UNITED STATES
SECURITIES AND EXCHANGE COMMISSION
Washington, DC 20549
FORMN-CSR
CERTIFIED SHAREHOLDER REPORT OF REGISTERED
MANAGEMENT INVESTMENT COMPANIES
Investment Company Act file number811-06243
Franklin Strategic Series
(Exact name of registrant as specified in charter)
One Franklin Parkway,
San Mateo, Ca 94403-1906
(Address of principal executive offices) (Zip code)
Craig S. Tyle,
One Franklin Parkway,
San Mateo, CA 94403-1906
(Name and address of agent for service)
Registrant’s telephone number, including area code: 650312-2000
Date of fiscal year end: 4/30
Date of reporting period: 4/30/19
Item 1. Reports to Stockholders.

Internet Delivery of Fund Reports Unless You Request Paper Copies: Effective January 1, 2021, as permitted by the SEC, paper copies of the Fund’s shareholder reports will no longer be sent by mail, unless you specifically request them from the Fund or your financial intermediary. Instead, the reports will be made available on a website, and you will be notified by mail each time a report is posted and provided with a website link to access the report.
If you already elected to receive shareholder reports electronically, you will not be affected by this change and you need not take any action. If you have not signed up for electronic delivery, we would encourage you to join fellow shareholders who have. You may elect to receive shareholder reports and other communications electronically from the Fund by calling(800) 632-2301 or by contacting your financial intermediary.
You may elect to continue to receive paper copies of all your future shareholder reports free of charge by contacting your financial intermediary or, if you invest directly with a Fund, calling (800)632-2301 to let the Fund know of your request. Your election to receive reports in paper will apply to all funds held in your account.
Franklin Templeton
Successful investing begins with ambition. And achievement only comes when you reach for it. That’s why we continually strive to deliver better outcomes for investors. No matter what your goals are, our deep, global investment expertise allows us to offer solutions that can help.
During our more than 70 years of experience, we’ve managed through all kinds of markets—up, down and those in between. We’re always preparing for what may come next. It’s because of this, combined with our strength as one of the world’s largest asset managers that we’ve earned the trust of millions of investors around the world.
Dear Shareholder:
During the 12 months ended April 30, 2019, the U.S. economy continued to grow amid positive economic data and corporate earnings, and the unemployment rate declined.
In April 2019, the Standard & Poor’s 500® Index (S&P 500®) reached anall-time high after declining in 2018’s fourth quarter. During the period, markets reflected concerns about the U.S. Federal Reserve’s (Fed’s) interest-rate path, U.S. political uncertainties and U.S.-China trade disputes, but these concerns were mitigated by the Fed’s patient monetary policy stance and investor optimism about a trade deal. Within this environment, U.S. stocks, as measured by the S&P 500, generated a double-digit percentage positive total return for the12-month period.
We are committed to our long-term perspective and disciplined investment approach as we conduct a rigorous, fundamental analysis of securities with a regular emphasis on investment risk management.
We believe active, professional investment management serves investors well. We also recognize the important role of financial advisors in today’s markets and encourage investors to continue to seek their advice. Amid changing markets and economic conditions, we are confident investors with a well-diversified portfolio and a patient, long-term outlook should be well positioned for the years ahead.
In addition, Franklin Strategic Series’ annual report includes more detail about prevailing conditions and a discussion about investment decisions during the period. Please remember all securities markets fluctuate, as do mutual fund share prices.
We thank you for investing with Franklin Templeton, welcome your questions and comments, and look forward to serving your future investment needs.
Sincerely,

Edward Perks, CFA
President and Chief Executive Officer –
Investment Management
Franklin Strategic Series
This letter reflects our analysis and opinions as of April 30, 2019, unless otherwise indicated. The information is not a complete analysis of every aspect of any market, country, industry, security or fund. Statements of fact are from sources considered reliable.
CFA® is a trademark owned by CFA Institute.
| Not FDIC Insured | May Lose Value | No Bank Guarantee |
franklintempleton.com | Not part of the annual report | 1 | ||
Contents
Annual Report | ||||
Economic and Market Overview | 3 | |||
Franklin Growth Opportunities Fund | 4 | |||
Franklin Select U.S. Equity Fund | 11 | |||
Franklin Small Cap Growth Fund | 18 | |||
FranklinSmall-Mid Cap Growth Fund | 25 | |||
Financial Highlights and Statements of Investments | 32 | |||
Financial Statements | 65 | |||
Notes to Financial Statements | 71 | |||
| Report of Independent Registered Public Accounting Firm | 90 | |||
Tax Information | 91 | |||
Board Members and Officers | 92 | |||
Shareholder Information | 96 | |||
Visitfranklintempleton.comfor fund updates, to access your account, or to find helpful financial planning tools.
| 2 | Annual Report | franklintempleton.com | ||||
Annual Report
Economic and Market Overview
The U.S. economy grew during the12-month period. The economy expanded at a faster rate in 2019’s first quarter after moderating in the previous two quarters. Growth in consumer spending, inventory investment, exports, state and local government spending and business investment was partly offset by declines in housing investment and federal government spending. The manufacturing and services sectors expanded during the period. The unemployment rate decreased from 3.9% in April 2018 to 3.6% atperiod-end.1 The annual inflation rate, as measured by the Consumer Price Index, decreased from 2.5% in April 2018 to 2.0% atperiod-end.1
The U.S. Federal Reserve (Fed) raised its target range for the federal funds rate by 0.25% three times during the period, to 2.25%–2.50%, and continued reducing its balance sheet as part of its plan to normalize monetary policy. At its March 2019 meeting, the Fed held its target range for the federal funds rate unchanged and signaled no rate hike in 2019. The Fed also lowered its forecasts for economic growth in 2019 and 2020. Furthermore, the Fed mentioned it would end its balance sheet normalization by the end of September 2019.
U.S. equity markets overall rose during the period, benefiting from upbeat economic data and better U.S. corporate earnings. However, markets reflected concerns about tighter regulation of technology companies, the Fed’s interest-rate path, U.S. political uncertainties, and the impact of U.S. trade disputes with China and other trading partners on global growth and corporate earnings. These concerns were partially alleviated by easing trade tensions and optimism about a potential U.S.-China trade deal. Markets also benefited from the Fed’s indications of a patient approach to its monetary policy decisions. The broad U.S. stock market, as measured by the Standard & Poor’s 500 Index (S&P 500), sold off sharply in 2018’s fourth quarter but rallied in 2019’s first four months, reaching a newall-time high in April 2019. Overall, the S&P 500 posted a +13.49% total return for the12-month period.2
The foregoing information reflects our analysis and opinions as of April 30, 2019. The information is not a complete analysis of every aspect of any market, country, industry, security or fund. Statements of fact are from sources considered reliable.
1. Source: Bureau of Labor Statistics.
2. Source: Morningstar.
See www.franklintempletondatasources.com for additional data provider information.
franklintempleton.com | Annual Report | 3 | ||
Franklin Growth Opportunities Fund
This annual report for Franklin Growth Opportunities Fund covers the fiscal year ended April 30, 2019.
Your Fund’s Goal and Main Investments
The Fund seeks capital appreciation by investing, under normal conditions, predominantly in equity securities of companies demonstrating accelerating growth, increasing profitability, or above-average growth or growth potential as compared with the overall economy.
Performance Overview
The Fund’s Class A shares posted a +15.91% cumulative total return for the 12 months under review. In comparison, the Fund’s narrow benchmark, the Russell 3000® Growth Index, which measures performance of Russell 3000® Index companies with relatively higherprice-to-book ratios and higher forecasted growth values, posted a +16.61% total return.1 The Fund’s broad benchmark, the Standard & Poor’s 500 Index (S&P 500), which tracks the broad U.S. stock market, posted a +13.49% total return.1 You can find the Fund’s long-term performance data in the Performance Summary beginning on page 7.
Performance data represent past performance, which does not guarantee future results. Investment return and principal value will fluctuate, and you may have a gain or loss when you sell your shares. Current performance may differ from figures shown. For most recentmonth-end performance, go to franklintempleton.comor call (800)342-5236.
Investment Strategy
We use fundamental,bottom-up research to seek companies meeting our criteria of growth potential, quality and valuation. In seeking sustainable growth characteristics, we look for companies we believe can produce sustainable earnings and cash flow growth, evaluating the long-term market opportunity and competitive structure of an industry to target leaders and emerging leaders. We define quality companies as those with strong and improving competitive positions in attractive markets. We also believe important attributes of quality are experienced and talented management teams as well as financial strength reflected in the capital structure, gross and
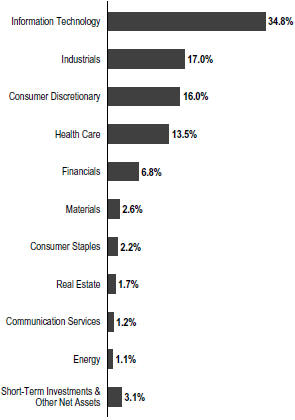
Portfolio Composition
Based on Total Net Assets as of 4/30/19
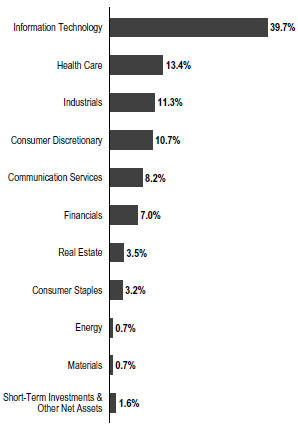
operating margins, free cash flow generation and returns on capital employed. Our valuation analysis includes a range of potential outcomes based on an assessment of multiple scenarios. In assessing value, we consider whether security prices fully reflect the balance of the sustainable growth opportunities relative to business and financial risks.
Manager’s Discussion
During the 12 months under review, nearly all sectors represented in the Fund’s portfolio posted positive returns and contributed to absolute performance. Relative to the Russell 3000® Growth Index, key contributors to the Fund’s performance included stock selection and an overweighting in the information technology (IT) sector, stock selection in the
1. Source: Morningstar.
Frank Russell Company is the source and owner of the trademarks, service marks and copyrights related to the Russell Indexes. Russell® is a trademark of Frank Russell Company.
The indexes are unmanaged and include reinvestment of any income or distributions. They do not reflect any fees, expenses or sales charges. One cannot invest directly in an index, and an index is not representative of the Fund’s portfolio.
See www.franklintempletondatasources.com for additional data provider information.
The dollar value, number of shares or principal amount, and names of all portfolio holdings are listed in the Fund’s Statement of Investments (SOI).
The SOI begins on page 37.
| 4 | Annual Report | franklintempleton.com | ||||
FRANKLIN GROWTH OPPORTUNITIES FUND
industrials sector, and stock selection and an underweighting in the materials sector.
In the IT sector, our investments in ServiceNow, Mastercard and Zendesk boosted relative results. ServiceNow, a provider of cloud-based services that enable companies to become more automated and efficient, continues to execute well in its large addressable market. A leader in enabling digital transformation, the company is becoming a multi-platform growth business with a strong product line, in our analysis. The recently introduced pro version of a core offering comes at a price premium we believe could drive revenue and billings growth. Payment solutions provider Mastercard continues to perform very well, exceeding expectations and announcing several growth initiatives, partnerships, acquisition of capabilities that expand its global network, investment in emerging regions and expansion into new payment flows. The company has shown an ability to both invest for the long term and deliver solidquarter-to-quarter execution, which we believe is supported by a strong organic growth profile. Customer service platform provider Zendesk saw solid momentum moving upmarket selling into enterprise clients and benefited from increased attach rates of its newer customer support offerings as it began to market the Zendesk Suite in bundle form in 2018’s second quarter. We believe the company’s addition of a sales automation software through an acquisition and its launch of a client relationship management platform for custom app development position the company to expand its total addressable market.
Notable contributors in the industrials and materials sectors included holdings in real estate information and marketing company CoStar Group and specialty chemicals and carbon materials manufacturer Ingevity, respectively.
Elsewhere, our position in MSCI, a provider of investment decision support tools, including indexes and portfolio risk and performance analytics, aided relative results.
In contrast, key detractors from the Fund’s relative performance included stock selection in the consumer staples, communication services and consumer discretionary sectors, as well as an underweighting in the communication services sector.
Within consumer staples, our position in Constellation Brand, which produces, markets and distributes beverage alcohol products, hurt relative results. In communication services, social media company Facebook’s shares advanced, and our underweighted position hindered relative performance. In
Top 10 Holdings
4/30/19
Company Sector/Industry | % of Total Net Assets | |||
Amazon.com Inc. | 7.8% | |||
Consumer Discretionary
| ||||
Mastercard Inc. | 5.3% | |||
Information Technology
| ||||
Microsoft Corp. | 5.2% | |||
Information Technology
| ||||
Visa Inc. | 4.0% | |||
Information Technology
| ||||
Alphabet Inc. | 3.9% | |||
Communication Services
| ||||
Apple Inc. | 2.9% | |||
Information Technology
| ||||
ServiceNow Inc. | 2.8% | |||
Information Technology
| ||||
SBA Communications Corp. | 2.6% | |||
Real Estate
| ||||
CoStar Group Inc. | 2.2% | |||
Industrials
| ||||
Adobe Inc. | 2.1% | |||
Information Technology
| ||||
consumer discretionary, our holding in casino resorts operator Wynn Resorts (not held atperiod-end) dampened relative results.
Other key individual detractors included positions in defense and security solutions manufacturer Raytheon, education technology company 2U and biotechnology firm Heron Therapeutics. Raytheon’s shares declined in 2018 along with other large-capitalization defense stocks after tensions eased between the U.S. and North Korea and as many investors worried about potential defense budget cuts. However, easing defense budget concerns helped drive defense stocks higher in 2019’s first four months. We believe the company has a better portfolio than its peers, with a focus on digital capabilities, and it has a strong position on missile defense. After reaching anall-time high early in the period, 2U’s share price declined due to investor concerns about competition and slowing growth.
franklintempleton.com | Annual Report | 5 | ||
FRANKLIN GROWTH OPPORTUNITIES FUND
Thank you for your continued participation in Franklin Growth Opportunities Fund. We look forward to serving your future investment needs.
 |
Grant Bowers Lead Portfolio Manager | |
 |
Sara Araghi, CFA | |
| Portfolio Management Team | ||


The foregoing information reflects our analysis, opinions and portfolio holdings as of April 30, 2019, the end of the reporting period. The way we implement our main investment strategies and the resulting portfolio holdings may change depending on factors such as market and economic conditions. These opinions may not be relied upon as investment advice or an offer for a particular security. The information is not a complete analysis of every aspect of any market, country, industry, security or the Fund. Statements of fact are from sources considered reliable, but the investment manager makes no representation or warranty as to their completeness or accuracy. Although historical performance is no guarantee of future results, these insights may help you understand our investment management philosophy.
| 6 | Annual Report | franklintempleton.com | ||||
FRANKLIN GROWTH OPPORTUNITIES FUND
Performance Summary as of April 30, 2019
The performance table and graphs do not reflect any taxes that a shareholder would pay on Fund dividends, capital gain distributions, if any, or any realized gains on the sale of Fund shares. Total return reflects reinvestment of the Fund’s dividends and capital gain distributions, if any, and any unrealized gains or losses. Your dividend income will vary depending on dividends or interest paid by securities in the Fund’s portfolio, adjusted for operating expenses of each class. Capital gain distributions are net profits realized from the sale of portfolio securities.
Performance as of 4/30/191
Cumulative total return excludes sales charges. Average annual total return includes maximum sales charges. Sales charges will vary depending on the size of the investment and the class of share purchased. The maximum is 5.50% and the minimum is 0%.Class A:5.50% maximum initial sales charge;Advisor Class:no sales charges. For other share classes, visitfranklintempleton.com.
| Share Class | Cumulative Total Return2 | Average Annual Total Return3 | ||
A4
| ||||
1-Year
| +15.91%
| +9.52%
| ||
5-Year
| +81.60%
| +11.41%
| ||
10-Year
| +321.57%
| +14.82%
| ||
Advisor
| ||||
1-Year
| +16.16%
| +16.16%
| ||
5-Year
| +83.97%
| +12.97%
| ||
10-Year
| +333.13%
| +15.79%
| ||
Performance data represent past performance, which does not guarantee future results. Investment return and principal value will fluctuate, and you may have a gain or loss when you sell your shares. Current performance may differ from figures shown. For most recentmonth-end performance, go tofranklintempleton.comor call(800)342-5236.
See page 9 for Performance Summary footnotes.
franklintempleton.com | Annual Report | 7 | ||
FRANKLIN GROWTH OPPORTUNITIES FUND
PERFORMANCE SUMMARY
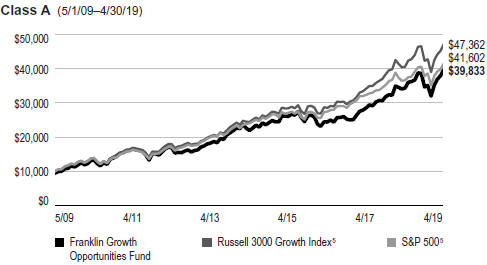
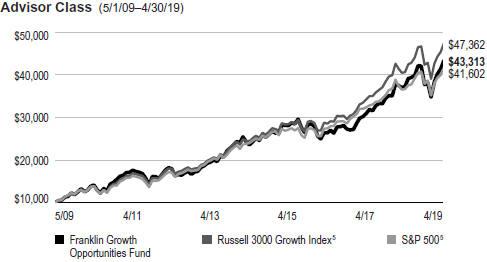
Total Return Index Comparison for a Hypothetical $10,000 Investment1
Total return represents the change in value of an investment over the periods shown. It includes any applicable maximum sales charge, Fund expenses, account fees and reinvested distributions. The unmanaged indexes include reinvestment of any income or distributions. They differ from the Fund in composition and do not pay management fees or expenses. One cannot invest directly in an index.
See page 9 for Performance Summary footnotes.
| 8 | Annual Report | franklintempleton.com | ||||
FRANKLIN GROWTH OPPORTUNITIES FUND
PERFORMANCE SUMMARY
Distributions(5/1/18–4/30/19)
Share Class
| Long-Term Capital Gain
| |||
A
|
| $4.1650
|
| |
C
|
| $4.1650
|
| |
R
|
| $4.1650
|
| |
R6
|
| $4.1650
|
| |
Advisor
|
| $4.1650
|
| |
Total Annual Operating Expenses6
| Share Class | With Fee Waiver | Without Fee Waiver | ||||||
A
|
| 0.99%
|
|
| 0.99%
|
| ||
Advisor
|
| 0.74%
|
|
| 0.74%
|
| ||
Each class of shares is available to certain eligible investors and has different annual fees and expenses, as described in the prospectus.
All investments involve risks, including possible loss of principal. Growth stock prices reflect projections of future earnings or revenues, and can, therefore, fall dramatically if the company fails to meet those projections. To the extent the Fund focuses on particular countries, regions, industries, sectors or types of investment from time to time, it may be subject to greater risks of adverse developments in such areas of focus than a fund that invests in a wider variety of countries, regions, industries, sectors or investments. Smaller, midsized and relatively new or unseasoned companies can be particularly sensitive to changing economic conditions, and their prospects for growth are less certain than those of larger, more established companies. Historically, these securities have experienced more price volatility than larger-company stocks, especially over the short term. The Fund is actively managed but there is no guarantee that the manager’s investment decisions will produce the desired results. The Fund’s prospectus also includes a description of the main investment risks.
1. The Fund has a fee waiver associated with any investment it makes in a Franklin Templeton money fund and/or other Franklin Templeton fund, contractually guaranteed through 8/31/19. Fund investment results reflect the fee waiver; without this waiver, the results would have been lower.
2. Cumulative total return represents the change in value of an investment over the periods indicated.
3. Average annual total return represents the average annual change in value of an investment over the periods indicated. Return for less than one year, if any, has not been annualized.
4. Prior to 9/10/18, these shares were offered at a higher initial sales charge of 5.75%, thus actual returns would have differed. Total returns with sales charges have been restated to reflect the current maximum initial sales charge of 5.50%.
5. Source: Morningstar. The Russell 3000 Growth Index is market capitalization weighted and measures performance of those Russell 3000 Index companies with relatively higherprice-to-book ratios and higher forecasted growth values. The S&P 500 is a market capitalization-weighted index of 500 stocks designed to measure total U.S. equity market performance.
6. Figures are as stated in the Fund’s current prospectus and may differ from the expense ratios disclosed in the Your Fund’s Expenses and Financial Highlights sections in this report. In periods of market volatility, assets may decline significantly, causing total annual Fund operating expenses to become higher than the figures shown.
See www.franklintempletondatasources.com for additional data provider information.
franklintempleton.com | Annual Report | 9 | ||
FRANKLIN GROWTH OPPORTUNITIES FUND
Your Fund’s Expenses
As a Fund shareholder, you can incur two types of costs: (1) transaction costs, including sales charges (loads) on Fund purchases and redemptions; and (2) ongoing Fund costs, including management fees, distribution and service(12b-1) fees, and other Fund expenses. All mutual funds have ongoing costs, sometimes referred to as operating expenses. The table below shows ongoing costs of investing in the Fund and can help you understand these costs and compare them with those of other mutual funds. The table assumes a $1,000 investment held for the six months indicated.
Actual Fund Expenses
The table below provides information about actual account values and actual expenses in the columns under the heading “Actual.” In these columns the Fund’s actual return, which includes the effect of Fund expenses, is used to calculate the “Ending Account Value” for each class of shares. You can estimate the expenses you paid during the period by following these steps (of course, your account value and expenses will differ from those in this illustration): Divide your account value by $1,000 (if your account had an $8,600 value, then $8,600÷ $1,000 = 8.6). Then multiply the result by the number in the row for your class of shares under the headings “Actual” and “Expenses Paid During Period” (if Actual Expenses Paid During Period were $7.50, then 8.6 x $7.50 =$64.50). In this illustration, the actual expenses paid this period are $64.50.
Hypothetical Example for Comparison with Other Funds
Under the heading “Hypothetical” in the table, information is provided about hypothetical account values and hypothetical expenses based on the Fund’s actual expense ratio and an assumed rate of return of 5% per year before expenses, which is not the Fund’s actual return. This information may not be used to estimate the actual ending account balance or expenses you paid for the period, but it can help you compare ongoing costs of investing in the Fund with those of other funds. To do so, compare this 5% hypothetical example for the class of shares you hold with the 5% hypothetical examples that appear in the shareholder reports of other funds.
Please note that expenses shown in the table are meant to highlight ongoing costs and do not reflect any transactional costs. Therefore, information under the heading “Hypothetical” is useful in comparing ongoing costs only, and will not help you compare total costs of owning different funds. In addition, if transactional costs were included, your total costs would have been higher.
Actual (actual return after expenses) | Hypothetical (5% annual return before expenses) | |||||||||||||||
Share Class | Beginning Value 11/1/18 | Ending Account | Expenses Paid During Period 11/1/18–4/30/191,2 | Ending Account Value 4/30/19 | Expenses Paid During 11/1/18–4/30/191,2 | Net Annualized Ratio2 | ||||||||||
A | $1,000 | $1,148.10 | $5.01 | $1,020.13 | $4.71 | 0.94% | ||||||||||
C | $1,000 | $1,144.30 | $9.04 | $1,016.36 | $8.50 | 1.70% | ||||||||||
R | $1,000 | $1,146.90 | $6.28 | $1,018.94 | $5.91 | 1.18% | ||||||||||
R6 | $1,000 | $1,149.40 | $3.09 | $1,021.92 | $2.91 | 0.58% | ||||||||||
Advisor | $1,000 | $1,149.10 | $3.68 | $1,021.37 | $3.46 | 0.69% | ||||||||||
1. Expenses are equal to the annualized expense ratio for thesix-month period as indicated above—in the far right column—multiplied by the simple average account value over the period indicated, and then multiplied by 181/365 to reflect theone-half year period.
2. Reflects expenses after fee waivers and expense reimbursements. Does not include acquired fund fees and expenses.
| 10 | Annual Report | franklintempleton.com | ||||
Franklin Select U.S. Equity Fund
Formerly, Franklin Focused Core Equity Fund
This annual report for Franklin Select U.S. Equity Fund covers the fiscal year ended April 30, 2019. As previously communicated, effective June 1, 2018, the Fund changed its investment strategy, but its goal remained the same.
Your Fund’s Goal and Main Investments
The Fund seeks capital appreciation by investing, under normal market conditions, at least 80% of its net assets in U.S. equity securities. The Fund invests primarily to predominantly in equity securities of large-capitalization companies, which are similar in size to those in the Standard & Poor’s 500 Index (S&P 500).
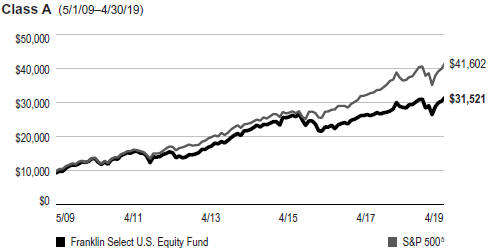
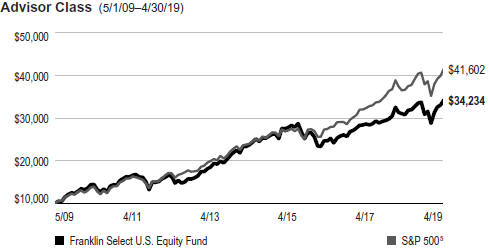
Performance Overview
The Fund’s Class A shares posted a +10.72% cumulative total return for the 12 months under review. In comparison, the S&P 500, which tracks the broad U.S. stock market, posted a +13.49% total return.1 You can find the Fund’s long-term performance data in the Performance Summary beginning on page 14.
Performance data represent past performance, which does not guarantee future results. Investment return and principal value will fluctuate, and you may have a gain or loss when you sell your shares. Current performance may differ from figures shown. For most recentmonth-end performance, go to franklintempleton.comor call (800)342-5236.
Investment Strategy
We are research-driven,bottom-up fundamental investors seeking companies that exhibit a combination of growth potential, quality and reasonable valuation. We assess growth potential by considering companies that we believe are positioned for growth in revenue, earnings or assets. In assessing valuation, we consider whether security prices fully reflect the balance of the long-term growth prospects relative to business and financial risks. We place a particular emphasis on quality and assessing downside risk, believing that important attributes of quality include experienced and talented management teams, favorable competitive positioning, and financial strength reflected in metrics including profitability, free cash flow generation and returns on capital employed. This quality analysis generally includes our assessment of the
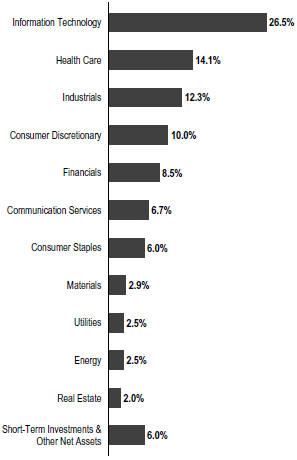
Portfolio Composition
Based on Total Net Assets as of 4/30/19
potential impacts of any material environmental, social and governance (ESG) factors on the long-term risk and return profile of a company. We generally use a team of analysts to help providein-depth industry expertise and use both qualitative and quantitative analysis to evaluate companies.
Manager’s Discussion
During the 12 months under review, key sector contributors to the Fund’s absolute performance included information technology (IT), health care and consumer discretionary.
In the IT sector, our investments in ServiceNow, Microsoft and Mastercard boosted absolute performance. ServiceNow, a
1. Source: Morningstar.
The index is unmanaged and includes reinvestment of any income or distributions. It does not reflect any fees, expenses or sales charges. One cannot invest directly in an index, and an index is not representative of the Fund’s portfolio.
See www.franklintempletondatasources.com for additional data provider information.
The dollar value, number of shares or principal amount, and names of all portfolio holdings are listed in the Fund’s Statement of Investments (SOI).
The SOI begins on page 45.
franklintempleton.com | Annual Report | 11 | ||
FRANKLIN SELECT U.S. EQUITY FUND
provider of cloud-based services that enable companies to become more automated and efficient, continues to execute well in its large addressable market. A leader in enabling digital transformation, the company is becoming a multi-platform growth business with a strong product line, in our analysis. The recently introduced pro version of a core offering comes at a price premium we believe could drive revenue and billings growth. Software and services company Microsoft is a beneficiary of strong sales execution, a positive enterprise IT spending environment, its status as a critical partner to IT departments in this time of digital transformation, and a large installed base that is successfully moving to higher-value cloud andService-as-a-Software deployments. The company saw sustained strength in its enterprise cloud computing platform Azure, solid growth in its traditional server products and particularly strong growth in commercial bookings. Furthermore, the company continued to expand gross profit margins and control operational expenses. Payment solutions provider Mastercard continues to perform very well, exceeding expectations and announcing several growth initiatives, partnerships, acquisition of capabilities that expand its global network, investment in emerging regions and expansion into new payment flows. The company has shown an ability to both invest for the long term and deliver solidquarter-to-quarter execution, which we believe is supported by a strong organic growth profile.
In health care, our position in Mettler-Toledo International, which manufactures precision instruments for use in laboratory, industrial and food retailing applications, aided absolute returns.
In consumer discretionary, key contributors included our investments ine-commerce and cloud computing services company Amazon.com and athletic apparel and equipment manufacturer NIKE.
Other key individual contributors included our holding in Walt Disney, a diversified international family entertainment and media enterprise.
In contrast, key sector detractors from the Fund’s absolute performance included energy and financials.
In the energy sector, our position in oil and natural gas exploration and production company Concho Resources hindered absolute results. Concho Resources’ share price declined along with the shares of manyoil-focused companies as crude oil prices fell toward the end of 2018, although the rebound in oil prices during 2019’s first four months helped pare earlier losses. Lower natural gas prices, a refinery outage,
Top 10 Holdings
4/30/19
Company Sector/Industry | % of Total Net Assets | |||
Amazon.com Inc. | 4.3% | |||
Consumer Discretionary
| ||||
Microsoft Corp. | 3.8% | |||
Information Technology
| ||||
Alphabet Inc. | 3.0% | |||
Communication Services
| ||||
Analog Devices Inc. | 3.0% | |||
Information Technology
| ||||
Mastercard Inc. | 2.8% | |||
Information Technology
| ||||
ServiceNow Inc. | 2.6% | |||
Information Technology
| ||||
NextEra Energy Inc. | 2.5% | |||
Utilities
| ||||
Alibaba Group Holding Ltd. | 2.4% | |||
Consumer Discretionary
| ||||
BlackRock Inc. | 2.4% | |||
Financials
| ||||
Fortive Corp. | 2.3% | |||
Industrials
| ||||
spending concerns, disappointing fourth-quarter 2018 earnings results and lower 2019 guidance pressured the stock further. However, company management has kept the balance sheet strong and oil production well hedged to potentially protect against downside risks to cash flows.
In financials, our holdings in financial services firm Charles Schwab and investment manager BlackRock hurt absolute results. Charles Schwab reported solid quarterly earnings results during the period, with the company delivering healthy net interest margin expansion. However, its share price declined due to investor concerns about pricing pressures coming from newno-fee products introduced by competitors, higher expenses and lower trading revenues.
Other key individual detractors included holdings in transportation, e-commerce and business services provider FedEx, nuclear components and products company BWX Technologies, and defense and security solutions manufacturer Raytheon. FedEx’s share price declined due to weaker-than-expected earnings reports and lower fiscal-year 2019 guidance, as its international revenues weakened, particularly in Europe. The company is mitigating the slowdown by offering voluntary buyouts, reducing international capacity, limiting hiring and reducing discretionary spending.
| 12 | Annual Report | franklintempleton.com | ||||
FRANKLIN SELECT U.S. EQUITY FUND
Thank you for your continued participation in Franklin Select U.S. Equity Fund. We look forward to serving your future investment needs.
 |
Serena Perin Vinton, CFA Lead Portfolio Manager | |
 |
Chris Anderson | |
| Portfolio Management Team | ||


The foregoing information reflects our analysis, opinions and portfolio holdings as of April 30, 2019, the end of the reporting period. The way we implement our main investment strategies and the resulting portfolio holdings may change depending on factors such as market and economic conditions. These opinions may not be relied upon as investment advice or an offer for a particular security. The information is not a complete analysis of every aspect of any market, country, industry, security or the Fund. Statements of fact are from sources considered reliable, but the investment manager makes no representation or warranty as to their completeness or accuracy. Although historical performance is no guarantee of future results, these insights may help you understand our investment management philosophy.
franklintempleton.com | Annual Report | 13 | ||
FRANKLIN SELECT U.S. EQUITY FUND
Performance Summary as of April 30, 2019
The performance table and graphs do not reflect any taxes that a shareholder would pay on Fund dividends, capital gain distributions, if any, or any realized gains on the sale of Fund shares. Total return reflects reinvestment of the Fund’s dividends and capital gain distributions, if any, and any unrealized gains or losses. Your dividend income will vary depending on dividends or interest paid by securities in the Fund’s portfolio, adjusted for operating expenses of each class. Capital gain distributions are net profits realized from the sale of portfolio securities.
Performance as of 4/30/191
Cumulative total return excludes sales charges. Average annual total return includes maximum sales charges. Sales charges will vary depending on the size of the investment and the class of share purchased. The maximum is 5.50% and the minimum is 0%.Class A:5.50% maximum initial sales charge;Advisor Class:no sales charges. For other share classes, visitfranklintempleton.com.
| Share Class | Cumulative Total Return2 | Average Annual Total Return3 | ||
A4
| ||||
1-Year
| +10.72%
| +4.63%
| ||
5-Year
| +42.21%
| +6.09%
| ||
10-Year
| +233.31%
| +12.17%
| ||
Advisor
| ||||
1-Year
| +11.06%
| +11.06%
| ||
5-Year
| +44.20%
| +7.60%
| ||
10-Year
| +242.34%
| +13.10%
| ||
Performance data represent past performance, which does not guarantee future results. Investment return and principal value will fluctuate, and you may have a gain or loss when you sell your shares. Current performance may differ from figures shown. For most recentmonth-end performance, go tofranklintempleton.comor call(800)342-5236.
See page 16 for Performance Summary footnotes.
| 14 | Annual Report | franklintempleton.com | ||||
FRANKLIN SELECT U.S. EQUITY FUND
PERFORMANCE SUMMARY
Total Return Index Comparison for a Hypothetical $10,000 Investment1
Total return represents the change in value of an investment over the periods shown. It includes any applicable maximum sales charge, Fund expenses, account fees and reinvested distributions. The unmanaged index includes reinvestment of any income or distributions. It differs from the Fund in composition and does not pay management fees or expenses. One cannot invest directly in an index.
See page 16 for Performance Summary footnotes.
franklintempleton.com | Annual Report | 15 | ||
FRANKLIN SELECT U.S. EQUITY FUND
PERFORMANCE SUMMARY
Distributions(5/1/18–4/30/19)
Share Class
| Long-Term
| |||
A
|
|
$2.1783
|
| |
C
|
|
$2.1783
|
| |
R
|
|
$2.1783
|
| |
R6
|
|
$2.1783
|
| |
Advisor
|
|
$2.1783
|
| |
Total Annual Operating Expenses6
Share Class
| With Fee Waiver
| Without Fee
| ||||||
A
|
|
1.25%
|
|
|
1.49%
|
| ||
Advisor
|
|
1.00%
|
|
|
1.24%
|
| ||
Each class of shares is available to certain eligible investors and has different annual fees and expenses, as described in the prospectus.
All investments involve risks, including possible loss of principal. To the extent the Fund focuses on particular countries, regions, industries, sectors or types of investment from time to time, it may be subject to greater risks of adverse developments in such areas of focus than a fund that invests in a wider variety of countries, regions, industries, sectors or investments. The Fund may have investments in both growth and value stocks, or in stocks with characteristics of both. Growth stock prices reflect projections of future earnings or revenues, and can, therefore, fall dramatically if the company fails to meet those projections. A value stock may not increase in price as anticipated by the investment manager if other investors fail to recognize the company’s value and bid up the price, the markets favor faster-growing companies, or the factors that the investment manager believes will increase the price of the security do not occur. Foreign securities involve special risks, including currency fluctuations and economic and political uncertainties. The Fund is actively managed but there is no guarantee that the manager’s investment decisions will produce the desired results. The Fund’s prospectus also includes a description of the main investment risks.
1. The Fund has an expense reduction and a fee waiver associated with any investments it makes in a Franklin Templeton money fund and/or other Franklin Templeton fund, contractually guaranteed through 8/31/19. Fund investment results reflect the expense reduction and fee waiver; without these reductions, the results would have been lower.
2. Cumulative total return represents the change in value of an investment over the periods indicated.
3. Average annual total return represents the average annual change in value of an investment over the periods indicated. Return for less than one year, if any, has not been annualized.
4. Prior to 9/10/18, these shares were offered at a higher initial sales charge of 5.75%, thus actual returns would have differed. Total returns with sales charges have been restated to reflect the current maximum initial sales charge of 5.50%.
5. Source: Morningstar. The S&P 500 is a market capitalization-weighted index of 500 stocks designed to measure total U.S. equity market performance.
6. Figures are as stated in the Fund’s current prospectus and may differ from the expense ratios disclosed in the Your Fund’s Expenses and Financial Highlights sections in this report. In periods of market volatility, assets may decline significantly, causing total annual Fund operating expenses to become higher than the figures shown.
See www.franklintempletondatasources.com for additional data provider information.
| 16 | Annual Report | franklintempleton.com | ||||
FRANKLIN SELECT U.S. EQUITY FUND
Your Fund’s Expenses
As a Fund shareholder, you can incur two types of costs: (1) transaction costs, including sales charges (loads) on Fund purchases and redemptions; and (2) ongoing Fund costs, including management fees, distribution and service(12b-1) fees, and other Fund expenses. All mutual funds have ongoing costs, sometimes referred to as operating expenses. The table below shows ongoing costs of investing in the Fund and can help you understand these costs and compare them with those of other mutual funds. The table assumes a $1,000 investment held for the six months indicated.
Actual Fund Expenses
The table below provides information about actual account values and actual expenses in the columns under the heading “Actual.” In these columns the Fund’s actual return, which includes the effect of Fund expenses, is used to calculate the “Ending Account Value” for each class of shares. You can estimate the expenses you paid during the period by following these steps (of course, your account value and expenses will differ from those in this illustration): Divide your account value by $1,000 (if your account had an $8,600 value, then $8,600÷ $1,000 = 8.6). Then multiply the result by the number in the row for your class of shares under the headings “Actual” and “Expenses Paid During Period” (if Actual Expenses Paid During Period were $7.50, then 8.6 x $7.50 =$64.50). In this illustration, the actual expenses paid this period are $64.50.
Hypothetical Example for Comparison with Other Funds
Under the heading “Hypothetical” in the table, information is provided about hypothetical account values and hypothetical expenses based on the Fund’s actual expense ratio and an assumed rate of return of 5% per year before expenses, which is not the Fund’s actual return. This information may not be used to estimate the actual ending account balance or expenses you paid for the period, but it can help you compare ongoing costs of investing in the Fund with those of other funds. To do so, compare this 5% hypothetical example for the class of shares you hold with the 5% hypothetical examples that appear in the shareholder reports of other funds.
Please note that expenses shown in the table are meant to highlight ongoing costs and do not reflect any transactional costs. Therefore, information under the heading “Hypothetical” is useful in comparing ongoing costs only, and will not help you compare total costs of owning different funds. In addition, if transactional costs were included, your total costs would have been higher.
Actual (actual return after expenses) | Hypothetical (5% annual return before expenses) | |||||||||||||||||
Share Class | Beginning Account Value 11/1/18 | Ending Account Value 4/30/19 | Expenses Paid During Period 11/1/18–4/30/191,2 | Ending Account Value 4/30/19 | Expenses Paid During Period 11/1/18–4/30/191,2 | Net Annualized Expense Ratio2 | ||||||||||||
A | $1,000 | $1,106.50 | $6.42 | $1,018.70 | $6.16 | 1.23% | ||||||||||||
C | $1,000 | $1,103.10 | $10.32 | $1,014.98 | $9.89 | 1.98% | ||||||||||||
R | $1,000 | $1,105.70 | $7.73 | $1,017.46 | $7.40 | 1.48% | ||||||||||||
R6 | $1,000 | $1,108.70 | $4.60 | $1,020.43 | $4.41 | 0.88% | ||||||||||||
Advisor | $1,000 | $1,108.60 | $5.12 | $1,019.93 | $4.91 | 0.98% | ||||||||||||
1. Expenses are equal to the annualized expense ratio for thesix-month period as indicated above—in the far right column—multiplied by the simple average account value over the period indicated, and then multiplied by 181/365 to reflect theone-half year period.
2. Reflects expenses after fee waivers and expense reimbursements. Does not include acquired fund fees and expenses.
franklintempleton.com | Annual Report | 17 | ||
Franklin Small Cap Growth Fund
This annual report for Franklin Small Cap Growth Fund covers the fiscal year ended April 30, 2019. At the market close on February 12, 2015, the Fund closed to new investors with limited exceptions. Existing shareholders may add to their accounts. Effective April 28, 2017, the Fund opened Class R6 shares to new investors who are eligible to purchase Class R6 shares. Effective January 17, 2019, all share classes of the Fundre-opened to new investors.
Your Fund’s Goal and Main Investments
The Fund seeks long-term capital growth by investing, under normal market conditions, at least 80% of its net assets in the equity securities ofsmall-cap companies, which for this Fund are those with market capitalizations not exceeding $1.5 billion or that of the highest market capitalization in the Russell 2000® Index, whichever is greater, at the time of purchase.1
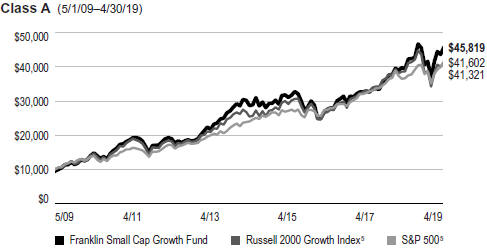
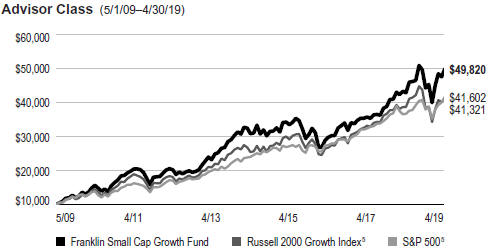
Performance Overview
The Fund’s Class A shares posted a +16.06% cumulative total return for the 12 months under review. In comparison, the Russell 2000® Growth Index, which measures performance ofsmall-cap companies with relatively higherprice-to-book ratios and higher forecasted growth values, posted a +6.91% total return.2 The Standard & Poor’s 500 Index (S&P 500), which tracks the broad U.S. stock market, posted a +13.49% total return.2 You can find the Fund’s long-term performance data in the Performance Summary beginning on page 21.
Performance data represent past performance, which does not guarantee future results. Investment return and principal value will fluctuate, and you may have a gain or loss when you sell your shares. Current performance may differ from figures shown. For most recentmonth-end performance, go tofranklintempleton.comor call(800)342-5236.
Investment Strategy
We use fundamental,bottom-up research to seek companies meeting our criteria of growth potential, quality and valuation. In seeking sustainable growth characteristics, we look for companies we believe can produce sustainable earnings and cash flow growth, evaluating the long-term market opportunity and competitive structure of an industry. We define quality
Portfolio Composition
Based on Total Net Assets as of 4/30/19

companies as those with strong and improving competitive positions in attractive markets. We also believe important attributes of quality are experienced and talented management teams as well as financial strength reflected in the capital structure, gross and operating margins, free cash flow generation and returns on capital employed. Our valuation analysis includes a range of potential outcomes based on an assessment of multiple scenarios. In assessing value, we consider whether security prices fully reflect the balance of the sustainable growth opportunities relative to business and financial risks.
1. The Russell 2000 Index is market capitalization weighted and measures performance of the 2,000 smallest companies in the Russell 3000 Index, which represent a small amount of the total market capitalization of the Russell 3000 Index.
2. Source: Morningstar.
The indexes are unmanaged and include reinvestment of any income or distributions. They do not reflect any fees, expenses or sales charges. One cannot invest directly in an index, and an index is not representative of the Fund’s portfolio.
See www.franklintempletondatasources.com for additional data provider information.
The dollar value, number of shares or principal amount, and names of all portfolio holdings are listed in the Fund’s Statement of Investments (SOI).
The SOI begins on page 52.
| 18 | Annual Report | franklintempleton.com | ||||
FRANKLIN SMALL CAP GROWTH FUND
Manager’s Discussion
During the 12 months under review, most sectors represented in the Fund’s portfolio posted positive results and contributed to absolute performance. Relative to the Russell 2000® Growth Index, key contributors included stock selection and an overweighting in the information technology (IT) sector, stock selection in the industrials sector, and stock selection and an overweighting in the consumer discretionary sector.
Within IT, notable contributors included our investments in communications software and cloud-based platform company Twilio, cloud-based internet security platform firm Zscaler and customer service platform provider Zendesk. Twilio continued to benefit from a growing customer base, expanding customer activity, higher average revenue per customer and its core voice and messaging solutions. Furthermore, Twilio Flex, its new contact center solution, and SendGrid, a recently acquired leadingbusiness-to-consumer email messaging company, contributed to revenue growth.
In the industrials sector, key contributors included our investments in Mercury Systems, a provider of secure sensor and safety critical mission processing subsystems, and Spirit Airlines (not part of the index), an ultralow-cost, low-fare airline. Mercury Systems repeatedly raised its fiscal-year 2019 guidance amid strong bookings growth. The company continued to expand its presence in the C41 market by making strategic acquisitions, most recently GECO Avionics, a leading designer of safety critical avionics systems.
In consumer discretionary, our investment in Boot Barn Holdings, which operates retail chain stores specializing in western and work-related footwear, apparel and accessories, aided relative results.
Other notable individual contributors included our position in medical device manufacturer DexCom (not held atperiod-end).
In contrast, key detractors from the Fund’s relative performance included stock selection and overweightings in the financials and energy sectors, as well as stock selection and an underweighting in the communication services sector.
Within financials, our position in Western Alliance Bancorp (not part of the index), which provides banking products and services for businesses, hampered relative results. Key detractors in the energy sector included holdings in oil and natural gas exploration and production companies Callon Petroleum (not part of the index) and Ring Energy. In communication services, our position in Yelp, which hosts an
Top 10 Holdings
4/30/19
Company Sector/Industry | % of Total Net Assets | |
2U Inc. | 1.8% | |
Information Technology
| ||
Silicon Laboratories Inc. | 1.6% | |
Information Technology
| ||
Grand Canyon Education Inc. | 1.6% | |
Consumer Discretionary
| ||
Mercury Systems Inc. | 1.5% | |
Industrials
| ||
Allegiant Travel Co. | 1.5% | |
Industrials
| ||
Nevro Corp. | 1.4% | |
Health Care
| ||
ViaSat Inc. | 1.4% | |
Information Technology
| ||
Monolithic Power Systems | 1.4% | |
Information Technology
| ||
Kennametal Inc. | 1.4% | |
Industrials
| ||
BWX Technologies Inc. | 1.4% | |
Industrials |
online database of user-generated reviews of local businesses, hindered relative results.
Other key individual detractors included holdings in education technology company 2U, financial technology company GreenSky (not part of the index; not held atperiod-end) and medical devices company Nevro. After reaching anall-time high early in the period, 2U’s share price declined due to investor concerns about competition and slowing growth. GreenSky’s share price declined after the company posted mixed earnings reports that disappointed many investors, who grew concerned about moderating growth and weaker credit quality. Nevro’s share price declined due to weaker-than-expected earnings reports and 2019 revenue guidance.
franklintempleton.com | Annual Report | 19 | ||
FRANKLIN SMALL CAP GROWTH FUND
Thank you for your continued participation in Franklin Small Cap Growth Fund. We look forward to serving your future investment needs.
 |
Michael P. McCarthy, CFA Lead Portfolio Manager | |
 |
Bradley T. Carris, CFA | |
| Portfolio Management Team | ||


The foregoing information reflects our analysis, opinions and portfolio holdings as of April 30, 2019, the end of the reporting period. The way we implement our main investment strategies and the resulting portfolio holdings may change depending on factors such as market and economic conditions. These opinions may not be relied upon as investment advice or an offer for a particular security. The information is not a complete analysis of every aspect of any market, country, industry, security or the Fund. Statements of fact are from sources considered reliable, but the investment manager makes no representation or warranty as to their completeness or accuracy. Although historical performance is no guarantee of future results, these insights may help you understand our investment management philosophy.
| 20 | Annual Report | franklintempleton.com | ||||
FRANKLIN SMALL CAP GROWTH FUND
Performance Summary as of April 30, 2019
The performance table and graphs do not reflect any taxes that a shareholder would pay on Fund dividends, capital gain distributions, if any, or any realized gains on the sale of Fund shares. Total return reflects reinvestment of the Fund’s dividends and capital gain distributions, if any, and any unrealized gains or losses. Your dividend income will vary depending on dividends or interest paid by securities in the Fund’s portfolio, adjusted for operating expenses of each class. Capital gain distributions are net profits realized from the sale of portfolio securities.
Performance as of 4/30/191
Cumulative total return excludes sales charges. Average annual total return includes maximum sales charges. Sales charges will vary depending on the size of the investment and the class of share purchased. The maximum is 5.50% and the minimum is 0%.Class A:5.50% maximum initial sales charge;Advisor Class:no sales charges. For other share classes, visitfranklintempleton.com.
| Share Class | Cumulative Total Return2 | Average Annual Total Return3 | ||
A4
| ||||
1-Year
| +16.06%
| +9.67%
| ||
5-Year
| +59.80%
| +8.59%
| ||
10-Year
| +384.64%
| +16.44%
| ||
Advisor
| ||||
1-Year
| +16.30%
| +16.30%
| ||
5-Year
| +61.81%
| +10.10%
| ||
10-Year
| +398.20%
| +17.42%
| ||
Performance data represent past performance, which does not guarantee future results. Investment return and principal value will fluctuate, and you may have a gain or loss when you sell your shares. Current performance may differ from figures shown. For most recentmonth-end performance, go tofranklintempleton.comor call(800)342-5236.
See page 23 for Performance Summary footnotes.
franklintempleton.com | Annual Report | 21 | ||
FRANKLIN SMALL CAP GROWTH FUND
PERFORMANCE SUMMARY
Total Return Index Comparison for a Hypothetical $10,000 Investment1
Total return represents the change in value of an investment over the periods shown. It includes any applicable maximum sales charge, Fund expenses, account fees and reinvested distributions. The unmanaged indexes include reinvestment of any income or distributions. They differ from the Fund in composition and do not pay management fees or expenses. One cannot invest directly in an index.
See page 23 for Performance Summary footnotes.
| 22 | Annual Report | franklintempleton.com | ||||
FRANKLIN SMALL CAP GROWTH FUND
PERFORMANCE SUMMARY
Distributions(5/1/18–4/30/19)
Share Class
| Short-Term
| Long-Term
| Total
| ||||||||||||
A
|
| $0.1294
|
|
| $4.1263
|
|
| $4.2557
|
| ||||||
C
|
| $0.1294
|
|
| $4.1263
|
|
| $4.2557
|
| ||||||
R
|
| $0.1294
|
|
| $4.1263
|
|
| $4.2557
|
| ||||||
R6
|
| $0.1294
|
|
| $4.1263
|
|
| $4.2557
|
| ||||||
Advisor
|
| $0.1294
|
|
| $4.1263
|
|
| $4.2557
|
| ||||||
Total Annual Operating Expenses6
Share Class
| With Fee Waiver
| Without Fee
| ||||||
A
|
| 1.09%
|
|
| 1.10%
|
| ||
Advisor
|
| 0.84%
|
|
| 0.85%
|
| ||
Each class of shares is available to certain eligible investors and has different annual fees and expenses, as described in the prospectus.
All investments involve risks, including possible loss of principal. Smaller, midsized and relatively new or unseasoned companies can be particularly sensitive to changing economic conditions, and their prospects for growth are less certain than those of larger, more established companies. Historically, these securities have experienced more price volatility than larger-company stocks, especially over the short term. Growth stock prices reflect projections of future earnings or revenues, and can, therefore, fall dramatically if the company fails to meet those projections. To the extent the Fund focuses on particular countries, regions, industries, sectors or types of investment from time to time, it may be subject to greater risks of adverse developments in such areas of focus than a fund that invests in a wider variety of countries, regions, industries, sectors or investments. From time to time, the trading market for a particular security or type of security in which the Fund invests may become less liquid or even illiquid. The Fund is actively managed but there is no guarantee that the manager’s investment decisions will produce the desired results. The Fund’s prospectus also includes a description of the main investment risks.
1. The Fund has a fee waiver associated with any investment it makes in a Franklin Templeton money fund and/or other Franklin Templeton fund, contractually guaranteed through 8/31/19. Fund investment results reflect the fee waiver; without this waiver, the results would have been lower.
2. Cumulative total return represents the change in value of an investment over the periods indicated.
3. Average annual total return represents the average annual change in value of an investment over the periods indicated. Return for less than one year, if any, has not been annualized.
4. Prior to 9/10/18, these shares were offered at a higher initial sales charge of 5.75%, thus actual returns would have differed. Total returns with sales charges have been restated to reflect the current maximum initial sales charge of 5.50%.
5. Source: Morningstar. The Russell 2000 Growth Index is market capitalization weighted and measures performance of those Russell 2000 Index companies with relatively higherprice-to-book ratios and higher forecasted growth values. The S&P 500 is a market capitalization-weighted index of 500 stocks designed to measure total U.S. equity market performance.
6. Figures are as stated in the Fund’s current prospectus and may differ from the expense ratios disclosed in the Your Fund’s Expenses and Financial Highlights sections in this report. In periods of market volatility, assets may decline significantly, causing total annual Fund operating expenses to become higher than the figures shown.
See www.franklintempletondatasources.com for additional data provider information.
franklintempleton.com | Annual Report | 23 | ||
FRANKLIN SMALL CAP GROWTH FUND
Your Fund’s Expenses
As a Fund shareholder, you can incur two types of costs: (1) transaction costs, including sales charges (loads) on Fund purchases and redemptions; and (2) ongoing Fund costs, including management fees, distribution and service(12b-1) fees, and other Fund expenses. All mutual funds have ongoing costs, sometimes referred to as operating expenses. The table below shows ongoing costs of investing in the Fund and can help you understand these costs and compare them with those of other mutual funds. The table assumes a $1,000 investment held for the six months indicated.
Actual Fund Expenses
The table below provides information about actual account values and actual expenses in the columns under the heading “Actual.” In these columns the Fund’s actual return, which includes the effect of Fund expenses, is used to calculate the “Ending Account Value” for each class of shares. You can estimate the expenses you paid during the period by following these steps (of course, your account value and expenses will differ from those in this illustration): Divide your account value by $1,000 (if your account had an $8,600 value, then $8,600÷ $1,000 = 8.6). Then multiply the result by the number in the row for your class of shares under the headings “Actual” and “Expenses Paid During Period” (if Actual Expenses Paid During Period were $7.50, then 8.6 x $7.50 =$64.50). In this illustration, the actual expenses paid this period are $64.50.
Hypothetical Example for Comparison with Other Funds
Under the heading “Hypothetical” in the table, information is provided about hypothetical account values and hypothetical expenses based on the Fund’s actual expense ratio and an assumed rate of return of 5% per year before expenses, which is not the Fund’s actual return. This information may not be used to estimate the actual ending account balance or expenses you paid for the period, but it can help you compare ongoing costs of investing in the Fund with those of other funds. To do so, compare this 5% hypothetical example for the class of shares you hold with the 5% hypothetical examples that appear in the shareholder reports of other funds.
Please note that expenses shown in the table are meant to highlight ongoing costs and do not reflect any transactional costs. Therefore, information under the heading “Hypothetical” is useful in comparing ongoing costs only, and will not help you compare total costs of owning different funds. In addition, if transactional costs were included, your total costs would have been higher.
Actual (actual return after expenses) | Hypothetical (5% annual return before expenses) | |||||||||||||||
Share Class | Beginning Value 11/1/18 | Ending Account Value 4/30/19 | Expenses Paid During 11/1/18–4/30/191,2 | Ending Account Value 4/30/19 | Expenses Paid During 11/1/18–4/30/191,2 | Net Annualized Ratio2 | ||||||||||
A | $1,000 | $1,125.90 | $5.64 | $1,019.49 | $5.36 | 1.07% | ||||||||||
C | $1,000 | $1,123.00 | $9.58 | $1,015.77 | $9.10 | 1.82% | ||||||||||
R | $1,000 | $1,124.50 | $6.95 | $1,018.25 | $6.61 | 1.32% | ||||||||||
R6 | $1,000 | $1,127.80 | $3.43 | �� | $1,021.57 | $3.26 | 0.65% | |||||||||
Advisor | $1,000 | $1,126.80 | $4.32 | $1,020.73 | $4.11 | 0.82% | ||||||||||
1. Expenses are equal to the annualized expense ratio for thesix-month period as indicated above—in the far right column—multiplied by the simple average account value over the period indicated, and then multiplied by 181/365 to reflect theone-half year period.
2. Reflects expenses after fee waivers and expense reimbursements. Does not include acquired fund fees and expenses.
| 24 | Annual Report | franklintempleton.com | ||||
FranklinSmall-Mid Cap Growth Fund
This annual report for FranklinSmall-Mid Cap Growth Fund covers the fiscal year ended April 30, 2019.
Your Fund’s Goal and Main Investments
The Fund seeks long-term capital growth by investing, under normal market conditions, at least 80% of its net assets in the equity securities ofsmall-cap andmid-cap companies. The Fund definessmall-cap companies as those within the market capitalization range of companies in the Russell 2500™ Index at the time of purchase, andmid-cap companies as those within the market capitalization range of the Russell Midcap® Index, at the time of purchase.1
Performance Overview
The Fund’s Class A shares posted a +17.43% cumulative total return for the 12 months under review. In comparison, the Russell Midcap® Growth Index, which measures performance of companies in the Russell Midcap® Index with relatively higherprice-to-book ratios and higher forecasted growth values, posted a +17.64% total return.2 Also in comparison, the Standard & Poor’s 500 Index (S&P 500), which tracks the broad U.S. stock market, posted a +13.49% total return.2 You can find the Fund’s long-term performance data in the Performance Summary beginning on page 28.
Performance data represent past performance, which does not guarantee future results. Investment return and principal value will fluctuate, and you may have a gain or loss when you sell your shares. Current performance may differ from figures shown. For most recentmonth-end performance, go tofranklintempleton.comor call(800)342-5236.
Investment Strategy
We use fundamental,bottom-up research to seek companies meeting our criteria of growth potential, quality and valuation. In seeking sustainable growth characteristics, we look for companies we believe can produce sustainable earnings and cash flow growth, evaluating the long-term market opportunity and competitive structure of an industry to target leaders and emerging leaders. We define quality companies as those with strong and improving competitive positions in attractive
Portfolio Composition
Based on Total Net Assets as of 4/30/19
markets. We also believe important attributes of quality are experienced and talented management teams as well as financial strength reflected in the capital structure, gross and operating margins, free cash flow generation and returns on capital employed. Our valuation analysis includes a range of potential outcomes based on an assessment of multiple scenarios. In assessing value, we consider whether security prices fully reflect the balance of the sustainable growth opportunities relative to business and financial risks.
Manager’s Discussion
During the 12 months under review, nearly all sectors represented in the Fund’s portfolio posted positive returns and
1. The Russell 2500 Index is market capitalization weighted and measures performance of the 2,500 smallest companies in the Russell 3000 Index, which represent a modest amount of the Russell 3000 Index’s total market capitalization. The Russell Midcap Index is market capitalization weighted and measures performance of the smallest companies in the Russell 1000 Index, which represent a modest amount of the Russell 1000 Index’s total market capitalization.
2. Source: Morningstar.
The indexes are unmanaged and include reinvestment of any income or distributions. They do not reflect any fees, expenses or sales charges. One cannot invest directly in an index, and an index is not representative of the Fund’s portfolio.
See www.franklintempletondatasources.com for additional data provider information.
The dollar value, number of shares or principal amount, and names of all portfolio holdings are listed in the Fund’s Statement of Investments (SOI).
The SOI begins on page 61.
franklintempleton.com | Annual Report | 25 | ||
FRANKLINSMALL-MID CAP GROWTH FUND
contributed to absolute performance. Relative to the Russell Midcap® Growth Index, key contributors to the Fund’s performance included stock selection and underweightings in the communication services and materials sectors and stock selection in the information technology (IT) sector.
Within communication services, our investment in photo-sharing website operator Pinterest (not part of the index), which recently completed its initial public offering, contributed to relative results. In materials, our position in specialty chemicals and carbon materials manufacturer Ingevity (not part of the index) aided relative results.
In the IT sector, key contributors to relative results included our investments in finance and human resources enterprise cloud applications company Workday, system-level semiconductor solutions developer Integrated Device Technology (not part of the index; not held atperiod-end) and Israel-based web development and management solutions provider Wix.com (not part of the index). Workday’s shares advanced as the company reported generally solid quarterly results during the period. The company saw strong human resources business activity and growing traction in financials activity, and we believe the company’s financials offerings are ready for broader adoption.
Other notable individual contributors to relative performance included our investments in Mercury Systems (not part of the index) and Edwards Lifesciences (not held atperiod-end). Mercury Systems, a provider of secure sensor and safety critical mission processing subsystems, repeatedly raised its fiscal-year 2019 guidance amid strong bookings growth. The company continued to expand its presence in the C41 market by making strategic acquisitions, most recently GECO Avionics, a leading designer of safety critical avionics systems. Edwards Lifesciences, which provides patient-focused medical products for heart disease and critical care monitoring, posted generally solid earnings reports during the period.
In contrast, key detractors from the Fund’s relative performance included stock selection in the consumer discretionary, energy and consumer staples sectors.
Within consumer discretionary, our position in casino resorts operator Wynn Resorts (not held atperiod-end) hurt relative results.
In the energy sector, our position in oil and natural gas exploration and production company Concho Resources hindered relative performance. Concho Resources’ share price declined along with the shares of manyoil-focused companies as crude oil prices fell toward the end of 2018, although the rebound in oil prices during 2019’s first four months helped
Top 10 Holdings
4/30/19
Company Sector/Industry | % of Total Net Assets | |
Microchip Technology Inc. | 2.3% | |
Information Technology
| ||
Verisk Analytics Inc. | 1.9% | |
Industrials
| ||
SBA Communications Corp. | 1.7% | |
Real Estate
| ||
Mettler-Toledo International Inc. | 1.7% | |
Health Care
| ||
CoStar Group Inc. | 1.6% | |
Industrials
| ||
GoDaddy Inc. | 1.6% | |
Information Technology
| ||
MSCI Inc. | 1.5% | |
Financials
| ||
Fortive Corp. | 1.5% | |
Industrials
| ||
Rockwell Automation Inc. | 1.4% | |
Industrials
| ||
IDEX Corp. | 1.4% | |
Industrials |
pare earlier losses. Lower natural gas prices, a refinery outage, spending concerns, disappointing fourth-quarter 2018 earnings results and lower 2019 guidance pressured the stock further. However, company management has kept the balance sheet strong and oil production well hedged to potentially protect against downside risks to cash flows.
In consumer staples, our position in baked sweet goods company Hostess Brands (not part of the index; not held atperiod-end) hindered relative results.
Other key individual detractors from the Fund’s relative performance included positions in education technology company 2U, medical devices company Nevro (not part of the index; not held at period end) and software solutions firm Red Hat (not held atperiod-end). After reachingall-time highs early in the period, 2U’s share price declined due to investor concerns about competition and slowing growth. Nevro’s share price declined due to weaker-than-expected earnings reports and 2019 revenue guidance.
| 26 | Annual Report | franklintempleton.com | ||||
FRANKLINSMALL-MID CAP GROWTH FUND
Thank you for your continued participation in FranklinSmall-Mid Cap Growth Fund. We look forward to serving your future investment needs.
 |
John P. Scandalios | |
 |
Michael P. McCarthy, CFA | |
| Portfolio Management Team | ||


The foregoing information reflects our analysis, opinions and portfolio holdings as of April 30, 2019, the end of the reporting period. The way we implement our main investment strategies and the resulting portfolio holdings may change depending on factors such as market and economic conditions. These opinions may not be relied upon as investment advice or an offer for a particular security. The information is not a complete analysis of every aspect of any market, country, industry, security or the Fund. Statements of fact are from sources considered reliable, but the investment manager makes no representation or warranty as to their completeness or accuracy. Although historical performance is no guarantee of future results, these insights may help you understand our investment management philosophy.
franklintempleton.com | Annual Report | 27 | ||
FRANKLINSMALL-MID CAP GROWTH FUND
Performance Summary as of April 30, 2019
The performance table and graphs do not reflect any taxes that a shareholder would pay on Fund dividends, capital gain distributions, if any, or any realized gains on the sale of Fund shares. Total return reflects reinvestment of the Fund’s dividends and capital gain distributions, if any, and any unrealized gains or losses. Your dividend income will vary depending on dividends or interest paid by securities in the Fund’s portfolio, adjusted for operating expenses of each class. Capital gain distributions are net profits realized from the sale of portfolio securities.
Performance as of 4/30/191
Cumulative total return excludes sales charges. Average annual total return includes maximum sales charges. Sales charges will vary depending on the size of the investment and the class of share purchased. The maximum is 5.50% and the minimum is 0%.Class A:5.50% maximum initial sales charge;Advisor Class:no sales charges. For other share classes, visitfranklintempleton.com.
| Share Class | Cumulative Total Return2 | Average Annual Total Return3 | ||||||
A4 | ||||||||
1-Year
|
| +17.43%
|
|
| +10.97%
|
| ||
5-Year
|
|
+62.58%
|
|
|
+8.97%
|
| ||
10-Year |
|
+290.92%
|
|
|
+13.96% |
| ||
Advisor | ||||||||
1-Year
|
| +17.67%
|
|
| +17.67%
|
| ||
5-Year
|
|
+64.58%
|
|
|
+10.48%
|
| ||
10-Year |
|
+300.76% |
|
|
+14.89% |
| ||
Performance data represent past performance, which does not guarantee future results. Investment return and principal value will fluctuate, and you may have a gain or loss when you sell your shares. Current performance may differ from figures shown. For most recentmonth-end performance, go tofranklintempleton.comor call(800)342-5236.
See page 30 for Performance Summary footnotes.
| 28 | Annual Report | franklintempleton.com | ||||
FRANKLINSMALL-MID CAP GROWTH FUND
PERFORMANCE SUMMARY
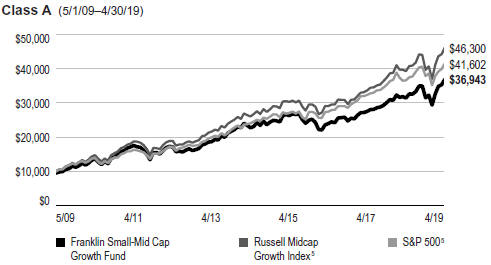
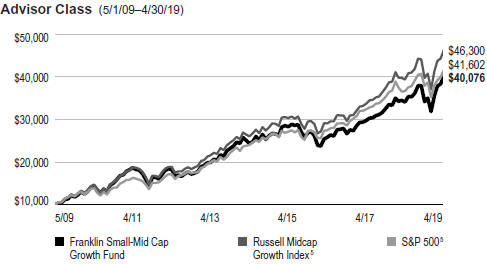
Total Return Index Comparison for a Hypothetical $10,000 Investment1
Total return represents the change in value of an investment over the periods shown. It includes any applicable maximum sales charge, Fund expenses, account fees and reinvested distributions. The unmanaged indexes include reinvestment of any income or distributions. They differ from the Fund in composition and do not pay management fees or expenses. One cannot invest directly in an index.
See page 30 for Performance Summary footnotes.
franklintempleton.com | Annual Report | 29 | ||
FRANKLINSMALL-MID CAP GROWTH FUND
PERFORMANCE SUMMARY
Distributions(5/1/18–4/30/19)
Share Class
| Short-Term Capital Gain
| Long-Term Capital Gain
| Total
| ||||||||||||
A
|
| $0.2790
|
|
| $3.8629
|
|
| $4.1419
|
| ||||||
C
|
|
$0.2790
|
|
|
$3.8629
|
|
|
$4.1419
|
| ||||||
R
|
|
$0.2790
|
|
|
$3.8629
|
|
|
$4.1419
|
| ||||||
R6
|
|
$0.2790
|
|
|
$3.8629
|
|
|
$4.1419
|
| ||||||
Advisor
|
|
$0.2790
|
|
|
$3.8629
|
|
|
$4.1419
|
| ||||||
Total Annual Operating Expenses6
Share Class
| With Fee Waiver
| Without Fee Waiver
| ||||||
A
|
| 0.93%
|
|
| 0.95%
|
| ||
Advisor
|
|
0.68%
|
|
|
0.70%
|
| ||
Each class of shares is available to certain eligible investors and has different annual fees and expenses, as described in the prospectus.
All investments involve risks, including possible loss of principal. Growth stock prices reflect projections of future earnings or revenues, and can, therefore, fall dramatically if the company fails to meet those projections. Smaller, midsized and relatively new or unseasoned companies can be particularly sensitive to changing economic conditions, and their prospects for growth are less certain than those of larger, more established companies. Historically, these securities have experienced more price volatility than larger-company stocks, especially over the short term. To the extent the Fund focuses on particular countries, regions, industries, sectors or types of investment from time to time, it may be subject to greater risks of adverse developments in such areas of focus than a fund that invests in a wider variety of countries, regions, industries, sectors or investments. From time to time, the trading market for a particular security or type of security in which the Fund invests may become less liquid or even illiquid. The Fund is actively managed but there is no guarantee that the manager’s investment decisions will produce the desired results. The Fund’s prospectus also includes a description of the main investment risks.
1. The Fund has a fee waiver associated with any investment it makes in a Franklin Templeton money fund and/or other Franklin Templeton fund, contractually guaranteed through 8/31/19. Fund investment results reflect the fee waiver; without this waiver, the results would have been lower.
2. Cumulative total return represents the change in value of an investment over the periods indicated.
3. Average annual total return represents the average annual change in value of an investment over the periods indicated. Return for less than one year, if any, has not been annualized.
4. Prior to 9/10/18, these shares were offered at a higher initial sales charge of 5.75%, thus actual returns would have differed. Total returns with sales charges have been restated to reflect the current maximum initial sales charge of 5.50%.
5. Source: Morningstar. The Russell Midcap Growth Index is market capitalization weighted and measures performance of those Russell Midcap Index companies with relatively higherprice-to-book ratios and higher forecasted growth values. The S&P 500 is a market capitalization-weighted index of 500 stocks designed to measure total U.S. equity market performance.
6. Figures are as stated in the Fund’s current prospectus and may differ from the expense ratios disclosed in the Your Fund’s Expenses and Financial Highlights sections in this report. In periods of market volatility, assets may decline significantly, causing total annual Fund operating expenses to become higher than the figures shown.
See www.franklintempletondatasources.com for additional data provider information.
| 30 | Annual Report | franklintempleton.com | ||||
FRANKLINSMALL-MID CAP GROWTH FUND
Your Fund’s Expenses
As a Fund shareholder, you can incur two types of costs: (1) transaction costs, including sales charges (loads) on Fund purchases and redemptions; and (2) ongoing Fund costs, including management fees, distribution and service(12b-1) fees, and other Fund expenses. All mutual funds have ongoing costs, sometimes referred to as operating expenses. The table below shows ongoing costs of investing in the Fund and can help you understand these costs and compare them with those of other mutual funds. The table assumes a $1,000 investment held for the six months indicated.
Actual Fund Expenses
The table below provides information about actual account values and actual expenses in the columns under the heading “Actual.” In these columns the Fund’s actual return, which includes the effect of Fund expenses, is used to calculate the “Ending Account Value” for each class of shares. You can estimate the expenses you paid during the period by following these steps (of course, your account value and expenses will differ from those in this illustration): Divide your account value by $1,000 (if your account had an $8,600 value, then $8,600÷ $1,000 = 8.6). Then multiply the result by the number in the row for your class of shares under the headings “Actual” and “Expenses Paid During Period” (if Actual Expenses Paid During Period were $7.50, then 8.6 x $7.50 =$64.50). In this illustration, the actual expenses paid this period are $64.50.
Hypothetical Example for Comparison with Other Funds
Under the heading “Hypothetical” in the table, information is provided about hypothetical account values and hypothetical expenses based on the Fund’s actual expense ratio and an assumed rate of return of 5% per year before expenses, which is not the Fund’s actual return. This information may not be used to estimate the actual ending account balance or expenses you paid for the period, but it can help you compare ongoing costs of investing in the Fund with those of other funds. To do so, compare this 5% hypothetical example for the class of shares you hold with the 5% hypothetical examples that appear in the shareholder reports of other funds.
Please note that expenses shown in the table are meant to highlight ongoing costs and do not reflect any transactional costs. Therefore, information under the heading “Hypothetical” is useful in comparing ongoing costs only, and will not help you compare total costs of owning different funds. In addition, if transactional costs were included, your total costs would have been higher.
Actual (actual return after expenses) | Hypothetical (5% annual return before expenses) | |||||||||||||||||
Share Class | Beginning Value 11/1/18 | Ending Account Value 4/30/19 | Expenses Paid During Period 11/1/18–4/30/191,2 | Ending Account Value 4/30/19 | Expenses Paid During | Net Annualized Expense Ratio2 | ||||||||||||
A | $1,000 | $1,172.00 | $4.63 | $1,020.53 | $4.31 | 0.86% | ||||||||||||
C | $1,000 | $1,169.10 | $8.71 | $1,016.76 | $8.10 | 1.62% | ||||||||||||
R | $1,000 | $1,171.00 | $5.92 | $1,019.34 | $5.51 | 1.10% | ||||||||||||
R6 | $1,000 | $1,173.80 | $2.64 | $1,022.36 | $2.46 | 0.49% | ||||||||||||
Advisor | $1,000 | $1,172.80 | $3.29 | $1,021.77 | $3.06 | 0.61% | ||||||||||||
1. Expenses are equal to the annualized expense ratio for thesix-month period as indicated above—in the far right column—multiplied by the simple average account value over the period indicated, and then multiplied by 181/365 to reflect theone-half year period.
2. Reflects expenses after fee waivers and expense reimbursements. Does not include acquired fund fees and expenses.
franklintempleton.com | Annual Report | 31 | ||
FRANKLIN STRATEGIC SERIES
Financial Highlights
Franklin Growth Opportunities Fund
Year Ended April 30, | ||||||||||||||||||||
| 2019 | 2018 | 2017 | 2016 | 2015 | ||||||||||||||||
Class A | ||||||||||||||||||||
Per share operating performance | ||||||||||||||||||||
(for a share outstanding throughout the year) | ||||||||||||||||||||
Net asset value, beginning of year | $38.58 | $34.81 | $30.40 | $33.13 | $28.48 | |||||||||||||||
Income from investment operationsa: | ||||||||||||||||||||
Net investment income (loss)b | (0.13 | ) | (0.10 | ) | (0.09 | ) | (0.19 | ) | (0.19 | ) | ||||||||||
Net realized and unrealized gains (losses) | 5.29 | 7.03 | 5.14 | (1.88 | ) | 5.50 | ||||||||||||||
Total from investment operations | 5.16 | 6.93 | 5.05 | (2.07 | ) | 5.31 | ||||||||||||||
Less distributions from: | ||||||||||||||||||||
Net realized gains | (4.17 | ) | (3.16 | ) | (0.64 | ) | (0.66 | ) | (0.66 | ) | ||||||||||
Net asset value, end of year | $39.57 | $38.58 | $34.81 | $30.40 | $33.13 | |||||||||||||||
Total returnc | 15.91% | 20.43% | 16.88% | (6.36)% | 18.87% | |||||||||||||||
Ratios to average net assets | ||||||||||||||||||||
Expenses before waiver and payments by affiliates | 0.94% | 1.02% | 1.05% | 1.11% | 1.18% | |||||||||||||||
Expenses net of waiver and payments by affiliates | 0.94% | d,e | 0.99% | d | 0.97% | d | 1.10% | 1.18% | e | |||||||||||
Net investment income (loss) | (0.32)% | (0.27)% | (0.30)% | (0.58)% | (0.59)% | |||||||||||||||
Supplemental data | ||||||||||||||||||||
Net assets, end of year (000’s) | $2,819,007 | $2,428,175 | $2,272,831 | $548,871 | $457,619 | |||||||||||||||
Portfolio turnover rate | 24.21% | 22.68% | 47.75% | 25.56% | 40.64% | |||||||||||||||
aThe amount shown for a share outstanding throughout the period may not correlate with the Statement of Operations for the period due to the timing of sales and repurchases of the Fund’s shares in relation to income earned and/or fluctuating fair value of the investments of the Fund.
bBased on average daily shares outstanding.
cTotal return does not reflect sales commissions or contingent deferred sales charges, if applicable.
dBenefit of expense reduction rounds to less than 0.01%.
eBenefit of waiver and payments by affiliates rounds to less than 0.01%.
| 32 | Annual Report | The accompanying notes are an integral part of these financial statements. | franklintempleton.com | ||||
FRANKLIN STRATEGIC SERIES
FINANCIAL HIGHLIGHTS
Franklin Growth Opportunities Fund(continued)
| Year Ended April 30, | ||||||||||||||||||||
| 2019 | 2018 | 2017 | 2016 | 2015 | ||||||||||||||||
Class C | ||||||||||||||||||||
Per share operating performance | ||||||||||||||||||||
(for a share outstanding throughout the year) | ||||||||||||||||||||
Net asset value, beginning of year | $32.67 | $30.12 | $26.59 | $29.27 | $25.41 | |||||||||||||||
Income from investment operationsa: | ||||||||||||||||||||
Net investment income (loss)b | (0.35 | ) | (0.33 | ) | (0.29 | ) | (0.37 | ) | (0.36 | ) | ||||||||||
Net realized and unrealized gains (losses) | 4.32 | 6.04 | 4.46 | (1.65 | ) | 4.88 | ||||||||||||||
Total from investment operations | 3.97 | 5.71 | 4.17 | (2.02 | ) | 4.52 | ||||||||||||||
Less distributions from: | ||||||||||||||||||||
Net realized gains | (4.17 | ) | (3.16 | ) | (0.64 | ) | (0.66 | ) | (0.66 | ) | ||||||||||
Net asset value, end of year | $32.47 | $32.67 | $30.12 | $26.59 | $29.27 | |||||||||||||||
Total returnc | 15.10% | 19.53% | 15.98% | (7.03)% | 18.04% | |||||||||||||||
Ratios to average net assets | ||||||||||||||||||||
Expenses before waiver and payments by affiliates | 1.69% | 1.77% | 1.80% | 1.85% | 1.88% | |||||||||||||||
Expenses net of waiver and payments by affiliates | 1.69% | d,e | 1.74% | d | 1.72% | d | 1.84% | 1.88% | e | |||||||||||
Net investment income (loss) | (1.07)% | (1.02)% | (1.05)% | (1.32)% | (1.29)% | |||||||||||||||
Supplemental data | ||||||||||||||||||||
Net assets, end of year (000’s) | $244,574 | $400,295 | $390,123 | $137,882 | $110,513 | |||||||||||||||
Portfolio turnover rate | 24.21% | 22.68% | 47.75% | 25.56% | 40.64% | |||||||||||||||
aThe amount shown for a share outstanding throughout the period may not correlate with the Statement of Operations for the period due to the timing of sales and repurchases of the Fund’s shares in relation to income earned and/or fluctuating fair value of the investments of the Fund.
bBased on average daily shares outstanding.
cTotal return does not reflect sales commissions or contingent deferred sales charges, if applicable.
dBenefit of expense reduction rounds to less than 0.01%.
eBenefit of waiver and payments by affiliates rounds to less than 0.01%.
franklintempleton.com | The accompanying notes are an integral part of these financial statements. | Annual Report | 33 | ||
FRANKLIN STRATEGIC SERIES
FINANCIAL HIGHLIGHTS
Franklin Growth Opportunities Fund(continued)
| Year Ended April 30, | ||||||||||||||||||||
| 2019 | 2018 | 2017 | 2016 | 2015 | ||||||||||||||||
Class R | ||||||||||||||||||||
Per share operating performance | ||||||||||||||||||||
(for a share outstanding throughout the year) | ||||||||||||||||||||
Net asset value, beginning of year | $36.93 | $33.52 | $29.37 | $32.10 | $27.67 | |||||||||||||||
Income from investment operationsa: | ||||||||||||||||||||
Net investment income (loss)b | (0.21 | ) | (0.18 | ) | (0.17 | ) | (0.26 | ) | (0.24 | ) | ||||||||||
Net realized and unrealized gains (losses) | 5.02 | 6.75 | 4.96 | (1.81 | ) | 5.33 | ||||||||||||||
Total from investment operations | 4.81 | 6.57 | 4.79 | (2.07 | ) | 5.09 | ||||||||||||||
Less distributions from: | ||||||||||||||||||||
Net realized gains | (4.17 | ) | (3.16 | ) | (0.64 | ) | (0.66 | ) | (0.66 | ) | ||||||||||
Net asset value, end of year | $37.57 | $36.93 | $33.52 | $29.37 | $32.10 | |||||||||||||||
Total return | 15.66% | 20.14% | 16.62% | (6.60)% | 18.63% | |||||||||||||||
Ratios to average net assets | ||||||||||||||||||||
Expenses before waiver and payments by affiliates | 1.19% | 1.27% | 1.30% | 1.35% | 1.38% | |||||||||||||||
Expenses net of waiver and payments by affiliates | 1.19% | c,d | 1.24% | c | 1.22% | c | 1.34% | 1.38% | d | |||||||||||
Net investment income (loss) | (0.57)% | (0.52)% | (0.55)% | (0.82)% | (0.79)% | |||||||||||||||
Supplemental data | ||||||||||||||||||||
Net assets, end of year (000’s) | $37,105 | $36,582 | $50,429 | $39,786 | $48,266 | |||||||||||||||
Portfolio turnover rate | 24.21% | 22.68% | 47.75% | 25.56% | 40.64% | |||||||||||||||
aThe amount shown for a share outstanding throughout the period may not correlate with the Statement of Operations for the period due to the timing of sales and repurchases of the Fund’s shares in relation to income earned and/or fluctuating fair value of the investments of the Fund.
bBased on average daily shares outstanding.
cBenefit of expense reduction rounds to less than 0.01%.
dBenefit of waiver and payments by affiliates rounds to less than 0.01%.
| 34 | Annual Report | The accompanying notes are an integral part of these financial statements. | franklintempleton.com | ||||
FRANKLIN STRATEGIC SERIES
FINANCIAL HIGHLIGHTS
Franklin Growth Opportunities Fund(continued)
| Year Ended April 30, | ||||||||||||||||||||
| 2019 | 2018 | 2017 | 2016 | 2015 | ||||||||||||||||
Class R6 | ||||||||||||||||||||
Per share operating performance | ||||||||||||||||||||
(for a share outstanding throughout the year) | ||||||||||||||||||||
Net asset value, beginning of year | $41.78 | $37.30 | $32.39 | $35.09 | $29.98 | |||||||||||||||
Income from investment operationsa: | ||||||||||||||||||||
Net investment income (loss)b | 0.01 | 0.07 | 0.05 | (0.05 | ) | (0.03 | ) | |||||||||||||
Net realized and unrealized gains (losses) | 5.80 | 7.57 | 5.50 | (1.99 | ) | 5.80 | ||||||||||||||
Total from investment operations | 5.81 | 7.64 | 5.55 | (2.04 | ) | 5.77 | ||||||||||||||
Less distributions from: | ||||||||||||||||||||
Net realized gains | (4.17 | ) | (3.16 | ) | (0.64 | ) | (0.66 | ) | (0.66 | ) | ||||||||||
Net asset value, end of year | $43.42 | $41.78 | $37.30 | $32.39 | $35.09 | |||||||||||||||
Total return | 16.26% | 20.98% | 17.42% | (5.94)% | 19.47% | |||||||||||||||
Ratios to average net assets | ||||||||||||||||||||
Expenses before waiver and payments by affiliates | 0.59% | 0.58% | 0.59% | 0.67% | 0.68% | |||||||||||||||
Expenses net of waiver and payments by affiliates | 0.58% | c | 0.55% | c | 0.51% | c | 0.66% | 0.68% | d | |||||||||||
Net investment income (loss) | 0.04% | 0.17% | 0.16% | (0.14)% | (0.09)% | |||||||||||||||
Supplemental data | ||||||||||||||||||||
Net assets, end of year (000’s) | $418,174 | $369,688 | $291,825 | $235,620 | $246,911 | |||||||||||||||
Portfolio turnover rate | 24.21% | 22.68% | 47.75% | 25.56% | 40.64% | |||||||||||||||
aThe amount shown for a share outstanding throughout the period may not correlate with the Statement of Operations for the period due to the timing of sales and repurchases of the Fund’s shares in relation to income earned and/or fluctuating fair value of the investments of the Fund.
bBased on average daily shares outstanding.
cBenefit of expense reduction rounds to less than 0.01%.
dBenefit of waiver and payments by affiliates rounds to less than 0.01%.
franklintempleton.com | The accompanying notes are an integral part of these financial statements. | Annual Report | 35 | ||
FRANKLIN STRATEGIC SERIES
FINANCIAL HIGHLIGHTS
Franklin Growth Opportunities Fund(continued)
| Year Ended April 30, | ||||||||||||||||||||
| 2019 | 2018 | 2017 | 2016 | 2015 | ||||||||||||||||
Advisor Class | ||||||||||||||||||||
Per share operating performance | ||||||||||||||||||||
(for a share outstanding throughout the year) | ||||||||||||||||||||
Net asset value, beginning of year | $41.34 | $37.02 | $32.20 | $34.96 | $29.93 | |||||||||||||||
Income from investment operationsa: | ||||||||||||||||||||
Net investment income (loss)b | (0.03 | ) | (0.01 | ) | (0.02 | ) | (0.11 | ) | (0.10 | ) | ||||||||||
Net realized and unrealized gains (losses) | 5.73 | 7.49 | 5.48 | (1.99 | ) | 5.79 | ||||||||||||||
Total from investment operations | 5.70 | 7.48 | 5.46 | (2.10 | ) | 5.69 | ||||||||||||||
Less distributions from: | ||||||||||||||||||||
Net realized gains | (4.17 | ) | (3.16 | ) | (0.64 | ) | (0.66 | ) | (0.66 | ) | ||||||||||
Net asset value, end of year | $42.87 | $41.34 | $37.02 | $32.20 | $34.96 | |||||||||||||||
Total return | 16.16% | 20.71% | 17.21% | (6.11)% | 19.23% | |||||||||||||||
Ratios to average net assets | ||||||||||||||||||||
Expenses before waiver and payments by affiliates | 0.69% | 0.77% | 0.80% | 0.85% | 0.88% | |||||||||||||||
Expenses net of waiver and payments by affiliates | 0.69% | c,d | 0.74% | c | 0.72% | c | 0.84% | 0.88% | d | |||||||||||
Net investment income (loss) | (0.07)% | (0.02)% | (0.05)% | (0.32)% | (0.29)% | |||||||||||||||
Supplemental data | ||||||||||||||||||||
Net assets, end of year (000’s) | $506,964 | $583,509 | $537,193 | $256,377 | $269,887 | |||||||||||||||
Portfolio turnover rate | 24.21% | 22.68% | 47.75% | 25.56% | 40.64% | |||||||||||||||
aThe amount shown for a share outstanding throughout the period may not correlate with the Statement of Operations for the period due to the timing of sales and repurchases of the Fund’s shares in relation to income earned and/or fluctuating fair value of the investments of the Fund.
bBased on average daily shares outstanding.
cBenefit of expense reduction rounds to less than 0.01%.
dBenefit of waiver and payments by affiliates rounds to less than 0.01%.
| 36 | Annual Report | The accompanying notes are an integral part of these financial statements. | franklintempleton.com | ||||
FRANKLIN STRATEGIC SERIES
Statement of Investments, April 30, 2019
Franklin Growth Opportunities Fund
Country
| Shares
| Value
| ||||||||||
Common Stocks 96.0% | ||||||||||||
Communication Services 8.1% | ||||||||||||
a Alphabet Inc., C | United States | 130,483 | $ | 155,076,436 | ||||||||
a Electronic Arts Inc. | United States | 265,570 | 25,136,201 | |||||||||
a Facebook Inc., A | United States | 151,743 | 29,347,096 | |||||||||
a Liberty Broadband Corp., C | United States | 387,427 | 38,242,919 | |||||||||
a Netflix Inc. | United States | 91,971 | 34,078,934 | |||||||||
a Pinterest Inc., A | United States | 252,500 | 7,822,450 | |||||||||
The Walt Disney Co. | United States | 259,499 | 35,543,578 | |||||||||
|
| |||||||||||
|
325,247,614 |
| ||||||||||
|
| |||||||||||
Consumer Discretionary 9.1% | ||||||||||||
aAlibaba Group Holding Ltd., ADR | China | 109,054 | 20,237,151 | |||||||||
aAmazon.com Inc. | United States | 163,046 | 314,111,380 | |||||||||
Aptiv PLC | United States | 301,625 | 25,849,262 | |||||||||
aLevi Strauss & Co., A | United States | 314,900 | 7,056,909 | |||||||||
|
| |||||||||||
|
367,254,702 |
| ||||||||||
|
| |||||||||||
Consumer Staples 3.2% | ||||||||||||
Constellation Brands Inc., A | United States | 226,836 | 48,014,376 | |||||||||
Lamb Weston Holdings Inc. | United States | 569,028 | 39,860,411 | |||||||||
aMonster Beverage Corp. | United States | 358,876 | 21,389,010 | |||||||||
aNomad Foods Ltd. | United Kingdom | 977,894 | 20,340,195 | |||||||||
|
| |||||||||||
|
129,603,992 |
| ||||||||||
|
| |||||||||||
Energy 0.7% | ||||||||||||
Diamondback Energy Inc. | United States | 279,605 | 29,747,176 | |||||||||
|
| |||||||||||
Financials 6.6% | ||||||||||||
aAthene Holding Ltd., A | United States | 403,933 | 18,241,614 | |||||||||
The Charles Schwab Corp. | United States | 881,105 | 40,336,987 | |||||||||
Intercontinental Exchange Inc. | United States | 511,297 | 41,594,011 | |||||||||
MarketAxess Holdings Inc. | United States | 112,201 | 31,228,904 | |||||||||
MSCI Inc. | United States | 285,244 | 64,288,293 | |||||||||
S&P Global Inc. | United States | 201,040 | 44,361,487 | |||||||||
aSVB Financial Group | United States | 81,870 | 20,608,316 | |||||||||
aTradeweb Markets Inc. | United States | 86,900 | 3,497,725 | |||||||||
|
| |||||||||||
|
264,157,337 |
| ||||||||||
|
| |||||||||||
Health Care 13.4% | ||||||||||||
aABIOMED Inc. | United States | 111,921 | 31,048,005 | |||||||||
aArray BioPharma Inc. | United States | 659,583 | 14,913,172 | |||||||||
aEdwards Lifesciences Corp. | United States | 293,686 | 51,709,294 | |||||||||
aElanco Animal Health Inc. | United States | 380,235 | 11,977,402 | |||||||||
aGuardant Health Inc. | United States | 264,025 | 17,296,278 | |||||||||
aGW Pharmaceuticals PLC, ADR | United Kingdom | 115,603 | 19,572,744 | |||||||||
aHeron Therapeutics Inc. | United States | 1,341,631 | 29,086,560 | |||||||||
aIDEXX Laboratories Inc. | United States | 91,289 | 21,179,048 | |||||||||
aIllumina Inc. | United States | 118,738 | 37,046,256 | |||||||||
aIntuitive Surgical Inc. | United States | 71,090 | 36,300,687 | |||||||||
aNevro Corp. | United States | 501,908 | 30,972,743 | |||||||||
aPTC Therapeutics Inc. | United States | 582,961 | 21,814,401 | |||||||||
aSage Therapeutics Inc. | United States | 193,267 | 32,513,307 | |||||||||
UnitedHealth Group Inc. | United States | 315,565 | 73,548,734 | |||||||||
aVeeva Systems Inc. | United States | 403,702 | 56,465,799 | |||||||||
West Pharmaceutical Services Inc. | United States | 435,113 | 53,862,638 | |||||||||
|
| |||||||||||
|
539,307,068 |
| ||||||||||
|
| |||||||||||
franklintempleton.com | Annual Report | 37 | ||
FRANKLIN STRATEGIC SERIES
STATEMENT OF INVESTMENTS
Franklin Growth Opportunities Fund(continued)
Country
| Shares
| Value
| ||||||||||
| Common Stocks(continued) | ||||||||||||
Industrials 11.0% | ||||||||||||
The Boeing Co. | United States | 100,153 | $ | 37,826,787 | ||||||||
aCoStar Group Inc. | United States | 177,183 | 87,927,064 | |||||||||
Honeywell International Inc. | United States | 224,356 | 38,954,932 | |||||||||
aIHS Markit Ltd. | United States | 648,526 | 37,134,599 | |||||||||
Raytheon Co. | United States | 331,783 | 58,921,343 | |||||||||
Rockwell Automation Inc. | United States | 162,258 | 29,321,643 | |||||||||
Roper Technologies Inc. | United States | 131,054 | 47,140,124 | |||||||||
Stanley Black & Decker Inc. | United States | 173,302 | 25,406,073 | |||||||||
aUnivar Inc. | United States | 968,887 | 21,635,247 | |||||||||
Verisk Analytics Inc. | United States | 427,189 | 60,293,455 | |||||||||
|
| |||||||||||
|
444,561,267 |
| ||||||||||
|
| |||||||||||
Information Technology 39.7% | ||||||||||||
a2U Inc. | United States | 609,097 | 36,850,368 | |||||||||
aAdobe Inc. | United States | 294,590 | 85,210,157 | |||||||||
Analog Devices Inc. | United States | 293,641 | 34,132,830 | |||||||||
Apple Inc. | United States | 574,257 | 115,236,152 | |||||||||
aAutodesk Inc. | United States | 250,756 | 44,687,227 | |||||||||
aDocuSign Inc. | United States | 174,496 | 9,888,688 | |||||||||
aFiserv Inc. | United States | 372,557 | 32,501,873 | |||||||||
aGuidewire Software Inc. | United States | 205,993 | 21,938,255 | |||||||||
aInterXion Holding NV | Netherlands | 574,065 | 39,719,557 | |||||||||
a,b,cLegalZoom.comInc | United States | 1,673,284 | 20,473,416 | |||||||||
Mastercard Inc., A | United States | 831,281 | 211,344,881 | |||||||||
Microsoft Corp. | United States | 1,607,258 | 209,907,895 | |||||||||
Monolithic Power Systems | United States | 288,836 | 44,974,654 | |||||||||
aNutanix Inc., A | United States | 468,086 | 20,216,634 | |||||||||
NVIDIA Corp. | United States | 215,377 | 38,983,237 | |||||||||
aPagerduty Inc. | United States | 33,500 | 1,571,150 | |||||||||
aPayPal Holdings Inc. | United States | 486,854 | 54,902,526 | |||||||||
aPluralsight Inc., A | United States | 470,947 | 16,713,909 | |||||||||
aPTC Inc. | United States | 301,256 | 27,254,630 | |||||||||
aSalesforce.com Inc. | United States | 393,572 | 65,077,130 | |||||||||
aServiceNow Inc. | United States | 421,492 | 114,439,293 | |||||||||
aTwilio Inc., A | United States | 348,697 | 47,820,307 | |||||||||
aTyler Technologies Inc. | United States | 141,050 | 32,710,906 | |||||||||
Visa Inc., A | United States | 989,673 | 162,731,931 | |||||||||
Xilinx Inc. | United States | 468,455 | 56,280,184 | |||||||||
aZendesk Inc. | United States | 571,236 | 50,143,096 | |||||||||
aZoom Video Communications Inc., A | United States | 42,000 | 3,043,740 | |||||||||
|
| |||||||||||
|
1,598,754,626 |
| ||||||||||
|
| |||||||||||
Materials 0.7% | ||||||||||||
aIngevity Corp. | United States | 234,489 | 26,968,580 | |||||||||
|
| |||||||||||
Real Estate 3.5% | ||||||||||||
American Tower Corp. | United States | 176,850 | 34,538,805 | |||||||||
aSBA Communications Corp., A | United States | 514,810 | 104,882,241 | |||||||||
|
| |||||||||||
|
139,421,046 |
| ||||||||||
|
| |||||||||||
Total Common Stocks (Cost $1,911,784,488) |
|
3,865,023,408 |
| |||||||||
|
| |||||||||||
Preferred Stocks 2.4% | ||||||||||||
Communication Services 0.1% | ||||||||||||
a,b,cTanium Inc., pfd., G | United States | 805,800 | 4,893,610 | |||||||||
|
| |||||||||||
| 38 | Annual Report | franklintempleton.com | ||||
FRANKLIN STRATEGIC SERIES
STATEMENT OF INVESTMENTS
Franklin Growth Opportunities Fund(continued)
Country
| Shares
| Value
| ||||||||||
| ||||||||||||
Preferred Stocks(continued) | ||||||||||||
Consumer Discretionary 1.6% | ||||||||||||
a,b,cClearMotion Inc., pfd., C | United States | 2,610,594 | $ | 6,717,996 | ||||||||
a,b,cClearMotion Inc., pfd., D | United States | 3,698,772 | 10,345,480 | |||||||||
a,b,cProterra Inc., pfd., 5, 144A | United States | 2,362,202 | 22,295,471 | |||||||||
a,b,cProterra Inc., pfd., 6, 144A | United States | 596,775 | 5,632,617 | |||||||||
a,b,cProterra Inc., pfd., 7 | United States | 780,667 | 7,368,268 | |||||||||
a,b,cSweetgreen Inc., pfd., H | United States | 928,488 | 13,006,896 | |||||||||
|
| |||||||||||
|
65,366,728 |
| ||||||||||
|
| |||||||||||
Financials 0.4% | ||||||||||||
a,b,cBill.com, pfd., H | United States | 1,624,999 | 14,395,754 | |||||||||
|
| |||||||||||
Industrials 0.3% | ||||||||||||
a,b,cOptoro Inc., pfd., E | United States | 509,182 | 12,168,487 | |||||||||
|
| |||||||||||
Total Preferred Stocks (Cost $75,426,051) | 96,824,579 | |||||||||||
|
| |||||||||||
Total Investments before Short Term Investments | 3,961,847,987 | |||||||||||
|
| |||||||||||
Short Term Investments (Cost $69,126,928) 1.7% | ||||||||||||
Money Market Funds 1.7% | ||||||||||||
d,eInstitutional Fiduciary Trust Money Market Portfolio, 2.10% | United States | 69,126,928 | 69,126,928 | |||||||||
|
| |||||||||||
Total Investments (Cost $2,056,337,467) 100.1% | 4,030,974,915 | |||||||||||
Other Assets, less Liabilities (0.1)% | (5,151,520 | ) | ||||||||||
|
| |||||||||||
Net Assets 100.0% | $ | 4,025,823,395 | ||||||||||
|
| |||||||||||
See Abbreviations on page 89.
aNon-income producing.
bFair valued using significant unobservable inputs. See Note 10 regarding fair value measurements.
cSee Note 7 regarding restricted securities.
dSee Note 3(f) regarding investments in affiliated management investment companies.
eThe rate shown is the annualizedseven-day effective yield at period end.
franklintempleton.com | The accompanying notes are an integral part of these financial statements. | Annual Report | 39 | ||
FRANKLIN STRATEGIC SERIES
Financial Highlights
Franklin Select U.S. Equity Fund
| Year Ended April 30, | ||||||||||||||||||||
| 2019 | 2018 | 2017 | 2016 | 2015 | ||||||||||||||||
Class A | ||||||||||||||||||||
Per share operating performance | ||||||||||||||||||||
(for a share outstanding throughout the year) | ||||||||||||||||||||
Net asset value, beginning of year | $16.32 | $15.20 | $13.12 | $15.29 | $13.38 | |||||||||||||||
Income from investment operationsa: | ||||||||||||||||||||
Net investment income (loss)b | (0.04 | ) | (0.04 | ) | (0.01 | ) | 0.07 | c | (0.01 | ) | ||||||||||
Net realized and unrealized gains (losses) | 1.41 | 1.16 | 2.09 | (1.83 | ) | 2.23 | ||||||||||||||
Total from investment operations | 1.37 | 1.12 | 2.08 | (1.76 | ) | 2.22 | ||||||||||||||
Less distributions from: | ||||||||||||||||||||
Net investment income | — | — | — | (0.06 | ) | — | ||||||||||||||
Net realized gains | (2.18 | ) | — | — | (0.35 | ) | (0.31 | ) | ||||||||||||
Total distributions | (2.18 | ) | — | — | (0.41 | ) | (0.31 | ) | ||||||||||||
Net asset value, end of year | $15.51 | $16.32 | $15.20 | $13.12 | $15.29 | |||||||||||||||
Total returnd | 10.72% | 7.37% | 15.85% | (11.70)% | 16.84% | |||||||||||||||
Ratios to average net assets | ||||||||||||||||||||
Expenses before waiver and payments by affiliates | 1.51% | 1.54% | 1.47% | 1.46% | 1.54% | |||||||||||||||
Expenses net of waiver and payments by affiliates | 1.23% | e | 1.25% | e | 1.24% | e | 1.25% | 1.28% | ||||||||||||
Net investment income (loss) | (0.22)% | (0.25)% | (0.04)% | 0.48% | c | (0.07)% | ||||||||||||||
Supplemental data | ||||||||||||||||||||
Net assets, end of year (000’s) | $77,230 | $65,565 | $77,733 | $100,483 | $92,612 | |||||||||||||||
Portfolio turnover rate | 4.79% | 93.43% | 17.45% | 35.56% | 25.55% | |||||||||||||||
aThe amount shown for a share outstanding throughout the period may not correlate with the Statement of Operations for the period due to the timing of sales and repurchases of the Fund’s shares in relation to income earned and/or fluctuating fair value of the investments of the Fund.
bBased on average daily shares outstanding.
cNet investment income per share includes approximately $0.06 per share related to income received in the form of special dividends in connection with certain Fund holdings. Excluding this amount, the ratio of net investment income to average net assets would have been 0.02%.
dTotal return does not reflect sales commissions or contingent deferred sales charges, if applicable.
eBenefit of expense reduction rounds to less than 0.01%.
| 40 | Annual Report | The accompanying notes are an integral part of these financial statements. | franklintempleton.com | ||||
FRANKLIN STRATEGIC SERIES
FINANCIAL HIGHLIGHTS
Franklin Select U.S. Equity Fund(continued)
| Year Ended April 30, | ||||||||||||||||||||
| 2019 | 2018 | 2017 | 2016 | 2015 | ||||||||||||||||
Class C | ||||||||||||||||||||
Per share operating performance | ||||||||||||||||||||
(for a share outstanding throughout the year) | ||||||||||||||||||||
Net asset value, beginning of year | $15.42 | $14.46 | $12.58 | $14.73 | $12.98 | |||||||||||||||
Income from investment operationsa: | ||||||||||||||||||||
Net investment income (loss)b | (0.15 | ) | (0.15 | ) | (0.10 | ) | (0.04 | )c | (0.11 | ) | ||||||||||
Net realized and unrealized gains (losses) | 1.31 | 1.11 | 1.98 | (1.76 | ) | 2.17 | ||||||||||||||
Total from investment operations | 1.16 | 0.96 | 1.88 | (1.80 | ) | 2.06 | ||||||||||||||
Less distributions from: | ||||||||||||||||||||
Net realized gains | (2.18 | ) | — | — | (0.35 | ) | (0.31 | ) | ||||||||||||
Net asset value, end of year | $14.40 | $15.42 | $14.46 | $12.58 | $14.73 | |||||||||||||||
Total returnd | 9.95% | 6.64% | 14.94% | (12.31)% | 16.12% | |||||||||||||||
Ratios to average net assets | ||||||||||||||||||||
Expenses before waiver and payments by affiliates | 2.26% | 2.29% | 2.21% | 2.20% | 2.24% | |||||||||||||||
Expenses net of waiver and payments by affiliates | 1.98% | e | 2.00% | e | 1.98% | e | 1.99% | 1.98% | ||||||||||||
Net investment income (loss) | (0.97)% | (1.00)% | (0.78)% | (0.26)% | c | (0.77)% | ||||||||||||||
Supplemental data | ||||||||||||||||||||
Net assets, end of year (000’s) | $15,702 | $18,103 | $20,341 | $25,119 | $18,758 | |||||||||||||||
Portfolio turnover rate | 4.79% | 93.43% | 17.45% | 35.56% | 25.55% | |||||||||||||||
aThe amount shown for a share outstanding throughout the period may not correlate with the Statement of Operations for the period due to the timing of sales and repurchases of the Fund’s shares in relation to income earned and/or fluctuating fair value of the investments of the Fund.
bBased on average daily shares outstanding.
cNet investment income per share includes approximately $0.06 per share related to income received in the form of special dividends in connection with certain Fund holdings. Excluding this amount, the ratio of net investment income to average net assets would have been (0.72)%.
dTotal return does not reflect sales commissions or contingent deferred sales charges, if applicable.
eBenefit of expense reduction rounds to less than 0.01%.
franklintempleton.com | The accompanying notes are an integral part of these financial statements. | Annual Report | 41 | ||
FRANKLIN STRATEGIC SERIES
FINANCIAL HIGHLIGHTS
Franklin Select U.S. Equity Fund(continued)
| Year Ended April 30, | ||||||||||||||||||||
| 2019 | 2018 | 2017 | 2016 | 2015 | ||||||||||||||||
Class R | ||||||||||||||||||||
Per share operating performance | ||||||||||||||||||||
(for a share outstanding throughout the year) | ||||||||||||||||||||
Net asset value, beginning of year | $16.08 | $15.01 | $12.98 | $15.15 | $13.28 | |||||||||||||||
Income from investment operationsa: | ||||||||||||||||||||
Net investment income (loss)b | (0.08 | ) | (0.06 | ) | (0.03 | ) | 0.03 | c | (0.04 | ) | ||||||||||
Net realized and unrealized gains (losses) | 1.39 | 1.13 | 2.06 | (1.81 | ) | 2.22 | ||||||||||||||
Total from investment operations | 1.31 | 1.07 | 2.03 | (1.78 | ) | 2.18 | ||||||||||||||
Less distributions from: | ||||||||||||||||||||
Net investment income | — | — | — | (0.04 | ) | — | ||||||||||||||
Net realized gains | (2.18 | ) | — | — | (0.35 | ) | (0.31 | ) | ||||||||||||
Total distributions | (2.18 | ) | — | — | (0.39 | ) | (0.31 | ) | ||||||||||||
Net asset value, end of year | $15.21 | $16.08 | $15.01 | $12.98 | $15.15 | |||||||||||||||
Total return | 10.50% | 7.13% | 15.64% | (11.91)% | 16.66% | |||||||||||||||
Ratios to average net assets | ||||||||||||||||||||
Expenses before waiver and payments by affiliates | 1.78% | 1.70% | 1.64% | 1.69% | 1.74% | |||||||||||||||
Expenses net of waiver and payments by affiliates | 1.50% | d | 1.41% | d | 1.41% | d | 1.48% | 1.48% | ||||||||||||
Net investment income (loss) | (0.49)% | (0.41)% | (0.21)% | 0.25% | c | (0.27)% | ||||||||||||||
Supplemental data | ||||||||||||||||||||
Net assets, end of year (000’s) | $144 | $137 | $166 | $273 | $169 | |||||||||||||||
Portfolio turnover rate | 4.79% | 93.43% | 17.45% | 35.56% | 25.55% | |||||||||||||||
aThe amount shown for a share outstanding throughout the period may not correlate with the Statement of Operations for the period due to the timing of sales and repurchases of the Fund’s shares in relation to income earned and/or fluctuating fair value of the investments of the Fund.
bBased on average daily shares outstanding.
cNet investment income per share includes approximately $0.06 per share related to income received in the form of special dividends in connection with certain Fund holdings. Excluding this amount, the ratio of net investment income to average net assets would have been (0.21)%.
dBenefit of expense reduction rounds to less than 0.01%.
| 42 | Annual Report | The accompanying notes are an integral part of these financial statements. | franklintempleton.com | ||||
FRANKLIN STRATEGIC SERIES
FINANCIAL HIGHLIGHTS
Franklin Select U.S. Equity Fund(continued)
| Year Ended April 30, | ||||||||||||||||||||
| 2019 | 2018 | 2017 | 2016 | 2015 | ||||||||||||||||
Class R6 | ||||||||||||||||||||
Per share operating performance | ||||||||||||||||||||
(for a share outstanding throughout the year) | ||||||||||||||||||||
Net asset value, beginning of year | $16.64 | $15.44 | $13.27 | $15.46 | $13.49 | |||||||||||||||
Income from investment operationsa: | ||||||||||||||||||||
Net investment incomeb | 0.02 | 0.11 | 0.05 | 0.12 | c | 0.05 | ||||||||||||||
Net realized and unrealized gains (losses) | 1.45 | 1.09 | 2.12 | (1.85 | ) | 2.27 | ||||||||||||||
Total from investment operations | 1.47 | 1.20 | 2.17 | (1.73 | ) | 2.32 | ||||||||||||||
Less distributions from: | ||||||||||||||||||||
Net investment income | — | — | — | (0.11 | ) | (0.04 | ) | |||||||||||||
Net realized gains | (2.18 | ) | — | — | (0.35 | ) | (0.31 | ) | ||||||||||||
Total distributions | (2.18 | ) | — | — | (0.46 | ) | (0.35 | ) | ||||||||||||
Net asset value, end of year | $15.93 | $16.64 | $15.44 | $13.27 | $15.46 | |||||||||||||||
Total return | 11.13% | 7.77% | 16.35% | (11.32)% | 17.45% | |||||||||||||||
Ratios to average net assets | ||||||||||||||||||||
Expenses before waiver and payments by affiliates | 1.22% | 1.12% | 1.06% | 1.04% | 1.09% | |||||||||||||||
Expenses net of waiver and payments by affiliates | 0.87% | d | 0.84% | d | 0.84% | d | 0.85% | 0.83% | ||||||||||||
Net investment income | 0.14% | 0.16% | 0.36% | 0.88% | c | 0.38% | ||||||||||||||
Supplemental data | ||||||||||||||||||||
Net assets, end of year (000’s) | $971 | $939 | $20,401 | $33,640 | $25,739 | |||||||||||||||
Portfolio turnover rate | 4.79% | 93.43% | 17.45% | 35.56% | 25.55% | |||||||||||||||
aThe amount shown for a share outstanding throughout the period may not correlate with the Statement of Operations for the period due to the timing of sales and repurchases of the Fund’s shares in relation to income earned and/or fluctuating fair value of the investments of the Fund.
bBased on average daily shares outstanding.
cNet investment income per share includes approximately $0.06 per share related to income received in the form of special dividends in connection with certain Fund holdings. Excluding this amount, the ratio of net investment income to average net assets would have been 0.42%.
dBenefit of expense reduction rounds to less than 0.01%.
franklintempleton.com | The accompanying notes are an integral part of these financial statements. | Annual Report | 43 | ||
FRANKLIN STRATEGIC SERIES
FINANCIAL HIGHLIGHTS
Franklin Select U.S. Equity Fund(continued)
| Year Ended April 30, | ||||||||||||||||||||
| 2019 | 2018 | 2017 | 2016 | 2015 | ||||||||||||||||
Advisor Class | ||||||||||||||||||||
Per share operating performance | ||||||||||||||||||||
(for a share outstanding throughout the year) | ||||||||||||||||||||
Net asset value, beginning of year | $16.57 | $15.39 | $13.25 | $15.44 | $13.48 | |||||||||||||||
Income from investment operationsa: | ||||||||||||||||||||
Net investment incomeb | 0.01 | — | c | 0.03 | 0.10 | d | 0.04 | |||||||||||||
Net realized and unrealized gains (losses) | 1.44 | 1.18 | 2.11 | (1.85 | ) | 2.25 | ||||||||||||||
Total from investment operations | 1.45 | 1.18 | 2.14 | (1.75 | ) | 2.29 | ||||||||||||||
Less distributions from: | ||||||||||||||||||||
Net investment income | — | — | — | (0.09 | ) | (0.02 | ) | |||||||||||||
Net realized gains | (2.18 | ) | — | — | (0.35 | ) | (0.31 | ) | ||||||||||||
Total distributions | (2.18 | ) | — | — | (0.44 | ) | (0.33 | ) | ||||||||||||
Net asset value, end of year | $15.84 | $16.57 | $15.39 | $13.25 | $15.44 | |||||||||||||||
Total return | 11.06% | 7.67% | 16.15% | (11.45)% | 17.25% | |||||||||||||||
Ratios to average net assets | ||||||||||||||||||||
Expenses before waiver and payments by affiliates | 1.26% | 1.29% | 1.22% | 1.20% | 1.24% | |||||||||||||||
Expenses net of waiver and payments by affiliates | 0.98% | e | 1.00% | e | 0.99% | e | 0.99% | 0.98% | ||||||||||||
Net investment income | 0.03% | —% | f | 0.21% | 0.74% | d | 0.23% | |||||||||||||
Supplemental data | ||||||||||||||||||||
Net assets, end of year (000’s) | $28,668 | $10,450 | $13,077 | $10,736 | $9,914 | |||||||||||||||
Portfolio turnover rate | 4.79% | 93.43% | 17.45% | 35.56% | 25.55% | |||||||||||||||
aThe amount shown for a share outstanding throughout the period may not correlate with the Statement of Operations for the period due to the timing of sales and repurchases of the Fund’s shares in relation to income earned and/or fluctuating fair value of the investments of the Fund.
bBased on average daily shares outstanding.
cAmount rounds to less than $0.01 per share.
dNet investment income per share includes approximately $0.06 per share related to income received in the form of special dividends in connection with certain Fund holdings. Excluding this amount, the ratio of net investment income to average net assets would have been 0.28%.
eBenefit of expense reduction rounds to less than 0.01%.
fRounds to less than 0.01%.
| 44 | Annual Report | The accompanying notes are an integral part of these financial statements. | franklintempleton.com | ||||
FRANKLIN STRATEGIC SERIES
Statement of Investments, April 30, 2019
Franklin Select U.S. Equity Fund
Country
| Shares
| Value
| ||||||||
Common Stocks 94.0% | ||||||||||
Communication Services 6.7% | ||||||||||
a Alphabet Inc., A | United States | 3,100 | $ | 3,716,776 | ||||||
a Electronic Arts Inc. | United States | 16,700 | 1,580,655 | |||||||
The Walt Disney Co. | United States | 21,100 | 2,890,067 | |||||||
|
| |||||||||
|
8,187,498 |
| ||||||||
|
| |||||||||
Consumer Discretionary 10.0% | ||||||||||
aAlibaba Group Holding Ltd., ADR | China | 15,700 | 2,913,449 | |||||||
aAmazon.com Inc. | United States | 2,720 | 5,240,134 | |||||||
Aptiv PLC | United States | 17,900 | 1,534,030 | |||||||
NIKE Inc., B | United States | 30,200 | 2,652,466 | |||||||
|
| |||||||||
|
12,340,079 |
| ||||||||
|
| |||||||||
Consumer Staples 6.0% | ||||||||||
Constellation Brands Inc., A | United States | 9,100 | 1,926,197 | |||||||
Estee Lauder Cos. Inc., A | United States | 10,700 | 1,838,367 | |||||||
Lamb Weston Holdings Inc. | United States | 27,000 | 1,891,350 | |||||||
aMonster Beverage Corp. | United States | 28,500 | 1,698,600 | |||||||
|
| |||||||||
|
7,354,514 |
| ||||||||
|
| |||||||||
Energy 2.5% | ||||||||||
Cabot Oil & Gas Corp., A | United States | 68,100 | 1,763,109 | |||||||
Concho Resources Inc. | United States | 10,900 | 1,257,642 | |||||||
|
| |||||||||
|
3,020,751 |
| ||||||||
|
| |||||||||
Financials 8.5% | ||||||||||
BlackRock Inc. | United States | 6,000 | 2,911,440 | |||||||
The Charles Schwab Corp. | United States | 59,300 | 2,714,754 | |||||||
Intercontinental Exchange Inc. | United States | 29,700 | 2,416,095 | |||||||
S&P Global Inc. | United States | 11,000 | 2,427,260 | |||||||
|
| |||||||||
|
10,469,549 |
| ||||||||
|
| |||||||||
Health Care 14.1% | ||||||||||
aABIOMED Inc. | United States | 4,900 | 1,359,309 | |||||||
AstraZeneca PLC, ADR | United Kingdom | 60,600 | 2,282,196 | |||||||
aIllumina Inc. | United States | 6,200 | 1,934,400 | |||||||
aMettler-Toledo International Inc. | United States | 3,650 | 2,720,199 | |||||||
Stryker Corp. | United States | 12,600 | 2,380,266 | |||||||
Teleflex Inc. | United States | 7,900 | 2,260,822 | |||||||
UnitedHealth Group Inc. | United States | 10,900 | 2,540,463 | |||||||
aWaters Corp. | United States | 8,300 | 1,772,382 | |||||||
|
| |||||||||
|
17,250,037 |
| ||||||||
|
| |||||||||
Industrials 12.3% | ||||||||||
3M Co. | United States | 10,950 | 2,075,135 | |||||||
BWX Technologies Inc. | United States | 26,000 | 1,328,600 | |||||||
FedEx Corp. | United States | 8,400 | 1,591,464 | |||||||
Fortive Corp. | United States | 33,600 | 2,901,024 | |||||||
Raytheon Co. | United States | 13,400 | 2,379,706 | |||||||
Republic Services Inc. | United States | 24,300 | 2,012,526 | |||||||
Verisk Analytics Inc. | United States | 20,200 | 2,851,028 | |||||||
|
| |||||||||
|
15,139,483 |
| ||||||||
|
| |||||||||
Information Technology 26.5% | ||||||||||
aAdyen NV | Netherlands | 429 | 349,165 | |||||||
Amphenol Corp., A | United States | 18,800 | 1,871,728 | |||||||
Analog Devices Inc. | United States | 31,350 | 3,644,124 | |||||||
franklintempleton.com | The accompanying notes are an integral part of these financial statements. | Annual Report | 45 | ||
FRANKLIN STRATEGIC SERIES
STATEMENT OF INVESTMENTS
Franklin Select U.S. Equity Fund(continued)
Country
| Shares
| Value
| ||||||||||
| Common Stocks(continued) | ||||||||||||
Information Technology(continued) | ||||||||||||
Apple Inc. | United States | 12,000 | $ | 2,408,040 | ||||||||
Applied Materials Inc. | United States | 54,000 | 2,379,780 | |||||||||
Cognex Corp. | United States | 32,500 | 1,638,975 | |||||||||
aInterXion Holding NV | Netherlands | 35,100 | 2,428,569 | |||||||||
Mastercard Inc., A | United States | 13,700 | 3,483,088 | |||||||||
Microsoft Corp. | United States | 35,600 | 4,649,360 | |||||||||
NVIDIA Corp. | United States | 10,950 | 1,981,950 | |||||||||
aSalesforce.com Inc. | United States | 16,450 | 2,720,008 | |||||||||
aServiceNow Inc. | United States | 11,900 | 3,230,969 | |||||||||
aTyler Technologies Inc. | United States | 7,300 | 1,692,943 | |||||||||
|
| |||||||||||
|
32,478,699 |
| ||||||||||
|
| |||||||||||
Materials 2.9% | ||||||||||||
Albemarle Corp. | United States | 12,000 | 900,720 | |||||||||
Ecolab Inc. | United States | 14,600 | 2,687,568 | |||||||||
|
| |||||||||||
|
3,588,288 |
| ||||||||||
|
| |||||||||||
Real Estate 2.0% | ||||||||||||
aSBA Communications Corp., A | United States | 12,200 | 2,485,506 | |||||||||
|
| |||||||||||
Utilities 2.5% | ||||||||||||
NextEra Energy Inc. | United States | 15,700 | 3,052,708 | |||||||||
|
| |||||||||||
Total Common Stocks (Cost $96,348,998) | 115,367,112 | |||||||||||
|
| |||||||||||
Short Term Investments (Cost $7,161,073) 5.8% | ||||||||||||
Money Market Funds 5.8% | ||||||||||||
b,cInstitutional Fiduciary Trust Money Market Portfolio, 2.10% | United States | 7,161,073 | 7,161,073 | |||||||||
|
| |||||||||||
Total Investments (Cost $103,510,071) 99.8% | 122,528,185 | |||||||||||
Other Assets, less Liabilities 0.2% | 187,072 | |||||||||||
|
| |||||||||||
Net Assets 100.0% | $ | 122,715,257 | ||||||||||
|
| |||||||||||
See Abbreviations on page 89.
aNon-income producing.
bSee Note 3(f) regarding investments in affiliated management investment companies.
cThe rate shown is the annualizedseven-day effective yield at period end.
| 46 | Annual Report | The accompanying notes are an integral part of these financial statements. | franklintempleton.com | ||||
FRANKLIN STRATEGIC SERIES
Financial Highlights
Franklin Small Cap Growth Fund
| Year Ended April 30, | ||||||||||||||||||||
| 2019 | 2018 | 2017 | 2016 | 2015 | ||||||||||||||||
Class A | ||||||||||||||||||||
Per share operating performance | ||||||||||||||||||||
(for a share outstanding throughout the year) | ||||||||||||||||||||
Net asset value, beginning of year | $23.01 | $19.60 | $16.37 | $18.83 | $18.20 | |||||||||||||||
Income from investment operationsa: | ||||||||||||||||||||
Net investment income (loss)b | (0.15 | ) | (0.13 | ) | (0.11 | ) | (0.08 | ) | (0.12 | ) | ||||||||||
Net realized and unrealized gains (losses) | 2.86 | 3.96 | 3.34 | (2.03 | ) | 1.57 | ||||||||||||||
Total from investment operations | 2.71 | 3.83 | 3.23 | (2.11 | ) | 1.45 | ||||||||||||||
Less distributions from: | ||||||||||||||||||||
Net realized gains | (4.26) | (0.42 | ) | — | (0.35 | ) | (0.82 | ) | ||||||||||||
Net asset value, end of year | $21.46 | $23.01 | $19.60 | $16.37 | $18.83 | |||||||||||||||
Total returnc | 16.06% | 19.71% | 19.73% | (11.28)% | 8.34% | |||||||||||||||
Ratios to average net assets | ||||||||||||||||||||
Expenses before waiver and payments by affiliates | 1.07% | 1.11% | 1.10% | 1.13% | 1.16% | |||||||||||||||
Expenses net of waiver and payments by affiliates | 1.06% | d | 1.10% | d | 1.08% | d | 1.11% | d | 1.16% | e | ||||||||||
Net investment income (loss) | (0.68)% | (0.61)% | (0.61)% | (0.44)% | (0.66)% | |||||||||||||||
Supplemental data | ||||||||||||||||||||
Net assets, end of year (000’s) | $713,442 | $665,251 | $719,752 | $792,072 | $1,164,218 | |||||||||||||||
Portfolio turnover rate | 42.10% | 29.82% | 29.93% | 43.99% | 30.15% | |||||||||||||||
aThe amount shown for a share outstanding throughout the period may not correlate with the Statement of Operations for the period due to the timing of sales and repurchases of the Fund’s shares in relation to income earned and/or fluctuating fair value of the investments of the Fund.
bBased on average daily shares outstanding.
cTotal return does not reflect sales commissions or contingent deferred sales charges, if applicable.
dBenefit of expense reduction rounds to less than 0.01%.
eBenefit of waiver and payments by affiliates and expense reduction rounds to less than 0.01%.
franklintempleton.com | The accompanying notes are an integral part of these financial statements. | Annual Report | 47 | ||
FRANKLIN STRATEGIC SERIES
FINANCIAL HIGHLIGHTS
Franklin Small Cap Growth Fund(continued)
| Year Ended April 30, | ||||||||||||||||||||
| 2019 | 2018 | 2017 | 2016 | 2015 | ||||||||||||||||
Class C | ||||||||||||||||||||
Per share operating performance | ||||||||||||||||||||
(for a share outstanding throughout the year) | ||||||||||||||||||||
Net asset value, beginning of year | $19.41 | $16.71 | $14.07 | $16.36 | $16.03 | |||||||||||||||
Income from investment operationsa: | ||||||||||||||||||||
Net investment income (loss)b | (0.28 | ) | (0.25 | ) | (0.21 | ) | (0.18 | ) | (0.22 | ) | ||||||||||
Net realized and unrealized gains (losses) | 2.28 | 3.37 | 2.85 | (1.76 | ) | 1.37 | ||||||||||||||
Total from investment operations | 2.00 | 3.12 | 2.64 | (1.94 | ) | 1.15 | ||||||||||||||
Less distributions from: | ||||||||||||||||||||
Net realized gains | (4.26 | ) | (0.42 | ) | — | (0.35 | ) | (0.82 | ) | |||||||||||
Net asset value, end of year | $17.15 | $19.41 | $16.71 | $14.07 | $16.36 | |||||||||||||||
Total returnc | 15.31% | 18.79% | 18.76% | (11.95)% | 7.58% | |||||||||||||||
Ratios to average net assets | ||||||||||||||||||||
Expenses before waiver and payments by affiliates | 1.82% | 1.86% | 1.85% | 1.88% | 1.87% | |||||||||||||||
Expenses net of waiver and payments by affiliates | 1.81% | d | 1.85% | d | 1.83% | d | 1.86% | d | 1.87% | e | ||||||||||
Net investment income (loss) | (1.43)% | (1.36)% | (1.36)% | (1.19)% | (1.37)% | |||||||||||||||
Supplemental data | ||||||||||||||||||||
Net assets, end of year (000’s) | $90,513 | $132,116 | $142,539 | $157,175 | $225,105 | |||||||||||||||
Portfolio turnover rate | 42.10% | 29.82% | 29.93% | 43.99% | 30.15% | |||||||||||||||
aThe amount shown for a share outstanding throughout the period may not correlate with the Statement of Operations for the period due to the timing of sales and repurchases of the Fund’s shares in relation to income earned and/or fluctuating fair value of the investments of the Fund.
bBased on average daily shares outstanding.
cTotal return does not reflect sales commissions or contingent deferred sales charges, if applicable.
dBenefit of expense reduction rounds to less than 0.01%.
eBenefit of waiver and payments by affiliates and expense reduction rounds to less than 0.01%.
| 48 | Annual Report | The accompanying notes are an integral part of these financial statements. | franklintempleton.com | ||||
FRANKLIN STRATEGIC SERIES
FINANCIAL HIGHLIGHTS
Franklin Small Cap Growth Fund(continued)
| Year Ended April 30, | ||||||||||||||||||||
| 2019 | 2018 | 2017 | 2016 | 2015 | ||||||||||||||||
Class R | ||||||||||||||||||||
Per share operating performance | ||||||||||||||||||||
(for a share outstanding throughout the year) | ||||||||||||||||||||
Net asset value, beginning of year | $21.93 | $18.74 | $15.70 | $18.11 | $17.57 | |||||||||||||||
Income from investment operationsa: | ||||||||||||||||||||
Net investment income (loss)b | (0.20 | ) | (0.17 | ) | (0.15 | ) | (0.12 | ) | (0.16 | ) | ||||||||||
Net realized and unrealized gains (losses) | 2.68 | 3.78 | 3.19 | (1.94 | ) | 1.52 | ||||||||||||||
Total from investment operations | 2.48 | 3.61 | 3.04 | (2.06 | ) | 1.36 | ||||||||||||||
Less distributions from: | ||||||||||||||||||||
Net realized gains | (4.26 | ) | (0.42 | ) | — | (0.35 | ) | (0.82 | ) | |||||||||||
Net asset value, end of year | $20.15 | $21.93 | $18.74 | $15.70 | $18.11 | |||||||||||||||
Total return | 15.78% | 19.37% | 19.36% | (11.46)% | 8.12% | |||||||||||||||
Ratios to average net assets | ||||||||||||||||||||
Expenses before waiver and payments by affiliates | 1.32% | 1.36% | 1.35% | 1.38% | 1.37% | |||||||||||||||
Expenses net of waiver and payments by affiliates | 1.31% | c | 1.35% | c | 1.33% | c | 1.36% | c | 1.37% | d | ||||||||||
Net investment income (loss) | (0.93)% | (0.86)% | (0.86)% | (0.69)% | (0.87)% | |||||||||||||||
Supplemental data | ||||||||||||||||||||
Net assets, end of year (000’s) | $74,634 | $71,398 | $79,995 | $79,929 | $92,455 | |||||||||||||||
Portfolio turnover rate | 42.10% | 29.82% | 29.93% | 43.99% | 30.15% | |||||||||||||||
aThe amount shown for a share outstanding throughout the period may not correlate with the Statement of Operations for the period due to the timing of sales and repurchases of the Fund’s shares in relation to income earned and/or fluctuating fair value of the investments of the Fund.
bBased on average daily shares outstanding.
cBenefit of expense reduction rounds to less than 0.01%.
dBenefit of waiver and payments by affiliates and expense reduction rounds to less than 0.01%.
franklintempleton.com | The accompanying notes are an integral part of these financial statements. | Annual Report | 49 | ||
FRANKLIN STRATEGIC SERIES
FINANCIAL HIGHLIGHTS
Franklin Small Cap Growth Fund(continued)
| Year Ended April 30, | ||||||||||||||||||||
| 2019 | 2018 | 2017 | 2016 | 2015 | ||||||||||||||||
Class R6 | ||||||||||||||||||||
Per share operating performance | ||||||||||||||||||||
(for a share outstanding throughout the year) | ||||||||||||||||||||
Net asset value, beginning of year | $24.88 | $21.06 | $17.52 | $20.02 | $19.21 | |||||||||||||||
Income from investment operationsa: | ||||||||||||||||||||
Net investment income (loss)b | (0.07 | ) | (0.03 | ) | (0.03 | ) | 0.01 | (0.03 | ) | |||||||||||
Net realized and unrealized gains (losses) | 3.18 | 4.27 | 3.57 | (2.16 | ) | 1.66 | ||||||||||||||
Total from investment operations | 3.11 | 4.24 | 3.54 | (2.15 | ) | 1.63 | ||||||||||||||
Less distributions from: | ||||||||||||||||||||
Net realized gains | (4.26 | ) | (0.42 | ) | — | (0.35 | ) | (0.82 | ) | |||||||||||
Net asset value, end of year | $23.73 | $24.88 | $21.06 | $17.52 | $20.02 | |||||||||||||||
Total return | 16.50% | 20.23% | 20.21% | (10.81)% | 8.91% | |||||||||||||||
Ratios to average net assets | ||||||||||||||||||||
Expenses before waiver and payments by affiliates | 0.67% | 0.65% | 0.63% | 0.63% | 0.66% | |||||||||||||||
Expenses net of waiver and payments by affiliates | 0.64% | c | 0.63% | c | 0.61% | c | 0.61% | c | 0.66% | d | ||||||||||
Net investment income (loss) | (0.26)% | (0.14)% | (0.14)% | 0.06% | (0.16)% | |||||||||||||||
Supplemental data | ||||||||||||||||||||
Net assets, end of year (000’s) | $1,084,442 | $935,509 | $858,972 | $846,724 | $844,293 | |||||||||||||||
Portfolio turnover rate | 42.10% | 29.82% | 29.93% | 43.99% | 30.15% | |||||||||||||||
aThe amount shown for a share outstanding throughout the period may not correlate with the Statement of Operations for the period due to the timing of sales and repurchases of the Fund’s shares in relation to income earned and/or fluctuating fair value of the investments of the Fund.
bBased on average daily shares outstanding.
cBenefit of expense reduction rounds to less than 0.01%.
dBenefit of waiver and payments by affiliates and expense reduction rounds to less than 0.01%.
| 50 | Annual Report | The accompanying notes are an integral part of these financial statements. | franklintempleton.com | ||||
FRANKLIN STRATEGIC SERIES
FINANCIAL HIGHLIGHTS
Franklin Small Cap Growth Fund(continued)
| Year Ended April 30, | ||||||||||||||||||||
| 2019 | 2018 | 2017 | 2016 | 2015 | ||||||||||||||||
Advisor Class | ||||||||||||||||||||
Per share operating performance | ||||||||||||||||||||
(for a share outstanding throughout the year) | ||||||||||||||||||||
Net asset value, beginning of year | $24.61 | $20.88 | $17.41 | $19.94 | $19.17 | |||||||||||||||
Income from investment operationsa: | ||||||||||||||||||||
Net investment income (loss)b | (0.10 | ) | (0.08 | ) | (0.07 | ) | (0.04 | ) | (0.07 | ) | ||||||||||
Net realized and unrealized gains (losses) | 3.12 | 4.23 | 3.54 | (2.14 | ) | 1.66 | ||||||||||||||
Total from investment operations | 3.02 | 4.15 | 3.47 | (2.18 | ) | 1.59 | ||||||||||||||
Less distributions from: | ||||||||||||||||||||
Net realized gains | (4.26 | ) | (0.42 | ) | — | (0.35 | ) | (0.82 | ) | |||||||||||
Net asset value, end of year | $23.37 | $24.61 | $20.88 | $17.41 | $19.94 | |||||||||||||||
Total return | 16.30% | 19.97% | 19.93% | (11.06)% | 8.65% | |||||||||||||||
Ratios to average net assets | ||||||||||||||||||||
Expenses before waiver and payments by affiliates | 0.82% | 0.86% | 0.85% | 0.88% | 0.87% | |||||||||||||||
Expenses net of waiver and payments by affiliates | 0.81% | c | 0.85% | c | 0.83% | c | 0.86% | c | 0.87% | d | ||||||||||
Net investment income (loss) | (0.43)% | (0.36)% | (0.36)% | (0.19)% | (0.37)% | |||||||||||||||
Supplemental data | ||||||||||||||||||||
Net assets, end of year (000’s) | $725,622 | $713,135 | $805,661 | $850,975 | $1,077,822 | |||||||||||||||
Portfolio turnover rate | 42.10% | 29.82% | 29.93% | 43.99% | 30.15% | |||||||||||||||
aThe amount shown for a share outstanding throughout the period may not correlate with the Statement of Operations for the period due to the timing of sales and repurchases of the Fund’s shares in relation to income earned and/or fluctuating fair value of the investments of the Fund.
bBased on average daily shares outstanding.
cBenefit of expense reduction rounds to less than 0.01%.
dBenefit of waiver and payments by affiliates and expense reduction rounds to less than 0.01%.
franklintempleton.com | The accompanying notes are an integral part of these financial statements. | Annual Report | 51 | ||
FRANKLIN STRATEGIC SERIES
Statement of Investments, April 30, 2019
Franklin Small Cap Growth Fund
Shares
| Value
| |||||||
Common Stocks 93.0% | ||||||||
Communication Services 1.7% | ||||||||
aIMAX Corp. | 680,200 | $ | 16,583,276 | |||||
aYelp Inc. | 766,600 | 30,709,996 | ||||||
|
| |||||||
|
47,293,272 |
| ||||||
|
| |||||||
Consumer Discretionary 13.4% | ||||||||
aAt Home Group Inc. | 1,236,400 | 29,043,036 | ||||||
aBoot Barn Holdings Inc. | 794,703 | 22,879,499 | ||||||
Dave & Buster’s Entertainment Inc. | 536,500 | 30,494,660 | ||||||
a,b,cDraftKings Inc. | 9,905,685 | 25,454,688 | ||||||
aDuluth Holdings Inc. | 773,911 | 12,320,663 | ||||||
aFive Below Inc. | 175,500 | 25,691,445 | ||||||
aGrand Canyon Education Inc. | 360,700 | 41,801,523 | ||||||
Lithia Motors Inc. | 272,700 | 30,956,904 | ||||||
aM/I Homes Inc. | 1,256,976 | 35,409,014 | ||||||
aRH | 277,100 | 29,569,341 | ||||||
a,dSportsman’s Warehouse Holdings Inc. | 3,588,200 | 16,003,372 | ||||||
Steven Madden Ltd. | 902,450 | 32,804,058 | ||||||
Wingstop Inc. | 359,829 | 27,084,329 | ||||||
|
| |||||||
|
359,512,532 |
| ||||||
|
| |||||||
Consumer Staples 1.7% | ||||||||
aHostess Brands Inc., A | 908,700 | 12,176,580 | ||||||
aNomad Foods Ltd. (United Kingdom) | 756,600 | 15,737,280 | ||||||
aThe Simply Good Foods Co. | 754,600 | 16,948,316 | ||||||
|
| |||||||
|
44,862,176 |
| ||||||
|
| |||||||
Energy 2.3% | ||||||||
aCallon Petroleum Co. | 3,498,500 | 26,273,735 | ||||||
Liberty Oilfield Services Inc., A | 1,399,900 | 20,872,510 | ||||||
aRing Energy Inc. | 2,634,077 | 13,644,519 | ||||||
|
| |||||||
|
60,790,764 |
| ||||||
|
| |||||||
Financials 7.2% | ||||||||
Chemical Financial Corp. | 623,723 | 27,400,151 | ||||||
Evercore Inc. | 180,800 | 17,615,344 | ||||||
FGL Holdings., A | 1,464,200 | 12,489,626 | ||||||
Houlihan Lokey Inc. | 566,400 | 27,934,848 | ||||||
LegacyTexas Financial Group Inc. | 443,160 | 17,761,853 | ||||||
aMetropolitan Bank Holding Corp. | 318,661 | 12,717,761 | ||||||
Pinnacle Financial Partners Inc. | 586,304 | 34,046,673 | ||||||
aPRA Group Inc. | 506,500 | 14,242,780 | ||||||
aWestern Alliance Bancorp | 623,400 | 29,786,052 | ||||||
|
| |||||||
|
193,995,088 |
| ||||||
|
| |||||||
Health Care 21.2% | ||||||||
aAclaris Therapeutics Inc. | 1,259,049 | 7,932,009 | ||||||
a,eAllogene Therapeutics Inc. | 161,782 | 4,845,371 | ||||||
aAmicus Therapeutics Inc. | 833,900 | 11,124,226 | ||||||
aArgenx SE, ADR (Netherlands) | 79,800 | 10,219,986 | ||||||
aArray BioPharma Inc. | 1,388,900 | 31,403,029 | ||||||
aAscendis Pharma AS, ADR (Denmark) | 178,900 | 19,925,882 | ||||||
aCollegium Pharmaceutical Inc. | 698,800 | 9,734,284 | ||||||
aDynavax Technologies Corp. | 1,116,300 | 7,423,395 | ||||||
aEmergent BioSolutions Inc. | 254,600 | 13,157,728 | ||||||
| 52 | Annual Report | franklintempleton.com | ||||
FRANKLIN STRATEGIC SERIES
STATEMENT OF INVESTMENTS
Franklin Small Cap Growth Fund(continued)
Shares
| Value
| |||||||
| Common Stocks(continued) | ||||||||
Health Care(continued) | ||||||||
a,eFoamix Pharmaceuticals Ltd. (Israel) | 586,080 | $ | 1,904,760 | |||||
aG1 Therapeutics Inc. | 148,800 | 3,184,320 | ||||||
aGlobal Blood Therapeutics Inc. | 162,500 | 9,002,500 | ||||||
aGW Pharmaceuticals PLC, ADR (United Kingdom) | 166,100 | 28,122,391 | ||||||
aHealthEquity Inc. | 341,116 | 23,110,609 | ||||||
aHeron Therapeutics Inc. | 1,076,588 | 23,340,428 | ||||||
aInspire Medical Systems Inc. | 311,253 | 16,088,667 | ||||||
aInteger Holdings Corp. | 369,000 | 25,494,210 | ||||||
aIovance Biotherapeutics Inc. | 2,248,900 | 25,637,460 | ||||||
aiRhythm Technologies Inc. | 391,097 | 29,844,612 | ||||||
aNeogen Corp. | 267,266 | 16,212,355 | ||||||
aNeoGenomics Inc. | 1,323,000 | 27,558,090 | ||||||
aNeos Therapeutics Inc. | 646,938 | 1,559,121 | ||||||
aNeuronetics Inc. | 380,300 | 6,339,601 | ||||||
aNevro Corp. | 628,600 | 38,790,906 | ||||||
a,eOdonate Therapeutics Inc. | 383,200 | 7,533,712 | ||||||
aPenumbra Inc. | 162,100 | 21,802,450 | ||||||
aPfenex Inc. | 1,552,672 | 8,989,971 | ||||||
aPrecision BioSciences Inc. | 262,000 | 3,406,000 | ||||||
aPTC Therapeutics Inc. | 864,500 | 32,349,590 | ||||||
a,eRA Medical Systems Inc. | 214,500 | 918,060 | ||||||
aReata Pharmaceuticals Inc. | 307,974 | 24,163,640 | ||||||
aRevance Therapeutics Inc. | 1,053,592 | 13,949,558 | ||||||
aSage Therapeutics Inc. | 153,100 | 25,756,013 | ||||||
a,eTherapeuticsMD Inc. | 2,797,900 | 12,030,970 | ||||||
aTivity Health Inc. | 1,300,278 | 28,112,010 | ||||||
|
| |||||||
|
570,967,914 |
| ||||||
|
| |||||||
Industrials 18.8% | ||||||||
Allegiant Travel Co. | 266,248 | 39,106,506 | ||||||
Altra Industrial Motion Corp. | 589,600 | 22,104,104 | ||||||
aBeacon Roofing Supply Inc. | 791,800 | 29,819,188 | ||||||
BWX Technologies Inc. | 724,400 | 37,016,840 | ||||||
Cubic Corp. | 582,900 | 33,097,062 | ||||||
Granite Construction Inc. | 673,544 | 30,235,390 | ||||||
Healthcare Services Group Inc. | 832,600 | 28,183,510 | ||||||
Kennametal Inc. | 924,700 | 37,635,290 | ||||||
a,dThe KeyW Holding Corp. | 2,962,282 | 33,592,278 | ||||||
Lindsay Corp. | 137,521 | 11,689,285 | ||||||
aMercury Systems Inc. | 558,816 | 40,804,744 | ||||||
Mobile Mini Inc. | 265,800 | 9,574,116 | ||||||
aSAIA Inc. | 444,424 | 28,616,461 | ||||||
aSpirit Airlines Inc. | 568,300 | 30,904,154 | ||||||
aUnivar Inc. | 1,605,332 | 35,847,064 | ||||||
aUpwork Inc. | 1,343,300 | 26,852,567 | ||||||
US Ecology Inc. | 515,470 | 31,448,825 | ||||||
|
| |||||||
|
506,527,384 |
| ||||||
|
| |||||||
Information Technology 24.6% | ||||||||
a2U Inc. | 814,372 | 49,269,506 | ||||||
aAlteryx Inc. | 278,500 | 24,686,240 | ||||||
aEnvestnet Inc. | 405,722 | 28,802,205 | ||||||
aGuidewire Software Inc. | 192,200 | 20,469,300 | ||||||
franklintempleton.com | Annual Report | 53 | ||
FRANKLIN STRATEGIC SERIES
STATEMENT OF INVESTMENTS
Franklin Small Cap Growth Fund(continued)
Shares
| Value
| |||||||
| Common Stocks(continued) | ||||||||
Information Technology(continued) | ||||||||
aHubspot Inc. | 135,029 | $ | 24,911,500 | |||||
aInterXion Holding NV (Netherlands) | 390,795 | 27,039,106 | ||||||
aLattice Semiconductor Corp. | 2,345,900 | 30,379,405 | ||||||
a,b,cLegalZoom.comInc. | 1,431,280 | 17,512,383 | ||||||
aLightspeed POS Inc (Canada) | 51,900 | 968,330 | ||||||
ManTech International Corp., A | 515,000 | 31,924,850 | ||||||
Monolithic Power Systems | 244,700 | 38,102,237 | ||||||
aNanometrics Inc. | 252,400 | 7,518,996 | ||||||
aPagerduty Inc. | 22,400 | 1,050,560 | ||||||
aPaylocity Holding Corp. | 288,032 | 27,809,490 | ||||||
aPluralsight Inc., A | 724,500 | 25,712,505 | ||||||
aPure Storage Inc., A | 1,035,700 | 23,676,102 | ||||||
aQ2 Holdings Inc. | 314,600 | 23,727,132 | ||||||
aSilicon Laboratories Inc. | 392,300 | 42,235,018 | ||||||
aTwilio Inc., A | 79,602 | 10,916,618 | ||||||
a,eUSA Technologies Inc. | 646,500 | 3,665,655 | ||||||
Versum Materials Inc. | 648,400 | 33,833,512 | ||||||
aViaSat Inc. | 421,283 | 38,260,922 | ||||||
aViavi Solutions Inc. | 2,524,600 | 33,577,180 | ||||||
aWix.com Ltd. (Israel) | 215,500 | 28,911,480 | ||||||
aZendesk Inc. | 370,214 | 32,497,385 | ||||||
aZscaler Inc. | 482,800 | 32,980,068 | ||||||
|
| |||||||
| 660,437,685 | ||||||||
|
| |||||||
Materials 1.1% | ||||||||
aIngevity Corp. | 249,578 | 28,703,966 | ||||||
|
| |||||||
Real Estate 1.0% | ||||||||
Coresite Realty Corp. | 244,600 | 26,761,685 | ||||||
|
| |||||||
Total Common Stocks (Cost $1,830,573,837) | 2,499,852,466 | |||||||
|
| |||||||
Preferred Stocks 4.5% | ||||||||
Consumer Discretionary 3.5% | ||||||||
a,b,cClearMotion Inc., pfd., D | 3,698,772 | 10,345,480 | ||||||
a,b,cPeloton Interactive Inc., pfd., F | 1,038,769 | 24,365,904 | ||||||
a,b,cProterra Inc., pfd., 5, 144A | 1,787,047 | 16,866,913 | ||||||
a,b,cProterra Inc., pfd., 6, 144A | 1,310,834 | 12,372,211 | ||||||
a,b,cProterra Inc., pfd., 7 | 536,367 | 5,062,461 | ||||||
a,b,cRent the Runway Inc., pfd. | 596,471 | 13,333,328 | ||||||
a,b,cSweetgreen Inc., pfd., H | 383,435 | 5,371,420 | ||||||
a,b,cTula eTechnology Inc. | 361,111 | — | ||||||
a,b,cTula Technology Inc., E | 3,611,111 | 6,824,476 | ||||||
|
| |||||||
| 94,542,193 | ||||||||
|
| |||||||
Industrials 0.5% | ||||||||
a,b,cOptoro Inc., pfd., E | 508,130 | 12,143,346 | ||||||
|
| |||||||
| 54 | Annual Report | franklintempleton.com | ||||
FRANKLIN STRATEGIC SERIES
STATEMENT OF INVESTMENTS
Franklin Small Cap Growth Fund(continued)
Shares
| Value
| |||||||
| Preferred Stocks(continued) | ||||||||
Information Technology 0.5% | ||||||||
a,b,c Smule Inc., pfd., G, 144A | 1,542,673 | $ | 10,805,398 | |||||
a,b,c Smule Inc., pfd., H, 144A | 352,675 | 2,746,149 | ||||||
|
| |||||||
|
13,551,547 |
| ||||||
|
| |||||||
Total Preferred Stocks (Cost $93,695,716) | 120,237,086 | |||||||
|
| |||||||
Total Investments before Short Term Investments (Cost $1,924,269,553) | 2,620,089,552 | |||||||
|
| |||||||
Short Term Investments 3.3% | ||||||||
Money Market Funds (Cost $70,752,806) 2.6% | ||||||||
f,gInstitutional Fiduciary Trust Money Market Portfolio, 2.10% | 70,752,806 | 70,752,806 | ||||||
|
| |||||||
h Investments from Cash Collateral Received for Loaned Securities (Cost $18,262,684) 0.7% | ||||||||
Money Market Funds 0.7% | ||||||||
f,gInstitutional Fiduciary Trust Money Market Portfolio, 2.10% | 18,262,684 | 18,262,684 | ||||||
|
| |||||||
Total Investments (Cost $2,013,285,043) 100.8% | 2,709,105,042 | |||||||
Other Assets, less Liabilities (0.8)% | (20,452,753 | ) | ||||||
|
| |||||||
Net Assets 100.0% | $ | 2,688,652,289 | ||||||
|
| |||||||
See Abbreviations on page 89.
aNon-income producing.
bFair valued using significant unobservable inputs. See Note 10 regarding fair value measurements.
cSee Note 7 regarding restricted securities.
dSee Note 8 regarding holdings of 5% voting securities.
eA portion or all of the security is on loan at April 30, 2019. See Note 1(c).
fSee Note 3(f) regarding investments in affiliated management investment companies.
gThe rate shown is the annualizedseven-day effective yield at period end.
hSee Note 1(c) regarding securities on loan.
franklintempleton.com | The accompanying notes are an integral part of these financial statements. | Annual Report | 55 | ||
FRANKLIN STRATEGIC SERIES
Financial Highlights
FranklinSmall-Mid Cap Growth Fund
| Year Ended April 30, | ||||||||||||||||||||
| 2019 | 2018 | 2017 | 2016 | 2015 | ||||||||||||||||
Class A | ||||||||||||||||||||
Per share operating performance | ||||||||||||||||||||
(for a share outstanding throughout the year) | ||||||||||||||||||||
Net asset value, beginning of year | $36.07 | $34.35 | $31.84 | $38.38 | $40.42 | |||||||||||||||
Income from investment operationsa: | ||||||||||||||||||||
Net investment income (loss)b | (0.09 | ) | (0.15 | ) | (0.11 | ) | (0.03 | )c | (0.14 | ) | ||||||||||
Net realized and unrealized gains (losses) | 5.33 | 4.97 | 4.73 | (3.37) | 5.71 | |||||||||||||||
Total from investment operations | 5.24 | 4.82 | 4.62 | (3.40) | 5.57 | |||||||||||||||
Less distributions from: | ||||||||||||||||||||
Net realized gains | (4.14 | ) | (3.10 | ) | (2.11 | ) | (3.14 | ) | (7.61 | ) | ||||||||||
Net asset value, end of year | $37.17 | $36.07 | $34.35 | $31.84 | $38.38 | |||||||||||||||
Total returnd | 17.43% | 14.28% | 15.01% | (9.02)% | 15.78% | |||||||||||||||
Ratios to average net assets | ||||||||||||||||||||
Expenses before waiver and payments by affiliates | 0.88% | 1.02% | 0.95% | 0.96% | 0.94% | |||||||||||||||
Expenses net of waiver and payments by affiliates | 0.87% | e | 1.00% | e | 0.94% | e | 0.95% | e | 0.94% | f | ||||||||||
Net investment income (loss) | (0.25)% | (0.41)% | (0.34)% | (0.08)% | c | (0.35)% | ||||||||||||||
Supplemental data | ||||||||||||||||||||
Net assets, end of year (000’s) | $2,684,131 | $2,262,471 | $2,303,113 | $2,231,822 | $2,535,853 | |||||||||||||||
Portfolio turnover rate | 54.28% | 38.35% | 35.46% | 38.72% | 47.98% | |||||||||||||||
aThe amount shown for a share outstanding throughout the period may not correlate with the Statement of Operations for the period due to the timing of sales and repurchases of the Fund’s shares in relation to income earned and/or fluctuating fair value of the investments of the Fund.
bBased on average daily shares outstanding.
cNet investment income per share includes approximately $0.11 per share related to income received in the form of special dividends in connection with certain Fund holdings. Excluding this amount, the ratio of net investment income to average net assets would have been (0.38)%.
dTotal return does not reflect sales commissions or contingent deferred sales charges, if applicable.
eBenefit of expense reduction rounds to less than 0.01%.
fBenefit of waiver and payments by affiliates rounds to less than 0.01%.
| 56 | Annual Report | The accompanying notes are an integral part of these financial statements. | franklintempleton.com | ||||
FRANKLIN STRATEGIC SERIES
FINANCIAL HIGHLIGHTS
FranklinSmall-Mid Cap Growth Fund(continued)
| Year Ended April 30, | ||||||||||||||||||||
| 2019 | 2018 | 2017 | 2016 | 2015 | ||||||||||||||||
Class C | ||||||||||||||||||||
Per share operating performance | ||||||||||||||||||||
(for a share outstanding throughout the year) | ||||||||||||||||||||
Net asset value, beginning of year | $25.84 | $25.59 | $24.40 | $30.43 | $33.78 | |||||||||||||||
Income from investment operationsa: | ||||||||||||||||||||
Net investment income (loss)b | (0.26 | ) | (0.31 | ) | (0.27 | ) | (0.23 | )c | (0.36 | ) | ||||||||||
Net realized and unrealized gains (losses) | 3.54 | 3.66 | 3.57 | (2.66 | ) | 4.62 | ||||||||||||||
Total from investment operations | 3.28 | 3.35 | 3.30 | (2.89 | ) | 4.26 | ||||||||||||||
Less distributions from: | ||||||||||||||||||||
Net realized gains | (4.14 | ) | (3.10 | ) | (2.11 | ) | (3.14 | ) | (7.61 | ) | ||||||||||
Net asset value, end of year | $24.98 | $25.84 | $25.59 | $24.40 | $30.43 | |||||||||||||||
Total returnd | 16.68% | 13.39% | 14.15% | (9.72)% | 14.96% | |||||||||||||||
Ratios to average net assets | ||||||||||||||||||||
Expenses before waiver and payments by affiliates | 1.63% | 1.77% | 1.70% | 1.71% | 1.69% | |||||||||||||||
Expenses net of waiver and payments by affiliates | 1.62% | e | 1.75% | e | 1.69% | e | 1.70% | e | 1.69% | f | ||||||||||
Net investment income (loss) | (1.00)% | (1.16)% | (1.09)% | (0.83)% | c | (1.10)% | ||||||||||||||
Supplemental data | ||||||||||||||||||||
Net assets, end of year (000’s) | $173,334 | $334,769 | $371,262 | $377,024 | $448,722 | |||||||||||||||
Portfolio turnover rate | 54.28% | 38.35% | 35.46% | 38.72% | 47.98% | |||||||||||||||
aThe amount shown for a share outstanding throughout the period may not correlate with the Statement of Operations for the period due to the timing of sales and repurchases of the Fund’s shares in relation to income earned and/or fluctuating fair value of the investments of the Fund.
bBased on average daily shares outstanding.
cNet investment income per share includes approximately $0.11 per share related to income received in the form of special dividends in connection with certain Fund holdings. Excluding this amount, the ratio of net investment income to average net assets would have been (1.13)%.
dTotal return does not reflect sales commissions or contingent deferred sales charges, if applicable.
eBenefit of expense reduction rounds to less than 0.01%.
f Benefit of waiver and payments by affiliates rounds to less than 0.01%.
franklintempleton.com | The accompanying notes are an integral part of these financial statements. | Annual Report | 57 | ||
FRANKLIN STRATEGIC SERIES
FINANCIAL HIGHLIGHTS
FranklinSmall-Mid Cap Growth Fund(continued)
| Year Ended April 30, | ||||||||||||||||||||
| 2019 | 2018 | 2017 | 2016 | 2015 | ||||||||||||||||
Class R | ||||||||||||||||||||
Per share operating performance | ||||||||||||||||||||
(for a share outstanding throughout the year) | ||||||||||||||||||||
Net asset value, beginning of year | $33.15 | $31.87 | $29.75 | $36.18 | $38.61 | |||||||||||||||
Income from investment operationsa: | ||||||||||||||||||||
Net investment income (loss)b | (0.16 | ) | (0.22 | ) | (0.18 | ) | (0.11 | )c | (0.23 | ) | ||||||||||
Net realized and unrealized gains (losses) | 4.81 | 4.60 | 4.41 | (3.18 | ) | 5.41 | ||||||||||||||
Total from investment operations | 4.65 | 4.38 | 4.23 | (3.29 | ) | 5.18 | ||||||||||||||
Less distributions from: | ||||||||||||||||||||
Net realized gains | (4.14 | ) | (3.10 | ) | (2.11 | ) | (3.14 | ) | (7.61 | ) | ||||||||||
Net asset value, end of year | $33.66 | $33.15 | $31.87 | $29.75 | $36.18 | |||||||||||||||
Total return | 17.17% | 14.00% | 14.70% | (9.24)% | 15.52% | |||||||||||||||
Ratios to average net assets | ||||||||||||||||||||
Expenses before waiver and payments by affiliates | 1.12% | 1.26% | 1.19% | 1.21% | 1.19% | |||||||||||||||
Expenses net of waiver and payments by affiliates | 1.11% | d | 1.24% | d | 1.18% | d | 1.20% | d | 1.19% | e | ||||||||||
Net investment income (loss) | (0.49)% | (0.65)% | (0.58)% | (0.33)% | c | (0.60)% | ||||||||||||||
Supplemental data | ||||||||||||||||||||
Net assets, end of year (000’s) | $50,721 | $70,692 | $81,864 | $86,989 | $96,593 | |||||||||||||||
Portfolio turnover rate | 54.28% | 38.35% | 35.46% | 38.72% | 47.98% | |||||||||||||||
aThe amount shown for a share outstanding throughout the period may not correlate with the Statement of Operations for the period due to the timing of sales and repurchases of the Fund’s shares in relation to income earned and/or fluctuating fair value of the investments of the Fund.
bBased on average daily shares outstanding.
cNet investment income per share includes approximately $0.11 per share related to income received in the form of special dividends in connection with certain Fund holdings. Excluding this amount, the ratio of net investment income to average net assets would have been (0.63)%.
dBenefit of expense reduction rounds to less than 0.01%.
eBenefit of waiver and payments by affiliates rounds to less than 0.01%.
| 58 | Annual Report | The accompanying notes are an integral part of these financial statements. | franklintempleton.com | ||||
FRANKLIN STRATEGIC SERIES
FINANCIAL HIGHLIGHTS
FranklinSmall-Mid Cap Growth Fund(continued)
| Year Ended April 30, | ||||||||||||||||||||
| 2019 | 2018 | 2017 | 2016 | 2015 | ||||||||||||||||
Class R6 | ||||||||||||||||||||
Per share operating performance | ||||||||||||||||||||
(for a share outstanding throughout the year) | ||||||||||||||||||||
Net asset value, beginning of year | $39.91 | $37.51 | $34.43 | $41.04 | $42.53 | |||||||||||||||
Income from investment operationsa: | ||||||||||||||||||||
Net investment incomeb | 0.05 | 0.05 | 0.05 | 0.15 | c | 0.05 | ||||||||||||||
Net realized and unrealized gains (losses) | 6.01 | 5.45 | 5.14 | (3.62 | ) | 6.07 | ||||||||||||||
Total from investment operations | 6.06 | 5.50 | 5.19 | (3.47 | ) | 6.12 | ||||||||||||||
Less distributions from: | ||||||||||||||||||||
Net realized gains | (4.14 | ) | (3.10 | ) | (2.11 | ) | (3.14 | ) | (7.61 | ) | ||||||||||
Net asset value, end of year | $41.83 | $39.91 | $37.51 | $34.43 | $41.04 | |||||||||||||||
Total return | 17.82% | 14.90% | 15.51% | (8.54)% | 16.32% | |||||||||||||||
Ratios to average net assets | ||||||||||||||||||||
Expenses before waiver and payments by affiliates | 0.52% | 0.50% | 0.48% | 0.48% | 0.48% | |||||||||||||||
Expenses net of waiver and payments by affiliates | 0.49% | d | 0.47% | d | 0.47% | d | 0.47% | d | 0.48% | e | ||||||||||
Net investment income | 0.13% | 0.12% | 0.13% | 0.40%c | 0.11% | |||||||||||||||
Supplemental data | ||||||||||||||||||||
Net assets, end of year (000’s) | $259,053 | $275,835 | $222,577 | $242,237 | $206,548 | |||||||||||||||
Portfolio turnover rate | 54.28% | 38.35% | 35.46% | 38.72% | 47.98% | |||||||||||||||
aThe amount shown for a share outstanding throughout the period may not correlate with the Statement of Operations for the period due to the timing of sales and repurchases of the Fund’s shares in relation to income earned and/or fluctuating fair value of the investments of the Fund.
bBased on average daily shares outstanding.
cNet investment income per share includes approximately $0.11 per share related to income received in the form of special dividends in connection with certain Fund holdings. Excluding this amount, the ratio of net investment income to average net assets would have been 0.10%.
dBenefit of expense reduction rounds to less than 0.01%.
eBenefit of waiver and payments by affiliates rounds to less than 0.01%.
franklintempleton.com | The accompanying notes are an integral part of these financial statements. | Annual Report | 59 | ||
FRANKLIN STRATEGIC SERIES
FINANCIAL HIGHLIGHTS
FranklinSmall-Mid Cap Growth Fund(continued)
| Year Ended April 30, | ||||||||||||||||||||
| 2019 | 2018 | 2017 | 2016 | 2015 | ||||||||||||||||
Advisor Class | ||||||||||||||||||||
Per share operating performance | ||||||||||||||||||||
(for a share outstanding throughout the year) | ||||||||||||||||||||
Net asset value, beginning of year | $39.33 | $37.11 | $34.15 | $40.83 | $42.44 | |||||||||||||||
Income from investment operationsa: | ||||||||||||||||||||
Net investment income (loss)b | 0.01 | (0.06 | ) | (0.03 | ) | 0.06 | c | (0.04 | ) | |||||||||||
Net realized and unrealized gains (losses) | 5.89 | 5.38 | 5.10 | (3.60 | ) | 6.04 | ||||||||||||||
Total from investment operations | 5.90 | 5.32 | 5.07 | (3.54 | ) | 6.00 | ||||||||||||||
Less distributions from: | ||||||||||||||||||||
Net realized gains | (4.14 | ) | (3.10 | ) | (2.11 | ) | (3.14 | ) | (7.61 | ) | ||||||||||
Net asset value, end of year | $41.09 | $39.33 | $37.11 | $34.15 | $40.83 | |||||||||||||||
Total return | 17.67% | 14.57% | 15.28% | (8.79)% | 16.09% | |||||||||||||||
Ratios to average net assets | ||||||||||||||||||||
Expenses before waiver and payments by affiliates | 0.63% | 0.77% | 0.70% | 0.71% | 0.69% | |||||||||||||||
Expenses net of waiver and payments by affiliates | 0.62% | d | 0.75% | d | 0.69% | d | 0.70% | d | 0.69% | e | ||||||||||
Net investment income (loss) | —% | f | (0.16)% | (0.09)% | 0.17% | c | (0.10)% | |||||||||||||
Supplemental data | ||||||||||||||||||||
Net assets, end of year (000’s) | $355,141 | $520,842 | $584,840 | $551,176 | $708,617 | |||||||||||||||
Portfolio turnover rate | 54.28% | 38.35% | 35.46% | 38.72% | 47.98% | |||||||||||||||
aThe amount shown for a share outstanding throughout the period may not correlate with the Statement of Operations for the period due to the timing of sales and repurchases of the Fund’s shares in relation to income earned and/or fluctuating fair value of the investments of the Fund.
bBased on average daily shares outstanding.
cNet investment income per share includes approximately $0.11 per share related to income received in the form of special dividends in connection with certain Fund holdings. Excluding this amount, the ratio of net investment income to average net assets would have been (0.13)%.
dBenefit of expense reduction rounds to less than 0.01%.
eBenefit of waiver and payments by affiliates rounds to less than 0.01%.
fRounds to less than 0.01%.
| 60 | Annual Report | The accompanying notes are an integral part of these financial statements. | franklintempleton.com | ||||
FRANKLIN STRATEGIC SERIES
Statement of Investments, April 30, 2019
FranklinSmall-Mid Cap Growth Fund
Shares
| Value
| |||||||
Common Stocks 96.3% | ||||||||
Communication Services 1.2% | ||||||||
aIAC/InterActiveCorp | 102,000 | $ | 22,933,680 | |||||
aPinterest Inc., A | 257,000 | 7,961,860 | ||||||
aSpotify Technology SA | 73,500 | 9,979,095 | ||||||
|
| |||||||
|
40,874,635 |
| ||||||
|
| |||||||
Consumer Discretionary 15.6% | ||||||||
Aptiv PLC | 465,000 | 39,850,500 | ||||||
aBurlington Stores Inc. | 278,000 | 46,956,980 | ||||||
aDollar Tree Inc. | 240,000 | 26,707,200 | ||||||
Domino’s Pizza Inc. | 162,000 | 43,833,960 | ||||||
a,b,cDraftKings Inc. | 7,974,537 | 20,492,207 | ||||||
Expedia Group Inc. | 303,500 | 39,406,440 | ||||||
aFive Below Inc. | 117,000 | 17,127,630 | ||||||
aGrand Canyon Education Inc. | 363,000 | 42,068,070 | ||||||
aLevi Strauss & Co., A | 420,000 | 9,412,200 | ||||||
MGM Resorts International | 973,000 | 25,910,990 | ||||||
aNVR Inc. | 11,000 | 34,677,280 | ||||||
aO’Reilly Automotive Inc. | 86,000 | 32,557,020 | ||||||
Tapestry Inc. | 455,000 | 14,682,850 | ||||||
Tractor Supply Co. | 330,000 | 34,155,000 | ||||||
aUlta Beauty Inc. | 91,000 | 31,757,180 | ||||||
aUnder Armour Inc., A | 417,000 | 9,628,530 | ||||||
Vail Resorts Inc. | 130,000 | 29,750,500 | ||||||
VF Corp. | 364,000 | 34,365,240 | ||||||
Wingstop Inc. | 204,000 | 15,355,080 | ||||||
|
| |||||||
|
548,694,857 |
| ||||||
|
| |||||||
Consumer Staples 2.2% | ||||||||
Brown-Forman Corp., B | 528,000 | 28,137,120 | ||||||
Church & Dwight Co. Inc. | 105,000 | 7,869,751 | ||||||
Lamb Weston Holdings Inc. | 326,000 | 22,836,300 | ||||||
McCormick & Co. Inc. | 112,000 | 17,244,640 | ||||||
|
| |||||||
|
76,087,811 |
| ||||||
|
| |||||||
Energy 1.1% | ||||||||
Concho Resources Inc. | 179,700 | 20,733,786 | ||||||
Diamondback Energy Inc. | 178,000 | 18,937,420 | ||||||
|
| |||||||
|
39,671,206 |
| ||||||
|
| |||||||
Financials 6.6% | ||||||||
Arthur J. Gallagher & Co. | 226,100 | 18,906,482 | ||||||
CBOE Global Markets Inc. | 303,000 | 30,787,830 | ||||||
Chemical Financial Corp. | 237,000 | 10,411,410 | ||||||
MarketAxess Holdings Inc. | 150,000 | 41,749,500 | ||||||
MSCI Inc. | 235,500 | 53,076,990 | ||||||
SEI Investments Co. | 448,000 | 24,393,600 | ||||||
a SVB Financial Group | 103,500 | 26,053,020 | ||||||
a Tradeweb Markets Inc. | 218,000 | 8,774,500 | ||||||
a Western Alliance Bancorp | 425,000 | 20,306,500 | ||||||
|
| |||||||
|
234,459,832 |
| ||||||
|
| |||||||
franklintempleton.com | Annual Report | 61 | ||
FRANKLIN STRATEGIC SERIES
STATEMENT OF INVESTMENTS
FranklinSmall-Mid Cap Growth Fund(continued)
Shares
| Value
| |||||||
| Common Stocks(continued) | ||||||||
Health Care 13.5% | ||||||||
aABIOMED Inc. | 132,500 | $ | 36,756,825 | |||||
aAlign Technology Inc. | 107,500 | 34,903,100 | ||||||
aArgenx SE, ADR (Netherlands) | 40,000 | 5,122,800 | ||||||
aArray BioPharma Inc. | 520,000 | 11,757,200 | ||||||
aBioMarin Pharmaceutical Inc. | 207,666 | 17,761,673 | ||||||
aDexCom Inc. | 184,414 | 22,327,003 | ||||||
aGW Pharmaceuticals PLC, ADR (United Kingdom) | 101,000 | 17,100,310 | ||||||
aHealthEquity Inc. | 264,000 | 17,886,000 | ||||||
aHeron Therapeutics Inc. | 724,000 | 15,696,320 | ||||||
aIDEXX Laboratories Inc. | 171,000 | 39,672,000 | ||||||
aIncyte Corp. | 188,614 | 14,485,555 | ||||||
aIonis Pharmaceuticals Inc. | 136,000 | 10,108,880 | ||||||
aiRhythm Technologies Inc. | 186,450 | 14,228,000 | ||||||
aJazz Pharmaceuticals PLC | 147,000 | 19,076,190 | ||||||
aMettler-Toledo International Inc. | 79,500 | 59,248,170 | ||||||
aNeurocrine Biosciences Inc. | 180,042 | 13,006,234 | ||||||
aPenumbra Inc. | 216,647 | 29,139,021 | ||||||
aPrecision BioSciences Inc. | 279,400 | 3,632,200 | ||||||
aRevance Therapeutics Inc. | 493,000 | 6,527,320 | ||||||
aSage Therapeutics Inc. | 64,100 | 10,783,543 | ||||||
aSarepta Therapeutics Inc. | 95,500 | 11,167,770 | ||||||
aSeattle Genetics Inc. | 124,500 | 8,438,610 | ||||||
aVeeva Systems Inc. | 179,000 | 25,036,730 | ||||||
aWaters Corp. | 150,000 | 32,031,000 | ||||||
|
| |||||||
|
475,892,454 |
| ||||||
|
| |||||||
Industrials 17.0% | ||||||||
BWX Technologies Inc. | 674,000 | 34,441,400 | ||||||
aCoStar Group Inc. | 117,000 | 58,061,250 | ||||||
Fortive Corp. | 607,500 | 52,451,550 | ||||||
Harris Corp. | 270,500 | 45,579,250 | ||||||
IDEX Corp. | 308,500 | 48,329,610 | ||||||
aIHS Markit Ltd. | 466,915 | 26,735,553 | ||||||
a,dLyft Inc., A | 123,000 | 7,355,400 | ||||||
aMercury Systems Inc. | 294,000 | 21,467,880 | ||||||
Old Dominion Freight Line Inc. | 220,000 | 32,841,600 | ||||||
Republic Services Inc. | 216,000 | 17,889,120 | ||||||
Rockwell Automation Inc. | 268,000 | 48,430,280 | ||||||
Roper Technologies Inc. | 49,530 | 17,815,941 | ||||||
aSpirit Airlines Inc. | 165,000 | 8,972,700 | ||||||
Stanley Black & Decker Inc. | 212,000 | 31,079,200 | ||||||
aTransDigm Group Inc. | 52,000 | 25,091,040 | ||||||
TransUnion | 342,000 | 23,820,300 | ||||||
aUnivar Inc. | 1,085,000 | 24,228,050 | ||||||
aUpwork Inc. | 344,600 | 6,888,554 | ||||||
Verisk Analytics Inc. | 468,000 | 66,053,520 | ||||||
|
| |||||||
|
597,532,198 |
| ||||||
|
| |||||||
Information Technology 34.8% | ||||||||
a2U Inc. | 745,000 | 45,072,500 | ||||||
aAdvanced Micro Devices Inc. | 700,000 | 19,341,000 | ||||||
aAdyen NV (Netherlands) | 28,500 | 23,196,307 | ||||||
Amphenol Corp., A | 355,000 | 35,343,800 | ||||||
| 62 | Annual Report | franklintempleton.com | ||||
FRANKLIN STRATEGIC SERIES
STATEMENT OF INVESTMENTS
FranklinSmall-Mid Cap Growth Fund(continued)
Shares
| Value
| |||||||
| Common Stocks(continued) | ||||||||
Information Technology(continued) | ||||||||
aArista Networks Inc. | 82,500 | $ | 25,763,925 | |||||
aAtlassian Corp. PLC | 308,000 | 33,926,200 | ||||||
aBlack Knight Inc. | 548,000 | 30,918,160 | ||||||
Cognex Corp. | 256,000 | 12,910,080 | ||||||
aCree Inc. | 40,000 | 2,643,600 | ||||||
aDocuSign Inc. | 455,000 | 25,784,850 | ||||||
aElastic NV | 263,000 | 22,499,650 | ||||||
aEPAM Systems Inc. | 203,000 | 36,410,080 | ||||||
Global Payments Inc. | 252,000 | 36,809,640 | ||||||
aGoDaddy Inc., A | 696,800 | 56,789,200 | ||||||
aGuidewire Software Inc. | 321,000 | 34,186,500 | ||||||
Jack Henry & Associates Inc. | 200,000 | 29,812,000 | ||||||
KLA-Tencor Corp. | 344,000 | 43,853,120 | ||||||
Lam Research Corp. | 188,000 | 38,996,840 | ||||||
aLattice Semiconductor Corp. | 398,335 | 5,158,438 | ||||||
Microchip Technology Inc. | 802,000 | 80,111,780 | ||||||
Monolithic Power Systems | 248,000 | 38,616,080 | ||||||
aNew Relic Inc. | 265,000 | 27,888,600 | ||||||
aNutanix Inc., A | 170,000 | 7,342,300 | ||||||
aPagerduty Inc. | 219,000 | 10,271,100 | ||||||
aPaylocity Holding Corp. | 202,000 | 19,503,100 | ||||||
aPluralsight Inc., A | 655,000 | 23,245,950 | ||||||
aPTC Inc. | 408,000 | 36,911,760 | ||||||
aQ2 Holdings Inc. | 361,000 | 27,226,620 | ||||||
aShopify Inc., A (Canada) | 56,000 | 13,637,680 | ||||||
aSilicon Laboratories Inc. | 289,000 | 31,113,740 | ||||||
aSquare Inc., A | 589,000 | 42,890,980 | ||||||
aSynopsys Inc. | 288,000 | 34,871,040 | ||||||
Total System Services Inc. | 387,500 | 39,618,000 | ||||||
aTrimble Inc. | 508,000 | 20,736,560 | ||||||
aTwilio Inc., A | 264,000 | 36,204,960 | ||||||
aViaSat Inc. | 415,050 | 37,694,841 | ||||||
aWEX Inc. | 139,500 | 29,336,850 | ||||||
aWix.com Ltd. (Israel) | 209,000 | 28,039,440 | ||||||
aWorkday Inc., A | 178,000 | 36,602,140 | ||||||
Xilinx Inc. | 207,000 | 24,868,980 | ||||||
aZscaler Inc. | 273,000 | 18,648,630 | ||||||
|
| |||||||
|
1,224,797,021 |
| ||||||
|
| |||||||
Materials 2.6% | ||||||||
aIngevity Corp. | 271,780 | 31,257,418 | ||||||
Martin Marietta Materials Inc. | 145,000 | 32,175,500 | ||||||
Packaging Corp. of America | 305,000 | 30,243,800 | ||||||
|
| |||||||
|
93,676,718 |
| ||||||
|
| |||||||
Real Estate 1.7% | ||||||||
aSBA Communications Corp., A | 298,000 | 60,711,540 | ||||||
|
| |||||||
Total Common Stocks (Cost $2,431,628,237) | 3,392,398,272 | |||||||
|
| |||||||
Preferred Stocks 0.6% | ||||||||
Consumer Discretionary 0.4% | ||||||||
a,b,cProterra Inc., pfd., 5, 144A | 1,416,913 | 13,373,430 | ||||||
|
| |||||||
franklintempleton.com | Annual Report | 63 | ||
FRANKLIN STRATEGIC SERIES
STATEMENT OF INVESTMENTS
FranklinSmall-Mid Cap Growth Fund(continued)
Shares
| Value
| |||||||
| Preferred Stocks(continued) | ||||||||
Financials 0.2% | ||||||||
a,b,cBill.com, pfd., H | 866,666 | $ | 7,677,734 | |||||
|
| |||||||
Total Preferred Stocks (Cost $14,335,915) | 21,051,164 | |||||||
|
| |||||||
Total Investments before Short Term Investments (Cost $2,445,964,152) | 3,413,449,436 | |||||||
|
| |||||||
Short Term Investments 3.7% | ||||||||
Money Market Funds (Cost $124,157,073) 3.5% | ||||||||
e,fInstitutional Fiduciary Trust Money Market Portfolio, 2.10% | 124,157,073 | 124,157,073 | ||||||
|
| |||||||
gInvestments from Cash Collateral Received for Loaned Securities (Cost $6,811,635) 0.2% | ||||||||
Money Market Funds 0.2% | ||||||||
e,fInstitutional Fiduciary Trust Money Market Portfolio, 2.10% | 6,811,635 | 6,811,635 | ||||||
|
| |||||||
Total Investments (Cost $2,576,932,860) 100.6% | 3,544,418,144 | |||||||
Other Assets, less Liabilities (0.6)% | (22,038,552 | ) | ||||||
|
| |||||||
Net Assets 100.0% | $ | 3,522,379,592 | ||||||
|
| |||||||
See Abbreviations on page 89.
aNon-income producing.
bFair valued using significant unobservable inputs. See Note 10 regarding fair value measurements.
cSee Note 7 regarding restricted securities.
dA portion or all of the security is on loan at April 30, 2019. See Note 1(c).
eSee Note 3(f) regarding investments in affiliated management investment companies.
fThe rate shown is the annualizedseven-day effective yield at period end.
gSee Note 1(c) regarding securities on loan.
| 64 | Annual Report | The accompanying notes are an integral part of these financial statements. | franklintempleton.com | ||||
FRANKLIN STRATEGIC SERIES
Financial Statements
Statements of Assets and Liabilities
April 30, 2019
| Franklin Growth Opportunities Fund | Franklin Select U.S. Equity Fund | Franklin Small Cap Growth Fund | Franklin Small-Mid Cap Growth Fund | |||||||||||||
Assets: | ||||||||||||||||
Investments in securities: | ||||||||||||||||
Cost - Unaffiliated issuers | $1,987,210,539 | $ | 96,348,998 | $ | 1,872,291,491 | $ | 2,445,964,152 | |||||||||
Cost -Non-controlled affiliates (Note 3f and 8) | 69,126,928 | 7,161,073 | 140,993,552 | 130,968,708 | ||||||||||||
|
| |||||||||||||||
Value - Unaffiliated issuers+ | $3,961,847,987 | $ | 115,367,112 | $ | 2,570,493,902 | $ | 3,413,449,436 | |||||||||
Value -Non-controlled affiliates (Note 3f and 8) | 69,126,928 | 7,161,073 | 138,611,140 | 130,968,708 | ||||||||||||
Receivables: | ||||||||||||||||
Investment securities sold | — | — | 8,982,581 | 11,962,690 | ||||||||||||
Capital shares sold | 2,227,445 | 405,390 | 4,191,723 | 4,193,394 | ||||||||||||
Dividends | 680,963 | 17,150 | 24,096 | 30,934 | ||||||||||||
Due from custodian | — | — | 246,600 | — | ||||||||||||
Other assets | 3,377 | 94 | 2,229 | 3,054 | ||||||||||||
|
| |||||||||||||||
Total assets | 4,033,886,700 | 122,950,819 | 2,722,552,271 | 3,560,608,216 | ||||||||||||
|
| |||||||||||||||
Liabilities: | ||||||||||||||||
Payables: | ||||||||||||||||
Investment securities purchased | — | — | 9,462,560 | 24,628,767 | ||||||||||||
Capital shares redeemed | 4,714,033 | 97,553 | 3,768,343 | 3,701,613 | ||||||||||||
Management fees | 1,747,480 | 46,185 | 1,314,960 | 1,268,607 | ||||||||||||
Distribution fees | 780,907 | 28,610 | 247,008 | 702,971 | ||||||||||||
Transfer agent fees | 624,403 | 16,620 | 467,214 | 902,267 | ||||||||||||
Professional fees | 50,001 | 39,248 | 46,560 | 55,946 | ||||||||||||
Payable upon return of securities loaned | — | — | 18,509,284 | 6,811,635 | ||||||||||||
Accrued expenses and other liabilities | 146,481 | 7,346 | 84,053 | 156,818 | ||||||||||||
|
| |||||||||||||||
Total liabilities | 8,063,305 | 235,562 | 33,899,982 | 38,228,624 | ||||||||||||
|
| |||||||||||||||
Net assets, at value | $4,025,823,395 | $ | 122,715,257 | $ | 2,688,652,289 | $ | 3,522,379,592 | |||||||||
|
| |||||||||||||||
Net assets consist of: | ||||||||||||||||
Paid-in capital | $1,831,459,651 | $ | 103,694,299 | $ | 1,874,740,894 | $ | 2,146,773,480 | |||||||||
Total distributable earnings (loss) | 2,194,363,744 | 19,020,958 | 813,911,395 | 1,375,606,112 | ||||||||||||
|
| |||||||||||||||
Net assets, at value | $4,025,823,395 | $ | 122,715,257 | $ | 2,688,652,289 | $ | 3,522,379,592 | |||||||||
|
| |||||||||||||||
+Includes securities loaned. | $ — | $ | — | $ | 17,688,882 | $ | 6,583,980 | |||||||||
franklintempleton.com | The accompanying notes are an integral part of these financial statements. | Annual Report | 65 | ||
FRANKLIN STRATEGIC SERIES
FINANCIAL STATEMENTS
Statements of Assets and Liabilities(continued)
April 30, 2019
| Franklin Growth Opportunities Fund | Franklin Select U.S. Equity Fund | Franklin Small Cap Growth Fund | Franklin Small-Mid Cap Growth Fund | |||||||||||||
Class A: | ||||||||||||||||
Net assets, at value | $2,819,006,821 | $ | 77,230,465 | $ | 713,441,579 | $ | 2,684,131,272 | |||||||||
Shares outstanding | 71,249,412 | 4,978,462 | 33,246,602 | 72,218,966 | ||||||||||||
Net asset value per sharea | $39.57 | $15.51 | $21.46 | $37.17 | ||||||||||||
Maximum offering price per share (net asset value per share ÷ 94.50%) | $41.87 | $16.41 | $22.71 | $39.33 | ||||||||||||
Class C: | ||||||||||||||||
Net assets, at value | $ 244,573,709 | $ | 15,701,821 | $ | 90,512,560 | $ | 173,333,516 | |||||||||
Shares outstanding | 7,532,444 | 1,090,439 | 5,276,466 | 6,938,042 | ||||||||||||
Net asset value and maximum offering price per sharea | $32.47 | $14.40 | $17.15 | $24.98 | ||||||||||||
Class R: | ||||||||||||||||
Net assets, at value | $ 37,104,937 | $ | 144,367 | $ | 74,633,979 | $ | 50,720,696 | |||||||||
Shares outstanding | 987,747 | 9,493 | 3,703,532 | 1,507,073 | ||||||||||||
Net asset value and maximum offering price per share | $37.57 | $15.21 | $20.15 | $33.66 | ||||||||||||
Class R6: | ||||||||||||||||
Net assets, at value | $ 418,173,766 | $ | 970,982 | $ | 1,084,442,045 | $ | 259,052,789 | |||||||||
Shares outstanding | 9,629,934 | 60,945 | 45,700,423 | 6,193,640 | ||||||||||||
Net asset value and maximum offering price per share | $43.42 | $15.93 | $23.73 | $41.83 | ||||||||||||
Advisor Class: | ||||||||||||||||
Net assets, at value | $ 506,964,162 | $ | 28,667,622 | $ | 725,622,126 | $ | 355,141,319 | |||||||||
Shares outstanding | 11,825,271 | 1,810,204 | 31,046,388 | 8,643,232 | ||||||||||||
Net asset value and maximum offering price per share | $42.87 | $15.84 | $23.37 | $41.09 | ||||||||||||
aRedemption price is equal to net asset value less contingent deferred sales charges, if applicable.
| 66 | Annual Report | The accompanying notes are an integral part of these financial statements. | franklintempleton.com | ||||
FRANKLIN STRATEGIC SERIES
FINANCIAL STATEMENTS
Statements of Operations
for the year ended April 30, 2019
| Franklin Growth Opportunities Fund | Franklin Select U.S. Equity Fund | Franklin Small Cap Growth Fund | Franklin Small-Mid Cap Growth Fund | |||||||||||||||||
Investment income: | ||||||||||||||||||||
Dividends: (net of foreign taxes)* | ||||||||||||||||||||
Unaffiliated issuers | $ 23,184,945 | $ 934,594 | $ 8,392,414 | $ 19,588,544 | ||||||||||||||||
Non-controlled affiliates (Note 3f and 8) | 644,989 | 100,768 | 751,145 | 1,923,102 | ||||||||||||||||
Interest: | ||||||||||||||||||||
Unaffiliated issuers | — | — | — | 332 | ||||||||||||||||
Income from securities loaned: | ||||||||||||||||||||
Unaffiliated issuers (net of fees and rebates) | 112,861 | — | 212,045 | 19,187 | ||||||||||||||||
Non-controlled affiliates (Note 3f) | 75,547 | — | 709,059 | 194,606 | ||||||||||||||||
|
| |||||||||||||||||||
Total investment income | 24,018,342 | 1,035,362 | 10,064,663 | 21,725,771 | ||||||||||||||||
|
| |||||||||||||||||||
Expenses: | ||||||||||||||||||||
Management fees (Note 3a) | 21,250,795 | 976,209 | 16,236,790 | 16,066,199 | ||||||||||||||||
Distribution fees: (Note 3c) | ||||||||||||||||||||
Class A | 6,437,543 | 174,075 | 1,724,654 | 6,049,416 | ||||||||||||||||
Class C | 3,218,095 | 165,465 | 1,126,807 | 2,505,936 | ||||||||||||||||
Class R | 179,039 | 714 | 370,716 | 333,533 | ||||||||||||||||
Transfer agent fees: (Note 3e) | ||||||||||||||||||||
Class A | 3,355,825 | 92,687 | 1,296,932 | 3,557,700 | ||||||||||||||||
Class C | 419,389 | 22,017 | 212,232 | 368,843 | ||||||||||||||||
Class R | 46,991 | 182 | 139,724 | 99,988 | ||||||||||||||||
Class R6 | 97,801 | 830 | 376,295 | 106,882 | ||||||||||||||||
Advisor Class | 758,794 | 20,739 | 1,386,535 | 748,020 | ||||||||||||||||
Custodian fees (Note 4) | 41,983 | 1,682 | 25,760 | 31,292 | ||||||||||||||||
Reports to shareholders | 320,566 | 22,127 | 149,525 | �� | 325,251 | |||||||||||||||
Registration and filing fees | 168,544 | 85,951 | 117,002 | 184,337 | ||||||||||||||||
Professional fees | 68,712 | 58,200 | 63,830 | 75,853 | ||||||||||||||||
Trustees’ fees and expenses | 56,123 | 1,442 | 38,084 | 50,985 | ||||||||||||||||
Other | 72,468 | 11,044 | 57,365 | 68,838 | ||||||||||||||||
|
| |||||||||||||||||||
Total expenses | 36,492,668 | 1,633,364 | 23,322,251 | 30,573,073 | ||||||||||||||||
Expense reductions (Note 4) | (10,901 | ) | (103 | ) | (1,919 | ) | (77 | ) | ||||||||||||
Expenses waived/paid by affiliates (Note 3f and 3g) | (154,146 | ) | (286,276 | ) | (499,865 | ) | (487,359 | ) | ||||||||||||
|
| |||||||||||||||||||
Net expenses | 36,327,621 | 1,346,985 | 22,820,467 | 30,085,637 | ||||||||||||||||
|
| |||||||||||||||||||
Net investment income (loss) | (12,309,279 | ) | (311,623 | ) | (12,755,804 | ) | (8,359,866 | ) | ||||||||||||
|
| |||||||||||||||||||
Realized and unrealized gains (losses): | ||||||||||||||||||||
Net realized gain (loss) from: | ||||||||||||||||||||
Investments: | ||||||||||||||||||||
Unaffiliated issuers | 459,853,047 | 516,205 | 392,150,056 | 651,074,279 | ||||||||||||||||
Non-controlled affiliates (Note 3f and 8) | — | — | (32,245,954 | ) | — | |||||||||||||||
Foreign currency transactions | 10,524 | (589 | ) | (2,073 | ) | (48,717 | ) | |||||||||||||
|
| |||||||||||||||||||
Net realized gain (loss) | 459,863,571 | 515,616 | 359,902,029 | 651,025,562 | ||||||||||||||||
|
| |||||||||||||||||||
Net change in unrealized appreciation (depreciation) on: | ||||||||||||||||||||
Investments: | ||||||||||||||||||||
Unaffiliated issuers | 124,321,685 | 11,651,347 | (4,595,788 | ) | (99,480,161 | ) | ||||||||||||||
Non-controlled affiliates (Note 3f and 8) | — | — | 37,884,242 | — | ||||||||||||||||
|
| |||||||||||||||||||
Net change in unrealized appreciation (depreciation) | 124,321,685 | 11,651,347 | 33,288,454 | (99,480,161 | ) | |||||||||||||||
|
| |||||||||||||||||||
Net realized and unrealized gain (loss) | 584,185,256 | 12,166,963 | 393,190,483 | 551,545,401 | ||||||||||||||||
|
| |||||||||||||||||||
franklintempleton.com | The��accompanying notes are an integral part of these financial statements. | Annual Report | 67 | ||
FRANKLIN STRATEGIC SERIES
FINANCIAL STATEMENTS
Statements of Operations(continued)
for the year ended April 30, 2019
| Franklin Growth Opportunities Fund | Franklin Select U.S. Equity Fund | Franklin Small Cap Growth Fund | Franklin Small-Mid Cap Growth Fund | |||||||||||||||||
Net increase (decrease) in net assets resulting from operations | $571,875,977 | $11,855,340 | $380,434,679 | $543,185,535 | ||||||||||||||||
|
| |||||||||||||||||||
*Foreign taxes withheld on dividends | $ 265 | $ | 1,654 | $ | — | $ | 435 | |||||||||||||
| 68 | Annual Report | The accompanying notes are an integral part of these financial statements. | franklintempleton.com | ||||
FRANKLIN STRATEGIC SERIES
FINANCIAL STATEMENTS
Statements of Changes in Net Assets
| Franklin Growth Opportunities Fund | Franklin Select U.S. Equity Fund | |||||||||||||||
| Year Ended April 30, | Year Ended April 30, | |||||||||||||||
| 2019 | 2018 | 2019 | 2018 | |||||||||||||
Increase (decrease) in net assets: | ||||||||||||||||
Operations: | ||||||||||||||||
Net investment income (loss) | $ | (12,309,279 | ) | $ | (10,261,563 | ) | $ | (311,623 | ) | $ | (359,541 | ) | ||||
Net realized gain (loss) | 459,863,571 | 289,840,333 | 515,616 | 23,070,802 | ||||||||||||
Net change in unrealized appreciation (depreciation) | 124,321,685 | 405,837,652 | 11,651,347 | (15,755,359 | ) | |||||||||||
Net increase (decrease) in net assets resulting from operations | 571,875,977 | 685,416,422 | 11,855,340 | 6,955,902 | ||||||||||||
Distributions to shareholders: (Note 1e) | ||||||||||||||||
Class A | (270,776,543 | ) | (189,384,206 | ) | (9,068,158 | ) | — | |||||||||
Class C | (29,467,299 | ) | (36,890,234 | ) | (2,096,439 | ) | — | |||||||||
Class R | (3,826,333 | ) | (3,861,226 | ) | (17,405 | ) | — | |||||||||
Class R6 | (36,746,123 | ) | (26,495,718 | ) | (112,384 | ) | — | |||||||||
Advisor Class | (56,405,582 | ) | (42,059,463 | ) | (1,714,775 | ) | — | |||||||||
Total distributions to shareholders | (397,221,880 | ) | (298,690,847 | ) | (13,009,161 | ) | — | |||||||||
Capital share transactions: (Note 2) | ||||||||||||||||
Class A | 274,938,208 | (91,864,958 | ) | 13,281,422 | (17,113,814 | ) | ||||||||||
Class C | (164,852,400 | ) | (23,626,956 | ) | (1,890,912 | ) | (3,442,504 | ) | ||||||||
Class R | (765,911 | ) | (18,366,509 | ) | 11,435 | (43,959 | ) | |||||||||
Class R6 | 25,388,596 | 41,353,334 | 44,676 | (19,406,366 | ) | |||||||||||
Advisor Class | (101,787,858 | ) | (18,372,365 | ) | 17,229,063 | (3,475,298 | ) | |||||||||
Total capital share transactions | 32,920,635 | (110,877,454 | ) | 28,675,684 | (43,481,941 | ) | ||||||||||
Net increase (decrease) in net assets | 207,574,732 | 275,848,121 | 27,521,863 | (36,526,039 | ) | |||||||||||
Net assets: | ||||||||||||||||
Beginning of year | 3,818,248,663 | 3,542,400,542 | 95,193,394 | 131,719,433 | ||||||||||||
End of year (Note 1e) | $ | 4,025,823,395 | $ | 3,818,248,663 | $ | 122,715,257 | $ | 95,193,394 | ||||||||
franklintempleton.com | The accompanying notes are an integral part of these financial statements. | Annual Report | 69 | ||
FRANKLIN STRATEGIC SERIES
FINANCIAL STATEMENTS
Statements of Changes in Net Assets(continued)
| Franklin Small Cap Growth Fund | Franklin Small-Mid Cap Growth Fund | |||||||||||||||
| Year Ended April 30, | Year Ended April 30, | |||||||||||||||
| 2019 | 2018 | 2019 | 2018 | |||||||||||||
Increase (decrease) in net assets: | ||||||||||||||||
Operations: | ||||||||||||||||
Net investment income (loss) | $ | (12,755,804 | ) | $ | (10,835,341 | ) | $ | (8,359,866 | ) | $ | (14,570,284 | ) | ||||
Net realized gain (loss) | 359,902,029 | 347,278,699 | 651,025,562 | 393,654,195 | ||||||||||||
Net change in unrealized appreciation (depreciation) | 33,288,454 | 131,654,453 | (99,480,161 | ) | 100,694,860 | |||||||||||
Net increase (decrease) in net assets resulting from operations | 380,434,679 | 468,097,811 | 543,185,535 | 479,778,771 | ||||||||||||
Distributions to shareholders: (Note 1e) | ||||||||||||||||
Class A | (119,248,780 | ) | (13,026,727 | ) | (273,591,265 | ) | (188,183,859 | ) | ||||||||
Class C | (19,107,819 | ) | (2,968,851 | ) | (25,744,621 | ) | (37,764,936 | ) | ||||||||
Class R | (13,109,783 | ) | (1,455,647 | ) | (8,327,251 | ) | (6,640,970 | ) | ||||||||
Class R6 | (158,804,029 | ) | (16,214,723 | ) | (27,160,456 | ) | (21,566,773 | ) | ||||||||
Advisor Class | (120,036,837 | ) | (13,459,989 | ) | (54,511,212 | ) | (39,628,357 | ) | ||||||||
Total distributions to shareholders | (430,307,248 | ) | (47,125,937 | ) | (389,334,805 | ) | (293,784,895 | ) | ||||||||
Capital share transactions: (Note 2) | ||||||||||||||||
Class A | 66,793,851 | (165,302,683 | ) | 299,393,170 | (165,123,618 | ) | ||||||||||
Class C | (37,156,667 | ) | (30,398,855 | ) | (163,688,617 | ) | (43,224,469 | ) | ||||||||
Class R | 5,850,633 | (20,277,000 | ) | (20,982,789 | ) | (14,958,409 | ) | |||||||||
Class R6 | 156,516,510 | (75,776,145 | ) | (34,742,726 | ) | 39,199,957 | ||||||||||
Advisor Class | 29,111,361 | (218,726,187 | ) | (176,059,390 | ) | (100,935,015 | ) | |||||||||
Total capital share transactions | 221,115,688 | (510,480,870 | ) | (96,080,352 | ) | (285,041,554 | ) | |||||||||
Net increase (decrease) in net assets | 171,243,119 | (89,508,996 | ) | 57,770,378 | (99,047,678 | ) | ||||||||||
Net assets: | ||||||||||||||||
Beginning of year | 2,517,409,170 | 2,606,918,166 | 3,464,609,214 | 3,563,656,892 | ||||||||||||
End of year (Note 1e) | $ | 2,688,652,289 | $ | 2,517,409,170 | $ | 3,522,379,592 | $ | 3,464,609,214 | ||||||||
| 70 | Annual Report | The accompanying notes are an integral part of these financial statements. | franklintempleton.com | ||||
FRANKLIN STRATEGIC SERIES
Notes to Financial Statements
1. Organization and Significant Accounting Policies
Franklin Strategic Series (Trust) is registered under the Investment Company Act of 1940 (1940 Act) as anopen-end management investment company, consisting of eight separate funds, four of which are included in this report (Funds) and applies the specialized accounting and reporting guidance in U.S. Generally Accepted Accounting Principles (U.S. GAAP). The Funds offer five classes of shares: Class A, Class C, Class R, Class R6, and Advisor Class. Beginning on October 19, 2018, Class C shares automatically convert to Class A shares after they have been held for 10 years. Each class of shares may differ by its initial sales load, contingent deferred sales charges, voting rights on matters affecting a single class, its exchange privilege and fees due to differing arrangements for distribution and transfer agent fees.
Franklin Small Cap Growth Fund was closed to new investors with limited exceptions effective at the close of market February 12, 2015. Effective April 28, 2017, the Fund opened Class R6 shares to new investors who are eligible to purchase Class R6 shares. Effective January 17, 2019, all share classes of the Fundre-opened to new investors.
Effective June 1, 2018, Franklin Focused Core Equity Fund was renamed Franklin Select U.S. Equity Fund.
The following summarizes the Funds’ significant accounting policies.
a. Financial Instrument Valuation
The Funds’ investments in financial instruments are carried at fair value daily. Fair value is the price that would be received to sell an asset or paid to transfer a liability in an orderly transaction between market participants on the measurement date. The Funds calculate the net asset value (NAV) per share each business day as of 4 p.m. Eastern time or the regularly scheduled close of the New York Stock Exchange (NYSE), whichever is earlier. Under compliance policies and procedures approved by the Trust’s Board of Trustees (the Board), the Funds’ administrator has responsibility for oversight of valuation, including leading the cross-functional Valuation Committee (VC). The Funds may utilize independent pricing services, quotations from securities and financial instrument dealers, and other market sources to determine fair value.
Equity securities listed on an exchange or on the NASDAQ National Market System are valued at the last quoted sale price or the official closing price of the day, respectively. Foreign equity securities are valued as of the close of trading on the foreign stock exchange on which the security is primarily traded, or as of 4 p.m. Eastern time. The value is then converted into its U.S. dollar equivalent at the foreign exchange rate in effect at 4 p.m. Eastern time on the day that the value of the security is determined.Over-the-counter (OTC) securities are valued within the range of the most recent quoted bid and ask prices. Securities that trade in multiple markets or on multiple exchanges are valued according to the broadest and most representative market. Certain equity securities are valued based upon fundamental characteristics or relationships to similar securities.
Investments inopen-end mutual funds are valued at the closing NAV. Investments in repurchase agreements are valued at cost, which approximates fair value.
The Funds have procedures to determine the fair value of financial instruments for which market prices are not reliable or readily available. Under these procedures, the Funds primarily employ a market-based approach which may use related or comparable assets or liabilities, recent transactions, market multiples, book values, and other relevant information for the investment to determine the fair value of the investment. An income-based valuation approach may also be used in which the anticipated future cash flows of the investment are discounted to calculate fair value. Discounts may also be applied due to the nature or duration of any restrictions on the disposition of the investments. Due to the inherent uncertainty of valuations of such investments, the fair values may differ significantly from the values that would have been used had an active market existed.
Trading in securities on foreign securities stock exchanges and OTC markets may be completed before 4 p.m. Eastern time. In addition, trading in certain foreign markets may not take place on every Funds’ business day. Occasionally, events occur between the time at which trading in a foreign security is completed and 4 p.m. Eastern time that might call into question the reliability of the value of a portfolio security held by the Fund. As a result, differences may arise between the value of the Funds’ portfolio securities as determined at the foreign market close and the latest indications of value at 4 p.m. Eastern time. In order to minimize the potential for these differences, the VC monitors price movements following the close of
franklintempleton.com | Annual Report | 71 | ||
FRANKLIN STRATEGIC SERIES
NOTES TO FINANCIAL STATEMENTS
1. Organization and Significant Accounting
Policies(continued)
a. Financial Instrument Valuation(continued)
trading in foreign stock markets through a series of country specific market proxies (such as baskets of American Depositary Receipts, futures contracts and exchange traded funds). These price movements are measured against established trigger thresholds for each specific market proxy to assist in determining if an event has occurred that may call into question the reliability of the values of the foreign securities held by the Funds. If such an event occurs, the securities may be valued using fair value procedures, which may include the use of independent pricing services.
When the last day of the reporting period is anon-business day, certain foreign markets may be open on those days that the Funds’ NAV is not calculated, which could result in differences between the value of the Funds’ portfolio securities on the last business day and the last calendar day of the reporting period. Any significant security valuation changes due to an open foreign market are adjusted and reflected by the Funds for financial reporting purposes.
b. Foreign Currency Translation
Portfolio securities and other assets and liabilities denominated in foreign currencies are translated into U.S. dollars based on the exchange rate of such currencies against U.S. dollars on the date of valuation. The Funds may enter into foreign currency exchange contracts to facilitate transactions denominated in a foreign currency. Purchases and sales of securities, income and expense items denominated in foreign currencies are translated into U.S. dollars at the exchange rate in effect on the transaction date. Portfolio securities and assets and liabilities denominated in foreign currencies contain risks that those currencies will decline in value relative to the U.S. dollar. Occasionally, events may impact the availability or reliability of foreign exchange rates used to convert the U.S. dollar equivalent value. If such an event occurs, the foreign exchange rate will be valued at fair value using procedures established and approved by the Board.
The Funds do not separately report the effect of changes in foreign exchange rates from changes in market prices on securities held. Such changes are included in net realized and unrealized gain or loss from investments in the Statements of Operations.
Realized foreign exchange gains or losses arise from sales of foreign currencies, currency gains or losses realized between the trade and settlement dates on securities transactions and the difference between the recorded amounts of dividends, interest, and foreign withholding taxes and the U.S. dollar equivalent of the amounts actually received or paid. Net unrealized foreign exchange gains and losses arise from changes in foreign exchange rates on foreign denominated assets and liabilities other than investments in securities held at the end of the reporting period.
c. Securities Lending
Certain or all Funds participate in an agency based securities lending program to earn additional income. The Fund receives cash collateral against the loaned securities in an amount equal to at least 102% of the fair value of the loaned securities. Collateral is maintained over the life of the loan in an amount not less than 100% of the fair value of loaned securities, as determined at the close of Fund business each day; any additional collateral required due to changes in security values is delivered to the Fund on the next business day. The collateral is deposited into a joint cash account with other funds and is used to invest in a money market fund managed by Franklin Advisers, Inc., an affiliate of the Funds and/or uninvested cash as included in due from custodian in the Statements of Assets and Liabilities. The Fund may receive income from the investment of cash collateral, in addition to lending fees and rebates paid by the borrower. Income from securities loaned, net of fees paid to the securities lending agent and/or third-party vendor, is reported separately in the Statements of Operations. The Fund bears the market risk with respect to the collateral investment, securities loaned, and the risk that the agent may default on its obligations to the Fund. If the borrower defaults on its obligation to return the securities loaned, the Fund has the right to repurchase the securities in the open market using the collateral received. The securities lending agent has agreed to indemnify the Fund in the event of default by a third party borrower. At April 30, 2019, Franklin Growth Opportunities Fund and Franklin Select U.S. Equity Fund had no securities on loan.
d. Income and Deferred Taxes
It is each Fund’s policy to qualify as a regulated investment company under the Internal Revenue Code. Each Fund intends to distribute to shareholders substantially all of its taxable
| 72 | Annual Report | franklintempleton.com | ||||
FRANKLIN STRATEGIC SERIES
NOTES TO FINANCIAL STATEMENTS
income and net realized gains to relieve it from federal income and excise taxes. As a result, no provision for U.S. federal income taxes is required.
The Funds may be subject to foreign taxation related to income received, capital gains on the sale of securities and certain foreign currency transactions in the foreign jurisdictions in which the Funds invest. Foreign taxes, if any, are recorded based on the tax regulations and rates that exist in the foreign markets in which the Funds invest. When a capital gain tax is determined to apply, certain or all Funds record an estimated deferred tax liability in an amount that would be payable if the securities were disposed of on the valuation date.
Each Fund may recognize an income tax liability related to its uncertain tax positions under U.S. GAAP when the uncertain tax position has a less than 50% probability that it will be sustained upon examination by the tax authorities based on its technical merits. As of April 30, 2019, each Fund has determined that no tax liability is required in its financial statements related to uncertain tax positions for any open tax years (or expected to be taken in future tax years). Open tax years are those that remain subject to examination and are based on the statute of limitations in each jurisdiction in which the Fund invests.
e. Security Transactions, Investment Income, Expenses and Distributions
Security transactions are accounted for on trade date. Realized gains and losses on security transactions are determined on a specific identification basis. Interest income and estimated expenses are accrued daily. Dividend income is recorded on theex-dividend date except for certain dividends from securities where the dividend rate is not available. In such cases, the dividend is recorded as soon as the information is received by the Funds. Distributions to shareholders are recorded on theex-dividend date. Distributable earnings are determined according to income tax regulations (tax basis) and may differ from earnings recorded in accordance with U.S. GAAP. These
differences may be permanent or temporary. Permanent differences are reclassified among capital accounts to reflect their tax character. These reclassifications have no impact on net assets or the results of operations. Temporary differences are not reclassified, as they may reverse in subsequent periods.*
Common expenses incurred by the Trust are allocated among the Funds based on the ratio of net assets of each Fund to the combined net assets of the Trust or based on the ratio of number of shareholders of each Fund to the combined number of shareholders of the Trust. Fund specific expenses are charged directly to the Fund that incurred the expense.
Realized and unrealized gains and losses and net investment income, excluding class specific expenses, are allocated daily to each class of shares based upon the relative proportion of net assets of each class. Differences in per share distributions by class are generally due to differences in class specific expenses.
f. Accounting Estimates
The preparation of financial statements in accordance with U.S. GAAP requires management to make estimates and assumptions that affect the reported amounts of assets and liabilities at the date of the financial statements and the amounts of income and expenses during the reporting period. Actual results could differ from those estimates.
g. Guarantees and Indemnifications
Under the Trust’s organizational documents, its officers and trustees are indemnified by the Trust against certain liabilities arising out of the performance of their duties to the Trust. Additionally, in the normal course of business, the Trust, on behalf of the Funds, enters into contracts with service providers that contain general indemnification clauses. The Trust’s maximum exposure under these arrangements is unknown as this would involve future claims that may be made against the Trust that have not yet occurred. Currently, the Trust expects the risk of loss to be remote.
*Effective during the current reporting period, it is no longer required to present certain line items in the Statements of Changes in Net Assets. The below prior period amounts affected by this change are shown as they were in the prior year Statements of Changes in Net Assets.
franklintempleton.com | Annual Report | 73 | ||
FRANKLIN STRATEGIC SERIES
NOTES TO FINANCIAL STATEMENTS
1. Organization and Significant Accounting Policies(continued)
For the year ended April 30, 2018, distributions to shareholders were as follows:
| Franklin Growth Opportunities Fund | Franklin Select U.S. Equity Fund | Franklin Small Cap Growth Fund | Franklin Small-Mid Cap Growth Fund | |||||||||||||
| ||||||||||||||||
Distributions from net realized gains: | ||||||||||||||||
Class A | $(189,384,206 | ) | $ — | $(13,026,727 | ) | $(188,183,859) | ||||||||||
Class C | (36,890,234 | ) | — | (2,968,851 | ) | (37,764,936) | ||||||||||
Class R | (3,861,226 | ) | — | (1,455,647 | ) | (6,640,970) | ||||||||||
Class R6 | (26,495,718 | ) | — | (16,214,723 | ) | (21,566,773) | ||||||||||
Advisor Class | (42,059,463 | ) | — | (13,459,989 | ) | (39,628,357) | ||||||||||
For the year ended April 30, 2018, accumulated net investment loss included in net assets was as follows:
| Fund | Accumulated net investment loss | |||
| ||||
Franklin Growth Opportunities Fund | $(4,268,478) | |||
Franklin Select U.S. Equity Fund | $ (243,541) | |||
Franklin Small Cap Growth Fund | $(2,644,648) | |||
FranklinSmall-Mid Cap Growth Fund | $ — | |||
2. Shares of Beneficial Interest
At April 30, 2019, there were an unlimited number of shares authorized (without par value). Transactions in the Funds’ shares were as follows:
| Franklin Growth | Franklin Select U.S. | |||||||||||||||
| Opportunities Fund | Equity Fund | |||||||||||||||
|
| |||||||||||||||
| Shares | Amount | Shares | Amount | |||||||||||||
| ||||||||||||||||
Class A Shares: | ||||||||||||||||
Year ended April 30, 2019 | ||||||||||||||||
Shares solda | 11,527,502 | $ | 446,798,931 | 1,406,734 | $ | 21,698,694 | ||||||||||
Shares issued in reinvestment of distributions | 7,925,459 | 253,773,429 | 686,186 | 9,057,652 | ||||||||||||
Shares redeemed | (11,143,246 | ) | (425,634,152 | ) | (1,132,089 | ) | (17,474,924) | |||||||||
|
| |||||||||||||||
Net increase (decrease) | 8,309,715 | $ | 274,938,208 | 960,831 | $ | 13,281,422 | ||||||||||
|
| |||||||||||||||
Year ended April 30, 2018 | ||||||||||||||||
Shares sold | 7,166,896 | $ | 269,822,921 | 503,310 | $ | 8,051,742 | ||||||||||
Shares issued in reinvestment of distributions | 4,805,055 | 175,240,189 | — | — | ||||||||||||
Shares redeemed | (14,319,505 | ) | (536,928,068 | ) | (1,600,612 | ) | (25,165,556) | |||||||||
|
| |||||||||||||||
Net increase (decrease) | (2,347,554 | ) | $ | (91,864,958 | ) | (1,097,302 | ) | $ | (17,113,814) | |||||||
|
| |||||||||||||||
| 74 | Annual Report | franklintempleton.com | ||||
FRANKLIN STRATEGIC SERIES
NOTES TO FINANCIAL STATEMENTS
| Franklin Growth | Franklin Select U.S. | |||||||||||||||
| Opportunities Fund | Equity Fund | |||||||||||||||
|
| |||||||||||||||
| Shares | Amount | Shares | Amount | |||||||||||||
| ||||||||||||||||
Class C Shares: | ||||||||||||||||
Year ended April 30, 2019 | ||||||||||||||||
Shares sold | 1,419,843 | $ | 46,769,565 | 246,596 | $ | 3,641,767 | ||||||||||
Shares issued in reinvestment of distributions | 1,096,405 | 28,890,280 | 169,618 | 2,082,903 | ||||||||||||
Shares redeemeda | (7,237,389 | ) | (240,512,245 | ) | (499,994 | ) | (7,615,582) | |||||||||
|
| |||||||||||||||
Net increase (decrease) | (4,721,141 | ) | $ | (164,852,400 | ) | (83,780 | ) | $ | (1,890,912) | |||||||
|
| |||||||||||||||
Year ended April 30, 2018 | ||||||||||||||||
Shares sold | 1,416,968 | $ | 45,670,045 | 169,798 | $ | 2,570,525 | ||||||||||
Shares issued in reinvestment of distributions | 1,171,816 | 36,291,145 | — | — | ||||||||||||
Shares redeemed | (3,285,529 | ) | (105,588,146 | ) | (401,846 | ) | (6,013,029) | |||||||||
|
| |||||||||||||||
Net increase (decrease) | (696,745 | ) | $ | (23,626,956 | ) | (232,048 | ) | $ | (3,442,504) | |||||||
|
| |||||||||||||||
Class R Shares: | ||||||||||||||||
Year ended April 30, 2019 | ||||||||||||||||
Shares sold | 181,946 | $ | 6,761,234 | 435 | $ | 6,572 | ||||||||||
Shares issued in reinvestment of distributions | 123,799 | 3,767,199 | 1,344 | 17,405 | ||||||||||||
Shares redeemed | (308,476 | ) | (11,294,344 | ) | (776 | ) | (12,542) | |||||||||
|
| |||||||||||||||
Net increase (decrease) | (2,731 | ) | $ | (765,911 | ) | 1,003 | $ | 11,435 | ||||||||
|
| |||||||||||||||
Year ended April 30, 2018 | ||||||||||||||||
Shares sold | 184,889 | $ | 6,657,157 | 5,129 | $ | 77,884 | ||||||||||
Shares issued in reinvestment of distributions | 109,382 | 3,821,807 | — | — | ||||||||||||
Shares redeemed | (808,089 | ) | (28,845,473 | ) | (7,727 | ) | (121,843) | |||||||||
|
| |||||||||||||||
Net increase (decrease) | (513,818 | ) | $ | (18,366,509 | ) | (2,598 | ) | $ | (43,959) | |||||||
|
| |||||||||||||||
Class R6 Shares: | ||||||||||||||||
Year ended April 30, 2019 | ||||||||||||||||
Shares sold | 1,593,233 | $ | 65,447,277 | 14,436 | $ | 230,801 | ||||||||||
Shares issued in reinvestment of distributions | 798,910 | 28,041,731 | 8,300 | 112,384 | ||||||||||||
Shares redeemed | (1,611,469 | ) | (68,100,412 | ) | (18,245 | ) | (298,509) | |||||||||
|
| |||||||||||||||
Net increase (decrease) | 780,674 | $ | 25,388,596 | 4,491 | $ | 44,676 | ||||||||||
|
| |||||||||||||||
Year ended April 30, 2018 | ||||||||||||||||
Shares sold | 1,719,083 | $ | 70,340,588 | 85,528 | $ | 1,360,151 | ||||||||||
Shares issued in reinvestment of distributions | 516,029 | 20,352,194 | — | — | ||||||||||||
Shares redeemed | (1,209,156 | ) | (49,339,448 | ) | (1,350,483 | ) | (20,766,517) | |||||||||
|
| |||||||||||||||
Net increase (decrease) | 1,025,956 | $ | 41,353,334 | (1,264,955 | ) | $ | (19,406,366) | |||||||||
|
| |||||||||||||||
Advisor Class Shares: | ||||||||||||||||
Year ended April 30, 2019 | ||||||||||||||||
Shares sold | 4,826,217 | $ | 192,490,364 | 1,588,134 | $ | 23,675,471 | ||||||||||
Shares issued in reinvestment of distributions | 1,596,331 | 55,344,783 | 111,006 | 1,494,146 | ||||||||||||
Shares redeemed | (8,711,497 | ) | (349,623,005 | ) | (519,636 | ) | (7,940,554) | |||||||||
|
| |||||||||||||||
Net increase (decrease) | (2,288,949 | ) | $ | (101,787,858 | ) | 1,179,504 | $ | 17,229,063 | ||||||||
|
| |||||||||||||||
Year ended April 30, 2018 | ||||||||||||||||
Shares sold | 2,255,020 | $ | 89,869,837 | 224,083 | $ | 3,543,200 | ||||||||||
Shares issued in reinvestment of distributions | 1,049,408 | 40,968,889 | — | — | ||||||||||||
Shares redeemed | (3,702,910 | ) | (149,211,091 | ) | (442,950 | ) | (7,018,498) | |||||||||
|
| |||||||||||||||
Net increase (decrease) | (398,482 | ) | $ | (18,372,365 | ) | (218,867 | ) | $ | (3,475,298) | |||||||
|
| |||||||||||||||
franklintempleton.com | Annual Report | 75 | ||
FRANKLIN STRATEGIC SERIES
NOTES TO FINANCIAL STATEMENTS
2. Shares of Beneficial Interest(continued)
| Franklin Small Cap | Franklin Small-Mid Cap | |||||||||||||||
| Growth Fund | Growth Fund | |||||||||||||||
|
| |||||||||||||||
| Shares | Amount | Shares | Amount | |||||||||||||
| ||||||||||||||||
Class A Shares: | ||||||||||||||||
Year ended April 30, 2019 | ||||||||||||||||
Shares solda | 7,109,392 | $ | 159,713,318 | 14,858,754 | $ | 536,401,847 | ||||||||||
Shares issued in reinvestment of distributions | 6,425,425 | 111,866,657 | 8,741,011 | 259,433,312 | ||||||||||||
Shares redeemed | (9,200,387 | ) | (204,786,124 | ) | (14,104,259 | ) | (496,441,989) | |||||||||
|
| |||||||||||||||
Net increase (decrease) | 4,334,430 | $ | 66,793,851 | 9,495,506 | $ | 299,393,170 | ||||||||||
|
| |||||||||||||||
Year ended April 30, 2018 | ||||||||||||||||
Shares sold | 3,189,012 | $ | 67,849,901 | 10,215,023 | $ | 369,305,768 | ||||||||||
Shares issued in reinvestment of distributions | 547,334 | 11,920,682 | 5,062,829 | 177,806,171 | ||||||||||||
Shares redeemed | (11,554,343 | ) | (245,073,266 | ) | (19,601,669 | ) | (712,235,557) | |||||||||
|
| |||||||||||||||
Net increase (decrease) | (7,817,997 | ) | $ | (165,302,683 | ) | (4,323,817 | ) | $ | (165,123,618) | |||||||
|
| |||||||||||||||
Class C Shares: | ||||||||||||||||
Year ended April 30, 2019 | ||||||||||||||||
Shares sold | 616,858 | $ | 10,919,327 | 1,512,688 | $ | 38,650,988 | ||||||||||
Shares issued in reinvestment of distributions | 1,309,694 | 18,270,229 | 1,265,311 | 25,318,892 | ||||||||||||
Shares redeemeda | (3,457,014 | ) | (66,346,223 | ) | (8,796,878 | ) | (227,658,497) | |||||||||
|
| |||||||||||||||
Net increase (decrease) | (1,530,462 | ) | $ | (37,156,667 | ) | (6,018,879 | ) | $ | (163,688,617) | |||||||
|
| |||||||||||||||
Year ended April 30, 2018 | ||||||||||||||||
Shares sold | 279,449 | $ | 5,088,767 | 1,315,525 | $ | 34,824,098 | ||||||||||
Shares issued in reinvestment of distributions | 156,063 | 2,874,674 | 1,482,639 | 37,392,153 | ||||||||||||
Shares redeemed | (2,157,881 | ) | (38,362,296 | ) | (4,350,045 | ) | (115,440,720) | |||||||||
|
| |||||||||||||||
Net increase (decrease) | (1,722,369 | ) | $ | (30,398,855 | ) | (1,551,881 | ) | $ | (43,224,469) | |||||||
|
| |||||||||||||||
Class R Shares: | ||||||||||||||||
Year ended April 30, 2019 | ||||||||||||||||
Shares sold | 1,090,360 | $ | 23,643,908 | 402,799 | $ | 13,332,859 | ||||||||||
Shares issued in reinvestment of distributions | 792,641 | 12,967,603 | 300,662 | 8,087,803 | ||||||||||||
Shares redeemed | (1,435,500 | ) | (30,760,878 | ) | (1,329,075 | ) | (42,403,451) | |||||||||
|
| |||||||||||||||
Net increase (decrease) | 447,501 | $ | 5,850,633 | (625,614 | ) | $ | (20,982,789) | |||||||||
|
| |||||||||||||||
Year ended April 30, 2018 | ||||||||||||||||
Shares sold | 642,577 | $ | 13,280,250 | 564,940 | $ | 18,785,330 | ||||||||||
Shares issued in reinvestment of distributions | 69,237 | 1,438,739 | 197,203 | 6,369,651 | ||||||||||||
Shares redeemed | (1,724,856 | ) | (34,995,989 | ) | (1,198,049 | ) | (40,113,390) | |||||||||
|
| |||||||||||||||
Net increase (decrease) | (1,013,042 | ) | $ | (20,277,000 | ) | (435,906 | ) | $ | (14,958,409) | |||||||
|
| |||||||||||||||
| 76 | Annual Report | franklintempleton.com | ||||
FRANKLIN STRATEGIC SERIES
NOTES TO FINANCIAL STATEMENTS
| Franklin Small Cap | Franklin Small-Mid Cap | |||||||||||||||
| Growth Fund | Growth Fund | |||||||||||||||
|
| |||||||||||||||
| Shares | Amount | Shares | Amount | |||||||||||||
| ||||||||||||||||
Class R6 Shares: | ||||||||||||||||
Year ended April 30, 2019 | ||||||||||||||||
Shares sold | 14,008,871 | $ | 340,717,317 | 2,051,263 | $ | 81,360,684 | ||||||||||
Shares issued in reinvestment of distributions | 7,029,042 | 135,098,188 | 733,010 | 24,453,238 | ||||||||||||
Shares redeemed | (12,935,223 | ) | (319,298,995 | ) | (3,502,497 | ) | (140,556,648) | |||||||||
|
| |||||||||||||||
Net increase (decrease) | 8,102,690 | $ | 156,516,510 | (718,224 | ) | $ | (34,742,726) | |||||||||
|
| |||||||||||||||
Year ended April 30, 2018 | ||||||||||||||||
Shares sold | 9,126,555 | $ | 210,441,655 | 2,883,707 | $ | 115,938,495 | ||||||||||
Shares issued in reinvestment of distributions | 599,648 | 14,103,732 | 509,486 | 19,762,976 | ||||||||||||
Shares redeemed | (12,909,982 | ) | (300,321,532 | ) | (2,414,377 | ) | (96,501,514) | |||||||||
|
| |||||||||||||||
Net increase (decrease) | (3,183,779 | ) | $ | (75,776,145 | ) | 978,816 | $ | 39,199,957 | ||||||||
|
| |||||||||||||||
Advisor Class Shares: | ||||||||||||||||
Year ended April 30, 2019 | ||||||||||||||||
Shares sold | 6,621,879 | $ | 160,225,038 | 3,117,800 | $ | 123,344,447 | ||||||||||
Shares issued in reinvestment of distributions | 5,738,085 | 108,679,322 | 1,592,925 | 52,232,005 | ||||||||||||
Shares redeemed | (10,287,992 | ) | (239,792,999 | ) | (9,309,703 | ) | (351,635,842) | |||||||||
|
| |||||||||||||||
Net increase (decrease) | 2,071,972 | $ | 29,111,361 | (4,598,978 | ) | $ | (176,059,390) | |||||||||
|
| |||||||||||||||
Year ended April 30, 2018 | ||||||||||||||||
Shares sold | 5,063,743 | $ | 115,186,325 | 2,962,038 | $ | 115,876,935 | ||||||||||
Shares issued in reinvestment of distributions | 516,706 | 12,028,914 | 979,925 | 37,482,152 | ||||||||||||
Shares redeemed | (15,186,221 | ) | (345,941,426 | ) | (6,459,038 | ) | (254,294,102) | |||||||||
|
| |||||||||||||||
Net increase (decrease) | (9,605,772 | ) | $ | (218,726,187 | ) | (2,517,075 | ) | $ | (100,935,015) | |||||||
|
| |||||||||||||||
aMay include a portion of Class C shares that were automatically converted to Class A.
3. Transactions with Affiliates
Franklin Resources, Inc. is the holding company for various subsidiaries that together are referred to as Franklin Templeton. Certain officers and trustees of the Trust are also officers and/or directors of the following subsidiaries:
| Subsidiary | Affiliation | |||
| Franklin Advisers, Inc. (Advisers) | Investment manager | |||
| Franklin Templeton Services, LLC (FT Services) | Administrative manager | |||
| Franklin Templeton Distributors, Inc. (Distributors) | Principal underwriter | |||
| Franklin Templeton Investor Services, LLC (Investor Services) | Transfer agent |
franklintempleton.com | Annual Report | 77 | ||
FRANKLIN STRATEGIC SERIES
NOTES TO FINANCIAL STATEMENTS
3. Transactions with Affiliates(continued)
a. Management Fees
Franklin Growth Opportunities Fund pays an investment management fee to Advisers based on the average daily net assets of the Fund as follows:
| Annualized Fee Rate | Net Assets | |
| 0.700% | Up to and including $500 million | |
| 0.600% | Over $500 million, up to and including $1 billion | |
| 0.550% | Over $1 billion, up to and including $1.5 billion | |
| 0.500% | Over $1.5 billion, up to and including $6.5 billion | |
| 0.475% | Over $6.5 billion, up to and including $11.5 billion | |
| 0.450% | Over $11.5 billion, up to and including $16.5 billion | |
| 0.440% | Over $16.5 billion, up to and including $19 billion | |
| 0.430% | Over $19 billion, up to and including $21.5 billion | |
| 0.420% | In excess of $21.5 billion |
Franklin Select U.S. Equity Fund pays an investment management fee to Advisers based on the average daily net assets of the Fund as follows:
| Annualized Fee Rate | Net Assets | |
| 0.950% | Up to and including $500 million | |
| 0.850% | Over $500 million, up to and including $1 billion | |
| 0.800% | Over $1 billion, up to and including $1.5 billion | |
| 0.750% | Over $1.5 billion, up to and including $6.5 billion | |
| 0.725% | Over $6.5 billion, up to and including $11.5 billion | |
| 0.700% | Over $11.5 billion, up to and including $16.5 billion | |
| 0.690% | Over $16.5 billion, up to and including $19 billion | |
| 0.680% | Over $19 billion, up to and including $21.5 billion | |
| 0.670% | In excess of $21.5 billion |
Franklin Small Cap Growth Fund pays an investment management fee to Advisers based on the average daily net assets of the Fund as follows:
| Annualized Fee Rate | Net Assets | |
| 0.750% | Up to and including $500 million | |
| 0.650% | Over $500 million, up to and including $1 billion | |
| 0.600% | Over $1 billion, up to and including $1.5 billion | |
| 0.550% | Over $1.5 billion, up to and including $6.5 billion | |
| 0.525% | Over $6.5 billion, up to and including $11.5 billion | |
| 0.500% | Over $11.5 billion, up to and including $16.5 billion | |
| 0.490% | Over $16.5 billion, up to and including $19 billion | |
| 0.480% | Over $19 billion, up to and including $21.5 billion | |
| 0.470% | In excess of $21.5 billion |
| 78 | Annual Report | franklintempleton.com | ||||
FRANKLIN STRATEGIC SERIES
NOTES TO FINANCIAL STATEMENTS
FranklinSmall-Mid Cap Growth Fund pays an investment management fee to Advisers based on the average daily net assets of the Fund as follows:
| Annualized Fee Rate | Net Assets | |
| 0.625% | Up to and including $100 million | |
| 0.500% | Over $100 million, up to and including $250 million | |
| 0.450% | Over $250 million, up to and including $7.5 billion | |
| 0.440% | Over $7.5 billion, up to and including $10 billion | |
| 0.430% | Over $10 billion, up to and including $12.5 billion | |
| 0.420% | Over $12.5 billion, up to and including $15 billion | |
| 0.400% | In excess of $15 billion |
For the year ended April 30, 2019, each Fund’s gross effective investment management fee rate based on average daily net assets was as follows:
| Franklin Growth Opportunities Fund | Franklin Select U.S. Equity Fund | Franklin Small Cap Growth Fund | Franklin Small-Mid Cap Growth Fund | |||
0.545% | 0.950% | 0.616% | 0.457% |
b. Administrative Fees
Under an agreement with Advisers, FT Services provides administrative services to the Funds. The fee is paid by Advisers based on each of the Funds’ average daily net assets, and is not an additional expense of the Funds.
c. Distribution Fees
The Board has adopted distribution plans for each share class, with the exception of Class R6 and Advisor Class shares, pursuant to Rule12b-1 under the 1940 Act. Under the Funds’ Class A reimbursement distribution plans, the Funds reimburse Distributors for costs incurred in connection with the servicing, sale and distribution of each Fund’s shares up to the maximum annual plan rate. Under the Class A reimbursement distribution plans, costs exceeding the maximum for the current plan year cannot be reimbursed in subsequent periods. In addition, under the Funds’ Class C and R compensation distribution plans, the Funds pay Distributors for costs incurred in connection with the servicing, sale and distribution of each Fund’s shares up to the maximum annual plan rate for each class. The plan year, for purposes of monitoring compliance with the maximum annual plan rates, is February 1 through January 31 for each Fund.
The maximum annual plan rates, based on the average daily net assets, for each class, are as follows:
| Franklin Growth Opportunities Fund | Franklin Select U.S. Equity Fund | Franklin Small Cap Growth Fund | Franklin Small-Mid Cap Growth Fund | |||||||||||||||||||||||||
Reimbursement Plans: | ||||||||||||||||||||||||||||
Class A | 0.35% | 0.35% | 0.35% | 0.25% | ||||||||||||||||||||||||
Compensation Plans: | ||||||||||||||||||||||||||||
Class C | 1.00% | 1.00% | 1.00% | 1.00% | ||||||||||||||||||||||||
Class R | 0.50% | 0.50% | 0.50% | 0.50% | ||||||||||||||||||||||||
For Franklin Growth Opportunities Fund, Franklin Select U.S. Equity Fund and Franklin Small Cap Growth Fund, the Board has set the current rate at 0.25% per year for Class A shares until further notice and approval by the Board.
franklintempleton.com | Annual Report | 79 | ||
FRANKLIN STRATEGIC SERIES
NOTES TO FINANCIAL STATEMENTS
3. Transactions with Affiliates(continued)
d. Sales Charges/Underwriting Agreements
Front-end sales charges and contingent deferred sales charges (CDSC) do not represent expenses of the Funds. These charges are deducted from the proceeds of sales of fund shares prior to investment or from redemption proceeds prior to remittance, as applicable. Distributors has advised the Funds of the following commission transactions related to the sales and redemptions of the Funds’ shares for the year:
| Franklin Growth Opportunities Fund | Franklin Select U.S. Equity Fund | Franklin Small Cap Growth Fund | Franklin Small-Mid Cap Growth Fund | |||||||||||||||||||||||||
Sales charges retained net of commissions paid to unaffiliated brokers/dealers | $390,122 | $16,238 | $54,637 | $495,012 | ||||||||||||||||||||||||
CDSC retained | $ 12,988 | $ 532 | $ 1,824 | $ 22,958 | ||||||||||||||||||||||||
Effective September 10, 2018, the Board approved changes to certainfront-end sales charges and dealer commissions on Class A shares. Further details are disclosed in the Funds’ Prospectus.
e. Transfer Agent Fees
Each class of shares pays transfer agent fees to Investor Services for its performance of shareholder servicing obligations. The fees are based on an annualized asset based fee of 0.02% plus a transaction based fee. In addition, each class reimburses Investor Services for out of pocket expenses incurred and, except for Class R6, reimburses shareholder servicing fees paid to third parties. These fees are allocated daily based upon their relative proportion of such classes’ aggregate net assets. Class R6 pays Investor Services transfer agent fees specific to that class.
For the year ended April 30, 2019, the Funds paid transfer agent fees as noted in the Statements of Operations of which the following amounts were retained by Investor Services:
| Franklin | Franklin | Franklin | ||||||||||||||||||||||||||
| Franklin Growth | Select U.S. | Small Cap | Small-Mid Cap | |||||||||||||||||||||||||
| Opportunities Fund | Equity Fund | Growth Fund | Growth Fund | |||||||||||||||||||||||||
Transfer agent fees | $2,393,702 | $81,488 | $1,466,237 | $2,630,959 | ||||||||||||||||||||||||
f. Investments in Affiliated Management Investment Companies
Certain or all Funds invest in one or more affiliated management investment companies for purposes other than exercising a controlling influence over the management or policies. Management fees paid by the Funds are waived on assets invested in the affiliated management investment companies, as noted in the Statements of Operations, in an amount not to exceed the management and administrative fees paid directly or indirectly by each affiliate. During the year ended April 30, 2019, investments in affiliated management investment companies were as follows:
| Number of Shares Held at Beginning of Year | Gross Additions | Gross Reductions | Number of Shares Held at End of Year | Value at End of Year | Investment Income | Realized Gain (Loss) | Net Change in Unrealized Appreciation (Depreciation) | |||||||||||||||||||||||||
Franklin Growth Opportunities Fund Non-Controlled Affiliates | ||||||||||||||||||||||||||||||||
| Dividends | ||||||||||||||||||||||||||||||||
Institutional Fiduciary Trust Money | 18,556,305 | 747,585,794 | (697,015,171 | ) | 69,126,928 | $ | 69,126,928 | $ | 644,989 | $ | — | $ | — | |||||||||||||||||||
| 80 | Annual Report | franklintempleton.com | ||||
FRANKLIN STRATEGIC SERIES
NOTES TO FINANCIAL STATEMENTS
| Number of Shares Held at Beginning of Year | Gross Additions | Gross Reductions | Number of Shares Held at End of Year | Value at End of Year | Investment Income | Realized Gain (Loss) | Net Change in Unrealized Appreciation (Depreciation) | |||||||||||||||||||||||||
Franklin Growth Opportunities Fund Non-Controlled Affiliates | ||||||||||||||||||||||||||||||||
Income from loaned | ||||||||||||||||||||||||||||||||
Institutional Fiduciary Trust Money | — | 68,172,227 | (68,172,227 | ) | — | $ | — | $ | 75,547 | $ | — | $ | — | |||||||||||||||||||
Total Affiliated Securities | $ | 69,126,928 | $ | 720,536 | $ | — | $ | — | ||||||||||||||||||||||||
Franklin Select U.S. Equity Fund Non-Controlled Affiliates | ||||||||||||||||||||||||||||||||
| Dividends | ||||||||||||||||||||||||||||||||
Institutional Fiduciary Trust Money | 761,261 | 37,589,949 | (31,190,137 | ) | 7,161,073 | $ | 7,161,073 | $ | 100,768 | $ | — | $ | — | |||||||||||||||||||
Franklin Small Cap Growth Fund Non-Controlled Affiliates | ||||||||||||||||||||||||||||||||
| Dividends | ||||||||||||||||||||||||||||||||
Institutional Fiduciary Trust Money | 15,082,060 | 703,175,424 | (647,504,678 | ) | 70,752,806 | $ | 70,752,806 | $ | 751,145 | $ | — | $ | — | |||||||||||||||||||
Income from loaned | ||||||||||||||||||||||||||||||||
Institutional Fiduciary Trust Money | 76,587,584 | 365,223,986 | (423,548,886 | ) | 18,262,684 | 18,262,684 | 709,059 | — | — | |||||||||||||||||||||||
Total Affiliated Securities | $ | 89,015,490 | $ | 1,460,204 | $ | — | $ | — | ||||||||||||||||||||||||
Franklin Small-Mid Cap Growth Fund Non-Controlled Affiliates | ||||||||||||||||||||||||||||||||
| Dividends | ||||||||||||||||||||||||||||||||
Institutional Fiduciary Trust Money | 114,742,583 | 945,824,429 | (936,409,939 | ) | 124,157,073 | $ | 124,157,073 | $ | 1,923,102 | $ | — | $ | — | |||||||||||||||||||
Income from loaned | ||||||||||||||||||||||||||||||||
Institutional Fiduciary Trust Money | 28,485,775 | 239,494,851 | (261,168,991 | ) | 6,811,635 | 6,811,635 | 194,606 | — | — | |||||||||||||||||||||||
Total Affiliated Securities | $ | 130,968,708 | $ | 2,117,708 | $ | — | $ | — | ||||||||||||||||||||||||
g. Waiver and Expense Reimbursements
Advisers and Investor Services have contractually agreed in advance to waive or limit their respective fees and to assume as their own expense certain expenses otherwise payable by Franklin Select U.S. Equity Fund so that the expenses (excluding distribution fees and acquired fund fees and expenses) for Class A, Class C, Class R and Advisor Class of the Fund does not exceed 1.00%, and Class R6 does not exceed 0.88% based on the average net assets of each class (other than certainnon-routine expenses or costs, including those relating to litigation, indemnification, reorganizations, and liquidations) until August 31, 2019. Total expenses waived or paid are not subject to recapture subsequent to the Fund’s fiscal year end.
Prior to September 1, 2018, expenses (excluding certain fees and expenses as previously disclosed) for Franklin Select U.S. Equity Fund for Class R6 were limited to 0.84% based on the average net assets of the class.
franklintempleton.com | Annual Report | 81 | ||
FRANKLIN STRATEGIC SERIES
NOTES TO FINANCIAL STATEMENTS
3. Transactions with Affiliates(continued)
g. Waiver and Expense Reimbursements(continued)
For Franklin Growth Opportunities Fund, Franklin Small Cap Growth Fund and FranklinSmall-Mid Cap Growth Fund, Investor Services has voluntarily agreed in advance to waive or limit its fees so that the Class R6 transfer agent fees do not exceed 0.02% based on the average net assets of the class. Investor Services may discontinue this waiver in the future.
h. Other Affiliated Transactions
At April 30, 2019, one or more of the funds in Franklin Fund Allocator Series owned 5.6% of the Franklin Growth Opportunities Fund’s outstanding shares.
4. Expense Offset Arrangement
The Funds have entered into an arrangement with their custodian whereby credits realized as a result of uninvested cash balances are used to reduce a portion of the Funds’ custodian expenses. During the year ended April 30, 2019, the custodian fees were reduced as noted in the Statements of Operations.
5. Income Taxes
For tax purposes, the Funds may elect to defer any portion of a post-October capital loss or late-year ordinary loss to the first day of the following fiscal year. At April 30, 2019, the deferred losses were as follows:
| Franklin Growth Opportunities Fund | Franklin Select U.S. Equity Fund | Franklin Small Cap Growth Fund | Franklin Small-Mid Cap Growth Fund | |||||||||||||||||||||||||
Late-year ordinary losses | $5,667,880 | $119,809 | $ — | $3,666,488 | ||||||||||||||||||||||||
The tax character of distributions paid during the years ended April 30, 2019 and 2018, was as follows:
Franklin Growth Opportunities Fund | Franklin Select U.S. Equity Fund | Franklin Small Cap Growth Fund | ||||||||||||||||||||||||||||||
| 2019 | 2018 | 2019 | 2018 | 2019 | 2018 | |||||||||||||||||||||||||||
Distributions paid from: | ||||||||||||||||||||||||||||||||
Ordinary income | $ | — | $ | — | $ | — | $ | — | $ | 13,084,020 | $ | — | ||||||||||||||||||||
Long term capital gain | 397,221,880 | 298,690,847 | 13,009,161 | — | 417,223,228 | 47,125,937 | ||||||||||||||||||||||||||
| $ | 397,221,880 | $ | 298,690,847 | $ | 13,009,161 | $ | — | $ | 430,307,248 | $ | 47,125,937 | |||||||||||||||||||||
Franklin Small-Mid Cap Growth Fund | ||||||||
| 2019 | 2018 | |||||||
Distributions paid from: | ||||||||
Ordinary income | $ | 26,220,410 | $ | 5,968,734 | ||||
Long term capital gain | 363,114,395 | 287,816,161 | ||||||
| $ | 389,334,805 | $ | 293,784,895 | |||||
| 82 | Annual Report | franklintempleton.com | ||||
FRANKLIN STRATEGIC SERIES
NOTES TO FINANCIAL STATEMENTS
At April 30, 2019, the cost of investments, net unrealized appreciation (depreciation), undistributed ordinary income and undistributed long term capital gains for income tax purposes were as follows:
| Franklin | Franklin | Franklin | ||||||||||||||||||||||||||
| Franklin Growth | Select U.S. | Small Cap | Small-Mid Cap | |||||||||||||||||||||||||
| Opportunities Fund | Equity Fund | Growth Fund | Growth Fund | |||||||||||||||||||||||||
Cost of investments | $2,058,224,554 | $103,511,269 | $2,016,883,510 | $2,578,726,165 | ||||||||||||||||||||||||
Unrealized appreciation | $2,006,431,921 | $ 22,095,841 | $ 835,893,035 | $1,010,024,239 | ||||||||||||||||||||||||
Unrealized depreciation | (33,681,560 | ) | (3,078,925 | ) | (143,671,503 | ) | (44,332,260 | ) | ||||||||||||||||||||
Net unrealized appreciation (depreciation) | $1,972,750,361 | $ 19,016,916 | $ 692,221,532 | $ 965,691,979 | ||||||||||||||||||||||||
Distributable earnings: | ||||||||||||||||||||||||||||
Undistributed ordinary income | $ — | $ — | $ 22,658,947 | $ — | ||||||||||||||||||||||||
Undistributed long term capital gains | 227,281,269 | 123,847 | 99,030,886 | 413,580,626 | ||||||||||||||||||||||||
Total distributable earnings | $ 227,281,269 | $ 123,847 | $ 121,689,833 | $ 413,580,626 | ||||||||||||||||||||||||
Differences between income and/or capital gains as determined on a book basis and a tax basis are primarily due to differing treatments of wash sales.
The Funds, except for Franklin Select U.S. Equity Fund, utilized a tax accounting practice to treat a portion of the proceeds from capital shares redeemed as a distribution from realized capital gains.
6. Investment Transactions
Purchases and sales of investments (excluding short term securities) for the year ended April 30, 2019, were as follows:
| Franklin Growth Opportunities Fund | Franklin Select U.S. Equity Fund | Franklin Small Cap Growth Fund | Franklin Small-Mid Cap Growth Fund | |||||||||||||||||||||||||
Purchases | $ 938,308,506 | $13,337,003 | $1,091,314,880 | $1,853,670,946 | ||||||||||||||||||||||||
Sales | $1,353,571,634 | $ 4,703,189 | $1,367,288,700 | $2,357,473,441 | ||||||||||||||||||||||||
At April 30, 2019, in connection with securities lending transactions, certain or all Funds loaned investments and received cash collateral as follows:
| Franklin Small Cap Growth Fund | Franklin Small-Mid Cap Growth Fund | |||||||
Securities lending transactionsa: | ||||||||
Equity investmentsb | $18,262,684 | $6,811,635 | ||||||
aThe agreements can be terminated at any time.
bThe gross amount of recognized liability for such transactions is included in payable upon return of securities loaned in the Statements of Assets and Liabilities.
7. Restricted Securities
Certain or all Funds invest in securities that are restricted under the Securities Act of 1933 (1933 Act). Restricted securities are often purchased in private placement transactions, and cannot be sold without prior registration unless the sale is pursuant to an exemption under the 1933 Act. Disposal of these securities may require greater effort and expense, and prompt sale at an acceptable price may be difficult. The Funds may have registration rights for restricted securities. The issuer generally incurs all registration costs.
franklintempleton.com | Annual Report | 83 | ||
FRANKLIN STRATEGIC SERIES
NOTES TO FINANCIAL STATEMENTS
7. Restricted Securities(continued)
At April 30, 2019, investments in restricted securities, excluding securities exempt from registration under the 1933 Act deemed to be liquid, were as follows:
| Shares | Issuer | Acquisition Date | Cost | Value | ||||||||||||
Franklin Growth Opportunities Fund | ||||||||||||||||
| 1,624,999 | Bill.com, pfd., H | 12/21/18 | $ | 13,500,004 | $ | 14,395,754 | ||||||||||
| 2,610,594 | ClearMotion Inc., pfd., C | 11/06/17 | 5,500,000 | 6,717,996 | ||||||||||||
| 3,698,772 | ClearMotion Inc., pfd., D | 12/21/18 | 10,000,000 | 10,345,480 | ||||||||||||
| 1,673,284 | LegalZoom.comInc. | 7/20/18 | 16,479,337 | 20,473,416 | ||||||||||||
| 509,182 | Optoro Inc., pfd., E | 7/24/18 | 10,020,702 | 12,168,487 | ||||||||||||
| 2,362,202 | Proterra Inc., pfd., 5, 144A | 9/21/16 - 1/13/17 | 11,896,616 | 22,295,471 | ||||||||||||
| 596,775 | Proterra Inc., pfd., 6, 144A | 6/07/17 | 3,306,052 | 5,632,617 | ||||||||||||
| 780,667 | Proterra Inc., pfd., 7 | 5/21/18 - 9/18/18 | 5,094,960 | 7,368,268 | ||||||||||||
| 928,488 | Sweetgreen Inc., pfd., H | 11/09/18 | 12,107,484 | 13,006,896 | ||||||||||||
| 805,800 | Tanium Inc., pfd., G | 9/14/15 | 4,000,233 | 4,893,610 | ||||||||||||
| Total Restricted Securities(Value is 2.9% of Net Assets) | $ | 91,905,388 | $ | 117,297,995 | ||||||||||||
Franklin Small Cap Growth Fund | ||||||||||||||||
| 3,698,772 | ClearMotion Inc., pfd., D | 12/21/18 | $ | 10,000,000 | $ | 10,345,480 | ||||||||||
| 9,905,685 | DraftKings Inc. | 8/07/15 - 3/02/17 | 26,627,302 | 25,454,688 | ||||||||||||
| 1,431,280 | LegalZoom.comInc. | 7/20/18 | 14,095,961 | 17,512,383 | ||||||||||||
| 508,130 | Optoro Inc., pfd., E | 7/24/18 | 9,999,999 | 12,143,346 | ||||||||||||
| 1,038,769 | Peloton Interactive Inc., pfd., F | 8/08/18 | 15,000,011 | 24,365,904 | ||||||||||||
| 1,787,047 | Proterra Inc., pfd., 5, 144A | 9/21/16 - 1/13/17 | 8,999,998 | 16,866,913 | ||||||||||||
| 1,310,834 | Proterra Inc., pfd., 6, 144A | 6/07/17 - 1/02/18 | 7,261,842 | 12,372,211 | ||||||||||||
| 536,367 | Proterra Inc., pfd., 7 | 5/21/18 | 3,500,556 | 5,062,461 | ||||||||||||
| 596,471 | Rent the Runway Inc., pfd. | 3/21/19 | 13,333,328 | 13,333,328 | ||||||||||||
| 1,542,673 | Smule Inc., pfd., G, 144A | 5/31/16 | 11,099,995 | 10,805,398 | ||||||||||||
| 352,675 | Smule Inc., pfd., H, 144A | 4/27/17 | 2,999,995 | 2,746,149 | ||||||||||||
| 383,435 | Sweetgreen Inc., pfd., H | 11/09/18 | 4,999,992 | 5,371,420 | ||||||||||||
| 361,111 | Tula eTechnology Inc. | 11/01/18 | — | — | ||||||||||||
| 3,611,111 | Tula Technology Inc., E | 9/08/17 | 6,500,000 | 6,824,476 | ||||||||||||
| Total Restricted Securities(Value is 6.1% of Net Assets) | $ | 134,418,979 | $ | 163,204,157 | ||||||||||||
FranklinSmall-Mid Cap Growth Fund | ||||||||||||||||
| 866,666 | Bill.com, pfd., H | 12/21/18 | $ | 7,200,001 | $ | 7,677,734 | ||||||||||
| 7,974,537 | DraftKings Inc. | 8/07/15 - 3/02/17 | 21,380,303 | 20,492,207 | ||||||||||||
| 1,416,913 | Proterra Inc., pfd., 5, 144A | 9/21/16 | 7,135,914 | 13,373,430 | ||||||||||||
| Total Restricted Securities(Value is 1.2% of Net Assets) | $ | 35,716,218 | $ | 41,543,371 | ||||||||||||
8. Holdings of 5% Voting Securities of Portfolio Companies
The 1940 Act defines “affiliated companies” to include investments in portfolio companies in which a fund owns 5% or more of the outstanding voting securities. During the year ended April 30, 2019, investments in “affiliated companies” were as follows:
| 84 | Annual Report | franklintempleton.com | ||||
FRANKLIN STRATEGIC SERIES
NOTES TO FINANCIAL STATEMENTS
| Name of Issuer | Number of at Beginning | Gross Additions | Gross Reductions | Number of of Year | Value at End of Year | Dividend Income | Realized Gain (Loss) | Net Change in Unrealized Appreciation (Depreciation) | ||||||||||||||||||||||
Franklin Small Cap Growth Fund | ||||||||||||||||||||||||||||||
Non-Controlled Affiliates | ||||||||||||||||||||||||||||||
Aratana Therapeutics Inc. | 2,697,019 | — | (2,697,019 | ) | — | $ — | $ — | $(26,414,104) | $24,416,933 | |||||||||||||||||||||
The KeyW Holding Corp. | 3,430,282 | — | (468,000 | ) | 2,962,282 | 33,592,278 | — | (692,698) | 11,955,895 | |||||||||||||||||||||
Pfenex Inc. | 1,175,631 | 611,700 | (234,659 | ) | 1,552,672 | — | a | — | (2,128,191) | — | a | |||||||||||||||||||
Sportsman’s Warehouse Holdings Inc. | 4,162,000 | — | (573,800 | ) | 3,588,200 | 16,003,372 | — | (3,010,961) | 1,511,414 | |||||||||||||||||||||
Total Affiliated Securities(Value is 1.8% of Net Assets) | $49,595,650 | $ — | $(32,245,954) | $37,884,242 | ||||||||||||||||||||||||||
aAs of April 30, 2019, no longer an affiliate.
9. Credit Facility
The Funds, together with other U.S. registered and foreign investment funds (collectively, Borrowers), managed by Franklin Templeton, are borrowers in a joint syndicated senior unsecured credit facility totaling $2 billion (Global Credit Facility) which matures on February 7, 2020. This Global Credit Facility provides a source of funds to the Borrowers for temporary and emergency purposes, including the ability to meet future unanticipated or unusually large redemption requests.
Under the terms of the Global Credit Facility, the Funds shall, in addition to interest charged on any borrowings made by the Funds and other costs incurred by the Funds, pay their share of fees and expenses incurred in connection with the implementation and maintenance of the Global Credit Facility, based upon their relative share of the aggregate net assets of all of the Borrowers, including an annual commitment fee of 0.15% based upon the unused portion of the Global Credit Facility. These fees are reflected in other expenses in the Statements of Operations. During the year ended April 30, 2019, the Funds did not use the Global Credit Facility.
10. Fair Value Measurements
The Funds follow a fair value hierarchy that distinguishes between market data obtained from independent sources (observable inputs) and the Funds own market assumptions (unobservable inputs). These inputs are used in determining the value of the Funds’ financial instruments and are summarized in the following fair value hierarchy:
| • | Level 1 – quoted prices in active markets for identical financial instruments |
| • | Level 2 – other significant observable inputs (including quoted prices for similar financial instruments, interest rates, prepayment speed, credit risk, etc.) |
| • | Level 3 – significant unobservable inputs (including the Funds’ own assumptions in determining the fair value of financial instruments) |
The input levels are not necessarily an indication of the risk or liquidity associated with financial instruments at that level.
franklintempleton.com | Annual Report | 85 | ||
FRANKLIN STRATEGIC SERIES
NOTES TO FINANCIAL STATEMENTS
10. Fair Value Measurements(continued)
A summary of inputs used as of April 30, 2019, in valuing the Funds’ assets carried at fair value, is as follows:
| Level 1 | Level 2 | Level 3 | Total | |||||||||||||
Franklin Growth Opportunities Fund | ||||||||||||||||
Assets: | ||||||||||||||||
Investments in Securities:a | ||||||||||||||||
Equity Investments:b | ||||||||||||||||
Communication Services | $ | 325,247,614 | $ | — | $ | 4,893,610 | $ | 330,141,224 | ||||||||
Consumer Discretionary | 367,254,702 | — | 65,366,728 | 432,621,430 | ||||||||||||
Financials | 264,157,337 | — | 14,395,754 | 278,553,091 | ||||||||||||
Industrials | 444,561,267 | — | 12,168,487 | 456,729,754 | ||||||||||||
Information Technology | 1,578,281,210 | — | 20,473,416 | 1,598,754,626 | ||||||||||||
All Other Equity Investments | 865,047,862 | — | — | 865,047,862 | ||||||||||||
Short Term Investments | 69,126,928 | — | — | 69,126,928 | ||||||||||||
Total Investments in Securities
|
$
|
3,913,676,920
|
|
$
|
—
|
|
$
|
117,297,995
|
|
$
|
4,030,974,915
|
| ||||
Franklin Select U.S. Equity Fund | ||||||||||||||||
Assets: | ||||||||||||||||
Investments in Securities:a | ||||||||||||||||
Equity Investments | $ | 115,367,112 | $ | — | $ | — | $ | 115,367,112 | ||||||||
Short Term Investments | 7,161,073 | — | — | 7,161,073 | ||||||||||||
Total Investments in Securities
|
$
|
122,528,185
|
|
$
|
—
|
|
$
|
—
|
|
$
|
122,528,185
|
| ||||
Franklin Small Cap Growth Fund | ||||||||||||||||
Assets: | ||||||||||||||||
Investments in Securities:a | ||||||||||||||||
Equity Investments:b | ||||||||||||||||
Consumer Discretionary | $ | 334,057,844 | $ | — | $ | 119,996,881 | c | $ | 454,054,725 | |||||||
Industrials | 506,527,384 | — | 12,143,346 | 518,670,730 | ||||||||||||
Information Technology | 642,925,302 | — | 31,063,930 | 673,989,232 | ||||||||||||
All Other Equity Investments | 973,374,865 | — | — | 973,374,865 | ||||||||||||
Short Term Investments | 89,015,490 | — | — | 89,015,490 | ||||||||||||
Total Investments in Securities
|
$
|
2,545,900,885
|
|
$
|
—
|
|
$
|
163,204,157
|
|
$
|
2,709,105,042
|
| ||||
FranklinSmall-Mid Cap Growth Fund | ||||||||||||||||
Assets: | ||||||||||||||||
Investments in Securities:a | ||||||||||||||||
Equity Investments:b | ||||||||||||||||
Consumer Discretionary | $ | 528,202,650 | $ | — | $ | 33,865,637 | $ | 562,068,287 | ||||||||
Financials | 234,459,832 | — | 7,677,734 | 242,137,566 | ||||||||||||
All Other Equity Investments | 2,609,243,583 | — | — | 2,609,243,583 | ||||||||||||
Short Term Investments | 130,968,708 | — | — | 130,968,708 | ||||||||||||
Total Investments in Securities
|
$
|
3,502,874,773
|
|
$
|
—
|
|
$
|
41,543,371
|
|
$
|
3,544,418,144
|
| ||||
aFor detailed categories, see the accompanying Statement of Investments.
bIncludes common and preferred stocks.
cIncludes securities determined to have no value at April 30, 2019.
| 86 | Annual Report | franklintempleton.com | ||||
FRANKLIN STRATEGIC SERIES
NOTES TO FINANCIAL STATEMENTS
A reconciliation of assets in which Level 3 inputs are used in determining fair value is presented when there are significant Level 3 financial instruments at the beginning and/or end of the year. At April 30, 2019, the reconciliation of assets are as follows:
Balance at Beginning of Year | Purchases | Sales | Transfer Into (Out of) Level 3 | Cost Basis Adjustments | Net Realized Gain (Loss) | Net Unrealized Appreciation (Depreciation) | Balance at End of Year | Net Change in Unrealized Year End | |||||||||||||||||||||||||||||||||||||
Franklin Growth Opportunities Fund | |||||||||||||||||||||||||||||||||||||||||||||
Assets: | |||||||||||||||||||||||||||||||||||||||||||||
Investments in Securities: | |||||||||||||||||||||||||||||||||||||||||||||
Equity Investments:a | |||||||||||||||||||||||||||||||||||||||||||||
Communication Services | $ | 5,074,222 | $ | — | $ | — | $ | — | $ | — | $ | — | $ | (180,612 | ) | $ | 4,893,610 | $ | (180,612 | ) | |||||||||||||||||||||||||
Consumer Discretionary | 23,116,412 | 27,202,444 | — | — | — | — | 15,047,872 | 65,366,728 | 15,047,872 | ||||||||||||||||||||||||||||||||||||
Financials | — | 13,500,004 | — | — | — | — | 895,750 | 14,395,754 | 895,750 | ||||||||||||||||||||||||||||||||||||
Industrials | — | 10,020,702 | — | — | — | — | 2,147,785 | 12,168,487 | 2,147,785 | ||||||||||||||||||||||||||||||||||||
Information Technology | — | 16,479,337 | — | — | — | — | 3,994,079 | 20,473,416 | 3,994,079 | ||||||||||||||||||||||||||||||||||||
Total Investments in Securities
|
$
|
28,190,634
|
|
$
|
67,202,487
|
|
$
|
—
|
|
$
|
—
|
|
$
|
—
|
|
$
|
—
|
|
$
|
21,904,874
|
|
$
|
117,297,995
|
|
$
|
21,904,874
|
| ||||||||||||||||||
Franklin Small Cap Growth Fund | |||||||||||||||||||||||||||||||||||||||||||||
Assets: | |||||||||||||||||||||||||||||||||||||||||||||
Investments in Securities: | |||||||||||||||||||||||||||||||||||||||||||||
Equity Investments:a | |||||||||||||||||||||||||||||||||||||||||||||
Consumer Discretionary | $ | 40,098,007 | $ | 46,833,887 | $ | — | $ | — | $ | — | $ | — | $ | 33,064,987 | $ | 119,996,881 | b | $ | 33,064,987 | ||||||||||||||||||||||||||
Industrials | — | 9,999,999 | — | — | — | — | 2,143,347 | 12,143,346 | 2,143,347 | ||||||||||||||||||||||||||||||||||||
Information Technology | 16,778,723 | 14,095,961 | — | — | — | — | 189,246 | 31,063,930 | 189,246 | ||||||||||||||||||||||||||||||||||||
Total Investments in Securities
|
$
|
56,876,730
|
|
$
|
70,929,847
|
|
$
|
—
|
|
$
|
—
|
|
$
|
—
|
|
$
|
—
|
|
$
|
35,397,580
|
|
$
|
163,204,157
|
|
$
|
35,397,580
|
| ||||||||||||||||||
FranklinSmall-Mid Cap Growth Fund | |||||||||||||||||||||||||||||||||||||||||||||
Assets: | |||||||||||||||||||||||||||||||||||||||||||||
Investments in Securities: | |||||||||||||||||||||||||||||||||||||||||||||
Equity Investments:a | |||||||||||||||||||||||||||||||||||||||||||||
Consumer Discretionary | $ | 20,493,825 | $ | — | $ | — | $ | — | $ | — | $ | — | $ | 13,371,812 | $ | 33,865,637 | $ | 13,371,812 | |||||||||||||||||||||||||||
Financials | — | 7,200,001 | — | — | — | — | 477,733 | 7,677,734 | 477,733 | ||||||||||||||||||||||||||||||||||||
Total Investments in Securities
|
$
|
20,493,825
|
|
$
|
7,200,001
|
|
$
|
—
|
|
$
|
—
|
|
$
|
—
|
|
$
|
—
|
|
$
|
13,849,545
|
|
$
|
41,543,371
|
|
$
|
13,849,545
|
| ||||||||||||||||||
aIncludes common and preferred stocks.
bIncludes securities determined to have no value.
Significant unobservable valuation inputs for material Level 3 financial instruments and impact to fair value as a result of changes in unobservable valuation inputs as of April 30, 2019, are as follows:
| Description | Fair Value at End of Year | Valuation Technique | Unobservable Inputs | Amount/Range (Weighted Averagea) | Impact to Fair Value if Input Increasesb | |||||||||||
Franklin Growth Opportunities Fund | ||||||||||||||||
Assets: | ||||||||||||||||
Investments in Securities: | ||||||||||||||||
Equity Investments:c | ||||||||||||||||
Communication Services | $ | 4,893,610 | Discounted cash flow | NOPAT multiple | 17.4x | Increase | d | |||||||||
| Discount rate | 9.8% | Decrease | e | |||||||||||||
franklintempleton.com | Annual Report | 87 | ||
FRANKLIN STRATEGIC SERIES
NOTES TO FINANCIAL STATEMENTS
10. Fair Value Measurements(continued)
| Description | Fair Value at End of Year | Valuation Technique | Unobservable Inputs | Amount/Range (Weighted Averagea) | Impact to Fair Value if Input Increasesb | |||||||||||||
Franklin Growth Opportunities Fund (continued) |
| Discount for lack of | 11.0% | Decreased | ||||||||||||||
Consumer Discretionary | 65,366,728 | Discounted cash flow | Forward EBITDA | 4.0% | Increasee | |||||||||||||
Free cash flow growth rate | 2.0% | Increased | ||||||||||||||||
Discount rate | | 9.7% - 15.8% (11.7%) | | Decreasee | ||||||||||||||
Discount for lack of marketability | | 5.4% - 18.7% (10.3%) | | Decreased | ||||||||||||||
Teminal multiple | 27.5x | Increase | ||||||||||||||||
Financials | 14,395,754 | Market comparables | EV / revenue multiple | 11.2x | Increased | |||||||||||||
Discount for lack of marketability | 8.6% | Decreased | ||||||||||||||||
Industrials | 12,168,487 | Market comparables | EV / revenue multiple | 11.1x | Increasee | |||||||||||||
Discount for lack of marketability | 13.3% | Decreased | ||||||||||||||||
Information Technology | 20,473,416 | Discounted cash flow | Long term growth | 4.0% | Increasee | |||||||||||||
Discount rate | 11.4% | Decreasee | ||||||||||||||||
Discount for lack of | 5.8% | Decreased | ||||||||||||||||
Total | $ | 117,297,995 | ||||||||||||||||
Franklin Small Cap Growth Fund |
| |||||||||||||||||
Assets: | ||||||||||||||||||
Investments in Securities: | ||||||||||||||||||
Equity Investments:c | ||||||||||||||||||
Consumer Discretionary | $ | 106,663,553 | Discounted cash flow | Forward EBITDA | 4.0% | Increasee | ||||||||||||
Free cash flow growth | 2.0% | Increased | ||||||||||||||||
Discount rate | | 9.7% - 15.8% (11.0%) | | Decreasee | ||||||||||||||
Discount for lack of | 5.4% - 18.7% (9.9%) | Decreased | ||||||||||||||||
Terminal multiple | 27.5x | Increase | ||||||||||||||||
| Market comparables | EV / EBITDA multiple | 17.9x - 22.2x | Increased | |||||||||||||||
EV / revenue multiple | 4.0x - 12.3x (5.0x) | Increased | ||||||||||||||||
Discount for lack of | 5.3% - 14.4% (7.3%) | Decreasec | ||||||||||||||||
Industrials | 12,143,346 | Market comparables | EV / revenue multiple | 11.1x | Increasee | |||||||||||||
Discount for lack of marketability | 13.3% | Decreased | ||||||||||||||||
Information Technology | 31,063,930 | Market comparables | EV / revenue multiple | 3.7x | Increased | |||||||||||||
Discount for lack of | 10.9% | Decreased | ||||||||||||||||
| 88 | Annual Report | franklintempleton.com | ||||
FRANKLIN STRATEGIC SERIES
NOTES TO FINANCIAL STATEMENTS
| Description | Fair Value at End of Year | Valuation Technique | Unobservable Inputs | Amount/ Range (Weighted Averagea) | Impact to Fair Value if Input Increasesb | |||||||||||||
| Discounted cash flow | Long term growth rate | 4.0% | Increasee | |||||||||||||||
Discount rate | 11.4% | Decreasee | ||||||||||||||||
Discount for lack of marketability | 5.8% | Decreased | ||||||||||||||||
All Other Investmentsf | 13,333,328 | g | ||||||||||||||||
Total | $ | 163,204,157 | ||||||||||||||||
FranklinSmall-Mid Cap Growth Fund |
| |||||||||||||||||
Assets: | ||||||||||||||||||
Investments in Securities: | ||||||||||||||||||
Equity Investments:c | ||||||||||||||||||
Consumer Discretionary | $ | 33,865,637 | Discounted cash flow | Forward EBITDA growth rate | 4.0% | Increased | ||||||||||||
Discount rate | 9.7% | Decreasee | ||||||||||||||||
Discount for lack of | 5.4% | Decreased | ||||||||||||||||
| Market Comparables | EV /revenue multiple | 4.0x | Increasee | |||||||||||||||
Discount for lack of | 11.7% | Decreased | ||||||||||||||||
Financials | 7,677,734 | Market comparables | EV / revenue multiple | 11.2x | Increased | |||||||||||||
Discount for lack of | 8.6% | Decreased | ||||||||||||||||
Total | $ | 41,543,371 | ||||||||||||||||
aWeighted based on the relative fair value of the financial instruments.
bRepresents the directional change in the fair value of the Level 3 financial instruments that would result from a significant and reasonable increase in the corresponding input. A significant and reasonable decrease in the input would have the opposite effect. Significant impacts, if any, to fair value and/or net assets have been indicated.
cIncludes common and preferred stocks.
dRepresents a significant impact to fair value but not net assets.
eRepresents a significant impact to fair value and net assets.
fIncludes financial instruments with values derived using private transaction prices ornon-public third party pricing information which is unobservable. May also include fair value of immaterial financial instruments developed using various valuation techniques and unobservable inputs.
gIncludes securities determined to have no value at April 30, 2019.
Abbreviations List
| EBITDA | Earnings before interest, taxes, depreciation and amortization | |
| EV | Enterprise value | |
| NOPAT | Net Operating Profit After Taxes |
11. Subsequent Events
The Funds have evaluated subsequent events through the issuance of the financial statements and determined that no events have occurred that require disclosure.
Abbreviations
Selected Portfolio |
ADR American Depositary Receipt
franklintempleton.com | Annual Report | 89 | ||
FRANKLIN STRATEGIC SERIES
Report of Independent Registered Public Accounting Firm
To the Board of Trustees of Franklin Strategic Series and Shareholders of Franklin Growth Opportunities Fund, Franklin Select U.S. Equity Fund, Franklin Small Cap Growth Fund and FranklinSmall-Mid Cap Growth Fund
Opinions on the Financial Statements
We have audited the accompanying statements of assets and liabilities, including the statements of investments, of Franklin Growth Opportunities Fund, Franklin Select U.S. Equity Fund, Franklin Small Cap Growth Fund and FranklinSmall-Mid Cap Growth Fund (the “Funds”) as of April 30, 2019, the related statements of operations for the year ended April 30, 2019, the statements of changes in net assets for each of the two years in the period ended April 30, 2019, including the related notes, and the financial highlights for each of the five years in the period ended April 30, 2019 (collectively referred to as the “financial statements”). In our opinion, the financial statements present fairly, in all material respects, the financial position of each of the Funds as of April 30, 2019, the results of each of their operations for the year then ended, the changes in each of their net assets for each of the two years in the period ended April 30, 2019 and each of the financial highlights for each of the five years in the period ended April 30, 2019 in conformity with accounting principles generally accepted in the United States of America.
Basis for Opinions
These financial statements are the responsibility of the Funds’ management. Our responsibility is to express an opinion on the Funds’ financial statements based on our audits. We are a public accounting firm registered with the Public Company Accounting Oversight Board (United States) (PCAOB) and are required to be independent with respect to the Funds in accordance with the U.S. federal securities laws and the applicable rules and regulations of the Securities and Exchange Commission and the PCAOB.
We conducted our audits of these financial statements in accordance with the standards of the PCAOB. Those standards require that we plan and perform the audit to obtain reasonable assurance about whether the financial statements are free of material misstatement, whether due to error or fraud.
Our audits included performing procedures to assess the risks of material misstatement of the financial statements, whether due to error or fraud, and performing procedures that respond to those risks. Such procedures included examining, on a test basis, evidence regarding the amounts and disclosures in the financial statements. Our audits also included evaluating the accounting principles used and significant estimates made by management, as well as evaluating the overall presentation of the financial statements. Our procedures included confirmation of securities owned as of April 30, 2019 by correspondence with the custodian, transfer agent and brokers; when replies were not received from brokers, we performed other auditing procedures. We believe that our audits provide a reasonable basis for our opinions.
PricewaterhouseCoopers LLP
San Francisco, California
June 17, 2019
We have served as the auditor of one or more investment companies in the Franklin Templeton Group of Funds since 1948.
| 90 | Annual Report | franklintempleton.com | ||||
FRANKLIN STRATEGIC SERIES
Tax Information (unaudited)
Under Section 852(b)(3)(C) of the Internal Revenue Code, the Funds hereby report the maximum amount allowable but no less than the following amounts as long term capital gain dividends for the fiscal year ended April 30, 2019:
Franklin Growth Opportunities Fund | Franklin Select U.S. Equity Fund | Franklin Small Cap Growth Fund | Franklin Small-Mid Cap Growth Fund | |||||||||
| ||||||||||||
| $401,999,946 | $13,009,161 | $422,645,228 | $388,292,007 | |||||||||
Under Section 871(k)(2)(C) of the Internal Revenue Code, the Funds hereby report the maximum amount allowable but no less than the following amounts as short term capital gain dividends for purposes of the tax imposed under Section 871(a)(1)(A) of the Internal Revenue Code for the fiscal year ended April 30, 2019:
Franklin Growth Opportunities Fund | Franklin Select U.S. Equity Fund | Franklin Small Cap Growth Fund | Franklin Small-Mid Cap Growth Fund | |||||||||
| ||||||||||||
| $ — | $ — | $13,084,020 | $26,220,410 | |||||||||
Under Section 854(b)(1)(A) of the Internal Revenue Code, the Funds hereby report the following percentage amounts of the ordinary income dividends as income qualifying for the dividends received deduction for the fiscal year ended April 30, 2019:
Franklin Growth Opportunities Fund | Franklin Select U.S. Equity Fund | Franklin Small Cap Growth Fund | Franklin Small-Mid Cap Growth Fund | |||||||||
| ||||||||||||
| 0.00% | 0.00% | 54.19% | 71.18% | |||||||||
Under Section 854(b)(1)(B) of the Internal Revenue Code, the Funds hereby report the maximum amount allowable but no less than the following amounts as qualified dividends for purposes of the maximum rate under Section 1(h)(11) of the Internal Revenue Code for the fiscal year ended April 30, 2019:
Franklin Growth Opportunities Fund | Franklin Select U.S. Equity Fund | Franklin Small Cap Growth Fund | Franklin Small-Mid Cap Growth Fund | |||||||||
| ||||||||||||
| $21,630,888 | $935,784 | $7,090,359 | $19,194,951 | |||||||||
Distributions, including qualified dividend income, paid during calendar year 2019 will be reported to shareholders on Form1099-DIV bymid-February 2020. Shareholders are advised to check with their tax advisors for information on the treatment of these amounts on their individual income tax returns.
franklintempleton.com | Annual Report | 91 | ||
FRANKLIN STRATEGIC SERIES
Board Members and Officers
The name, year of birth and address of the officers and board members, as well as their affiliations, positions held with the Trust, principal occupations during at least the past five years and number of U.S. registered portfolios overseen in the Franklin Templeton fund complex, are shown below. Generally, each board member serves until that person’s successor is elected and qualified.
Independent Board Members
Name, Year of Birth and Address
| Position
| Length of
| Number of Portfolios in
| Other Directorships Held During at Least the Past 5 Years
| ||||
Harris J. Ashton (1932) One Franklin Parkway San Mateo, CA 94403-1906 | Trustee | Since 1991 | 136 | Bar-S Foods (meat packing company) (1981-2010). | ||||
| Principal Occupation During at Least the Past 5 Years: | ||||||||
Director of various companies; andformerly, Director, RBC Holdings, Inc. (bank holding company) (until 2002); and President, Chief Executive Officer and Chairman of the Board, General Host Corporation (nursery and craft centers) (until 1998).
| ||||||||
Terrence J. Checki (1945) One Franklin Parkway San Mateo, CA 94403-1906 | Trustee | Since 2017 | 112 | Hess Corporation (exploration of oil and gas) (2014-present). | ||||
Principal Occupation During at Least the Past 5 Years: Member of the Council on Foreign Relations (1996-present); Member of the National Committee on U.S.-China Relations (1999-present); member of the Board of Trustees of the Economic Club of New York (2013-present); member of the Board of Trustees of the Foreign Policy Association (2005-present) and member of various other boards of trustees and advisory boards; andformerly, Executive Vice President of the Federal Reserve Bank of New York and Head of its Emerging Markets and Internal Affairs Group and Member of Management Committee (1995-2014); and Visiting Fellow at the Council on Foreign Relations (2014).
| ||||||||
Mary C. Choksi (1950) One Franklin Parkway San Mateo, CA 94403-1906 | Trustee | Since 2014 | 136 | Avis Budget Group Inc. (car rental) (2007-present), Omnicom Group Inc. (advertising and marketing communications services) (2011-present) and White Mountains Insurance Group, Ltd. (holding company) (2017-present). | ||||
Principal Occupation During at Least the Past 5 Years: Director of various companies; andformerly, Founder and Senior Advisor, Strategic Investment Group (investment management group) (2015-2017); Founding Partner and Senior Managing Director, Strategic Investment Group (1987-2015); Founding Partner and Managing Director, Emerging Markets Management LLC (investment management firm) (1987-2011); and Loan Officer/Senior Loan Officer/Senior Pension Investment Officer, World Bank Group (international financial institution) (1977-1987).
| ||||||||
Edith E. Holiday (1952) One Franklin Parkway San Mateo, CA 94403-1906 | Lead Independent Trustee | Trustee since 1998 and Lead Independent Trustee since March 2019 | 136 | Hess Corporation (exploration of oil and gas) (1993-present), Canadian National Railway (railroad) (2001-present), White Mountains Insurance Group, Ltd. (holding company)(2004-present), Santander Consumer USA Holdings, Inc. (consumer finance) (2016-present), RTI International Metals, Inc. (manufacture and distribution of titanium)(1999-2015) and H.J. Heinz Company (processed foods and allied products) (1994-2013). | ||||
Principal Occupation During at Least the Past 5 Years: Director or Trustee of various companies and trusts; andformerly, Assistant to the President of the United States and Secretary of the Cabinet (1990-1993); General Counsel to the United States Treasury Department (1989-1990); and Counselor to the Secretary and Assistant Secretary for Public Affairs and Public Liaison–United States Treasury Department (1988-1989).
| ||||||||
J. Michael Luttig (1954) One Franklin Parkway San Mateo, CA 94403-1906 | Trustee | Since 2009 | 136 | Boeing Capital Corporation (aircraft financing) (2006-2013). | ||||
Principal Occupation During at Least the Past 5 Years: Executive Vice President, Counselor and Senior Advisor to Boeing Chairman and Board of Directors, The Boeing Company (aerospace company) (May 2019); andformerly, General Counsel and member of the Executive Council, The Boeing Company (2006-2019); Federal Appeals Court Judge, U.S. Court of Appeals for the Fourth Circuit (1991-2006). | ||||||||
| 92 | Annual Report | franklintempleton.com | ||||
FRANKLIN STRATEGIC SERIES
Independent Board Members(continued)
Name, Year of Birth and Address
| Position
| Length of Time Served
| Number of Portfolios in
| Other Directorships Held During at Least the Past 5 Years
| ||||
Larry D. Thompson (1945) One Franklin Parkway San Mateo, CA 94403-1906 | Trustee | Since 2007 | 136 | The Southern Company (energy company) (2014-present; previously 2010-2012), Graham Holdings Company (education and media organization) (2011-present) and Cbeyond, Inc. (business communications provider)(2010-2012). | ||||
| Principal Occupation During at Least the Past 5 Years: | ||||||||
Director of various companies; Counsel, Finch McCranie, LLP (law firm) (2015-present); Independent Compliance Monitor and Auditor, Volkswagen AG (manufacturer of automobiles and commercial vehicles) (2017-present); John A. Sibley Professor of Corporate and Business Law, University of Georgia School of Law (2015-present; previously 2011-2012); andformerly, Executive Vice President – Government Affairs, General Counsel and Corporate Secretary, PepsiCo, Inc. (consumer products) (2012-2014); Senior Vice President – Government Affairs, General Counsel and Secretary, PepsiCo, Inc. (2004-2011); Senior Fellow of The Brookings Institution (2003-2004); Visiting Professor, University of Georgia School of Law (2004); and Deputy Attorney General, U.S. Department of Justice (2001-2003).
| ||||||||
Interested Board Members and Officers
| ||||||||
Name, Year of Birth and Address
| Position
| Length of
| Number of Portfolios in
| Other Directorships Held During at Least the Past 5 Years
| ||||
**Gregory E. Johnson (1961) One Franklin Parkway San Mateo, CA 94403-1906 | Trustee | Since 2013 | 150 | None | ||||
| Principal Occupation During at Least the Past 5 Years: | ||||||||
Chairman of the Board, Member – Office of the Chairman, Director and Chief Executive Officer, Franklin Resources, Inc.; officer and/or director or
| ||||||||
**Rupert H. Johnson, Jr. (1940) One Franklin Parkway San Mateo, CA 94403-1906 | Chairman of the Board and Trustee | Chairman of the Board since 2013 and Trustee since 1991 | 136 | None | ||||
| Principal Occupation During at Least the Past 5 Years: | ||||||||
Vice Chairman, Member – Office of the Chairman and Director, Franklin Resources, Inc.; Director, Franklin Advisers, Inc.; and officer and/or director or trustee, as the case may be, of some of the other subsidiaries of Franklin Resources, Inc. and of 40 of the investment companies in Franklin Templeton.
| ||||||||
Alison E. Baur (1964) One Franklin Parkway San Mateo, CA 94403-1906 | Vice President | Since 2012 | Not Applicable | Not Applicable | ||||
| Principal Occupation During at Least the Past 5 Years: | ||||||||
Deputy General Counsel, Franklin Templeton; and officer of some of the other subsidiaries of Franklin Resources, Inc. and of 44 of the investment companies in Franklin Templeton.
| ||||||||
Sonal Desai, Ph.D. (1963) One Franklin Parkway San Mateo, CA 94403-1906 | Vice President | Since December 2018 | Not Applicable | Not Applicable | ||||
| Principal Occupation During at Least the Past 5 Years: | ||||||||
| Director and Executive Vice President, Franklin Advisers, Inc.; Executive Vice President, Franklin Templeton Institutional, LLC; and officer of 18 of the investment companies in Franklin Templeton. | ||||||||
franklintempleton.com | Annual Report | 93 | ||
FRANKLIN STRATEGIC SERIES
Interested Board Members and Officers(continued)
Name, Year of Birth and Address
| Position
| Length of
| Number of Portfolios in
| Other Directorships Held
| ||||
Gaston Gardey (1967) One Franklin Parkway San Mateo, CA 94403-1906 | Treasurer, Chief Financial Officer and, Chief Accounting Officer | Since 2009 | Not Applicable | Not Applicable | ||||
| Principal Occupation During at Least the Past 5 Years: | ||||||||
Treasurer, U.S. Fund Administration & Reporting and officer of 28 of the investment companies in Franklin Templeton.
| ||||||||
Aliya S. Gordon (1973) One Franklin Parkway San Mateo, CA 94403-1906 | Vice President | Since 2009 | Not Applicable | Not Applicable | ||||
| Principal Occupation During at Least the Past 5 Years: | ||||||||
Senior Associate General Counsel and officer of 44 of the investment companies in Franklin Templeton.
| ||||||||
Steven J. Gray (1955) One Franklin Parkway San Mateo, CA 94403-1906 | Vice President and Co- Secretary | Vice President since 2009 and Co-Secretary since January 2019 | Not Applicable | Not Applicable | ||||
| Principal Occupation During at Least the Past 5 Years: | ||||||||
Senior Associate General Counsel, Franklin Templeton; Vice President, Franklin Templeton Distributors, Inc. and FASA, LLC; and officer of 44 of the investment companies in Franklin Templeton.
| ||||||||
Matthew T. Hinkle (1971) One Franklin Parkway San Mateo, CA 94403-1906 | Chief Executive Officer – Finance and Administration | Since 2017 | Not Applicable | Not Applicable | ||||
| Principal Occupation During at Least the Past 5 Years: | ||||||||
Senior Vice President, Franklin Templeton Services, LLC; officer of 44 of the investment companies in Franklin Templeton; andformerly, Vice President, Global Tax (2012-April 2017) and Treasurer/Assistant Treasurer, Franklin Templeton (2009-2017).
| ||||||||
Robert Lim (1948) One Franklin Parkway San Mateo, CA 94403-1906 | Vice President – AML Compliance | Since 2016 | Not Applicable | Not Applicable | ||||
| Principal Occupation During at Least the Past 5 Years: | ||||||||
Vice President, Franklin Templeton Companies, LLC; Chief Compliance Officer, Franklin Templeton Distributors, Inc. and Franklin Templeton Investor Services, LLC; and officer of 44 of the investment companies in Franklin Templeton.
| ||||||||
Kimberly H. Novotny (1972) 300 S.E. 2nd Street Fort Lauderdale, FL 33301-1923 | Vice President | Since 2013 | Not Applicable | Not Applicable | ||||
| Principal Occupation During at Least the Past 5 Years: | ||||||||
Associate General Counsel, Franklin Templeton; Vice President and Corporate Secretary, Fiduciary Trust International of the South; Vice President, Templeton Investment Counsel, LLC; Assistant Secretary, Franklin Resources, Inc.; and officer of 44 of the investment companies in Franklin Templeton.
| ||||||||
Edward D. Perks (1970) One Franklin Parkway San Mateo, CA 94403-1906 | President and Chief Executive Officer – Investment Management | Since December 2018 | Not Applicable | Not Applicable | ||||
| Principal Occupation During at Least the Past 5 Years: | ||||||||
President and Director, Franklin Advisers, Inc.; and officer of nine of the investment companies in Franklin Templeton (since December 2018).
| ||||||||
| 94 | Annual Report | franklintempleton.com | ||||
FRANKLIN STRATEGIC SERIES
Interested Board Members and Officers(continued)
Name, Year of Birth and Address
| Position
| Length of
| Number of Portfolios in
| Other Directorships Held During at Least the Past 5 Years
| ||||
| ||||||||
Robert C. Rosselot (1960) 300 S.E. 2nd Street Fort Lauderdale, FL 33301-1923 | Chief Compliance Officer | Since 2013 | Not Applicable | Not Applicable | ||||
| Principal Occupation During at Least the Past 5 Years: | ||||||||
Director, Global Compliance, Franklin Templeton; Vice President, Franklin Templeton Companies, LLC; officer of 44 of the investment companies in Franklin Templeton; andformerly,Senior Associate General Counsel, Franklin Templeton (2007-2013); and Secretary and Vice President, Templeton Group of Funds (2004-2013).
| ||||||||
| ||||||||
Navid J. Tofigh (1972) One Franklin Parkway San Mateo, CA 94403-1906 | Vice President | Since 2015 | Not Applicable | Not Applicable | ||||
| Principal Occupation During at Least the Past 5 Years: | ||||||||
Associate General Counsel and officer of 44 of the investment companies in Franklin Templeton.
| ||||||||
| ||||||||
Craig S. Tyle (1960) One Franklin Parkway San Mateo, CA 94403-1906 | Vice President | Since 2005 | Not Applicable | Not Applicable | ||||
| Principal Occupation During at Least the Past 5 Years: | ||||||||
General Counsel, Executive Vice President and Secretary, Franklin Resources, Inc.; and officer of some of the other subsidiaries of Franklin Resources, Inc. and of 44 of the investment companies in Franklin Templeton.
| ||||||||
| ||||||||
Lori A. Weber (1964) 300 S.E. 2nd Street Fort Lauderdale, FL 33301-1923 | Vice President andCo-Secretary | Vice President since 2011 and Co-Secretary since January 2019 | Not Applicable | Not Applicable | ||||
| Principal Occupation During at Least the Past 5 Years: | ||||||||
Senior Associate General Counsel, Franklin Templeton; Assistant Secretary, Franklin Resources, Inc.; Vice President and Secretary, Templeton Investment Counsel, LLC; and officer of 44 of the investment companies in Franklin Templeton.
| ||||||||
| ||||||||
*We base the number of portfolios on each separate series of the U.S. registered investment companies within the Franklin Templeton fund complex. These portfolios have a common investment manager or affiliated investment managers.
**Gregory E. Johnson is considered to be an interested person of the Fund under the federal securities laws due to his position as an officer and director of Franklin Resources, Inc. (Resources), which is the parent company of the Fund’s investment manager and distributor. Rupert H. Johnson, Jr. is considered to be an interested person of the Fund under the federal securities laws due to his position as an officer and director and major shareholder of Resources.
Note 1: Rupert H. Johnson, Jr. is the uncle of Gregory E. Johnson.
Note 2: Effective March 12, 2019, John B. Wilson ceased to be a trustee of the Trust.
Note 3: Officer information is current as of the date of this report. It is possible that after this date, information about officers may change.
The Sarbanes-Oxley Act of 2002 and Rules adopted by the Securities and Exchange Commission require the Fund to disclose whether the Fund’s Audit Committee includes at least one member who is an audit committee financial expert within the meaning of such Act and Rules. The Fund’s Board has determined that there is at least one such financial expert on the Audit Committee and effective May 21, 2019, designated Mary C. Choksi as its audit committee financial expert. The Board believes that Ms. Choksi qualifies as such an expert in view of her extensive business background and experience. She currently serves as a director of Avis Budget Group, Inc. (2007-present) and formerly, Founder and Senior Advisor, Strategic Investment Group (1987 to 2017). Ms. Choksi has been a Member of the Fund’s Audit Committee since 2014. As a result of such background and experience, the Board believes that Ms. Choksi has acquired an understanding of generally accepted accounting principles and financial statements, the general application of such principles in connection with the accounting estimates, accruals and reserves, and analyzing and evaluating financial statements that present a breadth and level of complexity of accounting issues generally comparable to those of the Fund, as well as an understanding of internal controls and procedures for financial reporting and an understanding of audit committee functions. Ms. Choksi is an independent Board member as that term is defined under the relevant Securities and Exchange Commission Rules and Releases.
The Statement of Additional Information (SAI) includes additional information about the board members and is available, without charge, upon request. Shareholders may call (800) DIALBEN/342-5236 to request the SAI.
franklintempleton.com | Annual Report | 95 | ||
FRANKLIN STRATEGIC SERIES
Shareholder Information
Board Approval of Investment Management Agreements
FRANKLIN STRATEGIC SERIES
Franklin Select U.S. Equity Fund
Franklin Growth Opportunities Fund
Franklin Small Cap Growth Fund
FranklinSmall-Mid Cap Growth Fund
(each a Fund)
At anin-person meeting held on April 16, 2019 (Meeting), the Board of Trustees (Board) of Franklin Strategic Series (Trust), including a majority of the trustees who are not “interested persons” as defined in the Investment Company Act of 1940 (Independent Trustees), reviewed and approved the continuance of the investment management agreement between Franklin Advisers, Inc. (Manager) and the Trust, on behalf of each Fund (each a Management Agreement) for an additionalone-year period. The Independent Trustees received advice from and met separately with Independent Trustee counsel in considering whether to approve the continuation of each Management Agreement. Although the Management Agreements for the Funds were considered at the same Board meeting, the Board considered the information provided to it about the Funds together and with respect to each Fund separately as the Board deemed appropriate.
In considering the continuation of each Management Agreement, the Board reviewed and considered information provided by the Manager at the Meeting and throughout the year at meetings of the Board and its committees. The Board also reviewed and considered information provided in response to a detailed set of requests for information submitted to the Manager by Independent Trustee counsel on behalf of the Independent Trustees in connection with the annual contract renewal process. In addition, prior to the Meeting, the Independent Trustees held a telephonic contract renewal meeting at which the Independent Trustees conferred amongst themselves and Independent Trustee counsel about contract renewal matters. The Board reviewed and considered all of the factors it deemed relevant in approving the continuance of each Management Agreement, including, but not limited to: (i) the nature, extent and quality of the services provided by the Manager; (ii) the investment performance of each Fund; (iii) the costs of the services provided and profits realized by the Manager and its affiliates from the relationship with each Fund; (iv) the extent to which economies of scale are realized as each Fund grows; and (v) whether fee levels reflect these economies of scale for the benefit of Fund investors.
In approving the continuance of each Management Agreement, the Board, including a majority of the Independent Trustees, determined that the terms of the Management Agreement are fair and reasonable and that the continuance of such Management Agreement is in the interests of the applicable Fund and its shareholders. While attention was given to all information furnished, the following discusses some primary factors relevant to the Board’s determination.
Nature, Extent and Quality of Services
The Board reviewed and considered information regarding the nature, extent and quality of investment management services provided by the Manager and its affiliates to the Funds and their shareholders. This information included, among other things, the qualifications, background and experience of the senior management and investment personnel of the Manager; the structure of investment personnel compensation; oversight of third-party service providers; investment performance reports and related financial information for each Fund; reports on expenses, shareholder services, marketing support payments made to financial intermediaries and third- party servicing arrangements; legal and compliance matters; risk controls; pricing and other services provided by the Manager and its affiliates; and management fees charged by the Manager and its affiliates to US funds and other accounts, including management’s explanation of differences among accounts where relevant. The Board also reviewed and considered an annual report on payments made by Franklin Templeton Investments (FTI) or the Funds to financial intermediaries, as well as a memorandum relating to third-party servicing arrangements in response to a guidance update in 2016 from the US Securities and Exchange Commission (SEC) relating to mutual fund distribution andsub-accounting fees. The Board noted management’s continuing efforts and expenditures in establishing effective business continuity plans and developing strategies to address areas of heightened concern in the mutual fund industry, such as cybersecurity and liquidity risk management. The Board also recognized management’s commitment to facilitating Board oversight of liquidity through the designation of a liquidity/risk administrator and the development of reports that highlight the amount of illiquid investments for each Fund.
The Board also reviewed and considered the benefits provided to Fund shareholders of investing in a fund that is part of the Franklin Templeton family of funds. The Board noted the financial position of Franklin Resources, Inc. (FRI), the Manager’s parent, and its commitment to the mutual fund business as evidenced by its continued introduction of new
| 96 | Annual Report | franklintempleton.com | ||||
FRANKLIN STRATEGIC SERIES
SHAREHOLDER INFORMATION
funds, reassessment of the fund offerings in response to the market environment and project initiatives and capital investments relating to the services provided to the Funds by the FTI organization.
Following consideration of such information, the Board was satisfied with the nature, extent and quality of services provided by the Manager and its affiliates to the Funds and their shareholders.
Fund Performance
The Board reviewed and considered the performance results of each Fund over various time periods ended January 31, 2019. The Board considered the performance returns for each Fund in comparison to the performance returns of mutual funds deemed comparable to the Fund included in a universe (Performance Universe) selected by Broadridge Financial Solutions, Inc. (Broadridge), an independent provider of investment company data. The Board received a description of the methodology used by Broadridge to select the mutual funds included in a Performance Universe. The Board also reviewed and considered Fund performance reports provided and discussions that occurred with portfolio managers at Board meetings throughout the year. A summary of each Fund’s performance results is below.
Franklin Select U.S. Equity Fund - The Performance Universe for this Fund included the Fund and all retail and institutionallarge-cap growth funds. The Board noted that the Fund’s annualized total return for theone-, three-, five- and10-year periods was below the median and in the fifth quintile (worst) of its Performance Universe. The Board discussed this performance with management and management explained that, in late 2017/first half of 2018, there were changes to the Fund’s portfolio management team and the Fund’s portfolio was restructured, resulting in the Fund being reclassified by Lipper and Morningstar from large cap blend/core to large cap growth. Management further explained that it restructured the Fund’s investments with an increased focus on investing in high quality growth businesses for the long term. The Board also noted that, effective June 1, 2018, the Fund changed its name from the Franklin Focused Core Equity Fund to the Franklin Select U.S. Equity Fund. The Board then noted management’s representation that it was further reviewing the Fund and would report back to the Board at an upcoming Board meeting. The Board concluded that the Fund’s Management Agreement should be continued for an additionalone-year period, and these changes continued to be monitored.
Franklin Growth Opportunities Fund - The Performance Universe for this Fund included the Fund and all retail and institutionalmulti-cap growth funds. The Board noted that the Fund’s annualized total return for the three-, five- and10-year periods was below the median of its Performance Universe, but for theone-year period was above the median of its Performance Universe. The Board discussed this performance with management and management explained that on December 31, 2017, the Fund was moved from its historicalmulti-cap peer group to thelarge-cap peer group. Management further explained that since this change and other investment process changes, including a refocus of research efforts in all sectors, the Fund’s recent performance has been strong with the Fund outperforming its benchmark and peer group in both the calendar year 2018 and for the first month of 2019. The Board concluded that the Fund’s performance was satisfactory, noting its positive short-term, second quintile performance, as well as its longer-term three-, five- and10-year performance that, while below median, had annualized total returns that exceeded 14%, 9% and 15%, respectively.
Franklin Small Cap Growth Fund - The Performance Universe for this Fund included the Fund and all retail and institutionalsmall-cap growth funds. The Board noted that the Fund’s annualized total return for the five-year period was below the median of its Performance Universe, but for theone-,three-and10-year periods was above the median and in the first (the best) or second quintile of its Performance Universe. The Board concluded that the Fund’s performance was satisfactory.
FranklinSmall-Mid Cap Growth Fund - The Performance Universe for this Fund included the Fund and all retail and institutionalmid-cap growth funds. The Board noted that the Fund’s annualized total return for the three-, five- and10-year periods was below the median of its Performance Universe, but for theone-year period was above the median of its Performance Universe. The Board discussed this performance with management and management explained that the Fund’s positions in the healthcare, consumer discretionary, financial and industrial sectors were a primary detractor from relative performance over the three- and five-year periods. Management further explained recent changes to the Fund’s investment process and portfolio management team. The Board concluded that the Fund’s performance was satisfactory, noting its positive short-term, second quintile performance, as well as its longer-term three-, five- and10-year performance that, while below median, had annualized total returns that exceeded 13%, 7% and 14%, respectively.
franklintempleton.com | Annual Report | 97 | ||
FRANKLIN STRATEGIC SERIES
SHAREHOLDER INFORMATION
Comparative Fees and Expenses
The Board reviewed and considered information regarding each Fund’s actual total expense ratio and its various components, including, as applicable, management fees; transfer agent expenses; underlying fund expenses; Rule12b-1 andnon-Rule12b-1 service fees; and othernon-management fees. The Board also noted the quarterly and annual reports it receives on all marketing support payments made by FTI to financial intermediaries. The Board considered the actual total expense ratio and, separately, the contractual management fee rate, without the effect of fee waivers, if any (Management Rate) of each Fund in comparison to the median expense ratio and median Management Rate, respectively, of other mutual funds deemed comparable to and with a similar expense structure to the Fund selected by Broadridge (Expense Group). Broadridge fee and expense data is based upon information taken from each fund’s most recent annual report, which reflects historical asset levels that may be quite different from those currently existing, particularly in a period of market volatility. While recognizing such inherent limitation and the fact that expense ratios and Management Rates generally increase as assets decline and decrease as assets grow, the Board believed the independent analysis conducted by Broadridge to be an appropriate measure of comparative fees and expenses. The Broadridge Management Rate includes administrative charges, and the actual total expense ratio, for comparative consistency, was shown for Class A shares for funds with multiple classes of shares. The Board received a description of the methodology used by Broadridge to select the mutual funds included in an Expense Group.
Franklin Select U.S. Equity Fund - The Expense Group for this Fund included the Fund and 14 otherlarge-cap growth funds. The Board noted that the Management Rate for this Fund was above the median of its Expense Group. The Board also noted that the actual total expense ratio for this Fund was slightly above the median of its Expense Group. The Board discussed the Fund’s expenses with management and noted management’s representation that it was further reviewing the Fund and would report back to the Board at an upcoming Board meeting. The Board concluded that the Management Rate charged to the Fund is reasonable. In doing so, the Board noted that the Fund’s actual total expense ratio reflected a fee waiver from management.
Franklin Growth Opportunities Fund, Franklin Small Cap Growth Fund, and FranklinSmall-Mid Cap Growth Fund - The Expense Group for the Franklin Growth Opportunities Fund included the Fund and 15 othermulti-cap growth funds.
The Expense Group for the Franklin Small Cap Growth Fund included the Fund and 12 othersmall-cap growth funds. The Expense Group for the FranklinSmall-Mid Cap Growth Fund included the Fund and 13 othermid-cap growth funds. The Board noted that the Management Rates and actual total expense ratios for these Funds were below the medians and in the first quintile (least expensive) of their respective Expense Groups. The Board concluded that the Management Rates charged to these Funds are reasonable.
Profitability
The Board reviewed and considered information regarding the profits realized by the Manager and its affiliates in connection with the operation of each Fund. In this respect, the Board considered the Fund profitability analysis provided by the Manager that addresses the overall profitability of FTI’s US fund business, as well as its profits in providing investment management and other services to each of the individual funds during the12-month period ended September 30, 2018, being the most recent fiscalyear-end for FRI. The Board noted that although management continually makes refinements to its methodologies used in calculating profitability in response to organizational and product-related changes, the overall methodology has remained consistent with that used in the Funds’ profitability report presentations from prior years. Additionally, PricewaterhouseCoopers LLP, auditor to FRI and certain Franklin Templeton funds, has been engaged by the Manager to periodically review and assess the allocation methodologies to be used solely by the Funds’ Board with respect to the profitability analysis.
The Board noted management’s belief that costs incurred in establishing the infrastructure necessary for the type of mutual fund operations conducted by the Manager and its affiliates may not be fully reflected in the expenses allocated to each Fund in determining its profitability, as well as the fact that the level of profits, to a certain extent, reflected operational cost savings and efficiencies initiated by management. The Board also noted management’s expenditures in improving shareholder services provided to the Funds, as well as the need to implement systems and meet additional regulatory and compliance requirements resulting from recent SEC and other regulatory requirements.
The Board also considered the extent to which the Manager and its affiliates might derive ancillary benefits from fund operations, including revenues generated from transfer agent services, potential benefits resulting from personnel and systems enhancements necessitated by fund growth, as well as
| 98 | Annual Report | franklintempleton.com | ||||
FRANKLIN STRATEGIC SERIES
SHAREHOLDER INFORMATION
increased leverage with service providers and counterparties. Based upon its consideration of all these factors, the Board concluded that the level of profits realized by the Manager and its affiliates from providing services to each Fund was not excessive in view of the nature, extent and quality of services provided to each Fund.
Economies of Scale
The Board reviewed and considered the extent to which the Manager may realize economies of scale, if any, as each Fund grows larger and whether each Fund’s management fee structure reflects any economies of scale for the benefit of shareholders. With respect to possible economies of scale, the Board noted the existence of management fee breakpoints, which operate generally to share any economies of scale with a Fund’s shareholders by reducing the Fund’s effective management fees as the Fund grows in size. The Board considered the Manager’s view that any analyses of potential economies of scale in managing a particular fund are inherently limited in light of the joint and common costs and investments the Manager incurs across the Franklin Templeton family of funds as a whole. The Board noted that the Franklin Select U.S. Equity Fund has not yet reached an asset size that would likely enable the Fund to achieve economies of scale, but concluded that to the extent economies of scale may be realized by the Manager and its affiliates, each Fund’s management fee structure provided a sharing of benefits with the Fund and its shareholders as the Fund grows.
Conclusion
Based on its review, consideration and evaluation of all factors it believed relevant, including the above-described factors and conclusions, the Board unanimously approved the continuation of each Management Agreement for an additionalone-year period.
Proxy Voting Policies and Procedures
The Trust’s investment manager has established Proxy Voting Policies and Procedures (Policies) that the Trust uses to determine how to vote proxies relating to portfolio securities. Shareholders may view the Trust’s complete Policies online at franklintempleton.com. Alternatively, shareholders may request copies of the Policies free of charge by calling the Proxy Group collect at (954)527-7678 or by sending a written request to: Franklin Templeton Companies, LLC, 300 S.E. 2nd Street, Fort Lauderdale, FL 33301, Attention: Proxy Group. Copies of the Trust’s proxy voting records are also made available online at franklintempleton.com and posted on the U.S. Securities and
Exchange Commission’s website at sec.gov and reflect the most recent12-month period ended June 30.
Quarterly Statement of Investments
The Trust files a complete statement of investments with the U.S. Securities and Exchange Commission for the first and third quarters for each fiscal year as an exhibit to its report on FormN-PORT. Shareholders may view the filed FormN-PORT by visiting the Commission’s website at sec.gov. The filed form may also be viewed and copied at the Commission’s Public Reference Room in Washington, DC. Information regarding the operations of the Public Reference Room may be obtained by calling(800) SEC-0330.
Householding of Reports and Prospectuses
You will receive each Fund’s financial reports every six months as well as an annual updated summary prospectus (prospectus available upon request). To reduce Fund expenses, we try to identify related shareholders in a household and send only one copy of the financial reports and summary prospectus. This process, called “householding,” will continue indefinitely unless you instruct us otherwise. If you prefer not to have these documents householded, please call us at (800)632-2301. At any time you may view current prospectuses/summary prospectuses and financial reports on our website. If you choose, you may receive these documents through electronic delivery.
franklintempleton.com | Annual Report | 99 | ||
This page intentionally left blank.
 | Annual Report and Shareholder Letter | |||
| Franklin Strategic Series | ||||
Investment Manager | ||||
| Franklin Advisers, Inc. | ||||
Distributor | ||||
| Franklin Templeton Distributors, Inc. | ||||
(800) DIAL BEN® /342-5236 franklintempleton.com | ||||
Shareholder Services | ||||
| (800)632-2301 | ||||
Authorized for distribution only when accompanied or preceded by a summary prospectus and/or prospectus. Investors should carefully consider a fund’s investment goals, risks, charges and expenses before investing. A prospectus contains this and other information; please read it carefully before investing.
To help ensure we provide you with quality service, all calls to and from our service areas are monitored and/or recorded.
| © 2019 Franklin Templeton Investments. All rights reserved. | FSS1 A 06/19 |
Internet Delivery of Fund Reports Unless You Request Paper Copies:Effective January 1, 2021, as permitted by the SEC, paper copies of the Fund’s shareholder reports will no longer be sent by mail, unless you specifically request them from the Fund or your financial intermediary. Instead, the reports will be made available on a website, and you will be notified by mail each time a report is posted and provided with a website link to access the report.
If you already elected to receive shareholder reports electronically, you will not be affected by this change and you need not take any action. If you have not signed up for electronic delivery, we would encourage you to join fellow shareholders who have. You may elect to receive shareholder reports and other communications electronically from the Fund by calling (800) 632-2301 or by contacting your financial intermediary.
You may elect to continue to receive paper copies of all your future shareholder reports free of charge by contacting your financial intermediary or, if you invest directly with a Fund, calling (800) 632-2301 to let the Fund know of your request. Your election to receive reports in paper will apply to all funds held in your account.
Franklin Templeton
Successful investing begins with ambition. And achievement only comes when you reach for it. That’s why we continually strive to deliver better outcomes for investors. No matter what your goals are, our deep, global investment expertise allows us to offer solutions that can help.
During our more than 70 years of experience, we’ve managed through all kinds of markets—up, down and those in between. We’re always preparing for what may come next. It’s because of this, combined with our strength as one of the world’s largest asset managers that we’ve earned the trust of millions of investors around the world.
Dear Shareholder:
During the 12 months ended April 30, 2019, the U.S. economy continued to grow amid positive economic data and corporate earnings, and the unemployment rate declined.
In April 2019, the Standard & Poor’s 500® Index (S&P 500®) reached an all-time high after declining in 2018’s fourth quarter. During the period, markets reflected concerns about the U.S. Federal Reserve’s (Fed’s) interest-rate path, U.S. political uncertainties and U.S.-China trade disputes, but these concerns were mitigated by the Fed’s patient monetary policy stance and investor optimism about a trade deal. Within this environment, U.S. stocks, as measured by the S&P 500, generated a double-digit percentage positive total return for the 12-month period.
We are committed to our long-term perspective and disciplined investment approach as we conduct a rigorous, fundamental analysis of securities with a regular emphasis on investment risk management.
We believe active, professional investment management serves investors well. We also recognize the important role of financial advisors in today’s markets and encourage investors to continue to seek their advice. Amid changing markets and economic conditions, we are confident investors with a well-diversified portfolio and a patient, long-term outlook should be well positioned for the years ahead.
In addition, Franklin Strategic Series’ annual report includes more detail about prevailing conditions and a discussion about investment decisions during the period. Please remember all securities markets fluctuate, as do mutual fund share prices.
We thank you for investing with Franklin Templeton, welcome your questions and comments, and look forward to serving your future investment needs.
Sincerely,
Edward Perks, CFA
President and Chief Executive Officer –
Investment Management
Franklin Strategic Series
This letter reflects our analysis and opinions as of April 30, 2019, unless otherwise indicated. The information is not a complete analysis of every aspect of any market, country, industry, security or fund. Statements of fact are from sources considered reliable.
CFA® is a trademark owned by CFA Institute.
| Not FDIC Insured | May Lose Value | No Bank Guarantee |
franklintempleton.com | Not part of the annual report | 1 | ||
Contents
Annual Report | ||||
Economic and Market Overview | 3 | |||
Franklin Biotechnology Discovery Fund | 4 | |||
Franklin Natural Resources Fund | 10 | |||
Financial Highlights and Statements of Investments | 18 | |||
Financial Statements | 32 | |||
Notes to Financial Statements | 36 | |||
Report of Independent Registered Public Accounting Firm | 48 | |||
Tax Information | 49 | |||
Board Members and Officers | 50 | |||
Shareholder Information | 54 | |||
Visitfranklintempleton.comfor fund updates, to access your account, or to find helpful financial planning tools.
2 | Annual Report | franklintempleton.com | ||
Annual Report
Economic and Market Overview
The U.S. economy grew during the 12-month period. The economy expanded at a faster rate in 2019’s first quarter after moderating in the previous two quarters. Growth in consumer spending, inventory investment, exports, state and local government spending and business investment was partly offset by declines in housing investment and federal government spending. The manufacturing and services sectors expanded during the period. The unemployment rate decreased from 3.9% in April 2018 to 3.6% at period-end.1 The annual inflation rate, as measured by the Consumer Price Index, decreased from 2.5% in April 2018 to 2.0% at period-end.1
The U.S. Federal Reserve (Fed) raised its target range for the federal funds rate by 0.25% three times during the period, to 2.25%–2.50%, and continued reducing its balance sheet as part of its plan to normalize monetary policy. At its March 2019 meeting, the Fed held its target range for the federal funds rate unchanged and signaled no rate hike in 2019. The Fed also lowered its forecasts for economic growth in 2019 and 2020. Furthermore, the Fed mentioned it would end its balance sheet normalization by the end of September 2019.
U.S. equity markets overall rose during the period, benefiting from upbeat economic data and better U.S. corporate earnings. However, markets reflected concerns about tighter regulation of technology companies, the Fed’s interest-rate path, U.S. political uncertainties, and the impact of U.S. trade disputes with China and other trading partners on global growth and corporate earnings. These concerns were partially alleviated by easing trade tensions and optimism about a potential U.S.-China trade deal. Markets also benefited from the Fed’s indications of a patient approach to its monetary policy decisions. The broad U.S. stock market, as measured by the Standard & Poor’s 500 Index (S&P 500), sold off sharply in 2018’s fourth quarter but rallied in 2019’s first four months, reaching a new all-time high in April 2019. Overall, the S&P 500 posted a +13.49% total return for the 12-month period.2
The foregoing information reflects our analysis and opinions as of April 30, 2019. The information is not a complete analysis of every aspect of any market, country, industry, security or fund. Statements of fact are from sources considered reliable.
1. Bureau of Labor Statistics.
2. Morningstar.
See www.franklintempletondatasources.com for additional data provider information.
franklintempleton.com | Annual Report | 3 | ||
Franklin Biotechnology Discovery Fund
This annual report for Franklin Biotechnology Discovery Fund covers the fiscal year ended April 30, 2019.
Your Fund’s Goal and Main Investments
The Fund seeks capital appreciation by investing at least 80% of its net assets in securities of biotechnology companies and discovery research firms located in the U.S. and other countries.
Performance Overview
The Fund’s Class A shares posted a -1.60% cumulative total return for the 12 months under review. In comparison, the NASDAQ Biotechnology Index®, which tracks U.S. and international-based biotechnology stocks, posted a +3.23% total return.1 Also in comparison, the Standard & Poor’s 500 Index (S&P 500), which is a broad measure of the U.S. stock market, posted a +13.49% total return.1 You can find the Fund’s long-term performance data in the Performance Summary beginning on page 6.
Performance data represent past performance, which does not guarantee future results. Investment return and principal value will fluctuate, and you may have a gain or loss when you sell your shares. Current performance may differ from figures shown. For most recent month-end performance, go tofranklintempleton.comor call(800) 342-5236.
Investment Strategy
We are research-driven, fundamental investors, pursuing a growth strategy. As bottom-up investors focusing primarily on individual securities, we choose companies that have identifiable drivers of future earnings growth and that present, in our opinion, the best trade-off between potential earnings growth, business and financial risk, and valuation. We rely on a team of analysts to help provide in-depth industry expertise and use both qualitative and quantitative analysis to evaluate companies for distinct and sustainable competitive advantages likely to lead to growth in earnings and/or share price. Competitive advantages, such as a particular product niche, proven technology, sound financial position and strong management, are all factors we believe may contribute to strong growth potential.
Portfolio Composition
Based on Total Net Assets as of 4/30/19
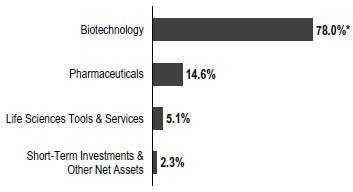
*Includes common, preferred stocks, escrows and litigation trusts as well as other equity interests.
Manager’s Discussion
During the 12 months under review, the biotechnology industry experienced significant volatility. Please keep in mind that volatility is not uncommon in the biotechnology industry, and we seek to take advantage of short-term volatility by initiating positions or adding to existing holdings in companies we believe are undervalued.
Key detractors from the Fund’s absolute performance included Clovis Oncology (not held at period-end), Nektar Therapeutics (not held at period-end) and Biogen.
Shares of pharmaceutical company Clovis Oncology declined despite a study suggesting Rubraca, currently used for treating ovarian cancer, could be effective for treating prostate cancer. Investor sentiment was hampered by concerns that AstraZeneca’s (not a Fund holding) Lynparza, a competing drug in the same class, would remain the market leader across all diseases treated by that drug type. Pharmaceutical company Nektar Therapeutics was hurt by the release of positive trial data from Roche for a competing drug in development for melanoma and head and neck cancer. Its share price was hurt by investor concerns around competition as well as weaker-than-expected clinical data. Pharmaceutical company Biogen was hurt by investor skepticism about its Alzheimer’s drug Aducanumab, which was confirmed when the company ended development following a trial failure in March 2019. Its share price was further hurt by Biogen’s weak development pipeline, possible near-term generic competition from an
1. Source: Morningstar.
The indexes are unmanaged and include reinvestment of any income or distributions. They do not reflect any fees, expenses or sales charges. One cannot invest directly in an index, and an index is not representative of the Fund’s portfolio.
See www.franklintempletondatasources.com for additional data provider information.
The dollar value, number of shares or principal amount, and names of all portfolio holdings are listed in the Fund’s Statement of Investments (SOI). The SOI begins on page 22.
4 | Annual Report | franklintempleton.com | ||
FRANKLIN BIOTECHNOLOGY DISCOVERY FUND
existing drug and the coming-to-market of a competitor’s gene therapy drug that is likely superior to Biogen’s existing treatment.
In contrast, key contributors to the Fund’s absolute performance included Array BioPharma, Fate Therapeutics and Alexion Pharmaceuticals.
Array BioPharma is focused on the development and sale of cancer-treatment drugs. Third-quarter 2018 earnings greatly benefited from the U.S. debut of Braftovi + Mektovi, a two-drug treatment for skin cancer, which saw sales well above market expectations. Positive results from more recent trials of Braftovi + Mektovi’s use to treat colorectal cancer also supported the company’s share price. We also believe Array’s drug discovery process has proven highly successful, and could, in our opinion, continue to develop profitable drugs. Biotechnology company Fate Therapeutics develops cell-based therapies for cancer and immune disorders. Shares rose significantly in late 2018 when the company expanded clinical trials for a promising cancer treatment and the Food and Drug Administration (FDA) approved an application to initiate a new clinical study for the first ever stem cell-derived cancer treatment. Alexion Pharmaceuticals is a biopharmaceutical company that focuses on developing treatments for rare disorders. Alexion benefited from its acquisition of a company with a treatment for autoimmune disorders, further diversifying their pipeline, as well as the FDA approval of Ultomiris, a treatment for rare blood disorders the company is hoping will replace its existing treatment Soliris.
Thank you for your continued participation in Franklin Biotechnology Discover Fund. We look forward to serving your future investment needs.
 |
Evan McCulloch, CFA Lead Portfolio Manager | |
Wendy Lam, Ph.D. Steven Kornfeld, CFA | ||
| Portfolio Management Team | ||

Top 10 Holdings
4/30/19
Company Sector/Industry | % of Total Net Assets | |
Alexion Pharmaceuticals Inc. | 7.2% | |
Biotechnology | ||
Vertex Pharmaceuticals Inc. | 5.3% | |
Biotechnology | ||
Array BioPharma Inc. | 5.3% | |
Biotechnology | ||
Illumina Inc. | 5.1% | |
Life Sciences Tools & Services | ||
Biogen Inc. | 4.1% | |
Biotechnology | ||
GW Pharmaceuticals PLC | 3.9% | |
Pharmaceuticals | ||
Regeneron Pharmaceuticals Inc. | 3.8% | |
Biotechnology | ||
Gilead Sciences Inc. | 3.6% | |
Biotechnology | ||
BioMarin Pharmaceutical Inc. | 3.3% | |
Biotechnology | ||
Amgen Inc. | 3.3% | |
Biotechnology |
The foregoing information reflects our analysis, opinions and portfolio holdings as of April 30, 2019, the end of the reporting period. The way we implement our main investment strategies and the resulting portfolio holdings may change depending on factors such as market and economic conditions. These opinions may not be relied upon as investment advice or an offer for a particular security. The information is not a complete analysis of every aspect of any market, country, industry, security or the Fund. Statements of fact are from sources considered reliable, but the investment manager makes no representation or warranty as to their completeness or accuracy. Although historical performance is no guarantee of future results, these insights may help you understand our investment management philosophy.
franklintempleton.com | Annual Report | 5 | ||
FRANKLIN BIOTECHNOLOGY DISCOVERY FUND
Performance Summary as of April 30, 2019
The performance table and graphs do not reflect any taxes that a shareholder would pay on Fund dividends, capital gain distributions, if any, or any realized gains on the sale of Fund shares. Total return reflects reinvestment of the Fund’s dividends and capital gain distributions, if any, and any unrealized gains or losses. Your dividend income will vary depending on dividends or interest paid by securities in the Fund’s portfolio, adjusted for operating expenses of each class. Capital gain distributions are net profits realized from the sale of portfolio securities.
Performance as of 4/30/191
Cumulative total return excludes sales charges. Average annual total return includes maximum sales charges. Sales charges will vary depending on the size of the investment and the class of share purchased. The maximum is 5.50% and the minimum is 0%.Class A:5.50% maximum initial sales charge; Advisor Class:no sales charges. For other share classes, visit franklintempleton.com.
| Share Class | Cumulative Total Return2 | Average Annual Total Return3 | ||
A4
| ||||
1-Year
| -1.60%
| -7.02%
| ||
5-Year
|
+34.79%
|
+4.96%
| ||
10-Year |
+333.57%
|
+15.15% | ||
Advisor5
| ||||
1-Year
| -1.36%
| -1.36%
| ||
5-Year
|
+36.46%
|
+6.41%
| ||
10-Year |
+344.96%
|
+16.10%
| ||
Performance data represent past performance, which does not guarantee future results. Investment return and principal value will fluctuate, and you may have a gain or loss when you sell your shares. Current performance may differ from figures shown. For most recent month-end performance, go tofranklintempleton.comor call(800) 342-5236.
See page 8 for Performance Summary footnotes.
6 | Annual Report | franklintempleton.com | ||
FRANKLIN BIOTECHNOLOGY DISCOVERY FUND
PERFORMANCE SUMMARY
Total Return Index Comparison for a Hypothetical $10,000 Investment1
Total return represents the change in value of an investment over the periods shown. It includes any applicable maximum sales charge, Fund expenses, account fees and reinvested distributions. The unmanaged indexes include reinvestment of any income or distributions. They differ from the Fund in composition and do not pay management fees or expenses. One cannot invest directly in an index.
Class A(5/1/09-4/30/19)
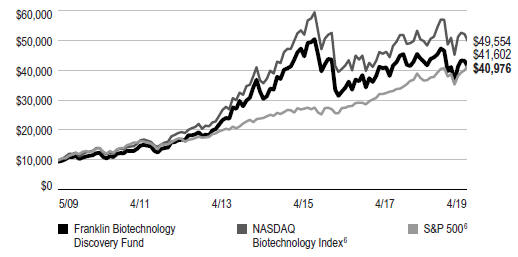
Advisor Class(5/1/09–4/30/19)5
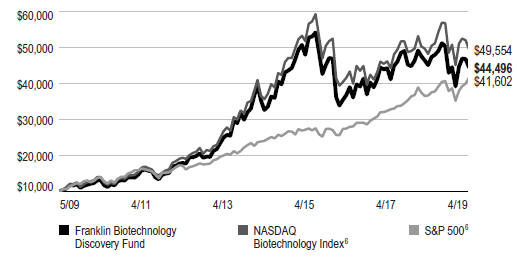
See page 8 for Performance Summary footnotes.
franklintempleton.com | Annual Report | 7 | ||
FRANKLIN BIOTECHNOLOGY DISCOVERY FUND
PERFORMANCE SUMMARY
Distributions(5/1/18–4/30/19)
Share Class
| Short-Term
| Long-Term
| Total
| |||||||||
A
|
| $2.3428
|
|
| $2.2068
|
|
| $4.5496
|
| |||
C
|
|
$2.3428
|
|
|
$2.2068
|
|
|
$4.5496
|
| |||
R6
|
|
$2.3428
|
|
|
$2.2068
|
|
|
$4.5496
|
| |||
Advisor
|
|
$2.3428
|
|
|
$2.2068
|
|
|
$4.5496
|
| |||
Total Annual Operating Expenses7
| ||||||||
| Share Class | With Fee Waiver |
Without Fee Waiver | ||||||
A
|
| 1.02%
|
|
| 1.04%
|
| ||
Advisor
|
|
0.77%
|
|
|
0.79%
|
| ||
Each class of shares is available to certain eligible investors and has different annual fees and expenses, as described in the prospectus.
All investments involve risks, including possible loss of principal. The Fund is a nondiversified fund that concentrates in a single sector, which involves risks such as patent considerations, product liability, government regulatory requirements, and regulatory approval for new drugs and medical products. Biotechnology companies often are small and/or relatively new. Smaller companies can be particularly sensitive to changes in economic conditions and have less certain growth prospects than larger, more established companies and can be volatile, especially over the short term. The Fund may also invest in foreign companies, which involve special risks, including currency fluctuations and political uncertainty. The Fund is actively managed but there is no guarantee that the manager’s investment decisions will produce the desired results. The Fund’s prospectus also includes a description of the main investment risks.
1. The Fund has a fee waiver associated with any investment it makes in a Franklin Templeton money fund and/or other Franklin Templeton fund, contractually guaranteed through 8/31/19. Fund investment results reflect the expense reduction and fee waiver; without these reductions, the results would have been lower.
2. Cumulative total return represents the change in value of an investment over the periods indicated.
3. Average annual total return represents the average annual change in value of an investment over the periods indicated. Return for less than one year, if any, has not been annualized.
4. Prior to 9/10/18, these shares were offered at a higher initial sales charge of 5.75%, thus actual returns would have differed. Total returns with sales charges have been restated to reflect the current maximum initial sales charge of 5.50%.
5. Effective 9/1/09, the Fund began offering Advisor Class shares, which do not have sales charges or a Rule 12b-1 plan. Performance quotations for this class reflect the following methods of calculation: (a) For periods prior to 9/1/09, a restated figure is used based upon the Fund’s Class A performance, excluding the effect of Class A’s maximum initial sales charge, but reflecting the effect of the Class A Rule 12b-1 fees; and (b) for periods after 9/1/09, actual Advisor Class performance is used reflecting all charges and fees applicable to that class. Since 9/1/09 (commencement of sales), the cumulative and average annual total returns of Advisor Class shares were +288.14% and +15.07% .
6. Source: Morningstar. The NASDAQ Biotechnology Index is a modified capitalization weighted index designed to measure performance of all NASDAQ stocks in the biotechnology sector. The S&P 500 is a market capitalization-weighted index of 500 stocks designed to measure total U.S. equity market performance.
7. Figures are as stated in the Fund’s current prospectus and may differ from the expense ratios disclosed in the Your Fund’s Expenses and Financial Highlights sections in this report. In periods of market volatility, assets may decline significantly, causing total annual Fund operating expenses to become higher than the figures shown.
See www.franklintempletondatasources.com for additional data provider information.
8 | Annual Report | franklintempleton.com | ||
FRANKLIN BIOTECHNOLOGY DISCOVERY FUND
Your Fund’s Expenses
As a Fund shareholder, you can incur two types of costs: (1) transaction costs, including sales charges (loads) on Fund purchases and redemptions; and (2) ongoing Fund costs, including management fees, distribution and service (12b-1) fees, and other Fund expenses. All mutual funds have ongoing costs, sometimes referred to as operating expenses. The table below shows ongoing costs of investing in the Fund and can help you understand these costs and compare them with those of other mutual funds. The table assumes a $1,000 investment held for the six months indicated.
Actual Fund Expenses
The table below provides information about actual account values and actual expenses in the columns under the heading “Actual.” In these columns the Fund’s actual return, which includes the effect of Fund expenses, is used to calculate the “Ending Account Value” for each class of shares. You can estimate the expenses you paid during the period by following these steps (ofcourse, your account value and expenses will differ from those in this illustration):Divide your account value by $1,000 (ifyour account had an $8,600 value, then $8,600 ÷ $1,000 = 8.6). Then multiply the result by the number in the row for your class of shares under the headings “Actual” and “Expenses Paid During Period” (ifActual Expenses Paid During Period were $7.50, then 8.6 x $7.50 = $64.50). In this illustration, the actual expenses paid this period are $64.50.
Hypothetical Example for Comparison with Other Funds
Under the heading “Hypothetical” in the table, information is provided about hypothetical account values and hypothetical expenses based on the Fund’s actual expense ratio and an assumed rate of return of 5% per year before expenses, which is not the Fund’s actual return. This information may not be used to estimate the actual ending account balance or expenses you paid for the period, but it can help you compare ongoing costs of investing in the Fund with those of other funds. To do so, compare this 5% hypothetical example for the class of shares you hold with the 5% hypothetical examples that appear in the shareholder reports of other funds.
Please note that expenses shown in the table are meant to highlight ongoing costs and do not reflect any transactional costs. Therefore, information under the heading “Hypothetical” is useful in comparing ongoing costs only, and will not help you compare total costs of owning different funds. In addition, if transactional costs were included, your total costs would have been higher.
Actual (actual return after expenses) | Hypothetical (5% annual return before expenses) | |||||||||||||||||
Share Class | Beginning Value 11/1/18 | Ending Value 4/30/19 | Expenses Paid During 11/1/18–4/30/191,2 | Ending Value 4/30/19 | Expenses Paid During 11/1/18–4/30/191,2 | Net Annualized Ratio2 | ||||||||||||
A | $1,000 | $1,034.30 | $5.09 | $1,019.79 | $5.06 | 1.01% | ||||||||||||
C | $1,000 | $1,030.50 | $8.81 | $1,016.12 | $8.75 | 1.75% | ||||||||||||
R6 | $1,000 | $1,036.20 | $3.23 | $1,021.62 | $3.21 | 0.64% | ||||||||||||
Advisor | $1,000 | $1,035.50 | $3.84 | $1,021.03 | $3.81 | 0.76% | ||||||||||||
1. Expenses are equal to the annualized expense ratio for the six-month period as indicated above—in the far right column—multiplied by the simple average account value over the period indicated, and then multiplied by 181/365 to reflect the one-half year period.
2. Reflects expenses after fee waivers and expense reimbursements. Does not include acquired fund fees and expenses.
franklintempleton.com | Annual Report | 9 | ||
Franklin Natural Resources Fund
This annual report for Franklin Natural Resources Fund covers the fiscal year ended April 30, 2019.
Your Fund’s Goal and Main Investments
The Fund seeks high total return (total return consists of capital appreciation and current dividend and interest income) by investing, under normal market conditions, at least 80% of its net assets in equity and debt securities of companies that own, produce, refine, process, transport or market natural resources, as well as those that provide related services.
Performance Overview
The Fund’s Class A shares posted a -13.69% cumulative total return for the 12 months under review. In comparison, the Standard & Poor’s (S&P®) North American Natural Resources Sector Index, which tracks companies involved in industries such as mining, energy, timber and forestry services, and the production of pulp and paper, posted a -9.11% total return.1 Also in comparison, the Standard & Poor’s 500 Index (S&P 500), which is a broad measure of the U.S. stock market, posted a +13.49% total return.1 Please note index performance information is provided for reference and we do not attempt to track any index but rather undertake investments on the basis of fundamental research. The Fund’s strategy, which focuses on companies with higher long-term growth potential, differs from the natural resources index’s large weighting in income-oriented companies that we believe typically provide more limited opportunities for growth. This difference may occasionally lead to wide performance discrepancies, especially in periods when investors focus on short-term safety and yield or, conversely, when investors focus more heavily on companies with stronger growth prospects and greater commodity price leverage. You can find the Fund’s long-term performance data in the Performance Summary beginning on page 14.
Performance data represent past performance, which does not guarantee future results. Investment return and principal value will fluctuate, and you may have a gain or loss when you sell your shares. Current performance may differ from figures shown. For most recent month-end performance, go tofranklintempleton.comor call(800) 342-5236.
Geographic Composition
Based on Total Net Assets as of 4/30/19
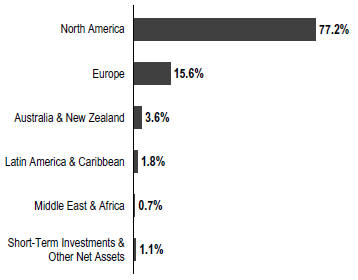
Investment Strategy
We are research-driven, fundamental investors, pursuing a growth strategy. As bottom-up investors focusing primarily on individual securities, we choose companies that have identifiable drivers of future earnings growth and that present, in our opinion, the best trade-off between potential earnings growth, business and financial risk, and valuation. We rely on a team of analysts to help provide in-depth industry expertise and use both qualitative and quantitative analysis to evaluate companies for distinct and sustainable competitive advantages likely to lead to growth in earnings and/or share price. Competitive advantages, such as a particular product niche, proven technology, sound financial position and strong management, are all factors we believe may contribute to strong growth potential.
Sector Overview
Global commodity prices declined during the 12-month period amid U.S.-China trade tensions, a strong U.S. dollar and lukewarm global economic data, particularly in China (the world’s largest consumer of raw materials). Oil prices were particularly volatile, buffeted by global political instability and production swings, though ended the period roughly where they started as export reductions by the Organization of the Petroleum Exporting Countries offset demand headwinds. Most metals declined, with the notable exceptions of iron ore and
1. Source: Morningstar.
The indexes are unmanaged and include reinvestment of any income or distributions. They do not reflect any fees, expenses or sales charges. One cannot invest directly in an index, and an index is not representative of the Fund’s portfolio.
See www.franklintempletondatasources.com for additional data provider information.
The dollar value, number of shares or principal amount, and names of all portfolio holdings are listed in the Fund’s Statement of Investments (SOI). The SOI begins on page 29.
10 | Annual Report | franklintempleton.com | ||
FRANKLIN NATURAL RESOURCES FUND
palladium. The overall commodity decline was limited by a rally in 2019 due to optimism about a U.S.-China trade deal, anticipation of an economic recovery in China and signs the U.S. Federal Reserve (Fed) would hold interest rates hikes steady in 2019.
Despite extreme volatility, crude oil prices ended the period at relatively similar levels compared to the start of the period. The U.S. benchmark oil, West Texas Intermediate, dropped slightly, while the international benchmark, Brent crude, increased modestly. Both benchmark oils followed similar trends: prices rallied early in the period due to U.S. sanctions against Iran, plummeting oil output from Venezuela, political turmoil in Libya, declines in U.S. oil stockpiles and healthy global demand growth. After reaching a multi-year high in October, prices declined sharply at the end of 2018 in response to signs of excess supply resulting from increased output by the U.S., Russia and Saudi Arabia. The rise in production was due, in part, to the expected impact of U.S. sanctions on Iran, which were later loosened with the granting of waivers to certain countries. Fears of slowing demand in China and elsewhere also weighed on sentiment. Prices rebounded substantially in 2019 due to supply cuts by the Organization of the Petroleum Exporting Countries and other countries outside the organization, as well as new, unexpected production declines from Venezuela.
U.S. natural gas prices ended the period lower despite continued strong demand as supply growth also remained robust. Prices increased in the first half of the period due to summer heat waves and an extended winter season, which increased demand (for air conditioning and then heating) and set the stage for decreased supplies. Overseas demand for liquefied natural gas increased exports, also helping to absorb excess inventories. In December, these price gains were reversed as investors considered forecasts for above-average temperatures in January and significant increases in U.S. production. The surge in production continued through 2019, leading to further price decreases despite a continued uptrend in demand and below-average gas inventory.
Gold prices declined during the period amid U.S. dollar strength and rising U.S. interest rates, particularly in 2018’s fourth quarter, that drove many investors toward income-producing asset classes. Gold prices partly recovered in the second half of the period due to signals the Fed would hold interest rates steady and challenges on the production side. Silver and platinum prices decreased for similar reasons, while palladium prices rose amid tight global supplies and stronger demand for the metal due to its emissions-control use in gasoline vehicles. Iron ore prices increased significantly,
Portfolio Composition
Based on Total Net Assets as of 4/30/19
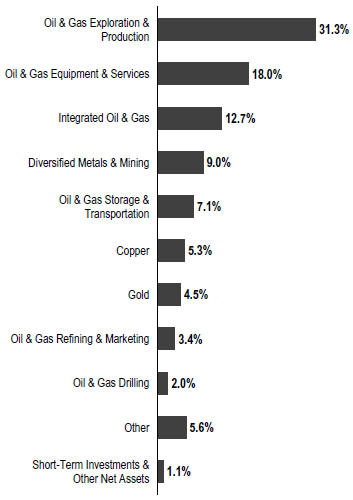
particularly after a major Brazilian mine shut down in 2019 due to a nearby tailings dam failure. Prices of copper and other metals declined in response to trade tensions and the weak economic outlook for China, the world’s largest consumer of base metals, as its factory activity slowed.
Manager’s Discussion
The global economic environment was not conducive to positive returns for natural resources equities during the period, as the recovery in early 2019 was not enough to offset losses in 2018.
An overweight in oil and gas equipment and services was the biggest detractor from the Fund’s relative performance. The sector as a whole was hurt by its relatively high operating leverage, as overall customer spending is tied to investor expectations around commodity prices and cash flows. Major detractors included overweighted positions in Superior Energy Services, Oil States International and Halliburton, all companies with significant U.S. onshore exposure where activity slowed in response to budget constraints and the decline in oil prices.
franklintempleton.com | Annual Report | 11 | ||
FRANKLIN NATURAL RESOURCES FUND
Underweighted oil and gas storage and transportation positions detracted from relative performance as well. An underweighting in Enbridge and TransCanada detracted from relative results as share prices rose due to the companies’ perceived stability and lower exposure to a weak commodity environment.
The Fund’s lack of exposure to metal and glass containers along with stock selection and an underweighting in integrated oil and gas, two relatively stable sectors, also hurt relative performance. In the latter sector, relative results were hurt by underweights in well-performing U.S.-based Chevron and Exxon Mobil.
In contrast, an overweight and stock selection in diversified metals and mining contributed to relative results. Top contributors included off-benchmark positions in mining companies BHP Group, Rio Tinto and Anglo American, all of which benefited from iron ore supply disruptions in Brazil related to a major mine-related dam failure and subsequent shut-down of other mines believed to also present safety risks.
An underweighted position in oil and gas refining and marketing also contributed to relative returns, as profit margins compressed due to investor concerns about demand and the general economy.
Cash holdings were another relative contributor.
Top 10 Holdings
4/30/19
Company Sector/Industry | | % of Total Net Assets | | |
Schlumberger Ltd. | 3.9% | |||
Oil & Gas Equipment & Services | ||||
Diamondback Energy Inc. | 3.3% | |||
Oil & Gas Exploration & Production | ||||
Concho Resources Inc. | 3.3% | |||
Oil & Gas Exploration & Production | ||||
EOG Resources Inc. | 3.0% | |||
Oil & Gas Exploration & Production | ||||
Pioneer Natural Resources Co. | 2.9% | |||
Oil & Gas Exploration & Production | ||||
Occidental Petroleum Corp. | 2.8% | |||
Integrated Oil & Gas | ||||
Royal Dutch Shell PLC | 2.8% | |||
Integrated Oil & Gas | ||||
TechnipFMC PLC | 2.6% | |||
Oil & Gas Equipment & Services | ||||
Chevron Corp. | 2.5% | |||
Integrated Oil & Gas | ||||
Cabot Oil & Gas Corp. | 2.5% | |||
Oil & Gas Exploration & Production | ||||
Thank you for your continued participation in Franklin Natural Resources Fund. We look forward to serving your future investment needs.
 |
Frederick G. Fromm, CFA | |
 |
Matthew J. Adams, CFA | |
| Stephen M. Land, CFA | ||
| Portfolio Management Team | ||


12 | Annual Report | franklintempleton.com | ||
FRANKLIN NATURAL RESOURCES FUND
The foregoing information reflects our analysis, opinions and portfolio holdings as of April 30, 2019, the end of the reporting period. The way we implement our main investment strategies and the resulting portfolio holdings may change depending on factors such as market and economic conditions. These opinions may not be relied upon as investment advice or an offer for a particular security. The information is not a complete analysis of every aspect of any market, country, industry, security or the Fund. Statements of fact are from sources considered reliable, but the investment manager makes no representation or warranty as to their completeness or accuracy. Although historical performance is no guarantee of future results, these insights may help you understand our investment management philosophy.
franklintempleton.com | Annual Report | 13 | ||
FRANKLIN NATURAL RESOURCES FUND
Performance Summary as of April 30, 2019
The performance table and graphs do not reflect any taxes that a shareholder would pay on Fund dividends, capital gain distributions, if any, or any realized gains on the sale of Fund shares. Total return reflects reinvestment of the Fund’s dividends and capital gain distributions, if any, and any unrealized gains or losses. Your dividend income will vary depending on dividends or interest paid by securities in the Fund’s portfolio, adjusted for operating expenses of each class. Capital gain distributions are net profits realized from the sale of portfolio securities.
Performance as of 4/30/191
Cumulative total return excludes sales charges. Average annual total return includes maximum sales charges. Sales charges will vary depending on the size of the investment and the class of share purchased. The maximum is 5.50% and the minimum is 0%.Class A:5.50% maximum initial sales charge;Advisor Class:no sales charges. For other share classes, visitfranklintempleton.com.
| Share Class | Cumulative Total Return2 | Average Annual Total Return3 | ||
A4
| ||||
1-Year
| -13.69%
| -18.44%
| ||
5-Year |
-36.76%
|
-9.78%
| ||
10-Year |
+16.23%
|
+0.94%
| ||
Advisor
| ||||
1-Year
| -13.50%
| -13.50%
| ||
5-Year
|
-35.92%
|
-8.52%
| ||
10-Year
|
+19.51%
|
+1.80%
| ||
Performance data represent past performance, which does not guarantee future results. Investment return and principal value will fluctuate, and you may have a gain or loss when you sell your shares. Current performance may differ from figures shown. For most recent month-end performance, go tofranklintempleton.com or call(800) 342-5236.
See page 16 for Performance Summary footnotes.
14 | Annual Report | franklintempleton.com | ||
FRANKLIN NATURAL RESOURCES FUND
PERFORMANCE SUMMARY
Total Return Index Comparison for a Hypothetical $10,000 Investment1
Total return represents the change in value of an investment over the periods shown. It includes any applicable maximum sales charge, Fund expenses, account fees and reinvested distributions. The unmanaged indexes include reinvestment of any income or distributions. They differ from the Fund in composition and do not pay management fees or expenses. One cannot invest directly in an index.
Class A(5/1/09–4/30/19)
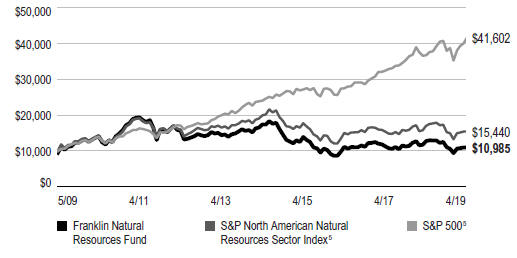
Advisor Class(5/1/09–4/30/19)
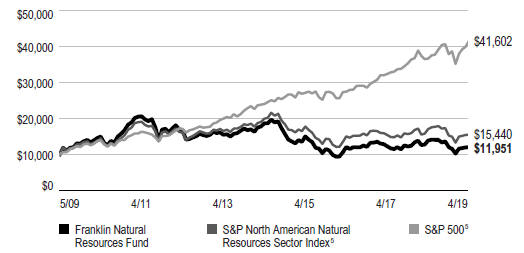
See page 16 for Performance Summary footnotes.
franklintempleton.com | Annual Report | 15 | ||
FRANKLIN NATURAL RESOURCES FUND
PERFORMANCE SUMMARY
| Distributions(5/1/18–4/30/19) | ||||
| Share Class | Net Investment Income | |||
A
|
| $0.4894
|
| |
C
|
| $0.3949
|
| |
R6
|
| $0.5348
|
| |
Advisor
|
| $0.5109
|
| |
Total Annual Operating Expenses6
| ||||||||
| Share Class | With Fee Waiver | Without Fee Waiver | ||||||
A
|
| 1.06%
|
|
| 1.06%
|
| ||
Advisor
|
|
0.81%
|
|
|
0.81%
|
| ||
Each class of shares is available to certain eligible investors and has different annual fees and expenses, as described in the prospectus.
All investments involve risks, including possible loss of principal. Investing in a fund concentrating in the natural resources sector involves special risks, including increased susceptibility to adverse economic and regulatory developments affecting the sector. Growth stock prices may fall dramatically if the company fails to meet projections of earnings or revenue; their prices may be more volatile than other securities, particularly over the short term. Smaller companies can be particularly sensitive to changes in economic conditions and have less certain growth prospects than larger, more established companies and can be volatile, especially over the short term. The Fund may also invest in foreign companies, which involve special risks, including currency fluctuations and political uncertainty. The Fund is actively managed but there is no guarantee that the manager’s investment decisions will produce the desired results. The Fund’s prospectus also includes a description of the main investment risks.
1. The Fund has a fee waiver associated with any investment it makes in a Franklin Templeton money fund and/or other Franklin Templeton fund, contractually guaranteed through 8/31/19. Fund investment results reflect the expense reduction and fee waiver; without these reductions, the results would have been lower.
2. Cumulative total return represents the change in value of an investment over the periods indicated.
3. Average annual total return represents the average annual change in value of an investment over the periods indicated. Return for less than one year, if any, has not been annualized.
4. Prior to 9/10/18, these shares were offered at a higher initial sales charge of 5.75%, thus actual returns would have differed. Total returns with sales charges have been restated to reflect the current maximum initial sales charge of 5.50%.
5. Source: Morningstar. The S&P North American Natural Resources Index is a modified capitalization-weighted index that includes companies involved in extractive industries (mining), energy and forestry services, producers of pulp and paper, and owners and operators of timber tracts or plantations. The S&P 500 is a market capitalization-weighted index of 500 stocks designed to measure total U.S. equity market performance.
6. Figures are as stated in the Fund’s current prospectus and may differ from the expense ratios disclosed in the Your Fund’s Expenses and Financial Highlights sections in this report. In periods of market volatility, assets may decline significantly, causing total annual Fund operating expenses to become higher than the figures shown.
See www.franklintempletondatasources.com for additional data provider information.
16 | Annual Report | franklintempleton.com | ||
FRANKLIN NATURAL RESOURCES FUND
Your Fund’s Expenses
As a Fund shareholder, you can incur two types of costs: (1) transaction costs, including sales charges (loads) on Fund purchases and redemptions; and (2) ongoing Fund costs, including management fees, distribution and service (12b-1) fees, and other Fund expenses. All mutual funds have ongoing costs, sometimes referred to as operating expenses. The table below shows ongoing costs of investing in the Fund and can help you understand these costs and compare them with those of other mutual funds. The table assumes a $1,000 investment held for the six months indicated.
Actual Fund Expenses
The table below provides information about actual account values and actual expenses in the columns under the heading “Actual.” In these columns the Fund’s actual return, which includes the effect of Fund expenses, is used to calculate the “Ending Account Value” for each class of shares. You can estimate the expenses you paid during the period by following these steps (ofcourse, your account value and expenses will differ from those in this illustration):Divide your account value by $1,000 (ifyour account had an $8,600 value, then $8,600 ÷ $1,000 = 8.6). Then multiply the result by the number in the row for your class of shares under the headings “Actual” and “Expenses Paid During Period” (ifActual Expenses Paid During Period were $7.50, then 8.6 x $7.50 = $64.50). In this illustration, the actual expenses paid this period are $64.50.
Hypothetical Example for Comparison with Other Funds
Under the heading “Hypothetical” in the table, information is provided about hypothetical account values and hypothetical expenses based on the Fund’s actual expense ratio and an assumed rate of return of 5% per year before expenses, which is not the Fund’s actual return. This information may not be used to estimate the actual ending account balance or expenses you paid for the period, but it can help you compare ongoing costs of investing in the Fund with those of other funds. To do so, compare this 5% hypothetical example for the class of shares you hold with the 5% hypothetical examples that appear in the shareholder reports of other funds.
Please note that expenses shown in the table are meant to highlight ongoing costs and do not reflect any transactional costs. Therefore, information under the heading “Hypothetical” is useful in comparing ongoing costs only, and will not help you compare total costs of owning different funds. In addition, if transactional costs were included, your total costs would have been higher.
Actual (actual return after expenses) | Hypothetical (5% annual return before expenses) | |||||||||||||||||
Share Class | Beginning Value 11/1/18 | Ending Value 4/30/19 | Expenses Paid During 11/1/18–4/30/191,2 | Ending Value 4/30/19 | Expenses Paid During 11/1/18–4/30/191,2 | Net Annualized Ratio2 | ||||||||||||
A | $1,000 | $995.60 | $5.24 | $1,019.54 | $5.31 | 1.06% | ||||||||||||
C | $1,000 | $991.30 | $8.94 | $1,015.82 | $9.05 | 1.81% | ||||||||||||
R6 | $1,000 | $997.90 | $3.02 | $1,021.77 | $3.06 | 0.61% | ||||||||||||
Advisor | $1,000 | $996.40 | $4.01 | $1,020.78 | $4.06 | 0.81% | ||||||||||||
1. Expenses are equal to the annualized expense ratio for the six-month period as indicated above—in the far right column—multiplied by the simple average account value over the period indicated, and then multiplied by 181/365 to reflect the one-half year period.
2. Reflects expenses after fee waivers and expense reimbursements. Does not include acquired fund fees and expenses.
franklintempleton.com | Annual Report | 17 | ||
FRANKLIN STRATEGIC SERIES
Financial Highlights
Franklin Biotechnology Discovery Fund
| Year Ended April 30, | ||||||||||||||||||||
| 2019 | 2018 | 2017 | 2016 | 2015 | ||||||||||||||||
Class A | ||||||||||||||||||||
Per share operating performance (for a share outstanding throughout the year) | ||||||||||||||||||||
Net asset value, beginning of year | $146.14 | $147.22 | $128.19 | $182.30 | �� | $129.27 | ||||||||||||||
Income from investment operationsa: | ||||||||||||||||||||
Net investment income (loss)b | (0.99 | ) | (0.80 | ) | (0.79 | ) | (0.94 | ) | (1.09 | ) | ||||||||||
Net realized and unrealized gains (losses) | (1.75 | ) | 3.32 | 25.75 | (39.39 | ) | 60.79 | |||||||||||||
Total from investment operations | (2.74 | ) | 2.52 | 24.96 | (40.33 | ) | 59.70 | |||||||||||||
Less distributions from: | ||||||||||||||||||||
Net investment income | — | — | (1.73 | ) | — | — | ||||||||||||||
Net realized gains | (4.55 | ) | (3.60 | ) | (4.20 | ) | (13.78 | ) | (6.67 | ) | ||||||||||
Total distributions | (4.55 | ) | (3.60 | ) | (5.93 | ) | (13.78 | ) | (6.67 | ) | ||||||||||
Net asset value, end of year | $138.85 | $146.14 | $147.22 | $128.19 | $182.30 | |||||||||||||||
Total returnc | (1.60)% | 1.69% | 20.02% | (23.55)% | 46.81% | |||||||||||||||
Ratios to average net assets | ||||||||||||||||||||
Expenses before waiver and payments by affiliates | 1.02% | 1.05% | 1.04% | 0.99% | 1.00% | |||||||||||||||
Expenses net of waiver and payments by affiliatesd | 1.00% | 1.03% | 1.02% | 0.98% | 1.00% | e | ||||||||||||||
Net investment income (loss) | (0.67)% | (0.53)% | (0.58)% | (0.56)% | (0.67)% | |||||||||||||||
Supplemental data | ||||||||||||||||||||
Net assets, end of year (000’s) | $924,611 | $1,081,883 | $1,176,687 | $1,074,903 | $1,601,906 | |||||||||||||||
Portfolio turnover rate | 28.62% | 26.95% | 34.12% | 22.13% | 41.43% | |||||||||||||||
aThe amount shown for a share outstanding throughout the period may not correlate with the Statement of Operations for the period due to the timing of sales and repurchases of the Fund’s shares in relation to income earned and/or fluctuating fair value of the investments of the Fund.
bBased on average daily shares outstanding.
cTotal return does not reflect sales commissions or contingent deferred sales charges, if applicable.
dBenefit of expense reduction rounds to less than 0.01%.
eBenefit of waiver and payments by affiliates rounds to less than 0.01%.
18 | Annual Report | The accompanying notes are an integral part of these financial statements. | franklintempleton.com | ||
FRANKLIN STRATEGIC SERIES
FINANCIAL HIGHLIGHTS
Franklin Biotechnology Discovery Fund(continued)
| Year Ended April 30, | ||||||||||||||||||||
| 2019 | 2018 | 2017 | 2016 | 2015 | ||||||||||||||||
Class C | ||||||||||||||||||||
Per share operating performance (for a share outstanding throughout the year) | ||||||||||||||||||||
Net asset value, beginning of year | $141.75 | $143.98 | $125.99 | $180.67 | $129.11 | |||||||||||||||
Income from investment operationsa: | ||||||||||||||||||||
Net investment income (loss)b | (2.03 | ) | (1.90 | ) | (1.81 | ) | (2.11 | ) | (2.38 | ) | ||||||||||
Net realized and unrealized gains (losses) | (1.66 | ) | 3.27 | 25.29 | (38.79 | ) | 60.61 | |||||||||||||
Total from investment operations | (3.69 | ) | 1.37 | 23.48 | (40.90 | ) | 58.23 | |||||||||||||
Less distributions from: | ||||||||||||||||||||
Net investment income | — | — | (1.29 | ) | — | — | ||||||||||||||
Net realized gains | (4.55 | ) | (3.60 | ) | (4.20 | ) | (13.78 | ) | (6.67 | ) | ||||||||||
Total distributions | (4.55 | ) | (3.60 | ) | (5.49 | ) | (13.78 | ) | (6.67 | ) | ||||||||||
Net asset value, end of year | $133.51 | $141.75 | $143.98 | $125.99 | $180.67 | |||||||||||||||
Total returnc | (2.33)% | 0.93% | 19.14% | (24.09)% | 45.76% | |||||||||||||||
Ratios to average net assets | ||||||||||||||||||||
Expenses before waiver and payments by affiliates | 1.77% | 1.80% | 1.79% | 1.71% | 1.75% | |||||||||||||||
Expenses net of waiver and payments by affiliatesd | 1.75% | 1.78% | 1.77% | 1.70% | 1.75% | e | ||||||||||||||
Net investment income (loss) | (1.42)% | (1.28)% | (1.33)% | (1.28)% | (1.42)% | |||||||||||||||
Supplemental data | ||||||||||||||||||||
Net assets, end of year (000’s) | $46,508 | $58,433 | $53,935 | $17,562 | $23,051 | |||||||||||||||
Portfolio turnover rate | 28.62% | 26.95% | 34.12% | 22.13% | 41.43% | |||||||||||||||
aThe amount shown for a share outstanding throughout the period may not correlate with the Statement of Operations for the period due to the timing of sales and repurchases of the Fund’s shares in relation to income earned and/or fluctuating fair value of the investments of the Fund.
bBased on average daily shares outstanding.
cTotal return does not reflect sales commissions or contingent deferred sales charges, if applicable.
dBenefit of expense reduction rounds to less than 0.01%.
eBenefit of waiver and payments by affiliates rounds to less than 0.01%.
franklintempleton.com | The accompanying notes are an integral part of these financial statements. | Annual Report | 19 | ||
FRANKLIN STRATEGIC SERIES
FINANCIAL HIGHLIGHTS
Franklin Biotechnology Discovery Fund(continued)
| Year Ended April 30, | ||||||||||||||||||||
| 2019 | 2018 | 2017 | 2016 | 2015 | ||||||||||||||||
Class R6 | ||||||||||||||||||||
Per share operating performance (for a share outstanding throughout the year) | ||||||||||||||||||||
Net asset value, beginning of year | $150.65 | $151.03 | $131.37 | $185.75 | $131.09 | |||||||||||||||
Income from investment operationsa: | ||||||||||||||||||||
Net investment income (loss)b | (0.46 | ) | (0.17 | ) | (0.25 | ) | (0.32 | ) | (0.45 | ) | ||||||||||
Net realized and unrealized gains (losses) | (1.81 | ) | 3.39 | 26.41 | (40.28 | ) | 61.78 | |||||||||||||
Total from investment operations | (2.27 | ) | 3.22 | 26.16 | (40.60 | ) | 61.33 | |||||||||||||
Less distributions from: | ||||||||||||||||||||
Net investment income | — | — | (2.30 | ) | — | — | ||||||||||||||
Net realized gains | (4.55 | ) | (3.60 | ) | (4.20 | ) | (13.78 | ) | (6.67 | ) | ||||||||||
Total distributions | (4.55 | ) | (3.60 | ) | (6.50 | ) | (13.78 | ) | (6.67 | ) | ||||||||||
Net asset value, end of year | $143.83 | $150.65 | $151.03 | $131.37 | $185.75 | |||||||||||||||
Total return | (1.24)% | 2.11% | 20.50% | (23.24)% | 47.40% | |||||||||||||||
Ratios to average net assets | ||||||||||||||||||||
Expenses before waiver and payments by affiliates | 0.70% | 0.65% | 0.63% | 0.60% | 0.60% | |||||||||||||||
Expenses net of waiver and payments by affiliatesc | 0.63% | 0.61% | 0.61% | 0.59% | 0.60% | d | ||||||||||||||
Net investment income (loss) | (0.30)% | (0.11)% | (0.17)% | (0.17)% | (0.27)% | |||||||||||||||
Supplemental data | ||||||||||||||||||||
Net assets, end of year (000’s) | $6,164 | $8,307 | $8,891 | $5,568 | $76,436 | |||||||||||||||
Portfolio turnover rate | 28.62% | 26.95% | 34.12% | 22.13% | 41.43% | |||||||||||||||
aThe amount shown for a share outstanding throughout the period may not correlate with the Statement of Operations for the period due to the timing of sales and repurchases of the Fund’s shares in relation to income earned and/or fluctuating fair value of the investments of the Fund.
bBased on average daily shares outstanding.
cBenefit of expense reduction rounds to less than 0.01%.
dBenefit of waiver and payments by affiliates rounds to less than 0.01%.
20 | Annual Report | The accompanying notes are an integral part of these financial statements. | franklintempleton.com | ||
FRANKLIN STRATEGIC SERIES
FINANCIAL HIGHLIGHTS
Franklin Biotechnology Discovery Fund(continued)
| Year Ended April 30, | ||||||||||||||||||||
| 2019 | 2018 | 2017 | 2016 | 2015 | ||||||||||||||||
Advisor Class | ||||||||||||||||||||
Per share operating performance (for a share outstanding throughout the year) | ||||||||||||||||||||
Net asset value, beginning of year | $149.54 | $150.20 | $130.67 | $185.12 | $130.86 | |||||||||||||||
Income from investment operationsa: | ||||||||||||||||||||
Net investment income (loss)b | (0.63 | ) | (0.45 | ) | (0.46 | ) | (0.55 | ) | (0.70 | ) | ||||||||||
Net realized and unrealized gains (losses) | (1.80 | ) | 3.39 | 26.27 | (40.12 | ) | 61.63 | |||||||||||||
Total from investment operations | (2.43 | ) | 2.94 | 25.81 | (40.67 | ) | 60.93 | |||||||||||||
Less distributions from: | ||||||||||||||||||||
Net investment income | — | — | (2.08 | ) | — | — | ||||||||||||||
Net realized gains | (4.55 | ) | (3.60 | ) | (4.20 | ) | (13.78 | ) | (6.67 | ) | ||||||||||
Total distributions | (4.55 | ) | (3.60 | ) | (6.28 | ) | (13.78 | ) | (6.67 | ) | ||||||||||
Net asset value, end of year | $142.56 | $149.54 | $150.20 | $130.67 | $185.12 | |||||||||||||||
Total return | (1.36)% | 1.94% | 20.32% | (23.36)% | 47.17% | |||||||||||||||
Ratios to average net assets | ||||||||||||||||||||
Expenses before waiver and payments by affiliates | 0.77% | 0.80% | 0.79% | 0.75% | 0.75% | |||||||||||||||
Expenses net of waiver and payments by affiliatesc | 0.75% | 0.78% | 0.77% | 0.74% | 0.75% | d | ||||||||||||||
Net investment income (loss) | (0.42)% | (0.28)% | (0.33)% | (0.32)% | (0.42)% | |||||||||||||||
Supplemental data | ||||||||||||||||||||
Net assets, end of year (000’s) | $153,874 | $180,219 | $159,894 | $93,263 | $167,035 | |||||||||||||||
Portfolio turnover rate | 28.62% | 26.95% | 34.12% | 22.13% | 41.43% | |||||||||||||||
aThe amount shown for a share outstanding throughout the period may not correlate with the Statement of Operations for the period due to the timing of sales and repurchases of the Fund’s shares in relation to income earned and/or fluctuating fair value of the investments of the Fund.
bBased on average daily shares outstanding.
cBenefit of expense reduction rounds to less than 0.01%.
dBenefit of waiver and payments by affiliates rounds to less than 0.01%.
franklintempleton.com | The accompanying notes are an integral part of these financial statements. | Annual Report | 21 | ||
FRANKLIN STRATEGIC SERIES
Statement of Investments, April 30, 2019
Franklin Biotechnology Discovery Fund
| Country | Shares/ Warrants | Value | ||||||||||
Common Stocks and Other Equity Interests 97.4% | ||||||||||||
Biotechnology 77.7% | ||||||||||||
aAcadia Pharmaceuticals Inc. | United States | 294,600 | $ | 7,085,130 | ||||||||
aAcceleron Pharma Inc. | United States | 250,900 | 10,219,157 | |||||||||
aAimmune Therapeutics Inc. | United States | 155,700 | 3,135,798 | |||||||||
a Alder Biopharmaceuticals Inc. | United States | 281,700 | 3,828,303 | |||||||||
aAlector Inc. | United States | 194,300 | 3,858,798 | |||||||||
aAlexion Pharmaceuticals Inc. | United States | 598,200 | 81,432,966 | |||||||||
a,b Allogene Therapeutics Inc., 144A | United States | 326,797 | 9,787,570 | |||||||||
aAlnylam Pharmaceuticals Inc. | United States | 77,200 | 6,897,048 | |||||||||
Amgen Inc. | United States | 208,000 | 37,298,560 | |||||||||
a Amicus Therapeutics Inc. | United States | 803,900 | 10,724,026 | |||||||||
aAnaptysBio Inc. | United States | 111,900 | 8,137,368 | |||||||||
a,c ARCA biopharma Inc., wts., 6/16/22 | United States | 1,338,619 | 54 | |||||||||
aArgenx SE, ADR | Netherlands | 138,825 | 17,779,318 | |||||||||
a Array BioPharma Inc. | United States | 2,639,900 | 59,688,139 | |||||||||
aAscendis Pharma AS, ADR | Denmark | 257,700 | 28,702,626 | |||||||||
aAudentes Therapeutics Inc. | United States | 87,500 | 3,306,625 | |||||||||
a,d Aurinia Pharmaceuticals Inc. | Canada | 570,300 | 3,518,751 | |||||||||
aBiogen Inc. | United States | 201,861 | 46,274,616 | |||||||||
aBiohaven Pharmaceutical Holding Co. Ltd. | United States | 109,600 | 6,559,560 | |||||||||
aBioMarin Pharmaceutical Inc. | United States | 441,556 | 37,766,285 | |||||||||
aBluebird Bio Inc. | United States | 57,800 | 8,197,774 | |||||||||
aCara Therapeutics Inc. | United States | 159,600 | 3,045,168 | |||||||||
aChemoCentryx Inc. | United States | 528,108 | 7,007,993 | |||||||||
a,d CRISPR Therapeutics AG | Switzerland | 166,314 | 6,684,160 | |||||||||
a,c DelMar Pharmaceuticals Inc., wts., 4/12/22 | Canada | 291,578 | 37 | |||||||||
aDynavax Technologies Corp. | United States | 771,870 | 5,132,936 | |||||||||
aFate Therapeutics Inc. | United States | 1,260,546 | 21,177,173 | |||||||||
aG1 Therapeutics Inc. | United States | 412,426 | 8,825,916 | |||||||||
Gilead Sciences Inc. | United States | 624,500 | 40,617,480 | |||||||||
aGlobal Blood Therapeutics Inc. | United States | 197,500 | 10,941,500 | |||||||||
aGlycoMimetics Inc. | United States | 693,700 | 8,442,329 | |||||||||
aGossamer Bio Inc. | United States | 242,900 | 4,119,584 | |||||||||
aHeron Therapeutics Inc. | United States | 1,436,677 | 31,147,157 | |||||||||
aHomology Medicines Inc. | United States | 138,400 | 2,978,368 | |||||||||
aImmunomedics Inc. | United States | 348,700 | 5,586,174 | |||||||||
a,c,e Intarcia Therapeutics Inc., DD | United States | 80,195 | 642,536 | |||||||||
a Intercept Pharmaceuticals Inc. | United States | 166,700 | 14,366,206 | |||||||||
aIonis Pharmaceuticals Inc. | United States | 102,400 | 7,611,392 | |||||||||
aIovance Biotherapeutics Inc. | United States | 2,233,600 | 25,463,040 | |||||||||
aKezar Life Sciences Inc. | United States | 131,900 | 2,488,953 | |||||||||
a,d LogicBio Therapeutics Inc. | United States | 280,700 | 3,820,327 | |||||||||
aMacroGenics Inc. | United States | 180,200 | 3,021,954 | |||||||||
aMinerva Neurosciences Inc. | United States | 492,400 | 3,628,988 | |||||||||
aMirati Therapeutics Inc. | United States | 162,151 | 9,646,363 | |||||||||
a,c,e Molecular Templates Inc., wts., 2/28/20 | United States | 39,954 | 17 | |||||||||
aMorphoSys AG, ADR | Germany | 275,700 | 6,798,762 | |||||||||
aNeurocrine Biosciences Inc. | United States | 292,600 | 21,137,424 | |||||||||
aPfenex Inc. | United States | 870,884 | 5,042,418 | |||||||||
aPortola Pharmaceuticals Inc. | United States | 374,900 | 13,233,970 | |||||||||
a,c,e Precision Biosciences Inc., 144A | United States | 425,322 | 4,965,280 | |||||||||
aPrincipia Biopharma Inc. | United States | 92,600 | 2,769,666 | |||||||||
aPTC Therapeutics Inc. | United States | 586,300 | 21,939,346 | |||||||||
22 | Annual Report | franklintempleton.com | ||
FRANKLIN STRATEGIC SERIES
STATEMENT OF INVESTMENTS
Franklin Biotechnology Discovery Fund(continued)
| Country | Shares/ Warrants | Value | ||||||||||
Common Stocks and Other Equity Interests(continued) | ||||||||||||
Biotechnology(continued) | ||||||||||||
aRegeneron Pharmaceuticals Inc. | United States | 125,009 | $ | 42,895,588 | ||||||||
aREGENXBIO Inc. | United States | 214,076 | 10,789,430 | |||||||||
aRocket Pharmaceuticals Inc. | United States | 178,571 | 3,314,278 | |||||||||
a,d Rubius Therapeutics Inc. | United States | 174,200 | 3,046,758 | |||||||||
aSage Therapeutics Inc. | United States | 144,470 | 24,304,188 | |||||||||
aSarepta Therapeutics Inc. | United States | 140,100 | 16,383,294 | |||||||||
auniQure NV | Netherlands | 206,000 | 11,575,140 | |||||||||
aVertex Pharmaceuticals Inc. | United States | 355,600 | 60,089,288 | |||||||||
aXencor Inc. | United States | 178,132 | 5,470,434 | |||||||||
aZymeworks Inc. | Canada | 251,920 | 4,801,595 | |||||||||
|
| |||||||||||
| 879,151,082 | ||||||||||||
|
| |||||||||||
Life Sciences Tools & Services 5.1% |
| |||||||||||
aIllumina Inc. | United States | 183,900 | 57,376,800 | |||||||||
|
| |||||||||||
Pharmaceuticals 14.6% | ||||||||||||
aAclaris Therapeutics Inc. | United States | 995,662 | 6,272,670 | |||||||||
a,b BioPharmX Corp., 144A | United States | 77,829 | 101,178 | |||||||||
a,c BioPharmX Corp., wts., 3/29/21 | United States | 108,000 | 993 | |||||||||
a,c BioPharmX Corp., wts., 11/22/23 | United States | 1,679,900 | 47,686 | |||||||||
aCollegium Pharmaceutical Inc. | United States | 403,450 | 5,620,058 | |||||||||
aCymabay Therapeutics Inc. | United States | 438,356 | 5,615,340 | |||||||||
aDermira Inc. | United States | 538,268 | 5,969,392 | |||||||||
aFoamix Pharmaceuticals Ltd. | Israel | 750,900 | 2,440,425 | |||||||||
aGW Pharmaceuticals PLC, ADR | United Kingdom | 260,500 | 44,105,255 | |||||||||
a Intra-Cellular Therapies Inc. | United States | 236,000 | 3,108,120 | |||||||||
aIterum Therapeutics PLC | United States | 144,737 | 1,172,370 | |||||||||
aJazz Pharmaceuticals PLC | United States | 188,500 | 24,461,645 | |||||||||
aMarinus Pharmaceuticals Inc. | United States | 942,053 | 4,653,742 | |||||||||
aNeos Therapeutics Inc. | United States | 489,765 | 1,180,334 | |||||||||
a,d Odonate Therapeutics Inc. | United States | 404,482 | 7,952,116 | |||||||||
a,d Optinose Inc. | United States | 230,300 | 2,293,788 | |||||||||
aReata Pharmaceuticals Inc. | United States | 242,600 | 19,034,396 | |||||||||
aRevance Therapeutics Inc. | United States | 647,300 | 8,570,252 | |||||||||
a,d TherapeuticsMD Inc. | United States | 2,847,040 | 12,242,272 | |||||||||
aZogenix Inc. | United States | 275,215 | 10,730,633 | |||||||||
|
| |||||||||||
| 165,572,665 | ||||||||||||
|
| |||||||||||
Total Common Stocks and Other Equity Interests | 1,102,100,547 | |||||||||||
|
| |||||||||||
Preferred Stocks (Cost $2,821,056) 0.2% | ||||||||||||
Biotechnology 0.2% | ||||||||||||
a,c,e Metacrine Inc., pfd., C | United States | 1,330,687 | 1,953,313 | |||||||||
|
| |||||||||||
Escrows and Litigation Trusts (Cost $2,241,691) 0.1% | ||||||||||||
a,c True North Therapeutics Inc., Escrow Account | United States | 759,880 | 997,867 | |||||||||
|
| |||||||||||
Total Investments before Short Term Investments | 1,105,051,727 | |||||||||||
|
| |||||||||||
franklintempleton.com | Annual Report | 23 | ||
FRANKLIN STRATEGIC SERIES
STATEMENT OF INVESTMENTS
Franklin Biotechnology Discovery Fund(continued)
| Country | Shares | Value | ||||||||||
Short Term Investments 4.9% | ||||||||||||
Money Market Funds (Cost $27,393,876) 2.4% | ||||||||||||
f,g Institutional Fiduciary Trust Money Market Portfolio, 2.10% | United States | 27,393,876 | $ | 27,393,876 | ||||||||
|
| |||||||||||
hInvestments from Cash Collateral Received for Loaned Securities (Cost $27,827,675) 2.5% | ||||||||||||
Money Market Funds 2.5% | ||||||||||||
f,g Institutional Fiduciary Trust Money Market Portfolio, 2.10% | United States | 27,827,675 | 27,827,675 | |||||||||
|
| |||||||||||
Total Investments (Cost $746,935,378) 102.6% | 1,160,273,278 | |||||||||||
Other Assets, less Liabilities (2.6)% | (29,115,908 | ) | ||||||||||
|
| |||||||||||
Net Assets 100.0% | $ | 1,131,157,370 | ||||||||||
|
| |||||||||||
See Abbreviations on page 47.
aNon-income producing.
bSecurity was purchased pursuant to Rule 144A under the Securities Act of 1933 and may be sold in transactions exempt from registration only to qualified institutional buyers or in a public offering registered under the Securities Act of 1933. These securities have been deemed liquid under guidelines approved by the Trust’s Board of Trustees. At April 30, 2019, the aggregate value of these securities was $9,888,748, representing 0.9% of net assets.
cFair valued using significant unobservable inputs. See Note 10 regarding fair value measurements.
dA portion or all of the security is on loan at April 30, 2019. See Note 1(c).
eSee Note 8 regarding restricted securities.
fSee Note 3(f) regarding investments in affiliated management investment companies.
gThe rate shown is the annualized seven-day effective yield at period end.
hSee Note 1(c) regarding securities on loan.
24 | Annual Report | The accompanying notes are an integral part of these financial statements. | franklintempleton.com | ||
FRANKLIN STRATEGIC SERIES
Financial Highlights
Franklin Natural Resources Fund
| Year Ended April 30, | ||||||||||||||||||||
| 2019 | 2018 | 2017 | 2016 | 2015 | ||||||||||||||||
Class A | ||||||||||||||||||||
Per share operating performance (for a share outstanding throughout the year) | ||||||||||||||||||||
Net asset value, beginning of year | $27.96 | $25.11 | $25.02 | $31.46 | $39.79 | |||||||||||||||
Income from investment operationsa: | ||||||||||||||||||||
Net investment incomeb | 0.31 | 0.39 | c | 0.20 | 0.29 | 0.23 | ||||||||||||||
Net realized and unrealized gains (losses) | (4.20 | ) | 2.77 | 0.17 | (6.55 | ) | (8.27 | ) | ||||||||||||
Total from investment operations | (3.89 | ) | 3.16 | 0.37 | (6.26 | ) | (8.04 | ) | ||||||||||||
Less distributions from: | ||||||||||||||||||||
Net investment income | (0.49 | ) | (0.31 | ) | (0.28 | ) | (0.18 | ) | (0.29 | ) | ||||||||||
Net asset value, end of year | $23.58 | $27.96 | $25.11 | $25.02 | $31.46 | |||||||||||||||
Total returnd | (13.69)% | 12.74% | 1.37% | (19.80)% | (20.07)% | |||||||||||||||
Ratios to average net assets | ||||||||||||||||||||
Expenses before waiver and payments by affiliates | 1.03% | 1.13% | 1.06% | 1.14% | 1.08% | |||||||||||||||
Expenses net of waiver and payments by affiliates | 1.03% | e,f | 1.13% | e,f | 1.05% | e | 1.13% | 1.08% | e,f | |||||||||||
Net investment income | 1.21% | 1.56% | c | 0.79% | 1.22% | 0.67% | ||||||||||||||
Supplemental data | ||||||||||||||||||||
Net assets, end of year (000’s) | $247,362 | $344,695 | $398,703 | $461,596 | $572,518 | |||||||||||||||
Portfolio turnover rate | 29.83% | 29.98% | 29.74% | 35.77% | 30.05% | |||||||||||||||
aThe amount shown for a share outstanding throughout the period may not correlate with the Statement of Operations for the period due to the timing of sales and repurchases of the Fund’s shares in relation to income earned and/or fluctuating fair value of the investments of the Fund.
bBased on average daily shares outstanding.
cNet investment income per share includes approximately $0.16 per share related to income received in the form of special dividends in connection with certain Fund holdings. Excluding this amount, the ratio of net investment income to average net assets would have been 0.91%.
dTotal return does not reflect sales commissions or contingent deferred sales charges, if applicable.
eBenefit of expense reduction rounds to less than 0.01%.
fBenefit of waiver and payments by affiliates rounds to less than 0.01%.
franklintempleton.com | The accompanying notes are an integral part of these financial statements. | Annual Report | 25 | ||
FRANKLIN STRATEGIC SERIES
FINANCIAL HIGHLIGHTS
Franklin Natural Resources Fund(continued)
| Year Ended April 30, | ||||||||||||||||||||
| 2019 | 2018 | 2017 | 2016 | 2015 | ||||||||||||||||
Class C | ||||||||||||||||||||
Per share operating performance (for a share outstanding throughout the year) | ||||||||||||||||||||
Net asset value, beginning of year | $27.17 | $24.28 | $24.25 | $30.46 | $38.39 | |||||||||||||||
Income from investment operationsa: | ||||||||||||||||||||
Net investment income (loss)b | 0.11 | 0.20 | c | 0.01 | 0.11 | (0.01 | ) | |||||||||||||
Net realized and unrealized gains (losses) | (4.07 | ) | 2.69 | 0.15 | (6.31 | ) | (7.91 | ) | ||||||||||||
Total from investment operations | (3.96 | ) | 2.89 | 0.16 | (6.20 | ) | (7.92 | ) | ||||||||||||
Less distributions from: | ||||||||||||||||||||
Net investment income | (0.39 | ) | — | (0.13 | ) | (0.01 | ) | (0.01 | ) | |||||||||||
Net asset value, end of year | $22.82 | $27.17 | $24.28 | $24.25 | $30.46 | |||||||||||||||
Total returnd | (14.37)% | 11.90% | 0.63% | (20.37)% | (20.63)% | |||||||||||||||
Ratios to average net assets | ||||||||||||||||||||
Expenses before waiver and payments by affiliates | 1.78% | 1.88% | 1.81% | 1.87% | 1.78% | |||||||||||||||
Expenses net of waiver and payments by affiliates | 1.78% | e,f | 1.88% | e,f | 1.80% | e | 1.86% | 1.78% | e,f | |||||||||||
Net investment income (loss) | 0.46% | 0.81% | c | 0.04% | 0.49% | (0.03)% | ||||||||||||||
Supplemental data | ||||||||||||||||||||
Net assets, end of year (000’s) | $49,620 | $83,814 | $96,835 | $107,724 | $123,735 | |||||||||||||||
Portfolio turnover rate | 29.83% | 29.98% | 29.74% | 35.77% | 30.05% | |||||||||||||||
aThe amount shown for a share outstanding throughout the period may not correlate with the Statement of Operations for the period due to the timing of sales and repurchases of the Fund’s shares in relation to income earned and/or fluctuating fair value of the investments of the Fund.
bBased on average daily shares outstanding.
cNet investment income per share includes approximately $0.16 per share related to income received in the form of special dividends in connection with certain Fund holdings. Excluding this amount, the ratio of net investment income to average net assets would have been 0.16%.
dTotal return does not reflect sales commissions or contingent deferred sales charges, if applicable.
eBenefit of expense reduction rounds to less than 0.01%.
fBenefit of waiver and payments by affiliates rounds to less than 0.01%.
26 | Annual Report | The accompanying notes are an integral part of these financial statements. | franklintempleton.com | ||
FRANKLIN STRATEGIC SERIES
FINANCIAL HIGHLIGHTS
Franklin Natural Resources Fund(continued)
| Year Ended April 30, | ||||||||||||||||||||
| 2019 | 2018 | 2017 | 2016 | 2015 | ||||||||||||||||
Class R6 | ||||||||||||||||||||
Per share operating performance (for a share outstanding throughout the year) | ||||||||||||||||||||
Net asset value, beginning of year | $29.79 | $26.87 | $26.73 | $33.62 | $42.58 | |||||||||||||||
Income from investment operationsa: | ||||||||||||||||||||
Net investment incomeb | 0.45 | 0.57 | c | 0.47 | 0.51 | 0.46 | ||||||||||||||
Net realized and unrealized gains (losses) | (4.49 | ) | 2.95 | 0.04 | (7.06 | ) | (8.92 | ) | ||||||||||||
Total from investment operations | (4.04 | ) | 3.52 | 0.51 | (6.55 | ) | (8.46 | ) | ||||||||||||
Less distributions from: | ||||||||||||||||||||
Net investment income | (0.53 | ) | (0.60 | ) | (0.37 | ) | (0.34 | ) | (0.50 | ) | ||||||||||
Net asset value, end of year | $25.22 | $29.79 | $26.87 | $26.73 | $33.62 | |||||||||||||||
Total return | (13.31)% | 13.37% | 1.89% | (19.31)% | (19.61)% | |||||||||||||||
Ratios to average net assets | ||||||||||||||||||||
Expenses before waiver and payments by affiliates | 0.62% | 0.64% | 0.83% | 0.60% | 0.55% | |||||||||||||||
Expenses net of waiver and payments by affiliates | 0.59% | d | 0.57% | d | 0.54% | d | 0.55% | 0.54% | d | |||||||||||
Net investment income | 1.65% | 2.12% | c | 1.30% | 1.80% | 1.21% | ||||||||||||||
Supplemental data | ||||||||||||||||||||
Net assets, end of year (000’s) | $15,627 | $15,866 | $218 | $15 | $439 | |||||||||||||||
Portfolio turnover rate | 29.83% | 29.98% | 29.74% | 35.77% | 30.05% | |||||||||||||||
aThe amount shown for a share outstanding throughout the period may not correlate with the Statement of Operations for the period due to the timing of sales and repurchases of the Fund’s shares in relation to income earned and/or fluctuating fair value of the investments of the Fund.
bBased on average daily shares outstanding.
cNet investment income per share includes approximately $0.16 per share related to income received in the form of special dividends in connection with certain Fund holdings. Excluding this amount, the ratio of net investment income to average net assets would have been 1.47%.
dBenefit of expense reduction rounds to less than 0.01%.
franklintempleton.com | The accompanying notes are an integral part of these financial statements. | Annual Report | 27 | ||
FRANKLIN STRATEGIC SERIES
FINANCIAL HIGHLIGHTS
Franklin Natural Resources Fund(continued)
| Year Ended April 30, | ||||||||||||||||||||
| 2019 | 2018 | 2017 | 2016 | 2015 | ||||||||||||||||
Advisor Class | ||||||||||||||||||||
Per share operating performance (for a share outstanding throughout the year) | ||||||||||||||||||||
Net asset value, beginning of year | $29.80 | $26.81 | $26.71 | $33.63 | $42.52 | |||||||||||||||
Income from investment operationsa: | ||||||||||||||||||||
Net investment incomeb | 0.40 | 0.49 | c | 0.29 | 0.36 | 0.35 | ||||||||||||||
Net realized and unrealized gains (losses) | (4.49 | ) | 2.95 | 0.17 | (7.00 | ) | (8.85 | ) | ||||||||||||
Total from investment operations | (4.09 | ) | 3.44 | 0.46 | (6.64 | ) | (8.50 | ) | ||||||||||||
Less distributions from: | ||||||||||||||||||||
Net investment income | (0.51 | ) | (0.45 | ) | (0.36 | ) | (0.28 | ) | (0.39 | ) | ||||||||||
Net asset value, end of year | $25.20 | $29.80 | $26.81 | $26.71 | $33.63 | |||||||||||||||
Total return | (13.50)% | 13.04% | 1.64% | (19.60)% | (19.81)% | |||||||||||||||
Ratios to average net assets | ||||||||||||||||||||
Expenses before waiver and payments by affiliates | 0.78% | 0.88% | 0.81% | 0.87% | 0.78% | |||||||||||||||
Expenses net of waiver and payments by affiliates | 0.78% | d,e | 0.88% | d,e | 0.80% | d | 0.86% | 0.78% | d,e | |||||||||||
Net investment income | 1.46% | 1.81% | c | 1.04% | 1.49% | 0.97% | ||||||||||||||
Supplemental data | ||||||||||||||||||||
Net assets, end of year (000’s) | $62,639 | $78,443 | $94,070 | $90,185 | $79,307 | |||||||||||||||
Portfolio turnover rate | 29.83% | 29.98% | 29.74% | 35.77% | 30.05% | |||||||||||||||
aThe amount shown for a share outstanding throughout the period may not correlate with the Statement of Operations for the period due to the timing of sales and repurchases of the Fund’s shares in relation to income earned and/or fluctuating fair value of the investments of the Fund.
bBased on average daily shares outstanding.
cNet investment income per share includes approximately $0.16 per share related to income received in the form of special dividends in connection with certain Fund holdings. Excluding this amount, the ratio of net investment income to average net assets would have been 1.16%.
dBenefit of expense reduction rounds to less than 0.01%.
eBenefit of waiver and payments by affiliates rounds to less than 0.01%.
28 | Annual Report | The accompanying notes are an integral part of these financial statements. | franklintempleton.com | ||
FRANKLIN STRATEGIC SERIES
Statement of Investments, April 30, 2019
Franklin Natural Resources Fund
| Country | Shares | Value | ||||||||||
Common Stocks 98.9% | ||||||||||||
Aluminum 0.4% | ||||||||||||
aAlcoa Corp. | United States | 53,400 | $ | 1,424,712 | ||||||||
|
| |||||||||||
Commodity Chemicals 0.2% | ||||||||||||
Dow Inc. | United States | 16,000 | 907,680 | |||||||||
|
| |||||||||||
Construction Materials 0.5% | ||||||||||||
a Cemex SAB de CV, CPO, ADR | Mexico | 367,000 | 1,688,200 | |||||||||
|
| |||||||||||
Copper 5.3% | ||||||||||||
Antofagasta PLC | United Kingdom | 455,800 | 5,397,024 | |||||||||
First Quantum Minerals Ltd. | Zambia | 248,400 | 2,624,205 | |||||||||
Freeport-McMoRan Inc. | United States | 429,200 | 5,283,452 | |||||||||
a Imperial Metals Corp. | Canada | 364,500 | 685,785 | |||||||||
Lundin Mining Corp. | Chile | 589,900 | 3,166,627 | |||||||||
Sandfire Resources NL | Australia | 584,367 | 2,901,359 | |||||||||
|
| |||||||||||
| 20,058,452 | ||||||||||||
|
| |||||||||||
Diversified Chemicals 0.8% | ||||||||||||
BASF SE | Germany | 35,600 | 2,894,708 | |||||||||
|
| |||||||||||
Diversified Metals & Mining 9.0% | ||||||||||||
Anglo American PLC | United Kingdom | 139,000 | 3,591,544 | |||||||||
BHP Group PLC, ADR | United Kingdom | 153,200 | 7,220,316 | |||||||||
Glencore PLC | Switzerland | 1,850,500 | 7,344,405 | |||||||||
Hudbay Minerals Inc. | Canada | 216,600 | 1,442,491 | |||||||||
a,b Nautilus Minerals Inc. | Canada | 3,895,831 | 65,601 | |||||||||
Nexa Resources SA | Peru | 165,200 | 1,955,968 | |||||||||
Rio Tinto PLC, ADR | Australia | 85,700 | 5,047,730 | |||||||||
South32 Ltd. | Australia | 981,400 | 2,311,722 | |||||||||
Teck Resources Ltd., B | Canada | 202,300 | 4,784,395 | |||||||||
|
| |||||||||||
| 33,764,172 | ||||||||||||
|
| |||||||||||
Fertilizers & Agricultural Chemicals 0.7% | ||||||||||||
Nutrien Ltd. | Canada | 48,900 | 2,649,402 | |||||||||
|
| |||||||||||
Gold 4.5% | ||||||||||||
Agnico Eagle Mines Ltd. | Canada | 66,300 | 2,746,248 | |||||||||
Alamos Gold Inc., A | Canada | 537,400 | 2,495,616 | |||||||||
aB2Gold Corp. | Canada | 962,100 | 2,614,636 | |||||||||
Barrick Gold Corp. | Canada | 248,091 | 3,155,717 | |||||||||
aGuyana Goldfields Inc. | Canada | 1,303,900 | 905,351 | |||||||||
Newcrest Mining Ltd. | Australia | 119,800 | 2,113,069 | |||||||||
Newmont Goldcorp Corp. | United States | 58,515 | 1,817,476 | |||||||||
OceanaGold Corp. | Australia | 402,310 | 1,129,375 | |||||||||
|
| |||||||||||
| 16,977,488 | ||||||||||||
|
| |||||||||||
Integrated Oil & Gas 12.7% | ||||||||||||
Chevron Corp. | United States | 77,900 | 9,352,674 | |||||||||
Exxon Mobil Corp. | United States | 71,000 | 5,699,880 | |||||||||
Occidental Petroleum Corp. | United States | 176,500 | 10,392,320 | |||||||||
Royal Dutch Shell PLC, A, ADR | United Kingdom | 163,521 | 10,388,489 | |||||||||
Suncor Energy Inc. | Canada | 247,400 | 8,160,469 | |||||||||
Total SA, B, ADR | France | 66,110 | 3,680,344 | |||||||||
|
| |||||||||||
| 47,674,176 | ||||||||||||
|
| |||||||||||
franklintempleton.com | Annual Report | 29 | ||
FRANKLIN STRATEGIC SERIES
STATEMENT OF INVESTMENTS
Franklin Natural Resources Fund(continued)
| Country | Shares | Value | ||||||||||
Common Stocks(continued) | ||||||||||||
Oil & Gas Drilling 2.0% | ||||||||||||
Ensco Rowan PLC, A | United States | 81,881 | $ | 1,143,878 | ||||||||
Patterson-UTI Energy Inc. | United States | 324,500 | 4,409,955 | |||||||||
aPioneer Energy Services Corp. | United States | 1,015,946 | 1,767,746 | |||||||||
|
| |||||||||||
| 7,321,579 | ||||||||||||
|
| |||||||||||
Oil & Gas Equipment & Services 18.0% | ||||||||||||
Baker Hughes a GE Co., A | United States | 242,700 | 5,829,654 | |||||||||
aC&J Energy Services Inc. | United States | 72,300 | 1,015,815 | |||||||||
aCactus Inc. | United States | 40,700 | 1,477,410 | |||||||||
aDril-Quip Inc. | United States | 40,400 | 1,759,824 | |||||||||
Halliburton Co. | United States | 312,335 | 8,848,451 | |||||||||
Hunting PLC | United Kingdom | 137,400 | 1,055,349 | |||||||||
Liberty Oilfield Services Inc., A | United States | 129,600 | 1,932,336 | |||||||||
Mammoth Energy Services Inc. | United States | 77,943 | 1,215,131 | |||||||||
aNine Energy Service Inc. | United States | 79,650 | 1,603,355 | |||||||||
aOceaneering International Inc. | United States | 127,400 | 2,446,080 | |||||||||
a Oil States International Inc. | United States | 209,366 | 4,044,951 | |||||||||
aProPetro Holding Corp. | United States | 73,600 | 1,628,768 | |||||||||
aRanger Energy Services Inc. | United States | 163,422 | 1,197,066 | |||||||||
RPC Inc. | United States | 137,800 | 1,417,962 | |||||||||
Schlumberger Ltd. | United States | 347,347 | 14,824,770 | |||||||||
Schoeller-Bleckmann Oilfield Equipment AG | Austria | 20,700 | 1,936,481 | |||||||||
aSelect Energy Services Inc. | United States | 222,200 | 2,559,744 | |||||||||
aSuperior Energy Services Inc. | United States | 722,700 | 2,594,493 | |||||||||
TechnipFMC PLC | United Kingdom | 405,700 | 9,976,163 | |||||||||
aWeatherford International PLC | United States | 511,300 | 282,902 | |||||||||
|
| |||||||||||
| 67,646,705 | ||||||||||||
|
| |||||||||||
Oil & Gas Exploration & Production 31.3% | ||||||||||||
Anadarko Petroleum Corp. | United States | 117,100 | 8,530,735 | |||||||||
Cabot Oil & Gas Corp., A | United States | 359,200 | 9,299,688 | |||||||||
aCairn Energy PLC | United Kingdom | 1,679,700 | 3,749,987 | |||||||||
aCallon Petroleum Co. | United States | 841,100 | 6,316,661 | |||||||||
Canadian Natural Resources Ltd. | Canada | 253,500 | 7,612,192 | |||||||||
Concho Resources Inc. | United States | 106,200 | 12,253,356 | |||||||||
ConocoPhillips | United States | 94,800 | 5,983,776 | |||||||||
Diamondback Energy Inc. | United States | 116,000 | 12,341,240 | |||||||||
EOG Resources Inc. | United States | 115,700 | 11,112,985 | |||||||||
EQT Corp. | United States | 230,700 | 4,717,815 | |||||||||
Hess Corp. | United States | 112,200 | 7,194,264 | |||||||||
aJagged Peak Energy Inc. | United States | 557,216 | 5,889,773 | |||||||||
Noble Energy Inc. | United States | 327,600 | 8,864,856 | |||||||||
Pioneer Natural Resources Co. | United States | 66,600 | 11,086,236 | |||||||||
aRing Energy Inc. | United States | 497,800 | 2,578,604 | |||||||||
|
| |||||||||||
| 117,532,168 | ||||||||||||
|
| |||||||||||
Oil & Gas Refining & Marketing 3.4% | ||||||||||||
HollyFrontier Corp. | United States | 31,500 | 1,503,495 | |||||||||
Marathon Petroleum Corp. | United States | 82,500 | 5,021,775 | |||||||||
Phillips 66 | United States | 42,800 | 4,034,756 | |||||||||
Valero Energy Corp. | United States | 22,900 | 2,076,114 | |||||||||
|
| |||||||||||
| 12,636,140 | ||||||||||||
|
| |||||||||||
30 | Annual Report | franklintempleton.com | ||
FRANKLIN STRATEGIC SERIES
STATEMENT OF INVESTMENTS
Franklin Natural Resources Fund(continued)
| Country | Shares | Value | ||||||||||
Common Stocks(continued) | ||||||||||||
Oil & Gas Storage & Transportation 7.1% | ||||||||||||
Enbridge Inc. | Canada | 77,647 | $ | 2,868,280 | ||||||||
Kinder Morgan Inc. | United States | 191,400 | 3,803,118 | |||||||||
ONEOK Inc. | United States | 64,200 | 4,361,106 | |||||||||
Targa Resources Corp. | United States | 167,100 | 6,709,065 | |||||||||
TransCanada Corp. | Canada | 67,800 | 3,238,128 | |||||||||
The Williams Cos. Inc. | United States | 195,700 | 5,544,181 | |||||||||
|
| |||||||||||
| 26,523,878 | ||||||||||||
|
| |||||||||||
Paper Packaging 0.6% | ||||||||||||
Packaging Corp. of America | United States | 24,100 | 2,389,756 | |||||||||
|
| |||||||||||
Pharmaceuticals 0.2% | ||||||||||||
aElanco Animal Health Inc. | United States | 17,600 | 554,400 | |||||||||
|
| |||||||||||
Specialty Chemicals 1.7% | ||||||||||||
Albemarle Corp. | United States | 44,700 | 3,355,182 | |||||||||
DowDuPont Inc. | United States | 48,000 | 1,845,600 | |||||||||
Umicore SA | Belgium | 32,200 | 1,246,097 | |||||||||
|
| |||||||||||
| 6,446,879 | ||||||||||||
|
| |||||||||||
Trading Companies & Distributors 0.5% | ||||||||||||
aUnivar Inc. | United States | 82,900 | 1,851,157 | |||||||||
|
| |||||||||||
Total Common Stocks (Cost $330,432,245) | 370,941,652 | |||||||||||
|
| |||||||||||
Short Term Investments (Cost $788,220) 0.2% | ||||||||||||
Money Market Funds 0.2% | ||||||||||||
c,d Institutional Fiduciary Trust Money Market Portfolio, 2.10% | United States | 788,220 | 788,220 | |||||||||
|
| |||||||||||
Total Investments (Cost $331,220,465) 99.1% | 371,729,872 | |||||||||||
Other Assets, less Liabilities 0.9% | 3,518,636 | |||||||||||
|
| |||||||||||
Net Assets 100.0% | $ | 375,248,508 | ||||||||||
|
| |||||||||||
See Abbreviations on page 47.
aNon-income producing.
bFair valued using significant unobservable inputs. See Note 10 regarding fair value measurements.
cSee Note 3(f) regarding investments in affiliated management investment companies.
dThe rate shown is the annualized seven-day effective yield at period end.
franklintempleton.com | The accompanying notes are an integral part of these financial statements. | Annual Report | 31 | ||
FRANKLIN STRATEGIC SERIES
Financial Statements
Statements of Assets and Liabilities
April 30, 2019
Franklin
| Franklin Natural
| |||||||
| ||||||||
Assets: | ||||||||
Investments in securities: | ||||||||
Cost - Unaffiliated issuers | $ | 691,713,827 | $ | 330,432,245 | ||||
Cost - Non-controlled affiliates (Note 3f) | 55,221,551 | 788,220 | ||||||
|
| |||||||
Value - Unaffiliated issuers+ | $ | 1,105,051,727 | $ | 370,941,652 | ||||
Value - Non-controlled affiliates (Note 3f) | 55,221,551 | 788,220 | ||||||
Cash | — | 32,194 | ||||||
Receivables: | ||||||||
Investment securities sold ** | 151,328 | 3,411,099 | ||||||
Capital shares sold | 994,449 | 234,654 | ||||||
Dividends and interest | 35,825 | 827,709 | ||||||
Other assets | 1,066 | 343 | ||||||
|
| |||||||
Total assets | 1,161,455,946 | 376,235,871 | ||||||
|
| |||||||
Liabilities: | ||||||||
Payables: | ||||||||
Capital shares redeemed | 1,293,533 | 527,744 | ||||||
Management fees | 559,398 | 163,115 | ||||||
Distribution fees | 236,888 | 94,663 | ||||||
Transfer agent fees | 260,829 | 121,466 | ||||||
Payable upon return of securities loaned | 27,827,675 | — | ||||||
Accrued expenses and other liabilities | 120,253 | 80,375 | ||||||
|
| |||||||
Total liabilities | 30,298,576 | 987,363 | ||||||
|
| |||||||
Net assets, at value | $ | 1,131,157,370 | $ | 375,248,508 | ||||
|
| |||||||
Net assets consist of: | ||||||||
Paid-in capital | $ | 665,468,509 | $ | 489,848,499 | ||||
Total distributable earnings (loss) | 465,688,861 | (114,599,991 | ) | |||||
|
| |||||||
Net assets, at value | $ | 1,131,157,370 | $ | 375,248,508 | ||||
|
| |||||||
+Includes securities loaned | $ | 26,306,665 | $ | — | ||||
**Includes securities loaned | $ | 151,328 | $ | — | ||||
32 | Annual Report | The accompanying notes are an integral part of these financial statements. | franklintempleton.com | ||
FRANKLIN STRATEGIC SERIES
FINANCIAL STATEMENTS
Statements of Assets and Liabilities(continued)
April 30, 2019
Franklin
| Franklin Natural
| |||||||
| ||||||||
Class A: | ||||||||
Net assets, at value | $924,611,188 | $247,362,445 | ||||||
|
| |||||||
Shares outstanding | 6,659,165 | 10,491,818 | ||||||
|
| |||||||
Net asset value per sharea | $138.85 | $23.58 | ||||||
|
| |||||||
Maximum offering price per share (net asset value per share ÷ 94.50%) | $146.93 | $24.95 | ||||||
|
| |||||||
Class C: | ||||||||
Net assets, at value | $ 46,507,938 | $ 49,619,977 | ||||||
|
| |||||||
Shares outstanding | 348,357 | 2,174,155 | ||||||
|
| |||||||
Net asset value and maximum offering price per sharea | $133.51 | $22.82 | ||||||
|
| |||||||
Class R6: | ||||||||
Net assets, at value | $ 6,164,398 | $ 15,626,986 | ||||||
|
| |||||||
Shares outstanding | 42,860 | 619,736 | ||||||
|
| |||||||
Net asset value and maximum offering price per share | $143.83 | $25.22 | ||||||
|
| |||||||
Advisor Class: | ||||||||
Net assets, at value | $153,873,846 | $ 62,639,100 | ||||||
|
| |||||||
Shares outstanding | 1,079,360 | 2,485,694 | ||||||
|
| |||||||
Net asset value and maximum offering price per share | $142.56 | $25.20 | ||||||
|
| |||||||
aRedemption price is equal to net asset value less contingent deferred sales charges, if applicable.
franklintempleton.com | The accompanying notes are an integral part of these financial statements. | Annual Report | 33 | ||
FRANKLIN STRATEGIC SERIES
FINANCIAL STATEMENTS
Statements of Operations
for the year ended April 30, 2019
Franklin
| Franklin Natural
| |||||||
| ||||||||
Investment income: | ||||||||
Dividends: (net of foreign taxes)* | ||||||||
Unaffiliated issuers | $ 2,817,526 | $ 9,643,674 | ||||||
Non-controlled affiliates (Note 3f) | 625,895 | 98,998 | ||||||
Interest: | ||||||||
Unaffiliated issuers | 5,958 | — | ||||||
Income from securities loaned: | ||||||||
Unaffiliated issuers (net of fees and rebates) | 398,001 | 45,857 | ||||||
Non-controlled affiliates (Note 3f) | 402,641 | 50,493 | ||||||
|
| |||||||
Total investment income | 4,250,021 | 9,839,022 | ||||||
|
| |||||||
Expenses: | ||||||||
Management fees (Note 3a) | 7,552,466 | 2,226,164 | ||||||
Distribution fees: (Note 3c) | ||||||||
Class A | 2,596,536 | 720,496 | ||||||
Class C | 551,321 | 644,452 | ||||||
Transfer agent fees: (Note 3e) | ||||||||
Class A | 1,539,586 | 638,911 | ||||||
Class C | 82,016 | 143,206 | ||||||
Class R6 | 5,697 | 9,376 | ||||||
Advisor Class | 267,073 | 154,590 | ||||||
Custodian fees (Note 4) | 22,568 | 10,985 | ||||||
Reports to shareholders | 141,605 | 89,468 | ||||||
Registration and filing fees | 88,834 | 89,453 | ||||||
Professional fees | 59,398 | 50,029 | ||||||
Trustees’ fees and expenses | 19,398 | 6,740 | ||||||
Other | 34,305 | 24,945 | ||||||
|
| |||||||
Total expenses | 12,960,803 | 4,808,815 | ||||||
Expense reductions (Note 4) | (973 | ) | (504 | ) | ||||
Expenses waived/paid by affiliates (Note 3f and 3g) | (224,405 | ) | (37,935 | ) | ||||
|
| |||||||
Net expenses | 12,735,425 | 4,770,376 | ||||||
|
| |||||||
Net investment income (loss) | (8,485,404 | ) | 5,068,646 | |||||
|
| |||||||
Realized and unrealized gains (losses): | ||||||||
Net realized gain (loss) from: | ||||||||
Investments: | ||||||||
Unaffiliated issuers | 59,100,885 | 3,219,999 | ||||||
Foreign currency transactions | — | (432 | ) | |||||
|
| |||||||
Net realized gain (loss) | 59,100,885 | 3,219,567 | ||||||
|
| |||||||
Net change in unrealized appreciation (depreciation) on: | ||||||||
Investments: | ||||||||
Unaffiliated issuers | (69,695,618 | ) | (76,621,703 | ) | ||||
Translation of other assets and liabilities | — | 7,499 | ||||||
|
| |||||||
Net change in unrealized appreciation (depreciation) | (69,695,618 | ) | (76,614,204 | ) | ||||
|
| |||||||
Net realized and unrealized gain (loss) | (10,594,733 | ) | (73,394,637 | ) | ||||
|
| |||||||
Net increase (decrease) in net assets resulting from operations | $(19,080,137 | ) | $(68,325,991 | ) | ||||
*Foreign taxes withheld on dividends | $ — | $ 379,718 | ||||||
34 | Annual Report | The accompanying notes are an integral part of these financial statements. | franklintempleton.com | ||
FRANKLIN STRATEGIC SERIES
FINANCIAL STATEMENTS
Statements of Changes in Net Assets
| Franklin Biotechnology | Franklin Natural | |||||||||||||||
| Discovery Fund | Resources Fund | |||||||||||||||
|
| |||||||||||||||
| Year Ended April 30, | Year Ended April 30, | |||||||||||||||
|
| |||||||||||||||
| 2019 | 2018 | 2019 | 2018 | |||||||||||||
| ||||||||||||||||
Increase (decrease) in net assets: | ||||||||||||||||
Operations: | ||||||||||||||||
Net investment income (loss) | $ | (8,485,404 | ) | $ | (7,400,442 | ) | $ | 5,068,646 | $ | 7,807,287 | ||||||
Net realized gain (loss) | 59,100,885 | 54,362,893 | 3,219,567 | (12,640,009 | ) | |||||||||||
Net change in unrealized appreciation (depreciation) | (69,695,618 | ) | (22,596,221 | ) | (76,614,204 | ) | 63,514,023 | |||||||||
|
| |||||||||||||||
Net increase (decrease) in net assets resulting from operations | (19,080,137 | ) | 24,366,230 | (68,325,991 | ) | 58,681,301 | ||||||||||
|
| |||||||||||||||
Distributions to shareholders: (Note 1e) | ||||||||||||||||
Class A | (31,140,117 | ) | (27,114,653 | ) | (5,445,964 | ) | (4,171,579 | ) | ||||||||
Class C | (1,654,793 | ) | (1,417,301 | ) | (929,534 | ) | — | |||||||||
Class R6 | (198,908 | ) | (199,407 | ) | (313,292 | ) | (26,407 | ) | ||||||||
Advisor Class | (5,381,467 | ) | (4,208,617 | ) | (1,289,908 | ) | (1,426,444 | ) | ||||||||
|
| |||||||||||||||
Total distributions to shareholders | (38,375,285 | ) | (32,939,978 | ) | (7,978,698 | ) | (5,624,430 | ) | ||||||||
|
| |||||||||||||||
Capital share transactions: (Note 2) | ||||||||||||||||
Class A | (112,026,697 | ) | (88,622,240 | ) | (46,670,690 | ) | (89,055,299 | ) | ||||||||
Class C | (9,069,507 | ) | 5,540,101 | (22,834,504 | ) | (22,010,700 | ) | |||||||||
Class R6 | (1,820,119 | ) | (555,474 | ) | 2,159,944 | 14,973,208 | ||||||||||
Advisor Class | (17,313,109 | ) | 21,646,333 | (3,919,165 | ) | (23,972,393 | ) | |||||||||
|
| |||||||||||||||
Total capital share transactions | (140,229,432 | ) | (61,991,280 | ) | (71,264,415 | ) | (120,065,184 | ) | ||||||||
|
| |||||||||||||||
Net increase (decrease) in net assets | (197,684,854 | ) | (70,565,028 | ) | (147,569,104 | ) | (67,008,313 | ) | ||||||||
Net assets: | ||||||||||||||||
Beginning of year | 1,328,842,224 | 1,399,407,252 | 522,817,612 | 589,825,925 | ||||||||||||
|
| |||||||||||||||
End of year (Note 1e) | $ | 1,131,157,370 | $ | 1,328,842,224 | $ | 375,248,508 | $ | 522,817,612 | ||||||||
|
| |||||||||||||||
franklintempleton.com | The accompanying notes are an integral part of these financial statements. | Annual Report | 35 | ||
FRANKLIN STRATEGIC SERIES
Notes to Financial Statements
1. Organization and Significant Accounting Policies
Franklin Strategic Series (Trust) is registered under the Investment Company Act of 1940 (1940 Act) as an open-end management investment company, consisting of eight separate funds, two of which are included in this report (Funds) and applies the specialized accounting and reporting guidance in U.S. Generally Accepted Accounting Principles (U.S. GAAP). The Funds offer four classes of shares: Class A, Class C, Class R6, and Advisor Class. Beginning on October 19, 2018, Class C shares automatically convert to Class A shares after they have been held for 10 years. Each class of shares may differ by its initial sales load, contingent deferred sales charges, voting rights on matters affecting a single class, its exchange privilege and fees due to differing arrangements for distribution and transfer agent fees.
The following summarizes the Funds’ significant accounting policies.
a. Financial Instrument Valuation
The Funds’ investments in financial instruments are carried at fair value daily. Fair value is the price that would be received to sell an asset or paid to transfer a liability in an orderly transaction between market participants on the measurement date. The Funds calculate the net asset value (NAV) per share each business day as of 4 p.m. Eastern time or the regularly scheduled close of the New York Stock Exchange (NYSE), whichever is earlier. Under compliance policies and procedures approved by the Trust’s Board of Trustees (the Board), the Funds’ administrator has responsibility for oversight of valuation, including leading the cross-functional Valuation Committee (VC). The Funds may utilize independent pricing services, quotations from securities and financial instrument dealers, and other market sources to determine fair value.
Equity securities listed on an exchange or on the NASDAQ National Market System are valued at the last quoted sale price or the official closing price of the day, respectively. Foreign equity securities are valued as of the close of trading on the foreign stock exchange on which the security is primarily traded, or as of 4 p.m. Eastern time. The value is then converted into its U.S. dollar equivalent at the foreign exchange rate in effect at 4 p.m. Eastern time on the day that the value of the security is determined. Over-the-counter(OTC) securities are valued within the range of the most recent quoted bid and ask prices. Securities that trade in multiple markets or on multiple
exchanges are valued according to the broadest and most representative market. Certain equity securities are valued based upon fundamental characteristics or relationships to similar securities.
Investments in open-end mutual funds are valued at the closing NAV.
The Funds have procedures to determine the fair value of financial instruments for which market prices are not reliable or readily available. Under these procedures, the Funds primarily employ a market-based approach which may use related or comparable assets or liabilities, recent transactions, market multiples, book values, and other relevant information for the investment to determine the fair value of the investment. An income-based valuation approach may also be used in which the anticipated future cash flows of the investment are discounted to calculate fair value. Discounts may also be applied due to the nature or duration of any restrictions on the disposition of the investments. Due to the inherent uncertainty of valuations of such investments, the fair values may differ significantly from the values that would have been used had an active market existed.
Trading in securities on foreign securities stock exchanges and OTC markets may be completed before 4 p.m. Eastern time. In addition, trading in certain foreign markets may not take place on every Funds’ business day. Occasionally, events occur between the time at which trading in a foreign security is completed and 4 p.m. Eastern time that might call into question the reliability of the value of a portfolio security held by the Fund. As a result, differences may arise between the value of the Funds’ portfolio securities as determined at the foreign market close and the latest indications of value at 4 p.m. Eastern time. In order to minimize the potential for these differences, the VC monitors price movements following the close of trading in foreign stock markets through a series of country specific market proxies (such as baskets of American Depositary Receipts, futures contracts and exchange traded funds). These price movements are measured against established trigger thresholds for each specific market proxy to assist in determining if an event has occurred that may call into question the reliability of the values of the foreign securities held by the Funds. If such an event occurs, the securities may be valued using fair value procedures, which may include the use of independent pricing services.
36 | Annual Report | franklintempleton.com | ||
FRANKLIN STRATEGIC SERIES
NOTES TO FINANCIAL STATEMENTS
When the last day of the reporting period is a non-business day, certain foreign markets may be open on those days that the Funds’ NAV is not calculated, which could result in differences between the value of the Funds’ portfolio securities on the last business day and the last calendar day of the reporting period. Any significant security valuation changes due to an open foreign market are adjusted and reflected by the Funds for financial reporting purposes.
b. Foreign Currency Translation
Portfolio securities and other assets and liabilities denominated in foreign currencies are translated into U.S. dollars based on the exchange rate of such currencies against U.S. dollars on the date of valuation. The Funds may enter into foreign currency exchange contracts to facilitate transactions denominated in a foreign currency. Purchases and sales of securities, income and expense items denominated in foreign currencies are translated into U.S. dollars at the exchange rate in effect on the transaction date. Portfolio securities and assets and liabilities denominated in foreign currencies contain risks that those currencies will decline in value relative to the U.S. dollar. Occasionally, events may impact the availability or reliability of foreign exchange rates used to convert the U.S. dollar equivalent value. If such an event occurs, the foreign exchange rate will be valued at fair value using procedures established and approved by the Board.
The Funds do not separately report the effect of changes in foreign exchange rates from changes in market prices on securities held. Such changes are included in net realized and unrealized gain or loss from investments in the Statements of Operations.
Realized foreign exchange gains or losses arise from sales of foreign currencies, currency gains or losses realized between the trade and settlement dates on securities transactions and the difference between the recorded amounts of dividends, interest, and foreign withholding taxes and the U.S. dollar equivalent of the amounts actually received or paid. Net unrealized foreign exchange gains and losses arise from changes in foreign exchange rates on foreign denominated assets and liabilities other than investments in securities held at the end of the reporting period.
c. Securities Lending
Certain or all Funds participate in an agency based securities lending program to earn additional income. The Fund receives cash collateral against the loaned securities in an amount equal
to at least 102% of the fair value of the loaned securities. Collateral is maintained over the life of the loan in an amount not less than 100% of the fair value of loaned securities, as determined at the close of Fund business each day; any additional collateral required due to changes in security values is delivered to the Fund on the next business day. The collateral is deposited into a joint cash account with other funds and is used to invest in a money market fund managed by Franklin Advisers, Inc., an affiliate of the Funds. The Fund may receive income from the investment of cash collateral, in addition to lending fees and rebates paid by the borrower. Income from securities loaned, net of fees paid to the securities lending agent and/or third-party vendor, is reported separately in the Statements of Operations. The Fund bears the market risk with respect to the collateral investment, securities loaned, and the risk that the agent may default on its obligations to the Fund. If the borrower defaults on its obligation to return the securities loaned, the Fund has the right to repurchase the securities in the open market using the collateral received. The securities lending agent has agreed to indemnify the Fund in the event of default by a third party borrower. At April 30, 2019, the Franklin Natural Resources Fund had no securities on loan.
d. Income and Deferred Taxes
It is each Fund’s policy to qualify as a regulated investment company under the Internal Revenue Code. Each Fund intends to distribute to shareholders substantially all of its taxable income and net realized gains to relieve it from federal income and excise taxes. As a result, no provision for U.S. federal income taxes is required.
The Funds may be subject to foreign taxation related to income received, capital gains on the sale of securities and certain foreign currency transactions in the foreign jurisdictions in which the Funds invest. Foreign taxes, if any, are recorded based on the tax regulations and rates that exist in the foreign markets in which the Funds invest. When a capital gain tax is determined to apply, certain or all Funds record an estimated deferred tax liability in an amount that would be payable if the securities were disposed of on the valuation date.
Each Fund may recognize an income tax liability related to its uncertain tax positions under U.S. GAAP when the uncertain tax position has a less than 50% probability that it will be sustained upon examination by the tax authorities based on its technical merits. As of April 30, 2019, each Fund has determined that no tax liability is required in its financial
franklintempleton.com | Annual Report | 37 | ||
FRANKLIN STRATEGIC SERIES
NOTES TO FINANCIAL STATEMENTS
1. Organization and Significant Accounting
Policies(continued)
d. Income and Deferred Taxes(continued)
statements related to uncertain tax positions for any open tax years (or expected to be taken in future tax years). Open tax years are those that remain subject to examination and are based on the statute of limitations in each jurisdiction in which the Fund invests.
e. Security Transactions, Investment Income, Expenses and Distributions
Security transactions are accounted for on trade date. Realized gains and losses on security transactions are determined on a specific identification basis. Interest income and estimated expenses are accrued daily. Dividend income is recorded on the ex-dividend date except for certain dividends from securities where the dividend rate is not available. In such cases, the dividend is recorded as soon as the information is received by the Funds. Distributions to shareholders are recorded on the ex-dividend date. Distributable earnings are determined according to income tax regulations (tax basis) and may differ from earnings recorded in accordance with U.S. GAAP. These differences may be permanent or temporary. Permanent differences are reclassified among capital accounts to reflect their tax character. These reclassifications have no impact on net assets or the results of operations. Temporary differences are not reclassified, as they may reverse in subsequent periods.*
Common expenses incurred by the Trust are allocated among the Funds based on the ratio of net assets of each Fund to the combined net assets of the Trust or based on the ratio of number
of shareholders of each Fund to the combined number of shareholders of the Trust. Fund specific expenses are charged directly to the Fund that incurred the expense.
Realized and unrealized gains and losses and net investment income, excluding class specific expenses, are allocated daily to each class of shares based upon the relative proportion of net assets of each class. Differences in per share distributions by class are generally due to differences in class specific expenses.
f. Accounting Estimates
The preparation of financial statements in accordance with U.S. GAAP requires management to make estimates and assumptions that affect the reported amounts of assets and liabilities at the date of the financial statements and the amounts of income and expenses during the reporting period. Actual results could differ from those estimates.
g. Guarantees and Indemnifications
Under the Trust’s organizational documents, its officers and trustees are indemnified by the Trust against certain liabilities arising out of the performance of their duties to the Trust. Additionally, in the normal course of business, the Trust, on behalf of the Funds, enters into contracts with service providers that contain general indemnification clauses. The Trust’s maximum exposure under these arrangements is unknown as this would involve future claims that may be made against the Trust that have not yet occurred. Currently, the Trust expects the risk of loss to be remote.
*Effective during the current reporting period, it is no longer required to present certain line items in the Statements of Changes in Net Assets. The below prior period amounts affected by this change are shown as they were in the prior year Statements of Changes in Net Assets.
38 | Annual Report | franklintempleton.com | ||
FRANKLIN STRATEGIC SERIES
NOTES TO FINANCIAL STATEMENTS
For the year ended April 30, 2018, distributions to shareholders were as follows:
| Franklin Biotechnology Discovery Fund | Franklin Natural Resources Fund | |||||||
Distributions from net investment income: | ||||||||
Class A | $ — | $(4,171,579 | ) | |||||
Class R6 | — | (26,407 | ) | |||||
Advisor Class | — | (1,426,444 | ) | |||||
Distributions from net realized gains: | ||||||||
Class A | (27,114,653 | ) | — | |||||
Class C | (1,417,301 | ) | — | |||||
Class R6 | (199,407 | ) | — | |||||
Advisor Class | (4,208,617 | ) | — | |||||
For the year ended April 30, 2018, undistributed net investment income(loss) included in net assets were as follows:
| Fund | Undistributed net investment income (loss) | |||
Franklin Biotechnology Discovery Fund | $(8,318,907 | ) | ||
Franklin Natural Resources Fund | $4,345,619 | |||
2. Shares of Beneficial Interest
At April 30, 2019, there were an unlimited number of shares authorized (without par value). Transactions in the Funds’ shares were as follows:
| Franklin Biotechnology | Franklin Natural | |||||||||||||||
| Discovery Fund | Resources Fund | |||||||||||||||
| Shares | Amount | Shares | Amount | |||||||||||||
Class A Shares: | ||||||||||||||||
Year ended April 30, 2019 | ||||||||||||||||
Shares solda | 721,089 | $ | 106,972,540 | 1,281,103 | $ | 32,532,375 | ||||||||||
Shares issued in reinvestment of distributions | 232,391 | 29,692,637 | 256,254 | 5,342,901 | ||||||||||||
Shares redeemed | (1,697,525 | ) | (248,691,874 | ) | (3,371,926 | ) | (84,545,966) | |||||||||
|
| |||||||||||||||
Net increase (decrease) | (744,045 | ) | $ | (112,026,697 | ) | (1,834,569 | ) | $ | (46,670,690) | |||||||
|
| |||||||||||||||
Year ended April 30, 2018 | ||||||||||||||||
Shares sold | 1,057,237 | $ | 160,996,348 | 1,583,808 | $ | 40,230,459 | ||||||||||
Shares issued in reinvestment of distributions | 175,206 | 25,819,984 | 164,031 | 4,090,940 | ||||||||||||
Shares redeemed | (1,821,677 | ) | (275,438,572 | ) | (5,298,641 | ) | (133,376,698) | |||||||||
|
| |||||||||||||||
Net increase (decrease) | (589,234 | ) | $ | (88,622,240 | ) | (3,550,802 | ) | $ | (89,055,299) | |||||||
|
| |||||||||||||||
Class C Shares: | ||||||||||||||||
Year ended April 30, 2019 | ||||||||||||||||
Shares sold | 72,561 | $ | 10,442,091 | 324,962 | $ | 7,969,298 | ||||||||||
Shares issued in reinvestment of distributions | 13,364 | 1,646,340 | 45,232 | 915,493 | ||||||||||||
Shares redeemeda | (149,801 | ) | (21,157,938 | ) | (1,280,715 | ) | (31,719,295) | |||||||||
|
| |||||||||||||||
Net increase (decrease) | (63,876 | ) | $ | (9,069,507 | ) | (910,521 | ) | $ | (22,834,504) | |||||||
|
| |||||||||||||||
Year ended April 30, 2018 | ||||||||||||||||
Shares sold | 142,042 | $ | 21,098,664 | 388,443 | $ | 9,522,328 | ||||||||||
Shares issued in reinvestment of distributions | 9,827 | 1,408,701 | — | — | ||||||||||||
Shares redeemed | (114,253 | ) | (16,967,264 | ) | (1,292,254 | ) | (31,533,028) | |||||||||
|
| |||||||||||||||
Net increase (decrease) | 37,616 | $ | 5,540,101 | (903,811 | ) | $ | (22,010,700) | |||||||||
|
| |||||||||||||||
franklintempleton.com | Annual Report | 39 | ||
FRANKLIN STRATEGIC SERIES
NOTES TO FINANCIAL STATEMENTS
2. Shares of Beneficial Interest(continued)
| Franklin Biotechnology | Franklin Natural | |||||||||||||||
| Discovery Fund | Resources Fund | |||||||||||||||
| Shares | Amount | Shares | Amount | |||||||||||||
Class R6 Shares: | ||||||||||||||||
Year ended April 30, 2019 | ||||||||||||||||
Shares sold | 14,632 | $ | 2,320,850 | 331,245 | $ | 8,552,092 | ||||||||||
Shares issued in reinvestment of distributions | 1,505 | 198,908 | 14,066 | 313,109 | ||||||||||||
Shares redeemed | (28,420 | ) | (4,339,877 | ) | (258,140 | ) | (6,705,257) | |||||||||
|
| |||||||||||||||
Net increase (decrease) | (12,283 | ) | $ | (1,820,119 | ) | 87,171 | $ | 2,159,944 | ||||||||
|
| |||||||||||||||
Year ended April 30, 2018 | ||||||||||||||||
Shares sold | 18,257 | $ | 2,841,320 | 544,711 | $ | 15,552,699 | ||||||||||
Shares issued in reinvestment of distributions | 1,314 | 199,406 | 995 | 26,408 | ||||||||||||
Shares redeemed | (23,294 | ) | (3,596,200 | ) | (21,257 | ) | (605,899) | |||||||||
|
| |||||||||||||||
Net increase (decrease) | (3,723 | ) | $ | (555,474 | ) | 524,449 | $ | 14,973,208 | ||||||||
|
| |||||||||||||||
Advisor Class Shares: | ||||||||||||||||
Year ended April 30, 2019 | ||||||||||||||||
Shares sold | 338,870 | $ | 52,338,943 | 757,766 | $ | 19,842,560 | ||||||||||
Shares issued in reinvestment of distributions | 36,842 | 4,828,793 | 57,021 | 1,269,854 | ||||||||||||
Shares redeemed | (501,477 | ) | (74,480,845 | ) | (961,445 | ) | (25,031,579) | |||||||||
|
| |||||||||||||||
Net increase (decrease) | (125,765 | ) | $ | (17,313,109 | ) | (146,658 | ) | $ | (3,919,165) | |||||||
|
| |||||||||||||||
Year ended April 30, 2018 | ||||||||||||||||
Shares sold | 444,625 | $ | 68,532,853 | 1,055,556 | $ | 28,419,344 | ||||||||||
Shares issued in reinvestment of distributions | 24,690 | 3,720,072 | 52,254 | 1,387,336 | ||||||||||||
Shares redeemed | (328,722 | ) | (50,606,592 | ) | (1,984,254 | ) | (53,779,073) | |||||||||
|
| |||||||||||||||
Net increase (decrease) | 140,593 | $ | 21,646,333 | (876,444 | ) | $ | (23,972,393) | |||||||||
|
| |||||||||||||||
aMay include a portion of Class C shares that were automatically converted to Class A.
3. Transactions with Affiliates
Franklin Resources, Inc. is the holding company for various subsidiaries that together are referred to as Franklin Templeton. Certain officers and trustees of the Trust are also officers and/or directors of the following subsidiaries:
| Subsidiary | Affiliation | |||
| Franklin Advisers, Inc. (Advisers) | Investment manager | |||
| Franklin Templeton Services, LLC (FT Services) | Administrative manager | |||
| Franklin Templeton Distributors, Inc. (Distributors) | Principal underwriter | |||
| Franklin Templeton Investor Services, LLC (Investor Services) | Transfer agent |
40 | Annual Report | franklintempleton.com | ||
FRANKLIN STRATEGIC SERIES
NOTES TO FINANCIAL STATEMENTS
a. Management Fees
Franklin Biotechnology Discovery Fund pays an investment management fee to Advisers based on the average daily net assets of the Fund as follows:
| Annualized Fee Rate | Net Assets | |
| 0.775% | Up to and including $100 million | |
| 0.650% | Over $100 million, up to and including $200 million | |
| 0.635% | Over $200 million, up to and including $250 million | |
| 0.585% | Over $250 million, up to and including $700 million | |
| 0.550% | Over $700 million, up to and including $1.2 billion | |
| 0.525% | Over $1.2 billion, up to and including $7.5 billion | |
| 0.515% | Over $7.5 billion, up to and including $10 billion | |
| 0.505% | Over $10 billion, up to and including $12.5 billion | |
| 0.495% | Over $12.5 billion, up to and including $15 billion | |
| 0.475% | in excess of $15 billion |
Franklin Natural Resources Fund pays an investment management fee to Advisers based on the average daily net assets of the Fund as follows:
| Annualized Fee Rate | Net Assets | |
| 0.625% | Up to and including $100 million | |
| 0.500% | Over $100 million, up to and including $250 million | |
| 0.450% | Over $250 million, up to and including $7.5 billion | |
| 0.440% | Over $7.5 billion, up to and including $10 billion | |
| 0.430% | Over $10 billion, up to and including $12.5 billion | |
| 0.420% | Over $12.5 billion, up to and including $15 billion | |
| 0.400% | In excess of $15 billion |
For the year ended April 30, 2019, each Fund’s gross effective investment management fee rate based on average daily net assets was as follows:
Franklin Biotechnology Discovery Fund | Franklin Natural Resources Fund | |
0.589% | 0.507% |
b. Administrative Fees
Under an agreement with Advisers, FT Services provides administrative services to the Funds. The fee is paid by Advisers based on Funds’ average daily net assets, and is not an additional expense of the Funds.
c. Distribution Fees
The Board has adopted distribution plans for each share class, with the exception of Class R6 and Advisor Class shares, pursuant to Rule 12b-1 under the 1940 Act. Under the Funds’ Class A reimbursement distribution plans, the Funds reimburse Distributors for costs incurred in connection with the servicing, sale and distribution of each Fund’s shares up to the maximum annual plan rate for each class. Under the Class A reimbursement distribution plans, costs exceeding the maximum for the current plan year cannot be reimbursed in subsequent periods. In addition, under the Funds’ Class C compensation distribution plans, the Funds pay Distributors
franklintempleton.com | Annual Report | 41 | ||
FRANKLIN STRATEGIC SERIES
NOTES TO FINANCIAL STATEMENTS
3. Transactions with Affiliates(continued)
c. Distribution Fees(continued)
for costs incurred in connection with the servicing, sale and distribution of each Fund’s shares up to the maximum annual plan rate for each class. The plan year, for purposes of monitoring compliance with the maximum annual plan rates, is February 1 through January 31 for each Fund.
The maximum annual plan rates, based on the average daily net assets, for each class, are as follows:
| Franklin Biotechnology Discovery Fund | Franklin Natural Resources Fund | |||||||
Reimbursement Plans: | ||||||||
Class A | 0.35 | % | 0.35 | % | ||||
Class C | 1.00 | % | 1.00 | % | ||||
The Board has set the current rate at 0.25% per year for Class A shares until further notice and approval by the Board.
d. Sales Charges/Underwriting Agreements
Front-end sales charges and contingent deferred sales charges (CDSC) do not represent expenses of the Funds. These charges are deducted from the proceeds of sales of fund shares prior to investment or from redemption proceeds prior to remittance, as applicable. Distributors has advised the Funds of the following commission transactions related to the sales and redemptions of the Funds’ shares for the year:
| Franklin Biotechnology Discovery Fund | Franklin Natural Resources Fund | |||||||
Sales charges retained net of commissions paid to unaffiliated brokers/dealers | $184,267 | $36,839 | ||||||
CDSC retained | $ 52,257 | $ 3,183 | ||||||
Effective September 10, 2018, the Board approved changes to certain front-end sales charges and dealer commissions on Class A shares. Further details are disclosed in the Funds’ Prospectus.
e. Transfer Agent Fees
Each class of shares pays transfer agent fees to Investor Services for its performance of shareholder servicing obligations. The fees are based on an annualized asset based fee of 0.02% plus a transaction based fee. In addition, each class reimburses Investor Services for out of pocket expenses incurred and, except for Class R6, reimburses shareholder servicing fees paid to third parties. These fees are allocated daily based upon their relative proportion of such classes’ aggregate net assets. Class R6 pays Investor Services transfer agent fees specific to that class.
For the year ended April 30, 2019, the Funds paid transfer agent fees as noted in the Statements of Operations of which the following amounts were retained by Investor Services:
| Franklin Biotechnology Discovery Fund | Franklin Natural Resources Fund | |||||||
Transfer agent fees | $736,649 | $398,953 | ||||||
42 | Annual Report | franklintempleton.com | ||
FRANKLIN STRATEGIC SERIES
NOTES TO FINANCIAL STATEMENTS
f. Investments in Affiliated Management Investment Companies
Certain or all Funds invest in one or more affiliated management investment companies for purposes other than exercising a controlling influence over the management or policies. Management fees paid by the Funds are waived on assets invested in the affiliated management investment companies, as noted in the Statements of Operations, in an amount not to exceed the management and administrative fees paid directly or indirectly by each affiliate. During the year ended April 30, 2019, investments in affiliated management investment companies were as follows:
| Number of Shares Held at Beginning of Year | Gross Additions | Gross Reductions | Number of Held at End | Value at End of Year | Investment Income | Realized Gain (Loss) | Net Change in Unrealized Appreciation (Depreciation) | |||||||||||||||||||||||||
| Franklin Biotechnology Discovery Fund Non-Controlled Affiliates | ||||||||||||||||||||||||||||||||
| Dividends | ||||||||||||||||||||||||||||||||
Institutional Fiduciary Trust Money Market Portfolio, 2.10% | 48,671,129 | 304,094,093 | (325,371,346 | ) | 27,393,876 | $ | 27,393,876 | $ 625,895 | $ — | $ — | ||||||||||||||||||||||
| | Income from securities loaned |
| ||||||||||||||||||||||||||||||
Institutional Fiduciary Trust Money Market Portfolio, 2.10% | 31,355,415 | 223,576,934 | (227,104,674 | ) | 27,827,675 | 27,827,675 | 402,641 | — | — | |||||||||||||||||||||||
|
| |||||||||||||||||||||||||||||||
Total Affiliated Securities | $ | 55,221,551 | $ 1,028,536 | $ — | $ — | |||||||||||||||||||||||||||
|
| |||||||||||||||||||||||||||||||
| Franklin Natural Resources Fund Non-Controlled Affiliates | ||||||||||||||||||||||||||||||||
| Dividends | ||||||||||||||||||||||||||||||||
Institutional Fiduciary Trust Money Market Portfolio, 2.10% | 11,815,239 | 85,287,366 | (96,314,385 | ) | 788,220 | $ | 788,220 | $ 98,998 | $ — | $ — | ||||||||||||||||||||||
| | Income from securities loaned |
| ||||||||||||||||||||||||||||||
Institutional Fiduciary Trust Money Market Portfolio, 2.10% | 5,473,225 | 59,545,277 | (65,018,502 | ) | — | — | 50,493 | — | — | |||||||||||||||||||||||
|
| |||||||||||||||||||||||||||||||
Total Affiliated Securities | $ | 788,220 | $ 149,491 | $ — | $ — | |||||||||||||||||||||||||||
|
| |||||||||||||||||||||||||||||||
g. Waiver and Expense Reimbursements
Investor Services has contractually agreed in advance to waive or limit its fees so that the Class R6 transfer agent fees do not exceed 0.03% based on the average net assets of the class until August 31, 2019.
4. Expense Offset Arrangement
The Funds have entered into an arrangement with their custodian whereby credits realized as a result of uninvested cash balances are used to reduce a portion of the Funds’ custodian expenses. During the year ended April 30, 2019, the custodian fees were reduced as noted in the Statements of Operations.
5. Income Taxes
For tax purposes, capital losses may be carried over to offset future capital gains.
franklintempleton.com | Annual Report | 43 | ||
FRANKLIN STRATEGIC SERIES
NOTES TO FINANCIAL STATEMENTS
5. Income Taxes(continued)
At April 30, 2019, the capital loss carryforwards were as follows:
| Franklin Natural Resources Fund | ||||
Capital loss carryforwards not subject to expiration: | ||||
Short term | $ 10,086,801 | |||
Long term | 135,396,222 | |||
Total capital loss carryforwards | $145,483,023 | |||
For tax purposes, the Fund may elect to defer any portion of a post-October capital loss or late-year ordinary loss to the first day of the following fiscal year. At April 30, 2019, Franklin Biotechnology Discovery Fund deferred late-year ordinary losses of $2,803,664.
The tax character of distributions paid during the years ended April 30, 2019 and 2018, was as follows:
| Franklin Biotechnology | Franklin Natural | |||||||||||||||
| Discovery Fund | Resources Fund | |||||||||||||||
| 2019 | 2018 | 2019 | 2018 | |||||||||||||
Distributions paid from: | ||||||||||||||||
Ordinary income | $ | 19,760,629 | $ | 9,966,331 | $ | 7,978,698 | $ | 5,624,430 | ||||||||
Long term capital gain | 18,614,656 | 22,973,647 | — | — | ||||||||||||
| $ | 38,375,285 | $ | 32,939,978 | $ | 7,978,698 | $ | 5,624,430 | |||||||||
At April 30, 2019, the cost of investments, net unrealized appreciation (depreciation), undistributed ordinary income and undistributed long term capital gains for income tax purposes were as follows:
| Franklin Biotechnology Discovery Fund | Franklin Natural Resources Fund | |||||||
Cost of investments | $749,005,156 | $344,971,645 | ||||||
Unrealized appreciation | $469,365,854 | $ 82,049,236 | ||||||
Unrealized depreciation | (58,097,732 | ) | (55,291,009 | ) | ||||
Net unrealized appreciation (depreciation) | $411,268,122 | $ 26,758,227 | ||||||
Distributable earnings: | ||||||||
Undistributed ordinary income | $ — | $ 4,122,622 | ||||||
Undistributed long term capital gains | 55,405,644 | — | ||||||
Total distributable earnings | $ 55,405,644 | $ 4,122,622 | ||||||
Differences between income and/or capital gains as determined on a book basis and a tax basis are primarily due to differing treatments of passive foreign investment company shares and wash sales.
44 | Annual Report | franklintempleton.com | ||
FRANKLIN STRATEGIC SERIES
NOTES TO FINANCIAL STATEMENTS
6. Investment Transactions
Purchases and sales of investments (excluding short term securities) for the year ended April 30, 2019, were as follows:
| Franklin Biotechnology Discovery Fund | Franklin Natural Resources Fund | |||||||
Purchases | $355,829,444 | $128,911,999 | ||||||
Sales | $521,623,188 | $195,822,705 | ||||||
At April 30, 2019, in connection with securities lending transactions, certain or all Funds loaned investments and received cash collateral as follows:
Franklin Fund | ||||
Securities lending transactionsa: | ||||
Equity Investmentsb | $27,827,675 | |||
aThe agreements can be terminated at any time.
bThe gross amount of recognized liability for such transactions is included in payable upon return of securities loaned in the Statements of Assets and Liabilities.
7. Concentration of Risk
Investing in foreign securities may include certain risks and considerations not typically associated with investing in U.S. securities, such as fluctuating currency values and changing local and regional economic, political and social conditions, which may result in greater market volatility. Current political and financial uncertainty surrounding the European Union may increase market volatility and the economic risk of investing in securities in Europe. In addition, certain foreign securities may not be as liquid as U.S. securities.
8. Restricted Securities
Certain or all Funds invest in securities that are restricted under the Securities Act of 1933 (1933 Act). Restricted securities are often purchased in private placement transactions, and cannot be sold without prior registration unless the sale is pursuant to an exemption under the 1933 Act. Disposal of these securities may require greater effort and expense, and prompt sale at an acceptable price may be difficult. The Funds may have registration rights for restricted securities. The issuer generally incurs all registration costs.
At April 30, 2019, investments in restricted securities, excluding securities exempt from registration under the 1933 Act deemed to be liquid, were as follows:
| Shares | Issuer | Acquisition Date | Cost | Value | ||||||||||||
Franklin Biotechnology Discovery Fund | ||||||||||||||||
| 80,195 | Intarcia Therapeutics Inc., DD | 3/26/14 | $ | 2,597,516 | $ | 642,536 | ||||||||||
| 1,330,687 | Metacrine Inc., pfd., C | 6/04/18 | 2,821,056 | 1,953,313 | ||||||||||||
| 39,954 | Molecular Templates Inc., wts., 2/28/20 | 2/12/15 | — | 17 | ||||||||||||
| 425,322 | Precision Biosciences Inc., 144A | 5/25/18 - 3/01/19 | 4,758,467 | 4,965,280 | ||||||||||||
| Total Restricted Securities(Value is 0.7% of Net Assets) | $ | 10,177,039 | $ | 7,561,146 | ||||||||||||
franklintempleton.com | Annual Report | 45 | ||
FRANKLIN STRATEGIC SERIES
NOTES TO FINANCIAL STATEMENTS
9. Credit Facility
The Funds, together with other U.S. registered and foreign investment funds (collectively, Borrowers), managed by Franklin Templeton, are borrowers in a joint syndicated senior unsecured credit facility totaling $2 billion (Global Credit Facility) which matures on February 7, 2020. This Global Credit Facility provides a source of funds to the Borrowers for temporary and emergency purposes, including the ability to meet future unanticipated or unusually large redemption requests.
Under the terms of the Global Credit Facility, the Funds shall, in addition to interest charged on any borrowings made by the Funds and other costs incurred by the Funds, pay their share of fees and expenses incurred in connection with the implementation and maintenance of the Global Credit Facility, based upon their relative share of the aggregate net assets of all of the Borrowers, including an annual commitment fee of 0.15% based upon the unused portion of the Global Credit Facility. These fees are reflected in other expenses in the Statements of Operations. During the year ended April 30, 2019, the Funds did not use the Global Credit Facility.
10. Fair Value Measurements
The Funds follow a fair value hierarchy that distinguishes between market data obtained from independent sources (observable inputs) and the Funds’ own market assumptions (unobservable inputs). These inputs are used in determining the value of the Funds’ financial instruments and are summarized in the following fair value hierarchy:
| • | Level 1 – quoted prices in active markets for identical financial instruments |
| • | Level 2 – other significant observable inputs (including quoted prices for similar financial instruments, interest rates, prepayment speed, credit risk, etc.) |
| • | Level 3 – significant unobservable inputs (including the Funds’ own assumptions in determining the fair value of financial instruments) |
The input levels are not necessarily an indication of the risk or liquidity associated with financial instruments at that level.
A summary of inputs used as of April 30, 2019, in valuing the Funds’ assets carried at fair value, is as follows:
| Level 1 | Level 2 | Level 3 | Total | |||||||||||||
Franklin Biotechnology Discovery Fund | ||||||||||||||||
Assets: | ||||||||||||||||
Investments in Securities:a | ||||||||||||||||
Equity Investments:b | ||||||||||||||||
Biotechnology | $ | 873,543,158 | $ | — | $ | 7,561,237 | $ | 881,104,395 | ||||||||
Pharmaceuticals | 165,523,986 | — | 48,679 | 165,572,665 | ||||||||||||
All Other Equity Investments | 57,376,800 | — | — | 57,376,800 | ||||||||||||
Escrows and Litigation Trusts | — | — | 997,867 | 997,867 | ||||||||||||
Short Term Investments | 55,221,551 | — | — | 55,221,551 | ||||||||||||
Total Investments in Securities | $ | 1,151,665,495 | $ | — | $ | 8,607,783 | $ | 1,160,273,278 | ||||||||
Franklin Natural Resources Fund | ||||||||||||||||
Assets: | ||||||||||||||||
Investments in Securities:a | ||||||||||||||||
Equity Investments:b | ||||||||||||||||
Diversified Metals & Mining | $ | 33,698,571 | $ | — | $ | 65,601 | $ | 33,764,172 | ||||||||
All Other Equity Investments | 337,177,480 | — | — | 337,177,480 | ||||||||||||
Short Term Investments | 788,220 | — | — | 788,220 | ||||||||||||
Total Investments in Securities | $ | 371,664,271 | $ | — | $ | 65,601 | $ | 371,729,872 | ||||||||
46 | Annual Report | franklintempleton.com | ||
FRANKLIN STRATEGIC SERIES
NOTES TO FINANCIAL STATEMENTS
aFor detailed categories, see the accompanying Statement of Investments.
bIncludes common and preferred stocks as well as other equity interests.
A reconciliation of assets in which Level 3 inputs are used in determining fair value is presented when there are significant Level 3 financial instruments at the beginning and/or end of the year.
11. Subsequent Events
The Funds have evaluated subsequent events through the issuance of the financial statements and determined that no events have occurred that require disclosure.
Abbreviations
| Selected Portfolio | ||||
ADR |
American Depositary Receipt | |||
CPO |
Certificate of Ordinary Participation (usually Mexico) | |||
franklintempleton.com | Annual Report | 47 | ||
FRANKLIN STRATEGIC SERIES
Report of Independent Registered Public Accounting Firm
To the Board of Trustees of Franklin Strategic Series and Shareholders of Franklin Biotechnology Discovery Fund and Franklin Natural Resources Fund
Opinions on the Financial Statements
We have audited the accompanying statements of assets and liabilities, including the statements of investments, of Franklin Biotechnology Discovery Fund and Franklin Natural Resources Fund (the “Funds”) as of April 30, 2019, the related statements of operations for the year ended April 30, 2019, the statements of changes in net assets for each of the two years in the period ended April 30, 2019, including the related notes, and the financial highlights for each of the five years in the period ended April, 30 2019 (collectively referred to as the “financial statements”). In our opinion, the financial statements present fairly, in all material respects, the financial position of each of the Funds as of April 30, 2019, the results of each of their operations for the year then ended, the changes in each of their net assets for each of the two years in the period ended April 30, 2019 and each of the financial highlights for each of the five years in the period ended April, 30 2019 in conformity with accounting principles generally accepted in the United States of America.
Basis for Opinions
These financial statements are the responsibility of the Funds’ management. Our responsibility is to express an opinion on the Funds’ financial statements based on our audits. We are a public accounting firm registered with the Public Company Accounting Oversight Board (United States) (PCAOB) and are required to be independent with respect to the Funds in accordance with the U.S. federal securities laws and the applicable rules and regulations of the Securities and Exchange Commission and the PCAOB.
We conducted our audits of these financial statements in accordance with the standards of the PCAOB. Those standards require that we plan and perform the audit to obtain reasonable assurance about whether the financial statements are free of material misstatement, whether due to error or fraud.
Our audits included performing procedures to assess the risks of material misstatement of the financial statements, whether due to error or fraud, and performing procedures that respond to those risks. Such procedures included examining, on a test basis, evidence regarding the amounts and disclosures in the financial statements. Our audits also included evaluating the accounting principles used and significant estimates made by management, as well as evaluating the overall presentation of the financial statements. Our procedures included confirmation of securities owned as of April 30, 2019 by correspondence with the custodian and transfer agent. We believe that our audits provide a reasonable basis for our opinions.
PricewaterhouseCoopers LLP
San Francisco, California
June 17, 2019
We have served as the auditor of one or more investment companies in the Franklin Templeton Group of Funds since 1948.
48 | Annual Report | franklintempleton.com | ||
FRANKLIN STRATEGIC SERIES
Tax Information (unaudited)
Under Section 852(b)(3)(C) of the Internal Revenue Code, Franklin Biotechnology Discovery Fund hereby reports the maximum amount allowable but no less than $18,614,656 as long term capital gain dividends for the fiscal year ended April 30, 2019.
Under Section 871(k)(2)(C) of the Internal Revenue Code, Franklin Biotechnology Discovery Fund hereby reports the maximum amount allowable but no less than $19,760,629 as short term capital gain dividends for purposes of the tax imposed under Section 871(a)(1)(A) of the Internal Revenue Code for the fiscal year ended April 30, 2019.
Under Section 854(b)(1)(A) of the Internal Revenue Code, the Funds hereby report the following percentage amounts of the ordinary income dividends as income qualifying for the dividends received deduction for the fiscal year ended April 30, 2019:
| Franklin Biotechnology Discovery Fund | Franklin Natural Resources Fund | |||||
| 14.26% | 52.84% | |||||
Under Section 854(b)(1)(B) of the Internal Revenue Code, the Funds hereby report the maximum amount allowable but no less than the following amounts as qualified dividends for purposes of the maximum rate under Section 1(h)(11) of the Internal Revenue Code for the fiscal year ended April 30, 2019:
| Franklin Biotechnology Discovery Fund | Franklin Natural Resources Fund | |||||
| $2,817,526 | $9,076,798 | |||||
Distributions, including qualified dividend income, paid during calendar year 2019 will be reported to shareholders on Form 1099-DIV by mid-February 2020. Shareholders are advised to check with their tax advisors for information on the treatment of these amounts on their individual income tax returns.
franklintempleton.com | Annual Report | 49 | ||
FRANKLIN STRATEGIC SERIES
Board Members and Officers
The name, year of birth and address of the officers and board members, as well as their affiliations, positions held with the Trust, principal occupations during at least the past five years and number of U.S. registered portfolios overseen in the Franklin Templeton fund complex, are shown below. Generally, each board member serves until that person’s successor is elected and qualified.
Independent Board Members
Name, Year of Birth and Address | Position | Length of Time Served | Number of Portfolios in Fund Complex Overseen by Board Member* | Other Directorships Held During at Least the Past 5 Years | ||||
Harris J. Ashton (1932) One Franklin Parkway San Mateo, CA 94403-1906 | Trustee | Since 1991 | 136 | Bar-S Foods (meat packing company) (1981-2010). | ||||
| Principal Occupation During at Least the Past 5 Years: | ||||||||
Director of various companies; andformerly, Director, RBC Holdings, Inc. (bank holding company) (until 2002); and President, Chief Executive Officer and Chairman of the Board, General Host Corporation (nursery and craft centers) (until 1998).
| ||||||||
Terrence J. Checki (1945) One Franklin Parkway San Mateo, CA 94403-1906 | Trustee | Since 2017 | 112 | Hess Corporation (exploration of oil and gas) (2014-present). | ||||
| Principal Occupation During at Least the Past 5 Years: | ||||||||
Member of the Council on Foreign Relations (1996-present); Member of the National Committee on U.S.-China Relations (1999-present);member of the Board of Trustees of the Economic Club of New York (2013-present); member of the Board of Trustees of the Foreign Policy Association (2005-present) and member of various other boards of trustees and advisory boards; andformerly, Executive Vice President of the Federal Reserve Bank of New York and Head of its Emerging Markets and Internal Affairs Group and Member of Management Committee (1995-2014); and Visiting Fellow at the Council on Foreign Relations (2014).
| ||||||||
Mary C. Choksi (1950) One Franklin Parkway San Mateo, CA 94403-1906 | Trustee | Since 2014 | 136 | Avis Budget Group Inc. (car rental) (2007-present), Omnicom Group Inc. (advertising and marketing communications services) (2011-present) and White Mountains Insurance Group, Ltd. (holding company) (2017-present). | ||||
| Principal Occupation During at Least the Past 5 Years: | ||||||||
Director of various companies; andformerly, Founder and Senior Advisor, Strategic Investment Group (investment management group) (2015-2017); Founding Partner and Senior Managing Director, Strategic Investment Group (1987-2015); Founding Partner and Managing Director, Emerging Markets Management LLC (investment management firm) (1987-2011); and Loan Officer/Senior Loan Officer/Senior Pension Investment Officer, World Bank Group (international financial institution) (1977-1987).
| ||||||||
Edith E. Holiday (1952) One Franklin Parkway San Mateo, CA 94403-1906 | Lead Independent Trustee | Trustee since 1998 and Lead Independent Trustee since March 2019 | 136 | Hess Corporation (exploration of oil and gas) (1993-present), Canadian National Railway (railroad) (2001-present), White Mountains Insurance Group, Ltd. (holding company) (2004-present), Santander Consumer USA Holdings, Inc. (consumer finance) (2016-present), RTI International Metals, Inc. (manufacture and distribution of titanium) (1999-2015) and H.J. Heinz Company (processed foods and allied products) (1994-2013). | ||||
| Principal Occupation During at Least the Past 5 Years: | ||||||||
| Director or Trustee of various companies and trusts; andformerly, Assistant to the President of the United States and Secretary of the Cabinet (1990-1993); General Counsel to the United States Treasury Department (1989-1990); and Counselor to the Secretary and Assistant Secretary for Public Affairs and Public Liaison–United States Treasury Department (1988-1989). | ||||||||
J. Michael Luttig (1954) One Franklin Parkway San Mateo, CA 94403-1906 | Trustee | Since 2009 | 136 | Boeing Capital Corporation (aircraft financing) (2006-2013). | ||||
| Principal Occupation During at Least the Past 5 Years: | ||||||||
| Executive Vice President, Counselor and Senior Advisor to Boeing Chairman and Board of Directors, The Boeing Company (aerospace company) (May 2019); andformerly, General Counsel and member of the Executive Council, The Boeing Company (2006-2019); Federal Appeals Court Judge, U.S. Court of Appeals for the Fourth Circuit (1991-2006). | ||||||||
50 | Annual Report | franklintempleton.com | ||
FRANKLIN STRATEGIC SERIES
Independent Board Members(continued)
Name,Year of Birth and Address | Position | Length of Time Served | Number of Portfolios in Fund Complex Overseen by Board Member* | Other Directorships Held During at Least the Past 5 Years | ||||
Larry D. Thompson (1945) One Franklin Parkway San Mateo, CA 94403-1906 | Trustee | Since 2007 | 136 | The Southern Company (energy company) (2014-present; previously 2010-2012), Graham Holdings Company (education and media organization) (2011-present) and Cbeyond, Inc. (business communications provider) (2010-2012). | ||||
| Principal Occupation During at Least the Past 5 Years: | ||||||||
Director of various companies; Counsel, Finch McCranie, LLP (law firm) (2015-present); Independent Compliance Monitor and Auditor, Volkswagen AG (manufacturer of automobiles and commercial vehicles) (2017-present); John A. Sibley Professor of Corporate and Business Law, University of Georgia School of Law (2015-present; previously 2011-2012); andformerly, Executive Vice President – Government Affairs, General Counsel and Corporate Secretary, PepsiCo, Inc. (consumer products) (2012-2014); Senior Vice President – Government Affairs, General Counsel and Secretary, PepsiCo, Inc. (2004-2011); Senior Fellow of The Brookings Institution (2003-2004); Visiting Professor, University of Georgia School of Law (2004); and Deputy Attorney General, U.S. Department of Justice (2001-2003).
| ||||||||
Interested Board Members and Officers | ||||||||
Name, Year of Birth and Address | Position | Length of Time Served | Number of Portfolios in Fund Complex Overseen by Board Member* | Other Directorships Held During at Least the Past 5 Years | ||||
**Gregory E. Johnson (1961) One Franklin Parkway San Mateo, CA 94403-1906 | Trustee | Since 2013 | 150 | None | ||||
| Principal Occupation During at Least the Past 5 Years: | ||||||||
Chairman of the Board, Member – Office of the Chairman, Director and Chief Executive Officer, Franklin Resources, Inc.; officer and/or director or trustee, as the case may be, of some of the other subsidiaries of Franklin Resources, Inc. and of 42 of the investment companies in Franklin Templeton; Vice Chairman, Investment Company Institute; andformerly, President, Franklin Resources, Inc. (1994-2015).
| ||||||||
**Rupert H. Johnson, Jr. (1940) One Franklin Parkway San Mateo, CA 94403-1906 | Chairman of the Board and Trustee | Chairman of the Board since 2013 and Trustee since 1991 | 136 | None | ||||
| Principal Occupation During at Least the Past 5 Years: | ||||||||
Vice Chairman, Member – Office of the Chairman and Director, Franklin Resources, Inc.; Director, Franklin Advisers, Inc.; and officer and/or director or trustee, as the case may be, of some of the other subsidiaries of Franklin Resources, Inc. and of 40 of the investment companies in Franklin Templeton.
| ||||||||
| Alison E. Baur (1964) | Vice President | Since 2012 | Not Applicable | Not Applicable | ||||
One Franklin Parkway San Mateo, CA 94403-1906 | ||||||||
| Principal Occupation During at Least the Past 5 Years: | ||||||||
Deputy General Counsel, Franklin Templeton; and officer of some of the other subsidiaries of Franklin Resources, Inc. and of 44 of the investment companies in Franklin Templeton.
| ||||||||
Sonal Desai, Ph.D. (1963) One Franklin Parkway San Mateo, CA 94403-1906 | Vice President | Since December 2018 | Not Applicable | Not Applicable | ||||
| Principal Occupation During at Least the Past 5 Years: | ||||||||
Director and Executive Vice President, Franklin Advisers, Inc.; Executive Vice President, Franklin Templeton Institutional, LLC; and officer of 18 of the investment companies in Franklin Templeton.
| ||||||||
franklintempleton.com | Annual Report | 51 | ||
FRANKLIN STRATEGIC SERIES
Interested Board Members and Officers(continued)
Name, Year of Birth and Address | Position | Length of Time Served | Number of Portfolios in Fund Complex Overseen by Board Member* | Other Directorships Held During at Least the Past 5 Years | ||||
Gaston Gardey (1967) One Franklin Parkway San Mateo, CA 94403-1906 | Treasurer, Chief Financial Officer and, Chief Accounting Officer | Since 2009 | Not Applicable | Not Applicable | ||||
| Principal Occupation During at Least the Past 5 Years: | ||||||||
Treasurer, U.S. Fund Administration & Reporting and officer of 28 of the investment companies in Franklin Templeton.
| ||||||||
Aliya S. Gordon (1973) One Franklin Parkway San Mateo, CA 94403-1906 | Vice President | Since 2009 | Not Applicable | Not Applicable | ||||
| Principal Occupation During at Least the Past 5 Years: | ||||||||
Senior Associate General Counsel and officer of 44 of the investment companies in Franklin Templeton.
| ||||||||
Steven J. Gray (1955) One Franklin Parkway San Mateo, CA 94403-1906 | Vice President and Co- Secretary | Vice President since 2009 and Co-Secretary since January 2019 | Not Applicable | Not Applicable | ||||
| Principal Occupation During at Least the Past 5 Years: | ||||||||
Senior Associate General Counsel, Franklin Templeton; Vice President, Franklin Templeton Distributors, Inc. and FASA, LLC; and officer of 44 of the investment companies in Franklin Templeton.
| ||||||||
Matthew T. Hinkle (1971) One Franklin Parkway San Mateo, CA 94403-1906 | Chief Executive Officer – Finance and Administration | Since 2017 | Not Applicable | Not Applicable | ||||
| Principal Occupation During at Least the Past 5 Years: | ||||||||
Senior Vice President, Franklin Templeton Services, LLC; officer of 44 of the investment companies in Franklin Templeton; andformerly, Vice President, Global Tax (2012-April 2017) and Treasurer/Assistant Treasurer, Franklin Templeton (2009-2017).
| ||||||||
Robert Lim (1948) One Franklin Parkway San Mateo, CA 94403-1906 | Vice President – AML Compliance | Since 2016 | Not Applicable | Not Applicable | ||||
| Principal Occupation During at Least the Past 5 Years: | ||||||||
Vice President, Franklin Templeton Companies, LLC; Chief Compliance Officer, Franklin Templeton Distributors, Inc. and Franklin Templeton Investor Services, LLC; and officer of 44 of the investment companies in Franklin Templeton.
| ||||||||
Kimberly H. Novotny (1972) 300 S.E. 2nd Street Fort Lauderdale, FL 33301-1923 | Vice President | Since 2013 | Not Applicable | Not Applicable | ||||
| Principal Occupation During at Least the Past 5 Years: | ||||||||
Associate General Counsel, Franklin Templeton; Vice President and Corporate Secretary, Fiduciary Trust International of the South; Vice President, Templeton Investment Counsel, LLC; Assistant Secretary, Franklin Resources, Inc.; and officer of 44 of the investment companies in Franklin Templeton.
| ||||||||
Edward D. Perks (1970) One Franklin Parkway San Mateo, CA 94403-1906 | President and Chief Executive Officer – Investment Management | Since December 2018 | Not Applicable | Not Applicable | ||||
| Principal Occupation During at Least the Past 5 Years: | ||||||||
President and Director, Franklin Advisers, Inc.; and officer of nine of the investment companies in Franklin Templeton (since December 2018).
| ||||||||
52 | Annual Report | franklintempleton.com | ||
FRANKLIN STRATEGIC SERIES
Interested Board Members and Officers(continued)
Name, Year of Birth and Address | Position | Length of Time Served | Number of Portfolios in Fund Complex Overseen by Board Member* | Other Directorships Held During at Least the Past 5 Years | ||||
Robert C. Rosselot (1960) 300 S.E. 2nd Street Fort Lauderdale, FL 33301-1923 | Chief Compliance Officer | Since 2013 | Not Applicable | Not Applicable | ||||
| Principal Occupation During at Least the Past 5 Years: | ||||||||
Director, Global Compliance, Franklin Templeton; Vice President, Franklin Templeton Companies, LLC; officer of 44 of the investment companies in Franklin Templeton; andformerly, Senior Associate General Counsel, Franklin Templeton (2007-2013); and Secretary and Vice President, Templeton Group of Funds (2004-2013).
| ||||||||
Navid J. Tofigh (1972) One Franklin Parkway San Mateo, CA 94403-1906 | Vice President | Since 2015 | Not Applicable | Not Applicable | ||||
| Principal Occupation During at Least the Past 5 Years: | ||||||||
Associate General Counsel and officer of 44 of the investment companies in Franklin Templeton.
| ||||||||
Craig S. Tyle (1960) One Franklin Parkway San Mateo, CA 94403-1906 | Vice President | Since 2005 | Not Applicable | Not Applicable | ||||
| Principal Occupation During at Least the Past 5 Years: | ||||||||
General Counsel, Executive Vice President and Secretary, Franklin Resources, Inc.; and officer of some of the other subsidiaries of Franklin Resources, Inc. and of 44 of the investment companies in Franklin Templeton.
| ||||||||
Lori A. Weber (1964) 300 S.E. 2nd Street Fort Lauderdale, FL 33301-1923 | Vice President and Co-Secretary | Vice President since 2011 and Co- Secretary since January 2019 | Not Applicable | Not Applicable | ||||
| Principal Occupation During at Least the Past 5 Years: | ||||||||
Senior Associate General Counsel, Franklin Templeton; Assistant Secretary, Franklin Resources, Inc.; Vice President and Secretary, Templeton Investment Counsel, LLC; and officer of 44 of the investment companies in Franklin Templeton.
| ||||||||
*We base the number of portfolios on each separate series of the U.S. registered investment companies within the Franklin Templeton Investments fund complex. These portfolios have a common investment manager or affiliated investment managers.
**Gregory E. Johnson is considered to be an interested person of the Fund under the federal securities laws due to his position as an officer and director of Franklin Resources, Inc. (Resources), which is the parent company of the Fund’s investment manager and distributor. Rupert H. Johnson, Jr. is considered to be an interested person of the Fund under the federal securities laws due to his position as an officer and director and major shareholder of Resources.
Note 1: Rupert H. Johnson, Jr. is the uncle of Gregory E. Johnson.
Note 2: Officer information is current as of the date of this report. It is possible that after this date, information about officers may change.
The Sarbanes-Oxley Act of 2002 and Rules adopted by the Securities and Exchange Commission require the Fund to disclose whether the Fund’s Audit Committee includes at least one member who is an audit committee financial expert within the meaning of such Act and Rules. The Fund’s Board has determined that there is at least one such financial expert on the Audit Committee and effective May 21, 2019, designated Mary C. Choksi as its audit committee financial expert. The Board believes that Ms. Choksi qualifies as such an expert in view of her extensive business background and experience. She currently serves as a director of Avis Budget Group, Inc. (2007-present) and formerly, Founder and Senior Advisor, Strategic Investment Group (1987 to 2017). Ms. Choksi has been a Member of the Fund’s Audit Committee since 2014. As a result of such background and experience, the Board believes that Ms. Choksi has acquired an understanding of generally accepted accounting principles and financial statements, the general application of such principles in connection with the accounting estimates, accruals and reserves, and analyzing and evaluating financial statements that present a breadth and level of complexity of accounting issues generally comparable to those of the Fund, as well as an understanding of internal controls and procedures for financial reporting and an understanding of audit committee functions. Ms. Choksi is an independent Board member as that term is defined under the relevant Securities and Exchange Commission Rules and Releases.
The Statement of Additional Information (SAI) includes additional information about the board members and is available, without charge, upon request. Shareholders may call (800) DIAL BEN/342-5236 to request the SAI.
franklintempleton.com | Annual Report | 53 | ||
FRANKLIN STRATEGIC SERIES
Shareholder Information
Board Approval of Investment Management Agreements
FRANKLIN STRATEGIC SERIES
Franklin Biotechnology Discovery Fund
Franklin Natural Resources Fund
(each a Fund)
At an in-person meeting held on April 16, 2019 (Meeting), the Board of Trustees (Board) of Franklin Strategic Series (Trust), including a majority of the trustees who are not “interested persons” as defined in the Investment Company Act of 1940 (Independent Trustees), reviewed and approved the continuance of the investment management agreement between Franklin Advisers, Inc. (Manager) and the Trust, on behalf of each Fund (each a Management Agreement) for an additional one-year period. The Independent Trustees received advice from and met separately with Independent Trustee counsel in considering whether to approve the continuation of each Management Agreement. Although the Management Agreements for the Funds were considered at the same Board meeting, the Board considered the information provided to it about the Funds together and with respect to each Fund separately as the Board deemed appropriate.
In considering the continuation of each Management Agreement, the Board reviewed and considered information provided by the Manager at the Meeting and throughout the year at meetings of the Board and its committees. The Board also reviewed and considered information provided in response to a detailed set of requests for information submitted to the Manager by Independent Trustee counsel on behalf of the Independent Trustees in connection with the annual contract renewal process. In addition, prior to the Meeting, the Independent Trustees held a telephonic contract renewal meeting at which the Independent Trustees conferred amongst themselves and Independent Trustee counsel about contract renewal matters. The Board reviewed and considered all of the factors it deemed relevant in approving the continuance of each Management Agreement, including, but not limited to: (i) the nature, extent and quality of the services provided by the Manager; (ii) the investment performance of each Fund; (iii) the costs of the services provided and profits realized by the Manager and its affiliates from the relationship with each Fund; (iv) the extent to which economies of scale are realized as each Fund grows; and (v) whether fee levels reflect these economies of scale for the benefit of Fund investors.
In approving the continuance of each Management Agreement, the Board, including a majority of the Independent Trustees,
determined that the terms of the Management Agreement are fair and reasonable and that the continuance of such Management Agreement is in the interests of the applicable Fund and its shareholders. While attention was given to all information furnished, the following discusses some primary factors relevant to the Board’s determination.
Nature, Extent and Quality of Services
The Board reviewed and considered information regarding the nature, extent and quality of investment management services provided by the Manager and its affiliates to the Funds and their shareholders. This information included, among other things, the qualifications, background and experience of the senior management and investment personnel of the Manager; the structure of investment personnel compensation; oversight of third-party service providers; investment performance reports and related financial information for each Fund; reports on expenses, shareholder services, marketing support payments made to financial intermediaries and third- party servicing arrangements; legal and compliance matters; risk controls; pricing and other services provided by the Manager and its affiliates; and management fees charged by the Manager and its affiliates to US funds and other accounts, including management’s explanation of differences among accounts where relevant. The Board also reviewed and considered an annual report on payments made by Franklin Templeton Investments (FTI) or the Funds to financial intermediaries, as well as a memorandum relating to third-party servicing arrangements in response to a guidance update in 2016 from the US Securities and Exchange Commission (SEC) relating to mutual fund distribution and sub-accounting fees. The Board noted management’s continuing efforts and expenditures in establishing effective business continuity plans and developing strategies to address areas of heightened concern in the mutual fund industry, such as cybersecurity and liquidity risk management. The Board also recognized management’s commitment to facilitating Board oversight of liquidity through the designation of a liquidity/risk administrator and the development of reports that highlight the amount of illiquid investments for each Fund.
The Board also reviewed and considered the benefits provided to Fund shareholders of investing in a fund that is part of the Franklin Templeton family of funds. The Board noted the financial position of Franklin Resources, Inc. (FRI), the Manager’s parent, and its commitment to the mutual fund business as evidenced by its continued introduction of new funds, reassessment of the fund offerings in response to the market environment and project initiatives and capital
54 | Annual Report | franklintempleton.com | ||
FRANKLIN STRATEGIC SERIES
SHAREHOLDER INFORMATION
investments relating to the services provided to the Funds by the FTI organization.
Following consideration of such information, the Board was satisfied with the nature, extent and quality of services provided by the Manager and its affiliates to the Funds and their shareholders.
Fund Performance
The Board reviewed and considered the performance results of each Fund over various time periods ended January 31, 2019. The Board considered the performance returns for each Fund in comparison to the performance returns of mutual funds deemed comparable to the Fund included in a universe (Performance Universe) selected by Broadridge Financial Solutions, Inc. (Broadridge), an independent provider of investment company data. The Board received a description of the methodology used by Broadridge to select the mutual funds included in a Performance Universe. The Board also reviewed and considered Fund performance reports provided and discussions that occurred with portfolio managers at Board meetings throughout the year. A summary of each Fund’s performance results is below.
Franklin Biotechnology Discovery Fund - The Performance Universe for this Fund included the Fund and all retail and institutional health/biotechnology funds. The Board noted that the Fund’s annualized total return for the one-, three-, five- and 10-year periods was below the median and in the fifth (worst) or fourth quintile of its Performance Universe. The Board discussed this performance with management and management explained that the Fund focuses on biotechnology, while the Performance Universe is comprised of mostly general healthcare funds. The Board noted management’s explanation that the Fund underperformed its biotechnology-only peers due to individual stock selection. The Board further noted a number of changes implemented/being implemented by management to address the Fund’s below median annualized total return, in particular, changes to the Fund’s portfolio management team and portfolio construction. The Board concluded that the Fund’s Management Agreement should be continued for an additional one-year period, and these changes monitored.
Franklin Natural Resources Fund- The Performance Universe for this Fund included the Fund and all retail and institutional global natural resources funds. The Board noted that the Fund’s annualized total return for the one- and five-year periods was below the median of its Performance Universe, but for the three- and 10-year periods was above the median of its Performance Universe. The Board discussed this performance
with management and management explained that the Fund’s relative performance over the past five years was negatively impacted by its overweight position in the weak-performing energy sector as compared to its peers. Management further explained that several funds in the Performance Universe had no exposure to the energy sector and the average weighting to the energy sector for the Performance Universe was 50% as compared to 60-80% for most diversified natural resources funds. The Board further noted management’s explanation that management has sought to focus more heavily on company-specific risk factors such as size and operating leverage and to continue to diversify Fund exposure by adding several non-energy positions. The Board concluded that the Fund’s performance was acceptable, noting the Fund’s longer term performance.
Comparative Fees and Expenses
The Board reviewed and considered information regarding each Fund’s actual total expense ratio and its various components, including, as applicable, management fees; transfer agent expenses; underlying fund expenses; Rule 12b-1 and non-Rule 12b-1 service fees; and other non-management fees. The Board also noted the quarterly and annual reports it receives on all marketing support payments made by FTI to financial intermediaries. The Board considered the actual total expense ratio and, separately, the contractual management fee rate, without the effect of fee waivers, if any (Management Rate) of each Fund in comparison to the median expense ratio and median Management Rate, respectively, of other mutual funds deemed comparable to and with a similar expense structure to the Fund selected by Broadridge (Expense Group). Broadridge fee and expense data is based upon information taken from each fund’s most recent annual report, which reflects historical asset levels that may be quite different from those currently existing, particularly in a period of market volatility. While recognizing such inherent limitation and the fact that expense ratios and Management Rates generally increase as assets decline and decrease as assets grow, the Board believed the independent analysis conducted by Broadridge to be an appropriate measure of comparative fees and expenses. The Broadridge Management Rate includes administrative charges, and the actual total expense ratio, for comparative consistency, was shown for Class A shares for funds with multiple classes of shares. The Board received a description of the methodology used by Broadridge to select the mutual funds included in an Expense Group.
The Expense Group for the Franklin Biotechnology Discovery Fund included the Fund and eight other health/biotechnology
franklintempleton.com | Annual Report | 55 | ||
FRANKLIN STRATEGIC SERIES
SHAREHOLDER INFORMATION
funds. The Expense Group for the Franklin Natural Resources Fund included the Fund and nine other global natural resources funds. The Board noted that the Management Rates and actual total expense ratios for these Funds were below the medians and in the first quintile (least expensive) of their respective Expense Groups. The Board concluded that the Management Rates charged to these Funds are reasonable.
Profitability
The Board reviewed and considered information regarding the profits realized by the Manager and its affiliates in connection with the operation of each Fund. In this respect, the Board considered the Fund profitability analysis provided by the Manager that addresses the overall profitability of FTI’s US fund business, as well as its profits in providing investment management and other services to each of the individual funds during the 12-month period ended September 30, 2018, being the most recent fiscal year-end for FRI. The Board noted that although management continually makes refinements to its methodologies used in calculating profitability in response to organizational and product-related changes, the overall methodology has remained consistent with that used in the Funds’ profitability report presentations from prior years. Additionally, PricewaterhouseCoopers LLP, auditor to FRI and certain Franklin Templeton funds, has been engaged by the Manager to periodically review and assess the allocation methodologies to be used solely by the Funds’ Board with respect to the profitability analysis.
The Board noted management’s belief that costs incurred in establishing the infrastructure necessary for the type of mutual fund operations conducted by the Manager and its affiliates may not be fully reflected in the expenses allocated to each Fund in determining its profitability, as well as the fact that the level of profits, to a certain extent, reflected operational cost savings and efficiencies initiated by management. The Board also noted management’s expenditures in improving shareholder services provided to the Funds, as well as the need to implement systems and meet additional regulatory and compliance requirements resulting from recent SEC and other regulatory requirements.
The Board also considered the extent to which the Manager and its affiliates might derive ancillary benefits from fund operations, including revenues generated from transfer agent services, potential benefits resulting from personnel and systems enhancements necessitated by fund growth, as well as increased leverage with service providers and counterparties. Based upon its consideration of all these factors, the Board
concluded that the level of profits realized by the Manager and its affiliates from providing services to each Fund was not excessive in view of the nature, extent and quality of services provided to each Fund.
Economies of Scale
The Board reviewed and considered the extent to which the Manager may realize economies of scale, if any, as each Fund grows larger and whether each Fund’s management fee structure reflects any economies of scale for the benefit of shareholders. With respect to possible economies of scale, the Board noted the existence of management fee breakpoints, which operate generally to share any economies of scale with a Fund’s shareholders by reducing the Fund’s effective management fees as the Fund grows in size. The Board considered the Manager’s view that any analyses of potential economies of scale in managing a particular fund are inherently limited in light of the joint and common costs and investments the Manager incurs across the Franklin Templeton family of funds as a whole. The Board noted that the Franklin Biotechnology Discovery Fund had experienced a decrease in assets and would not be expected to demonstrate additional economies of scale in the near term, but concluded that to the extent economies of scale may be realized by the Manager and its affiliates, each Fund’s management fee structure provided a sharing of benefits with the Fund and its shareholders as the Fund grows.
Conclusion
Based on its review, consideration and evaluation of all factors it believed relevant, including the above-described factors and conclusions, the Board unanimously approved the continuation of each Management Agreement for an additional one-year period.
Proxy Voting Policies and Procedures
The Trust’s investment manager has established Proxy Voting Policies and Procedures (Policies) that the Trust uses to determine how to vote proxies relating to portfolio securities. Shareholders may view the Trust’s complete Policies online at franklintempleton.com. Alternatively, shareholders may request copies of the Policies free of charge by calling the Proxy Group collect at (954) 527-7678 or by sending a written request to: Franklin Templeton Companies, LLC, 300 S.E. 2nd Street, Fort Lauderdale, FL 33301, Attention: Proxy Group. Copies of the Trust’s proxy voting records are also made available online at franklintempleton.com and posted on the U.S. Securities and Exchange Commission’s website at sec.gov and reflect the most recent 12-month period ended June 30.
56 | Annual Report | franklintempleton.com | ||
FRANKLIN STRATEGIC SERIES
SHAREHOLDER INFORMATION
Quarterly Statement of Investments
The Trust files a complete statement of investments with the U.S. Securities and Exchange Commission for the first and third quarters for each fiscal year as an exhibit to its report on Form N-PORT. Shareholders may view the filed Form N-PORT by visiting the Commission’s website at sec.gov. The filed form may also be viewed and copied at the Commission’s Public Reference Room in Washington, DC. Information regarding the operations of the Public Reference Room may be obtained by calling (800) SEC-0330.
Householding of Reports and Prospectuses
You will receive each Fund’s financial reports every six months as well as an annual updated summary prospectus (prospectus available upon request). To reduce Fund expenses, we try to identify related shareholders in a household and send only one copy of the financial reports and summary prospectus. This process, called “householding,” will continue indefinitely unless you instruct us otherwise. If you prefer not to have these documents householded, please call us at (800) 632-2301. At any time you may view current prospectuses/summary prospectuses and financial reports on our website. If you choose, you may receive these documents through electronic delivery.
franklintempleton.com | Annual Report | 57 | ||
This page intentionally left blank.
This page intentionally left blank.
This page intentionally left blank.
 | Annual Report and Shareholder Letter Franklin Strategic Series
Investment Manager Franklin Advisers, Inc.
Distributor Franklin Templeton Distributors, Inc. (800) DIAL BEN® / 342-5236 franklintempleton.com
Shareholder Services (800) 632-2301 |
Authorized for distribution only when accompanied or preceded by a summary prospectus and/or prospectus. Investors should carefully consider a fund’s investment goals, risks, charges and expenses before investing. A prospectus contains this and other information; please read it carefully before investing.
To help ensure we provide you with quality service, all calls to and from our service areas are monitored and/or recorded.
| © 2019 Franklin Templeton Investments. All rights reserved. | FSS2 A 06/19 |

Internet Delivery of Fund Reports Unless You Request Paper Copies:Effective January 1, 2021, as permitted by the SEC, paper copies of the Fund’s shareholder reports will no longer be sent by mail, unless you specifically request them from the Fund or your financial intermediary. Instead, the reports will be made available on a website, and you will be notified by mail each time a report is posted and provided with a website link to access the report.
If you already elected to receive shareholder reports electronically, you will not be affected by this change and you need not take any action. If you have not signed up for electronic delivery, we would encourage you to join fellow shareholders who have. You may elect to receive shareholder reports and other communications electronically from the Fund by calling (800) 632-2301 or by contacting your financial intermediary.
You may elect to continue to receive paper copies of all your future shareholder reports free of charge by contacting your financial intermediary or, if you invest directly with a Fund, calling (800) 632-2301 to let the Fund know of your request. Your election to receive reports in paper will apply to all funds held in your account.
Franklin Templeton
Successful investing begins with ambition. And achievement only comes when you reach for it. That’s why we continually strive to deliver better outcomes for investors. No matter what your goals are, our deep, global investment expertise allows us to offer solutions that can help.
During our more than 70 years of experience, we’ve managed through all kinds of markets—up, down and those in between. We’re always preparing for what may come next. It’s because of this, combined with our strength as one of the world’s largest asset managers that we’ve earned the trust of millions of investors around the world.
Dear Shareholder:
During the 12 months ended April 30, 2019, the U.S. economy grew, while annual inflation decreased, prompting the U.S. Federal Reserve (Fed) to raise its target range for the federal funds rate 0.25% at its June, September and December 2018 meetings. The 10-year Treasury yield, which moves inversely to price, decreased by period-end but rose to multi-year highs in 2018 amid a healthy U.S. economy and investor concerns about inflation, Fed actions and potentially decreased monetary stimulus by major central banks. However, the yield declined at times during the period and overall due to worries about slower global economic growth and political uncertainties, including turmoil in Italy and U.S.-China trade tensions. The U.S. dollar rose against its major trading partners during the period. In this environment, global government bonds, as measured by the FTSE World Government Bond Index, had slight losses in U.S. dollar terms.
We are committed to our long-term perspective and disciplined investment approach as we conduct a rigorous, fundamental analysis of securities with a regular emphasis on investment risk management.
We believe active, professional investment management serves investors well. We also recognize the important role of financial advisors in today’s markets and encourage investors to continue to seek their advice. Amid changing markets and economic conditions, we are confident investors with a well-diversified portfolio and a patient, long-term outlook should be well positioned for the years ahead.
CFA® is a trademark owned by CFA Institute.
In addition, Franklin Flexible Alpha Bond Fund’s annual report includes more detail about prevailing conditions and a discussion about investment decisions during the period. Please remember all securities markets fluctuate, as do mutual fund share prices.
We thank you for investing with Franklin Templeton, welcome your questions and comments, and look forward to serving your investment needs in the years ahead.
Sincerely,

Edward Perks, CFA
President and Chief Executive Officer –
Investment Management
Franklin Strategic Series
This letter reflects our analysis and opinions as of April 30, 2019, unless otherwise indicated. The information is not a complete analysis of every aspect of any market, country, industry, security or fund. Statements of fact are from sources considered reliable.
| Not FDIC Insured | May Lose Value | No Bank Guarantee |
franklintempleton.com | Not part of the annual report | 1 | ||
Contents
Annual Report | ||||
Franklin Flexible Alpha Bond Fund | 3 | |||
Performance Summary | 7 | |||
Your Fund’s Expenses | 10 | |||
Financial Highlights and Statement of Investments | 11 | |||
Financial Statements | 37 | |||
Notes to Financial Statements | 42 | |||
| Report of Independent Registered Public Accounting Firm | 57 | |||
Tax Information | 58 | |||
Board Members and Officers | 59 | |||
Shareholder Information | 63 | |||
| Visitfranklintempleton.comfor fund updates, to access your account, or to find helpful financial planning tools. |
| |||
2 | Annual Report | franklintempleton.com | ||
Annual Report
Franklin Flexible Alpha Bond Fund
This annual report for Franklin Flexible Alpha Bond Fund covers the fiscal year ended April 30, 2019.
Your Fund’s Goal and Main Investments
The Fund seeks to provide total return through a combination of current income and capital appreciation by investing at least 80% of its net assets in bonds and investments that provide exposure to bonds, including debt obligations of any credit quality, maturity or duration, all varieties of fixed income, variable rate and floating-rate debt securities and investments, money market instruments and derivatives. The Fund aims to provide attractive risk-adjusted total returns over a full market cycle. A full market cycle is a period of time that spans a full business and economic cycle, which may include periods of rising and declining interest rates.
What is duration?
|
Duration is a measure of a bond’s price sensitivity to interest-rate changes. In general, a portfolio of securities with a lower duration can be expected to be less sensitive to interest-rate changes than a portfolio with a higher duration.
|
Performance Overview
For the 12 months under review, the Fund’s Class A shares posted a +2.18% cumulative total return. In comparison, the LIBOR USD 3-Month Rate Index posted a +2.53% total return.1 The index tracks the interest rate at which banks offer to lend to one another in the wholesale money markets in London and is used to set the cost of various variable-rate loans. You can find more of the Fund’s performance data in the Performance Summary beginning on page 7.
Performance data represent past performance, which does not guarantee future results. Investment return and principal value will fluctuate, and you may have a gain or loss when you sell your shares. Current performance may differ from figures shown. For most recent month-end performance, go tofranklintempleton.comor call(800) 342-5236.
Sector Exposure*
4/30/19
% of Total Net Assets |
Collateralized Loan Obligations | 32.0 | % | ||
Residential Mortgage-Backed Securities | 24.8 | % | ||
International Bonds | 8.8 | % | ||
Floating-Rate Loans | 7.7 | % | ||
Investment-Grade Corporates | 4.2 | % | ||
Commercial Mortgage-Backed Securities | 4.1 | % | ||
Covered Bonds | 3.2 | % | ||
Treasury Inflation-Protected Securities | 3.0 | % | ||
Municipal Bonds | 2.9 | % | ||
High-Yield Corporates Securities | 2.3 | % | ||
Other | 0.3 | % | ||
Interest-Rate Derivatives | -21.4 | % | ||
Cash & Cash Equivalents | 17.7 | % |
*Sector Exposure is intended to estimate the portfolio’s exposure to various sectors, including any hedged or increased exposure through certain derivatives held in the portfolio (or their underlying reference assets) and may not total 100% or may be negative due to rounding, use of any derivatives, unsettled trades or other factors. Interest-Rate Derivatives sector consists of Treasury, interest rate and other derivatives that are primarily used for duration management; a negative number indicates that the Fund is seeking to hedge interest-rate risk.
Economic and Market Overview
The U.S. economy grew during the 12-month period. The economy expanded at a faster rate in 2019’s first quarter after moderating in the previous two quarters. Growth in consumer spending, inventory investment, exports, state and local government spending and business investment was partly offset by declines in housing investment and federal government spending. The manufacturing and services sectors expanded during the period. The unemployment rate decreased from 3.9% in April 2018 to 3.6% at period-end.2 The annual inflation rate, as measured by the Consumer Price Index, decreased from 2.5% in April 2018 to 2.0% at period-end.2
1. Source: Bloomberg LP.
The index is unmanaged and includes reinvestment of any income or distributions. It does not reflect any fees, expenses or sales charges. One cannot invest directly in an index, and an index is not representative of the Fund’s portfolio.
2. Source: Bureau of Labor Statistics.
See www.franklintempletondatasources.com for additional data provider information.
The dollar value, number of shares or principal amount, and names of all portfolio holdings are listed in the Fund’s Statement of Investments (SOI). The SOI begins on page 16.
franklintempleton.com | Annual Report | 3 | ||
FRANKLIN FLEXIBLE ALPHA BOND FUND
Dividend Distributions*
5/1/18–4/30/19
| Dividend per Share (cents) | ||||||||||||||||||||
| Month | Class A | Class C | Class R | Class R6 | Advisor Class | |||||||||||||||
May | 1.2601 | 1.1178 | 1.4491 | 1.8198 | 1.9819 | |||||||||||||||
June | 1.3402 | 1.2697 | 1.1372 | 1.4877 | 1.3418 | |||||||||||||||
July | 1.5761 | 1.4688 | 1.5959 | 2.2257 | 1.9702 | |||||||||||||||
August | 1.7712 | 1.4283 | 1.5541 | 2.1787 | 1.9776 | |||||||||||||||
September | 1.3435 | 1.0819 | 1.1739 | 1.6741 | 1.5259 | |||||||||||||||
October | 2.4119 | 2.3123 | 2.3735 | 2.1809 | 2.8921 | |||||||||||||||
November | 1.6017 | 1.5295 | 1.5735 | 2.0028 | 1.9455 | |||||||||||||||
December** | 4.2708 | 3.9167 | 4.0767 | 4.5955 | 4.4699 | |||||||||||||||
January | 2.0163 | 1.7095 | 1.8316 | 2.3030 | 2.2009 | |||||||||||||||
February | 2.0238 | 1.7256 | 1.8438 | 2.3209 | 2.2181 | |||||||||||||||
March | 1.8829 | 1.5592 | 1.6940 | 2.1975 | 2.0406 | |||||||||||||||
April | 3.1506 | 2.6354 | 2.8092 | 2.7517 | 3.2235 | |||||||||||||||
Total | 24.6491 | 21.7547 | 23.1125 | 27.7383 | 27.7880 | |||||||||||||||
*The distribution amount is the sum of all net investment income distributions for the period shown. Assumes shares were purchased and held for the entire accrual period. Since dividends accrue daily, your actual distributions will vary depending on the date you purchased your shares and any account activity. All Fund distributions will vary depending upon current market conditions, and past distributions are not indicative of future trends.
**Includes an additional 2.11 cent per share distribution to meet excise tax requirements.
The U.S. Federal Reserve (Fed) raised its target range for the federal funds rate by 0.25% three times during the period, to 2.25%–2.50%, and continued reducing its balance sheet as part of its plan to normalize monetary policy. At its March 2019 meeting, the Fed held its target range for the federal funds rate unchanged and signaled no rate hike in 2019. The Fed also lowered its forecasts for economic growth in 2019 and 2020. Furthermore, the Fed mentioned it would end its balance sheet normalization by the end of September 2019.
The 10-year Treasury yield, which moves inversely to its price, decreased during the period. The yield rose to multi-year highs several times in 2018 amid investor concerns about higher inflation and the Fed’s interest-rate path. Concerns that other central banks might scale back monetary stimulus, several better-than-expected U.S. economic reports and optimism surrounding trade talks between the U.S. and China also pushed the yield higher. However, some factors weighed on the Treasury yield at certain points during the period, including concerns about political turmoil in Italy, political uncertainties in the U.S., tensions between the U.S. and North Korea, U.S. trade disputes with China and other trading partners, slower domestic and global economic growth, and the Fed’s indications of a patient approach to its monetary policy
decisions. Overall, the 10-year Treasury yield declined from 2.95% at the beginning of the period to 2.51% at period-end.
Currency Composition*
4/30/19
| % of Total Net Assets | ||||
| ||||
North America | 100.0% | |||
| ||||
U.S. Dollar | 100.4% | |||
| ||||
Mexican Peso | 0.3% | |||
| ||||
Canadian Dollar | -0.7% | |||
| ||||
Asia | 0.4% | |||
| ||||
Japanese Yen | 0.6% | |||
| ||||
Indonesian Rupiah | 0.3% | |||
| ||||
South Korean Won | -0.2% | |||
| ||||
Chinese Renminbi | -0.3% | |||
| ||||
Latin America & Caribbean | 0.3% | |||
| ||||
Columbian Peso | 0.2% | |||
| ||||
Uruguayan Peso | 0.1% | |||
| ||||
Middle East & Africa | 0.1% | |||
| ||||
South African Rand | 0.1% | |||
| ||||
Europe | 0.0% | ** | ||
| ||||
Turkish Lira | 0.1% | |||
| ||||
British Pound | 0.0% | ** | ||
| ||||
Euro | -0.1% | |||
| ||||
Australia & New Zealand | -0.9% | |||
| ||||
Australian Dollar | -0.9% | |||
| ||||
*Currency Composition is intended to estimate the portfolio’s exposure to various currencies, including any hedged or increased exposure through certain derivatives held in the portfolio (or their underlying reference assets) and may not total 100% or may be negative due to rounding, use of any derivatives, unsettled trades or other factors.
**Rounds to less than 0.1%.
Investment Strategy
The Fund seeks to generate returns from various sources, other than solely from interest income, by allocating its portfolio across various risks (such as credit, currency and duration risks). In employing this strategy, the Fund has the flexibility to invest across all debt asset classes without regard to country, sector, quality, maturity or duration and without reference to a benchmark index.
The Fund may engage in active and frequent trading as part of its investment strategies and, at any given time, may have a substantial amount of its assets invested in any class of debt
4 | Annual Report | franklintempleton.com | ||
FRANKLIN FLEXIBLE ALPHA BOND FUND
securities, including, but not limited to: U.S. government and agency securities; foreign government and supranational debt securities; corporate bonds; corporate loans (and loan participations); collateralized debt and loan obligations; preferred securities; various types of mortgage-backed securities and other asset-backed securities (including covered bonds); municipal securities; and derivatives and other instruments with similar economic characteristics, or that provide exposure, to such debt securities.
Manager’s Discussion
Over the 12-month period, the Fund posted a positive total return and outperformed its benchmark on a gross basis. The Fund’s yield curve and duration positioning was the primary source of positive alpha, driven primarily by duration exposure in the U.S. The Fund’s spread-sector exposure also enhanced results, driven primarily by the Fund’s exposure to floating-rate bank loans, sovereign emerging market bonds, residential mortgage-backed securities (RMBS) and basis trade positions (taking opposing long and short positions in two securities to profit from the convergence of their values). Additionally, the Fund’s active currency positioning also contributed to returns, driven primarily by our Mexican peso, Australian dollar and Canadian dollar positions. In contrast, the Fund’s exposure to collateralized loan obligations (CLOs) and covered bonds were the primary detractors from performance. Duration exposure in Europe also hurt returns over the period.
What is the yield curve? |
A yield curve is a line that plots the yield to maturity of bonds having equal credit quality against their maturity dates.
|
At period-end, we continued to invest in a broad set of global fixed income sectors, with a goal of achieving more consistent positive alpha with a risk-diversified portfolio. Additionally, we maintained the Fund’s risk profile at a conservative level. We remained overweighted in CLOs as well as RMBS. In contrast, we sought to reduce the amount of risk in our portfolio over the period by reducing our exposure to investment-grade corporate securities. We continued to find what we considered value in credit-hedged corporate positions. We sought to hedge all of the high-yield corporate beta (or risk) in the Fund, although we retained exposure to select corporate loans and CLOs. We also retained positions in Treasury Inflation-Protected Securities as well as covered bonds. Overall, portfolio duration remained relatively neutral toward U.S. interest-rate and non-U.S. duration positions. The portfolio held an overweight exposure to the U.S. dollar versus a basket of developed market and commodity-related
currencies for most of the period. Overall currency allocation did not represent a significant portion of the Fund’s risk allocation.
The Fund utilized derivatives, including credit default and currency swaps, currency forwards, futures, interest rate swaps, total return swaps and inflation index swaps, principally as a tool for efficient portfolio management and to manage overall portfolio risk. These derivative transactions may provide the same, or similar, net long or short exposure to select currencies, interest rates, countries, duration or credit risks in a less expensive way than by directly purchasing securities. In those markets where portfolio securities are readily available, the cost difference in normal market conditions may be small. Overall the portfolio continued to meet its risk-adjusted return target and remained in the lower end of our explicitly targeted risk range. Much of the Fund’s derivatives positioning was to hedge various risks in the portfolio and achieve the goal of a stable return profile.
What are swap agreements? |
Swap agreements, such as interest-rate, currency and credit default swaps, are contracts between the Fund and another party (the swap counterparty). In a basic swap transaction, the Fund agrees with the swap counterparty to exchange the returns (or differentials in rates of return) earned or realized on a particular “notional amount” of underlying instruments. The notional amount is the set amount selected by the parties as the basis on which to calculate the obligations that they have agreed to exchange. The parties typically do not actually exchange the notional amount. Instead, they agree to exchange the returns that would be earned or realized if the notional amount were invested in given instruments or at given interest rates.
|
What is a currency forward contract? |
A currency forward contract is an agreement between the Fund and a counterparty to buy or sell a foreign currency in exchange for another currency at a specific exchange rate on a future date. Currency forward contracts are privately traded in the interbank market, not on a centralized exchange.
|
What is a futures contract? |
A futures contract is an agreement between the Fund and a counterparty made through a U.S. or foreign futures exchange to buy or sell an underlying instrument or asset at a specific price on a future date.
|
franklintempleton.com | Annual Report | 5 | ||
FRANKLIN FLEXIBLE ALPHA BOND FUND
Thank you for your continued participation in Franklin Flexible Alpha Bond Fund. We look forward to serving your future investment needs.
 |
| |
David Yuen, CFA, FRM Co-Lead Portfolio Manager | ||
 |
| |
Michael J. Materasso Co-Lead Portfolio Manager
Sonal Desai, Ph.D.
Portfolio Management Team |


The foregoing information reflects our analysis, opinions and portfolio holdings as of April 30, 2019, the end of the reporting period. The way we implement our main investment strategies and the resulting portfolio holdings may change depending on factors such as market and economic conditions. These opinions may not be relied upon as investment advice or an offer for a particular security. The information is not a complete analysis of every aspect of any market, country, industry, security or the Fund. Statements of fact are from sources considered reliable, but the investment manager makes no representation or warranty as to their completeness or accuracy. Although historical performance is no guarantee of future results, these insights may help you understand our investment management philosophy.
CFA® is a trademark owned by CFA Institute.
6 | Annual Report | franklintempleton.com | ||
FRANKLIN FLEXIBLE ALPHA BOND FUND
Performance Summary as of April 30, 2019
The performance tables and graphs do not reflect any taxes that a shareholder would pay on Fund dividends, capital gain distributions, if any, or any realized gains on the sale of Fund shares. Total return reflects reinvestment of the Fund’s dividends and capital gain distributions, if any, and any unrealized gains or losses. Your dividend income will vary depending on dividends or interest paid by securities in the Fund’s portfolio, adjusted for operating expenses of each class. Capital gain distributions are net profits realized from the sale of portfolio securities.
Performance as of 4/30/191
Cumulative total return excludes sales charges. Average annual total return includes maximum sales charges. Sales charges will vary depending on the size of the investment and the class of share purchased. The maximum is 3.75% and the minimum is 0%. Class A: 3.75% maximum initial sales charge; Advisor Class: no sales charges. For other share classes, visit franklintempleton.com.
Share Class
|
| Cumulative Total Return
| 2
|
| Average Annual Total Return
| 3
| ||
A4
| ||||||||
1-Year | +2.18 | %5 | -1.64 | % | ||||
3-Year | +5.19 | % | +0.43 | % | ||||
Since Inception (8/3/15) | +4.83 | % | +0.24 | % | ||||
Advisor | ||||||||
1-Year | +2.20 | % | +2.20 | % | ||||
3-Year | +5.57 | % | +1.82 | % | ||||
Since Inception (8/3/15) | +5.24 | % | +1.37 | % | ||||
| Distribution | 30-Day Standardized Yield7 | |||||||||
| Share Class | Rate6 | (with fee waiver) | (without fee waiver) | |||||||
A
| 3.59% | 2.82% | 2.47% | |||||||
Advisor
| 3.87% | 3.18% | 2.81% | |||||||
Performance data represent past performance, which does not guarantee future results. Investment return and principal value will fluctuate, and you may have a gain or loss when you sell your shares. Current performance may differ from figures shown. For most recent month-end performance, go tofranklintempleton.com or call(800) 342-5236.
See page 9 for Performance Summary footnotes.
franklintempleton.com | Annual Report | 7 | ||
FRANKLIN FLEXIBLE ALPHA BOND FUND
PERFORMANCE SUMMARY
Total Return Index Comparison for a Hypothetical $10,000 Investment1
Total return represents the change in value of an investment over the periods shown. It includes any applicable maximum sales charge, Fund expenses, account fees and reinvested distributions. The unmanaged index includes reinvestment of any income or distributions. It differs from the Fund in composition and does not pay management fees or expenses. One cannot invest directly in an index.
Class A(8/3/15–4/30/19)
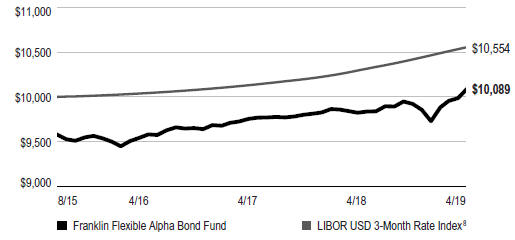
Advisor Class(8/3/15–4/30/19)
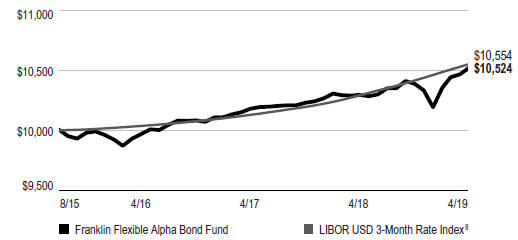
See page 9 for Performance Summary footnotes.
8 | Annual Report | franklintempleton.com | ||
FRANKLIN FLEXIBLE ALPHA BOND FUND
PERFORMANCE SUMMARY
Distributions(5/1/18–4/30/19)
| Share Class | Net Investment Income | Short-Term Capital Gain | Long-Term Capital Gain | Total | ||||||||||||
A
| $0.246491 | $0.0022 | $0.0105 | $0.259191 | ||||||||||||
C
| $0.217547 | $0.0022 | $0.0105 | $0.230247 | ||||||||||||
R
| $0.231125 | $0.0022 | $0.0105 | $0.243825 | ||||||||||||
R6
| $0.277383 | $0.0022 | $0.0105 | $0.290083 | ||||||||||||
Advisor
| $0.277880 | $0.0022 | $0.0105 | $0.290580 | ||||||||||||
Total Annual Operating Expenses9
| With Fee | Without Fee | |||||||||||
Share Class
| Waiver
| Waiver
| ||||||||||
A
|
| 1.19%
|
|
| 1.24%
|
| ||||||
Advisor
|
|
0.94%
|
|
|
0.99%
|
| ||||||
Each class of shares is available to certain eligible investors and has different annual fees and expenses, as described in the prospectus.
All investments involve risks, including possible loss of principal. Changes in the financial strength of a bond issuer or in a bond’s credit rating may affect its value. Interest rate movements and mortgage prepayments will affect the Fund’s share price and yield. During periods of declining interest rates, principal prepayments tend to increase as borrowers refinance their mortgages at lower rates; therefore the Fund may be forced to reinvest returned principal at lower interest rates, reducing income. Bond prices generally move in the opposite direction of interest rates. Thus, as the prices of bonds in the Fund adjust to a rise in interest rates, the Fund’s share price may decline. The Fund may be affected by issuers that fail to make interest payments and repay principal when due. The risks associated with higher-yielding, lower-rated securities (commonly called junk bonds) include higher risk of default and loss of principal. Derivatives, including currency management strategies, involve costs and can create economic leverage in the portfolio, which may result in significant volatility and cause the Fund to participate in losses (as well as enable gains) in an amount that exceeds the Fund’s initial investment. The Fund may not achieve the anticipated benefits, and may realize losses when a counterparty fails to perform as intended. The Fund is actively managed but there is no guarantee that the manager’s investment decisions will produce the desired results. The Fund’s prospectus also includes a description of the main investment risks.
1. The Fund has an expense reduction and a fee waiver associated with any investments it makes in a Franklin Templeton money fund and/or other Franklin Templeton fund, contractually guaranteed through 8/31/19. Fund investment results reflect the expense reduction and fee waiver; without these reductions, the results would have been lower.
2. Cumulative total return represents the change in value of an investment over the periods indicated.
3. Average annual total return represents the average annual change in value of an investment over the periods indicated. Return for less than one year, if any, has not been annualized.
4. Prior to 3/1/19, these shares were offered at a higher initial sales charge of 4.25%, thus actual returns would have differed. Total returns with sales charges have been restated to reflect the current maximum initial sales charge of 3.75%.
5. Total return information is based on net asset values calculated for shareholder transactions. Certain adjustments were made to the net assets of the Fund at 4/30/18 for financial reporting purposes, and as a result, the total returns based on those net asset values differ from the adjusted total returns reported in the Financial Highlights.
6. Distribution rate is based on an annualization of the sum of the respective class’s past 30 days’ daily distributions and the maximum offering price (NAV for Advisor Class) per share on 4/30/19.
7. The Fund’s 30-day standardized yield is calculated over a trailing 30-day period using the yield to maturity on bonds and/or the dividends accrued on stocks. It may not equal the Fund’s actual income distribution rate, which reflects the Fund’s past dividends paid to shareholders.
8. Source: Bloomberg LP. The LIBOR USD 3-Month Rate Index tracks the interest rate at which banks offer to lend to one another in the wholesale money markets in London and is used to set the cost of various variable-rate loans.
9. Figures are as stated in the Fund’s current prospectus and may differ from the expense ratios disclosed in the Your Fund’s Expenses and Financial Highlights sections in this report. In periods of market volatility, assets may decline significantly, causing total annual Fund operating expenses to become higher than the figures shown.
See www.franklintempletondatasources.com for additional data provider information.
franklintempleton.com | Annual Report | 9 | ||
FRANKLIN FLEXIBLE ALPHA BOND FUND
Your Fund’s Expenses
As a Fund shareholder, you can incur two types of costs: (1) transaction costs, including sales charges (loads) on Fund purchases and redemptions; and (2) ongoing Fund costs, including management fees, distribution and service (12b-1) fees, and other Fund expenses. All mutual funds have ongoing costs, sometimes referred to as operating expenses. The table below shows ongoing costs of investing in the Fund and can help you understand these costs and compare them with those of other mutual funds. The table assumes a $1,000 investment held for the six months indicated.
Actual Fund Expenses
The table below provides information about actual account values and actual expenses in the columns under the heading “Actual.” In these columns the Fund’s actual return, which includes the effect of Fund expenses, is used to calculate the “Ending Account Value” for each class of shares. You can estimate the expenses you paid during the period by following these steps (ofcourse, your account value and expenses will differ from those in this illustration):Divide your account value by $1,000 (ifyour account had an $8,600 value, then $8,600 ÷ $1,000 = 8.6). Then multiply the result by the number in the row for your class of shares under the headings “Actual” and “Expenses Paid During Period” (ifActual Expenses Paid During Period were $7.50, then 8.6 x $7.50 = $64.50). In this illustration, the actual expenses paid this period are $64.50.
Hypothetical Example for Comparison with Other Funds
Under the heading “Hypothetical” in the table, information is provided about hypothetical account values and hypothetical expenses based on the Fund’s actual expense ratio and an assumed rate of return of 5% per year before expenses, which is not the Fund’s actual return. This information may not be used to estimate the actual ending account balance or expenses you paid for the period, but it can help you compare ongoing costs of investing in the Fund with those of other funds. To do so, compare this 5% hypothetical example for the class of shares you hold with the 5% hypothetical examples that appear in the shareholder reports of other funds.
Please note that expenses shown in the table are meant to highlight ongoing costs and do not reflect any transactional costs. Therefore, information under the heading “Hypothetical” is useful in comparing ongoing costs only, and will not help you compare total costs of owning different funds. In addition, if transactional costs were included, your total costs would have been higher.
| Actual | Hypothetical | |||||||||||||||||
| (actual return after expenses) | (5% annual return before expenses) | |||||||||||||||||
Share Class | Beginning Account Value 11/1/18 | Ending Account Value 4/30/19 |
Expenses Paid During 11/1/18–4/30/191,2 | Ending Account Value 4/30/19 | Expenses Paid During Period 11/1/18–4/30/191,2 | Net Annualized Expense Ratio2 | ||||||||||||
A | $1,000 | $1,011.70 | $5.59 | $1,019.24 | $5.61 | 1.12% | ||||||||||||
C | $1,000 | $1,009.90 | $7.57 | $1,017.26 | $7.60 | 1.52% | ||||||||||||
R | $1,000 | $1,010.60 | $6.83 | $1,018.00 | $6.85 | 1.37% | ||||||||||||
R6 | $1,000 | $1,014.10 | $3.00 | $1,021.82 | $3.01 | 0.60% | ||||||||||||
Advisor | $1,000 | $1,013.00 | $4.34 | $1,020.48 | $4.36 | 0.87% | ||||||||||||
1. Expenses are equal to the annualized expense ratio for the six-month period as indicated above—in the far right column—multiplied by the simple average account value over the period indicated, and then multiplied by 181/365 to reflect the one-half year period.
2. Reflects expenses after fee waivers and expense reimbursements. Does not include acquired fund fees and expenses.
10 | Annual Report | franklintempleton.com | ||
FRANKLIN STRATEGIC SERIES
Financial Highlights
Franklin Flexible Alpha Bond Fund
Year Ended April 30, | ||||||||||||||||
| 2019 | 2018 | 2017 | 2016a | |||||||||||||
Class A | ||||||||||||||||
Per share operating performance | ||||||||||||||||
(for a share outstanding throughout the year) | ||||||||||||||||
Net asset value, beginning of year | $ 9.79 | $ 9.86 | $ 9.88 | $ 10.00 | ||||||||||||
Income from investment operationsb: | ||||||||||||||||
Net investment income | 0.249 | c | 0.166 | c | 0.180 | 0.099 | ||||||||||
Net realized and unrealized gains (losses) | (0.080 | ) | (0.066 | ) | 0.017 | (0.123 | ) | |||||||||
Total from investment operations | 0.169 | 0.100 | 0.197 | (0.024 | ) | |||||||||||
Less distributions from: | ||||||||||||||||
Net investment income | (0.246 | ) | (0.160 | ) | (0.217 | ) | (0.096 | ) | ||||||||
Net realized gains | (0.013 | ) | (0.010 | ) | — | — | ||||||||||
Total distributions | (0.259 | ) | (0.170 | ) | (0.217 | ) | (0.096 | ) | ||||||||
Net asset value, end of year | $ 9.70 | $ 9.79 | $ 9.86 | $ 9.88 | ||||||||||||
Total returnd | 1.76% | 1.02% | 2.22% | (0.34)% | ||||||||||||
Ratios to average net assetse | ||||||||||||||||
Expenses before waiver and payments by affiliates | 1.19% | 0.97% | 3.17% | 3.47% | ||||||||||||
Expenses net of waiver and payments by affiliatesf | 1.04% | 0.79% | 0.67% | 0.84% | ||||||||||||
Net investment income | 2.60% | 1.80% | 1.83% | 1.37% | ||||||||||||
Supplemental data | ||||||||||||||||
Net assets, end of year (000’s) | $1,458 | $1,132 | $10,443 | $10,200 | ||||||||||||
Portfolio turnover rate | 24.74% | 48.04% | 90.37% | 40.12% | ||||||||||||
Portfolio turnover rate excluding mortgage dollar rollsg | 24.00% | 19.40% | 57.79% | 30.05% | ||||||||||||
aFor the period August 3, 2015 (commencement of operations) to April 30, 2016.
bThe amount shown for a share outstanding throughout the period may not correlate with the Statement of Operations for the period due to the timing of sales and repurchases of the Fund’s shares in relation to income earned and/or fluctuating fair value of the investments of the Fund.
cBased on average daily shares outstanding.
dTotal return does not reflect sales commissions or contingent deferred sales charges, if applicable, and is not annualized for periods less than one year.
eRatios are annualized for periods less than one year, except for non-recurring expenses, if any.
fBenefit of expense reduction rounds to less than 0.01%.
gSee Note 1(f) regarding mortgage dollar rolls.
franklintempleton.com | The accompanying notes are an integral part of these financial statements. | Annual Report | 11 | ||
FRANKLIN STRATEGIC SERIES
FINANCIAL HIGHLIGHTS
Franklin Flexible Alpha Bond Fund(continued)
| Year Ended April 30, | ||||||||||||||||
| 2019 | 2018 | 2017 | 2016a | |||||||||||||
Class C | ||||||||||||||||
Per share operating performance | ||||||||||||||||
(for a share outstanding throughout the year) | ||||||||||||||||
Net asset value, beginning of year | $ 9.73 | $ 9.80 | $ 9.86 | $ 10.00 | ||||||||||||
Income from investment operationsb: | ||||||||||||||||
Net investment income | 0.212 | c | 0.120 | 0.130 | 0.072 | |||||||||||
Net realized and unrealized gains (losses) | (0.071 | ) | (0.062 | ) | (0.006 | ) | (0.131 | ) | ||||||||
Total from investment operations | 0.141 | 0.058 | 0.124 | (0.059 | ) | |||||||||||
Less distributions from: | ||||||||||||||||
Net investment income | (0.218 | ) | (0.118 | ) | (0.184 | ) | (0.081 | ) | ||||||||
Net realized gains | (0.013 | ) | (0.010 | ) | — | — | ||||||||||
Total distributions | (0.231 | ) | (0.128 | ) | (0.184 | ) | (0.081 | ) | ||||||||
Net asset value, end of year | $ 9.64 | $ 9.73 | $ 9.80 | $ 9.86 | ||||||||||||
Total returnd | 1.58% | 0.49% | 1.47% | (0.69)% | ||||||||||||
Ratios to average net assetse | ||||||||||||||||
Expenses before waiver and payments by affiliates | 1.55% | 1.58% | 3.88% | 3.98% | ||||||||||||
Expenses net of waiver and payments by affiliatesf | 1.40% | 1.40% | 1.38% | 1.34% | ||||||||||||
Net investment income | 2.24% | 1.19% | 1.12% | 0.87% | ||||||||||||
Supplemental data | ||||||||||||||||
Net assets, end of year (000’s) | $368 | $279 | $245 | $204 | ||||||||||||
Portfolio turnover rate | 24.74% | 48.04% | 90.37% | 40.12% | ||||||||||||
Portfolio turnover rate excluding mortgage dollar rollsg | 24.00% | 19.40% | 57.79% | 30.05% | ||||||||||||
aFor the period August 3, 2015 (commencement of operations) to April 30, 2016.
bThe amount shown for a share outstanding throughout the period may not correlate with the Statement of Operations for the period due to the timing of sales and repurchases of the Fund’s shares in relation to income earned and/or fluctuating fair value of the investments of the Fund.
cBased on average daily shares outstanding.
dTotal return does not reflect sales commissions or contingent deferred sales charges, if applicable, and is not annualized for periods less than one year.
eRatios are annualized for periods less than one year, except for non-recurring expenses, if any.
fBenefit of expense reduction rounds to less than 0.01%.
gSee Note 1(f) regarding mortgage dollar rolls.
12 | Annual Report | The accompanying notes are an integral part of these financial statements. | franklintempleton.com | ||
FRANKLIN STRATEGIC SERIES
FINANCIAL HIGHLIGHTS
Franklin Flexible Alpha Bond Fund(continued)
| Year Ended April 30, | ||||||||||||||||
| 2019 | 2018 | 2017 | 2016a | |||||||||||||
Class R | ||||||||||||||||
Per share operating performance | ||||||||||||||||
(for a share outstanding throughout the year) | ||||||||||||||||
Net asset value, beginning of year | $ 9.78 | $ 9.86 | $ 9.86 | $ 10.00 | ||||||||||||
Income from investment operationsb: | ||||||||||||||||
Net investment income | 0.230 | c | 0.112 | 0.112 | 0.072 | |||||||||||
Net realized and unrealized gains (losses) | (0.076 | ) | (0.058 | ) | 0.095 | (0.127 | ) | |||||||||
Total from investment operations | 0.154 | 0.054 | 0.207 | (0.055 | ) | |||||||||||
Less distributions from: | ||||||||||||||||
Net investment income | (0.231 | ) | (0.124 | ) | (0.207 | ) | (0.085 | ) | ||||||||
Net realized gains | (0.013 | ) | (0.010 | ) | — | — | ||||||||||
Total distributions | (0.244 | ) | (0.134 | ) | (0.207 | ) | (0.085 | ) | ||||||||
Net asset value, end of year | $ 9.69 | $ 9.78 | $ 9.86 | $ 9.86 | ||||||||||||
Total returnd | 1.71% | 0.54% | 2.21% | (0.65)% | ||||||||||||
Ratios to average net assetse | ||||||||||||||||
Expenses before waiver and payments by affiliates | 1.41% | 1.47% | 3.36% | 3.84% | ||||||||||||
Expenses net of waiver and payments by affiliatesf | 1.26% | 1.29% | 0.86% | 1.22% | ||||||||||||
Net investment income | 2.38% | 1.30% | 1.64% | 0.99% | ||||||||||||
Supplemental data | ||||||||||||||||
Net assets, end of year (000’s) | $83 | $51 | $60 | $10 | ||||||||||||
Portfolio turnover rate | 24.74% | 48.04% | 90.37% | 40.12% | ||||||||||||
Portfolio turnover rate excluding mortgage dollar rollsg | 24.00% | 19.40% | 57.79% | 30.05% | ||||||||||||
aFor the period August 3, 2015 (commencement of operations) to April 30, 2016.
bThe amount shown for a share outstanding throughout the period may not correlate with the Statement of Operations for the period due to the timing of sales and repurchases of the Fund’s shares in relation to income earned and/or fluctuating fair value of the investments of the Fund.
cBased on average daily shares outstanding.
dTotal return is not annualized for periods less than one year.
eRatios are annualized for periods less than one year, except for non-recurring expenses, if any.
fBenefit of expense reduction rounds to less than 0.01%.
gSee Note 1(f) regarding mortgage dollar rolls.
franklintempleton.com | The accompanying notes are an integral part of these financial statements. | Annual Report | 13 | ||
FRANKLIN STRATEGIC SERIES
FINANCIAL HIGHLIGHTS
Franklin Flexible Alpha Bond Fund(continued)
| Year Ended April 30, | ||||||||||||||||
| 2019 | 2018 | 2017 | 2016a | |||||||||||||
Class R6 | ||||||||||||||||
Per share operating performance | ||||||||||||||||
(for a share outstanding throughout the year) | ||||||||||||||||
Net asset value, beginning of year | $ 9.79 | $ 9.86 | $ 9.88 | $ 10.00 | ||||||||||||
Income from investment operationsb: | ||||||||||||||||
Net investment income | 0.296 | c | 0.204 | 0.177 | 0.108 | |||||||||||
Net realized and unrealized gains (losses) | (0.086 | ) | (0.088 | ) | 0.022 | (0.124 | ) | |||||||||
Total from investment operations | 0.210 | 0.116 | 0.199 | (0.016 | ) | |||||||||||
Less distributions from: | ||||||||||||||||
Net investment income | (0.277 | ) | (0.176 | ) | (0.219 | ) | (0.104 | ) | ||||||||
Net realized gains | (0.013 | ) | (0.010 | ) | — | — | ||||||||||
Total distributions | (0.290 | ) | (0.186 | ) | (0.219 | ) | (0.104 | ) | ||||||||
Net asset value, end of year | $ 9.71 | $ 9.79 | $ 9.86 | $ 9.88 | ||||||||||||
Total returnd | 2.30% | 1.18% | 2.03% | (0.15)% | ||||||||||||
Ratios to average net assetse | ||||||||||||||||
Expenses before waiver and payments by affiliates | 0.65% | 0.86% | 5.23% | 3.72% | ||||||||||||
Expenses net of waiver and payments by affiliatesf | 0.59% | 0.71% | 0.71% | 0.71% | ||||||||||||
Net investment income | 3.05% | 1.88% | 1.79% | 1.50% | ||||||||||||
Supplemental data | ||||||||||||||||
Net assets, end of year (000’s) | $504,875 | $210,808 | $10 | $10 | ||||||||||||
Portfolio turnover rate | 24.74% | 48.04% | 90.37% | 40.12% | ||||||||||||
Portfolio turnover rate excluding mortgage dollar rollsg | 24.00% | 19.40% | 57.79% | 30.05% | ||||||||||||
aFor the period August 3, 2015 (commencement of operations) to April 30, 2016.
bThe amount shown for a share outstanding throughout the period may not correlate with the Statement of Operations for the period due to the timing of sales and repurchases of the Fund’s shares in relation to income earned and/or fluctuating fair value of the investments of the Fund.
cBased on average daily shares outstanding.
dTotal return is not annualized for periods less than one year.
eRatios are annualized for periods less than one year, except for non-recurring expenses, if any.
fBenefit of expense reduction rounds to less than 0.01%.
gSee Note 1(f) regarding mortgage dollar rolls.
14 | Annual Report | The accompanying notes are an integral part of these financial statements. | franklintempleton.com | ||
FRANKLIN STRATEGIC SERIES
FINANCIAL HIGHLIGHTS
Franklin Flexible Alpha Bond Fund(continued)
| Year Ended April 30, | ||||||||||||||||
| 2019 | 2018 | 2017 | 2016a | |||||||||||||
Advisor Class | ||||||||||||||||
Per share operating performance (for a share outstanding throughout the year) | ||||||||||||||||
Net asset value, beginning of year | $ 9.79 | $ 9.85 | $ 9.88 | $ 10.00 | ||||||||||||
Income from investment operationsb: | ||||||||||||||||
Net investment income | 0.275 | c | 0.194 | 0.166 | 0.107 | |||||||||||
Net realized and unrealized gains (losses) | (0.074 | ) | (0.072 | ) | 0.023 | (0.129 | ) | |||||||||
Total from investment operations | 0.201 | 0.122 | 0.189 | (0.022 | ) | |||||||||||
Less distributions from: | ||||||||||||||||
Net investment income | (0.278 | ) | (0.172 | ) | (0.219 | ) | (0.098 | ) | ||||||||
Net realized gains | (0.013 | ) | (0.010 | ) | — | — | ||||||||||
Total distributions | (0.291 | ) | (0.182 | ) | (0.219 | ) | (0.098 | ) | ||||||||
Net asset value, end of year | $ 9.70 | $ 9.79 | $ 9.85 | $ 9.88 | ||||||||||||
Total returnd | 2.20% | 1.14% | 2.13% | (0.31)% | ||||||||||||
Ratios to average net assetse | ||||||||||||||||
Expenses before waiver and payments by affiliates | 0.90% | 0.93% | 3.22% | 3.34% | ||||||||||||
Expenses net of waiver and payments by affiliatesf | 0.75% | 0.75% | 0.72% | 0.71% | ||||||||||||
Net investment income | 2.89% | 1.84% | 1.78% | 1.50% | ||||||||||||
Supplemental data | ||||||||||||||||
Net assets, end of year (000’s) | $433 | $425 | $232 | $344 | ||||||||||||
Portfolio turnover rate | 24.74% | 48.04% | 90.37% | 40.12% | ||||||||||||
Portfolio turnover rate excluding mortgage dollar rollsg | 24.00% | 19.40% | 57.79% | 30.05% | ||||||||||||
aFor the period August 3, 2015 (commencement of operations) to April 30, 2016.
bThe amount shown for a share outstanding throughout the period may not correlate with the Statement of Operations for the period due to the timing of sales and repurchases of the Fund’s shares in relation to income earned and/or fluctuating fair value of the investments of the Fund.
cBased on average daily shares outstanding.
dTotal return is not annualized for periods less than one year.
eRatios are annualized for periods less than one year, except for non-recurring expenses, if any.
fBenefit of expense reduction rounds to less than 0.01%.
gSee Note 1(f) regarding mortgage dollar rolls.
franklintempleton.com | The accompanying notes are an integral part of these financial statements. | Annual Report | 15 | ||
FRANKLIN STRATEGIC SERIES
Statement of Investments, April 30, 2019
Franklin Flexible Alpha Bond Fund
| Country | Shares | Value | ||||||||||||||
Management Investment Companies (Cost $4,549,803) 0.9% | ||||||||||||||||
Diversified Financials 0.9% | ||||||||||||||||
Invesco Senior Loan ETF | United States | 196,765 | $ | 4,519,692 | ||||||||||||
|
| |||||||||||||||
Principal
| ||||||||||||||||
Corporate Bonds 18.7% | ||||||||||||||||
Automobiles & Components 0.2% | ||||||||||||||||
Aptiv Corp., senior bond, 4.15%, 3/15/24 | United States | 900,000 | 929,539 | |||||||||||||
|
| |||||||||||||||
Banks 5.2% | ||||||||||||||||
aBanca Monte dei Paschi di Siena SpA, | ||||||||||||||||
secured note, Reg S, 2.875%, 7/16/62 | Italy | 1,500,000 | EUR | 1,792,908 | ||||||||||||
secured note, Reg S, 2.125%, 11/26/63 | Italy | 2,000,000 | EUR | 2,288,930 | ||||||||||||
aBanca Popolare di Milano Scarl, | ||||||||||||||||
secured note, Reg S, 0.875%, 9/14/23 | Italy | 900,000 | EUR | 1,020,297 | ||||||||||||
secured note, Reg S, 0.625%, 6/08/24 | Italy | 2,800,000 | EUR | 3,137,289 | ||||||||||||
aBanco BPM SpA, secured note, Reg S, 0.75%, 3/31/23 | Italy | 1,700,000 | EUR | 1,922,202 | ||||||||||||
Bank of America Corp., | ||||||||||||||||
senior bond, 5.50%, 12/04/19 | United States | 75,000 | GBP | 100,515 | ||||||||||||
senior note, 3.55% to 3/05/23, FRN thereafter, 3/05/24 | United States | 1,400,000 | 1,422,999 | |||||||||||||
aBank of China Ltd., senior note, Reg S, 2.875%, 4/20/22 | China | 1,000,000 | 993,090 | |||||||||||||
Bank of Nova Scotia, secured note, 1.875%, 4/26/22 | Canada | 100,000 | 98,769 | |||||||||||||
aChina Construction Bank Corp., senior note, Reg S, 2.75%, 12/04/20 | China | 1,000,000 | 994,200 | |||||||||||||
Citigroup Inc., senior note, 2.65%, 10/26/20 | United States | 1,050,000 | 1,048,886 | |||||||||||||
HSBC Holdings PLC, | ||||||||||||||||
senior note, 4.30%, 3/08/26 | United Kingdom | 800,000 | 834,176 | |||||||||||||
senior note, 3.262% to 3/13/22, FRN thereafter, 3/13/23 | United Kingdom | 1,400,000 | 1,409,681 | |||||||||||||
Industrial & Commercial Bank of China Ltd., senior note, 2.452%, 10/20/21 | China | 1,900,000 | 1,867,595 | |||||||||||||
JPMorgan Chase & Co., | ||||||||||||||||
senior bond, 3.30%, 4/01/26 | United States | 800,000 | 800,603 | |||||||||||||
senior note, 2.40%, 6/07/21 | United States | 400,000 | 397,542 | |||||||||||||
bKookmin Bank, secured note, 144A, 2.25%, 2/03/22 | South Korea | 1,800,000 | 1,780,852 | |||||||||||||
PHH Corp., senior note, 7.375%, 9/01/19 | United States | 200,000 | 200,625 | |||||||||||||
Royal Bank of Canada, secured note, 2.10%, 10/14/21 | Canada | 100,000 | 99,372 | |||||||||||||
bThe Toronto-Dominion Bank, secured note, 144A, 2.25%, 3/15/22 | Canada | 200,000 | 198,975 | |||||||||||||
aTurkiye Vakiflar Bankasi TAO, secured note, Reg S, 2.375%, 11/04/22 | Turkey | 3,800,000 | EUR | 4,138,124 | ||||||||||||
|
| |||||||||||||||
| 26,547,630 | ||||||||||||||||
|
| |||||||||||||||
Consumer Durables & Apparel 0.0%† | ||||||||||||||||
KB Home, senior note, 8.00%, 3/15/20 | United States | 100,000 | 104,250 | |||||||||||||
|
| |||||||||||||||
Consumer Services 0.1% | ||||||||||||||||
bWynn Las Vegas LLC/Wynn Las Vegas Capital Corp., senior bond, 144A, 5.50%, 3/01/25 | United States | 525,000 | 531,400 | |||||||||||||
|
| |||||||||||||||
Diversified Financials 2.1% | ||||||||||||||||
Capital One Financial Corp., senior note, 3.05%, 3/09/22 | United States | 1,200,000 | 1,205,171 | |||||||||||||
cDeutsche Bank AG, senior note, FRN, 3.954%, (3-month USD LIBOR + 1.31%), 8/20/20 | Germany | 100,000 | 100,117 | |||||||||||||
bDexia Credit Local SA, senior note, 144A, 2.375%, 9/20/22 | France | 250,000 | 248,370 | |||||||||||||
The Goldman Sachs Group Inc., | ||||||||||||||||
senior note, 3.75%, 5/22/25 | United States | 2,000,000 | 2,029,888 | |||||||||||||
csenior note, FRN, 3.811%, (3-month USD LIBOR + 1.20%), 9/15/20 | United States | 500,000 | 505,444 | |||||||||||||
16 | Annual Report | franklintempleton.com | ||
FRANKLIN STRATEGIC SERIES
STATEMENT OF INVESTMENTS
Franklin Flexible Alpha Bond Fund(continued)
| Country | Principal Amount* | Value | ||||||||||||||
Corporate Bonds(continued) | ||||||||||||||||
Diversified Financials(continued) | ||||||||||||||||
b ICBCIL Finance Co. Ltd., senior note, 144A, 2.50%, 9/29/21 | China | 500,000 | $ | 490,167 | ||||||||||||
Morgan Stanley, senior note, 3.70%, 10/23/24 | United States | 1,400,000 | 1,438,551 | |||||||||||||
Navient Corp., senior bond, 8.00%, 3/25/20 | United States | 4,660,000 | 4,840,575 | |||||||||||||
|
| |||||||||||||||
|
10,858,283 |
| ||||||||||||||
|
| |||||||||||||||
Energy 1.9% | ||||||||||||||||
CNOOC Finance 2015 USA LLC, senior note, 3.50%, 5/05/25 | China | 1,700,000 | 1,712,673 | |||||||||||||
bCNPC General Capital Ltd., senior note, 144A, 3.40%, 4/16/23 | China | 2,100,000 | 2,110,731 | |||||||||||||
Energy Transfer Operating LP, senior note, 7.50%, 10/15/20 | United States | 750,000 | 798,022 | |||||||||||||
Enterprise Products Operating LLC, senior note, 3.35%, 3/15/23 | United States | 850,000 | 861,737 | |||||||||||||
bHarvest Operations Corp., senior note, 144A, 4.20%, 6/01/23 | South Korea | 1,000,000 | 1,042,818 | |||||||||||||
Oceaneering International Inc., senior note, 4.65%, 11/15/24 | United States | 50,000 | 47,735 | |||||||||||||
b Sinopec Group Overseas Development 2015 Ltd., | ||||||||||||||||
senior note, 144A, 2.50%, 4/28/20 | China | 1,800,000 | 1,793,493 | |||||||||||||
senior note, 144A, 3.25%, 4/28/25 | China | 1,000,000 | 989,098 | |||||||||||||
|
| |||||||||||||||
| 9,356,307 | ||||||||||||||||
|
| |||||||||||||||
Food, Beverage & Tobacco 0.6% | ||||||||||||||||
bImperial Brands Finance PLC, senior note, 144A, 4.25%, 7/21/25 | United Kingdom | 1,695,000 | 1,732,761 | |||||||||||||
Kraft Heinz Foods Co., | ||||||||||||||||
senior bond, 3.00%, 6/01/26 | United States | 600,000 | 566,428 | |||||||||||||
senior note, 3.50%, 7/15/22 | United States | 350,000 | 354,227 | |||||||||||||
Reynolds American Inc., senior note, 4.45%, 6/12/25 | United Kingdom | 100,000 | 103,247 | |||||||||||||
|
| |||||||||||||||
|
2,756,663 |
| ||||||||||||||
|
| |||||||||||||||
Health Care Equipment & Services 1.0% | ||||||||||||||||
Anthem Inc., senior note, 2.95%, 12/01/22 | United States | 600,000 | 599,817 | |||||||||||||
CVS Health Corp., senior note, 3.70%, 3/09/23 | United States | 1,700,000 | 1,724,045 | |||||||||||||
Edwards Lifesciences Corp., senior note, 4.30%, 6/15/28 | United States | 300,000 | 313,105 | |||||||||||||
HCA Inc., senior note, 7.50%, 2/15/22 | United States | 2,050,000 | 2,260,125 | |||||||||||||
|
| |||||||||||||||
|
4,897,092 |
| ||||||||||||||
|
| |||||||||||||||
Insurance 0.2% | ||||||||||||||||
bAthene Global Funding, secured note, 144A, 3.00%, 7/01/22 | United States | 950,000 | 949,611 | |||||||||||||
bJackson National Life Global Funding, | ||||||||||||||||
secured note, 144A, 2.25%, 4/29/21 | United States | 50,000 | 49,548 | |||||||||||||
secured note, 144A, 2.10%, 10/25/21 | United States | 25,000 | 24,590 | |||||||||||||
|
| |||||||||||||||
|
1,023,749 |
| ||||||||||||||
|
| |||||||||||||||
Materials 0.4% | ||||||||||||||||
Freeport-McMoRan Inc., senior note, 4.00%, 11/14/21 | United States | 915,000 | 927,581 | |||||||||||||
bSealed Air Corp., senior bond, 144A, 5.25%, 4/01/23 | United States | 950,000 | 992,750 | |||||||||||||
|
| |||||||||||||||
|
1,920,331 |
| ||||||||||||||
|
| |||||||||||||||
Media & Entertainment 0.3% | ||||||||||||||||
Baidu Inc., senior note, 4.375%, 5/14/24 | China | 500,000 | 521,557 | |||||||||||||
bTencent Holdings Ltd., senior note, 144A, 2.985%, 1/19/23 | China | 1,200,000 | 1,192,890 | |||||||||||||
|
| |||||||||||||||
|
1,714,447 |
| ||||||||||||||
|
| |||||||||||||||
Pharmaceuticals, Biotechnology & Life Sciences 0.4% | ||||||||||||||||
Allergan Funding SCS, senior bond, 3.80%, 3/15/25 | United States | 600,000 | 606,517 | |||||||||||||
Amgen Inc., senior note, 2.60%, 8/19/26 | United States | 850,000 | 807,101 | |||||||||||||
bBayer U.S. Finance II LLC, senior note, 144A, 3.875%, 12/15/23 | Germany | 400,000 | 403,704 | |||||||||||||
bSABIC Capital II BV, senior note, 144A, 4.50%, 10/10/28 | Saudi Arabia | 400,000 | 423,046 | |||||||||||||
|
| |||||||||||||||
|
2,240,368 |
| ||||||||||||||
|
| |||||||||||||||
franklintempleton.com | Annual Report | 17 | ||
FRANKLIN STRATEGIC SERIES
STATEMENT OF INVESTMENTS
Franklin Flexible Alpha Bond Fund(continued)
| Country | Principal Amount* | Value | ||||||||||||||
Corporate Bonds(continued) | ||||||||||||||||
Real Estate 0.6% | ||||||||||||||||
American Tower Corp., senior bond, 3.375%, 10/15/26 | United States | 700,000 | $ | 689,712 | ||||||||||||
aChina Overseas Finance Cayman VII Ltd., senior note, Reg S, 4.25%, 4/26/23 | China | 2,500,000 | 2,571,712 | |||||||||||||
|
| |||||||||||||||
| 3,261,424 | ||||||||||||||||
|
| |||||||||||||||
Retailing 0.3% | ||||||||||||||||
Alibaba Group Holding Ltd., senior note, 2.80%, 6/06/23 | China | 1,100,000 | 1,088,340 | |||||||||||||
bPetSmart Inc., senior note, 144A, 7.125%, 3/15/23 | United States | 550,000 | 489,500 | |||||||||||||
|
| |||||||||||||||
| 1,577,840 | ||||||||||||||||
|
| |||||||||||||||
Semiconductors & Semiconductor Equipment 0.2% | ||||||||||||||||
Maxim Integrated Products Inc., senior note, 3.45%, 6/15/27 | United States | 800,000 | 777,109 | |||||||||||||
|
| |||||||||||||||
Software & Services 0.2% | ||||||||||||||||
Fiserv Inc., senior bond, 3.85%, 6/01/25 | United States | 800,000 | 824,460 | |||||||||||||
|
| |||||||||||||||
Technology Hardware & Equipment 0.0%† | ||||||||||||||||
b Sanmina Corp., senior note, first lien, 144A, 4.375%, 6/01/19 | United States | 100,000 | 100,188 | |||||||||||||
|
| |||||||||||||||
Telecommunication Services 1.1% | ||||||||||||||||
CenturyLink Inc., senior note, Series S, 6.45%, 6/15/21 | United States | 4,700,000 | 4,911,500 | |||||||||||||
Verizon Communications Inc., senior note, 2.45%, 11/01/22 | United States | 850,000 | 843,265 | |||||||||||||
|
| |||||||||||||||
| 5,754,765 | ||||||||||||||||
|
| |||||||||||||||
Transportation 0.4% | ||||||||||||||||
bAmerican Airlines Group Inc., senior note, 144A, 5.50%, 10/01/19 | United States | 530,000 | 535,300 | |||||||||||||
American Airlines Pass Through Trust, first lien, 2016-2, AA, 3.20%, 12/15/29 | United States | 44,975 | 44,067 | |||||||||||||
FedEx Corp., senior bond, 3.20%, 2/01/25 | United States | 850,000 | 858,148 | |||||||||||||
bKazakhstan Temir Zholy Finance BV, senior bond, 144A, 6.95%, 7/10/42 | Kazakhstan | 200,000 | 237,158 | |||||||||||||
a,d RZD Capital PLC, (Russian Railways), loan participation, senior bond, Reg S, 5.70%, 4/05/22 | Russia | 200,000 | 209,167 | |||||||||||||
|
| |||||||||||||||
|
1,883,840 |
| ||||||||||||||
|
| |||||||||||||||
Utilities 3.5% | ||||||||||||||||
AES Corp., senior note, 4.00%, 3/15/21 | United States | 2,750,000 | 2,784,375 | |||||||||||||
aCGNPC International Ltd., senior note, Reg S, 3.75%, 12/11/27 | China | 2,100,000 | 2,094,383 | |||||||||||||
Dominion Energy Inc., senior bond, 2.85%, 8/15/26 | United States | 1,300,000 | 1,246,565 | |||||||||||||
Duke Energy Indiana Inc., senior secured bond, 3.75%, 7/15/20 | United States | 100,000 | 101,310 | |||||||||||||
b,e EDF SA, junior sub. bond, 144A, 5.625% to 1/22/24, FRN thereafter, Perpetual | France | 2,200,000 | 2,224,915 | |||||||||||||
bIsrael Electric Corp. Ltd., secured bond, 144A, 4.25%, 8/14/28 | Israel | 1,400,000 | 1,418,753 | |||||||||||||
bKorea East-West Power Co. Ltd., senior note, 144A, 3.875%, 7/19/23 | South Korea | 1,500,000 | 1,548,015 | |||||||||||||
The Southern Co., senior bond, 3.25%, 7/01/26 | United States | 850,000 | 839,662 | |||||||||||||
bState Grid Overseas Investment 2016 Ltd., senior note, 144A, 3.50%, 5/04/27 | China | 3,500,000 | 3,492,527 | |||||||||||||
bThree Gorges Finance I Cayman Islands Ltd., senior note, 144A, 3.70%, 6/10/25 | China | 2,100,000 | 2,140,583 | |||||||||||||
|
| |||||||||||||||
|
17,891,088 |
| ||||||||||||||
|
| |||||||||||||||
Total Corporate Bonds (Cost $94,285,723) | 94,950,773 | |||||||||||||||
|
| |||||||||||||||
18 | Annual Report | franklintempleton.com | ||
FRANKLIN STRATEGIC SERIES
STATEMENT OF INVESTMENTS
Franklin Flexible Alpha Bond Fund(continued)
| Country | Principal Amount* | Value | ||||||||||||||
Foreign Government and Agency Securities 2.8% | ||||||||||||||||
bAngolan Government International Bond, senior note, 144A, 8.25%, 5/09/28 | Angola | 700,000 | $ | 734,023 | ||||||||||||
aBanque Centrale de Tunisie International Bond, senior note, Reg S, 5.625%, 2/17/24 | Tunisia | 300,000 | EUR | 328,398 | ||||||||||||
bDominican Republic, senior note, 144A, 8.90%, 2/15/23 | Dominican Republic | 8,000,000 | DOP | 158,310 | ||||||||||||
bThe Export-Import Bank of China, | ||||||||||||||||
senior note, 144A, 2.50%, 7/31/19 | China | 200,000 | 199,869 | |||||||||||||
senior note, 144A, 3.625%, 7/31/24 | China | 2,100,000 | 2,141,706 | |||||||||||||
bThe Export-Import Bank of India, senior note, 144A, 3.875%, 2/01/28 | India | 3,400,000 | 3,365,764 | |||||||||||||
The Export-Import Bank of Korea, senior note, 2.875%, 1/21/25 | South Korea | 2,000,000 | 1,988,090 | |||||||||||||
Government of Colombia, senior bond, 9.85%, 6/28/27 | Colombia | 1,935,000,000 | COP | 741,303 | ||||||||||||
bGovernment of Gabon, 144A, 6.375%, 12/12/24 | Gabon | 500,000 | 483,265 | |||||||||||||
Government of Indonesia, senior bond, FR70, 8.375%, 3/15/24 | Indonesia | 263,000,000 | IDR | 19,252 | ||||||||||||
bGovernment of Iraq, 144A, 5.80%, 1/15/28 | Iraq | 800,000 | 779,216 | |||||||||||||
bGovernment of Kazakhstan, senior bond, 144A, 4.875%, 10/14/44 | Kazakhstan | 300,000 | 322,998 | |||||||||||||
Government of South Africa, senior bond, 7.00%, 2/28/31 | South Africa | 11,100,000 | ZAR | 653,064 | ||||||||||||
bGovernment of Ukraine, senior bond, 144A, 7.375%, 9/25/32 | Ukraine | 800,000 | 705,840 | |||||||||||||
fGovernment of Uruguay, senior bond, Index Linked, 3.70%, 6/26/37 | Uruguay | 21,486,098 | UYU | 634,725 | ||||||||||||
The Korea Development Bank, senior note, 3.375%, 3/12/23 | South Korea | 600,000 | 609,960 | |||||||||||||
Republic of Colombia, senior bond, 5.00%, 6/15/45 | Colombia | 600,000 | 627,981 | |||||||||||||
|
| |||||||||||||||
Total Foreign Government and Agency Securities | 14,493,764 | |||||||||||||||
|
| |||||||||||||||
U.S. Government and Agency Securities 1.5% | ||||||||||||||||
fU.S. Treasury Note, | ||||||||||||||||
Index Linked, 0.25%, 1/15/25 | United States | 1,429,878 | 1,415,177 | |||||||||||||
Index Linked, 0.625%, 1/15/26 | United States | 3,084,649 | 3,113,820 | |||||||||||||
Index Linked, 0.125%, 7/15/26 | United States | 2,952,314 | 2,884,516 | |||||||||||||
|
| |||||||||||||||
Total U.S. Government and Agency Securities | 7,413,513 | |||||||||||||||
|
| |||||||||||||||
Asset-Backed Securities and Commercial Mortgage-Backed Securities 62.0% | ||||||||||||||||
Banks 0.3% | ||||||||||||||||
b,g DBCG Mortgage Trust, 2017-BBG, A, 144A, FRN, 3.173%, (1-month USD LIBOR + 0.70%), 6/15/34 | United States | 1,500,000 | 1,499,611 | |||||||||||||
gImpac Secured Assets Corp., 2004-4, M1, FRN, 3.242%, (1-month USD LIBOR + 0.765%), 2/25/35 | United States | 4,831 | 4,852 | |||||||||||||
|
| |||||||||||||||
| 1,504,463 | ||||||||||||||||
|
| |||||||||||||||
Diversified Financials 61.5% | ||||||||||||||||
b,g Alinea CLO Ltd., 2018-1A, B, 144A, FRN, 4.242%, (3-month USD LIBOR + 1.65%), 7/20/31 | United States | 2,300,000 | 2,250,757 | |||||||||||||
b,h AMMC CLO 15 Ltd., | ||||||||||||||||
2014-15A, ARR, 144A, FRN, 3.857%, 1/15/32 | United States | 1,000,000 | 995,930 | |||||||||||||
2014-15A, BRR, 144A, FRN, 4.397%, 1/15/32 | United States | 439,516 | 438,505 | |||||||||||||
b,g AMMC CLO 21 Ltd., 2017-21A, C, 144A, FRN, 4.838%, (3-month USD LIBOR + 2.10%), 11/02/30 | United States | 400,000 | 389,896 | |||||||||||||
b,h AMMC CLO XI Ltd., 2012-11A, A1R2, 144A, FRN, 3.593%, 4/30/31 | United States | 5,350,000 | 5,270,552 | |||||||||||||
b,g Antares CLO Ltd., 2018-1A, B, 144A, FRN, 4.242%, (3-month USD LIBOR + 1.65%), 4/20/31 | United States | 600,000 | 585,558 | |||||||||||||
b,h ARES L CLO Ltd., 2018-50A, B, 144A, FRN, 4.478%, 1/15/32 | United States | 2,000,000 | 1,994,780 | |||||||||||||
franklintempleton.com | Annual Report | 19 | ||
FRANKLIN STRATEGIC SERIES
STATEMENT OF INVESTMENTS
Franklin Flexible Alpha Bond Fund(continued)
| Country | Principal Amount* | Value | ||||||||||||||
Asset-Backed Securities and Commercial Mortgage-Backed Securities(continued) | ||||||||||||||||
Diversified Financials(continued) | ||||||||||||||||
b,h ARES LII CLO Ltd., | ||||||||||||||||
2019-52A, A2, 144A, FRN, 4.259%, 4/22/31 | United States | 345,528 | $ | 344,329 | ||||||||||||
2019-52A, C, 144A, FRN, 5.289%, 4/22/31 | United States | 500,000 | 499,175 | |||||||||||||
2019-52A, D, 144A, FRN, 6.559%, 4/22/31 | United States | 851,852 | 848,555 | |||||||||||||
b,h Atrium XII, 2012A, CR, 144A, FRN, 3.422%, 4/22/27 | United States | 7,000,000 | 6,979,350 | |||||||||||||
b,g Atrium XIII, | ||||||||||||||||
2013A, B, 144A, FRN, 4.092%, (3-month USD LIBOR + 1.50%), 11/21/30 | United States | 2,000,000 | 1,971,300 | |||||||||||||
2013A, C, 144A, FRN, 4.392%, (3-month USD LIBOR + 1.80%), 11/21/30 | United States | 600,000 | 584,268 | |||||||||||||
b,h Atrium XV, 15A, D, 144A, FRN, 5.592%, 1/23/31 | United States | 1,666,667 | 1,629,084 | |||||||||||||
bBAMLL Commercial Mortgage Securities Trust, | ||||||||||||||||
2012-PARK, A, 144A, 2.959%, 12/10/30 | United States | 100,000 | 101,245 | |||||||||||||
2015-200P, A, 144A, 3.218%, 4/14/33 | United States | 600,000 | 608,006 | |||||||||||||
Banc of America Commercial Mortgage Trust, 2015-UBS7, A4, 3.705%, 9/15/48 | United States | 100,000 | 103,686 | |||||||||||||
b,g Bellemeade Re Ltd., 2018-1A, M1B, 144A, FRN, 4.077%, (1-month USD LIBOR + 1.60%), 4/25/28 | Bermuda | 1,320,000 | 1,326,646 | |||||||||||||
b,g Betony CLO 2 Ltd., 2018-1A, C, 144A, FRN, 5.483%, (3-month USD LIBOR + 2.90%), 4/30/31 | United States | 500,000 | 478,915 | |||||||||||||
b,h BlueMountain CLO Ltd., | ||||||||||||||||
2012-2A, BR2, 144A, FRN, 4.094%, 11/20/28 | United States | 918,083 | 915,577 | |||||||||||||
2012-2A, DR2, 144A, FRN, 5.544%, 11/20/28 | United States | 2,000,000 | 1,960,440 | |||||||||||||
2018-3A, B, 144A, FRN, 4.35%, 10/25/30 | United States | 3,000,000 | 2,986,200 | |||||||||||||
2018-3A, C, 144A, FRN, 4.78%, 10/25/30 | United States | 1,428,570 | 1,398,299 | |||||||||||||
b,h BlueMountain CLO XXIII Ltd., | ||||||||||||||||
2018-23A, B, 144A, FRN, 4.292%, 10/20/31 | United States | 1,000,000 | 987,820 | |||||||||||||
2018-23A, C, 144A, FRN, 4.742%, 10/20/31 | United States | 694,444 | 677,659 | |||||||||||||
b,h BlueMountain CLO XXIV Ltd., | ||||||||||||||||
2019-24A, A2, 144A, FRN, 4.224%, 4/20/31 | United States | 1,562,500 | 1,561,000 | |||||||||||||
2019-24A, D, 144A, FRN, 6.524%, 4/20/31 | United States | 1,000,000 | 997,070 | |||||||||||||
b,g BlueMountain Fuji U.S. CLO I Ltd., 2017-1A, C, 144A, FRN, 4.942%, (3-month USD LIBOR + 2.35%), 7/20/29 | United States | 60,000 | 60,026 | |||||||||||||
b,g BlueMountain Fuji U.S. CLO II Ltd., 2017-2A, A1A, 144A, FRN, 3.792%, (3-month USD LIBOR + 1.20%), 10/20/30 | United States | 250,000 | 250,190 | |||||||||||||
b,g BlueMountain Fuji U.S. CLO III Ltd., 2017-3A, C, 144A, FRN, 4.297%, (3-month USD LIBOR + 1.70%), 1/15/30 | United States | 1,900,000 | 1,833,025 | |||||||||||||
bBRAVO Residential Funding Trust, 2019-1, A1C, 144A, 3.50%, 3/25/58 | United States | 1,270,000 | 1,270,648 | |||||||||||||
b,h Burnham Park CLO Ltd., | ||||||||||||||||
2016-1A, BR, 144A, FRN, 4.092%, 10/20/29 | United States | 3,000,000 | 2,959,830 | |||||||||||||
2016-1A, CR, 144A, FRN, 4.742%, 10/20/29 | United States | 2,000,000 | 1,968,060 | |||||||||||||
2016-1A, DR, 144A, FRN, 5.442%, 10/20/29 | United States | 2,000,000 | 1,968,840 | |||||||||||||
b,h BX Commercial Mortgage Trust, 2018-IND, A, 144A, FRN, 3.223%, 11/15/35 | United States | 833,511 | 834,137 | |||||||||||||
bBXP Trust, 2017-GM, A, 144A, 3.379%, 6/13/39 | United States | 2,000,000 | 2,028,203 | |||||||||||||
b,g Carlyle Global Market Strategies CLO Ltd., | ||||||||||||||||
2014-4RA, A1B, 144A, FRN, 3.947%, (3-month USD LIBOR + 1.35%), 7/15/30 | United States | 2,750,000 | 2,688,565 | |||||||||||||
2014-4RA, C, 144A, FRN, 5.497%, (3-month USD LIBOR + 2.90%), 7/15/30 | United States | 750,000 | 713,438 | |||||||||||||
20 | Annual Report | franklintempleton.com | ||
FRANKLIN STRATEGIC SERIES
STATEMENT OF INVESTMENTS
Franklin Flexible Alpha Bond Fund(continued)
| Country | Principal Amount* | Value | ||||||||||||||
Asset-Backed Securities and Commercial Mortgage-Backed Securities(continued) | ||||||||||||||||
Diversified Financials(continued) | ||||||||||||||||
b,h Carlyle GMS Finance MM CLO LLC, 2015-1A, A2R, 144A, FRN, 4.797%, 10/15/31 | United States | 800,000 | $ | 769,832 | ||||||||||||
b,g Carlyle U.S. CLO Ltd., | ||||||||||||||||
2017-2A, B, 144A, FRN, 4.992%, (3-month USD LIBOR + 2.40%), 7/20/31 | United States | 60,000 | 60,028 | |||||||||||||
2017-4A, B, 144A, FRN, 4.447%, (3-month USD LIBOR + 1.85%), 1/15/30 | United States | 1,107,000 | 1,078,727 | |||||||||||||
2017-4A, C, 144A, FRN, 5.397%, (3-month USD LIBOR + 2.80%), 1/15/30 | United States | 400,000 | 384,000 | |||||||||||||
b,h Cent CLO, | ||||||||||||||||
2018-28A, B, 144A, FRN, 4.889%, 11/07/30 | United States | 2,025,000 | 1,975,914 | |||||||||||||
2018-28A, C, 144A, FRN, 6.009%, 11/07/30 | United States | 2,500,000 | 2,456,275 | |||||||||||||
b,h CGRBS Commercial Mortgage Trust, 2013-VN05, C, 144A, FRN, 3.703%, 3/13/35 | United States | 450,000 | 456,494 | |||||||||||||
b,h CIM Trust, | ||||||||||||||||
2018-INV1, A4, 144A, FRN, 4.00%, 8/25/48 | United States | 1,226,386 | 1,249,414 | |||||||||||||
2019-INV1, A1, 144A, FRN, 4.00%, 2/25/49 | United States | 1,908,462 | 1,943,998 | |||||||||||||
b,h Cole Park CLO Ltd., 2015-1A, BR, 144A, FRN, 4.192%, 10/20/28 | United States | 857,143 | 853,217 | |||||||||||||
b,h Colombia Cent CLO 27 Ltd., 2018-27A, A2A, 144A, FRN, 4.18%, 10/25/28 | United States | 769,231 | 761,846 | |||||||||||||
bCOMM Mortgage Trust, | ||||||||||||||||
h2014-277P, A, 144A, FRN, 3.732%, 8/10/49 | United States | 900,000 | 934,052 | |||||||||||||
2015-3BP, A, 144A, 3.178%, 2/10/35 | United States | 600,000 | 606,912 | |||||||||||||
hConseco Finance Securitizations Corp., 2002-2, M1, FRN, 7.424%, 3/01/33 | United States | 59,838 | 64,845 | |||||||||||||
bCore Industrial Trust, 2015-CALW, A, 144A, 3.04%, 2/10/34 | United States | 28,460 | 28,822 | |||||||||||||
b,g Dorchester Park CLO Ltd., 2015-1A, CR, 144A, FRN, 4.342%, (3-month USD | United States | 1,350,000 | 1,341,576 | |||||||||||||
b,h Dryden 38 Senior Loan Fund, 2015-38A, CR, 144A, FRN, 4.597%, 7/15/30 | United States | 2,500,000 | 2,454,275 | |||||||||||||
b,h Dryden 45 Senior Loan Fund, | ||||||||||||||||
2016-45A, A2R, 144A, FRN, 3.997%, 10/15/30 | United States | 1,000,000 | 995,160 | |||||||||||||
2016-45A, BR, 144A, FRN, 4.297%, 10/15/30 | United States | 1,000,000 | 995,030 | |||||||||||||
2016-45A, CR, 144A, FRN, 4.797%, 10/15/30 | United States | 1,250,000 | 1,243,313 | |||||||||||||
b,g Dryden 49 Senior Loan Fund, 2017-49A, C, 144A, FRN, 4.951%, (3-month USD LIBOR + 2.35%), 7/18/30 | United States | 60,000 | 60,013 | |||||||||||||
b,g Dryden 53 CLO Ltd., | ||||||||||||||||
2017-53A, B, 144A, FRN, 3.997%, (3-month USD LIBOR + 1.40%), 1/15/31 | United States | 6,000,000 | 5,873,280 | |||||||||||||
2017-53A, C, 144A, FRN, 4.297%, (3-month USD LIBOR + 1.70%), 1/15/31 | United States | 1,000,000 | 963,210 | |||||||||||||
b,h Dryden 61 CLO Ltd., 61A, A2, FRN, 3.988%, 1/17/32 | United States | 2,000,000 | 1,989,340 | |||||||||||||
b,g Dryden 64 CLO Ltd., | ||||||||||||||||
2018-64A, A, 144A, FRN, 3.571%, (3-month USD LIBOR + 0.97%), 4/18/31 | United States | 3,000,000 | 2,957,220 | |||||||||||||
2018-64A, C, 144A, FRN, 4.351%, (3-month USD LIBOR + 1.75%), 4/18/31 | United States | 750,000 | 724,253 | |||||||||||||
franklintempleton.com | Annual Report | 21 | ||
FRANKLIN STRATEGIC SERIES
STATEMENT OF INVESTMENTS
Franklin Flexible Alpha Bond Fund(continued)
| Country | Principal Amount* | Value | ||||||||||||||
Asset-Backed Securities and Commercial Mortgage-Backed | ||||||||||||||||
Diversified Financials(continued) | ||||||||||||||||
b,h Dryden 70 CLO Ltd., 2018-70A, B, 144A, FRN, 4.54%, 1/16/32 | United States | 280,290 | $ | 278,995 | ||||||||||||
b,h Eleven Madison Trust Mortgage Trust, 2015-11MD, A, 144A, FRN, 3.673%, 9/10/35 | United States | 2,005,000 | 2,066,789 | |||||||||||||
b,g Ellington CLO III Ltd., 2018-3A, A1, 144A, FRN, 4.242%, (3-month USD LIBOR + 1.65%) 7/20/30 | United States | 500,000 | 496,330 | |||||||||||||
FHLMC Structured Agency Credit Risk Debt Notes, | ||||||||||||||||
g 2013-DN2, M2, FRN, 6.727%, (1-month USD LIBOR + 4.25%), 11/25/23 | United States | 2,406,155 | 2,627,827 | |||||||||||||
g 2014-DN1, M2, FRN, 4.677%, (1-month USD LIBOR + 2.20%), 2/25/24 | United States | 372,222 | 378,554 | |||||||||||||
g 2014-DN2, M3, FRN, 6.077%, (1-month USD LIBOR + 3.60%), 4/25/24 | United States | 2,645,000 | 2,849,461 | |||||||||||||
g 2014-DN3, M3, FRN, 6.477%, (1-month USD LIBOR + 4.00%), 8/25/24 | United States | 2,093,650 | 2,263,217 | |||||||||||||
g 2014-DN4, M3, FRN, 7.027%, (1-month USD LIBOR + 4.55%), 10/25/24 | United States | 1,584,919 | 1,737,440 | |||||||||||||
g 2014-HQ1, M3, FRN, 6.577%, (1-month USD LIBOR + 4.10%), 8/25/24 | United States | 973,871 | 1,056,646 | |||||||||||||
g 2014-HQ2, M2, FRN, 4.677%, (1-month USD LIBOR + 2.20%), 9/25/24 | United States | 371,678 | 378,838 | |||||||||||||
g 2014-HQ2, M3, FRN, 6.227%, (1-month USD LIBOR + 3.75%), 9/25/24 | United States | 2,500,000 | 2,770,758 | |||||||||||||
g 2014-HQ3, M3, FRN, 7.227%, (1-month USD LIBOR + 4.75%), 10/25/24 | United States | 248,604 | 273,426 | |||||||||||||
g 2015-DN1, M3, FRN, 6.627%, (1-month USD LIBOR + 4.15%), 1/25/25 | United States | 612,692 | 654,891 | |||||||||||||
g 2015-DNA1, M2, FRN, 4.327%, (1-month USD LIBOR + 1.85%), 10/25/27 | United States | 178,904 | 180,786 | |||||||||||||
g 2015-DNA1, M3, FRN, 5.777%, (1-month USD LIBOR + 3.30%), 10/25/27 | United States | 2,000,000 | 2,167,460 | |||||||||||||
g 2015-DNA2, M2, FRN, 5.077%, (1-month USD LIBOR + 2.60%), 12/25/27 | United States | 95,439 | 96,596 | |||||||||||||
g 2015-DNA2, M3, FRN, 6.377%, (1-month USD LIBOR + 3.90%), 12/25/27 | United States | 2,850,000 | 3,071,614 | |||||||||||||
g 2015-DNA3, M2, FRN, 5.327%, (1-month USD LIBOR + 2.85%), 4/25/28 | United States | 362,426 | 370,925 | |||||||||||||
g 2015-DNA3, M3, FRN, 7.177%, (1-month USD LIBOR + 4.70%), 4/25/28 | United States | 2,500,000 | 2,872,231 | |||||||||||||
g 2015-HQ1, M3, FRN, 6.277%, (1-month USD LIBOR + 3.80%), 3/25/25 | United States | 528,843 | 557,902 | |||||||||||||
g 2015-HQ2, M3, FRN, 5.727%, (1-month USD LIBOR + 3.25%), 5/25/25 | United States | 1,500,000 | 1,621,215 | |||||||||||||
g 2015-HQA1, M3, FRN, 7.177%, (1-month USD LIBOR + 4.70%), 3/25/28 | United States | 2,000,000 | 2,244,665 | |||||||||||||
g 2015-HQA2, M2, FRN, 5.277%, (1-month USD LIBOR + 2.80%), 5/25/28 | United States | 217,719 | 222,169 | |||||||||||||
g 2015-HQA2, M3, FRN, 7.277%, (1-month USD LIBOR + 4.80%), 5/25/28 | United States | 2,000,000 | 2,266,168 | |||||||||||||
g 2016-DNA1, M3, FRN, 8.027%, (1-month USD LIBOR + 5.55%), 7/25/28 | United States | 1,550,000 | 1,814,415 | |||||||||||||
22 | Annual Report | franklintempleton.com | ||
FRANKLIN STRATEGIC SERIES
STATEMENT OF INVESTMENTS
Franklin Flexible Alpha Bond Fund(continued)
| Country | Principal Amount* | Value | ||||||||||||||
Asset-Backed Securities and Commercial Mortgage-Backed | ||||||||||||||||
Diversified Financials(continued) | ||||||||||||||||
FHLMC Structured Agency Credit Risk Debt Notes, (continued) | ||||||||||||||||
g 2016-DNA2, M2, FRN, 4.677%, (1-month USD LIBOR + 2.20%), 10/25/28 | United States | 180,362 | $ | 181,463 | ||||||||||||
g 2016-DNA2, M3, FRN, 7.127%, (1-month USD LIBOR + 4.65%), 10/25/28 | United States | 3,600,000 | 4,010,214 | |||||||||||||
g 2016-DNA3, M2, FRN, 4.477%, (1-month USD LIBOR + 2.00%), 12/25/28 | United States | 229,809 | 231,629 | |||||||||||||
g 2016-HQA2, M2, FRN, 4.727%, (1-month USD LIBOR + 2.25%), 11/25/28 | United States | 372,566 | 378,382 | |||||||||||||
g 2016-HQA2, M3, FRN, 7.627%, (1-month USD LIBOR + 5.15%), 11/25/28 | United States | 2,000,000 | 2,321,638 | |||||||||||||
g 2016-HQA3, M2, FRN, 3.827%, (1-month USD LIBOR + 1.35%), 3/25/29 | United States | 2,349,454 | 2,363,826 | |||||||||||||
g 2016-HQA4, M2, FRN, 3.777%, (1-month USD LIBOR + 1.30%), 4/25/29 | United States | 700,000 | 703,764 | |||||||||||||
h2017-DNA1, M2, FRN, 5.727%, 7/25/29 | United States | 2,600,000 | 2,785,226 | |||||||||||||
h2017-DNA2, M2, FRN, 5.927%, 10/25/29 | United States | 3,000,000 | 3,252,438 | |||||||||||||
g 2017-DNA3, M2, FRN, 4.977%, (1-month USD LIBOR + 2.50%), 3/25/30 | United States | 2,000,000 | 2,063,995 | |||||||||||||
h2017-HQA1, M2, FRN, 6.027%, 8/25/29 | United States | 2,350,000 | 2,524,355 | |||||||||||||
b,g Flagship CLO VIII Ltd., 2014-8A, CRR, 144A, FRN, 4.401%, (3-month USD LIBOR + 1.80%), 1/16/26 | United States | 1,400,000 | 1,370,992 | |||||||||||||
b,h Flagstar Mortgage Trust, 2018-6RR, 1A3, 144A, FRN, 4.00%, 10/25/48 | United States | 1,306,788 | 1,325,096 | |||||||||||||
FNMA Connecticut Avenue Securities, | ||||||||||||||||
g 2013-C01, M2, FRN, 7.727%, (1-month USD LIBOR + 5.25%), 10/25/23 | United States | 2,863,669 | 3,228,967 | |||||||||||||
g 2014-C01, M2, FRN, 6.877%, (1-month USD LIBOR + 4.40%), 1/25/24 | United States | 3,300,000 | 3,681,188 | |||||||||||||
g 2014-C02, 1M2, FRN, 5.077%, (1-month USD LIBOR + 2.60%), 5/25/24 | United States | 1,820,000 | 1,909,840 | |||||||||||||
g 2014-C02, 2M2, FRN, 5.077%, (1-month USD LIBOR + 2.60%), 5/25/24 | United States | 2,619,410 | 2,735,511 | |||||||||||||
g 2014-C03, 1M2, FRN, 5.477%, (1-month USD LIBOR + 3.00%), 7/25/24 | United States | 1,241,633 | 1,327,894 | |||||||||||||
g 2014-C03, 2M2, FRN, 5.377%, (1-month USD LIBOR + 2.90%), 7/25/24 | United States | 2,465,276 | 2,593,214 | |||||||||||||
g 2014-C04, 1M1, FRN, 7.377%, (1-month USD LIBOR + 4.90%), 11/25/24 | United States | 2,935,436 | 3,306,820 | |||||||||||||
g 2014-C04, 2M2, FRN, 7.477%, (1-month USD LIBOR + 5.00%), 11/25/24 | United States | 458,320 | 510,032 | |||||||||||||
g 2015-C01, 1M2, FRN, 6.777%, (1-month USD LIBOR + 4.30%), 2/25/25 | United States | 30,021 | 32,632 | |||||||||||||
g 2015-C01, 2M2, FRN, 7.027%, (1-month USD LIBOR + 4.55%), 2/25/25 | United States | 115,804 | 124,582 | |||||||||||||
g 2015-C02, 1M2, FRN, 6.477%, (1-month USD LIBOR + 4.00%), 5/25/25 | United States | 439,437 | 473,544 | |||||||||||||
g 2015-C02, 2M2, FRN, 6.477%, (1-month USD LIBOR + 4.00%), 5/25/25 | United States | 132,918 | 141,654 | |||||||||||||
g 2015-C03, 1M2, FRN, 7.477%, (1-month USD LIBOR + 5.00%), 7/25/25 | United States | 2,598,421 | 2,889,164 | |||||||||||||
franklintempleton.com | Annual Report | 23 | ||
FRANKLIN STRATEGIC SERIES
STATEMENT OF INVESTMENTS
Franklin Flexible Alpha Bond Fund(continued)
| Country | Principal Amount* | Value | ||||||||||||||
Asset-Backed Securities and Commercial Mortgage-Backed | ||||||||||||||||
Diversified Financials(continued) | ||||||||||||||||
FNMA Connecticut Avenue Securities, (continued) | ||||||||||||||||
g 2015-C03, 2M2, FRN, 7.477%, (1-month USD LIBOR + 5.00%), 7/25/25 | United States | 666,066 | $ | 733,329 | ||||||||||||
g 2016-C01, 1M2, FRN, 9.227%, (1-month USD LIBOR + 6.75%), 8/25/28 | United States | 2,588,159 | 3,004,251 | |||||||||||||
h2016-C04, 1M2, FRN, 6.727%, 1/25/29 | United States | 2,000,000 | 2,202,776 | |||||||||||||
g 2017-C01, 1B1, FRN, 8.227%, (1-month USD LIBOR + 5.75%), 7/25/29 | United States | 33,000 | 39,241 | |||||||||||||
g 2017-C01, 1M2, FRN, 6.027%, (1-month USD LIBOR + 3.55%), 7/25/29 | United States | 890,000 | 956,401 | |||||||||||||
h2017-C03, 1M2, FRN, 5.477%, 10/25/29 | United States | 2,780,000 | 2,955,722 | |||||||||||||
h2017-C03, 2M2, FRN, 5.327%, 11/25/29 | United States | 570,000 | 593,548 | |||||||||||||
h2017-C07, 1M1, FRN, 3.127%, 5/25/30 | United States | 1,639,834 | 1,638,139 | |||||||||||||
g 2018-C04, 2M1, FRN, 3.227%, (1-month USD LIBOR + 0.75%), 12/25/30 | United States | 613,539 | 613,291 | |||||||||||||
hC02, 1M2, FRN, 8.477%, 9/25/28 | United States | 244,994 | 278,678 | |||||||||||||
b,h FREMF Mortgage Trust, 2018-K72, B, 144A, FRN, 4.117%, 12/25/50 | United States | 450,000 | 456,809 | |||||||||||||
b,h Galaxy XXVI CLO Ltd., | ||||||||||||||||
2018-26A, A, 144A, FRN, 3.852%, 11/22/31 | United States | 685,921 | 681,456 | |||||||||||||
2018-26A, B, 144A, FRN, 4.352%, 11/22/31 | United States | 600,000 | 594,732 | |||||||||||||
b,g Galaxy XXVII CLO Ltd., | ||||||||||||||||
2018-27A, A, 144A, FRN, 3.703%, (3-month USD LIBOR + 1.02%), 5/16/31 | United States | 2,500,000 | 2,458,675 | |||||||||||||
2018-27A, C, 144A, FRN, 4.483%, (3-month USD LIBOR + 1.80%), 5/16/31 | United States | 1,450,000 | 1,380,415 | |||||||||||||
2018-27A, C, 144A, FRN, 5.433%, (3-month USD LIBOR + 2.75%), 5/16/31 | United States | 300,000 | 287,262 | |||||||||||||
b,g Gilbert Park CLO Ltd., | ||||||||||||||||
2017-1A, B, 144A, FRN, 4.197%, (3-month USD LIBOR + 1.60%), 10/15/30 | United States | 3,000,000 | 2,964,870 | |||||||||||||
2017-1A, D, 144A, FRN, 5.547%, (3-month USD LIBOR + 2.95%), 10/15/30 | United States | 400,000 | 390,432 | |||||||||||||
GS Mortgage Securities Trust, | ||||||||||||||||
2016-GS3, A4, 2.85%, 10/10/49 | United States | 600,000 | 590,890 | |||||||||||||
2017-GS5, A4, 3.674%, 3/10/50 | United States | 2,600,000 | 2,697,368 | |||||||||||||
2017-GS6, A3, 3.433%, 5/10/50 | United States | 2,000,000 | 2,028,206 | |||||||||||||
b,g Halcyon Loan Advisors Funding Ltd., 2018-1A, A2, 144A, FRN, 4.392%, (3-month USD LIBOR + 1.80%), 7/21/31 | United States | 400,000 | 393,012 | |||||||||||||
b,h Harbor Park CLO Ltd., | ||||||||||||||||
1A, B1, 144A, FRN, 4.539%, 1/20/31 | United States | 1,333,333 | 1,326,666 | |||||||||||||
1A, D, 144A, FRN, 5.739%, 1/20/31 | United States | 1,296,296 | 1,242,785 | |||||||||||||
bInvitation Homes Trust, | ||||||||||||||||
g 2017-SFR2, A, 144A, FRN, 3.324%, (1-month USD LIBOR + 0.85%), 12/17/36 | United States | 3,242,428 | 3,225,370 | |||||||||||||
g 2018-SFR1, A, 144A, FRN, 3.174%, (1-month USD LIBOR + 0.70%), 3/17/37 | United States | 1,560,914 | 1,546,466 | |||||||||||||
g 2018-SFR3, A, 144A, FRN, 3.474%, (1-month USD LIBOR + 1.00%), 7/17/37 | United States | 1,114,394 | 1,117,371 | |||||||||||||
h2018-SFR4, A, 144A, FRN, 3.574%, 1/17/38 | United States | 1,360,632 | 1,367,424 | |||||||||||||
24 | Annual Report | franklintempleton.com | ||
FRANKLIN STRATEGIC SERIES
STATEMENT OF INVESTMENTS
Franklin Flexible Alpha Bond Fund(continued)
| Country | Principal Amount* | Value | ||||||||||||||
Asset-Backed Securities and Commercial Mortgage-Backed | ||||||||||||||||
Diversified Financials(continued) | ||||||||||||||||
b,h J.P. Morgan Chase Commercial Mortgage Securities Trust, 2016-NINE, A, 144A, FRN, 2.949%, 10/06/38 | United States | 600,000 | $ | 589,040 | ||||||||||||
JPMBB Commercial Mortgage Securities Trust, | ||||||||||||||||
2015-C30, A5, 3.822%, 7/15/48 | United States | 1,500,000 | 1,564,184 | |||||||||||||
h2015-C30, AS, FRN, 4.226%, 7/15/48 | United States | 450,000 | 473,085 | |||||||||||||
2016-C1, A5, 3.576%, 3/15/49 | United States | 1,500,000 | 1,549,017 | |||||||||||||
h,i JPMDB Commercial Mortgage Securities Trust, 2017-C5, XA, IO, FRN, 1.143%, 3/15/50 | United States | 195,805 | 11,489 | |||||||||||||
b,g LCM 26 Ltd., 26A, C, 144A, FRN, 4.392%, (3-month USD LIBOR + 1.80%), 1/20/31 | United States | 400,000 | 386,452 | |||||||||||||
b,h LCM 28 Ltd., | ||||||||||||||||
28A, B, 144A, FRN, 4.192%, 10/20/30 | United States | 1,000,000 | 987,970 | |||||||||||||
28A, C, 144A, FRN, 4.742%, 10/20/30 | United States | 500,000 | 487,140 | |||||||||||||
b,h LCM XVI LP, 2016A, BR2, 144A, FRN, 4.347%, 10/15/31 | United States | 878,301 | 877,546 | |||||||||||||
b,h LCM XXII Ltd., | ||||||||||||||||
22A, A2R, 144A, FRN, 4.042%, 10/20/28 | United States | 3,500,000 | 3,438,995 | |||||||||||||
22A, BR, 144A, FRN, 4.592%, 10/20/28 | United States | 1,500,000 | 1,469,265 | |||||||||||||
22A, CR, 144A, FRN, 5.392%, 10/20/28 | United States | 2,000,000 | 1,930,720 | |||||||||||||
b,g LCM XXV Ltd., 25A, A, 144A, FRN, 3.802%, (3-month USD LIBOR + 1.21%), 7/20/30 | United States | 250,000 | 249,920 | |||||||||||||
b,g Long Point Park CLO Ltd., | ||||||||||||||||
2017-1A, A2, 144A, FRN, 3.963%, (3-month USD LIBOR + 1.375%), 1/17/30 | United States | 1,000,000 | 979,620 | |||||||||||||
2017-1A, B, 144A, FRN, 4.288%, (3-month USD LIBOR + 1.70%), 1/17/30 | United States | 1,000,000 | 964,850 | |||||||||||||
b,h Madison Park Funding XIV Ltd., | ||||||||||||||||
2014-14A, A2RR, 144A, FRN, 3.992%, 10/22/30 | United States | 1,000,000 | 1,002,930 | |||||||||||||
2014-14A, BRR, 144A, FRN, 4.292%, 10/22/30 | United States | 1,500,000 | 1,496,805 | |||||||||||||
2014-14A, CRR, 144A, FRN, 4.792%, 10/22/30 | United States | 562,500 | 560,649 | |||||||||||||
b,h Madison Park Funding XXIX Ltd., | ||||||||||||||||
2018-29A, A2, 144A, FRN, 4.051%, 10/18/30 | United States | 1,468,182 | 1,457,450 | |||||||||||||
2018-29A, B, 144A, FRN, 4.351%, 10/18/30 | United States | 3,000,000 | 2,994,360 | |||||||||||||
2018-29A, C, 144A, FRN, 4.801%, 10/18/30 | United States | 766,129 | 753,756 | |||||||||||||
2018-29A, D, 144A, FRN, 5.601%, 10/18/30 | United States | 600,000 | 576,486 | |||||||||||||
b,g Madison Park Funding XXVI Ltd., 07-4A, AR, 144A, FRN, 3.782%, (3-month USD LIBOR + 1.20%), 7/29/30 | United States | 2,500,000 | 2,496,875 | |||||||||||||
b,h Madison Park Funding XXXI Ltd., | ||||||||||||||||
2018-31A, A2A, 144A, FRN, 4.092%, 1/23/31 | United States | 750,000 | 746,123 | |||||||||||||
2018-31A, B, 144A, FRN, 4.292%, 1/23/31 | United States | 3,000,000 | 2,984,940 | |||||||||||||
2018-31A, C, 144A, FRN, 4.742%, 1/23/31 | United States | 1,950,000 | 1,920,536 | |||||||||||||
b,h Mill City Mortgage Loan Trust, | ||||||||||||||||
2017-1, A1, 144A, FRN, 2.75%, 11/25/58 | United States | 1,168,017 | 1,161,025 | |||||||||||||
2018-1, A1, 144A, FRN, 3.25%, 5/25/62 | United States | 2,847,455 | 2,854,964 | |||||||||||||
2018-4, A1B, 144A, FRN, 3.50%, 4/25/66 | United States | 1,660,000 | 1,673,131 | |||||||||||||
bMorgan Stanley Capital I Trust, 2014-150E, A, 144A, 3.912%, 9/09/32 | United States | 450,000 | 469,595 | |||||||||||||
b,h Neuberger Berman CLO XVIII Ltd., | ||||||||||||||||
2014-18A, A1BR, 144A, FRN, 3.992%, 10/21/30 | United States | 2,550,000 | 2,554,564 | |||||||||||||
2014-18A, A2R2, 144A, FRN, 4.292%, 10/21/30 | United States | 545,455 | 540,579 | |||||||||||||
franklintempleton.com | Annual Report | 25 | ||
FRANKLIN STRATEGIC SERIES
STATEMENT OF INVESTMENTS
Franklin Flexible Alpha Bond Fund(continued)
| Country | Principal Amount* | Value | ||||||||||
Asset-Backed Securities and Commercial Mortgage-Backed Securities(continued) | ||||||||||||
Diversified Financials(continued) | ||||||||||||
b Neuberger Berman Loan Advisers CLO Ltd., | ||||||||||||
g 2017-26A, B, 144A, FRN, 4.101%, (3-month USD LIBOR + 1.50%), 10/18/30 | United States | 539,475 | $ | 530,056 | ||||||||
h 2019-32A, B, 144A, FRN, 4.417%, 1/19/32 | United States | 2,800,000 | 2,797,172 | |||||||||
h2019-32A, C, 144A, FRN, 5.217%, 1/19/32 | United States | 2,000,000 | 2,005,740 | |||||||||
h2019-32A, D, 144A, FRN, 6.368%, 1/19/32 | United States | 710,526 | 709,929 | |||||||||
b,g Newark BSL CLO 2 Ltd., 2017-1A, B, 144A, FRN, 4.93%, (3-month USD LIBOR + 2.35%), 7/25/30 | United States | 2,000,000 | 2,000,600 | |||||||||
b,g Octagon Investment Partners 18-R Ltd., 2018-18A, C, 144A, FRN, 5.301%, (3-month USD LIBOR + 2.70%), 4/16/31 | United States | 350,000 | 333,312 | |||||||||
b,h Octagon Investment Partners 27 Ltd., 2016-1A, CR, 144A, FRN, 4.697%, 7/15/30 | United States | 1,565,000 | 1,547,128 | |||||||||
b,h Octagon Investment Partners 28 Ltd., 2016-1A, BR, 144A, FRN, 4.381%, 10/24/30 | United States | 593,141 | 594,434 | |||||||||
b,g Octagon Investment Partners 33 Ltd., | ||||||||||||
2017-1A, A2, 144A, FRN, 4.092%, (3-month USD LIBOR + 1.50%), 1/20/31 | United States | 2,000,000 | 1,970,220 | |||||||||
2017-1A, B, 144A, FRN, 4.442%, (3-month USD LIBOR + 1.85%), 1/20/31 | United States | 500,000 | 492,720 | |||||||||
2017-1A, C, 144A, FRN, 5.342%, (3-month USD LIBOR + 2.75%), 1/20/31 | United States | 250,000 | 240,130 | |||||||||
b,g Octagon Investment Partners XX Ltd., 2014-1A, AR, 144A, FRN, 3.828%, (3-month USD LIBOR + 1.13%), 8/12/26 | United States | 370,831 | 371,306 | |||||||||
b,g Octagon Investment Partners XXIII Ltd., | ||||||||||||
2015-1A, BR, 144A, FRN, 3.797%, (3-month USD LIBOR + 1.20%), 7/15/27 | United States | 1,200,000 | 1,193,568 | |||||||||
2015-1A, CR, 144A, FRN, 4.447%, (3-month USD LIBOR + 1.85%), 7/15/27 | United States | 2,000,000 | 1,989,660 | |||||||||
2015-1A, DR, 144A, FRN, 5.147%, (3-month USD LIBOR + 2.55%), 7/15/27 | United States | 300,000 | 296,100 | |||||||||
b,h Octagon Loan Funding Ltd., 2014-1A, DRR, 144A, FRN, 5.583%, 11/18/31 | United States | 1,333,333 | 1,277,160 | |||||||||
bProgress Residential Trust, 2018-SFR2, A, 144A, 3.712%, 8/17/35 | United States | 290,000 | 295,821 | |||||||||
b,h Race Point X CLO Ltd., 2016-10A, C1R, 144A, FRN, 4.58%, 7/25/31 | United States | 1,700,000 | 1,641,452 | |||||||||
b,g Radnor RE Ltd., 2018-1, M1, 144A, FRN, 3.877%, (1-month USD LIBOR + 1.40%), 3/25/28 | United States | 630,000 | 631,935 | |||||||||
b,h Sequoia Mortgage Trust, 2016-2, A4, 144A, FRN, 3.50%, 8/25/46 | United States | 1,953,713 | 1,956,144 | |||||||||
b TCI-Flatiron CLO Ltd., | ||||||||||||
h2017-1A, A, 144A, FRN, 3.883%, 11/18/30 | United States | 2,000,000 | 1,995,220 | |||||||||
g 2017-1A, B, 144A, FRN, 4.243%, (3-month USD LIBOR + 1.56%), 11/18/30 | United States | 2,000,000 | 1,969,060 | |||||||||
g 2017-1A, C, 144A, FRN, 4.533%, (3-month USD LIBOR + 1.85%), 11/18/30 | United States | 1,200,000 | 1,149,336 | |||||||||
g 2017-1A, D, 144A, FRN, 5.433%, (3-month USD LIBOR + 2.75%), 11/18/30 | United States | 250,000 | 237,428 | |||||||||
hThornburg Mortgage Securities Trust, 2005-1, A3, FRN, 4.576%, 4/25/45 | United States | 20,104 | 20,432 | |||||||||
bTowd Point Mortgage Trust, | ||||||||||||
h2015-2, 2A1, 144A, FRN, 3.75%, 11/25/57 | United States | 314,692 | 316,610 | |||||||||
h2016-3, A1, 144A, FRN, 2.25%, 4/25/56 | United States | 1,676,063 | 1,656,325 | |||||||||
h2016-4, A1, 144A, FRN, 2.25%, 7/25/56 | United States | 1,078,787 | 1,063,262 | |||||||||
h2016-5, A1, 144A, FRN, 2.50%, 10/25/56 | United States | 422,464 | 416,462 | |||||||||
26 | Annual Report | franklintempleton.com | ||
FRANKLIN STRATEGIC SERIES
STATEMENT OF INVESTMENTS
Franklin Flexible Alpha Bond Fund(continued)
| Country | Principal Amount* | Value | ||||||||||
Asset-Backed Securities and Commercial Mortgage-Backed Securities(continued) | ||||||||||||
Diversified Financials(continued) | ||||||||||||
bTowd Point Mortgage Trust, (continued) | ||||||||||||
h2017-1, A1, 144A, FRN, 2.75%, 10/25/56 | United States | 1,289,554 | $ | 1,275,859 | ||||||||
h2017-2, A1, 144A, FRN, 2.75%, 4/25/57 | United States | 1,264,161 | 1,250,635 | |||||||||
h2017-4, A1, 144A, FRN, 2.75%, 6/25/57 | United States | 2,186,825 | 2,162,467 | |||||||||
g 2017-5, A1, 144A, FRN, 3.077%, (1-month USD LIBOR + 0.60%), 2/25/57 | United States | 134,479 | 133,946 | |||||||||
h2018-1, A1, 144A, FRN, 3.00%, 1/25/58 | United States | 559,039 | 555,321 | |||||||||
h2018-2, A1, 144A, FRN, 3.25%, 3/25/58 | United States | 279,909 | 281,315 | |||||||||
h2018-4, A1, 144A, FRN, 3.00%, 6/25/58 | United States | 1,874,615 | 1,854,017 | |||||||||
h2018-5, A1A, 144A, FRN, 3.25%, 7/25/58 | United States | 607,990 | 608,419 | |||||||||
h2019-1, A1, 144A, FRN, 3.75%, 3/25/58 | United States | 2,470,984 | 2,521,569 | |||||||||
bVoya CLO Ltd., | ||||||||||||
g 2013-2A, A1R, 144A, FRN, 3.55%, (3-month USD LIBOR + 0.97%), 4/25/31 | United States | 7,300,000 | 7,200,355 | |||||||||
g 2013-2A, BR, 144A, FRN, 4.43%, (3-month USD LIBOR + 1.85%), 4/25/31 | United States | 2,000,000 | 1,929,920 | |||||||||
g 2014-1A, BR2, 144A, FRN, 4.501%, (3-month USD LIBOR + 1.90%), 4/18/31 | United States | 2,750,000 | 2,673,467 | |||||||||
h2016-3A, A2R, 144A, FRN, 4.001%, 10/18/31 | United States | 1,636,364 | 1,643,760 | |||||||||
g 2017-2A, B, 144A, FRN, 4.947%, (3-month USD LIBOR + 2.35%), 6/07/30 | United States | 1,000,000 | 1,000,320 | |||||||||
h2018-4A, B, 144A, FRN, 4.554%, 1/15/32 | United States | 474,026 | 475,524 | |||||||||
b,g Webster Park CLO Ltd., 2015-1A, BR, 144A, FRN, 4.392%, (3-month USD LIBOR + 1.80%), 7/20/30 | United States | 2,000,000 | 1,937,520 | |||||||||
Wells Fargo Commercial Mortgage Trust, 2016-NXS6, A4, 2.918%, 11/15/49 | United States | 1,500,000 | 1,479,282 | |||||||||
b,h Wells Fargo Mortgage Backed Securities, 2018-1, A3, 144A, FRN, 3.50%, 7/25/47 | United States | 867,924 | 875,032 | |||||||||
b,g West CLO Ltd., 2014-1A, A2R, 144A, FRN, 3.951%, (3-month USD LIBOR + 1.35%), 7/18/26 | United States | 170,000 | 169,471 | |||||||||
|
| |||||||||||
| 312,164,555 | ||||||||||||
|
| |||||||||||
Real Estate 0.2% | ||||||||||||
bAmerican Homes 4 Rent, 2014-SFR3, A, 144A, 3.678%, 12/17/36 | United States | 747,409 | 764,720 | |||||||||
|
| |||||||||||
Total Asset-Backed Securities and Commercial Mortgage-Backed Securities (Cost $317,117,678) | 314,433,738 | |||||||||||
|
| |||||||||||
Municipal Bonds 0.2% | ||||||||||||
Cincinnati GO, Various Purpose, Improvement and Refunding, Series A, 5.00%, 12/01/25 | United States | 100,000 | 118,552 | |||||||||
Citizens Property Insurance Corp. Revenue, Coastal Account, senior secured, Series A-1, 5.00%, 6/01/22 | United States | 125,000 | 135,045 | |||||||||
Colorado State Board of Governors University Enterprise System Revenue, Green Bonds, Series E-2, 5.00%, 3/01/25 | United States | 100,000 | 118,157 | |||||||||
Orlando Health Obligated Group, 3.777%, 10/01/28 | United States | 105,000 | 106,475 | |||||||||
Providence St. Joseph Health Obligated Group, 2.746%, 10/01/26 | United States | 15,000 | 14,345 | |||||||||
San Jose RDA Successor Agency Tax Allocation, Senior, Refunding, Series A-T, 3.226%, 8/01/27 | United States | 190,000 | 192,580 | |||||||||
Teays Valley Local School District GO, Pickaway Fairfield and Franklin Counties, Refunding, 4.00%, 12/01/26 | United States | 100,000 | 108,758 | |||||||||
franklintempleton.com | Annual Report | 27 | ||
FRANKLIN STRATEGIC SERIES
STATEMENT OF INVESTMENTS
Franklin Flexible Alpha Bond Fund(continued)
| Country | Principal Amount* | Value | ||||||||||
Municipal Bonds(continued) | ||||||||||||
Texas State GO, Transportation Commission Highway Improvement, Series A, 5.00%, 4/01/21 | United States | 5,000 | $ | 5,319 | ||||||||
|
| |||||||||||
Total Municipal Bonds (Cost $778,837) | 799,231 | |||||||||||
|
| |||||||||||
| Number of Contracts | Notional Amount* | |||||||||||
Options Purchased 0.0%† | ||||||||||||
Puts - Over-the-Counter | ||||||||||||
Credit Default Swaptions 0.0%† | ||||||||||||
Buy protection on CDX.NA.HY.31, Premium Rate 5.00%, Strike Price $105, Counterparty JPHQ, Expires 6/19/19 | 1 | 9,800,000 | 16,797 | |||||||||
Buy Protection on CDX.NA.HY.32, Premium Rate 5.00%, Strike Price $106, Counterparty JPHQ, Expires 7/17/19 | 1 | 8,000,000 | 50,752 | |||||||||
Buy protection on CDX.NA.IG.31, Premium Rate 1.00%, Strike Price $67.50, Counterparty CITI, Expires 5/15/19 | 1 | 10,000,000 | 470 | |||||||||
Buy protection on CDX.NA.IG.31, Premium Rate 1.00%, Strike Price $72.50, Counterparty JPHQ, Expires 6/19/19 | 1 | 10,000,000 | 1,890 | |||||||||
Buy Protection on CDX.NA.IG.32, Premium Rate 1.00%, Strike Price $62.50, Counterparty BNDP, Expires 7/17/19 | 1 | 24,000,000 | 41,376 | |||||||||
|
| |||||||||||
| 111,285 | ||||||||||||
|
| |||||||||||
Interest Rate Swaptions 0.0%† | ||||||||||||
Receive float 3 month USD LIBOR, pay fixed 2.25%, Counterparty CITI, Expires 6/28/19 | 1 | 17,400,000 | 26,239 | |||||||||
|
| |||||||||||
Total Options Purchased (Cost $335,689) | 137,524 | |||||||||||
|
| |||||||||||
Total Investments before Short Term Investments (Cost $438,673,669) | 436,748,235 | |||||||||||
|
| |||||||||||
| Country | Shares | |||||||||||
Short Term Investments (Cost $77,861,898) 15.4% | ||||||||||||
Money Market Funds 15.4% | ||||||||||||
j,k Institutional Fiduciary Trust Money Market Portfolio, 2.10% | United States | 77,861,898 | 77,861,898 | |||||||||
|
| |||||||||||
Total Investments (Cost $516,535,567) 101.5% | 514,610,133 | |||||||||||
Options Written (0.0)%† | (30,265 | ) | ||||||||||
Other Assets, less Liabilities (1.5)% | (7,363,083 | ) | ||||||||||
|
| |||||||||||
Net Assets 100.0% | $ | 507,216,785 | ||||||||||
|
| |||||||||||
28 | Annual Report | franklintempleton.com | ||
FRANKLIN STRATEGIC SERIES
STATEMENT OF INVESTMENTS
Franklin Flexible Alpha Bond Fund(continued)
| Number of Contracts | Notional Amount* | Value | ||||||||||
lOptions Written (0.0)%† | ||||||||||||
Puts - Over-the-Counter | ||||||||||||
Credit Default Swaptions (0.0)%† | ||||||||||||
Buy protection on CDX.NA.HY.31, Premium Rate 5.00%, Strike Price $101.50, Counterparty JPHQ, Expires 6/19/19 | 1 | 9,800,000 | $ | (6,017 | ) | |||||||
Buy Protection on CDX.NA.HY.32, Premium Rate 5.00%, Strike Price $102, Counterparty JPHQ, Expires 7/17/19 | 1 | 8,000,000 | (14,192 | ) | ||||||||
Buy Protection on CDX.NA.IG.32, Premium Rate 1.00%, Strike Price $85, Counterparty BNDP, Expires 7/17/19 | 1 | 24,000,000 | (10,056 | ) | ||||||||
|
| |||||||||||
Total Options Written (Premiums received $57,620) | $ | (30,265 | ) | |||||||||
|
| |||||||||||
†Rounds to less than 0.1% of net assets.
*The principal/notional amount is stated in U.S. dollars unless otherwise indicated.
aSecurity was purchased pursuant to Regulation S under the Securities Act of 1933, which exempts from registration securities offered and sold outside of the United States. Such a security cannot be sold in the United States without either an effective registration statement filed pursuant to the Securities Act of 1933, or pursuant to an exemption from registration. These securities have been deemed liquid under guidelines approved by the Trust’s Board of Trustees. At April 30, 2019, the aggregate value of these securities was $21,490,700, representing 4.2% of net assets.
bSecurity was purchased pursuant to Rule 144A under the Securities Act of 1933 and may be sold in transactions exempt from registration only to qualified institutional buyers or in a public offering registered under the Securities Act of 1933. These securities have been deemed liquid under guidelines approved by the Trust’s Board of Trustees. At April 30, 2019, the aggregate value of these securities was $250,614,584, representing 49.4% of net assets.
cThe coupon rate shown represents the rate at period end.
dSee Note 1(e) regarding loan participation notes.
ePerpetual security with no stated maturity date.
fPrincipal amount of security is adjusted for inflation. See Note 1(h).
gThe coupon rate shown represents the rate inclusive of any caps or floors, if applicable, in effect at period end.
hAdjustable rate security with an interest rate that is not based on a published reference index and spread. The rate is based on the structure of the agreement and current market conditions. The coupon rate shown represents the rate at period end.
iInvestment in an interest-only security entitles holders to receive only the interest payment on the underlying instruments. The principal amount shown is the notional amount of the underlying instruments.
jSee Note 3(f) regarding investments in affiliated management investment companies.
kThe rate shown is the annualized seven-day effective yield at period end.
lSee Note 1(c) regarding written options.
franklintempleton.com | Annual Report | 29 | ||
FRANKLIN STRATEGIC SERIES
STATEMENT OF INVESTMENTS
Franklin Flexible Alpha Bond Fund(continued)
At April 30, 2019, the Fund had the following futures contracts outstanding. See Note 1(c).
Futures Contracts
| Description | Type | Number of Contracts | Notional Amount* | Expiration Date | Value/ Unrealized Appreciation (Depreciation) | |||||||||||||||
| ||||||||||||||||||||
Interest Rate Contracts | ||||||||||||||||||||
Australian 10 Yr. Bond | Long | 79 | $ | 7,704,233 | 6/17/19 | $ 130,906 | ||||||||||||||
Canadian 10 Yr. Bond | Long | 70 | 7,221,592 | 6/19/19 | 98,154 | |||||||||||||||
Euro BOBL | Short | 40 | 5,964,303 | 6/06/19 | (30,095 | ) | ||||||||||||||
Euro-Bund | Short | 5 | 927,141 | 6/06/19 | (10,156 | ) | ||||||||||||||
U.S. Treasury 10 Yr. Note | Short | 80 | 9,893,750 | �� | 6/19/19 | (90,110 | ) | |||||||||||||
U.S. Treasury 2 Yr. Note | Short | 106 | 22,578,828 | 6/28/19 | (68,035 | ) | ||||||||||||||
U.S. Treasury 30 Yr. Bond | Short | 13 | 1,917,094 | 6/19/19 | (11,268 | ) | ||||||||||||||
U.S. Treasury 5 Yr. Note | Short | 349 | 40,358,578 | 6/28/19 | (278,553 | ) | ||||||||||||||
Ultra 10 Yr. U.S. Treasury Note | Short | 71 | 9,356,469 | 6/19/19 | (112,144 | ) | ||||||||||||||
|
| |||||||||||||||||||
Total Futures Contracts | $(371,301 | ) | ||||||||||||||||||
|
| |||||||||||||||||||
*As of period end.
At April 30, 2019, the Fund had the following forward exchange contracts outstanding. See Note 1(c).
Forward Exchange Contracts
| Currency | Counterpartya | Type | Quantity | Contract Amount* | Settlement Date | Unrealized Appreciation | Unrealized Depreciation | |||||||||||||||||||||||||
| ||||||||||||||||||||||||||||||||
OTC Forward Exchange Contracts | ||||||||||||||||||||||||||||||||
Chinese Yuan Renminbi | JPHQ | Buy | 8,800,000 | 1,312,181 | 5/06/19 | $ | — | $ | (5,826 | ) | ||||||||||||||||||||||
Chinese Yuan Renminbi | JPHQ | Sell | 8,800,000 | 1,307,772 | 5/06/19 | 1,417 | — | |||||||||||||||||||||||||
Canadian Dollar | UBSW | Sell | 26,000 | 27,537 | AUD | 5/14/19 | 9 | — | ||||||||||||||||||||||||
Indonesian Rupiah | JPHQ | Buy | 22,436,500,000 | 1,576,261 | 5/28/19 | — | (5,781 | ) | ||||||||||||||||||||||||
South Korean Won | JPHQ | Sell | 1,174,000,000 | 1,052,726 | 6/03/19 | 43,346 | — | |||||||||||||||||||||||||
Swedish Krona | UBSW | Buy | 16,135,000 | 1,739,660 | 6/04/19 | — | (35,344 | ) | ||||||||||||||||||||||||
Swedish Krona | UBSW | Sell | 16,135,000 | 1,749,810 | 6/04/19 | 45,494 | — | |||||||||||||||||||||||||
Canadian Dollar | UBSW | Sell | 3,347,000 | 2,512,763 | 6/05/19 | 11,456 | — | |||||||||||||||||||||||||
Mexican Peso | RBS | Buy | 35,708,000 | 1,806,628 | 6/10/19 | 64,712 | — | |||||||||||||||||||||||||
Mexican Peso | RBS | Sell | 10,700,000 | 555,487 | 6/10/19 | — | (5,265 | ) | ||||||||||||||||||||||||
Japanese Yen | JPHQ | Buy | 172,000,000 | 1,561,054 | 6/12/19 | — | (11,076 | ) | ||||||||||||||||||||||||
Japanese Yen | JPHQ | Buy | 173,000,000 | 1,553,176 | 6/12/19 | 5,814 | — | |||||||||||||||||||||||||
Polish Zloty | RBS | Buy | 1,930,000 | 512,616 | 6/19/19 | — | (6,754 | ) | ||||||||||||||||||||||||
Polish Zloty | RBS | Sell | 1,930,000 | 511,326 | 6/19/19 | 5,463 | — | |||||||||||||||||||||||||
Mexican Peso | JPHQ | Buy | 4,800,000 | 247,365 | 6/21/19 | 3,755 | — | |||||||||||||||||||||||||
Australian Dollar | UBSW | Sell | 5,050,000 | 3,580,097 | 7/01/19 | 13,207 | — | |||||||||||||||||||||||||
Euro | UBSW | Sell | 1,427,000 | 1,615,100 | 7/01/19 | 5,636 | — | |||||||||||||||||||||||||
Norwegian Krone | UBSW | Buy | 2,320,000 | 273,169 | 7/15/19 | — | (3,454 | ) | ||||||||||||||||||||||||
Norwegian Krone | UBSW | Sell | 2,320,000 | 273,795 | 7/15/19 | 4,081 | — | |||||||||||||||||||||||||
Chinese Yuan Renminbi | JPHQ | Sell | 8,700,000 | 1,292,719 | 7/24/19 | 1,311 | — | |||||||||||||||||||||||||
British Pound | JPHQ | Sell | 86,300 | 115,081 | 8/15/19 | 1,916 | — | |||||||||||||||||||||||||
Canadian Dollar | JPHQ | Sell | 1,700,000 | 1,278,396 | 9/18/19 | 4,904 | — | |||||||||||||||||||||||||
Euro | DBAB | Sell | 120,000 | 137,078 | 9/18/19 | 816 | — | |||||||||||||||||||||||||
Euro | JPHQ | Sell | 400,000 | 450,690 | 9/18/19 | — | (3,516 | ) | ||||||||||||||||||||||||
30 | Annual Report | franklintempleton.com | ||
FRANKLIN STRATEGIC SERIES
STATEMENT OF INVESTMENTS
Franklin Flexible Alpha Bond Fund(continued)
Forward Exchange Contracts(continued)
| Contract | Settlement | Unrealized | Unrealized | |||||||||||||||||||||||||
| Currency | Counterpartya | Type | Quantity | Amount* | Date | Appreciation | Depreciation | |||||||||||||||||||||
| ||||||||||||||||||||||||||||
OTC Forward Exchange Contracts(continued) | ||||||||||||||||||||||||||||
Euro | JPHQ | Sell | 4,550,000 | 5,196,328 | 9/18/19 | $ | 29,738 | $ | — | |||||||||||||||||||
Australian Dollar | JPHQ | Sell | 1,520,000 | 1,093,575 | 10/11/19 | 17,082 | — | |||||||||||||||||||||
Turkish Lira | JPHQ | Buy | 2,600,000 | 399,969 | 10/18/19 | — | (9,688 | ) | ||||||||||||||||||||
Euro | DBAB | Buy | 100,000 | 117,270 | 12/13/19 | — | (2,901 | ) | ||||||||||||||||||||
Euro | DBAB | Sell | 800,000 | 934,000 | 12/13/19 | 19,049 | — | |||||||||||||||||||||
|
| |||||||||||||||||||||||||||
Total Forward Exchange Contracts | $ | 279,206 | $ | (89,605 | ) | |||||||||||||||||||||||
|
| |||||||||||||||||||||||||||
Net unrealized appreciation (depreciation) |
| $ | 189,601 | |||||||||||||||||||||||||
|
| |||||||||||||||||||||||||||
*In U.S. dollars unless otherwise indicated.
aMay be comprised of multiple contracts with the same counterparty, currency and settlement date.
At April 30, 2019, the Fund had the following credit default swap contracts outstanding. See Note 1(c).
Credit Default Swap Contracts
| Description | Periodic Payment Rate Received (Paid) | Payment Frequency | Counter- party | Maturity Date | Notional Amounta | Value | Unamortized Upfront Payments (Receipts) | Unrealized Appreciation (Depreciation) | Ratingb | |||||||||||||||||||||||||||
| ||||||||||||||||||||||||||||||||||||
OTC Swap Contracts | ||||||||||||||||||||||||||||||||||||
Contracts to Buy Protectionc | ||||||||||||||||||||||||||||||||||||
Single Name | ||||||||||||||||||||||||||||||||||||
The AES Corp. | (5.00)% | Quarterly | CITI | 3/20/21 | $ | 2,750,000 | $ | (260,197 | ) | $ | (222,571 | ) | $ | (37,626 | ) | |||||||||||||||||||||
Ally Financial Inc. | (5.00)% | Quarterly | JPHQ | 6/20/24 | 2,600,000 | (487,286 | ) | (422,995 | ) | (64,291 | ) | |||||||||||||||||||||||||
American Airlines Group Inc. | (5.00)% | Quarterly | BZWS | 12/20/19 | 400,000 | (14,309 | ) | (10,688 | ) | (3,621 | ) | |||||||||||||||||||||||||
American Airlines Group Inc. | (5.00)% | Quarterly | CITI | 12/20/19 | 130,000 | (4,650 | ) | (3,429 | ) | (1,221 | ) | |||||||||||||||||||||||||
Boyd Gaming Corp. | (5.00)% | Quarterly | BZWS | 6/20/22 | 525,000 | (75,103 | ) | (62,211 | ) | (12,892 | ) | |||||||||||||||||||||||||
Centurylink Inc. | (5.00)% | Quarterly | BZWS | 6/20/21 | 4,700,000 | (406,052 | ) | (238,403 | ) | (167,649 | ) | |||||||||||||||||||||||||
Dish DBS Corp. | (5.00)% | Quarterly | BZWS | 12/20/20 | 175,000 | (11,017 | ) | (8,354 | ) | (2,663 | ) | |||||||||||||||||||||||||
Dish DBS Corp. | (5.00)% | Quarterly | JPHQ | 6/20/21 | 470,000 | (34,071 | ) | (14,741 | ) | (19,330 | ) | |||||||||||||||||||||||||
Energy Transfer LP | (5.00)% | Quarterly | MSCO | 12/20/20 | 750,000 | (63,058 | ) | (51,857 | ) | (11,201 | ) | |||||||||||||||||||||||||
Government of Italy | (1.00)% | Quarterly | BZWS | 6/20/23 | 700,000 | (1,700 | ) | 6,314 | (8,014 | ) | ||||||||||||||||||||||||||
Government of Turkey | (1.00)% | Quarterly | BZWS | 12/20/19 | 166,667 | 2,483 | 4,990 | (2,507 | ) | |||||||||||||||||||||||||||
HCA Inc. | (5.00)% | Quarterly | FBCO | 3/20/22 | 2,050,000 | (271,640 | ) | (216,960 | ) | (54,680 | ) | |||||||||||||||||||||||||
KB Home | (5.00)% | Quarterly | JPHQ | 3/20/20 | 100,000 | (4,797 | ) | (3,169 | ) | (1,628 | ) | |||||||||||||||||||||||||
Nabors Industries Inc. | (1.00)% | Quarterly | CITI | 12/20/21 | 805,000 | 26,610 | 32,434 | (5,824 | ) | |||||||||||||||||||||||||||
Nabors Industries Inc. | (1.00)% | Quarterly | CITI | 12/20/21 | 245,000 | 8,098 | 7,935 | 163 | ||||||||||||||||||||||||||||
Navient Corp. | (5.00)% | Quarterly | GSCO | 3/20/20 | 1,800,000 | (83,781 | ) | (62,910 | ) | (20,871 | ) | |||||||||||||||||||||||||
Navient Corp. | (5.00)% | Quarterly | JPHQ | 3/20/20 | 2,860,000 | (133,119 | ) | (100,019 | ) | (33,100 | ) | |||||||||||||||||||||||||
PHH Corp. | (5.00)% | Quarterly | BZWS | 9/20/19 | 200,000 | (4,906 | ) | (351 | ) | (4,555 | ) | |||||||||||||||||||||||||
Sanmina Corp. | (5.00)% | Quarterly | BZWS | 6/20/19 | 100,000 | (1,240 | ) | (601 | ) | (639 | ) | |||||||||||||||||||||||||
Universal Health Services Inc. | (5.00)% | Quarterly | BZWS | 9/20/19 | 50,000 | (1,252 | ) | (813 | ) | (439 | ) | |||||||||||||||||||||||||
Contracts to Sell Protectionc,d | ||||||||||||||||||||||||||||||||||||
Single Name | ||||||||||||||||||||||||||||||||||||
American Tower Corp. | 1.00% | Quarterly | GSCO | 3/20/21 | $ | 100,000 | $ | 130 | $ | (708 | ) | $ | 838 | BBB- | ||||||||||||||||||||||
Dish DBS Corp. | 5.00% | Quarterly | BZWS | 12/20/22 | 175,000 | 7,358 | 6,579 | 779 | B- | |||||||||||||||||||||||||||
franklintempleton.com | Annual Report | 31 | ||
FRANKLIN STRATEGIC SERIES
STATEMENT OF INVESTMENTS
Franklin Flexible Alpha Bond Fund(continued)
Credit Default Swap Contracts(continued)
| Description | Periodic Payment Rate Received (Paid) | Payment Frequency | Counter- party | Maturity Date | Notional Amounta | Value | Unamortized Upfront Payments (Receipts) | Unrealized Appreciation (Depreciation) | Ratingb | |||||||||||||||||||||||||||
| ||||||||||||||||||||||||||||||||||||
OTC Swap Contracts(continued) | ||||||||||||||||||||||||||||||||||||
Contracts to Sell Protectionc,d(continued) | ||||||||||||||||||||||||||||||||||||
Single Name(continued) | ||||||||||||||||||||||||||||||||||||
Dish DBS Corp. | 5.00% | Quarterly | JPHQ | 6/20/23 | $ | 470,000 | $ | 11,635 | $ | (5,150 | ) | $ | 16,785 | B- | ||||||||||||||||||||||
Goldman Sachs Group Inc. | 1.00% | Quarterly | JPHQ | 6/20/24 | 2,600,000 | 34,257 | 18,335 | 15,922 | BBB+ | |||||||||||||||||||||||||||
Government of Argentina | 5.00% | Quarterly | BZWS | 6/20/23 | 330,000 | (66,222 | ) | (69,163 | ) | 2,941 | B | |||||||||||||||||||||||||
Government of Argentina | 5.00% | Quarterly | CITI | 12/20/23 | 630,000 | (132,289 | ) | (33,119 | ) | (99,170 | ) | B | ||||||||||||||||||||||||
Government of Indonesia | 1.00% | Quarterly | CITI | 6/20/24 | 1,025,000 | 3,682 | (3,436 | ) | 7,118 | BBB- | ||||||||||||||||||||||||||
Government of Italy | 1.00% | Quarterly | BZWS | 6/20/23 | 700,000 | (17,272 | ) | (27,688 | ) | 10,416 | NR | |||||||||||||||||||||||||
Government of Russia | 1.00% | Quarterly | BNDP | 6/20/24 | 620,000 | (6,546 | ) | (8,268 | ) | 1,722 | BBB- | |||||||||||||||||||||||||
Morgan Stanley | 1.00% | Quarterly | JPHQ | 6/20/24 | 2,600,000 | 48,093 | 36,908 | 11,185 | BBB+ | |||||||||||||||||||||||||||
Nabors Industries Inc. | 1.00% | Quarterly | CITI | 12/20/23 | 1,050,000 | (134,372 | ) | (145,854 | ) | 11,482 | BB | |||||||||||||||||||||||||
Sprint Communications Inc. | 5.00% | Quarterly | JPHQ | 9/20/20 | 12,000 | 724 | — | 724 | B | |||||||||||||||||||||||||||
Traded Index | ||||||||||||||||||||||||||||||||||||
eBNP Paribas Bespoke Bordeaux Index, Mezzanine Tranche 7-10% | 2.10% | Quarterly | BNDP | 6/20/20 | 300,000 | 4,371 | — | 4,371 | Non- | |||||||||||||||||||||||||||
| Invest- | ||||||||||||||||||||||||||||||||||||
| ment | ||||||||||||||||||||||||||||||||||||
| Grade | ||||||||||||||||||||||||||||||||||||
eBNP Paribas Bespoke Rodez | ||||||||||||||||||||||||||||||||||||
Index, Mezzanine Tranche | ||||||||||||||||||||||||||||||||||||
5-7% | 2.00% | Quarterly | BNDP | 12/20/20 | 500,000 | 4,096 | — | 4,096 | Non- | |||||||||||||||||||||||||||
| Invest- | ||||||||||||||||||||||||||||||||||||
| ment | ||||||||||||||||||||||||||||||||||||
| Grade | ||||||||||||||||||||||||||||||||||||
eBNP Paribas Bespoke Rodez2 | ||||||||||||||||||||||||||||||||||||
Index, Mezzanine Tranche | ||||||||||||||||||||||||||||||||||||
5-7% | 3.20% | Quarterly | BNDP | 12/20/20 | 340,000 | 10,225 | — | 10,225 | Non- | |||||||||||||||||||||||||||
| Invest- | ||||||||||||||||||||||||||||||||||||
| ment | ||||||||||||||||||||||||||||||||||||
| Grade | ||||||||||||||||||||||||||||||||||||
eCitibank Bespoke Bogota | ||||||||||||||||||||||||||||||||||||
Index, Mezzanine Tranche | ||||||||||||||||||||||||||||||||||||
7-10% | 1.35% | Quarterly | CITI | 6/20/20 | 1,650,000 | 15,378 | — | 15,378 | Non- | |||||||||||||||||||||||||||
| Invest- | ||||||||||||||||||||||||||||||||||||
| ment | ||||||||||||||||||||||||||||||||||||
| Grade | ||||||||||||||||||||||||||||||||||||
eCitibank Bespoke Boulder | ||||||||||||||||||||||||||||||||||||
Index, Mezzanine Tranche | ||||||||||||||||||||||||||||||||||||
5-10% | 1.18% | Quarterly | CITI | 12/20/19 | 3,000,000 | 7,718 | — | 7,718 | Non- | |||||||||||||||||||||||||||
| Invest- | ||||||||||||||||||||||||||||||||||||
| ment | ||||||||||||||||||||||||||||||||||||
| Grade | ||||||||||||||||||||||||||||||||||||
32 | Annual Report | franklintempleton.com | ||
FRANKLIN STRATEGIC SERIES
STATEMENT OF INVESTMENTS
Franklin Flexible Alpha Bond Fund(continued)
Credit Default Swap Contracts(continued)
| Description | Periodic Payment Rate Received (Paid) | Payment Frequency | Counter- party | Maturity Date | Notional Amounta | Value | Unamortized Upfront Payments (Receipts) | Unrealized Appreciation (Depreciation) | Ratingb | |||||||||||||||||||||||||||
| ||||||||||||||||||||||||||||||||||||
OTC Swap Contracts(continued) | ||||||||||||||||||||||||||||||||||||
Contracts to Sell Protectionc,d (continued) | ||||||||||||||||||||||||||||||||||||
Traded Index(continued) | ||||||||||||||||||||||||||||||||||||
eCitibank Bespoke Boulder | ||||||||||||||||||||||||||||||||||||
Index, Mezzanine Tranche | ||||||||||||||||||||||||||||||||||||
5-15% | 1.24% | Quarterly | CITI | 12/20/19 | $ | 1,600,000 | $ | 8,064 | $ | — | $ | 8,064 | Non- | |||||||||||||||||||||||
| Invest- | ||||||||||||||||||||||||||||||||||||
| ment | ||||||||||||||||||||||||||||||||||||
| Grade | ||||||||||||||||||||||||||||||||||||
eCitibank Bespoke Broker | ||||||||||||||||||||||||||||||||||||
Index, Mezzanine Tranche | ||||||||||||||||||||||||||||||||||||
3-7% | 1.30% | Quarterly | CITI | 6/20/19 | 1,900,000 | 6,231 | — | 6,231 | Non- | |||||||||||||||||||||||||||
| Invest- | ||||||||||||||||||||||||||||||||||||
| ment | ||||||||||||||||||||||||||||||||||||
| Grade | ||||||||||||||||||||||||||||||||||||
eCitibank Bespoke Broker | ||||||||||||||||||||||||||||||||||||
Index, Mezzanine Tranche | ||||||||||||||||||||||||||||||||||||
3-7% | 1.40% | Quarterly | CITI | 6/20/19 | 1,500,000 | 5,298 | — | 5,298 | Non- | |||||||||||||||||||||||||||
| Invest- | ||||||||||||||||||||||||||||||||||||
| ment | ||||||||||||||||||||||||||||||||||||
| Grade | ||||||||||||||||||||||||||||||||||||
eCitibank Bespoke Cambridge | ||||||||||||||||||||||||||||||||||||
Index, Equity Tranche 0-3% | 0.00% | Quarterly | CITI | 12/20/19 | 500,000 | (65,919 | ) | (26,239 | ) | (39,680 | ) | Non- | ||||||||||||||||||||||||
| Invest- | ||||||||||||||||||||||||||||||||||||
| ment | ||||||||||||||||||||||||||||||||||||
| Grade | ||||||||||||||||||||||||||||||||||||
eCitibank Bespoke Lima Index, | ||||||||||||||||||||||||||||||||||||
Mezzanine Tranche 5-7% | 2.13% | Quarterly | CITI | 12/20/19 | 650,000 | 2,116 | — | 2,116 | Non- | |||||||||||||||||||||||||||
| Invest- | ||||||||||||||||||||||||||||||||||||
| ment | ||||||||||||||||||||||||||||||||||||
| Grade | ||||||||||||||||||||||||||||||||||||
eCitibank Bespoke Lisbon | ||||||||||||||||||||||||||||||||||||
Index, Equity Tranche 0-3% | 0.00% | Quarterly | CITI | 6/20/19 | 10,000 | (289 | ) | (166 | ) | (123 | ) | Non- | ||||||||||||||||||||||||
| Invest- | ||||||||||||||||||||||||||||||||||||
| ment | ||||||||||||||||||||||||||||||||||||
| Grade | ||||||||||||||||||||||||||||||||||||
eCitibank Bespoke Lisbon | ||||||||||||||||||||||||||||||||||||
Index, Mezzanine Tranche | ||||||||||||||||||||||||||||||||||||
3-7% | 0.79% | Quarterly | CITI | 6/20/19 | 1,100,000 | 397 | — | 397 | Non- | |||||||||||||||||||||||||||
| Invest- | ||||||||||||||||||||||||||||||||||||
| ment | ||||||||||||||||||||||||||||||||||||
| Grade | ||||||||||||||||||||||||||||||||||||
eCitibank Bespoke Palma Index, | ||||||||||||||||||||||||||||||||||||
Mezzanine Tranche 5-7% | 2.30% | Quarterly | CITI | 6/20/21 | 710,000 | 5,122 | — | 5,122 | Non- | |||||||||||||||||||||||||||
| Invest- | ||||||||||||||||||||||||||||||||||||
| ment | ||||||||||||||||||||||||||||||||||||
| Grade | ||||||||||||||||||||||||||||||||||||
franklintempleton.com | Annual Report | 33 | ||
FRANKLIN STRATEGIC SERIES
STATEMENT OF INVESTMENTS
Franklin Flexible Alpha Bond Fund(continued)
Credit Default Swap Contracts(continued)
| Description | Periodic Payment Rate Received (Paid) | Payment Frequency | Counter- party | Maturity Date | Notional Amounta | Value | Unamortized Upfront Payments (Receipts) | Unrealized Appreciation (Depreciation) | Ratingb | |||||||||||||||||||||||||||
| ||||||||||||||||||||||||||||||||||||
OTC Swap Contracts(continued) | ||||||||||||||||||||||||||||||||||||
Contracts to Sell Protectionc,d (continued) | ||||||||||||||||||||||||||||||||||||
Traded Index(continued) | ||||||||||||||||||||||||||||||||||||
eCitibank Bespoke Singapore | ||||||||||||||||||||||||||||||||||||
Index, Equity Tranche 0-3% | 0.00% | Quarterly | CITI | 6/20/20 | $ | 770,000 | $ | (86,748) | $ | (122,747) | $ | 35,999 | Non- | |||||||||||||||||||||||
| Invest- | ||||||||||||||||||||||||||||||||||||
| ment | ||||||||||||||||||||||||||||||||||||
| Grade | ||||||||||||||||||||||||||||||||||||
eCitibank Bespoke Verona | ||||||||||||||||||||||||||||||||||||
Index, Equity Tranche 0-3% | 0.00% | Quarterly | CITI | 12/20/19 | 15,000 | (1,711) | (966) | (745) | Non- | |||||||||||||||||||||||||||
| Invest- | ||||||||||||||||||||||||||||||||||||
| ment | ||||||||||||||||||||||||||||||||||||
| Grade | ||||||||||||||||||||||||||||||||||||
eCitibank Bespoke Verona | ||||||||||||||||||||||||||||||||||||
Index, Mezzanine Tranche | ||||||||||||||||||||||||||||||||||||
7-15% | 0.40% | Quarterly | CITI | 12/20/19 | 280,000 | 581 | — | 581 | Non- | |||||||||||||||||||||||||||
| Invest- | ||||||||||||||||||||||||||||||||||||
| ment | ||||||||||||||||||||||||||||||||||||
| Grade | ||||||||||||||||||||||||||||||||||||
MCDX.NA.30 | 1.00% | Quarterly | CITI | 6/20/28 | 2,000,000 | 48,430 | 18,445 | 29,985 | | Invest- ment |
| |||||||||||||||||||||||||
| Grade | ||||||||||||||||||||||||||||||||||||
| Invest- | ||||||||||||||||||||||||||||||||||||
MCDX.NA.31 | 1.00% | Quarterly | CITI | 12/20/23 | 12,200,000 | 215,260 | 116,790 | 98,470 | | ment Grade |
| |||||||||||||||||||||||||
|
| |||||||||||||||||||||||||||||||||||
Total Credit Default Swap Contracts |
| $ | (1,893,189 | ) | $ | (1,614,846) | $ | (278,343) | ||||||||||||||||||||||||||||
|
| |||||||||||||||||||||||||||||||||||
aIn U.S. dollars unless otherwise indicated. For contracts to sell protection, the notional amount is equal to the maximum potential amount of the future payments and no recourse provisions have been entered into in association with the contracts.
bBased on Standard and Poor’s (S&P) Rating for single name swaps and internal ratings for index swaps. Internal ratings based on mapping into equivalent ratings from external vendors.
cPerformance triggers for settlement of contract include default, bankruptcy or restructuring for single name swaps, and failure to pay or bankruptcy of the underlying securities for traded index swaps.
dThe Fund enters contracts to sell protection to create a long credit position.
eRepresents a custom index comprised of a basket of underlying instruments.
At April 30, 2019, the Fund had the following cross-currency swap contracts outstanding. See Note 1(c).
Cross-Currency Swap Contracts
| Description | Payment Frequency | Counter- party | Maturity Date | Notional Amount | Value/ Unrealized Appreciation (Depreciation) | |||||||||||||||||||
| ||||||||||||||||||||||||
OTC Swap Contracts | ||||||||||||||||||||||||
Receive Floating 3-month USD LIBOR + 1.894% | Quarterly | 2,460,000 | USD | |||||||||||||||||||||
Pay Fixed 1.50% | Annual | CITI | 5/04/21 | 2,000,000 | EUR | $209,322 | ||||||||||||||||||
34 | Annual Report | franklintempleton.com | ||
FRANKLIN STRATEGIC SERIES
STATEMENT OF INVESTMENTS
Franklin Flexible Alpha Bond Fund(continued)
Cross-Currency Swap Contracts(continued)
| Description | Payment Frequency | Counter- party | Maturity Date | Notional Amount | Value/ Unrealized Appreciation (Depreciation) | |||||||||||||||||||
| ||||||||||||||||||||||||
OTC Swap Contracts(continued) | ||||||||||||||||||||||||
Receive Floating 3-month USD LIBOR + 1.850% | Quarterly | 617,500 | USD | |||||||||||||||||||||
Pay Fixed 1.50% | Annual | CITI | 5/04/21 | 500,000 | EUR | $ 54,260 | ||||||||||||||||||
Receive Floating 3-month USD LIBOR + 2.87% | Quarterly | 232,400 | USD | |||||||||||||||||||||
Pay Fixed 2.50% | Annual | CITI | 5/04/21 | 200,000 | EUR | 6,059 | ||||||||||||||||||
Receive Floating 3-month USD LIBOR + 1.303% | Quarterly | 496,000 | USD | |||||||||||||||||||||
Pay Fixed 1.00% | Annual | JPHQ | 5/04/21 | 400,000 | EUR | 46,274 | ||||||||||||||||||
Receive Floating 3-month USD LIBOR + 0.849% | Quarterly | 3,472,000 | USD | |||||||||||||||||||||
Pay Fixed 0.75% | Annual | DBAB | 9/14/22 | 2,800,000 | EUR | 344,512 | ||||||||||||||||||
|
| |||||||||||||||||||||||
Total Cross Currency Swap Contracts | $660,427 | |||||||||||||||||||||||
|
| |||||||||||||||||||||||
At April 30, 2019, the Fund had the following interest rate swap contracts outstanding. See Note 1(c).
Interest Rate Swap Contracts
| Description | Payment Frequency | Maturity Date | Notional Amount | Value | Unamortized Upfront Payments (Receipts) | Unrealized Appreciation (Depreciation) | ||||||||||||||||||
| ||||||||||||||||||||||||
Centrally Cleared Swap Contracts | ||||||||||||||||||||||||
Receive Floating 3-month USD LIBOR | Quarterly | |||||||||||||||||||||||
Pay Fixed 2.788% | Semi-Annual | 3/26/23 | $ | 7,900,000 | $ | (144,366 | ) | $ — | $(144,366 | ) | ||||||||||||||
Receive Floating 3-month USD LIBOR | Quarterly | |||||||||||||||||||||||
Pay Fixed 2.79% | Semi-Annual | 3/28/23 | 7,900,000 | (145,283 | ) | — | (145,283 | ) | ||||||||||||||||
Receive Floating 3-month USD LIBOR | Quarterly | |||||||||||||||||||||||
Pay Fixed 2.713% | Semi-Annual | 3/29/23 | 4,700,000 | (71,897 | ) | — | (71,897 | ) | ||||||||||||||||
Receive Floating 3-month USD LIBOR | Quarterly | |||||||||||||||||||||||
Pay Fixed 2.806% | Semi-Annual | 4/17/23 | 5,800,000 | (110,967 | ) | — | (110,967 | ) | ||||||||||||||||
Receive Floating 3-month USD LIBOR | Quarterly | |||||||||||||||||||||||
Pay Fixed 2.00% | Semi-Annual | 6/20/25 | 11,100,000 | 180,018 | 553,194 | (373,176 | ) | |||||||||||||||||
Receive Floating 3-month USD LIBOR | Quarterly | |||||||||||||||||||||||
Pay Fixed 3.082% | Semi-Annual | 9/28/25 | 8,000,000 | (345,523 | ) | — | (345,523 | ) | ||||||||||||||||
Receive Floating 3-month USD LIBOR | Quarterly | |||||||||||||||||||||||
Pay Fixed 3.225% | Semi-Annual | 11/13/25 | 5,500,000 | (337,171 | ) | — | (337,171 | ) | ||||||||||||||||
|
| |||||||||||||||||||||||
Total Interest Rate Swap Contracts | $ | (975,189 | ) | $553,194 | $(1,528,383 | ) | ||||||||||||||||||
|
| |||||||||||||||||||||||
At April 30, 2019, the Fund had the following inflation index swap contracts outstanding. See Note 1(c).
Inflation Index Swap Contracts
| Description | Payment Frequency | Maturity Date | Notional Amount | Value/ Unrealized Appreciaton (Depreciation) | ||||||||||||
| ||||||||||||||||
Centrally Cleared Swap Contracts | ||||||||||||||||
Receive variable change in USA-CPI-U | At maturity | |||||||||||||||
Pay Fixed 2.079% | At maturity | 9/18/24 | $ | 1,770,000 | $ | 1,002 | ||||||||||
franklintempleton.com | Annual Report | 35 | ||
FRANKLIN STRATEGIC SERIES
STATEMENT OF INVESTMENTS
Franklin Flexible Alpha Bond Fund(continued)
Inflation Index Swap Contracts(continued)
| Description | Payment Frequency | Maturity Date | Notional Amount | Value/ Unrealized Appreciaton (Depreciation) | ||||||||||||
| ||||||||||||||||
Centrally Cleared Swap Contracts(continued) | ||||||||||||||||
Receive variable change in USA-CPI-U | At maturity | |||||||||||||||
Pay Fixed 2.35% | At maturity | 9/20/26 | $5,200,000 | $(138,120) | ||||||||||||
Receive variable change in USA-CPI-U | At maturity | |||||||||||||||
Pay Fixed 2.313% | At maturity | 6/01/28 | 1,400,000 | (31,216) | ||||||||||||
|
| |||||||||||||||
Total Inflation Index Swap Contracts | $(168,334) | |||||||||||||||
|
| |||||||||||||||
At April 30, 2019, the Fund had the following total return swap contracts outstanding. See Note 1(c).
Total Return Swap Contracts
| Underlying Instruments | Financing Rate | Payment Frequency | Counterparty | Maturity Date | Notional Value | Value/ Unrealized Appreciation (Depreciation) | ||||||||||||||||||
| ||||||||||||||||||||||||
OTC Swap Contracts | ||||||||||||||||||||||||
Longa | ||||||||||||||||||||||||
Markit iBoxx USD Liquid Leveraged Loan Index | 3-month USD LIBOR | Quarterly | JPHQ | 6/20/19 | $ | 17,550,000 | $ 505,566 | |||||||||||||||||
Markit iBoxx USD Liquid Leveraged Loan Index | 3-month USD LIBOR | Quarterly | MSCO | 6/20/19 | 630,000 | 18,937 | ||||||||||||||||||
Markit iBoxx USD Liquid Leveraged Loan Index | 3-month USD LIBOR | Quarterly | CITI | 9/20/19 | 4,200,000 | 94,235 | ||||||||||||||||||
Markit iBoxx USD Liquid Leveraged Loan Index | 3-month USD LIBOR | Quarterly | GSCO | 9/20/19 | 3,300,000 | 70,224 | ||||||||||||||||||
Markit iBoxx USD Liquid Leveraged Loan Index | 3-month USD LIBOR | Quarterly | JPHQ | 9/20/19 | 9,030,000 | 367,121 | ||||||||||||||||||
|
| |||||||||||||||||||||||
Total Total Return Swap Contracts | $1,056,083 | |||||||||||||||||||||||
|
| |||||||||||||||||||||||
aThe Fund receives the total return on the underlying instrument and pays a variable financing rate.
See Note 8 regarding other derivative information.
See Abbreviations on page 56.
36 | Annual Report | The accompanying notes are an integral part of these financial statements. | franklintempleton.com | ||
FRANKLIN STRATEGIC SERIES
Financial Statements
Statement of Assets and Liabilities
April 30, 2019
Franklin Flexible Alpha Bond Fund
Assets: | ||||
Investments in securities: | ||||
Cost - Unaffiliated issuers | $438,673,669 | |||
Cost - Non-controlled affiliates (Note 3f) | 77,861,898 | |||
|
| |||
Value - Unaffiliated issuers | $436,748,235 | |||
Value - Non-controlled affiliates (Note 3f) | 77,861,898 | |||
Restricted cash for OTC derivative contracts (Note 1d) | 350,000 | |||
Foreign currency, at value (cost $176,361) | 176,872 | |||
Receivables: | ||||
Investment securities sold | 29,631 | |||
Capital shares sold | 13,556 | |||
Interest | 1,792,680 | |||
Deposits with brokers for: | ||||
OTC derivative contracts | 680,000 | |||
Futures contracts | 820,859 | |||
Centrally cleared swap contracts | 1,249,016 | |||
OTC swap contracts (upfront payments $212,485) | 248,730 | |||
Unrealized appreciation on OTC forward exchange contracts | 279,206 | |||
Unrealized appreciation on OTC swap contracts | 2,030,636 | |||
Other assets | 1,126 | |||
|
| |||
Total assets | 522,282,445 | |||
|
| |||
Liabilities: | ||||
Payables: | ||||
Investment securities purchased | 162,028 | |||
Capital shares redeemed | 9,872,838 | |||
Management fees | 208,439 | |||
Distribution fees | 523 | |||
Transfer agent fees | 6,924 | |||
Distributions to shareholders | 1,430,678 | |||
Variation margin on futures contracts | 105,401 | |||
Variation margin on centrally cleared swap contracts | 74,037 | |||
Deposits from brokers for: | ||||
OTC derivative contracts | 350,000 | |||
OTC swap contracts (upfront receipts $1,856,384) | 1,863,576 | |||
Funds advanced by custodian | 185,709 | |||
Options written, at value (premiums received $57,620) | 30,265 | |||
Unrealized depreciation on OTC forward exchange contracts | 89,605 | |||
Unrealized depreciation on OTC swap contracts | 592,469 | |||
Accrued expenses and other liabilities | 93,168 | |||
|
| |||
Total liabilities | 15,065,660 | |||
|
| |||
Net assets, at value | $507,216,785 | |||
|
| |||
Net assets consist of: | ||||
Paid-in capital | $510,708,346 | |||
Total distributable earnings (loss) | (3,491,561 | ) | ||
|
| |||
Net assets, at value | $507,216,785 | |||
|
| |||
franklintempleton.com | The accompanying notes are an integral part of these financial statements. | Annual Report | 37 | ||
FRANKLIN STRATEGIC SERIES
FINANCIAL STATEMENTS
Statement of Assets and Liabilities(continued)
April 30, 2019
Franklin Flexible Alpha Bond Fund
Class A: | ||||
Net assets, at value | $ 1,457,621 | |||
|
| |||
Shares outstanding | 150,249 | |||
|
| |||
Net asset value per sharea | $9.70 | |||
|
| |||
Maximum offering price per share (net asset value per share ÷ 96.25%) | $10.08 | |||
|
| |||
Class C: | ||||
Net assets, at value | $ 368,100 | |||
|
| |||
Shares outstanding | 38,195 | |||
|
| |||
Net asset value and maximum offering price per sharea | $9.64 | |||
|
| |||
Class R: | ||||
Net assets, at value | $ 83,197 | |||
|
| |||
Shares outstanding | 8,586 | |||
|
| |||
Net asset value and maximum offering price per share | $9.69 | |||
|
| |||
Class R6: | ||||
Net assets, at value | $504,874,698 | |||
|
| |||
Shares outstanding | 51,989,012 | |||
|
| |||
Net asset value and maximum offering price per share | $9.71 | |||
|
| |||
Advisor Class: | ||||
Net assets, at value | $ 433,169 | |||
|
| |||
Shares outstanding | 44,672 | |||
|
| |||
Net asset value and maximum offering price per share | $9.70 | |||
|
|
aRedemption price is equal to net asset value less contingent deferred sales charges, if applicable.
38 | Annual Report | The accompanying notes are an integral part of these financial statements. | franklintempleton.com | ||
FRANKLIN STRATEGIC SERIES
FINANCIAL STATEMENTS
Statement of Operations
for the year ended April 30, 2019
Franklin Flexible Alpha Bond Fund
Investment income: | ||||
Dividends: | ||||
Unaffiliated issuers | $ 209,204 | |||
Non-controlled affiliates (Note 3f) | 1,286,983 | |||
Interest: (net of foreign taxes)~ | ||||
Unaffiliated issuers | 12,686,283 | |||
|
| |||
Total investment income | 14,182,470 | |||
|
| |||
Expenses: | ||||
Management fees (Note 3a) | 2,134,980 | |||
Distribution fees: (Note 3c) | ||||
Class A | 4,259 | |||
Class C | 1,913 | |||
Class R | 338 | |||
Transfer agent fees: (Note 3e) | ||||
Class A | 4,034 | |||
Class C | 797 | |||
Class R | 178 | |||
Class R6 | 77,410 | |||
Advisor Class | 1,076 | |||
Custodian fees (Note 4) | 14,219 | |||
Reports to shareholders | 5,299 | |||
Registration and filing fees | 81,512 | |||
Professional fees | 96,105 | |||
Trustees’ fees and expenses | 3,703 | |||
Other | 135,451 | |||
|
| |||
Total expenses | 2,561,274 | |||
Expense reductions (Note 4) | (1,692 | ) | ||
Expenses waived/paid by affiliates (Note 3f and 3g) | (245,137 | ) | ||
|
| |||
Net expenses | 2,314,445 | |||
|
| |||
Net investment income | 11,868,025 | |||
|
| |||
Realized and unrealized gains (losses): | ||||
Net realized gain (loss) from: | ||||
Investments: | ||||
Unaffiliated issuers | (1,067,398 | ) | ||
Written options | 45,360 | |||
Foreign currency transactions | (114,146 | ) | ||
Forward exchange contracts | 474,291 | |||
Futures contracts | (991,042 | ) | ||
TBA sale commitments | (2,027 | ) | ||
Swap contracts | 711,463 | |||
|
| |||
Net realized gain (loss) | (943,499 | ) | ||
|
| |||
Net change in unrealized appreciation (depreciation) on: | ||||
Investments: | ||||
Unaffiliated issuers | (294,296 | ) | ||
Translation of other assets and liabilities denominated in foreign currencies | 2,504 | |||
Forward exchange contracts | 213,188 | |||
Written options | 22,575 | |||
Futures contracts | (494,189 | ) | ||
franklintempleton.com | The accompanying notes are an integral part of these financial statements. | Annual Report | 39 | ||
FRANKLIN STRATEGIC SERIES
FINANCIAL STATEMENTS
Statement of Operations(continued)
for the year ended April 30, 2019
Franklin Flexible Alpha Bond Fund
TBA sale commitments | 2,227 | |||
Swap contracts | (541,588 | ) | ||
|
| |||
Net change in unrealized appreciation (depreciation) | (1,089,579 | ) | ||
|
| |||
Net realized and unrealized gain (loss) | (2,033,078 | ) | ||
|
| |||
Net increase (decrease) in net assets resulting from operations | $ 9,834,947 | |||
|
|
~Foreign taxes withheld on interest | $ | 238 | ||||
40 | Annual Report | The accompanying notes are an integral part of these financial statements. | franklintempleton.com | ||
FRANKLIN STRATEGIC SERIES
FINANCIAL STATEMENTS
Statements of Changes in Net Assets
Franklin Flexible Alpha Bond Fund
Year Ended April 30,
| ||||||||
2019
| 2018
| |||||||
Increase (decrease) in net assets: | ||||||||
Operations: | ||||||||
Net investment income | $ 11,868,025 | $ 1,642,692 | ||||||
Net realized gain (loss) | (943,499 | ) | 1,033,175 | |||||
Net change in unrealized appreciation (depreciation) | (1,089,579 | ) | (1,558,393 | ) | ||||
|
| |||||||
Net increase (decrease) in net assets resulting from operations | 9,834,947 | 1,117,474 | ||||||
|
| |||||||
Distributions to shareholders: (Note 1h) | ||||||||
Class A | (41,958 | ) | (103,600 | ) | ||||
Class C | (7,107 | ) | (3,159 | ) | ||||
Class R | (1,752 | ) | (745 | ) | ||||
Class R6 | (12,371,974 | ) | (1,711,598 | ) | ||||
Advisor Class | (11,924 | ) | (6,239 | ) | ||||
|
| |||||||
Total distributions to shareholders | (12,434,715 | ) | (1,825,341 | ) | ||||
|
| |||||||
Capital share transactions: (Note 2) | ||||||||
Class A | 351,865 | (9,288,308 | ) | |||||
Class C | 91,704 | 35,861 | ||||||
Class R | 33,323 | (9,156 | ) | |||||
Class R6 | 296,632,582 | 211,478,984 | ||||||
Advisor Class | 11,647 | 195,749 | ||||||
|
| |||||||
Total capital share transactions | 297,121,121 | 202,413,130 | ||||||
|
| |||||||
Net increase (decrease) in net assets | 294,521,353 | 201,705,263 | ||||||
Net assets: | ||||||||
Beginning of year | 212,695,432 | 10,990,169 | ||||||
|
| |||||||
End of year (Note 1h) | $507,216,785 | $212,695,432 | ||||||
|
| |||||||
franklintempleton.com | The accompanying notes are an integral part of these financial statements. | Annual Report | 41 | ||
FRANKLIN STRATEGIC SERIES
Notes to Financial Statements
Franklin Flexible Alpha Bond Fund
1. Organization and Significant Accounting Policies
Franklin Strategic Series (Trust) is registered under the Investment Company Act of 1940 (1940 Act) as an open-end management investment company, consisting of eight separate funds and applies the specialized accounting and reporting guidance in U.S. Generally Accepted Accounting Principles (U.S. GAAP). Franklin Flexible Alpha Bond Fund (Fund) is included in this report. The Fund offers five classes of shares: Class A, Class C, Class R, Class R6, and Advisor Class. Beginning on October 19, 2018, Class C shares automatically convert to Class A shares after they have been held for 10 years. Each class of shares may differ by its initial sales load, contingent deferred sales charges, voting rights on matters affecting a single class, its exchange privilege and fees due to differing arrangements for distribution and transfer agent fees.
The following summarizes the Fund’s significant accounting policies.
a. Financial Instrument Valuation
The Fund’s investments in financial instruments are carried at fair value daily. Fair value is the price that would be received to sell an asset or paid to transfer a liability in an orderly transaction between market participants on the measurement date. The Fund calculates the net asset value (NAV) per share each business day as of 4 p.m. Eastern time or the regularly scheduled close of the New York Stock Exchange (NYSE), whichever is earlier. Under compliance policies and procedures approved by the Trust’s Board of Trustees (the Board), the Fund’s administrator has responsibility for oversight of valuation, including leading the cross-functional Valuation Committee (VC). The Fund may utilize independent pricing services, quotations from securities and financial instrument dealers, and other market sources to determine fair value.
Equity securities, exchange traded funds and derivative financial instruments listed on an exchange or on the NASDAQ National Market System are valued at the last quoted sale price or the official closing price of the day, respectively. Over-the-counter (OTC) securities are valued within the range of the most recent quoted bid and ask prices. Securities that trade in multiple markets or on multiple exchanges are valued according to the broadest and most representative market. Certain equity securities are valued based upon fundamental characteristics or relationships to similar securities.
Debt securities generally trade in the OTC market rather than on a securities exchange. The Fund’s pricing services use multiple valuation techniques to determine fair value. In instances where sufficient market activity exists, the pricing services may utilize a market-based approach through which quotes from market makers are used to determine fair value. In instances where sufficient market activity may not exist or is limited, the pricing services also utilize proprietary valuation models which may consider market characteristics such as benchmark yield curves, credit spreads, estimated default rates, anticipated market interest rate volatility, coupon rates, anticipated timing of principal repayments, underlying collateral, and other unique security features in order to estimate the relevant cash flows, which are then discounted to calculate the fair value. Securities denominated in a foreign currency are converted into their U.S. dollar equivalent at the foreign exchange rate in effect at 4 p.m. Eastern time on the date that the values of the foreign debt securities are determined.
Investments in open-end mutual funds are valued at the closing NAV.
Certain derivative financial instruments are centrally cleared or trade in the OTC market. The Fund’s pricing services use various techniques including industry standard option pricing models and proprietary discounted cash flow models to determine the fair value of those instruments. The Fund’s net benefit or obligation under the derivative contract, as measured by the fair value of the contract, is included in net assets.
The Fund has procedures to determine the fair value of financial instruments for which market prices are not reliable or readily available. Under these procedures, the Fund primarily employs a market-based approach which may use related or comparable assets or liabilities, recent transactions, market multiples, book values, and other relevant information for the investment to determine the fair value of the investment. An income-based valuation approach may also be used in which the anticipated future cash flows of the investment are discounted to calculate fair value. Discounts may also be applied due to the nature or duration of any restrictions on the disposition of the investments. Due to the inherent uncertainty of valuations of such investments, the fair values may differ significantly from the values that would have been used had an active market existed.
42 | Annual Report | franklintempleton.com | ||
FRANKLIN STRATEGIC SERIES
NOTES TO FINANCIAL STATEMENTS
Franklin Flexible Alpha Bond Fund(continued)
b. Foreign Currency Translation
Portfolio securities and other assets and liabilities denominated in foreign currencies are translated into U.S. dollars based on the exchange rate of such currencies against U.S. dollars on the date of valuation. The Fund may enter into foreign currency exchange contracts to facilitate transactions denominated in a foreign currency. Purchases and sales of securities, income and expense items denominated in foreign currencies are translated into U.S. dollars at the exchange rate in effect on the transaction date. Portfolio securities and assets and liabilities denominated in foreign currencies contain risks that those currencies will decline in value relative to the U.S. dollar. Occasionally, events may impact the availability or reliability of foreign exchange rates used to convert the U.S. dollar equivalent value. If such an event occurs, the foreign exchange rate will be valued at fair value using procedures established and approved by the Board.
The Fund does not separately report the effect of changes in foreign exchange rates from changes in market prices on securities held. Such changes are included in net realized and unrealized gain or loss from investments in the Statement of Operations.
Realized foreign exchange gains or losses arise from sales of foreign currencies, currency gains or losses realized between the trade and settlement dates on securities transactions and the difference between the recorded amounts of dividends, interest, and foreign withholding taxes and the U.S. dollar equivalent of the amounts actually received or paid. Net unrealized foreign exchange gains and losses arise from changes in foreign exchange rates on foreign denominated assets and liabilities other than investments in securities held at the end of the reporting period.
c. Derivative Financial Instruments
The Fund invested in derivative financial instruments in order to manage risk or gain exposure to various other investments or markets. Derivatives are financial contracts based on an underlying or notional amount, require no initial investment or an initial net investment that is smaller than would normally be required to have a similar response to changes in market factors, and require or permit net settlement. Derivatives contain various risks including the potential inability of the counterparty to fulfill their obligations under the terms of the contract, the potential for an illiquid secondary market, and/or the potential for market movements which expose the Fund to gains or losses in excess of the amounts shown in the Statement of Assets and
Liabilities. Realized gain and loss and unrealized appreciation and depreciation on these contracts for the period are included in the Statement of Operations.
Derivative counterparty credit risk is managed through a formal evaluation of the creditworthiness of all potential counterparties. The Fund attempts to reduce its exposure to counterparty credit risk on OTC derivatives, whenever possible, by entering into International Swaps and Derivatives Association (ISDA) master agreements with certain counterparties. These agreements contain various provisions, including but not limited to collateral requirements, events of default, or early termination. Termination events applicable to the counterparty include certain deteriorations in the credit quality of the counterparty. Termination events applicable to the Fund include failure of the Fund to maintain certain net asset levels and/or limit the decline in net assets over various periods of time. In the event of default or early termination, the ISDA master agreement gives the non-defaulting party the right to net and close-out all transactions traded, whether or not arising under the ISDA agreement, to one net amount payable by one counterparty to the other. However, absent an event of default or early termination, OTC derivative assets and liabilities are presented gross and not offset in the Statement of Assets and Liabilities. Early termination by the counterparty may result in an immediate payment by the Fund of any net liability owed to that counterparty under the ISDA agreement.
Collateral requirements differ by type of derivative. Collateral or initial margin requirements are set by the broker or exchange clearing house for exchange traded and centrally cleared derivatives. Initial margin deposited is held at the exchange and can be in the form of cash and/or securities. For OTC derivatives traded under an ISDA master agreement, posting of collateral is required by either the Fund or the applicable counterparty if the total net exposure of all OTC derivatives with the applicable counterparty exceeds the minimum transfer amount, which typically ranges from $100,000 to $250,000, and can vary depending on the counterparty and the type of the agreement. Generally, collateral is determined at the close of Fund business each day and any additional collateral required due to changes in derivative values may be delivered by the Fund or the counterparty the next business day, or within a few business days. Collateral pledged and/or received by the Fund for OTC derivatives, if any, is held in segregated accounts with the Fund’s custodian/counterparty broker and can be in the form of cash and/or securities. Unrestricted cash may be invested
franklintempleton.com | Annual Report | 43 | ||
FRANKLIN STRATEGIC SERIES
NOTES TO FINANCIAL STATEMENTS
Franklin Flexible Alpha Bond Fund(continued)
1. Organization and Significant Accounting Policies(continued)
c. Derivative Financial Instruments(continued)
according to the Fund’s investment objectives. To the extent that the amounts due to the Fund from its counterparties are not subject to collateralization or are not fully collateralized, the Fund bears the risk of loss from counterparty non-performance.
The Fund entered into exchange traded futures contracts primarily to manage and/or gain exposure to interest rate risk. A futures contract is an agreement between the Fund and a counterparty to buy or sell an asset at a specified price on a future date. Required initial margins are pledged by the Fund, and the daily change in fair value is accounted for as a variation margin payable or receivable in the Statement of Assets and Liabilities.
The Fund entered into OTC forward exchange contracts primarily to manage and/or gain exposure to certain foreign currencies. A forward exchange contract is an agreement between the Fund and a counterparty to buy or sell a foreign currency at a specific exchange rate on a future date.
The Fund entered into credit default swap contracts primarily to manage and/or gain exposure to credit risk. A credit default swap is an agreement between the Fund and a counterparty whereby the buyer of the contract receives credit protection and the seller of the contract guarantees the credit worthiness of a referenced debt obligation. These agreements may be privately negotiated in the over-the-counter market (OTC credit default swaps) or may be executed in a multilateral trade facility platform, such as a registered exchange (centrally cleared credit default swaps). The underlying referenced debt obligation may be a single issuer of corporate or sovereign debt, a credit index, a basket of issuers or indices, or a tranche of a credit index or basket of issuers or indices. In the event of a default of the underlying referenced debt obligation, the buyer is entitled to receive the notional amount of the credit default swap contract from the seller in exchange for the referenced debt obligation, a net settlement amount equal to the notional amount of the credit default swap less the recovery value of the referenced debt obligation, or other agreed upon amount. For centrally cleared credit default swaps, required initial margins are pledged by the Fund, and the daily change in fair value is accounted for as a variation margin payable or receivable in the Statement of Assets and Liabilities. Over the term of the contract, the buyer pays the seller a periodic stream of payments, provided that no
event of default has occurred. Such periodic payments are accrued daily as an unrealized appreciation or depreciation until the payments are made, at which time they are realized. Upfront payments and receipts are reflected in the Statement of Assets and Liabilities and represent compensating factors between stated terms of the credit default swap agreement and prevailing market conditions (credit spreads and other relevant factors). These upfront payments and receipts are amortized over the term of the contract as a realized gain or loss in the Statement of Operations.
The Fund entered into OTC cross currency swap contracts primarily to manage and/or gain exposure to interest rate risk and certain foreign currencies. A cross currency swap is an agreement between the Fund and a counterparty to exchange cash flows (determined using either a fixed or floating rate) based on the notional amounts of two different currencies. The notional amounts are typically determined based on the spot exchange rates at the opening of the contract. Cross currency swaps may require the exchange of notional amounts at the opening and/or closing of the contract. Over the term of the contract, contractually required payments to be paid and to be received are accrued daily and recorded as unrealized depreciation and appreciation until the payments are made, at which time they are realized. Upfront payments and receipts are reflected in the Statement of Assets and Liabilities and represent compensating factors between stated terms of the cross currency swap contract and prevailing market conditions (interest rate spreads and other relevant factors). These upfront payments and receipts are amortized over the term of the contract as a realized gain or loss in the Statement of Operations.
The Fund entered into inflation index swap contracts primarily to manage and/or gain exposure to inflation risk. An inflation index swap is an agreement between the Fund and a counterparty to exchange cash flows whereby one party makes payments based on the percentage change in an index that serves as a measure of inflation and the other party makes a regular payment based on a compounded fixed rate, applied to a notional amount. These agreements may be privately negotiated in the over-the-counter market (OTC inflation index swap) or may be executed on a registered exchange (centrally cleared inflation index swap). For centrally cleared inflation index swaps, required initial margins are pledged by the Fund, and the daily change in fair value is accounted for as a variation margin payable or receivable. Over the term of the contract, contractually required payments to be paid and to be received
44 | Annual Report | franklintempleton.com | ||
FRANKLIN STRATEGIC SERIES
NOTES TO FINANCIAL STATEMENTS
Franklin Flexible Alpha Bond Fund(continued)
are accrued daily and recorded as unrealized depreciation and appreciation until the payments are made, at which time they are realized. Typically, an inflation index swap has payment obligations netted and exchanged upon maturity.
The Fund entered into interest rate swap contracts primarily to manage interest rate risk. An interest rate swap is an agreement between the Fund and a counterparty to exchange cash flows based on the difference between two interest rates, applied to a notional amount. These agreements may be privately negotiated in the over-the-counter market (OTC interest rate swaps) or may be executed on a registered exchange (centrally cleared interest rate swaps). For centrally cleared interest rate swaps, required initial margins are pledged by the Fund, and the daily change in fair value is accounted for as a variation margin payable or receivable in the Statement of Assets and Liabilities. Over the term of the contract, contractually required payments to be paid and to be received are accrued daily and recorded as unrealized depreciation and appreciation until the payments are made, at which time they are realized.
The Fund entered into OTC total return swap contracts primarily to manage and/or gain exposure to interest rate risk of an underlying instrument such as a stock, bond, index or basket of securities or indices. A total return swap is an agreement between the Fund and a counterparty to exchange a return linked to an underlying instrument for a floating or fixed rate payment, both based upon a notional amount. Over the term of the contract, contractually required payments to be paid or received are accrued daily and recorded as unrealized appreciation or depreciation until the payments are made, at which time they are recognized as realized gain or loss.
The Fund purchased or wrote exchange traded and/or OTC option contracts primarily to manage and/or gain exposure to interest rate, foreign exchange rate and credit risk. An option is a contract entitling the holder to purchase or sell a specific amount of shares or units of an asset or notional amount of a swap (swaption), at a specified price. When an option is purchased or written, an amount equal to the premium paid or received is recorded as an asset or liability, respectively. Upon exercise of an option, the acquisition cost or sales proceeds of the underlying investment is adjusted by any premium received or paid. Upon expiration of an option, any premium received or paid is recorded as a realized gain or loss. Upon closing an
option other than through expiration or exercise, the difference between the premium received or paid and the cost to close the position is recorded as a realized gain or loss.
See Note 8 regarding other derivative information.
d. Restricted Cash
At April 30, 2019, the Fund held restricted cash in connection with investments in certain derivative securities. Restricted cash is held in a segregated account with the Fund’s custodian and is reflected in the Statement of Assets and Liabilities.
e. Loan Participation Notes
The Fund invests in loan participation notes (Participations). Participations are loans originally issued to a borrower by one or more financial institutions (the Lender) and subsequently sold to other investors, such as the Fund. Participations typically result in the Fund having a contractual relationship only with the Lender and not with the borrower. The Fund has the right to receive from the Lender any payments of principal, interest and fees which the Lender received from the borrower. The Fund generally has no rights to either enforce compliance by the borrower with the terms of the loan agreement or to any collateral relating to the original loan. As a result, the Fund assumes the credit risk of both the borrower and the Lender that is selling the Participation. The Participations may also involve interest rate risk and liquidity risk, including the potential default or insolvency of the borrower and/or the Lender.
f. Mortgage Dollar Rolls
The Fund enters into mortgage dollar rolls, typically on a TBA basis. Mortgage dollar rolls are agreements between the Fund and a financial institution where the Fund sells (or buys) mortgage-backed securities for delivery on a specified date and simultaneously contracts to repurchase (or sell) substantially similar (same type, coupon, and maturity) securities at a future date and at a predetermined price. Gains or losses are realized on the initial sale, and the difference between the repurchase price and the sale price is recorded as an unrealized gain or loss to the Fund upon entering into the mortgage dollar roll. In addition, the Fund may invest the cash proceeds that are received from the initial sale. During the period between the sale and repurchase, the Fund is not entitled to principal and interest paid on the mortgage backed securities. Transactions in mortgage dollar rolls are accounted for as purchases and sales
franklintempleton.com | Annual Report | 45 | ||
FRANKLIN STRATEGIC SERIES
NOTES TO FINANCIAL STATEMENTS
Franklin Flexible Alpha Bond Fund(continued)
1. Organization and Significant Accounting
Policies(continued)
f. Mortgage Dollar Rolls(continued)
and may result in an increase to the Fund’s portfolio turnover rate. The risks of mortgage dollar roll transactions include the potential inability of the counterparty to fulfill its obligations.
g. Income and Deferred Taxes
It is the Fund’s policy to qualify as a regulated investment company under the Internal Revenue Code. The Fund intends to distribute to shareholders substantially all of its taxable income and net realized gains to relieve it from federal income and excise taxes. As a result, no provision for U.S. federal income taxes is required.
The Fund may be subject to foreign taxation related to income received, capital gains on the sale of securities and certain foreign currency transactions in the foreign jurisdictions in which it invests. Foreign taxes, if any, are recorded based on the tax regulations and rates that exist in the foreign markets in which the Fund invests. When a capital gain tax is determined to apply, the Fund records an estimated deferred tax liability in an amount that would be payable if the securities were disposed of on the valuation date.
The Fund may recognize an income tax liability related to its uncertain tax positions under U.S. GAAP when the uncertain tax position has a less than 50% probability that it will be sustained upon examination by the tax authorities based on its technical merits. As of April 30, 2019, the has determined that no tax liability is required in its financial statements related to uncertain tax positions for any open tax years (or expected to be taken in future tax years). Open tax years are those that remain subject to examination and are based on the statute of limitations in each jurisdiction in which the Fund invests.
h. Security Transactions, Investment Income, Expenses and Distributions
Security transactions are accounted for on trade date. Realized gains and losses on security transactions are determined on a specific identification basis. Interest income and estimated expenses are accrued daily. Amortization of premium and accretion of discount on debt securities are included in interest income. Paydown gains and losses are recorded as an adjustment to interest income. Dividend income is recorded on the ex-dividend date. Dividends from net investment income are
normally declared daily; these dividends may be reinvested or paid monthly to shareholders. Distributions from realized capital gains and other distributions, if any, are recorded on the ex-dividend date. Distributable earnings are determined according to income tax regulations (tax basis) and may differ from earnings recorded in accordance with U.S. GAAP. These differences may be permanent or temporary. Permanent differences are reclassified among capital accounts to reflect their tax character. These reclassifications have no impact on net assets or the results of operations. Temporary differences are not reclassified, as they may reverse in subsequent periods.*
Common expenses incurred by the Trust are allocated among the Funds based on the ratio of net assets of each Fund to the combined net assets of the Trust or based on the ratio of number of shareholders of each Fund to the combined number of shareholders of the Trust. Fund specific expenses are charged directly to the Fund that incurred the expense.
Net investment income, excluding class specific expenses, is allocated daily to each class of shares based upon the relative value of the settled shares of each class. Realized and unrealized gains and losses are allocated daily to each class of shares based upon the relative proportion of net assets of each class. Differences in per share distributions by class are generally due to differences in class specific expenses.
Inflation-indexed bonds are adjusted for inflation through periodic increases or decreases in the security’s interest accruals, face amount, or principal redemption value, by amounts corresponding to the rate of inflation as measured by an index. Any increase or decrease in the face amount or principal redemption value will be included as interest income in the Statement of Operations.
i. Accounting Estimates
The preparation of financial statements in accordance with U.S. GAAP requires management to make estimates and assumptions that affect the reported amounts of assets and liabilities at the date of the financial statements and the amounts of income and expenses during the reporting period. Actual results could differ from those estimates.
j. Guarantees and Indemnifications
Under the Trust’s organizational documents, its officers and trustees are indemnified by the Trust against certain liabilities arising out of the performance of their duties to the Trust.
46 | Annual Report | franklintempleton.com | ||
FRANKLIN STRATEGIC SERIES
NOTES TO FINANCIAL STATEMENTS
Franklin Flexible Alpha Bond Fund(continued)
Additionally, in the normal course of business, the Trust, on behalf of the Fund, enters into contracts with service providers that contain general indemnification clauses. The Trust’s maximum exposure under these arrangements is unknown as
this would involve future claims that may be made against the Trust that have not yet occurred. Currently, the Trust expects the risk of loss to be remote.
*Effective during the current reporting period, it is no longer required to present certain line items in the Statements of Changes in Net Assets. The below prior period amounts affected by this change are shown as they were in the prior year Statements of Changes in Net Assets.
For the year ended April 30, 2018, distributions to shareholders were as follows:
Distributions from net investment income: | ||||
Class A | $ | (102,670 | ) | |
Class C | (2,927 | ) | ||
Class R | (695 | ) | ||
Class R6 | (1,603,614 | ) | ||
Advisor Class | (5,822 | ) | ||
Distributions from net realized gains: | ||||
Class A | (930 | ) | ||
Class C | (232 | ) | ||
Class R | (50 | ) | ||
Class R6 | (107,984 | ) | ||
Advisor Class | (417 | ) |
For the year ended April 30, 2018, undistributed net investment income included in net assets was $58,013.
2. Shares of Beneficial Interest
At April 30, 2019, there were an unlimited number of shares authorized (without par value). Transactions in the Fund’s shares were as follows:
| Year Ended April 30, | ||||||||||||||||
| 2019 | 2018 | |||||||||||||||
| Shares | Amount | Shares | Amount | |||||||||||||
Class A Shares: | ||||||||||||||||
Shares solda | 146,054 | $ | 1,426,571 | 71,706 | $ | 705,410 | ||||||||||
Shares issued in reinvestment of distributions | 4,309 | 41,654 | 2,584 | 25,433 | ||||||||||||
Shares redeemed | (115,764 | ) | (1,116,360 | ) | (1,017,579 | ) | (10,019,151 | ) | ||||||||
Net increase (decrease) | 34,599 | $ | 351,865 | (943,289 | ) | $ | (9,288,308 | ) | ||||||||
Class C Shares: | ||||||||||||||||
Shares sold | 21,517 | $ | 208,316 | 28,772 | $ | 281,596 | ||||||||||
Shares issued in reinvestment of distributions | 735 | 7,066 | 318 | 3,106 | ||||||||||||
Shares redeemeda | (12,740 | ) | (123,678 | ) | (25,418 | ) | (248,841 | ) | ||||||||
Net increase (decrease) | 9,512 | $ | 91,704 | 3,672 | $ | 35,861 | ||||||||||
Class R Shares: | ||||||||||||||||
Shares sold | 3,238 | $ | 31,606 | — | $ | — | ||||||||||
Shares issued in reinvestment of distributions | 181 | 1,752 | 71 | 695 | ||||||||||||
Shares redeemed | (3 | ) | (35 | ) | (1,001 | ) | (9,851 | ) | ||||||||
Net increase (decrease) | 3,416 | $ | 33,323 | (930 | ) | $ | (9,156 | ) | ||||||||
franklintempleton.com | Annual Report | 47 | ||
FRANKLIN STRATEGIC SERIES
NOTES TO FINANCIAL STATEMENTS
Franklin Flexible Alpha Bond Fund(continued)
2. Shares of Beneficial Interest(continued)
Year Ended April 30, | ||||||||||||||||
2019 | 2018 | |||||||||||||||
| Shares | Amount | Shares | Amount | |||||||||||||
Class R6 Shares: | ||||||||||||||||
Shares sold | 31,582,771 | $ | 307,592,000 | 21,649,534 | $ | 212,625,650 | ||||||||||
Shares issued in reinvestment of distributions | 29,382 | 284,707 | 9,792 | 96,166 | ||||||||||||
Shares redeemed | (1,157,235 | ) | (11,244,125 | ) | (126,232 | ) | (1,242,832 | ) | ||||||||
Net increase (decrease) | 30,454,918 | $ | 296,632,582 | 21,533,094 | $ | 211,478,984 | ||||||||||
Advisor Class Shares: | ||||||||||||||||
Shares sold | 4,301 | $ | 41,736 | 19,425 | $ | 191,301 | ||||||||||
Shares issued in reinvestment of distributions | 1,232 | 11,923 | 635 | 6,240 | ||||||||||||
Shares redeemed | (4,298 | ) | (42,012 | ) | (181 | ) | (1,792 | ) | ||||||||
Net increase (decrease) | 1,235 | $ | 11,647 | 19,879 | $ | 195,749 | ||||||||||
aMay include a portion of Class C shares that were automatically converted to Class A.
3. Transactions with Affiliates
Franklin Resources, Inc. is the holding company for various subsidiaries that together are referred to as Franklin Templeton. Certain officers and trustees of the Trust are also officers and/or directors of the following subsidiaries:
| Subsidiary | Affiliation | |||
Franklin Advisers, Inc. (Advisers) | Investment manager | |||
Franklin Templeton Institutional, LLC (FT Institutional) | Investment manager | |||
Franklin Templeton Services, LLC (FT Services) | Administrative manager | |||
Franklin Templeton Distributors, Inc. (Distributors) | Principal underwriter | |||
Franklin Templeton Investor Services, LLC (Investor Services) | Transfer agent |
a. Management Fees
The Fund pays an investment management fee to Advisers based on the average daily net assets of the Fund as follows:
| Annualized Fee Rate | Net Assets | |||
0.550% | Up to and including $1 billion | |||
0.500% | Over $1 billion, up to and including $5 billion | |||
0.450% | Over $5 billion, up to and including $10 billion | |||
0.445% | Over $10 billion, up to and including $15 billion | |||
0.440% | Over $15 billion, up to and including $20 billion | |||
0.435% | In excess of $20 billion |
Under a subadvisory agreement, FT Instituitional, an affiliate of Advisers, provides subadvisory services to the Fund. The subadvisory fee is paid by Advisers based on the Fund’s average daily net assets, and is not an additional expense of the Fund.
b. Administrative Fees
Under an agreement with Advisers, FT Services provides administrative services to the Fund. The fee is paid by Advisers based on the Fund’s average daily net assets, and is not an additional expense of the Fund.
48 | Annual Report | franklintempleton.com | ||
FRANKLIN STRATEGIC SERIES
NOTES TO FINANCIAL STATEMENTS
Franklin Flexible Alpha Bond Fund(continued)
c. Distribution Fees
The Board has adopted distribution plans for each share class, with the exception of Class R6 and Advisor Class shares, pursuant to Rule 12b-1 under the 1940 Act. Under the Fund’s Class A reimbursement distribution plan, the Fund reimburses Distributors for costs incurred in connection with the servicing, sale and distribution of the Fund’s shares up to the maximum annual plan rate. Under the Class A reimbursement distribution plan, costs exceeding the maximum for the current plan year cannot be reimbursed in subsequent periods. In addition, under the Fund’s Class C and R compensation distribution plans, the Fund pays Distributors for costs incurred in connection with the servicing, sale and distribution of the Fund’s shares up to the maximum annual plan rate for each class. The plan year, for purposes of monitoring compliance with the maximum annual plan rates, is February 1 through January 31.
The maximum annual plan rates, based on the average daily net assets, for each class, are as follows:
Class A | 0.25 | % | ||
Class C | 0.65 | % | ||
Class R | 0.50 | % |
d. Sales Charges/Underwriting Agreements
Front-end sales charges and contingent deferred sales charges (CDSC) do not represent expenses of the Fund. These charges are deducted from the proceeds of sales of Fund shares prior to investment or from redemption proceeds prior to remittance, as applicable. Distributors has advised the Fund of the following commission transactions related to the sales and redemptions of the Fund’s shares for the year:
Sales charges retained net of commissions paid to unaffiliated brokers/dealers | $ | 181 | ||
CDSC retained | $ | 546 |
Effective March 1, 2019, certain front-end sales charges on Class A shares, if any, were lowered. Further details are disclosed in the Fund’s Prospectus.
e. Transfer Agent Fees
Each class of shares pays transfer agent fees to Investor Services for its performance of shareholder servicing obligations. The fees are based on an annualized asset based fee of 0.02% plus a transaction based fee. In addition, each class reimburses Investor Services for out of pocket expenses incurred and, except for Class R6, reimburses shareholder servicing fees paid to third parties. These fees are allocated daily based upon their relative proportion of such classes’ aggregate net assets. Class R6 pays Investor Services transfer agent fees specific to that class.
For the year ended April 30, 2019, the Fund paid transfer agent fees of $83,495, of which $83,233 was retained by Investor Services.
franklintempleton.com | Annual Report | 49 | ||
FRANKLIN STRATEGIC SERIES
NOTES TO FINANCIAL STATEMENTS
Franklin Flexible Alpha Bond Fund(continued)
3. Transactions with Affiliates(continued)
f. Investments in Affiliated Management Investment Companies
The Fund invests in one or more affiliated management investment companies for purposes other than exercising a controlling influence over the management or policies. Management fees paid by the Fund are waived on assets invested in the affiliated management investment companies, as noted in the Statement of Operations, in an amount not to exceed the management and administrative fees paid directly or indirectly by each affiliate. During the year ended April 30, 2019, the Fund held investments in affiliated management investment companies as follows:
Number of at Beginning of Year | Gross Additions | Gross Reductions | Number of Shares Held at End of Year | Value at End of Year | Dividend Income | Realized Gain (Loss) | Net Change in Unrealized Appreciation (Depreciation) | |||||||||||||||||||||||||
Non-Controlled Affiliates | ||||||||||||||||||||||||||||||||
Institutional Fiduciary Trust Money Market Portfolio, 2.10% | 44,846,991 | 362,467,562 | (329,452,655 | ) | 77,861,898 | $77,861,898 | $1,286,983 | $ — | $ — | |||||||||||||||||||||||
g. Waiver and Expense Reimbursements
Advisers has contractually agreed in advance to waive or limit its fees and to assume as its own expense certain expenses otherwise payable by the Fund so that the expenses (excluding distribution fees, acquired fund fees and expenses and certain non-routine expenses or costs, including those relating to litigation, indemnification, reorganizations, and liquidations) for Class A, Class C, Class R and Advisor Class of the Fund do not exceed 0.85% and for Class R6 do not exceed 0.81%, based on the average net assets of each class until August 31, 2019. Total expenses waived or paid are not subject to recapture subsequent to the Fund’s fiscal year end.
Prior to September 1, 2018, expenses (excluding certain fees and expenses as previously disclosed) for Class R6 were limited to 0.85% based on the average net assets of the class.
Investor Services has voluntarily agreed in advance to waive or limit its fees so that the new transfer agent fee arrangement effective November 1, 2017 will not increase the fees retained by more than 0.02% based on the average net assets of the class. Investor Services discontinued the waiver effective October 31, 2018.
h. Other Affiliated Transactions
At April 30, 2019, the shares of the Fund were owned by the following entities/investment companies:
| Shares | Percentage of Outstanding Sharesa | |||||||
Franklin Resources, Inc | 41,816,072 | 80.0% | ||||||
Franklin Total Return Fund | 10,172,940 | 19.5% | ||||||
| 51,989,012 | 99.5% | |||||||
aInvestment activities of significant shareholders could have a material impact on the Fund.
4. Expense Offset Arrangement
The Fund has entered into an arrangement with its custodian whereby credits realized as a result of uninvested cash balances are used to reduce a portion of the Fund’s custodian expenses. During the year ended April 30, 2019, the custodian fees were reduced as noted in the Statement of Operations.
50 | Annual Report | franklintempleton.com | ||
FRANKLIN STRATEGIC SERIES
NOTES TO FINANCIAL STATEMENTS
Franklin Flexible Alpha Bond Fund(continued)
5. Income Taxes
For tax purposes, capital losses may be carried over to offset future capital gains.
At April 30, 2019, the capital loss carryforwards were as follows:
Capital loss carryforwards not subject to expiration: | ||||
Short term | $ | 1,069,279 | ||
Long term | 2,264,409 | |||
Total capital loss carryforwards | $ | 3,333,688 | ||
The tax character of distributions paid during the years ended April 30, 2019 and 2018, was as follows:
| 2019 | 2018 | |||||||
Distributions paid from: | ||||||||
Ordinary income | $ | 11,879,347 | $ | 1,715,728 | ||||
Long term capital gain | 555,368 | 109,613 | ||||||
| $ | 12,434,715 | $ | 1,825,341 | |||||
At April 30, 2019, the cost of investments, net unrealized appreciation (depreciation) and undistributed ordinary income for income tax purposes were as follows:
Cost of investments | $ | 516,432,581 | ||
Unrealized appreciation | $ | 6,937,414 | ||
Unrealized depreciation | (10,007,284 | ) | ||
Net unrealized appreciation (depreciation) | $ | (3,069,870 | ) | |
Distributable earnings-undistributed ordinary income | $ | 4,596,603 | ||
Differences between income and/or capital gains as determined on a book basis and a tax basis are primarily due to differing treatments of paydown losses, swaps and financial futures transactions.
6. Investment Transactions
Purchases and sales of investments (excluding short term securities) for the year ended April 30, 2019, aggregated $348,007,267 and $78,955,568, respectively.
7. Credit Risk
At April 30, 2019, the Fund had 12.7% of its portfolio invested in high yield securities, or other securities rated below investment grade and unrated securities, if any. These securities may be more sensitive to economic conditions causing greater price volatility and are potentially subject to a greater risk of loss due to default than higher rated securities.
franklintempleton.com | Annual Report | 51 | ||
FRANKLIN STRATEGIC SERIES
NOTES TO FINANCIAL STATEMENTS
Franklin Flexible Alpha Bond Fund(continued)
8. Other Derivative Information
At April 30, 2019, the investments in derivative contracts are reflected in the Statement of Assets and Liabilities as follows:
| Asset Derivatives | Liability Derivatives | |||||||||||
Derivative Contracts Not Accounted for as Hedging Instruments | Statement of Assets and Liabilities Location | Fair Value | Statement of Assets and Liabilities Location | Fair Value | ||||||||
Interest rate contracts | Investments in securities, at value | $ 26,239 | a | Options written, at value | $ — | |||||||
Variation margin on futures contracts | 229,060 | b | Variation margin on futures contracts | 600,361 | b | |||||||
Variation margin on centrally cleared swap contracts | — | Variation margin on centrally cleared swap contracts | 1,528,383 | b | ||||||||
Unrealized appreciation on OTC swap contracts | 1,716,510 | Unrealized depreciation on OTC swap contracts | — | |||||||||
Foreign exchange contracts | Unrealized appreciation on OTC forward exchange contracts | 279,206 | Unrealized depreciation on OTC forward exchange contracts | 89,605 | ||||||||
Credit contracts | Investments in securities, at value | 111,285 | a | Options written, at value | 30,265 | |||||||
OTC swap contracts (upfront payments) | 248,730 | OTC swap contracts (upfront receipts) | 1,863,576 | |||||||||
Unrealized appreciation on OTC swap contracts | 314,126 | Unrealized depreciation on OTC swap contracts | 592,469 | |||||||||
Inflation contracts | Variation margin on centrally cleared swap contracts | 1,002 | b | Variation margin on centrally cleared swap contracts | 169,336 | b | ||||||
Totals | $ 2,926,158 | $4,873,995 | ||||||||||
aPurchased option contracts are included in investments in securities, at value in the Statement of Assets and Liabilities.
bThis amount reflects the cumulative appreciation (depreciation) of futures contracts and centrally cleared swap contracts as reported in the Statement of Investments. Only the variation margin receivable/payable at year end is separately reported within the Statement of Assets and Liabilities. Prior variation margin movements were recorded to cash upon receipt or payment.
For the year ended April 30, 2019, the effect of derivative contracts in the Statement of Operations was as follows:
Derivative Contracts Not Accounted for as Hedging Instruments
| Statement of Operations Location
| Net Realized Gain (Loss) for the Year
| Statement of Operations Location
| Net Change in Unrealized Appreciation (Depreciation) for the Year
| ||||||||
Net realized gain (loss) from: | Net change in unrealized | |||||||||||
| appreciation (depreciation) on: | ||||||||||||
Interest rate contracts | Investments | $(172,796) | a | Investments | $ (133,922) | a | ||||||
Written options | 15,180 | Written options | (1,380) | |||||||||
Futures contracts | (991,042) | Futures contracts | (494,189) | |||||||||
Swap contracts | (67,416) | Swap contracts | (131,781) | |||||||||
Foreign exchange contracts | Forward exchange contracts | 474,291 | Forward exchange contracts | 213,188 | ||||||||
Credit contracts | Investments | 5,719 | a | Investments | (96,299) | a | ||||||
Written options | 30,180 | Written options | 23,955 | |||||||||
Swap contracts | 778,919 | Swap contracts | (202,065) | |||||||||
Inflation contracts | Swap contracts | (40) | Swap contracts | (207,742) | ||||||||
Totals | $ 72,995 | $(1,030,235) | ||||||||||
aPurchased option contracts are included in net realized gain (loss) from investments and net change in unrealized appreciation (depreciation) on investments in the Statement of Operations.
52 | Annual Report | franklintempleton.com | ||
FRANKLIN STRATEGIC SERIES
NOTES TO FINANCIAL STATEMENTS
Franklin Flexible Alpha Bond Fund(continued)
For the year ended April 30, 2019, the average month end notional amount of futures contracts, options and swap contracts and the average month end contract value for forward exchange contracts, were as follows:
Futures contracts | $ | 106,181,424 | ||||||
Options | 74,964,462 | shares | ||||||
Swap contracts | 158,507,557 | |||||||
Forward exchange contracts | 25,527,325 |
At April 30, 2019, OTC derivative assets and liabilities are as follows:
Gross Amounts of Assets and Liabilities Presented in the Statement of Assets and Liabilities | ||||||||
Assetsa
| Liabilitiesa
| |||||||
Derivatives | ||||||||
Forward exchange contracts | $ 279,206 | $ 89,605 | ||||||
Options purchased | 137,524 | — | ||||||
Options written | — | 30,265 | ||||||
Swap contracts | 2,279,366 | 2,456,045 | ||||||
Total | $2,696,096 | $2,575,915 | ||||||
aAbsent an event of default or early termination, OTC derivative assets and liabilities are presented gross and not offset in the Statement of Assets and Liabilities.
At April 30, 2019, OTC derivative assets, which may be offset against OTC derivative liabilities and collateral received from the counterparty, are as follows:
| Amounts Not Offset in the | ||||||||||||||||||||
| Statement of Assets and Liabilities | ||||||||||||||||||||
Gross Amounts of Assets Presented in the Statement of Assets and Liabilities
| Financial Instruments Available for Offset
| Financial Instruments Collateral Receiveda
| Cash Collateral Received
| Net Amount (Not less than zero) | ||||||||||||||||
Counterparty | ||||||||||||||||||||
BNDP | $ 61,790 | $ (18,324 | ) | $ — | $ — | $ 43,466 | ||||||||||||||
BZWS | 32,019 | (32,019 | ) | — | — | — | ||||||||||||||
CITI | 800,311 | (742,917 | ) | — | — | 57,394 | ||||||||||||||
DBAB | 364,377 | (2,901 | ) | — | (350,000 | ) | 11,476 | |||||||||||||
FBCO | — | — | — | — | — | |||||||||||||||
GSCO | 71,062 | (71,062 | ) | — | — | — | ||||||||||||||
JPHQ | 1,197,542 | (720,519 | ) | (267,634 | ) | — | 209,389 | |||||||||||||
MSCO | 18,937 | (18,937 | ) | — | — | — | ||||||||||||||
RBS | 70,175 | (12,019 | ) | — | — | 58,156 | ||||||||||||||
UBSW | 79,883 | (38,798 | ) | — | — | 41,085 | ||||||||||||||
Total | $2,696,096 | $(1,657,496 | ) | $(267,634 | ) | $(350,000 | ) | $420,966 | ||||||||||||
aAt April 30, 2019, the Fund received U.S. Treasury Bonds and Notes as collateral for derivatives.
franklintempleton.com | Annual Report | 53 | ||
FRANKLIN STRATEGIC SERIES
NOTES TO FINANCIAL STATEMENTS
Franklin Flexible Alpha Bond Fund(continued)
8. Other Derivative Information(continued)
At April 30, 2019, OTC derivative liabilities, which may be offset against OTC derivative assets and collateral pledged to the counterparty, are as follows:
| Amounts Not Offset in the | ||||||||||||||||||||
| Statement of Assets and Liabilities | ||||||||||||||||||||
Gross Amounts of Liabilities Presented in the Statement of Assets and Liabilities | Financial Instruments Available for Offset | Financial Instruments Collateral Pledged | Cash Collateral Pledged | Net Amount (Not less than zero) | ||||||||||||||||
Counterparty | ||||||||||||||||||||
BNDP | $ 18,324 | $ (18,324 | ) | $ — | $ — | $ — | ||||||||||||||
BZWS | 621,250 | (32,019 | ) | — | (440,000 | ) | 149,231 | |||||||||||||
CITI | 742,917 | (742,917 | ) | — | — | — | ||||||||||||||
DBAB | 2,901 | (2,901 | ) | — | — | — | ||||||||||||||
FBCO | 271,640 | — | — | (240,000 | ) | 31,640 | ||||||||||||||
GSCO | 84,489 | (71,062 | ) | — | — | 13,427 | ||||||||||||||
JPHQ | 720,519 | (720,519 | ) | — | — | — | ||||||||||||||
MSCO | 63,058 | (18,937 | ) | — | — | 44,121 | ||||||||||||||
RBS | 12,019 | (12,019 | ) | — | — | — | ||||||||||||||
UBSW | 38,798 | (38,798 | ) | — | — | — | ||||||||||||||
Total | $2,575,915 | $(1,657,496 | ) | $ — | $(680,000 | ) | $238,419 | |||||||||||||
See Note 1(c) regarding derivative financial instruments.
See Abbreviations on page 56.
9. Credit Facility
The Fund, together with other U.S. registered and foreign investment funds (collectively, Borrowers), managed by Franklin Templeton, are borrowers in a joint syndicated senior unsecured credit facility totaling $2 billion (Global Credit Facility) which matures on February 7, 2020. This Global Credit Facility provides a source of funds to the Borrowers for temporary and emergency purposes, including the ability to meet future unanticipated or unusually large redemption requests.
Under the terms of the Global Credit Facility, the Fund shall, in addition to interest charged on any borrowings made by the Fund and other costs incurred by the Fund, pay its share of fees and expenses incurred in connection with the implementation and maintenance of the Global Credit Facility, based upon its relative share of the aggregate net assets of all of the Borrowers, including an annual commitment fee of 0.15% based upon the unused portion of the Global Credit Facility. These fees are reflected in other expenses in the Statement of Operations. During the year ended April 30, 2019, the Fund did not use the Global Credit Facility.
10. Fair Value Measurements
The Fund follows a fair value hierarchy that distinguishes between market data obtained from independent sources (observable inputs) and the Fund’s own market assumptions (unobservable inputs). These inputs are used in determining the value of the Fund’s financial instruments and are summarized in the following fair value hierarchy:
| • | Level 1 – quoted prices in active markets for identical financial instruments |
| • | Level 2 – other significant observable inputs (including quoted prices for similar financial instruments, interest rates, prepayment speed, credit risk, etc.) |
54 | Annual Report | franklintempleton.com | ||
FRANKLIN STRATEGIC SERIES
NOTES TO FINANCIAL STATEMENTS
Franklin Flexible Alpha Bond Fund(continued)
| • | Level 3 – significant unobservable inputs (including the Fund’s own assumptions in determining the fair value of financial instruments) |
The input levels are not necessarily an indication of the risk or liquidity associated with financial instruments at that level.
A summary of inputs used as of April 30, 2019, in valuing the Fund’s assets and liabilities carried at fair value, is as follows:
| Level 1 | Level 2 | Level 3 | Total | |||||||||||||
Assets: | ||||||||||||||||
Investments in Securities:a | ||||||||||||||||
Management Investment Companies | $ | 4,519,692 | $ | — | $ | — | $ | 4,519,692 | ||||||||
Corporate Bonds | — | 94,950,773 | — | 94,950,773 | ||||||||||||
Foreign Government and Agency Securities | — | 14,493,764 | — | 14,493,764 | ||||||||||||
U.S. Government and Agency Securities | — | 7,413,513 | — | 7,413,513 | ||||||||||||
Asset-Backed Securities and Commercial Mortgage-Backed Securities | — | 314,433,738 | — | 314,433,738 | ||||||||||||
Municipal Bonds | — | 799,231 | — | 799,231 | ||||||||||||
Options Purchased | — | 137,524 | — | 137,524 | ||||||||||||
Short Term Investments | 77,861,898 | — | — | 77,861,898 | ||||||||||||
Total Investments in Securities | $ | 82,381,590 | $ | 432,228,543 | $ | — | $ | 514,610,133 | ||||||||
Other Financial Instruments: | ||||||||||||||||
Futures Contracts | $ | 229,060 | $ | — | $ | — | $ | 229,060 | ||||||||
Forward Exchange Contracts | — | 279,206 | — | 279,206 | ||||||||||||
Swap Contracts | — | 2,031,638 | — | 2,031,638 | ||||||||||||
Total Other Financial Instruments | $ | 229,060 | $ | 2,310,844 | $ | — | $ | 2,539,904 | ||||||||
Liabilities: | ||||||||||||||||
Other Financial Instruments: | ||||||||||||||||
Options Written | $ | — | $ | 30,265 | $ | — | $ | 30,265 | ||||||||
Futures Contracts | 600,361 | — | — | 600,361 | ||||||||||||
Forward Exchange Contracts | — | 89,605 | — | 89,605 | ||||||||||||
Swap Contracts | — | 2,290,188 | — | 2,290,188 | ||||||||||||
Total Other Financial Instruments | $ | 600,361 | $ | 2,410,058 | $ | — | $ | 3,010,419 | ||||||||
aFor detailed categories, see the accompanying Statement of Investments.
11. Subsequent Events
The Fund has evaluated subsequent events through the issuance of the financial statements and determined that no events have occurred that require disclosure.
franklintempleton.com | Annual Report | 55 | ||
FRANKLIN STRATEGIC SERIES
NOTES TO FINANCIAL STATEMENTS
Franklin Flexible Alpha Bond Fund(continued)
Abbreviations
| Counterparty/Exchange | Currency | Selected Portfolio | ||||||||
BNDP | BNP Paribas | AUD | Australian Dollar | CLO | Collateralized Loan Obligation | |||||
BZWS | Barclays Bank PLC | COP | Colombian Peso | CPI | Consumer Price Index | |||||
CITI | Citigroup, Inc. | DOP | Dominican Peso | ETF | Exchange Traded Fund | |||||
DBAB | Deutsche Bank AG | EUR | Euro | FHLMC | Federal Home Loan Mortgage Corp. | |||||
FBCO | Credit Suisse International | GBP | British Pound | FNMA | Federal National Mortgage Association | |||||
GSCO | The Goldman Sachs Group, Inc. | IDR | Indonesian Rupiah | FRN | Floating Rate Note | |||||
JPHQ | JP Morgan Chase & Co. | USD | United States Dollar | GO | General Obligation | |||||
MSCO | Morgan Stanley | UYU | Uruguayan Peso | IO | Interest Only | |||||
RBS | Royal Bank of Scotland PLC | ZAR | South African Rand | LIBOR | London InterBank Offered Rate | |||||
UBSW | UBS AG | RDA | Redevelopment Agency/Authority | |||||||
| SFR | Single Family Revenue | |||||||||
Index | ||
CDX.EM.Series number | CDX Emerging Markets Index | |
CDX.NA.HY.Series number | CDX North America High Yield Index | |
CDX.NA.IG.Series number | CDX North America Investment Grade Index | |
MCDX.NA.Series number | MCDX North America Index |
56 | Annual Report | franklintempleton.com | ||
FRANKLIN STRATEGIC SERIES
Report of Independent Registered Public Accounting Firm
To the Board of Trustees of Franklin Strategic Series and Shareholders of Franklin Flexible Alpha Bond Fund
Opinion on the Financial Statements
We have audited the accompanying statement of assets and liabilities, including the statement of investments, of Franklin Flexible Alpha Bond Fund (the “Fund”) as of April 30, 2019, the related statement of operations for the year ended April 30, 2019, the statement of changes in net assets for each of the two years in the period ended April 30, 2019, including the related notes, and the financial highlights for each of the periods indicated therein (collectively referred to as the “financial statements”). In our opinion, the financial statements present fairly, in all material respects, the financial position of the Fund as of April 30, 2019, the results of its operations for the year then ended, the changes in its net assets for each of the two years in the period ended April 30, 2019 and the financial highlights for each of the periods indicated therein in conformity with accounting principles generally accepted in the United States of America.
Basis for Opinion
These financial statements are the responsibility of the Fund’s management. Our responsibility is to express an opinion on the Fund’s financial statements based on our audits. We are a public accounting firm registered with the Public Company Accounting Oversight Board (United States) (PCAOB) and are required to be independent with respect to the Fund in accordance with the U.S. federal securities laws and the applicable rules and regulations of the Securities and Exchange Commission and the PCAOB.
We conducted our audits of these financial statements in accordance with the standards of the PCAOB. Those standards require that we plan and perform the audit to obtain reasonable assurance about whether the financial statements are free of material misstatement, whether due to error or fraud.
Our audits included performing procedures to assess the risks of material misstatement of the financial statements, whether due to error or fraud, and performing procedures that respond to those risks. Such procedures included examining, on a test basis, evidence regarding the amounts and disclosures in the financial statements. Our audits also included evaluating the accounting principles used and significant estimates made by management, as well as evaluating the overall presentation of the financial statements. Our procedures included confirmation of securities owned as of April 30, 2019 by correspondence with the custodian, transfer agent, and brokers; when replies were not received from brokers, we performed other auditing procedures. We believe that our audits provide a reasonable basis for our opinion.
PricewaterhouseCoopers LLP
San Francisco, California
June 17, 2019
We have served as the auditor of one or more investment companies in the Franklin Templeton Group of Funds since 1948.
franklintempleton.com | Annual Report | 57 | ||
FRANKLIN STRATEGIC SERIES
Tax Information (unaudited)
Under Section 852(b)(3)(C) of the Internal Revenue Code, the Fund hereby reports the maximum amount allowable but no less than $555,368 as a long term capital gain dividend for the fiscal year ended April 30, 2019.
Under Section 871(k)(2)(C) of the Internal Revenue Code, the Fund hereby reports the maximum amount allowable but no less than $115,922 as a short term capital gain dividend for purposes of the tax imposed under Section 871(a)(1)(A) of the Internal Revenue Code for the fiscal year ended April 30, 2019.
Under Section 871(k)(1)(C) of the Internal Revenue Code, the Fund hereby reports the maximum amount allowable but no less than $9,731,236 as interest related dividends for purposes of the tax imposed under Section 871(a)(1)(A) of the Internal Revenue Code for the fiscal year ended April 30, 2019.
58 | Annual Report | franklintempleton.com | ||
FRANKLIN STRATEGIC SERIES
Board Members and Officers
The name, year of birth and address of the officers and board members, as well as their affiliations, positions held with the Fund, principal occupations during at least the past five years and number of U.S. registered portfolios overseen in the Franklin Templeton fund complex, are shown below. Generally, each board member serves until that person’s successor is elected and qualified.
Independent Board Members
Name, Year of Birth and Address | Position | Length of Time Served | Number of Portfolios in Fund Complex Overseen by Board Member* | Other Directorships Held During at Least the Past 5 Years | ||||
| ||||||||
Harris J. Ashton (1932) One Franklin Parkway San Mateo, CA 94403-1906 | Trustee | Since 1991 | 136 | Bar-S Foods (meat packing company) (1981-2010). | ||||
| Principal Occupation During at Least the Past 5 Years: | ||||||||
Director of various companies; andformerly, Director, RBC Holdings, Inc. (bank holding company) (until 2002); and President, Chief Executive Officer and Chairman of the Board, General Host Corporation (nursery and craft centers) (until 1998).
| ||||||||
| ||||||||
Terrence J. Checki (1945) One Franklin Parkway San Mateo, CA 94403-1906 | Trustee | Since 2017 | 112 | Hess Corporation (exploration of oil and gas) (2014-present). | ||||
| Principal Occupation During at Least the Past 5 Years: | ||||||||
Member of the Council on Foreign Relations (1996-present); Member of the National Committee on U.S.-China Relations (1999-present);member of the Board of Trustees of the Economic Club of New York (2013-present); member of the Board of Trustees of the Foreign Policy Association (2005-present) and member of various other boards of trustees and advisory boards; andformerly, Executive Vice President of the Federal Reserve Bank of New York and Head of its Emerging Markets and Internal Affairs Group and Member of Management Committee (1995-2014); and Visiting Fellow at the Council on Foreign Relations (2014).
| ||||||||
| ||||||||
Mary C. Choksi (1950) One Franklin Parkway San Mateo, CA 94403-1906 | Trustee | Since 2014 | 136 | Avis Budget Group Inc. (car rental) (2007-present), Omnicom Group Inc. (advertising and marketing communications services) (2011-present) and White Mountains Insurance Group, Ltd. (holding company) (2017-present). | ||||
| Principal Occupation During at Least the Past 5 Years: | ||||||||
Director of various companies; andformerly, Founder and Senior Advisor, Strategic Investment Group (investment management group) (2015-2017); Founding Partner and Senior Managing Director, Strategic Investment Group (1987-2015); Founding Partner and Managing Director, Emerging Markets Management LLC (investment management firm) (1987-2011); and Loan Officer/Senior Loan Officer/Senior Pension Investment Officer, World Bank Group (international financial institution) (1977-1987).
| ||||||||
| ||||||||
Edith E. Holiday (1952) One Franklin Parkway San Mateo, CA 94403-1906 | Lead Independent Trustee | Trustee since 1998 and Lead Independent Trustee since March 2019 | 136 | Hess Corporation (exploration of oil and gas) (1993-present), Canadian National Railway (railroad) (2001-present), White Mountains Insurance Group, Ltd. (holding company) (2004-present), Santander Consumer USA Holdings, Inc. (consumer finance) (2016-present), RTI International Metals, Inc. (manufacture and distribution of titanium) (1999-2015) and H.J. Heinz Company (processed foods and allied products) (1994-2013). | ||||
| Principal Occupation During at Least the Past 5 Years: | ||||||||
Director or Trustee of various companies and trusts; andformerly, Assistant to the President of the United States and Secretary of the Cabinet (1990-1993); General Counsel to the United States Treasury Department (1989-1990); and Counselor to the Secretary and Assistant Secretary for Public Affairs and Public Liaison–United States Treasury Department (1988-1989).
| ||||||||
| ||||||||
J. Michael Luttig (1954) One Franklin Parkway San Mateo, CA 94403-1906 | Trustee | Since 2009 | 136 | Boeing Capital Corporation (aircraft financing) (2006-2013). | ||||
| Principal Occupation During at Least the Past 5 Years: | ||||||||
Executive Vice President, Counselor and Senior Advisor to Boeing Chairman and Board of Directors, The Boeing Company (aerospace company) (May 2019); andformerly, General Counsel and member of the Executive Council, The Boeing Company (2006-2019); Federal Appeals Court Judge, U.S. Court of Appeals for the Fourth Circuit (1991-2006).
| ||||||||
| ||||||||
franklintempleton.com | Annual Report | 59 | ||
FRANKLIN STRATEGIC SERIES
Independent Board Members (continued)
Name, Year of Birth and Address | Position | Length of Time Served | Number of Portfolios in Fund Complex Overseen by Board Member* | Other Directorships Held During at Least the Past 5 Years | ||||
| ||||||||
Larry D. Thompson (1945) One Franklin Parkway San Mateo, CA 94403-1906 | Trustee | Since 2007 | 136 | The Southern Company (energy company) (2014-present; previously 2010-2012), Graham Holdings Company (education and media organization) (2011-present) and Cbeyond, Inc. (business communications provider) (2010-2012). | ||||
| Principal Occupation During at Least the Past 5 Years: | ||||||||
Director of various companies; Counsel, Finch McCranie, LLP (law firm) (2015-present); Independent Compliance Monitor and Auditor, Volkswagen AG (manufacturer of automobiles and commercial vehicles) (2017-present); John A. Sibley Professor of Corporate and Business Law, University of Georgia School of Law (2015-present; previously 2011-2012); andformerly,Executive Vice President – Government Affairs, General Counsel and Corporate Secretary, PepsiCo, Inc. (consumer products) (2012-2014); Senior Vice President – Government Affairs, General Counsel and Secretary, PepsiCo, Inc. (2004-2011); Senior Fellow of The Brookings Institution (2003-2004); Visiting Professor, University of Georgia School of Law (2004); and Deputy Attorney General, U.S. Department of Justice (2001-2003).
| ||||||||
| ||||||||
Interested Board Members and Officers
| ||||||||
Name, Year of Birth and Address | Position | Length of Time Served | Number of Portfolios in Fund Complex Overseen by Board Member* | Other Directorships Held During at Least the Past 5 Years | ||||
| ||||||||
**Gregory E. Johnson (1961) One Franklin Parkway San Mateo, CA 94403-1906 | Trustee | Since 2013 | 150 | None | ||||
| Principal Occupation During at Least the Past 5 Years: | ||||||||
Chairman of the Board, Member – Office of the Chairman, Director and Chief Executive Officer, Franklin Resources, Inc.; officer and/or director or trustee, as the case may be, of some of the other subsidiaries of Franklin Resources, Inc. and of 42 of the investment companies in Franklin Templeton; Vice Chairman, Investment Company Institute; andformerly, President, Franklin Resources, Inc. (1994-2015).
| ||||||||
| ||||||||
**Rupert H. Johnson, Jr. (1940) One Franklin Parkway San Mateo, CA 94403-1906 | Chairman of the Board and Trustee | Chairman of the Board since 2013 and Trustee since 1991 | 136 | None | ||||
| Principal Occupation During at Least the Past 5 Years: | ||||||||
Vice Chairman, Member – Office of the Chairman and Director, Franklin Resources, Inc.; Director, Franklin Advisers, Inc.; and officer and/or director or trustee, as the case may be, of some of the other subsidiaries of Franklin Resources, Inc. and of 40 of the investment companies in Franklin Templeton.
| ||||||||
| ||||||||
Alison E. Baur (1964) One Franklin Parkway San Mateo, CA 94403-1906 | Vice President | Since 2012 | Not Applicable | Not Applicable | ||||
| Principal Occupation During at Least the Past 5 Years: | ||||||||
Deputy General Counsel, Franklin Templeton; and officer of some of the other subsidiaries of Franklin Resources, Inc. and of 44 of the investment companies in Franklin Templeton.
| ||||||||
| ||||||||
Sonal Desai, Ph.D. (1963) One Franklin Parkway San Mateo, CA 94403-1906 | Vice President | Since December 2018 | Not Applicable | Not Applicable | ||||
| Principal Occupation During at Least the Past 5 Years: | ||||||||
Director and Executive Vice President, Franklin Advisers, Inc.; Executive Vice President, Franklin Templeton Institutional, LLC; and officer of 18 of the investment companies in Franklin Templeton.
| ||||||||
| ||||||||
60 | Annual Report | franklintempleton.com | ||
FRANKLIN STRATEGIC SERIES
Interested Board Members and Officers(continued)
Name, Year of Birth and Address | Position | Length of Time Served | Number of Portfolios in Fund Complex Overseen by Board Member* | Other Directorships Held During at Least the Past 5 Years | ||||
| ||||||||
Gaston Gardey (1967) One Franklin Parkway San Mateo, CA 94403-1906 | Treasurer, Chief Financial Officer and, Chief Accounting Officer | Since 2009 | Not Applicable | Not Applicable | ||||
| Principal Occupation During at Least the Past 5 Years: | ||||||||
Treasurer, U.S. Fund Administration & Reporting and officer of 28 of the investment companies in Franklin Templeton.
| ||||||||
| ||||||||
Aliya S. Gordon (1973) One Franklin Parkway San Mateo, CA 94403-1906 | Vice President | Since 2009 | Not Applicable | Not Applicable | ||||
| Principal Occupation During at Least the Past 5 Years: | ||||||||
Senior Associate General Counsel and officer of 44 of the investment companies in Franklin Templeton.
| ||||||||
| ||||||||
Steven J. Gray (1955) One Franklin Parkway | Vice President and Co- Secretary | Vice President since 2009 and Co-Secretary since January 2019 | Not Applicable | Not Applicable | ||||
| Principal Occupation During at Least the Past 5 Years: | ||||||||
Senior Associate General Counsel, Franklin Templeton; Vice President, Franklin Templeton Distributors, Inc. and FASA, LLC; and officer of 44 of the investment companies in Franklin Templeton.
| ||||||||
| ||||||||
Matthew T. Hinkle (1971) One Franklin Parkway SanMateo, CA 94403-1906 | Chief Executive Officer – Finance and Administration | Since 2017 | Not Applicable | Not Applicable | ||||
| Principal Occupation During at Least the Past 5 Years: | ||||||||
| Senior Vice President, Franklin Templeton Services, LLC; officer of 44 of the investment companies in Franklin Templeton; andformerly, Vice President, Global Tax (2012-April 2017) and Treasurer/Assistant Treasurer, Franklin Templeton (2009-2017). | ||||||||
| ||||||||
Robert Lim (1948) One Franklin Parkway San Mateo, CA 94403-1906 | Vice President –AML Compliance | Since 2016 | Not Applicable | Not Applicable | ||||
| Principal Occupation During at Least the Past 5 Years: | ||||||||
Vice President, Franklin Templeton Companies, LLC; Chief Compliance Officer, Franklin Templeton Distributors, Inc. and Franklin Templeton Investor Services, LLC; and officer of 44 of the investment companies in Franklin Templeton.
| ||||||||
| ||||||||
Kimberly H. Novotny (1972) 300 S.E. 2nd Street Fort Lauderdale, FL 33301-1923 | Vice President | Since 2013 | Not Applicable | Not Applicable | ||||
| Principal Occupation During at Least the Past 5 Years: | ||||||||
Associate General Counsel, Franklin Templeton; Vice President and Corporate Secretary, Fiduciary Trust International of the South; Vice President, Templeton Investment Counsel, LLC; Assistant Secretary, Franklin Resources, Inc.; and officer of 44 of the investment companies in Franklin Templeton.
| ||||||||
| ||||||||
Edward D. Perks (1970) One Franklin Parkway San Mateo, CA 94403-1906 | President and Chief Executive Officer – Investment Management | �� | Since December 2018 | Not Applicable | Not Applicable | |||
| Principal Occupation During at Least the Past 5 Years: | ||||||||
President and Director, Franklin Advisers, Inc.; and officer of nine of the investment companies in Franklin Templeton (since December 2018).
| ||||||||
| ||||||||
franklintempleton.com | Annual Report | 61 | ||
FRANKLIN STRATEGIC SERIES
Interested Board Members and Officers(continued)
Name, Year of Birth and Address
| Position
| Length of Time Served
| Number of Portfolios in
| Other Directorships Held
| ||||
| ||||||||
| Robert C. Rosselot (1960) 300S.E. 2nd Street Fort Lauderdale, FL 33301-1923 | Chief Compliance Officer | Since 2013 | Not Applicable | Not Applicable | ||||
| Principal Occupation During at Least the Past 5 Years: | ||||||||
Director, Global Compliance, Franklin Templeton; Vice President, Franklin Templeton Companies, LLC; officer of 44 of the investment companies in Franklin Templeton; andformerly, Senior Associate General Counsel, Franklin Templeton (2007-2013); and Secretary and Vice President, Templeton Group of Funds (2004-2013).
| ||||||||
| ||||||||
Navid J. Tofigh (1972) San Mateo, CA 94403-1906 | Vice President | Since 2015 | Not Applicable | Not Applicable | ||||
| Principal Occupation During at Least the Past 5 Years: | ||||||||
Associate General Counsel and officer of 44 of the investment companies in Franklin Templeton.
| ||||||||
| ||||||||
Craig S. Tyle (1960) San Mateo, CA 94403-1906 | Vice President | Since 2005 | Not Applicable | Not Applicable | ||||
| Principal Occupation During at Least the Past 5 Years: | ||||||||
General Counsel, Executive Vice President and Secretary, Franklin Resources, Inc.; and officer of some of the other subsidiaries of Franklin Resources, Inc. and of 44 of the investment companies in Franklin Templeton.
| ||||||||
| ||||||||
Lori A. Weber (1964) Fort Lauderdale, FL 33301-1923 | Vice President and Co-Secretary | Vice President since 2011 and Co-Secretary since January 2019 | Not Applicable | Not Applicable | ||||
| Principal Occupation During at Least the Past 5 Years: | ||||||||
Senior Associate General Counsel, Franklin Templeton; Assistant Secretary, Franklin Resources, Inc.; Vice President and Secretary, Templeton Investment Counsel, LLC; and officer of 44 of the investment companies in Franklin Templeton.
| ||||||||
| ||||||||
*We base the number of portfolios on each separate series of the U.S. registered investment companies within the Franklin Templeton Investments fund complex. These portfolios have a common investment manager or affiliated investment managers.
**Gregory E. Johnson is considered to be an interested person of the Fund under the federal securities laws due to his position as an officer and director of Franklin Resources, Inc. (Resources), which is the parent company of the Fund’s investment manager and distributor. Rupert H. Johnson, Jr. is considered to be an interested person of the Fund under the federal securities laws due to his position as an officer and director and major shareholder of Resources.
Note 1: Rupert H. Johnson, Jr. is the uncle of Gregory E. Johnson.
Note 2: Officer information is current as of the date of this report. It is possible that after this date, information about officers may change.
The Sarbanes-Oxley Act of 2002 and Rules adopted by the Securities and Exchange Commission require the Fund to disclose whether the Fund’s Audit Committee includes at least one member who is an audit committee financial expert within the meaning of such Act and Rules. The Fund’s Board has determined that there is at least one such financial expert on the Audit Committee and effective May 21, 2019, designated Mary C. Choksi as its audit committee financial expert. The Board believes that Ms. Choksi qualifies as such an expert in view of her extensive business background and experience. She currently serves as a director of Avis Budget Group, Inc. (2007-present) and formerly, Founder and Senior Advisor, Strategic Investment Group (1987 to 2017). Ms. Choksi has been a Member of the Fund’s Audit Committee since 2014. As a result of such background and experience, the Board believes that Ms. Choksi has acquired an understanding of generally accepted accounting principles and financial statements, the general application of such principles in connection with the accounting estimates, accruals and reserves, and analyzing and evaluating financial statements that present a breadth and level of complexity of accounting issues generally comparable to those of the Fund, as well as an understanding of internal controls and procedures for financial reporting and an understanding of audit committee functions. Ms. Choksi is an independent Board member as that term is defined under the relevant Securities and Exchange Commission Rules and Releases.
The Statement of Additional Information (SAI) includes additional information about the board members and is available, without charge, upon request. Shareholders may call (800) DIAL BEN/342-5236 to request the SAI.
62 | Annual Report | franklintempleton.com | ||
FRANKLIN STRATEGIC SERIES
FRANKLIN FLEXIBLE ALPHA BOND FUND
Shareholder Information
Board Approval of Investment Management Agreements
FRANKLIN STRATEGIC SERIES
Franklin Flexible Alpha Bond Fund
(Fund)
At an in-person meeting held on April 16, 2019 (Meeting), the Board of Trustees (Board) of Franklin Strategic Series (Trust), including a majority of the trustees who are not “interested persons” as defined in the Investment Company Act of 1940 (Independent Trustees), reviewed and approved the continuance of the investment management agreement between Franklin Advisers, Inc. (FAI) and the Trust, on behalf of the Fund and the investment sub-advisory agreement between FAI and Franklin Templeton Institutional, LLC (Sub-Adviser), an affiliate of FAI, on behalf of the Fund (each a Management Agreement) for an additional one-year period. The Independent Trustees received advice from and met separately with Independent Trustee counsel in considering whether to approve the continuation of each Management Agreement. FAI and the Sub-Adviser are each referred to herein as a Manager.
In considering the continuation of each Management Agreement, the Board reviewed and considered information provided by each Manager at the Meeting and throughout the year at meetings of the Board and its committees. The Board also reviewed and considered information provided in response to a detailed set of requests for information submitted to each Manager by Independent Trustee counsel on behalf of the Independent Trustees in connection with the annual contract renewal process. In addition, prior to the Meeting, the Independent Trustees held a telephonic contract renewal meeting at which the Independent Trustees conferred amongst themselves and Independent Trustee counsel about contract renewal matters. The Board reviewed and considered all of the factors it deemed relevant in approving the continuance of each Management Agreement, including, but not limited to: (i) the nature, extent and quality of the services provided by each Manager; (ii) the investment performance of the Fund; (iii) the costs of the services provided and profits realized by each Manager and its affiliates from the relationship with the Fund; (iv) the extent to which economies of scale are realized as the Fund grows; and (v) whether fee levels reflect these economies of scale for the benefit of Fund investors.
In approving the continuance of each Management Agreement, the Board, including a majority of the Independent Trustees, determined that the terms of the Management Agreement are fair and reasonable and that the continuance of such
Management Agreement is in the interests of the Fund and its shareholders. While attention was given to all information furnished, the following discusses some primary factors relevant to the Board’s determination.
Nature, Extent and Quality of Services
The Board reviewed and considered information regarding the nature, extent and quality of investment management services provided by each Manager and its affiliates to the Fund and its shareholders. This information included, among other things, the qualifications, background and experience of the senior management and investment personnel of each Manager; the structure of investment personnel compensation; oversight of third-party service providers; investment performance reports and related financial information for the Fund; reports on expenses, shareholder services, marketing support payments made to financial intermediaries and third party servicing arrangements; legal and compliance matters; risk controls; pricing and other services provided by each Manager and its affiliates; and management fees charged by each Manager and its affiliates to US funds and other accounts, including management’s explanation of differences among accounts where relevant. The Board also reviewed and considered an annual report on payments made by Franklin Templeton Investments (FTI) or the Fund to financial intermediaries, as well as a memorandum relating to third-party servicing arrangements in response to a guidance update in 2016 from the US Securities and Exchange Commission (SEC) relating to mutual fund distribution and sub-accounting fees. The Board noted management’s continuing efforts and expenditures in establishing effective business continuity plans and developing strategies to address areas of heightened concern in the mutual fund industry, such as cybersecurity and liquidity risk management. The Board also recognized management’s commitment to facilitating Board oversight of liquidity through the designation of a liquidity/risk administrator and the development of reports that highlight the amount of illiquid investments for the Fund.
The Board also reviewed and considered the benefits provided to Fund shareholders of investing in a fund that is part of the Franklin Templeton family of funds. The Board noted the financial position of Franklin Resources, Inc. (FRI), the Managers’ parent, and its commitment to the mutual fund business as evidenced by its continued introduction of new funds, reassessment of the fund offerings in response to the market environment and project initiatives and capital investments relating to the services provided to the Fund by the FTI organization.
franklintempleton.com | Annual Report | 63 | ||
FRANKLIN STRATEGIC SERIES
FRANKLIN FLEXIBLE ALPHA BOND FUND
SHAREHOLDER INFORMATION
Following consideration of such information, the Board was satisfied with the nature, extent and quality of services provided by each Manager and its affiliates to the Fund and its shareholders.
Fund Performance
The Board reviewed and considered the performance results of the Fund over various time periods ended January 31, 2019. The Board considered the performance returns for the Fund in comparison to the performance returns of mutual funds deemed comparable to the Fund included in a universe (Performance Universe) selected by Broadridge Financial Solutions, Inc. (Broadridge), an independent provider of investment company data. The Board received a description of the methodology used by Broadridge to select the mutual funds included in a Performance Universe. The Board also reviewed and considered Fund performance reports provided and discussions that occurred with portfolio managers at Board meetings throughout the year. A summary of the Fund’s performance results is below.
The Performance Universe for the Fund included the Fund and all retail and institutional alternative credit focus funds. The Fund commenced operations on August 3, 2015, and thus has been in operation for less than five years. The Board noted that the Fund’s annualized income return for the one- and three-year periods was below the median of its Performance Universe. The Board noted that the Fund’s annualized total return for the three-year period was below the median of its Performance Universe, but for the one-year period was above the median and in the second quintile of its Performance Universe. The Board concluded that the Fund’s performance was satisfactory, especially given its short period of operation.
Comparative Fees and Expenses
The Board reviewed and considered information regarding the Fund’s actual total expense ratio and its various components, including, as applicable, management fees; transfer agent expenses; underlying fund expenses; Rule 12b-1 and non-Rule 12b-1 service fees; and other non-management fees. The Board also noted the quarterly and annual reports it receives on all marketing support payments made by FTI to financial intermediaries. The Board considered the actual total expense ratio and, separately, the contractual management fee rate, without the effect of fee waivers, if any (Management Rate) of the Fund in comparison to the median expense ratio and median Management Rate, respectively, of other mutual funds deemed comparable to and with a similar expense structure to the Fund selected by Broadridge (Expense Group).
Broadridge fee and expense data is based upon information taken from each fund’s most recent annual report, which reflects historical asset levels that may be quite different from those currently existing, particularly in a period of market volatility. While recognizing such inherent limitation and the fact that expense ratios and Management Rates generally increase as assets decline and decrease as assets grow, the Board believed the independent analysis conducted by Broadridge to be an appropriate measure of comparative fees and expenses. The Broadridge Management Rate includes administrative charges, and the actual total expense ratio, for comparative consistency, was shown for Class A shares for funds with multiple classes of shares. The Board received a description of the methodology used by Broadridge to select the mutual funds included in an Expense Group.
The Expense Group for the Fund included the Fund and 12 other alternative credit focus funds. The Board noted that the Management Rate and actual total expense ratio for the Fund were below the medians of its Expense Group. The Board concluded that the Management Rate charged to the Fund is reasonable. In doing so, the Board noted that the Fund’s actual total expense ratio reflected a fee waiver from management and that the Sub-Adviser was paid by FAI out of the management fee FAI received from the Fund.
Profitability
The Board reviewed and considered information regarding the profits realized by each Manager and its affiliates in connection with the operation of the Fund. In this respect, the Board considered the Fund profitability analysis that addresses the overall profitability of FTI’s US fund business, as well as its profits in providing investment management and other services to each of the individual funds during the 12-month period ended September 30, 2018, being the most recent fiscal year-end for FRI. The Board noted that although management continually makes refinements to its methodologies used in calculating profitability in response to organizational and product-related changes, the overall methodology has remained consistent with that used in the Fund’s profitability report presentations from prior years. Additionally, Pricewaterhouse-Coopers LLP, auditor to FRI and certain Franklin Templeton funds, has been engaged to periodically review and assess the allocation methodologies to be used solely by the Fund’s Board with respect to the profitability analysis.
The Board noted management’s belief that costs incurred in establishing the infrastructure necessary for the type of mutual fund operations conducted by each Manager and its affiliates
64 | Annual Report | franklintempleton.com | ||
FRANKLIN STRATEGIC SERIES
FRANKLIN FLEXIBLE ALPHA BOND FUND
SHAREHOLDER INFORMATION
may not be fully reflected in the expenses allocated to the Fund in determining its profitability, as well as the fact that the level of profits, to a certain extent, reflected operational cost savings and efficiencies initiated by management. The Board also noted management’s expenditures in improving shareholder services provided to the Fund, as well as the need to implement systems and meet additional regulatory and compliance requirements resulting from recent SEC and other regulatory requirements.
The Board also considered the extent to which each Manager and its affiliates might derive ancillary benefits from fund operations, including revenues generated from transfer agent services, potential benefits resulting from personnel and systems enhancements necessitated by fund growth, as well as increased leverage with service providers and counterparties. Based upon its consideration of all these factors, the Board concluded that the level of profits realized by each Manager and its affiliates from providing services to the Fund was not excessive in view of the nature, extent and quality of services provided to the Fund.
Economies of Scale
The Board reviewed and considered the extent to which each Manager may realize economies of scale, if any, as the Fund grows larger and whether the Fund’s management fee structure reflects any economies of scale for the benefit of shareholders. With respect to possible economies of scale, the Board noted the existence of management fee breakpoints, which operate generally to share any economies of scale with the Fund’s shareholders by reducing the Fund’s effective management fees as the Fund grows in size. The Board considered each Manager’s view that any analyses of potential economies of scale in managing a particular fund are inherently limited in light of the joint and common costs and investments each Manager incurs across the Franklin Templeton family of funds as a whole. The Board concluded that to the extent economies of scale may be realized by each Manager and its affiliates, the Fund’s management fee structure provided a sharing of benefits with the Fund and its shareholders as the Fund grows.
Conclusion
Based on its review, consideration and evaluation of all factors it believed relevant, including the above-described factors and conclusions, the Board unanimously approved the continuation of each Management Agreement for an additional one-year period.
Proxy Voting Policies and Procedures
The Fund’s investment manager has established Proxy Voting Policies and Procedures (Policies) that the Fund uses to determine how to vote proxies relating to portfolio securities. Shareholders may view the Fund’s complete Policies online at franklintempleton.com. Alternatively, shareholders may request copies of the Policies free of charge by calling the Proxy Group collect at (954) 527-7678 or by sending a written request to: Franklin Templeton Companies, LLC, 300 S.E. 2nd Street, Fort Lauderdale, FL 33301, Attention: Proxy Group. Copies of the Fund’s proxy voting records are also made available online at franklintempleton.com and posted on the U.S. Securities and Exchange Commission’s website at sec.gov and reflect the most recent 12-month period ended June 30.
Quarterly Statement of Investments
The Trust, on behalf of the Fund, files a complete statement of investments with the U.S. Securities and Exchange Commission for the first and third quarters for each fiscal year as an exhibit to its report on Form N-PORT. Shareholders may view the filed Form N-PORT by visiting the Commission’s website at sec.gov. The filed form may also be viewed and copied at the Commission’s Public Reference Room in Washington, DC. Information regarding the operations of the Public Reference Room may be obtained by calling (800) SEC-0330.
Householding of Reports and Prospectuses
You will receive the Fund’s financial reports every six months as well as an annual updated summary prospectus (prospectus available upon request). To reduce Fund expenses, we try to identify related shareholders in a household and send only one copy of the financial reports and summary prospectus. This process, called “householding,” will continue indefinitely unless you instruct us otherwise. If you prefer not to have these documents householded, please call us at (800) 632-2301. At any time you may view current prospectuses/summary prospectuses and financial reports on our website. If you choose, you may receive these documents through electronic delivery.
franklintempleton.com | Annual Report | 65 | ||
This page intentionally left blank.
This page intentionally left blank.
This page intentionally left blank.
 | Annual Report and Shareholder Letter | |
| Franklin Flexible Alpha Bond Fund | ||
Investment Manager | ||
| Franklin Advisers, Inc. | ||
Subadvisor | ||
| Franklin Templeton Institutional, LLC | ||
Distributor | ||
| Franklin Templeton Distributors, Inc. | ||
| (800) DIAL BEN®/342-5236 | ||
| franklintempleton.com | ||
Shareholder Services | ||
| (800)632-2301 |
Authorized for distribution only when accompanied or preceded by a summary prospectus and/or prospectus. Investors should carefully consider a fund’s investment goals, risks, charges and expenses before investing. A prospectus contains this and other information; please read it carefully before investing.
To help ensure we provide you with quality service, all calls to and from our service areas are monitored and/or recorded.
| © 2019 Franklin Templeton Investments. All rights reserved. | 953 A 06/19 |
Internet Delivery of Fund Reports Unless You Request Paper Copies: Effective January 1, 2021, as permitted by the SEC, paper copies of the Fund’s shareholder reports will no longer be sent by mail, unless you specifically request them from the Fund or your financial intermediary. Instead, the reports will be made available on a website, and you will be notified by mail each time a report is posted and provided with a website link to access the report.
If you already elected to receive shareholder reports electronically, you will not be affected by this change and you need not take any action. If you have not signed up for electronic delivery, we would encourage you to join fellow shareholders who have. You may elect to receive shareholder reports and other communications electronically from the Fund by calling (800)632-2301 or by contacting your financial intermediary.
You may elect to continue to receive paper copies of all your future shareholder reports free of charge by contacting your financial intermediary or, if you invest directly with a Fund, calling (800)632-2301 to let the Fund know of your request. Your election to receive reports in paper will apply to all funds held in your account.
Franklin Templeton
Successful investing begins with ambition. And achievement only comes when you reach for it. That’s why we continually strive to deliver better outcomes for investors. No matter what your goals are, our deep, global investment expertise allows us to offer solutions that can help.
During our more than 70 years of experience, we’ve managed through all kinds of markets—up, down and those in between. We’re always preparing for what may come next. It’s because of this, combined with our strength as one of the world’s largest asset managers that we’ve earned the trust of millions of investors around the world.
Dear Shareholder:
During the 12 months ended April 30, 2019, the U.S. economy continued to grow amid positive economic data and corporate earnings, and the unemployment rate declined.
During the period, markets reflected concerns about the U.S. Federal Reserve’s (Fed’s) interest-rate path, U.S. political uncertainties and U.S.-China trade disputes, but these concerns were mitigated by the Fed’s patient monetary policy stance and investor optimism about a trade deal. Within this environment, investment-grade bonds, as measured by the Bloomberg Barclays U.S. Aggregate Bond Index, had a positive total return for the12-month period.
We are committed to our long-term perspective and disciplined investment approach as we conduct a rigorous, fundamental analysis of securities with a regular emphasis on investment risk management.
We believe active, professional investment management serves investors well. We also recognize the important role of financial advisors in today’s markets and encourage investors to continue to seek their advice. Amid changing markets and economic conditions, we are confident investors with a well-diversified portfolio and a patient, long-term outlook should be well positioned for the years ahead.
In addition, Franklin Strategic Income Fund’s annual report includes more detail about prevailing conditions and a discussion about investment decisions during the period. Please remember all securities markets fluctuate, as do mutual fund share prices.
We thank you for investing with Franklin Templeton, welcome your questions and comments, and look forward to serving your future investment needs
Sincerely,

Edward Perks, CFA
President and Chief Executive Officer –
Investment Management
Franklin Strategic Series
This letter reflects our analysis and opinions as of April 30, 2019, unless otherwise indicated. The information is not a complete analysis of every aspect of any market, country, industry, security or fund. Statements of fact are from sources considered reliable.
CFA® is a trademark owned by CFA Institute.
| Not FDIC Insured | May Lose Value | No Bank Guarantee |
franklintempleton.com | Not part of the annual report | 1 | ||
Contents | ||||
Annual Report | ||||
| Franklin Strategic Income Fund | 3 | |||
| Performance Summary | 7 | |||
| Your Fund’s Expenses | 10 | |||
| Consolidated Financial Highlights and Consolidated Statement of Investments | 11 | |||
| Consolidated Financial Statements | 43 | |||
| Notes to Consolidated Financial Statements | 48 | |||
| Report of Independent Registered Public Accounting Firm | 67 | |||
| Board Members and Officers | 68 | |||
| Shareholder Information | 72 | |||
Visitfranklintempleton.comfor fund updates, to access your account, or to find helpful financial planning tools.
2 | Annual Report | franklintempleton.com | ||
Annual Report
Franklin Strategic Income Fund
This annual report for Franklin Strategic Income Fund covers the fiscal year ended April 30, 2019.
Your Fund’s Goal and Main Investments
The Fund seeks a high level of current income, with capital appreciation over the long term as a secondary objective. The Fund uses an active asset allocation process and under normal market conditions invests at least 65% of its assets in U.S. and foreign debt securities, including those in emerging markets.
The Fund may invest in all varieties of fixed, variable and floating rate income securities, including bonds, U.S. and foreign government and agency securities, corporate loans (and loan participations), mortgage-backed securities and other asset-backed securities and convertible securities.
Performance Overview
The Fund’s Class A shares posted a +4.52% cumulative total return for the 12 months under review. In comparison, the Bloomberg Barclays U.S. Aggregate Bond Index, which represents the U.S. investment-grade fixed rate taxable bond market, posted a +5.29% total return.1 The Lipper Multi-Sector Income Funds Classification Average, which consists of funds chosen by Lipper that seek current income by allocating assets among different fixed income securities sectors, with a significant portion rated below investment grade, posted a +3.93% total return.2 You can find more of the Fund’s performance data in the Performance Summary beginning on
page 7.
Performance data represent past performance, which does not guarantee future results. Investment return and principal value will fluctuate, and you may have a gain or loss when you sell your shares. Current performance may differ from figures shown. For most recentmonth-end performance, go tofranklintempleton.comor call(800)342-5236.
Economic and Market Overview
The U.S. economy grew during the12-month period. The economy expanded at a faster rate in 2019’s first quarter after moderating in the previous two quarters. Growth in consumer spending, inventory investment, exports, state and local government spending and business investment was partly offset by declines in housing investment and federal government spending. The manufacturing and services sectors expanded during the period. The unemployment rate decreased from 3.9% in April 2018 to 3.6% atperiod-end.3 The annual inflation rate, as measured by the Consumer Price Index, decreased from 2.5% in April 2018 to 2.0% atperiod-end.3
The U.S. Federal Reserve (Fed) raised its target range for the federal funds rate by 0.25% three times during the period, to 2.25%–2.50%, and continued reducing its balance sheet as part of its plan to normalize monetary policy. At its March 2019 meeting, the Fed held its target range for the federal funds rate unchanged and signaled no rate hike in 2019. The Fed also lowered its forecasts for economic growth in 2019 and 2020. Furthermore, the Fed mentioned it would end its balance sheet normalization by the end of September 2019.
The10-year Treasury yield, which moves inversely to its price, decreased during the period. The yield rose to multi-year highs several times in 2018 amid investor concerns about higher inflation and the Fed’s interest-rate path. Concerns that other central banks might scale back monetary stimulus, several better-than-expected U.S. economic reports and optimism surrounding trade talks between the U.S. and China also pushed the yield higher. However, some factors weighed on the Treasury yield at certain points during the period, including concerns about political turmoil in Italy, political uncertainties in the U.S., tensions between the U.S. and North Korea, U.S. trade disputes with China and other trading partners, slower domestic and global economic growth, and the Fed’s indications of a patient approach to its monetary policy
1. Source: Morningstar.
2. Source: Lipper, a Thomson Reuters Company. For the12-month period ended 4/30/19, this category consisted of 328 funds. Lipper calculations do not include sales charges or expense subsidization by a fund’s manager. Fund performance relative to the average may have differed if these or other factors had been considered.
The indexes are unmanaged and include reinvestment of any income or distributions. They do not reflect any fees, expenses or sales charges. One cannot invest directly in an index, and an index is not representative of the Fund’s portfolio.
3. Source: Bureau of Labor Statistics.
See www.franklintempletondatasources.com for additional data provider information.
The dollar value, number of shares or principal amount, and names of all portfolio holdings are listed in the Fund’s Consolidated Statement of Investments (SOI). The Consolidated SOI begins on page 16.
franklintempleton.com | Annual Report | 3 | ||
FRANKLIN STRATEGIC INCOME FUND
decisions. Overall, the10-year Treasury yield declined from 2.95% at the beginning of the period to 2.51% atperiod-end.
Portfolio Composition*
Based on Consolidated Net Assets
| 4/30/19 | ||||
High-Yield Corporate Bonds | 26.2% | |||
Mortgage-Backed Securities | 20.9% | |||
Floating-Rate Loans | 19.3% | |||
Investment-Grade Corporate Bonds | 11.3% | |||
International Government & Agency Bonds | 9.8% | |||
Collateralized Loan Obligations | 9.4% | |||
Interest-Rate Derivatives | 6.4% | |||
U.S. Treasuries | 3.3% | |||
Commercial Mortgage-Backed Securities | 2.7% | |||
Treasury Inflation-Protected Securities | 2.5% | |||
Municipal Bonds | 2.3% | |||
Asset-Backed Securities | 2.1% | |||
Other | 1.2% | |||
Marketplace Loans | 0.5% | |||
Covered Bonds | 0.1% | |||
Short-Term Investments & Other Net Assets | -3.6% | |||
*Figures reflect certain derivatives held in the portfolio (or their underlying reference assets) and may not total 100% or may be negative due to rounding, use of any derivatives, unsettled trades or other factors. The composition may not match the SOI.
Investment Strategy
We use an active asset allocation strategy to try to achieve the Fund’s investment goals. We employ atop-down analysis of macroeconomic trends combined with abottom-up fundamental analysis of market sectors, industries and issuers to try to take advantage of varying sector reactions to economic events. We regularly enter into various currency-related transactions involving derivative instruments, including currency and cross currency forwards, currency swaps, currency and currency index futures contracts and currency options. We may also enter into interest-rate and credit-related transactions involving derivative instruments, including interest-rate, fixed income total return and credit default swaps and interest rate and/or bond futures contracts.
What is a currency forward contract?
A currency forward contract is an agreement between the Fund and a counterparty to buy or sell a foreign currency in exchange for another currency at a specific exchange rate on a future date. Currency forward contracts are privately traded in the interbank market, not on a centralized exchange.
What is a futures contract?
A futures contract is an agreement between the Fund and a counterparty made through a U.S. or foreign futures exchange to buy or sell an underlying instrument or asset at a specific price on a future date.
What are swap agreements?
Swap agreements, such as interest-rate, currency and credit default swaps, are contracts between the Fund and another party (the swap counterparty). In a basic swap transaction, the Fund agrees with the swap counterparty to exchange the returns (or differentials in rates of return) earned or realized on a particular “notional amount” of underlying instruments. The notional amount is the set amount selected by the parties as the basis on which to calculate the obligations that they have agreed to exchange. The parties typically do not actually exchange the notional amount. Instead, they agree to exchange the returns that would be earned or realized if the notional amount were invested in given instruments or at given interest rates.
What is an option?
An option is a contract to buy or sell a specific financial product known as the option’s underlying instrument at a specific price. The buyer of an option has the right, but not the obligation, to buy or sell the underlying instrument at or until a specified expiration date. Conversely, the seller (“writer”) of an option who opens a transaction is obligated to buy or sell the underlying instrument should the option holder exercise that right.
Manager’s Discussion
For global fixed income markets, the first half of the 12 months under review were generally characterized by low levels of volatility, strong risk appetite and relatively low interest rates. The Fed raised its rates three times during the period in June, September and December of 2018 citing continued strength in the economy and strong labor conditions. Volatility and a generally pessimistic market tone in the last few months of 2018 gave way to improved market conditions in the first quarter of 2019. Global financial markets responded favorably to a dovish tilt in policy outlook by global central banks. Additionally, anticipation of an eventual U.S. trade deal with China, broad equity market recoveries and further restoration of risk appetite among global financial market participants contributed toward positive market sentiments as spreads across fixed income sectors generally trended lower during the first quarter of 2019. Outside the U.S., many major economies kept their interest rates unchanged.
4 | Annual Report | franklintempleton.com | ||
FRANKLIN STRATEGIC INCOME FUND
In this environment, high-yield corporate credit outpaced U.S. Treasuries on a duration-matched basis. Senior secured floating-rate loans,non-agency residential mortgage-backed securities (RMBS), investment-grade corporate credit and commercial mortgage-backed securities (CMBS) also delivered strong performance.
What is duration?
Duration is a measure of a bond’s price sensitivity to interest-rate changes. In general, a portfolio of securities with a lower duration can be expected to be less sensitive to interest-rate changes than a portfolio with a higher duration.
Dividend Distributions*
5/1/18–4/30/19
| Dividend per Share (cents) | ||||||||||||||||||||
| Month | Class A | Class C | Class R | Class R6 | Advisor Class | |||||||||||||||
May | 3.11 | 2.79 | 2.92 | 3.39 | 3.31 | |||||||||||||||
June | 3.46 | 3.12 | 3.25 | 3.79 | 3.67 | |||||||||||||||
July | 3.61 | 3.29 | 3.41 | 3.92 | 3.81 | |||||||||||||||
August | 3.61 | 3.27 | 3.40 | 3.94 | 3.82 | |||||||||||||||
September | 3.61 | 3.31 | 3.43 | 3.90 | 3.79 | |||||||||||||||
October | 3.62 | 3.14 | 3.38 | 3.97 | 3.84 | |||||||||||||||
November | 3.53 | 3.22 | 3.33 | 3.82 | 3.72 | |||||||||||||||
December | 3.53 | 3.23 | 3.34 | 3.82 | 3.72 | |||||||||||||||
January | 3.54 | 3.20 | 3.32 | 3.86 | 3.75 | |||||||||||||||
February | 3.49 | 3.18 | 3.30 | 3.78 | 3.68 | |||||||||||||||
March | 3.50 | 3.20 | 3.32 | 3.79 | 3.67 | |||||||||||||||
April | 3.50 | 3.19 | 3.32 | 3.80 | 3.69 | |||||||||||||||
Total | 42.11 | 38.14 | 39.72 | 45.78 | 44.47 | |||||||||||||||
*The distribution amount is the sum of all net investment income distributions for the period shown. All Fund distributions will vary depending upon current market conditions, and past distributions are not indicative of future trends.
During the period, the Fund’s U.S. duration exposure was a significant boost to performance. Additionally, our exposure to high-yield corporate credit also added to results. Senior secured floating rate loans,tax-exempt municipal bonds and investment-grade corporate credit also benefited returns. In contrast, our exposure to foreign currencies, fixed-rate agency mortgage-backed securities (MBS) and sovereign emerging markets securities detracted from performance.
What is the yield curve?
A yield curve is a line that plots the yield to maturity of bonds having equal credit quality against their maturity dates.
Our largest allocation is in corporate credit inclusive of high-yield and investment-grade corporate credit, senior
secured floating rate bank loans and collateralized loan obligations (CLOs), with most of the exposure in below investment-grade corporate securities. We pared our investment-grade and high-yield corporate credit exposures over the period, while increasing our allocation to CLOs and senior secured floating-rate loans. We increased our RMBS allocation as we prefer to remain allocated to the seasoned credit risk transfer where fundamental and technical forces remain positive.
Our foreign currency exposure was held through a basket of developed-market shorts with major positions in the Australian dollar, Canadian dollar and South Korean won versus a basket of emerging market long positions with major positions in Indonesian rupiah, Brazilian Real and Mexican peso.
Thank you for your continued participation in Franklin Strategic Income Fund. We look forward to serving your future investment needs.
 |  | |
| Sonal Desai, Ph.D. | ||
 |  | |
Roger A. Bayston, CFA | ||
Patricia O’Connor, CFA
Portfolio Management Team | ||
franklintempleton.com | Annual Report | 5 | ||
FRANKLIN STRATEGIC INCOME FUND
The foregoing information reflects our analysis, opinions and portfolio holdings as of April 30, 2019, the end of the reporting period. The way we implement our main investment strategies and the resulting portfolio holdings may change depending on factors such as market and economic conditions. These opinions may not be relied upon as investment advice or an offer for a particular security. The information is not a complete analysis of every aspect of any market, country, industry, security or the Fund. Statements of fact are from sources considered reliable, but the investment manager makes no representation or warranty as to their completeness or accuracy. Although historical performance is no guarantee of future results, these insights may help you understand our investment management philosophy.
6 | Annual Report | franklintempleton.com | ||
FRANKLIN STRATEGIC INCOME FUND
Performance Summary as of April 30, 2019
The performance tables and graphs do not reflect any taxes that a shareholder would pay on Fund dividends, capital gain distributions, if any, or any realized gains on the sale of Fund shares. Total return reflects reinvestment of the Fund’s dividends and capital gain distributions, if any, and any unrealized gains or losses. Your dividend income will vary depending on dividends or interest paid by securities in the Fund’s portfolio, adjusted for operating expenses of each class. Capital gain distributions are net profits realized from the sale of portfolio securities.
Performance as of 4/30/191
Cumulative total return excludes sales charges. Average annual total return includes maximum sales charges. Sales charges will vary depending on the size of the investment and the class of share purchased. The maximum is 3.75% and the minimum is 0%.Class A:3.75% maximum initial sales charge;Advisor Class:no sales charges. For other share classes, visitfranklintempleton.com.
| Share Class | Cumulative Total Return2 | Average Annual Total Return3 | ||
A4 | ||||
1-Year | +4.52% | +0.65% | ||
5-Year | +10.80% | +1.30% | ||
10-Year | +74.56% | +5.33% | ||
Advisor | ||||
1-Year | +4.88% | +4.88% | ||
5-Year | +12.18% | +2.33% | ||
10-Year | +78.89% | +5.99% | ||
| Distribution | 30-Day Standardized Yield6 | |||||||||||
| Share Class | Rate5 | (with fee waiver) | (without fee waiver) | |||||||||
A | 4.22 | % | 4.33 | % | 4.31 | % | ||||||
Advisor | 4.62 | % | 4.76 | % | 4.72 | % | ||||||
Performance data represent past performance, which does not guarantee future results. Investment return and principal value will fluctuate, and you may have a gain or loss when you sell your shares. Current performance may differ from figures shown. For most recentmonth-end performance, go tofranklintempleton.comor call(800)342-5236.
See page 9 for Performance Summary footnotes. |
franklintempleton.com | Annual Report | 7 | ||
FRANKLIN STRATEGIC INCOME FUND
PERFORMANCE SUMMARY
Total Return Index Comparison for a Hypothetical $10,000 Investment1
Total return represents the change in value of an investment over the periods shown. It includes any applicable maximum sales charge, Fund expenses, account fees and reinvested distributions. The unmanaged indexes include reinvestment of any income or distributions. They differ from the Fund in composition and do not pay management fees or expenses. One cannot invest directly in an index.
Class A(5/1/09–4/30/19)
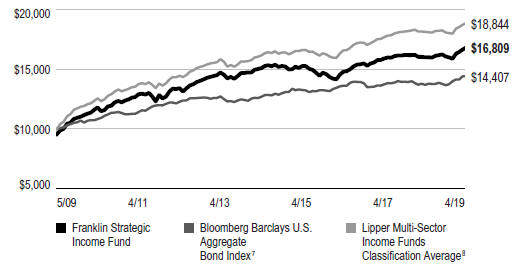
Advisor Class(5/1/09–4/30/19)

See page 9 for Performance Summary footnotes.
8 | Annual Report | franklintempleton.com | ||
FRANKLIN STRATEGIC INCOME FUND
PERFORMANCE SUMMARY
Distributions(5/1/18–4/30/19)
| Share Class | Net Investment Income | |||
A | $0.4211 | |||
C | $0.3814 | |||
R | $0.3972 | |||
R6 | $0.4578 | |||
Advisor | $0.4447 | |||
Total Annual Operating Expenses9
| With Fee | Without Fee | |||||||
| Share Class | Waiver | Waiver | ||||||
A | 0.88 | % | 0.93 | % | ||||
Advisor | 0.63 | % | 0.68 | % | ||||
Each class of shares is available to certain eligible investors and has different annual fees and expenses, as described in the prospectus.
All investments involve risks, including possible loss of principal. Bond prices generally move in the opposite direction of interest rates. Thus, as prices of bonds in the Fund adjust to a rise in interest rates, the Fund’s share price may decline. Changes in the financial strength of a bond issuer or in a bond’s credit rating may affect its value. High yields reflect the higher credit risks associated with certain lower rated securities held in the portfolio. Floating-rate loans and high-yield corporate bonds are rated below investment grade and are subject to greater risk of default, which could result in loss of principal—a risk that may be heightened in a slowing economy. The risks of foreign securities include currency fluctuations and political uncertainty. Investments in developing markets involve heightened risks related to the same factors, in addition to those associated with their relatively small size and lesser liquidity. Investing in derivative securities and the use of foreign currency techniques involve special risks as such may not achieve the anticipated benefits and/or may result in losses to the Fund. The Fund is actively managed but there is no guarantee that the manager’s investment decisions will produce the desired results. The Fund’s prospectus also includes a description of the main investment risks.
1. The Fund has a fee waiver associated with any investment it makes in a Franklin Templeton money fund and/or other Franklin Templeton fund, contractually guaranteed through 8/31/19. Fund investment results reflect the fee waiver; without this waiver, the results would have been lower.
2. Cumulative total return represents the change in value of an investment over the periods indicated.
3. Average annual total return represents the average annual change in value of an investment over the periods indicated. Return for less than one year, if any, has not been annualized.
4. Prior to 3/1/19, these shares were offered at a higher initial sales charge of 4.25%, thus actual returns would have differed. Total returns with sales charges have been restated to reflect the current maximum initial sales charge of 3.75%.
5. Distribution rate is based on the sum of the respective class’s dividend distributions over the past 12 months and the maximum offering price (NAV for Advisor Class) per share on 4/30/19.
6. The Fund’s30-day standardized yield is calculated over a trailing30-day period using the yield to maturity on bonds and/or the dividends accrued on stocks. It may not equal the Fund’s actual income distribution rate, which reflects the Fund’s past dividends paid to shareholders.
7. Source: Morningstar. The Bloomberg Barclays U.S. Aggregate Bond Index is a market capitalization-weighted index representing the U.S. investment-grade, fixed-rate, taxable bond market with index components for government and corporate, mortgage pass-through and asset-backed securities. All issues included areSEC-registered, taxable, dollar denominated and nonconvertible, must have at least one year to final maturity, and must be rated investment grade(Baa3/BBB-/BBB- or above) using the middle rating of Moody’s, Standard & Poor’s and Fitch, respectively.
8. Source: Lipper, a Thomson Reuters Company. The Lipper Multi-Sector Income Funds Classification Average is calculated by averaging the total returns of all funds within the Lipper Multi-Sector Income Funds classification in the LipperOpen-End underlying funds universe. Lipper Multi-Sector Income Funds are defined as funds that seek current income by allocating assets among different fixed income securities sectors (not primarily in one sector except for defensive purposes), including U.S. and foreign governments, with a significant portion rated below investment grade. For the12-month period ended 4/30/19, there were 328 funds in this category. Lipper calculations do not include sales charges, but include reinvestment of any income or distributions. Fund performance relative to the average may have differed if these and other factors had been considered.
9. Figures are as stated in the Fund’s current prospectus and may differ from the expense ratios disclosed in the Your Fund’s Expenses and Consolidated Financial Highlights sections in this report. In periods of market volatility, assets may decline significantly, causing total annual Fund operating expenses to become higher than the figures shown. See www.franklintempletondatasources.com for additional data provider information.
franklintempleton.com | Annual Report | 9 | ||
FRANKLIN STRATEGIC INCOME FUND
Your Fund’s Expenses
As a Fund shareholder, you can incur two types of costs: (1) transaction costs, including sales charges (loads) on Fund purchases and redemptions; and (2) ongoing Fund costs, including management fees, distribution and service(12b-1) fees, and other Fund expenses. All mutual funds have ongoing costs, sometimes referred to as operating expenses. The table below shows ongoing costs of investing in the Fund and can help you understand these costs and compare them with those of other mutual funds. The table assumes a $1,000 investment held for the six months indicated.
Actual Fund Expenses
The table below provides information about actual account values and actual expenses in the columns under the heading “Actual.” In these columns the Fund’s actual return, which includes the effect of Fund expenses, is used to calculate the “Ending Account Value” for each class of shares. You can estimate the expenses you paid during the period by following these steps (of course, your account value and expenses will differ from those in this illustration): Divide your account value by $1,000 (if your account had an $8,600 value, then $8,600÷ $1,000 = 8.6). Then multiply the result by the number in the row for your class of shares under the headings “Actual” and “Expenses Paid During Period” (if Actual Expenses Paid During Period were $7.50, then 8.6 x $7.50 =$64.50). In this illustration, the actual expenses paid this period are $64.50.
Hypothetical Example for Comparison with Other Funds
Under the heading “Hypothetical” in the table, information is provided about hypothetical account values and hypothetical expenses based on the Fund’s actual expense ratio and an assumed rate of return of 5% per year before expenses, which is not the Fund’s actual return. This information may not be used to estimate the actual ending account balance or expenses you paid for the period, but it can help you compare ongoing costs of investing in the Fund with those of other funds. To do so, compare this 5% hypothetical example for the class of shares you hold with the 5% hypothetical examples that appear in the shareholder reports of other funds.
Please note that expenses shown in the table are meant to highlight ongoing costs and do not reflect any transactional costs. Therefore, information under the heading “Hypothetical” is useful in comparing ongoing costs only, and will not help you compare total costs of owning different funds. In addition, if transactional costs were included, your total costs would have been higher.
| Actual | Hypothetical | |||||||||||||||||
| (actual return after expenses) | (5% annual return before expenses) | |||||||||||||||||
Share Class | Beginning Account | Ending Account | Expenses Paid During Period 11/1/18–4/30/191,2 | Ending Account | Expenses Paid During Period 11/1/18–4/30/191,2 |
| Net Annualized Ratio2 | |||||||||||
A | $1,000 | $1,040.90 | $4.25 | $1,020.63 | $4.21 | 0.84% | ||||||||||||
C | $1,000 | $1,038.90 | $6.27 | $1,018.65 | $6.21 | 1.24% | ||||||||||||
R | $1,000 | $1,039.80 | $5.51 | $1,019.39 | $5.46 | 1.09% | ||||||||||||
R6 | $1,000 | $1,043.90 | $2.28 | $1,022.56 | $2.26 | 0.45% | ||||||||||||
Advisor | $1,000 | $1,042.10 | $2.99 | $1,021.87 | $2.96 | 0.59% | ||||||||||||
1. Expenses are equal to the annualized expense ratio for thesix-month period as indicated above—in the far right column—multiplied by the simple average account value over the period indicated, and then multiplied by 181/365 to reflect theone-half year period.
2. Reflects expenses after fee waivers and expense reimbursements. Does not include acquired fund fees and expenses.
10 | Annual Report | franklintempleton.com | ||
FRANKLIN STRATEGIC SERIES
Consolidated Financial Highlights
Franklin Strategic Income Fund
Year Ended April 30, | ||||||||||||||||||||
| 2019 | 2018 | 2017 | 2016 | 2015 | ||||||||||||||||
Class A | ||||||||||||||||||||
Per share operating performance (for a share outstanding throughout the year) | ||||||||||||||||||||
Net asset value, beginning of year | $ 9.61 | $ 9.84 | $ 9.32 | $10.04 | $10.57 | |||||||||||||||
Income from investment operationsa: | ||||||||||||||||||||
Net investment incomeb | 0.42 | 0.39 | 0.39 | 0.42 | 0.42 | |||||||||||||||
Net realized and unrealized gains (losses) | — | c | (0.32 | ) | 0.30 | (0.74 | ) | (0.30 | ) | |||||||||||
Total from investment operations | 0.42 | 0.07 | 0.69 | (0.32 | ) | 0.12 | ||||||||||||||
Less distributions from: | ||||||||||||||||||||
Net investment income and net foreign currency gains | (0.42 | ) | (0.30 | ) | (0.17 | ) | (0.40 | ) | (0.55 | ) | ||||||||||
Net realized gains | — | — | — | — | (0.10 | ) | ||||||||||||||
Total distributions | (0.42 | ) | (0.30 | ) | (0.17 | ) | (0.40 | ) | (0.65 | ) | ||||||||||
Net asset value, end of year | $ 9.61 | $ 9.61 | $ 9.84 | $ 9.32 | $10.04 | |||||||||||||||
Total returnd | 4.52% | 0.64% | 7.50% | (3.14 | )% | 1.16% | ||||||||||||||
Ratios to average net assets | ||||||||||||||||||||
Expenses before waiver and payments by affiliates | 0.89% | 0.90% | 0.88% | 0.88% | 0.86% | |||||||||||||||
Expenses net of waiver and payments by affiliatese | 0.84% | 0.85% | 0.82% | 0.84% | 0.85% | |||||||||||||||
Net investment income | 4.39% | 3.93% | 4.08% | 4.44% | 4.03% | |||||||||||||||
Supplemental data | ||||||||||||||||||||
Net assets, end of year (000’s) | $3,131,799 | $3,291,002 | $3,833,786 | $4,500,752 | $5,242,844 | |||||||||||||||
Portfolio turnover rate | 116.21% | f | 115.94% | 140.83% | 88.04% | 72.51% | ||||||||||||||
Portfolio turnover rate excluding mortgage dollar rollsg | 39.01% | f | 47.40% | 87.33% | 48.33% | 49.36% | ||||||||||||||
aThe amount shown for a share outstanding throughout the period may not correlate with the Consolidated Statement of Operations for the period due to the timing of sales and repurchases of the Fund’s shares in relation to income earned and/or fluctuating fair value of the investments of the Fund.
bBased on average daily shares outstanding.
cAmount rounds to less than $0.01 per share.
dTotal return does not reflect sales commissions or contingent deferred sales charges, if applicable.
eBenefit of expense reduction rounds to less than 0.01%.
fExcludes the value of portfolio activity as a result ofin-kind transactions. See Note 6.
gSee Note 1(i) regarding mortgage dollar rolls.
franklintempleton.com | The accompanying notes are an integral part of these consolidated financial statements. | Annual Report | 11 | ||
FRANKLIN STRATEGIC SERIES
CONSOLIDATED FINANCIAL HIGHLIGHTS
Franklin Strategic Income Fund(continued)
Year Ended April 30, | ||||||||||||||||||||
| 2019 | 2018 | 2017 | 2016 | 2015 | ||||||||||||||||
Class C | ||||||||||||||||||||
Per share operating performance (for a share outstanding throughout the year) | ||||||||||||||||||||
Net asset value, beginning of year | $ 9.60 | $ 9.84 | $ 9.31 | $10.04 | $10.57 | |||||||||||||||
Income from investment operationsa: | ||||||||||||||||||||
Net investment incomeb | 0.38 | 0.35 | 0.35 | 0.38 | 0.38 | |||||||||||||||
Net realized and unrealized gains (losses) | 0.01 | (0.33 | ) | 0.31 | (0.75 | ) | (0.30 | ) | ||||||||||||
Total from investment operations | 0.39 | 0.02 | 0.66 | (0.37 | ) | 0.08 | ||||||||||||||
Less distributions from: | ||||||||||||||||||||
Net investment income and net foreign currency gains | (0.38 | ) | (0.26 | ) | (0.13 | ) | (0.36 | ) | (0.51 | ) | ||||||||||
Net realized gains | — | — | — | — | (0.10 | ) | ||||||||||||||
Total distributions | (0.38 | ) | (0.26 | ) | (0.13 | ) | (0.36 | ) | (0.61 | ) | ||||||||||
Net asset value, end of year | $ 9.61 | $ 9.60 | $ 9.84 | $ 9.31 | $10.04 | |||||||||||||||
Total returnc | 4.19% | 0.14% | 7.19% | (3.64 | )% | 0.76% | ||||||||||||||
Ratios to average net assets | ||||||||||||||||||||
Expenses before waiver and payments by affiliates | 1.29% | 1.30% | 1.28% | 1.28% | 1.26% | |||||||||||||||
Expenses net of waiver and payments by affiliatesd | 1.24% | 1.25% | 1.22% | 1.24% | 1.25% | |||||||||||||||
Net investment income | 3.99% | 3.53% | 3.68% | 4.04% | 3.63% | |||||||||||||||
Supplemental data | ||||||||||||||||||||
Net assets, end of year (000’s) | $716,327 | $1,078,890 | $1,385,981 | $1,645,852 | $2,070,739 | |||||||||||||||
Portfolio turnover rate | 116.21% | e | 115.94% | 140.83% | 88.04% | 72.51% | ||||||||||||||
Portfolio turnover rate excluding mortgage dollar rollsf | 39.01% | e | 47.40% | 87.33% | 48.33% | 49.36% | ||||||||||||||
aThe amount shown for a share outstanding throughout the period may not correlate with the Consolidated Statement of Operations for the period due to the timing of sales and repurchases of the Fund’s shares in relation to income earned and/or fluctuating fair value of the investments of the Fund.
bBased on average daily shares outstanding.
cTotal return does not reflect sales commissions or contingent deferred sales charges, if applicable.
dBenefit of expense reduction rounds to less than 0.01%.
eExcludes the value of portfolio activity as a result ofin-kind transactions. See Note 6.
fSee Note 1(i) regarding mortgage dollar rolls.
12 | Annual Report | The accompanying notes are an integral part of these consolidated financial statements. | franklintempleton.com | ||
FRANKLIN STRATEGIC SERIES
CONSOLIDATED FINANCIAL HIGHLIGHTS
Franklin Strategic Income Fund(continued)
Year Ended April 30, | ||||||||||||||||||||
| 2019 | 2018 | 2017 | 2016 | 2015 | ||||||||||||||||
Class R | ||||||||||||||||||||
Per share operating performance (for a share outstanding throughout the year) | ||||||||||||||||||||
Net asset value, beginning of year | $ 9.57 | $ 9.81 | $ 9.28 | $10.01 | $10.54 | |||||||||||||||
Income from investment operationsa: | ||||||||||||||||||||
Net investment incomeb | 0.39 | 0.36 | 0.37 | 0.39 | 0.39 | |||||||||||||||
Net realized and unrealized gains (losses) | 0.01 | (0.33 | ) | 0.31 | (0.74 | ) | (0.29 | ) | ||||||||||||
Total from investment operations | 0.40 | 0.03 | 0.68 | (0.35 | ) | 0.10 | ||||||||||||||
Less distributions from: | ||||||||||||||||||||
Net investment income and net foreign currency gains | (0.40 | ) | (0.27 | ) | (0.15 | ) | (0.38 | ) | (0.53 | ) | ||||||||||
Net realized gains | — | — | — | — | (0.10 | ) | ||||||||||||||
Total distributions | (0.40 | ) | (0.27 | ) | (0.15 | ) | (0.38 | ) | (0.63 | ) | ||||||||||
Net asset value, end of year | $ 9.57 | $ 9.57 | $ 9.81 | $ 9.28 | $10.01 | |||||||||||||||
Total return | 4.28% | 0.29% | 7.38% | (3.50 | )% | 0.91% | ||||||||||||||
Ratios to average net assets | ||||||||||||||||||||
Expenses before waiver and payments by affiliates | 1.14% | 1.15% | 1.13% | 1.13% | 1.11% | |||||||||||||||
Expenses net of waiver and payments by affiliatesc | 1.09% | 1.10% | 1.07% | 1.09% | 1.10% | |||||||||||||||
Net investment income | 4.14% | 3.68% | 3.83% | 4.19% | 3.78% | |||||||||||||||
Supplemental data | ||||||||||||||||||||
Net assets, end of year (000’s) | $85,458 | $105,692 | $146,552 | $181,671 | $223,758 | |||||||||||||||
Portfolio turnover rate | 116.21% | d | 115.94% | 140.83% | 88.04% | 72.51% | ||||||||||||||
Portfolio turnover rate excluding mortgage dollar rollse | 39.01% | d | 47.40% | 87.33% | 48.33% | 49.36% | ||||||||||||||
aThe amount shown for a share outstanding throughout the period may not correlate with the Consolidated Statement of Operations for the period due to the timing of sales and repurchases of the Fund’s shares in relation to income earned and/or fluctuating fair value of the investments of the Fund.
bBased on average daily shares outstanding.
cBenefit of expense reduction rounds to less than 0.01%.
dExcludes the value of portfolio activity as a result ofin-kind transactions. See Note 6.
eSee Note 1(i) regarding mortgage dollar rolls.
franklintempleton.com | The accompanying notes are an integral part of these consolidated financial statements. | Annual Report | 13 | ||
FRANKLIN STRATEGIC SERIES
CONSOLIDATED FINANCIAL HIGHLIGHTS
Franklin Strategic Income Fund(continued)
Year Ended April 30, | ||||||||||||||||||||
| 2019 | 2018 | 2017 | 2016 | 2015 | ||||||||||||||||
Class R6 | ||||||||||||||||||||
Per share operating performance (for a share outstanding throughout the year) | ||||||||||||||||||||
Net asset value, beginning of year | $ 9.62 | $ 9.86 | $ 9.33 | $10.05 | $10.58 | |||||||||||||||
Income from investment operationsa: | ||||||||||||||||||||
Net investment incomeb | 0.45 | 0.43 | 0.43 | 0.46 | 0.46 | |||||||||||||||
Net realized and unrealized gains (losses) | 0.02 | (0.34 | ) | 0.31 | (0.74 | ) | (0.30 | ) | ||||||||||||
Total from investment operations | 0.47 | 0.09 | 0.74 | (0.28 | ) | 0.16 | ||||||||||||||
Less distributions from: | ||||||||||||||||||||
Net investment income and net foreign currency gains | (0.46 | ) | (0.33 | ) | (0.21 | ) | (0.44 | ) | (0.59 | ) | ||||||||||
Net realized gains | — | — | — | — | (0.10 | ) | ||||||||||||||
Total distributions | (0.46 | ) | (0.33 | ) | (0.21 | ) | (0.44 | ) | (0.69 | ) | ||||||||||
Net asset value, end of year | $ 9.63 | $ 9.62 | $ 9.86 | $ 9.33 | $10.05 | |||||||||||||||
Total return | 5.03% | 0.95% | 8.03% | (2.76 | )% | 1.54% | ||||||||||||||
Ratios to average net assets | ||||||||||||||||||||
Expenses before waiver and payments by affiliates | 0.51% | 0.50% | 0.48% | 0.49% | 0.48% | |||||||||||||||
Expenses net of waiver and payments by affiliatesc | 0.45% | 0.45% | 0.42% | 0.45% | 0.47% | |||||||||||||||
Net investment income | 4.78% | 4.33% | 4.48% | 4.83% | 4.41% | |||||||||||||||
Supplemental data | ||||||||||||||||||||
Net assets, end of year (000’s) | $307,287 | $433,068 | $369,106 | $286,503 | $253,929 | |||||||||||||||
Portfolio turnover rate | 116.21% | d | 115.94% | 140.83% | 88.04% | 72.51% | ||||||||||||||
Portfolio turnover rate excluding mortgage dollar rollse | 39.01% | d | 47.40% | 87.33% | 48.33% | 49.36% | ||||||||||||||
aThe amount shown for a share outstanding throughout the period may not correlate with the Consolidated Statement of Operations for the period due to the timing of sales and repurchases of the Fund’s shares in relation to income earned and/or fluctuating fair value of the investments of the Fund.
bBased on average daily shares outstanding.
cBenefit of expense reduction rounds to less than 0.01%.
dExcludes the value of portfolio activity as a result ofin-kind transactions. See Note 6.
eSee Note 1(i) regarding mortgage dollar rolls.
14 | Annual Report | The accompanying notes are an integral part of these consolidated financial statements. | franklintempleton.com | ||
FRANKLIN STRATEGIC SERIES
CONSOLIDATED FINANCIAL HIGHLIGHTS
Franklin Strategic Income Fund(continued)
| Year Ended April 30, | ||||||||||||||||||||
| 2019 | 2018 | 2017 | 2016 | 2015 | ||||||||||||||||
Advisor Class | ||||||||||||||||||||
Per share operating performance (for a share outstanding throughout the year) | ||||||||||||||||||||
Net asset value, beginning of year | $9.62 | $ 9.85 | $ 9.33 | $10.05 | $10.58 | |||||||||||||||
Income from investment operationsa: | ||||||||||||||||||||
Net investment incomeb | 0.44 | 0.41 | 0.42 | 0.44 | 0.44 | |||||||||||||||
Net realized and unrealized gains (losses) | — | c | (0.32) | 0.30 | (0.74) | (0.29 | ) | |||||||||||||
Total from investment operations | 0.44 | 0.09 | 0.72 | (0.30) | 0.15 | |||||||||||||||
Less distributions from: | ||||||||||||||||||||
Net investment income and net foreign currency gains | (0.44) | (0.32) | (0.20) | (0.42) | (0.58) | |||||||||||||||
Net realized gains | — | — | — | — | (0.10) | |||||||||||||||
Total distributions | (0.44) | (0.32) | (0.20) | (0.42) | (0.68) | |||||||||||||||
Net asset value, end of year | $ 9.62 | $ 9.62 | $ 9.85 | $ 9.33 | $10.05 | |||||||||||||||
Total return | 4.88% | 0.79% | 7.76% | (2.89)% | 1.41% | |||||||||||||||
Ratios to average net assets | ||||||||||||||||||||
Expenses before waiver and payments by affiliates | 0.64% | 0.65% | 0.63% | 0.63% | 0.61% | |||||||||||||||
Expenses net of waiver and payments by affiliatesd | 0.59% | 0.60% | 0.57% | 0.59% | 0.60% | |||||||||||||||
Net investment income | 4.64% | 4.18% | 4.33% | 4.69% | 4.28% | |||||||||||||||
Supplemental data | ||||||||||||||||||||
Net assets, end of year (000’s) | $608,317 | $933,747 | $1,070,103 | $904,899 | $1,130,796 | |||||||||||||||
Portfolio turnover rate | 116.21% | e | 115.94% | 140.83% | 88.04% | 72.51% | ||||||||||||||
Portfolio turnover rate excluding mortgage dollar rollsf | 39.01%e | 47.40% | 87.33% | 48.33% | 49.36% | |||||||||||||||
aThe amount shown for a share outstanding throughout the period may not correlate with the Consolidated Statement of Operations for the period due to the timing of sales and repurchases of the Fund’s shares in relation to income earned and/or fluctuating fair value of the investments of the Fund.
bBased on average daily shares outstanding.
cAmount rounds to less than $0.01 per share.
dBenefit of expense reduction rounds to less than 0.01%.
eExcludes the value of portfolio activity as a result ofin-kind transactions. See Note 6.
fSee Note 1(i) regarding mortgage dollar rolls.
franklintempleton.com | The accompanying notes are an integral part of these consolidated financial statements. | Annual Report | 15 | ||
FRANKLIN STRATEGIC SERIES
Consolidated Statement of Investments, April 30, 2019
Franklin Strategic Income Fund
| Country | Shares/ Warrants | Value | ||||||||||
Common Stocks and Other Equity Interests 0.5% | ||||||||||||
Commercial & Professional Services 0.1% | ||||||||||||
a,aaRemington Outdoor Co. Inc. | United States | 1,322,439 | $ 2,909,366 | |||||||||
| ||||||||||||
Consumer Services 0.0%† | ||||||||||||
a,ab,bTurtle Bay Resort | United States | 5,579,940 | 122,759 | |||||||||
| ||||||||||||
Energy 0.3% | ||||||||||||
aBirch Permian Holdings Inc. | United States | 831,762 | 9,565,263 | |||||||||
aChaparral Energy Inc., A | United States | 94,305 | 656,363 | |||||||||
a,cChaparral Energy Inc., A, 144A | United States | 3,418 | 23,789 | |||||||||
aHalcon Resources Corp. | United States | 955,276 | 1,241,859 | |||||||||
aHalcon Resources Corp., wts., 9/09/20 | United States | 75,770 | 591 | |||||||||
aMidstates Petroleum Co. Inc. | United States | 5,125 | 65,446 | |||||||||
a,bMidstates Petroleum Co. Inc., wts., 4/21/20 | United States | 49,552 | 2 | |||||||||
aRiviera Resources Inc. | United States | 88,309 | 1,324,635 | |||||||||
aRoan Resources Inc. | United States | 88,309 | 500,712 | |||||||||
| ||||||||||||
| 13,378,660 | ||||||||||||
| ||||||||||||
Materials 0.1% | ||||||||||||
a,b,dAppvion Operations Inc. | United States | 331,325 | 4,615,489 | |||||||||
aVerso Corp., A | United States | 38,905 | 868,360 | |||||||||
aVerso Corp., wts., 7/25/23 | United States | 4,095 | 17,813 | |||||||||
| ||||||||||||
| 5,501,662 | ||||||||||||
| ||||||||||||
Retailing 0.0%† | ||||||||||||
a,b,dK2016470219 South Africa Ltd., A | South Africa | 125,940,079 | 88,110 | |||||||||
a,b,dK2016470219 South Africa Ltd., B | South Africa | 12,532,821 | 8,768 | |||||||||
| ||||||||||||
| 96,878 | ||||||||||||
| ||||||||||||
Software & Services 0.0%† | ||||||||||||
a,bWorkCapital BSD SARL, wts., 2/13/26 | Brazil | 6,000,000 | 750,000 | |||||||||
| ||||||||||||
Total Common Stocks and Other Equity Interests (Cost $64,996,831) | 22,759,325 | |||||||||||
| ||||||||||||
Management Investment Companies (Cost $218,117,419) 4.0% | ||||||||||||
Diversified Financials 4.0% | ||||||||||||
eFranklin Middle Tier Floating Rate Fund | United States | 21,833,687 | 194,101,482 | |||||||||
| ||||||||||||
| Principal Amount* | ||||||||||||
Corporate Bonds 36.2% | ||||||||||||
Automobiles & Components 0.2% | ||||||||||||
Fiat Chrysler Automobiles NV, senior note, 5.25%, 4/15/23 | United Kingdom | 10,000,000 | 10,449,650 | |||||||||
| ||||||||||||
Banks 2.0% | ||||||||||||
cAkbank T.A.S., senior note, 144A, 5.125%, 3/31/25 | Turkey | 6,300,000 | 5,450,098 | |||||||||
Bank of America Corp., | ||||||||||||
senior bond, 3.248%, 10/21/27 | United States | 5,000,000 | 4,908,581 | |||||||||
senior note, 3.50%, 4/19/26 | United States | 29,800,000 | 30,098,426 | |||||||||
Citigroup Inc., | ||||||||||||
senior note, 3.20%, 10/21/26 | United States | 20,000,000 | 19,641,924 | |||||||||
sub. bond, 5.50%, 9/13/25 | United States | 10,000,000 | 11,048,024 | |||||||||
sub. note, 4.05%, 7/30/22 | United States | 5,000,000 | 5,164,961 | |||||||||
16 | Annual Report | franklintempleton.com | ||
FRANKLIN STRATEGIC SERIES
CONSOLIDATED STATEMENT OF INVESTMENTS
Franklin Strategic Income Fund(continued)
| Country | Principal Amount* | Value | ||||||||||
Corporate Bonds(continued) | ||||||||||||
Banks(continued) | ||||||||||||
cIntesa Sanpaolo SpA, senior note, 144A, 6.50%, 2/24/21 | Italy | 1,400,000 | $ 1,467,130 | |||||||||
JPMorgan Chase & Co., | ||||||||||||
senior bond, 3.30%, 4/01/26 | United States | 3,200,000 | 3,202,411 | |||||||||
sub. note, 3.875%, 9/10/24 | United States | 10,000,000 | 10,307,768 | |||||||||
fTurkiye Vakiflar Bankasi TAO, secured note, Reg S, 2.375%, 11/04/22 | Turkey | 3,900,000 | EUR | 4,247,022 | ||||||||
| ||||||||||||
95,536,345 | ||||||||||||
Capital Goods 1.1% | ||||||||||||
cBeacon Roofing Supply Inc., senior note, 144A, 4.875%, 11/01/25 | United States | 15,000,000 | 14,475,000 | |||||||||
CNH Industrial NV, senior bond, 3.85%, 11/15/27 | United Kingdom | 6,600,000 | 6,331,842 | |||||||||
Legrand France SA, senior bond, 8.50%, 2/15/25 | France | 200,000 | 247,903 | |||||||||
gOnsite Rental Group Operations Pty. Ltd., secured note, PIK, 6.10%, 10/26/23 | Australia | 4,655,177 | 3,607,762 | |||||||||
cTerex Corp., senior note, 144A, 5.625%, 2/01/25 | United States | 14,600,000 | 14,800,750 | |||||||||
cVertiv Group Corp., senior note, 144A, 9.25%, 10/15/24 | United States | 14,000,000 | 13,755,000 | |||||||||
| ||||||||||||
| 53,218,257 | ||||||||||||
| ||||||||||||
Commercial & Professional Services 0.7% | ||||||||||||
United Rentals North America Inc., senior bond, 5.875%, 9/15/26 | United States | 18,000,000 | 18,855,000 | |||||||||
cWest Corp., senior note, 144A, 8.50%, 10/15/25 | United States | 19,300,000 | 17,104,625 | |||||||||
| ||||||||||||
| 35,959,625 | ||||||||||||
| ||||||||||||
Consumer Durables & Apparel 1.0% | ||||||||||||
cHanesbrands Inc., senior bond, 144A, 4.875%, 5/15/26 | United States | 19,000,000 | 19,118,750 | |||||||||
KB Home, | ||||||||||||
senior bond, 7.50%, 9/15/22 | United States | 5,000,000 | 5,512,500 | |||||||||
senior note, 7.00%, 12/15/21 | United States | 10,000,000 | 10,737,500 | |||||||||
PulteGroup Inc., senior bond, 5.00%, 1/15/27 | United States | 12,000,000 | 12,210,000 | |||||||||
| ||||||||||||
| 47,578,750 | ||||||||||||
| ||||||||||||
Consumer Services 1.6% | ||||||||||||
c1011778 BC ULC/New Red Finance Inc., | ||||||||||||
secured note, second lien, 144A, 5.00%, 10/15/25 | Canada | 11,500,000 | 11,428,125 | |||||||||
senior secured note, first lien, 144A, 4.25%, 5/15/24 | Canada | 4,000,000 | 3,952,180 | |||||||||
cGolden Nugget Inc., senior note, 144A, 6.75%, 10/15/24 | United States | 13,200,000 | 13,530,000 | |||||||||
cInternational Game Technology PLC, senior secured bond, 144A, 6.50%, 2/15/25 | United States | 11,200,000 | 11,942,000 | |||||||||
cKFC Holding Co./Pizza Hut Holdings LLC/Taco Bell of America LLC, | ||||||||||||
senior note, 144A, 5.00%, 6/01/24 | United States | 7,000,000 | 7,175,000 | |||||||||
senior note, 144A, 5.25%, 6/01/26 | United States | 9,100,000 | 9,407,125 | |||||||||
cStars Group Holdings BV/Stars Group U.S.Co-Borrower LLC, senior note, 144A, 7.00%, 7/15/26 | Canada | 6,600,000 | 6,938,250 | |||||||||
cWynn Las Vegas LLC/Wynn Las Vegas Capital Corp., senior bond, 144A, 5.50%, 3/01/25 | United States | 13,700,000 | 13,867,003 | |||||||||
| ||||||||||||
| 78,239,683 | ||||||||||||
| ||||||||||||
franklintempleton.com | Annual Report | 17 | ||
FRANKLIN STRATEGIC SERIES
CONSOLIDATED STATEMENT OF INVESTMENTS
Franklin Strategic Income Fund(continued)
| Country | Principal Amount* | Value | ||||||||||
Corporate Bonds(continued) | ||||||||||||
Diversified Financials 2.1% | ||||||||||||
Capital One Financial Corp., senior note, 3.20%, 2/05/25 | United States | 11,900,000 | $ 11,779,744 | |||||||||
The Goldman Sachs Group Inc., | ||||||||||||
senior note, 3.50%, 1/23/25 | United States | 23,000,000 | 23,125,714 | |||||||||
senior note, 3.75%, 2/25/26 | United States | 15,000,000 | 15,125,686 | |||||||||
Morgan Stanley, | ||||||||||||
senior bond, 3.591% to 7/22/27, FRN thereafter, 7/22/28 | United States | 10,000,000 | 10,003,784 | |||||||||
senior note, 3.875%, 1/27/26 | United States | 32,300,000 | 33,121,711 | |||||||||
Navient Corp., senior note, 6.125%, 3/25/24 | United States | 8,000,000 | 8,240,000 | |||||||||
| ||||||||||||
| 101,396,639 | ||||||||||||
| ||||||||||||
Energy 4.4% | ||||||||||||
cCalifornia Resources Corp., secured note, second lien, 144A, 8.00%, 12/15/22 | United States | 7,852,000 | 6,036,225 | |||||||||
Cheniere Corpus Christi Holdings LLC, | ||||||||||||
senior secured note, first lien, 7.00%, 6/30/24 | United States | 8,800,000 | 9,889,000 | |||||||||
senior secured note, first lien, 5.875%, 3/31/25 | United States | 8,200,000 | 8,856,000 | |||||||||
Cheniere Energy Partners LP, senior secured note, first lien, 5.25%, 10/01/25 | United States | 11,900,000 | 12,182,625 | |||||||||
CONSOL Energy Inc., senior note, 5.875%, 4/15/22 | United States | 11,076,000 | 11,089,845 | |||||||||
Energy Transfer Operating LP, | ||||||||||||
senior bond, 5.20%, 2/01/22 | United States | 8,000,000 | 8,418,527 | |||||||||
senior bond, 4.05%, 3/15/25 | United States | 1,300,000 | 1,321,475 | |||||||||
senior note, 7.50%, 10/15/20 | United States | 11,000,000 | 11,704,316 | |||||||||
Energy Transfer Partners LP/Regency Energy Finance Corp., senior note, 5.00%, 10/01/22 | United States | 10,000,000 | 10,531,277 | |||||||||
c,gEnQuest PLC, senior note, 144A, PIK, 7.00%, 4/15/22 | United Kingdom | 12,855,122 | 10,744,697 | |||||||||
Exxon Mobil Corp., senior note, 2.222%, 3/01/21 | United States | 3,000,000 | 2,990,233 | |||||||||
c,hGaz Capital SA, (OJSC Gazprom), loan participation, senior note, 144A, 3.85%, 2/06/20 | Russia | 20,000,000 | 20,146,300 | |||||||||
Kinder Morgan Inc., | ||||||||||||
senior bond, 4.30%, 6/01/25 | United States | 17,000,000 | 17,820,473 | |||||||||
senior note, 3.15%, 1/15/23 | United States | 9,000,000 | 9,021,965 | |||||||||
Martin Midstream Partners LP/Martin Midstream Finance Corp., senior note, 7.25%, 2/15/21 | United States | 19,000,000 | 18,715,000 | |||||||||
Oceaneering International Inc., senior note, 4.65%, 11/15/24 | United States | 2,100,000 | 2,004,870 | |||||||||
Sabine Pass Liquefaction LLC, | ||||||||||||
senior secured note, first lien, 5.625%, 2/01/21 | United States | 20,000,000 | 20,757,146 | |||||||||
senior secured note, first lien, 5.625%, 3/01/25 | United States | 5,000,000 | 5,485,713 | |||||||||
Sanchez Energy Corp., senior note, 6.125%, 1/15/23 | United States | 6,000,000 | 832,500 | |||||||||
Sunoco LP/Sunoco Finance Corp., senior note, 4.875%, 1/15/23 | United States | 5,900,000 | 6,010,625 | |||||||||
Weatherford International Ltd., | ||||||||||||
senior note, 7.75%, 6/15/21 | United States | 9,000,000 | 7,965,000 | |||||||||
senior note, 8.25%, 6/15/23 | United States | 7,000,000 | 4,865,000 | |||||||||
cWoodside Finance Ltd., senior note, 144A, 3.70%, 9/15/26 | Australia | 5,400,000 | 5,316,945 | |||||||||
| ||||||||||||
| 212,705,757 | ||||||||||||
| ||||||||||||
Food & Staples Retailing 0.6% | ||||||||||||
cAramark Services Inc., senior bond, 144A, 5.00%, 2/01/28 | United States | 7,600,000 | 7,754,280 | |||||||||
Walgreens Boots Alliance Inc., senior note, 3.80%, 11/18/24 | United States | 21,900,000 | 22,145,663 | |||||||||
| ||||||||||||
| 29,899,943 | ||||||||||||
| ||||||||||||
18 | Annual Report | franklintempleton.com | ||
FRANKLIN STRATEGIC SERIES
CONSOLIDATED STATEMENT OF INVESTMENTS
Franklin Strategic Income Fund(continued)
| Country | Principal Amount* | Value | ||||||||||
Corporate Bonds(continued) | ||||||||||||
Food, Beverage & Tobacco 1.2% | ||||||||||||
Bunge Ltd. Finance Corp., senior note, 3.25%, 8/15/26 | United States | 2,000,000 | $ 1,847,198 | |||||||||
cImperial Brands Finance PLC, senior note, 144A, 3.50%, 2/11/23 | United Kingdom | 20,400,000 | 20,458,528 | |||||||||
cLamb Weston Holdings Inc., senior note, 144A, 4.875%, 11/01/26 | United States | 16,500,000 | 16,830,000 | |||||||||
cPost Holdings Inc., | ||||||||||||
senior bond, 144A, 5.625%, 1/15/28 | United States | 10,000,000 | 10,155,600 | |||||||||
senior note, 144A, 5.50%, 3/01/25 | United States | 8,000,000 | 8,220,000 | |||||||||
Reynolds American Inc., senior note, 4.45%, 6/12/25 | United Kingdom | 1,900,000 | 1,961,699 | |||||||||
| ||||||||||||
| 59,473,025 | ||||||||||||
| ||||||||||||
Health Care Equipment & Services 1.6% | ||||||||||||
cAvantor Inc., senior secured note, first lien, 144A, 6.00%, 10/01/24 | United States | 15,000,000 | 15,689,063 | |||||||||
Centene Corp., | ||||||||||||
senior note, 4.75%, 5/15/22 | United States | 10,000,000 | 10,229,100 | |||||||||
csenior note, 144A, 5.375%, 6/01/26 | United States | 8,600,000 | 8,997,750 | |||||||||
CHS/Community Health Systems Inc., | ||||||||||||
senior note, 6.875%, 2/01/22 | United States | 7,223,000 | 4,762,666 | |||||||||
senior secured note, first lien, 6.25%, 3/31/23 | United States | 3,900,000 | 3,812,250 | |||||||||
CVS Health Corp., senior bond, 4.30%, 3/25/28 | United States | 5,800,000 | 5,847,761 | |||||||||
DaVita Inc., | ||||||||||||
senior bond, 5.125%, 7/15/24 | United States | 10,000,000 | 10,025,000 | |||||||||
senior bond, 5.00%, 5/01/25 | United States | 6,000,000 | 5,893,140 | |||||||||
Edwards Lifesciences Corp., senior note, 4.30%, 6/15/28 | United States | 2,700,000 | 2,817,940 | |||||||||
HCA Inc., senior bond, 5.875%, 2/15/26 | United States | 3,000,000 | 3,231,570 | |||||||||
cMEDNAX Inc., senior note, 144A, 6.25%, 1/15/27 | United States | 6,300,000 | 6,441,750 | |||||||||
| ||||||||||||
| 77,747,990 | ||||||||||||
| ||||||||||||
Materials 5.1% | ||||||||||||
ArcelorMittal, | ||||||||||||
senior note, 5.50%, 3/01/21 | France | 17,600,000 | 18,404,408 | |||||||||
senior note, 6.125%, 6/01/25 | France | 2,700,000 | 3,016,406 | |||||||||
gARD Finance SA, secured note, PIK, 7.125%, 9/15/23 | Luxembourg | 1,300,000 | 1,306,500 | |||||||||
cArdagh Packaging Finance PLC/Ardagh MP Holdings USA Inc., senior note, 144A, 6.00%, 2/15/25 | Luxembourg | 11,500,000 | 11,643,750 | |||||||||
cBWAY Holding Co., senior note, 144A, 7.25%, 4/15/25 | United States | 15,000,000 | 14,662,500 | |||||||||
cCemex SAB de CV, | ||||||||||||
senior secured bond, first lien, 144A, 5.70%, 1/11/25 | Mexico | 15,000,000 | 15,444,075 | |||||||||
senior secured bond, first lien, 144A, 6.125%, 5/05/25 | Mexico | 4,000,000 | 4,168,220 | |||||||||
The Chemours Co., senior note, 6.625%, 5/15/23 | United States | 10,860,000 | 11,291,142 | |||||||||
Crown Americas LLC/Crown Americas Capital Corp. VI, senior note, 4.75%, 2/01/26 | United States | 7,100,000 | 7,233,125 | |||||||||
cFirst Quantum Minerals Ltd., | ||||||||||||
senior note, 144A, 7.00%, 2/15/21 | Zambia | 2,144,000 | 2,188,220 | |||||||||
senior note, 144A, 7.25%, 4/01/23 | Zambia | 7,200,000 | 7,137,000 | |||||||||
cFMG Resources (August 2006) Pty. Ltd., | ||||||||||||
senior note, 144A, 5.125%, 3/15/23 | Australia | 3,600,000 | 3,690,000 | |||||||||
senior note, 144A, 5.125%, 5/15/24 | Australia | 7,700,000 | 7,837,060 | |||||||||
Freeport-McMoRan Inc., senior note, 4.55%, 11/14/24 | United States | 15,000,000 | 14,943,750 | |||||||||
cGlencore Funding LLC, | ||||||||||||
senior note, 144A, 4.125%, 5/30/23 | Switzerland | 5,000,000 | 5,110,597 | |||||||||
senior note, 144A, 4.625%, 4/29/24 | Switzerland | 2,500,000 | 2,593,130 | |||||||||
franklintempleton.com | Annual Report | 19 | ||
FRANKLIN STRATEGIC SERIES
CONSOLIDATED STATEMENT OF INVESTMENTS
Franklin Strategic Income Fund(continued)
| Country | Principal Amount* | Value | ||||||||||
Corporate Bonds(continued) | ||||||||||||
Materials(continued) | ||||||||||||
cINVISTA Finance LLC, senior secured note, 144A, 4.25%, 10/15/19 | United States | 10,000,000 | $ 10,082,000 | |||||||||
cNew Gold Inc., senior note, 144A, 6.375%, 5/15/25 | Canada | 6,900,000 | 5,554,500 | |||||||||
cNorthwest Acquisitions ULC/Dominion Finco Inc., secured note, second lien, 144A, 7.125%, 11/01/22 | Canada | 3,800,000 | 3,201,500 | |||||||||
cNovelis Corp., senior bond, 144A, 5.875%, 9/30/26 | United States | 14,000,000 | 14,262,500 | |||||||||
cOwens-Brockway Glass Container Inc., | ||||||||||||
senior note, 144A, 5.00%, 1/15/22 | United States | 7,800,000 | 8,014,500 | |||||||||
senior note, 144A, 5.875%, 8/15/23 | United States | 10,000,000 | 10,500,000 | |||||||||
Reynolds Group Issuer Inc./Reynolds Group Issuer LLC/ Reynolds Group Issuer Luxembourg SA, | ||||||||||||
senior secured note, first lien, 5.75%, 10/15/20 | United States | 5,427,003 | 5,450,068 | |||||||||
csenior secured note, first lien, 144A, 5.125%, 7/15/23 | United States | 5,900,000 | 5,992,984 | |||||||||
c,isenior secured note, first lien, 144A, FRN, 6.097%,(3-month USD LIBOR + 3.50%), 7/15/21 | United States | 6,500,000 | 6,540,625 | |||||||||
cSealed Air Corp., | ||||||||||||
senior bond, 144A, 5.125%, 12/01/24 | United States | 11,300,000 | 11,780,250 | |||||||||
senior note, 144A, 4.875%, 12/01/22 | United States | 5,000,000 | 5,181,250 | |||||||||
cSociedad Quimica y Minera de Chile SA, senior note, 144A, 3.625%, 4/03/23 | Chile | 1,500,000 | 1,518,420 | |||||||||
Steel Dynamics Inc., | ||||||||||||
senior bond, 5.50%, 10/01/24 | United States | 9,700,000 | 10,039,500 | |||||||||
senior note, 5.125%, 10/01/21 | United States | 5,000,000 | 5,037,500 | |||||||||
cSunCoke Energy Partners LP/SunCoke Energy Partners Finance Corp., senior note, 144A, 7.50%, 6/15/25 | United States | 12,000,000 | 12,150,000 | |||||||||
| ||||||||||||
| 245,975,480 | ||||||||||||
| ||||||||||||
Media & Entertainment 4.1% | ||||||||||||
cAltice Financing SA, secured bond, 144A, 7.50%, 5/15/26 | Luxembourg | 3,000,000 | 3,041,250 | |||||||||
CCO Holdings LLC/CCO Holdings Capital Corp., | ||||||||||||
senior bond, 5.25%, 9/30/22 | United States | 8,500,000 | 8,654,062 | |||||||||
csenior bond, 144A, 5.375%, 5/01/25 | United States | 13,000,000 | 13,487,500 | |||||||||
Clear Channel Worldwide Holdings Inc., | ||||||||||||
senior note, 6.50%, 11/15/22 | United States | 3,000,000 | 3,075,000 | |||||||||
senior note, 6.50%, 11/15/22 | United States | 5,000,000 | 5,137,500 | |||||||||
csenior sub. note, 144A, 9.25%, 2/15/24 | United States | 1,600,000 | 1,726,000 | |||||||||
cCSC Holdings LLC, senior secured note, first lien, 144A, 5.50%, 5/15/26 | United States | 16,000,000 | 16,470,000 | |||||||||
DISH DBS Corp., | ||||||||||||
senior bond, 5.00%, 3/15/23 | United States | 8,000,000 | 7,360,000 | |||||||||
senior note, 5.875%, 11/15/24 | United States | 8,000,000 | 6,930,000 | |||||||||
jiHeartCommunications Inc., | ||||||||||||
senior secured bond, first lien, 9.00%, 3/01/21 | United States | 8,000,000 | 5,960,000 | |||||||||
senior secured note, first lien, 9.00%, 9/15/22 | United States | 3,100,000 | 2,325,000 | |||||||||
Netflix Inc., | ||||||||||||
senior bond, 5.875%, 2/15/25 | United States | 5,000,000 | 5,403,125 | |||||||||
senior bond, 4.375%, 11/15/26 | United States | 11,800,000 | 11,711,500 | |||||||||
cNexstar Broadcasting Inc., senior note, 144A, 5.625%, 8/01/24 | United States | 17,000,000 | 17,300,900 | |||||||||
Tegna Inc., senior note, 5.125%, 7/15/20 | United States | 4,000,000 | 4,025,000 | |||||||||
Time Warner Inc., senior bond, 2.95%, 7/15/26 | United States | 25,400,000 | 24,382,757 | |||||||||
cUnitymedia KabelBW GmbH, senior bond, 144A, 6.125%, 1/15/25 | Germany | 16,000,000 | 16,640,000 | |||||||||
20 | Annual Report | franklintempleton.com | ||
FRANKLIN STRATEGIC SERIES
CONSOLIDATED STATEMENT OF INVESTMENTS
Franklin Strategic Income Fund(continued)
| Country | Principal Amount* | Value | ||||||||||
Corporate Bonds(continued) | ||||||||||||
Media & Entertainment(continued) | ||||||||||||
cUnivision Communications Inc., senior secured note, first lien, 144A, 5.125%, 2/15/25 | United States | 18,000,000 | $ 16,942,500 | |||||||||
cVirgin Media Finance PLC, senior bond, 144A, 6.375%, 10/15/24 | United Kingdom | 9,600,000 | GBP | 13,198,216 | ||||||||
cVirgin Media Secured Finance PLC, senior secured bond, first lien, 144A, 5.50%, 1/15/25 | United Kingdom | 14,000,000 | 14,332,500 | |||||||||
| ||||||||||||
| 198,102,810 | ||||||||||||
| ||||||||||||
Pharmaceuticals, Biotechnology & Life Sciences 1.8% | ||||||||||||
Allergan Funding SCS, senior bond, 3.80%, 3/15/25 | United States | 25,000,000 | 25,271,562 | |||||||||
cBausch Health Cos. Inc., | ||||||||||||
senior bond, 144A, 6.125%, 4/15/25 | United States | 3,100,000 | 3,146,500 | |||||||||
senior note, 144A, 4.50%, 5/15/23 | United States | 8,000,000 | EUR | 9,076,347 | ||||||||
senior note, 144A, 8.50%, 1/31/27 | United States | 5,000,000 | 5,459,375 | |||||||||
senior note, first lien, 144A, 7.00%, 3/15/24 | United States | 2,100,000 | 2,218,125 | |||||||||
cBayer U.S. Finance II LLC, senior bond, 144A, 4.375%, 12/15/28 | Germany | 11,700,000 | 11,752,698 | |||||||||
c,gEagle Holdings Co. II LLC, senior note, 144A, PIK, 7.625%, 5/15/22 | United States | 3,300,000 | 3,320,625 | |||||||||
cEndo DAC/Endo Finance LLC/Endo Finco Inc., | ||||||||||||
senior bond, 144A, 6.00%, 2/01/25 | United States | 11,000,000 | 8,442,500 | |||||||||
senior note, 144A, 6.00%, 7/15/23 | United States | 1,637,000 | 1,342,340 | |||||||||
cJaguar Holding Co. II/Pharmaceutical Product Development LLC, senior note, 144A, 6.375%, 8/01/23 | United States | 10,000,000 | 10,225,000 | |||||||||
cSABIC Capital II BV, senior note, 144A, 4.50%, 10/10/28 | Saudi Arabia | 5,500,000 | 5,816,883 | |||||||||
| ||||||||||||
| 86,071,955 | ||||||||||||
| ||||||||||||
Real Estate 1.2% | ||||||||||||
American Tower Corp., senior bond, 3.375%, 10/15/26 | United States | 28,900,000 | 28,475,238 | |||||||||
Equinix Inc., senior bond, 5.375%, 4/01/23 | United States | 17,000,000 | 17,419,900 | |||||||||
MPT Operating Partnership LP/MPT Finance Corp., | ||||||||||||
senior bond, 5.25%, 8/01/26 | United States | 4,200,000 | 4,294,500 | |||||||||
senior bond, 5.00%, 10/15/27 | United States | 5,700,000 | 5,728,500 | |||||||||
| ||||||||||||
| 55,918,138 | ||||||||||||
| ||||||||||||
Retailing 0.3% | ||||||||||||
b,d,gK2016470219 South Africa Ltd., senior secured note, 144A, PIK, 3.00%, 12/31/22 | South Africa | 9,834,030 | 12,171 | |||||||||
b,d,gK2016470260 South Africa Ltd., senior secured note, 144A, PIK, 25.00%, 12/31/22 | South Africa | 2,108,028 | 77,835 | |||||||||
cParty City Holdings Inc., senior note, 144A, 6.625%, 8/01/26 | United States | 5,300,000 | 5,266,981 | |||||||||
cPetSmart Inc., senior note, 144A, 7.125%, 3/15/23 | United States | 12,500,000 | 11,125,000 | |||||||||
| ||||||||||||
| 16,481,987 | ||||||||||||
| ||||||||||||
Semiconductors & Semiconductor Equipment 0.2% | ||||||||||||
Maxim Integrated Products Inc., senior note, 3.375%, 3/15/23 | United States | 1,800,000 | 1,808,728 | |||||||||
cQorvo Inc., senior note, 144A, 5.50%, 7/15/26 | United States | 5,600,000 | 5,852,000 | |||||||||
| ||||||||||||
| 7,660,728 | ||||||||||||
| ||||||||||||
Software & Services 0.4% | ||||||||||||
Fiserv Inc., senior bond, 3.85%, 6/01/25 | United States | 8,400,000 | 8,656,826 | |||||||||
cSymantec Corp., senior note, 144A, 5.00%, 4/15/25 | United States | 9,500,000 | 9,695,054 | |||||||||
| ||||||||||||
| 18,351,880 | ||||||||||||
| ||||||||||||
franklintempleton.com | Annual Report | 21 | ||
FRANKLIN STRATEGIC SERIES
CONSOLIDATED STATEMENT OF INVESTMENTS
Franklin Strategic Income Fund(continued)
| Country | Principal Amount* | Value | ||||||||||
Corporate Bonds(continued) | ||||||||||||
Technology Hardware & Equipment 0.7% | ||||||||||||
cCommScope Technologies LLC, senior bond, 144A, 6.00%, 6/15/25 | United States | 16,600,000 | $ 16,932,000 | |||||||||
cDell International LLC/EMC Corp., | ||||||||||||
senior note, 144A, 5.875%, 6/15/21 | United States | 2,500,000 | 2,546,806 | |||||||||
senior note, 144A, 7.125%, 6/15/24 | United States | 12,600,000 | 13,330,246 | |||||||||
Juniper Networks Inc., senior bond, 5.95%, 3/15/41 | United States | 1,200,000 | 1,266,505 | |||||||||
Tech Data Corp., senior bond, 4.95%, 2/15/27 | United States | 1,900,000 | 1,928,434 | |||||||||
| ||||||||||||
| 36,003,991 | ||||||||||||
| ||||||||||||
Telecommunication Services 1.8% | ||||||||||||
cDigicel Group Two Ltd., | ||||||||||||
senior note, 144A, 8.25%, 9/30/22 | Bermuda | 2,427,000 | 961,881 | |||||||||
gsenior note, 144A, PIK, 9.125%, 4/01/24 | Bermuda | 3,012,833 | 949,660 | |||||||||
cDigicel Ltd., senior note, 144A, 6.00%, 4/15/21 | Bermuda | 10,000,000 | 8,815,500 | |||||||||
Hughes Satellite Systems Corp., senior bond, 6.625%, 8/01/26 | United States | 13,000,000 | 13,178,750 | |||||||||
Sprint Communications Inc., | ||||||||||||
senior note, 6.00%, 11/15/22 | United States | 10,000,000 | 10,087,500 | |||||||||
csenior note, 144A, 7.00%, 3/01/20 | United States | 5,000,000 | 5,150,000 | |||||||||
T-Mobile USA Inc., | ||||||||||||
senior bond, 6.50%, 1/15/24 | United States | 5,000,000 | 5,187,500 | |||||||||
senior bond, 6.375%, 3/01/25 | United States | 13,000,000 | 13,548,730 | |||||||||
senior note, 5.125%, 4/15/25 | United States | 6,000,000 | 6,202,500 | |||||||||
Verizon Communications Inc., senior note, 5.15%, 9/15/23 | United States | 22,000,000 | 24,097,715 | |||||||||
| ||||||||||||
| 88,179,736 | ||||||||||||
| ||||||||||||
Transportation 0.5% | ||||||||||||
cDAE Funding LLC, | ||||||||||||
senior note, 144A, 4.50%, 8/01/22 | United Arab Emirates | 4,000,000 | 4,060,000 | |||||||||
senior note, 144A, 5.00%, 8/01/24 | United Arab Emirates | 14,000,000 | 14,525,000 | |||||||||
cKazakhstan Temir Zholy Finance BV, senior bond, 144A, 6.95%, 7/10/42 | Kazakhstan | 3,900,000 | 4,624,581 | |||||||||
f,hRZD Capital PLC, (Russian Railways), loan participation, senior bond, Reg S, 5.70%, 4/05/22 | Russia | 3,300,000 | 3,451,255 | |||||||||
| ||||||||||||
| 26,660,836 | ||||||||||||
| ||||||||||||
Utilities 3.6% | ||||||||||||
Calpine Corp., | ||||||||||||
senior bond, 5.75%, 1/15/25 | United States | 9,000,000 | 8,932,500 | |||||||||
senior note, 5.375%, 1/15/23 | United States | 6,000,000 | 6,060,000 | |||||||||
cClearway Energy Operating LLC, senior note, 144A, 5.75%, 10/15/25 | United States | 12,800,000 | 13,136,000 | |||||||||
Dominion Energy Inc., senior bond, 2.85%, 8/15/26 | United States | 11,400,000 | 10,931,418 | |||||||||
c,kEDF SA, | ||||||||||||
junior sub. bond, 144A, 5.625% to 1/22/24, FRN thereafter, Perpetual | France | 5,000,000 | 5,056,625 | |||||||||
junior sub. note, 144A, 5.25% to 1/29/23, FRN thereafter, Perpetual | France | 25,000,000 | 25,490,750 | |||||||||
Exelon Corp., senior bond, 3.95%, 6/15/25 | United States | 18,500,000 | 19,250,607 | |||||||||
cInterGen NV, secured bond, 144A, 7.00%, 6/30/23 | Netherlands | 4,800,000 | 4,434,000 | |||||||||
cIsrael Electric Corp. Ltd., secured bond, 144A, 4.25%, 8/14/28 | Israel | 9,200,000 | 9,323,234 | |||||||||
The Southern Co., senior bond, 3.25%, 7/01/26 | United States | 24,200,000 | 23,905,678 | |||||||||
cState Grid Overseas Investment 2016 Ltd., senior note, 144A, 3.50%, 5/04/27 | China | 12,800,000 | 12,772,672 | |||||||||
22 | Annual Report | franklintempleton.com | ||
FRANKLIN STRATEGIC SERIES
CONSOLIDATED STATEMENT OF INVESTMENTS
Franklin Strategic Income Fund(continued)
| Country | Principal Amount* | Value | ||||||||||||
Corporate Bonds(continued) | ||||||||||||||
Utilities(continued) | ||||||||||||||
cTalen Energy Supply LLC, | ||||||||||||||
senior note, 144A, 9.50%, 7/15/22 | United States | 15,900,000 | $ | 17,410,500 | ||||||||||
senior note, 144A, 10.50%, 1/15/26 | United States | 3,000,000 | 3,142,500 | |||||||||||
cThree Gorges Finance I Cayman Islands Ltd., senior note, 144A, 3.15%, 6/02/26 | China | 12,800,000 | 12,498,304 | |||||||||||
Virginia Electric & Power Co., senior bond, 6.35%, 11/30/37 | United States | 820,000 | 1,057,823 | |||||||||||
|
| |||||||||||||
| 173,402,611 | ||||||||||||||
|
| |||||||||||||
Total Corporate Bonds (Cost $1,773,816,259) | 1,755,015,816 | |||||||||||||
|
| |||||||||||||
i,lSenior Floating Rate Interests 11.9% | ||||||||||||||
Automobiles & Components 0.1% | ||||||||||||||
Allison Transmission Inc., Initial Term Loans, 4.479%,(1-month USD LIBOR + 2.00%), 3/29/26 | United States | 1,423,206 | 1,436,675 | |||||||||||
Thor Industries Inc., Initial USD Term Loans, 6.313%,(1-month USD LIBOR + 3.75%), 2/01/26 | United States | 2,590,592 | 2,550,114 | |||||||||||
|
| |||||||||||||
| 3,986,789 | ||||||||||||||
|
| |||||||||||||
Capital Goods 0.3% | ||||||||||||||
Altra Industrial Motion Corp., Term Loan, 4.483%,(1-month USD LIBOR + 2.00%), 10/01/25 | United States | 733,182 | 733,176 | |||||||||||
Doncasters U.S. Finance LLC, Second Lien Term Loan, 10.851%,(3-month USD LIBOR + 8.25%), 10/09/20 | United States | 12,543,188 | 3,867,441 | |||||||||||
Harsco Corp., Term LoanB-2, 4.75%,(1-month USD LIBOR + 2.25%), 12/10/24 | United States | 4,259,330 | 4,277,965 | |||||||||||
Onsite Rental Group Operations Pty. Ltd., Term Loan, 6.983%,(1-month USD LIBOR + 4.50%), 10/25/22 | Australia | 3,404,855 | 3,353,782 | |||||||||||
|
| |||||||||||||
| 12,232,364 | ||||||||||||||
|
| |||||||||||||
Commercial & Professional Services 0.2% | ||||||||||||||
KAR Auction Services Inc., TrancheB-5 Term Loans, 5.125%,(3-month USD LIBOR + 2.50%), 3/09/23 | United States | 7,269,575 | 7,284,660 | |||||||||||
United Rentals North America Inc., Initial Term Loans, 4.233%,(1-month USD LIBOR + 1.75%), 10/30/25 | United States | 3,583,762 | 3,594,065 | |||||||||||
Ventia Pty. Ltd., Term B Loans (USD), 6.101%,(3-month USD LIBOR + 3.50%), 5/21/22 | Australia | 832,033 | 832,033 | |||||||||||
|
| |||||||||||||
| 11,710,758 | ||||||||||||||
|
| |||||||||||||
Consumer Services 0.2% | ||||||||||||||
Aristocrat Technologies Inc., TermB-3 Loans, 4.342%,(3-month USD LIBOR + 1.75%), 10/19/24 | United States | 1,556,965 | 1,556,271 | |||||||||||
Avis Budget Car Rental LLC, Tranche B Term Loans, 4.49%,(1-month USD LIBOR + 2.00%), 2/13/25 | United States | 6,327,748 | 6,272,412 | |||||||||||
Eldorado Resorts Inc., Initial Term Loan, 4.75%,(1-month USD LIBOR + 2.25%), 4/17/24 | United States | 3,508,477 | 3,512,132 | |||||||||||
|
| |||||||||||||
| 11,340,815 | ||||||||||||||
|
| |||||||||||||
franklintempleton.com | Annual Report | 23 | ||
FRANKLIN STRATEGIC SERIES
CONSOLIDATED STATEMENT OF INVESTMENTS
Franklin Strategic Income Fund(continued)
| Country | Principal Amount* | Value | ||||||||||
i,lSenior Floating Rate Interests(continued) | ||||||||||||
Diversified Financials 0.2% | ||||||||||||
Asurion LLC, Second Lien ReplacementB-2 Term Loans, 8.983%,(1-month USD LIBOR + 6.50%), 8/04/25 | United States | 636,940 | $ 651,204 | |||||||||
First Eagle Holdings Inc., Initial Term Loans, 5.351%,(3-month USD LIBOR + 2.75%), 12/01/24 | United States | 5,164,853 | 5,186,375 | |||||||||
Trans Union LLC, 2017 Replacement TermA-2 Loans, 4.233%,(1-month USD LIBOR + 1.75%), 8/09/22 | United States | 3,408,400 | 3,408,400 | |||||||||
| ||||||||||||
| 9,245,979 | ||||||||||||
| ||||||||||||
Energy 2.8% | ||||||||||||
Fieldwood Energy LLC, Closing Date Loans, 7.749%,(1-month USD LIBOR + 5.25%), 4/11/22 | United States | 74,097,871 | 71,844,035 | |||||||||
Foresight Energy LLC, Term Loans, 8.379%,(3-month USD LIBOR + 5.75%), 3/28/22 | United States | 15,900,922 | 15,026,371 | |||||||||
Utex Industries Inc., | ||||||||||||
First Lien Initial Term Loan, 6.483%,(1-month USD LIBOR + 4.00%), 5/21/21 | United States | 9,216,822 | 8,963,360 | |||||||||
Second Lien Initial Term Loan, 9.733%,(1-month USD LIBOR + 7.25%), 5/20/22 | United States | 955,410 | 907,640 | |||||||||
Wolverine Fuels Holding LLC, | ||||||||||||
First Lien Initial Term Loan, 8.379%,(3-month USD LIBOR + 5.75%), 8/14/20 | United States | 19,455,394 | 19,127,084 | |||||||||
Second Lien Initial Term Loan, 13.379%,(3-month USD LIBOR + 10.75%), 2/16/21 | United States | 22,488,412 | 21,307,770 | |||||||||
| ||||||||||||
| 137,176,260 | ||||||||||||
| ||||||||||||
Food & Staples Retailing 0.5% | ||||||||||||
Aramark Corp., U.S. TermB-3 Loan, 4.233%,(1-month USD LIBOR + 1.75%), 3/11/25 | United States | 3,656,382 | 3,657,907 | |||||||||
Smart & Final Stores LLC, First Lien Term Loan, 6.129%,(3-month USD LIBOR + 3.50%), 11/15/22 | United States | 18,228,779 | 18,268,663 | |||||||||
| ||||||||||||
| 21,926,570 | ||||||||||||
| ||||||||||||
Food, Beverage & Tobacco 1.1% | ||||||||||||
CSM Bakery Supplies LLC, | ||||||||||||
Second Lien Term Loan, 10.34%,(3-month USD LIBOR + 7.75%), 7/03/21 | United States | 16,940,234 | 15,225,035 | |||||||||
Term Loans, 6.59%,(3-month USD LIBOR + 4.00%), 7/03/20 | United States | 1,830,000 | 1,746,126 | |||||||||
JBS USA Lux SA, | ||||||||||||
New Initial Term Loans, 4.98%,(1-month USD LIBOR + 2.50%), 10/30/22 | United States | 22,313,354 | 22,351,197 | |||||||||
m,nTerm Loan, TBD, 5/01/26 | United States | 14,729,802 | 14,779,780 | |||||||||
| ||||||||||||
| 54,102,138 | ||||||||||||
| ||||||||||||
Health Care Equipment & Services 0.0%† | ||||||||||||
IQVIA Inc., TermB-3 Dollar Loans, 4.233%,(1-month USD LIBOR + 1.75%), 6/11/25 | United States | 1,451,686 | 1,448,446 | |||||||||
U.S. Renal Care Inc., Initial Term Loan, 6.851%,(3-month USD LIBOR + 4.25%), 12/31/22 | United States | 978,473 | 980,552 | |||||||||
| ||||||||||||
| 2,428,998 | ||||||||||||
| ||||||||||||
24 | Annual Report | franklintempleton.com | ||
FRANKLIN STRATEGIC SERIES
CONSOLIDATED STATEMENT OF INVESTMENTS
Franklin Strategic Income Fund(continued)
| Country | Principal Amount* | Value | ||||||||||
i,lSenior Floating Rate Interests(continued) | ||||||||||||
Household & Personal Products 0.9% | ||||||||||||
bFGI Operating Co. LLC (Freedom Group), | ||||||||||||
DDTL FILO, 10.129%,(3-month USD LIBOR + 7.50%), 5/15/21 | United States | 2,605,664 | $ 2,598,419 | |||||||||
gTerm Loan, PIK, 12.684%,(3-month USD LIBOR + 10.00%), 5/15/22 | United States | 13,951,317 | 13,526,354 | |||||||||
Term Loan FILO, 10.184%,(3-month USD LIBOR + 7.50%), 5/15/21 | United States | 26,056,641 | 25,984,191 | |||||||||
| ||||||||||||
| 42,108,964 | ||||||||||||
| ||||||||||||
Materials 1.1% | ||||||||||||
Appvion Operations Inc., Term Loan, 8.60%,(3-month USD LIBOR + 6.00%), 6/15/26 | United States | 7,533,445 | 7,561,696 | |||||||||
Ashland LLC, Term B Loan, 4.227% - 4.233%,(1-month USD LIBOR + 1.75%), 5/17/24 | United States | 3,998,772 | 4,001,272 | |||||||||
Axalta Coating Systems U.S. Holdings Inc., TermB-3 Dollar Loan, 4.351%,(3-month USD LIBOR + 1.75%), 6/01/24 | United States | 4,800,670 | 4,781,539 | |||||||||
Chemours Co., TrancheB-2 US$ Term Loan, 4.24%,(1-month USD LIBOR + 1.75%), 4/03/25 | United States | 11,443,554 | 11,413,457 | |||||||||
Crown Americas LLC, Dollar Term B Loan, 4.482%,(1-month USD LIBOR + 2.00%), 4/03/25 | United States | 530,376 | 534,810 | |||||||||
Oxbow Carbon LLC, | ||||||||||||
Second Lien Term Loan, 9.983%,(1-month USD LIBOR + 7.50%), 1/04/24 | United States | 6,631,974 | 6,681,713 | |||||||||
Tranche A Term Loan, 4.733%,(1-month USD LIBOR + 2.25%), 1/04/22 | United States | 11,921,875 | 11,862,265 | |||||||||
Tranche B Term Loan, 5.983%,(1-month USD LIBOR + 3.50%), 1/04/23 | United States | 7,340,625 | 7,395,680 | |||||||||
| ||||||||||||
| 54,232,432 | ||||||||||||
| ||||||||||||
Media & Entertainment 0.5% | ||||||||||||
Charter Communications Operating LLC, TermA-2 Loan, 3.99%,(1-month USD LIBOR + 1.50%), 3/31/23 | United States | 8,732,121 | 8,721,206 | |||||||||
CSC Holdings LLC, March 2017 Incremental Term Loans, 4.723%,(1-month USD LIBOR + 2.25%), 7/17/25 | United States | 12,699,430 | 12,683,556 | |||||||||
Gray Television Inc., Term C Loan, 4.977%,(1-month USD LIBOR + 2.50%), 1/02/26 | United States | 398,804 | 400,100 | |||||||||
Lions Gate Capital Holdings LLC, Term A Loan, 4.483%,(1-month USD LIBOR + 2.00%), 3/22/23 | Canada | 2,541,660 | 2,506,712 | |||||||||
| ||||||||||||
| 24,311,574 | ||||||||||||
| ||||||||||||
Pharmaceuticals, Biotechnology & Life Sciences 0.7% | ||||||||||||
Endo Luxembourg Finance Co. I S.A.R.L. and Endo LLC, Initial Term Loans, 6.75%,(1-month USD LIBOR + 4.25%), 4/29/24 | United States | 9,661,003 | 9,600,507 | |||||||||
Grifols Worldwide Operations USA Inc., Tranche B Term Loan, 4.674%,(1-week USD LIBOR + 2.25%), 1/31/25 | United States | 12,791,599 | 12,825,752 | |||||||||
Syneos Health Inc., Initial Term B Loans, 4.483%,(1-month USD LIBOR + 2.00%), 8/01/24 | United States | 7,058,773 | 7,058,279 | |||||||||
Valeant Pharmaceuticals International, Initial Term Loans, 5.474%,(1-month USD LIBOR + 3.00%), 6/02/25 | United States | 2,980,641 | 2,992,984 | |||||||||
| ||||||||||||
| 32,477,522 | ||||||||||||
| ||||||||||||
franklintempleton.com | Annual Report | 25 | ||
FRANKLIN STRATEGIC SERIES
CONSOLIDATED STATEMENT OF INVESTMENTS
Franklin Strategic Income Fund(continued)
| Country | Principal Amount* | Value | ||||||||||
i,lSenior Floating Rate Interests(continued) | ||||||||||||
Retailing 1.2% | ||||||||||||
g99 Cents Only Stores, | ||||||||||||
First Lien Term Loan, PIK, 9.129%,(3-month USD LIBOR + 6.50%), 1/13/22 | United States | 3,766,144 | $ �� 3,253,007 | |||||||||
First Lien Term Loan, PIK, 9.151%,(6-month USD LIBOR + 6.50%), 1/13/22 | United States | 4,594,050 | 3,968,111 | |||||||||
First Lien Term Loan, PIK, 11.00%, (Prime + 7.00%), 1/13/22 | United States | 1,774 | 1,532 | |||||||||
Ascena Retail Group Inc., Tranche B Term Loan, 7.00%,(1-month USD LIBOR + 4.50%), 8/21/22 | United States | 34,153,335 | 29,554,930 | |||||||||
General Nutrition Centers Inc., | ||||||||||||
FILO Term Loan (ABL), 9.49%,(1-month USD LIBOR + 7.00%), 12/31/22 | United States | 2,706,793 | 2,739,275 | |||||||||
TrancheB-2 Term Loans, 11.24%,(1-month USD LIBOR + 8.75%), 3/04/21 | United States | 10,168,853 | 9,700,628 | |||||||||
Jo-Ann Stores Inc., Initial Loans, 7.592%,(3-month USD LIBOR + 5.00%), 10/23/23 | United States | 7,080,483 | 7,076,058 | |||||||||
PETCO Animal Supplies Stores Inc., Second Amendment Term Loans, 5.833%,(3-month USD LIBOR + 3.25%), 1/26/23 | United States | 1,896,122 | 1,548,657 | |||||||||
mPetSmart Inc., Amended Loan, 6.73%,(1-month USD LIBOR + 3.00%), 3/11/22 | United States | 630,374 | 609,449 | |||||||||
| ||||||||||||
| 58,451,647 | ||||||||||||
| ||||||||||||
Semiconductors & Semiconductor Equipment 0.3% | ||||||||||||
MKS Instruments Inc., | ||||||||||||
TrancheB-4 Term Loan, 4.483%,(1-month USD LIBOR + 2.00%), 4/29/23 | United States | 2,722,325 | 2,727,429 | |||||||||
TrancheB-5 Term Loans, 4.733%,(1-month USD LIBOR + 2.25%), 2/01/26 | United States | 1,428,456 | 1,432,473 | |||||||||
ON Semiconductor Corp., 2018 New Replacement TermB-3 Loans, 4.233%,(1-month USD LIBOR + 1.75%), 3/31/23 | United States | 11,425,542 | 11,395,196 | |||||||||
| ||||||||||||
| 15,555,098 | ||||||||||||
| ||||||||||||
Software & Services 0.5% | ||||||||||||
LegalZoom.com Inc., 2018 Term Loans, 6.977%,(1-month USD LIBOR + 4.50%), 11/21/24 | United States | 1,094,702 | 1,101,517 | |||||||||
Wex Inc., TermB-2 Loan, 4.733%,(1-month USD LIBOR + 2.25%), 7/01/23 | United States | 1,853,348 | 1,860,298 | |||||||||
bWorkCapital BSD SARL, Loan, 18.688%,(3-month USD LIBOR + 16.00%), 11/29/21 | Luxembourg | 20,000,000 | 19,883,394 | |||||||||
| ||||||||||||
| 22,845,209 | ||||||||||||
| ||||||||||||
Technology Hardware & Equipment 0.0%† | ||||||||||||
CommScope Inc., Initial Term Loans, 5.733%,(1-month USD LIBOR + 3.25%), 4/04/26 | United States | 380,922 | 384,779 | |||||||||
| ||||||||||||
Telecommunication Services 0.3% | ||||||||||||
Global Tel*Link Corp., Second Lien Term Loan, 10.733%,(1-month USD LIBOR + 8.25%), 11/29/26 | United States | 3,245,755 | 3,193,687 | |||||||||
Securus Technologies Holdings Inc., Second Lien Initial Loan, 10.733%,(1-month USD LIBOR + 8.25%), 11/01/25 | United States | 10,588,688 | 10,359,263 | |||||||||
| ||||||||||||
| 13,552,950 | ||||||||||||
| ||||||||||||
26 | Annual Report | franklintempleton.com | ||
FRANKLIN STRATEGIC SERIES
CONSOLIDATED STATEMENT OF INVESTMENTS
Franklin Strategic Income Fund(continued)
| Country | Principal Amount* | Value | ||||||||||
i,lSenior Floating Rate Interests(continued) | ||||||||||||
Transportation 0.7% | ||||||||||||
Air Canada, Term Loan, 4.479%,(1-month USD LIBOR + 2.00%), 10/06/23 | Canada | 410,166 | $ 411,274 | |||||||||
Allegiant Travel Co., Class B Term Loans, 7.233%,(3-month USD LIBOR + 4.50%), 2/05/24 | United States | 2,916,146 | 2,919,791 | |||||||||
Hertz Corp., TrancheB-1 Term Loan, 5.24%,(1-month USD LIBOR + 2.75%), 6/30/23 | United States | 8,905,975 | 8,904,861 | |||||||||
International Seaways Operating Corp., Initial Term Loans, 8.49%,(1-month USD LIBOR + 6.00%), 6/22/22 | United States | 7,758,516 | 7,826,403 | |||||||||
Navios Maritime Midstream Partners LP, Initial Term Loan, 7.14%,(3-month USD LIBOR + 4.50%), 6/18/20 | Marshall Islands | 13,027,190 | 12,620,091 | |||||||||
| ||||||||||||
| 32,682,420 | ||||||||||||
| ||||||||||||
Utilities 0.3% | ||||||||||||
EFS Cogen Holdings I LLC (Linden), Term B Advance, 5.86%,(3-month USD LIBOR + 3.25%), 6/28/23 | United States | 6,084,502 | 6,058,515 | |||||||||
NRG Energy Inc., Term Loan B, 4.233%,(1-month USD LIBOR + 1.75%), 6/30/23 | United States | 8,392,675 | 8,402,159 | |||||||||
| ||||||||||||
| 14,460,674 | ||||||||||||
| ||||||||||||
Total Senior Floating Rate Interests | 575,213,940 | |||||||||||
| ||||||||||||
Foreign Government and Agency Securities 5.7% | ||||||||||||
cAngolan Government International Bond, senior note, 144A, 8.25%, 5/09/28 | Angola | 16,800,000 | 17,616,564 | |||||||||
fBanque Centrale de Tunisie International Bond, senior note, Reg S, 5.625%, 2/17/24 | Tunisia | 6,300,000 | EUR | 6,896,353 | ||||||||
Brazil Notas do Tesouro Nacional, | ||||||||||||
10.00%, 1/01/21 | Brazil | 97,200 | o | BRL | 25,872,242 | |||||||
10.00%, 1/01/23 | Brazil | 34,402 | o | BRL | 9,275,594 | |||||||
pIndex Linked, 6.00%, 5/15/23 | Brazil | 19,500 | o | BRL | 17,269,542 | |||||||
cDominican Republic, senior note, 144A, 8.90%, 2/15/23 | Dominican Republic | 40,700,000 | DOP | 805,402 | ||||||||
cThe Export-Import Bank of India, senior note, 144A, 3.875%, 2/01/28 | India | 16,000,000 | 15,838,888 | |||||||||
Government of Colombia, senior bond, 9.85%, 6/28/27 | Colombia | 42,750,000,000 | COP | 16,377,615 | ||||||||
cGovernment of Gabon, 144A, 6.375%, 12/12/24 | Gabon | 10,750,000 | 10,390,198 | |||||||||
Government of Indonesia, | ||||||||||||
senior bond, FR34, 12.80%, 6/15/21 | Indonesia | 169,210,000,000 | IDR | 13,267,248 | ||||||||
senior bond, FR36, 11.50%, 9/15/19 | Indonesia | 35,400,000,000 | IDR | 2,536,378 | ||||||||
senior bond, FR39, 11.75%, 8/15/23 | Indonesia | 29,150,000,000 | IDR | 2,379,765 | ||||||||
senior bond, FR44, 10.00%, 9/15/24 | Indonesia | 8,340,000,000 | IDR | 649,174 | ||||||||
senior bond, FR56, 8.375%, 9/15/26 | Indonesia | 363,988,000,000 | IDR | 26,398,703 | ||||||||
cGovernment of Iraq, 144A, 5.80%, 1/15/28 | Iraq | 17,000,000 | 16,558,340 | |||||||||
cGovernment of Kazakhstan, senior bond, 144A, 4.875%, 10/14/44 | Kazakhstan | 7,600,000 | 8,182,616 | |||||||||
Government of Mexico, senior bond, M, 6.50%, 6/10/21 | Mexico | 3,990,000 | q | MXN | 20,465,981 | |||||||
Government of South Africa, senior bond, 7.00%, 2/28/31 | South Africa | 260,000,000 | ZAR | 15,297,007 | ||||||||
cGovernment of Ukraine, | ||||||||||||
144A, 7.75%, 9/01/22 | Ukraine | 2,200,000 | 2,164,910 | |||||||||
144A, 7.75%, 9/01/23 | Ukraine | 4,355,000 | 4,214,442 | |||||||||
144A, 7.75%, 9/01/24 | Ukraine | 4,355,000 | 4,169,455 | |||||||||
a,r144A, VRI, GDP Linked Security, 5/31/40 | Ukraine | 9,990,000 | 6,406,038 | |||||||||
franklintempleton.com | Annual Report | 27 | ||
FRANKLIN STRATEGIC SERIES
CONSOLIDATED STATEMENT OF INVESTMENTS
Franklin Strategic Income Fund(continued)
| Country | Principal Amount* | Value | ||||||||||
Foreign Government and Agency Securities(continued) | ||||||||||||
cGovernment of Ukraine, (continued) | ||||||||||||
senior bond, 144A, 7.375%, 9/25/32 | Ukraine | 6,000,000 | $ 5,293,800 | |||||||||
sGovernment of Uruguay, senior bond, Index Linked, 3.70%, 6/26/37 | Uruguay | 471,212,345 | UYU | 13,920,174 | ||||||||
Republic of Colombia, senior bond, 5.00%, 6/15/45 | Colombia | 13,500,000 | 14,129,572 | |||||||||
| ||||||||||||
Total Foreign Government and Agency Securities | 276,376,001 | |||||||||||
| ||||||||||||
U.S. Government and Agency Securities 5.8% | ||||||||||||
U.S. Treasury Bond, | ||||||||||||
7.125%, 2/15/23 | United States | 3,000,000 | 3,526,875 | |||||||||
6.25%, 8/15/23 | United States | 4,000,000 | 4,646,250 | |||||||||
6.875%, 8/15/25 | United States | 1,000,000 | 1,261,426 | |||||||||
5.25%, 2/15/29 | United States | 1,750,000 | 2,165,317 | |||||||||
3.00%, 11/15/45 | United States | 26,900,000 | 27,328,719 | |||||||||
U.S. Treasury Note, | ||||||||||||
2.375%, 8/15/24 | United States | 5,000,000 | 5,018,360 | |||||||||
3.125%, 11/15/28 | United States | 111,000,000 | 116,870,859 | |||||||||
sIndex Linked, 0.625%, 1/15/24 | United States | 24,859,130 | 25,136,291 | |||||||||
sIndex Linked, 0.125%, 7/15/24 | United States | 96,371,948 | 95,402,855 | |||||||||
| ||||||||||||
Total U.S. Government and Agency Securities | 281,356,952 | |||||||||||
| ||||||||||||
Asset-Backed Securities and Commercial Mortgage-Backed Securities 26.2% | ||||||||||||
Banks 0.5% | ||||||||||||
Citigroup Commercial Mortgage Trust,2006-C5, AJ, 5.482%, 10/15/49 | United States | 2,706,225 | 2,621,620 | |||||||||
tCommercial Mortgage Trust,2006-GG7, AJ, FRN, 5.855%, 7/10/38 | United States | 7,193,000 | 6,550,068 | |||||||||
CSAIL Commercial Mortgage Trust,2015-C1, A4, 3.505%, 4/15/50 | United States | 10,050,000 | 10,353,006 | |||||||||
tCWABS Asset-Backed Certificates Trust,2005-11, AF4, FRN, 5.21%, 3/25/34 | United States | 2,200,739 | 2,215,780 | |||||||||
uMerrill Lynch Mortgage Investors Trust,2005-A6, 2A3, FRN, 2.857%,(1-month USD LIBOR + 0.38%), 8/25/35 | United States | 1,178,678 | 1,185,971 | |||||||||
| ||||||||||||
| 22,926,445 | ||||||||||||
| ||||||||||||
Diversified Financials 25.7% | ||||||||||||
uAmerican Express Credit Account Master Trust,2017-2, A, FRN, 2.923%,(1-month USD LIBOR + 0.45%), 9/16/24 | United States | 9,170,000 | 9,233,152 | |||||||||
c,uAMMC CLO XI Ltd., | ||||||||||||
2012-11A, BR2, 144A, FRN, 4.183%,(3-month USD LIBOR + 1.60%), 4/30/31 | United States | 3,000,000 | 2,958,930 | |||||||||
2012-11A, CR2, 144A, FRN, 4.483%,(3-month USD LIBOR + 1.90%), 4/30/31 | United States | 1,000,000 | 961,740 | |||||||||
2012-11A, DR2, 144A, FRN, 5.433%,(3-month USD LIBOR + 2.85%), 4/30/31 | United States | 1,450,000 | 1,381,981 | |||||||||
28 | Annual Report | franklintempleton.com | ||
FRANKLIN STRATEGIC SERIES
CONSOLIDATED STATEMENT OF INVESTMENTS
Franklin Strategic Income Fund(continued)
| Country | Principal Amount* | Value | ||||||||||
Asset-Backed Securities and Commercial Mortgage-Backed Securities(continued) | ||||||||||||
Diversified Financials(continued) | ||||||||||||
c,uAntares CLO Ltd.,2018-1A, B, 144A, FRN, 4.242%,(3-month USD LIBOR + 1.65%), 4/20/31 | United States | 17,500,000 | $ 17,078,775 | |||||||||
c,uAres CLO Ltd.,2018-48A, D, 144A, FRN, 5.292%,(3-month USD LIBOR + 2.70%), 7/20/30 | United States | 3,550,000 | 3,398,415 | |||||||||
c,tARES L CLO Ltd.,2018-50A, B, 144A, FRN, 4.478%, 1/15/32 | United States | 15,700,000 | 15,659,023 | |||||||||
c,tARES LII CLO Ltd., | ||||||||||||
2019-52A, A2, 144A, FRN, 4.259%, 4/22/31 | United States | 2,522,358 | 2,513,605 | |||||||||
2019-52A, B, 144A, FRN, 4.459%, 4/22/31 | United States | 3,500,000 | 3,487,155 | |||||||||
2019-52A, C, 144A, FRN, 5.289%, 4/22/31 | United States | 1,000,000 | 998,350 | |||||||||
2019-52A, D, 144A, FRN, 6.559%, 4/22/31 | United States | 1,703,704 | 1,697,111 | |||||||||
c,uAres XLIII CLO Ltd.,2017-43A, A, 144A, FRN, 3.817%,(3-month USD LIBOR + 1.22%), 10/15/29 | United States | 3,870,000 | 3,867,214 | |||||||||
c,tAtrium XIV LLC, 14A, D, 144A, FRN, 5.551%, 8/23/30 | United States | 3,750,000 | 3,580,988 | |||||||||
Banc of America Commercial Mortgage Trust, | ||||||||||||
2015-UBS7, A3, 3.441%, 9/15/48 | United States | 10,920,000 | 11,165,466 | |||||||||
2015-UBS7, A4, 3.705%, 9/15/48 | United States | 12,450,000 | 12,908,914 | |||||||||
t2015-UBS7, B, FRN, 4.507%, 9/15/48 | United States | 6,740,000 | 7,148,572 | |||||||||
c,tBBC Middle Market CLO LLC,2018-1A, A2, 144A, FRN, 4.742%, 10/20/30 | United States | 6,300,000 | 6,092,919 | |||||||||
c,tBCAP LLC Trust,2009-RR1, 2A2, 144A, FRN, 4.831%, 5/26/35 | United States | 6,191,781 | 6,043,097 | |||||||||
cBetony CLO 2 Ltd., | ||||||||||||
t2018-1A, A1, 144A, FRN, 3.663%, 4/30/31 | United States | 15,300,000 | 15,185,250 | |||||||||
u2018-1A, C, 144A, FRN, 5.483%,(3-month USD LIBOR + 2.90%), 4/30/31 | United States | 4,000,000 | 3,831,320 | |||||||||
c,tBlueMountain CLO Ltd., | ||||||||||||
2012-2A, BR2, 144A, FRN, 4.094%, 11/20/28 | United States | 6,710,000 | 6,691,682 | |||||||||
2012-2A, CR2, 144A, FRN, 4.644%, 11/20/28 | United States | 2,730,000 | 2,715,176 | |||||||||
2014-2A, CR2, 144A, FRN, 4.792%, 10/20/30 | United States | 3,800,000 | 3,759,758 | |||||||||
2018-1A, D, 144A, FRN, 5.633%, 7/30/30 | United States | 5,000,000 | 4,883,700 | |||||||||
c,uBlueMountain Fuji U.S. CLO II Ltd.,2017-2A, A1A, 144A, FRN, 3.792%,(3-month USD LIBOR + 1.20%), 10/20/30 | United States | 4,200,000 | 4,203,192 | |||||||||
c,uBlueMountain Fuji U.S. CLO III Ltd.,2017-3A, A2, 144A, FRN, 3.747%,(3-month USD LIBOR + 1.15%), 1/15/30 | United States | 4,600,000 | 4,504,412 | |||||||||
cBRAVO Residential Funding Trust,2019-1, A1C, 144A, 3.50%, 3/25/58 | United States | 12,000,000 | 12,006,120 | |||||||||
cBurnham Park CLO Ltd., | ||||||||||||
u2016-1A, A, 144A, FRN, 4.022%,(3-month USD LIBOR + 1.43%), 10/20/29 | United States | 4,590,000 | 4,607,442 | |||||||||
t2016-1A, BR, 144A, FRN, 4.092%, 10/20/29 | United States | 3,500,000 | 3,453,135 | |||||||||
t2016-1A, CR, 144A, FRN, 4.742%, 10/20/29 | United States | 4,000,000 | 3,936,120 | |||||||||
c,tButtermilk Park CLO Ltd.,2018-1A, C, 144A, FRN, 4.697%, 10/15/31 | United States | 9,730,950 | 9,455,856 | |||||||||
uCapital One Multi-Asset Execution Trust, | ||||||||||||
2016-A2, A2, FRN, 3.103%,(1-month USD LIBOR + 0.63%), 2/15/24 | United States | 44,033,000 | 44,408,553 | |||||||||
2016-A7, A7, FRN, 2.983%,(1-month USD LIBOR + 0.51%), 9/16/24 | United States | 4,400,000 | 4,436,176 | |||||||||
franklintempleton.com | Annual Report | 29 | ||
FRANKLIN STRATEGIC SERIES
CONSOLIDATED STATEMENT OF INVESTMENTS
Franklin Strategic Income Fund(continued)
| Country | Principal Amount* | Value | ||||||||||
Asset-Backed Securities and Commercial Mortgage-Backed Securities(continued) | ||||||||||||
Diversified Financials(continued) | ||||||||||||
c,uCarlyle Global Market Strategies CLO Ltd.,2014-4RA, C, 144A, FRN, 5.497%,(3-month USD LIBOR + 2.90%), 7/15/30 | United States | 3,000,000 | $ 2,853,750 | |||||||||
c,tCarlyle GMS Finance MM CLO LLC,2015-1A, A2R, 144A, FRN, 4.797%, 10/15/31 | United States | 12,000,000 | 11,547,480 | |||||||||
c,uCarlyle U.S. CLO Ltd.,2017-2A, A1B, 144A, FRN, 3.812%,(3-month USD LIBOR + 1.22%), 7/20/31 | United States | 8,500,000 | 8,483,850 | |||||||||
c,uCatamaran CLO Ltd.,2014-2A, BR, 144A, FRN, 5.551%,(3-month USD LIBOR + 2.95%), 10/18/26 | United States | 11,770,000 | 11,773,884 | |||||||||
c,tCGRBS Commercial Mortgage Trust, 2013-VN05, C, 144A, FRN, 3.703%, 3/13/35 | United States | 7,700,000 | 7,811,122 | |||||||||
c,tCIM Trust, 2019-INV1, A1, 144A, FRN, 4.00%, 2/25/49 | United States | 17,904,129 | 18,237,503 | |||||||||
tCitibank Credit Card Issuance Trust, | ||||||||||||
2016-A3, A3, FRN, 2.964%, 12/07/23 | United States | 4,800,000 | 4,835,859 | |||||||||
2017-A7, A7, FRN, 2.844%, 8/08/24 | United States | 36,060,000 | 36,162,627 | |||||||||
c,tCole Park CLO Ltd.,2015-1A, BR, 144A, FRN, 4.192%, 10/20/28 | United States | 3,530,000 | 3,513,833 | |||||||||
tCOMM Mortgage Trust, 2014-CR19, B, FRN, 4.703%, 8/10/47 | United States | 7,700,000 | 8,094,148 | |||||||||
c,tConsumer Loan Underlying Bond CLUB Certificate Issuer Trust I, | ||||||||||||
2018-29, PT, 144A, FRN, 23.67%, 12/15/43 | United States | 3,230,233 | 2,713,086 | |||||||||
2019-S1, PT, 144A, FRN, 17.91%, 4/15/44 | United States | 9,354,058 | 8,753,905 | |||||||||
2019-S2, PT, 144A, FRN, 13.852%, 5/16/44 | United States | 6,394,719 | 6,081,243 | |||||||||
2018-14, PT, 144A, FRN, 9.61%, 9/16/41 | United States | 7,861,776 | 7,873,607 | |||||||||
cCore Industrial Trust, 2015-CALW, A, 144A, 3.04%, 2/10/34 | United States | 14,291,733 | 14,473,393 | |||||||||
tDiscover Card Execution Note Trust,2017-A7, A7, FRN, 2.833%, 4/15/25 | United States | 5,360,000 | 5,367,314 | |||||||||
c,tDryden 38 Senior Loan Fund, | ||||||||||||
2015-38A, CR, 144A, FRN, 4.597%, 7/15/30 | United States | 7,186,000 | 7,054,568 | |||||||||
2015-38A, DR, 144A, FRN, 5.597%, 7/15/30 | United States | 4,556,000 | 4,446,519 | |||||||||
c,uDryden 42 Senior Loan Fund,2016-42A, DR, 144A, FRN, 5.527%,(3-month USD LIBOR + 2.93%), 7/15/30 | United States | 8,400,000 | 8,125,068 | |||||||||
c,uDryden 55 CLO Ltd., | ||||||||||||
2018-55A, A1, 144A, FRN, 3.617%,(3-month USD LIBOR + 1.02%), 4/15/31 | United States | 6,000,000 | 5,934,840 | |||||||||
2018-55A, D, 144A, FRN, 5.447%,(3-month USD LIBOR + 2.85%), 4/15/31 | United States | 3,000,000 | 2,880,270 | |||||||||
c,uDryden 64 CLO Ltd., | ||||||||||||
2018-64A, A, 144A, FRN, 3.571%,(3-month USD LIBOR + 0.97%), 4/18/31 | United States | 5,070,000 | 4,997,702 | |||||||||
2018-64A, D, 144A, FRN, 5.251%,(3-month USD LIBOR + 2.65%), 4/18/31 | United States | 2,200,000 | 2,128,500 | |||||||||
c,tEaton Vance CLO Ltd., | ||||||||||||
2014-1RA, C, 144A, FRN, 4.697%, 7/15/30 | United States | 1,972,575 | 1,905,823 | |||||||||
2014-1RA, D, 144A, FRN, 5.647%, 7/15/30 | United States | 3,653,850 | 3,557,461 | |||||||||
30 | Annual Report | franklintempleton.com | ||
FRANKLIN STRATEGIC SERIES
CONSOLIDATED STATEMENT OF INVESTMENTS
Franklin Strategic Income Fund(continued)
| Country | Principal Amount* | Value | ||||||||||||||
Asset-Backed Securities and Commercial Mortgage-Backed Securities (continued) | ||||||||||||||||
Diversified Financials(continued) | ||||||||||||||||
c,t Eleven Madison Trust Mortgage Trust, 2015-11MD, A, 144A, FRN, 3.673%, 9/10/35 | United States | 14,920,000 | $ | 15,379,794 | ||||||||||||
FHLMC Structured Agency Credit Risk Debt Notes, | ||||||||||||||||
u2013-DN2, M2, FRN, 6.727%,(1-month USD LIBOR + 4.25%), 11/25/23 | United States | 13,084,231 | 14,289,648 | |||||||||||||
u2014-DN1, M2, FRN, 4.677%,(1-month USD LIBOR + 2.20%), 2/25/24 | United States | 7,444,438 | 7,571,085 | |||||||||||||
u2014-DN2, M3, FRN, 6.077%,(1-month USD LIBOR + 3.60%), 4/25/24 | United States | 21,379,000 | 23,031,620 | |||||||||||||
u2014-DN3, M3, FRN, 6.477%,(1-month USD LIBOR + 4.00%), 8/25/24 | United States | 1,181,806 | 1,277,522 | |||||||||||||
u2014-DN4, M3, FRN, 7.027%,(1-month USD LIBOR + 4.55%), 10/25/24 | United States | 15,408,935 | 16,891,774 | |||||||||||||
u2014-HQ1, M3, FRN, 6.577%,(1-month USD LIBOR + 4.10%), 8/25/24 | United States | 3,564,368 | 3,867,324 | |||||||||||||
u2014-HQ2, M2, FRN, 4.677%,(1-month USD LIBOR + 2.20%), 9/25/24 | United States | 9,044,165 | 9,218,402 | |||||||||||||
u2014-HQ3, M3, FRN, 7.227%,(1-month USD LIBOR + 4.75%), 10/25/24 | United States | 7,038,601 | 7,741,379 | |||||||||||||
u2015-DNA1, M3, FRN, 5.777%,(1-month USD LIBOR + 3.30%), 10/25/27 | United States | 2,830,000 | 3,066,956 | |||||||||||||
u2015-DNA3, M3, FRN, 7.177%,(1-month USD LIBOR + 4.70%), 4/25/28 | United States | 18,411,581 | 21,152,925 | |||||||||||||
u2015-HQ1, M3, FRN, 6.277%,(1-month USD LIBOR + 3.80%), 3/25/25 | United States | 9,211,480 | 9,717,630 | |||||||||||||
u2015-HQA1, M3, FRN, 7.177%,(1-month USD LIBOR + 4.70%), 3/25/28 | United States | 18,830,000 | 21,133,521 | |||||||||||||
u2016-DNA2, M3, FRN, 7.127%,(1-month USD LIBOR + 4.65%), 10/25/28 | United States | 17,820,000 | 19,850,559 | |||||||||||||
t2017-DNA1, M2, FRN, 5.727%, 7/25/29 | United States | 7,300,000 | 7,820,056 | |||||||||||||
t2017-DNA2, M2, FRN, 5.927%, 10/25/29 | United States | 5,868,312 | 6,362,107 | |||||||||||||
u2017-DNA3, M2, FRN, 4.977%,(1-month USD LIBOR + 2.50%), 3/25/30 | United States | 26,312,269 | 27,154,193 | |||||||||||||
t2017-HQA1, M2, FRN, 6.027%, 8/25/29 | United States | 28,226,000 | 30,320,191 | |||||||||||||
c,uFlagship CLO VIII Ltd., | ||||||||||||||||
2014-8A, ARR, 144A, FRN, 3.451%,(3-month USD LIBOR + 0.85%), 1/16/26 | United States | 6,392,792 | 6,382,308 | |||||||||||||
2014-8A, DR, 144A, FRN, 5.651%,(3-month USD LIBOR + 3.05%), 1/16/26 | United States | 3,000,000 | 2,982,690 | |||||||||||||
FNMA Connecticut Avenue Securities, | ||||||||||||||||
u2013-C01, M2, FRN, 7.727%,(1-month USD LIBOR + 5.25%), 10/25/23 | United States | 16,098,592 | 18,152,176 | |||||||||||||
u2014-C01, M2, FRN, 6.877%,(1-month USD LIBOR + 4.40%), 1/25/24 | United States | 17,420,000 | 19,432,210 | |||||||||||||
u2014-C02, 1M2, FRN, 5.077%,(1-month USD LIBOR + 2.60%), 5/25/24 | United States | 14,572,000 | 15,291,309 | |||||||||||||
u2014-C03, 1M2, FRN, 5.477%,(1-month USD LIBOR + 3.00%), 7/25/24 | United States | 32,953,958 | 35,243,388 | |||||||||||||
u2014-C03, 2M2, FRN, 5.377%,(1-month USD LIBOR + 2.90%), 7/25/24 | United States | 4,386,698 | 4,614,349 | |||||||||||||
franklintempleton.com | Annual Report | 31 | ||
FRANKLIN STRATEGIC SERIES
CONSOLIDATED STATEMENT OF INVESTMENTS
Franklin Strategic Income Fund(continued)
| Country | Principal Amount* | Value | ||||||||||||||
Asset-Backed Securities and Commercial Mortgage-Backed Securities (continued) | ||||||||||||||||
Diversified Financials(continued) | ||||||||||||||||
FNMA Connecticut Avenue Securities, (continued) | ||||||||||||||||
u2015-C01, 1M2, FRN, 6.777%,(1-month USD LIBOR + 4.30%), 2/25/25 | United States | 8,812,977 | $ | 9,579,582 | ||||||||||||
u2015-C01, 2M2, FRN, 7.027%,(1-month USD LIBOR + 4.55%), 2/25/25 | United States | 11,589,457 | 12,467,952 | |||||||||||||
u2015-C02, 1M2, FRN, 6.477%,(1-month USD LIBOR + 4.00%), 5/25/25 | United States | 25,268,655 | 27,229,907 | |||||||||||||
u2015-C02, 2M2, FRN, 6.477%,(1-month USD LIBOR + 4.00%), 5/25/25 | United States | 13,181,668 | 14,048,092 | |||||||||||||
u2015-C03, 1M2, FRN, 7.477%,(1-month USD LIBOR + 5.00%), 7/25/25 | United States | 30,408,863 | 33,811,372 | |||||||||||||
u2015-C03, 2M2, FRN, 7.477%,(1-month USD LIBOR + 5.00%), 7/25/25 | United States | 16,336,499 | 17,986,243 | |||||||||||||
t2016-C04, 1M2, FRN, 6.727%, 1/25/29 | United States | 9,910,000 | 10,914,757 | |||||||||||||
u2017-C01, 1M2, FRN, 6.027%,(1-month USD LIBOR + 3.55%), 7/25/29 | United States | 22,910,000 | 24,619,269 | |||||||||||||
t2017-C03, 1M2, FRN, 5.477%, 10/25/29 | United States | 9,290,000 | 9,877,213 | |||||||||||||
t2017-C03, 2M2, FRN, 5.327%, 11/25/29 | United States | 5,225,499 | 5,441,379 | |||||||||||||
cGalaxy XVIII CLO Ltd., | ||||||||||||||||
t2018-28A, A2, 144A, FRN, 3.667%, 7/15/31 | United States | 9,500,000 | 9,453,260 | |||||||||||||
u2018-28A, C, 144A, FRN, 4.547%,(3-month USD LIBOR + 1.95%), 7/15/31 | United States | 3,070,000 | 2,965,313 | |||||||||||||
c,tGalaxy XXV CLO Ltd.,2018-25A, D, 144A, FRN, 5.68%, 10/25/31 | United States | 4,734,850 | 4,591,952 | |||||||||||||
c,tGalaxy XXVI CLO Ltd.,2018-26A, A, 144A, FRN, 3.852%, 11/22/31 | United States | 7,600,000 | 7,550,524 | |||||||||||||
c,uGalaxy XXVII CLO Ltd.,2018-27A, C, 144A, FRN, 5.433%,(3-month USD LIBOR + 2.75%), 5/16/31 | United States | 5,750,000 | 5,505,855 | |||||||||||||
GS Mortgage Securities Trust, | ||||||||||||||||
t2016-GS3, B, FRN, 3.395%, 10/10/49 | United States | 8,037,000 | 8,003,085 | |||||||||||||
2017-GS6, B, 3.869%, 5/10/50 | United States | 7,700,000 | 7,865,060 | |||||||||||||
c,tHPS Loan Management Ltd.,2013A-18, C, 144A, FRN, 4.747%, 10/15/30 | United States | 4,950,000 | 4,808,381 | |||||||||||||
c,tJ.P. Morgan Chase Commercial Mortgage Securities Trust, 2016-NINE, B, 144A, FRN, 2.949%, 10/06/38 | United States | 9,600,000 | 9,058,669 | |||||||||||||
JPMCC Commercial Mortgage Securities Trust,2017-JP6, B, 3.946%, 7/15/50 | United States | 9,250,000 | 9,454,194 | |||||||||||||
c,t LCM XVI LP, | ||||||||||||||||
2016A, A2R, 144A, FRN, 3.777%, 10/15/31 | United States | 7,655,557 | 7,610,236 | |||||||||||||
2016A, BR2, 144A, FRN, 4.347%, 10/15/31 | United States | 13,525,832 | 13,514,200 | |||||||||||||
c,t LCM XVII LP, | ||||||||||||||||
2017A, BRR, 144A, FRN, 4.197%, 10/15/31 | United States | 4,590,000 | 4,540,933 | |||||||||||||
2017A, CRR, 144A, FRN, 4.697%, 10/15/31 | United States | 4,240,000 | 4,159,737 | |||||||||||||
32 | Annual Report | franklintempleton.com | ||
FRANKLIN STRATEGIC SERIES
CONSOLIDATED STATEMENT OF INVESTMENTS
Franklin Strategic Income Fund(continued)
| Country | Principal Amount* | Value | ||||||||||||||
Asset-Backed Securities and Commercial Mortgage-Backed Securities (continued) | ||||||||||||||||
Diversified Financials (continued) | ||||||||||||||||
c,uLCM XVIII LP, 2018A, DR, 144A, FRN, 5.392%,(3-month USD LIBOR + 2.80%), 4/20/31 | United States | 6,860,000 | $ | 6,587,384 | ||||||||||||
c,uLCM XXIV Ltd., 24A, A, 144A, FRN, 3.902%,(3-month USD LIBOR + 1.31%), 3/20/30 | United States | 4,300,000 | 4,310,793 | |||||||||||||
c,u Madison Park Funding XXIII Ltd., | ||||||||||||||||
2017-23A, B, 144A, FRN, 4.282%,(3-month USD LIBOR + 1.70%), 7/27/30 | United States | 2,400,000 | 2,397,288 | |||||||||||||
2017-23A, C, 144A, FRN, 4.932%,(3-month USD LIBOR + 2.35%), 7/27/30 | United States | 5,000,000 | 5,006,850 | |||||||||||||
c,tMagnetite Ltd., 2015-14RA, A1, 144A, FRN, 3.721%, 10/18/31 | United States | 2,000,000 | 1,982,880 | |||||||||||||
c,tMill City Mortgage Loan Trust,2018-4, A1B, 144A, FRN, 3.50%, 4/25/66 | United States | 16,720,000 | 16,852,256 | |||||||||||||
u MortgageIT Trust, | ||||||||||||||||
2004-1, A2, FRN, 3.377%,(1-month USD LIBOR + 0.90%), 11/25/34 | United States | 1,888,004 | 1,892,722 | |||||||||||||
2005-5, A1, FRN, 2.997%,(1-month USD LIBOR + 0.26%), 12/25/35 | United States | 1,734,780 | 1,725,400 | |||||||||||||
c,tMountain View Funding CLO XIV Ltd., | ||||||||||||||||
2019-1A, A1, 144A, FRN, 4.058%, 4/15/29 | United States | 5,000,000 | 5,007,600 | |||||||||||||
2019-1A, C, 144A, FRN, 5.518%, 4/15/29 | United States | 4,500,000 | 4,468,770 | |||||||||||||
c,t Neuberger Berman CLO Ltd.,2016-22A, CR, 144A, FRN, 4.788%, 10/17/30 | United States | 2,129,630 | 2,095,705 | |||||||||||||
c,uNZCG Funding Ltd.,2015-1A, A2R, 144A, FRN, 4.196%,(3-month USD LIBOR + 1.55%), 2/26/31 | United States | 15,500,000 | 15,033,760 | |||||||||||||
c,tOctagon Investment Partners 24 Ltd.,2015-1A, BS, 144A, FRN, 4.529%, 4/21/31 | United States | 4,485,000 | 4,477,151 | |||||||||||||
c,t Octagon Investment Partners 28 Ltd., | ||||||||||||||||
2016-1A, A2R, 144A, FRN, 4.031%, 10/24/30 | United States | 10,000,000 | 10,020,600 | |||||||||||||
2016-1A, BR, 144A, FRN, 4.381%, 10/24/30 | United States | 3,914,730 | 3,923,264 | |||||||||||||
c,uOctagon Investment Partners 30 Ltd., 144A, FRN, 3.912%,(3-month USD LIBOR + 1.32%), 3/17/30 | United States | 4,300,000 | 4,293,550 | |||||||||||||
c,uOctagon Investment Partners 37 Ltd.,2018-2A, C, 144A, FRN, 5.43%,(3-month USD LIBOR + 2.85%), 7/25/30 | United States | 4,000,000 | 3,847,880 | |||||||||||||
c,tOctagon Investment Partners 38 Ltd.,2018-1A, C, 144A, FRN, 5.542%, 7/20/30 | United States | 5,000,000 | 4,844,400 | |||||||||||||
c,uOctagon Investment Partners XVI Ltd.,2013-1A, DR, 144A, FRN, 5.588%,(3-month USD LIBOR + 3.00%), 7/17/30 | United States | 6,000,000 | 5,833,260 | |||||||||||||
c,uOctagon Investment Partners XX Ltd.,2014-1A, AR, 144A, FRN, 3.828%,(3-month USD LIBOR + 1.13%), 8/12/26 | United States | 4,524,140 | 4,529,931 | |||||||||||||
c,u Octagon Investment Partners XXIII Ltd., | ||||||||||||||||
2015-1A, BR, 144A, FRN, 3.797%,(3-month USD LIBOR + 1.20%), 7/15/27 | United States | 4,590,000 | 4,565,398 | |||||||||||||
2015-1A, DR, 144A, FRN, 5.147%,(3-month USD LIBOR + 2.55%), 7/15/27 | United States | 6,400,000 | 6,316,800 | |||||||||||||
uOpteum Mortgage Acceptance Corp. Trust,2005-4, 1APT, FRN, 2.787%,(1-month USD LIBOR + 0.31%), 11/25/35 | United States | 2,060,638 | 2,055,612 | |||||||||||||
c,tStrata CLO I Ltd.,2018-1A, B, 144A, FRN, 5.016%, 1/15/31 | United States | 14,100,000 | 14,209,275 | |||||||||||||
uStructured Asset Securities Corp.,2005-2XS, 2A2, FRN, 4.002%,(1-month USD LIBOR + 1.50%), 2/25/35 | United States | 1,942,657 | 1,941,992 | |||||||||||||
tThornburg Mortgage Securities Trust,2005-1, A3, FRN, 4.576%, 4/25/45 | United States | 2,521,594 | 2,562,688 | |||||||||||||
franklintempleton.com | Annual Report | 33 | ||
FRANKLIN STRATEGIC SERIES
CONSOLIDATED STATEMENT OF INVESTMENTS
Franklin Strategic Income Fund(continued)
| Country | Principal Amount* | Value | ||||||||||||||
Asset-Backed Securities and Commercial Mortgage-Backed Securities(continued) | ||||||||||||||||
Diversified Financials (continued) | ||||||||||||||||
c Voya CLO Ltd., | ||||||||||||||||
t2013-2A, A2AR, 144A, FRN, 3.98%, 4/25/31 | United States | 2,200,000 | $ | 2,147,354 | ||||||||||||
u2013-2A, BR, 144A, FRN, 4.43%,(3-month USD LIBOR + 1.85%), 4/25/31 | United States | 5,770,000 | 5,567,819 | |||||||||||||
u2014-1A, CR2, 144A, FRN, 5.401%,(3-month USD LIBOR + 2.80%), 4/18/31 | United States | 8,000,000 | 7,674,640 | |||||||||||||
t2015-2A, BR, 144A, FRN, 4.092%, 7/23/27 | United States | 9,290,000 | 9,239,927 | |||||||||||||
t2016-3A, A1R, 144A, FRN, 3.791%, 10/18/31 | United States | 10,000,000 | 9,955,300 | |||||||||||||
u2017-2A, B, 144A, FRN, 4.947%,(3-month USD LIBOR + 2.35%), 6/07/30 | United States | 19,200,000 | 19,206,144 | |||||||||||||
u2018-2A, D, 144A, FRN, 5.347%,(3-month USD LIBOR + 2.75%), 7/15/31 | United States | 2,900,000 | 2,773,270 | |||||||||||||
Wells Fargo Mortgage Backed Securities Trust, | ||||||||||||||||
t2004-W, A9, FRN, 4.845%, 11/25/34 | United States | 990,234 | 1,025,930 | |||||||||||||
2007-3, 3A1, 5.50%, 4/25/22 | United States | 163,357 | 166,199 | |||||||||||||
|
| |||||||||||||||
| 1,249,402,727 | ||||||||||||||||
|
| |||||||||||||||
Total Asset-Backed Securities and Commercial | 1,272,329,172 | |||||||||||||||
|
| |||||||||||||||
Mortgage-Backed Securities 9.4% | ||||||||||||||||
vFederal Home Loan Mortgage Corp. (FHLMC) Adjustable Rate 0.0%† | ||||||||||||||||
FHLMC, 4.929%, (US 1 Year CMTT-Note +/- MBS Margin), 1/01/33 | United States | 17,487 | 18,066 | |||||||||||||
|
| |||||||||||||||
Federal Home Loan Mortgage Corp. (FHLMC) Fixed Rate 4.6% | ||||||||||||||||
FHLMC Gold 15 Year, 4.50%, 6/01/19 - 9/01/19 | United States | 6,143 | 6,273 | |||||||||||||
FHLMC Gold 15 Year, 5.00%, 6/01/19 - 7/01/22 | United States | 49,166 | 50,593 | |||||||||||||
FHLMC Gold 30 Year, 3.50%, 12/01/47 | United States | 13,898,119 | 14,073,340 | |||||||||||||
wFHLMC Gold 30 Year, 3.50%, 4/01/49 | United States | 59,600,000 | 60,186,233 | |||||||||||||
wFHLMC Gold 30 Year, 4.00%, 4/01/49 | United States | 117,450,000 | 120,647,468 | |||||||||||||
FHLMC Gold 30 Year, 4.50%, 10/01/40 | United States | 146,926 | 156,330 | |||||||||||||
wFHLMC Gold 30 Year, 4.50%, 4/01/49 | United States | 23,000,000 | 23,973,906 | |||||||||||||
FHLMC Gold 30 Year, 5.00%, 5/01/27 - 2/01/38 | United States | 1,141,747 | 1,219,618 | |||||||||||||
FHLMC Gold 30 Year, 5.50%, 6/01/33 - 6/01/36 | United States | 799,234 | 869,588 | |||||||||||||
FHLMC Gold 30 Year, 6.00%, 6/01/33 - 6/01/37 | United States | 269,796 | 295,547 | |||||||||||||
FHLMC Gold 30 Year, 6.50%, 10/01/21 - 6/01/36 | United States | 126,003 | 139,796 | |||||||||||||
FHLMC Gold 30 Year, 7.00%, 9/01/21 - 8/01/32 | United States | 22,951 | 23,837 | |||||||||||||
FHLMC Gold 30 Year, 7.50%, 1/01/26 - 1/01/31 | United States | 5,534 | 6,398 | |||||||||||||
FHLMC Gold 30 Year, 8.00%, 11/01/25 - 1/01/26 | United States | 72 | 72 | |||||||||||||
FHLMC Gold 30 Year, 9.00%, 12/01/24 | United States | 64 | 70 | |||||||||||||
|
| |||||||||||||||
| 221,649,069 | ||||||||||||||||
|
| |||||||||||||||
vFederal National Mortgage Association (FNMA) Adjustable Rate 0.0%† | ||||||||||||||||
FNMA, 4.622%, (US 1 Year CMTT-Note +/- MBS Margin), 12/01/34 | United States | 119,260 | 125,344 | |||||||||||||
|
| |||||||||||||||
34 | Annual Report | franklintempleton.com | ||
FRANKLIN STRATEGIC SERIES
CONSOLIDATED STATEMENT OF INVESTMENTS
Franklin Strategic Income Fund(continued)
| Country | Principal Amount* | Value | ||||||||||||||
Mortgage-Backed Securities(continued) | ||||||||||||||||
Federal National Mortgage Association (FNMA) Fixed Rate 3.3% | ||||||||||||||||
FNMA 15 Year, 2.50%, 7/01/27 | United States | 268,938 | $ | 267,724 | ||||||||||||
FNMA 15 Year, 4.50%, 3/01/20 | United States | 7,054 | 7,182 | |||||||||||||
FNMA 15 Year, 5.50%, 3/01/21 - 4/01/22 | United States | 29,812 | 30,051 | |||||||||||||
FNMA 30 Year, 3.00%, 9/01/48 | United States | 41,532,980 | 41,128,192 | |||||||||||||
FNMA 30 Year, 3.50%, 11/01/47 | United States | 14,556,136 | 14,711,880 | |||||||||||||
wFNMA 30 Year, 3.50%, 4/01/49 | United States | 62,320,000 | 62,895,053 | |||||||||||||
FNMA 30 Year, 4.50%, 3/01/28 - 2/01/41 | United States | 455,864 | 481,876 | |||||||||||||
wFNMA 30 Year, 4.50%, 4/01/49 | United States | 36,000,000 | 37,462,108 | |||||||||||||
FNMA 30 Year, 5.00%, 9/01/23 - 10/01/35 | United States | 1,226,499 | 1,308,092 | |||||||||||||
FNMA 30 Year, 5.50%, 9/01/33 - 12/01/35 | United States | 1,096,223 | 1,200,557 | |||||||||||||
FNMA 30 Year, 6.00%, 6/01/34 - 5/01/38 | United States | 2,302,292 | 2,546,608 | |||||||||||||
FNMA 30 Year, 6.50%, 3/01/28 - 10/01/37 | United States | 320,753 | 362,080 | |||||||||||||
FNMA 30 Year, 7.50%, 10/01/29 | United States | 5,229 | 6,092 | |||||||||||||
FNMA 30 Year, 8.00%, 1/01/25 - 5/01/26 | United States | 2,792 | 3,091 | |||||||||||||
|
| |||||||||||||||
| 162,410,586 | ||||||||||||||||
|
| |||||||||||||||
Government National Mortgage Association (GNMA) Fixed Rate 1.5% | ||||||||||||||||
GNMA I SF 30 Year, 4.50%, 9/20/48 | United States | 29,010,876 | 30,182,729 | |||||||||||||
GNMA I SF 30 Year, 5.00%, 6/15/34 - 7/15/34 | United States | 151,466 | 162,555 | |||||||||||||
GNMA I SF 30 Year, 5.50%, 2/15/33 - 6/15/36 | United States | 363,608 | 392,855 | |||||||||||||
GNMA I SF 30 Year, 6.00%, 8/15/36 | United States | 22,978 | 25,484 | |||||||||||||
GNMA I SF 30 Year, 6.50%, 2/15/29 - 3/15/32 | United States | 39,310 | 42,841 | |||||||||||||
GNMA I SF 30 Year, 7.00%, 11/15/27 - 5/15/28 | United States | 10,194 | 10,411 | |||||||||||||
GNMA I SF 30 Year, 7.50%, 9/15/23 - 5/15/27 | United States | 707 | 728 | |||||||||||||
GNMA I SF 30 Year, 8.00%, 2/15/25 - 9/15/27 | United States | 3,646 | 3,911 | |||||||||||||
GNMA I SF 30 Year, 8.50%, 8/15/24 | United States | 47 | 49 | |||||||||||||
GNMA I SF 30 Year, 9.00%, 1/15/25 | United States | 203 | 203 | |||||||||||||
GNMA I SF 30 Year, 9.50%, 6/15/25 | United States | 405 | 406 | |||||||||||||
wGNMA II SF 30 Year, 4.50%, 4/01/49 | United States | 19,000,000 | 19,703,387 | |||||||||||||
GNMA II SF 30 Year, 5.00%, 9/20/33 - 11/20/33 | United States | 204,845 | 218,980 | |||||||||||||
wGNMA II SF 30 Year, 5.00%, 4/01/49 | United States | 22,500,000 | 23,472,510 | |||||||||||||
GNMA II SF 30 Year, 5.50%, 6/20/34 | United States | 104,028 | 113,966 | |||||||||||||
GNMA II SF 30 Year, 6.00%, 11/20/34 | United States | 99,252 | 112,524 | |||||||||||||
GNMA II SF 30 Year, 6.50%, 7/20/28 - 12/20/31 | United States | 56,187 | 63,232 | |||||||||||||
GNMA II SF 30 Year, 7.50%, 4/20/32 | United States | 16,398 | 18,195 | |||||||||||||
|
| |||||||||||||||
| 74,524,966 | ||||||||||||||||
|
| |||||||||||||||
Total Mortgage-Backed Securities | 458,728,031 | |||||||||||||||
|
| |||||||||||||||
Municipal Bonds 1.8% | ||||||||||||||||
California State GO, Various Purpose, Refunding, 5.00%, 9/01/29 | United States | 17,200,000 | 20,839,004 | |||||||||||||
New York City HDC Capital Fund Grant Program Revenue, New York City Housing Authority Program, Series B1, 5.00%, 7/01/33 | United States | 3,500,000 | 3,817,205 | |||||||||||||
Orlando Health Obligated Group, 3.777%, 10/01/28 | United States | 3,870,000 | 3,924,358 | |||||||||||||
Port Authority of New York and New Jersey Revenue, Consolidated, One Hundred Ninety-First Series, 4.823%, 6/01/45 | United States | 14,165,000 | 15,195,788 | |||||||||||||
franklintempleton.com | Annual Report | 35 | ||
FRANKLIN STRATEGIC SERIES
CONSOLIDATED STATEMENT OF INVESTMENTS
Franklin Strategic Income Fund(continued)
| Country | Principal Amount* | Value | ||||||||||||||
Municipal Bonds(continued) | ||||||||||||||||
jPuerto Rico Electric Power Authority Power Revenue, | ||||||||||||||||
Series A, 6.75%, 7/01/36 | United States | 30,900,000 | $ 25,338,000 | |||||||||||||
Series XX, 5.25%, 7/01/40 | United States | 15,000,000 | 12,187,500 | |||||||||||||
San Jose RDA Successor Agency Tax Allocation, Senior, Refunding, | United States | 5,675,000 | 5,678,575 | |||||||||||||
|
| |||||||||||||||
Total Municipal Bonds (Cost $84,331,665) | 86,980,430 | |||||||||||||||
|
| |||||||||||||||
Shares/ Units | ||||||||||||||||
Escrows and Litigation Trusts 0.0%† | ||||||||||||||||
a,bMidstates Petroleum Co. Inc./Midstates Petroleum Co. LLC, Escrow Account | United States | 15,000,000 | — | |||||||||||||
a,bNewPage Corp., Litigation Trust | United States | 14,000,000 | — | |||||||||||||
a,aa,b,dRemington Outdoor Co. Inc., Litigation Units | United States | 124,500 | — | |||||||||||||
a,bT-Mobile USA Inc., Escrow Account | United States | 29,900,000 | — | |||||||||||||
aVistra Energy Corp., Escrow Account | United States | 30,000,000 | 75,000 | |||||||||||||
|
| |||||||||||||||
Total Escrows and Litigation Trusts | 75,000 | |||||||||||||||
|
| |||||||||||||||
Total Investments before Short Term | 4,922,936,149 | |||||||||||||||
|
| |||||||||||||||
| Shares | ||||||||||||||||
Short Term Investments 3.3% | ||||||||||||||||
Money Market Funds (Cost $63,183,777) 1.3% | ||||||||||||||||
e,xInstitutional Fiduciary Trust Money Market Portfolio, 2.10% | United States | 63,183,777 | 63,183,777 | |||||||||||||
|
| |||||||||||||||
Principal Amount* | ||||||||||||||||
Repurchase Agreements (Cost $97,392,171) 2.0% | ||||||||||||||||
yJoint Repurchase Agreement, 2.702%, 5/01/19 (Maturity Value $97,399,481) | ||||||||||||||||
BNP Paribas Securities Corp. (Maturity Value $73,729,459) | ||||||||||||||||
Deutsche Bank Securities Inc. (Maturity Value $19,456,520) | ||||||||||||||||
HSBC Securities (USA) Inc. (Maturity Value $4,213,502) | ||||||||||||||||
Collateralized by U.S. Government Agency Securities, 2.50% - | United States | 97,392,171 | 97,392,171 | |||||||||||||
|
| |||||||||||||||
Total Investments (Cost $5,202,675,588) 104.8% | 5,083,512,097 | |||||||||||||||
Other Assets, less Liabilities (4.8)% | (234,323,304 | ) | ||||||||||||||
|
| |||||||||||||||
Net Assets 100.0% | $4,849,188,793 | |||||||||||||||
|
| |||||||||||||||
36 | Annual Report | franklintempleton.com | ||
FRANKLIN STRATEGIC SERIES
CONSOLIDATED STATEMENT OF INVESTMENTS
Franklin Strategic Income Fund(continued)
†Rounds to less than 0.1% of net assets.
*The principal amount is stated in U.S. dollars unless otherwise indicated.
aNon-income producing.
aaSee Note 10 regarding holdings of 5% voting securities.
abThe security is owned by FT Holdings Corporation ll, a wholly-owned subsidiary of the Fund. See Note 1(h).
bFair valued using significant unobservable inputs. See Note 12 regarding fair value measurements.
cSecurity was purchased pursuant to Rule 144A under the Securities Act of 1933 and may be sold in transactions exempt from registration only to qualified institutional buyers or in a public offering registered under the Securities Act of 1933. These securities have been deemed liquid under guidelines approved by the Trust’s Board of Trustees. At April 30, 2019, the aggregate value of these securities was $1,522,931,224, representing 31.4% of net assets.
dSee Note 8 regarding restricted securities.
eSee Note 3(f) regarding investments in affiliated management investment companies.
fSecurity was purchased pursuant to Regulation S under the Securities Act of 1933, which exempts from registration securities offered and sold outside of the United States. Such a security cannot be sold in the United States without either an effective registration statement filed pursuant to the Securities Act of 1933, or pursuant to an exemption from registration. These securities have been deemed liquid under guidelines approved by the Trust’s Board of Trustees. At April 30, 2019, the aggregate value of these securities was $14,594,630, representing 0.3% of net assets.
gIncome may be received in additional securities and/or cash.
hSee Note 1(g) regarding loan participation notes.
iThe coupon rate shown represents the rate at period end.
jSee Note 7 regarding defaulted securities.
kPerpetual security with no stated maturity date.
lSee Note 1(j) regarding senior floating rate interests.
mSecurity purchased on a delayed delivery basis. See Note 1(d).
nA portion or all of the security represents an unsettled loan commitment. The coupon rate isto-be determined (TBD) at the time of settlement and will be based upon a reference index/floor plus a spread.
oPrincipal amount is stated in 1,000 Brazilian Real Units.
pRedemption price at maturity and coupon payment is adjusted for inflation. See Note 1(l).
qPrincipal amount is stated in 100 Mexican Peso Units.
rThe principal represents the notional amount. See Note 1(e) regarding value recovery instruments.
sPrincipal amount of security is adjusted for inflation. See Note 1(l).
tAdjustable rate security with an interest rate that is not based on a published reference index and spread. The rate is based on the structure of the agreement and current market conditions. The coupon rate shown represents the rate at period end.
uThe coupon rate shown represents the rate inclusive of any caps or floors, if applicable, in effect at period end.
vAdjustable Rate Mortgage-Backed Security (ARM); the rate shown is the effective rate at period end. ARM rates are not based on a published reference rate and spread, but instead pass-through weighted average interest income inclusive of any caps or floors, if applicable, from the underlying mortgage loans in which the majority of mortgages pay interest based on the index shown at their designated reset dates plus a spread, less the applicable servicing and guaranty fee (MBS margin).
wSecurity purchased on ato-be-announced (TBA) basis. See Note 1(d).
xThe rate shown is the annualizedseven-day effective yield at period end.
ySee Note 1(c) regarding joint repurchase agreement.
zThe security was issued on a discount basis with no stated coupon rate.
franklintempleton.com | Annual Report | 37 | ||
FRANKLIN STRATEGIC SERIES
CONSOLIDATED STATEMENT OF INVESTMENTS
Franklin Strategic Income Fund(continued)
At April 30, 2019, the Fund had the following futures contracts outstanding. See Note 1(e).
Futures Contracts
| Description | Type | Number of Contracts | Notional Amount* | Expiration Date | Value/ (Depreciation) | |||||||||||||||
Interest Rate Contracts | ||||||||||||||||||||
U.S. Treasury 30 Yr. Bond | Long | 310 | $ | 45,715,312 | 6/19/19 | $ 492,352 | ||||||||||||||
Ultra 10 Yr. U.S. Treasury Note | Long | 2,027 | 267,120,594 | 6/19/19 | 3,353,208 | |||||||||||||||
|
| |||||||||||||||||||
Total Futures Contracts | $3,845,560 | |||||||||||||||||||
|
| |||||||||||||||||||
*As of period end.
At April 30, 2019, the Fund had the following forward exchange contracts outstanding. See Note 1(e).
Forward Exchange Contracts
| Currency | Counterpartya | Type | Quantity | Contract Amount | Settlement Date | Unrealized Appreciation | Unrealized Depreciation | |||||||||||||||||||||
OTC Forward Exchange Contracts | ||||||||||||||||||||||||||||
Australian Dollar | JPHQ | Buy | 6,900,000 | $ | 4,894,860 | 5/10/19 | $ — | $ | (27,380 | ) | ||||||||||||||||||
Australian Dollar | JPHQ | Sell | 19,500,000 | 13,949,266 | 5/10/19 | 193,344 | — | |||||||||||||||||||||
Norwegian Krone | JPHQ | Buy | 137,300,000 | 15,944,907 | 5/20/19 | — | (17,807 | ) | ||||||||||||||||||||
Norwegian Krone | JPHQ | Sell | 137,300,000 | 16,187,659 | 5/20/19 | 260,559 | — | |||||||||||||||||||||
Indonesian Rupiah | JPHQ | Buy | 40,000,000,000 | 2,772,003 | 6/20/19 | 19,490 | — | |||||||||||||||||||||
Indonesian Rupiah | JPHQ | Sell | 246,000,000,000 | 17,030,114 | 6/20/19 | — | (137,567 | ) | ||||||||||||||||||||
Indian Rupee | DBAB | Buy | 1,326,000,000 | 18,317,447 | 6/21/19 | 586,342 | — | |||||||||||||||||||||
Indian Rupee | DBAB | Sell | 417,000,000 | 5,962,253 | 6/21/19 | 17,397 | — | |||||||||||||||||||||
Indian Rupee | DBAB | Sell | 909,000,000 | 12,937,660 | 6/21/19 | — | (21,272 | ) | ||||||||||||||||||||
Indian Rupee | JPHQ | Buy | 442,000,000 | 6,090,671 | 6/21/19 | 210,592 | — | |||||||||||||||||||||
Indian Rupee | JPHQ | Sell | 442,000,000 | 6,325,581 | 6/21/19 | 24,318 | — | |||||||||||||||||||||
Mexican Peso | JPHQ | Buy | 273,200,000 | 14,079,208 | 6/21/19 | 213,731 | — | |||||||||||||||||||||
Mexican Peso | JPHQ | Sell | 75,000,000 | 3,939,076 | 6/21/19 | 15,319 | — | |||||||||||||||||||||
Mexican Peso | JPHQ | Sell | 198,200,000 | 10,340,798 | 6/21/19 | — | (28,384 | ) | ||||||||||||||||||||
South Korean Won | JPHQ | Sell | 18,600,000,000 | 16,696,589 | 6/21/19 | 694,799 | — | |||||||||||||||||||||
Brazilian Real | JPHQ | Sell | 30,400,000 | 8,105,370 | 6/24/19 | 379,830 | — | |||||||||||||||||||||
Australian Dollar | DBAB | Sell | 3,000,000 | 2,149,200 | 7/26/19 | 28,876 | — | |||||||||||||||||||||
Canadian Dollar | JPHQ | Sell | 15,200,000 | 11,492,428 | 7/26/19 | 119,298 | — | |||||||||||||||||||||
British Pound | JPHQ | Sell | 10,000,000 | 13,144,300 | 9/18/19 | 10,288 | — | |||||||||||||||||||||
Canadian Dollar | JPHQ | Buy | 6,500,000 | 4,855,812 | 9/18/19 | 13,422 | — | |||||||||||||||||||||
Canadian Dollar | JPHQ | Sell | 16,900,000 | 12,708,764 | 9/18/19 | 48,754 | — | |||||||||||||||||||||
Canadian Dollar | JPHQ | Sell | 27,000,000 | 20,192,653 | 9/18/19 | — | (33,399 | ) | ||||||||||||||||||||
Euro | JPHQ | Buy | 31,213,600 | 35,689,419 | 9/18/19 | — | (245,931 | ) | ||||||||||||||||||||
Euro | JPHQ | Sell | 6,400,000 | 7,211,040 | 9/18/19 | — | (56,251 | ) | ||||||||||||||||||||
Euro | JPHQ | Sell | 40,125,400 | 45,825,213 | 9/18/19 | 262,250 | — | |||||||||||||||||||||
Swedish Krona | JPHQ | Buy | 143,700,000 | 15,448,872 | 9/18/19 | — | (143,553 | ) | ||||||||||||||||||||
Swedish Krona | JPHQ | Sell | 143,700,000 | 15,691,199 | 9/18/19 | 385,880 | — | |||||||||||||||||||||
Swiss Franc | JPHQ | Sell | 1,600,000 | 1,616,145 | 9/18/19 | 23,830 | — | |||||||||||||||||||||
Chinese Yuan Renminbi | JPHQ | Buy | 78,000,000 | 11,622,207 | 9/27/19 | — | (48,505 | ) | ||||||||||||||||||||
Chinese Yuan Renminbi | JPHQ | Sell | 143,000,000 | 21,284,830 | 9/27/19 | 66,376 | — | |||||||||||||||||||||
Brazilian Real | JPHQ | Sell | 95,000,000 | 24,209,990 | 10/10/19 | 294,006 | — | |||||||||||||||||||||
38 | Annual Report | franklintempleton.com | ||
FRANKLIN STRATEGIC SERIES
CONSOLIDATED STATEMENT OF INVESTMENTS
Franklin Strategic Income Fund(continued)
Forward Exchange Contracts(continued)
| Currency | Counterpartya | Type | Quantity | Contract Amount | Settlement Date | Unrealized Appreciation | Unrealized Depreciation | |||||||||||||||||||||
| ||||||||||||||||||||||||||||
OTC Forward Exchange Contracts(continued) | ||||||||||||||||||||||||||||
Australian Dollar | JPHQ | Sell | 55,850,000 | $ | 39,994,958 | 10/11/19 | $ 440,930 | $ — | ||||||||||||||||||||
Turkish Lira | JPHQ | Buy | 62,000,000 | 9,537,728 | 10/18/19 | — | (231,015 | ) | ||||||||||||||||||||
|
| |||||||||||||||||||||||||||
Total Forward Exchange Contracts |
| $ 4,309,631 | $ (991,064 | ) | ||||||||||||||||||||||||
|
| |||||||||||||||||||||||||||
Net unrealized appreciation (depreciation) |
| $ 3,318,567 | ||||||||||||||||||||||||||
|
| |||||||||||||||||||||||||||
aMay be comprised of multiple contracts with the same counterparty, currency and settlement date.
At April 30, 2019, the Fund had the following credit default swap contracts outstanding. See Note 1(e).
Credit Default Swap Contracts
| Description | Periodic Payment Rate Received (Paid) | Payment Frequency | Counter- party | Maturity Date | Notional Amounta | Value | Unamortized Upfront Payments (Receipts) | Unrealized Appreciation (Depreciation) | Ratingb | |||||||||||||||||||||||||||
Centrally Cleared Swap Contracts |
| |||||||||||||||||||||||||||||||||||
Contracts to Sell Protectionc,d |
| |||||||||||||||||||||||||||||||||||
Traded Index |
| |||||||||||||||||||||||||||||||||||
CDX.EM.30 | 1.00% | Quarterly | 12/20/23 | $ | 43,150,000 | $ | (1,562,243 | ) | $ | (1,717,492 | ) | $ 155,249 | Investment | |||||||||||||||||||||||
|
| |||||||||||||||||||||||||||||||||||
| Grade | ||||||||||||||||||||||||||||||||||||
OTC Swap Contracts |
| |||||||||||||||||||||||||||||||||||
Contracts to Buy Protectionc |
| |||||||||||||||||||||||||||||||||||
Single Name |
| |||||||||||||||||||||||||||||||||||
Ally Financial Inc. | (5.00)% | Quarterly | JPHQ | 6/20/24 | $ | 19,800,000 | $ | (3,710,868 | ) | $ | (3,221,267 | ) | $ (489,601 | ) | ||||||||||||||||||||||
Government of Italy | (1.00)% | Quarterly | BZWS | 6/20/23 | 14,200,000 | (34,492 | ) | 128,085 | (162,577 | ) | ||||||||||||||||||||||||||
Government of Turkey | (1.00)% | Quarterly | BZWS | 12/20/19 | 9,100,000 | 135,584 | 272,457 | (136,873 | ) | |||||||||||||||||||||||||||
Contracts to Sell Protectionc,d |
| |||||||||||||||||||||||||||||||||||
Single Name |
| |||||||||||||||||||||||||||||||||||
Government of Argentina | 5.00% | Quarterly | MSCO | 6/20/23 | 48,600,000 | (9,752,680 | ) | 4,019,049 | (13,771,729 | ) | B | |||||||||||||||||||||||||
Government of Indonesia | 1.00% | Quarterly | CITI | 6/20/24 | 24,700,000 | 88,732 | (82,782 | ) | 171,514 | BBB- | ||||||||||||||||||||||||||
Government of Italy | 1.00% | Quarterly | BZWS | 6/20/23 | 14,200,000 | (350,372 | ) | (561,671 | ) | 211,299 | NR | |||||||||||||||||||||||||
Government of Russia | 1.00% | Quarterly | BNDP | 6/20/24 | 13,500,000 | (142,538 | ) | (180,023 | ) | 37,485 | BBB- | |||||||||||||||||||||||||
Traded Index |
| |||||||||||||||||||||||||||||||||||
eBNP Paribas Bespoke | ||||||||||||||||||||||||||||||||||||
Bordeaux Index, | ||||||||||||||||||||||||||||||||||||
Mezzanine Tranche 7-10% | 2.10% | Quarterly | BNDP | 6/20/20 | 6,850,000 | 99,814 | — | 99,814 | Non- | |||||||||||||||||||||||||||
| Investment | ||||||||||||||||||||||||||||||||||||
| Grade | ||||||||||||||||||||||||||||||||||||
eBNP Paribas Bespoke | ||||||||||||||||||||||||||||||||||||
Rodez2 Index, | ||||||||||||||||||||||||||||||||||||
Mezzanine Tranche 5-7% | 3.20% | Quarterly | BNDP | 12/20/20 | 3,300,000 | 99,244 | — | 99,244 | Non- | |||||||||||||||||||||||||||
| Investment | ||||||||||||||||||||||||||||||||||||
| Grade | ||||||||||||||||||||||||||||||||||||
franklintempleton.com | Annual Report | 39 | ||
FRANKLIN STRATEGIC SERIES
CONSOLIDATED STATEMENT OF INVESTMENTS
Franklin Strategic Income Fund(continued)
Credit Default Swap Contracts(continued)
| Description | Periodic Payment Rate Received (Paid) | Payment Frequency | Counter- party | Maturity Date | Notional Amounta | Value | Unamortized Upfront Payments (Receipts) | Unrealized Appreciation (Depreciation) | Ratingb | |||||||||||||||||||||||||||
OTC Swap Contracts(continued) |
| |||||||||||||||||||||||||||||||||||
Contracts to Sell Protectionc,d(continued) |
| |||||||||||||||||||||||||||||||||||
Traded Index(continued) |
| |||||||||||||||||||||||||||||||||||
eCitibank Bespoke Bogota | ||||||||||||||||||||||||||||||||||||
Index, Mezzanine | ||||||||||||||||||||||||||||||||||||
Tranche7-10% | 1.35% | Quarterly | CITI | 6/20/20 | $ | 7,000,000 | $ | 65,242 | $ | — | $ | 65,242 | Non- | |||||||||||||||||||||||
| Investment | ||||||||||||||||||||||||||||||||||||
| Grade | ||||||||||||||||||||||||||||||||||||
eCitibank Bespoke Broker | ||||||||||||||||||||||||||||||||||||
Index, Mezzanine Tranche3-7% | 1.30% | Quarterly | CITI | 6/20/19 | 16,200,000 | 53,129 | — | 53,129 | Non- | |||||||||||||||||||||||||||
| Investment | ||||||||||||||||||||||||||||||||||||
| Grade | ||||||||||||||||||||||||||||||||||||
eCitibank Bespoke Broker | ||||||||||||||||||||||||||||||||||||
Index, Mezzanine Tranche3-7% | 1.40% | Quarterly | CITI | 6/20/19 | 13,200,000 | 46,620 | — | 46,620 | Non- | |||||||||||||||||||||||||||
| Investment | ||||||||||||||||||||||||||||||||||||
| Grade | ||||||||||||||||||||||||||||||||||||
eCitibank Bespoke | ||||||||||||||||||||||||||||||||||||
Cambridge Index, Equity | ||||||||||||||||||||||||||||||||||||
Tranche0-3% | 0.00% | Quarterly | CITI | 12/20/19 | 27,300,000 | (3,599,163 | ) | (1,432,615 | ) | (2,166,548 | ) | Non- | ||||||||||||||||||||||||
| Investment | ||||||||||||||||||||||||||||||||||||
| Grade | ||||||||||||||||||||||||||||||||||||
eCitibank Bespoke Lisbon | ||||||||||||||||||||||||||||||||||||
Index, Equity Tranche0-3% | 0.00% | Quarterly | CITI | 6/20/19 | 5,440,000 | (157,050 | ) | (89,926 | ) | (67,124 | ) | Non- | ||||||||||||||||||||||||
| Investment | ||||||||||||||||||||||||||||||||||||
| Grade | ||||||||||||||||||||||||||||||||||||
eCitibank Bespoke Palma | ||||||||||||||||||||||||||||||||||||
Index, Mezzanine | ||||||||||||||||||||||||||||||||||||
Tranche5-7% | 2.30% | Quarterly | CITI | 6/20/21 | 6,700,000 | 48,332 | — | 48,332 | Non- | |||||||||||||||||||||||||||
| Investment | ||||||||||||||||||||||||||||||||||||
| Grade | ||||||||||||||||||||||||||||||||||||
eCitibank Bespoke | ||||||||||||||||||||||||||||||||||||
Singapore Index, Equity | ||||||||||||||||||||||||||||||||||||
Tranche0-3% | 0.00% | Quarterly | CITI | 6/20/20 | 7,000,000 | (788,618 | ) | (1,115,885 | ) | 327,267 | Non- | |||||||||||||||||||||||||
| Investment | ||||||||||||||||||||||||||||||||||||
| Grade | ||||||||||||||||||||||||||||||||||||
eCitibank Bespoke | ||||||||||||||||||||||||||||||||||||
Sydney Index, Equity | ||||||||||||||||||||||||||||||||||||
Tranche0-3% | 0.00% | Quarterly | CITI | 6/20/20 | 5,500,000 | (1,029,744 | ) | (1,000,944 | ) | (28,800 | ) | Non- | ||||||||||||||||||||||||
| Investment | ||||||||||||||||||||||||||||||||||||
| Grade | ||||||||||||||||||||||||||||||||||||
40 | Annual Report | franklintempleton.com | ||
FRANKLIN STRATEGIC SERIES
CONSOLIDATED STATEMENT OF INVESTMENTS
Franklin Strategic Income Fund(continued)
Credit Default Swap Contracts(continued)
| Description | Periodic Payment Rate Received (Paid) | Payment Frequency | Counter- party | Maturity Date | Notional Amounta | Value | Unamortized Upfront Payments (Receipts) | Unrealized Appreciation (Depreciation) | Ratingb | |||||||||||||||||||||||||||
OTC Swap Contracts(continued) |
| |||||||||||||||||||||||||||||||||||
Contracts to Sell Protectionc,d(continued) |
| |||||||||||||||||||||||||||||||||||
Traded Index(continued) |
| |||||||||||||||||||||||||||||||||||
eCitibank Bespoke Verona | ||||||||||||||||||||||||||||||||||||
Index, Equity Tranche0-3% | 0.00% | Quarterly | CITI | 12/20/19 | $ | 10,900,000 | $ | (1,243,167 | ) | $ | (702,131 | ) | $ | (541,036 | ) | Non- | ||||||||||||||||||||
| Investment | ||||||||||||||||||||||||||||||||||||
| Grade | ||||||||||||||||||||||||||||||||||||
eCitibank Bespoke Verona | ||||||||||||||||||||||||||||||||||||
Index, Mezzanine | ||||||||||||||||||||||||||||||||||||
Tranche7-15% | 0.40% | Quarterly | CITI | 12/20/19 | 31,000,000 | 64,333 | — | 64,333 | Non- | |||||||||||||||||||||||||||
| Investment | ||||||||||||||||||||||||||||||||||||
| Grade | ||||||||||||||||||||||||||||||||||||
MCDX.NA.31 | 1.00% | Quarterly | CITI | 12/20/23 | 23,060,000 | 406,877 | 216,800 | 190,077 | Investment | |||||||||||||||||||||||||||
|
| |||||||||||||||||||||||||||||||||||
| Grade | ||||||||||||||||||||||||||||||||||||
Total OTC Swap Contracts |
| $ | (19,700,785 | ) | $ | (3,750,853) | $ | (15,949,932) | ||||||||||||||||||||||||||||
|
| |||||||||||||||||||||||||||||||||||
Total Credit Default Swap Contracts |
| $ | (21,263,028 | ) | $ | (5,468,345) | $ | (15,794,683) | ||||||||||||||||||||||||||||
|
| |||||||||||||||||||||||||||||||||||
aFor contracts to sell protection, the notional amount is equal to the maximum potential amount of the future payments and no recourse provisions have been entered into in association with the contracts.
bBased on Standard and Poor’s (S&P) Rating for single name swaps and internal ratings for index swaps. Internal ratings based on mapping into equivalent ratings from external vendors.
cPerformance triggers for settlement of contract include default, bankruptcy or restructuring for single name swaps and failure to pay or bankruptcy of the underlying securities for traded index swaps.
dThe Fund enters contracts to sell protection to create a long credit position.
eRepresents a custom index comprised of a basket of underlying issuers.
At April 30, 2019, the Fund had the following cross-currency swap contracts outstanding. See Note 1(e).
Cross-Currency Swap Contracts
| Description | Payment Frequency | Counter- party | Maturity Date | Notional Amount | Value/ Unrealized Appreciation (Depreciation) | |||||||||||||||||
OTC Swap Contracts | ||||||||||||||||||||||
| Receive Floating3-month USD LIBOR + 2.87% | Quarterly | 3,834,600 | USD | |||||||||||||||||||
Pay Fixed 2.50% | Annual | CITI | 5/04/21 | 3,300,000 | EUR | $99,462 | ||||||||||||||||
|
| |||||||||||||||||||||
franklintempleton.com | Annual Report | 41 | ||
FRANKLIN STRATEGIC SERIES
CONSOLIDATED STATEMENT OF INVESTMENTS
Franklin Strategic Income Fund(continued)
At April 30, 2019, the Fund had the following total return swap contracts outstanding. See Note 1(e).
Total Return Swap Contracts
| Underlying Instruments | Financing Rate | Payment Frequency | Counterparty | Maturity Date | Notional Value | Value/ Unrealized Appreciation (Depreciation) | ||||||||||||||||
OTC Swap Contracts | ||||||||||||||||||||||
Longa | ||||||||||||||||||||||
iBoxx USD Liquid High Yield Index | 3-month USD LIBOR | Quarterly | BOFA | 6/20/19 | $ | 14,000,000 | $ 970,858 | |||||||||||||||
iBoxx USD Liquid High Yield Index | 3-month USD LIBOR | Quarterly | CITI | 6/20/19 | 38,000,000 | 2,546,646 | ||||||||||||||||
Markit iBoxx USD Liquid Leveraged Loan Index | 3-month USD LIBOR | Quarterly | GSCO | 6/20/19 | 170,000,000 | 6,805,392 | ||||||||||||||||
|
| |||||||||||||||||||||
Total Total Return Swap Contracts | $10,322,896 | |||||||||||||||||||||
|
| |||||||||||||||||||||
aThe Fund receives the total return on the underlying instrument and pays a variable financing rate.
See Note 9 regarding other derivative information.
See Abbreviations on page 66.
42 | Annual Report | The accompanying notes are an integral part of these consolidated financial statements. | franklintempleton.com | ||||
FRANKLIN STRATEGIC SERIES
Consolidated Financial Statements
Consolidated Statement of Assets and Liabilities
April 30, 2019
Franklin Strategic Income Fund
Assets: | ||||
Investments in securities: | ||||
Cost - Unaffiliated issuers | $ | 4,822,296,112 | ||
Cost - Controlled affiliates (Note 3f and 10) | 218,117,419 | |||
Cost -Non-controlled affiliates (Note 3f and 10) | 64,869,886 | |||
Cost - Unaffiliated repurchase agreements | 97,392,171 | |||
|
| |||
Value - Unaffiliated issuers | $ | 4,725,925,301 | ||
Value - Controlled affiliates (Note 3f and 10) | 194,101,482 | |||
Value -Non-controlled affiliates (Note 3f and 10) | 66,093,143 | |||
Value - Unaffiliated repurchase agreements | 97,392,171 | |||
Cash | 23,688,023 | |||
Restricted cash for OTC derivative contracts (Note 1f) | 7,650,000 | |||
Foreign currency, at value (cost $1,658,796) | 1,660,457 | |||
Receivables: | ||||
Investment securities sold | 54,198,072 | |||
Capital shares sold | 7,379,638 | |||
Dividends and interest | 40,317,595 | |||
Deposits with brokers for: | ||||
OTC derivative contracts | 13,655,000 | |||
Futures contracts | 3,628,300 | |||
Centrally cleared swap contracts | 6,985,197 | |||
Variation margin on futures contracts | 756,756 | |||
OTC swap contracts (upfront payments $6,063,118) | 4,636,391 | |||
Unrealized appreciation on OTC forward exchange contracts | 4,309,631 | |||
Unrealized appreciation on OTC swap contracts | 11,836,714 | |||
FT Subsidiary deferred tax benefit (Note 1h) | 532,014 | |||
Other assets | 4,534 | |||
|
| |||
Total assets | 5,264,750,419 | |||
|
| |||
Liabilities: | ||||
Payables: | ||||
Investment securities purchased | 364,051,986 | |||
Capital shares redeemed | 11,504,686 | |||
Management fees | 1,705,390 | |||
Distribution fees | 1,063,831 | |||
Transfer agent fees | 1,052,121 | |||
Distributions to shareholders | 1,300,928 | |||
Variation margin on centrally cleared swap contracts | 11,468 | |||
Deposits from brokers for: | ||||
OTC derivative contracts | 7,650,000 | |||
OTC swap contracts (upfront receipts $15,459,060) | 8,387,244 | |||
Unrealized depreciation on OTC forward exchange contracts | 991,064 | |||
Unrealized depreciation on OTC swap contracts | 17,364,288 | |||
Deferred tax | 80,365 | |||
Accrued expenses and other liabilities | 398,255 | |||
|
| |||
Total liabilities | 415,561,626 | |||
|
| |||
Net assets, at value | $ | 4,849,188,793 | ||
|
| |||
Net assets consist of: | ||||
Paid-in capital | $ | 5,462,247,550 | ||
Total distributable earnings (loss) | (613,058,757 | ) | ||
|
| |||
franklintempleton.com | The accompanying notes are an integral part of these consolidated financial statements. | Annual Report | 43 | ||
FRANKLIN STRATEGIC SERIES
CONSOLIDATED FINANCIAL STATEMENTS
Consolidated Statement of Assets and Liabilities(continued)
April 30, 2019
Franklin Strategic Income Fund
Net assets, at value | $ 4,849,188,793 | |||
|
| |||
Class A: | ||||
Net assets, at value | $ 3,131,799,335 | |||
|
| |||
Shares outstanding | 325,800,344 | |||
|
| |||
Net asset value per sharea | $9.61 | |||
|
| |||
Maximum offering price per share (net asset value per share ÷ 96.25%) | $9.98 | |||
|
| |||
Class C: | ||||
Net assets, at value | $ 716,326,834 | |||
|
| |||
Shares outstanding | 74,525,777 | |||
|
| |||
Net asset value and maximum offering price per sharea | $9.61 | |||
|
| |||
Class R: | ||||
Net assets, at value | $ 85,457,789 | |||
|
| |||
Shares outstanding | 8,925,682 | |||
|
| |||
Net asset value and maximum offering price per share | $9.57 | |||
|
| |||
Class R6: | ||||
Net assets, at value | $ 307,287,406 | |||
|
| |||
Shares outstanding | 31,922,933 | |||
|
| |||
Net asset value and maximum offering price per share | $9.63 | |||
|
| |||
Advisor Class: | ||||
Net assets, at value | $ 608,317,429 | |||
|
| |||
Shares outstanding | 63,208,451 | |||
|
| |||
Net asset value and maximum offering price per share | $9.62 | |||
|
| |||
aRedemption price is equal to net asset value less contingent deferred sales charges, if applicable.
44 | Annual Report | | The accompanying notes are an integral part of these consolidated financial statements. | franklintempleton.com | |||
FRANKLIN STRATEGIC SERIES
CONSOLIDATED FINANCIAL STATEMENTS
Consolidated Statement of Operations
for the year ended April 30, 2019
Franklin Strategic Income Fund
Investment income: | ||||
Dividends: | ||||
Unaffiliated issuers | $ | 890,188 | ||
Controlled affiliates (Note 3f and 10) | 36,824,034 | |||
Non-controlled affiliates (Note 3f and 10) | 1,736,770 | |||
Interest: (net of foreign taxes)~ | ||||
Unaffiliated issuers | 239,738,955 | |||
Other income (Note 1h) | 1,070,873 | |||
|
| |||
Total investment income | 280,260,820 | |||
|
| |||
Expenses: | ||||
Management fees (Note 3a) | 24,390,811 | |||
Distribution fees: (Note 3c) | ||||
Class A | 7,867,315 | |||
Class C | 5,672,646 | |||
Class R | 471,129 | |||
Transfer agent fees: (Note 3e) | ||||
Class A | 4,945,053 | |||
Class C | 1,376,550 | |||
Class R | 148,468 | |||
Class R6 | 116,356 | |||
Advisor Class | 1,329,184 | |||
Custodian fees (Note 4) | 140,938 | |||
Reports to shareholders | 454,273 | |||
Registration and filing fees | 177,089 | |||
Professional fees | 372,464 | |||
Trustees’ fees and expenses | 80,307 | |||
Other | 231,883 | |||
|
| |||
Total expenses | 47,774,466 | |||
Expense reductions (Note 4) | (128,191 | ) | ||
Expenses waived/paid by affiliates (Note 3f and 3g) | (2,803,479 | ) | ||
|
| |||
Net expenses | 44,842,796 | |||
|
| |||
Net investment income | 235,418,024 | |||
|
| |||
Realized and unrealized gains (losses): | ||||
Net realized gain (loss) from: | ||||
Investments:# | ||||
Unaffiliated issuers | (45,475,779 | ) | ||
Controlled affiliates (Note 3f and 10) | (34,375,561 | ) | ||
Foreign currency transactions | (1,764,067 | ) | ||
Forward exchange contracts | 2,758,198 | |||
Futures contracts | 7,842,483 | |||
Swap contracts | 9,636,494 | |||
|
| |||
Net realized gain (loss) | (61,378,232 | ) | ||
|
| |||
Net change in unrealized appreciation (depreciation) on: | ||||
Investments: | ||||
Unaffiliated issuers | 63,832,844 | |||
Controlled affiliates (Note 3f and 10) | (12,445,202 | ) | ||
Non-controlled affiliates (Note 3f and 10) | 1,223,257 | |||
Translation of other assets and liabilities denominated in foreign currencies | (23,059 | ) | ||
Forward exchange contracts | 3,007,356 | |||
franklintempleton.com | The accompanying notes are an integral part of these consolidated financial statements. | | Annual Report | 45 | |||
FRANKLIN STRATEGIC SERIES
CONSOLIDATED FINANCIAL STATEMENTS
Consolidated Statement of Operations(continued)
for the year ended April 30, 2019
Franklin Strategic Income Fund
Futures contracts | 2,810,354 | |||
Swap contracts | (4,159,859 | ) | ||
Change in FT Subsidiary deferred tax benefit (Note 1h) | (858,525 | ) | ||
Change in deferred taxes on unrealized appreciation | 239,363 | |||
|
| |||
Net change in unrealized appreciation (depreciation) | 53,626,529 | |||
|
| |||
Net realized and unrealized gain (loss) | (7,751,703 | ) | ||
|
| |||
Net increase (decrease) in net assets resulting from operations | $ | 227,666,321 | ||
|
| |||
~Foreign taxes withheld on interest | $ | 359,552 | ||
#Net of foreign taxes | $ | 21,122 |
46 | Annual Report | | The accompanying notes are an integral part of these consolidated financial statements. | franklintempleton.com | |||
FRANKLIN STRATEGIC SERIES
CONSOLIDATED FINANCIAL STATEMENTS
Consolidated Statements of Changes in Net Assets
Franklin Strategic Income Fund
| Year Ended April 30, | ||||||||
| 2019 | 2018 | |||||||
| ||||||||
Increase (decrease) in net assets: | ||||||||
Operations: | ||||||||
Net investment income | $ | 235,418,024 | $ | 249,545,798 | ||||
Net realized gain (loss) | (61,378,232 | ) | (113,213,321 | ) | ||||
Net change in unrealized appreciation (depreciation) | 53,626,529 | (92,950,330 | ) | |||||
|
| |||||||
Net increase (decrease) in net assets resulting from operations | 227,666,321 | 43,382,147 | ||||||
|
| |||||||
Distributions to shareholders: (Note 1l) | ||||||||
Class A | (138,743,800 | ) | (106,537,907 | ) | ||||
Class C | (34,243,715 | ) | (31,329,580 | ) | ||||
Class R | (3,918,092 | ) | (3,355,206 | ) | ||||
Class R6 | (18,669,569 | ) | (13,824,604 | ) | ||||
Advisor Class | (38,939,889 | ) | (32,910,570 | ) | ||||
|
| |||||||
Total distributions to shareholders | (234,515,065 | ) | (187,957,867 | ) | ||||
|
| |||||||
Capital share transactions: (Note 2) | ||||||||
Class A | (160,333,285 | ) | (461,379,634 | ) | ||||
Class C | (360,085,250 | ) | (280,427,839 | ) | ||||
Class R | (19,998,642 | ) | (38,252,437 | ) | ||||
Class R6 | (123,669,688 | ) | 75,196,883 | |||||
Advisor Class | (322,273,887 | ) | (113,689,921 | ) | ||||
|
| |||||||
Total capital share transactions | (986,360,752 | ) | (818,552,948 | ) | ||||
|
| |||||||
Net increase (decrease) in net assets | (993,209,496 | ) | (963,128,668 | ) | ||||
Net assets: | ||||||||
Beginning of year | 5,842,398,289 | 6,805,526,957 | ||||||
|
| |||||||
End of year (Note 1l) | $ | 4,849,188,793 | $ | 5,842,398,289 | ||||
|
| |||||||
franklintempleton.com | The accompanying notes are an integral part of these consolidated financial statements. | | Annual Report | 47 | |||
FRANKLIN STRATEGIC SERIES
Notes to Consolidated Financial Statements
Franklin Strategic Income Fund
1. Organization and Significant Accounting Policies
Franklin Strategic Series (Trust) is registered under the Investment Company Act of 1940 (1940 Act) as anopen-end management investment company, consisting of eight separate funds and applies the specialized accounting and reporting guidance in U.S. Generally Accepted Accounting Principles (U.S. GAAP). Franklin Strategic Income Fund (Fund) is included in this report. The Fund offers five classes of shares: Class A, Class C, Class R, Class R6, and Advisor Class. Beginning on October 19, 2018, Class C shares automatically convert to Class A shares after they have been held for 10 years. Each class of shares may differ by its initial sales load, contingent deferred sales charges, voting rights on matters affecting a single class, its exchange privilege and fees due to differing arrangements for distribution and transfer agent fees.
The following summarizes the Fund’s significant accounting policies.
a. Financial Instrument Valuation
The Fund’s investments in financial instruments are carried at fair value daily. Fair value is the price that would be received to sell an asset or paid to transfer a liability in an orderly transaction between market participants on the measurement date. The Fund calculates the net asset value (NAV) per share each business day as of 4 p.m. Eastern time or the regularly scheduled close of the New York Stock Exchange (NYSE), whichever is earlier. Under compliance policies and procedures approved by the Trust’s Board of Trustees (the Board), the Fund’s administrator has responsibility for oversight of valuation, including leading the cross-functional Valuation Committee (VC). The Fund may utilize independent pricing services, quotations from securities and financial instrument dealers, and other market sources to determine fair value.
Equity securities and derivative financial instruments listed on an exchange or on the NASDAQ National Market System are valued at the last quoted sale price or the official closing price of the day, respectively. Foreign equity securities are valued as of the close of trading on the foreign stock exchange on which the security is primarily traded, or as of 4 p.m. Eastern time. The value is then converted into its U.S. dollar equivalent at the foreign exchange rate in effect at 4 p.m. Eastern time on the day that the value of the security is determined.Over-the-counter (OTC) securities are valued within the range of the most recent quoted bid and ask prices. Securities that trade in multiple
markets or on multiple exchanges are valued according to the broadest and most representative market. Certain equity securities are valued based upon fundamental characteristics or relationships to similar securities.
Debt securities generally trade in the OTC market rather than on a securities exchange. The Fund’s pricing services use multiple valuation techniques to determine fair value. In instances where sufficient market activity exists, the pricing services may utilize a market-based approach through which quotes from market makers are used to determine fair value. In instances where sufficient market activity may not exist or is limited, the pricing services also utilize proprietary valuation models which may consider market characteristics such as benchmark yield curves, credit spreads, estimated default rates, anticipated market interest rate volatility, coupon rates, anticipated timing of principal repayments, underlying collateral, and other unique security features in order to estimate the relevant cash flows, which are then discounted to calculate the fair value. Securities denominated in a foreign currency are converted into their U.S. dollar equivalent at the foreign exchange rate in effect at 4 p.m. Eastern time on the date that the values of the foreign debt securities are determined.
Investments inopen-end mutual funds are valued at the closing NAV. Investments in repurchase agreements are valued at cost, which approximates fair value.
Certain derivative financial instruments are centrally cleared or trade in the OTC market. The Fund’s pricing services use various techniques including industry standard option pricing models and proprietary discounted cash flow models to determine the fair value of those instruments. The Fund’s net benefit or obligation under the derivative contract, as measured by the fair value of the contract, is included in net assets.
The Fund has procedures to determine the fair value of financial instruments for which market prices are not reliable or readily available. Under these procedures, the Fund primarily employs a market-based approach which may use related or comparable assets or liabilities, recent transactions, market multiples, book values, and other relevant information for the investment to determine the fair value of the investment. An income-based valuation approach may also be used in which the anticipated future cash flows of the investment are discounted to calculate fair value. Discounts may also be applied due to the nature or duration of any restrictions on the disposition of the
48 | Annual Report | franklintempleton.com | ||
FRANKLIN STRATEGIC SERIES
NOTES TO CONSOLIDATED FINANCIAL STATEMENTS
Franklin Strategic Income Fund(continued)
investments. Due to the inherent uncertainty of valuations of such investments, the fair values may differ significantly from the values that would have been used had an active market existed.
Trading in securities on foreign securities stock exchanges and OTC markets may be completed before 4 p.m. Eastern time. In addition, trading in certain foreign markets may not take place on every Fund’s business day. Occasionally, events occur between the time at which trading in a foreign security is completed and 4 p.m. Eastern time that might call into question the reliability of the value of a portfolio security held by the Fund. As a result, differences may arise between the value of the Fund’s portfolio securities as determined at the foreign market close and the latest indications of value at 4 p.m. Eastern time. In order to minimize the potential for these differences, the VC monitors price movements following the close of trading in foreign stock markets through a series of country specific market proxies (such as baskets of American Depositary Receipts, futures contracts and exchange traded funds). These price movements are measured against established trigger thresholds for each specific market proxy to assist in determining if an event has occurred that may call into question the reliability of the values of the foreign securities held by the Fund. If such an event occurs, the securities may be valued using fair value procedures, which may include the use of independent pricing services.
When the last day of the reporting period is anon-business day, certain foreign markets may be open on those days that the Fund’s NAV is not calculated, which could result in differences between the value of the Fund’s portfolio securities on the last business day and the last calendar day of the reporting period. Any significant security valuation changes due to an open foreign market are adjusted and reflected by the Fund for financial reporting purposes.
b. Foreign Currency Translation
Portfolio securities and other assets and liabilities denominated in foreign currencies are translated into U.S. dollars based on the exchange rate of such currencies against U.S. dollars on the date of valuation. The Fund may enter into foreign currency exchange contracts to facilitate transactions denominated in a foreign currency. Purchases and sales of securities, income and expense items denominated in foreign currencies are translated into U.S. dollars at the exchange rate in effect on the transaction date. Portfolio securities and assets and liabilities denominated
in foreign currencies contain risks that those currencies will decline in value relative to the U.S. dollar. Occasionally, events may impact the availability or reliability of foreign exchange rates used to convert the U.S. dollar equivalent value. If such an event occurs, the foreign exchange rate will be valued at fair value using procedures established and approved by the Board.
The Fund does not separately report the effect of changes in foreign exchange rates from changes in market prices on securities held. Such changes are included in net realized and unrealized gain or loss from investments in the Consolidated Statement of Operations.
Realized foreign exchange gains or losses arise from sales of foreign currencies, currency gains or losses realized between the trade and settlement dates on securities transactions and the difference between the recorded amounts of dividends, interest, and foreign withholding taxes and the U.S. dollar equivalent of the amounts actually received or paid. Net unrealized foreign exchange gains and losses arise from changes in foreign exchange rates on foreign denominated assets and liabilities other than investments in securities held at the end of the reporting period.
c. Joint Repurchase Agreement
The Fund enters into a joint repurchase agreement whereby its uninvested cash balance is deposited into a joint cash account with other funds managed by the investment manager or an affiliate of the investment manager and is used to invest in one or more repurchase agreements. The value and face amount of the joint repurchase agreement are allocated to the funds based on theirpro-rata interest. A repurchase agreement is accounted for as a loan by the Fund to the seller, collateralized by securities which are delivered to the Fund’s custodian. The fair value, including accrued interest, of the initial collateralization is required to be at least 102% of the dollar amount invested by the funds, with the value of the underlying securities marked to market daily to maintain coverage of at least 100%. Repurchase agreements are subject to the terms of Master Repurchase Agreements (MRAs) with approved counterparties (sellers). The MRAs contain various provisions, including but not limited to events of default and maintenance of collateral for repurchase agreements. In the event of default by either the seller or the Fund, certain MRAs may permit thenon-defaulting party to net andclose-out all transactions, if any, traded under such agreements. The Fund may sell securities it holds as collateral and apply the proceeds towards the repurchase price and any
franklintempleton.com | Annual Report | 49 | ||
FRANKLIN STRATEGIC SERIES
NOTES TO CONSOLIDATED FINANCIAL STATEMENTS
Franklin Strategic Income Fund(continued)
1. Organization and Significant Accounting
Policies (continued)
c. Joint Repurchase Agreement(continued)
other amounts owed by the seller to the Fund in the event of default by the seller. This could involve costs or delays in addition to a loss on the securities if their value falls below the repurchase price owed by the seller. The joint repurchase agreement held by the Fund at year end, as indicated in the Consolidated Statement of Investments, had been entered into on on April 30, 2019.
d. Securities Purchased on a Delayed Delivery and TBA Basis
The Fund purchases securities on a delayed delivery andto-be-announced (TBA) basis, with payment and delivery scheduled for a future date. These transactions are subject to market fluctuations and are subject to the risk that the value at delivery may be more or less than the trade date purchase price. Although the Fund will generally purchase these securities with the intention of holding the securities, it may sell the securities before the settlement date. Sufficient assets have been segregated for these securities and collateral has been pledged and/or received for open TBA trades.
e. Derivative Financial Instruments
The Fund invested in derivative financial instruments in order to manage risk or gain exposure to various other investments or markets. Derivatives are financial contracts based on an underlying or notional amount, require no initial investment or an initial net investment that is smaller than would normally be required to have a similar response to changes in market factors, and require or permit net settlement. Derivatives contain various risks including the potential inability of the counterparty to fulfill their obligations under the terms of the contract, the potential for an illiquid secondary market, and/or the potential for market movements which expose the Fund to gains or losses in excess of the amounts shown in the Consolidated Statement of Assets and Liabilities. Realized gain and loss and unrealized appreciation and depreciation on these contracts for the period are included in the Consolidated Statement of Operations.
Derivative counterparty credit risk is managed through a formal evaluation of the creditworthiness of all potential counterparties. The Fund attempts to reduce its exposure to counterparty credit risk on OTC derivatives, whenever possible, by entering into International Swaps and Derivatives
Association (ISDA) master agreements with certain counterparties. These agreements contain various provisions, including but not limited to collateral requirements, events of default, or early termination. Termination events applicable to the counterparty include certain deteriorations in the credit quality of the counterparty. Termination events applicable to the Fund include failure of the Fund to maintain certain net asset levels and/or limit the decline in net assets over various periods of time. In the event of default or early termination, the ISDA master agreement gives thenon-defaulting party the right to net andclose-out all transactions traded, whether or not arising under the ISDA agreement, to one net amount payable by one counterparty to the other. However, absent an event of default or early termination, OTC derivative assets and liabilities are presented gross and not offset in the Consolidated Statement of Assets and Liabilities. Early termination by the counterparty may result in an immediate payment by the Fund of any net liability owed to that counterparty under the ISDA agreement.
Collateral requirements differ by type of derivative. Collateral or initial margin requirements are set by the broker or exchange clearing house for exchange traded and centrally cleared derivatives. Initial margin deposited is held at the exchange and can be in the form of cash and/or securities. For OTC derivatives traded under an ISDA master agreement, posting of collateral is required by either the Fund or the applicable counterparty if the total net exposure of all OTC derivatives with the applicable counterparty exceeds the minimum transfer amount, which typically ranges from $100,000 to $250,000, and can vary depending on the counterparty and the type of the agreement. Generally, collateral is determined at the close of Fund business each day and any additional collateral required due to changes in derivative values may be delivered by the Fund or the counterparty the next business day, or within a few business days. Collateral pledged and/or received by the Fund for OTC derivatives, if any, is held in segregated accounts with the Fund’s custodian/counterparty broker and can be in the form of cash and/or securities. Unrestricted cash may be invested according to the Fund’s investment objectives. To the extent that the amounts due to the Fund from its counterparties are not subject to collateralization or are not fully collateralized, the Fund bears the risk of loss from counterpartynon-performance.
The Fund entered into exchange traded futures contracts primarily to manage and/or gain exposure to interest rate risk. A futures contract is an agreement between the Fund and a counterparty to buy or sell an asset at a specified price on a
50 | Annual Report | franklintempleton.com | ||
FRANKLIN STRATEGIC SERIES
NOTES TO CONSOLIDATED FINANCIAL STATEMENTS
Franklin Strategic Income Fund(continued)
future date. Required initial margins are pledged by the Fund, and the daily change in fair value is accounted for as a variation margin payable or receivable in the Consolidated Statement of Assets and Liabilities.
The Fund entered into OTC forward exchange contracts primarily to manage and/or gain exposure to certain foreign currencies. A forward exchange contract is an agreement between the Fund and a counterparty to buy or sell a foreign currency at a specific exchange rate on a future date.
The Fund entered into credit default swap contracts primarily to manage and/or gain exposure to credit risk. A credit default swap is an agreement between the Fund and a counterparty whereby the buyer of the contract receives credit protection and the seller of the contract guarantees the credit worthiness of a referenced debt obligation. These agreements may be privately negotiated in theover-the-counter market (OTC credit default swaps) or may be executed in a multilateral trade facility platform, such as a registered exchange (centrally cleared credit default swaps). The underlying referenced debt obligation may be a single issuer of corporate or sovereign debt, a credit index, a basket of issuers or indices, or a tranche of a credit index or basket of issuers or indices. In the event of a default of the underlying referenced debt obligation, the buyer is entitled to receive the notional amount of the credit default swap contract from the seller in exchange for the referenced debt obligation, a net settlement amount equal to the notional amount of the credit default swap less the recovery value of the referenced debt obligation, or other agreed upon amount. For centrally cleared credit default swaps, required initial margins are pledged by the Fund, and the daily change in fair value is accounted for as a variation margin payable or receivable in the Consolidated Statement of Assets and Liabilities. Over the term of the contract, the buyer pays the seller a periodic stream of payments, provided that no event of default has occurred. Such periodic payments are accrued daily as an unrealized appreciation or depreciation until the payments are made, at which time they are realized. Upfront payments and receipts are reflected in the Consolidated Statement of Assets and Liabilities and represent compensating factors between stated terms of the credit default swap agreement and prevailing market conditions (credit spreads and other relevant factors). These upfront payments and receipts are amortized over the term of the contract as a realized gain or loss in the Consolidated Statement of Operations.
The Fund entered into OTC cross currency swap contracts primarily to manage and/or gain exposure to interest rate risk and certain foreign currencies. A cross currency swap is an agreement between the Fund and a counterparty to exchange cash flows (determined using either a fixed or floating rate) based on the notional amounts of two different currencies. The notional amounts are typically determined based on the spot exchange rates at the opening of the contract. Cross currency swaps may require the exchange of notional amounts at the opening and/or closing of the contract. Over the term of the contract, contractually required payments to be paid and to be received are accrued daily and recorded as unrealized depreciation and appreciation until the payments are made, at which time they are realized. Upfront payments and receipts are reflected in the Consolidated Statement of Assets and Liabilities and represent compensating factors between stated terms of the cross currency swap contract and prevailing market conditions (interest rate spreads and other relevant factors). These upfront payments and receipts are amortized over the term of the contract as a realized gain or loss in the Consolidated Statement of Operations.
The Fund entered into OTC total return swap contracts primarily to manage and/or gain exposure to interest rate risk of an underlying instrument such as a stock, bond, index or basket of securities or indices. A total return swap is an agreement between the Fund and a counterparty to exchange a return linked to an underlying instrument for a floating or fixed rate payment, both based upon a notional amount. Over the term of the contract, contractually required payments to be paid or received are accrued daily and recorded as unrealized appreciation or depreciation until the payments are made, at which time they are recognized as realized gain or loss.
The Fund invests in value recovery instruments (VRI) primarily to gain exposure to economic growth. Periodic payments from VRI are dependent on established benchmarks for underlying variables. VRI has a notional amount, which is used to calculate amounts of payments to holders. Payments are recorded upon receipt as realized gains in the Consolidated Statement of Operations. The risks of investing in VRI include growth risk, liquidity, and the potential loss of investment.
See Note 9 regarding other derivative information.
franklintempleton.com | Annual Report | 51 | ||
FRANKLIN STRATEGIC SERIES
NOTES TO CONSOLIDATED FINANCIAL STATEMENTS
Franklin Strategic Income Fund(continued)
1. Organization and Significant Accounting
Policies(continued)
f. Restricted Cash
At April 30, 2019, the Fund held restricted cash in connection with investments in certain derivative securities. Restricted cash is held in a segregated account with the Fund’s custodian and is reflected in the Consolidated Statement of Assets and Liabilities.
g. Loan Participation Notes
The Fund invests in loan participation notes (Participations). Participations are loans originally issued to a borrower by one or more financial institutions (the Lender) and subsequently sold to other investors, such as the Fund. Participations typically result in the Fund having a contractual relationship only with the Lender and not with the borrower. The Fund has the right to receive from the Lender any payments of principal, interest and fees which the Lender received from the borrower. The Fund generally has no rights to either enforce compliance by the borrower with the terms of the loan agreement or to any collateral relating to the original loan. As a result, the Fund assumes the credit risk of both the borrower and the Lender that is selling the Participation. The Participations may also involve interest rate risk and liquidity risk, including the potential default or insolvency of the borrower and/or the Lender.
h. FT Holdings Corporation II (FT Subsidiary)
The Fund invests in certain financial instruments through its investment in FT Subsidiary. FT Subsidiary is a Delaware Corporation, is a wholly-owned subsidiary of the Fund, and is able to invest in certain financial instruments consistent with the investment objective of the Fund. At April 30, 2019, FT Subsidiary’s investment, Turtle Bay Resort, as well as any other assets and liabilities of FT Subsidiary are reflected in the Fund’s Consolidated Statement of Investments and Consolidated Statement of Assets and Liabilities.
During the year ended April 30, 2019, Turtle Bay Resort paid a distribution to FT Subsidiary. The distribution received is reflected as other income in the Consolidated Statement of Operations. At April 30, 2019, FT Subsidiary, which is a tax paying entity, recognized an unrealized loss on its Turtle Bay investment. An estimated deferred tax asset based on such unrealized loss is reflected as FT Subsidiary deferred tax benefit in the Consolidated Statement of Assets and Liabilities. The estimated benefit was calculated using a federal rate of 21%.
When the Turtle Bay investment liquidates, the FT Subsidiary will recognize a capital loss which can be carried-back to offset prior year capital gains, resulting in a tax refund which will relieve the deferred tax asset.
The financial statements have been consolidated and include the accounts of the Fund and FT Subsidiary. All intercompany transactions and balances have been eliminated. At April 30, 2019, the net assets of FT Subsidiary were $18,615,261, representing less than 1% of the Fund’s consolidated net assets. The Fund’s investment in FT Subsidiary is limited to 25% of consolidated assets.
i. Mortgage Dollar Rolls
The Fund enters into mortgage dollar rolls, typically on a TBA basis. Mortgage dollar rolls are agreements between the Fund and a financial institution where the Fund sells (or buys) mortgage-backed securities for delivery on a specified date and simultaneously contracts to repurchase (or sell) substantially similar (same type, coupon, and maturity) securities at a future date and at a predetermined price. Gains or losses are realized on the initial sale, and the difference between the repurchase price and the sale price is recorded as an unrealized gain or loss to the Fund upon entering into the mortgage dollar roll. In addition, the Fund may invest the cash proceeds that are received from the initial sale. During the period between the sale and repurchase, the Fund is not entitled to principal and interest paid on the mortgage backed securities. Transactions in mortgage dollar rolls are accounted for as purchases and sales and may result in an increase to the Fund’s portfolio turnover rate. The risks of mortgage dollar roll transactions include the potential inability of the counterparty to fulfill its obligations.
j. Senior Floating Rate Interests
The Fund invests in senior secured corporate loans that pay interest at rates which are periodically reset by reference to a base lending rate plus a spread. These base lending rates are generally the prime rate offered by a designated U.S. bank or the London InterBank Offered Rate (LIBOR). Senior secured corporate loans often require prepayment of principal from excess cash flows or at the discretion of the borrower. As a result, actual maturity may be substantially less than the stated maturity. Senior secured corporate loans in which the Fund invests are generally readily marketable, but may be subject to certain restrictions on resale.
52 | Annual Report | franklintempleton.com | ||
FRANKLIN STRATEGIC SERIES
NOTES TO CONSOLIDATED FINANCIAL STATEMENTS
Franklin Strategic Income Fund(continued)
k. Income and Deferred Taxes
It is the Fund’s policy to qualify as a regulated investment company under the Internal Revenue Code. The Fund intends to distribute to shareholders substantially all of its taxable income and net realized gains to relieve it from federal income and excise taxes. As a result, no provision for U.S. federal income taxes is required.
The Fund may be subject to foreign taxation related to income received, capital gains on the sale of securities and certain foreign currency transactions in the foreign jurisdictions in which it invests. Foreign taxes, if any, are recorded based on the tax regulations and rates that exist in the foreign markets in which the Fund invests. When a capital gain tax is determined to apply, the Fund records an estimated deferred tax liability in an amount that would be payable if the securities were disposed of on the valuation date.
The Fund may recognize an income tax liability related to its uncertain tax positions under U.S. GAAP when the uncertain tax position has a less than 50% probability that it will be sustained upon examination by the tax authorities based on its technical merits. As of April 30, 2019, the Fund has determined that no tax liability is required in its financial statements related to uncertain tax positions for any open tax years (or expected to be taken in future tax years). Open tax years are those that remain subject to examination and are based on the statute of limitations in each jurisdiction in which the Fund invests.
l. Security Transactions, Investment Income, Expenses and Distributions
Security transactions are accounted for on trade date. Realized gains and losses on security transactions are determined on a specific identification basis. Interest income and estimated expenses are accrued daily. Amortization of premium and accretion of discount on debt securities are included in interest income. Paydown gains and losses are recorded as an adjustment to interest income. Facility fees are recognized as income over the expected term of the loan. Dividend income is recorded on theex-dividend date except for certain dividends from securities where the dividend rate is not available. In such cases, the dividend is recorded as soon as the information is received by the Fund. Distributions to shareholders are recorded on theex-dividend date. Distributable earnings are determined according to income tax regulations (tax basis) and may differ from earnings recorded in accordance with U.S. GAAP. These
differences may be permanent or temporary. Permanent differences are reclassified among capital accounts to reflect their tax character. These reclassifications have no impact on net assets or the results of operations. Temporary differences are not reclassified, as they may reverse in subsequent periods.*
Common expenses incurred by the Trust are allocated among the Funds based on the ratio of net assets of each Fund to the combined net assets of the Trust or based on the ratio of number of shareholders of each Fund to the combined number of shareholders of the Trust. Fund specific expenses are charged directly to the Fund that incurred the expense.
Realized and unrealized gains and losses and net investment income, excluding class specific expenses, are allocated daily to each class of shares based upon the relative proportion of net assets of each class. Differences in per share distributions by class are generally due to differences in class specific expenses.
Inflation-indexed bonds are adjusted for inflation through periodic increases or decreases in the security’s interest accruals, face amount, or principal redemption value, by amounts corresponding to the rate of inflation as measured by an index. Any increase or decrease in the face amount or principal redemption value will be included as interest income in the Consolidated Statement of Operations.
m. Accounting Estimates
The preparation of financial statements in accordance with U.S. GAAP requires management to make estimates and assumptions that affect the reported amounts of assets and liabilities at the date of the financial statements and the amounts of income and expenses during the reporting period. Actual results could differ from those estimates.
n. Guarantees and Indemnifications
Under the Trust’s organizational documents, its officers and trustees are indemnified by the Trust against certain liabilities arising out of the performance of their duties to the Trust. Additionally, in the normal course of business, the Trust, on behalf of the Fund, enters into contracts with service providers that contain general indemnification clauses. The Trust’s maximum exposure under these arrangements is unknown as this would involve future claims that may be made against the Trust that have not yet occurred. Currently, the Trust expects the risk of loss to be remote.
franklintempleton.com | Annual Report | 53 | ||
FRANKLIN STRATEGIC SERIES
NOTES TO CONSOLIDATED FINANCIAL STATEMENTS
Franklin Strategic Income Fund(continued)
1. Organization and Significant Accounting Policies(continued)
*Effective during the current reporting period, it is no longer required to present certain line items in the Statements of Changes
in Net Assets. The below prior period amounts affected by this change are shown as they were in the prior year Statements of
Changes in Net Assets.
For the year ended April 30, 2018, distributions to shareholders were as follows:
Distributions from net investment income: | ||||
Class A | $ | (106,537,907 | ) | |
Class C | (31,329,580 | ) | ||
Class R | (3,355,206 | ) | ||
Class R6 | (13,824,604 | ) | ||
Advisor Class | (32,910,570 | ) |
For the year ended April 30, 2018, distributions in excess of net investment income included in net assets was $(39,100,421).
2. Shares of Beneficial Interest
At April 30, 2019, there were an unlimited number of shares authorized (without par value). Transactions in the Fund’s shares were
as follows:
| Year Ended April 30, | ||||||||||||||||
| 2019 | 2018 | |||||||||||||||
| Shares | Amount | Shares | Amount | |||||||||||||
Class A Shares: | ||||||||||||||||
Shares solda | 50,096,209 | $ | 476,428,245 | 43,921,154 | $ | 432,817,045 | ||||||||||
Shares issued in reinvestment of distributions | 13,459,738 | 127,947,689 | 10,060,731 | 98,645,567 | ||||||||||||
Shares redeemed | (80,356,291 | ) | (764,709,219 | ) | (100,902,437 | ) | (992,842,246 | ) | ||||||||
Net increase (decrease) | (16,800,344 | ) | $ | (160,333,285 | ) | (46,920,552 | ) | $ | (461,379,634 | ) | ||||||
Class C Shares: | ||||||||||||||||
Shares sold | 4,597,179 | $ | 43,711,512 | 8,181,686 | $ | 80,552,705 | ||||||||||
Shares issued in reinvestment of distributions | 3,342,536 | 31,796,374 | 2,971,594 | 29,122,692 | ||||||||||||
Shares redeemeda | (45,752,627 | ) | (435,593,136 | ) | (39,654,519 | ) | (390,103,236 | ) | ||||||||
Net increase (decrease) | (37,812,912 | ) | $ | (360,085,250 | ) | (28,501,239 | ) | $ | (280,427,839 | ) | ||||||
Class R Shares: | ||||||||||||||||
Shares sold | 1,437,455 | $ | 13,630,121 | 2,109,693 | $ | 20,673,849 | ||||||||||
Shares issued in reinvestment of distributions | 405,340 | 3,838,586 | 334,005 | 3,263,282 | ||||||||||||
Shares redeemed | (3,962,132 | ) | (37,467,349 | ) | (6,343,188 | ) | (62,189,568 | ) | ||||||||
Net increase (decrease) | (2,119,337 | ) | $ | (19,998,642 | ) | (3,899,490 | ) | $ | (38,252,437 | ) | ||||||
Class R6 Shares: | ||||||||||||||||
Shares sold | 10,323,576 | $ | 98,464,071 | 16,787,902 | $ | 165,966,032 | ||||||||||
Shares issued in reinvestment of distributions | 1,882,797 | 17,913,831 | 1,355,636 | 13,298,999 | ||||||||||||
Shares redeemed | (25,303,121 | ) | (240,047,590 | ) | (10,569,929 | ) | (104,068,148 | ) | ||||||||
Net increase (decrease) | (13,096,748 | ) | $ | (123,669,688 | ) | 7,573,609 | $ | 75,196,883 | ||||||||
Advisor Class Shares: | ||||||||||||||||
Shares sold | 18,952,628 | $ | 180,567,542 | 27,736,896 | $ | 273,558,768 | ||||||||||
Shares issued in reinvestment of distributions | 3,899,671 | 37,096,165 | 3,187,566 | 31,290,077 | ||||||||||||
Shares redeemed | (56,752,457 | ) | (539,937,594 | ) | (42,428,324 | ) | (418,538,766 | ) | ||||||||
Net increase (decrease) | (33,900,158 | ) | $ | (322,273,887 | ) | (11,503,862 | ) | $ | (113,689,921 | ) | ||||||
aMay include a portion of Class C shares that were automatically converted to Class A. | ||||||||||||||||
54 | Annual Report | franklintempleton.com | ||
FRANKLIN STRATEGIC SERIES
NOTES TO CONSOLIDATED FINANCIAL STATEMENTS
Franklin Strategic Income Fund(continued)
3. Transactions with Affiliates
Franklin Resources, Inc. is the holding company for various subsidiaries that together are referred to as Franklin Templeton. Certain
officers and trustees of the Trust are also officers and/or directors of the following subsidiaries:
| Subsidiary | Affiliation | |
| Franklin Advisers, Inc. (Advisers) | Investment manager | |
| Franklin Templeton Services, LLC (FT Services) | Administrative manager | |
| Franklin Templeton Distributors, Inc. (Distributors) | Principal underwriter | |
| Franklin Templeton Investor Services, LLC (Investor Services) | Transfer agent |
a. Management Fees
The Fund pays an investment management fee to Advisers based on the average daily net assets of the Fund as follows:
| Annualized Fee Rate | Net Assets | |
| 0.625% | Up to and including $100 million | |
| 0.500% | Over $100 million, up to and including $250 million | |
| 0.450% | Over $250 million, up to and including $7.5 billion | |
| 0.440% | Over $7.5 billion, up to and including $10 billion | |
| 0.430% | Over $10 billion, up to and including $12.5 billion | |
| 0.420% | Over $12.5 billion, up to and including $15 billion | |
| 0.400% | Over $15 billion, up to and including $17.5 billion | |
| 0.380% | Over $17.5 billion, up to and including $20 billion | |
| 0.360% | Over $20 billion, up to and including $35 billion | |
| 0.355% | Over $35 billion, up to and including $50 billion | |
| 0.350% | In excess of $50 billion |
For the year ended April 30, 2019, the gross effective investment management fee rate was 0.455% of the Fund’s average daily net assets.
b. Administrative Fees
Under an agreement with Advisers, FT Services provides administrative services to the Fund. The fee is paid by Advisers based on the Fund’s average daily net assets, and is not an additional expense of the Fund.
c. Distribution Fees
The Board has adopted distribution plans for each share class, with the exception of Class R6 and Advisor Class shares, pursuant to Rule12b-1 under the 1940 Act. Under the Fund’s Class A reimbursement distribution plan, the Fund reimburses Distributors for costs incurred in connection with the servicing, sale and distribution of the Fund’s shares up to the maximum annual plan rate. Under the Class A reimbursement distribution plan, costs exceeding the maximum for the current plan year cannot be reimbursed in subsequent periods. In addition, under the Fund’s Class C and R compensation distribution plans, the Fund pays Distributors for costs incurred in connection with the servicing, sale and distribution of the Fund’s shares up to the maximum annual plan rate for each class. The plan year, for purposes of monitoring compliance with the maximum annual plan rates, is February 1 through January 31.
franklintempleton.com | Annual Report | 55 | ||
FRANKLIN STRATEGIC SERIES
NOTES TO CONSOLIDATED FINANCIAL STATEMENTS
Franklin Strategic Income Fund(continued)
3. Transactions with Affiliates(continued)
c. Distribution Fees(continued)
The maximum annual plan rates, based on the average daily net assets, for each class, are as follows:
Class A | 0.25 | % | ||
Class C | 0.65 | % | ||
Class R | 0.50 | % |
d. Sales Charges/Underwriting Agreements
Front-end sales charges and contingent deferred sales charges (CDSC) do not represent expenses of the Fund. These charges are deducted from the proceeds of sales of Fund shares prior to investment or from redemption proceeds prior to remittance, as applicable. Distributors has advised the Fund of the following commission transactions related to the sales and redemptions of the Fund’s shares for the year:
Sales charges retained net of commissions paid to unaffiliated brokers/dealers | $ | 222,236 | ||
CDSC retained | $ | 25,401 | ||
Effective March 1, 2019, certainfront-end sales charges on Class A and A1 shares, if any, were lowered. Further details are disclosed in the Fund’s Prospectus.
e. Transfer Agent Fees
Each class of shares pays transfer agent fees to Investor Services for its performance of shareholder servicing obligations. The fees are based on an annualized asset based fee of 0.02% plus a transaction based fee. In addition, each class reimburses Investor Services for out of pocket expenses incurred and, except for Class R6, reimburses shareholder servicing fees paid to third parties. These fees are allocated daily based upon their relative proportion of such classes’ aggregate net assets. Class R6 pays Investor Services transfer agent fees specific to that class.
For the year ended April 30, 2019, the Fund paid transfer agent fees of $7,915,611, of which $3,441,566 was retained by Investor Services.
f. Investments in Affiliated Management Investment Companies
The Fund invests in one or more affiliated management investment companies for purposes other than exercising a controlling influence over the management or policies. Management fees paid by the Fund are waived on assets invested in the affiliated management investment companies, as noted in the Consolidated Statement of Operations, in an amount not to exceed the management and administrative fees paid directly or indirectly by each affiliate. During the year ended April 30, 2019, the Fund held investments in affiliated management investment companies as follows:
| Number of Shares Held at Beginning of Year | Gross Additions | Gross Reductions | Number of Held at End of Year | Value at End of Year | Dividend Income | Realized Gain (Loss) | Net Change in Unrealized Appreciation (Depreciation) | |||||||||||||||||||||||||
Controlled Affiliates | ||||||||||||||||||||||||||||||||
Franklin Lower Tier Floating Rate Fund | 25,361,119 | — | (25,361,119 | )a | — | $ | — | $ | 21,162,839 | $ | (34,375,561 | ) | $ | — | ||||||||||||||||||
Franklin Middle Tier Floating Rate Fund | 21,833,687 | — | — | 21,833,687 | 194,101,482 | 15,661,195 | — | (12,445,202 | ) | |||||||||||||||||||||||
|
| |||||||||||||||||||||||||||||||
Total Controlled Affiliates |
| $ | 194,101,482 | $ | 36,824,034 | $ | (34,375,561 | ) | $ | (12,445,202 | ) | |||||||||||||||||||||
|
| |||||||||||||||||||||||||||||||
56 | Annual Report | franklintempleton.com | ||
FRANKLIN STRATEGIC SERIES
NOTES TO CONSOLIDATED FINANCIAL STATEMENTS
Franklin Strategic Income Fund(continued)
| Number of Shares Held at Beginning of Year | Gross Additions | Gross Reductions | Number of Shares Held at End of Year | Value at End of Year | Dividend Income | Realized Gain (Loss) | Net Change in Unrealized Appreciation (Depreciation) | |||||||||||||||||||||||||
Non-Controlled Affiliates | ||||||||||||||||||||||||||||||||
Institutional Fiduciary Trust Money Market Portfolio, 2.10% | 200,193,361 | 284,937,373 | (421,946,957 | ) | 63,183,777 | $ | 63,183,777 | $ | 1,736,770 | $ | — | $ | — | |||||||||||||||||||
|
| |||||||||||||||||||||||||||||||
Total Affiliated Securities |
| $ | 257,285,259 | $ | 38,560,804 | $ | (34,375,561 | ) | $ | (12,445,202 | ) | |||||||||||||||||||||
|
| |||||||||||||||||||||||||||||||
aThe Fund sold shares of the affiliate through anin-kind transfer of common stocks and other equity interests, corporate bonds and senior floating rate interests securities and cash. See Note 6.
g. Waiver and Expense Reimbursements
Investor Services has voluntarily agreed in advance to waive or limit its fees so that the Class R6 transfer agent fees do not exceed 0.02% based on the average net assets of the class. Investor Services may discontinue this waiver in the future.
h. Interfund Transactions
The Fund engaged in purchases and sales of investments with funds or other accounts that have common investment managers (or affiliated investment managers), directors, trustees or officers. During the year ended April 30, 2019, these purchase and sale transactions (excludingin-kind transactions) aggregated $589,399 and $0, respectively. See Note 3(f).
4. Expense Offset Arrangement
The Fund has entered into an arrangement with its custodian whereby credits realized as a result of uninvested cash balances are used to reduce a portion of the Fund’s custodian expenses. During the year ended April 30, 2019, the custodian fees were reduced as noted in the Consolidated Statement of Operations.
5. Income Taxes
For tax purposes, capital losses may be carried over to offset future capital gains, if any. At April 30, 2019, the capital loss carryforwards were as follows:
Capital loss carryforwards not subject to expiration: | ||||
Short term | $ | 33,032,070 | ||
Long term | 441,662,444 | |||
|
| |||
Total capital loss carryforwards | $ | 474,694,514 | ||
|
|
The tax character of distributions paid during the years ended April 30, 2019 and 2018, was as follows:
| 2019 | 2018 | |||||||
|
| |||||||
Distributions paid from ordinary income | $ | 234,515,065 | $ | 187,957,867 | ||||
|
| |||||||
franklintempleton.com | Annual Report | 57 | ||
FRANKLIN STRATEGIC SERIES
NOTES TO CONSOLIDATED FINANCIAL STATEMENTS
Franklin Strategic Income Fund(continued)
5. Income Taxes(continued)
At April 30, 2019, the cost of investments, net unrealized appreciation (depreciation) and undistributed ordinary income for income
tax purposes were as follows:
Cost of investments | $ | 5,227,364,068 | ||
|
| |||
Unrealized appreciation | $ | 79,689,821 | ||
Unrealized depreciation | (227,603,542 | ) | ||
|
| |||
Net unrealized appreciation (depreciation) | $ | (147,913,721 | ) | |
|
| |||
Distributable earnings-undistributed ordinary income | $ | 2,304,402 | ||
|
| |||
Differences between income and/or capital gains as determined on a book basis and a tax basis are primarily due to differing treatments of paydown losses, bond discounts and premiums, swaps and financial futures transactions.
6. Investment Transactions
Purchases and sales of investments (excluding short term securities) for the year ended April 30, 2019, aggregated $6,423,784,686 and $7,399,557,434, respectively. Purchases and sales of investments excludein-kind transactions of $182,139,208 and $218,465,749, respectively.
7. Credit Risk and Defaulted Securities
At April 30, 2019, the Fund had 43.5% of its portfolio invested in high yield, senior secured floating rate loans, or other securities rated below investment grade and unrated securities, if any. These securities may be more sensitive to economic conditions causing greater price volatility and are potentially subject to a greater risk of loss due to default than higher rated securities.
The Fund held defaulted securities and/or other securities for which the income has been deemed uncollectible. At April 30, 2019, the aggregate value of these securities was $45,810,500, representing 0.9% of the Fund’s net assets. The Fund discontinues accruing income on securities for which income has been deemed uncollectible and provides an estimate for losses on interest receivable. The securities have been identified in the accompanying Consolidated Statement of Investments.
8. Restricted Securities
The Fund invests in securities that are restricted under the Securities Act of 1933 (1933 Act). Restricted securities are often purchased in private placement transactions, and cannot be sold without prior registration unless the sale is pursuant to an exemption under the 1933 Act. Disposal of these securities may require greater effort and expense, and prompt sale at an acceptable price may be difficult. The Fund may have registration rights for restricted securities. The issuer generally incurs all registration costs.
At April 30, 2019, investments in restricted securities, excluding securities exempt from registration under the 1933 Act deemed to be liquid, were as follows:
| Principal Amount/ Shares/ Units | Issuer | Acquisition Date | Cost | Value | ||||||||||
331,325 | aAppvion Operations Inc. | 4/12/19 | $ | 4,481,262 | $ | 4,615,489 | ||||||||
125,940,079 | K2016470219 South Africa Ltd., A | 2/08/13 - 2/01/17 | 977,122 | 88,110 | ||||||||||
12,532,821 | K2016470219 South Africa Ltd., B | 2/01/17 | 9,305 | 8,768 | ||||||||||
58 | Annual Report | franklintempleton.com | ||
FRANKLIN STRATEGIC SERIES
NOTES TO CONSOLIDATED FINANCIAL STATEMENTS
Franklin Strategic Income Fund(continued)
| Principal Amount/ Shares/ Units | Issuer | Acquisition Date | Cost | Value | ||||||||||
9,834,030 | K2016470219 South Africa Ltd., senior secured note, 144A, PIK, 3.00%, 12/31/22 | 2/08/13 -12/31/18 | $ | 14,330,270 | $ | 12,171 | ||||||||
2,108,028 | K2016470260 South Africa Ltd., senior secured note, 144A, PIK, 25.00%, 12/31/22 | 2/01/17 - 12/31/18 | 1,683,618 | 77,835 | ||||||||||
124,500 | bRemington Outdoor Co. Inc., Litigation Units | 4/12/19 | — | — | ||||||||||
|
| |||||||||||||
| Total Restricted Securities(Value is 0.1% of Net Assets) | $ | 21,481,577 | $ | 4,802,373 | ||||||||||
|
| |||||||||||||
aThe Fund also invests in unrestricted securities or other investments in the issuer, valued at $7,561,696 as of April 30, 2019.
bThe Fund also invests in unrestricted securities or other investments in the issuer, valued at $2,909,366 as of April 30, 2019.
9. Other Derivative Information
At April 30, 2019, the investments in derivative contracts are reflected in the Consolidated Statement of Assets and Liabilities as follows:
| Asset Derivatives | Liability Derivatives | |||||||||||
|
| |||||||||||
Derivative Contracts Not Accounted for as Hedging Instruments | Consolidated Statement of Assets and Liabilities Location | Fair Value | Consolidated Statement of Assets and Liabilities Location | Fair Value | ||||||||
Interest rate contracts | Variation margin on futures contracts | $ | 3,845,560 | a | Variation margin on futures contracts | $ | — | |||||
Unrealized appreciation on OTC swap contracts | 10,422,358 | Unrealized depreciation on OTC swap contracts | — | |||||||||
Foreign exchange contracts | Unrealized appreciation on OTC forward exchange contracts | 4,309,631 | Unrealized depreciation on OTC forward exchange contracts | 991,064 | ||||||||
Credit contracts | Variation margin on centrally cleared swap contracts | 155,249 | a | Variation margin on centrally cleared swap contracts | — | |||||||
OTC swap contracts (upfront payments) | 4,636,391 | OTC swap contracts (upfront receipts) | 8,387,244 | |||||||||
Unrealized appreciation on OTC swap contracts | 1,414,356 | Unrealized depreciation on OTC swap contracts | 17,364,288 | |||||||||
Value recovery instruments | Investments in securities, at value | 6,406,038 | b | |||||||||
|
|
|
| |||||||||
Totals | $ | 31,189,583 | $ | 26,742,596 | ||||||||
|
|
|
| |||||||||
aThis amount reflects the cumulative appreciation (depreciation) of futures contracts and centrally cleared swap contracts as reported in the Consolidated Statement of Investments. Only the variation margin receivable/payable at period end is separately reported within the Consolidated Statement of Assets and Liabilities. Prior variation margin movements were recorded to cash upon receipt or payment.
bVRI are included in investments in securities, at value in the Consolidated Statement of Assets and Liabilities.
For the year ended April 30, 2019, the effect of derivative contracts in the Consolidated Statement of Operations was as follows:
Derivative Contracts Not Accounted for as Hedging Instruments | Consolidated Statement of Operations Location | Net Realized Gain (Loss) for | Consolidated Statement of Operations Location | Net Change in Unrealized Appreciation (Depreciation) for the Year | ||||||
Net realized gain (loss) from: | Net change in unrealized appreciation (depreciation) on: | |||||||||
Interest rate contracts | Futures contracts | $ 7,842,483 | Futures contracts | $ 2,810,354 | ||||||
Swap contracts | (2,928,599 | ) | Swap contracts | 10,422,358 | ||||||
Foreign exchange contracts | Forward exchange contracts | 2,758,198 | Forward exchange contracts | 3,007,356 | ||||||
| �� | ||||
franklintempleton.com | Annual Report | 59 | ||
FRANKLIN STRATEGIC SERIES
NOTES TO CONSOLIDATED FINANCIAL STATEMENTS
Franklin Strategic Income Fund(continued)
9. Other Derivative Information(continued)
| Derivative Contracts Not Accounted for as Hedging Instruments | Consolidated Statement of Operations Location | Net Realized Gain (Loss) for the Year | Consolidated Statement of Operations Location | Net Change in Unrealized Appreciation (Depreciation) for the Year | ||||||||
| Net realized gain (loss) from: | Net change in unrealized appreciation (depreciation) on: | |||||||||||
Credit contracts | Swap contracts | $12,565,093 | Swap contracts | $(14,582,217) | ||||||||
Value recovery instruments | Investments | 2,235,000 | a | Investments | (3,340,936)a | |||||||
|
|
|
| |||||||||
Totals | $22,472,175 | $ (1,683,085) | ||||||||||
|
|
|
| |||||||||
aVRI are included in net realized gain (loss) from investments and net change in unrealized appreciation (depreciation) on investments in the Consolidated Statement of Operations.
For the year ended April 30, 2019, the average month end notional amount of futures contracts and swap contracts, the average month end contract value for forward exchange contracts and average month end fair value of VRI, were as follows:
| ||||||
Futures Contracts | $ | 266,841,534 | ||||
Swap contracts | 655,848,008 | |||||
Forward exchange contracts | 544,155,048 | |||||
VRI | 10,520,209 | |||||
At April 30, 2019, the Fund’s OTC derivative assets and liabilities are as follows:
Gross Amounts of Assets and Liabilities Presented in the Consolidated Statement of Assets and Liabilities | ||||||||
|
| |||||||
| Assetsa | Liabilitiesa | |||||||
| ||||||||
Derivatives | ||||||||
Forward exchange contracts | $ 4,309,631 | $ 991,064 | ||||||
Swap contracts | 16,473,105 | 25,751,532 | ||||||
|
| |||||||
Total | $20,782,736 | $26,742,596 | ||||||
|
| |||||||
aAbsent an event of default or early termination, OTC derivative assets and liabilities are presented gross and not offset in the Consolidated Statement of Assets and Liabilities.
60 | Annual Report | franklintempleton.com | ||
FRANKLIN STRATEGIC SERIES
NOTES TO CONSOLIDATED FINANCIAL STATEMENTS
Franklin Strategic Income Fund(continued)
At April 30, 2019, the Fund’s OTC derivative assets, which may be offset against the Fund’s OTC derivative liabilities and collateral received from the counterparty, are as follows:
| Amounts Not Offset in the | ||||||||||||||||||||
Consolidated Statement of Assets and Liabilities | ||||||||||||||||||||
Gross Amounts of Assets Presented in the Consolidated Statement of Assets and Liabilities | Financial Instruments Available for Offset | Financial Instruments Collateral Receiveda,b | Cash Collateral Received | Net Amount (Not less than zero) | ||||||||||||||||
Counterparty | ||||||||||||||||||||
BNDP | $ 236,543 | $ (180,023 | ) | $ (56,520 | ) | $ — | $ — | |||||||||||||
BOFA | 970,858 | — | — | (890,000 | ) | 80,858 | ||||||||||||||
BZWS | 611,841 | (611,841 | ) | — | — | — | ||||||||||||||
CITI | 3,829,422 | (3,829,422 | ) | — | — | — | ||||||||||||||
DBAB | 632,615 | (21,272 | ) | (611,343 | ) | — | — | |||||||||||||
GSCO | 6,805,392 | — | — | (6,760,000 | ) | 45,392 | ||||||||||||||
JPHQ | 3,677,016 | (3,677,016 | ) | — | — | — | ||||||||||||||
MSCO | 4,019,049 | (4,019,049 | ) | — | — | — | ||||||||||||||
Total | $20,782,736 | $(12,338,623 | ) | $(667,863 | ) | $(7,650,000 | ) | $126,250 | ||||||||||||
At April 30, 2019, the Fund’s OTC derivative liabilities, which may be offset against the Fund’s OTC derivative assets and collateral pledged to the counterparty, are as follows:
|
| |||||||||||||||||||
| Amounts Not Offset in the | ||||||||||||||||||||
Consolidated Statement of Assets and Liabilities | ||||||||||||||||||||
Gross Amounts of Liabilities Presented in the Consolidated Statement of Assets and Liabilities | Financial Instruments Offset | Financial Instruments Collateral Pledged | Cash Collateral Pledgedb | Net Amount (Not less than zero) | ||||||||||||||||
Counterparty | ||||||||||||||||||||
BNDP | $ 180,023 | $ (180,023 | ) | $ — | $ — | $ — | ||||||||||||||
BZWS | 861,121 | (611,841 | ) | — | (249,280 | ) | — | |||||||||||||
CITI | 7,227,791 | (3,829,422 | ) | — | (3,260,000 | ) | 138,369 | |||||||||||||
DBAB | 21,272 | (21,272 | ) | — | — | — | ||||||||||||||
JPHQ | 4,680,660 | (3,677,016 | ) | — | (325,000 | ) | 678,644 | |||||||||||||
MSCO | 13,771,729 | (4,019,049 | ) | — | (9,752,680 | ) | — | |||||||||||||
Total | $26,742,596 | $(12,338,623 | ) | $ — | $(13,586,960 | ) | $ 817,013 | |||||||||||||
aAt April 30, 2019, the Fund received U.S. Treasury Bonds and Notes as collateral for derivatives.
bIn some instances, the collateral amounts disclosed in the table above were adjusted due to the requirement to limit collateral amounts to avoid the effect of overcollateralization. Actual collateral received and/or pledged may be more than the amounts disclosed herein.
See Note 1(e) regarding derivative financial instruments.
See Abbreviations on page 66.
franklintempleton.com | Annual Report | 61 | ||
FRANKLIN STRATEGIC SERIES
NOTES TO CONSOLIDATED FINANCIAL STATEMENTS
Franklin Strategic Income Fund(continued)
10. Holdings of 5% Voting Securities of Portfolio Companies
The 1940 Act defines “affiliated companies” to include investments in portfolio companies in which a fund owns 5% or more of the outstanding voting securities. During the year ended April 30, 2019, investments in “affiliated companies” were as follows:
| Name of Issuer | Number of Shares Held at Beginning of Year | Gross Additions | Gross Reductions | Number of of Year | Value at End of Year | Dividend Income | Realized Gain (Loss) | Net Change in Unrealized Appreciation (Depreciation) | ||||||||||||||||||||||||
| ||||||||||||||||||||||||||||||||
Non-Controlled Affiliates | ||||||||||||||||||||||||||||||||
Remington Outdoor Co. Inc. | — | 1,322,439 | a | — | 1,322,439 | $ | 2,909,366 | $ — | $ — | $1,223,257 | ||||||||||||||||||||||
Remington Outdoor Co. Inc., Litigation Units | — | 124,500 | a | — | 124,500 | — | — | — | — | |||||||||||||||||||||||
|
| |||||||||||||||||||||||||||||||
Total Affiliated Securities(Value is 0.1% of Net Assets) | $ | 2,909,366 | $ — | $ — | $1,223,257 | |||||||||||||||||||||||||||
|
| |||||||||||||||||||||||||||||||
aGross addition was the result of anin-kind transfer of securities.
11. Credit Facility
The Fund, together with other U.S. registered and foreign investment funds (collectively, Borrowers), managed by Franklin Templeton, are borrowers in a joint syndicated senior unsecured credit facility totaling $2 billion (Global Credit Facility) which matures on February 7, 2020. This Global Credit Facility provides a source of funds to the Borrowers for temporary and emergency purposes, including the ability to meet future unanticipated or unusually large redemption requests.
Under the terms of the Global Credit Facility, the Fund shall, in addition to interest charged on any borrowings made by the Fund and other costs incurred by the Fund, pay its share of fees and expenses incurred in connection with the implementation and maintenance of the Global Credit Facility, based upon its relative share of the aggregate net assets of all of the Borrowers, including an annual commitment fee of 0.15% based upon the unused portion of the Global Credit Facility. These fees are reflected in other expenses in the Consolidated Statement of Operations. During the year ended April 30, 2019, the Fund did not use the Global Credit Facility.
12. Fair Value Measurements
The Fund follows a fair value hierarchy that distinguishes between market data obtained from independent sources (observable inputs) and the Fund’s own market assumptions (unobservable inputs). These inputs are used in determining the value of the Fund’s financial instruments and are summarized in the following fair value hierarchy:
| • | Level 1 – quoted prices in active markets for identical financial instruments |
| • | Level 2 – other significant observable inputs (including quoted prices for similar financial instruments, interest rates, prepayment speed, credit risk, etc.) |
| • | Level 3 – significant unobservable inputs (including the Fund’s own assumptions in determining the fair value of financial instruments) |
The input levels are not necessarily an indication of the risk or liquidity associated with financial instruments at that level.
62 | Annual Report | franklintempleton.com | ||
FRANKLIN STRATEGIC SERIES
NOTES TO CONSOLIDATED FINANCIAL STATEMENTS
Franklin Strategic Income Fund(continued)
A summary of inputs used as of April 30, 2019, in valuing the Fund’s assets and liabilities carried at fair value, is as follows:
Level 1
| Level 2
| Level 3
| Total
| |||||||||||||
Assets: | ||||||||||||||||
Investments in Securities:a | ||||||||||||||||
Equity Investments:b | ||||||||||||||||
Commercial & Professional Services | $ | — | $ | 2,909,366 | $ | — | $ | 2,909,366 | ||||||||
Consumer Services | — | — | 122,759 | 122,759 | ||||||||||||
Energy | 3,813,395 | 9,565,263 | 2 | 13,378,660 | ||||||||||||
Materials | 886,173 | — | 4,615,489 | 5,501,662 | ||||||||||||
Retailing | — | — | 96,878 | 96,878 | ||||||||||||
Software & Services | — | — | 750,000 | 750,000 | ||||||||||||
All Other Equity Investments | 194,101,482 | — | — | 194,101,482 | ||||||||||||
Corporate Bonds: | ||||||||||||||||
Retailing | — | 16,391,981 | 90,006 | 16,481,987 | ||||||||||||
All Other Corporate Bonds | — | 1,738,533,829 | — | 1,738,533,829 | ||||||||||||
Senior Floating Rate Interests: | ||||||||||||||||
Household & Personal Products | — | — | 42,108,964 | 42,108,964 | ||||||||||||
Software & Services | — | 2,961,815 | 19,883,394 | 22,845,209 | ||||||||||||
All Other Senior Floating Rate Interests | — | 510,259,767 | — | 510,259,767 | ||||||||||||
Foreign Government and Agency Securities | — | 276,376,001 | — | 276,376,001 | ||||||||||||
U.S. Government and Agency Securities | — | 281,356,952 | — | 281,356,952 | ||||||||||||
Asset-Backed Securities and Commercial Mortgage-Backed Securities | — | 1,272,329,172 | — | 1,272,329,172 | ||||||||||||
Mortgage-Backed Securities | — | 458,728,031 | — | 458,728,031 | ||||||||||||
Municipal Bonds | — | 86,980,430 | — | 86,980,430 | ||||||||||||
Escrows and Litigation Trusts | — | 75,000 | — | c | 75,000 | |||||||||||
Short Term Investments | 63,183,777 | 97,392,171 | — | 160,575,948 | ||||||||||||
Total Investments in Securities | $ | 261,984,827 | $ | 4,753,859,778 | $ | 67,667,492 | $ | 5,083,512,097 | ||||||||
Other Financial Instruments: | ||||||||||||||||
Futures Contracts | $ | 3,845,560 | $ | — | $ | — | $ | 3,845,560 | ||||||||
Forward Exchange Contracts | — | 4,309,631 | — | 4,309,631 | ||||||||||||
Swap Contracts | — | 11,991,963 | — | 11,991,963 | ||||||||||||
Total Other Financial Instruments | $ | 3,845,560 | $ | 16,301,594 | $ | — | $ | 20,147,154 | ||||||||
Liabilities: | ||||||||||||||||
Other Financial Instruments: | ||||||||||||||||
Forward Exchange Contracts | $ | — | $ | 991,064 | $ | — | $ | 991,064 | ||||||||
Swap Contracts | — | 17,364,288 | — | 17,364,288 | ||||||||||||
Total Other Financial Instruments | $ | — | $ | 18,355,352 | $ | — | $ | 18,355,352 | ||||||||
aFor detailed categories, see the accompanying Consolidated Statement of Investments.
bIncludes common stocks and management investment companies as well as other equity interests.
cIncludes securities determined to have no value at April 30, 2019.
franklintempleton.com | Annual Report | 63 | ||
FRANKLIN STRATEGIC SERIES
NOTES TO CONSOLIDATED FINANCIAL STATEMENTS
Franklin Strategic Income Fund(continued)
12. Fair Value Measurements(continued)
A reconciliation of assets in which Level 3 inputs are used in determining fair value is presented when there are significant Level 3 financial instruments at the beginning and/or end of the year. At April 30, 2019, the reconciliation of assets is as follows:
| Balance at Beginning of Year | Purchases | Sales | Transfer Into Level 3a | Transfer Out of Level 3 | Cost Basis Adjustments | Net (Loss) | Net Unrealized Appreciation (Depreciation) | Balance at End of Year | Net Change in Unrealized Appreciation (Depreciation) on Assets Held at Year End | |||||||||||||||||||||||||||||||
| ||||||||||||||||||||||||||||||||||||||||
Assets: | ||||||||||||||||||||||||||||||||||||||||
Investments in Securities: | ||||||||||||||||||||||||||||||||||||||||
Equity Investments:b | ||||||||||||||||||||||||||||||||||||||||
Consumer Services | $1,009,115 | $ — | $ — | $ — | $— | $— | $ — | $ (886,356 | ) | $ 122,759 | $(886,356 | ) | ||||||||||||||||||||||||||||
Energy | 1,083 | — | — | — | — | — | — | (1,081 | ) | 2 | (1,081 | ) | ||||||||||||||||||||||||||||
Materials | — | 4,481,262 | c | — | — | — | — | — | 134,227 | 4,615,489 | 134,227 | |||||||||||||||||||||||||||||
Retailing | 111,118 | — | — | — | — | — | — | (14,240 | ) | 96,878 | (14,240 | ) | ||||||||||||||||||||||||||||
Software & Services | — | 750,000 | — | — | — | — | — | — | 750,000 | — | ||||||||||||||||||||||||||||||
Transportation | 1,895,749 | — | (1,512,758 | ) | — | — | — | (5,977,606 | ) | 5,594,615 | — | — | ||||||||||||||||||||||||||||
Corporate Bonds: | ||||||||||||||||||||||||||||||||||||||||
Retailing | 230,474 | — | — | 12,081 | — | — | — | (152,549 | ) | 90,006 | (152,549 | ) | ||||||||||||||||||||||||||||
Senior Floating Rate Interests: | ||||||||||||||||||||||||||||||||||||||||
Household & Personal Products | — | 42,008,717 | c | — | — | — | — | — | 100,247 | 42,108,964 | 100,247 | |||||||||||||||||||||||||||||
Software & Services | — | 20,000,000 | c | — | — | — | — | — | (116,606 | ) | 19,883,394 | (116,606 | ) | |||||||||||||||||||||||||||
Escrows and Litigation Trusts | — | d | — | c,d | — | — | — | — | — | — | — | d | — | |||||||||||||||||||||||||||
|
| |||||||||||||||||||||||||||||||||||||||
Total Investments in Securities | $ 3,247,539 | $67,239,979 | $(1,512,758 | ) | $12,081 | $— | $— | $(5,977,606 | ) | $4,658,257 | $67,667,492 | $(936,358 | ) | |||||||||||||||||||||||||||
|
| |||||||||||||||||||||||||||||||||||||||
aThe investments were transferred into Level 3 as a result of the unavailability of a quoted market price in an active market for identical securities and other significant observable valuation inputs.
bIncludes common stocks as well as other equity interests.
cIncludes securities received as a result of anin-kind transfer.
dIncludes securities determined to have no value.
64 | Annual Report | franklintempleton.com | ||
FRANKLIN STRATEGIC SERIES
NOTES TO CONSOLIDATED FINANCIAL STATEMENTS
Franklin Strategic Income Fund(continued)
Significant unobservable valuation inputs for material Level 3 financial instruments and impact to fair value as a result of changes in unobservable valuation inputs as of April 30, 2019, are as follows:
| Description | Fair Value at End of Year | Valuation Technique | Unobservable Input | Amount/ Range (Weighted Averagea) | Impact to Fair Value if Input Increasesb | |||||
| ||||||||||
Assets: | ||||||||||
Investments in Securities: | ||||||||||
Senior Floating Rate Interests: | ||||||||||
Household & Personal Products | $39,510,545 | Discounted cash flow | Free cash flow | $18.9 - $32.4 mil | Increasec | |||||
| ||||||||||
| Discount rate | 11.4% - 12.3% (11.7%) | Decrease | ||||||||
| ||||||||||
Software & Services | 19,883,394 | Discounted cash flow | Free cash flow | $28.7 mil | Increasec | |||||
| ||||||||||
| Discount rate | 20.0% | Decreased | ||||||||
| ||||||||||
All other investmentse | 8,273,553f | |||||||||
| ||||||||||
Total | $67,667,492 | |||||||||
| ||||||||||
aWeighted based on the relative fair value of the financial instruments.
bRepresents the directional change in the fair value of the Level 3 financial instruments that would result from a significant and reasonable increase in the corresponding input. A significant and reasonable decrease in the input would have the opposite effect. Significant impacts, if any, to fair value and/or net assets have been indicated.
cRepresents a significant impact to fair value and net assets.
dRepresents a significant impact to fair value but not net assets.
eIncludes fair value of immaterial financial instruments developed using various valuation techniques and unobservable inputs. May also include financial instruments with values derived using private transaction prices ornon-public third party pricing information which is unobservable.
fIncludes securities determined to have no value at April 30, 2019.
13. Subsequent Events
The Fund has evaluated subsequent events through the issuance of the financial statements and determined that no events have occurred that require disclosure.
franklintempleton.com | Annual Report | 65 | ||
FRANKLIN STRATEGIC SERIES
NOTES TO CONSOLIDATED FINANCIAL STATEMENTS
Franklin Strategic Income Fund(continued)
Abbreviations
| Counterparty | Currency | Selected Portfolio | ||||||||
BNDP | BNP Paribas | BRL | Brazilian Real | ARM | Adjustable Rate Mortgage | |||||
BOFA | Bank of America Corp. | COP | Colombian Peso | CLO | Collateralized Loan Obligation | |||||
BZWS | Barclays Bank PLC | DOP | Dominican Peso | CMT | Constant Maturity Treasury Index | |||||
CITI | Citigroup, Inc. | EUR | Euro | FRN | Floating Rate Note | |||||
DBAB | Deutsche Bank AG | GBP | British Pound | GDP | Gross Domestic Product | |||||
GSCO | The Goldman Sachs Group, Inc. | IDR | Indonesian Rupiah | GO | General Obligation | |||||
JPHQ | JP Morgan Chase & Co. | MXN | Mexican Peso | HDC | Housing Development Corp. | |||||
MSCO | Morgan Stanley | USD | United States Dollar | LIBOR | London InterBank Offered Rate | |||||
| UYU | Uruguayan Peso | MBS | Mortgage-Backed Security | |||||||
| ZAR | South African Rand | PIK | Payment-In-Kind | |||||||
| RDA | Redevelopment Agency/Authority | |||||||||
| SF | Single Family | |||||||||
| TBD | To be determined | |||||||||
| T-Note | Treasury Note | |||||||||
| VRI | Value Recovery Instruments | |||||||||
Index | ||||
CDX.EM.30 | CDX Emerging Markets Index | |||
MCDX.NA.31 | MCDX North America Index |
66 | Annual Report | franklintempleton.com | ||
FRANKLIN STRATEGIC SERIES
Report of Independent Registered Public Accounting Firm
To the Board of Trustees of Franklin Strategic Series and Shareholders of Franklin Strategic Income Fund
Opinion on the Financial Statements
We have audited the accompanying consolidated statement of assets and liabilities, including the consolidated statement of investments, of Franklin Strategic Income Fund and its subsidiary (the “Fund”) as of April 30, 2019, the related consolidated statements of operations for the year ended April 30, 2019, the consolidated statement of changes in net assets for each of the two years in the period ended April 30, 2019, including the related notes, and the consolidated financial highlights for each of the five years in the period ended April 30, 2019 (collectively referred to as the “consolidated financial statements”). In our opinion, the consolidated financial statements present fairly, in all material respects, the consolidated financial position of the Fund as of April 30, 2019, the results of their operations for the year then ended, the changes in their net assets for each of the two years in the period ended April 30, 2019 and the consolidated financial highlights for each of the five years in the period ended April 30, 2019 in conformity with accounting principles generally accepted in the United States of America.
Basis for Opinion
These financial statements are the responsibility of the Fund’s management. Our responsibility is to express an opinion on the Fund’s consolidated financial statements based on our audits. We are a public accounting firm registered with the Public Company Accounting Oversight Board (United States) (PCAOB) and are required to be independent with respect to the Fund in accordance with the U.S. federal securities laws and the applicable rules and regulations of the Securities and Exchange Commission and the PCAOB.
We conducted our audits of these consolidated financial statements in accordance with the standards of the PCAOB. Those standards require that we plan and perform the audit to obtain reasonable assurance about whether the financial statements are free of material misstatement, whether due to error or fraud.
Our audits included performing procedures to assess the risks of material misstatement of the financial statements, whether due to error or fraud, and performing procedures that respond to those risks. Such procedures included examining, on a test basis, evidence regarding the amounts and disclosures in the financial statements. Our audits also included evaluating the accounting principles used and significant estimates made by management, as well as evaluating the overall presentation of the consolidated financial statements. Our procedures included confirmation of securities owned as of April 30, 2019 by correspondence with the custodian, transfer agent and brokers; when replies were not received from brokers, we performed other auditing procedures. We believe that our audits provide a reasonable basis for our opinion.
PricewaterhouseCoopers LLP
San Francisco, California
June 17, 2019
We have served as the auditor of one or more investment companies in the Franklin Templeton Group of Funds since 1948.
franklintempleton.com | Annual Report | 67 | ||
FRANKLIN STRATEGIC SERIES
Board Members and Officers
The name, year of birth and address of the officers and board members, as well as their affiliations, positions held with the Trust, principal occupations during at least the past five years and number of U.S. registered portfolios overseen in the Franklin Templeton fund complex, are shown below. Generally, each board member serves until that person’s successor is elected and qualified.
Independent Board Members
Name, Year of Birth and Address
| Position
| Length of
| Number of Portfolios in Fund Complex Overseen by Board Member*
| Other Directorships Held During at Least the Past 5 Years
| ||||
Harris J. Ashton (1932) One Franklin Parkway San Mateo, CA 94403-1906 | Trustee | Since 1991 | 136 | Bar-S Foods (meat packing company) (1981-2010). | ||||
| Principal Occupation During at Least the Past 5 Years: | ||||||||
| Director of various companies; andformerly, Director, RBC Holdings, Inc. (bank holding company) (until 2002); and President, Chief Executive Officer and Chairman of the Board, General Host Corporation (nursery and craft centers) (until 1998). | ||||||||
Terrence J. Checki (1945) One Franklin Parkway San Mateo, CA 94403-1906 | Trustee | Since 2017 | 112 | Hess Corporation (exploration of oil and gas) (2014-present). | ||||
Principal Occupation During at Least the Past 5 Years: Member of the Council on Foreign Relations (1996-present); Member of the National Committee on U.S.-China Relations (1999-present); member of the Board of Trustees of the Economic Club of New York (2013-present); member of the Board of Trustees of the Foreign Policy Association (2005-present) and member of various other boards of trustees and advisory boards; andformerly, Executive Vice President of the Federal Reserve Bank of New York and Head of its Emerging Markets and Internal Affairs Group and Member of Management Committee (1995-2014); and Visiting Fellow at the Council on Foreign Relations (2014). | ||||||||
Mary C. Choksi (1950) One Franklin Parkway San Mateo, CA 94403-1906 | Trustee | Since 2014 | 136 | Avis Budget Group Inc. (car rental) (2007-present), Omnicom Group Inc. (advertising and marketing communications services) (2011-present) and White Mountains Insurance Group, Ltd. (holding company) (2017-present). | ||||
Principal Occupation During at Least the Past 5 Years: Director of various companies; andformerly, Founder and Senior Advisor, Strategic Investment Group (investment management group) (2015-2017); Founding Partner and Senior Managing Director, Strategic Investment Group (1987-2015); Founding Partner and Managing Director, Emerging Markets Management LLC (investment management firm) (1987-2011); and Loan Officer/Senior Loan Officer/Senior Pension Investment Officer, World Bank Group (international financial institution) (1977-1987). | ||||||||
Edith E. Holiday (1952) One Franklin Parkway San Mateo, CA 94403-1906 | Lead Independent Trustee | Trustee since 1998 and Lead Independent Trustee since March 2019 | 136 | Hess Corporation (exploration of oil and gas) (1993-present), Canadian National Railway (railroad) (2001-present), White Mountains Insurance Group, Ltd. (holding company) (2004-present), Santander Consumer USA Holdings, Inc. (consumer finance) (2016-present), RTI International Metals, Inc. (manufacture and distribution of titanium) (1999-2015) and H.J. Heinz Company (processed foods and allied products) (1994-2013). | ||||
Principal Occupation During at Least the Past 5 Years: Director or Trustee of various companies and trusts; andformerly, Assistant to the President of the United States and Secretary of the Cabinet (1990-1993); General Counsel to the United States Treasury Department (1989-1990); and Counselor to the Secretary and Assistant Secretary for Public Affairs and Public Liaison–United States Treasury Department (1988-1989). | ||||||||
J. Michael Luttig (1954) One Franklin Parkway San Mateo, CA 94403-1906 | Trustee | Since 2009 | 136 | Boeing Capital Corporation (aircraft financing) (2006-2013). | ||||
Principal Occupation During at Least the Past 5 Years: Executive Vice President, Counselor and Senior Advisor to Boeing Chairman and Board of Directors, The Boeing Company (aerospace company) (May 2019); andformerly, General Counsel and member of the Executive Council, The Boeing Company (2006-2019); Federal Appeals Court Judge, U.S. Court of Appeals for the Fourth Circuit (1991-2006). | ||||||||
68 | Annual Report | franklintempleton.com | ||
FRANKLIN STRATEGIC SERIES
Independent Board Members(continued)
Name, Year of Birth and Address
| Position
| Length of Time Served
| Number of Portfolios in Fund Complex Overseen by Board Member*
| Other Directorships Held During at Least the Past 5 Years
| ||||
Larry D. Thompson (1945) One Franklin Parkway San Mateo, CA 94403-1906 | Trustee | Since 2007 | 136 | The Southern Company (energy company) (2014-present; previously 2010-2012), Graham Holdings Company (education and media organization) (2011-present) and Cbeyond, Inc. (business communications provider) (2010-2012). | ||||
| Principal Occupation During at Least the Past 5 Years: | ||||||||
| Director of various companies; Counsel, Finch McCranie, LLP (law firm) (2015-present); Independent Compliance Monitor and Auditor, Volkswagen AG (manufacturer of automobiles and commercial vehicles) (2017-present); John A. Sibley Professor of Corporate and Business Law, University of Georgia School of Law (2015-present; previously 2011-2012); andformerly, Executive Vice President – Government Affairs, General Counsel and Corporate Secretary, PepsiCo, Inc. (consumer products) (2012-2014); Senior Vice President – Government Affairs, General Counsel and Secretary, PepsiCo, Inc. (2004-2011); Senior Fellow of The Brookings Institution (2003-2004); Visiting Professor, University of Georgia School of Law (2004); and Deputy Attorney General, U.S. Department of Justice (2001-2003). | ||||||||
Interested Board Members and Officers
| ||||||||
Name, Year of Birth and Address
| Position
| Length of Time Served
| Number of Portfolios in Fund Complex Overseen by Board Member*
| Other Directorships Held During at Least the Past 5 Years
| ||||
**Gregory E. Johnson (1961) One Franklin Parkway San Mateo, CA 94403-1906 | Trustee | Since 2013 | 150 | None | ||||
| Principal Occupation During at Least the Past 5 Years: | ||||||||
Chairman of the Board, Member – Office of the Chairman, Director and Chief Executive Officer, Franklin Resources, Inc.; officer and/or director or
| ||||||||
**Rupert H. Johnson, Jr. (1940) One Franklin Parkway San Mateo, CA 94403-1906 | Chairman of the Board and Trustee | Chairman of the Board since 2013 and Trustee since 1991 | 136 | None | ||||
| Principal Occupation During at Least the Past 5 Years: | ||||||||
| Vice Chairman, Member – Office of the Chairman and Director, Franklin Resources, Inc.; Director, Franklin Advisers, Inc.; and officer and/or director or trustee, as the case may be, of some of the other subsidiaries of Franklin Resources, Inc. and of 40 of the investment companies in Franklin Templeton. | ||||||||
Alison E. Baur (1964) One Franklin Parkway San Mateo, CA 94403-1906 | Vice President | Since 2012 | Not Applicable | Not Applicable | ||||
| Principal Occupation During at Least the Past 5 Years: | ||||||||
| Deputy General Counsel, Franklin Templeton; and officer of some of the other subsidiaries of Franklin Resources, Inc. and of 44 of the investment companies in Franklin Templeton. | ||||||||
Sonal Desai, Ph.D. (1963) One Franklin Parkway San Mateo, CA 94403-1906 | Vice President | Since December 2018 | Not Applicable | Not Applicable | ||||
| Principal Occupation During at Least the Past 5 Years: | ||||||||
| Director and Executive Vice President, Franklin Advisers, Inc.; Executive Vice President, Franklin Templeton Institutional, LLC; and officer of 18 of the investment companies in Franklin Templeton. | ||||||||
franklintempleton.com | Annual Report | 69 | ||
FRANKLIN STRATEGIC SERIES
Interested Board Members and Officers(continued)
Name, Year of Birth and Address | Position | Length of Time Served | Number of Portfolios in Fund Complex Overseen by Board Member* | Other Directorships Held During at Least the Past 5 Years | ||||
Gaston Gardey (1967) One Franklin Parkway SanMateo, CA 94403-1906 | Treasurer, Chief Financial Officer and, Chief Accounting Officer | Since 2009 | Not Applicable | Not Applicable | ||||
| Principal Occupation During at Least the Past 5 Years: | ||||||||
| Treasurer, U.S. Fund Administration & Reporting and officer of 28 of the investment companies in Franklin Templeton. | ||||||||
Aliya S. Gordon (1973) One Franklin Parkway San Mateo, CA 94403-1906 | Vice President | Since 2009 | Not Applicable | Not Applicable | ||||
| Principal Occupation During at Least the Past 5 Years: | ||||||||
| Senior Associate General Counsel and officer of 44 of the investment companies in Franklin Templeton. | ||||||||
Steven J. Gray (1955) One Franklin Parkway San Mateo, CA 94403-1906 | Vice President and Co- Secretary | Vice President since 2009 andCo-Secretary since January 2019 | Not Applicable | Not Applicable | ||||
| Principal Occupation During at Least the Past 5 Years: | ||||||||
| Senior Associate General Counsel, Franklin Templeton; Vice President, Franklin Templeton Distributors, Inc. and FASA, LLC; and officer of 44 of the investment companies in Franklin Templeton. | ||||||||
Matthew T. Hinkle (1971) One Franklin Parkway San Mateo, CA 94403-1906 | Chief Executive Officer – Finance and Administration | Since 2017 | Not Applicable | Not Applicable | ||||
| Principal Occupation During at Least the Past 5 Years: | ||||||||
| Senior Vice President, Franklin Templeton Services, LLC; officer of 44 of the investment companies in Franklin Templeton; andformerly, Vice President, Global Tax (2012-April 2017) and Treasurer/Assistant Treasurer, Franklin Templeton (2009-2017). | ||||||||
Robert Lim (1948) One Franklin Parkway SanMateo, CA 94403-1906 | Vice President – AML Compliance | Since 2016 | Not Applicable | Not Applicable | ||||
| Principal Occupation During at Least the Past 5 Years: | ||||||||
| Vice President, Franklin Templeton Companies, LLC; Chief Compliance Officer, Franklin Templeton Distributors, Inc. and Franklin Templeton Investor Services, LLC; and officer of 44 of the investment companies in Franklin Templeton. | ||||||||
Kimberly H. Novotny (1972) 300 S.E. 2nd Street FortLauderdale,FL 33301-1923 | Vice President | Since 2013 | Not Applicable | Not Applicable | ||||
| Principal Occupation During at Least the Past 5 Years: | ||||||||
| Associate General Counsel, Franklin Templeton; Vice President and Corporate Secretary, Fiduciary Trust International of the South; Vice President, Templeton Investment Counsel, LLC; Assistant Secretary, Franklin Resources, Inc.; and officer of 44 of the investment companies in Franklin Templeton. | ||||||||
Edward D. Perks (1970) One Franklin Parkway SanMateo, CA 94403-1906 | President and Chief Executive Officer – Investment Management | Since December 2018 | Not Applicable | Not Applicable | ||||
| Principal Occupation During at Least the Past 5 Years: | ||||||||
| President and Director, Franklin Advisers, Inc.; and officer of nine of the investment companies in Franklin Templeton (since December 2018). | ||||||||
70 | Annual Report | franklintempleton.com | ||
FRANKLIN STRATEGIC SERIES
Interested Board Members and Officers(continued)
Name, Year of Birth and Address | Position | Length of Time Served | Number of Portfolios in Fund Complex Overseen by Board Member* | Other Directorships Held During at Least the Past 5 Years | ||||
Robert C. Rosselot (1960) 300 S.E. 2nd Street Fort Lauderdale, FL 33301-1923 | Chief Compliance Officer | Since 2013 | Not Applicable | Not Applicable | ||||
| Principal Occupation During at Least the Past 5 Years: | ||||||||
| Director, Global Compliance, Franklin Templeton; Vice President, Franklin Templeton Companies, LLC; officer of 44 of the investment companies in Franklin Templeton; andformerly, Senior Associate General Counsel, Franklin Templeton (2007-2013); and Secretary and Vice President, Templeton Group of Funds (2004-2013). | ||||||||
Navid J. Tofigh (1972) One Franklin Parkway San Mateo, CA 94403-1906 | Vice President | Since 2015 | Not Applicable | Not Applicable | ||||
| Principal Occupation During at Least the Past 5 Years: | ||||||||
| Associate General Counsel and officer of 44 of the investment companies in Franklin Templeton. | ||||||||
Craig S. Tyle (1960) One Franklin Parkway SanMateo, CA 94403-1906 | Vice President | Since 2005 | Not Applicable | Not Applicable | ||||
| Principal Occupation During at Least the Past 5 Years: | ||||||||
| General Counsel, Executive Vice President and Secretary, Franklin Resources, Inc.; and officer of some of the other subsidiaries of Franklin Resources, Inc. and of 44 of the investment companies in Franklin Templeton. | ||||||||
Lori A. Weber (1964) 300 S.E. 2nd Street Fort Lauderdale, FL 33301-1923 | Vice President and Co-Secretary | Vice President since 2011 andCo-Secretary since January 2019 | Not Applicable | Not Applicable | ||||
| Principal Occupation During at Least the Past 5 Years: | ||||||||
| Senior Associate General Counsel, Franklin Templeton; Assistant Secretary, Franklin Resources, Inc.; Vice President and Secretary, Templeton Investment Counsel, LLC; and officer of 44 of the investment companies in Franklin Templeton. | ||||||||
*We base the number of portfolios on each separate series of the U.S. registered investment companies within the Franklin Templeton fund complex. These portfolios have a common investment manager or affiliated investment managers.
**Gregory E. Johnson is considered to be an interested person of the Fund under the federal securities laws due to his position as an officer and director of Franklin Resources, Inc. (Resources), which is the parent company of the Fund’s investment manager and distributor. Rupert H. Johnson, Jr. is considered to be an interested person of the Fund under the federal securities laws due to his position as an officer and director and major shareholder of Resources.
Note 1: Rupert H. Johnson, Jr. is the uncle of Gregory E. Johnson.
Note 2: Effective March 12, 2019, John B. Wilson ceased to be a trustee of the Trust.
Note 3: Officer information is current as of the date of this report. It is possible that after this date, information about officers may change.
The Sarbanes-Oxley Act of 2002 and Rules adopted by the Securities and Exchange Commission require the Fund to disclose whether the Fund’s Audit Committee includes at least one member who is an audit committee financial expert within the meaning of such Act and Rules. The Fund’s Board has determined that there is at least one such financial expert on the Audit Committee and effective May 21, 2019, designated Mary C. Choksi as its audit committee financial expert. The Board believes that Ms. Choksi qualifies as such an expert in view of her extensive business background and experience. She currently serves as a director of Avis Budget Group, Inc. (2007-present) and formerly, Founder and Senior Advisor, Strategic Investment Group (1987 to 2017). Ms. Choksi has been a Member of the Fund’s Audit Committee since 2014. As a result of such background and experience, the Board believes that Ms. Choksi has acquired an understanding of generally accepted accounting principles and financial statements, the general application of such principles in connection with the accounting estimates, accruals and reserves, and analyzing and evaluating financial statements that present a breadth and level of complexity of accounting issues generally comparable to those of the Fund, as well as an understanding of internal controls and procedures for financial reporting and an understanding of audit committee functions. Ms. Choksi is an independent Board member as that term is defined under the relevant Securities and Exchange Commission Rules and Releases.
The Statement of Additional Information (SAI) includes additional information about the board members and is available, without charge, upon request. Shareholders may call (800) DIALBEN/342-5236 to request the SAI.
franklintempleton.com | Annual Report | 71 | ||
FRANKLIN STRATEGIC SERIES
FRANKLIN STRATEGIC INCOME FUND
Shareholder Information
Board Approval of Investment Management Agreements
FRANKLIN STRATEGIC SERIES
Franklin Strategic Income Fund
(Fund)
At anin-person meeting held on April 16, 2019 (Meeting), the Board of Trustees (Board) of Franklin Strategic Series (Trust), including a majority of the trustees who are not “interested persons” as defined in the Investment Company Act of 1940 (Independent Trustees), reviewed and approved the continuance of the investment management agreement between Franklin Advisers, Inc. (Manager) and the Trust, on behalf of the Fund (Management Agreement) for an additionalone-year period. The Independent Trustees received advice from and met separately with Independent Trustee counsel in considering whether to approve the continuation of the Management Agreement.
In considering the continuation of the Management Agreement, the Board reviewed and considered information provided by the Manager at the Meeting and throughout the year at meetings of the Board and its committees. The Board also reviewed and considered information provided in response to a detailed set of requests for information submitted to the Manager by Independent Trustee counsel on behalf of the Independent Trustees in connection with the annual contract renewal process. In addition, prior to the Meeting, the Independent Trustees held a telephonic contract renewal meeting at which the Independent Trustees conferred amongst themselves and Independent Trustee counsel about contract renewal matters. The Board reviewed and considered all of the factors it deemed relevant in approving the continuance of the Management Agreement, including, but not limited to: (i) the nature, extent and quality of the services provided by the Manager; (ii) the investment performance of the Fund; (iii) the costs of the services provided and profits realized by the Manager and its affiliates from the relationship with the Fund; (iv) the extent to which economies of scale are realized as the Fund grows; and (v) whether fee levels reflect these economies of scale for the benefit of Fund investors.
In approving the continuance of the Management Agreement, the Board, including a majority of the Independent Trustees, determined that the terms of the Management Agreement are fair and reasonable and that the continuance of such Management Agreement is in the interests of the Fund and its shareholders. While attention was given to all information
furnished, the following discusses some primary factors relevant to the Board’s determination.
Nature, Extent and Quality of Services
The Board reviewed and considered information regarding the nature, extent and quality of investment management services provided by the Manager and its affiliates to the Fund and its shareholders. This information included, among other things, the qualifications, background and experience of the senior management and investment personnel of the Manager; the structure of investment personnel compensation; oversight of third-party service providers; investment performance reports and related financial information for the Fund; reports on expenses, shareholder services, marketing support payments made to financial intermediaries and third party servicing arrangements; legal and compliance matters; risk controls; pricing and other services provided by the Manager and its affiliates; and management fees charged by the Manager and its affiliates to US funds and other accounts, including management’s explanation of differences among accounts where relevant. The Board also reviewed and considered an annual report on payments made by Franklin Templeton Investments (FTI) or the Fund to financial intermediaries, as well as a memorandum relating to third-party servicing arrangements in response to a guidance update in 2016 from the US Securities and Exchange Commission (SEC) relating to mutual fund distribution andsub-accounting fees. The Board noted management’s continuing efforts and expenditures in establishing effective business continuity plans and developing strategies to address areas of heightened concern in the mutual fund industry, such as cybersecurity and liquidity risk management. The Board also recognized management’s commitment to facilitating Board oversight of liquidity through the designation of a liquidity/risk administrator and the development of reports that highlight the amount of illiquid investments for the Fund.
The Board also reviewed and considered the benefits provided to Fund shareholders of investing in a fund that is part of the Franklin Templeton family of funds. The Board noted the financial position of Franklin Resources, Inc. (FRI), the Manager’s parent, and its commitment to the mutual fund business as evidenced by its continued introduction of new funds, reassessment of the fund offerings in response to the market environment and project initiatives and capital investments relating to the services provided to the Fund by the FTI organization.
72 | Annual Report | franklintempleton.com | ||
FRANKLIN STRATEGIC SERIES
FRANKLIN STRATEGIC INCOME FUND
SHAREHOLDER INFORMATION
Following consideration of such information, the Board was satisfied with the nature, extent and quality of services provided by the Manager and its affiliates to the Fund and its shareholders.
Fund Performance
The Board reviewed and considered the performance results of the Fund over various time periods ended January 31, 2019. The Board considered the performance returns for the Fund in comparison to the performance returns of mutual funds deemed comparable to the Fund included in a universe (Performance Universe) selected by Broadridge Financial Solutions, Inc. (Broadridge), an independent provider of investment company data. The Board received a description of the methodology used by Broadridge to select the mutual funds included in a Performance Universe. The Board also reviewed and considered Fund performance reports provided and discussions that occurred with portfolio managers at Board meetings throughout the year. A summary of the Fund’s performance results is below.
The Performance Universe for the Fund included the Fund and all retail and institutional multi-sector income funds. The Board noted that the Fund’s annualized income return for the three-year period was below the median of its Performance Universe, but for theone-, five- and10-year periods was above the median of its Performance Universe. The Board also noted that the Fund’s annualized total return for theone-, three-,five- and10-year periods was below the median of its Performance Universe. The Board discussed the performance of the Fund with management and noted that the Fund’s annualized total return for theone- and three-year periods was only slightly below the median of its Performance Universe and that such relative underperformance was due to a shorter duration profile of its portfolio holdings. The Board also noted management’s continued enhancements to the Fund’s investment team and process. Given the Fund’s income-oriented investment objective and the considerations noted above, the Board concluded that the Fund’s performance was satisfactory.
Comparative Fees and Expenses
The Board reviewed and considered information regarding the Fund’s actual total expense ratio and its various components, including, as applicable, management fees; transfer agent expenses; underlying fund expenses; Rule12b-1 andnon-Rule12b-1 service fees; and othernon-management fees. The Board also noted the quarterly and annual reports it receives on all marketing support payments made by FTI to financial intermediaries. The Board considered the actual total
expense ratio and, separately, the contractual management fee rate, without the effect of fee waivers, if any (Management Rate) of the Fund in comparison to the median expense ratio and median Management Rate, respectively, of other mutual funds deemed comparable to and with a similar expense structure to the Fund selected by Broadridge (Expense Group). Broadridge fee and expense data is based upon information taken from each fund’s most recent annual report, which reflects historical asset levels that may be quite different from those currently existing, particularly in a period of market volatility. While recognizing such inherent limitation and the fact that expense ratios and Management Rates generally increase as assets decline and decrease as assets grow, the Board believed the independent analysis conducted by Broadridge to be an appropriate measure of comparative fees and expenses. The Broadridge Management Rate includes administrative charges, and the actual total expense ratio, for comparative consistency, was shown for Class A shares for the Fund and Class A and Class M shares for the other funds in the Expense Group with multiple classes of shares. The Board received a description of the methodology used by Broadridge to select the mutual funds included in an Expense Group.
The Expense Group for the Fund included the Fund and ten other multi-sector income funds. The Board noted that the Management Rate and actual total expense ratio for the Fund were below the medians of its Expense Group. The Board concluded that the Management Rate charged to the Fund is reasonable.
Profitability
The Board reviewed and considered information regarding the profits realized by the Manager and its affiliates in connection with the operation of the Fund. In this respect, the Board considered the Fund profitability analysis provided by the Manager that addresses the overall profitability of FTI’s US fund business, as well as its profits in providing investment management and other services to each of the individual funds during the12-month period ended September 30, 2018, being the most recent fiscalyear-end for FRI. The Board noted that although management continually makes refinements to its methodologies used in calculating profitability in response to organizational and product-related changes, the overall methodology has remained consistent with that used in the Fund’s profitability report presentations from prior years. Additionally, PricewaterhouseCoopers LLP, auditor to FRI and certain Franklin Templeton funds, has been engaged by the Manager to periodically review and assess the allocation
franklintempleton.com | Annual Report | 73 | ||
FRANKLIN STRATEGIC SERIES
FRANKLIN STRATEGIC INCOME FUND
SHAREHOLDER INFORMATION
methodologies to be used solely by the Fund’s Board with respect to the profitability analysis.
The Board noted management’s belief that costs incurred in establishing the infrastructure necessary for the type of mutual fund operations conducted by the Manager and its affiliates may not be fully reflected in the expenses allocated to the Fund in determining its profitability, as well as the fact that the level of profits, to a certain extent, reflected operational cost savings and efficiencies initiated by management. The Board also noted management’s expenditures in improving shareholder services provided to the Fund, as well as the need to implement systems and meet additional regulatory and compliance requirements resulting from recent SEC and other regulatory requirements.
The Board also considered the extent to which the Manager and its affiliates might derive ancillary benefits from fund operations, including revenues generated from transfer agent services, potential benefits resulting from personnel and systems enhancements necessitated by fund growth, as well as increased leverage with service providers and counterparties. Based upon its consideration of all these factors, the Board concluded that the level of profits realized by the Manager and its affiliates from providing services to the Fund was not excessive in view of the nature, extent and quality of services provided to the Fund.
Economies of Scale
The Board reviewed and considered the extent to which the Manager may realize economies of scale, if any, as the Fund grows larger and whether the Fund’s management fee structure reflects any economies of scale for the benefit of shareholders. With respect to possible economies of scale, the Board noted the existence of management fee breakpoints, which operate generally to share any economies of scale with the Fund’s shareholders by reducing the Fund’s effective management fees as the Fund grows in size. The Board considered the Manager’s view that any analyses of potential economies of scale in managing a particular fund are inherently limited in light of the joint and common costs and investments the Manager incurs across the Franklin Templeton family of funds as a whole. The Board concluded that to the extent economies of scale may be realized by the Manager and its affiliates, the Fund’s management fee structure provided a sharing of benefits with the Fund and its shareholders as the Fund grows.
Conclusion
Based on its review, consideration and evaluation of all factors it believed relevant, including the above-described factors and
conclusions, the Board unanimously approved the continuation of the Management Agreement for an additionalone-year period.
Proxy Voting Policies and Procedures
The Fund’s investment manager has established Proxy Voting Policies and Procedures (Policies) that the Fund uses to determine how to vote proxies relating to portfolio securities. Shareholders may view the Fund’s complete Policies online at franklintempleton.com. Alternatively, shareholders may request copies of the Policies free of charge by calling the Proxy Group collect at (954)527-7678 or by sending a written request to: Franklin Templeton Companies, LLC, 300 S.E. 2nd Street, Fort Lauderdale, FL 33301, Attention: Proxy Group. Copies of the Fund’s proxy voting records are also made available online at franklintempleton.com and posted on the U.S. Securities and Exchange Commission’s website at sec.gov and reflect the most recent12-month period ended June 30.
Quarterly Statement of Investments
The Trust, on behalf of the Fund, files a complete statement of investments with the U.S. Securities and Exchange Commission for the first and third quarters for each fiscal year as an exhibit to its report on FormN-PORT. Shareholders may view the filed FormN-PORT by visiting the Commission’s website at sec.gov. The filed form may also be viewed and copied at the Commission’s Public Reference Room in Washington, DC. Information regarding the operations of the Public Reference Room may be obtained by calling(800) SEC-0330.
Householding of Reports and Prospectuses
You will receive the Fund’s financial reports every six months as well as an annual updated summary prospectus (prospectus available upon request). To reduce Fund expenses, we try to identify related shareholders in a household and send only one copy of the financial reports and summary prospectus. This process, called “householding,” will continue indefinitely unless you instruct us otherwise. If you prefer not to have these documents householded, please call us at (800)632-2301. At any time you may view current prospectuses/summary prospectuses and financial reports on our website. If you choose, you may receive these documents through electronic delivery.
74 | Annual Report | franklintempleton.com | ||
This page intentionally left blank.
This page intentionally left blank.
 | Annual Report and Shareholder Letter | |||
| Franklin Strategic Income Fund | ||||
Investment Manager | ||||
| Franklin Advisers, Inc. | ||||
Distributor | ||||
| Franklin Templeton Distributors, Inc. | ||||
(800) DIAL BEN®/342-5236 franklintempleton.com | ||||
Shareholder Services | ||||
| (800)632-2301 | ||||
Authorized for distribution only when accompanied or preceded by a summary prospectus and/or prospectus. Investors should carefully consider a fund’s investment goals, risks, charges and expenses before investing. A prospectus contains this and other information; please read it carefully before investing.
To help ensure we provide you with quality service, all calls to and from our service areas are monitored and/or recorded.
© 2019 Franklin Templeton Investments. All rights reserved. | 194 A 06/19 |
Item 2. Code of Ethics.
(a) The Registrant has adopted a code of ethics that applies to its principal executive officers and principal financial and accounting officer.
(c) N/A
(d) N/A
(f) Pursuant to Item 13(a)(1), the Registrant is attaching as an exhibit a copy of its code of ethics that applies to its principal executive officers and principal financial and accounting officer.
Item 3. Audit Committee Financial Expert.
(a)(1) The Registrant has an audit committee financial expert serving on its audit committee.
(2) The audit committee financial expert is Mary C. Choksi and he is “independent” as defined under the relevant Securities and Exchange Commission Rules and Releases.
Item 4. Principal Accountant Fees and Services.
(a) Audit Fees
The aggregate fees paid to the principal accountant for professional services rendered by the principal accountant for the audit of the registrant’s annual financial statements or for services that are normally provided by the principal accountant in connection with statutory and regulatory filings or engagements were $403,045 for the fiscal year ended April 30, 2019 and $407,625 for the fiscal year ended April 30, 2018.
(b) Audit-Related Fees
There were no fees paid to the principal accountant for assurance and related services rendered by the principal accountant to the registrant that are reasonably related to the performance of the audit of the registrant’s financial statements and are not reported under paragraph (a) of Item 4.
There were no fees paid to the principal accountant for assurance and related services rendered by the principal accountant to the registrant’s investment adviser and any entity controlling, controlled by or under common control with the investment adviser that provides ongoing services to the registrant that are reasonably related to the performance of the audit of their financial statements.
(c) Tax Fees
There were no fees paid to the principal accountant for professional services rendered by the principal accountant to the registrant for tax compliance, tax advice and tax planning.
The aggregate fees paid to the principal accountant for professional services rendered by the principal accountant to the registrant’s investment adviser and any entity controlling, controlled by or under common control with the investment adviser that provides ongoing
services to the registrant for tax compliance, tax advice and tax planning were $204,500 for the fiscal year ended April 30, 2019 and $16,250 for the fiscal year ended April 30, 2018. The services for which these fees were paid included tax compliance services related toyear-end, professional fees in connection with an Indonesia withholding tax refund claim and tax consulting services related to the operating agreement and term sheet for the launch of a new fund.
(d) All Other Fees
The aggregate fees paid to the principal accountant for products and services rendered by the principal accountant to the registrant not reported in paragraphs (a)-(c) of Item 4 were $0 for the fiscal year ended April 30, 2019 and $6,535 for the fiscal year ended April 30, 2018. The services for which these fees were paid include review of materials provided to the fund Board in connection with the investment management contract renewal process.
The aggregate fees paid to the principal accountant for products and services rendered by the principal accountant to the registrant’s investment adviser and any entity controlling, controlled by or under common control with the investment adviser that provides ongoing services to the registrant not reported in paragraphs (a)-(c) of Item 4 were $36,500 for the fiscal year ended April 30, 2019 and $65,225 for the fiscal year ended April 30, 2018. The services for which these fees were paid included the issuance of an Auditor’s Certificate for South Korean regulatory shareholders disclosures, assets under management certification, compliance examination for Investment Advisor Act rule204-2 and206-4(2), account maintenance project, training on partnership tax accounting and capital account maintenance and benchmarking services in connection with the ICI TA survey.
(e) (1) The registrant’s audit committee is directly responsible for approving the services to be provided by the auditors, including:
(i)pre-approval of all audit and audit related services;
(ii)pre-approval of allnon-audit related services to be provided to the Fund by the auditors;
(iii)pre-approval of allnon-audit related services to be provided to the registrant by the auditors to the registrant’s investment adviser or to any entity that controls, is controlled by or is under common control with the registrant’s investment adviser and that provides ongoing services to the registrant where thenon-audit services relate directly to the operations or financial reporting of the registrant; and
(iv) establishment by the audit committee, if deemed necessary or appropriate, as an alternative to committeepre-approval of services to be provided by the auditors, as required by paragraphs (ii) and (iii) above, of policies and procedures to permit such services to bepre-approved by other means, such as through establishment of guidelines or by action of a designated member or members of the committee; provided the policies and procedures are detailed as to the particular service and the committee is informed of each service and such policies and procedures do not include delegation
of audit committee responsibilities, as contemplated under the Securities Exchange Act of 1934, to management; subject, in the case of (ii) through (iv), to any waivers, exceptions or exemptions that may be available under applicable law or rules.
(e) (2) None of the services provided to the registrant described in paragraphs (b)-(d) of Item 4 were approved by the audit committee pursuant to paragraph (c)(7)(i)(C) of Rule2-01 of regulationS-X.
(f) No disclosures are required by this Item 4(f).
(g) The aggregatenon-audit fees paid to the principal accountant for services rendered by the principal accountant to the registrant and the registrant’s investment adviser and any entity controlling, controlled by or under common control with the investment adviser that provides ongoing services to the registrant were $241,000 for the fiscal year ended April 30, 2019 and $88,010 for the fiscal year ended April 30, 2018.
(h) The registrant’s audit committee of the board has considered whether the provision ofnon-audit services that were rendered to the registrant’s investment adviser (not including anysub-adviser whose role is primarily portfolio management and is subcontracted with or overseen by another investment adviser), and any entity controlling, controlled by, or under common control with the investment adviser that provides ongoing services to the registrant that were notpre-approved pursuant to paragraph (c)(7)(ii) of Rule2-01 of RegulationS-X is compatible with maintaining the principal accountant’s independence.
Item 5. Audit Committee of Listed Registrants. N/A
Item 6. Schedule of Investments. N/A
Item 7. Disclosure of Proxy Voting Policies and Procedures forClosed-End Management Investment Companies. N/A
Item 8. Portfolio Managers ofClosed-End Management Investment Companies. N/A
Item 9. Purchases of Equity Securities byClosed-End Management Investment Company and Affiliated Purchasers. N/A
Item 10. Submission of Matters to a Vote of Security Holders.
There have been no changes to the procedures by which shareholders may recommend nominees to the Registrant’s Board of Trustees that would require disclosure herein.
Item 11. Controls and Procedures.
(a) Evaluation of Disclosure Controls and Procedures. The Registrant maintains disclosure controls and procedures that are designed to provide reasonable assurance that information required to be disclosed in the Registrant’s filings under the Securities Exchange Act of 1934, as amended, and the Investment Company Act of 1940 is recorded, processed, summarized and reported within the periods specified in the rules and forms of the Securities and Exchange Commission. Such information is accumulated and communicated to the Registrant’s management, including its principal executive officer and principal financial officer, as appropriate, to allow timely decisions regarding required disclosure. The Registrant’s management, including the principal executive officer and the principal financial officer, recognizes that any set of controls and procedures, no matter how well designed and operated, can provide only reasonable assurance of achieving the desired control objectives.
Within 90 days prior to the filing date of this Shareholder Report on FormN-CSRS, the Registrant had carried out an evaluation, under the supervision and with the participation of the Registrant’s management, including the Registrant’s principal executive officer and the Registrant’s principal financial officer, of the effectiveness of the design and operation of the Registrant’s disclosure controls and procedures. Based on such evaluation, the Registrant’s principal executive officer and principal financial officer concluded that the Registrant’s disclosure controls and procedures are effective.
(b) Changes in Internal Controls: Effective November 1, 2018, the Registrant’s controls were enhanced through the implementation of a daily secondary review of market events following the close of trading on foreign stock markets to ensure the appropriate application of market level fair value.
Item 12. Disclosure of Securities Lending Activities forClosed-End Management Investment Company. N/A
Item 13. Exhibits.
(a) (1) Code of Ethics
(a) (2) Certifications pursuant to Section 302 of the Sarbanes-Oxley Act of 2002 of Matthew T. Hinkle, Chief Executive Officer - Finance and Administration, and Gaston Gardey, Chief Financial Officer and Chief Accounting Officer
(b) Certifications pursuant to Section 906 of the Sarbanes-Oxley Act of 2002 of Matthew T. Hinkle, Chief Executive Officer - Finance and Administration, and Gaston Gardey, Chief Financial Officer and Chief Accounting Officer
SIGNATURES
Pursuant to the requirements of the Securities Exchange Act of 1934 and the Investment Company Act of 1940, the registrant has duly caused this report to be signed on its behalf by the undersigned, thereunto duly authorized.
FRANKLIN STRATEGIC SERIES
| By | /s/ MATTHEW T. HINKLE | |
| Matthew T. Hinkle | ||
| Chief Executive Officer – | ||
| Finance and Administration |
Date June 26, 2019
Pursuant to the requirements of the Securities Exchange Act of 1934 and the Investment Company Act of 1940, this report has been signed below by the following persons on behalf of the registrant and in the capacities and on the dates indicated.
| By | /s/ MATTHEW T. HINKLE | |
| Matthew T. Hinkle | ||
| Chief Executive Officer – | ||
| Finance and Administration |
Date June 26, 2019
| By | /s/ GASTON GARDEY | |
| Gaston Gardey | ||
| Chief Financial Officer and | ||
| Chief Accounting Officer |
Date June 26, 2019