UNITED STATES
SECURITIES AND EXCHANGE COMMISSION
Washington, DC 20549
FORM N-CSR
CERTIFIED SHAREHOLDER REPORT OF REGISTERED
MANAGEMENT INVESTMENT COMPANIES
Investment Company Act file number 811-06243
Franklin Strategic Series
(Exact name of registrant as specified in charter)
_One Franklin Parkway, San Mateo, Ca 94403-1906
(Address of principal executive offices) (Zip code)
_Craig S. Tyle, One Franklin Parkway, San Mateo, CA 94403-1906
(Name and address of agent for service)
Registrant’s telephone number, including area code: 650 312-2000
Date of fiscal year end: 4/30
Date of reporting period: 4/30/17
Item 1. Reports to Stockholders.
Franklin Templeton Investments
Gain From Our Perspective®
At Franklin Templeton Investments, we’re dedicated to one goal: delivering exceptional asset management for our clients. By bringing together multiple, world-class investment teams in a single firm, we’re able to offer specialized expertise across styles and asset classes, all supported by the strength and resources of one of the world’s largest asset managers. This has helped us to become a trusted partner to individual and institutional investors across the globe.
Dear Shareholder:
During the 12 months ended April 30, 2017, mostly upbeat economic data, improved U.S. corporate earnings and supportive monetary policies were positives for the securities markets. After maintaining its target interest rate in the 0.25%–0.50% range for nearly a year, the U.S. Federal Reserve increased its target range for the federal funds rate twice, in December 2016 and March 2017, to 0.75%–1.00%, noting improved employment and hints of higher inflation. The 10-year U.S. Treasury yield began the period at 1.83% and ended the period at 2.29%. In this environment, U.S. stocks, as measured by the Standard & Poor’s 500® Index, generated a +17.92% total return for the 12-month period.1
In all economic environments, we are committed to our long-term perspective and disciplined investment approach as we conduct a diligent, fundamental analysis of securities with a regular emphasis on investment risk management.
We believe active, professional investment management serves investors well. We also recognize the important role of financial advisors in today’s markets and encourage investors to continue to seek their advice. Amid changing markets and economic conditions, we are confident investors with a well-diversified portfolio and a patient, long-term outlook should be well positioned for the years ahead.
In addition, Franklin Strategic Series’ annual report includes more detail about prevailing conditions and a discussion about investment decisions during the period. Please remember all securities markets fluctuate, as do mutual fund share prices.
We thank you for investing with Franklin Templeton, welcome your questions and comments, and look forward to serving your future investment needs.
Sincerely,

Edward B. Jamieson
President and Chief Executive Officer –
Investment Management
Franklin Strategic Series
This letter reflects our analysis and opinions as of April 30, 2017, unless otherwise indicated. The information is not a complete analysis of every aspect of any market, country, industry, security or fund. Statements of fact are from sources considered reliable.
1. Source: Morningstar.
See www.franklintempletondatasources.com for additional data provider information.
| Not FDIC Insured | May Lose Value | No Bank Guarantee |
franklintempleton.com | Not part of the annual report | 1 | ||
| 3 | ||||
| 4 | ||||
| 11 | ||||
| 18 | ||||
| 25 | ||||
| 33 | ||||
| 66 | ||||
| 71 | ||||
| 88 | ||||
| 89 | ||||
| 90 | ||||
| 95 | ||||
Visit franklintempleton.com for fund updates, to access your account, or to find helpful financial planning tools.
2 | Annual Report | franklintempleton.com | ||
The U.S. economy expanded during the 12 months under review. The economy strengthened in 2016’s second and third quarters, but moderated in the next two quarters, largely due to declines in private inventory investment and government spending. The manufacturing sector generally expanded and the services sector also continued to grow. The unemployment rate decreased from 5.0% in April 2016 to 4.4% at period-end.1 Monthly retail sales were volatile, but grew during most of the period. Annual inflation, as measured by the Consumer Price Index, increased from 1.1% to 2.2% during the period.
After maintaining its target interest rate in the 0.25%–0.50% range for nearly a year, the U.S. Federal Reserve (Fed), at its December meeting, increased its target range for the federal funds rate to 0.50%–0.75%, as policymakers noted improvement in the U.S. labor market and inflation. The Fed kept its interest rate unchanged at its February meeting, but incoming economic data, along with statements by Fed officials in late February and early March, heightened many investors’ expectations for a March interest-rate hike. The Fed, at its March meeting, made the widely anticipated increase in its federal funds target rate to 0.75%–1.00%.
U.S. equity markets rose during the period, benefiting from mostly upbeat economic data, better U.S. corporate earnings and signs of improvement in the Chinese and European economies. Ongoing expansionary monetary policies from key central banks, investor optimism arising from pro-growth and pro-business policy plans in the U.S. and the results of the first round of presidential elections in France also helped U.S. equities. However, the U.K.’s historic vote to leave the European Union (also known as “Brexit”), global growth concerns and geopolitical tensions in the Middle East and Korean peninsula weighed on market sentiment. The broad U.S. stock market, as measured by the Standard & Poor’s 500 Index, generated a +17.92% total return for the 12-month period.2
The foregoing information reflects our analysis and opinions as of April 30, 2017. The information is not a complete analysis of every aspect of any market, country, industry, security or fund. Statements of fact are from sources considered reliable.
1. Source: Bureau of Labor Statistics.
2. Source: Morningstar.
See www.franklintempletondatasources.com for additional data provider information.
franklintempleton.com | Annual Report | 3 | ||
Franklin Focused Core Equity Fund
This annual report for Franklin Focused Core Equity Fund covers the fiscal year ended April 30, 2017.
Your Fund’s Goal and Main Investments
The Fund seeks capital appreciation by normally investing at least 80% of its net assets in equity securities. The Fund normally invests primarily to predominantly in equity securities of large capitalization companies, which are similar in size to those in the Standard & Poor’s 500 Index (S&P 500®).
Performance Overview
The Fund’s Class A shares delivered a +15.85% cumulative total return for the 12 months under review. In comparison, the S&P 500, which tracks the broad U.S. stock market, generated a +17.92% total return.1 You can find more of the Fund’s performance data in the Performance Summary beginning on page 7.
Performance data represent past performance, which does not guarantee future results. Investment return and principal value will fluctuate, and you may have a gain or loss when you sell your shares. Current performance may differ from figures shown. For most recent month-end performance, go to franklintempleton.com or call (800) 342-5236.
Investment Strategy
We are research-driven, bottom-up, fundamental investors. Our investment approach is opportunistic and contrarian, and we seek to identify mispriced companies using fundamental analysis. We seek to take advantage of price dislocations that result from the market’s short-term focus. Our analysis includes the investigation of the valuation for each investment based upon the view that the price paid for the security is a critical factor determining long-term success. We rely on a team of analysts to help provide in-depth industry expertise and use both qualitative and quantitative analysis to evaluate companies. Our analysts identify each company’s market opportunity, competitive position, management and financial strength, business and financial risks, and valuation. We choose to invest in those companies that, in our opinion, offer the best trade-off between growth opportunity, business and financial risk, and valuation.
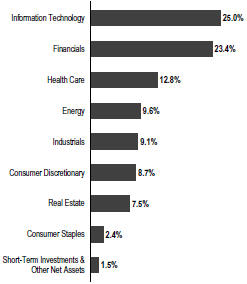
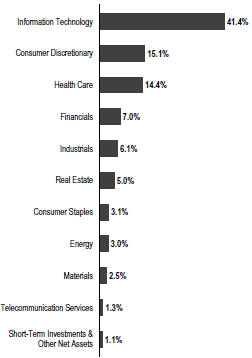
Portfolio Composition
Based on Total Net Assets as of 4/30/17
Manager’s Discussion
During the 12 months under review, key contributors to the Fund’s absolute performance included holdings in the information technology (IT), financials and real estate sectors.
In IT, the Fund’s positions in Microsoft, a software and IT services company, and Alphabet, parent company of search engine Google, helped results. Microsoft performed well during the period due to a more resilient personal computer spending environment, continued growth in enterprise Office 365 adoption, a rebound in growth of its legacy server business and sustained growth of its Azure cloud offering. We remain positive on Microsoft as the company transitions to the cloud and expands its share of IT spending. Google parent company Alphabet continued to nurture the businesses it helped found, including online advertising and cloud computing. During the period, Alphabet reported a significant net profit growth in 2017’s first quarter, with no indications of any negative impact from a well-publicized backlash that began late in the period from advertisers worried about their brands appearing near objectionable content.
1. Source: Morningstar.
The index is unmanaged and includes reinvestment of any income or distributions. It does not reflect any fees, expenses or sales charges. One cannot invest directly in an index, and an index is not representative of the Fund’s portfolio.
See www.franklintempletondatasources.com for additional data provider information.
The dollar value, number of shares or principal amount, and names of all portfolio holdings are listed in the Fund’s Statement of Investments (SOI). The SOI begins on page 38.
4 | Annual Report | franklintempleton.com | ||
FRANKLIN FOCUSED CORE EQUITY FUND
In financials, banking and financial services providers Charles Schwab and JPMorgan Chase helped results. In general, banks outperformed the broader equity market following the Republican victory in the November 2016 U.S. elections. Investor optimism increased due to hopes that economic growth would improve, which could benefit pro-cyclical bank stocks and drive stronger loan growth and lower credit costs. In addition, many observers believe interest rates will rise and improve bank net interest income because of higher inflation and stronger economic growth. Investors also believe the regulatory burden could decrease, which could reduce expenses and free up capital to return to shareholders, as well as potentially create new revenue opportunities. In addition, corporate tax rates could fall and benefit banks more than the broader markets because of their higher relative tax rates and more domestic focus.
In the real estate sector, data center provider Equinix contributed to results as it continued to benefit from a strong demand environment where cloud adoption is driving the need for interconnection-rich colocation space. We believe that as one of the highest-quality, most highly-interconnected data center companies, Equinix benefits significantly from this trend.
Elsewhere, Netherlands-based media company Altice contributed to results in the consumer discretionary sector. Altice has been performing well, in part because its U.S. business has continued to perform strongly, with solid revenue growth and outsized profit growth led by continued cost synergies achieved through recent acquisitions. In addition, the company’s French business has stabilized after a few weak quarters. The company plans to spin off its U.S. business in an initial public offering in the coming months, which we believe could help unlock additional value.
In contrast, key detractors from the Fund’s absolute performance included the Fund’s only holding in the consumer staples sector, retailer and pharmacy benefits manager CVS Health. Its shares declined during the reporting period due to increasing scrutiny on the business model of pharmacy benefits managers and uncertainty regarding the drug pricing environment. We believe the vertically integrated business model of CVS as a retailer and pharmacy benefits manager offers competitive advantages that could enable the company to capture an increasing share of health care spending in the long term.
Top 10 Holdings
4/30/17
Company Sector/Industry | % of Total
| |
Alphabet Inc. |
6.2% | |
Information Technology
| ||
Microsoft Corp. | 5.5% | |
Information Technology
| ||
Allergan PLC | 5.0% | |
Health Care
| ||
Altice NV | 4.9% | |
Consumer Discretionary
| ||
The Charles Schwab Corp. | 4.6% | |
Financials
| ||
Genesee & Wyoming Inc. | 4.4% | |
Industrials
| ||
Anadarko Petroleum Corp. | 4.2% | |
Energy
| ||
CBRE Group Inc. | 3.8% | |
Real Estate
| ||
Twenty-First Century Fox Inc. | 3.8% | |
Consumer Discretionary
| ||
Equinix Inc. | 3.7% | |
Real Estate
|
Elsewhere, in the health care sector, Valeant Pharmaceuticals International (no longer held at period-end) hindered results. Declining earnings and cash flow raised questions about the company’s ability to properly resource its business and repay its debt obligations. Managed care and pharmacy benefits managers limited Valeant’s ability to get reimbursed for expensive drugs, and political pressure on aggressive pricing tactics exposed the company’s tactics and forced policy changes, which increased costs and decreased revenues. In energy, oilfield services company Schlumberger detracted from performance. The period began with oilfield services stocks, including Schlumberger, at a near-term peak after the industry recovered from the depths of the commodity crisis, which the company reached in January. Although shares of Schlumberger and other oilfield services continued to perform well through mid-January, with the rig count up more than 50% from the lows in late May 2016 to mid-January 2017 and continuing to climb through period-end, investors became increasingly concerned with the potential impact of a resurgence in U.S. production growth and the possibility that the agreement by major oil producers to cut production will not be extended at a meeting on May 25. As a result, Schlumberger’s share price pulled back sharply from mid-January through period-end as investors began to question the longevity of the recovery and the ability of the company to meet earnings projections. In IT, travel industry technology services provider Sabre detracted from performance.
franklintempleton.com | Annual Report | 5 | ||
FRANKLIN FOCUSED CORE EQUITY FUND
Thank you for your continued participation in Franklin Focused Core Equity Fund. We look forward to serving your future investment needs.
 |
Brent Loder Lead Portfolio Manager | |
 |
Chris Anderson | |
| Portfolio Management Team | ||


The foregoing information reflects our analysis, opinions and portfolio holdings as of April 30, 2017, the end of the reporting period. The way we implement our main investment strategies and the resulting portfolio holdings may change depending on factors such as market and economic conditions. These opinions may not be relied upon as investment advice or an offer for a particular security. The information is not a complete analysis of every aspect of any market, country, industry, security or the Fund. Statements of fact are from sources considered reliable, but the investment manager makes no representation or warranty as to their completeness or accuracy. Although historical performance is no guarantee of future results, these insights may help you understand our investment management philosophy.
6 | Annual Report | franklintempleton.com | ||
FRANKLIN FOCUSED CORE EQUITY FUND
Performance Summary as of April 30, 2017
The performance table and graphs do not reflect any taxes that a shareholder would pay on Fund dividends, capital gain distributions, if any, or any realized gains on the sale of Fund shares. Total return reflects reinvestment of the Fund’s dividends and capital gain distributions, if any, and any unrealized gains or losses. Your dividend income will vary depending on dividends or interest paid by securities in the Fund’s portfolio, adjusted for operating expenses of each class. Capital gain distributions are net profits realized from the sale of portfolio securities.
Performance as of 4/30/171
Cumulative total return excludes sales charges. Average annual total return includes maximum sales charges. Sales charges will vary depending on the size of the investment and the class of share purchased. The maximum is 5.75% and the minimum is 0%. Class A: 5.75% maximum initial sales charge; Advisor Class: no sales charges. For other share classes, visit franklintempleton.com.
Share Class
| Cumulative Total Return2
| Average Annual Total Return3
| ||
A
| ||||
1-Year
| +15.85%
| +9.27%
| ||
5-Year
|
+73.13%
|
+10.28%
| ||
Since Inception (12/13/07)
|
+79.91%
|
+5.79%
| ||
Advisor
| ||||
1-Year
| +16.15%
| +16.15%
| ||
5-Year
|
+75.51%
|
+11.91%
| ||
Since Inception (12/13/07)
|
+84.47%
|
+6.75%
| ||
Performance data represent past performance, which does not guarantee future results. Investment return and principal value will fluctuate, and you may have a gain or loss when you sell your shares. Current performance may differ from figures shown. For most recent month-end performance, go to franklintempleton.com or call (800) 342-5236.
See page 9 for Performance Summary footnotes.
franklintempleton.com | Annual Report | 7 | ||
FRANKLIN FOCUSED CORE EQUITY FUND
PERFORMANCE SUMMARY
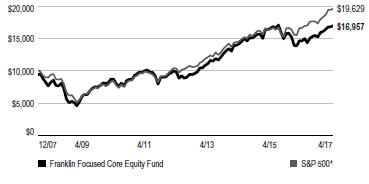
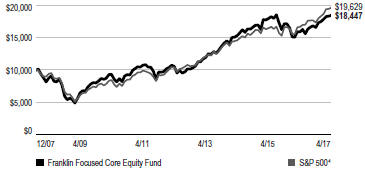
Total Return Index Comparison for a Hypothetical $10,000 Investment1
Total return represents the change in value of an investment over the periods shown. It includes any applicable maximum sales charge, Fund expenses, account fees and reinvested distributions. The unmanaged index includes reinvestment of any income or distributions. It differs from the Fund in composition and does not pay management fees or expenses. One cannot invest directly in an index.
Class A (12/13/07–4/30/17)
Advisor Class (12/13/07–4/30/17)
See page 9 for Performance Summary footnotes.
8 | Annual Report | franklintempleton.com | ||
FRANKLIN FOCUSED CORE EQUITY FUND
PERFORMANCE SUMMARY
Total Annual Operating Expenses5
Share Class
| With Waiver
| Without Waiver
| ||||||
A
|
| 1.25%
|
|
| 1.45%
|
| ||
Advisor
|
| 1.00%
|
|
| 1.20%
|
| ||
Each class of shares is available to certain eligible investors and has different annual fees and expenses, as described in the prospectus.
All investments involve risks, including possible loss of principal. To the extent the Fund focuses on particular countries, regions, industries, sectors or types of investment from time to time, it may be subject to greater risks of adverse developments in such areas of focus than a fund that invests in a wider variety of countries, regions, industries, sectors or investments. The Fund may have investments in both growth and value stocks, or in stocks with characteristics of both. Growth stock prices reflect projections of future earnings or revenues, and can, therefore, fall dramatically if the company fails to meet those projections. A value stock may not increase in price as anticipated by the investment manager if other investors fail to recognize the company’s value and bid up the price, the markets favor faster growing companies, or the factors that the investment manager believes will increase the price of the security do not occur. Foreign securities involve special risks, including currency fluctuations and economic and political uncertainties. The Fund is actively managed but there is no guarantee that the manager’s investment decisions will produce the desired results. The Fund’s prospectus also includes a description of the main investment risks.
1. The Fund has an expense reduction and a fee waiver associated with any investments it makes in a Franklin Templeton money fund and/or other Franklin Templeton fund, contractually guaranteed through 8/31/17. Fund investment results reflect the expense reduction and fee waiver; without these reductions, the results would have been lower.
2. Cumulative total return represents the change in value of an investment over the periods indicated.
3. Average annual total return represents the average annual change in value of an investment over the periods indicated. Return for less than one year, if any, has not been annualized.
4. Source: Morningstar. The S&P 500 is a market capitalization-weighted index of 500 stocks designed to measure total U.S. equity market performance.
5. Figures are as stated in the Fund’s current prospectus and may differ from the expense ratios disclosed in the Your Fund’s Expenses and Financial Highlights sections in this report. In periods of market volatility, assets may decline significantly, causing total annual Fund operating expenses to become higher than the figures shown.
See www.franklintempletondatasources.com for additional data provider information.
franklintempleton.com | Annual Report | 9 | ||
FRANKLIN FOCUSED CORE EQUITY FUND
Your Fund’s Expenses
As a Fund shareholder, you can incur two types of costs: (1) transaction costs, including sales charges (loads) on Fund purchases and redemptions; and (2) ongoing Fund costs, including management fees, distribution and service (12b-1) fees, and other Fund expenses. All mutual funds have ongoing costs, sometimes referred to as operating expenses. The table below shows ongoing costs of investing in the Fund and can help you understand these costs and compare them with those of other mutual funds. The table assumes a $1,000 investment held for the six months indicated.
Actual Fund Expenses
The table below provides information about actual account values and actual expenses in the columns under the heading “Actual.” In these columns the Fund’s actual return, which includes the effect of Fund expenses, is used to calculate the “Ending Account Value” for each class of shares. You can estimate the expenses you paid during the period by following these steps (of course, your account value and expenses will differ from those in this illustration): Divide your account value by $1,000 (if your account had an $8,600 value, then $8,600 ÷ $1,000 = 8.6). Then multiply the result by the number in the row for your class of shares under the headings “Actual” and “Expenses Paid During Period” (if Actual Expenses Paid During Period were $7.50, then 8.6 x $7.50 = $64.50). In this illustration, the actual expenses paid this period are $64.50.
Hypothetical Example for Comparison with Other Funds
Under the heading “Hypothetical” in the table, information is provided about hypothetical account values and hypothetical expenses based on the Fund’s actual expense ratio and an assumed rate of return of 5% per year before expenses, which is not the Fund’s actual return. This information may not be used to estimate the actual ending account balance or expenses you paid for the period, but it can help you compare ongoing costs of investing in the Fund with those of other funds. To do so, compare this 5% hypothetical example for the class of shares you hold with the 5% hypothetical examples that appear in the shareholder reports of other funds.
Please note that expenses shown in the table are meant to highlight ongoing costs and do not reflect any transactional costs. Therefore, information under the heading “Hypothetical” is useful in comparing ongoing costs only, and will not help you compare total costs of owning different funds. In addition, if transactional costs were included, your total costs would have been higher.
Actual (actual return after expenses) | Hypothetical (5% annual return before expenses) | |||||||||||||||||
Share Class | Beginning Account Value 11/1/16 | Ending Account Value 4/30/17 | Expenses Paid During Period 11/1/16–4/30/171,2 | Ending Account Value 4/30/17 | Expenses Paid During 11/1/16–4/30/171,2 | Net Annualized Ratio2 | ||||||||||||
A | $1,000 | $1,113.60 | $6.45 | $1,018.70 | $6.16 | 1.23% | ||||||||||||
C | $1,000 | $1,108.90 | $10.25 | $1,015.08 | $9.79 | 1.96% | ||||||||||||
R | $1,000 | $1,112.70 | $7.23 | $1,017.95 | $6.90 | 1.38% | ||||||||||||
R6 | $1,000 | $1,115.60 | $4.46 | $1,020.58 | $4.26 | 0.85% | ||||||||||||
Advisor | $1,000 | $1,114.40 | $5.14 | $1,019.93 | $4.91 | 0.98% | ||||||||||||
1. Expenses are equal to the annualized expense ratio for the six-month period as indicated above—in the far right column—multiplied by the simple average account value over the period indicated, and then multiplied by 181/365 to reflect the one-half year period.
2. Reflects expenses after fee waivers and expense reimbursements. Does not include acquired fund fees and expenses.
10 | Annual Report | franklintempleton.com | ||
Franklin Growth Opportunities Fund
This annual report for Franklin Growth Opportunities Fund covers the fiscal year ended April 30, 2017. We welcome the former shareholders of Franklin Flex Cap Growth Fund who now own shares of Franklin Growth Opportunities Fund as a result of Franklin Flex Cap Growth Fund’s reorganization that took effect on August 26, 2016.
Your Fund’s Goal and Main Investments
The Fund seeks capital appreciation by normally investing substantially in equity securities of companies demonstrating accelerating growth, increasing profitability, or above-average growth or growth potential, when compared with the overall economy.
Performance Overview
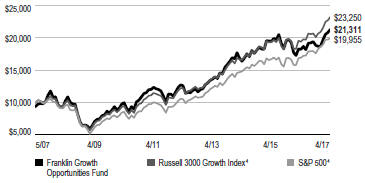
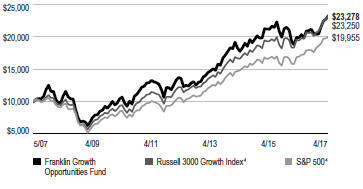
The Fund’s Class A shares delivered a +16.88% cumulative total return for the 12 months under review. In comparison, the Fund’s narrow benchmark, the Russell 3000® Growth Index, which measures performance of Russell 3000® Index companies with higher price-to-book ratios and higher forecasted growth values, generated a +19.83% total return.1 The Fund’s broad benchmark, the Standard & Poor’s 500 Index (S&P 500), which tracks the broad U.S. stock market, produced a +17.92% total return.1 You can find the Fund’s long-term performance data in the Performance Summary beginning on page 14.
Performance data represent past performance, which does not guarantee future results. Investment return and principal value will fluctuate, and you may have a gain or loss when you sell your shares. Current performance may differ from figures shown. For most recent month-end performance, go to franklintempleton.com or call (800) 342-5236.
Investment Strategy
We use fundamental, bottom-up research to seek companies meeting our criteria of growth potential, quality and valuation. In seeking sustainable growth characteristics, we look for companies we believe can produce sustainable earnings and cash flow growth, evaluating the long-term market opportunity and competitive structure of an industry to target leaders and emerging leaders. We define quality companies as those with strong and improving competitive positions in attractive markets. We also believe important attributes of quality are
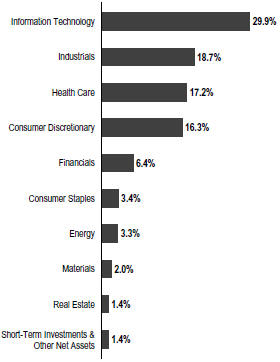
Portfolio Composition
Based on Total Net Assets as of 4/30/17
experienced and talented management teams as well as financial strength reflected in the capital structure, gross and operating margins, free cash flow generation and returns on capital employed. Our valuation analysis includes a range of potential outcomes based on an assessment of multiple scenarios. In assessing value, we consider whether security prices fully reflect the balance of the sustainable growth opportunities relative to business and financial risks.
Manager’s Discussion
During the 12 months under review, nearly all sectors represented in the Fund’s portfolio had positive returns and contributed to absolute performance. Relative to the Russell 3000® Growth Index, stock selection and an underweighting in the consumer staples sector contributed to the Fund’s
1. Source: Morningstar.
The indexes are unmanaged and include reinvestment of any income or distributions. They do not reflect any fees, expenses or sales charges. One cannot invest directly in an index, and an index is not representative of the Fund’s portfolio.
The dollar value, number of shares or principal amount, and names of all portfolio holdings are listed in the Fund’s Statement of Investments (SOI). The SOI begins on page 45.
franklintempleton.com | Annual Report | 11 | ||
FRANKLIN GROWTH OPPORTUNITIES FUND
performance. Stock selection in the real estate and telecommunication services sectors also boosted relative results.
In the consumer staples sector, shares of packaged food and beverage company WhiteWave Foods2 surged as Danone announced in July 2016 its intention to acquire WhiteWave in an all-cash transaction.
In real estate, shares of data center provider Equinix advanced as the company continued to benefit from a strong demand environment where cloud adoption is driving the need for interconnection-rich colocation space. We believe that as one of the highest-quality, most highly-interconnected data center companies, Equinix benefits significantly from this trend.
In telecommunication services, wireless company T-Mobile U.S. benefited performance as it continued to gain market share in the U.S. wireless market. Further boosting shares were speculations about potential merger-and-acquisition activity as consolidation in the industry makes sense, and T-Mobile, in our assessment, is a well-run valuable asset for a number of industry participants.
Other key contributors included video game maker Electronic Arts and graphics processor semiconductor company NVIDIA in the information technology (IT) sector and Amazon.com in the consumer discretionary sector. Electronic Arts’ strong performance during this period was largely driven by the success of its holiday title releases, and through the continuation of its profit margin expansion story as new game releases move toward high-margin digital distribution. NVIDIA performed well during the period as growth accelerated, driven by a strong product cycle in its traditional graphics market. The company also benefited from significant growth with its products targeting data center growth, advanced driver assistance systems and artificial intelligence, which benefited from high-speed parallel processing, NVIDIA’s core competency. Amazon.com helped the Fund’s results amid consistent and profitable growth of its Amazon Web Service, a leader in cloud computing, which has a significantly higher profit margin than its retail business and accounts for about half of the company’s overall profits. The company invested in its retail business to constantly improve its Prime subscription service in the U.S. and offer benefits globally. It also invested in fulfillment centers and logistics to achieve faster shipping
Top 10 Holdings
4/30/17
Company Sector/Industry | % of Total Net Assets | |||
Amazon.com Inc. | 5.3 | % | ||
Consumer Discretionary
| ||||
Apple Inc. | 5.1 | % | ||
Information Technology
| ||||
Facebook Inc. | 4.9 | % | ||
Information Technology
| ||||
Mastercard Inc. | 3.9 | % | ||
Information Technology
| ||||
Alphabet Inc. | 3.7 | % | ||
Information Technology
| ||||
Microsoft Corp. | 3.5 | % | ||
Information Technology
| ||||
Celgene Corp. | 3.5 | % | ||
Health Care
| ||||
Visa Inc. | 3.3 | % | ||
Information Technology
| ||||
Adobe Systems Inc. | 2.2 | % | ||
Information Technology
| ||||
Broadcom Ltd. | 2.1 | % | ||
Information Technology
| ||||
times for a widening selection of products, including third-party merchandise fulfilled by the company.
In contrast, key detractors from the Fund’s relative performance included stock selection in the IT sector. An overweighted position in the energy sector also hindered relative results, as did security selection in the industrials sector.
In IT, shares of technology hardware and software provider Apple performed well. As a result, the Fund’s underweighted position in the company detracted from relative results. Security solutions platform provider Palo Alto Networks struggled with sale execution during the year as a sales reorganization impacted results. Paylocity Holding, a provider of cloud-based payroll and human resources software solutions, also hindered results. The company benefited from new employer reporting requirements related to the Affordable Care Act (ACA), resulting in accelerated revenue growth, but underperformed in the second half of the period, in our view due to President Donald Trump’s victory and Republicans’ goal to repeal and replace the ACA. The potential passage of a new legislation would effectively eliminate the employer mandate and penalty for non-compliance.
2. No longer held at period-end.
See www.franklintempletondatasources.com for additional data provider information.
13 | Annual Report | franklintempleton.com | ||
FRANKLIN GROWTH OPPORTUNITIES FUND
In energy, shares of Cabot Oil & Gas declined slightly over the 12-month period, despite a significant increase in natural gas prices.2 A mild winter weather in the northern U.S. reduced heating demand for natural gas during the winter of 2016–2017 and affected Cabot’s revenues. In the industrials sector, Fortune Brands & Security, which provides home and security products, detracted from relative performance.2 The company increased promotional activity for its cabinet products throughout 2016, which compressed profit margins.
Elsewhere, beverages maker Monster Beverage hindered results in the consumer staples sector, as did asset manager Affiliated Managers Group2 in the financials sector. Monster Beverage experienced a challenging production environment in the U.S. Additionally, its new product innovation has been slower than expected. Shares of Affiliated Managers Group declined as asset managers in general struggled amid weaker industry-wide investor flows.
Thank you for your continued participation in Franklin Growth Opportunities Fund. We look forward to serving your future investment needs.
 |
Grant Bowers Lead Portfolio Manager | |
 |
Sara Araghi, CFA | |
| Portfolio Management Team | ||


The foregoing information reflects our analysis, opinions and portfolio holdings as of April 30, 2017, the end of the reporting period. The way we implement our main investment strategies and the resulting portfolio holdings may change depending on factors such as market and economic conditions. These opinions may not be relied upon as investment advice or an offer for a particular security. The information is not a complete analysis of every aspect of any market, country, industry, security or the Fund. Statements of fact are from sources considered reliable, but the investment manager makes no representation or warranty as to their completeness or accuracy. Although historical performance is no guarantee of future results, these insights may help you understand our investment management philosophy.
CFA® is a trademark owned by CFA Institute.
franklintempleton.com | Annual Report | 13 | ||
FRANKLIN GROWTH OPPORTUNITIES FUND
Performance Summary as of April 30, 2017
The performance table and graphs do not reflect any taxes that a shareholder would pay on Fund dividends, capital gain distributions, if any, or any realized gains on the sale of Fund shares. Total return reflects reinvestment of the Fund’s dividends and capital gain distributions, if any, and any unrealized gains or losses. Your dividend income will vary depending on dividends or interest paid by securities in the Fund’s portfolio, adjusted for operating expenses of each class. Capital gain distributions are net profits realized from the sale of portfolio securities.
Performance as of 4/30/171
Cumulative total return excludes sales charges. Average annual total return includes maximum sales charges. Sales charges will vary depending on the size of the investment and the class of share purchased. The maximum is 5.75% and the minimum is 0%. Class A: 5.75% maximum initial sales charge; Advisor Class: no sales charges. For other share classes, visit franklintempleton.com.
| Share Class | Cumulative Total Return2 | Average Annual Total Return3 | ||
A | ||||
1-Year
| +16.88%
| +10.17%
| ||
5-Year
| +69.43%
| +9.82%
| ||
10-Year
| +126.10%
| +7.86%
| ||
Advisor | ||||
1-Year
| +17.21%
| +17.21%
| ||
5-Year
| +71.84%
| +11.44%
| ||
10-Year
| +132.78%
| +8.82%
| ||
Performance data represent past performance, which does not guarantee future results. Investment return and principal value will fluctuate, and you may have a gain or loss when you sell your shares. Current performance may differ from figures shown. For most recent month-end performance, go to franklintempleton.com or call (800) 342-5236.
See page 16 for Performance Summary footnotes.
14 | Annual Report | franklintempleton.com | ||
FRANKLIN GROWTH OPPORTUNITIES FUND
PERFORMANCE SUMMARY
Total Return Index Comparison for a Hypothetical $10,000 Investment1
Total return represents the change in value of an investment over the periods shown. It includes any applicable maximum sales charge, Fund expenses, account fees and reinvested distributions. The unmanaged indexes include reinvestment of any income or distributions. They differ from the Fund in composition and do not pay management fees or expenses. One cannot invest directly in an index.
Class A (5/1/07–4/30/17)
Advisor Class (5/1/07–4/30/17)
See page 16 for Performance Summary footnotes.
franklintempleton.com | Annual Report | 15 | ||
FRANKLIN GROWTH OPPORTUNITIES FUND
PERFORMANCE SUMMARY
Distributions (5/1/16–4/30/17)
Share Class
| Long-Term
| |||
A | $ | 0.6413 | ||
C | $ | 0.6413 | ||
R | $ | 0.6413 | ||
R6 | $ | 0.6413 | ||
Advisor | $ | 0.6413 | ||
Total Annual Operating Expenses5
Share Class
| With Waiver
| Without Waiver
| ||||
A | 0.94% | 1.03% | ||||
Advisor | 0.69% | 0.78% | ||||
Each class of shares is available to certain eligible investors and has different annual fees and expenses, as described in the prospectus.
All investments involve risks, including possible loss of principal. Growth stock prices reflect projections of future earnings or revenues, and can, therefore, fall dramatically if the company fails to meet those projections. Smaller, midsized and relatively new or unseasoned companies can be particularly sensitive to changing economic conditions, and their prospects for growth are less certain than those of larger, more established companies. Historically, these securities have experienced more price volatility than larger company stocks, especially over the short term. To the extent the Fund focuses on particular countries, regions, industries, sectors or types of investment from time to time, it may be subject to greater risks of adverse developments in such areas of focus than a fund that invests in a wider variety of countries, regions, industries, sectors or investments. The Fund is actively managed but there is no guarantee that the manager’s investment decisions will produce the desired results. The Fund’s prospectus also includes a description of the main investment risks.
1. The Fund has an expense reduction and a fee waiver associated with any investments it makes in a Franklin Templeton money fund and/or other Franklin Templeton fund, contractually guaranteed through 8/31/17. Fund investment results reflect the expense reduction and fee waiver; without these reductions, the results would have been lower.
2. Cumulative total return represents the change in value of an investment over the periods indicated.
3. Average annual total return represents the average annual change in value of an investment over the periods indicated. Return for less than one year, if any, has not been annualized.
4. Source: Morningstar. The Russell 3000 Growth Index is market capitalization weighted and measures performance of those Russell 3000 Index companies with higher price-to-book ratios and higher forecasted growth values. The S&P 500 is a market capitalization-weighted index of 500 stocks designed to measure total U.S. equity market performance.
5. Figures are as stated in the Fund’s current prospectus and may differ from the expense ratios disclosed in the Your Fund’s Expenses and Financial Highlights sections in this report. In periods of market volatility, assets may decline significantly, causing total annual Fund operating expenses to become higher than the figures shown.
See www.franklintempletondatasources.com for additional data provider information.
16 | Annual Report | franklintempleton.com | ||
FRANKLIN GROWTH OPPORTUNITIES FUND
Your Fund’s Expenses
As a Fund shareholder, you can incur two types of costs: (1) transaction costs, including sales charges (loads) on Fund purchases and redemptions; and (2) ongoing Fund costs, including management fees, distribution and service (12b-1) fees, and other Fund expenses. All mutual funds have ongoing costs, sometimes referred to as operating expenses. The table below shows ongoing costs of investing in the Fund and can help you understand these costs and compare them with those of other mutual funds. The table assumes a $1,000 investment held for the six months indicated.
Actual Fund Expenses
The table below provides information about actual account values and actual expenses in the columns under the heading “Actual.” In these columns the Fund’s actual return, which includes the effect of Fund expenses, is used to calculate the “Ending Account Value” for each class of shares. You can estimate the expenses you paid during the period by following these steps (of course, your account value and expenses will differ from those in this illustration): Divide your account value by $1,000 (if your account had an $8,600 value, then $8,600 ÷ $1,000 = 8.6). Then multiply the result by the number in the row for your class of shares under the headings “Actual” and “Expenses Paid During Period” (if Actual Expenses Paid During Period were $7.50, then 8.6 x $7.50 = $64.50). In this illustration, the actual expenses paid this period are $64.50.
Hypothetical Example for Comparison with Other Funds
Under the heading “Hypothetical” in the table, information is provided about hypothetical account values and hypothetical expenses based on the Fund’s actual expense ratio and an assumed rate of return of 5% per year before expenses, which is not the Fund’s actual return. This information may not be used to estimate the actual ending account balance or expenses you paid for the period, but it can help you compare ongoing costs of investing in the Fund with those of other funds. To do so, compare this 5% hypothetical example for the class of shares you hold with the 5% hypothetical examples that appear in the shareholder reports of other funds.
Please note that expenses shown in the table are meant to highlight ongoing costs and do not reflect any transactional costs. Therefore, information under the heading “Hypothetical” is useful in comparing ongoing costs only, and will not help you compare total costs of owning different funds. In addition, if transactional costs were included, your total costs would have been higher.
Actual (actual return after expenses) | Hypothetical (5% annual return before expenses) | |||||||||||||||||
Share Class | Beginning Account Value 11/1/16 | Ending Account Value 4/30/17 | Expenses Paid During Period 11/1/16–4/30/171,2 | Ending Account Value 4/30/17 | Expenses Paid During 11/1/16–4/30/171,2 | Net Annualized Ratio2 | ||||||||||||
A | $1,000 | $1,130.50 | $4.97 | $1,020.13 | $4.71 | 0.94% | ||||||||||||
C | $1,000 | $1,126.30 | $8.86 | $1,016.46 | $8.40 | 1.68% | ||||||||||||
R | $1,000 | $1,129.30 | $6.23 | $1,018.94 | $5.91 | 1.18% | ||||||||||||
R6 | $1,000 | $1,133.30 | $2.54 | $1,022.41 | $2.41 | 0.48% | ||||||||||||
Advisor | $1,000 | $1,132.30 | $3.65 | $1,021.37 | $3.46 | 0.69% | ||||||||||||
1. Expenses are equal to the annualized expense ratio for the six-month period as indicated above—in the far right column—multiplied by the simple average account value over the period indicated, and then multiplied by 181/365 to reflect the one-half year period.
2. Reflects expenses after fee waivers and expense reimbursements. Does not include acquired fund fees and expenses.
franklintempleton.com | Annual Report | 17 | ||
Franklin Small Cap Growth Fund
This annual report for Franklin Small Cap Growth Fund covers the fiscal year ended April 30, 2017. At the market close on February 12, 2015, the Fund closed to new investors with limited exceptions. Existing shareholders may add to their accounts. Effective April 28, 2017, the Fund opened Class R6 shares to new investors who are eligible to purchase Class R6 shares.
Your Fund’s Goal and Main Investments
The Fund seeks long-term capital growth by normally investing at least 80% of its net assets in equity securities of small cap companies, which for this Fund are those with market capitalizations not exceeding $1.5 billion or that of the highest market capitalization in the Russell 2000® Index, whichever is greater, at the time of purchase.1
Performance Overview
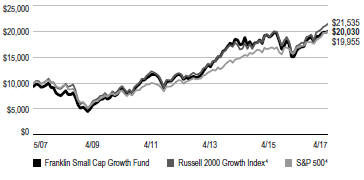
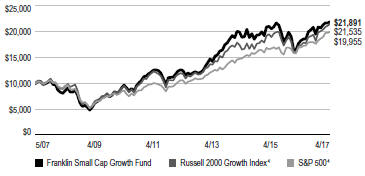
The Fund’s Class A shares delivered a +19.73% cumulative total return for the 12 months under review. In comparison, the Russell 2000® Growth Index, which measures performance of small cap companies with higher price-to-book ratios and higher forecasted growth values, generated a +24.06% total return.2 The Standard & Poor’s 500 Index (S&P 500), which tracks the broad U.S. stock market, produced a +17.92% total return.2 You can find the Fund’s long-term performance data in the Performance Summary beginning on page 21.
Performance data represent past performance, which does not guarantee future results. Investment return and principal value will fluctuate, and you may have a gain or loss when you sell your shares. Current performance may differ from figures shown. For most recent month-end performance, go to franklintempleton.com or call (800) 342-5236.
Investment Strategy
We use fundamental, bottom-up research to seek companies meeting our criteria of growth potential, quality and valuation. In seeking sustainable growth characteristics, we look for companies we believe can produce sustainable earnings and cash flow growth, evaluating the long-term market opportunity and competitive structure of an industry to target leaders and emerging leaders. We define quality companies as those with
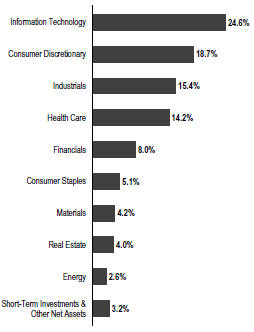
Portfolio Composition
Based on Total Net Assets as of 4/30/17
strong and improving competitive positions in attractive markets. We also believe important attributes of quality are experienced and talented management teams as well as financial strength reflected in the capital structure, gross and operating margins, free cash flow generation and returns on capital employed. Our valuation analysis includes a range of potential outcomes based on an assessment of multiple scenarios. In assessing value, we consider whether security prices fully reflect the balance of the sustainable growth opportunities relative to business and financial risks.
Manager’s Discussion
During the 12 months under review, most sectors represented in the Fund’s portfolio posted positive returns and contributed to absolute performance. Relative to the Russell 2000® Growth Index, key contributors to the Fund’s relative performance included stock selection and an overweighting in the
1. The Russell 2000 Index is market capitalization weighted and measures performance of the 2,000 smallest companies in the Russell 3000 Index, which represent a small amount of the total market capitalization of the Russell 3000 Index.
2. Source: Morningstar.
The indexes are unmanaged and include reinvested dividends. They do not reflect any fees, expenses or sales charges. One cannot invest directly in an index, and an index is not representative of the Fund’s portfolio.
The dollar value, number of shares or principal amount, and names of all portfolio holdings are listed in the Fund’s Statement of Investments (SOI). The SOI begins on page 53.
18 | Annual Report | franklintempleton.com | ||
FRANKLIN SMALL CAP GROWTH FUND
information technology (IT) sector. Stock selection and an underweighting in the real estate sector also boosted relative results, as did stock selection in the financials sector.
In the IT sector, shares of software technology company Demandware3 rose as the company was acquired by Salesforce.com in July 2016 at a significant premium. 2U, which provides cloud-based software-as-a-service solutions for non-profit colleges and universities, has continued to exceed consensus earnings estimates and raise expectations every quarter since it went public in mid-2014. In March, 2U announced its planned domestic graduate program launch schedule through 2020, which implied faster growth than was broadly expected and provided high visibility into expectations of strong growth for upcoming years. Programs the company launched in the past two years have been scaling faster and with higher profit margins than many observers expected. In addition, the company continued to announce additional programs, with both new and existing partners. Our off-benchmark investment in Intersil, a high-performance analog semiconductor company with expertise in power and voltage management, also helped the Fund’s results.3 Since installing a new management team in 2013, the company has streamlined its product focus, which led to strong growth and profitability. In September, Renesas Electronics announced its intention to acquire Intersil. Given Intersil’s solid execution and the subsequent acquisition bid from Renesas, its shares advanced significantly during the reporting period.
In the real estate sector, data center company CoreSite Realty aided relative performance amid accelerated growth driven by both cloud and enterprise data center deployments. The company successfully managed through a rather abrupt chief executive officer transition during the past year and emerged with a newfound focus on organic growth. Additionally, CoreSite continued to perform well in a strong demand environment where cloud adoption at enterprises is driving a re-architecture of a company’s data center needs, which appears to favor interconnection-rich colocation spaces that CoreSite offers.
In the financials sector, independent investment banking advisory company Evercore Partners contributed to the Fund’s results. The company benefited from strong earnings growth, as well as many investors’ belief that economic growth and lighter regulation would stimulate merger and acquisition activity.
Top 10 Holdings
4/30/17
Company Sector/Industry
| % of Total
| |||
2U Inc. | 2.6 | % | ||
Information Technology
| ||||
Zendesk Inc. | 1.9 | % | ||
Information Technology
| ||||
Nevro Corp. | 1.8 | % | ||
Health Care
| ||||
Ingevity Corp. | 1.8 | % | ||
Materials
| ||||
Alarm.com Holdings Inc. | 1.7 | % | ||
Information Technology
| ||||
US Ecology Inc. | 1.7 | % | ||
Industrials
| ||||
TreeHouse Foods Inc. | 1.7 | % | ||
Consumer Staples
| ||||
Paylocity Holding Corp. | 1.6 | % | ||
Information Technology
| ||||
Callidus Software Inc. | 1.6 | % | ||
Information Technology
| ||||
The Spectranetics Corp. | 1.5 | % | ||
Health Care
| ||||
Other key contributors included HeartWare International3 and Grand Canyon Education. Medical devices company HeartWare International announced in June 2016 that it would be acquired by Medtronic at a significant premium. Post-secondary education services provider Grand Canyon Education helped results in the consumer discretionary sector. Online new enrollment growth began accelerating sequentially in the second quarter of 2016 and has continued to be strong through the first quarter of 2017. The company has been benefiting from a combination of targeted new program launches, an improving regional brand and an attractive price point. Grand Canyon’s free cash flow generation is poised to improve in 2017, in our analysis, and company management has been signaling the beginning of a share repurchase program later this year, which follows many years of heavy capital investment. Overall sentiment regarding for-profit education companies, as well as their valuation multiples, improved following the U.S. election outcome, as the prior administration was seen as much more critical of the industry.
In contrast, key detractors from the Fund’s relative performance included stock selection in the health care sector. Within the sector, emergency room operator Adeptus Health
3. No longer held at period-end.
See www.franklintempletondatasources.com for additional data provider information.
franklintempleton.com | Annual Report | 19 | ||
FRANKLIN SMALL CAP GROWTH FUND
hurt the Fund’s relative performance as the company suffered from delays in payer collections and growing its footprint too aggressively.3 Specialty pharmaceuticals firm Impax Laboratories also hindered results.3 The company repeatedly reduced earnings guidance and reported declining results during the period as competitive dynamics worsened. Customer consolidation and new competition led to lower prices for generic drugs. The company acquired a portfolio of products from Teva Pharmaceutical Industries that dramatically underperformed after the transaction closed, due to the above-cited challenges. Impax did not receive important approvals for key generic drugs that have been awaiting Food and Drug Administration approval for several years. During the period, the company’s chief executive officer was fired without a replacement identified.
Stock selection in the consumer staples sector also hindered relative performance. Warehouse grocery store operator Smart & Final Stores was negatively impacted by persistent food price deflation, as well as increased competition between its existing stores and an acquisition it made last year.
The consumer discretionary sector detracted from the Fund’s relative results due to stock selection and an underweighted allocation. Within the sector, outdoor sporting goods retailer Sportsman’s Warehouse Holdings detracted from performance. Its shares fell significantly as the outlook for its key firearm segment appeared to decline after the November elections. Shares of casual restaurant operator Zoe’s Kitchen declined amid generally sluggish sales within the restaurant industry as retail traffic declined and consumer spending weakened. The company’s financial results have suffered from negative traffic trends and inefficiencies in new stores. Additionally, unexpected elevated technology investments, as well as labor and rent headwinds, negatively impacted profitability, which caused Zoe’s Kitchen to miss market expectations. Global Eagle Entertainment, a provider of content, connectivity and digital media solutions to the global travel industry, also hindered results in the sector. During the period, the company took on considerable debt to make a large acquisition, and the acquisition almost immediately disappointed after the company missed early targets. In addition, Global Eagle then announced a delay in filing financial results and fired its chief executive officer and chief financial officer. During this time, the company’s communications were poor, causing many investors to worry that there might be some issues that could potentially lead the company to breach its debt agreements.
Elsewhere, data platform provider Pure Storage detracted from results in the IT sector. Despite generally improving earnings per share and mostly steady revenue for the reporting period,
shares of Pure Storage fell as investors worried about growing competition from legacy incumbents, such as NetApp, and the negative impact of increased costs for NAND flash, a key input for the company. We remain confident that Pure Storage’s differentiation is high and improving and that the growth in NAND prices may moderate over the next year.
Thank you for your continued participation in Franklin Small Cap Growth Fund. We look forward to serving your future investment needs.
 |
Michael P. McCarthy, CFA Lead Portfolio Manager | |
 |
Bradley T. Carris, CFA | |
| Portfolio Management Team | ||


The foregoing information reflects our analysis, opinions and portfolio holdings as of April 30, 2017, the end of the reporting period. The way we implement our main investment strategies and the resulting portfolio holdings may change depending on factors such as market and economic conditions. These opinions may not be relied upon as investment advice or an offer for a particular security. The information is not a complete analysis of every aspect of any market, country, industry, security or the Fund. Statements of fact are from sources considered reliable, but the investment manager makes no representation or warranty as to their completeness or accuracy. Although historical performance is no guarantee of future results, these insights may help you understand our investment management philosophy.
20 | Annual Report | franklintempleton.com | ||
FRANKLIN SMALL CAP GROWTH FUND
Performance Summary as of April 30, 2017
The performance table and graphs do not reflect any taxes that a shareholder would pay on Fund dividends, capital gain distributions, if any, or any realized gains on the sale of Fund shares. Total return reflects reinvestment of the Fund’s dividends and capital gain distributions, if any, and any unrealized gains or losses. Your dividend income will vary depending on dividends or interest paid by securities in the Fund’s portfolio, adjusted for operating expenses of each class. Capital gain distributions are net profits realized from the sale of portfolio securities.
Performance as of 4/30/171
Cumulative total return excludes sales charges. Average annual total return includes maximum sales charges. Sales charges will vary depending on the size of the investment and the class of share purchased. The maximum is 5.75% and the minimum is 0%. Class A: 5.75% maximum initial sales charge; Advisor Class: no sales charges. For other share classes, visit franklintempleton.com.
Share Class
| Cumulative Total Return2
| Average Annual Total Return3
| ||
A | ||||
1-Year | +19.73% | +12.78% | ||
5-Year | +74.14% | +10.42% | ||
10-Year | +112.57% | +7.19% | ||
Advisor
| ||||
1-Year | +19.93% | +19.93% | ||
5-Year | +76.53% | +12.04% | ||
10-Year | +118.91% | +8.15% | ||
Performance data represent past performance, which does not guarantee future results. Investment return and principal value will fluctuate, and you may have a gain or loss when you sell your shares. Current performance may differ from figures shown. For most recent month-end performance, go to franklintempleton.com or call (800) 342-5236.
See page 23 for Performance Summary footnotes.
franklintempleton.com | Annual Report | 21 | ||
FRANKLIN SMALL CAP GROWTH FUND
PERFORMANCE SUMMARY
Total Return Index Comparison for a Hypothetical $10,000 Investment1
Total return represents the change in value of an investment over the periods shown. It includes any applicable maximum sales charge, Fund expenses, account fees and reinvested distributions. The unmanaged indexes include reinvestment of any income or distributions. They differ from the Fund in composition and do not pay management fees or expenses. One cannot invest directly in an index.
Class A (5/1/07–4/30/17)
Advisor Class (5/1/07–4/30/17)
See page 23 for Performance Summary footnotes.
22 | Annual Report | franklintempleton.com | ||
FRANKLIN SMALL CAP GROWTH FUND
PERFORMANCE SUMMARY
Total Annual Operating Expenses5
Share Class
| With Waiver
| Without Waiver
| ||||
A
|
| 1.12%
|
| 1.14%
| ||
Advisor
|
| 0.87%
|
| 0.89%
| ||
Each class of shares is available to certain eligible investors and has different annual fees and expenses, as described in the prospectus.
All investments involve risks, including possible loss of principal. Smaller, midsized and relatively new or unseasoned companies can be particularly sensitive to changing economic conditions, and their prospects for growth are less certain than those of larger, more established companies. Historically, these securities have experienced more price volatility than larger company stocks, especially over the short term. Growth stock prices reflect projections of future earnings or revenues, and can, therefore, fall dramatically if the company fails to meet those projections. To the extent the Fund focuses on particular countries, regions, industries, sectors or types of investment from time to time, it may be subject to greater risks of adverse developments in such areas of focus than a fund that invests in a wider variety of countries, regions, industries, sectors or investments. From time to time, the trading market for a particular security or type of security in which the Fund invests may become less liquid or even illiquid. The Fund is actively managed but there is no guarantee that the manager’s investment decisions will produce the desired results. The Fund’s prospectus also includes a description of the main investment risks.
1. The Fund has a fee waiver associated with any investment it makes in a Franklin Templeton money fund and/or other Franklin Templeton fund, contractually guaranteed through 8/31/17. Fund investment results reflect the fee waiver; without this waiver, the results would have been lower.
2. Cumulative total return represents the change in value of an investment over the periods indicated.
3. Average annual total return represents the average annual change in value of an investment over the periods indicated. Return for less than one year, if any, has not been annualized.
4. Source: Morningstar. The Russell 2000 Growth Index is market capitalization weighted and measures performance of those Russell 2000 Index companies with higher price-to-book ratios and higher forecasted growth values. The S&P 500 is a market capitalization-weighted index of 500 stocks designed to measure total U.S. equity market performance.
5. Figures are as stated in the Fund’s current prospectus and may differ from the expense ratios disclosed in the Your Fund’s Expenses and Financial Highlights sections in this report. In periods of market volatility, assets may decline significantly, causing total annual Fund operating expenses to become higher than the figures shown.
See www.franklintempletondatasources.com for additional data provider information.
franklintempleton.com | Annual Report | 23 | ||
FRANKLIN SMALL CAP GROWTH FUND
Your Fund’s Expenses
As a Fund shareholder, you can incur two types of costs: (1) transaction costs, including sales charges (loads) on Fund purchases and redemptions; and (2) ongoing Fund costs, including management fees, distribution and service (12b-1) fees, and other Fund expenses. All mutual funds have ongoing costs, sometimes referred to as operating expenses. The table below shows ongoing costs of investing in the Fund and can help you understand these costs and compare them with those of other mutual funds. The table assumes a $1,000 investment held for the six months indicated.
Actual Fund Expenses
The table below provides information about actual account values and actual expenses in the columns under the heading “Actual.” In these columns the Fund’s actual return, which includes the effect of Fund expenses, is used to calculate the “Ending Account Value” for each class of shares. You can estimate the expenses you paid during the period by following these steps (of course, your account value and expenses will differ from those in this illustration): Divide your account value by $1,000 (if your account had an $8,600 value, then $8,600 ÷ $1,000 = 8.6). Then multiply the result by the number in the row for your class of shares under the headings “Actual” and “Expenses Paid During Period” (if Actual Expenses Paid During Period were $7.50, then 8.6 x $7.50 = $64.50). In this illustration, the actual expenses paid this period are $64.50.
Hypothetical Example for Comparison with Other Funds
Under the heading “Hypothetical” in the table, information is provided about hypothetical account values and hypothetical expenses based on the Fund’s actual expense ratio and an assumed rate of return of 5% per year before expenses, which is not the Fund’s actual return. This information may not be used to estimate the actual ending account balance or expenses you paid for the period, but it can help you compare ongoing costs of investing in the Fund with those of other funds. To do so, compare this 5% hypothetical example for the class of shares you hold with the 5% hypothetical examples that appear in the shareholder reports of other funds.
Please note that expenses shown in the table are meant to highlight ongoing costs and do not reflect any transactional costs. Therefore, information under the heading “Hypothetical” is useful in comparing ongoing costs only, and will not help you compare total costs of owning different funds. In addition, if transactional costs were included, your total costs would have been higher.
Actual (actual return after expenses) | Hypothetical (5% annual return before expenses) | |||||||||||||||||
Share Class | Beginning Account Value 11/1/16 | Ending Account Value 4/30/17 | Expenses Paid During Period | Ending Account Value 4/30/17 | Expenses Paid During Period | Net Annualized Ratio2 | ||||||||||||
A | $1,000 | $1,123.30 | $5.42 | $1,019.69 | $5.16 | 1.03% | ||||||||||||
C | $1,000 | $1,119.20 | $9.35 | $1,015.97 | $8.90 | 1.78% | ||||||||||||
R | $1,000 | $1,122.20 | $6.68 | $1,018.50 | $6.36 | 1.27% | ||||||||||||
R6 | $1,000 | $1,125.60 | $3.16 | $1,021.82 | $3.01 | 0.60% | ||||||||||||
Advisor | $1,000 | $1,124.40 | $4.11 | $1,020.93 | $3.91 | 0.78% | ||||||||||||
1. Expenses are equal to the annualized expense ratio for the six-month period as indicated above—in the far right column—multiplied by the simple average account value over the period indicated, and then multiplied by 181/365 to reflect the one-half year period.
2. Reflects expenses after fee waivers and expense reimbursements. Does not include acquired fund fees and expenses.
24 | Annual Report | franklintempleton.com | ||
Franklin Small-Mid Cap Growth Fund
This annual report for Franklin Small-Mid Cap Growth Fund covers the fiscal year ended April 30, 2017.
Your Fund’s Goal and Main Investments
The Fund seeks long-term capital growth by normally investing at least 80% of its net assets in equity securities of small-cap and mid-cap companies. The Fund defines small-cap companies as those within the market capitalization range of companies in the Russell 2500™ Index at the time of purchase, and mid-cap companies as those within the market capitalization range of the Russell Midcap® Index at the time of purchase.1
Performance Overview
The Fund’s Class A shares delivered a +15.01% cumulative total return for the 12 months under review. In comparison, the Russell Midcap® Growth Index, which measures performance of companies in the Russell Midcap® Index with higher price-to-book ratios and higher forecasted growth values, generated a +15.83% total return.2 Also in comparison, the Standard & Poor’s 500 Index (S&P 500), which tracks the broad U.S. stock market, produced a total return of +17.92% total return.2 You can find the Fund’s long-term performance data in the Performance Summary beginning on
page 29.
Performance data represent past performance, which does not guarantee future results. Investment return and principal value will fluctuate, and you may have a gain or loss when you sell your shares. Current performance may differ from figures shown. For most recent month-end performance, go to franklintempleton.com or call (800) 342-5236.
Investment Strategy
We use fundamental, bottom-up research to seek companies meeting our criteria of growth potential, quality and valuation. In seeking sustainable growth characteristics, we look for companies we believe can produce sustainable earnings and cash flow growth, evaluating the long-term market opportunity and competitive structure of an industry to target leaders and emerging leaders. We define quality companies as those with strong and improving competitive positions in attractive markets. We also believe important attributes of quality are
Portfolio Composition
Based on Total Net Assets as of 4/30/17
experienced and talented management teams as well as financial strength reflected in the capital structure, gross and operating margins, free cash flow generation and returns on capital employed. Our valuation analysis includes a range of potential outcomes based on an assessment of multiple scenarios. In assessing value, we consider whether security prices fully reflect the balance of the sustainable growth opportunities relative to business and financial risks.
Manager’s Discussion
During the 12 months under review, contributors to the Fund’s performance relative to the Russell Midcap® Growth Index included investments in the consumer staples, information technology (IT) and materials sectors, largely due to stock selection. In consumer staples, shares of packaged food and
1. The Russell 2500 Index is market capitalization weighted and measures performance of the 2,500 smallest companies in the Russell 3000 Index, which represent a modest amount of the Russell 3000 Index’s total market capitalization. The Russell Midcap Index is market capitalization weighted and measures performance of the smallest companies in the Russell 1000 Index, which represent a modest amount of the Russell 1000 Index’s total market capitalization.
2. Source: Morningstar.
The indexes are unmanaged and include reinvested dividends. They do not reflect any fees, expense or sales charges. One cannot invest directly in an index, and an index is not representative of the Fund’s portfolio.
The dollar value, number of shares or principal amount, and names of all portfolio holdings are listed in the Fund’s Statement of Investments (SOI). The SOI begins on page 62.
franklintempleton.com | Annual Report | 25 | ||
FRANKLIN SMALL-MID CAP GROWTH FUND
beverage company WhiteWave Foods3 surged as Danone announced in July 2016 its intention to acquire WhiteWave in an all-cash transaction. We decided to exit our position as the deal was not expected to close until the end of 2016, and we did not anticipate a competitive bidding process.
In IT, machine vision products provider Cognex performed well during the reporting period, due to incremental new business from a large consumer electronics customer, as well as continued strong growth in logistics and automotive end markets. The company experienced significant positive earnings revisions in 2016, and some expansion in valuation multiples, which drove shares higher. Further boosting shares were additional new business outside the large consumer electronics customer base and continued growth in its eRetailer customer base, combined with strong operating leverage amid strong sales growth. Our off-benchmark position in Intersil (no longer held at period-end), a high-performance analog semiconductor company with expertise in power and voltage management, also helped the Fund’s results. Since installing a new management team in 2013, the company has streamlined its product focus, which led to strong growth and profitability. In September 2016, Renesas Electronics announced its intention to acquire Intersil. Given Intersil’s solid execution and the subsequent acquisition bid from Renesas, its shares advanced significantly during the reporting period. 2U, which provides cloud-based software-as-a-service solutions for non-profit colleges and universities, has continued to exceed consensus earnings estimates and raise expectations every quarter since it went public in mid-2014. In March, 2U announced its planned domestic graduate program launch schedule through 2020, which implied faster growth than was broadly expected and provided high visibility into strong growth for upcoming years. Programs the company launched in the past two years have been scaling faster and with higher margins than most observers expected. In addition, the company continued to announce additional programs, with both new and existing partners.
In materials, aggregates and heavy building materials provider Martin Marietta Materials contributed to performance. The company experienced increased visibility resulting from the passage of a five-year federal highway bill, which led to stronger sales volumes for infrastructure projects. Several state-level highway funding initiatives in key states where the company operates drove higher aggregates and cement demand for highway construction, notably Texas, North Carolina, Iowa
Top 10 Holdings
4/30/17
Company Sector/Industry
| % of Total Net Assets
| |
Roper Technologies Inc. | 2.2% | |
Industrials
| ||
Equinix Inc. | 1.9% | |
Real Estate
| ||
CoStar Group Inc. | 1.6% | |
Information Technology
| ||
Affiliated Managers Group Inc. | 1.5% | |
Financials
| ||
Axalta Coating Systems Ltd. | 1.5% | |
Materials
| ||
Edwards Lifesciences Corp. | 1.5% | |
Health Care
| ||
Vantiv Inc. | 1.4% | |
Information Technology
| ||
Martin Marietta Materials Inc. | 1.4% | |
Materials
| ||
IHS Markit Ltd. | 1.3% | |
Industrials
| ||
Norwegian Cruise Line Holdings Ltd. | 1.3% | |
Consumer Discretionary
|
and Georgia. Additionally, the company benefited from strong housing and non-residential construction activity in Colorado and parts of Texas. Optimism for a major infrastructure stimulus package and tax reform further boosted its share price.
Elsewhere, post-secondary education services provider Grand Canyon Education helped results in the consumer discretionary sector. Online new enrollment growth began accelerating sequentially in the second quarter of 2016 and continued to be strong through the first quarter of 2017. The company has been benefiting from a combination of targeted new program launches, an improving regional brand and an attractive price point. Grand Canyon’s free cash flow generation is poised to improve in 2017, in our analysis, and company management has been signaling the beginning of a share repurchase program later this year, which follows many years of heavy capital investment. Overall sentiment regarding for-profit education companies, as well as their and valuation multiples, improved following the U.S. election outcome, as the prior administration was seen as much more critical of the industry.
In contrast, key detractors from the Fund’s relative results for the period included the health care, energy and consumer discretionary sectors, primarily due to stock selection. In health
3. No longer held at period-end.
See www.franklintempletondatasources.com for additional data provider information.
26 | Annual Report | franklintempleton.com | ||
FRANKLIN SMALL-MID CAP GROWTH FUND
care, specialty pharmaceuticals firm Impax Laboratories hindered results.3 The company repeatedly reduced earnings guidance and reported declining results during the period as competitive dynamics worsened. Customer consolidation and new competition led to lower prices for generic drugs. The company acquired a portfolio of products from Teva Pharmaceutical Industries that dramatically underperformed after the transaction closed, due to the above-cited challenges. Impax did not receive important approvals for key generic drugs that have been awaiting Food and Drug Administration approval for several years. During the period, the company’s chief executive officer was fired without a replacement identified. Pharmaceuticals firm Mallinckrodt also hindered results in the sector.3 Challenges to the company’s generic pharmaceutical unit, which accounts for about one quarter of earnings, continued due to price declines and lower demand. Increased scrutiny on drug pricing brought attention to Mallinckrodt due to the high price of its salvage therapy, Acthar Gel. The company’s underlying strong business performance was overshadowed by the pricing and political pressures on specialty pharmaceutical companies.
In energy, specialized oilfield services and equipment provider Superior Energy Services detracted from performance. Energy stocks generally performed poorly in the first four months of 2017 due to a decline in oil prices tied to high inventory levels, resurgent U.S. production and fears the Organization of the Petroleum Exporting Countries will not renew its output reduction targets. As with many oilfield services companies, Superior has struggled to regain profitability, despite recently strong revenue growth, as input costs have also risen and pressured margins. We believe this dynamic could see some relief by the second half of this year, and our outlook for oil prices also remains constructive longer term.
In consumer discretionary, specialty retailer L Brands and casual restaurant operator Zoe’s Kitchen declined. L Brands experienced volatility recently, driven by a strategic initiative early last year to exit non-core categories at Victoria’s Secret. The initiative has driven negative comparable-store sales and a focus on core categories, with the goal of driving market share in the short term. This move has led to potential customer demand disruptions during a time when the environment has become more competitive and mall traffic continued to suffer. In April, there was also an Easter timing issue that drove March comparable-store sales lower, which, when coupled with declining overall mall traffic, led to a decline in the stock. However, we have seen recovery in most segments of the company’s business. We continue to believe L Brands is a high-quality company that is going through a transition that has
driven volatility but should benefit the business longer term. Shares of casual restaurant operator Zoe’s Kitchen declined amid generally sluggish sales within the restaurant industry as retail traffic declined and consumer spending weakened. The company’s financial results have suffered from negative traffic trends and inefficiencies in new stores. Additionally, unexpected elevated technology investments, as well as labor and rent headwinds, negatively impacted profitability, which caused Zoe’s Kitchen to miss market expectations.
Elsewhere, our underweighting in graphics processor company NVIDIA hampered the Fund’s results. The company’s shares performed particularly well during the period as growth accelerated and led to significant expansion in valuation multiples based on higher earnings per share than the market expected. The Fund’s underweighted position in the company relative to the benchmark index detracted from relative results.
Thank you for your continued participation in Franklin Small-Mid Cap Growth Fund. We look forward to serving your future investment needs.
 |
Edward B. Jamieson Lead Portfolio Manager |
 |
John P. Scandalios | |
Michael P. McCarthy, CFA James Cross, CFA
Portfolio Management Team |

franklintempleton.com | Annual Report | 27 | ||
FRANKLIN SMALL-MID CAP GROWTH FUND
The foregoing information reflects our analysis, opinions and portfolio holdings as of April 30, 2017, the end of the reporting period. The way we implement our main investment strategies and the resulting portfolio holdings may change depending on factors such as market and economic conditions. These opinions may not be relied upon as investment advice or an offer for a particular security. The information is not a complete analysis of every aspect of any market, country, industry, security or the Fund. Statements of fact are from sources considered reliable, but the investment manager makes no representation or warranty as to their completeness or accuracy. Although historical performance is no guarantee of future results, these insights may help you understand our investment management philosophy.
28 | Annual Report | franklintempleton.com | ||
FRANKLIN SMALL-MID CAP GROWTH FUND
Performance Summary as of April 30, 2017
The performance table and graphs do not reflect any taxes that a shareholder would pay on Fund dividends, capital gain distributions, if any, or any realized gains on the sale of Fund shares. Total return reflects reinvestment of the Fund’s dividends and capital gain distributions, if any, and any unrealized gains or losses. Your dividend income will vary depending on dividends or interest paid by securities in the Fund’s portfolio, adjusted for operating expenses of each class. Capital gain distributions are net profits realized from the sale of portfolio securities.
Performance as of 4/30/171
Cumulative total return excludes sales charges. Average annual total return includes maximum sales charges. Sales charges will vary depending on the size of the investment and the class of share purchased. The maximum is 5.75% and the minimum is 0%. Class A: 5.75% maximum initial sales charge; Advisor Class: no sales charges. For other share classes, visit franklintempleton.com.
Share Class
| Cumulative Total Return2
| Average Annual Total Return3
| ||
A
| ||||
1-Year
| +15.01%
| +8.40%
| ||
5-Year
| +61.01%
| �� | +8.70%
| |
10-Year
| +87.21%
| +5.84%
| ||
Advisor
| ||||
1-Year
| +15.28%
| +15.28%
| ||
5-Year
| +63.04%
| +10.27%
| ||
10-Year
| +92.01%
| +6.74%
| ||
Performance data represent past performance, which does not guarantee future results. Investment return and principal value will fluctuate, and you may have a gain or loss when you sell your shares. Current performance may differ from figures shown. For most recent month-end performance, go to franklintempleton.com or call (800) 342-5236.
See page 31 for Performance Summary footnotes.
franklintempleton.com | Annual Report | 29 | ||
FRANKLIN SMALL-MID CAP GROWTH FUND
PERFORMANCE SUMMARY
Total Return Index Comparison for a Hypothetical $10,000 Investment1
Total return represents the change in value of an investment over the periods shown. It includes any applicable maximum sales charge, Fund expenses, account fees and reinvested distributions. The unmanaged indexes include reinvestment of any income or distributions. They differ from the Fund in composition and do not pay management fees or expenses. One cannot invest directly in an index.
Class A (5/1/07–4/30/17)
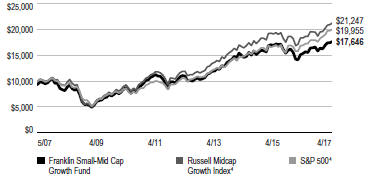
Advisor Class (5/1/07–4/30/17)
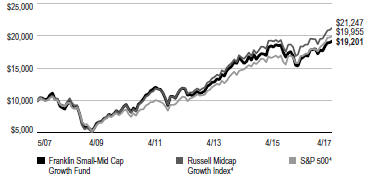
See page 31 for Performance Summary footnotes.
30 | Annual Report | franklintempleton.com | ||
FRANKLIN SMALL-MID CAP GROWTH FUND
PERFORMANCE SUMMARY
Distributions (5/1/16–4/30/17)
| Share Class | Short-Term Capital Gain | Long-Term Capital Gain | Total | |||||||||
A
|
| $0.1470
|
|
| $1.9639
|
|
| $2.1109
|
| |||
C
|
| $0.1470
|
|
| $1.9639
|
|
| $2.1109
|
| |||
R
|
| $0.1470
|
|
| $1.9639
|
|
| $2.1109
|
| |||
R6
|
| $0.1470
|
|
| $1.9639
|
|
| $2.1109
|
| |||
Advisor
|
| $0.1470
|
| $1.9639 | $2.1109 | |||||||
Total Annual Operating Expenses5
Share Class
| With Waiver
| Without Waiver
| ||||
A
|
| 0.96%
|
| 0.97%
| ||
Advisor
|
| 0.71%
|
| 0.72%
| ||
Each class of shares is available to certain eligible investors and has different annual fees and expenses, as described in the prospectus.
All investments involve risks, including possible loss of principal. Growth stock prices reflect projections of future earnings or revenues, and can, therefore, fall dramatically if the company fails to meet those projections. Smaller, midsized and relatively new or unseasoned companies can be particularly sensitive to changing economic conditions, and their prospects for growth are less certain than those of larger, more established companies. Historically, these securities have experienced more price volatility than larger company stocks, especially over the short term. To the extent the Fund focuses on particular countries, regions, industries, sectors or types of investment from time to time, it may be subject to greater risks of adverse developments in such areas of focus than a fund that invests in a wider variety of countries, regions, industries, sectors or investments. From time to time, the trading market for a particular security or type of security in which the Fund invests may become less liquid or even illiquid. The Fund is actively managed but there is no guarantee that the manager’s investment decisions will produce the desired results. The Fund’s prospectus also includes a description of the main investment risks.
1. The Fund has a fee waiver associated with any investment it makes in a Franklin Templeton money fund and/or other Franklin Templeton fund, contractually guaranteed through 8/31/17. Fund investment results reflect the fee waiver; without this waiver, the results would have been lower.
2. Cumulative total return represents the change in value of an investment over the periods indicated.
3. Average annual total return represents the average annual change in value of an investment over the periods indicated. Return for less than one year, if any, has not been annualized.
4. Source: Morningstar. The Russell Midcap Growth Index is market capitalization weighted and measures performance of those Russell Midcap Index companies with higher price-to-book ratios and higher forecasted growth values. The S&P 500 is a market capitalization-weighted index of 500 stocks designed to measure total U.S. equity market performance.
5. Figures are as stated in the Fund’s current prospectus and may differ from the expense ratios disclosed in the Your Fund’s Expenses and Financial Highlights sections in this report. In periods of market volatility, assets may decline significantly, causing total annual Fund operating expenses to become higher than the figures shown.
See www.franklintempletondatasources.com for additional data provider information.
franklintempleton.com | Annual Report | 31 | ||
FRANKLIN SMALL-MID CAP GROWTH FUND
Your Fund’s Expenses
As a Fund shareholder, you can incur two types of costs: (1) transaction costs, including sales charges (loads) on Fund purchases and redemptions; and (2) ongoing Fund costs, including management fees, distribution and service (12b-1) fees, and other Fund expenses. All mutual funds have ongoing costs, sometimes referred to as operating expenses. The table below shows ongoing costs of investing in the Fund and can help you understand these costs and compare them with those of other mutual funds. The table assumes a $1,000 investment held for the six months indicated.
Actual Fund Expenses
The table below provides information about actual account values and actual expenses in the columns under the heading “Actual.” In these columns the Fund’s actual return, which includes the effect of Fund expenses, is used to calculate the “Ending Account Value” for each class of shares. You can estimate the expenses you paid during the period by following these steps (of course, your account value and expenses will differ from those in this illustration): Divide your account value by $1,000 (if your account had an $8,600 value, then $8,600 ÷ $1,000 = 8.6). Then multiply the result by the number in the row for your class of shares under the headings “Actual” and “Expenses Paid During Period” (if Actual Expenses Paid During Period were $7.50, then 8.6 x $7.50 = $64.50). In this illustration, the actual expenses paid this period are $64.50.
Hypothetical Example for Comparison with Other Funds
Under the heading “Hypothetical” in the table, information is provided about hypothetical account values and hypothetical expenses based on the Fund’s actual expense ratio and an assumed rate of return of 5% per year before expenses, which is not the Fund’s actual return. This information may not be used to estimate the actual ending account balance or expenses you paid for the period, but it can help you compare ongoing costs of investing in the Fund with those of other funds. To do so, compare this 5% hypothetical example for the class of shares you hold with the 5% hypothetical examples that appear in the shareholder reports of other funds.
Please note that expenses shown in the table are meant to highlight ongoing costs and do not reflect any transactional costs. Therefore, information under the heading “Hypothetical” is useful in comparing ongoing costs only, and will not help you compare total costs of owning different funds. In addition, if transactional costs were included, your total costs would have been higher.
Actual (actual return after expenses) | Hypothetical (5% annual return before expenses) | |||||||||||||||||
Share Class | Beginning Account Value 11/1/16 | Ending Account Value 4/30/17 | Expenses Paid During | Ending Account Value 4/30/17 | Expenses Paid During | Net Annualized Expense Ratio2 | ||||||||||||
A | $1,000 | $1,113.70 | $4.87 | $1,020.18 | $4.66 | 0.93% | ||||||||||||
C | $1,000 | $1,109.60 | $8.79 | $1,016.46 | $8.40 | 1.68% | ||||||||||||
R | $1,000 | $1,112.30 | $6.13 | $1,018.99 | $5.86 | 1.17% | ||||||||||||
R6 | $1,000 | $1,116.20 | $2.47 | $1,022.46 | $2.36 | 0.47% | ||||||||||||
Advisor | $1,000 | $1,115.30 | $3.57 | $1,021.42 | $3.41 | 0.68% | ||||||||||||
1. Expenses are equal to the annualized expense ratio for the six-month period as indicated above—in the far right column—multiplied by the simple average account value over the period indicated, and then multiplied by 181/365 to reflect the one-half year period.
2. Reflects expenses after fee waivers and expense reimbursements. Does not include acquired fund fees and expenses.
32 | Annual Report | franklintempleton.com | ||
FRANKLIN STRATEGIC SERIES
Franklin Focused Core Equity Fund
| Year Ended April 30, | ||||||||||||||||||||
| 2017 | 2016 | 2015 | 2014 | 2013 | ||||||||||||||||
Class A | ||||||||||||||||||||
Per share operating performance | ||||||||||||||||||||
(for a share outstanding throughout the year) | ||||||||||||||||||||
Net asset value, beginning of year | $13.12 | $15.29 | $13.38 | $10.63 | $9.47 | |||||||||||||||
Income from investment operationsa: | ||||||||||||||||||||
Net investment income (loss)b | (0.01 | ) | 0.07 | c | (0.01 | ) | 0.03 | 0.07 | ||||||||||||
Net realized and unrealized gains (losses) | 2.09 | (1.83 | ) | 2.23 | 2.92 | 1.16 | ||||||||||||||
Total from investment operations | 2.08 | (1.76 | ) | 2.22 | 2.95 | 1.23 | ||||||||||||||
Less distributions from: | ||||||||||||||||||||
Net investment income | — | (0.06 | ) | — | (0.07 | ) | — | |||||||||||||
Net realized gains | — | (0.35 | ) | (0.31 | ) | (0.13 | ) | (0.07 | ) | |||||||||||
Total distributions | — | (0.41 | ) | (0.31 | ) | (0.20 | ) | (0.07 | ) | |||||||||||
Net asset value, end of year | $15.20 | $13.12 | $15.29 | $13.38 | $10.63 | |||||||||||||||
Total returnd | 15.85% | (11.70)% | 16.84% | 28.00% | 13.08% | |||||||||||||||
Ratios to average net assets | ||||||||||||||||||||
Expenses before waiver and payments by affiliates | 1.47% | 1.46% | 1.54% | 1.73% | 1.89% | |||||||||||||||
Expenses net of waiver and payments by affiliates | 1.24% | e | 1.25% | 1.28% | 1.22% | 1.19% | ||||||||||||||
Net investment income (loss) | (0.04)% | 0.48% | c | (0.07)% | 0.23% | 0.76% | ||||||||||||||
Supplemental data | ||||||||||||||||||||
Net assets, end of year (000’s) | $77,733 | $100,483 | $92,612 | $40,372 | $19,029 | |||||||||||||||
Portfolio turnover rate | 17.45% | 35.56% | 25.55% | 43.30% | 74.50% | |||||||||||||||
aThe amount shown for a share outstanding throughout the period may not correlate with the Statement of Operations for the period due to the timing of sales and repurchases of the Fund’s shares in relation to income earned and/or fluctuating fair value of the investments of the Fund.
bBased on average daily shares outstanding.
cNet investment income per share includes approximately $0.06 per share related to income received in the form of special dividends in connection with certain Fund holdings. Excluding this amount, the ratio of net investment income to average net assets would have been 0.02%.
dTotal return does not reflect sales commissions or contingent deferred sales charges, if applicable.
eBenefit of expense reduction rounds to less than 0.01%.
franklintempleton.com | The accompanying notes are an integral part of these financial statements. | Annual Report | 33 | ||
FRANKLIN STRATEGIC SERIES
FINANCIAL HIGHLIGHTS
Franklin Focused Core Equity Fund (continued)
| Year Ended April 30, | ||||||||||||||||||||
| 2017 | 2016 | 2015 | 2014 | 2013 | ||||||||||||||||
Class C | ||||||||||||||||||||
Per share operating performance | ||||||||||||||||||||
(for a share outstanding throughout the year) | ||||||||||||||||||||
Net asset value, beginning of year | $12.58 | $14.73 | $12.98 | $10.36 | $9.29 | |||||||||||||||
Income from investment operationsa: | ||||||||||||||||||||
Net investment income (loss)b | (0.10 | ) | (0.04 | )c | (0.11 | ) | (0.06 | ) | 0.01 | |||||||||||
Net realized and unrealized gains (losses) | 1.98 | (1.76 | ) | 2.17 | 2.84 | 1.13 | ||||||||||||||
Total from investment operations | 1.88 | (1.80 | ) | 2.06 | 2.78 | 1.14 | ||||||||||||||
Less distributions from: | ||||||||||||||||||||
Net investment income | — | — | — | (0.03 | ) | — | ||||||||||||||
Net realized gains | — | (0.35 | ) | (0.31 | ) | (0.13 | ) | (0.07 | ) | |||||||||||
Total distributions | — | (0.35 | ) | (0.31 | ) | (0.16 | ) | (0.07 | ) | |||||||||||
Net asset value, end of year | $14.46 | $12.58 | $14.73 | $12.98 | $10.36 | |||||||||||||||
Total returnd | 14.94% | (12.31)% | 16.12% | 26.99% | 12.36% | |||||||||||||||
Ratios to average net assets | ||||||||||||||||||||
Expenses before waiver and payments by affiliates | 2.21% | 2.20% | 2.24% | 2.43% | 2.59% | |||||||||||||||
Expenses net of waiver and payments by affiliates | 1.98% | e | 1.99% | 1.98% | 1.92% | 1.89% | ||||||||||||||
Net investment income (loss) | (0.78)% | (0.26)% | c | (0.77)% | (0.47)% | 0.06% | ||||||||||||||
Supplemental data | ||||||||||||||||||||
Net assets, end of year (000’s) | $20,341 | $25,119 | $18,758 | $6,666 | $2,502 | |||||||||||||||
Portfolio turnover rate | 17.45% | 35.56% | 25.55% | 43.30% | 74.50% | |||||||||||||||
aThe amount shown for a share outstanding throughout the period may not correlate with the Statement of Operations for the period due to the timing of sales and repurchases of the Fund’s shares in relation to income earned and/or fluctuating fair value of the investments of the Fund.
bBased on average daily shares outstanding.
cNet investment income per share includes approximately $0.06 per share related to income received in the form of special dividends in connection with certain Fund holdings. Excluding this amount, the ratio of net investment income to average net assets would have been (0.72)%.
dTotal return does not reflect sales commissions or contingent deferred sales charges, if applicable.
eBenefit of expense reduction rounds to less than 0.01%.
34 | Annual Report | The accompanying notes are an integral part of these financial statements. | franklintempleton.com | ||
FRANKLIN STRATEGIC SERIES
FINANCIAL HIGHLIGHTS
Franklin Focused Core Equity Fund (continued)
| Year Ended April 30, | ||||||||||||||||||||
| 2017 | 2016 | 2015 | 2014 | 2013 | ||||||||||||||||
Class R | ||||||||||||||||||||
Per share operating performance | ||||||||||||||||||||
(for a share outstanding throughout the year) | ||||||||||||||||||||
Net asset value, beginning of year | $12.98 | $15.15 | $13.28 | $10.56 | $9.43 | |||||||||||||||
Income from investment operationsa: | ||||||||||||||||||||
Net investment income (loss)b | (0.03 | ) | 0.03 | c | (0.04 | ) | 0.01 | 0.05 | ||||||||||||
Net realized and unrealized gains (losses) | 2.06 | (1.81 | ) | 2.22 | 2.90 | 1.15 | ||||||||||||||
Total from investment operations | 2.03 | (1.78 | ) | 2.18 | 2.91 | 1.20 | ||||||||||||||
Less distributions from: | ||||||||||||||||||||
Net investment income | — | (0.04 | ) | — | (0.06 | ) | — | |||||||||||||
Net realized gains | — | (0.35 | ) | (0.31 | ) | (0.13 | ) | (0.07 | ) | |||||||||||
Total distributions | — | (0.39 | ) | (0.31 | ) | (0.19 | ) | (0.07 | ) | |||||||||||
Net asset value, end of year | $15.01 | $12.98 | $15.15 | $13.28 | $10.56 | |||||||||||||||
Total return | 15.64% | (11.91)% | 16.66% | 27.70% | 12.81% | |||||||||||||||
Ratios to average net assets | ||||||||||||||||||||
Expenses before waiver and payments by affiliates | 1.64% | 1.69% | 1.74% | 1.93% | 2.09% | |||||||||||||||
Expenses net of waiver and payments by affiliates | 1.41%d | 1.48% | 1.48% | 1.42% | 1.39% | |||||||||||||||
Net investment income (loss) | (0.21)% | 0.25% | c | (0.27)% | 0.03% | 0.56% | ||||||||||||||
Supplemental data | ||||||||||||||||||||
Net assets, end of year (000’s) | $166 | $273 | $169 | $124 | $76 | |||||||||||||||
Portfolio turnover rate | 17.45% | 35.56% | 25.55% | 43.30% | 74.50% | |||||||||||||||
aThe amount shown for a share outstanding throughout the period may not correlate with the Statement of Operations for the period due to the timing of sales and repurchases of the Fund’s shares in relation to income earned and/or fluctuating fair value of the investments of the Fund.
bBased on average daily shares outstanding.
cNet investment income per share includes approximately $0.06 per share related to income received in the form of special dividends in connection with certain Fund holdings. Excluding this amount, the ratio of net investment income to average net assets would have been (0.21)%.
dBenefit of expense reduction rounds to less than 0.01%.
franklintempleton.com | The accompanying notes are an integral part of these financial statements. | Annual Report | 35 | ||
FRANKLIN STRATEGIC SERIES
FINANCIAL HIGHLIGHTS
Franklin Focused Core Equity Fund (continued)
| Year Ended April 30, | ||||||||||||||||
| 2017 | 2016 | 2015 | 2014a | |||||||||||||
Class R6 | ||||||||||||||||
Per share operating performance | ||||||||||||||||
(for a share outstanding throughout the year) | ||||||||||||||||
Net asset value, beginning of year | $13.27 | $15.46 | $13.49 | $10.54 | ||||||||||||
Income from investment operationsb: | ||||||||||||||||
Net investment incomec | 0.05 | 0.12 | d | 0.05 | 0.07 | |||||||||||
Net realized and unrealized gains (losses) | 2.12 | (1.85 | ) | 2.27 | 3.11 | |||||||||||
Total from investment operations | 2.17 | (1.73 | ) | 2.32 | 3.18 | |||||||||||
Less distributions from: | ||||||||||||||||
Net investment income | — | (0.11 | ) | (0.04 | ) | (0.10 | ) | |||||||||
Net realized gains | — | (0.35 | ) | (0.31 | ) | (0.13 | ) | |||||||||
Total distributions | — | (0.46 | ) | (0.35 | ) | (0.23 | ) | |||||||||
Net asset value, end of year | $15.44 | $13.27 | $15.46 | $13.49 | ||||||||||||
Total return | 16.35% | (11.32)% | 17.45% | 30.43% | ||||||||||||
Ratios to average net assets | ||||||||||||||||
Expenses before waiver and payments by affiliates | 1.06% | 1.04% | 1.09% | 2.28% | ||||||||||||
Expenses net of waiver and payments by affiliates | 0.84% | e | 0.85% | 0.83% | 0.77% | |||||||||||
Net investment income | 0.36% | 0.88% | d | 0.38% | 0.68% | |||||||||||
Supplemental data | ||||||||||||||||
Net assets, end of year (000’s) | $20,401 | $33,640 | $25,739 | $14 | ||||||||||||
Portfolio turnover rate | 17.45% | 35.56% | 25.55% | 43.30% | ||||||||||||
aFor the year May 1, 2013 (effective date) to April 30, 2014.
bThe amount shown for a share outstanding throughout the period may not correlate with the Statement of Operations for the period due to the timing of sales and repurchases of the Fund’s shares in relation to income earned and/or fluctuating fair value of the investments of the Fund.
cBased on average daily shares outstanding.
dNet investment income per share includes approximately $0.06 per share related to income received in the form of special dividends in connection with certain Fund holdings. Excluding this amount, the ratio of net investment income to average net assets would have been 0.42%.
eBenefit of expense reduction rounds to less than 0.01%.
36 | Annual Report | The accompanying notes are an integral part of these financial statements. | franklintempleton.com | ||
FRANKLIN STRATEGIC SERIES
FINANCIAL HIGHLIGHTS
Franklin Focused Core Equity Fund (continued)
| Year Ended April 30, | ||||||||||||||||||||
| 2017 | 2016 | 2015 | 2014 | 2013 | ||||||||||||||||
Advisor Class | ||||||||||||||||||||
Per share operating performance | ||||||||||||||||||||
(for a share outstanding throughout the year) | ||||||||||||||||||||
Net asset value, beginning of year | $13.25 | $15.44 | $13.48 | $10.70 | $9.50 | |||||||||||||||
Income from investment operationsa: | ||||||||||||||||||||
Net investment incomeb | 0.03 | 0.10 | c | 0.04 | 0.07 | 0.10 | ||||||||||||||
Net realized and unrealized gains (losses) | 2.11 | (1.85 | ) | 2.25 | 2.93 | 1.17 | ||||||||||||||
Total from investment operations | 2.14 | (1.75 | ) | 2.29 | 3.00 | 1.27 | ||||||||||||||
Less distributions from: | ||||||||||||||||||||
Net investment income | — | (0.09 | ) | (0.02 | ) | (0.09 | ) | — | ||||||||||||
Net realized gains | — | (0.35 | ) | (0.31 | ) | (0.13 | ) | (0.07 | ) | |||||||||||
Total distributions | — | (0.44 | ) | (0.33 | ) | (0.22 | ) | (0.07 | ) | |||||||||||
Net asset value, end of year | $15.39 | $13.25 | $15.44 | $13.48 | $10.70 | |||||||||||||||
Total return | 16.15% | (11.45)% | 17.25% | 28.27% | 13.46% | |||||||||||||||
Ratios to average net assets | ||||||||||||||||||||
Expenses before waiver and payments by affiliates | 1.22% | 1.20% | 1.24% | 1.43% | 1.59% | |||||||||||||||
Expenses net of waiver and payments by affiliates | 0.99% | d | 0.99% | 0.98% | 0.92% | 0.89% | ||||||||||||||
Net investment income | 0.21% | 0.74% | c | 0.23% | 0.53% | 1.06% | ||||||||||||||
Supplemental data | ||||||||||||||||||||
Net assets, end of year (000’s) | $13,077 | $10,736 | $9,914 | $6,990 | $4,347 | |||||||||||||||
Portfolio turnover rate | 17.45% | 35.56% | 25.55% | 43.30% | 74.50% | |||||||||||||||
aThe amount shown for a share outstanding throughout the period may not correlate with the Statement of Operations for the period due to the timing of sales and repurchases of the Fund’s shares in relation to income earned and/or fluctuating fair value of the investments of the Fund.
bBased on average daily shares outstanding.
cNet investment income per share includes approximately $0.06 per share related to income received in the form of special dividends in connection with certain Fund holdings. Excluding this amount, the ratio of net investment income to average net assets would have been 0.28%.
dBenefit of expense reduction rounds to less than 0.01%.
franklintempleton.com | The accompanying notes are an integral part of these financial statements. | Annual Report | 37 | ||
FRANKLIN STRATEGIC SERIES
Statement of Investments, April 30, 2017
Franklin Focused Core Equity Fund
Country
| Shares
| Value
| ||||||||
Common Stocks 98.5% | ||||||||||
Consumer Discretionary 8.7% | ||||||||||
a Altice NV, A | Netherlands | 257,870 | $ | 6,405,874 | ||||||
Twenty-First Century Fox Inc., B | United States | 168,110 | 5,019,765 | |||||||
|
| |||||||||
| 11,425,639 | ||||||||||
|
| |||||||||
Consumer Staples 2.4% | ||||||||||
CVS Health Corp. | United States | 38,930 | 3,209,389 | |||||||
|
| |||||||||
Energy 9.6% | ||||||||||
Anadarko Petroleum Corp. | United States | 97,250 | 5,545,196 | |||||||
Pioneer Natural Resources Co. | United States | 16,020 | 2,771,300 | |||||||
Schlumberger Ltd. | United States | 60,190 | 4,369,192 | |||||||
|
| |||||||||
| 12,685,688 | ||||||||||
|
| |||||||||
Financials 23.4% | ||||||||||
a Athene Holding Ltd., A | United States | 59,850 | 3,190,604 | |||||||
Bank of America Corp. | United States | 137,630 | 3,212,284 | |||||||
BlackRock Inc. | United States | 3,067 | 1,179,476 | |||||||
The Charles Schwab Corp. | United States | 155,360 | 6,035,736 | |||||||
The Hartford Financial Services Group Inc. | United States | 13,760 | 665,434 | |||||||
JPMorgan Chase & Co. | United States | 53,053 | 4,615,611 | |||||||
Moody’s Corp. | United States | 23,910 | 2,829,031 | |||||||
SunTrust Banks Inc. | United States | 26,140 | 1,485,013 | |||||||
Synchrony Financial | United States | 112,235 | 3,120,133 | |||||||
Willis Towers Watson PLC | United States | 34,000 | 4,509,080 | |||||||
| �� |
|
| ||||||||
| 30,842,402 | ||||||||||
|
| |||||||||
Health Care 12.8% | ||||||||||
Aetna Inc. | United States | 32,890 | 4,442,452 | |||||||
Allergan PLC | United States | 27,224 | 6,638,845 | |||||||
a Horizon Pharma PLC | United States | 142,260 | 2,187,959 | |||||||
Medtronic PLC | United States | 42,510 | 3,532,156 | |||||||
|
| |||||||||
| 16,801,412 | ||||||||||
|
| |||||||||
Industrials 9.1% | ||||||||||
General Dynamics Corp. | United States | 11,620 | 2,251,840 | |||||||
a Genesee & Wyoming Inc. | United States | 85,640 | 5,802,966 | |||||||
a IHS Markit Ltd. | United States | 90,393 | 3,923,056 | |||||||
|
| |||||||||
| 11,977,862 | ||||||||||
|
| |||||||||
Information Technology 25.0% | ||||||||||
a Adobe Systems Inc. | United States | 14,830 | 1,983,364 | |||||||
a Alphabet Inc., A | United States | 4,340 | 4,012,417 | |||||||
a Alphabet Inc., C | United States | 4,550 | 4,122,118 | |||||||
a Blackhawk Network Holdings Inc. | United States | 58,630 | 2,371,583 | |||||||
Mastercard Inc., A | United States | 41,540 | 4,831,933 | |||||||
Microsoft Corp. | United States | 105,030 | 7,190,354 | |||||||
Motorola Solutions Inc. | United States | 20,220 | 1,738,313 | |||||||
QUALCOMM Inc. | United States | 65,720 | 3,531,793 | |||||||
Sabre Corp. | United States | 133,270 | 3,119,851 | |||||||
|
| |||||||||
| 32,901,726 | ||||||||||
|
| |||||||||
38 | Annual Report | franklintempleton.com | ||
FRANKLIN STRATEGIC SERIES
STATEMENT OF INVESTMENTS
Franklin Focused Core Equity Fund (continued)
Country
| Shares
| Value
| ||||||||
| Common Stocks (continued) | ||||||||||
Real Estate 7.5% | ||||||||||
a CBRE Group Inc. | United States | 140,910 | $ | 5,045,987 | ||||||
Equinix Inc. | United States | 11,651 | 4,866,623 | |||||||
|
| |||||||||
| 9,912,610 | ||||||||||
|
| |||||||||
Total Common Stocks (Cost $106,634,602) | 129,756,728 | |||||||||
|
| |||||||||
Short Term Investments (Cost $2,075,737) 1.6% | ||||||||||
Money Market Funds 1.6% | ||||||||||
b,c Institutional Fiduciary Trust Money Market Portfolio, 0.37% | United States | 2,075,737 | 2,075,737 | |||||||
|
| |||||||||
Total Investments (Cost $108,710,339) 100.1% | 131,832,465 | |||||||||
Other Assets, less Liabilities (0.1)% | (113,032 | ) | ||||||||
|
| |||||||||
Net Assets 100.0% | $ | 131,719,433 | ||||||||
|
| |||||||||
aNon-income producing.
bSee Note 3(f) regarding investments in affiliated management investment companies.
cThe rate shown is the annualized seven-day yield at period end.
franklintempleton.com | The accompanying notes are an integral part of these financial statements. | | Annual Report | 39 | |||
FRANKLIN STRATEGIC SERIES
Financial Highlights
Franklin Growth Opportunities Fund
| Year Ended April 30, | ||||||||||||||||||||
| 2017 | 2016 | 2015 | 2014 | 2013 | ||||||||||||||||
Class A | ||||||||||||||||||||
Per share operating performance | ||||||||||||||||||||
(for a share outstanding throughout the year) | ||||||||||||||||||||
Net asset value, beginning of year | $30.40 | $33.13 | $28.48 | $24.29 | $23.02 | |||||||||||||||
Income from investment operationsa: | ||||||||||||||||||||
Net investment income (loss)b | (0.09 | ) | (0.19 | ) | (0.19 | ) | (0.19 | ) | (0.12 | ) | ||||||||||
Net realized and unrealized gains (losses) | 5.14 | (1.88 | ) | 5.50 | 5.11 | 1.95 | ||||||||||||||
Total from investment operations | 5.05 | (2.07 | ) | 5.31 | 4.92 | 1.83 | ||||||||||||||
Less distributions from net realized gains | (0.64 | ) | (0.66 | ) | (0.66 | ) | (0.73 | ) | (0.56 | ) | ||||||||||
Net asset value, end of year | $34.81 | $30.40 | $33.13 | $28.48 | $24.29 | |||||||||||||||
Total returnc | 16.88% | (6.36)% | 18.87% | 20.26% | 8.29% | |||||||||||||||
Ratios to average net assets | ||||||||||||||||||||
Expenses before waiver and payments by affiliates | 1.05% | 1.11% | 1.18% | 1.17% | 1.25% | |||||||||||||||
Expenses net of waiver and payments by affiliates | 0.97% | d | 1.10% | 1.18% | e | 1.17% | d,e | 1.25% | ||||||||||||
Net investment income (loss) | (0.30)% | (0.58)% | (0.59)% | (0.70)% | (0.56)% | |||||||||||||||
Supplemental data | ||||||||||||||||||||
Net assets, end of year (000’s) | $2,272,831 | $548,871 | $457,619 | $349,343 | $213,639 | |||||||||||||||
Portfolio turnover rate | 47.75% | 25.56% | 40.64% | 36.64% | 58.76% | |||||||||||||||
aThe amount shown for a share outstanding throughout the period may not correlate with the Statement of Operations for the period due to the timing of sales and repurchases of the Fund’s shares in relation to income earned and/or fluctuating fair value of the investments of the Fund.
bBased on average daily shares outstanding.
cTotal return does not reflect sales commissions or contingent deferred sales charges, if applicable.
dBenefit of expense reduction rounds to less than 0.01%.
eBenefit of waiver and payments by affiliates rounds to less than 0.01%.
40 | Annual Report | The accompanying notes are an integral part of these financial statements. | franklintempleton.com | ||
FRANKLIN STRATEGIC SERIES
FINANCIAL HIGHLIGHTS
Franklin Growth Opportunities Fund (continued)
| Year Ended April 30, | ||||||||||||||||||||
| 2017 | 2016 | 2015 | 2014 | 2013 | ||||||||||||||||
Class C | ||||||||||||||||||||
Per share operating performance | ||||||||||||||||||||
(for a share outstanding throughout the year) | ||||||||||||||||||||
Net asset value, beginning of year | $26.59 | $29.27 | $25.41 | $21.89 | $20.95 | |||||||||||||||
Income from investment operationsa: | ||||||||||||||||||||
Net investment income (loss)b | (0.29 | ) | (0.37 | ) | (0.36 | ) | (0.35 | ) | (0.26 | ) | ||||||||||
Net realized and unrealized gains (losses) | 4.46 | (1.65 | ) | 4.88 | 4.60 | 1.76 | ||||||||||||||
Total from investment operations | 4.17 | (2.02 | ) | 4.52 | 4.25 | 1.50 | ||||||||||||||
Less distributions from net realized gains | (0.64 | ) | (0.66 | ) | (0.66 | ) | (0.73 | ) | (0.56 | ) | ||||||||||
Net asset value, end of year | $30.12 | $26.59 | $29.27 | $25.41 | $21.89 | |||||||||||||||
Total returnc | 15.98% | (7.03)% | 18.04% | 19.42% | 7.47% | |||||||||||||||
Ratios to average net assets | ||||||||||||||||||||
Expenses before waiver and payments by affiliates | 1.80% | 1.85% | 1.88% | 1.87% | 1.97% | |||||||||||||||
Expenses net of waiver and payments by affiliates | 1.72% | d | 1.84% | 1.88% | e | 1.87% | d,e | 1.97% | ||||||||||||
Net investment income (loss) | (1.05)% | (1.32)% | (1.29)% | (1.40)% | (1.28)% | |||||||||||||||
Supplemental data | ||||||||||||||||||||
Net assets, end of year (000’s) | $390,123 | $137,882 | $110,513 | $85,883 | $51,719 | |||||||||||||||
Portfolio turnover rate | 47.75% | 25.56% | 40.64% | 36.64% | 58.76% | |||||||||||||||
aThe amount shown for a share outstanding throughout the period may not correlate with the Statement of Operations for the period due to the timing of sales and repurchases of the Fund’s shares in relation to income earned and/or fluctuating fair value of the investments of the Fund.
bBased on average daily shares outstanding.
cTotal return does not reflect sales commissions or contingent deferred sales charges, if applicable.
dBenefit of expense reduction rounds to less than 0.01%.
eBenefit of waiver and payments by affiliates rounds to less than 0.01%.
franklintempleton.com | The accompanying notes are an integral part of these financial statements. | Annual Report | 41 | ||
FRANKLIN STRATEGIC SERIES
FINANCIAL HIGHLIGHTS
Franklin Growth Opportunities Fund (continued)
| Year Ended April 30, | ||||||||||||||||||||
| 2017 | 2016 | 2015 | 2014 | 2013 | ||||||||||||||||
Class R | ||||||||||||||||||||
Per share operating performance | ||||||||||||||||||||
(for a share outstanding throughout the year) | ||||||||||||||||||||
Net asset value, beginning of year | $29.37 | $32.10 | $27.67 | $23.67 | $22.49 | |||||||||||||||
Income from investment operationsa: | ||||||||||||||||||||
Net investment income (loss)b | (0.17) | (0.26 | ) | (0.24) | (0.24) | (0.17) | ||||||||||||||
Net realized and unrealized gains (losses) | 4.96 | (1.81 | ) | 5.33 | 4.97 | 1.91 | ||||||||||||||
Total from investment operations | 4.79 | (2.07 | ) | 5.09 | 4.73 | 1.74 | ||||||||||||||
Less distributions from net realized gains | (0.64) | (0.66 | ) | (0.66) | (0.73) | (0.56) | ||||||||||||||
Net asset value, end of year | $33.52 | $29.37 | $32.10 | $27.67 | $23.67 | |||||||||||||||
Total return | 16.62% | (6.60)% | 18.63% | 19.99% | 8.03% | |||||||||||||||
Ratios to average net assets | ||||||||||||||||||||
Expenses before waiver and payments by affiliates | 1.30% | 1.35% | 1.38% | 1.37% | 1.47% | |||||||||||||||
Expenses net of waiver and payments by affiliates | 1.22%c | 1.34% | 1.38%d | 1.37% | c,d | 1.47% | ||||||||||||||
Net investment income (loss) | (0.55)% | (0.82)% | (0.79)% | (0.90)% | (0.78)% | |||||||||||||||
Supplemental data | ||||||||||||||||||||
Net assets, end of year (000’s) | $50,429 | $39,786 | $48,266 | $42,953 | $34,399 | |||||||||||||||
Portfolio turnover rate | 47.75% | 25.56% | 40.64% | 36.64% | 58.76% | |||||||||||||||
aThe amount shown for a share outstanding throughout the period may not correlate with the Statement of Operations for the period due to the timing of sales and repurchases of the Fund’s shares in relation to income earned and/or fluctuating fair value of the investments of the Fund.
bBased on average daily shares outstanding.
cBenefit of expense reduction rounds to less than 0.01%.
dBenefit of waiver and payments by affiliates rounds to less than 0.01%.
42 | Annual Report | The accompanying notes are an integral part of these financial statements. | franklintempleton.com | ||
FRANKLIN STRATEGIC SERIES
FINANCIAL HIGHLIGHTS
Franklin Growth Opportunities Fund (continued)
| Year Ended April 30, | ||||||||||||||||
| 2017 | 2016 | 2015 | 2014a | |||||||||||||
Class R6 | ||||||||||||||||
Per share operating performance | ||||||||||||||||
(for a share outstanding throughout the year) | ||||||||||||||||
Net asset value, beginning of year | $32.39 | $35.09 | $29.98 | $24.99 | ||||||||||||
Income from investment operationsb: | ||||||||||||||||
Net investment income (loss)c | 0.05 | (0.05) | (0.03) | (0.07) | ||||||||||||
Net realized and unrealized gains (losses) | 5.50 | (1.99) | 5.80 | 5.79 | ||||||||||||
Total from investment operations | 5.55 | (2.04) | 5.77 | 5.72 | ||||||||||||
Less distributions from net realized gains | (0.64) | (0.66) | (0.66) | (0.73) | ||||||||||||
Net asset value, end of year | $37.30 | $32.39 | $35.09 | $29.98 | ||||||||||||
Total return | 17.42% | (5.94)% | 19.47% | 22.90% | ||||||||||||
Ratios to average net assets | ||||||||||||||||
Expenses before waiver and payments by affiliates | 0.59% | 0.67% | 0.68% | 0.71% | ||||||||||||
Expenses net of waiver and payments by affiliates | 0.51%d | 0.66% | 0.68%e | 0.71% | d,e | |||||||||||
Net investment income (loss) | 0.16% | (0.14)% | (0.09)% | (0.24)% | ||||||||||||
Supplemental data | ||||||||||||||||
Net assets, end of year (000’s) | $291,825 | $235,620 | $246,911 | $180,843 | ||||||||||||
Portfolio turnover rate | 47.75% | 25.56% | 40.64% | 36.64% | ||||||||||||
aFor the year May 1, 2013 (effective date) to April 30, 2014.
bThe amount shown for a share outstanding throughout the period may not correlate with the Statement of Operations for the period due to the timing of sales and repurchases of the Fund’s shares in relation to income earned and/or fluctuating fair value of the investments of the Fund.
cBased on average daily shares outstanding.
dBenefit of expense reduction rounds to less than 0.01%.
eBenefit of waiver and payments by affiliates rounds to less than 0.01%.
franklintempleton.com | The accompanying notes are an integral part of these financial statements. | | Annual Report | 43 | |||
FRANKLIN STRATEGIC SERIES
FINANCIAL HIGHLIGHTS
Franklin Growth Opportunities Fund (continued)
| Year Ended April 30, | ||||||||||||||||||||
| 2017 | 2016 | 2015 | 2014 | 2013 | ||||||||||||||||
Advisor Class | ||||||||||||||||||||
Per share operating performance | ||||||||||||||||||||
(for a share outstanding throughout the year) | ||||||||||||||||||||
Net asset value, beginning of year | $32.20 | $34.96 | $29.93 | $25.43 | $23.99 | |||||||||||||||
Income from investment operationsa: | ||||||||||||||||||||
Net investment income (loss)b | (0.02) | (0.11) | (0.10) | (0.13) | (0.06) | |||||||||||||||
Net realized and unrealized gains (losses) | 5.48 | (1.99) | 5.79 | 5.36 | 2.06 | |||||||||||||||
Total from investment operations | 5.46 | (2.10) | 5.69 | 5.23 | 2.00 | |||||||||||||||
Less distributions from net realized gains | (0.64) | (0.66) | (0.66) | (0.73) | (0.56) | |||||||||||||||
Net asset value, end of year | $37.02 | $32.20 | $34.96 | $29.93 | $25.43 | |||||||||||||||
Total return | 17.21% | (6.11)% | 19.23% | 20.58% | 8.62% | |||||||||||||||
Ratios to average net assets | ||||||||||||||||||||
Expenses before waiver and payments by affiliates | 0.80% | 0.85% | 0.88% | 0.87% | 0.97% | |||||||||||||||
Expenses net of waiver and payments by affiliates | 0.72%c | 0.84% | 0.88%d | 0.87% | c,d | 0.97% | ||||||||||||||
Net investment income (loss) | (0.05)% | (0.32)% | (0.29)% | (0.40)% | (0.28)% | |||||||||||||||
Supplemental data | ||||||||||||||||||||
Net assets, end of year (000’s) | $537,193 | $256,377 | $269,887 | $224,469 | $182,954 | |||||||||||||||
Portfolio turnover rate | 47.75% | 25.56% | 40.64% | 36.64% | 58.76% | |||||||||||||||
aThe amount shown for a share outstanding throughout the period may not correlate with the Statement of Operations for the period due to the timing of sales and repurchases of the Fund’s shares in relation to income earned and/or fluctuating fair value of the investments of the Fund.
bBased on average daily shares outstanding.
cBenefit of expense reduction rounds to less than 0.01%.
dBenefit of waiver and payments by affiliates rounds to less than 0.01%.
44 | Annual Report | | The accompanying notes are an integral part of these financial statements. | franklintempleton.com | |||
FRANKLIN STRATEGIC SERIES
Statement of Investments, April 30, 2017
Franklin Growth Opportunities Fund
Country
| Shares
| Value
| ||||||||||
Common Stocks 98.5% | ||||||||||||
Consumer Discretionary 14.8% | ||||||||||||
a Amazon.com Inc. | United States | 204,170 | $ | 188,855,208 | ||||||||
a Charter Communications Inc., A | United States | 172,592 | 59,571,855 | |||||||||
Comcast Corp., A | United States | 958,038 | 37,545,509 | |||||||||
Delphi Automotive PLC | United Kingdom | 80,705 | 6,488,682 | |||||||||
a,b Global Eagle Entertainment Inc. | United States | 395,223 | 1,225,191 | |||||||||
Las Vegas Sands Corp. | United States | 422,523 | 24,924,632 | |||||||||
Newell Brands Inc. | United States | 370,348 | 17,680,414 | |||||||||
NIKE Inc., B | United States | 492,096 | 27,267,039 | |||||||||
a The Priceline Group Inc. | United States | 29,009 | 53,574,401 | |||||||||
Starbucks Corp. | United States | 606,695 | 36,438,102 | |||||||||
The Walt Disney Co. | United States | 595,858 | 68,881,185 | |||||||||
|
| |||||||||||
| 522,452,218 | ||||||||||||
|
| |||||||||||
Consumer Staples 3.1% | ||||||||||||
Constellation Brands Inc., A | United States | 167,668 | 28,929,437 | |||||||||
a,c Hostess Brands Inc., A | United States | 816,343 | 13,992,119 | |||||||||
a Monster Beverage Corp. | United States | 791,289 | 35,908,695 | |||||||||
Pinnacle Foods Inc. | United States | 529,363 | 30,782,458 | |||||||||
|
| |||||||||||
| 109,612,709 | ||||||||||||
|
| |||||||||||
Energy 3.0% | ||||||||||||
Anadarko Petroleum Corp. | United States | 697,871 | 39,792,604 | |||||||||
a Diamondback Energy Inc. | United States | 113,534 | 11,335,235 | |||||||||
Halliburton Co. | United States | 883,418 | 40,531,218 | |||||||||
a,b Resolute Energy Corp. | United States | 380,751 | 14,259,125 | |||||||||
|
| |||||||||||
| 105,918,182 | ||||||||||||
|
| |||||||||||
Financials 7.0% | ||||||||||||
a Athene Holding Ltd., A | United States | 738,554 | 39,372,314 | |||||||||
BlackRock Inc. | United States | 26,607 | 10,232,254 | |||||||||
The Charles Schwab Corp. | United States | 1,233,025 | 47,903,021 | |||||||||
Intercontinental Exchange Inc. | United States | 437,687 | 26,348,757 | |||||||||
MarketAxess Holdings Inc. | United States | 225,350 | 43,384,382 | |||||||||
S&P Global Inc. | United States | 135,492 | 18,181,672 | |||||||||
a Signature Bank | United States | 248,126 | 34,353,045 | |||||||||
a SVB Financial Group | United States | 161,783 | 28,464,101 | |||||||||
|
| |||||||||||
| 248,239,546 | ||||||||||||
|
| |||||||||||
Health Care 14.4% | ||||||||||||
a,d Acerta Pharma BV | Netherlands | 35,601,435 | 1,377,989 | |||||||||
Allergan PLC | United States | 296,770 | 72,370,332 | |||||||||
a Biogen Inc. | United States | 112,287 | 30,453,357 | |||||||||
Bristol-Myers Squibb Co. | United States | 761,821 | 42,700,067 | |||||||||
a Celgene Corp. | United States | 995,846 | 123,534,696 | |||||||||
a Edwards Lifesciences Corp. | United States | 380,596 | 41,739,964 | |||||||||
Eli Lilly & Co. | United States | 444,918 | 36,509,971 | |||||||||
a,b Heron Therapeutics Inc. | United States | 872,964 | 13,399,998 | |||||||||
a Incyte Corp. | United States | 322,377 | 40,065,014 | |||||||||
Medtronic PLC | United States | 220,100 | 18,288,109 | |||||||||
a Nevro Corp. | United States | 222,045 | 20,921,080 | |||||||||
a Revance Therapeutics Inc. | United States | 242,812 | 5,281,161 | |||||||||
a Tesaro Inc. | United States | 243,490 | 35,936,689 | |||||||||
UnitedHealth Group Inc. | United States | 155,539 | 27,200,660 | |||||||||
|
| |||||||||||
| 509,779,087 | ||||||||||||
|
| |||||||||||
franklintempleton.com | Annual Report | 45 | ||||
FRANKLIN STRATEGIC SERIES
STATEMENT OF INVESTMENTS
Franklin Growth Opportunities Fund (continued)
Country
| Shares
| Value
| ||||||||||
| ||||||||||||
| Common Stocks (continued) | ||||||||||||
Industrials 6.1% | ||||||||||||
Allegiant Travel Co. | United States | 45,773 | $ | 6,655,394 | ||||||||
a Azul SA, ADR | Brazil | 400,900 | 9,104,439 | |||||||||
Honeywell International Inc. | United States | 282,542 | 37,052,558 | |||||||||
a IHS Markit Ltd. | United States | 1,082,351 | 46,974,033 | |||||||||
Raytheon Co. | United States | 337,915 | 52,447,787 | |||||||||
Rockwell Automation Inc. | United States | 113,124 | 17,800,061 | |||||||||
Roper Technologies Inc. | United States | 99,758 | 21,817,075 | |||||||||
a Univar Inc. | United States | 812,994 | 24,267,871 | |||||||||
|
| |||||||||||
| 216,119,218 | ||||||||||||
|
| |||||||||||
Information Technology 41.3% | ||||||||||||
a Adobe Systems Inc. | United States | 576,686 | 77,125,986 | |||||||||
a Alphabet Inc., C | United States | 145,139 | 131,490,128 | |||||||||
Analog Devices Inc. | United States | 310,630 | 23,670,006 | |||||||||
Apple Inc. | United States | 1,248,186 | 179,301,919 | |||||||||
a Autodesk Inc. | United States | 412,175 | 37,124,602 | |||||||||
Broadcom Ltd. | United States | 335,201 | 74,015,733 | |||||||||
a Cavium Inc. | United States | 242,812 | 16,717,606 | |||||||||
a CoStar Group Inc. | United States | 141,904 | 34,183,255 | |||||||||
a Electronic Arts Inc. | United States | 308,673 | 29,268,374 | |||||||||
a Facebook Inc., A | United States | 1,164,741 | 175,002,335 | |||||||||
a Fiserv Inc. | United States | 247,117 | 29,441,519 | |||||||||
a MACOM Technology Solutions Holdings Inc. | United States | 183,465 | 8,967,769 | |||||||||
Mastercard Inc., A | United States | 1,174,305 | 136,595,158 | |||||||||
Microsoft Corp. | United States | 1,827,209 | 125,090,728 | |||||||||
a,b MuleSoft Inc. | United States | 74,700 | 1,721,088 | |||||||||
NVIDIA Corp. | United States | 319,803 | 33,355,453 | |||||||||
a Palo Alto Networks Inc. | United States | 171,387 | 18,580,065 | |||||||||
a Paylocity Holding Corp. | United States | 473,700 | 18,682,728 | |||||||||
a Salesforce.com Inc. | United States | 754,936 | 65,015,088 | |||||||||
a ServiceNow Inc. | United States | 606,347 | 57,287,665 | |||||||||
a Tyler Technologies Inc. | United States | 114,597 | 18,746,923 | |||||||||
Visa Inc., A | United States | 1,273,628 | 116,180,346 | |||||||||
Xilinx Inc. | United States | 441,225 | 27,845,710 | |||||||||
a Zendesk Inc. | United States | 927,203 | 26,657,086 | |||||||||
|
| |||||||||||
| 1,462,067,270 | ||||||||||||
|
| |||||||||||
Materials 2.5% | ||||||||||||
a Axalta Coating .Systems Ltd. | United States | 413,701 | 12,977,800 | |||||||||
Ecolab Inc. | United States | 209,400 | 27,031,446 | |||||||||
a Ingevity Corp. | United States | 220,504 | 13,942,468 | |||||||||
Martin Marietta Materials Inc. | United States | 161,958 | 35,661,532 | |||||||||
|
| |||||||||||
| 89,613,246 | ||||||||||||
|
| |||||||||||
Real Estate 5.0% | ||||||||||||
American Tower Corp. | United States | 412,587 | 51,961,207 | |||||||||
Equinix Inc. | United States | 133,081 | 55,587,934 | |||||||||
a SBA Communications Corp. | United States | 559,919 | 70,824,154 | |||||||||
|
| |||||||||||
| 178,373,295 | ||||||||||||
|
| |||||||||||
Telecommunication Services 1.3% | ||||||||||||
a T-Mobile U.S. Inc. | United States | 685,996 | 46,146,951 | |||||||||
|
| |||||||||||
Total Common Stocks (Cost $2,043,755,415) | 3,488,321,722 | |||||||||||
|
| |||||||||||
46 | Annual Report | franklintempleton.com | ||||
FRANKLIN STRATEGIC SERIES
STATEMENT OF INVESTMENTS
Franklin Growth Opportunities Fund (continued)
Country
| Shares
| Value
| ||||||||||
| ||||||||||||
Preferred Stocks 0.4% | ||||||||||||
Consumer Discretionary 0.3% | ||||||||||||
a,d Proterra Inc., pfd., 5, 144A | United States | 2,362,202 | $ | 11,896,616 | ||||||||
|
| |||||||||||
Information Technology 0.1% | ||||||||||||
a,d Tanium Inc., pfd., G | United States | 805,800 | 3,996,768 | |||||||||
|
| |||||||||||
Total Preferred Stocks (Cost $15,896,849) | 15,893,384 | |||||||||||
|
| |||||||||||
Total Investments before Short Term Investments |
| 3,504,215,106
|
| |||||||||
|
| |||||||||||
Short Term Investments 1.6% | ||||||||||||
Money Market Funds (Cost $45,233,287) 1.3% | ||||||||||||
e,f Institutional Fiduciary Trust Money Market Portfolio, 0.37% | United States | 45,233,287 | 45,233,287 | |||||||||
|
| |||||||||||
g Investments from Cash Collateral Received for Loaned Securities | ||||||||||||
Money Market Funds 0.3% | ||||||||||||
e,f Institutional Fiduciary Trust Money Market Portfolio, 0.37% | United States | 10,394,075 | 10,394,075 | |||||||||
|
| |||||||||||
Total Investments (Cost $2,115,279,626) 100.5% | 3,559,842,468 | |||||||||||
Other Assets, less Liabilities (0.5)% | (17,441,926 | ) | ||||||||||
|
| |||||||||||
Net Assets 100.0% | $ | 3,542,400,542 | ||||||||||
|
| |||||||||||
aNon-income producing.
bA portion or all of the security is on loan at April 30, 2017. See Note 1(d).
cA portion or all of the security purchased on a delayed delivery basis. See Note 1(c).
dSee Note 7 regarding restricted securities.
eSee Note 3(f) regarding investments in affiliated management investment companies.
fThe rate shown is the annualized seven-day yield at period end.
gSee Note 1(d) regarding securities on loan.
franklintempleton.com | The accompanying notes are an integral part of these financial statements. | | Annual Report | 47 | |||
FRANKLIN STRATEGIC SERIES
Financial Highlights
Franklin Small Cap Growth Fund
| Year Ended April 30, | ||||||||||||||||||||
| 2017 | 2016 | 2015 | 2014 | 2013 | ||||||||||||||||
Class A | ||||||||||||||||||||
Per share operating performance | ||||||||||||||||||||
(for a share outstanding throughout the year) | ||||||||||||||||||||
Net asset value, beginning of year | $16.37 | $18.83 | $18.20 | $14.26 | $12.84 | |||||||||||||||
Income from investment operationsa: | ||||||||||||||||||||
Net investment income (loss)b | (0.11 | ) | (0.08 | ) | (0.12 | ) | (0.15 | ) | (0.09 | ) | ||||||||||
Net realized and unrealized gains (losses) | 3.34 | (2.03 | ) | 1.57 | 4.75 | 1.87 | ||||||||||||||
Total from investment operations | 3.23 | (2.11 | ) | 1.45 | 4.60 | 1.78 | ||||||||||||||
Less distributions from net realized gains | — | (0.35 | ) | (0.82 | ) | (0.66 | ) | (0.36 | ) | |||||||||||
Net asset value, end of year | $19.60 | $16.37 | $18.83 | $18.20 | $14.26 | |||||||||||||||
Total returnc | 19.73% | (11.28)% | 8.34% | 32.40% | 14.35% | |||||||||||||||
Ratios to average net assets | ||||||||||||||||||||
Expenses before waiver and payments by affiliates | 1.10% | 1.13% | 1.16% | 1.20% | 1.33% | |||||||||||||||
Expenses net of waiver and payments by affiliates | 1.08% | d | 1.11% | d | 1.16% | e | 1.20% | e | 1.33% | |||||||||||
Net investment income (loss) | (0.61)% | (0.44)% | (0.66)% | (0.85)% | (0.68)% | |||||||||||||||
Supplemental data | ||||||||||||||||||||
Net assets, end of year (000’s) | $719,752 | $792,072 | $1,164,218 | $851,317 | $327,882 | |||||||||||||||
Portfolio turnover rate | 29.93% | 43.99% | 30.15% | 40.35% | 41.02% | |||||||||||||||
aThe amount shown for a share outstanding throughout the period may not correlate with the Statement of Operations for the period due to the timing of sales and repurchases of the Fund’s shares in relation to income earned and/or fluctuating fair value of the investments of the Fund.
bBased on average daily shares outstanding.
cTotal return does not reflect sales commissions or contingent deferred sales charges, if applicable.
dBenefit of expense reduction rounds to less than 0.01%.
eBenefit of waiver and payments by affiliates and expense reduction rounds to less than 0.01%.
48 | Annual Report | The accompanying notes are an integral part of these financial statements. | franklintempleton.com | ||
FRANKLIN STRATEGIC SERIES
FINANCIAL HIGHLIGHTS
Franklin Small Cap Growth Fund (continued)
| Year Ended April 30, | ||||||||||||||||||||
| 2017 | 2016 | 2015 | 2014 | 2013 | ||||||||||||||||
Class C | ||||||||||||||||||||
Per share operating performance | ||||||||||||||||||||
(for a share outstanding throughout the year) | ||||||||||||||||||||
Net asset value, beginning of year | $14.07 | $16.36 | $16.03 | $12.70 | $11.57 | |||||||||||||||
Income from investment operationsa: | ||||||||||||||||||||
Net investment income (loss)b | (0.21 | ) | (0.18 | ) | (0.22 | ) | (0.24 | ) | (0.16 | ) | ||||||||||
Net realized and unrealized gains (losses) | 2.85 | (1.76 | ) | 1.37 | 4.23 | 1.65 | ||||||||||||||
Total from investment operations | 2.64 | (1.94 | ) | 1.15 | 3.99 | 1.49 | ||||||||||||||
Less distributions from net realized gains | — | (0.35 | ) | (0.82 | ) | (0.66 | ) | (0.36 | ) | |||||||||||
Net asset value, end of year | $16.71 | $14.07 | $16.36 | $16.03 | $12.70 | |||||||||||||||
Total returnc | 18.76% | (11.95)% | 7.58% | 31.57% | 13.41% | |||||||||||||||
Ratios to average net assets | ||||||||||||||||||||
Expenses before waiver and payments by affiliates | 1.85% | 1.88% | 1.87% | 1.90% | 2.03% | |||||||||||||||
Expenses net of waiver and payments by affiliates | 1.83% | d | 1.86% | d | 1.87% | e | 1.90% | e | 2.03% | |||||||||||
Net investment income (loss) | (1.36)% | (1.19)% | (1.37)% | (1.55)% | (1.38)% | |||||||||||||||
Supplemental data | ||||||||||||||||||||
Net assets, end of year (000’s) | $142,539 | $157,175 | $225,105 | $187,271 | $77,644 | |||||||||||||||
Portfolio turnover rate | 29.93% | 43.99% | 30.15% | 40.35% | 41.02% | |||||||||||||||
aThe amount shown for a share outstanding throughout the period may not correlate with the Statement of Operations for the period due to the timing of sales and repurchases of the Fund’s shares in relation to income earned and/or fluctuating fair value of the investments of the Fund.
bBased on average daily shares outstanding.
cTotal return does not reflect sales commissions or contingent deferred sales charges, if applicable.
dBenefit of expense reduction rounds to less than 0.01%.
eBenefit of waiver and payments by affiliates and expense reduction rounds to less than 0.01%.
franklintempleton.com | The accompanying notes are an integral part of these financial statements. | | Annual Report | 49 | |||
FRANKLIN STRATEGIC SERIES
FINANCIAL HIGHLIGHTS
Franklin Small Cap Growth Fund (continued)
| Year Ended April 30, | ||||||||||||||||||||
| 2017 | 2016 | 2015 | 2014 | 2013 | ||||||||||||||||
Class R | ||||||||||||||||||||
Per share operating performance | ||||||||||||||||||||
(for a share outstanding throughout the year) | ||||||||||||||||||||
Net asset value, beginning of year | $15.70 | $18.11 | $17.57 | $13.81 | $12.48 | |||||||||||||||
Income from investment operationsa: | ||||||||||||||||||||
Net investment income (loss)b | (0.15 | ) | (0.12 | ) | (0.16 | ) | (0.18 | ) | (0.11 | ) | ||||||||||
Net realized and unrealized gains (losses) | 3.19 | (1.94 | ) | 1.52 | 4.60 | 1.80 | ||||||||||||||
Total from investment operations | 3.04 | (2.06 | ) | 1.36 | 4.42 | 1.69 | ||||||||||||||
Less distributions from net realized gains | — | (0.35 | ) | (0.82 | ) | (0.66 | ) | (0.36 | ) | |||||||||||
Net asset value, end of year | $18.74 | $15.70 | $18.11 | $17.57 | $13.81 | |||||||||||||||
Total return | 19.36% | (11.46)% | 8.12% | 32.15% | 14.04% | |||||||||||||||
Ratios to average net assets | ||||||||||||||||||||
Expenses before waiver and payments by affiliates | 1.35% | 1.38% | 1.37% | 1.40% | 1.53% | |||||||||||||||
Expenses net of waiver and payments by affiliates | 1.33% | c | 1.36% | c | 1.37% | d | 1.40% | d | 1.53% | |||||||||||
Net investment income (loss) | (0.86)% | (0.69)% | (0.87)% | (1.05)% | (0.88)% | |||||||||||||||
Supplemental data | ||||||||||||||||||||
Net assets, end of year (000’s) | $79,995 | $79,929 | $92,455 | $51,190 | $15,783 | |||||||||||||||
Portfolio turnover rate | 29.93% | 43.99% | 30.15% | 40.35% | 41.02% | |||||||||||||||
aThe amount shown for a share outstanding throughout the period may not correlate with the Statement of Operations for the period due to the timing of sales and repurchases of the Fund’s shares in relation to income earned and/or fluctuating fair value of the investments of the Fund.
bBased on average daily shares outstanding.
cBenefit of expense reduction rounds to less than 0.01%.
dBenefit of waiver and payments by affiliates and expense reduction rounds to less than 0.01%.
50 | Annual Report | The accompanying notes are an integral part of these financial statements. | franklintempleton.com | ||
FRANKLIN STRATEGIC SERIES
FINANCIAL HIGHLIGHTS
Franklin Small Cap Growth Fund (continued)
| Year Ended April 30, | ||||||||||||||||
| 2017 | 2016 | 2015 | 2014a | |||||||||||||
Class R6 | ||||||||||||||||
Per share operating performance | ||||||||||||||||
(for a share outstanding throughout the year) | ||||||||||||||||
Net asset value, beginning of year | $17.52 | $20.02 | $19.21 | $14.64 | ||||||||||||
Income from investment operationsb: | ||||||||||||||||
Net investment income (loss)c | (0.03 | ) | 0.01 | (0.03 | ) | (0.06 | ) | |||||||||
Net realized and unrealized gains (losses) | 3.57 | (2.16 | ) | 1.66 | 5.29 | |||||||||||
Total from investment operations | 3.54 | (2.15 | ) | 1.63 | 5.23 | |||||||||||
Less distributions from net realized gains | — | (0.35 | ) | (0.82 | ) | (0.66 | ) | |||||||||
Net asset value, end of year | $21.06 | $17.52 | $20.02 | $19.21 | ||||||||||||
Total return | 20.21% | (10.81)% | 8.91% | 35.80% | ||||||||||||
Ratios to average net assets | ||||||||||||||||
Expenses before waiver and payments by affiliates | 0.63% | 0.63% | 0.66% | 0.72% | ||||||||||||
Expenses net of waiver and payments by affiliates | 0.61% | d | 0.61% | d | 0.66% | e | 0.72% | e | ||||||||
Net investment income (loss) | (0.14)% | 0.06% | (0.16)% | (0.37)% | ||||||||||||
Supplemental data | ||||||||||||||||
Net assets, end of year (000’s) | $858,972 | $846,724 | $844,293 | $87,777 | ||||||||||||
Portfolio turnover rate | 29.93% | 43.99% | 30.15% | 40.35% | ||||||||||||
aFor the year May 1, 2013 (effective date) to April 30, 2014.
bThe amount shown for a share outstanding throughout the period may not correlate with the Statement of Operations for the period due to the timing of sales and repurchases of the Fund’s shares in relation to income earned and/or fluctuating fair value of the investments of the Fund.
cBased on average daily shares outstanding.
dBenefit of expense reduction rounds to less than 0.01%.
eBenefit of waiver and payments by affiliates and expense reduction rounds to less than 0.01%.
franklintempleton.com | The accompanying notes are an integral part of these financial statements. | | Annual Report | 51 | |||
FRANKLIN STRATEGIC SERIES
FINANCIAL HIGHLIGHTS
Franklin Small Cap Growth Fund (continued)
| Year Ended April 30, | ||||||||||||||||||||
| 2017 | 2016 | 2015 | 2014 | 2013 | ||||||||||||||||
Advisor Class | ||||||||||||||||||||
Per share operating performance | ||||||||||||||||||||
(for a share outstanding throughout the year) | ||||||||||||||||||||
Net asset value, beginning of year | $17.41 | $19.94 | $19.17 | $14.94 | $13.41 | |||||||||||||||
Income from investment operationsa: | ||||||||||||||||||||
Net investment income (loss)b | (0.07 | ) | (0.04 | ) | (0.07 | ) | (0.11 | ) | (0.05 | ) | ||||||||||
Net realized and unrealized gains (losses) | 3.54 | (2.14 | ) | 1.66 | 5.00 | 1.94 | ||||||||||||||
Total from investment operations | 3.47 | (2.18 | ) | 1.59 | 4.89 | 1.89 | ||||||||||||||
Less distributions from net realized gains | — | (0.35 | ) | (0.82 | ) | (0.66 | ) | (0.36 | ) | |||||||||||
Net asset value, end of year | $20.88 | $17.41 | $19.94 | $19.17 | $14.94 | |||||||||||||||
Total return | 19.93% | (11.06)% | 8.65% | 32.87% | 14.56% | |||||||||||||||
Ratios to average net assets | ||||||||||||||||||||
Expenses before waiver and payments by affiliates | 0.85% | 0.88% | 0.87% | 0.90% | 1.03% | |||||||||||||||
Expenses net of waiver and payments by affiliates | 0.83% | c | 0.86% | c | 0.87% | d | 0.90% | d | 1.03% | |||||||||||
Net investment income (loss) | (0.36)% | (0.19)% | (0.37)% | (0.55)% | (0.38)% | |||||||||||||||
Supplemental data | ||||||||||||||||||||
Net assets, end of year (000’s) | $805,661 | $850,975 | $1,077,822 | $427,406 | $91,687 | |||||||||||||||
Portfolio turnover rate | 29.93% | 43.99% | 30.15% | 40.35% | 41.02% | |||||||||||||||
aThe amount shown for a share outstanding throughout the period may not correlate with the Statement of Operations for the period due to the timing of sales and repurchases of the Fund’s shares in relation to income earned and/or fluctuating fair value of the investments of the Fund.
bBased on average daily shares outstanding.
cBenefit of expense reduction rounds to less than 0.01%.
dBenefit of waiver and payments by affiliates and expense reduction rounds to less than 0.01%.
52 | Annual Report | | The accompanying notes are an integral part of these financial statements. | franklintempleton.com | |||
FRANKLIN STRATEGIC SERIES
Statement of Investments, April 30, 2017
Franklin Small Cap Growth Fund
Shares
| Value
| |||||||
Common Stocks 96.9% | ||||||||
Consumer Discretionary 15.2% | ||||||||
a At Home Group Inc. | 1,326,200 | $ | 23,221,762 | |||||
a Boot Barn Holdings Inc. | 1,288,939 | 13,675,643 | ||||||
a Buffalo Wild Wings Inc. | 144,200 | 22,718,710 | ||||||
a,b Duluth Holdings Inc. | 564,842 | 12,511,250 | ||||||
a Five Below Inc. | 496,700 | 24,397,904 | ||||||
a Floor & Decor Holdings Inc. | 44,900 | 1,454,760 | ||||||
a Global Eagle Entertainment Inc. | 2,049,456 | 6,353,314 | ||||||
a Grand Canyon Education Inc. | 528,700 | 39,737,092 | ||||||
a The Habit Restaurants Inc., A | 858,700 | 16,229,430 | ||||||
a IMAX Corp. | 947,600 | 28,901,800 | ||||||
KB Home | 989,400 | 20,381,640 | ||||||
a Laureate Education Inc., A | 700,051 | 9,667,704 | ||||||
Lithia Motors Inc. | 297,600 | 28,435,680 | ||||||
a M/I Homes Inc. | 1,014,976 | 27,566,748 | ||||||
a,b Nord Anglia Education Inc. (Hong Kong) | 491,836 | 15,837,119 | ||||||
a Shutterfly Inc. | 230,200 | 11,947,380 | ||||||
a,c Sportsman’s Warehouse Holdings Inc. | 3,944,700 | 16,133,823 | ||||||
Tenneco Inc. | 210,600 | 13,274,118 | ||||||
Tile Shop Holdings Inc. | 1,187,200 | 25,346,720 | ||||||
Wingstop Inc. | 982,529 | 28,915,829 | ||||||
a Zoe’s Kitchen Inc. | 512,100 | 9,243,405 | ||||||
|
| |||||||
| 395,951,831 | ||||||||
|
| |||||||
Consumer Staples 3.4% | ||||||||
a Hostess Brands Inc., A | 1,003,000 | 17,191,420 | ||||||
a Smart & Final Stores Inc. | 2,439,100 | 28,781,380 | ||||||
a TreeHouse Foods Inc. | 497,900 | 43,616,040 | ||||||
|
| |||||||
| 89,588,840 | ||||||||
|
| |||||||
Energy 3.3% a Matador Resources Co. | 1,236,839 | 26,814,669 | ||||||
a Resolute Energy Corp. | 612,000 | 22,919,400 | ||||||
a SRC Energy Inc. | 2,559,100 | 19,295,614 | ||||||
a Superior Energy Services Inc. | 1,452,700 | 17,548,616 | ||||||
|
| |||||||
| 86,578,299 | ||||||||
|
| |||||||
Financials 6.4% a Cadence BanCorp. | 273,900 | 6,157,272 | ||||||
Chemical Financial Corp. | 469,023 | 22,255,141 | ||||||
Evercore Partners Inc. | 265,200 | 19,558,500 | ||||||
Houlihan Lokey Inc. | 429,700 | 14,412,138 | ||||||
MB Financial Inc. | 478,700 | 20,349,537 | ||||||
Pinnacle Financial Partners Inc. | 499,804 | 31,987,456 | ||||||
a PRA Group Inc. | 641,200 | 20,646,640 | ||||||
a Western Alliance Bancorp | 648,700 | 31,072,730 | ||||||
|
| |||||||
| 166,439,414 | ||||||||
|
| |||||||
Health Care 17.2% a Aclaris Therapeutics Inc. | 412,716 | 11,601,447 | ||||||
a American Renal Associates Holdings Inc. | 472,500 | 8,131,725 | ||||||
a,c Aratana Therapeutics Inc. | 2,697,019 | 16,721,518 | ||||||
a Array BioPharma Inc. | 2,007,400 | 17,404,158 | ||||||
a AveXis Inc. | 234,293 | 18,860,586 | ||||||
a Celldex Therapeutics Inc. | 1,719,100 | 5,724,603 | ||||||
franklintempleton.com | Annual Report | 53 | ||
FRANKLIN STRATEGIC SERIES
STATEMENT OF INVESTMENTS
Franklin Small Cap Growth Fund (continued)
Shares
| Value
| |||||||
| Common Stocks (continued) | ||||||||
Health Care (continued) a,b Collegium Pharmaceutical Inc. | 899,800 | $ | 8,827,038 | |||||
a Corium International Inc. | 760,450 | 3,429,630 | ||||||
a DexCom Inc. | 317,100 | 24,721,116 | ||||||
a Edge Therapeutics Inc. | 636,900 | 6,611,022 | ||||||
a,b Foamix Pharmaceuticals Ltd. (Israel) | 457,580 | 1,926,412 | ||||||
a HealthEquity Inc. | 442,216 | 20,129,672 | ||||||
a Heron Therapeutics Inc. | 1,185,993 | 18,204,993 | ||||||
a Integer Holdings Corp. | 1,006,100 | 36,974,175 | ||||||
a iRhythm Technologies Inc. | 662,097 | 23,365,403 | ||||||
a Karyopharm Therapeutics Inc. | 1,277,686 | 13,057,951 | ||||||
a Lion Biotechnologies Inc. | 1,422,800 | 9,746,180 | ||||||
a Loxo Oncology Inc. | 154,958 | 7,137,365 | ||||||
a Neogen Corp. | 452,500 | 28,204,325 | ||||||
a,b Neos Therapeutics Inc. | 479,738 | 3,406,140 | ||||||
a Nevro Corp. | 493,200 | 46,469,304 | ||||||
a Penumbra Inc. | 138,300 | 11,817,735 | ||||||
a,c Pfenex Inc. | 1,175,631 | 5,654,785 | ||||||
a Revance Therapeutics Inc. | 1,085,600 | 23,611,800 | ||||||
a Sage Therapeutics Inc. | 212,800 | 15,108,800 | ||||||
a The Spectranetics Corp. | 1,407,200 | 40,245,920 | ||||||
a,b TG Therapeutics Inc. | 756,400 | 8,358,220 | ||||||
a,b TherapeuticsMD Inc. | 2,627,000 | 13,397,700 | ||||||
|
| |||||||
| 448,849,723 | ||||||||
|
| |||||||
Industrials 18.7% | ||||||||
Allegiant Travel Co. | 218,548 | 31,776,879 | ||||||
Altra Industrial Motion Corp. | 666,400 | 29,421,560 | ||||||
a Astronics Corp. | 1,054,299 | 34,275,261 | ||||||
a Beacon Roofing Supply Inc. | 674,100 | 33,415,137 | ||||||
Cubic Corp. | 547,400 | 28,410,060 | ||||||
a DigitalGlobe Inc. | 524,200 | 16,879,240 | ||||||
a Echo Global Logistics Inc. | 1,006,625 | 18,874,219 | ||||||
Granite Construction Inc. | 219,400 | 11,564,574 | ||||||
Interface Inc. | 324,200 | 6,451,580 | ||||||
Kennametal Inc. | 852,000 | 35,426,160 | ||||||
a,c The KeyW Holding Corp. | 3,006,882 | 28,535,310 | ||||||
a Mercury Systems Inc. | 1,029,893 | 38,497,400 | ||||||
Mobile Mini Inc. | 1,021,200 | 29,308,440 | ||||||
a Spirit Airlines Inc. | 702,300 | 40,220,721 | ||||||
Steelcase Inc., A | 1,141,223 | 19,457,852 | ||||||
a Univar Inc. | 1,317,832 | 39,337,285 | ||||||
US Ecology Inc. | 938,690 | 44,259,234 | ||||||
|
| |||||||
| 486,110,912 | ||||||||
|
| |||||||
Information Technology 29.3% a 2U Inc. | 1,510,852 | 68,592,681 | ||||||
a Alarm.com Holdings Inc. | 1,373,222 | 44,780,769 | ||||||
a Bazaarvoice Inc. | 3,288,150 | 15,454,305 | ||||||
a Bottomline Technologies (de) Inc. | 1,354,304 | 31,555,283 | ||||||
a BroadSoft Inc. | 846,974 | 32,523,802 | ||||||
a Callidus Software Inc. | 1,965,300 | 41,369,565 | ||||||
a Cavium Inc. | 554,900 | 38,204,865 | ||||||
a Cloudera Inc. | 54,800 | 991,880 | ||||||
54 | Annual Report | franklintempleton.com | ||
FRANKLIN STRATEGIC SERIES
STATEMENT OF INVESTMENTS
Franklin Small Cap Growth Fund (continued)
Shares
| Value
| |||||||
| Common Stocks (continued) | ||||||||
Information Technology (continued) | ||||||||
Cognex Corp. | 215,300 | $ | 18,373,702 | |||||
a Envestnet Inc. | 953,022 | 33,165,166 | ||||||
a FARO Technologies Inc. | 371,400 | 13,611,810 | ||||||
a Guidewire Software Inc. | 510,700 | 31,402,943 | ||||||
a Hubspot Inc. | 523,929 | 35,129,439 | ||||||
a Integrated Device Technology Inc. | 1,564,300 | 37,527,557 | ||||||
a InterXion Holding NV (Netherlands) | 287,400 | 11,973,084 | ||||||
a Lattice Semiconductor Corp. | 5,134,200 | 35,220,612 | ||||||
a MACOM Technology Solutions Holdings Inc. | 573,000 | 28,008,240 | ||||||
a Nanometrics Inc. | 616,200 | 19,444,191 | ||||||
a Paylocity Holding Corp. | 1,060,432 | 41,823,438 | ||||||
a Proofpoint Inc. | 435,300 | 32,808,561 | ||||||
a Pure Storage Inc., A | 2,627,900 | 27,882,019 | ||||||
a Q2 Holdings Inc. | 566,900 | 21,627,235 | ||||||
a Shoretel Inc. | 1,261,800 | 8,264,790 | ||||||
a,b Twilio Inc., A | 745,802 | 24,648,756 | ||||||
a ViaSat Inc. | 293,383 | 18,785,313 | ||||||
a Zendesk Inc. | 1,749,414 | 50,295,653 | ||||||
|
| |||||||
| 763,465,659 | ||||||||
|
| |||||||
Materials 2.0% | ||||||||
H.B. Fuller Co. | 123,400 | 6,519,222 | ||||||
a Ingevity Corp. | 727,500 | 45,999,825 | ||||||
|
| |||||||
| 52,519,047 | ||||||||
|
| |||||||
Real Estate 1.4% | ||||||||
Coresite Realty Corp. | 383,700 | 37,545,045 | ||||||
|
| |||||||
Total Common Stocks (Cost $1,990,740,820) | 2,527,048,770 | |||||||
|
| |||||||
Preferred Stocks 1.7% | ||||||||
Consumer Discretionary 1.1% a,d DraftKings Inc., pfd., D | 825,201 | 3,261,689 | ||||||
a,d DraftKings Inc., pfd., D-1 | 2,029,318 | 11,411,464 | ||||||
a,d DraftKings Inc., pfd., E | 4,179,808 | 4,406,620 | ||||||
a,d Proterra Inc., pfd., 5, 144A | 1,787,047 | 8,999,998 | ||||||
|
| |||||||
| 28,079,771 | ||||||||
|
| |||||||
Information Technology 0.6% a,d Smule Inc., pfd., G, 144A | 1,542,673 | 13,122,593 | ||||||
a,d,e Smule Inc., pfd., H | 352,675 | 2,999,995 | ||||||
|
| |||||||
| 16,122,588 | ||||||||
|
| |||||||
Total Preferred Stocks (Cost $49,633,217) | 44,202,359 | |||||||
|
| |||||||
Total Investments before Short Term Investments (Cost $2,040,374,037) | 2,571,251,129 | |||||||
|
| |||||||
Short Term Investments 4.1% | ||||||||
Money Market Funds (Cost $44,495,628) 1.7% f,g Institutional Fiduciary Trust Money Market Portfolio, 0.37% | 44,495,628 | 44,495,628 | ||||||
|
| |||||||
franklintempleton.com | Annual Report | 55 | ||
FRANKLIN STRATEGIC SERIES
STATEMENT OF INVESTMENTS
Franklin Small Cap Growth Fund (continued)
Shares
| Value
| |||||||
h Investments from Cash Collateral Received for Loaned Securities | ||||||||
Money Market Funds 2.4% f,g Institutional Fiduciary Trust Money Market Portfolio, 0.37% | 62,071,100 | $ | 62,071,100 | |||||
|
| |||||||
Total Investments (Cost $2,146,940,765) 102.7% | 2,677,817,857 | |||||||
Other Assets, less Liabilities (2.7)% | (70,899,691 | ) | ||||||
|
| |||||||
Net Assets 100.0% | $ | 2,606,918,166 | ||||||
|
| |||||||
aNon-income producing.
bA portion or all of the security is on loan at April 30, 2017. See Note 1(d).
cSee Note 8 regarding holdings of 5% voting securities.
dSee Note 7 regarding restricted securities.
eSecurity purchased on a delayed delivery basis. See Note 1(c).
fSee Note 3(f) regarding investments in affiliated management investment companies.
gThe rate shown is the annualized seven-day yield at period end.
hSee Note 1(d) regarding securities on loan.
56 | Annual Report | The accompanying notes are an integral part of these financial statements. | franklintempleton.com | ||
FRANKLIN STRATEGIC SERIES
Financial Highlights
Franklin Small-Mid Cap Growth Fund
| Year Ended April 30, | ||||||||||||||||||||
| 2017 | 2016 | 2015 | 2014 | 2013 | ||||||||||||||||
Class A | ||||||||||||||||||||
Per share operating performance | ||||||||||||||||||||
(for a share outstanding throughout the year) | ||||||||||||||||||||
Net asset value, beginning of year | $31.84 | $38.38 | $40.42 | $38.01 | $38.51 | |||||||||||||||
Income from investment operationsa: | ||||||||||||||||||||
Net investment income (loss)b | (0.11 | ) | (0.03 | )c | (0.14 | ) | (0.20 | ) | (0.10 | ) | ||||||||||
Net realized and unrealized gains (losses) | 4.73 | (3.37 | ) | 5.71 | 8.39 | 3.08 | ||||||||||||||
Total from investment operations | 4.62 | (3.40 | ) | 5.57 | 8.19 | 2.98 | ||||||||||||||
Less distributions from net realized gains | (2.11 | ) | (3.14 | ) | (7.61 | ) | (5.78 | ) | (3.48 | ) | ||||||||||
Net asset value, end of year | $34.35 | $31.84 | $38.38 | $40.42 | $38.01 | |||||||||||||||
Total returnd | 15.01% | (9.02)% | 15.78% | 21.99% | 8.95% | |||||||||||||||
Ratios to average net assets | ||||||||||||||||||||
Expenses before waiver and payments by affiliates | 0.95% | 0.96% | 0.94% | 0.96% | 0.98% | |||||||||||||||
Expenses net of waiver and payments by affiliates | 0.94% | e | 0.95% | e | 0.94% | f | 0.96% | e,f | 0.98% | |||||||||||
Net investment income (loss) | (0.34)% | (0.08)% | c | (0.35)% | (0.48)% | (0.27)% | ||||||||||||||
Supplemental data | ||||||||||||||||||||
Net assets, end of year (000’s) | $ | 2,303,113 | $ | 2,231,822 | $ | 2,535,853 | $ | 2,371,448 | $ | 2,355,507 | ||||||||||
Portfolio turnover rate | 35.46% | 38.72% | 47.98% | 40.82% | 43.72% | |||||||||||||||
aThe amount shown for a share outstanding throughout the period may not correlate with the Statement of Operations for the period due to the timing of sales and repurchases of the Fund’s shares in relation to income earned, and/or fluctuating fair value of the investments of the Fund.
bBased on average daily shares outstanding.
cNet investment income per share includes approximately $0.11 per share related to income received in the form of special dividends in connection with certain Fund holdings. Excluding this amount, the ratio of net investment income to average net assets would have been (0.38)%.
dTotal return does not reflect sales commissions or contingent deferred sales charges, if applicable.
eBenefit of expense reduction rounds to less than 0.01%.
fBenefit of waiver and payments by affiliates rounds to less than 0.01%.
franklintempleton.com | The accompanying notes are an integral part of these financial statements. | Annual Report | 57 | ||
FRANKLIN STRATEGIC SERIES
FINANCIAL HIGHLIGHTS
Franklin Small-Mid Cap Growth Fund (continued)
| Year Ended April 30, | ||||||||||||||||||||
| 2017 | 2016 | 2015 | 2014 | 2013 | ||||||||||||||||
Class C | ||||||||||||||||||||
Per share operating performance | ||||||||||||||||||||
(for a share outstanding throughout the year) | ||||||||||||||||||||
Net asset value, beginning of year | $24.40 | $30.43 | $33.78 | $32.80 | $33.97 | |||||||||||||||
Income from investment operationsa: | ||||||||||||||||||||
Net investment income (loss)b | (0.27 | ) | (0.23 | )c | (0.36 | ) | (0.43 | ) | (0.32 | ) | ||||||||||
Net realized and unrealized gains (losses) | 3.57 | (2.66 | ) | 4.62 | 7.19 | 2.63 | ||||||||||||||
Total from investment operations | 3.30 | (2.89 | ) | 4.26 | 6.76 | 2.31 | ||||||||||||||
Less distributions from net realized gains | (2.11 | ) | (3.14 | ) | (7.61 | ) | (5.78 | ) | (3.48 | ) | ||||||||||
Net asset value, end of year | $25.59 | $24.40 | $30.43 | $33.78 | $32.80 | |||||||||||||||
Total returnd | 14.15% | (9.72)% | 14.96% | 21.04% | 8.11% | |||||||||||||||
Ratios to average net assets | ||||||||||||||||||||
Expenses before waiver and payments by affiliates | 1.70% | 1.71% | 1.69% | 1.71% | 1.73% | |||||||||||||||
Expenses net of waiver and payments by affiliates | 1.69% | e | 1.70% | e | 1.69% | f | 1.71% | e,f | 1.73% | |||||||||||
Net investment income (loss) | (1.09)% | (0.83)% | c | (1.10)% | (1.23)% | (1.02)% | ||||||||||||||
Supplemental data | ||||||||||||||||||||
Net assets, end of year (000’s) | $ | 371,262 | $ | 377,024 | $ | 448,722 | $ | 404,923 | $ | 348,144 | ||||||||||
Portfolio turnover rate | 35.46% | 38.72% | 47.98% | 40.82% | 43.72% | |||||||||||||||
aThe amount shown for a share outstanding throughout the period may not correlate with the Statement of Operations for the period due to the timing of sales and repurchases of the Fund’s shares in relation to income earned, and/or fluctuating fair value of the investments of the Fund.
bBased on average daily shares outstanding.
cNet investment income per share includes approximately $0.11 per share related to income received in the form of special dividends in connection with certain Fund holdings. Excluding this amount, the ratio of net investment income to average net assets would have been (1.13)%.
dTotal return does not reflect sales commissions or contingent deferred sales charges, if applicable.
eBenefit of expense reduction rounds to less than 0.01%.
fBenefit of waiver and payments by affiliates rounds to less than 0.01%.
58 | Annual Report | The accompanying notes are an integral part of these financial statements. | franklintempleton.com | ||
FRANKLIN STRATEGIC SERIES
FINANCIAL HIGHLIGHTS
Franklin Small-Mid Cap Growth Fund (continued)
| Year Ended April 30, | ||||||||||||||||||||
| 2017 | 2016 | 2015 | 2014 | 2013 | ||||||||||||||||
Class R | ||||||||||||||||||||
Per share operating performance | ||||||||||||||||||||
(for a share outstanding throughout the year) | ||||||||||||||||||||
Net asset value, beginning of year | $29.75 | $36.18 | $38.61 | $36.61 | $37.32 | |||||||||||||||
Income from investment operationsa: | ||||||||||||||||||||
Net investment income (loss)b | (0.18 | ) | (0.11 | )c | (0.23 | ) | (0.29 | ) | (0.18 | ) | ||||||||||
Net realized and unrealized gains (losses) | 4.41 | (3.18 | ) | 5.41 | 8.07 | 2.95 | ||||||||||||||
Total from investment operations | 4.23 | (3.29 | ) | 5.18 | 7.78 | 2.77 | ||||||||||||||
Less distributions from net realized gains | (2.11 | ) | (3.14 | ) | (7.61 | ) | (5.78 | ) | (3.48 | ) | ||||||||||
Net asset value, end of year | $31.87 | $29.75 | $36.18 | $38.61 | $36.61 | |||||||||||||||
Total return | 14.70% | (9.24)% | 15.52% | 21.66% | 8.66% | |||||||||||||||
Ratios to average net assets | ||||||||||||||||||||
Expenses before waiver and payments by affiliates | 1.19% | 1.21% | 1.19% | 1.21% | 1.23% | |||||||||||||||
Expenses net of waiver and payments by affiliates | 1.18% | d | 1.20% | d | 1.19% | e | 1.21% | d,e | 1.23% | |||||||||||
Net investment income (loss) | (0.58)% | (0.33)% | c | (0.60)% | (0.73)% | (0.52)% | ||||||||||||||
Supplemental data | ||||||||||||||||||||
Net assets, end of year (000’s) | $81,864 | $86,989 | $96,593 | $85,921 | $65,397 | |||||||||||||||
Portfolio turnover rate | 35.46% | 38.72% | 47.98% | 40.82% | 43.72% | |||||||||||||||
aThe amount shown for a share outstanding throughout the period may not correlate with the Statement of Operations for the period due to the timing of sales and repurchases of the Fund’s shares in relation to income earned and/or fluctuating fair value of the investments of the Fund.
bBased on average daily shares outstanding.
cNet investment income per share includes approximately $0.11 per share related to income received in the form of special dividends in connection with certain Fund holdings. Excluding this amount, the ratio of net investment income to average net assets would have been (0.63)%.
dBenefit of expense reduction rounds to less than 0.01%.
eBenefit of waiver and payments by affiliates rounds to less than 0.01%.
franklintempleton.com | The accompanying notes are an integral part of these financial statements. | Annual Report | 59 | ||
FRANKLIN STRATEGIC SERIES
FINANCIAL HIGHLIGHTS
Franklin Small-Mid Cap Growth Fund (continued)
| Year Ended April 30, | ||||||||||||||||
| 2017 | 2016 | 2015 | 2014a | |||||||||||||
Class R6 | ||||||||||||||||
Per share operating performance | ||||||||||||||||
(for a share outstanding throughout the year) | ||||||||||||||||
Net asset value, beginning of year | $34.43 | $41.04 | $42.53 | $38.96 | ||||||||||||
Income from investment operationsb: | ||||||||||||||||
Net investment incomec | 0.05 | 0.15 | d | 0.05 | 0.01 | |||||||||||
Net realized and unrealized gains (losses) | 5.14 | (3.62 | ) | 6.07 | 9.34 | |||||||||||
Total from investment operations | 5.19 | (3.47 | ) | 6.12 | 9.35 | |||||||||||
Less distributions from net realized gains | (2.11 | ) | (3.14 | ) | (7.61 | ) | (5.78 | ) | ||||||||
Net asset value, end of year | $37.51 | $34.43 | $14.04 | $42.53 | ||||||||||||
Total return | 15.51% | (8.54)% | 16.32% | 24.43% | ||||||||||||
Ratios to average net assets | ||||||||||||||||
Expenses before waiver and payments by affiliates | 0.48% | 0.48% | 0.48% | 0.47% | ||||||||||||
Expenses net of waiver and payments by affiliates | 0.47% | e | 0.47% | e | 0.48% | f | 0.47% | e,f | ||||||||
Net investment income | 0.13% | 0.40% | d | 0.11% | 0.01% | |||||||||||
Supplemental data | ||||||||||||||||
Net assets, end of year (000’s) | $ | 222,577 | $ | 242,237 | $ | 206,548 | $ | 157,153 | ||||||||
Portfolio turnover rate | 35.46% | 38.72% | 47.98% | 40.82% | ||||||||||||
aFor the year May 1, 2013 (effective date) to April 30, 2014.
bThe amount shown for a share outstanding throughout the period may not correlate with the Statement of Operations for the period due to the timing of sales and repurchases of the Fund’s shares in relation to income earned and/or fluctuating fair value of the investments of the Fund.
cBased on average daily shares outstanding.
dNet investment income per share includes approximately $0.11 per share related to income received in the form of special dividends in connection with certain Fund holdings. Excluding this amount, the ratio of net investment income to average net assets would have been 0.10%.
eBenefit of expense reduction rounds to less than 0.01%.
fBenefit of waiver and payments by affiliates rounds to less than 0.01%.
60 | Annual Report | The accompanying notes are an integral part of these financial statements. | franklintempleton.com | ||
FRANKLIN STRATEGIC SERIES
FINANCIAL HIGHLIGHTS
Franklin Small-Mid Cap Growth Fund (continued)
| Year Ended April 30, | ||||||||||||||||||||
| 2017 | 2016 | 2015 | 2014 | 2013 | ||||||||||||||||
Advisor Class | ||||||||||||||||||||
Per share operating performance | ||||||||||||||||||||
(for a share outstanding throughout the year) | ||||||||||||||||||||
Net asset value, beginning of year | $34.15 | $40.83 | $42.44 | $39.56 | $39.83 | |||||||||||||||
Income from investment operationsa: | ||||||||||||||||||||
Net investment income (loss)b | (0.03 | ) | 0.06 | c | (0.04 | ) | (0.10 | ) | (0.01 | ) | ||||||||||
Net realized and unrealized gains (losses) | 5.10 | (3.60 | ) | 6.04 | 8.76 | 3.22 | ||||||||||||||
Total from investment operations | 5.07 | (3.54 | ) | 6.00 | 8.66 | 3.21 | ||||||||||||||
Less distributions from net realized gains | (2.11 | ) | (3.14 | ) | (7.61 | ) | (5.78 | ) | (3.48 | ) | ||||||||||
Net asset value, end of year | $37.11 | $34.15 | $40.83 | $42.44 | $39.56 | |||||||||||||||
Total return | 15.28% | (8.79)% | 16.09% | 22.30% | 9.21% | |||||||||||||||
Ratios to average net assets | ||||||||||||||||||||
Expenses before waiver and payments by affiliates | 0.70% | 0.71% | 0.69% | 0.71% | 0.73% | |||||||||||||||
Expenses net of waiver and payments by affiliates | 0.69% | d | 0.70% | d | 0.69% | e | 0.71% | d,e | 0.73% | |||||||||||
Net investment income (loss) | (0.09)% | 0.17% | c | (0.10)% | (0.23)% | (0.02)% | ||||||||||||||
Supplemental data | ||||||||||||||||||||
Net assets, end of year (000’s) | $ | 584,840 | $ | 551,176 | $ | 708,617 | $ | 650,426 | $ | 909,895 | ||||||||||
Portfolio turnover rate | 35.46% | 38.72% | 47.98% | 40.82% | 43.72% | |||||||||||||||
aThe amount shown for a share outstanding throughout the period may not correlate with the Statement of Operations for the period due to the timing of sales and repurchases of the Fund’s shares in relation to income earned and/or fluctuating fair value of the investments of the Fund.
bBased on average daily shares outstanding.
cNet investment income per share includes approximately $0.11 per share related to income received in the form of special dividends in connection with certain Fund holdings. Excluding this amount, the ratio of net investment income to average net assets would have been (0.13)%.
dBenefit of expense reduction rounds to less than 0.01%.
eBenefit of waiver and payments by affiliates rounds to less than 0.01%.
franklintempleton.com | The accompanying notes are an integral part of these financial statements. | Annual Report | 61 | ||
FRANKLIN STRATEGIC SERIES
Statement of Investments, April 30, 2017
Franklin Small-Mid Cap Growth Fund
Shares
| Value
| |||||||
Common Stocks 96.2% | ||||||||
Consumer Discretionary 18.1% | ||||||||
Advance Auto Parts Inc. | 150,400 | $ | 21,377,856 | |||||
a Buffalo Wild Wings Inc. | 164,000 | 25,838,200 | ||||||
Delphi Automotive PLC (United Kingdom) | 525,200 | 42,226,080 | ||||||
Dick’s Sporting Goods Inc. | 692,600 | 35,010,930 | ||||||
a Dollar Tree Inc. | 506,600 | 41,931,282 | ||||||
Dominos Pizza Inc. | 90,000 | 16,325,100 | ||||||
Expedia Inc. | 224,500 | 30,020,140 | ||||||
a,b Global Eagle Entertainment Inc. | 1,126,784 | 3,493,031 | ||||||
a Grand Canyon Education Inc. | 543,200 | 40,826,912 | ||||||
Hanesbrands Inc. | 837,500 | 18,265,875 | ||||||
a IMAX Corp. | 956,200 | 29,164,100 | ||||||
L Brands Inc. | 355,000 | 18,747,550 | ||||||
a Laureate Education Inc., A | 530,300 | 7,323,443 | ||||||
a Liberty Broadband Corp., C | 413,500 | 37,694,660 | ||||||
Marriott International Inc., A | 391,800 | 36,993,756 | ||||||
Newell Brands Inc. | 812,776 | 38,801,926 | ||||||
a Norwegian Cruise Line Holdings Ltd. | 880,100 | 47,463,793 | ||||||
a NVR Inc. | 18,100 | 38,213,625 | ||||||
a O’Reilly Automotive Inc. | 139,300 | 34,567,295 | ||||||
Ross Stores Inc. | 614,300 | 39,929,500 | ||||||
Thor Industries Inc. | 96,500 | 9,281,370 | ||||||
Tractor Supply Co. | 481,400 | 29,803,474 | ||||||
a,b Zoe’s Kitchen Inc. | 85,800 | 1,548,690 | ||||||
|
| |||||||
|
644,848,588 |
| ||||||
|
| |||||||
Consumer Staples 5.1% | ||||||||
Church & Dwight Co. Inc. | 315,000 | 15,601,950 | ||||||
a Hostess Brands Inc., A | 508,500 | 8,715,690 | ||||||
Molson Coors Brewing Co., B | 255,000 | 24,451,950 | ||||||
a Monster Beverage Corp. | 538,900 | 24,455,282 | ||||||
Pinnacle Foods Inc. | 780,000 | 45,357,000 | ||||||
a Post Holdings Inc. | 441,400 | 37,161,466 | ||||||
a TreeHouse Foods Inc. | 296,500 | 25,973,400 | ||||||
|
| |||||||
|
181,716,738 |
| ||||||
|
| |||||||
Energy 2.6% | ||||||||
Cabot Oil & Gas Corp., A | 1,189,510 | 27,644,212 | ||||||
a Jagged Peak Energy Inc. | 1,710,000 | 19,049,400 | ||||||
Noble Energy Inc. | 641,400 | 20,736,462 | ||||||
a Oil States International Inc. | 110,000 | 3,272,500 | ||||||
b RPC Inc. | 250,000 | 4,542,500 | ||||||
a Superior Energy Services Inc. | 1,417,500 | 17,123,400 | ||||||
|
| |||||||
|
92,368,474 |
| ||||||
|
| |||||||
Financials 8.0% | ||||||||
Affiliated Managers Group Inc. | 328,800 | 54,445,992 | ||||||
Arthur J. Gallagher & Co. | 659,000 | 36,778,790 | ||||||
Lazard Ltd., A | 476,300 | 20,452,322 | ||||||
MarketAxess Holdings Inc. | 144,200 | 27,761,384 | ||||||
Moody’s Corp. | 315,000 | 37,270,800 | ||||||
a Signature Bank | 342,500 | 47,419,125 | ||||||
a SVB Financial Group | 185,100 | 32,566,494 | ||||||
62 | Annual Report | franklintempleton.com | ||
FRANKLIN STRATEGIC SERIES
STATEMENT OF INVESTMENTS
Franklin Small-Mid Cap Growth Fund (continued)
Shares
| Value
| |||||||
Common Stocks (continued) | ||||||||
Financials (continued) | ||||||||
Willis Towers Watson PLC | 205,200 | $ | 27,213,624 | |||||
|
| |||||||
|
283,908,531 |
| ||||||
|
| |||||||
Health Care 14.2% | ||||||||
a Acadia Pharmaceuticals Inc. | 322,349 | 11,066,241 | ||||||
a BioMarin Pharmaceutical Inc. | 156,066 | 14,957,365 | ||||||
a Cerner Corp. | 348,502 | 22,565,504 | ||||||
The Cooper Cos. Inc. | 140,200 | 28,086,266 | ||||||
a DaVita Inc. | 489,900 | 33,807,999 | ||||||
a DexCom Inc. | 295,314 | 23,022,679 | ||||||
a Edwards Lifesciences Corp. | 474,600 | 52,049,382 | ||||||
a,b Heron Therapeutics Inc. | 492,411 | 7,558,509 | ||||||
a Hologic Inc. | 810,000 | 36,571,500 | ||||||
a Illumina Inc. | 127,000 | 23,477,220 | ||||||
a Incyte Corp. | 230,614 | 28,660,708 | ||||||
a Insulet Corp. | 284,217 | 12,337,860 | ||||||
a Intuitive Surgical Inc. | 31,600 | 26,413,492 | ||||||
a iRhythm Technologies Inc. | 191,450 | 6,756,271 | ||||||
a Jazz Pharmaceuticals PLC | 128,000 | 20,387,840 | ||||||
a Mednax Inc. | 128,500 | 7,756,260 | ||||||
a Mettler-Toledo International Inc. | 88,000 | 45,180,960 | ||||||
a Neurocrine Biosciences Inc. | 199,842 | 10,671,563 | ||||||
a Nevro Corp. | 198,800 | 18,730,936 | ||||||
a Patheon NV | 343,000 | 9,230,130 | ||||||
a Penumbra Inc. | 168,647 | 14,410,886 | ||||||
a Revance Therapeutics Inc. | 344,100 | 7,484,175 | ||||||
a Tesaro Inc. | 143,145 | 21,126,771 | ||||||
a Waters Corp. | 135,000 | 22,935,150 | ||||||
|
| |||||||
|
505,245,667 |
| ||||||
|
| |||||||
Industrials 15.4% | ||||||||
Acuity Brands Inc. | 137,000 | 24,125,700 | ||||||
Allegiant Travel Co. | 107,109 | 15,573,649 | ||||||
BWX Technologies Inc. | 108,400 | 5,330,028 | ||||||
a DigitalGlobe Inc. | 251,600 | 8,101,520 | ||||||
Dun & Bradstreet Corp. | 310,100 | 33,990,061 | ||||||
Equifax Inc. | 145,000 | 19,619,950 | ||||||
Fortive Corp. | 233,000 | 14,739,580 | ||||||
a Genesee & Wyoming Inc. | 680,200 | 46,090,352 | ||||||
a HD Supply Holdings Inc. | 798,068 | 32,162,140 | ||||||
Hexcel Corp. | 756,709 | 39,159,691 | ||||||
a IHS Markit Ltd. | 1,094,015 | 47,480,251 | ||||||
J.B. Hunt Transport Services Inc. | 285,700 | 25,615,862 | ||||||
Robert Half International Inc. | 653,600 | 30,098,280 | ||||||
Rockwell Automation Inc. | 201,000 | 31,627,350 | ||||||
Roper Technologies Inc. | 360,530 | 78,847,911 | ||||||
Stanley Black & Decker Inc. | 205,000 | 27,910,750 | ||||||
Textron Inc. | 443,800 | 20,707,708 | ||||||
a Univar Inc. | 456,100 | 13,614,585 | ||||||
a Verisk Analytics Inc. | 402,800 | 33,355,868 | ||||||
|
| |||||||
|
548,151,236 |
| ||||||
|
| |||||||
franklintempleton.com | Annual Report | 63 | ||
FRANKLIN STRATEGIC SERIES
STATEMENT OF INVESTMENTS
Franklin Small-Mid Cap Growth Fund (continued)
Shares
| Value
| |||||||
Common Stocks (continued) | ||||||||
Information Technology 24.6% | ||||||||
a 2U Inc. | 1,036,800 | $ | 47,070,720 | |||||
a Alarm.com Holdings Inc. | 302,000 | 9,848,220 | ||||||
Alliance Data Systems Corp. | 79,600 | 19,870,548 | ||||||
Analog Devices Inc. | 358,500 | 27,317,700 | ||||||
a ANSYS Inc. | 272,100 | 29,974,536 | ||||||
a Atlassian Corp. PLC (Australia) | 625,000 | 21,550,000 | ||||||
a Autodesk Inc. | 297,000 | 26,750,790 | ||||||
a Bottomline Technologies (de) Inc. | 750,200 | 17,479,660 | ||||||
a Cavium Inc. | 152,500 | 10,499,625 | ||||||
a Cloudera Inc. | 74,700 | 1,352,070 | ||||||
Cognex Corp. | 511,800 | 43,677,012 | ||||||
a CoStar Group Inc. | 242,600 | 58,439,914 | ||||||
CSRA Inc. | 1,165,347 | 33,888,291 | ||||||
a Electronic Arts Inc. | 243,100 | 23,050,742 | ||||||
Fidelity National Information Services Inc. | 500,900 | 42,170,771 | ||||||
a FleetCor Technologies Inc. | 243,800 | 34,409,932 | ||||||
a GoDaddy Inc., A | 981,800 | 38,211,656 | ||||||
a Inphi Corp. | 246,000 | 10,189,320 | ||||||
a Integrated Device Technology Inc. | 607,000 | 14,561,930 | ||||||
KLA-Tencor Corp. | 295,000 | 28,974,900 | ||||||
Lam Research Corp. | 261,000 | 37,805,850 | ||||||
Microchip Technology Inc. | 439,800 | 33,240,084 | ||||||
Monolithic Power Systems | 75,000 | 6,862,500 | ||||||
NVIDIA Corp. | 294,500 | 30,716,350 | ||||||
a Palo Alto Networks Inc. | 270,000 | 29,270,700 | ||||||
a Proofpoint Inc. | 225,000 | 16,958,250 | ||||||
a Q2 Holdings Inc. | 181,700 | 6,931,855 | ||||||
a ServiceNow Inc. | 479,600 | 45,312,608 | ||||||
Skyworks Solutions Inc. | 113,000 | 11,270,620 | ||||||
a Square Inc., A | 563,000 | 10,269,120 | ||||||
a Vantiv Inc., A | 818,700 | 50,792,148 | ||||||
a ViaSat Inc. | 348,050 | 22,285,641 | ||||||
a Workday Inc., A | 290,000 | 25,346,000 | ||||||
a Zendesk Inc. | 401,500 | 11,543,125 | ||||||
|
| |||||||
|
877,893,188
|
| ||||||
|
| |||||||
Materials 4.2% | ||||||||
a Axalta Coating Systems Ltd. | 1,689,603 | 53,002,846 | ||||||
a Ingevity Corp. | 406,700 | 25,715,641 | ||||||
International Flavors & Fragrances Inc. | 165,000 | 22,867,350 | ||||||
Martin Marietta Materials Inc. | 223,300 | 49,168,427 | ||||||
|
| |||||||
|
150,754,264 |
| ||||||
|
| |||||||
Real Estate 4.0% | ||||||||
American Campus Communities Inc. | 264,200 | 12,520,438 | ||||||
a CBRE Group Inc. | 677,100 | 24,246,951 | ||||||
Equinix Inc. | 164,178 | 68,577,151 | ||||||
a SBA Communications Corp. | 282,000 | 35,670,180 | ||||||
|
| |||||||
|
141,014,720 |
| ||||||
|
| |||||||
Total Common Stocks (Cost $2,453,654,335) |
|
3,425,901,406 |
| |||||
|
| |||||||
64 | Annual Report | franklintempleton.com | ||
FRANKLIN STRATEGIC SERIES
STATEMENT OF INVESTMENTS
Franklin Small-Mid Cap Growth Fund (continued)
Shares
| Value
| |||||||
Preferred Stocks 0.6% | ||||||||
Consumer Discretionary 0.6% | ||||||||
a,c DraftKings Inc., pfd., D | 660,161 | $ | 2,609,352 | |||||
a,c DraftKings Inc., pfd., D-1 | 1,623,455 | 9,129,175 | ||||||
a,c DraftKings Inc., pfd., E | 3,388,624 | 3,572,503 | ||||||
a,c Proterra Inc., pfd., 5, 144A | 1,416,913 | 7,135,914 | ||||||
|
| |||||||
Total Preferred Stocks (Cost $28,423,430) | 22,446,944 | |||||||
|
| |||||||
Total Investments before Short Term Investments (Cost $2,482,077,765) | 3,448,348,350 | |||||||
|
| |||||||
Short Term Investments 3.7% | ||||||||
Money Market Funds (Cost $128,167,885) 3.6% | ||||||||
d,e Institutional Fiduciary Trust Money Market Portfolio, 0.37% | 128,167,885 | 128,167,885 | ||||||
|
| |||||||
f Investments from Cash Collateral Received for Loaned Securities | ||||||||
Money Market Funds 0.1% | ||||||||
d,e Institutional Fiduciary Trust Money Market Portfolio, 0.37% | 5,704,575 | 5,704,575 | ||||||
|
| |||||||
Total Investments (Cost $2,615,950,225) 100.5% |
|
3,582,220,810 |
| |||||
Other Assets, less Liabilities (0.5)% | (18,563,918 | ) | ||||||
|
| |||||||
Net Assets 100.0% |
$ |
3,563,656,892 |
| |||||
|
| |||||||
aNon-income producing.
bA portion or all of the security is on loan at April 30, 2017. See Note 1(d).
cSee Note 7 regarding restricted securities.
dSee Note 3(f) regarding investments in affiliated management investment companies.
eThe rate shown is the annualized seven-day yield at period end.
fSee Note 1(d) regarding securities on loan.
franklintempleton.com | The accompanying notes are an integral part of these financial statements. | Annual Report | 65 | ||
FRANKLIN STRATEGIC SERIES
Statements of Assets and Liabilities
April 30, 2017
Franklin Focused Core Equity Fund | Franklin Growth Opportunities Fund | Franklin Small Cap Growth Fund | Franklin Small-Mid Cap Growth Fund | |||||||||||||||||
Assets: | ||||||||||||||||||||
Investments in securities: | ||||||||||||||||||||
Cost - Unaffiliated issuers | $106,634,602 | $2,059,652,264 | $1,926,567,835 | $2,482,077,765 | ||||||||||||||||
Cost - Non-controlled affiliates (Note 3f and 8) | 2,075,737 | 55,627,362 | 220,372,930 | 133,872,460 | ||||||||||||||||
|
| |||||||||||||||||||
Total cost of investments |
|
$108,710,339 |
| $2,115,279,626 | $2,146,940,765 | $2,615,950,225 | ||||||||||||||
|
| |||||||||||||||||||
Value - Unaffiliated issuers |
|
$129,756,728 |
| $3,504,215,106 | $2,504,205,693 | $3,448,348,350 | ||||||||||||||
Value - Non-controlled affiliates (Note 3f and 8) | 2,075,737 | 55,627,362 | 173,612,164 | 133,872,460 | ||||||||||||||||
|
| |||||||||||||||||||
Total value of investments* |
|
131,832,465 |
| 3,559,842,468 | 2,677,817,857 | 3,582,220,810 | ||||||||||||||
Receivables: | ||||||||||||||||||||
Investment securities sold | 611,233 | 3,028,181 | 1,197,596 | 455,670 | ||||||||||||||||
Capital shares sold | 44,451 | 2,194,088 | 1,396,790 | 3,953,859 | ||||||||||||||||
Dividends and interest | 61,250 | 840,961 | 306,618 | 157,047 | ||||||||||||||||
Due from custodian | — | 6,158,250 | 1,549,075 | 3,099,600 | ||||||||||||||||
Other assets | 116 | 2,829 | 2,340 | 2,863 | ||||||||||||||||
|
| |||||||||||||||||||
Total assets |
|
132,549,515 |
| 3,572,066,777 | 2,682,270,276 | 3,589,889,849 | ||||||||||||||
|
| |||||||||||||||||||
Liabilities: | ||||||||||||||||||||
Payables: | ||||||||||||||||||||
Investment securities purchased | 451,047 | 2,147,322 | 6,533,980 | 3,850,742 | ||||||||||||||||
Capital shares redeemed | 190,196 | 7,862,236 | 2,604,712 | 10,058,804 | ||||||||||||||||
Management fees | 101,810 | 1,317,865 | 1,283,788 | 1,297,213 | ||||||||||||||||
Distribution fees | 31,741 | 786,401 | 304,638 | 795,612 | ||||||||||||||||
Transfer agent fees | 10,936 | 828,803 | 805,070 | 1,196,261 | ||||||||||||||||
Payable upon return of securities loaned | — | 16,552,325 | 63,620,175 | 8,804,175 | ||||||||||||||||
Accrued expenses and other liabilities | 44,352 | 171,283 | 199,747 | 230,150 | ||||||||||||||||
|
| |||||||||||||||||||
Total liabilities |
|
830,082 |
| 29,666,235 | 75,352,110 | 26,232,957 | ||||||||||||||
|
| |||||||||||||||||||
Net assets, at value |
|
$131,719,433 |
| $3,542,400,542 | $2,606,918,166 | $3,563,656,892 | ||||||||||||||
|
| |||||||||||||||||||
Net assets consist of: | ||||||||||||||||||||
Paid-in capital | $117,827,567 | $1,924,602,590 | $2,170,296,698 | $2,506,546,275 | ||||||||||||||||
Undistributed net investment income (loss) | (57,895 | ) | (3,796,709 | ) | (4,025,448 | ) | (2,048,836 | ) | ||||||||||||
Net unrealized appreciation (depreciation) | 23,122,126 | 1,444,478,111 | 530,877,092 | 966,270,585 | ||||||||||||||||
Accumulated net realized gain (loss) | (9,172,365 | ) | 177,116,550 | (90,230,176 | ) | 92,888,868 | ||||||||||||||
|
| |||||||||||||||||||
Net assets, at value |
|
$131,719,433 |
| $3,542,400,542 | $2,606,918,166 | $3,563,656,892 | ||||||||||||||
|
| |||||||||||||||||||
*Includes securities loaned | $ — | $ 16,107,079 | $ 61,207,818 | $ 8,537,740 | ||||||||||||||||
66 | Annual Report | The accompanying notes are an integral part of these financial statements. | franklintempleton.com | ||
FRANKLIN STRATEGIC SERIES
FINANCIAL STATEMENTS
Statements of Assets and Liabilities (continued)
April 30, 2017
Franklin Focused Core Equity Fund | Franklin Growth Opportunities Fund | Franklin Small Cap Growth Fund | Franklin Small-Mid Cap Growth Fund | |||||||||||||||||
Class A: | ||||||||||||||||||||
Net assets, at value | $77,733,034 | $2,272,831,377 | $719,751,626 | $2,303,113,228 | ||||||||||||||||
Shares outstanding | 5,114,933 | 65,287,251 | 36,730,169 | 67,047,277 | ||||||||||||||||
Net asset value per sharea | $15.20 | $34.81 | $19.60 | $34.35 | ||||||||||||||||
Maximum offering price per share (net asset value per share ÷ 94.25%) | $16.13 | $36.93 | $20.80 | $36.45 | ||||||||||||||||
Class C: | ||||||||||||||||||||
Net assets, at value | $20,341,306 | $ 390,123,362 | $142,538,850 | $ 371,262,318 | ||||||||||||||||
Shares outstanding | 1,406,267 | 12,950,330 | 8,529,297 | 14,508,802 | ||||||||||||||||
Net asset value and maximum offering price per sharea | $14.46 | $30.12 | $16.71 | $25.59 | ||||||||||||||||
Class R: | ||||||||||||||||||||
Net assets, at value | $ 166,418 | $ 50,428,687 | $ 79,994,597 |
| $ 81,863,820 | |||||||||||||||
Shares outstanding | 11,088 | 1,504,296 | 4,269,073 | 2,568,593 | ||||||||||||||||
Net asset value and maximum offering price per share | $15.01 | $33.52 | $18.74 | $31.87 | ||||||||||||||||
Class R6: | ||||||||||||||||||||
Net assets, at value | $20,401,396 | $ 291,824,591 | $858,972,473 | $ 222,577,400 | ||||||||||||||||
Shares outstanding | 1,321,409 | 7,823,304 | 40,781,512 | 5,933,048 | ||||||||||||||||
Net asset value and maximum offering price per share | $15.44 | $37.30 | $21.06 | $37.51 | ||||||||||||||||
Advisor Class: | ||||||||||||||||||||
Net assets, at value | $13,077,279 | $ 537,192,525 | $805,660,620 | $ 584,840,126 | ||||||||||||||||
Shares outstanding | 849,567 | 14,512,702 | 38,580,188 | 15,759,285 | ||||||||||||||||
Net asset value and maximum offering price per share | $15.39 | $37.02 | $20.88 | $37.11 | ||||||||||||||||
aRedemption price is equal to net asset value less contingent deferred sales charges, if applicable.
franklintempleton.com | The accompanying notes are an integral part of these financial statements. | Annual Report | 67 | ||
FRANKLIN STRATEGIC SERIES
FINANCIAL STATEMENTS
Statements of Operations
for the year ended April 30, 2017
Franklin Focused Core Equity Fund | Franklin Growth Opportunities Fund | Franklin Small Cap Growth Fund | Franklin Small-Mid Cap Growth Fund | |||||||||||||||||
Investment income: | ||||||||||||||||||||
Dividends: | ||||||||||||||||||||
Unaffiliated issuers | $ | 1,715,636 | $ 18,310,473 | $ | 9,090,262 | $ 20,247,788 | ||||||||||||||
Non-controlled affiliates (Note 3f and 8) | 1,001 | 23,166 | 66,600 | 64,711 | ||||||||||||||||
Interest | — | — | 296,685 | 250,231 | ||||||||||||||||
Income from securities loaned (net of fees and rebates) | — | 182,385 | 3,743,229 | 382,280 | ||||||||||||||||
|
| |||||||||||||||||||
Total investment income | 1,716,637 | 18,516,024 | 13,196,776 | 20,945,010 | ||||||||||||||||
|
| |||||||||||||||||||
Expenses: | ||||||||||||||||||||
Management fees (Note 3a) | 1,357,731 | 15,661,146 | 16,944,181 | 15,963,209 | ||||||||||||||||
Distribution fees: (Note 3c) | ||||||||||||||||||||
Class A | 212,628 | 4,262,748 | 1,899,092 | 5,582,468 | ||||||||||||||||
Class C | 213,604 | 3,076,819 | 1,503,192 | 3,724,196 | ||||||||||||||||
Class R | 670 | 237,681 | 397,879 | 417,390 | ||||||||||||||||
Transfer agent fees: (Note 3e) | ||||||||||||||||||||
Class A | 133,330 | 3,518,517 | 1,686,151 | 5,029,891 | ||||||||||||||||
Class C | 33,703 | 636,051 | 332,306 | 838,859 | ||||||||||||||||
Class R | 250 | 98,425 | 176,918 | 189,637 | ||||||||||||||||
Class R6 | 119 | 615 | 10,160 | 2,880 | ||||||||||||||||
Advisor Class | 21,447 | 854,677 | 1,834,078 | 1,259,765 | ||||||||||||||||
Custodian fees (Note 4) | 2,891 | 26,533 | 22,770 | 28,352 | ||||||||||||||||
Reports to shareholders | 19,611 | 252,727 | 244,660 | 410,380 | ||||||||||||||||
Registration and filing fees | 74,652 | 167,956 | 115,752 | 179,212 | ||||||||||||||||
Professional fees | 42,651 | 51,140 | 58,091 | 62,078 | ||||||||||||||||
Trustees’ fees and expenses | 1,556 | 24,002 | 27,261 | 34,668 | ||||||||||||||||
Other | 8,895 | 162,808 | 51,312 | 64,532 | ||||||||||||||||
|
| |||||||||||||||||||
Total expenses | 2,123,738 | 29,031,845 | 25,303,803 | 33,787,517 | ||||||||||||||||
Expense reductions (Note 4) | (12 | ) | (504 | ) | (720 | ) | (316 | ) | ||||||||||||
Expenses waived/paid by affiliates (Note 3f and 3g) | (316,498 | ) | (2,205,850 | ) | (522,463 | ) | (474,426 | ) | ||||||||||||
|
| |||||||||||||||||||
Net expenses | 1,807,228 | 26,825,491 | 24,780,620 | 33,312,775 | ||||||||||||||||
|
| |||||||||||||||||||
Net investment income (loss) | (90,591 | ) | (8,309,467 | ) | (11,583,844 | ) | (12,367,765 | ) | ||||||||||||
|
| |||||||||||||||||||
Realized and unrealized gains (losses): | ||||||||||||||||||||
Net realized gain (loss) from: | ||||||||||||||||||||
Investments : | ||||||||||||||||||||
Unaffiliated issuers | (313,407 | ) | 270,071,985 | 84,638,612 | 296,127,318 | |||||||||||||||
Non-controlled affiliates (Note 3f and 8) | — | — | 26,606,892 | — | ||||||||||||||||
Foreign currency transactions | (717 | ) | 12,159 | 6,188 | 9,876 | |||||||||||||||
|
| |||||||||||||||||||
Net realized gain (loss) | (314,124 | ) | 270,084,144 | 111,251,692 | 296,137,194 | |||||||||||||||
|
| |||||||||||||||||||
Net change in unrealized appreciation (depreciation) on: | ||||||||||||||||||||
Investments | 20,899,832 | 141,378,056 | 397,379,604 | 204,507,795 | ||||||||||||||||
Translation of other assets and liabilities denominated in foreign currencies | — | 12,435 | — | — | ||||||||||||||||
|
| |||||||||||||||||||
Net change in unrealized appreciation (depreciation) | 20,899,832 | 141,390,491 | 397,379,604 | 204,507,795 | ||||||||||||||||
|
| |||||||||||||||||||
Net realized and unrealized gain (loss) | 20,585,708 | 411,474,635 | 508,631,296 | 500,644,989 | ||||||||||||||||
|
| |||||||||||||||||||
Net increase (decrease) in net assets resulting from operations | $ | 20,495,117 | $403,165,168 | $ | 497,047,452 | $488,277,224 | ||||||||||||||
|
| |||||||||||||||||||
68 | Annual Report | The accompanying notes are an integral part of these financial statements. | franklintempleton.com | ||
FRANKLIN STRATEGIC SERIES
FINANCIAL STATEMENTS
Statements of Changes in Net Assets
Franklin Focused Core Equity Fund | Franklin Growth Opportunities Fund | |||||||||||||||
| Year Ended April 30, | Year Ended April 30, | |||||||||||||||
| 2017 | 2016 | 2017 | 2016 | |||||||||||||
Increase (decrease) in net assets: | ||||||||||||||||
Operations: | ||||||||||||||||
Net investment income (loss) | $ | (90,591 | ) | $ | 865,847 | $ | (8,309,467 | ) | $ | (6,485,092 | ) | |||||
Net realized gain (loss) | (314,124 | ) | (6,954,510 | ) | 270,084,144 | (7,640,390 | ) | |||||||||
Net change in unrealized appreciation (depreciation) | 20,899,832 | (20,401,231 | ) | 141,390,491 | (70,395,108 | ) | ||||||||||
Net increase (decrease) in net assets resulting from operations | 20,495,117 | (26,489,894 | ) | 403,165,168 | (84,520,590 | ) | ||||||||||
Distributions to shareholders from: | ||||||||||||||||
Net investment income: | ||||||||||||||||
Class A | — | (497,875 | ) | — | — | |||||||||||
Class R | — | (953 | ) | — | — | |||||||||||
Class R6 | — | (285,880 | ) | — | — | |||||||||||
Advisor Class | — | (75,820 | ) | — | — | |||||||||||
Net realized gains: | ||||||||||||||||
Class A | — | (3,097,294 | ) | (44,859,072 | ) | (11,684,036 | ) | |||||||||
Class C | — | (753,648 | ) | (8,913,159 | ) | (3,434,327 | ) | |||||||||
Class R | — | (8,526 | ) | (1,075,523 | ) | (919,987 | ) | |||||||||
Class R6 | — | (947,505 | ) | (5,023,963 | ) | (4,559,642 | ) | |||||||||
Advisor Class | — | (303,800 | ) | (9,033,594 | ) | (5,175,160 | ) | |||||||||
Total distributions to shareholders | — | (5,971,301 | ) | (68,905,311 | ) | (25,773,152 | ) | |||||||||
Capital share transactions: (Note 2) | ||||||||||||||||
Class A | (35,011,790 | ) | 27,607,644 | 1,519,824,161 | 142,478,599 | |||||||||||
Class C | (7,689,560 | ) | 10,981,811 | 218,581,841 | 42,387,168 | |||||||||||
Class R | (130,011 | ) | 158,571 | 4,640,014 | (4,630,356 | ) | ||||||||||
Class R6 | (16,295,505 | ) | 14,106,218 | 22,457,460 | 7,201,428 | |||||||||||
Advisor Class | 100,080 | 2,665,730 | 224,101,152 | 8,197,076 | ||||||||||||
Total capital share transactions | (59,026,786 | ) | 55,519,974 | 1,989,604,628 | 195,633,915 | |||||||||||
Net increase (decrease) in net assets | (38,531,669 | ) | 23,058,779 | 2,323,864,485 | 85,340,173 | |||||||||||
Net assets: | ||||||||||||||||
Beginning of year | 170,251,102 | 147,192,323 | 1,218,536,057 | 1,133,195,884 | ||||||||||||
End of year | $ | 131,719,433 | $ | 170,251,102 | $ | 3,542,400,542 | $ | 1,218,536,057 | ||||||||
Undistributed net investment income (loss) included in net assets: | ||||||||||||||||
End of year | $ | (57,895 | ) | $ | — | $ | (3,796,709 | ) | $ | (2,362,629 | ) | |||||
Distributions in excess of net investment income included in net assets: | ||||||||||||||||
End of year | $ | — | $ | (48,510 | ) | $ | — | $ | — | |||||||
franklintempleton.com | The accompanying notes are an integral part of these financial statements. | Annual Report | 69 | ||
FRANKLIN STRATEGIC SERIES
FINANCIAL STATEMENTS
Statements of Changes in Net Assets (continued)
Franklin Small Cap Growth Fund | Franklin Small-Mid Cap Growth Fund | |||||||||||||||
| Year Ended April 30, | Year Ended April 30, | |||||||||||||||
| 2017 | 2016 | 2017 | 2016 | |||||||||||||
Increase (decrease) in net assets: | ||||||||||||||||
Operations: | ||||||||||||||||
Net investment income (loss) | $ | (11,583,844 | ) | $ | (8,604,877 | ) | $ | (12,367,765 | ) | $ | (3,590,643 | ) | ||||
Net realized gain (loss) | 111,251,692 | (195,895,106 | ) | 296,137,194 | 192,892,797 | |||||||||||
Net change in unrealized appreciation (depreciation) | 397,379,604 | (189,905,421 | ) | 204,507,795 | (552,669,162 | ) | ||||||||||
Net increase (decrease) in net assets resulting from operations | 497,047,452 | (394,405,404 | ) | 488,277,224 | (363,367,008 | ) | ||||||||||
Distributions to shareholders from: | ||||||||||||||||
Net realized gains: | ||||||||||||||||
Class A | — | (18,855,133 | ) | (136,505,889 | ) | (203,767,135 | ) | |||||||||
Class C | — | (4,317,704 | ) | (29,638,216 | ) | (45,252,717 | ) | |||||||||
Class R | — | (1,825,810 | ) | (5,497,412 | ) | (8,434,665 | ) | |||||||||
Class R6 | — | (16,908,538 | ) | (12,322,477 | ) | (20,262,074 | ) | |||||||||
Advisor Class | — | (17,868,315 | ) | (31,556,678 | ) | (49,942,277 | ) | |||||||||
Total distributions to shareholders | — | (59,775,500 | ) | (215,520,672 | ) | (327,658,868 | ) | |||||||||
Capital share transactions: (Note 2) | ||||||||||||||||
Class A | (210,965,256 | ) | (221,885,481 | ) | (104,570,061 | ) | 128,177,630 | |||||||||
Class C | (40,612,322 | ) | (37,262,306 | ) | (25,199,072 | ) | 17,363,176 | |||||||||
Class R | (14,134,257 | ) | 564,740 | (11,196,875 | ) | 8,280,172 | ||||||||||
Class R6 | (157,322,943 | ) | 124,630,820 | (42,853,407 | ) | 75,185,512 | ||||||||||
Advisor Class | (193,970,739 | ) | (88,883,508 | ) | (14,527,511 | ) | (45,066,011 | ) | ||||||||
Total capital share transactions | (617,005,517 | ) | (222,835,735 | ) | (198,346,926 | ) | 183,940,479 | |||||||||
Net increase (decrease) in net assets | (119,958,065 | ) | (677,016,639 | ) | 74,409,626 | (507,085,397 | ) | |||||||||
Net assets: | ||||||||||||||||
Beginning of year | 2,726,876,231 | 3,403,892,870 | 3,489,247,266 | 3,996,332,663 | ||||||||||||
End of year | $ | 2,606,918,166 | $ | 2,726,876,231 | $ | 3,563,656,892 | $ | 3,489,247,266 | ||||||||
Undistributed net investment income (loss) included in net assets: | ||||||||||||||||
End of year | $ | (4,025,448 | ) | $ | (2,532,991 | ) | $ | (2,048,836 | ) | $ | (4,254,714 | ) | ||||
70 | Annual Report | The accompanying notes are an integral part of these financial statements. | franklintempleton.com | ||
FRANKLIN STRATEGIC SERIES
1. Organization and Significant Accounting Policies
Franklin Strategic Series (Trust) is registered under the Investment Company Act of 1940 (1940 Act) as an open-end management investment company, consisting of nine separate funds, four of which are included in this report (Funds) and applies the specialized accounting and reporting guidance in U.S. Generally Accepted Accounting Principles (U.S. GAAP). The financial statements of the remaining funds in the Trust are presented separately. The Funds offer five classes of shares: Class A, Class C, Class R, Class R6, and Advisor Class. Each class of shares may differ by its initial sales load, contingent deferred sales charges, voting rights on matters affecting a single class, its exchange privilege and fees primarily due to differing arrangements for distribution and transfer agent fees.
Franklin Small Cap Growth Fund was closed to new investors with limited exceptions effective at the close of market February 12, 2015. Effective April 28, 2017, the fund opened Class R6 shares to new investors who are eligible to purchase Class R6 shares.
The following summarizes the Funds’ significant accounting policies.
a. Financial Instrument Valuation
The Funds’ investments in financial instruments are carried at fair value daily. Fair value is the price that would be received to sell an asset or paid to transfer a liability in an orderly transaction between market participants on the measurement date. The Funds calculate the net asset value (NAV) per share as of 4 p.m. Eastern time each day the New York Stock Exchange (NYSE) is open for trading. Under compliance policies and procedures approved by the Trust’s Board of Trustees (the Board), the Funds’ administrator has responsibility for oversight of valuation, including leading the cross-functional Valuation Committee (VC). The VC provides administration and oversight of the Funds’ valuation policies and procedures, which are approved annually by the Board. Among other things, these procedures allow the Funds to utilize independent pricing services, quotations from securities and financial instrument dealers, and other market sources to determine fair value.
Equity securities listed on an exchange or on the NASDAQ National Market System are valued at the last quoted sale price or the official closing price of the day, respectively. Foreign equity securities are valued as of the close of trading on the foreign stock exchange on which the security is primarily traded, or as of 4 p.m. Eastern time. The value is then converted into its U.S. dollar equivalent at the foreign exchange rate in effect at 4 p.m. Eastern time on the day that the value of the security is determined. Over-the-counter (OTC) securities are valued within the range of the most recent quoted bid and ask prices. Securities that trade in multiple markets or on multiple exchanges are valued according to the broadest and most representative market. Certain equity securities are valued based upon fundamental characteristics or relationships to similar securities.
Debt securities generally trade in the OTC market rather than on a securities exchange. The Funds’ pricing services use multiple valuation techniques to determine fair value. In instances where sufficient market activity exists, the pricing services may utilize a market-based approach through which quotes from market makers are used to determine fair value. In instances where sufficient market activity may not exist or is limited, the pricing services also utilize proprietary valuation models which may consider market characteristics such as benchmark yield curves, credit spreads, estimated default rates, anticipated market interest rate volatility, coupon rates, anticipated timing of principal repayments, underlying collateral, and other unique security features in order to estimate the relevant cash flows, which are then discounted to calculate the fair value.
Investments in open-end mutual funds are valued at the closing NAV.
The Funds have procedures to determine the fair value of financial instruments for which market prices are not reliable or readily available. Under these procedures, the VC convenes on a regular basis to review such financial instruments and considers a number of factors, including significant unobservable valuation inputs, when arriving at fair value. The VC primarily employs a market-based approach which may use related or comparable assets or liabilities, recent transactions, market multiples, book values, and other relevant information for the investment to determine the fair value of the investment. An income-based valuation approach may also be used in which the anticipated future cash flows of the investment are discounted to calculate fair value. Discounts may also be applied due to the nature or duration of any restrictions on the
franklintempleton.com | Annual Report | 71 | ||
FRANKLIN STRATEGIC SERIES
NOTES TO FINANCIAL STATEMENTS
1. Organization and Significant Accounting Policies (continued)
a. Financial Instrument Valuation (continued)
disposition of the investments. Due to the inherent uncertainty of valuations of such investments, the fair values may differ significantly from the values that would have been used had an active market existed. The VC employs various methods for calibrating these valuation approaches including a regular review of key inputs and assumptions, transactional back-testing or disposition analysis, and reviews of any related market activity.
Trading in securities on foreign securities stock exchanges and OTC markets may be completed before 4 p.m. Eastern time. In addition, trading in certain foreign markets may not take place on every Funds’ business day. Occasionally, events occur between the time at which trading in a foreign security is completed and 4 p.m. Eastern time that might call into question the reliability of the value of a portfolio security held by the Fund. As a result, differences may arise between the value of the Funds’ portfolio securities as determined at the foreign market close and the latest indications of value at 4 p.m. Eastern time. In order to minimize the potential for these differences, the VC monitors price movements following the close of trading in foreign stock markets through a series of country specific market proxies (such as baskets of American Depositary Receipts, futures contracts and exchange traded funds). These price movements are measured against established trigger thresholds for each specific market proxy to assist in determining if an event has occurred that may call into question the reliability of the values of the foreign securities held by the Funds. If such an event occurs, the securities may be valued using fair value procedures, which may include the use of independent pricing services.
When the last day of the reporting period is a non-business day, certain foreign markets may be open on those days that the Funds’ NAV is not calculated, which could result in differences between the value of the Funds’ portfolio securities on the last business day and the last calendar day of the reporting period. Any significant security valuation changes due to an open foreign market are adjusted and reflected by the Funds for financial reporting purposes.
b. Foreign Currency Translation
Portfolio securities and other assets and liabilities denominated in foreign currencies are translated into U.S. dollars based on the exchange rate of such currencies against U.S. dollars on the date of valuation. The Funds may enter into foreign currency exchange contracts to facilitate transactions denominated in a foreign currency. Purchases and sales of securities, income and expense items denominated in foreign currencies are translated into U.S. dollars at the exchange rate in effect on the transaction date. Portfolio securities and assets and liabilities denominated in foreign currencies contain risks that those currencies will decline in value relative to the U.S. dollar. Occasionally, events may impact the availability or reliability of foreign exchange rates used to convert the U.S. dollar equivalent value. If such an event occurs, the foreign exchange rate will be valued at fair value using procedures established and approved by the Board.
The Funds do not separately report the effect of changes in foreign exchange rates from changes in market prices on securities held. Such changes are included in net realized and unrealized gain or loss from investments in the Statements of Operations.
Realized foreign exchange gains or losses arise from sales of foreign currencies, currency gains or losses realized between the trade and settlement dates on securities transactions and the difference between the recorded amounts of dividends, interest, and foreign withholding taxes and the U.S. dollar equivalent of the amounts actually received or paid. Net unrealized foreign exchange gains and losses arise from changes in foreign exchange rates on foreign denominated assets and liabilities other than investments in securities held at the end of the reporting period.
c. Securities Purchased on a Delayed Delivery Basis
Certain or all Funds purchase securities on a delayed delivery basis, with payment and delivery scheduled for a future date. These transactions are subject to market fluctuations and are subject to the risk that the value at delivery may be more or less than the trade date purchase price. Although the Funds will generally purchase these securities with the intention of holding the securities, they may sell the securities before the settlement date. Sufficient assets have been segregated for these securities.
72 | Annual Report | franklintempleton.com | ||
FRANKLIN STRATEGIC SERIES
NOTES TO FINANCIAL STATEMENTS
d. Securities Lending
Certain or all Funds participate in an agency based securities lending program to earn additional income. The Fund receives cash collateral against the loaned securities in an amount equal to at least 102% of the fair value of the loaned securities. Collateral is maintained over the life of the loan in an amount not less than 100% of the fair value of loaned securities, as determined at the close of Fund business each day; any additional collateral required due to changes in security values is delivered to the Fund on the next business day. The collateral is deposited into a joint cash account with other funds and is used to invest in a money market fund managed by Franklin Advisers, Inc., an affiliate of the Funds, and/or uninvested cash as included in due from custodian in the Statements of Assets and Liabilities. The Fund may receive income from the investment of cash collateral, in addition to lending fees and rebates paid by the borrower. Income from securities loaned, net of fees paid to the securities lending agent and/or third-party vendor, is reported separately in the Statements of Operations. The Fund bears the market risk with respect to the collateral investment, securities loaned, and the risk that the agent may default on its obligations to the Fund. If the borrower defaults on its obligation to return the securities loaned, the Fund has the right to repurchase the securities in the open market using the collateral received. The securities lending agent has agreed to indemnify the Fund in the event of default by a third party borrower.
e. Income and Deferred Taxes
It is each Fund’s policy to qualify as a regulated investment company under the Internal Revenue Code. Each Fund intends to distribute to shareholders substantially all of its taxable income and net realized gains to relieve it from federal income and excise taxes. As a result, no provision for U.S. federal income taxes is required.
The Funds may be subject to foreign taxation related to income received, capital gains on the sale of securities and certain foreign currency transactions in the foreign jurisdictions in which the Funds invest. Foreign taxes, if any, are recorded based on the tax regulations and rates that exist in the foreign markets in which the Funds invest. When a capital gain tax is determined to apply, certain or all Funds record an estimated deferred tax liability in an amount that would be payable if the securities were disposed of on the valuation date.
Each Fund may recognize an income tax liability related to its uncertain tax positions under U.S. GAAP when the uncertain tax position has a less than 50% probability that it will be sustained upon examination by the tax authorities based on its technical merits. As of April 30, 2017, each Fund has determined that no tax liability is required in its financial statements related to uncertain tax positions for any open tax years (or expected to be taken in future tax years). Open tax years are those that remain subject to examination and are based on each tax jurisdiction’s statute of limitation.
f. Security Transactions, Investment Income, Expenses and Distributions
Security transactions are accounted for on trade date. Realized gains and losses on security transactions are determined on a specific identification basis. Interest income and estimated expenses are accrued daily. Dividend income is recorded on the ex-dividend date except for certain dividends from securities where the dividend rate is not available. In such cases, the dividend is recorded as soon as the information is received by the Funds. Distributions to shareholders are recorded on the ex-dividend date and are determined according to income tax regulations (tax basis). Distributable earnings determined on a tax basis may differ from earnings recorded in accordance with U.S. GAAP. These differences may be permanent or temporary. Permanent differences are reclassified among capital accounts to reflect their tax character. These reclassifications have no impact on net assets or the results of operations. Temporary differences are not reclassified, as they may reverse in subsequent periods.
Common expenses incurred by the Trust are allocated among the Funds based on the ratio of net assets of each Fund to the combined net assets of the Trust. Fund specific expenses are charged directly to the Fund that incurred the expense.
Realized and unrealized gains and losses and net investment income, not including class specific expenses, are allocated daily to each class of shares based upon the relative proportion of net assets of each class. Differences in per share distributions, by class, are generally due to differences in class specific expenses.
g. Accounting Estimates
The preparation of financial statements in accordance with U.S. GAAP requires management to make estimates and assumptions that affect the reported amounts of assets and
franklintempleton.com | Annual Report | 73 | ||
FRANKLIN STRATEGIC SERIES
NOTES TO FINANCIAL STATEMENTS
1. Organization and Significant Accounting
Policies (continued)
g. Accounting Estimates (continued)
liabilities at the date of the financial statements and the amounts of income and expenses during the reporting period. Actual results could differ from those estimates.
h. Guarantees and Indemnifications
Under the Trust’s organizational documents, its officers and trustees are indemnified by the Trust against certain liabilities arising out of the performance of their duties to the Trust.
Additionally, in the normal course of business, the Trust, on behalf of the Funds, enters into contracts with service providers that contain general indemnification clauses. The Trust’s maximum exposure under these arrangements is unknown as this would involve future claims that may be made against the Trust that have not yet occurred. Currently, the Trust expects the risk of loss to be remote.
2. Shares of Beneficial Interest
At April 30, 2017, there were an unlimited number of shares authorized (without par value). Transactions in the Funds’ shares were as follows:
| Franklin Focused Core | Franklin Growth | |||||||||||||||
| Equity Fund | Opportunities Fund | |||||||||||||||
|
| |||||||||||||||
| Shares | Amount | Shares | Amount | |||||||||||||
| ||||||||||||||||
Class A Shares: | ||||||||||||||||
Year ended April 30, 2017 | ||||||||||||||||
Shares sold | 766,686 | $ | 10,993,989 | 8,855,024 | $ | 285,856,595 | ||||||||||
Shares issued in reinvestment of distributions | — | — | 1,336,770 | 41,439,884 | ||||||||||||
Shares issued on reorganization (Note 9) | — | — | 55,853,813 | 1,797,934,327 | ||||||||||||
Shares redeemed | (3,313,236 | ) | (46,005,779 | ) | (18,813,942 | ) | (605,406,645) | |||||||||
|
| |||||||||||||||
Net increase (decrease) |
|
(2,546,550 |
) | $ | (35,011,790 | ) | 47,231,665 | $ | 1,519,824,161 | |||||||
|
| |||||||||||||||
Year ended April 30, 2016 | ||||||||||||||||
Shares sold | 5,194,472 | $ | 76,809,979 | 8,456,259 | $ | 274,758,449 | ||||||||||
Shares issued in reinvestment of distributions | 264,790 | 3,590,557 | 351,747 | 11,284,114 | ||||||||||||
Shares redeemed | (3,853,385 | ) | (52,792,892 | ) | (4,566,206 | ) | (143,563,964) | |||||||||
|
| |||||||||||||||
Net increase (decrease) |
|
1,605,877 |
| $ | 27,607,644 | 4,241,800 | $ | 142,478,599 | ||||||||
|
| |||||||||||||||
Class C Shares: | ||||||||||||||||
Year ended April 30, 2017 | ||||||||||||||||
Shares sold | 210,816 | $ | 2,860,457 | 905,877 | $ | 25,435,592 | ||||||||||
Shares issued in reinvestment of distributions | — | — | 320,376 | 8,618,123 | ||||||||||||
Shares issued on reorganization (Note 9) | — | — | 10,841,658 | 304,433,926 | ||||||||||||
Shares redeemed | (801,361 | ) | (10,550,017 | ) | (4,303,742 | ) | (119,905,800) | |||||||||
|
| |||||||||||||||
Net increase (decrease) |
|
(590,545 |
) | $ | (7,689,560 | ) | 7,764,169 | $ | 218,581,841 | |||||||
|
| |||||||||||||||
Year ended April 30, 2016 | ||||||||||||||||
Shares sold | 1,399,717 | $ | 19,891,883 | 2,651,152 | $ | 76,378,591 | ||||||||||
Shares issued in reinvestment of distributions | 57,646 | 751,703 | 113,685 | 3,199,097 | ||||||||||||
Shares redeemed | (734,079 | ) | (9,661,775 | ) | (1,354,189 | ) | (37,190,520) | |||||||||
|
| |||||||||||||||
Net increase (decrease) |
|
723,284 |
| $ | 10,981,811 | 1,410,648 | $ | 42,387,168 | ||||||||
|
| |||||||||||||||
74 | Annual Report | franklintempleton.com | ||
FRANKLIN STRATEGIC SERIES
NOTES TO FINANCIAL STATEMENTS
| Franklin Focused Core | Franklin Growth | |||||||||||||||
| Equity Fund | Opportunities Fund | |||||||||||||||
|
| |||||||||||||||
| Shares | Amount | Shares | Amount | |||||||||||||
| ||||||||||||||||
Class R Shares: | ||||||||||||||||
Year ended April 30, 2017 | ||||||||||||||||
Shares sold | 1,428 | $ | 19,514 | 11,331 | $ | 316,184 | ||||||||||
Shares issued in reinvestment of distributions | — | — | 35,650 | 1,065,216 | ||||||||||||
Shares issued on reorganization (Note 9) | — | — | 783,369 | 24,339,319 | ||||||||||||
Shares redeemed | (11,363 | ) | (149,525 | ) | (680,834 | ) | (21,080,705) | |||||||||
|
| |||||||||||||||
Net increase (decrease) |
|
(9,935 |
) | $ | (130,011 | ) | 149,516 | $ | 4,640,014 | |||||||
|
| |||||||||||||||
Year ended April 30, 2016 | ||||||||||||||||
Shares sold | 25,274 | $ | 366,702 | 367,541 | $ | 11,531,931 | ||||||||||
Shares issued in reinvestment of distributions | 706 | 9,480 | 29,367 | 910,971 | ||||||||||||
Shares redeemed | (16,124 | ) | (217,611 | ) | (545,651 | ) | (17,073,258) | |||||||||
|
| |||||||||||||||
Net increase (decrease) |
|
9,856 |
| $ | 158,571 | (148,743 | ) | $ | (4,630,356) | |||||||
|
| |||||||||||||||
Class R6 Shares: | ||||||||||||||||
Year ended April 30, 2017 | ||||||||||||||||
Shares sold | 403,349 | $ | 5,673,073 | 854,113 | $ | 29,053,360 | ||||||||||
Shares issued in reinvestment of distributions | — | — | 113,533 | 3,764,740 | ||||||||||||
Shares issued on reorganization (Note 9) | — | — | 5,075,827 | 174,304,065 | ||||||||||||
Shares redeemed | (1,616,859 | ) | (21,968,578 | ) | (5,495,669 | ) | (184,664,705) | |||||||||
|
| |||||||||||||||
Net increase (decrease) |
|
(1,213,510 |
) | $ | (16,295,505 | ) | 547,804 | $ | 22,457,460 | |||||||
|
| |||||||||||||||
Year ended April 30, 2016 | ||||||||||||||||
Shares sold | 1,219,631 | $ | 18,751,979 | 1,320,454 | $ | 42,825,228 | ||||||||||
Shares issued in reinvestment of distributions | 90,028 | 1,233,386 | 99,392 | 3,391,255 | ||||||||||||
Shares redeemed | (439,680 | ) | (5,879,147 | ) | (1,180,480 | ) | (39,015,055) | |||||||||
|
| |||||||||||||||
Net increase (decrease) |
|
869,979 |
| $ | 14,106,218 | 239,366 | $ | 7,201,428 | ||||||||
|
| |||||||||||||||
Advisor Class Shares: | ||||||||||||||||
Year ended April 30, 2017 | ||||||||||||||||
Shares sold | 870,779 | $ | 12,465,363 | 3,995,406 | $ | 136,490,569 | ||||||||||
Shares issued in reinvestment of distributions | — | — | 268,379 | 8,837,733 | ||||||||||||
Shares issued on reorganization (Note 9) | — | — | 9,066,575 | 309,442,413 | ||||||||||||
Shares redeemed | (831,228 | ) | (12,365,283 | ) | (6,779,384 | ) | (230,669,563) | |||||||||
|
| |||||||||||||||
Net increase (decrease) |
|
39,551 |
| $ | 100,080 | 6,550,976 | $ | 224,101,152 | ||||||||
|
| |||||||||||||||
Year ended April 30, 2016 | ||||||||||||||||
Shares sold | 433,979 | $ | 6,439,932 | 1,484,253 | $ | 49,836,416 | ||||||||||
Shares issued in reinvestment of distributions | 20,306 | 277,987 | 149,430 | 5,073,151 | ||||||||||||
Shares redeemed | (286,239 | ) | (4,052,189 | ) | (1,391,763 | ) | (46,712,491) | |||||||||
|
| |||||||||||||||
Net increase (decrease) |
|
168,046 |
| $ | 2,665,730 | 241,920 | $ | 8,197,076 | ||||||||
|
| |||||||||||||||
franklintempleton.com | Annual Report | 75 | ||
FRANKLIN STRATEGIC SERIES
NOTES TO FINANCIAL STATEMENTS
2. Shares of Beneficial Interest (continued)
| Franklin Small Cap | Franklin Small-Mid Cap | |||||||||||||||
| Growth Fund | Growth Fund | |||||||||||||||
|
| |||||||||||||||
| Shares | Amount | Shares | Amount | |||||||||||||
| ||||||||||||||||
Class A Shares: | ||||||||||||||||
Year ended April 30, 2017 | ||||||||||||||||
Shares sold | 4,458,478 | $ | 81,421,221 | 12,398,150 | $ | 412,209,497 | ||||||||||
Shares issued in reinvestment of distributions | — | — | 3,813,303 | 122,521,421 | ||||||||||||
Shares redeemed | (16,103,736 | ) | (292,386,477 | ) | (19,264,077 | ) | (639,300,979) | |||||||||
|
| |||||||||||||||
Net increase (decrease) | (11,645,258 | ) | $ | (210,965,256 | ) | (3,052,624 | ) | $ | (104,570,061) | |||||||
|
| |||||||||||||||
Year ended April 30, 2016 | ||||||||||||||||
Shares sold | 9,355,935 | $ | 164,566,603 | 12,907,569 | $ | 443,875,701 | ||||||||||
Shares issued in reinvestment of distributions | 1,032,714 | 17,618,102 | 5,680,738 | 183,487,832 | ||||||||||||
Shares redeemed | (23,836,334 | ) | (404,070,186 | ) | (14,552,480 | ) | (499,185,903) | |||||||||
|
| |||||||||||||||
Net increase (decrease) | (13,447,685 | ) | $ | (221,885,481 | ) | 4,035,827 | $ | 128,177,630 | ||||||||
|
| |||||||||||||||
Class C Shares: | ||||||||||||||||
Year ended April 30, 2017 | ||||||||||||||||
Shares sold | 428,443 | $ | 6,699,404 | 1,514,724 | $ | 38,005,629 | ||||||||||
Shares issued in reinvestment of distributions | — | — | 1,158,597 | 27,806,305 | ||||||||||||
Shares redeemed | (3,071,150 | ) | (47,311,726 | ) | (3,618,908 | ) | (91,011,006) | |||||||||
|
| |||||||||||||||
Net increase (decrease) | (2,642,707 | ) | $ | (40,612,322 | ) | (945,587 | ) | $ | (25,199,072) | |||||||
|
| |||||||||||||||
Year ended April 30, 2016 | ||||||||||||||||
Shares sold | 849,422 | $ | 12,859,934 | 2,150,607 | $ | 59,253,003 | ||||||||||
Shares issued in reinvestment of distributions | 266,930 | 3,923,876 | 1,699,234 | 42,175,007 | ||||||||||||
Shares redeemed | (3,707,026 | ) | (54,046,116 | ) | (3,139,510 | ) | (84,064,834) | |||||||||
|
| |||||||||||||||
Net increase (decrease) | (2,590,674 | ) | $ | (37,262,306 | ) | 710,331 | $ | 17,363,176 | ||||||||
|
| |||||||||||||||
Class R Shares: | ||||||||||||||||
Year ended April 30, 2017 | ||||||||||||||||
Shares sold | 925,913 | $ | 16,178,854 | 667,776 | $ | 20,604,680 | ||||||||||
Shares issued in reinvestment of distributions | — | — | 177,385 | 5,293,167 | ||||||||||||
Shares redeemed | (1,749,128 | ) | (30,313,111 | ) | (1,200,302 | ) | (37,094,722) | |||||||||
|
| |||||||||||||||
Net increase (decrease) | (823,215 | ) | $ | (14,134,257 | ) | (355,141 | ) | $ | (11,196,875) | |||||||
|
| |||||||||||||||
Year ended April 30, 2016 | ||||||||||||||||
Shares sold | 1,467,096 | $ | 24,818,077 | 970,177 | $ | 32,177,674 | ||||||||||
Shares issued in reinvestment of distributions | 110,763 | 1,813,185 | 271,520 | 8,205,344 | ||||||||||||
Shares redeemed | (1,590,105 | ) | (26,066,522 | ) | (987,525 | ) | (32,102,846) | |||||||||
|
| |||||||||||||||
Net increase (decrease) | (12,246 | ) | $ | 564,740 | 254,172 | $ | 8,280,172 | |||||||||
|
| |||||||||||||||
Class R6 Shares: | ||||||||||||||||
Year ended April 30, 2017 | ||||||||||||||||
Shares sold | 13,928,123 | $ | 275,768,482 | 3,167,526 | $ | 112,096,496 | ||||||||||
Shares issued in reinvestment of distributions | — | — | 337,444 | 11,820,661 | ||||||||||||
Shares redeemed | (21,481,423 | ) | (433,091,425 | ) | (4,607,797 | ) | (166,770,564) | |||||||||
|
| |||||||||||||||
Net increase (decrease) | (7,553,300 | ) | $ | (157,322,943 | ) | (1,102,827 | ) | $ | (42,853,407) | |||||||
|
| |||||||||||||||
Year ended April 30, 2016 | ||||||||||||||||
Shares sold | 16,170,895 | $ | 309,172,532 | 3,986,227 | $ | 144,238,638 | ||||||||||
Shares issued in reinvestment of distributions | 871,223 | 15,864,975 | 486,072 | 16,949,319 | ||||||||||||
Shares redeemed | (10,882,040 | ) | (200,406,687 | ) | (2,469,832 | ) | (86,002,445) | |||||||||
|
| |||||||||||||||
Net increase (decrease) | 6,160,078 | $ | 124,630,820 | 2,002,467 | $ | 75,185,512 | ||||||||||
|
| |||||||||||||||
76 | Annual Report | franklintempleton.com | ||
FRANKLIN STRATEGIC SERIES
NOTES TO FINANCIAL STATEMENTS
| Franklin Small Cap | Franklin Small-Mid Cap | |||||||||||||||
| Growth Fund | Growth Fund | |||||||||||||||
|
| |||||||||||||||
| Shares | Amount | Shares | Amount | |||||||||||||
| ||||||||||||||||
Advisor Class Shares: | ||||||||||||||||
Year ended April 30, 2017 | ||||||||||||||||
Shares sold | 9,430,468 | $ | 185,643,970 | 4,591,094 | $ | 165,044,336 | ||||||||||
Shares issued in reinvestment of distributions | — | — | 844,407 | 29,284,034 | ||||||||||||
Shares redeemed | (19,741,159 | ) | (379,614,709 | ) | (5,814,226 | ) | (208,855,881) | |||||||||
|
| |||||||||||||||
Net increase (decrease) | (10,310,691 | ) | $ | (193,970,739 | ) | (378,725 | ) | $ | (14,527,511) | |||||||
|
| |||||||||||||||
Year ended April 30, 2016 | ||||||||||||||||
Shares sold | 13,824,812 | $ | 254,897,448 | 2,777,179 | $ | 103,360,464 | ||||||||||
Shares issued in reinvestment of distributions | 890,640 | 16,138,402 | 1,300,049 | 45,007,699 | ||||||||||||
Shares redeemed | (19,867,945 | ) | (359,919,358 | ) | (5,295,143 | ) | (193,434,174) | |||||||||
|
| |||||||||||||||
Net increase (decrease) | (5,152,493 | ) | $ | (88,883,508 | ) | (1,217,915 | ) | $ | (45,066,011) | |||||||
|
| |||||||||||||||
3. Transactions with Affiliates
Franklin Resources, Inc. is the holding company for various subsidiaries that together are referred to as Franklin Templeton Investments. Certain officers and trustees of the Trust are also officers and/or directors of the following subsidiaries:
| Subsidiary | Affiliation | |
| Franklin Advisers, Inc. (Advisers) | Investment manager | |
| Franklin Templeton Services, LLC (FT Services) | Administrative manager | |
| Franklin Templeton Distributors, Inc. (Distributors) | Principal underwriter | |
| Franklin Templeton Investor Services, LLC (Investor Services) | Transfer agent |
a. Management Fees
Franklin Focused Core Equity Fund pays an investment management fee to Advisers based on the average daily net assets of the Fund as follows:
| Annualized Fee Rate | Net Assets | |
| 0.950% | Up to and including $500 million | |
| 0.850% | Over $500 million, up to and including $1 billion | |
| 0.800% | Over $1 billion, up to and including $1.5 billion | |
| 0.750% | Over $1.5 billion, up to and including $6.5 billion | |
| 0.725% | Over $6.5 billion, up to and including $11.5 billion | |
| 0.700% | Over $11.5 billion, up to and including $16.5 billion | |
| 0.690% | Over $16.5 billion, up to and including $19 billion | |
| 0.680% | Over $19 billion, up to and including $21.5 billion | |
| 0.670% | In excess of $21.5 billion |
franklintempleton.com | Annual Report | 77 | ||
FRANKLIN STRATEGIC SERIES
NOTES TO FINANCIAL STATEMENTS
3. Transactions with Affiliates (continued)
a. Management Fees (continued)
Franklin Growth Opportunities Fund pays an investment management fee to Advisers based on the average daily net assets of the Fund as follows:
| Annualized Fee Rate | Net Assets | |
| 0.700% | Up to and including $500 million | |
| 0.600% | Over $500 million, up to and including $1 billion | |
| 0.550% | Over $1 billion, up to and including $1.5 billion | |
| 0.500% | Over $1.5 billion, up to and including $6.5 billion | |
| 0.475% | Over $6.5 billion, up to and including $11.5 billion | |
| 0.450% | Over $11.5 billion, up to and including $16.5 billion | |
| 0.440% | Over $16.5 billion, up to and including $19 billion | |
| 0.430% | Over $19 billion, up to and including $21.5 billion | |
| 0.420% | In excess of $21.5 billion |
Franklin Small Cap Growth Fund pays an investment management fee to Advisers based on the average daily net assets of the Fund as follows:
| Annualized Fee Rate | Net Assets | |
| 0.750% | Up to and including $500 million | |
| 0.650% | Over $500 million, up to and including $1 billion | |
| 0.600% | Over $1 billion, up to and including $1.5 billion | |
| 0.550% | Over $1.5 billion, up to and including $6.5 billion | |
| 0.525% | Over $6.5 billion, up to and including $11.5 billion | |
| 0.500% | Over $11.5 billion, up to and including $16.5 billion | |
| 0.490% | Over $16.5 billion, up to and including $19 billion | |
| 0.480% | Over $19 billion, up to and including $21.5 billion | |
| 0.470% | In excess of $21.5 billion |
Franklin Small-Mid Cap Growth Fund pays an investment management fee to Advisers based on the average daily net assets of the Fund as follows:
| Annualized Fee Rate | Net Assets | |
| 0.625% | Up to and including $100 million | |
| 0.500% | Over $100 million, up to and including $250 million | |
| 0.450% | Over $250 million, up to and including $7.5 billion | |
| 0.440% | Over $7.5 billion, up to and including $10 billion | |
| 0.430% | Over $10 billion, up to and including $12.5 billion | |
| 0.420% | Over $12.5 billion, up to and including $15 billion | |
| 0.400% | In excess of $15 billion |
For the year ended April 30, 2017, each Fund’s effective investment management fee rate based on average daily net assets was as follows:
Franklin Focused Core Equity Fund | Franklin Growth Opportunities Fund | Franklin Small Cap Growth Fund | Franklin Small-Mid Cap Growth Fund | |||
0.950% | 0.564% | 0.613% | 0.457% |
78 | Annual Report | franklintempleton.com | ||
FRANKLIN STRATEGIC SERIES
NOTES TO FINANCIAL STATEMENTS
b. Administrative Fees
Under an agreement with Advisers, FT Services provides administrative services to the Funds. The fee is paid by Advisers based on each of the Funds’ average daily net assets, and is not an additional expense of the Funds.
c. Distribution Fees
The Board has adopted distribution plans for each share class, with the exception of Class R6 and Advisor Class shares, pursuant to Rule 12b-1 under the 1940 Act. Under the Funds’ Class A reimbursement distribution plans, the Funds reimburse Distributors for costs incurred in connection with the servicing, sale and distribution of each Fund’s shares up to the maximum annual plan rate. Under the Class A reimbursement distribution plans, costs exceeding the maximum for the current plan year cannot be reimbursed in subsequent periods. In addition, under the Funds’ Class C and R compensation distribution plans, the Funds pay Distributors for costs incurred in connection with the servicing, sale and distribution of each Fund’s shares up to the maximum annual plan rate for each class. The plan year, for purposes of monitoring compliance with the maximum annual plan rates, is February 1 through January 31 for each Fund.
The maximum annual plan rates, based on the average daily net assets, for each class, are as follows:
| Franklin Focused Core Equity Fund | Franklin Growth Opportunities Fund | Franklin Small Cap Growth Fund | Franklin Small-Mid Cap Growth Fund | |||||||||||||||||||||
Reimbursement Plans: | ||||||||||||||||||||||||
Class A | 0.35% | 0.35% | 0.35% | 0.25% | ||||||||||||||||||||
Compensation Plans: | ||||||||||||||||||||||||
Class C | 1.00% | 1.00% | 1.00% | 1.00% | ||||||||||||||||||||
Class R | 0.50% | 0.50% | 0.50% | 0.50% | ||||||||||||||||||||
For Franklin Focused Core Equity Fund, Franklin Growth Opportunities Fund and Franklin Small Cap Growth Fund the Board has set the current rate at 0.25% per year for Class A shares until further notice and approval by the Board.
d. Sales Charges/Underwriting Agreements
Front-end sales charges and contingent deferred sales charges (CDSC) do not represent expenses of the Funds. These charges are deducted from the proceeds of sales of fund shares prior to investment or from redemption proceeds prior to remittance, as applicable. Distributors has advised the Funds of the following commission transactions related to the sales and redemptions of the Funds’ shares for the year:
| Franklin Focused Core Equity Fund | Franklin Growth Opportunities Fund | Franklin Small Cap Growth Fund | Franklin Small-Mid Cap Growth Fund | |||||||||||||||||||||
Sales charges retained net of commissions paid to unaffiliated brokers/dealers | $21,774 | $310,784 | $41,839 | $671,606 | ||||||||||||||||||||
CDSC retained | $ 2,714 | $ 37,960 | $ 5,851 | $ 30,822 | ||||||||||||||||||||
e. Transfer Agent Fees
Each class of shares, except for Class R6, pays transfer agent fees to Investor Services for its performance of shareholder servicing obligations and reimburses Investor Services for out of pocket expenses incurred, including shareholder servicing fees paid to third parties. These fees are allocated daily based upon their relative proportion of such classes’ aggregate net assets. Class R6 pays Investor Services transfer agent fees specific to that class.
franklintempleton.com | Annual Report | 79 | ||
FRANKLIN STRATEGIC SERIES
NOTES TO FINANCIAL STATEMENTS
3. Transactions with Affiliates (continued)
e. Transfer Agent Fees (continued)
For the year ended April 30, 2017, the Funds paid transfer agent fees as noted in the Statements of Operations of which the following amounts were retained by Investor Services:
| Franklin | Franklin | Franklin | ||||||||||||||
| Focused Core | Franklin Growth | Small Cap | Small-Mid Cap | |||||||||||||
| Equity Fund | Opportunities Fund | Growth Fund | Growth Fund | |||||||||||||
Transfer agent fees | $104,444 | $3,007,912 | $1,731,988 | $3,531,887 | ||||||||||||
f. Investments in Affiliated Management Investment Companies
Certain or all Funds invest in one or more affiliated management investment companies for purposes other than exercising a controlling influence over the management or policies. Management fees paid by the Funds are waived on assets invested in the affiliated management investment companies, as noted in the Statements of Operations, in an amount not to exceed the management and administrative fees paid directly or indirectly by each affiliate. Prior to May 1, 2013, the waiver was accounted for as a reduction to management fees. During the year ended April 30, 2017, investments in affiliated management investment companies were as follows:
| Number of Shares Held at Beginning of Year | Gross Additions | Gross Reductions | Number of Shares Held at End of Year | Value at End of Year | Investment Income | Realized Gain (Loss) | %of Affiliated Fund Shares Outstanding Held at End of Year | |||||||||||||||||||||||||
Franklin Focused Core Equity Fund Non-Controlled Affiliates | ||||||||||||||||||||||||||||||||
Institutional Fiduciary Trust Money Market Portfolio, 0.37% | – | 45,428,162 | (43,352,425 | ) | 2,075,737 | $ 2,075,737 | $ 1,001 | $— | 0.0%a | |||||||||||||||||||||||
Franklin Growth Opportunities Fund Non-Controlled Affiliates | ||||||||||||||||||||||||||||||||
Institutional Fiduciary Trust Money Market Portfolio, 0.37% | 52,116,118 | 1,155,951,423 | (1,152,440,179 | ) | 55,627,362 | $ 55,627,362 | $23,166 | $— | 0.3% | |||||||||||||||||||||||
Franklin Small Cap Growth | ||||||||||||||||||||||||||||||||
Fund | ||||||||||||||||||||||||||||||||
Non-Controlled Affiliates | ||||||||||||||||||||||||||||||||
Institutional Fiduciary Trust Money Market Portfolio, 0.37% | 286,863,418 | 1,381,008,588 | (1,561,305,278 | ) | 106,566,728 | $106,566,728 | $66,600 | $— | 0.6% | |||||||||||||||||||||||
Franklin Small-Mid Cap | ||||||||||||||||||||||||||||||||
Growth Fund | ||||||||||||||||||||||||||||||||
Non-Controlled Affiliates | ||||||||||||||||||||||||||||||||
Institutional Fiduciary Trust Money Market Portfolio, 0.37% | 215,216,548 | 1,229,066,432 | (1,310,410,520 | ) | 133,872,460 | $133,872,460 | $64,711 | $— | 0.7% | |||||||||||||||||||||||
aRounds to less than 0.1% | ||||||||||||||||||||||||||||||||
80 | Annual Report | franklintempleton.com | ||
FRANKLIN STRATEGIC SERIES
NOTES TO FINANCIAL STATEMENTS
g. Waiver and Expense Reimbursements
Advisers and Investor Services contractually agreed in advance to waive or limit their respective fees and to assume as their own expense certain expenses otherwise payable by Franklin Focused Core Equity Fund so that the expenses (excluding distribution fees, and acquired fund fees and expenses) for Class A, Class C, Class R and Advisor Class of the Fund does not exceed 1.00% and Class R6 does not exceed 0.84% based on the average net assets of each class (other than certain non-routine expenses or costs, including those relating to litigation, indemnification, reorganizations, and liquidations) until August 31, 2017. Total expenses waived or paid are not subject to recapture subsequent to the Funds’ fiscal year end.
Additionally, Investor Services has contractually agreed in advance to waive or limit its fees so that the Class R6 transfer agent fees for the Funds, except Franklin Focused Core Equity Fund, do not exceed 0.01% until August 31, 2017. There were no Class R6 transfer agent fees waived during the year ended April 30, 2017.
Effective August 27, 2016, Advisers has contractually agreed to waive or limit its fees so that the management fees paid by Franklin Growth Opportunities Fund do not exceed an annual rate of 0.46% of the fund’s average daily net assets through August 31, 2017.
h. Other Affiliated Transactions
At April 30, 2017, one or more of the funds in Franklin Fund Allocator Series owned a percentage of the Funds’ outstanding shares as follows:
| Franklin | Franklin Growth | Franklin | ||
| Focused Core | Opportunities | Small Cap | ||
| Equity Fund | Fund | Growth Fund | ||
15.18% | 5.67% | 2.14% |
4. Expense Offset Arrangement
The Funds have entered into an arrangement with their custodian whereby credits realized as a result of uninvested cash balances are used to reduce a portion of the Funds’ custodian expenses. During the year ended April 30, 2017, the custodian fees were reduced as noted in the Statements of Operations.
5. Income Taxes
For tax purposes, capital losses may be carried over to offset future capital gains, if any. At April 30, 2017, the capital loss carryforwards were as follows:
| Franklin | Franklin | |||||||
| Focused Core | Small Cap | |||||||
| Equity Fund | Growth Fund | |||||||
Capital loss carryforwards: | ||||||||
Short term | $5,899,323 | $38,560,351 | ||||||
Long term. | 2,295,643 | 47,722,757 | ||||||
|
| |||||||
Total capital loss carryforwards | $8,194,966 | $86,283,108 | ||||||
|
| |||||||
During the year ended April 30, 2017, Franklin Growth Opportunities Fund utilized $12,966,224, of capital loss carryforwards.
For tax purposes, the Funds may elect to defer any portion of a late-year ordinary loss to the first day of the following fiscal year. At April 30, 2017, deferred late-year ordinary losses were as follows:
| Franklin | ||||||||||||||||
| Focused Core | Franklin Growth | Franklin Small Cap | Franklin Small-Mid | |||||||||||||
| Equity Fund | Opportunities Fund | Growth Fund | Cap Growth Fund | |||||||||||||
Late-year ordinary losses | $57,895 | $3,796,709 | $4,025,448 | $2,048,836 | ||||||||||||
franklintempleton.com | Annual Report | 81 | ||
FRANKLIN STRATEGIC SERIES
NOTES TO FINANCIAL STATEMENTS
5. Income Taxes (continued)
The tax character of distributions paid during the years ended April 30, 2017 and 2016, was as follows:
| Franklin Focused Core Equity Fund | Franklin Growth Opportunities Fund | Franklin Small Cap Growth Fund | ||||||||||||||||||||||
| 2017 | 2016 | 2017 | 2016 | 2017 | 2016 | |||||||||||||||||||
Distributions paid from: | ||||||||||||||||||||||||
Ordinary income | $ | — | $ | 2,114,090 | $ | — | $ | — | $ | — | $ | 31,688,531 | ||||||||||||
Long term capital gain | — | 3,857,211 | 68,905,311 | 25,773,152 | — | 28,081,216 | ||||||||||||||||||
| $ | — | $ | 5,971,301 | $ | 68,905,311 | $ | 25,773,152 | $ | — | $ | 59,769,747 | |||||||||||||
Franklin Small-Mid Cap Growth Fund | ||||||||
| 2017 | 2016 | |||||||
Distributions paid from: | ||||||||
Ordinary income | $ | 15,010,212 | $ | — | ||||
Long term capital gain | 200,510,460 | 327,658,868 | ||||||
| $ | 215,520,672 | $ | 327,658,868 | |||||
At April 30, 2017, the cost of investments, net unrealized appreciation (depreciation) and undistributed long term capital gains for income tax purposes were as follows:
| Franklin | Franklin | Franklin | ||||||||||||||
| Focused Core | Franklin Growth | Small Cap | Small-Mid Cap | |||||||||||||
| Equity Fund | Opportunities Fund | Growth Fund | Growth Fund | |||||||||||||
Cost of investments | $109,687,739 | $2,120,464,428 | $2,150,887,834 | $2,620,418,980 | ||||||||||||
Unrealized appreciation | $ 26,585,878 | $1,460,488,901 | $ 715,035,547 | $1,047,897,676 | ||||||||||||
Unrealized depreciation | (4,441,152) | (21,110,861) | (188,105,524 | ) | (86,095,846 | ) | ||||||||||
Net unrealized appreciation (depreciation) | $ 22,144,726 | $1,439,378,040 | $ 526,930,023 | $ 961,801,830 | ||||||||||||
Distributable earnings - undistributed long term capital gains | $ — | $ 182,301,352 | $ — | $ 97,357,632 | ||||||||||||
Differences between income and/or capital gains as determined on a book basis and a tax basis are primarily due to differing treatments of wash sales.
Franklin Growth Opportunities Fund utilized a tax accounting practice to treat a portion of the proceeds from capital shares redeemed as distribution from realized capital gains.
6. Investment Transactions
Purchases and sales of investments (excluding short term securities) for the year ended April 30, 2017, were as follows:
| Franklin | Franklin | Franklin | ||||||||||||||
| Focused Core | Franklin Growth | Small Cap | Small-Mid Cap | |||||||||||||
| Equity Fund | Opportunities Fund | Growth Fund | Growth Fund | |||||||||||||
Purchases | $24,745,127 | $1,337,023,812 | $ 805,180,635 | $1,200,889,609 | ||||||||||||
Sales | $87,734,734 | $2,011,734,710 | $ 1,418,179,057 | $1,662,491,220 | ||||||||||||
82 | Annual Report | franklintempleton.com | ||
FRANKLIN STRATEGIC SERIES
NOTES TO FINANCIAL STATEMENTS
At April 30, 2017, in connection with securities lending transactions, certain or all Funds loaned investments and received cash collateral as follows:
| Equity Investmentsa | ||||
Securities lending transactionsb: | ||||
Franklin Growth Opportunities Fund | $16,552,325 | |||
Franklin Small Cap Growth Fund. | $63,620,175 | |||
Franklin Small-Mid Cap Growth Fund | $ 8,804,175 | |||
aThe gross amount of recognized liability for such transactions is included in payable upon return of securities loaned in the Statements of Assets and Liabilities.
bThe agreements can be terminated at any time.
7. Restricted Securities
Certain or all Funds invest in securities that are restricted under the Securities Act of 1933 (1933 Act) or which are subject to legal, contractual, or other agreed upon restrictions on resale. Restricted securities are often purchased in private placement transactions, and cannot be sold without prior registration unless the sale is pursuant to an exemption under the 1933 Act. Disposal of these securities may require greater effort and expense, and prompt sale at an acceptable price may be difficult. The Funds may have registration rights for restricted securities. The issuer generally incurs all registration costs.
At April 30, 2017, investments in restricted securities, excluding certain securities exempt from registration under the 1933 Act deemed to be liquid, were as follows:
| Principal Amount/ Shares | Issuer | Acquisition Date | Cost | Value | ||||||||||
Franklin Growth Opportunities Fund | ||||||||||||||
35,601,435 | Acerta Pharma BV | 5/06/15 | $ | 2,048,084 | $ | 1,377,989 | ||||||||
2,362,202 | Proterra Inc., pfd., 5, 144A | 9/21/16 - 1/13/17 | 11,896,616 | 11,896,616 | ||||||||||
805,800 | Tanium Inc., pfd., G | 9/14/15 | 4,000,233 | 3,996,768 | ||||||||||
| Total Restricted Securities (Value is 0.5% of Net Assets) | $ | 17,944,933 | $ | 17,271,373 | ||||||||||
Franklin Small Cap Growth Fund | ||||||||||||||
825,201 | DraftKings Inc., pfd., D | 8/07/15 | $ | 4,444,444 | $ | 3,261,689 | ||||||||
2,029,318 | DraftKings Inc., pfd., D-1 | 8/07/15 | 15,555,553 | 11,411,464 | ||||||||||
4,179,808 | DraftKings Inc., pfd., E | 12/23/15 - 7/20/16 | 6,533,232 | 4,406,620 | ||||||||||
1,787,047 | Proterra Inc., pfd., 5, 144A | 9/21/16 -1/13/17 | 8,999,998 | 8,999,998 | ||||||||||
1,542,673 | Smule Inc., pfd., G, 144A | 5/31/16 | 11,099,995 | 13,122,593 | ||||||||||
352,675 | Smule Inc., pfd., H | 4/27/17 | 2,999,995 | 2,999,995 | ||||||||||
| Total Restricted Securities (Value is 1.7% of Net Assets) | $ | 49,633,217 | $ | 44,202,359 | ||||||||||
Franklin Small-Mid Cap Growth Fund | ||||||||||||||
660,161 | DraftKings Inc., pfd., D | 8/07/15 | $ | 3,555,556 | $ | 2,609,352 | ||||||||
1,623,455 | DraftKings Inc., pfd., D-1 | 8/07/15 | 12,444,447 | 9,129,175 | ||||||||||
3,388,624 | DraftKings Inc., pfd., E | 12/23/15 | 5,287,513 | 3,572,503 | ||||||||||
1,416,913 | Proterra Inc., pfd., 5, 144A | 9/21/16 | 7,135,914 | 7,135,914 | ||||||||||
| Total Restricted Securities (Value is 0.6% of Net Assets) | $ | 28,423,430 | $ | 22,446,944 | ||||||||||
franklintempleton.com | Annual Report | 83 | ||
FRANKLIN STRATEGIC SERIES
NOTES TO FINANCIAL STATEMENTS
8. Holdings of 5% Voting Securities of Portfolio Companies
The 1940 Act defines “affiliated companies” to include investments in portfolio companies in which a fund owns 5% or more of the outstanding voting securities. During the year ended April 30, 2017, investments in “affiliated companies” were as follows:
| Name of Issuer | Number of Shares Held at Beginning of Year | Gross Additions | Gross Reductions | Number of Shares Held at End of Year | Value at End of Year | Investment Income | Realized Gain (Loss) | |||||||||||||||||||
Franklin Small Cap Growth Fund | ||||||||||||||||||||||||||
Non-Controlled Affiliates | ||||||||||||||||||||||||||
2U Inc. | 2,955,523 | 431,100 | (1,875,771 | ) | 1,510,852 | $ | — | a | $— | $ | 24,082,847 | |||||||||||||||
Aratana Therapeutics Inc. | 2,697,019 | — | — | 2,697,019 | 16,721,518 | — | — | |||||||||||||||||||
The KeyW Holding Corp. | 3,851,460 | 903,500 | (1,748,078 | ) | 3,006,882 | 28,535,310 | — | (3,239,759 | ) | |||||||||||||||||
Lattice Semiconductor Corp. | 6,466,700 | — | (1,332,500 | ) | 5,134,200 | — | a | — | 732,130 | |||||||||||||||||
M/I Homes Inc. | 1,385,700 | — | (370,724 | ) | 1,014,976 | — | a | — | 597,865 | |||||||||||||||||
Nanometrics Inc. | 1,610,800 | — | (994,600 | ) | 616,200 | — | a | — | 8,820,067 | |||||||||||||||||
Pfenex Inc. | 1,175,631 | — | — | 1,175,631 | 5,654,785 | — | — | |||||||||||||||||||
The Spectranetics Corp. | 2,276,600 | — | (869,400 | ) | 1,407,200 | — | a | — | (4,111,859 | ) | ||||||||||||||||
Sportsman’s Warehouse Holdings Inc. | 2,972,800 | 971,900 | — | 3,944,700 | 16,133,823 | — | — | |||||||||||||||||||
US Ecology Inc. | 1,119,090 | — | (180,400 | ) | 938,690 | — | a | — | (274,399 | ) | ||||||||||||||||
Total Affiliated Securities (Value is 2.6% of Net Assets) | $ | 67,045,436 | $— | $ | 26,606,892 | |||||||||||||||||||||
aAs of April 30, 2017, no longer an affiliate.
9. Reorganization
On August 26, 2016, Franklin Growth Opportunities Fund (Surviving Fund), pursuant to a plan of reorganization approved on August 5, 2016 by shareholders of Franklin Flex Cap Growth Fund (Acquired Fund), acquired 100% of the Acquired Fund’s net assets, primarily made up of investment securities, which included $1,013,454,475 of unrealized appreciation, through a tax-free exchange of 81,621,242 shares of the Surviving Fund (valued at $2,610,454,049). Immediately after the completion of the reorganization, the combined net assets of the Surviving Fund were $3,936,549,167.
The primary purpose for the reorganization was to combine the Acquired Fund with a fund that has identical investment goals and generally similar principal investment strategies and principal investment risk, better historical investment performance, both on a total return basis and a risk-adjusted basis, and more favorable sales prospects. The estimated cost of the reorganization was $797,000, of which the Surviving Fund and the Acquired Fund each paid 25% and Advisers paid 50%. The allocated portion of the Surviving Fund’s reorganization expenses are included with other expenses in the Statement of Operations.
Assuming the reorganization had been completed on May 1, 2016, the Fund’s pro forma results of operations, would have been as follows:
| Period | Net Investment Income (Loss) | Net Realized and Unrealized Gain (Loss) | Net Increase (Decrease) in Net Assets from Operations | |||||||||
For the period May 1, 2016 through April 30, 2017 | $(11,383,914) | $575,079,130 | $563,695,216 | |||||||||
Subsequent to the reorganization, the Surviving Fund has been managed as a single entity. Accordingly, it is impracticable to identify the amounts of investment income and net investment income attributable to the Acquired Fund’s assets after the completion of the reorganization.
84 | Annual Report | franklintempleton.com | ||
FRANKLIN STRATEGIC SERIES
NOTES TO FINANCIAL STATEMENTS
10. Credit Facility
The Funds, together with other U.S. registered and foreign investment funds (collectively, Borrowers), managed by Franklin Templeton Investments, are borrowers in a joint syndicated senior unsecured credit facility totaling $2 billion (Global Credit Facility) which matures on February 9, 2018. This Global Credit Facility provides a source of funds to the Borrowers for temporary and emergency purposes, including the ability to meet future unanticipated or unusually large redemption requests.
Under the terms of the Global Credit Facility, the Funds shall, in addition to interest charged on any borrowings made by the Funds and other costs incurred by the Funds, pay their share of fees and expenses incurred in connection with the implementation and maintenance of the Global Credit Facility, based upon their relative share of the aggregate net assets of all of the Borrowers, including an annual commitment fee of 0.15% based upon the unused portion of the Global Credit Facility. These fees are reflected in other expenses in the Statements of Operations. During the period ended April 30, 2017, the Funds did not use the Global Credit Facility.
11. Fair Value Measurements
The Funds follow a fair value hierarchy that distinguishes between market data obtained from independent sources (observable inputs) and the Funds’ own market assumptions (unobservable inputs). These inputs are used in determining the value of the Funds’ financial instruments and are summarized in the following fair value hierarchy:
| • | Level 1 – quoted prices in active markets for identical financial instruments |
| • | Level 2 – other significant observable inputs (including quoted prices for similar financial instruments, interest rates, prepayment speed, credit risk, etc.) |
| • | Level 3 – significant unobservable inputs (including the Funds’ own assumptions in determining the fair value of financial instruments) |
The input levels are not necessarily an indication of the risk or liquidity associated with financial instruments at that level.
For movements between the levels within the fair value hierarchy, the Funds have adopted a policy of recognizing the transfers as of the date of the underlying event which caused the movement.
A summary of inputs used as of April 30, 2017, in valuing the Funds’ assets carried at fair value, is as follows:
| Level 1 | Level 2 | Level 3 | Total | |||||||||||||
Franklin Focused Core Equity Fund | ||||||||||||||||
Assets: | ||||||||||||||||
Investments in Securities: | ||||||||||||||||
Equity Investmentsa | $ | 129,756,728 | $ | — | $ | — | $ | 129,756,728 | ||||||||
Short Term Investments | 2,075,737 | — | — | 2,075,737 | ||||||||||||
Total Investments in Securities | $ | 131,832,465 | $ | — | $ | — | $ | 131,832,465 | ||||||||
Franklin Growth Opportunities Fund | ||||||||||||||||
Assets: | ||||||||||||||||
Investments in Securities: | ||||||||||||||||
Equity Investments:b | ||||||||||||||||
Consumer Discretionary | $ | 522,452,218 | $ | — | $ | 11,896,616 | $ | 534,348,834 | ||||||||
Health Care | 508,401,098 | — | 1,377,989 | 509,779,087 | ||||||||||||
Information Technology | 1,462,067,270 | — | 3,996,768 | 1,466,064,038 | ||||||||||||
All Other Equity Investmentsa | 994,023,147 | — | — | 994,023,147 | ||||||||||||
Short Term Investments | 55,627,362 | — | — | 55,627,362 | ||||||||||||
Total Investments in Securities | $ | 3,542,571,095 | $ | — | $ | 17,271,373 | $ | 3,559,842,468 | ||||||||
Receivables: | ||||||||||||||||
Investment Securities Sold | $ | — | $ | — | $ | 3,028,181 | $ | 3,028,181 | ||||||||
franklintempleton.com | Annual Report | 85 | ||
FRANKLIN STRATEGIC SERIES
NOTES TO FINANCIAL STATEMENTS
11. Fair Value Measurements (continued)
| Level 1 | Level 2 | Level 3 | Total | |||||||||||||
Franklin Small Cap Growth Fund | ||||||||||||||||
Assets: | ||||||||||||||||
Investments in Securities: | ||||||||||||||||
Equity Investments:b | ||||||||||||||||
Consumer Discretionary | $ | 395,951,831 | $ | — | $ | 28,079,771 | $ | 424,031,602 | ||||||||
Information Technology | 763,465,659 | — | 16,122,588 | 779,588,247 | ||||||||||||
All Other Equity Investmentsa | 1,367,631,280 | — | — | 1,367,631,280 | ||||||||||||
Short Term Investments | 106,566,728 | — | — | 106,566,728 | ||||||||||||
Total Investments in Securities | $ | 2,633,615,498 | $ | — | $ | 44,202,359 | $ | 2,677,817,857 | ||||||||
Franklin Small-Mid Cap Growth Fund | ||||||||||||||||
Assets: | ||||||||||||||||
Investments in Securities: | ||||||||||||||||
Equity Investments:b | ||||||||||||||||
Consumer Discretionary | $ | 644,848,588 | $ | — | $ | 22,446,944 | $ | 667,295,532 | ||||||||
All Other Equity Investmentsa | 2,781,052,818 | — | — | 2,781,052,818 | ||||||||||||
Short Term Investments | 133,872,460 | — | — | 133,872,460 | ||||||||||||
Total Investments in Securities | $ | 3,559,773,866 | $ | — | $ | 22,446,944 | $ | 3,582,220,810 | ||||||||
aFor detailed categories, see the accompanying Statement of Investments.
bIncludes common and preferred stocks.
A reconciliation of assets in which Level 3 inputs are used in determining fair value is presented when there are significant Level 3 financial instruments at the end of the year. At April 30, 2017, the reconciliation of assets are as follows:
| Net Change in | ||||||||||||||||||||||||||||||||||||||||
| Unrealized | ||||||||||||||||||||||||||||||||||||||||
| Appreciation | ||||||||||||||||||||||||||||||||||||||||
| Net | Net | (Depreciation) | ||||||||||||||||||||||||||||||||||||||
| Balance at | Transfer | Transfer | Realized | Unrealized | Balance | on Assets | ||||||||||||||||||||||||||||||||||
| Beginning of | Into | Out of | Cost Basis | Gain | Appreciation | at End | Held at | |||||||||||||||||||||||||||||||||
| Year | Purchases | Sales | Level 3a | Level 3b | Adjustments | (Loss) | (Depreciation) | of Year | Year End | |||||||||||||||||||||||||||||||
Franklin Small Cap Growth Fund | ||||||||||||||||||||||||||||||||||||||||
Assets: | ||||||||||||||||||||||||||||||||||||||||
Investments in Securities: | ||||||||||||||||||||||||||||||||||||||||
Equity Investments:c | ||||||||||||||||||||||||||||||||||||||||
Consumer Discretionary | $10,761,537 | $ 8,999,998 | $— | $9,092,042 | $ — | $— | $— | $ (773,806 | ) | $28,079,771 | $ (773,806 | ) | ||||||||||||||||||||||||||||
Information Technology | — | 14,099,990 | — | — | — | — | — | 2,022,598 | 16,122,588 | 2,022,598 | ||||||||||||||||||||||||||||||
Convertible Bonds | 9,726,750 | 1,200,000 | — | — | (8,758,810 | ) | — | — | (2,167,940 | ) | — | — | ||||||||||||||||||||||||||||
Total | $20,488,287 | $24,299,988 | $— | $9,092,042 | $(8,758,810 | ) | $— | $— | $ (919,148 | ) | $44,202,359 | $1,248,792 | ||||||||||||||||||||||||||||
aThe investment was transferred into Level 3 as a result of the unavailability of a quoted market price in an active market for identical securities. May include amounts related to a corporate action.
bThe investment was transferred out of Level 3 as a result of the availability of a quoted price in an active market for identical securities. May include amounts related to a corporate action.
cIncludes preferred stocks.
86 | Annual Report | franklintempleton.com | ||
FRANKLIN STRATEGIC SERIES
NOTES TO FINANCIAL STATEMENTS
Significant unobservable valuation inputs developed by the VC for material Level 3 financial instruments and impact to fair value as a result of changes in unobservable valuation inputs as of April 30, 2017, are as follows:
| Description | Fair Value at End of Year | Valuation Technique | Unobservable Input | Amount | Impact to Fair Value if Input Increasesa | |||||||||||||
Franklin Small Cap Growth Fund | ||||||||||||||||||
Assets: | ||||||||||||||||||
Investments in Securities: | ||||||||||||||||||
Equity Investments:b | ||||||||||||||||||
Consumer Discretionary | $19,079,773 | Market Approach | Enterprise Value | $775 (mil) - $1,000 (mil) | Increase | c | ||||||||||||
| Merger Probability | 50.0% | Increase | ||||||||||||||||
| Market Comparables | Discount for lack of marketability | 10.6%-25.0% | Decrease | c | ||||||||||||||
All Other Investmentsd | 25,122,586 | |||||||||||||||||
Total | $44,202,359 | |||||||||||||||||
aRepresents the directional change in the fair value of the Level 3 financial instruments that would result from a significant and reasonable increase in the corresponding input. A significant and reasonable decrease in the input would have the opposite effect. Significant impacts, if any, to fair value and/or net assets have been indicated.
bIncludes preferred stocks.
cRepresents a significant impact to fair value and net assets.
dIncludes financial instruments with values derived using prior transaction prices or third party pricing information without adjustment for which such inputs are also unobservable. May also include fair value of immaterial financial instruments developed using various valuation techniques and unobservable inputs.
12. Investment Company Reporting Modernization
In October 2016, the U.S. Securities and Exchange Commission adopted new rules and amended existing rules (together, final rules) intended to modernize the reporting and disclosure of information by registered investment companies. In part, the final rules amend Regulation S-X and require standardized, enhanced disclosures about derivatives in investment company financial statements, as well as other amendments. The compliance date for the amendments to Regulation S-X is August 1, 2017. Management is currently evaluating the impact that the adoption of the amendments to Regulation S-X will have on the Funds’ financial statements and related disclosures.
13. Subsequent Events
The Funds have evaluated subsequent events through the issuance of the financial statements and determined that no events have occurred that require disclosure.
Abbreviations
Selected Portfolio
ADR American Depositary Receipt
franklintempleton.com | Annual Report | 87 | ||
FRANKLIN STRATEGIC SERIES
Report of Independent Registered Public Accounting Firm
To the Board of Trustees of Franklin Strategic Series and Shareholders of the Franklin Focused Core Equity Fund, Franklin Growth Opportunities Fund, Franklin Small Cap Growth Fund, and Franklin Small-Mid Cap Growth Fund:
In our opinion, the accompanying statements of assets and liabilities, including the statements of investments, and the related statements of operations and of changes in net assets and the financial highlights present fairly, in all material respects, the financial position of the Franklin Focused Core Equity Fund, Franklin Growth Opportunities Fund, Franklin Small Cap Growth Fund, and Franklin Small-Mid Cap Growth Fund (the “Funds”) as of April 30, 2017, the results of each of their operations for the year then ended, the changes in each of their net assets for each of the two years in the period then ended and the financial highlights for each of the periods indicated, in conformity with accounting principles generally accepted in the United States of America. These financial statements and financial highlights (hereafter referred to as “financial statements”) are the responsibility of the Fund’s management. Our responsibility is to express an opinion on these financial statements based on our audits. We conducted our audits of these financial statements in accordance with the standards of the Public Company Accounting Oversight Board (United States). Those standards require that we plan and perform the audit to obtain reasonable assurance about whether the financial statements are free of material misstatement. An audit includes examining, on a test basis, evidence supporting the amounts and disclosures in the financial statements, assessing the accounting principles used and significant estimates made by management, and evaluating the overall financial statement presentation. We believe that our audits, which included confirmation of securities as of April 30, 2017 by correspondence with the custodian, transfer agent, and brokers, provide a reasonable basis for our opinion.
PricewaterhouseCoopers LLP
San Francisco, California
June 20, 2017
88 | Annual Report | franklintempleton.com | ||
FRANKLIN STRATEGIC SERIES
Under Section 852(b)(3)(C) of the Internal Revenue Code (Code), the Funds hereby report the maximum amount allowable but no less than the following amounts as long term capital gain dividends for the fiscal year ended April 30, 2017:
Franklin Growth Opportunities Fund | Franklin Small-Mid Cap | |||||
|
| |||||
|
$70,410,336 |
|
|
$200,510,460 |
| |
Under Section 871(k)(2)(C) of the Code, the Funds hereby report the maximum amount allowable but no less than the following amounts as short term capital gain dividends for purposes of the tax imposed under Section 871(a)(1)(A) of the Code for the fiscal year ended April 30, 2017:
Franklin Small-Mid Cap Growth Fund | ||
|
| |
|
$15,010,212 |
|
Under Section 854(b)(1)(A) of the Code, the Funds hereby report the following percentage amounts of the ordinary income dividends as income qualifying for the dividends received deduction for the fiscal year ended April 30, 2017:
Franklin Small-Mid Cap Growth Fund | ||
|
| |
|
100% |
|
Under Section 854(b)(1)(B) of the Code, the Funds hereby report the maximum amount allowable but no less than the following amounts as qualified dividends for purposes of the maximum rate under Section 1(h)(11) of the Code for the fiscal year ended April 30, 2017:
Franklin Focused Core Equity Fund | Franklin Growth Opportunities Fund | Franklin Small Cap Growth Fund | Franklin Small-Mid Cap Growth Fund | |||||||||
| ||||||||||||
$1,499,729 | $15,023,766 | $8,316,794 | $19,059,289 | |||||||||
Distributions, including qualified dividend income, paid during calendar year 2017 will be reported to shareholders on Form 1099-DIV by mid-February 2018. Shareholders are advised to check with their tax advisors for information on the treatment of these amounts on their individual income tax returns.
franklintempleton.com | Annual Report | 89 | ||
FRANKLIN STRATEGIC SERIES
The name, year of birth and address of the officers and board members, as well as their affiliations, positions held with the Trust, principal occupations during at least the past five years and number of U.S. registered portfolios overseen in the Franklin Templeton Investments fund complex, are shown below. Generally, each board member serves until that person’s successor is elected and qualified.
Independent Board Members
Name, Year of Birth and Address
| Position
| Length of Time Served
| Number of Portfolios in
| Other Directorships Held
| ||||
| ||||||||
Harris J. Ashton (1932) One Franklin Parkway San Mateo, CA 94403-1906 | Trustee | Since 1991 | 142 | Bar-S Foods (meat packing company) (1981-2010). | ||||
| Principal Occupation During at Least the Past 5 Years: | ||||||||
Director of various companies; and formerly, Director, RBC Holdings, Inc. (bank holding company) (until 2002); and President, Chief Executive Officer and Chairman of the Board, General Host Corporation (nursery and craft centers) (until 1998).
| ||||||||
| ||||||||
Mary C. Choksi (1950) One Franklin Parkway San Mateo, CA 94403-1906 | Trustee | Since 2014 | 136 | Avis Budget Group Inc. (car rental) (2007-present), Omnicom Group Inc. (advertising and marketing communications services) (2011-present) and H.J. Heinz Company (processed foods and allied products) (1998-2006) | ||||
| Principal Occupation During at Least the Past 5 Years: | ||||||||
Senior Advisor, Strategic Investment Group (investment management group) (2015-present); director of various companies; and formerly, Founding Partner and Senior Managing Director, Strategic Investment Group (1987–2015); Founding Partner and Managing Director, Emerging Markets Management LLC (investment management firm) (1987-2011); and Loan Officer/Senior Loan Officer/Senior Pension Investment Officer, World Bank Group (international financial institution) (1977-1987).
| ||||||||
| ||||||||
Edith E. Holiday (1952) One Franklin Parkway San Mateo, CA 94403-1906 | Trustee | Since 1998 | 142 | Hess Corporation (exploration and refining of oil and gas) (1993-present), Canadian National Railway (railroad) (2001-present), White Mountains Insurance Group, Ltd. (holding company) (2004-present), Santander Consumer USA Holdings, Inc. (consumer finance) (2016-present), RTI International Metals, Inc. (manufacture and distribution of titanium) (1999-2015) and H.J. Heinz Company (processed foods and allied products) (1994-2013). | ||||
| Principal Occupation During at Least the Past 5 Years: | ||||||||
Director or Trustee of various companies and trusts; and formerly, Assistant to the President of the United States and Secretary of the Cabinet (1990-1993); General Counsel to the United States Treasury Department (1989-1990); and Counselor to the Secretary and Assistant Secretary for Public Affairs and Public Liaison – United States Treasury Department (1988-1989).
| ||||||||
| ||||||||
J. Michael Luttig (1954) One Franklin Parkway San Mateo, CA 94403-1906 | Trustee | Since 2009 | 142 | Boeing Capital Corporation (aircraft financing) (2006-2013). | ||||
| Principal Occupation During at Least the Past 5 Years: | ||||||||
Executive Vice President, General Counsel and member of the Executive Council, The Boeing Company (aerospace company)(2006-present);and formerly, Federal Appeals Court Judge, U.S. Court of Appeals for the Fourth Circuit (1991-2006).
| ||||||||
| ||||||||
90 | Annual Report | franklintempleton.com | ||
FRANKLIN STRATEGIC SERIES
Independent Board Members (continued)
Name, Year of Birth and Address
| Position
| Length of Time Served
| Number of Portfolios in
| Other Directorships Held
| ||||
| ||||||||
Larry D. Thompson (1945) One Franklin Parkway San Mateo, CA 94403-1906 | Trustee | Since 2007 | 142 | The Southern Company (energy company) (2014-present; previously 2010-2012), Graham Holdings Company (education and media organization) (2011-present) and Cbeyond, Inc. (business communications provider) (2010-2012). | ||||
| Principal Occupation During at Least the Past 5 Years: | ||||||||
Director of various companies; John A. Sibley Professor of Corporate and Business Law, University of Georgia School of Law (2015-present;previously 2011-2012); and formerly, Executive Vice President – Government Affairs, General Counsel and Corporate Secretary, PepsiCo, Inc. (consumer products) (2012-2014); Senior Vice President – Government Affairs, General Counsel and Secretary, PepsiCo, Inc. (2004-2011); Senior Fellow of The Brookings Institution (2003-2004); Visiting Professor, University of Georgia School of Law (2004); and Deputy Attorney General, U.S. Department of Justice (2001-2003).
| ||||||||
| ||||||||
John B. Wilson (1959) One Franklin Parkway San Mateo, CA 94403-1906 | Lead Independent Trustee | Trustee since 2006 and Lead Independent Trustee since 2008 | 116 | None | ||||
| Principal Occupation During at Least the Past 5 Years: | ||||||||
President, Staples Europe (office supplies) (2012-present); President and Founder, Hyannis Port Capital, Inc. (real estate and private equity investing); serves on private and non-profit boards; and formerly, Chief Operating Officer and Executive Vice President, Gap, Inc. (retail) (1996-2000); Chief Financial Officer and Executive Vice President – Finance and Strategy, Staples, Inc. (1992-1996); Senior Vice President – Corporate Planning, Northwest Airlines, Inc. (airlines) (1990-1992); and Vice President and Partner, Bain & Company (consulting firm) (1986-1990).
| ||||||||
| ||||||||
Interested Board Members and Officers
| ||||||||
Name, Year of Birth and Address
| Position
| Length of Time Served
| Number of Portfolios in
| Other Directorships Held
| ||||
| ||||||||
**Gregory E. Johnson (1961) One Franklin Parkway San Mateo, CA 94403-1906 | Trustee | Since 2013 | 158 | None | ||||
| Principal Occupation During at Least the Past 5 Years: | ||||||||
Chairman of the Board, Member - Office of the Chairman, Director and Chief Executive Officer, Franklin Resources, Inc.; officer and/or director or trustee, as the case may be, of some of the other subsidiaries of Franklin Resources, Inc. and of 44 of the investment companies in Franklin Templeton Investments; Vice Chairman, Investment Company Institute; and formerly, President, Franklin Resources, Inc. (1994-2015).
| ||||||||
| ||||||||
**Rupert H. Johnson, Jr. (1940) One Franklin Parkway San Mateo, CA 94403-1906 | Chairman of the Board and Trustee | Chairman of the Board since 2013 and Trustee since 1991 | 142 | None | ||||
| Principal Occupation During at Least the Past 5 Years: | ||||||||
Vice Chairman, Member – Office of the Chairman and Director, Franklin Resources, Inc.; Director, Franklin Advisers, Inc.; Senior Vice President, Franklin Advisory Services, LLC; and officer and/or director or trustee, as the case may be, of some of the other subsidiaries of Franklin Resources, Inc. and of 42 of the investment companies in Franklin Templeton Investments.
| ||||||||
| ||||||||
Alison E. Baur (1964) One Franklin Parkway San Mateo, CA 94403-1906 | Vice President | Since 2012 | Not Applicable | Not Applicable | ||||
| Principal Occupation During at Least the Past 5 Years: | ||||||||
Deputy General Counsel, Franklin Templeton Investments; and officer of some of the other subsidiaries of Franklin Resources, Inc. and of 45 of the investment companies in Franklin Templeton Investments.
| ||||||||
| ||||||||
franklintempleton.com | Annual Report | 91 | ||
FRANKLIN STRATEGIC SERIES
Interested Board Members and Officers (continued)
Name, Year of Birth and Address
| Position
| Length of Time Served
| Number of Portfolios in
| Other Directorships Held
| ||||
| ||||||||
Laura F. Fergerson (1962) One Franklin Parkway San Mateo, CA 94403-1906 | Chief Executive Officer – Finance and Administration | Since 2009 | Not Applicable | Not Applicable | ||||
| Principal Occupation During at Least the Past 5 Years: | ||||||||
Senior Vice President, Franklin Templeton Services, LLC; Vice President, Franklin Advisers, Inc. and Franklin Templeton Institutional, LLC; and officer of 45 of the investment companies in Franklin Templeton Investments.
| ||||||||
| ||||||||
Gaston Gardey (1967) One Franklin Parkway San Mateo, CA 94403-1906 | Treasurer, Chief Financial Officer and Chief Accounting Officer | Since 2009 | Not Applicable | Not Applicable | ||||
| Principal Occupation During at Least the Past 5 Years: | ||||||||
Treasurer, U.S. Fund Administration & Reporting, Franklin Templeton Investments; and officer of 27 of the investment companies in Franklin Templeton Investments.
| ||||||||
| ||||||||
Aliya S. Gordon (1973) One Franklin Parkway San Mateo, CA 94403-1906 | Vice President | Since 2009 | Not Applicable | Not Applicable | ||||
| Principal Occupation During at Least the Past 5 Years: | ||||||||
Senior Associate General Counsel, Franklin Templeton Investments; and officer of 45 of the investment companies in Franklin Templeton Investments.
| ||||||||
| ||||||||
Steven J. Gray (1955) One Franklin Parkway San Mateo, CA 94403-1906 | Vice President | Since 2009 | Not Applicable | Not Applicable | ||||
| Principal Occupation During at Least the Past 5 Years: | ||||||||
Senior Associate General Counsel, Franklin Templeton Investments; Vice President, Franklin Templeton Distributors, Inc.; and officer of 45 of the investment companies in Franklin Templeton Investments.
| ||||||||
| ||||||||
Edward B. Jamieson (1948) One Franklin Parkway San Mateo, CA 94403-1906 | President and Chief Executive Officer – Investment Management | Since 2010 | Not Applicable | Not Applicable | ||||
| Principal Occupation During at Least the Past 5 Years: | ||||||||
President and Director, Franklin Advisers, Inc.; Executive Vice President, Franklin Templeton Institutional, LLC; and officer and/or trustee, as the case may be, of some of the other subsidiaries of Franklin Resources, Inc. and of 10 of the investment companies in Franklin Templeton Investments.
| ||||||||
| ||||||||
Robert Lim (1948) One Franklin Parkway San Mateo, CA 94403-1906 | Vice President – AML Compliance | Since 2016 | Not Applicable | Not Applicable | ||||
| Principal Occupation During at Least the Past 5 Years: | ||||||||
Vice President, Franklin Templeton Companies, LLC; Chief Compliance Officer, Franklin Templeton Distributors, Inc. and Franklin Templeton Investor Services, LLC; and officer of 45 of the investment companies in Franklin Templeton Investments.
| ||||||||
| ||||||||
Christopher J. Molumphy (1962) One Franklin Parkway San Mateo, CA 94403-1906 | Vice President | Since 2000 | Not Applicable | Not Applicable | ||||
| Principal Occupation During at Least the Past 5 Years: | ||||||||
Director and Executive Vice President, Franklin Advisers, Inc.; Executive Vice President, Franklin Templeton Institutional, LLC; and officer of some of the other subsidiaries of Franklin Resources, Inc. and of 22 of the investment companies in Franklin Templeton Investments.
| ||||||||
| ||||||||
92 | Annual Report | franklintempleton.com | ||
FRANKLIN STRATEGIC SERIES
Interested Board Members and Officers (continued)
Name, Year of Birth and Address
| Position
| Length of Time Served
| Number of Portfolios in
| Other Directorships Held
| ||||
| ||||||||
Kimberly H. Novotny (1972) 300 S.E. 2nd Street Fort Lauderdale, FL 33301-1923 | Vice President | Since 2013 | Not Applicable | Not Applicable | ||||
| Principal Occupation During at Least the Past 5 Years: | ||||||||
Associate General Counsel, Franklin Templeton Investments; Vice President and Corporate Secretary, Fiduciary Trust International of the South; Vice President, Templeton Investment Counsel, LLC; Assistant Secretary, Franklin Resources, Inc.; and officer of 45 of the investment companies in Franklin Templeton Investments.
| ||||||||
| ||||||||
Robert C. Rosselot (1960) 300 S.E. 2nd Street Fort Lauderdale, FL 33301-1923 | Chief Compliance Officer | Since 2013 | Not Applicable | Not Applicable | ||||
| Principal Occupation During at Least the Past 5 Years: | ||||||||
Director, Global Compliance, Franklin Templeton Investments; Vice President, Franklin Templeton Companies, LLC; officer of 45 of the investment companies in Franklin Templeton Investments; and formerly, Senior Associate General Counsel, Franklin Templeton Investments (2007-2013); and Secretary and Vice President, Templeton Group of Funds (2004-2013).
| ||||||||
| ||||||||
Karen L. Skidmore (1952) One Franklin Parkway San Mateo, CA 94403-1906 | Vice President and Secretary | Since 2006 | Not Applicable | Not Applicable | ||||
| Principal Occupation During at Least the Past 5 Years: | ||||||||
Senior Associate General Counsel, Franklin Templeton Investments; and officer of 45 of the investment companies in Franklin Templeton Investments.
| ||||||||
| ||||||||
Navid J. Tofigh (1972) One Franklin Parkway San Mateo, CA 94403-1906 | Vice President | Since 2015 | Not Applicable | Not Applicable | ||||
| Principal Occupation During at Least the Past 5 Years: | ||||||||
Associate General Counsel, Franklin Templeton Investments; and officer of 45 of the investment companies in Franklin Templeton Investments.
| ||||||||
| ||||||||
Craig S. Tyle (1960) One Franklin Parkway San Mateo, CA 94403-1906 | Vice President | Since 2005 | Not Applicable | Not Applicable | ||||
| Principal Occupation During at Least the Past 5 Years: | ||||||||
General Counsel and Executive Vice President, Franklin Resources, Inc.; and officer of some of the other subsidiaries of Franklin Resources, Inc. and of 45 of the investment companies in Franklin Templeton Investments.
| ||||||||
| ||||||||
Lori A. Weber (1964) 300 S.E. 2nd Street Fort Lauderdale, FL 33301-1923 | Vice President | Since 2011 | Not Applicable | Not Applicable | ||||
| Principal Occupation During at Least the Past 5 Years: | ||||||||
Senior Associate General Counsel, Franklin Templeton Investments; Assistant Secretary, Franklin Resources, Inc.; Vice President and Secretary, Templeton Investment Counsel, LLC; and officer of 45 of the investment companies in Franklin Templeton Investments.
| ||||||||
| ||||||||
*We base the number of portfolios on each separate series of the U.S. registered investment companies within the Franklin Templeton Investments fund complex. These portfolios have a common investment manager or affiliated investment managers.
**Gregory E. Johnson is considered to be an interested person of the Fund under the federal securities laws due to his position as an officer and director of Franklin Resources, Inc. (Resources), which is the parent company of the Fund’s investment manager and distributor. Rupert H. Johnson, Jr. is considered to be an interested person of the Fund under the federal securities laws due to his position as officer and director and major shareholder of Resources.
Note 1: Rupert H. Johnson, Jr. is the uncle of Gregory E. Johnson.
Note 2: Officer information is current as of the date of this report. It is possible that after this date, information about officers may change.
Note 3; Effective November 1, 2016, Frank Olson ceased to be a trustee of the trust.
The Sarbanes-Oxley Act of 2002 and Rules adopted by the Securities and Exchange Commission require the Fund to disclose whether the Fund’s Audit Committee includes at least one member who is an audit committee financial expert within the meaning of such Act and Rules. The Fund’s Board has determined that there is at least one such financial expert on the Audit Committee and has designated John B. Wilson as its audit committee financial expert. The Board believes that Mr. Wilson qualifies as such an expert in view of his extensive business background and experience, including service as chief financial officer of Staples, Inc. from 1992 to 1996. Mr. Wilson has been a Member and Chairman of the Fund’s Audit Committee since 2006. As a result of such background and
franklintempleton.com | Annual Report | 93 | ||
FRANKLIN STRATEGIC SERIES
Interested Board Members and Officers (continued)
experience, the Board believes that Mr. Wilson has acquired an understanding of generally accepted accounting principles and financial statements, the general application of such principles in connection with the accounting estimates, accruals and reserves, and analyzing and evaluating financial statements that present a breadth and level of complexity of accounting issues generally comparable to those of the Fund, as well as an understanding of internal controls and procedures for financial reporting and an understanding of audit committee functions. Mr. Wilson is an independent Board member as that term is defined under the relevant Securities and Exchange Commission Rules and Releases.
The Statement of Additional Information (SAI) includes additional information about the board members and is available, without charge, upon request. Shareholders may call (800) DIAL BEN/342-5236 to request the SAI.
94 | Annual Report | franklintempleton.com | ||
FRANKLIN STRATEGIC SERIES
Board Approval of Investment Management Agreements
FRANKLIN STRATEGIC SERIES
Franklin Focused Core Equity Fund
Franklin Growth Opportunities Fund
Franklin Small Cap Growth Fund
Franklin Small-Mid Cap Growth Fund
(each a Fund)
At an in-person meeting held on April 18, 2017 (Meeting), the Board of Trustees (Board) of Franklin Strategic Series, including a majority of the trustees who are not “interested persons” as defined in the Investment Company Act of 1940 (Independent Trustees), reviewed and approved the continuance of the investment management agreement between Franklin Advisers, Inc. (Manager) and each Fund (each a Management Agreement) for an additional one-year period. The Independent Trustees received advice from and met separately with Independent Trustee counsel in considering whether to approve the continuation of each Management Agreement. Although the Management Agreements for the Funds were considered at the same Board meeting, the Board considered the information provided to it about the Funds together and with respect to each Fund separately as the Board deemed appropriate.
In considering the continuation of each Management Agreement, the Board reviewed and considered information provided by the Manager at the Meeting and throughout the year at meetings of the Board and its committees. The Board also reviewed and considered information provided in response to a detailed set of requests for information submitted to the Manager by Independent Trustee counsel on behalf of the Independent Trustees in connection with the annual contract renewal process. In addition, prior to the Meeting, the Independent Trustees held a telephonic contract renewal meeting at which the Independent Trustees conferred amongst themselves and Independent Trustee counsel about contract renewal matters. The Board reviewed and considered all of the factors it deemed relevant in approving the continuance of each Management Agreement, including, but not limited to: (i) the nature, extent, and quality of the services provided by the Manager; (ii) the investment performance of each Fund; (iii) the costs of the services provided and profits realized by the Manager and its affiliates from the relationship with each Fund; (iv) the extent to which economies of scale are realized as each Fund grows; and (v) whether fee levels reflect these economies of scale for the benefit of Fund investors.
In approving the continuance of each Management Agreement, the Board, including a majority of the Independent Trustees, determined that the existing management fees are fair and reasonable and that the continuance of such Management Agreement is in the interests of the applicable Fund and its shareholders. While attention was given to all information furnished, the following discusses some primary factors relevant to the Board’s determination.
Nature, Extent and Quality of Services
The Board reviewed and considered information regarding the nature, extent and quality of investment management services provided by the Manager and its affiliates to the Funds and their shareholders. This information included, among other things, the qualifications, background and experience of the senior management and investment personnel of the Manager; the structure of investment personnel compensation; oversight of third-party service providers; investment performance reports and related financial information for each Fund; reports on expenses, shareholder services, marketing support payments made to financial intermediaries and third party servicing arrangements; legal and compliance matters; risk controls; pricing and other services provided by the Manager and its affiliates; and management fees charged by the Manager and its affiliates to U.S. funds and other accounts, including management’s explanation of differences among accounts where relevant. The Board noted management’s continual efforts and expenditures in establishing effective business continuity plans and developing strategies to address areas of heightened concern in the mutual fund industry, such as cybersecurity, derivatives and liquidity risk management.
The Board also reviewed and considered the benefits provided to Fund shareholders of investing in a fund that is part of the Franklin Templeton family of funds. The Board noted the financial position of Franklin Resources, Inc. (FRI), the Manager’s parent, and its commitment to the mutual fund business as evidenced by its continued introduction of new funds, reassessment of the fund offerings in response to the market environment and project initiatives and capital investments relating to the services provided to the Funds by the Franklin Templeton Investments (FTI) organization.
Following consideration of such information, the Board was satisfied with the nature, extent and quality of services provided by the Manager and its affiliates to the Funds and their shareholders.
franklintempleton.com | Annual Report | 95 | ||
FRANKLIN STRATEGIC SERIES
SHAREHOLDER INFORMATION
Fund Performance
The Board reviewed and considered the performance results of
each Fund over various time periods ended January 31, 2017. The Board considered the performance returns for each Fund in comparison to the performance returns of mutual funds deemed comparable to the Fund included in a universe (Performance Universe) selected by Broadridge Financial Solutions, Inc. (Broadridge), an independent provider of investment company data. The Board received a description of the methodology used by Broadridge to select the mutual funds included in a Performance Universe. The Board also reviewed and considered Fund performance reports provided and discussions that occurred with portfolio managers at Board meetings throughout the year. A summary of each Fund’s performance results is below.
Franklin Focused Core Equity Fund - The Performance Universe for this Fund included the Fund and all retail and institutional multi-cap core funds. The Fund has been in operation for less than 10 years. The Board noted that the Fund’s annualized total return for the one-, three- and five-year periods was below the median of its Performance Universe. The Board concluded that the Fund’s performance was acceptable. In doing so, the Board noted management’s explanation that underperformance over the one-and three-year periods was primarily related to a small number of holdings in this concentrated strategy. In particular, management explained that two holdings within the pharmaceutical industry detracted from the Fund’s returns and that the investment team eliminated one of the holdings and retained the other based on its view of relative attractiveness. Management further explained that such industry in general was a poor performing sector due to concerns over drug pricing and the role of specialty pharmacies. The Board also noted management’s explanation that underperformance over the five-year period was due to several portfolio holdings that were holdovers from the former investment team, all of which have been eliminated by the current investment team. The Board further noted that the investment team continues to believe in its focus on intrinsic value, bottom-up fundamental research and a patient/opportunistic approach. In addition, the Board noted that the Fund’s annualized total return for each period was positive and for the one-year period, while below the median, exceeded 17.9%.
Franklin Growth Opportunities Fund - The Performance Universe for this Fund included the Fund and all retail and institutional multi-cap growth funds. The Board noted that the Fund’s annualized total return for the one-, three- and five-year periods was below the median of its Performance Universe, but for the 10-year period was above the median of its Performance
Universe. The Board concluded that the Fund’s performance was acceptable. In doing so, the Board noted management’s explanation that over the one-year performance period value and cyclical equities outperformed growth equities, which broadly weighed on Fund performance. The Board also noted management’s further explanation that the Fund’s underweight position in the industrial sector additionally detracted from performance as cyclical industries performed well following the presidential election in November 2016. The Board further noted that management explained that the magnitude of underperformance in the one-year time period contributed to a significant portion of the three- and five-year fund underperformance. In addition, the Board noted that the Fund’s annualized total return for the one- and five-year periods, while below the median, each exceeded 11%.
Franklin Small Cap Growth Fund - The Performance Universe for this Fund included the Fund and all retail and institutional small-cap growth funds. The Board noted that the Fund’s annualized total return for the one-, five- and 10-year periods was above the median of its Performance Universe, but for the three-year period was below the median of its Performance Universe. The Board concluded that the Fund’s performance was satisfactory. In doing so, the Board noted that the Fund is currently closed to new investors, except for certain types of investors. The Board also noted that effective on or about April 28, 2017, the Fund will reopen Class R6 shares to new investors who are eligible to purchase Class R6 shares.
Franklin Small-Mid Cap Growth Fund - The Performance Universe for this Fund included the Fund and all retail and institutional mid-cap growth funds. The Board noted that the Fund’s annualized total return for the one-, three-, five- and 10-year periods was below the median of its Performance Universe. The Board concluded that the Fund’s performance was acceptable and that it would continue to closely monitor such performance. In doing so, the Board noted management’s explanation that the Fund’s positioning in the health care sector was a primary detractor from benchmark relative performance over the one-, three-, and five-year periods, particularly as a result of recent pricing pressure and public scrutiny on drug price increases for several holdings within the pharmaceutical industry. The Board also noted management’s explanation that avoiding certain benchmark holdings with high valuations also contributed to underperformance, as those companies ultimately performed better than expected. The Board further noted that the Fund’s annualized total return for each period, while below the median, was positive and for the one-year period exceeded 19%.
96 | Annual Report | franklintempleton.com | ||
FRANKLIN STRATEGIC SERIES
SHAREHOLDER INFORMATION
Comparative Fees and Expenses
The Board reviewed and considered information regarding each Fund’s actual total expense ratio and its various components, including, as applicable, management fees; transfer agent expenses; underlying fund expenses; Rule 12b-1 and non-Rule 12b-1 service fees; and other non-management fees. The Board also noted that at its February meeting each year, it receives an annual report on all marketing support payments made by FTI to financial intermediaries. The Board considered the actual total expense ratio and, separately, the contractual management fee rate, without the effect of fee waivers, if any (Management Rate) of each Fund in comparison to the median ratio and median Management Rate, respectively, of other mutual funds deemed comparable to and with a similar expense structure as the Fund selected by Broadridge (Expense Group). Broadridge fee and expense data is based upon information taken from each fund’s most recent annual report, which reflects historical asset levels that may be quite different from those currently existing, particularly in a period of market volatility. While recognizing such inherent limitation and the fact that expense ratios and Management Rates generally increase as assets decline and decrease as assets grow, the Board believed the independent analysis conducted by Broadridge to be an appropriate measure of comparative fees and expenses. The Broadridge Management Rate includes administrative charges, and the actual total expense ratio, for comparative consistency, was shown for Class A shares for funds with multiple classes of shares. The Board received a description of the methodology used by Broadridge to select the mutual funds included in an Expense Group.
Franklin Focused Core Equity Fund - The Expense Group for this Fund included the Fund and 12 other multi-cap core funds. The Board noted that the Management Rate for this Fund was above the median of its Expense Group, but its actual total expense ratio was equal to the median of its Expense Group. The Board concluded that the Management Rate charged to the Fund is fair and reasonable. In doing so, the Board noted management’s explanation that the Fund’s assets under management are small relative to a broader group of peers; at $139 million in assets under management as of December 31, 2016, the Fund has not yet achieved the benefits of scale to meet the next breakpoint in its investment manager fee schedule. The Board also noted that the Fund’s actual total expense ratio reflected a fee waiver from management.
Franklin Growth Opportunities Fund, Franklin Small Cap Growth Fund, and Franklin Small-Mid Cap Growth Fund - The Expense Group for the Franklin Growth Opportunities
Fund included the Fund and 15 other multi-cap growth funds. The Expense Group for the Franklin Small Cap Growth Fund included the Fund and 14 other small-cap growth funds. The Expense Group for the Franklin Small-Mid Cap Growth Fund included the Fund and 14 other mid-cap growth funds. The Board noted that the Management Rates and actual total expense ratios for these Funds were below the medians of their respective Expense Groups. The Board concluded that the Management Rates charged to these Funds are fair and reasonable. In doing so, the Board noted that the Franklin Growth Opportunities Fund’s actual total expense ratio reflected a fee waiver from management.
Profitability
The Board reviewed and considered information regarding the profits realized by the Manager and its affiliates in connection with the operation of each Fund. In this respect, the Board considered the Fund profitability analysis provided by the Manager that addresses the overall profitability of FTI’s U.S. fund business, as well as its profits in providing investment management and other services to each of the individual funds during the 12-month period ended September 30, 2016, being the most recent fiscal year-end for FRI. The Board noted that although management continually makes refinements to its methodologies used in calculating profitability in response to organizational and product-related changes, the overall methodology has remained consistent with that used in the Funds’ profitability report presentations from prior years. Additionally, the Funds’ independent registered public accounting firm has been engaged by the Manager to periodically review the reasonableness of the allocation methodologies to be used solely by the Funds’ Board with respect to the profitability analysis.
The Board noted management’s belief that costs incurred in establishing the infrastructure necessary for the type of mutual fund operations conducted by the Manager and its affiliates may not be fully reflected in the expenses allocated to each Fund in determining its profitability, as well as the fact that the level of profits, to a certain extent, reflected operational cost savings and efficiencies initiated by management. The Board also noted management’s expenditures in improving shareholder services provided to the Funds, as well as the need to implement systems and meet additional regulatory and compliance requirements resulting from recent SEC and other regulatory requirements.
franklintempleton.com | Annual Report | 97 | ||
FRANKLIN STRATEGIC SERIES
SHAREHOLDER INFORMATION
The Board also considered the extent to which the Manager and its affiliates might derive ancillary benefits from fund operations, including revenues generated from transfer agent services, potential benefits resulting from personnel and systems enhancements necessitated by fund growth, as well as increased leverage with service providers and counterparties. Based upon its consideration of all these factors, the Board concluded that the level of profits realized by the Manager and its affiliates from providing services to each Fund was not excessive in view of the nature, quality and extent of services provided to each Fund.
Economies of Scale
The Board reviewed and considered the extent to which the Manager may realize economies of scale, if any, as each Fund grows larger and whether the Fund’s management fee structure reflects any economies of scale for the benefit of shareholders. With respect to possible economies of scale, the Board noted the existence of management fee breakpoints, which operate generally to share any economies of scale with a Fund’s shareholders by reducing the Fund’s effective management fees as the Fund grows in size. The Board considered the Manager’s view that any analyses of potential economies of scale in managing a particular fund are inherently limited in light of the joint and common costs and investments the Manager incurs across the Franklin Templeton family of funds as a whole. The Board concluded that to the extent economies of scale may be realized by the Manager and its affiliates, each Fund’s management fee structure provided a sharing of benefits with the Fund and its shareholders as the Fund grows.
Conclusion
Based on its review, consideration and evaluation of all factors it believed relevant, including the above-described factors and conclusions, the Board unanimously approved the continuation of each Management Agreement for an additional one-year period.
Proxy Voting Policies and Procedures
The Trust’s investment manager has established Proxy Voting Policies and Procedures (Policies) that the Trust uses to determine how to vote proxies relating to portfolio securities. Shareholders may view the Trust’s complete Policies online at franklintempleton.com. Alternatively, shareholders may request copies of the Policies free of charge by calling the Proxy Group collect at (954) 527-7678 or by sending a written request to: Franklin Templeton Companies, LLC, 300 S.E. 2nd Street, Fort Lauderdale, FL 33301, Attention: Proxy Group. Copies of the Trust’s proxy voting records are also made available online at franklintempleton.com and posted on the U.S. Securities and
Exchange Commission’s website at sec.gov and reflect the most recent 12-month period ended June 30.
Quarterly Statement of Investments
The Trust files a complete statement of investments with the U.S. Securities and Exchange Commission for the first and third quarters for each fiscal year on Form N-Q. Shareholders may view the filed Form N-Q by visiting the Commission’s website at sec.gov. The filed form may also be viewed and copied at the Commission’s Public Reference Room in Washington, DC. Information regarding the operations of the Public Reference Room may be obtained by calling (800) SEC-0330.
Householding of Reports and Prospectuses
You will receive each Fund’s financial reports every six months as well as an annual updated summary prospectus (prospectus available upon request). To reduce Fund expenses, we try to identify related shareholders in a household and send only one copy of the financial reports and summary prospectus. This process, called “householding,” will continue indefinitely unless you instruct us otherwise. If you prefer not to have these documents householded, please call us at (800) 632-2301. At any time you may view current prospectuses/summary prospectuses and financial reports on our website. If you choose, you may receive these documents through electronic delivery.
98 | Annual Report | franklintempleton.com | ||
This page intentionally left blank.
This page intentionally left blank.
 | Annual Report and Shareholder Letter | |
| Franklin Strategic Series | ||
Investment Manager | ||
| Franklin Advisers, Inc. | ||
Distributor | ||
| Franklin Templeton Distributors, Inc. | ||
| (800) DIAL BEN® / 342-5236 | ||
| franklintempleton.com | ||
Shareholder Services | ||
| (800) 632-2301 |
Authorized for distribution only when accompanied or preceded by a summary prospectus and/or prospectus. Investors should carefully consider a fund’s investment goals, risks, charges and expenses before investing. A prospectus contains this and other information; please read it carefully before investing.
To help ensure we provide you with quality service, all calls to and from our service areas are monitored and/or recorded.
© 2017 Franklin Templeton Investments. All rights reserved. | FSS1 A 06/17 | |||||
Franklin Templeton Investments
Gain From Our Perspective®
At Franklin Templeton Investments, we’re dedicated to one goal: delivering exceptional asset management for our clients. By bringing together multiple, world-class investment teams in a single firm, we’re able to offer specialized expertise across styles and asset classes, all supported by the strength and resources of one of the world’s largest asset managers. This has helped us to become a trusted partner to individual and institutional investors across the globe.
Dear Shareholder:
During the 12 months ended April 30, 2017, mostly upbeat economic data, improved U.S. corporate earnings and supportive monetary policies were positives for the securities markets. After maintaining its target interest rate in the 0.25%–0.50% range for nearly a year, the U.S. Federal Reserve increased its target range for the federal funds rate twice, in December 2016 and March 2017, to 0.75%–1.00%, noting improved employment and hints of higher inflation. The 10-year U.S. Treasury yield began the period at 1.83% and ended the period at 2.29%. In this environment, U.S. stocks, as measured by the Standard & Poor’s 500® Index, generated a +17.92% total return for the 12-month period.1
In all economic environments, we are committed to our long-term perspective and disciplined investment approach as we conduct a diligent, fundamental analysis of securities with a regular emphasis on investment risk management.
We believe active, professional investment management serves investors well. We also recognize the important role of financial advisors in today’s markets and encourage investors to continue to seek their advice. Amid changing markets and economic conditions, we are confident investors with a well-diversified portfolio and a patient, long-term outlook should be well positioned for the years ahead.
In addition, Franklin Strategic Series’ annual report includes more detail about prevailing conditions and a discussion about investment decisions during the period. Please remember all securities markets fluctuate, as do mutual fund share prices.
We thank you for investing with Franklin Templeton, welcome your questions and comments, and look forward to serving your future investment needs.
Sincerely,

Edward B. Jamieson
President and Chief Executive Officer –
Investment Management
Franklin Strategic Series
This letter reflects our analysis and opinions as of April 30, 2017, unless otherwise indicated. The information is not a complete analysis of every aspect of any market, country, industry, security or fund. Statements of fact are from sources considered reliable.
1. Source: Morningstar
See www.franklintempletondatasources.com for additional data provider information.
| Not FDIC Insured | May Lose Value | No Bank Guarantee |
franklintempleton.com | Not part of the annual report | 1 | ||
| ||||
| 3 | ||||
| 4 | ||||
| 10 | ||||
| 18 | ||||
| 33 | ||||
| 37 | ||||
| 50 | ||||
| 51 | ||||
| 52 | ||||
| 57 | ||||
Visit franklintempleton.com for fund updates, to access your account, or to find helpful financial planning tools.
2 | Annual Report | franklintempleton.com | ||
The U.S. economy expanded during the 12 months under review. The economy strengthened in 2016’s second and third quarters, but moderated in the next two quarters, largely due to declines in private inventory investment and government spending. The manufacturing sector generally expanded and the services sector also continued to grow. The unemployment rate decreased from 5.0% in April 2016 to 4.4% at period-end.1 Monthly retail sales were volatile, but grew during most of the period. Annual inflation, as measured by the Consumer Price Index, increased from 1.1% to 2.2% during the period.
After maintaining its target interest rate in the 0.25%–0.50% range for nearly a year, the U.S. Federal Reserve (Fed), at its December meeting, increased its target range for the federal funds rate to 0.50%–0.75%, as policymakers noted improvement in the U.S. labor market and inflation. The Fed kept its interest rate unchanged at its February meeting, but incoming economic data, along with statements by Fed officials in late February and early March, heightened many investors’ expectations for a March interest-rate hike. The Fed, at its March meeting, made the widely anticipated increase in its federal funds target rate to 0.75%–1.00%.
U.S. equity markets rose during the period, benefiting from mostly upbeat economic data, better U.S. corporate earnings and signs of improvement in the Chinese and European economies. Ongoing expansionary monetary policies from key central banks, investor optimism arising from pro-growth and pro-business policy plans in the U.S. and the results of the first round of presidential elections in France also helped U.S. equities. However, the U.K.’s historic vote to leave the European Union (also known as “Brexit”), global growth concerns and geopolitical tensions in the Middle East and Korean peninsula weighed on market sentiment. The broad U.S. stock market, as measured by the Standard & Poor’s 500 Index, generated a +17.92% total return for the 12-month period.2
The foregoing information reflects our analysis and opinions as of April 30, 2017. The information is not a complete analysis of every aspect of any market, country, industry, security or fund. Statements of fact are from sources considered reliable.
1. Source: Bureau of Labor Statistics.
2. Source: Morningstar.
See www.franklintempletondatasources.com for additional data provider information.
franklintempleton.com | Annual Report | 3 | ||
Franklin Biotechnology Discovery Fund
This annual report for Franklin Biotechnology Discovery Fund covers the fiscal year ended April 30, 2017. Effective July 8, 2014, with limited exceptions, the Fund closed to new investors. Effective May 16, 2016, the Fund reopened to new investors.
Your Fund’s Goal and Main Investments
The Fund seeks capital appreciation by investing at least 80% of its net assets in securities of biotechnology companies and discovery research firms located in the U.S. and other countries.
Performance Overview
The Fund’s Class A shares delivered a +20.02% cumulative total return for the 12 months under review. In comparison, the NASDAQ Biotechnology Index®, which tracks U.S. and international-based biotechnology stocks, generated a +11.51% total return.1 Also in comparison, the Standard & Poor’s 500 Index (S&P 500®), which is a broad measure of the U.S. stock market, produced a +17.92% total return.1 Finally, domestic and international-based stocks, as measured by the NASDAQ Composite Index®, posted a +28.18% total return.1 You can find the Fund’s long-term performance data in the Performance Summary beginning on page 6.
Performance data represent past performance, which does not guarantee future results. Investment return and principal value will fluctuate, and you may have a gain or loss when you sell your shares. Current performance may differ from figures shown. For most recent month-end performance, go to franklintempleton.com or call (800) 342-5236.
Investment Strategy
We are research-driven, fundamental investors, pursuing a growth strategy. As bottom-up investors focusing primarily on individual securities, we choose companies that have identifiable drivers of future earnings growth and that present, in our opinion, the best trade-off between earnings growth, business and financial risk, and valuation. We rely on a team of analysts to help provide in-depth industry expertise and use both qualitative and quantitative analysis to evaluate companies for distinct and sustainable competitive advantages likely to lead to growth in earnings and/or share price. Competitive
Portfolio Composition
Based on Total Net Assets as of 4/30/17
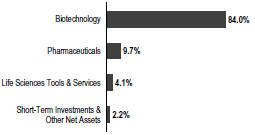
advantages, such as a particular product niche, proven technology, sound financial position and strong management, are all factors we believe may contribute to strong growth potential.
Manager’s Discussion
During the 12 months under review, the biotechnology industry experienced significant volatility in response to increased scrutiny over drug pricing leading up to the U.S. presidential election in November 2016. Please keep in mind that volatility is not uncommon in the biotechnology industry, and we seek to take advantage of short-term volatility by initiating positions or adding to existing holdings in companies we believe are undervalued. Overall, the biotechnology industry had strong gains for the reporting period.
Key contributors included TESARO, Incyte and Celgene. Oncology-focused biopharmaceutical company TESARO announced better-than-expected Phase 3 trial results in June 2016 for its PARP inhibitor, niraparib, in ovarian cancer. We believe niraparib may have a best-in-class profile and that the trial results demonstrated a broad market potential for the drug. Oncology therapeutics firm Incyte announced clinical collaborations for epacadostat, an IDO inhibitor to treat various cancers. In addition, the company’s sales of Jakafi, which is used to treat intermediate- or high-risk myelofibrosis, a disorder that affects bone marrow, drove 2016 revenue growth. Biotechnology firm Celgene’s strong performance during the review period was aided by subsiding concerns about government regulation on drug pricing. As an industry, biotechnology had underperformed the broader market leading
1. Source: Morningstar.
The indexes are unmanaged and include reinvestment of any income or distributions. They do not reflect any fees, expenses or sales charges. One cannot invest directly in an index, and an index is not representative of the Fund’s portfolio.
See www.franklintempletondatasources.com for additional data provider information.
The dollar value, number of shares or principal amount, and names of all portfolio holdings are listed in the Fund’s Statement of Investments (SOI).
The SOI begins on page 22.
4 | Annual Report | franklintempleton.com | ||
FRANKLIN BIOTECHNOLOGY DISCOVERY FUND
into the November 2016 election as consensus expectations were for a Hillary Clinton victory. With the election of Donald Trump, and more importantly, the Republican sweep in Congress, investors viewed the risk of government intervention on drug pricing as diminished.
In contrast, key detractors from the Fund’s absolute performance during the reporting period included Gilead Sciences, Heron Therapeutics and Ophthotech (no longer held by period-end). Biopharmaceutical company Gilead Sciences was impacted by slower sales trends in key products. Shares of clinical-stage biotechnology company Heron Therapeutics declined as approval of Sustol, the company’s drug to treat nausea and vomiting associated with chemotherapy, was delayed until August 2016 from an initial expectation of early 2016. Sustol’s early sales have been lower than expected. These negative factors were offset somewhat by positive data for HTX-011 to treat pain. Ophthotech is a biopharmaceutical company that develops treatments for eye diseases. The company’s Phase 3 clinical trial studying Fovista to treat age-related macular degeneration failed and showed little effect, which was surprising to us given the positive effect that was seen in the Phase 2 trial. The stock declined significantly following the trial result.
Thank you for your continued participation in Franklin Biotechnology Discovery Fund. We look forward to serving your future investment needs.
 |
Evan McCulloch, CFA Lead Portfolio Manager | |
Christopher Lee, M.D. | ||
Steven Kornfeld, CFA | ||
Portfolio Management Team |

Top 10 Holdings
4/30/17
Company Sector/Industry | % of Total Net Assets
| |
Celgene Corp. | 9.5% | |
Biotechnology
| ||
Biogen Inc. | 6.5% | |
Biotechnology
| ||
Alexion Pharmaceuticals Inc. | 5.9% | |
Biotechnology
| ||
Incyte Corp. | 5.8% | |
Biotechnology
| ||
Tesaro Inc. | 5.6% | |
Biotechnology
| ||
Regeneron Pharmaceuticals Inc. | 4.6% | |
Biotechnology
| ||
Gilead Sciences Inc. | 4.2% | |
Biotechnology
| ||
Illumina Inc. | 4.1% | |
Life Sciences Tools & Services
| ||
Neurocrine Biosciences Inc. | 3.4% | |
Biotechnology
| ||
Vertex Pharmaceuticals Inc. | 3.3% | |
Biotechnology
|
The foregoing information reflects our analysis, opinions and portfolio holdings as of April 30, 2017, the end of the reporting period. The way we implement our main investment strategies and the resulting portfolio holdings may change depending on factors such as market and economic conditions. These opinions may not be relied upon as investment advice or an offer for a particular security. The information is not a complete analysis of every aspect of any market, country, industry, security or the Fund. Statements of fact are from sources considered reliable, but the investment manager makes no representation or warranty as to their completeness or accuracy. Although historical performance is no guarantee of future results, these insights may help you understand our investment management philosophy.
CFA® is a trademark owned by CFA Institute.
franklintempleton.com | Annual Report | 5 | ||
FRANKLIN BIOTECHNOLOGY DISCOVERY FUND
Performance Summary as of April 30, 2017
The performance table and graphs do not reflect any taxes that a shareholder would pay on Fund dividends, capital gain distributions, if any, or any realized gains on the sale of Fund shares. Total return reflects reinvestment of the Fund’s dividends and capital gain distributions, if any, and any unrealized gains or losses. Your dividend income will vary depending on dividends or interest paid by securities in the Fund’s portfolio, adjusted for operating expenses of each class. Capital gain distributions are net profits realized from the sale of portfolio securities.
Performance as of 4/30/171
Cumulative total return excludes sales charges. Average annual total return includes maximum sales charges. Sales charges will vary depending on the size of the investment and the class of share purchased. The maximum is 5.75% and the minimum is 0%. Class A: 5.75% maximum initial sales charge; Advisor Class: no sales charges. For other share classes, visit franklintempleton.com.
Share Class
| Cumulative Total Return2
| Average Annual Total Return3
| ||
A
| ||||
1-Year
| +20.02%
| +13.12%
| ||
5-Year
|
+144.76%
|
+18.20%
| ||
10-Year
|
+233.94%
|
+12.15%
| ||
Advisor4
| ||||
1-Year
| +20.32%
| +20.32%
| ||
5-Year
|
+148.05%
|
+19.92%
| ||
10-Year
|
+241.02%
|
+13.05%
| ||
Performance data represent past performance, which does not guarantee future results. Investment return and principal value will fluctuate, and you may have a gain or loss when you sell your shares. Current performance may differ from figures shown. For most recent month-end performance, go to franklintempleton.com or call (800) 342-5236.
See page 8 for Performance Summary footnotes.
6 | Annual Report | franklintempleton.com | ||
FRANKLIN BIOTECHNOLOGY DISCOVERY FUND
PERFORMANCE SUMMARY
Total Return Index Comparison for a Hypothetical $10,000 Investment1
Total return represents the change in value of an investment over the periods shown. It includes any applicable maximum sales charge, Fund expenses, account fees and reinvested distributions. The unmanaged indexes include reinvestment of any income or distributions. They differ from the Fund in composition and do not pay management fees or expenses. One cannot invest directly in an index.
Class A (5/1/07–4/30/17)
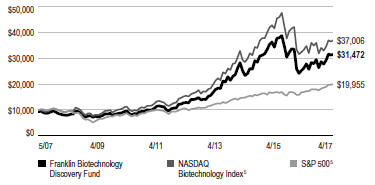
Advisor Class (5/1/07–4/30/17)4
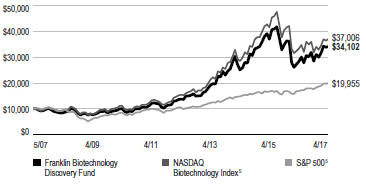
See page 8 for Performance Summary footnotes.
franklintempleton.com | Annual Report | 7 | ||
FRANKLIN BIOTECHNOLOGY DISCOVERY FUND
PERFORMANCE SUMMARY
Distributions (5/1/16–4/30/17)
Share Class
| Net Investment
| Long-Term
| Total
| |||||||||
A
|
|
$1.7284
|
|
|
$4.2035
|
|
|
$5.9319
|
| |||
C
|
|
$1.2918
|
|
|
$4.2035
|
|
|
$5.4953
|
| |||
R6
|
|
$2.3023
|
|
|
$4.2035
|
|
|
$6.5058
|
| |||
Advisor
|
|
$2.0807
|
|
|
$4.2035
|
|
|
$6.2842
|
| |||
Total Annual Operating Expenses6
Share Class
| With Waiver
| Without Waiver
| ||||
A
|
|
0.99%
|
|
1.00%
| ||
Advisor
|
|
0.75%
|
|
0.76%
| ||
Each class of shares is available to certain eligible investors and has different annual fees and expenses, as described in the prospectus.
All investments involve risks, including possible loss of principal. The Fund is a nondiversified fund that concentrates in a single sector, which involves risks such as patent considerations, product liability, government regulatory requirements, and regulatory approval for new drugs and medical products. Biotechnology companies often are small and/or relatively new. Smaller companies can be particularly sensitive to changes in economic conditions and have less certain growth prospects than larger, more established companies and can be volatile, especially over the short term. The Fund may also invest in foreign companies, which involve special risks, including currency fluctuations and political uncertainty. The Fund is actively managed but there is no guarantee that the manager’s investment decisions will produce the desired results. The Fund’s prospectus also includes a description of the main investment risks.
1. The Fund has a fee waiver associated with any investment it makes in a Franklin Templeton money fund and/or other Franklin Templeton fund, contractually guaranteed through 8/31/17. Fund investment results reflect the fee waiver; without this waiver, the results would have been lower.
2. Cumulative total return represents the change in value of an investment over the periods indicated.
3. Average annual total return represents the average annual change in value of an investment over the periods indicated. Return for less than one year, if any, has not been annualized.
4. Effective 9/1/09, the Fund began offering Advisor Class shares, which do not have sales charges or a Rule 12b-1 plan. Performance quotations for this class reflect the following methods of calculation: (a) For periods prior to 9/1/09, a restated figure is used based upon the Fund’s Class A performance, excluding the effect of Class A’s maximum initial sales charge, but reflecting the effect of the Class A Rule 12b-1 fees; and (b) for periods after 9/1/09, actual Advisor Class performance is used reflecting all charges and fees applicable to that class. Since 9/1/09 (commencement of sales), the cumulative and average annual total returns of Advisor Class shares were +286.01% and +19.28%.
5. Source: Morningstar. The NASDAQ Biotechnology Index is a modified capitalization-weighted index designed to measure performance of all NASDAQ stocks in the biotechnology sector. The S&P 500 is a market capitalization-weighted index of 500 stocks designed to measure total U.S. equity market performance.
6. Figures are as stated in the Fund’s current prospectus and may differ from the expense ratios disclosed in the Your Fund’s Expenses and Financial Highlights sections in this report. In periods of market volatility, assets may decline significantly, causing total annual Fund operating expenses to become higher than the figures shown.
See www.franklintempletondatasources.com for additional data provider information.
8 | Annual Report | franklintempleton.com | ||
FRANKLIN BIOTECHNOLOGY DISCOVERY FUND
Your Fund’s Expenses
As a Fund shareholder, you can incur two types of costs: (1) transaction costs, including sales charges (loads) on Fund purchases and redemptions; and (2) ongoing Fund costs, including management fees, distribution and service (12b-1) fees, and other Fund expenses. All mutual funds have ongoing costs, sometimes referred to as operating expenses. The table below shows ongoing costs of investing in the Fund and can help you understand these costs and compare them with those of other mutual funds. The table assumes a $1,000 investment held for the six months indicated.
Actual Fund Expenses
The table below provides information about actual account values and actual expenses in the columns under the heading “Actual.” In these columns the Fund’s actual return, which includes the effect of Fund expenses, is used to calculate the “Ending Account Value” for each class of shares. You can estimate the expenses you paid during the period by following these steps (of course, your account value and expenses will differ from those in this illustration): Divide your account value by $1,000 (if your account had an $8,600 value, then $8,600 ÷ $1,000 = 8.6). Then multiply the result by the number in the row for your class of shares under the headings “Actual” and “Expenses Paid During Period” (if Actual Expenses Paid During Period were $7.50, then 8.6 x $7.50 = $64.50). In this illustration, the actual expenses paid this period are $64.50.
Hypothetical Example for Comparison with Other Funds
Under the heading “Hypothetical” in the table, information is provided about hypothetical account values and hypothetical expenses based on the Fund’s actual expense ratio and an assumed rate of return of 5% per year before expenses, which is not the Fund’s actual return. This information may not be used to estimate the actual ending account balance or expenses you paid for the period, but it can help you compare ongoing costs of investing in the Fund with those of other funds. To do so, compare this 5% hypothetical example for the class of shares you hold with the 5% hypothetical examples that appear in the shareholder reports of other funds.
Please note that expenses shown in the table are meant to highlight ongoing costs and do not reflect any transactional costs. Therefore, information under the heading “Hypothetical” is useful in comparing ongoing costs only, and will not help you compare total costs of owning different funds. In addition, if transactional costs were included, your total costs would have been higher.
Actual (actual return after expenses) | Hypothetical (5% annual return before expenses) | |||||||||||||||||
Share Class | Beginning Account Value 11/1/16 | Ending Account Value 4/30/17 | Expenses Paid During 11/1/16–4/30/171,2 | Ending Account Value 4/30/17 | Expenses Paid During 11/1/16–4/30/171,2 | Net Annualized Expense Ratio2 | ||||||||||||
A | $1,000 | $1,196.00 | $5.50 | $1,019.79 | $5.06 | 1.01% | ||||||||||||
C | $1,000 | $1,191.70 | $9.56 | $1,016.07 | $8.80 | 1.76% | ||||||||||||
R6 | $1,000 | $1,198.40 | $3.33 | $1,021.77 | $3.06 | 0.61% | ||||||||||||
Advisor | $1,000 | $1,197.50 | $4.14 | $1,021.03 | $3.81 | 0.76% | ||||||||||||
1. Expenses are equal to the annualized expense ratio for the six-month period as indicated above–in the far right column–multiplied by the simple average account value over the period indicated, and then multiplied by 181/365 to reflect the one-half year period.
2. Reflects expenses after fee waivers and expense reimbursements. Does not include acquired fund fees and expenses.
franklintempleton.com | Annual Report | 9 | ||
Franklin Natural Resources Fund
This annual report for Franklin Natural Resources Fund covers the fiscal year ended April 30, 2017.
Your Fund’s Goal and Main Investments
The Fund seeks high total return (total return consists of capital appreciation and current dividend and interest income) by investing, under normal market conditions, at least 80% of its net assets in equity and debt securities of companies that own, produce, refine, process, transport or market natural resources, as well as those that provide related services.
Performance Overview
The Fund’s Class A shares delivered a +1.37% cumulative total return for the 12 months under review. In comparison, the Standard & Poor’s (S&P®) North American Natural Resources Sector Index, which tracks companies involved in industries such as mining, energy, timber and forestry services, and the production of pulp and paper, generated a +2.59% total return.1 Also in comparison, the S&P 500, which is a broad measure of the U.S. stock market, generated a +17.92% total return.1 Please note index performance information is provided for reference and we do not attempt to track any index but rather undertake investments on the basis of fundamental research. The Fund’s strategy, which focuses on companies with higher long-term growth potential, differs from the natural resources index’s large weighting in income-oriented companies that typically provide more limited opportunities for growth. This difference may occasionally lead to wide performance discrepancies, especially in periods when investors focus on short-term safety and yield or, conversely, when investors focus more heavily on companies with stronger growth prospects and greater commodity price leverage. You can find the Fund’s long-term performance data in the Performance Summary beginning on page 14.
Performance data represent past performance, which does not guarantee future results. Investment return and principal value will fluctuate, and you may have a gain or loss when you sell your shares. Current performance may differ from figures shown. For most recent month-end performance, go to franklintempleton.com or call (800) 342-5236.
Geographic Composition
Based on Total Net Assets as of 4/30/17
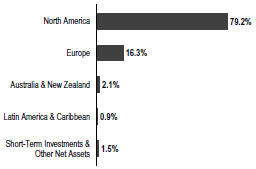
Investment Strategy
We are research-driven, fundamental investors, pursuing a growth strategy. As bottom-up investors focusing primarily on individual securities, we choose companies that have identifiable drivers of future earnings growth and that present, in our opinion, the best trade-off between earnings growth, business and financial risk, and valuation. We rely on a team of analysts to help provide in-depth industry expertise and use both qualitative and quantitative analysis to evaluate companies for distinct and sustainable competitive advantages likely to lead to growth in earnings and/or share price. Competitive advantages, such as a particular product niche, proven technology, sound financial position and strong management, are all factors we believe may contribute to strong growth potential.
Sector Overview
Global commodity prices were mixed during the 12 months under review. Despite heightened volatility during the period, energy commodities and industrial metals generally rose as oversupply concerns subsided. However, precious metals, with the exception of palladium, declined due to a strong U.S. dollar, the U.S. Federal Reserve’s (Fed’s) two interest-rate increases and expectations for higher interest rates in 2017.
Crude oil prices ended the period higher despite periods of heightened volatility, especially during the summer and early fall of 2016, aided by an agreement between the Organization
1. Source: Morningstar.
The indexes are unmanaged and include reinvestment of any income or distributions. They do not reflect any fees, expenses or sales charges. One cannot invest directly in an index, and an index is not representative of the Fund’s portfolio.
See www.franklintempletondatasources.com for additional data provider information.
The dollar value, number of shares or principal amount, and names of all portfolio holdings are listed in the Fund’s Statement of Investments (SOI).
The SOI begins on page 30.
10 | Annual Report | franklintempleton.com | ||
FRANKLIN NATURAL RESOURCES FUND
Portfolio Composition
Based on Total Net Assets as of 4/30/17
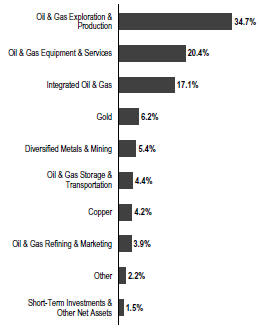
of the Petroleum Exporting Countries (OPEC) and major non-OPEC producers, including Russia, to curb production, which helped ease concerns about rising oil exports from several members and provided a path to inventory reductions. OPEC and non-OPEC producers’ compliance with production quotas and speculation that OPEC would extend the agreement to curb output at its meeting in May 2017 further supported oil prices. However, investor concerns that growing U.S. production and higher rig counts could offset the continuing effort to reduce global stockpiles restricted price gains.
U.S. natural gas prices rose for the 12 months under review, despite periods of weakness resulting from smaller-than-anticipated seasonal withdrawals from stockpiles due to a mild winter in North America. Despite the long stretch of warm winter conditions in North America, natural-gas supplies ended the first quarter tighter than the prior year due to waning production and rising exports. Although the surplus in early 2017 is smaller than last year, it has persisted, leading some investors to be concerned that production will eventually increase as stronger prices could lead producers to increase rig counts and drilling activity, associated gas produced from newly drilled oil wells in shale plays grows, and pipelines out of Appalachia provide more capacity to higher priced end markets.
Gold prices declined slightly for the 12-month period, as a rally in the first four months of 2017 failed to offset the price plunge in the latter part of 2016 amid the U.S. dollar’s rapid appreciation, the Fed’s December rate increase and lower demand for gold exchange-traded funds. Gold partially recovered amid increased physical demand and investor concerns about U.S. President Donald Trump’s political and economic policies, a slower U.S. economic expansion in the first quarter, the outcome of the French election and geopolitical tensions. Among other precious metals, silver and platinum prices declined, while palladium prices rose, supported by emissions-catalyst demand from automobile manufacturers and tight supplies. Industrial metals performed well after the U.S. presidential election and as the global economy improved. Copper prices rose amid higher demand from China and supply disruptions at some of the world’s major mines. Other industrial metals rose in price, including iron ore, aluminum and zinc.
Manager’s Discussion
The Fund’s fiscal year ended April 30, 2017, was somewhat volatile, including the peaking of a recovery in various commodities and commodity-linked equities followed by a retrenchment driven by growing economic concerns and deflation of the U.S. presidential election mini-bubble. In addition to the usual catalysts that included U.S. dollar strength, supply-and-demand imbalances and China economic worries, new factors also impacted commodities and commodity-linked equities, such as India’s demonetization program to recall large-denominated currency notes to fight corruption. The Fund performed relatively well in this environment, though most of the benefits of the recovery had been realized near the beginning of the 12-month reporting period.
The Fund’s holdings in the diversified metals and mining industry contributed significantly to absolute results, despite a price pullback in industrial metals and related equities in March and April. Stock selection within the industry contributed to performance relative to the S&P North American Natural Resources Index, notably an overweighted position in Teck Resources (Canada) and several off-benchmark holdings that managed to generate robust returns despite the pullback, notably Glencore (Switzerland), BHP Billiton (U.K.), South32 (Australia) and Rio Tinto (U.K.). Overall, the Fund’s overweighted industry holdings significantly outperformed the index’s industry components.
Stock selection and an underweighting in the integrated oil and gas industry contributed to relative performance, as the Fund’s overall industry holdings outperformed the index’s industry
franklintempleton.com | Annual Report | 11 | ||
FRANKLIN NATURAL RESOURCES FUND
Top 10 Holdings
4/30/17
Company Sector/Industry
| % of Total Net Assets
| |||
Schlumberger Ltd. Oil & Gas Equipment & Services
|
|
5.0% |
| |
Anadarko Petroleum Corp. Oil & Gas Exploration & Production
|
|
3.6% |
| |
Royal Dutch Shell PLC Integrated Oil & Gas
|
|
3.5% |
| |
Noble Energy Inc. Oil & Gas Exploration & Production
|
|
3.5% |
| |
Halliburton Co. Oil & Gas Equipment & Services
|
|
3.4% |
| |
Occidental Petroleum Corp. Integrated Oil & Gas
|
|
3.3% |
| |
EOG Resources Inc. Oil & Gas Exploration & Production
|
|
2.9% |
| |
Suncor Energy Inc. Integrated Oil & Gas
|
|
2.5% |
| |
Kinder Morgan Inc. Oil & Gas Storage & Transportation
|
|
2.5% |
| |
Cabot Oil & Gas Corp. Oil & Gas Exploration & Production
|
|
2.5% |
| |
components. European integrated oil and gas companies Total (France), Royal Dutch Shell (U.K.) and BP (U.K.), which are not part of the index, outperformed the index holdings and U.S. company Exxon Mobil, which is a large index weighting and declined during the period. Conversely, an underweighted position in Chevron (U.S.), which posted a positive return, detracted from performance.
Stock selection in gold and in oil and gas exploration and production (E&P) also contributed to the Fund’s performance, as the Fund’s holdings in these industries generally outperformed the index’s industry components. In gold, a lack of ownership or underweighted positions in poor performers helped, as did an off-benchmark position in B2Gold (Canada), which posted robust returns. In E&P, off-benchmark investments in Aker BP (Norway) and SRC Energy (U.S.), as well as overweighted positions in Rice Energy (U.S.) and Anadarko Petroleum (U.S.), benefited absolute and relative performance. Avoidance of several index components that posted negative returns also helped Fund performance.
In contrast, an underweighting in oil and gas storage and transportation was a major detractor from the Fund’s relative performance as the industry performed well amid a recovery in oil and natural gas prices, increased drilling activity and expected production growth, which led to increased throughput in pipelines and expectations of more to come. Although the
Fund’s overall industry holdings outperformed the index’s industry components, a lack of ownership in several index components that performed well hurt relative performance.
Oilfield services also detracted from relative performance, due to the Fund’s overweighted position and weak relative performance, with losses concentrated in offshore-focused companies, which suffered from continued fundamental weakness in offshore markets and the stalled-out recovery in oil prices. Investor concerns that increased drilling activity and related production would drive oil prices lower and hurt spending also weighed on the industry, including several companies with an onshore focus, though some of the largest detractors are hybrid companies with onshore and offshore exposure. Key detractors included overweighted holdings in hybrid company Superior Energy Services (U.S.) and offshore-focused company Oceaneering International (U.S.), as well as an off-benchmark position in offshore-focused company Hornbeck Offshore Services (U.S.; no longer held by period-end).
A lack of exposure to the paper and packaging industry and an underweighting in the construction materials industry, which are both economically sensitive, also detracted from relative performance.
Thank you for your continued participation in Franklin Natural Resources Fund. We look forward to serving your future investment needs.
 |
Frederick G. Fromm, CFA | |
 |
Matthew J. Adams, CFA | |
| Stephen M. Land, CFA | ||
| Portfolio Management Team | ||


12 | Annual Report | franklintempleton.com | ||
FRANKLIN NATURAL RESOURCES FUND
The foregoing information reflects our analysis, opinions and portfolio holdings as of April 30, 2017, the end of the reporting period. The way we implement our main investment strategies and the resulting portfolio holdings may change depending on factors such as market and economic conditions. These opinions may not be relied upon as investment advice or an offer for a particular security. The information is not a complete analysis of every aspect of any market, country, industry, security or the Fund. Statements of fact are from sources considered reliable, but the investment manager makes no representation or warranty as to their completeness or accuracy. Although historical performance is no guarantee of future results, these insights may help you understand our investment management philosophy.
franklintempleton.com | Annual Report | 13 | ||
FRANKLIN NATURAL RESOURCES FUND
Performance Summary as of April 30, 2017
The performance table and graphs do not reflect any taxes that a shareholder would pay on Fund dividends, capital gain distributions, if any, or any realized gains on the sale of Fund shares. Total return reflects reinvestment of the Fund’s dividends and capital gain distributions, if any, and any unrealized gains or losses. Your dividend income will vary depending on dividends or interest paid by securities in the Fund’s portfolio, adjusted for operating expenses of each class. Capital gain distributions are net profits realized from the sale of portfolio securities.
Performance as of 4/30/171
Cumulative total return excludes sales charges. Average annual total return includes maximum sales charges. Sales charges will vary depending on the size of the investment and the class of share purchased. The maximum is 5.75% and the minimum is 0%. Class A: 5.75% maximum initial sales charge; Advisor Class: no sales charges. For other share classes, visit franklintempleton.com.
Share Class
| Cumulative Total Return2
| Average Annual Total Return3
| ||
A
| ||||
1-Year
| +1.37%
| -4.47%
| ||
5-Year
|
-27.63%
|
-7.36%
| ||
10-Year
|
-17.18%
|
-2.45%
| ||
Advisor
| ||||
1-Year
|
+1.64%
|
+1.64%
| ||
5-Year
|
-26.60%
|
-6.00%
| ||
10-Year
|
-14.76%
|
-1.58%
| ||
Performance data represent past performance, which does not guarantee future results. Investment return and principal value will fluctuate, and you may have a gain or loss when you sell your shares. Current performance may differ from figures shown. For most recent month-end performance, go to franklintempleton.com or call (800) 342-5236.
See page 16 for Performance Summary footnotes.
14 | Annual Report | franklintempleton.com | ||
FRANKLIN NATURAL RESOURCES FUND
PERFORMANCE SUMMARY
Total Return Index Comparison for a Hypothetical $10,000 Investment1
Total return represents the change in value of an investment over the periods shown. It includes any applicable maximum sales charge, Fund expenses, account fees and reinvested distributions. The unmanaged indexes include reinvestment of any income or distributions. They differ from the Fund in composition and do not pay management fees or expenses. One cannot invest directly in an index.
Class A (5/1/07–4/30/17)
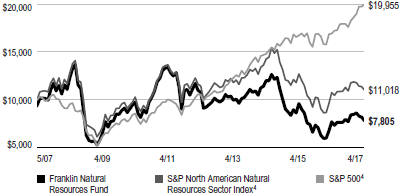
Advisor Class (5/1/07–4/30/17)
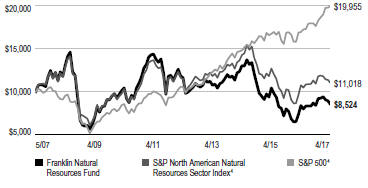
See page 16 for Performance Summary footnotes.
franklintempleton.com | Annual Report | 15 | ||
FRANKLIN NATURAL RESOURCES FUND
PERFORMANCE SUMMARY
Distributions (5/1/16–4/30/17)
| Share Class | Net Investment Income | |||
A
|
|
$0.2765
|
| |
C
|
|
$0.1336
|
| |
R6
|
|
$0.3748
|
| |
Advisor
|
|
$0.3587
|
| |
Total Annual Operating Expenses5
| Share Class | With Waiver | Without Waiver | ||||
A |
|
1.14%
|
|
1.15%
| ||
Advisor
|
|
0.87%
|
|
0.88%
| ||
Each class of shares is available to certain eligible investors and has different annual fees and expenses, as described in the prospectus.
All investments involve risks, including possible loss of principal. Investing in a fund concentrating in the natural resources sector involves special risks, including increased susceptibility to adverse economic and regulatory developments affecting the sector. Smaller companies can be particularly sensitive to changes in economic conditions and have less certain growth prospects than larger, more established companies and can be volatile, especially over the short term. The Fund may also invest in foreign companies, which involve special risks, including currency fluctuations and political uncertainty. The Fund is actively managed but there is no guarantee that the manager’s investment decisions will produce the desired results. The Fund’s prospectus also includes a description of the main investment risks.
1. The Fund has a fee waiver associated with any investment it makes in a Franklin Templeton money fund and/or other Franklin Templeton fund, contractually guaranteed through 8/31/17. Fund investment results reflect the fee waiver; without this waiver, the results would have been lower.
2. Cumulative total return represents the change in value of an investment over the periods indicated.
3. Average annual total return represents the average annual change in value of an investment over the periods indicated. Return for less than one year, if any, has not been annualized.
4. Source: Morningstar. The S&P North American Natural Resources Index is a modified capitalization-weighted index that includes companies involved in extractive industries (mining), energy and forestry services, producers of pulp and paper, and owners and operators of timber tracts or plantations. The S&P 500 Index is a market capitalization-weighted index of 500 stocks designed to measure total U.S. equity market performance.
5. Figures are as stated in the Fund’s current prospectus and may differ from the expense ratios disclosed in the Your Fund’s Expenses and Financial Highlights sections in this report. In periods of market volatility, assets may decline significantly, causing total annual Fund operating expenses to become higher than the figures shown.
16 | Annual Report | franklintempleton.com | ||
FRANKLIN NATURAL RESOURCES FUND
Your Fund’s Expenses
As a Fund shareholder, you can incur two types of costs: (1) transaction costs, including sales charges (loads) on Fund purchases and redemptions; and (2) ongoing Fund costs, including management fees, distribution and service (12b-1) fees, and other Fund expenses. All mutual funds have ongoing costs, sometimes referred to as operating expenses. The table below shows ongoing costs of investing in the Fund and can help you understand these costs and compare them with those of other mutual funds. The table assumes a $1,000 investment held for the six months indicated.
Actual Fund Expenses
The table below provides information about actual account values and actual expenses in the columns under the heading “Actual.” In these columns the Fund’s actual return, which includes the effect of Fund expenses, is used to calculate the “Ending Account Value” for each class of shares. You can estimate the expenses you paid during the period by following these steps (of course, your account value and expenses will differ from those in this illustration): Divide your account value by $1,000 (if your account had an $8,600 value, then $8,600 ÷ $1,000 = 8.6). Then multiply the result by the number in the row for your class of shares under the headings “Actual” and “Expenses Paid During Period” (if Actual Expenses Paid During Period were $7.50, then 8.6 x $7.50 = $64.50). In this illustration, the actual expenses paid this period are $64.50.
Hypothetical Example for Comparison with Other Funds
Under the heading “Hypothetical” in the table, information is provided about hypothetical account values and hypothetical expenses based on the Fund’s actual expense ratio and an assumed rate of return of 5% per year before expenses, which is not the Fund’s actual return. This information may not be used to estimate the actual ending account balance or expenses you paid for the period, but it can help you compare ongoing costs of investing in the Fund with those of other funds. To do so, compare this 5% hypothetical example for the class of shares you hold with the 5% hypothetical examples that appear in the shareholder reports of other funds.
Please note that expenses shown in the table are meant to highlight ongoing costs and do not reflect any transactional costs. Therefore, information under the heading “Hypothetical” is useful in comparing ongoing costs only, and will not help you compare total costs of owning different funds. In addition, if transactional costs were included, your total costs would have been higher.
Actual (actual return after expenses) | Hypothetical (5% annual return before expenses) | |||||||||||||||||
Share Class | Beginning Account Value 11/1/16 | Ending Account Value 4/30/17 | Expenses Paid During Period 11/1/16–4/30/171,2 | Ending Account Value 4/30/17 | Expenses Paid During Period 11/1/16–4/30/171,2 | Net Annualized Expense Ratio2 | ||||||||||||
A | $1,000 | $1,012.50 | $5.09 | $1,019.74 | $5.11 | 1.02% | ||||||||||||
C | $1,000 | $1,008.80 | $8.82 | $1,016.02 | $8.85 | 1.77% | ||||||||||||
R6 | $1,000 | $1,014.70 | $2.65 | $1,022.17 | $2.66 | 0.53% | ||||||||||||
Advisor | $1,000 | $1,013.80 | $3.84 | $1,020.98 | $3.86 | 0.77% | ||||||||||||
1. Expenses are equal to the annualized expense ratio for the six-month period as indicated above–in the far right column–multiplied by the simple average account value over the period indicated, and then multiplied by 181/365 to reflect the one-half year period.
2. Reflects expenses after fee waivers and expense reimbursements. Does not include acquired fund fees and expenses.
franklintempleton.com | Annual Report | 17 | ||
FRANKLIN STRATEGIC SERIES
Franklin Biotechnology Discovery Fund
| Year Ended April 30, | ||||||||||||||||||||
| 2017 | 2016 | 2015 | 2014 | 2013 | ||||||||||||||||
Class A | ||||||||||||||||||||
Per share operating performance | ||||||||||||||||||||
(for a share outstanding throughout the year) | ||||||||||||||||||||
Net asset value, beginning of year | $128.19 | $182.30 | $129.27 | $105.95 | $ 76.22 | |||||||||||||||
Income from investment operationsa: | ||||||||||||||||||||
Net investment income (loss)b | (0.79 | ) | (0.94 | ) | (1.09 | ) | (1.07 | ) | (0.76 | ) | ||||||||||
Net realized and unrealized gains (losses) | 25.75 | (39.39 | ) | 60.79 | 33.18 | 30.56 | ||||||||||||||
Total from investment operations | 24.96 | (40.33 | ) | 59.70 | 32.11 | 29.80 | ||||||||||||||
Less distributions from: | ||||||||||||||||||||
Net investment income | (1.73 | ) | — | — | — | (0.07 | ) | |||||||||||||
Net realized gains | (4.20 | ) | (13.78 | ) | (6.67 | ) | (8.79 | ) | — | |||||||||||
Total distributions | (5.93 | ) | (13.78 | ) | (6.67 | ) | (8.79 | ) | (0.07 | ) | ||||||||||
Net asset value, end of year | $147.22 | $128.19 | $182.30 | $129.27 | $105.95 | |||||||||||||||
Total returnc | 20.02% | (23.55)% | 46.81% | 30.60% | 39.12% | |||||||||||||||
Ratios to average net assets | ||||||||||||||||||||
Expenses before waiver and payments by affiliates | 1.04% | 0.99% | 1.00% | 1.10% | 1.20% | |||||||||||||||
Expenses net of waiver and payments by affiliates | 1.02% | d | 0.98% | d | 1.00% | d,e | 1.10% | d,e | 1.20% | |||||||||||
Net investment income (loss) | (0.58)% | (0.56)% | (0.67)% | (0.82)% | (0.88)% | |||||||||||||||
Supplemental data | ||||||||||||||||||||
Net assets, end of year (000’s) | $1,176,687 | $1,074,903 | $1,601,906 | $1,141,890 | $653,718 | |||||||||||||||
Portfolio turnover rate | 34.12% | 22.13% | 41.43% | 48.70% | 33.64% | |||||||||||||||
aThe amount shown for a share outstanding throughout the period may not correlate with the Statement of Operations for the period due to the timing of sales and repurchases of the Fund’s shares in relation to income earned and/or fluctuating fair value of the investments of the Fund.
bBased on average daily shares outstanding.
cTotal return does not reflect sales commissions or contingent deferred sales charges, if applicable.
dBenefit of expense reduction rounds to less than 0.01%.
eBenefit of waiver and payments by affiliates rounds to less than 0.01%.
18 | Annual Report | The accompanying notes are an integral part of these financial statements. | franklintempleton.com | ||
FRANKLIN STRATEGIC SERIES
FINANCIAL HIGHLIGHTS
Franklin Biotechnology Discovery Fund (continued)
| Year Ended April 30, | ||||||||||||||||
| 2017 | 2016 | 2015 | 2014a | |||||||||||||
Class C | ||||||||||||||||
Per share operating performance | ||||||||||||||||
(for a share outstanding throughout the year) | ||||||||||||||||
Net asset value, beginning of year | $125.99 | $180.67 | $129.11 | $159.15 | ||||||||||||
Income from investment operationsb: | ||||||||||||||||
Net investment income (loss)c | (1.81 | ) | (2.11 | ) | (2.38 | ) | (0.34 | ) | ||||||||
Net realized and unrealized gains (losses) | 25.29 | (38.79 | ) | 60.61 | (29.70 | ) | ||||||||||
Total from investment operations | 23.48 | (40.90 | ) | 58.23 | (30.04 | ) | ||||||||||
Less distributions from: | ||||||||||||||||
Net investment income | (1.29 | ) | — | — | — | |||||||||||
Net realized gains | (4.20 | ) | (13.78 | ) | (6.67 | ) | — | |||||||||
Total distributions | (5.49 | ) | (13.78 | ) | (6.67 | ) | — | |||||||||
Net asset value, end of year | $143.98 | $125.99 | $180.67 | $129.11 | ||||||||||||
Total returnd | 19.14% | (24.09)% | 45.76% | (18.88)% | ||||||||||||
Ratios to average net assetse | ||||||||||||||||
Expenses before waiver and payments by affiliates | 1.79% | 1.71% | 1.75% | 1.82% | ||||||||||||
Expenses net of waiver and payments by affiliatesf | 1.77% | 1.70% | 1.75% | g | 1.82% | g | ||||||||||
Net investment income (loss) | (1.33)% | (1.28)% | (1.42)% | (1.52)% | ||||||||||||
Supplemental data | ||||||||||||||||
Net assets, end of year (000’s) | $53,935 | $17,562 | $23,051 | $5,486 | ||||||||||||
Portfolio turnover rate | 34.12% | 22.13% | 41.43% | 48.70% | ||||||||||||
aFor the period March 4, 2014 (effective date) to April 30, 2014.
bThe amount shown for a share outstanding throughout the period may not correlate with the Statement of Operations for the period due to the timing of sales and repurchases of the Fund’s shares in relation to income earned and/or fluctuating fair value of the investments of the Fund.
cBased on average daily shares outstanding.
dTotal return does not reflect sales commissions or contingent deferred sales charges, if applicable, and is not annualized for periods less than one year.
eRatios are annualized for periods less than one year.
fBenefit of expense reduction rounds to less than 0.01%.
gBenefit of waiver and payments by affiliates rounds to less than 0.01%.
franklintempleton.com | The accompanying notes are an integral part of these financial statements. | | Annual Report | 19 | |||
FRANKLIN STRATEGIC SERIES
FINANCIAL HIGHLIGHTS
Franklin Biotechnology Discovery Fund (continued)
| Year Ended April 30, | ||||||||||||||||
| 2017 | 2016 | 2015 | 2014a | |||||||||||||
Class R6 | ||||||||||||||||
Per share operating performance | ||||||||||||||||
(for a share outstanding throughout the year) | ||||||||||||||||
Net asset value, beginning of year | $131.37 | $185.75 | $131.09 | $104.56 | ||||||||||||
Income from investment operationsb: | ||||||||||||||||
Net investment income (loss)c | (0.25 | ) | (0.32 | ) | (0.45 | ) | (0.49 | ) | ||||||||
Net realized and unrealized gains (losses) | 26.41 | (40.28 | ) | 61.78 | 35.81 | |||||||||||
Total from investment operations | 26.16 | (40.60 | ) | 61.33 | 35.32 | |||||||||||
Less distributions from: | ||||||||||||||||
Net investment income | (2.30 | ) | — | — | — | |||||||||||
Net realized gains | (4.20 | ) | (13.78 | ) | (6.67 | ) | (8.79 | ) | ||||||||
Total distributions | (6.50 | ) | (13.78 | ) | (6.67 | ) | (8.79 | ) | ||||||||
Net asset value, end of year | $151.03 | $131.37 | $185.75 | $131.09 | ||||||||||||
Total returnd | 20.50% | (23.24)% | 47.40% | 34.10% | ||||||||||||
Ratios to average net assetse | ||||||||||||||||
Expenses before waiver and payments by affiliates | 0.63% | 0.60% | 0.60% | 0.63% | ||||||||||||
Expenses net of waiver and payments by affiliatesf | 0.61% | 0.59% | 0.60% | g | 0.63% | g | ||||||||||
Net investment income (loss) | (0.17)% | (0.17)% | (0.27)% | (0.35)% | ||||||||||||
Supplemental data | ||||||||||||||||
Net assets, end of year (000’s) | $8,891 | $5,568 | $76,436 | $50,846 | ||||||||||||
Portfolio turnover rate | 34.12% | 22.13% | 41.43% | 48.70% | ||||||||||||
aFor the year May 1, 2013 (effective date) to April 30, 2014.
bThe amount shown for a share outstanding throughout the period may not correlate with the Statement of Operations for the period due to the timing of sales and repurchases of the Fund’s shares in relation to income earned and/or fluctuating fair value of the investments of the Fund.
cBased on average daily shares outstanding.
dTotal return is not annualized for periods less than one year.
eRatios are annualized for periods less than one year.
fBenefit of expense reduction rounds to less than 0.01%.
gBenefit of waiver and payments by affiliates rounds to less than 0.01%.
20 | Annual Report | The accompanying notes are an integral part of these financial statements. | franklintempleton.com | ||
FRANKLIN STRATEGIC SERIES
FINANCIAL HIGHLIGHTS
Franklin Biotechnology Discovery Fund (continued)
| Year Ended April 30, | ||||||||||||||||||||
| 2017 | 2016 | 2015 | 2014 | 2013 | ||||||||||||||||
Advisor Class | ||||||||||||||||||||
Per share operating performance | ||||||||||||||||||||
(for a share outstanding throughout the year) | ||||||||||||||||||||
Net asset value, beginning of year | $130.67 | $185.12 | $130.86 | $106.86 | $ 76.65 | |||||||||||||||
Income from investment operationsa: | ||||||||||||||||||||
Net investment income (loss)b | (0.46 | ) | (0.55 | ) | (0.70 | ) | (0.69 | ) | (0.52 | ) | ||||||||||
Net realized and unrealized gains (losses) | 26.27 | (40.12 | ) | 61.63 | 33.48 | 30.80 | ||||||||||||||
Total from investment operations | 25.81 | (40.67 | ) | 60.93 | 32.79 | 30.28 | ||||||||||||||
Less distributions from: | ||||||||||||||||||||
Net investment income | (2.08 | ) | — | — | — | (0.07 | ) | |||||||||||||
Net realized gains | (4.20 | ) | (13.78 | ) | (6.67 | ) | (8.79 | ) | — | |||||||||||
Total distributions | (6.28 | ) | (13.78 | ) | (6.67 | ) | (8.79 | ) | (0.07 | ) | ||||||||||
Net asset value, end of year | $150.20 | $130.67 | $185.12 | $130.86 | $106.86 | |||||||||||||||
Total return | 20.32% | (23.36)% | 47.17% | 31.02% | 39.51% | |||||||||||||||
Ratios to average net assets | ||||||||||||||||||||
Expenses before waiver and payments by affiliates | 0.79% | 0.75% | 0.75% | 0.80% | 0.91% | |||||||||||||||
Expenses net of waiver and payments by affiliates | 0.77% | c | 0.74% | c | 0.75% | c,d | 0.80% | c,d | 0.91% | |||||||||||
Net investment income (loss) | (0.33)% | (0.32)% | (0.42)% | (0.52)% | (0.59)% | |||||||||||||||
Supplemental data | ||||||||||||||||||||
Net assets, end of year (000’s) | $159,894 | $93,263 | $167,035 | $91,012 | $25,744 | |||||||||||||||
Portfolio turnover rate | 34.12% | 22.13% | 41.43% | 48.70% | 33.64% | |||||||||||||||
aThe amount shown for a share outstanding throughout the period may not correlate with the Statement of Operations for the period due to the timing of sales and repurchases of the Fund’s shares in relation to income earned and/or fluctuating fair value of the investments of the Fund.
bBased on average daily shares outstanding.
cBenefit of expense reduction rounds to less than 0.01%.
dBenefit of waiver and payments by affiliates rounds to less than 0.01%.
franklintempleton.com | The accompanying notes are an integral part of these financial statements. | | Annual Report | 21 | |||
FRANKLIN STRATEGIC SERIES
Statement of Investments, April 30, 2017
Franklin Biotechnology Discovery Fund
Country | Shares/ Warrants | Value | ||||||||||
Common Stocks and Other Equity Interests 97.5% | ||||||||||||
Biotechnology 83.9% | ||||||||||||
a Acadia Pharmaceuticals Inc. | United States | 949,600 | $ | 32,599,768 | ||||||||
a Acceleron Pharma Inc. | United States | 186,700 | 6,164,834 | |||||||||
a,b ADMA Biologics Inc. | United States | 135,600 | 611,556 | |||||||||
a Alder Biopharmaceuticals Inc. | United States | 94,400 | 1,892,720 | |||||||||
a Alexion Pharmaceuticals Inc. | United States | 641,300 | 81,945,314 | |||||||||
Amgen Inc. | United States | 253,900 | 41,466,948 | |||||||||
a Amicus Therapeutics Inc. | United States | 736,100 | 5,653,248 | |||||||||
a,b AnaptysBio, Inc. | United States | 102,470 | 2,733,900 | |||||||||
a,b,c Aptose Biosciences Inc., 144A | Canada | 189,431 | 165,157 | |||||||||
a,b Aquinox Pharmaceuticals Inc. | Canada | 469,500 | 6,892,260 | |||||||||
a,b,d ARCA biopharma Inc. | United States | 478,077 | 1,290,808 | |||||||||
a,d,e ARCA biopharma Inc., wts., 6/16/22 | United States | 1,338,619 | 61,040 | |||||||||
a Array BioPharma Inc. | United States | 1,270,100 | 11,011,767 | |||||||||
a Audentes Therapeutics Inc. | United States | 139,400 | 2,077,060 | |||||||||
a,b Aurinia Pharmaceuticals Inc. | Canada | 459,100 | 3,218,291 | |||||||||
a AveXis Inc. | United States | 237,118 | 19,087,999 | |||||||||
a,b Axovant Sciences Ltd. | United States | 589,582 | 14,291,468 | |||||||||
a Bellicum Pharmaceuticals Inc. | United States | 257,000 | 3,436,090 | |||||||||
a Biogen Inc. | United States | 334,761 | 90,790,531 | |||||||||
a BioMarin Pharmaceutical Inc. | United States | 410,256 | 39,318,935 | |||||||||
a Bioverativ Inc. | United States | 134,280 | 7,897,007 | |||||||||
a Bluebird Bio Inc. | United States | 190,000 | 16,900,500 | |||||||||
a Blueprint Medicines Corp. | United States | 76,400 | 3,558,712 | |||||||||
a,b Calithera Biosciences Inc. | United States | 275,500 | 2,989,175 | |||||||||
a,b Cara Therapeutics Inc. | United States | 202,400 | 3,216,136 | |||||||||
a Cascadian Therapeutics Inc. | United States | 457,783 | 1,945,578 | |||||||||
a Celgene Corp. | United States | 1,076,900 | 133,589,444 | |||||||||
a Celldex Therapeutics Inc. | United States | 1,265,929 | 4,215,544 | |||||||||
a,b Cellectis SA, ADR | France | 97,200 | 2,343,492 | |||||||||
a ChemoCentryx Inc. | United States | 817,508 | 5,918,758 | |||||||||
a Clovis Oncology Inc. | United States | 359,000 | 20,782,510 | |||||||||
a Concert Pharmaceuticals Inc. | United States | 263,800 | 4,186,506 | |||||||||
a,b CRISPR Therapeutics AG | Switzerland | 136,300 | 2,319,826 | |||||||||
a,f CRISPR Therapeutics AG, Reg S | Switzerland | 137,714 | 2,241,261 | |||||||||
a CytomX Therapeutics Inc. | United States | 125,100 | 1,965,321 | |||||||||
a,b DelMar Pharmaceuticals Inc. | Canada | 388,770 | 1,045,791 | |||||||||
a,e DelMar Pharmaceuticals Inc., wts., 2/01/49 | Canada | 291,578 | 149,989 | |||||||||
a,b Dynavax Technologies Corp. | United States | 368,070 | 2,042,788 | |||||||||
a Edge Therapeutics Inc. | United States | 702,846 | 7,295,541 | |||||||||
a Epizyme Inc. | United States | 450,800 | 8,136,940 | |||||||||
a Exelixis Inc. | United States | 765,100 | 17,138,240 | |||||||||
a,d Fate Therapeutics Inc. | United States | 2,373,777 | 10,895,636 | |||||||||
a,b Genocea Biosciences Inc. | United States | 1,133,200 | 7,241,148 | |||||||||
Gilead Sciences Inc. | United States | 854,100 | 58,548,555 | |||||||||
a GlycoMimetics Inc. | United States | 379,800 | 1,633,140 | |||||||||
a Heron Therapeutics Inc. | United States | 1,700,356 | 26,100,465 | |||||||||
a Immune Design Corp. | United States | 241,427 | 1,581,347 | |||||||||
a Incyte Corp. | United States | 653,200 | 81,179,696 | |||||||||
a,f Intarcia Therapeutics Inc., DD | United States | 80,195 | 4,811,700 | |||||||||
a,b Intellia Therapeutics Inc. | United States | 112,400 | 1,637,668 | |||||||||
a Karyopharm Therapeutics Inc. | United States | 652,554 | 6,669,102 | |||||||||
a Kite Pharma Inc. | United States | 88,844 | 7,292,315 | |||||||||
22 | Annual Report | franklintempleton.com | ||
FRANKLIN STRATEGIC SERIES
STATEMENT OF INVESTMENTS
Franklin Biotechnology Discovery Fund (continued)
Country | Shares/ Warrants | Value | ||||||||||
Common Stocks and Other Equity Interests (continued) | ||||||||||||
Biotechnology (continued) | ||||||||||||
a La Jolla Pharmaceutical Co. | United States | 296,900 | $ | 8,610,100 | ||||||||
a Lion Biotechnologies Inc. | United States | 1,378,100 | 9,439,985 | |||||||||
a Loxo Oncology Inc. | United States | 162,200 | 7,470,932 | |||||||||
a MacroGenics Inc. | United States | 223,000 | 4,819,030 | |||||||||
a,b Merrimack Pharmaceuticals Inc. | United States | 1,402,187 | 4,669,283 | |||||||||
a Merus BV | Netherlands | 240,506 | 5,339,233 | |||||||||
a Minerva Neurosciences Inc. | United States | 321,900 | 2,446,440 | |||||||||
a,b Mirna Therapeutics Inc. | United States | 545,947 | 1,146,489 | |||||||||
a Natera Inc. | United States | 392,629 | 3,553,292 | |||||||||
a Neurocrine Biosciences Inc. | United States | 898,400 | 47,974,560 | |||||||||
a NewLink Genetics Corp. | United States | 205,300 | 3,837,057 | |||||||||
a,e Northwest Biotherapeutics Inc., wts., 2/20/19 | United States | 223,880 | 2,516 | |||||||||
a OncoMed Pharmaceuticals Inc. | United States | 376,800 | 1,484,592 | |||||||||
a OvaScience Inc. | United States | 250,154 | 377,733 | |||||||||
a Pfenex Inc. | United States | 532,384 | 2,560,767 | |||||||||
a ProQR Therapeutics NV | Netherlands | 123,300 | 604,170 | |||||||||
a Proteostasis Therapeutics Inc. | United States | 88,600 | 535,587 | |||||||||
a Ra Pharmaceuticals Inc. | United States | 140,500 | 3,315,800 | |||||||||
a Radius Health Inc. | United States | 157,400 | 6,149,618 | |||||||||
a Regeneron Pharmaceuticals Inc. | United States | 167,009 | 64,881,326 | |||||||||
a REGENXBIO Inc. | United States | 345,200 | 7,214,680 | |||||||||
a Retrophin Inc. | United States | 376,194 | 7,369,640 | |||||||||
a Sage Therapeutics Inc. | United States | 135,770 | 9,639,670 | |||||||||
a Seattle Genetics Inc. | United States | 12,069 | 824,313 | |||||||||
a Stemline Therapeutics Inc. | United States | 548,004 | 4,877,236 | |||||||||
a Tesaro Inc. | United States | 528,344 | 77,978,291 | |||||||||
a,b TG Therapeutics Inc. | United States | 504,000 | 5,569,200 | |||||||||
a Threshold Pharmaceuticals Inc., wts., 2/12/20 | United States | 439,500 | — | |||||||||
a Tocagen Inc. | United States | 108,400 | 1,515,432 | |||||||||
a,b Tracon Pharmaceuticals Inc. | United States | 333,860 | 1,185,203 | |||||||||
a,b Trillium Therapeutics Inc. | Canada | 158,100 | 972,315 | |||||||||
a,b Vascular Biogenics Ltd. | Israel | 340,900 | 1,943,130 | |||||||||
a Vertex Pharmaceuticals Inc. | United States | 388,800 | 45,995,040 | |||||||||
a vTv Therapeutics Inc., A | United States | 370,900 | 2,043,659 | |||||||||
a Xencor Inc. | United States | 230,332 | 5,912,622 | |||||||||
|
| |||||||||||
|
1,174,438,466 |
| ||||||||||
|
| |||||||||||
Life Sciences Tools & Services 4.1% | ||||||||||||
a Illumina Inc. | United States | 309,700 | 57,251,142 | |||||||||
|
| |||||||||||
Pharmaceuticals 9.5% | ||||||||||||
a,f Acerta Pharma BV | Netherlands | 107,297,280 | 4,153,049 | |||||||||
a Aclaris Therapeutics Inc. | United States | 349,062 | 9,812,133 | |||||||||
a,b Agile Therapeutics Inc. | United States | 846,353 | 3,038,407 | |||||||||
a,b,d Alcobra Ltd. | Israel | 1,737,306 | 1,997,902 | |||||||||
a Aratana Therapeutics Inc. | United States | 904,000 | 5,604,800 | |||||||||
a,b,d BioPharmX Corp. | United States | 1,900,375 | 1,570,470 | |||||||||
a,c,d BioPharmX Corp., 144A | United States | 1,945,737 | 1,607,957 | |||||||||
a,d,e BioPharmX Corp., wts., 3/29/21 | United States | 108,000 | 39,908 | |||||||||
a,d,e BioPharmX Corp., wts., 11/22/23 | United States | 1,259,925 | 544,390 | |||||||||
a Collegium Pharmaceutical Inc. | United States | 442,700 | 4,342,887 | |||||||||
a,b Egalet Corp. | United States | 1,032,677 | 3,944,826 | |||||||||
a Flex Pharma Inc. | United States | 170,200 | 585,488 | |||||||||
franklintempleton.com | Annual Report | 23 | ||
FRANKLIN STRATEGIC SERIES
STATEMENT OF INVESTMENTS
Franklin Biotechnology Discovery Fund (continued)
Country | Shares/ Warrants | Value | ||||||||||
Common Stocks and Other Equity Interests (continued) | ||||||||||||
Pharmaceuticals (continued) | ||||||||||||
a Foamix Pharmaceuticals Ltd. | Israel | 371,100 | $ | 1,562,331 | ||||||||
a GW Pharmaceuticals PLC, ADR | United Kingdom | 106,767 | 12,676,446 | |||||||||
a Jazz Pharmaceuticals PLC | United States | 97,900 | 15,593,512 | |||||||||
a,b Marinus Pharmaceuticals Inc. | United States | 831,820 | 1,197,821 | |||||||||
a The Medicines Co. | United States | 405,700 | 20,009,124 | |||||||||
a,b Nabriva Therapeutics AG, ADR | Austria | 140,100 | 1,503,273 | |||||||||
a,b Neos Therapeutics Inc. | United States | 614,800 | 4,365,080 | |||||||||
a Neuroderm Ltd. | Israel | 232,600 | 6,716,325 | |||||||||
a,b,g Novan Inc. | United States | 120,969 | 658,071 | |||||||||
a Paratek Pharmaceuticals Inc. | United States | 107,993 | 2,316,450 | |||||||||
a Revance Therapeutics Inc. | United States | 377,100 | 8,201,925 | |||||||||
a,b TherapeuticsMD Inc. | United States | 2,700,640 | 13,773,264 | |||||||||
a,b Zogenix Inc. | United States | 246,315 | 2,709,465 | |||||||||
a Zymeworks Inc. | Canada | 296,400 | 3,853,200 | |||||||||
|
| |||||||||||
|
132,378,504 |
| ||||||||||
|
| |||||||||||
Total Common Stocks and Other Equity Interests | ||||||||||||
(Cost $858,410,734) | 1,364,068,112 | |||||||||||
|
| |||||||||||
Preferred Stocks 0.3% | ||||||||||||
Biotechnology 0.1% | ||||||||||||
a,f True North Therapeutics Inc., pfd., Series D, 144A | United States | 759,880 | 1,900,004 | |||||||||
|
| |||||||||||
Pharmaceuticals 0.2% | ||||||||||||
a,f G1 Therapeutics Inc., pfd. | United States | 942,380 | 3,028,056 | |||||||||
|
| |||||||||||
Total Preferred Stocks | ||||||||||||
(Cost $4,700,003) | 4,928,060 | |||||||||||
|
| |||||||||||
Total Investments before Short Term Investments | ||||||||||||
(Cost $863,110,737) | 1,368,996,172 | |||||||||||
|
| |||||||||||
Short Term Investments 6.1% | ||||||||||||
Money Market Funds (Cost $26,158,969) 1.9% | ||||||||||||
h,i Institutional Fiduciary Trust Money Market Portfolio, 0.37% | United States | 26,158,969 | 26,158,969 | |||||||||
|
| |||||||||||
j Investments from Cash Collateral Received for Loaned | ||||||||||||
Securities (Cost $59,514,173) 4.2% | ||||||||||||
Money Market Funds 4.2% | ||||||||||||
h,i Institutional Fiduciary Trust Money Market Portfolio, 0.37% | United States | 59,514,173 | 59,514,173 | |||||||||
|
| |||||||||||
Total Investments (Cost $948,783,879) 103.9% | 1,454,669,314 | |||||||||||
Other Assets, less Liabilities (3.9)% | (55,262,062 | ) | ||||||||||
|
| |||||||||||
Net Assets 100.0% |
$ |
1,399,407,252 |
| |||||||||
|
| |||||||||||
24 | Annual Report | franklintempleton.com | ||
FRANKLIN STRATEGIC SERIES
STATEMENT OF INVESTMENTS
Franklin Biotechnology Discovery Fund (continued)
See Abbreviations on page 49.
aNon-income producing.
bA portion or all of the security is on loan at April 30, 2017. See Note 1(c).
cSecurity was purchased pursuant to Rule 144A under the Securities Act of 1933 and may be sold in transactions exempt from registration only to qualified institutional buyers or in a public offering registered under the Securities Act of 1933. These securities have been deemed liquid under guidelines approved by the Trust’s Board of Trustees. At April 30, 2017, the aggregate value of these securities was $1,773,114, representing 0.1% of net assets.
dSee regarding holdings of 5% voting securities.
eSecurity has been deemed illiquid because it may not be able to be sold within seven days. At April 30, 2017, the aggregate value of these securities was $797,843, representing 0.1% of net assets.
fSee Note 7 regarding restricted securities.
gAt April 30, 2017, pursuant to the Fund’s policies and the requirements of applicable securities law, the Fund is restricted from trading this security at year end.
hSee Note 3(f) regarding investments in affiliated management investment companies.
iThe rate shown is the annualized seven-day yield at period end.
jSee Note 1(c) regarding securities on loan.
franklintempleton.com | The accompanying notes are an integral part of these financial statements. | Annual Report | 25 | ||
FRANKLIN STRATEGIC SERIES
Financial Highlights
Franklin Natural Resources Fund
| Year Ended April 30, | ||||||||||||||||||||
| 2017 | 2016 | 2015 | 2014 | 2013 | ||||||||||||||||
Class A | ||||||||||||||||||||
Per share operating performance | ||||||||||||||||||||
(for a share outstanding throughout the year) | ||||||||||||||||||||
Net asset value, beginning of year | $25.02 | $31.46 | $39.79 | $33.03 | $35.81 | |||||||||||||||
Income from investment operationsa: | ||||||||||||||||||||
Net investment incomeb | 0.20 | 0.29 | 0.23 | 0.19 | 0.08 | |||||||||||||||
Net realized and unrealized gains (losses) | 0.17 | (6.55 | ) | (8.27 | ) | 6.65 | (2.86 | ) | ||||||||||||
Total from investment operations | 0.37 | (6.26 | ) | (8.04 | ) | 6.84 | (2.78 | ) | ||||||||||||
Less distributions from net investment income | (0.28 | ) | (0.18 | ) | (0.29 | ) | (0.08 | ) | — | |||||||||||
Net asset value, end of year | $25.11 | $25.02 | $31.46 | $39.79 | $33.03 | |||||||||||||||
Total returnc | 1.37% | (19.80)% | (20.07)% | 20.74% | (7.76)% | |||||||||||||||
Ratios to average net assets | ||||||||||||||||||||
Expenses before waiver and payments by affiliates | 1.06% | 1.14% | 1.08% | 1.07% | 1.08% | |||||||||||||||
Expenses net of waiver and payments by affiliates | 1.05% | d | 1.13% | 1.08% | d,e | 1.07% | d,e | 1.08% | ||||||||||||
Net investment income | 0.79% | 1.22% | 0.67% | 0.53% | 0.26% | |||||||||||||||
Supplemental data | ||||||||||||||||||||
Net assets, end of year (000’s) | $398,703 | $461,596 | $572,518 | $624,250 | $628,722 | |||||||||||||||
Portfolio turnover rate | 29.74% | 35.77% | 30.05% | 21.03% | 20.40% | |||||||||||||||
aThe amount shown for a share outstanding throughout the period may not correlate with the Statement of Operations for the period due to the timing of sales and repurchases of the Fund’s shares in relation to income earned and/or fluctuating fair value of the investments of the Fund.
bBased on average daily shares outstanding.
cTotal return does not reflect sales commissions or contingent deferred sales charges, if applicable.
dBenefit of expense reduction rounds to less than 0.01%.
eBenefit of waiver and payments by affiliates rounds to less than 0.01%.
26 | Annual Report | The accompanying notes are an integral part of these financial statements. | franklintempleton.com | ||
FRANKLIN STRATEGIC SERIES
FINANCIAL HIGHLIGHTS
Franklin Natural Resources Fund (continued)
| Year Ended April 30, | ||||||||||||||||||||
| 2017 | 2016 | 2015 | 2014 | 2013 | ||||||||||||||||
Class C | ||||||||||||||||||||
Per share operating performance | ||||||||||||||||||||
(for a share outstanding throughout the year) | ||||||||||||||||||||
Net asset value, beginning of year | $24.25 | $30.46 | $38.39 | $32.02 | $34.96 | |||||||||||||||
Income from investment operationsa: | ||||||||||||||||||||
Net investment income (loss)b | 0.01 | 0.11 | (0.01 | ) | (0.06 | ) | (0.14 | ) | ||||||||||||
Net realized and unrealized gains (losses) | 0.15 | (6.31 | ) | (7.91 | ) | 6.43 | (2.80 | ) | ||||||||||||
Total from investment operations | 0.16 | (6.20 | ) | (7.92 | ) | 6.37 | (2.94 | ) | ||||||||||||
Less distributions from net investment income | (0.13 | ) | (0.01 | ) | (0.01 | ) | — | — | ||||||||||||
Net asset value, end of year | $24.28 | $24.25 | $30.46 | $38.39 | $32.02 | |||||||||||||||
Total returnc | 0.63% | (20.37)% | (20.63)% | 19.89% | (8.41)% | |||||||||||||||
Ratios to average net assets | ||||||||||||||||||||
Expenses before waiver and payments by affiliates | 1.81% | 1.87% | 1.78% | 1.76% | 1.77% | |||||||||||||||
Expenses net of waiver and payments by affiliates | 1.80% | d | 1.86% | 1.78% | d,e | 1.76% | d,e | 1.77% | ||||||||||||
Net investment income (loss) | 0.04% | 0.49% | (0.03)% | (0.16)% | (0.43)% | |||||||||||||||
Supplemental data | ||||||||||||||||||||
Net assets, end of year (000’s) | $96,835 | $107,724 | $123,735 | $126,651 | $130,424 | |||||||||||||||
Portfolio turnover rate | 29.74% | 35.77% | 30.05% | 21.03% | 20.40% | |||||||||||||||
aThe amount shown for a share outstanding throughout the period may not correlate with the Statement of Operations for the period due to the timing of sales and repurchases of the Fund’s shares in relation to income earned and/or fluctuating fair value of the investments of the Fund.
bBased on average daily shares outstanding.
cTotal return does not reflect sales commissions or contingent deferred sales charges, if applicable.
dBenefit of expense reduction rounds to less than 0.01%.
eBenefit of waiver and payments by affiliates rounds to less than 0.01%.
franklintempleton.com | The accompanying notes are an integral part of these financial statements. | | Annual Report | 27 | |||
FRANKLIN STRATEGIC SERIES
FINANCIAL HIGHLIGHTS
Franklin Natural Resources Fund (continued)
| Year Ended April 30, | ||||||||||||||||
| 2017 | 2016 | 2015 | 2014a | |||||||||||||
Class R6 | ||||||||||||||||
Per share operating performance | ||||||||||||||||
(for a share outstanding throughout the year) | ||||||||||||||||
Net asset value, beginning of year | $26.73 | $33.62 | $42.58 | $38.28 | ||||||||||||
Income from investment operationsb: | ||||||||||||||||
Net investment incomec | 0.47 | 0.51 | 0.46 | 0.19 | ||||||||||||
Net realized and unrealized gains (losses) | 0.04 | (7.06 | ) | (8.92 | ) | 4.31 | ||||||||||
Total from investment operations | 0.51 | (6.55 | ) | (8.46 | ) | 4.50 | ||||||||||
Less distributions from net investment income | (0.37 | ) | (0.34 | ) | (0.50 | ) | (0.20 | ) | ||||||||
Net asset value, end of year | $26.87 | $26.73 | $33.62 | $42.58 | ||||||||||||
Total returnd | 1.89% | (19.31)% | (19.61)% | 11.83% | ||||||||||||
Ratios to average net assetse | ||||||||||||||||
Expenses before waiver and payments by affiliates | 0.83% | 0.60% | 0.55% | 0.55% | ||||||||||||
Expenses net of waiver and payments by affiliates | 0.54%f | 0.55% | 0.54%f | 0.53%f | ||||||||||||
Net investment income | 1.30% | 1.80% | 1.21% | 1.07% | ||||||||||||
Supplemental data | ||||||||||||||||
Net assets, end of year (000’s) | $218 | $15 | $439 | $939 | ||||||||||||
Portfolio turnover rate | 29.74% | 35.77% | 30.05% | 21.03% | ||||||||||||
aFor the period September 20, 2013 (effective date) to April 30, 2014.
bThe amount shown for a share outstanding throughout the period may not correlate with the Statement of Operations for the period due to the timing of sales and repurchases of the Fund’s shares in relation to income earned and/or fluctuating fair value of the investments of the Fund.
cBased on average daily shares outstanding.
dTotal return is not annualized for periods less than one year.
eRatios are annualized for periods less than one year.
fBenefit of expense reduction rounds to less than 0.01%.
28 | Annual Report | The accompanying notes are an integral part of these financial statements. | franklintempleton.com | ||
FRANKLIN STRATEGIC SERIES
FINANCIAL HIGHLIGHTS
Franklin Natural Resources Fund (continued)
| Year Ended April 30, | ||||||||||||||||||||
| 2017 | 2016 | 2015 | 2014 | 2013 | ||||||||||||||||
Advisor Class | ||||||||||||||||||||
Per share operating performance | ||||||||||||||||||||
(for a share outstanding throughout the year) | ||||||||||||||||||||
Net asset value, beginning of year | $26.71 | $33.63 | $42.52 | $35.31 | $38.17 | |||||||||||||||
Income from investment operationsa: | ||||||||||||||||||||
Net investment incomeb | 0.29 | 0.36 | 0.35 | 0.31 | 0.21 | |||||||||||||||
Net realized and unrealized gains (losses) | 0.17 | (7.00 | ) | (8.85 | ) | 7.10 | (3.07 | ) | ||||||||||||
Total from investment operations | 0.46 | (6.64 | ) | (8.50 | ) | 7.41 | (2.86 | ) | ||||||||||||
Less distributions from net investment income | (0.36 | ) | (0.28 | ) | (0.39 | ) | (0.20 | ) | — | |||||||||||
Net asset value, end of year | $26.81 | $26.71 | $33.63 | $42.52 | $35.31 | |||||||||||||||
Total return | 1.64% | (19.60)% | (19.81)% | 21.07% | (7.49)% | |||||||||||||||
Ratios to average net assets | ||||||||||||||||||||
Expenses before waiver and payments by affiliates | 0.81% | 0.87% | 0.78% | 0.77% | 0.78% | |||||||||||||||
Expenses net of waiver and payments by affiliates | 0.80% | c | 0.86% | 0.78% | c,d | 0.77% | c,d | 0.78% | ||||||||||||
Net investment income | 1.04% | 1.49% | 0.97% | 0.83% | 0.56% | |||||||||||||||
Supplemental data | ||||||||||||||||||||
Net assets, end of year (000’s) | $94,070 | $90,185 | $79,307 | $94,651 | $117,087 | |||||||||||||||
Portfolio turnover rate | 29.74% | 35.77% | 30.05% | 21.03% | 20.40% | |||||||||||||||
aThe amount shown for a share outstanding throughout the period may not correlate with the Statement of Operations for the period due to the timing of sales and repurchases of the Fund’s shares in relation to income earned and/or fluctuating fair value of the investments of the Fund.
bBased on average daily shares outstanding.
cBenefit of expense reduction rounds to less than 0.01%.
dBenefit of waiver and payments by affiliates rounds to less than 0.01%.
franklintempleton.com | The accompanying notes are an integral part of these financial statements. | | Annual Report | 29 | |||
FRANKLIN STRATEGIC SERIES
Statement of Investments, April 30, 2017
Franklin Natural Resources Fund
Country
| Shares
| Value
| ||||||||||
Common Stocks 97.0% | ||||||||||||
Coal & Consumable Fuels 0.0% | ||||||||||||
a,b Energy Coal Resources, 144A | United States | 199,375 | $ | — | ||||||||
|
| |||||||||||
Copper 4.2% | ||||||||||||
Antofagasta PLC | United Kingdom | 598,500 | 6,496,487 | |||||||||
First Quantum Minerals Ltd. | Canada | 293,800 | 2,800,453 | |||||||||
a Freeport-McMoRan Inc. | United States | 440,300 | 5,613,825 | |||||||||
a Imperial Metals Corp. | Canada | 380,700 | 1,693,054 | |||||||||
Lundin Mining Corp. | Canada | 543,100 | 2,896,745 | |||||||||
Sandfire Resources NL | Australia | 1,194,967 | 5,180,495 | |||||||||
|
| |||||||||||
|
24,681,059 |
| ||||||||||
|
| |||||||||||
Diversified Metals & Mining 5.4% | ||||||||||||
BHP Billiton PLC, ADR | United Kingdom | 364,700 | 11,207,231 | |||||||||
a Glencore PLC | Switzerland | 1,583,400 | 6,227,795 | |||||||||
Hudbay Minerals Inc. | Canada | 245,800 | 1,467,704 | |||||||||
a Nautilus Minerals Inc. | Canada | 3,895,831 | 727,846 | |||||||||
Rio Tinto PLC, ADR | United Kingdom | 154,200 | 6,140,244 | |||||||||
South32 Ltd. | Australia | 1,314,600 | 2,736,373 | |||||||||
Teck Resources Ltd., B | Canada | 159,600 | 3,310,104 | |||||||||
|
| |||||||||||
|
31,817,297 |
| ||||||||||
|
| |||||||||||
Fertilizers & Agricultural Chemicals 0.4% | ||||||||||||
The Mosaic Co. | United States | 88,200 | 2,375,226 | |||||||||
|
| |||||||||||
Gold 6.2% | ||||||||||||
Agnico Eagle Mines Ltd. | Canada | 72,000 | 3,442,011 | |||||||||
Alamos Gold Inc., A | Canada | 470,100 | 3,364,992 | |||||||||
a B2Gold Corp. | Canada | 1,829,800 | 4,598,296 | |||||||||
Barrick Gold Corp. | Canada | 318,900 | 5,332,008 | |||||||||
Goldcorp Inc. | Canada | 389,300 | 5,434,628 | |||||||||
a Guyana Goldfields Inc. | Canada | 758,600 | 3,762,709 | |||||||||
Newcrest Mining Ltd. | Australia | 184,000 | 2,915,213 | |||||||||
OceanaGold Corp. | Australia | 473,310 | 1,543,138 | |||||||||
Randgold Resources Ltd., ADR | United Kingdom | 31,700 | 2,789,283 | |||||||||
Tahoe Resources Inc. | Canada | 398,500 | 3,229,108 | |||||||||
|
| |||||||||||
|
36,411,386 |
| ||||||||||
|
| |||||||||||
Integrated Oil & Gas 17.1% | ||||||||||||
BP PLC, ADR | United Kingdom | 182,000 | 6,246,240 | |||||||||
Chevron Corp. | United States | 115,500 | 12,323,850 | |||||||||
Exxon Mobil Corp. | United States | 148,600 | 12,133,190 | |||||||||
Occidental Petroleum Corp. | United States | 318,300 | 19,588,182 | |||||||||
a Petroleo Brasileiro SA, ADR | Brazil | 206,400 | 1,859,664 | |||||||||
Royal Dutch Shell PLC, A | United Kingdom | 48,347 | 1,254,043 | |||||||||
Royal Dutch Shell PLC, A, ADR | United Kingdom | 371,800 | 19,404,242 | |||||||||
Suncor Energy Inc. | Canada | 476,000 | 14,919,247 | |||||||||
Total SA, B, ADR | France | 261,810 | 13,396,818 | |||||||||
|
| |||||||||||
|
101,125,476 |
| ||||||||||
|
| |||||||||||
Oil & Gas Drilling 1.5% | ||||||||||||
Ensco PLC, A | United States | 317,319 | 2,503,647 | |||||||||
a Pioneer Energy Services Corp. | United States | 931,943 | 2,842,426 | |||||||||
a Rowan Cos. PLC | United States | 265,900 | 3,741,213 | |||||||||
|
| |||||||||||
|
9,087,286 |
| ||||||||||
|
| |||||||||||
30 | Annual Report | franklintempleton.com | ||
FRANKLIN STRATEGIC SERIES
STATEMENT OF INVESTMENTS
Franklin Natural Resources Fund (continued)
Country
| Shares
| Value
| ||||||||||
Common Stocks (continued) | ||||||||||||
Oil & Gas Equipment & Services 20.4% | ||||||||||||
Baker Hughes Inc. | United States | 203,500 | $ | 12,081,795 | ||||||||
a Dril-Quip Inc. | United States | 80,200 | 4,134,310 | |||||||||
Halliburton Co. | United States | 437,135 | 20,055,754 | |||||||||
Hunting PLC | United Kingdom | 253,600 | 1,847,745 | |||||||||
a Keane Group Inc. | United States | 152,200 | 2,103,404 | |||||||||
a Mammoth Energy Services Inc. | United States | 82,800 | 1,598,040 | |||||||||
Oceaneering International Inc. | United States | 317,000 | 8,365,630 | |||||||||
a Oil States International Inc. | United States | 179,000 | 5,325,250 | |||||||||
a PHI Inc., non-voting | United States | 117,900 | 1,382,967 | |||||||||
a ProPetro Holding Corp. | United States | 156,200 | 2,116,510 | |||||||||
RPC Inc. | United States | 178,000 | 3,234,260 | |||||||||
Schlumberger Ltd. | United States | 408,147 | 29,627,391 | |||||||||
a Superior Energy Services Inc. | United States | 923,900 | 11,160,712 | |||||||||
a TechnipFMC PLC | United Kingdom | 403,000 | 12,142,390 | |||||||||
a Weatherford International PLC | United States | 960,100 | 5,539,777 | |||||||||
|
| |||||||||||
|
120,715,935 |
| ||||||||||
|
| |||||||||||
Oil & Gas Exploration & Production 33.2% | ||||||||||||
Aker BP ASA | Norway | 181,000 | 3,072,210 | |||||||||
Anadarko Petroleum Corp. | United States | 370,800 | 21,143,016 | |||||||||
Cabot Oil & Gas Corp., A | United States | 624,400 | 14,511,056 | |||||||||
a Cairn Energy PLC | United Kingdom | 1,670,300 | 4,203,758 | |||||||||
a Callon Petroleum Co. | United States | 344,000 | 4,072,960 | |||||||||
Canadian Natural Resources Ltd. | Canada | 326,800 | 10,410,480 | |||||||||
Cimarex Energy Co. | United States | 27,500 | 3,208,700 | |||||||||
a Cobalt International Energy Inc. | United States | 693,200 | 271,111 | |||||||||
a Concho Resources Inc. | United States | 73,500 | 9,309,510 | |||||||||
ConocoPhillips | United States | 244,100 | 11,694,831 | |||||||||
a Diamondback Energy Inc. | United States | 32,300 | 3,224,832 | |||||||||
EOG Resources Inc. | United States | 184,500 | 17,066,250 | |||||||||
EQT Corp. | United States | 197,100 | 11,459,394 | |||||||||
a Gran Tierra Energy Inc. | Colombia | 1,266,000 | 3,190,320 | |||||||||
a Gulfport Energy Corp. | United States | 185,700 | 2,948,916 | |||||||||
Hess Corp. | United States | 200,300 | 9,780,649 | |||||||||
a Jagged Peak Energy Inc. | United States | 385,900 | 4,298,926 | |||||||||
a Matador Resources Co. | United States | 281,246 | 6,097,413 | |||||||||
Noble Energy Inc. | United States | 637,200 | 20,600,676 | |||||||||
a Ophir Energy PLC | United Kingdom | 1,750,000 | 1,949,427 | |||||||||
Pioneer Natural Resources Co. | United States | 67,500 | 11,676,825 | |||||||||
a Resolute Energy Corp. | United States | 109,600 | 4,104,520 | |||||||||
a Rice Energy Inc. | United States | 144,200 | 3,070,018 | |||||||||
a Sanchez Energy Corp. | United States | 8,960 | 69,350 | |||||||||
SM Energy Co. | United States | 315,900 | 7,136,181 | |||||||||
a SRC Energy Inc. | United States | 938,600 | 7,077,044 | |||||||||
|
| |||||||||||
|
195,648,373 |
| ||||||||||
|
| |||||||||||
Oil & Gas Refining & Marketing 3.9% | ||||||||||||
HollyFrontier Corp. | United States | 178,400 | 5,020,176 | |||||||||
Marathon Petroleum Corp. | United States | 111,000 | 5,654,340 | |||||||||
Phillips 66 | United States | 78,900 | 6,277,284 | |||||||||
Valero Energy Corp. | United States | 92,600 | 5,982,886 | |||||||||
|
| |||||||||||
|
22,934,686 |
| ||||||||||
|
| |||||||||||
franklintempleton.com | Annual Report | 31 | ||
FRANKLIN STRATEGIC SERIES
STATEMENT OF INVESTMENTS
Franklin Natural Resources Fund (continued)
Country
| Shares
| Value
| ||||||||||
Common Stocks (continued) | ||||||||||||
Oil & Gas Storage & Transportation 4.4% | ||||||||||||
Enbridge Inc. | Canada | 163,147 | $ | 6,762,443 | ||||||||
Kinder Morgan Inc. | United States | 704,400 | 14,531,772 | |||||||||
Targa Resources Corp. | United States | 82,800 | 4,564,764 | |||||||||
|
| |||||||||||
|
25,858,979 |
| ||||||||||
|
| |||||||||||
Steel 0.3% | ||||||||||||
United States Steel Corp. | United States | 73,700 | 1,644,984 | |||||||||
|
| |||||||||||
Total Common Stocks (Cost $511,803,627) | 572,300,687 | |||||||||||
|
| |||||||||||
Convertible Preferred Stocks 1.3% | ||||||||||||
Oil & Gas Exploration & Production 1.3% | ||||||||||||
Hess Corp., 8.00%, cvt. pfd. | United States | 52,900 | 3,155,485 | |||||||||
a Sanchez Energy Corp., 4.875%, cvt. pfd., A | United States | 84,500 | 2,392,195 | |||||||||
Sanchez Energy Corp., 6.50%, cvt. pfd., B | United States | 56,000 | 1,893,360 | |||||||||
|
| |||||||||||
Total Convertible Preferred Stocks (Cost $9,744,127) | 7,441,040 | |||||||||||
|
| |||||||||||
Preferred Stocks (Cost $2,376,164) 0.0% | ||||||||||||
Coal & Consumable Fuels 0.0% a,b Energy Coal Resources, 144A, pfd. | United States | 29,847 | — | |||||||||
|
| |||||||||||
| Principal Amount | ||||||||||||
Convertible Bonds (Cost $3,631,941) 0.2% | ||||||||||||
Oil & Gas Exploration & Production 0.2% | ||||||||||||
Cobalt International Energy Inc., cvt., senior bond, 3.125%, 5/15/24 | United States | $ | 4,787,000 | 1,424,132 | ||||||||
|
| |||||||||||
Total Investments before Short Term Investments | ||||||||||||
(Cost $527,555,859) | 581,165,859 | |||||||||||
|
| |||||||||||
| Shares | ||||||||||||
Short Term Investments (Cost $7,627,816) 1.3% | ||||||||||||
Money Market Funds 1.3% c,d Institutional Fiduciary Trust Money Market Portfolio, 0.37% | United States | 7,627,816 | 7,627,816 | |||||||||
|
| |||||||||||
Total Investments (Cost $535,183,675) 99.8% | 588,793,675 | |||||||||||
Other Assets, less Liabilities 0.2% | 1,032,250 | |||||||||||
|
| |||||||||||
Net Assets 100.0% | $ | 589,825,925 | ||||||||||
|
| |||||||||||
See Abbreviations on page 49.
aNon-income producing.
bSee Note 7 regarding restricted securities.
cSee Note 3(f) regarding investments in affiliated management investment companies.
dThe rate shown is the annualized seven-day yield at period end.
32 | Annual Report | The accompanying notes are an integral part of these financial statements. | franklintempleton.com | ||
FRANKLIN STRATEGIC SERIES
Statements of Assets and Liabilities
April 30, 2017
Franklin
| Franklin Natural
| |||||||
| ||||||||
Assets: | ||||||||
Investments in securities: | ||||||||
Cost - Unaffiliated issuers | $ | 841,649,269 | $ | 527,555,859 | ||||
Cost - Non-controlled affiliates (Note 3f and 8) | 107,134,610 | 7,627,816 | ||||||
|
| |||||||
Total cost of investments |
$ |
948,783,879 |
| $ | 535,183,675 | |||
|
| |||||||
Value - Unaffiliated issuers |
$ |
1,350,988,061 |
| $ | 581,165,859 | |||
Value - Non-controlled affiliates (Note 3f and 8) | 103,681,253 | 7,627,816 | ||||||
|
| |||||||
Total value of investments* |
|
1,454,669,314 |
| 588,793,675 | ||||
Cash | — | 820 | ||||||
Receivables | ||||||||
Investment securities sold ** | 9,561,067 | 3,653,315 | ||||||
Capital shares sold | 2,414,264 | 696,734 | ||||||
Dividends and interest | 291,116 | 652,335 | ||||||
Other assets | 1,082 | 569 | ||||||
|
| |||||||
Total assets |
|
1,466,936,843 |
| 593,797,448 | ||||
|
| |||||||
Liabilities: | ||||||||
Payables: | ||||||||
Investment securities purchased | 3,945,640 | 1,431,096 | ||||||
Capital shares redeemed | 2,676,308 | 1,791,827 | ||||||
Management fees | 635,550 | 246,660 | ||||||
Distribution fees | 277,935 | 168,259 | ||||||
Transfer agent fees | 356,420 | 238,779 | ||||||
Payable upon return of securities loaned | 59,514,173 | — | ||||||
Accrued expenses and other liabilities | 123,565 | 94,902 | ||||||
|
| |||||||
Total liabilities |
|
67,529,591 |
| 3,971,523 | ||||
|
| |||||||
Net assets, at value |
$ |
1,399,407,252 |
| $ | 589,825,925 | |||
|
| |||||||
Net assets consist of: | ||||||||
Paid-in capital | $ | 873,365,302 | $ | 693,915,775 | ||||
Undistributed net investment income | — | 1,804,541 | ||||||
Distributions in excess of net investment income | (6,168,715 | ) | — | |||||
Net unrealized appreciation (depreciation) | 505,629,739 | 53,611,777 | ||||||
Accumulated net realized gain (loss) | 26,580,926 | (159,506,168 | ) | |||||
|
| |||||||
Net assets, at value |
$ |
1,399,407,252 |
| $ | 589,825,925 | |||
|
| |||||||
*Includes securities loaned | $ | 55,292,623 | $ | — | ||||
**Includes securities loaned | $ | 311,010 | $ | — | ||||
franklintempleton.com | The accompanying notes are an integral part of these financial statements. | Annual Report | 33 | ||
FRANKLIN STRATEGIC SERIES
FINANCIAL STATEMENTS
Statements of Assets and Liabilities (continued)
April 30, 2017
Franklin
| Franklin Natural
| |||||||
| ||||||||
Class A: | ||||||||
Net assets, at value | $1,176,686,814 | $398,702,669 | ||||||
|
| |||||||
Shares outstanding | 7,992,444 | 15,877,189 | ||||||
|
| |||||||
Net asset value per sharea | $147.22 | $25.11 | ||||||
|
| |||||||
Maximum offering price per share (net asset value per share ÷ 94.25%) | $156.20 | $26.64 | ||||||
|
| |||||||
Class C: | ||||||||
Net assets, at value | $53,935,492 | $96,834,929 | ||||||
|
| |||||||
Shares outstanding | 374,617 | 3,988,487 | ||||||
|
| |||||||
Net asset value and maximum offering price per sharea | $143.98 | $24.28 | ||||||
|
| |||||||
Class R6: | ||||||||
Net assets, at value | $8,890,640 | $218,074 | ||||||
|
| |||||||
Shares outstanding | 58,866 | 8,116 | ||||||
|
| |||||||
Net asset value and maximum offering price per share | $151.03 | $26.87 | ||||||
|
| |||||||
Advisor Class: | ||||||||
Net assets, at value | $159,894,306 | $94,070,253 | ||||||
|
| |||||||
Shares outstanding | 1,064,532 | 3,508,796 | ||||||
|
| |||||||
Net asset value and maximum offering price per share | $150.20 | $26.81 | ||||||
|
| |||||||
aRedemption price is equal to net asset value less contingent deferred sales charges, if applicable.
34 | Annual Report | The accompanying notes are an integral part of these financial statements. | franklintempleton.com | ||
FRANKLIN STRATEGIC SERIES
FINANCIAL STATEMENTS
Statements of Operations
for the year ended April 30, 2017
Franklin
| Franklin Natural
| |||||||
| ||||||||
Investment income: | ||||||||
Dividends: | ||||||||
Unaffiliated issuers | $ | 3,785,964 | $ | 11,700,015 | ||||
Non-controlled affiliates (Note 3f) | 21,264 | 11,363 | ||||||
Interest | — | 268,899 | ||||||
Income from securities loaned (net of fees and rebates) | 1,964,855 | 4,928 | ||||||
|
| |||||||
Total investment income |
|
5,772,083 |
| 11,985,205 | ||||
|
| |||||||
Expenses: | ||||||||
Management fees (Note 3a) | 7,709,832 | 3,195,138 | ||||||
Distribution fees: (Note 3c) | ||||||||
Class A | 2,853,355 | 1,127,818 | ||||||
Class C | 384,546 | 1,083,154 | ||||||
Transfer agent fees: (Note 3e) | ||||||||
Class A | 1,917,529 | 1,215,359 | ||||||
Class C | 64,474 | 291,810 | ||||||
Class R6 | 778 | 184 | ||||||
Advisor Class | 200,537 | 253,154 | ||||||
Custodian fees (Note 4) | 16,103 | 18,934 | ||||||
Reports to shareholders | 181,279 | 155,102 | ||||||
Registration and filing fees | 105,124 | 80,634 | ||||||
Professional fees | 56,080 | 43,474 | ||||||
Trustees’ fees and expenses | 12,642 | 6,153 | ||||||
Other | 47,727 | 19,450 | ||||||
|
| |||||||
Total expenses |
|
13,550,006 |
| 7,490,364 | ||||
Expense reductions (Note 4) | (678 | ) | (65 | ) | ||||
Expenses waived/paid by affiliates (Note 3f and 3g) | (312,387 | ) | (79,018 | ) | ||||
|
| |||||||
Net expenses |
|
13,236,941 |
| 7,411,281 | ||||
|
| |||||||
Net investment income (loss) |
|
(7,464,858 |
) | 4,573,924 | ||||
|
| |||||||
Realized and unrealized gains (losses): | ||||||||
Net realized gain (loss) from: | ||||||||
Investments | 98,014,012 | (16,230,263 | ) | |||||
Foreign currency transactions | 4,244 | (46,449 | ) | |||||
|
| |||||||
Net realized gain (loss) |
|
98,018,256 |
| (16,276,712 | ) | |||
|
| |||||||
Net change in unrealized appreciation (depreciation) on: | ||||||||
Investments | 145,053,480 | 23,237,758 | ||||||
Translation of other assets and liabilities denominated in foreign currencies | 37,144 | 5,291 | ||||||
|
| |||||||
Net change in unrealized appreciation (depreciation) |
|
145,090,624 |
| 23,243,049 | ||||
|
| |||||||
Net realized and unrealized gain (loss) |
|
243,108,880 |
| 6,966,337 | ||||
|
| |||||||
Net increase (decrease) in net assets resulting from operations |
$ |
235,644,022 |
| $ | 11,540,261 | |||
|
| |||||||
franklintempleton.com | The accompanying notes are an integral part of these financial statements. | Annual Report | 35 | ||
FRANKLIN STRATEGIC SERIES
FINANCIAL STATEMENTS
Statements of Changes in Net Assets
| Franklin Biotechnology | Franklin Natural | |||||||||||||||
| Discovery Fund | Resources Fund | |||||||||||||||
|
| |||||||||||||||
Year Ended April 30, | Year Ended April 30, | |||||||||||||||
|
| |||||||||||||||
2017 | 2016 | 2017 | 2016 | |||||||||||||
| ||||||||||||||||
Increase (decrease) in net assets: | ||||||||||||||||
Operations: | ||||||||||||||||
Net investment income (loss) | $ | (7,464,858 | ) | $ | (8,934,186 | ) | $ | 4,573,924 | $ | 6,662,268 | ||||||
Net realized gain (loss) | 98,018,256 | 41,508,062 | (16,276,712 | ) | (105,823,288 | ) | ||||||||||
Net change in unrealized appreciation (depreciation) | 145,090,624 | (443,061,045 | ) | 23,243,049 | (46,797,418 | ) | ||||||||||
|
| |||||||||||||||
Net increase (decrease) in net assets resulting from operations |
|
235,644,022 |
| (410,487,169 | ) | 11,540,261 | (145,958,438 | ) | ||||||||
|
| |||||||||||||||
Distributions to shareholders from: | ||||||||||||||||
Net investment income: | ||||||||||||||||
Class A | (14,076,436 | ) | — | (4,756,117 | ) | (3,065,832 | ) | |||||||||
Class C | (408,909 | ) | — | (577,641 | ) | (21,423 | ) | |||||||||
Class R6 | (126,292 | ) | — | (212 | ) | (5,056 | ) | |||||||||
Advisor Class | (1,688,739 | ) | — | (1,234,610 | ) | (880,846 | ) | |||||||||
Net realized gains: | ||||||||||||||||
Class A | (34,234,146 | ) | (115,150,452 | ) | — | — | ||||||||||
Class C | (1,330,584 | ) | (1,868,138 | ) | — | — | ||||||||||
Class R6 | (230,582 | ) | (555,624 | ) | — | — | ||||||||||
Advisor Class | (3,411,647 | ) | (11,496,430 | ) | — | — | ||||||||||
|
| |||||||||||||||
Total distributions to shareholders |
|
(55,507,335 |
) | (129,070,644 | ) | (6,568,580 | ) | (3,973,157 | ) | |||||||
|
| |||||||||||||||
Capital share transactions: (Note 2) | ||||||||||||||||
Class A | (55,488,311 | ) | (51,384,188 | ) | (66,989,230 | ) | 1,840,165 | |||||||||
Class C | 31,398,641 | 2,640,554 | (11,600,701 | ) | 7,417,245 | |||||||||||
Class R6 | 2,002,691 | (63,450,822 | ) | 222,601 | (222,058 | ) | ||||||||||
Advisor Class | 50,061,306 | (25,379,192 | ) | 3,702,378 | 24,416,177 | |||||||||||
|
| |||||||||||||||
Total capital share transactions |
|
27,974,327 |
| (137,573,648 | ) | (74,664,952 | ) | 33,451,529 | ||||||||
|
| |||||||||||||||
Net increase (decrease) in net assets | 208,111,014 | (677,131,461 | ) | (69,693,271 | ) | (116,480,066 | ) | |||||||||
Net assets: | ||||||||||||||||
Beginning of year | 1,191,296,238 | 1,868,427,699 | 659,519,196 | 775,999,262 | ||||||||||||
|
| |||||||||||||||
End of year |
$ |
1,399,407,252 |
| $ | 1,191,296,238 | $ | 589,825,925 | $ | 659,519,196 | |||||||
|
| |||||||||||||||
Undistributed net investment income (loss) included in net assets: | ||||||||||||||||
End of year | $ | — | $ | (7,964,127 | ) | $ | 1,804,541 | $ | 3,830,515 | |||||||
|
| |||||||||||||||
Distributions in excess of net investment income included in net assets: | ||||||||||||||||
End of year | $ | (6,168,715 | ) | $ | — | $ | — | $ | — | |||||||
|
| |||||||||||||||
36 | Annual Report | The accompanying notes are an integral part of these financial statements. | franklintempleton.com | ||
FRANKLIN STRATEGIC SERIES
1. Organization and Significant Accounting Policies
Franklin Strategic Series (Trust) is registered under the Investment Company Act of 1940 (1940 Act) as an open-end management investment company, consisting of nine separate funds, two of which are included in this report (Funds) and applies the specialized accounting and reporting guidance in U.S. Generally Accepted Accounting Principles (U.S. GAAP). The financial statements of the remaining funds in the Trust are presented separately. The Funds offer four classes of shares: Class A, Class C, Class R6, and Advisor Class. Each class of shares may differ by its initial sales load, contingent deferred sales charges, voting rights on matters affecting a single class, its exchange privilege and fees primarily due to differing arrangements for distribution and transfer agent fees. Franklin Biotechnology Discovery Fund was closed to new investors with limited exceptions effective at the close of market July 8, 2014. Effective May 16, 2016, the Fund reopened to new investors.
The following summarizes the Funds’ significant accounting policies.
a. Financial Instrument Valuation
The Funds’ investments in financial instruments are carried at fair value daily. Fair value is the price that would be received to sell an asset or paid to transfer a liability in an orderly transaction between market participants on the measurement date. The Funds calculate the net asset value (NAV) per share as of 4 p.m. Eastern time each day the New York Stock Exchange (NYSE) is open for trading. Under compliance policies and procedures approved by the Trust’s Board of Trustees (the Board), the Funds’ administrator has responsibility for oversight of valuation, including leading the cross-functional Valuation Committee (VC). The VC provides administration and oversight of the Funds’ valuation policies and procedures, which are approved annually by the Board. Among other things, these procedures allow the Funds to utilize independent pricing services, quotations from securities and financial instrument dealers, and other market sources to determine fair value.
Equity securities listed on an exchange or on the NASDAQ National Market System are valued at the last quoted sale price or the official closing price of the day, respectively. Foreign equity securities are valued as of the close of trading on the foreign stock exchange on which the security is primarily
traded, or as of 4 p.m. Eastern time. The value is then converted into its U.S. dollar equivalent at the foreign exchange rate in effect at 4 p.m. Eastern time on the day that the value of the security is determined. Over-the-counter (OTC) securities are valued within the range of the most recent quoted bid and ask prices. Securities that trade in multiple markets or on multiple exchanges are valued according to the broadest and most representative market. Certain equity securities are valued based upon fundamental characteristics or relationships to similar securities.
Debt securities generally trade in the OTC market rather than on a securities exchange. The Funds’ pricing services use multiple valuation techniques to determine fair value. In instances where sufficient market activity exists, the pricing services may utilize a market-based approach through which quotes from market makers are used to determine fair value. In instances where sufficient market activity may not exist or is limited, the pricing services also utilize proprietary valuation models which may consider market characteristics such as benchmark yield curves, credit spreads, estimated default rates, anticipated market interest rate volatility, coupon rates, anticipated timing of principal repayments, underlying collateral, and other unique security features in order to estimate the relevant cash flows, which are then discounted to calculate the fair value.
Investments in open-end mutual funds are valued at the closing NAV.
The Funds have procedures to determine the fair value of financial instruments for which market prices are not reliable or readily available. Under these procedures, the VC convenes on a regular basis to review such financial instruments and considers a number of factors, including significant unobservable valuation inputs, when arriving at fair value. The VC primarily employs a market-based approach which may use related or comparable assets or liabilities, recent transactions, market multiples, book values, and other relevant information for the investment to determine the fair value of the investment. An income-based valuation approach may also be used in which the anticipated future cash flows of the investment are discounted to calculate fair value. Discounts may also be applied due to the nature or duration of any restrictions on the disposition of the investments. Due to the inherent uncertainty of valuations of such investments, the fair values may differ significantly from the values that would have been used had an active market existed. The VC employs various methods for calibrating these valuation approaches including a regular
franklintempleton.com | Annual Report | 37 | ||
FRANKLIN STRATEGIC SERIES
NOTES TO FINANCIAL STATEMENTS
1. Organization and Significant Accounting Policies (continued)
a. Financial Instrument Valuation (continued)
review of key inputs and assumptions, transactional back-testing or disposition analysis, and reviews of any related market activity.
Trading in securities on foreign securities stock exchanges and OTC markets may be completed before 4 p.m. Eastern time. In addition, trading in certain foreign markets may not take place on every Funds’ business day. Occasionally, events occur between the time at which trading in a foreign security is completed and 4 p.m. Eastern time that might call into question the reliability of the value of a portfolio security held by the Fund. As a result, differences may arise between the value of the Funds’ portfolio securities as determined at the foreign market close and the latest indications of value at 4 p.m. Eastern time. In order to minimize the potential for these differences, the VC monitors price movements following the close of trading in foreign stock markets through a series of country specific market proxies (such as baskets of American Depositary Receipts, futures contracts and exchange traded funds). These price movements are measured against established trigger thresholds for each specific market proxy to assist in determining if an event has occurred that may call into question the reliability of the values of the foreign securities held by the Funds. If such an event occurs, the securities may be valued using fair value procedures, which may include the use of independent pricing services.
When the last day of the reporting period is a non-business day, certain foreign markets may be open on those days that the Funds’ NAV is not calculated, which could result in differences between the value of the Funds’ portfolio securities on the last business day and the last calendar day of the reporting period. Any significant security valuation changes due to an open foreign market are adjusted and reflected by the Funds for financial reporting purposes.
b. Foreign Currency Translation
Portfolio securities and other assets and liabilities denominated in foreign currencies are translated into U.S. dollars based on the exchange rate of such currencies against U.S. dollars on the date of valuation. The Funds may enter into foreign currency exchange contracts to facilitate transactions denominated in a foreign currency. Purchases and sales of securities, income and
expense items denominated in foreign currencies are translated into U.S. dollars at the exchange rate in effect on the transaction date. Portfolio securities and assets and liabilities denominated in foreign currencies contain risks that those currencies will decline in value relative to the U.S. dollar. Occasionally, events may impact the availability or reliability of foreign exchange rates used to convert the U.S. dollar equivalent value. If such an event occurs, the foreign exchange rate will be valued at fair value using procedures established and approved by the Board.
The Funds do not separately report the effect of changes in foreign exchange rates from changes in market prices on securities held. Such changes are included in net realized and unrealized gain or loss from investments in the Statements of Operations.
Realized foreign exchange gains or losses arise from sales of foreign currencies, currency gains or losses realized between the trade and settlement dates on securities transactions and the difference between the recorded amounts of dividends, interest, and foreign withholding taxes and the U.S. dollar equivalent of the amounts actually received or paid. Net unrealized foreign exchange gains and losses arise from changes in foreign exchange rates on foreign denominated assets and liabilities other than investments in securities held at the end of the reporting period.
c. Securities Lending
Certain or all Funds participate in an agency based securities lending program to earn additional income. The Fund receives cash collateral against the loaned securities in an amount equal to at least 102% of the fair value of the loaned securities. Collateral is maintained over the life of the loan in an amount not less than 100% of the fair value of loaned securities, as determined at the close of Fund business each day; any additional collateral required due to changes in security values is delivered to the Fund on the next business day. The collateral is deposited into a joint cash account with other funds and is used to invest in a money market fund managed by Franklin Advisers, Inc., an affiliate of the Funds. The Fund may receive income from the investment of cash collateral, in addition to lending fees and rebates paid by the borrower. Income from securities loaned, net of fees paid to the securities lending agent and/or third-party vendor, is reported separately in the Statements of Operations. The Fund bears the market risk with respect to the collateral investment, securities loaned, and the risk that the agent may default on its obligations to the Fund. If
38 | Annual Report | franklintempleton.com | ||
FRANKLIN STRATEGIC SERIES
NOTES TO FINANCIAL STATEMENTS
the borrower defaults on its obligation to return the securities loaned, the Fund has the right to repurchase the securities in the open market using the collateral received. The securities lending agent has agreed to indemnify the Fund in the event of default by a third party borrower.
d. Income and Deferred Taxes
It is each Fund’s policy to qualify as a regulated investment company under the Internal Revenue Code. Each Fund intends to distribute to shareholders substantially all of its taxable income and net realized gains to relieve it from federal income and excise taxes. As a result, no provision for U.S. federal income taxes is required.
The Funds may be subject to foreign taxation related to income received, capital gains on the sale of securities and certain foreign currency transactions in the foreign jurisdictions in which the Funds invest. Foreign taxes, if any, are recorded based on the tax regulations and rates that exist in the foreign markets in which the Funds invest. When a capital gain tax is determined to apply, certain or all Funds record an estimated deferred tax liability in an amount that would be payable if the securities were disposed of on the valuation date.
Each Fund may recognize an income tax liability related to its uncertain tax positions under U.S. GAAP when the uncertain tax position has a less than 50% probability that it will be sustained upon examination by the tax authorities based on its technical merits. As of April 30, 2017, each Fund has determined that no tax liability is required in its financial statements related to uncertain tax positions for any open tax years (or expected to be taken in future tax years). Open tax years are those that remain subject to examination and are based on each tax jurisdiction’s statute of limitation.
e. Security Transactions, Investment Income, Expenses and Distributions
Security transactions are accounted for on trade date. Realized gains and losses on security transactions are determined on a specific identification basis. Interest income and estimated expenses are accrued daily. Dividend income is recorded on the ex-dividend date except for certain dividends from securities where the dividend rate is not available. In such cases, the dividend is recorded as soon as the information is received by
the Funds. Distributions to shareholders are recorded on the ex-dividend date and are determined according to income tax regulations (tax basis). Distributable earnings determined on a tax basis may differ from earnings recorded in accordance with U.S. GAAP. These differences may be permanent or temporary. Permanent differences are reclassified among capital accounts to reflect their tax character. These reclassifications have no impact on net assets or the results of operations. Temporary differences are not reclassified, as they may reverse in subsequent periods.
Common expenses incurred by the Trust are allocated among the Funds based on the ratio of net assets of each Fund to the combined net assets of the Trust. Fund specific expenses are charged directly to the Fund that incurred the expense.
Realized and unrealized gains and losses and net investment income, not including class specific expenses, are allocated daily to each class of shares based upon the relative proportion of net assets of each class. Differences in per share distributions, by class, are generally due to differences in class specific expenses.
f. Accounting Estimates
The preparation of financial statements in accordance with U.S. GAAP requires management to make estimates and assumptions that affect the reported amounts of assets and liabilities at the date of the financial statements and the amounts of income and expenses during the reporting period. Actual results could differ from those estimates.
g. Guarantees and Indemnifications
Under the Trust’s organizational documents, its officers and trustees are indemnified by the Trust against certain liabilities arising out of the performance of their duties to the Trust. Additionally, in the normal course of business, the Trust, on behalf of the Funds, enters into contracts with service providers that contain general indemnification clauses. The Trust’s maximum exposure under these arrangements is unknown as this would involve future claims that may be made against the Trust that have not yet occurred. Currently, the Trust expects the risk of loss to be remote.
franklintempleton.com | Annual Report | 39 | ||
FRANKLIN STRATEGIC SERIES
NOTES TO FINANCIAL STATEMENTS
2. Shares of Beneficial Interest
At April 30, 2017, there were an unlimited number of shares authorized (without par value). Transactions in the Funds’ shares were as follows:
Franklin Biotechnology Discovery Fund | Franklin Natural Resources Fund | |||||||||||||||
Shares | Amount | Shares | Amount | |||||||||||||
Class A Shares: | ||||||||||||||||
Year ended April 30, 2017 | ||||||||||||||||
Shares sold | 2,141,244 | $ | 293,440,540 | 3,407,729 | $ | 87,917,703 | ||||||||||
Shares issued in reinvestment of distributions | 347,251 | 45,878,780 | 168,961 | 4,629,546 | ||||||||||||
Shares redeemed |
|
(2,881,393 |
) | (394,807,631 | ) | (6,146,306 | ) | (159,536,479 | ) | |||||||
Net increase (decrease) |
|
(392,898 |
) | $ | (55,488,311 | ) | (2,569,616 | ) | $ | (66,989,230 | ) | |||||
Year ended April 30, 2016 | ||||||||||||||||
Shares sold | 994,554 | $ | 169,501,230 | 5,741,950 | $ | 131,553,976 | ||||||||||
Shares issued in reinvestment of distributions | 691,137 | 108,930,097 | 143,948 | 2,979,717 | ||||||||||||
Shares redeemed | (2,087,610 | ) | (329,815,515 | ) | (5,636,208 | ) | (132,693,528 | ) | ||||||||
Net increase (decrease) |
|
(401,919 |
) | $ | (51,384,188 | ) | 249,690 | $ | 1,840,165 | |||||||
Class C Shares: | ||||||||||||||||
Year ended April 30, 2017 | ||||||||||||||||
Shares sold | 314,992 | $ | 42,287,943 | 801,399 | $ | 19,979,661 | ||||||||||
Shares issued in reinvestment of distributions | 13,374 | 1,732,743 | 21,022 | 558,336 | ||||||||||||
Shares redeemed | (93,143 | ) | (12,622,045 | ) | (1,275,577 | ) | (32,138,698 | ) | ||||||||
Net increase (decrease) |
|
235,223 |
| $ | 31,398,641 | (453,156 | ) | $ | (11,600,701 | ) | ||||||
Year ended April 30, 2016 | ||||||||||||||||
Shares sold | 35,382 | $ | 6,172,232 | 1,548,932 | $ | 34,012,781 | ||||||||||
Shares issued in reinvestment of distributions | 12,007 | 1,864,389 | 1,031 | 20,756 | ||||||||||||
Shares redeemed | (35,581 | ) | (5,396,067 | ) | (1,170,096 | ) | (26,616,292 | ) | ||||||||
Net increase (decrease) |
|
11,808 |
| $ | 2,640,554 | 379,867 | $ | 7,417,245 | ||||||||
Class R6 Shares: | ||||||||||||||||
Year ended April 30, 2017 | ||||||||||||||||
Shares sold | 38,854 | $ | 5,153,854 | 7,779 | $ | 228,431 | ||||||||||
Shares issued in reinvestment of distributions | 2,637 | 356,874 | 7 | 211 | ||||||||||||
Shares redeemed | (25,011 | ) | (3,508,037 | ) | (222 | ) | (6,041 | ) | ||||||||
Net increase (decrease) |
|
16,480 |
| $ | 2,002,691 | 7,564 | $ | 222,601 | ||||||||
Year ended April 30, 2016 | ||||||||||||||||
Shares sold | 21,331 | $ | 3,581,555 | 2,400 | $ | 64,684 | ||||||||||
Shares issued in reinvestment of distributions | 3,445 | 555,624 | 229 | 5,056 | ||||||||||||
Shares redeemed | (393,884 | ) | (67,588,001 | ) | (15,127 | ) | (291,798 | ) | ||||||||
Net increase (decrease) |
|
(369,108 |
) | $ | (63,450,822 | ) | (12,498 | ) | $ | (222,058 | ) | |||||
40 | Annual Report | franklintempleton.com | ||
FRANKLIN STRATEGIC SERIES
NOTES TO FINANCIAL STATEMENTS
Franklin Biotechnology Discovery Fund | Franklin Natural Resources Fund | |||||||||||||||
Shares | Amount | Shares | Amount | |||||||||||||
Advisor Class Shares: | ||||||||||||||||
Year ended April 30, 2017 | ||||||||||||||||
Shares sold | 662,833 | $ | 93,724,820 | 1,645,341 | $ | 45,812,950 | ||||||||||
Shares issued in reinvestment of distributions | 31,641 | 4,260,757 | 40,400 | 1,180,483 | ||||||||||||
Shares redeemed | (343,647 | ) | (47,924,271 | ) | (1,553,855 | ) | (43,291,055 | ) | ||||||||
Net increase (decrease) |
|
350,827 |
| $ | 50,061,306 | 131,886 | $ | 3,702,378 | ||||||||
Year ended April 30, 2016 | ||||||||||||||||
Shares sold | 208,936 | $ | 35,072,346 | 2,472,344 | $ | 59,834,181 | ||||||||||
Shares issued in reinvestment of distributions | 58,123 | 9,330,443 | 37,248 | 822,065 | ||||||||||||
Shares redeemed | (455,659 | ) | (69,781,981 | ) | (1,490,983 | ) | (36,240,069 | ) | ||||||||
Net increase (decrease) |
|
(188,600 |
) | $ | (25,379,192 | ) | 1,018,609 | $ | 24,416,177 | |||||||
3. Transactions with Affiliates
Franklin Resources, Inc. is the holding company for various subsidiaries that together are referred to as Franklin Templeton Investments. Certain officers and trustees of the Trust are also officers and/or directors of the following subsidiaries:
| Subsidiary | Affiliation | |
| Franklin Advisers, Inc. (Advisers) | Investment manager | |
| Franklin Templeton Services, LLC (FT Services) | Administrative manager | |
| Franklin Templeton Distributors, Inc. (Distributors) | Principal underwriter | |
| Franklin Templeton Investor Services, LLC (Investor Services) | Transfer agent |
a. Management Fees
Franklin Biotechnology Discovery Fund pays an investment management fee to Advisers based on the average daily net assets of the Fund as follows:
| Annualized Fee Rate | Net Assets | |
| 0.775% | Up to and including $100 million | |
| 0.650% | Over $100 million, up to and including $200 million | |
| 0.635% | Over $200 million, up to and including $250 million | |
| 0.585% | Over $250 million, up to and including $700 million | |
| 0.550% | Over $700 million, up to and including $1.2 billion | |
| 0.525% | Over $1.2 billion, up to and including $7.5 billion | |
| 0.515% | Over $7.5 billion, up to and including $10 billion | |
| 0.505% | Over $10 billion, up to and including $12.5 billion | |
| 0.495% | Over $12.5 billion, up to and including $15 billion | |
| 0.475% | in excess of $15 billion |
franklintempleton.com | Annual Report | 41 | ||
FRANKLIN STRATEGIC SERIES
NOTES TO FINANCIAL STATEMENTS
3. Transactions with Affiliates (continued)
a. Management Fees (continued)
Franklin Natural Resources Fund pays an investment management fee to Advisers based on the average daily net assets of the Fund as follows:
| Annualized Fee Rate | Net Assets | |
| 0.625% | Up to and including $100 million | |
| 0.500% | Over $100 million, up to and including $250 million | |
| 0.450% | Over $250 million, up to and including $7.5 billion | |
| 0.440% | Over $7.5 billion, up to and including $10 billion | |
| 0.430% | Over $10 billion, up to and including $12.5 billion | |
| 0.420% | Over $12.5 billion, up to and including $15 billion | |
| 0.400% | In excess of $15 billion |
For the year ended April 30, 2017, each Fund’s effective investment management fee rate based on average daily net assets was as follows:
Franklin Biotechnology Discovery Fund | Franklin Natural Resources Fund | |
| ||
0.588% | 0.488% | |
b. Administrative Fees
Under an agreement with Advisers, FT Services provides administrative services to the Funds. The fee is paid by Advisers based on the Funds’ average daily net assets, and is not an additional expense of the Funds.
c. Distribution Fees
The Board has adopted distribution plans for each share class, with the exception of Class R6 and Advisor Class shares, pursuant to Rule 12b-1 under the 1940 Act. Under the Funds’ Class A reimbursement distribution plans, the Funds reimburses Distributors for costs incurred in connection with the servicing, sale and distribution of the Funds’ shares up to the maximum annual plan rate for each class. Under the Class A reimbursement distribution plans, costs exceeding the maximum for the current plan year cannot be reimbursed in subsequent periods. In addition, under the Funds’ Class C compensation distribution plans, the Funds pay Distributors for costs incurred in connection with the servicing, sale and distribution of each Funds’ shares up to the maximum annual plan rate for each class. The plan year, for purposes of monitoring compliance with the maximum annual plan rates, is February 1 through January 31 for each Fund.
The maximum annual plan rates, based on the average daily net assets, for each class, are as follows:
Class A | 0.35 | % | ||
Class C | 1.00 | % |
The Board has set the current rate at 0.25% per year for Class A shares until further notice and approval by the Board.
42 | Annual Report | franklintempleton.com | ||
FRANKLIN STRATEGIC SERIES
NOTES TO FINANCIAL STATEMENTS
d. Sales Charges/Underwriting Agreements
Front-end sales charges and contingent deferred sales charges (CDSC) do not represent expenses of the Funds. These charges are deducted from the proceeds of sales of fund shares prior to investment or from redemption proceeds prior to remittance, as applicable. Distributors has advised the Funds of the following commission transactions related to the sales and redemptions of the Funds’ shares for the year:
Franklin Biotechnology Discovery Fund | Franklin Natural Resources Fund | |||||||
Sales charges retained net of commissions paid to unaffiliated brokers/dealers | $687,533 | $186,707 | ||||||
CDSC retained | $ 29,320 | $ 26,043 | ||||||
e. Transfer Agent Fees
Each class of shares, except for Class R6 pays transfer agent fees to Investor Services for its performance of shareholder servicing obligations and reimburses Investor Services for out of pocket expenses incurred, including shareholder servicing fees paid to third parties. These fees are allocated daily based upon their relative proportion of such classes’ aggregate net assets. Class R6 pays Investor Services transfer agent fees specific to that class.
For the year ended April 30, 2017, the Funds paid transfer agent fees as noted in the Statements of Operations of which the following amounts were retained by Investor Services:
Franklin Biotechnology Discovery Fund | Franklin Natural Resources Fund | |||||||
Transfer agent fees |
|
$959,743 |
|
|
$808,338 |
| ||
f. Investments in Affiliated Management Investment Companies
Certain or all Funds invest in one or more affiliated management investment companies for purposes other than exercising a controlling influence over the management or policies. Management fees paid by the Funds are waived on assets invested in the affiliated management investment companies, as noted in the Statements of Operations, in an amount not to exceed the management and administrative fees paid directly or indirectly by each affiliate. Prior to May 1, 2013, the waiver was accounted for as a reduction to management fees. During the year ended April 30, 2017, investments in affiliated management investment companies were as follows:
Number of Shares Held at Beginning of Year | Gross Additions | Gross Reductions | Number of Shares Held at End of Year | Value at End of Year | Investment Income | Realized Gain | %of Affiliated Fund Shares Outstanding Held at End of Year | |||||||||||||||||||||||
Franklin Biotechnology Discovery Fund | ||||||||||||||||||||||||||||||
Non-Controlled Affiliates | ||||||||||||||||||||||||||||||
Institutional Fiduciary Trust Money Market Portfolio, 0.37% | 82,758,981 | 702,589,588 | (699,675,427 | ) | 85,673,142 | $ | 85,673,142 | $21,264 | $ — | 0.4% | ||||||||||||||||||||
Franklin Natural Resources Fund | ||||||||||||||||||||||||||||||
Non-Controlled Affiliates | ||||||||||||||||||||||||||||||
Institutional Fiduciary Trust Money Market Portfolio, 0.37% | 43,909,680 | 159,016,084 | (195,297,948 | ) | 7,627,816 | $ | 7,627,816 | $11,363 | $ — | —%a | ||||||||||||||||||||
aRounds to less than 0.1%.
franklintempleton.com | Annual Report | 43 | ||
FRANKLIN STRATEGIC SERIES
NOTES TO FINANCIAL STATEMENTS
3. Transactions with Affiliates (continued)
g. Waiver and Expense Reimbursements
Investor Services has contractually agreed in advance to waive or limit its fees so that the Class R6 transfer agent fees do not exceed 0.01% until August 31, 2017.
4. Expense Offset Arrangement
The Funds have entered into an arrangement with their custodian whereby credits realized as a result of uninvested cash balances are used to reduce a portion of the Funds’ custodian expenses. During the year ended April 30, 2017, the custodian fees were reduced as noted in the Statements of Operations.
5. Income Taxes
For tax purposes, capital losses may be carried over to offset future capital gains. Capital loss carryforwards with no expiration, if any, must be fully utilized before those losses with expiration dates.
At April 30, 2017, the capital loss carryforwards were as follows:
Franklin Natural Resources Fund | ||||
Capital loss carryforwards subject to expiration: | ||||
2018 | $ | 12,737,677 | ||
Capital loss carryforwards not subject to expiration: | ||||
Short term | 10,125,851 | |||
Long term | 121,921,833 | |||
|
| |||
Total capital loss carryforwards |
$ |
144,785,361 |
| |
|
| |||
The tax character of distributions paid during the years ended April 30, 2017 and 2016, was as follows:
Franklin Biotechnology Discovery Fund | Franklin Natural Resources Fund | |||||||||||||||
|
| |||||||||||||||
| 2017 | 2016 | 2017 | 2016 | |||||||||||||
| ||||||||||||||||
Distributions paid from: | ||||||||||||||||
Ordinary income | $ | 16,300,376 | $ | 35,788,633 | $ | 6,568,580 | $ | 3,973,157 | ||||||||
Long term capital gain | 39,206,959 | 93,282,011 | — | — | ||||||||||||
|
| |||||||||||||||
$ |
55,507,335 |
| $ | 129,070,644 | $ | 6,568,580 | $ | 3,973,157 | ||||||||
|
| |||||||||||||||
At April 30, 2017, the cost of investments, net unrealized appreciation (depreciation), undistributed ordinary income and undistributed long term capital gains for income tax purposes were as follows:
44 | Annual Report | franklintempleton.com | ||
FRANKLIN STRATEGIC SERIES
NOTES TO FINANCIAL STATEMENTS
Franklin Biotechnology Discovery Fund | Franklin Natural Resources Fund | |||||||
| ||||||||
Cost of investments | $ | 958,801,208 | $ | 552,582,388 | ||||
|
| |||||||
Unrealized appreciation | $ | 606,614,957 | $ | 108,496,752 | ||||
Unrealized depreciation | (110,746,851 | ) | (72,285,465) | |||||
|
| |||||||
Net unrealized appreciation (depreciation) | $ | 495,868,106 | $ | 36,211,287 | ||||
|
| |||||||
Undistributed ordinary income | 7,456,013 | 4,482,452 | ||||||
Undistributed long term capital gains | 22,973,524 | — | ||||||
|
| |||||||
Distributable earnings |
$ |
30,429,537 |
| $ | 4,482,452 | |||
|
| |||||||
Differences between income and/or capital gains as determined on a book basis and a tax basis are primarily due to differing treatments of passive foreign investment companies and wash sales.
6. Investment Transactions
Purchases and sales of investments (excluding short term securities) for the year ended April 30, 2017, were as follows:
Franklin Biotechnology Discovery Fund | Franklin Natural Resources Fund | |||||||
Purchases | $ | 433,555,021 | $186,374,004 | |||||
Sales | $ | 483,607,147 | $236,500,147 | |||||
At April 30, 2017, in connection with securities lending transactions, certain or all funds loaned investments and received cash collateral as follows:
Franklin Biotechnology Discovery Fund | ||||
Securities lending transactionsa: | ||||
Equity Investmentsb | $59,514,173 | |||
aThe agreements open at year end can be terminated at any time.
bGross amount of recognized liabilities for securities lending transactions is included in payable upon return of securities loaned in the Statements of Assets and Liabilities.
7. Restricted Securities
Certain or all Funds invest in securities that are restricted under the Securities Act of 1933 (1933 Act) or which are subject to legal, contractual, or other agreed upon restrictions on resale. Restricted securities are often purchased in private placement transactions, and cannot be sold without prior registration unless the sale is pursuant to an exemption under the 1933 Act. Disposal of these securities may require greater effort and expense, and prompt sale at an acceptable price may be difficult. The Funds may have registration rights for restricted securities. The issuer generally incurs all registration costs.
franklintempleton.com | Annual Report | 45 | ||
FRANKLIN STRATEGIC SERIES
NOTES TO FINANCIAL STATEMENTS
7. Restricted Securities (continued)
At April 30, 2017, investments in restricted securities, excluding certain securities exempt from registration under the 1933 Act deemed to be liquid, were as follows:
Shares | Issuer | Acquisition Date | Cost | Value | ||||||||||
Franklin Biotechnology Discovery Fund |
| |||||||||||||
107,297,280 | Acerta Pharma BV | 5/06/15 | $ | 6,172,605 | $ | 4,153,049 | ||||||||
137,714 | CRISPR Therapeutics AG, Reg S | 6/10/16 | 1,850,041 | 2,241,261 | ||||||||||
942,380 | G1 Therapeutics Inc., pfd. | 4/26/16 | 2,799,999 | 3,028,056 | ||||||||||
80,195 | Intarcia Therapeutics Inc., DD | 3/26/14 | 2,597,516 | 4,811,700 | ||||||||||
759,880 | True North Therapeutics Inc., pfd., Series D, 144A | 10/05/16 | 1,900,004 | 1,900,004 | ||||||||||
|
| |||||||||||||
| Total Restricted Securities (Value is 1.2% of Net Assets) |
$ |
15,320,165 |
| $ | 16,134,070 | |||||||||
|
| |||||||||||||
Franklin Natural Resources Fund | ||||||||||||||
199,375 | Energy Coal Resources, 144A | 11/16/05 - 5/05/06 | $ | 741,939 | $ | — | ||||||||
29,847 | Energy Coal Resources, 144A, pfd. | 3/17/09 | 2,376,164 | — | ||||||||||
|
| |||||||||||||
| Total Restricted Securities (Value is —% of Net Assets) |
$ |
3,118,103 |
| $ | — | |||||||||
|
| |||||||||||||
8. Holdings of 5% Voting Securities of Portfolio Companies
The 1940 Act defines “affiliated companies” to include investments in portfolio companies in which a fund owns 5% or more of the outstanding voting securities. During the year ended April 30, 2017, investments in “affiliated companies” were as follows:
| Name of Issuer | Number of Shares/ Warrants Held at Beginning of Year | Gross Additions | Gross Reductions | Number of Shares/ Warrants Held at End of Year | Value at End of Year | Investment Income | Realized Gain (Loss) | |||||||||||||||||||||
Franklin Biotechnology Discovery Fund |
| |||||||||||||||||||||||||||
Non-Controlled Affiliates |
| |||||||||||||||||||||||||||
Alcobra Ltd. | 1,367,755 | 369,551 | — | 1,737,306 | $ | 1,997,902 | $ | — | $ | — | ||||||||||||||||||
ARCA biopharma Inc. | 478,077 | — | — | 478,077 | 1,290,808 | — | — | |||||||||||||||||||||
ARCA biopharma Inc., wts., 6/16/22 | 1,338,619 | — | — | 1,338,619 | 61,040 | — | — | |||||||||||||||||||||
BioPharmX Corp. | 216,000 | 1,684,375 | — | 1,900,375 | 1,570,470 | — | — | |||||||||||||||||||||
BioPharmX Corp., 144A | 1,600,000 | 345,737 | — | 1,945,737 | 1,607,957 | — | — | |||||||||||||||||||||
BioPharmX Corp., wts., 3/29/21 | 108,000 | — | — | 108,000 | 39,908 | — | — | |||||||||||||||||||||
BioPharmX Corp., wts., 11/22/23 | — | 1,259,925 | — | 1,259,925 | 544,390 | — | — | |||||||||||||||||||||
Fate Therapeutics Inc. | 195,700 | 2,178,077 | a | — | 2,373,777 | 10,895,636 | — | — | ||||||||||||||||||||
|
| |||||||||||||||||||||||||||
Total Affiliated Securities (Value is 1.3% of Net Assets) |
| $ | 18,008,111 | $ | — | $ | — | |||||||||||||||||||||
|
| |||||||||||||||||||||||||||
aGross addition was the result of a corporate action.
9. Credit Facility
The Funds, together with other U.S. registered and foreign investment funds (collectively, Borrowers), managed by Franklin Templeton Investments, are borrowers in a joint syndicated senior unsecured credit facility totaling $2 billion (Global Credit Facility) matures on February 9, 2018. This Global Credit Facility provides a source of funds to the Borrowers for temporary and emergency purposes, including the ability to meet future unanticipated or unusually large redemption requests.
46 | Annual Report | franklintempleton.com | ||
FRANKLIN STRATEGIC SERIES
NOTES TO FINANCIAL STATEMENTS
��
Under the terms of the Global Credit Facility, the Funds shall, in addition to interest charged on any borrowings made by the Funds and other costs incurred by the Funds, pay their share of fees and expenses incurred in connection with the implementation and maintenance of the Global Credit Facility, based upon their relative share of the aggregate net assets of all of the Borrowers, including an annual commitment fee of 0.15% based upon the unused portion of the Global Credit Facility. These fees are reflected in other expenses in the Statements of Operations. During the year ended April 30, 2017, the Funds did not use the Global Credit Facility.
10. Fair Value Measurements
The Funds follow a fair value hierarchy that distinguishes between market data obtained from independent sources (observable inputs) and the Funds’ own market assumptions (unobservable inputs). These inputs are used in determining the value of the Funds’ financial instruments and are summarized in the following fair value hierarchy:
| • | Level 1 – quoted prices in active markets for identical financial instruments |
| • | Level 2 – other significant observable inputs (including quoted prices for similar financial instruments, interest rates, prepayment speed, credit risk, etc.) |
| • | Level 3 – significant unobservable inputs (including the Funds’ own assumptions in determining the fair value of financial instruments) |
The input levels are not necessarily an indication of the risk or liquidity associated with financial instruments at that level.
For movements between the levels within the fair value hierarchy, the Funds have adopted a policy of recognizing the transfers as of the date of the underlying event which caused the movement.
A summary of inputs used as of April 30, 2017, in valuing the Funds’ assets carried at fair value, is as follows:
Level 1
| Level 2
| Level 3
| Total
| |||||||||||||
Franklin Biotechnology Discovery Fund | ||||||||||||||||
Assets: | ||||||||||||||||
Investments in Securities: | ||||||||||||||||
Equity Investments:a | ||||||||||||||||
Biotechnology | $ | 1,167,171,960 | $ | — | b | $ | 9,166,510 | $ | 1,176,338,470 | |||||||
Pharmaceuticals | 127,641,157 | — | 7,765,403 | 135,406,560 | ||||||||||||
All Other Equity Investmentsc | 57,251,142 | — | — | 57,251,142 | ||||||||||||
Short Term Investments | 85,673,142 | — | — | 85,673,142 | ||||||||||||
Total Investments in Securities |
$ |
1,437,737,401 |
| $ | — | $ | 16,931,913 | $ | 1,454,669,314 | |||||||
Receivables: | ||||||||||||||||
Investment Securities Sold | $ | — | $ | — | $ | 9,126,475 | $ | 9,126,475 | ||||||||
Franklin Natural Resources Fund | ||||||||||||||||
Assets: | ||||||||||||||||
Investments in Securities: | ||||||||||||||||
Equity Investments:a | ||||||||||||||||
Oil & Gas Exploration & Production | $ | 198,803,858 | $ | 4,285,555 | $ | — | $ | 203,089,413 | ||||||||
All Other Equity Investmentsc | 376,652,314 | — | — | b | 376,652,314 | |||||||||||
Convertible Bonds | — | 1,424,132 | — | 1,424,132 | ||||||||||||
Short Term Investments | 7,627,816 | — | — | 7,627,816 | ||||||||||||
Total Investments in Securities |
$ |
583,083,988 |
| $ | 5,709,687 | $ | — | $ | 588,793,675 | |||||||
franklintempleton.com | Annual Report | 47 | ||
FRANKLIN STRATEGIC SERIES
NOTES TO FINANCIAL STATEMENTS
10. Fair Value Measurements (continued)
aIncludes common, preferred, and convertible preferred stocks as well as other equity investments.
bIncludes securities determined to have no value at April 30, 2017.
cFor detailed categories, see the accompanying Statement of Investments.
A reconciliation of assets in which Level 3 inputs are used in determining fair value is presented when there are significant Level 3 financial instruments at the end of the year. At April 30, 2017, the reconciliation of assets is as follows:
| Net Change in | ||||||||||||||||||||||||||||||||||||
| Unrealized | ||||||||||||||||||||||||||||||||||||
| Appreciation | ||||||||||||||||||||||||||||||||||||
| Net | Net | (Depreciation) | ||||||||||||||||||||||||||||||||||
Balance at Beginning of Year | Purchases | Sales | Transfer Into/(Out of) Level 3 | Cost Basis Adjustmentsa | Realized Gain (Loss) | Unrealized Appreciation (Depreciation) | Balance at End of Year | on Assets Held at Year End | ||||||||||||||||||||||||||||
| Franklin Biotechnology Discovery Fund | ||||||||||||||||||||||||||||||||||||
| Assets: | ||||||||||||||||||||||||||||||||||||
Investments in Securities:b | ||||||||||||||||||||||||||||||||||||
Equity Investments: | ||||||||||||||||||||||||||||||||||||
Biotechnology | $ 3,195,479 | $3,750,045 | $— | $— | $— | $— | $2,220,986 | $ 9,166,510 | $ 2,220,986 | |||||||||||||||||||||||||||
Pharmaceuticals | 8,460,560 | — | — | — | — | — | (695,157 | ) | 7,765,403 | (695,157 | ) | |||||||||||||||||||||||||
Total Investments in Securities | $11,656,039 | $3,750,045 | $— | $— | $— | $— | $1,525,829 | $16,931,913 | $1,525,829 | |||||||||||||||||||||||||||
Receivables: | ||||||||||||||||||||||||||||||||||||
Investment Securities Sold | $ 9,089,004 | $ — | $— | $— | $— | $— | $ 37,471 | $ 9,126,475 | $ 37,471 | |||||||||||||||||||||||||||
aMay include accretion, amortization, partnership adjustments, and/or other cost basis adjustments.
bIncludes common and preferred stocks as well as other equity investments.
| Impact to Fair | ||||||||||||||||
| Fair Value at | Valuation | Amount/ | Value if Input | |||||||||||||
| Description | End of Year | Technique | Unobservable Inputs | Range | Increasesa | |||||||||||
Franklin Biotechnology Discovery Fund | ||||||||||||||||
Assets: | ||||||||||||||||
Investments in Securities: | ||||||||||||||||
Equity Investments:b | ||||||||||||||||
Biotechnology | $2,241,261 | Market Comparables | Discount for lack of marketability | 4.4% | Decrease | |||||||||||
Pharmaceutical | 7,181,105 | Probability Weighted | Free Cash Flow | $3,000(mil) | Increase | d | ||||||||||
| Discounted Cash Flow Modelc | Discount Rate | 12.5% | Decrease | d | ||||||||||||
| Discounted Cash Flow | Free Cash Flow | $193.3(mil) | Increase | d | ||||||||||||
| Model | Discount for lack of marketability | 35.0% | Decrease | d | ||||||||||||
| Discount Rate | 12.5% | Decrease | d | |||||||||||||
All Other Investmentse | 7,509,547 | |||||||||||||||
Total | $16,931,913 | |||||||||||||||
Receivables: | ||||||||||||||||
Investment Securities Sold | $ 9,126,475 | Discounted Cash Flow Model | Discount Rate | 1.7% | Decrease | |||||||||||
48 | Annual Report | franklintempleton.com | ||
FRANKLIN STRATEGIC SERIES
NOTES TO FINANCIAL STATEMENTS
aRepresents the directional change in the fair value of the Level 3 financial instruments that would result from a significant and reasonable increase in the corresponding input. A significant and reasonable decrease in the input would have the opposite effect. Significant impacts, if any, to fair value and/or net assets have been indicated.
bIncludes common and preferred stocks as well as other equity investments.
cIncludes probability assumptions for various outcomes of contingent payments for clinical trials and regulatory approvals.
dRepresents a significant impact to fair value but not net assets.
eIncludes financial instruments with values derived using prior transaction prices or third party pricing information without adjustment for which such inputs are also unobservable. May also include fair value of immaterial financial instruments developed using various valuation techniques and unobservable inputs.
11. Investment Company Reporting Modernization
In October 2016, the U.S. Securities and Exchange Commission adopted new rules and amended existing rules (together, final rules) intended to modernize the reporting and disclosure of information by registered investment companies. In part, the final rules amend Regulation S-X and require standardized, enhanced disclosures about derivatives in investment company financial statements, as well as other amendments. The compliance date for the amendments to Regulation S-X is August 1, 2017. Management is currently evaluating the impact that the adoption of the amendments to Regulation S-X will have on the Funds’ financial statements and related disclosures.
12. Subsequent Events
The Funds have evaluated subsequent events through the issuance of the financial statements and determined that no events have occurred that require disclosure.
Abbreviations
Selected Portfolio
ADR American Depositary Receipt
franklintempleton.com | Annual Report | 49 | ||
FRANKLIN STRATEGIC SERIES
Report of Independent Registered Public Accounting Firm
To the Board of Trustees of Franklin Strategic Series and Shareholders of the Franklin Biotechnology Discovery Fund and Franklin Natural Resources Fund:
In our opinion, the accompanying statements of assets and liabilities, including the statements of investments, and the related statements of operations and of changes in net assets and the financial highlights present fairly, in all material respects, the financial position of the Franklin Biotechnology Discovery Fund and Franklin Natural Resources Fund (the “Funds”) as of April 30, 2017, the results of each of their operations for the year then ended, the changes in each of their net assets for each of the two years in the period then ended and the financial highlights for each of the periods indicated, in conformity with accounting principles generally accepted in the United States of America. These financial statements and financial highlights (hereafter referred to as “financial statements”) are the responsibility of the Funds’ management. Our responsibility is to express an opinion on these financial statements based on our audits. We conducted our audits of these financial statements in accordance with the standards of the Public Company Accounting Oversight Board (United States). Those standards require that we plan and perform the audit to obtain reasonable assurance about whether the financial statements are free of material misstatement. An audit includes examining, on a test basis, evidence supporting the amounts and disclosures in the financial statements, assessing the accounting principles used and significant estimates made by management, and evaluating the overall financial statement presentation. We believe that our audits, which included confirmation of securities as of April 30, 2017 by correspondence with the custodian, transfer agent, and brokers, provide a reasonable basis for our opinion.
PricewaterhouseCoopers LLP
San Francisco, California
June 20, 2017
50 | Annual Report | franklintempleton.com | ||
FRANKLIN STRATEGIC SERIES
Under Section 852(b)(3)(C) of the Internal Revenue Code (Code), Franklin Biotechnology Discovery Fund hereby reports the maximum amount allowable but no less than $39,206,959 as long term capital gain dividends for the fiscal year ended April 30, 2017.
Under Section 854(b)(1)(A) of the Code, the Funds hereby report the following percentage amounts of the ordinary income dividends as income qualifying for the dividends received deduction for the fiscal year ended April 30, 2017:
Franklin Biotechnology Discovery Fund | Franklin Natural Resources Fund | |||||
| 23.23% | 94.40% | |||||
Under Section 854(b)(1)(B) of the Code , the Funds hereby report the maximum amount allowable but no less than the following amounts as qualified dividends for purposes of the maximum rate under Section 1(h)(11) of the Code for the fiscal year ended April 30, 2017:
Franklin Biotechnology Discovery Fund | Franklin Natural Resources Fund | |||||
| $3,785,991 | $11,543,526 | |||||
Distributions, including qualified dividend income, paid during calendar year 2017 will be reported to shareholders on Form 1099-DIV by mid-February 2018. Shareholders are advised to check with their tax advisors for information on the treatment of these amounts on their individual income tax returns.
franklintempleton.com | Annual Report | 51 | ||
FRANKLIN STRATEGIC SERIES
The name, year of birth and address of the officers and board members, as well as their affiliations, positions held with the Trust, principal occupations during at least the past five years and number of U.S. registered portfolios overseen in the Franklin Templeton Investments fund complex, are shown below. Generally, each board member serves until that person’s successor is elected and qualified.
Independent Board Members
Name, Year of Birth and Address | Position | Length of Time Served | Number of Portfolios in Fund Complex Overseen by Board Member* | Other Directorships Held During at Least the Past 5 Years | ||||
Harris J. Ashton (1932) One Franklin Parkway | Trustee | Since 1991 | 142 | Bar-S Foods (meat packing company) (1981-2010). | ||||
| San Mateo, CA 94403-1906 | ||||||||
| Principal Occupation During at Least the Past 5 Years: | ||||||||
| Director of various companies; and formerly, Director, RBC Holdings, Inc. (bank holding company) (until 2002); and President, Chief Executive Officer and Chairman of the Board, General Host Corporation (nursery and craft centers) (until 1998). | ||||||||
| Mary C. Choksi (1950) | Trustee | Since 2014 | 136 | Avis Budget Group Inc. (car rental) | ||||
One Franklin Parkway San Mateo, CA 94403-1906 | (2007-present), Omnicom Group Inc. (advertising and marketing communications services) (2011- present) and H.J. Heinz Company (processed foods and allied products) (1998-2006) | |||||||
Principal Occupation During at Least the Past 5 Years: Senior Advisor, Strategic Investment Group (investment management group) (2015-present); director of various companies; and formerly, Founding Partner and Senior Managing Director, Strategic Investment Group (1987–2015); Founding Partner and Managing Director, Emerging Markets Management LLC (investment management firm) (1987-2011); and Loan Officer/Senior Loan Officer/Senior Pension Investment Officer, World Bank Group (international financial institution) (1977-1987). | ||||||||
| Edith E. Holiday (1952) | Trustee | Since 1998 | 142 | Hess Corporation (exploration and | ||||
One Franklin Parkway San Mateo, CA 94403-1906 | refining of oil and gas) (1993-present), Canadian National Railway (railroad) (2001-present), White Mountains Insurance Group, Ltd. (holding company) (2004-present), Santander Consumer USA Holdings, Inc. (consumer finance) (2016-present), RTI International Metals, Inc. (manufacture and distribution of titanium) (1999-2015) and H.J. Heinz Company (processed foods and allied products) (1994-2013). | |||||||
Principal Occupation During at Least the Past 5 Years: Director or Trustee of various companies and trusts; and formerly, Assistant to the President of the United States and Secretary of the Cabinet (1990-1993); General Counsel to the United States Treasury Department (1989-1990); and Counselor to the Secretary and Assistant Secretary for Public Affairs and Public Liaison – United States Treasury Department (1988-1989). | ||||||||
| J. Michael Luttig (1954) | Trustee | Since 2009 | 142 | Boeing Capital Corporation (aircraft | ||||
| One Franklin Parkway | financing) (2006-2013). | |||||||
| San Mateo, CA 94403-1906 | ||||||||
| Principal Occupation During at Least the Past 5 Years: | ||||||||
| Executive Vice President, General Counsel and member of the Executive Council, The Boeing Company (aerospace company)(2006-present);and formerly, Federal Appeals Court Judge, U.S. Court of Appeals for the Fourth Circuit (1991-2006). | ||||||||
52 | Annual Report | franklintempleton.com | ||
FRANKLIN STRATEGIC SERIES
Independent Board Members (continued)
Name, Year of Birth and Address | Position | Length of Time Served | Number of Portfolios in Fund Complex Overseen by Board Member* | Other Directorships Held During at Least the Past 5 Years | ||||||
Larry D. Thompson (1945) One Franklin Parkway San Mateo, CA 94403-1906 | Trustee | Since 2007 | | 142 | | The Southern Company (energy company) (2014-present; previously 2010-2012), Graham Holdings Company (education and media organization) (2011-present) and Cbeyond, Inc. (business communications provider) (2010-2012). | ||||
| Principal Occupation During at Least the Past 5 Years: | ||||||||||
| Director of various companies; John A. Sibley Professor of Corporate and Business Law, University of Georgia School of Law (2015-present; previously 2011-2012); and formerly, Executive Vice President – Government Affairs, General Counsel and Corporate Secretary, PepsiCo, Inc. (consumer products) (2012-2014); Senior Vice President – Government Affairs, General Counsel and Secretary, PepsiCo, Inc. (2004-2011); Senior Fellow of The Brookings Institution (2003-2004); Visiting Professor, University of Georgia School of Law (2004); and Deputy Attorney General, U.S. Department of Justice (2001-2003). | ||||||||||
John B. Wilson (1959) One Franklin Parkway San Mateo, CA 94403-1906 | Lead Independent Trustee | Trustee since 2006 and Lead Independent Trustee since 2008
| | 116 | | None | ||||
| Principal Occupation During at Least the Past 5 Years: | ||||||||||
| President, Staples Europe (office supplies) (2012-present); President and Founder, Hyannis Port Capital, Inc. (real estate and private equity investing); serves on private and non-profit boards; and formerly, Chief Operating Officer and Executive Vice President, Gap, Inc. (retail) (1996-2000); Chief Financial Officer and Executive Vice President – Finance and Strategy, Staples, Inc. (1992-1996); Senior Vice President – Corporate Planning, Northwest Airlines, Inc. (airlines) (1990-1992); and Vice President and Partner, Bain & Company (consulting firm) (1986-1990). | ||||||||||
Interested Board Members and Officers
| ||||||||||
Name, Year of Birth and Address | Position | Length of Time Served | Number of Portfolios in Fund Complex Overseen by Board Member* | Other Directorships Held During at Least the Past 5 Years | ||||||
**Gregory E. Johnson (1961) One Franklin Parkway San Mateo, CA 94403-1906 | Trustee | Since 2013 | | 158 | | None | ||||
| Principal Occupation During at Least the Past 5 Years: | ||||||||||
| Chairman of the Board, Member - Office of the Chairman, Director and Chief Executive Officer, Franklin Resources, Inc.; officer and/or director or trustee, as the case may be, of some of the other subsidiaries of Franklin Resources, Inc. and of 44 of the investment companies in Franklin Templeton Investments; Vice Chairman, Investment Company Institute; and formerly, President, Franklin Resources, Inc. (1994-2015). | ||||||||||
**Rupert H. Johnson, Jr. (1940) One Franklin Parkway San Mateo, CA 94403-1906 | Chairman of the Board and Trustee | Chairman of the Board since 2013 and Trustee since 1991 | | 142 | | None | ||||
| Principal Occupation During at Least the Past 5 Years: | ||||||||||
| Vice Chairman, Member – Office of the Chairman and Director, Franklin Resources, Inc.; Director, Franklin Advisers, Inc.; Senior Vice President, Franklin Advisory Services, LLC; and officer and/or director or trustee, as the case may be, of some of the other subsidiaries of Franklin Resources, Inc. and of 42 of the investment companies in Franklin Templeton Investments. | ||||||||||
| Alison E. Baur (1964) | Vice President | Since 2012 | Not Applicable | Not Applicable | ||||||
One Franklin Parkway San Mateo, CA 94403-1906 | ||||||||||
| Principal Occupation During at Least the Past 5 Years: | ||||||||||
| Deputy General Counsel, Franklin Templeton Investments; and officer of some of the other subsidiaries of Franklin Resources, Inc. and of 45 of the investment companies in Franklin Templeton Investments. | ||||||||||
franklintempleton.com | Annual Report | 53 | ||
FRANKLI N STRATEGIC SERIES
Interested Board Members and Officers (continued)
Name, Year of Birth and Address | Position | Length of Time Served | Number of Portfolios in Fund Complex Overseen by Board Member* | Other Directorships Held During at Least the Past 5 Years | ||||||||
Laura F. Fergerson (1962) One Franklin Parkway San Mateo, CA 94403-1906 | Chief Executive Officer – Finance and Administration | | Since 2009 | | | Not Applicable | | Not Applicable | ||||
| Principal Occupation During at Least the Past 5 Years: | ||||||||||||
| Senior Vice President, Franklin Templeton Services, LLC; Vice President, Franklin Advisers, Inc. and Franklin Templeton Institutional, LLC; and officer of 45 of the investment companies in Franklin Templeton Investments. | ||||||||||||
Gaston Gardey (1967) One Franklin Parkway San Mateo, CA 94403-1906 | Treasurer, Chief Financial Officer and Chief Accounting Officer | | Since 2009 | | | Not Applicable | | Not Applicable | ||||
| Principal Occupation During at Least the Past 5 Years: | ||||||||||||
| Treasurer, U.S. Fund Administration & Reporting, Franklin Templeton Investments; and officer of 27 of the investment companies in Franklin Templeton Investments. | ||||||||||||
Aliya S. Gordon (1973) One Franklin Parkway San Mateo, CA 94403-1906 | Vice President | | Since 2009 | | | Not Applicable | | Not Applicable | ||||
| Principal Occupation During at Least the Past 5 Years: | ||||||||||||
| Senior Associate General Counsel, Franklin Templeton Investments; and officer of 45 of the investment companies in Franklin Templeton Investments. | ||||||||||||
Steven J. Gray (1955) One Franklin Parkway San Mateo, CA 94403-1906 | Vice President | | Since 2009 | | | Not Applicable | | Not Applicable | ||||
| Principal Occupation During at Least the Past 5 Years: | ||||||||||||
| Senior Associate General Counsel, Franklin Templeton Investments; Vice President, Franklin Templeton Distributors, Inc.; and officer of 45 of the investment companies in Franklin Templeton Investments. | ||||||||||||
Edward B. Jamieson (1948) One Franklin Parkway San Mateo, CA 94403-1906 | President and Chief Executive Officer – Investment Management | | Since 2010 | | | Not Applicable | | Not Applicable | ||||
| Principal Occupation During at Least the Past 5 Years: | ||||||||||||
| President and Director, Franklin Advisers, Inc.; Executive Vice President, Franklin Templeton Institutional, LLC; and officer and/or trustee, as the case may be, of some of the other subsidiaries of Franklin Resources, Inc. and of 10 of the investment companies in Franklin Templeton Investments. | ||||||||||||
Robert Lim (1948) One Franklin Parkway San Mateo, CA 94403-1906 | Vice President – AML Compliance | | Since 2016 | | | Not Applicable | | Not Applicable | ||||
| Principal Occupation During at Least the Past 5 Years: | ||||||||||||
| Vice President, Franklin Templeton Companies, LLC; Chief Compliance Officer, Franklin Templeton Distributors, Inc. and Franklin Templeton Investor Services, LLC; and officer of 45 of the investment companies in Franklin Templeton Investments. | ||||||||||||
Christopher J. Molumphy (1962) One Franklin Parkway San Mateo, CA 94403-1906 | Vice President | | Since 2000 | | | Not Applicable | | Not Applicable | ||||
| Principal Occupation During at Least the Past 5 Years: | ||||||||||||
| Director and Executive Vice President, Franklin Advisers, Inc.; Executive Vice President, Franklin Templeton Institutional, LLC; and officer of some of the other subsidiaries of Franklin Resources, Inc. and of 22 of the investment companies in Franklin Templeton Investments. | ||||||||||||
54 | Annual Report | franklintempleton.com | ||
FRANKLIN STRATEGIC SERIES
Interested Board Members and Officers (continued)
Name, Year of Birth and Address | Position | Length of Time Served | Number of Portfolios in Fund Complex Overseen by Board Member* | Other Directorships Held During at Least the Past 5 Years | ||||
Kimberly H. Novotny (1972) 300 S.E. 2nd Street Fort Lauderdale, FL 33301-1923 | Vice President | Since 2013 | Not Applicable | Not Applicable | ||||
| Principal Occupation During at Least the Past 5 Years: | ||||||||
| Associate General Counsel, Franklin Templeton Investments; Vice President and Corporate Secretary, Fiduciary Trust International of the South; Vice President, Templeton Investment Counsel, LLC; Assistant Secretary, Franklin Resources, Inc.; and officer of 45 of the investment companies in Franklin Templeton Investments. | ||||||||
Robert C. Rosselot (1960) 300 S.E. 2nd Street Fort Lauderdale, FL 33301-1923 | Chief Compliance Officer | Since 2013 | Not Applicable | Not Applicable | ||||
| Principal Occupation During at Least the Past 5 Years: | ||||||||
| Director, Global Compliance, Franklin Templeton Investments; Vice President, Franklin Templeton Companies, LLC; officer of 45 of the investment companies in Franklin Templeton Investments; and formerly, Senior Associate General Counsel, Franklin Templeton Investments (2007-2013); and Secretary and Vice President, Templeton Group of Funds (2004-2013). | ||||||||
Karen L. Skidmore (1952) One Franklin Parkway San Mateo, CA 94403-1906 | Vice President and Secretary | Since 2006 | Not Applicable | Not Applicable | ||||
| Principal Occupation During at Least the Past 5 Years: | ||||||||
| Senior Associate General Counsel, Franklin Templeton Investments; and officer of 45 of the investment companies in Franklin Templeton Investments. | ||||||||
Navid J. Tofigh (1972) One Franklin Parkway San Mateo, CA 94403-1906 | Vice President | Since 2015 | Not Applicable | Not Applicable | ||||
| Principal Occupation During at Least the Past 5 Years: | ||||||||
| Associate General Counsel, Franklin Templeton Investments; and officer of 45 of the investment companies in Franklin Templeton Investments. | ||||||||
Craig S. Tyle (1960) One Franklin Parkway San Mateo, CA 94403-1906 | Vice President | Since 2005 | Not Applicable | Not Applicable | ||||
| Principal Occupation During at Least the Past 5 Years: | ||||||||
| General Counsel and Executive Vice President, Franklin Resources, Inc.; and officer of some of the other subsidiaries of Franklin Resources, Inc. and of 45 of the investment companies in Franklin Templeton Investments. | ||||||||
Lori A. Weber (1964) 300 S.E. 2nd Street Fort Lauderdale, FL 33301-1923 | Vice President | Since 2011 | Not Applicable | Not Applicable | ||||
| Principal Occupation During at Least the Past 5 Years: | ||||||||
| Senior Associate General Counsel, Franklin Templeton Investments; Assistant Secretary, Franklin Resources, Inc.; Vice President and Secretary, Templeton Investment Counsel, LLC; and officer of 45 of the investment companies in Franklin Templeton Investments. | ||||||||
*We base the number of portfolios on each separate series of the U.S. registered investment companies within the Franklin Templeton Investments fund complex. These portfolios have a common investment manager or affiliated investment managers.
**Gregory E. Johnson is considered to be an interested person of the Fund under the federal securities laws due to his position as an officer and director of Franklin Resources, Inc. (Resources), which is the parent company of the Fund’s investment manager and distributor. Rupert H. Johnson, Jr. is considered to be an interested person of the Fund under the federal securities laws due to his position as officer and director and major shareholder of Resources.
Note 1: Rupert H. Johnson, Jr. is the uncle of Gregory E. Johnson.
Note 2: Officer information is current as of the date of this report. It is possible that after this date, information about officers may change.
Note 3: Effective November 1, 2016, Frank Olson ceased to be a trustee of the trust.
The Sarbanes-Oxley Act of 2002 and Rules adopted by the Securities and Exchange Commission require the Fund to disclose whether the Fund’s Audit Committee includes at least one member who is an audit committee financial expert within the meaning of such Act and Rules. The Fund’s Board has determined that there is at least one such financial expert on the Audit Committee and has designated John B. Wilson as its audit committee financial expert. The Board believes that Mr. Wilson qualifies as such an expert in view of his extensive business background and experience, including service as chief financial officer of Staples, Inc. from 1992 to 1996. Mr. Wilson has been a Member and Chairman of the Fund’s Audit Committee since 2006. As a result of such background and
franklintempleton.com | Annual Report | 55 | ||
FRANKLIN STRATEGIC SERIES
Interested Board Members and Officers (continued)
experience, the Board believes that Mr. Wilson has acquired an understanding of generally accepted accounting principles and financial statements, the general application of such principles in connection with the accounting estimates, accruals and reserves, and analyzing and evaluating financial statements that present a breadth and level of complexity of accounting issues generally comparable to those of the Fund, as well as an understanding of internal controls and procedures for financial reporting and an understanding of audit committee functions. Mr. Wilson is an independent Board member as that term is defined under the relevant Securities and Exchange Commission Rules and Releases.
The Statement of Additional Information (SAI) includes additional information about the board members and is available, without charge, upon request. Shareholders may call (800) DIAL BEN/342-5236 to request the SAI.
56 | Annual Report | franklintempleton.com | ||
FRANKLIN STRATEGIC SERIES
Board Approval of Investment Management Agreements
FRANKLIN STRATEGIC SERIES
Franklin Biotechnology Discovery Fund
Franklin Natural Resources Fund
(each a Fund)
At an in-person meeting held on April 18, 2017 (Meeting), the Board of Trustees (Board) of Franklin Strategic Series, including a majority of the trustees who are not “interested persons” as defined in the Investment Company Act of 1940 (Independent Trustees), reviewed and approved the continuance of the investment management agreement between Franklin Advisers, Inc. (Manager) and each Fund (each a Management Agreement) for an additional one-year period. The Independent Trustees received advice from and met separately with Independent Trustee counsel in considering whether to approve the continuation of each Management Agreement. Although the Management Agreements for the Funds were considered at the same Board meeting, the Board considered the information provided to it about the Funds together and with respect to each Fund separately as the Board deemed appropriate.
In considering the continuation of each Management Agreement, the Board reviewed and considered information provided by the Manager at the Meeting and throughout the year at meetings of the Board and its committees. The Board also reviewed and considered information provided in response to a detailed set of requests for information submitted to the Manager by Independent Trustee counsel on behalf of the Independent Trustees in connection with the annual contract renewal process. In addition, prior to the Meeting, the Independent Trustees held a telephonic contract renewal meeting at which the Independent Trustees conferred amongst themselves and Independent Trustee counsel about contract renewal matters. The Board reviewed and considered all of the factors it deemed relevant in approving the continuance of each Management Agreement, including, but not limited to: (i) the nature, extent, and quality of the services provided by the Manager; (ii) the investment performance of each Fund; (iii) the costs of the services provided and profits realized by the Manager and its affiliates from the relationship with each Fund; (iv) the extent to which economies of scale are realized as each Fund grows; and (v) whether fee levels reflect these economies of scale for the benefit of Fund investors.
In approving the continuance of each Management Agreement, the Board, including a majority of the Independent Trustees,
determined that the existing management fees are fair and reasonable and that the continuance of such Management Agreement is in the interests of the applicable Fund and its shareholders. While attention was given to all information furnished, the following discusses some primary factors relevant to the Board’s determination.
Nature, Extent and Quality of Services
The Board reviewed and considered information regarding the nature, extent and quality of investment management services provided by the Manager and its affiliates to the Funds and their shareholders. This information included, among other things, the qualifications, background and experience of the senior management and investment personnel of the Manager; the structure of investment personnel compensation; oversight of third-party service providers; investment performance reports and related financial information for each Fund; reports on expenses, shareholder services, marketing support payments made to financial intermediaries and third party servicing arrangements; legal and compliance matters; risk controls; pricing and other services provided by the Manager and its affiliates; and management fees charged by the Manager and its affiliates to U.S. funds and other accounts, including management’s explanation of differences among accounts where relevant. The Board noted management’s continual efforts and expenditures in establishing effective business continuity plans and developing strategies to address areas of heightened concern in the mutual fund industry, such as cybersecurity, derivatives and liquidity risk management.
The Board also reviewed and considered the benefits provided to Fund shareholders of investing in a fund that is part of the Franklin Templeton family of funds. The Board noted the financial position of Franklin Resources, Inc. (FRI), the Manager’s parent, and its commitment to the mutual fund business as evidenced by its continued introduction of new funds, reassessment of the fund offerings in response to the market environment and project initiatives and capital investments relating to the services provided to the Funds by the Franklin Templeton Investments (FTI) organization.
Following consideration of such information, the Board was satisfied with the nature, extent and quality of services provided by the Manager and its affiliates to the Funds and their shareholders.
Fund Performance
The Board reviewed and considered the performance results of each Fund over various time periods ended January 31, 2017. The Board considered the performance returns for each Fund in
franklintempleton.com | Annual Report | 57 | ||
FRANKLIN STRATEGIC SERIES
SHAREHOLDER INFORMATION
comparison to the performance returns of mutual funds deemed comparable to the Fund included in a universe (Performance Universe) selected by Broadridge Financial Solutions, Inc. (Broadridge), an independent provider of investment company data. The Board received a description of the methodology used by Broadridge to select the mutual funds included in a Performance Universe. The Board also reviewed and considered Fund performance reports provided and discussions that occurred with portfolio managers at Board meetings throughout the year. A summary of each Fund’s performance results is below.
Franklin Biotechnology Discovery Fund - The Performance Universe for this Fund included the Fund and all retail and institutional health/biotechnology funds. The Board noted that the Fund’s annualized total return for the one-, five- and 10-year periods was above the median of its Performance Universe, but for the three-year period was below the median of its Performance Universe. The Board concluded that the Fund’s performance was satisfactory. In doing so, the Board noted that at the Fund opened to new investors on May 16, 2016.
Franklin Natural Resources Fund - The Performance Universe for this Fund included the Fund and all retail and institutional global natural resources funds. The Board noted that the Fund’s annualized total return for the one- and 10-year periods was above the median of its Performance Universe, but for the three- and five-year periods was below the median of its Performance Universe. The Board concluded that the Fund’s performance was satisfactory. In doing so, the Board noted that the Fund’s annualized total return for the one-year period exceeded 44% and was in the second quintile of its Performance Universe.
Comparative Fees and Expenses
The Board reviewed and considered information regarding each Fund’s actual total expense ratio and its various components, including, as applicable, management fees; transfer agent expenses; underlying fund expenses; Rule 12b-1 and non-Rule 12b-1 service fees; and other non-management fees. The Board also noted that at its February meeting each year, it receives an annual report on all marketing support payments made by FTI to financial intermediaries. The Board considered the actual total expense ratio and, separately, the contractual management fee rate, without the effect of fee waivers, if any (Management Rate) of each Fund in comparison to the median ratio and median Management Rate, respectively, of other mutual funds deemed comparable to and with a similar expense
structure as the Fund selected by Broadridge (Expense Group). Broadridge fee and expense data is based upon information taken from each fund’s most recent annual report, which reflects historical asset levels that may be quite different from those currently existing, particularly in a period of market volatility. While recognizing such inherent limitation and the fact that expense ratios and Management Rates generally increase as assets decline and decrease as assets grow, the Board believed the independent analysis conducted by Broadridge to be an appropriate measure of comparative fees and expenses. The Broadridge Management Rate includes administrative charges, and the actual total expense ratio, for comparative consistency, was shown for Class A shares for funds with multiple classes of shares. The Board received a description of the methodology used by Broadridge to select the mutual funds included in an Expense Group.
The Expense Group for the Franklin Biotechnology Discovery Fund included the Fund and six other health/biotechnology funds. The Expense Group for the Franklin Natural Resources Fund included the Fund and seven other global natural resources funds. The Board noted that the Management Rates and actual total expense ratios for these Funds were below the medians of their respective Expense Groups. The Board concluded that the Management Rates charged to these Funds are fair and reasonable.
Profitability
The Board reviewed and considered information regarding the profits realized by the Manager and its affiliates in connection with the operation of each Fund. In this respect, the Board considered the Fund profitability analysis provided by the Manager that addresses the overall profitability of FTI’s U.S. fund business, as well as its profits in providing investment management and other services to each of the individual funds during the 12-month period ended September 30, 2016, being the most recent fiscal year-end for FRI. The Board noted that although management continually makes refinements to its methodologies used in calculating profitability in response to organizational and product-related changes, the overall methodology has remained consistent with that used in the Funds’ profitability report presentations from prior years. Additionally, the Funds’ independent registered public accounting firm has been engaged by the Manager to periodically review the reasonableness of the allocation methodologies to be used solely by the Funds’ Board with respect to the profitability analysis.
58 | Annual Report | franklintempleton.com | ||
FRANKLIN STRATEGIC SERIES
SHAREHOLDER INFORMATION
The Board noted management’s belief that costs incurred in establishing the infrastructure necessary for the type of mutual fund operations conducted by the Manager and its affiliates may not be fully reflected in the expenses allocated to each Fund in determining its profitability, as well as the fact that the level of profits, to a certain extent, reflected operational cost savings and efficiencies initiated by management. The Board also noted management’s expenditures in improving shareholder services provided to the Funds, as well as the need to implement systems and meet additional regulatory and compliance requirements resulting from recent SEC and other regulatory requirements.
The Board also considered the extent to which the Manager and its affiliates might derive ancillary benefits from fund operations, including revenues generated from transfer agent services, potential benefits resulting from personnel and systems enhancements necessitated by fund growth, as well as increased leverage with service providers and counterparties. Based upon its consideration of all these factors, the Board concluded that the level of profits realized by the Manager and its affiliates from providing services to each Fund was not excessive in view of the nature, quality and extent of services provided to each Fund.
Economies of Scale
The Board reviewed and considered the extent to which the Manager may realize economies of scale, if any, as each Fund grows larger and whether the Fund’s management fee structure reflects any economies of scale for the benefit of shareholders. With respect to possible economies of scale, the Board noted the existence of management fee breakpoints, which operate generally to share any economies of scale with a Fund’s shareholders by reducing the Fund’s effective management fees as the Fund grows in size. The Board considered the Manager’s view that any analyses of potential economies of scale in managing a particular fund are inherently limited in light of the joint and common costs and investments the Manager incurs across the Franklin Templeton family of funds as a whole. The Board concluded that to the extent economies of scale may be realized by the Manager and its affiliates, each Fund’s management fee structure provided a sharing of benefits with the Fund and its shareholders as the Fund grows.
Conclusion
Based on its review, consideration and evaluation of all factors it believed relevant, including the above-described factors and
conclusions, the Board unanimously approved the continuation of each Management Agreement for an additional one-year period.
Proxy Voting Policies and Procedures
The Trust’s investment manager has established Proxy Voting Policies and Procedures (Policies) that the Trust uses to determine how to vote proxies relating to portfolio securities. Shareholders may view the Trust’s complete Policies online at franklintempleton.com. Alternatively, shareholders may request copies of the Policies free of charge by calling the Proxy Group collect at (954) 527-7678 or by sending a written request to: Franklin Templeton Companies, LLC, 300 S.E. 2nd Street, Fort Lauderdale, FL 33301, Attention: Proxy Group. Copies of the Trust’s proxy voting records are also made available online at franklintempleton.com and posted on the U.S. Securities and Exchange Commission’s website at sec.gov and reflect the most recent 12-month period ended June 30.
Quarterly Statement of Investments
The Trust files a complete statement of investments with the U.S. Securities and Exchange Commission for the first and third quarters for each fiscal year on Form N-Q. Shareholders may view the filed Form N-Q by visiting the Commission’s website at sec.gov. The filed form may also be viewed and copied at the Commission’s Public Reference Room in Washington, DC. Information regarding the operations of the Public Reference Room may be obtained by calling (800) SEC-0330.
Householding of Reports and Prospectuses
You will receive each Fund’s financial reports every six months as well as an annual updated summary prospectus (prospectus available upon request). To reduce Fund expenses, we try to identify related shareholders in a household and send only one copy of the financial reports and summary prospectus. This process, called “householding,” will continue indefinitely unless you instruct us otherwise. If you prefer not to have these documents householded, please call us at (800) 632-2301. At any time you may view current prospectuses/summary prospectuses and financial reports on our website. If you choose, you may receive these documents through electronic delivery.
franklintempleton.com | Annual Report | 59 | ||
This page intentionally left blank.
 |
Annual Report and Shareholder Letter Franklin Strategic Series
| |
| Investment Manager | ||
Franklin Advisers, Inc.
| ||
| Distributor | ||
| Franklin Templeton Distributors, Inc. | ||
(800) DIAL BEN® / 342-5236 franklintempleton.com
| ||
| Shareholder Services | ||
| (800) 632-2301 |
Authorized for distribution only when accompanied or preceded by a summary prospectus and/or prospectus. Investors should carefully consider a fund’s investment goals, risks, charges and expenses before investing. A prospectus contains this and other information; please read it carefully before investing.
To help ensure we provide you with quality service, all calls to and from our service areas are monitored and/or recorded.
© 2017 Franklin Templeton Investments. All rights reserved. | FSS2 A 06/17 | |||

Franklin Templeton Investments
Gain From Our Perspective®
At Franklin Templeton Investments, we’re dedicated to one goal: delivering exceptional asset management for our clients. By bringing together multiple, world-class investment teams in a single firm, we’re able to offer specialized expertise across styles and asset classes, all supported by the strength and resources of one of the world’s largest asset managers. This has helped us to become a trusted partner to individual and institutional investors across the globe.
Dear Shareholder:
During the 12 months ended April 30, 2017, the global economy expanded amid a stronger recovery in several developed markets and encouraging economic data in certain emerging markets. Improving growth expectations led to higher interest rates. In this environment, global government bonds, as measured by the Citigroup World Government Bond Index, recorded modest losses in U.S. dollar and local currency terms.
In all economic environments, we are committed to our long-term perspective and disciplined investment approach as we conduct a diligent, fundamental analysis of securities with a regular emphasis on investment risk management.
We believe active, professional investment management serves investors well. We also recognize the important role of financial advisors in today’s markets and encourage investors to continue to seek their advice. Amid changing markets and economic conditions, we are confident investors with a well-diversified portfolio and a patient, long-term outlook should be well positioned for the years ahead.
Franklin Flexible Alpha Bond Fund’s annual report includes more detail about prevailing conditions and a discussion about
investment decisions during the period. Please remember all securities markets fluctuate, as do mutual fund share prices.
We thank you for investing with Franklin Templeton, welcome your questions and comments, and look forward to serving your investment needs in the years ahead.
Sincerely,
Edward B. Jamieson
President and Chief Executive Officer –
Investment Management
Franklin Strategic Series
This letter reflects our analysis and opinions as of April 30, 2017, unless otherwise indicated. The information is not a complete analysis of every aspect of any market, country, industry, security or fund. Statements of fact are from sources considered reliable.
Not FDIC Insured | May Lose Value | No Bank Guarantee
|
franklintempleton.com | Not part of the annual report | 1 | ||
Contents
| 3 | ||||
| 8 | ||||
| 11 | ||||
| 12 | ||||
| 26 | ||||
| 30 | ||||
| Report of Independent Registered Public Accounting Firm | 45 | |||
| 46 | ||||
| 47 | ||||
| 52 | ||||
Visit franklintempleton.com for fund updates, to access your account, or to find helpful financial planning tools.
2 | Annual Report | franklintempleton.com | ||
Franklin Flexible Alpha Bond Fund
We are pleased to bring you Franklin Flexible Alpha Bond Fund’s annual report for the fiscal year ended April 30, 2017.
Your Fund’s Goal and Main Investments
The Fund seeks to provide total return through a combination of current income and capital appreciation by investing at least 80% of its net assets in bonds and investments that provide exposure to bonds, including global debt obligations of any credit quality, maturity or duration, all varieties of fixed income, variable rate and floating rate debt securities and investments, and derivatives. The Fund aims to provide attractive risk-adjusted total returns over a full market cycle. A full market cycle is a period of time that spans a full business and economic cycle, which may include periods of rising and declining interest rates.
What is duration?
|
Duration is a measure of a bond’s price sensitivity to interest-rate changes. In general, a portfolio of securities with a lower duration can be expected to be less sensitive to interest-rate changes than a portfolio with a higher duration.
|
Performance Overview
For the 12 months under review, the Fund’s Class A shares delivered a +2.22% cumulative total return. In comparison, the LIBOR USD 3-Month Rate Index posted a +0.39% total return.1 The index tracks the interest rate at which banks offer to lend to one another in the wholesale money markets in London and is used to set the cost of various variable-rate loans. You can find more of the Fund’s performance data in the Performance Summary beginning on page 8.
Performance data represent past performance, which does not guarantee future results. Investment return and principal value will fluctuate, and you may have a gain or loss when you sell your shares. Current performance may differ from figures shown. For most recent month-end performance, go to franklintempleton.com or call (800) 342-5236.
Sector Exposure*
4/30/17
% of Total
| ||||
Investment-Grade Corporate Securities |
|
25.5%
|
| |
Residential Mortgage-Backed Securities |
| 22.2%
|
| |
Collateralized Loan Obligations |
| 9.7%
|
| |
Municipal Bonds |
| 6.6%
|
| |
Commercial Mortgage-Backed Securities |
| 6.6%
|
| |
Cash & Cash Equivalents |
| 6.6%
|
| |
Covered Bonds |
| 5.8%
|
| |
U.S. Treasuries |
| 4.9%
|
| |
Asset-Backed Securities |
| 4.1%
|
| |
Floating Rate Loans |
| 3.9%
|
| |
International Bonds |
| 2.6%
|
| |
High Yield Corporate Securities |
| 1.3%
|
| |
Other |
| -0.1%
|
| |
Interest-Rate Derivatives |
| -40.0%
|
| |
*Sector Exposure is intended to estimate the portfolio’s exposure to various sectors, including any hedged or increased exposure through certain derivatives held in the portfolio (or their underlying reference assets) and may not total 100% or may be negative due to rounding, use of any derivatives, unsettled trades or other factors. Interest-Rate Derivatives sector consists of Treasury, interest-rate and other derivatives that are primarily used for duration management; a negative number indicates that the Fund is seeking to hedge interest-rate risk.
Economic and Market Overview
The U.S. economy expanded during the 12 months under review. The economy strengthened in 2016’s third quarter, but moderated in the next two quarters, largely due to declines in private inventory investment and government spending. The manufacturing sector generally expanded and the services sector also continued to grow. The unemployment rate decreased from 5.0% in April 2016 to 4.4% at period-end.2 Monthly retail sales were volatile, but grew during most of the period. Annual inflation as measured by the Consumer Price Index, generally increased during the period.
1. Source: Bloomberg LP.
The index is unmanaged and includes reinvestment of any income or distributions. It does not reflect any fees, expenses or sales charges. One cannot invest directly in an index, and an index is not representative of the Fund’s portfolio.
2. Source: Bureau of Labor Statistics.
See www.franklintempletondatasources.com for additional data provider information.
The dollar value, number of shares or principal amount, and names of all portfolio holdings are listed in the Fund’s Statement of Investments (SOI). The SOI begins on page 17.
franklintempleton.com | Annual Report | 3 | ||
FRANKLIN FLEXIBLE ALPHA BOND FUND
Distributions*
5/1/16–4/30/17
| Distributions per Share (cents) | ||||||||||||||||||||
| Month | Class A | Class C | Class R | Class R6 | Advisor Class | |||||||||||||||
May | 1.0180 | 0.6150 | 0.6960 | 1.0770 | 1.0342 | |||||||||||||||
June | 0.3727 | 0.2379 | 0.2670 | 0.3790 | 0.3793 | |||||||||||||||
July | 0.3835 | 0.2480 | 0.2780 | 0.3900 | 0.3900 | |||||||||||||||
August | 0.3873 | 0.2338 | 0.2730 | 0.3980 | 0.3941 | |||||||||||||||
September | 0.6832 | 0.3944 | 0.4640 | 0.6990 | 0.6964 | |||||||||||||||
October | 0.4992 | 0.2583 | 0.5080 | 0.5100 | 0.5080 | |||||||||||||||
November | 0.7502 | 0.4642 | 1.2610 | 0.7500 | 0.7444 | |||||||||||||||
December** | 12.6841 | 12.5626 | 12.6920 | 12.6920 | 12.6889 | |||||||||||||||
January | 1.2636 | 0.8202 | 1.2751 | 1.2840 | 1.2793 | |||||||||||||||
February | 1.2238 | 0.8307 | 1.2340 | 1.2400 | 1.2379 | |||||||||||||||
March | 1.6597 | 1.1970 | 1.6711 | 1.6850 | 1.6763 | |||||||||||||||
April | 0.8000 | 0.5174 | 0.0370 | 0.8290 | 0.8217 | |||||||||||||||
Total | 21.7253 | 18.3795 | 20.6562 | 21.9330 | 21.8505 | |||||||||||||||
*The distribution amount is the sum of all distributions to shareholders for the period shown and includes only net investment income. All Fund distributions will vary depending upon current market conditions, and past distributions are not indicative of future trends.
**Includes an additional 12.37 cent per share distribution to meet excise tax requirements.
After maintaining its target interest rate in the 0.25%–0.50% range for nearly a year, the U.S. Federal Reserve (Fed), at its December meeting, increased its target range for the federal funds rate to 0.50%–0.75%, as policymakers noted improvement in U.S. labor market and inflation. The Fed kept its interest rate unchanged at its February meeting, but incoming economic data, along with statements by Fed officials in late February and early March, heightened many investors’ expectations for a March interest-rate hike. The Fed, at its March meeting, made the widely anticipated increase in its federal funds target rate to 0.75%–1.00%.
The 10-year Treasury yield, which moves inversely to its price, shifted throughout the period. Treasury yields declined earlier in the period due to negative interest rates in Japan and Europe, central banks’ purchases of government bonds and the U.K.’s historic referendum to leave the European Union in June 2016 (also known as “Brexit”). Geopolitical tensions in the Middle East and the Korean peninsula pulled the yield further down. However, the yield rose in October due to positive economic data and signals from the Fed about the possibility of an increase in interest rates in the near term. The yield further increased in November and December, amid a bond market sell-off, based on investor expectations that possible expansionary fiscal policies under new U.S. President Donald Trump could lead to a stronger economy and higher inflation.
Overall, the U.S. Treasury yield rose from 1.83% at the beginning of the period to 2.29% at period-end.
Currency Composition*
4/30/17
| % of Total Net Assets | ||||
North America | 102.6% | |||
U.S. Dollar | 103.2% | |||
Canadian Dollar | -0.6% | |||
Latin America & Caribbean | 0.4% | |||
Mexican Peso | 0.6% | |||
Chilean Peso | -0.2% | |||
Asia | -0.8% | |||
Indian Rupee | 0.5% | |||
Indonesian Rupiah | 0.2% | |||
Japanese Yen | -0.3% | |||
Singapore Dollar | -0.5% | |||
South Korean Won | -0.7% | |||
Europe | -1.3% | |||
Norwegian Krone | 0.2% | |||
Swedish Krona | 0.0%** | |||
Euro | -1.0% | |||
British Pound | -0.5% | |||
Australia & New Zealand | -1.0% | |||
Australian Dollar
|
| -1.0%
|
| |
*Currency Composition is intended to estimate the portfolio’s exposure to various currencies, including any hedged or increased exposure through certain derivatives held in the portfolio (or their underlying reference assets) and may not total 100% or may be negative due to rounding, use of any derivatives, unsettled trades or other factors.
**Rounds to less than 0.1% of total net assets.
During the period under review, global financial markets were broadly influenced by accommodative monetary policies of various global central banks, improved commodity prices and generally encouraging economic data across regions. Investor optimism about pro-growth policies in the U.S. as well as hopes of tax reforms under the Trump administration, the results of the first round of presidential elections in France, encouraging corporate earnings reports, and a deal by major oil producing countries in December to curb oil production also supported global equity markets. However, investors expressed concerns about the timing and economic effects of Brexit and the U.S. executive order banning entry from some Muslim-majority countries. Other headwinds included the
4 | Annual Report | franklintempleton.com | ||
FRANKLIN FLEXIBLE ALPHA BOND FUND
health of European banks; elections in Europe, particularly in France; and geopolitical tensions in certain regions.
Investment Strategy
The Fund seeks to generate returns from various sources, other than solely from interest rates, by allocating its portfolio across various risks (such as credit, currency and duration risks). In employing this strategy, the Fund has the flexibility to invest across all debt asset classes without regard to country, sector, quality, maturity or duration and without reference to a benchmark index.
The Fund may engage in active and frequent trading as part of its investment strategies and, at any given time, may have a substantial amount of its assets invested in any class of debt securities, including, but not limited to: U.S. government and agency securities; foreign government and supranational debt securities; corporate bonds; corporate loans (and loan participations); collateralized debt and loan obligations; preferred securities; various types of mortgage-backed securities and other asset-backed securities; municipal securities; and derivatives and other instruments with similar economic characteristics, or that provide exposure, to such debt securities.
Manager’s Discussion
During the period under review, the Fund posted a positive total return. The Fund’s spread sector exposure was the primary contributor to performance, driven mainly by the Fund’s exposure to residential mortgage-backed securities (RMBS), investment-grade corporate bonds, floating rate bank loans (including collateralized loan obligations), commercial mortgage-backed securities (CMBS) and the Fund’s exposure to Treasury inflation-protected securities (TIPS). The Fund’s basis trade positions (taking opposing long and short positions in the two securities to profit from the convergence of their values) was another positive source of alpha (excess return). In addition, the Fund’s yield curve and duration positioning, as well as foreign currency exposure, also contributed to results. In contrast, the Fund’s exposure to the corporate high yield sector was the primary detractor from performance over the period.
What is the yield curve?
|
The yield curve is a line that plots the interest rates, at a set point in time, of bonds having equal credit quality but differing maturity dates. The most frequently reported yield curve compares three-month, two-year and 30-year U.S. Treasury debt.
|
At period-end, we continued to invest in a broad set of global fixed income sectors, with a goal of achieving more consistent positive alpha with a risk-diversified portfolio. Additionally, the Fund’s risk profile was maintained at a conservative level. We remained overweighted to the investment-grade corporate bond sector as well as securitized sectors including RMBS and CMBS. We continued to find what we considered value in credit hedged corporate positions as well. We sought to hedge all of the high yield corporate beta (or risk) in the Fund, although we retained exposure to select corporate loans and collateralized loan obligations. We also retained positions in TIPS and municipal bonds. Overall, portfolio duration remained relatively neutral toward U.S. interest-rate and non-U.S. duration positions. The portfolio maintained an overweighting to the U.S. dollar versus a basket of developed market and commodity-related currencies, although its various currency positions did not represent a significant portion of the Fund’s risk allocation.
The Fund utilized derivatives, including currency forward contracts, government bond futures, credit default swaps, total return swaps and options, principally as a tool for efficient portfolio management and to manage overall portfolio risk. A majority of the exposures were used to hedge various beta risks including interest rates, credit and currency. Additionally, derivatives were used to more efficiently achieve various exposures including expressing directional currency views and select credit exposures. These derivative transactions may provide the same, or similar, net long or short exposure to select currencies, interest rates, countries, duration or credit risks in a less expensive way than by directly purchasing securities. Furthermore, the option positions may provide a tail-risk (the risk of an investment moving more than three standard deviations from its current price) hedge in the portfolio to help minimize lower performance during more extreme market environments, when investors seek to reduce risk. Overall, the portfolio continued to meet its risk-adjusted return target and remained in the lower end of our targeted risk range.
What is a currency forward contract?
|
A currency forward contract is an agreement between the Fund and a counterparty to buy or sell a foreign currency in exchange for another currency at a specific exchange rate on a future date.
|
franklintempleton.com | Annual Report | 5 | ||
FRANKLIN FLEXIBLE ALPHA BOND FUND
What are swap agreements?
|
Swap agreements, such as interest-rate, currency and credit default swaps, are contracts between the Fund and another party (the swap counterparty). In a basic swap transaction, the Fund agrees with the swap counterparty to exchange the returns (or differentials in rates of return) earned or realized on a particular “notional amount” of underlying instruments. The notional amount is the set amount selected by the parties as the basis on which to calculate the obligations that they have agreed to exchange. The parties typically do not actually exchange the notional amount. Instead, they agree to exchange the returns that would be earned or realized if the notional amount were invested in given instruments or at given interest rates.
|
What is a futures contract?
|
A futures contract is an agreement between the Fund and a counterparty made through a U.S. or foreign futures exchange to buy or sell an underlying instrument or asset at a specific price on a future date.
|
What is an option?
|
An option is a contract to buy or sell a specific financial product known as the option’s underlying instrument at a specific price. The buyer of an option has the right, but not the obligation, to buy or sell the underlying instrument at or until a specified expiration date. Conversely, the seller (“writer”) of an option who opens a transaction is obligated to buy or sell the underlying instrument should the option holder exercise that right.
|
Thank you for your participation in Franklin Flexible Alpha Bond Fund. We look forward to serving your future investment needs.
 |
David Yuen, CFA, FRM | |
 |
Michael J. Materasso | |
| Portfolio Management Team | ||


CFA® is a trademark owned by CFA Institute.
6 | Annual Report | franklintempleton.com | ||
FRANKLIN FLEXIBLE ALPHA BOND FUND
The foregoing information reflects our analysis, opinions and portfolio holdings as of April 30, 2017, the end of the reporting period. The way we implement our main investment strategies and the resulting portfolio holdings may change depending on factors such as market and economic conditions. These opinions may not be relied upon as investment advice or an offer for a particular security. The information is not a complete analysis of every aspect of any market, country, industry, security or the Fund. Statements of fact are from sources considered reliable, but the investment manager makes no representation or warranty as to their completeness or accuracy. Although historical performance is no guarantee of future results, these insights may help you understand our investment management philosophy.
franklintempleton.com | Annual Report | 7 | ||
FRANKLIN FLEXIBLE ALPHA BOND FUND
Performance Summary as of April 30, 2017
The performance tables and graphs do not reflect any taxes that a shareholder would pay on Fund dividends, capital gain distributions, if any, or any realized gains on the sale of Fund shares. Total return reflects reinvestment of the Fund’s dividends and capital gain distributions, if any, and any unrealized gains or losses. Your dividend income will vary depending on dividends or interest paid by securities in the Fund’s portfolio, adjusted for operating expenses of each class. Capital gain distributions are net profits realized from the sale of portfolio securities.
Performance as of 4/30/171
Cumulative total return excludes sales charges. Average annual total return include maximum sales charges. Sales charges will vary depending on the size of the investment and the class of share purchased. The maximum is 4.25% and the minimum is 0%. Class A: 4.25% maximum initial sales charge; Advisor Class: no sales charges. For other share classes, visit franklintempleton.com.
Share Class
| Cumulative Total Return2
| Average Annual Total Return3
| ||
A
| ||||
1-Year
| +2.22% | -2.14% | ||
Since Inception (8/3/15)
| +1.87% | -1.40% | ||
Advisor
| ||||
1-Year
| +2.13% | +2.13% | ||
Since Inception (8/3/15) | +1.81% | +1.03% | ||
Distribution Rate4 | 30-Day Standardized Yield5 | |||||||||||||||
| Share Class |
(with waiver) | (without waiver) | ||||||||||||||
A
| 0.94% | 1.66% | -0.47% | |||||||||||||
Advisor
| 1.01% | 1.77% | -0.47% | |||||||||||||
Performance data represent past performance, which does not guarantee future results. Investment return and principal value will fluctuate, and you may have a gain or loss when you sell your shares. Current performance may differ from figures shown. For most recent month-end performance, go to franklintempleton.com or call (800) 342-5236.
See page 10 for Performance Summary footnotes.
8 | Annual Report | franklintempleton.com | ||
FRANKLIN FLEXIBLE ALPHA BOND FUND
PERFORMANCE SUMMARY
Total Return Index Comparison for a Hypothetical $10,000 Investment1
Total return represents the change in value of an investment over the periods shown. It includes any applicable maximum sales charge, Fund expenses, account fees and reinvested distributions. The unmanaged index includes reinvestment of any income or distributions. It differs from the Fund in composition and does not pay management fees or expenses. One cannot invest directly in an index.
Class A (8/3/15–4/30/17)
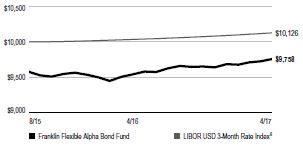
Advisor Class (8/3/15–4/30/17)
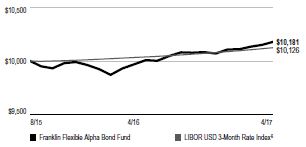
See page 10 for Performance Summary footnotes.
franklintempleton.com | Annual Report | 9 | ||
FRANKLIN FLEXIBLE ALPHA BOND FUND
PERFORMANCE SUMMARY
Distributions (5/1/16–4/30/17)
Share Class
| Net Investment Income
| |||
A
|
|
$0.217253 |
| |
C
| $0.183795 | |||
R
| $0.206562 | |||
R6
| $0.219330 | |||
Advisor
| $0.218505 | |||
Total Annual Operating Expenses7
Share Class
| With Waiver
| Without Waiver
| ||||
A
| 1.12% | 4.13% | ||||
Advisor
| 0.87% | 3.88% | ||||
Each class of shares is available to certain eligible investors and has different annual fees and expenses, as described in the prospectus.
All investments involve risks, including possible loss of principal. Changes in the financial strength of a bond issuer or in a bond’s credit rating may affect its value. Interest rate movements and mortgage prepayments will affect the Fund’s share price and yield. Bond prices generally move in the opposite direction of interest rates. Thus, as the prices of bonds in the Fund adjust to a rise in interest rates, the Fund’s share price may decline. The risks associated with higher yielding, lower rated securities (commonly called junk bonds) include higher risk of default and loss of principal. Derivatives, including currency management strategies, involve costs and can create economic leverage in the portfolio, which may result in significant volatility and cause the Fund to participate in losses (as well as enable gains) in an amount that exceeds the Fund’s initial investment. The Fund may not achieve the anticipated benefits, and may realize losses when a counterparty fails to perform as intended. Investments in foreign securities involve risks such as currency fluctuations, and political and economic uncertainty. The Fund is actively managed but there is no guarantee that the manager’s investment decisions will produce the desired results. The Fund’s prospectus also includes a description of the main investment risks.
1. The Fund has an expense reduction and a fee waiver associated with any investments it makes in a Franklin Templeton money fund and/or other Franklin Templeton fund, contractually guaranteed through 8/31/17. Fund investment results reflect the expense reduction and fee waiver; without these reductions, the results would have been lower.
2. Cumulative total return represents the change in value of an investment over the period indicated.
3. Average annual total return represents the average annual change in value of an investment over the periods indicated. Return for less than one year, if any, has not been annualized.
4. Distribution rate is based on an annualization of the sum of the respective class’s past 30 days’ daily distributions and the maximum offering price (NAV for Advisor Class) per share on 4/30/17.
5. The Fund’s 30-day standardized yield is calculated over a trailing 30-day period using the yield to maturity on bonds and/or the dividends accrued on stocks. It may not equal the Fund’s actual income distribution rate, which reflects the Fund’s past dividends paid to shareholders.
6. Source: Bloomberg LP. The LIBOR USD 3-Month Rate Index tracks the interest rate at which banks offer to lend to one another in the wholesale money markets in London and is used to set the cost of various variable-rate loans.
7. Figures are as stated in the Fund’s current prospectus and may differ from the expense ratios disclosed in the Your Fund’s Expenses and Financial Highlights sections in this report. In periods of market volatility, assets may decline significantly, causing total annual Fund operating expenses to become higher than the figures shown.
See www.franklintempletondatasources.com for additional data provider information.
10 | Annual Report | franklintempleton.com | ||
FRANKLIN FLEXIBLE ALPHA BOND FUND
As a Fund shareholder, you can incur two types of costs: (1) transaction costs, including sales charges (loads) on Fund purchases and redemptions; and (2) ongoing Fund costs, including management fees, distribution and service (12b-1) fees, and other Fund expenses. All mutual funds have ongoing costs, sometimes referred to as operating expenses. The table below shows ongoing costs of investing in the Fund and can help you understand these costs and compare them with those of other mutual funds. The table assumes a $1,000 investment held for the six months indicated.
Actual Fund Expenses
The table below provides information about actual account values and actual expenses in the columns under the heading “Actual.” In these columns the Fund’s actual return, which includes the effect of Fund expenses, is used to calculate the “Ending Account Value” for each class of shares. You can estimate the expenses you paid during the period by following these steps (of course, your account value and expenses will differ from those in this illustration): Divide your account value by $1,000 (if your account had an $8,600 value, then $8,600 ÷ $1,000 = 8.6). Then multiply the result by the number in the row for your class of shares under the headings “Actual” and “Expenses Paid During Period” (if Actual Expenses Paid During Period were $7.50, then 8.6 x $7.50 = $64.50). In this illustration, the actual expenses paid this period are $64.50.
Hypothetical Example for Comparison with Other Funds
Under the heading “Hypothetical” in the table, information is provided about hypothetical account values and hypothetical expenses based on the Fund’s actual expense ratio and an assumed rate of return of 5% per year before expenses, which is not the Fund’s actual return. This information may not be used to estimate the actual ending account balance or expenses you paid for the period, but it can help you compare ongoing costs of investing in the Fund with those of other funds. To do so, compare this 5% hypothetical example for the class of shares you hold with the 5% hypothetical examples that appear in the shareholder reports of other funds.
Please note that expenses shown in the table are meant to highlight ongoing costs and do not reflect any transactional costs. Therefore, information under the heading “Hypothetical” is useful in comparing ongoing costs only, and will not help you compare total costs of owning different funds. In addition, if transactional costs were included, your total costs would have been higher.
Actual (actual return after expenses) | Hypothetical (5% annual return before expenses) | |||||||||||||||||
Share Class | Beginning Account Value 11/1/16 | Ending Account Value 4/30/17 | Expenses Paid During Period 11/1/16–4/30/171,2 | Ending Account Value 4/30/17 | Expenses Paid During 11/1/16–4/30/171,2 | Net Annualized Ratio2 | ||||||||||||
A | $1,000 | $1,010.60 | $3.69 | $1,021.12 | $3.71 | 0.74% | ||||||||||||
C | $1,000 | $1,006.50 | $6.82 | $1,018.00 | $6.85 | 1.37% | ||||||||||||
R | $1,000 | $1,010.30 | $4.49 | $1,020.33 | $4.51 | 0.90% | ||||||||||||
R6 | $1,000 | $1,009.60 | $3.54 | $1,021.27 | $3.56 | 0.71% | ||||||||||||
Advisor | $1,000 | $1,009.60 | $3.59 | $1,021.22 | $3.61 | 0.72% | ||||||||||||
1. Expenses are equal to the annualized expense ratio for the six-month period as indicated above—in the far right column—multiplied by the simple average account value over the period indicated, and then multiplied by 181/365 to reflect the one-half year period.
2. Reflects expenses after fee waivers and expense reimbursements. Does not include acquired fund fees and expenses.
franklintempleton.com | Annual Report | 11 | ||
FRANKLIN STRATEGIC SERIES
Franklin Flexible Alpha Bond Fund
| Year Ended April 30, | ||||||||
2017 |
2016a | |||||||
Class A | ||||||||
Per share operating performance | ||||||||
(for a share outstanding throughout the year) | ||||||||
Net asset value, beginning of year | $ 9.88 | $10.00 | ||||||
Income from investment operationsb: | ||||||||
Net investment income | 0.180 | 0.099 | ||||||
Net realized and unrealized gains (losses) | 0.017 | (0.123 | ) | |||||
Total from investment operations | 0.197 | (0.024 | ) | |||||
Less distributions from net investment income | (0.217 | ) | (0.096 | ) | ||||
Net asset value, end of year | $ 9.86 | $ 9.88 | ||||||
Total returnc | 2.22% | (0.34)% | ||||||
Ratios to average net assetsd | ||||||||
Expenses before waiver and payments by affiliates | 3.17% | 3.47% | ||||||
Expenses net of waiver and payments by affiliatese | 0.67% | 0.84% | ||||||
Net investment income | 1.83% | 1.37% | ||||||
Supplemental data | ||||||||
Net assets, end of year (000’s) | $10,443 | $10,200 | ||||||
Portfolio turnover rate | 90.37% | 40.12% | ||||||
Portfolio turnover rate excluding mortgage dollar rollsf | 57.79% | 30.05% | ||||||
aFor the period August 3, 2015 (commencement of operations) to April 30, 2016.
bThe amount shown for a share outstanding throughout the period may not correlate with the Statement of Operations for the period due to the timing of sales and repurchases of the Fund’s shares in relation to income earned and/or fluctuating fair value of the investments of the Fund.
cTotal return does not reflect sales commissions or contingent deferred sales charges, if applicable, and is not annualized for periods less than one year.
dRatios are annualized for periods less than one year, except for non-recurring expenses, if any.
eBenefit of expense reduction rounds to less than 0.01%.
fSee Note 1(d) regarding mortgage dollar rolls.
12 | Annual Report | | The accompanying notes are an integral part of these financial statements. | franklintempleton.com | |||
FRANKLIN STRATEGIC SERIES
FINANCIAL HIGHLIGHTS
Franklin Flexible Alpha Bond Fund (continued)
| Year Ended April 30, | ||||||||
2017 |
2016a | |||||||
Class C | ||||||||
Per share operating performance | ||||||||
(for a share outstanding throughout the year) | ||||||||
Net asset value, beginning of year | $ 9.86 | $ 10.00 | ||||||
Income from investment operationsb: | ||||||||
Net investment income | 0.130 | 0.072 | ||||||
Net realized and unrealized gains (losses) | (0.006 | ) | (0.131 | ) | ||||
Total from investment operations | 0.124 | (0.059 | ) | |||||
Less distributions from net investment income | (0.184 | ) | (0.081 | ) | ||||
Net asset value, end of year | $ 9.80 | $ 9.86 | ||||||
Total returnc | 1.47% | (0.69)% | ||||||
Ratios to average net assetsd | ||||||||
Expenses before waiver and payments by affiliates | 3.88% | 3.98% | ||||||
Expenses net of waiver and payments by affiliatese | 1.38% | 1.34% | ||||||
Net investment income | 1.12% | 0.87% | ||||||
Supplemental data | ||||||||
Net assets, end of year (000’s) | $245 | $204 | ||||||
Portfolio turnover rate | 90.37% | 40.12% | ||||||
Portfolio turnover rate excluding mortgage dollar rollsf | 57.79% | 30.05% | ||||||
aFor the period August 3, 2015 (commencement of operations) to April 30, 2016.
bThe amount shown for a share outstanding throughout the period may not correlate with the Statement of Operations for the period due to the timing of sales and repurchases of the Fund’s shares in relation to income earned and/or fluctuating fair value of the investments of the Fund.
cTotal return does not reflect sales commissions or contingent deferred sales charges, if applicable, and is not annualized for periods less than one year.
dRatios are annualized for periods less than one year, except for non-recurring expenses, if any.
eBenefit of expense reduction rounds to less than 0.01%.
fSee Note 1(d) regarding mortgage dollar rolls.
franklintempleton.com | The accompanying notes are an integral part of these financial statements. | | Annual Report | 13 | |||
FRANKLIN STRATEGIC SERIES
FINANCIAL HIGHLIGHTS
Franklin Flexible Alpha Bond Fund (continued)
| Year Ended April 30, | ||||||||
2017 |
2016a | |||||||
Class R | ||||||||
Per share operating performance | ||||||||
(for a share outstanding throughout the year) | ||||||||
Net asset value, beginning of year | $9.86 | $10.00 | ||||||
Income from investment operationsb: | ||||||||
Net investment income | 0.112 | 0.072 | ||||||
Net realized and unrealized gains (losses) | 0.095 | (0.127 | ) | |||||
Total from investment operations | 0.207 | (0.055 | ) | |||||
Less distributions from net investment income | (0.207 | ) | (0.085 | ) | ||||
Net asset value, end of year | $9.86 | $9.86 | ||||||
Total returnc | 2.21% | (0.65)% | ||||||
Ratios to average net assetsd | ||||||||
Expenses before waiver and payments by affiliates | 3.36% | 3.84% | ||||||
Expenses net of waiver and payments by affiliatese | 0.86% | 1.22% | ||||||
Net investment income | 1.64% | 0.99% | ||||||
Supplemental data | ||||||||
Net assets, end of year (000’s) | $60 | $10 | ||||||
Portfolio turnover rate | 90.37% | 40.12% | ||||||
Portfolio turnover rate excluding mortgage dollar rollsf | 57.79% | 30.05% | ||||||
aFor the period August 3, 2015 (commencement of operations) to April 30, 2016.
bThe amount shown for a share outstanding throughout the period may not correlate with the Statement of Operations for the period due to the timing of sales and repurchases of the Fund’s shares in relation to income earned and/or fluctuating fair value of the investments of the Fund.
cTotal return is not annualized for periods less than one year.
dRatios are annualized for periods less than one year, except for non-recurring expenses, if any.
eBenefit of expense reduction rounds to less than 0.01%.
fSee Note 1(d) regarding mortgage dollar rolls.
14 | Annual Report | | The accompanying notes are an integral part of these financial statements. | franklintempleton.com | |||
FRANKLIN STRATEGIC SERIES
FINANCIAL HIGHLIGHTS
Franklin Flexible Alpha Bond Fund (continued)
| Year Ended April 30, | ||||||||
2017 |
2016a | |||||||
Class R6 | ||||||||
Per share operating performance | ||||||||
(for a share outstanding throughout the year) | ||||||||
Net asset value, beginning of year | $ 9.88 | $10.00 | ||||||
Income from investment operationsb: | ||||||||
Net investment income | 0.177 | 0.108 | ||||||
Net realized and unrealized gains (losses) | 0.022 | (0.124 | ) | |||||
Total from investment operations | 0.199 | (0.016 | ) | |||||
Less distributions from net investment income | (0.219 | ) | (0.104 | ) | ||||
Net asset value, end of year | $ 9.86 | $ 9.88 | ||||||
Total returnc | 2.03% | (0.15)% | ||||||
Ratios to average net assetsd | ||||||||
Expenses before waiver and payments by affiliates | 5.23% | 3.72% | ||||||
Expenses net of waiver and payments by affiliatese | 0.71% | 0.71% | ||||||
Net investment income | 1.79% | 1.50% | ||||||
Supplemental data | ||||||||
Net assets, end of year (000’s) | $10 | $10 | ||||||
Portfolio turnover rate | 90.37% | 40.12% | ||||||
Portfolio turnover rate excluding mortgage dollar rollsf | 57.79% | 30.05% | ||||||
aFor the period August 3, 2015 (commencement of operations) to April 30, 2016.
bThe amount shown for a share outstanding throughout the period may not correlate with the Statement of Operations for the period due to the timing of sales and repurchases of the Fund’s shares in relation to income earned and/or fluctuating fair value of the investments of the Fund.
cTotal return is not annualized for periods less than one year.
dRatios are annualized for periods less than one year, except for non-recurring expenses, if any.
eBenefit of expense reduction rounds to less than 0.01%.
fSee Note 1(d) regarding mortgage dollar rolls.
franklintempleton.com | The accompanying notes are an integral part of these financial statements. | | Annual Report | 15 | |||
FRANKLIN STRATEGIC SERIES
FINANCIAL HIGHLIGHTS
Franklin Flexible Alpha Bond Fund (continued)
| Year Ended April 30, | ||||||||
2017 |
2016a | |||||||
Advisor Class | ||||||||
Per share operating performance | ||||||||
(for a share outstanding throughout the year) | ||||||||
Net asset value, beginning of year | $9.88 | $10.00 | ||||||
Income from investment operationsb: | ||||||||
Net investment income | 0.166 | 0.107 | ||||||
Net realized and unrealized gains (losses) | 0.023 | (0.129 | ) | |||||
Total from investment operations | 0.189 | (0.022 | ) | |||||
Less distributions from net investment income | (0.219 | ) | (0.098 | ) | ||||
Net asset value, end of year | $9.85 | $9.88 | ||||||
Total returnc | 2.13% | (0.31)% | ||||||
Ratios to average net assetsd | ||||||||
Expenses before waiver and payments by affiliates | 3.22% | 3.34% | ||||||
Expenses net of waiver and payments by affiliatese | 0.72% | 0.71% | ||||||
Net investment income | 1.78% | 1.50% | ||||||
Supplemental data | ||||||||
Net assets, end of year (000’s) | $232 | $344 | ||||||
Portfolio turnover rate | 90.37% | 40.12% | ||||||
Portfolio turnover rate excluding mortgage dollar rollsf | 57.79% | 30.05% | ||||||
aFor the period August 3, 2015 (commencement of operations) to April 30, 2016.
bThe amount shown for a share outstanding throughout the period may not correlate with the Statement of Operations for the period due to the timing of sales and repurchases of the Fund’s shares in relation to income earned and/or fluctuating fair value of the investments of the Fund.
cTotal return is not annualized for periods less than one year.
dRatios are annualized for periods less than one year, except for non-recurring expenses, if any.
eBenefit of expense reduction rounds to less than 0.01%.
fSee Note 1(d) regarding mortgage dollar rolls.
16 | Annual Report | | The accompanying notes are an integral part of these financial statements. | franklintempleton.com | |||
FRANKLIN STRATEGIC SERIES
Statement of Investments, April 30, 2017
Franklin Flexible Alpha Bond Fund
| Country | Shares | Value | ||||||||||||||
| ||||||||||||||||
Management Investment Companies (Cost $195,215) 1.8% |
| |||||||||||||||
Diversified Financials 1.8% |
| |||||||||||||||
PowerShares Senior Loan Portfolio ETF | United States | 8,265 | $ | 192,409 | ||||||||||||
|
| |||||||||||||||
| Principal | ||||||||||||||||
| Amount* | ||||||||||||||||
Corporate Bonds 38.4% |
| |||||||||||||||
Banks 11.8% |
| |||||||||||||||
a Banco Popular Espanol SA, secured note, Reg S, 1.00%, 3/03/22 | Spain | 100,000 | EUR | 110,822 | ||||||||||||
Bank of America Corp., senior bond, 5.50%, 12/04/19 | United States | 75,000 | GBP | 108,328 | ||||||||||||
Bank of Nova Scotia, secured note, 1.875%, 4/26/21 | Canada | 100,000 | 98,726 | |||||||||||||
Citigroup Inc., senior note, 2.65%, 10/26/20 | United States | 50,000 | 50,469 | |||||||||||||
HSBC USA Inc., senior note, 2.00%, 8/07/18 | United States | 100,000 | 100,280 | |||||||||||||
Intesa Sanpaolo SpA, senior note, 3.875%, 1/15/19 | Italy | 200,000 | 204,613 | |||||||||||||
JPMorgan Chase & Co., senior note, 2.25%, 1/23/20 | United States | 100,000 | 100,457 | |||||||||||||
PHH Corp., senior note, 7.375%, 9/01/19 | United States | 200,000 | 217,500 | |||||||||||||
Royal Bank of Canada, secured note, 2.10%, 10/14/20 | Canada | 100,000 | 100,026 | |||||||||||||
b The Toronto-Dominion Bank, secured note, 144A, 2.25%, 3/15/21 | Canada | 200,000 | 200,366 | |||||||||||||
|
| |||||||||||||||
|
1,291,587 |
| ||||||||||||||
|
| |||||||||||||||
Consumer Durables & Apparel 3.4% |
| |||||||||||||||
CalAtlantic Group Inc., senior note, 8.375%, 5/15/18 | United States | 250,000 | 265,625 | |||||||||||||
KB Home, senior note, 8.00%, 3/15/20 | United States | 100,000 | 113,125 | |||||||||||||
|
| |||||||||||||||
|
378,750 |
| ||||||||||||||
|
| |||||||||||||||
Diversified Financials 6.8% |
| |||||||||||||||
b AIG Global Funding, |
| |||||||||||||||
secured note, 144A, 1.90%, 10/06/21 | United States | 50,000 | 48,570 | |||||||||||||
secured note, 144A, 2.70%, 12/15/21 | United States | 100,000 | 99,859 | |||||||||||||
American Airlines Pass Through Trust, first lien, 2016-2, AA, 3.20%, 6/15/28 | United States | 50,000 | 49,063 | |||||||||||||
b Athene Global Funding, secured note, 144A, 2.75%, 4/20/20 | United States | 50,000 | 50,066 | |||||||||||||
Capital One Financial Corp., senior note, 3.20%, 2/05/25 | United States | 100,000 | 97,181 | |||||||||||||
c Deutsche Bank AG, senior note, FRN, 2.362%, 8/20/20 | Germany | 100,000 | 100,361 | |||||||||||||
c The Goldman Sachs Group Inc., senior note, FRN, 2.331%, 9/15/20 | United States | 100,000 | 101,579 | |||||||||||||
Morgan Stanley, senior note, 2.65%, 1/27/20 | United States | 100,000 | 101,387 | |||||||||||||
Springleaf Finance Corp., senior note, 6.00%, 6/01/20 | United States | 100,000 | 102,750 | |||||||||||||
|
| |||||||||||||||
|
750,816 |
| ||||||||||||||
|
| |||||||||||||||
Energy 1.0% |
| |||||||||||||||
Anadarko Petroleum Corp., senior bond, 3.45%, 7/15/24 | United States | 50,000 | 49,436 | |||||||||||||
Sabine Pass Liquefaction LLC, first lien, 5.625%, 4/15/23 | United States | 50,000 | 55,209 | |||||||||||||
|
| |||||||||||||||
|
104,645 |
| ||||||||||||||
|
| |||||||||||||||
Food & Staples Retailing 1.4% |
| |||||||||||||||
The Kroger Co., senior note, 3.40%, 4/15/22 | United States | 50,000 | 51,423 | |||||||||||||
Walgreen Co., senior bond, 3.10%, 9/15/22 | United States | 100,000 | 101,733 | |||||||||||||
|
| |||||||||||||||
|
153,156 |
| ||||||||||||||
|
| |||||||||||||||
Food, Beverage & Tobacco 0.9% |
| |||||||||||||||
Altria Group Inc., senior bond, 4.25%, 8/09/42 | United States | 100,000 | 100,309 | |||||||||||||
|
| |||||||||||||||
Health Care Equipment & Services 2.3% |
| |||||||||||||||
Stryker Corp., senior note, 2.00%, 3/08/19 | United States | 50,000 | 50,191 | |||||||||||||
Tenet Healthcare Corp., senior note, 5.50%, 3/01/19 | United States | 150,000 | 152,250 | |||||||||||||
b Universal Health Services Inc., first lien, 144A, 3.75%, 8/01/19 | United States | 50,000 | 50,938 | |||||||||||||
|
| |||||||||||||||
|
253,379 |
| ||||||||||||||
|
| |||||||||||||||
franklintempleton.com | Annual Report | 17 | ||
FRANKLIN STRATEGIC SERIES
STATEMENT OF INVESTMENTS
Franklin Flexible Alpha Bond Fund (continued)
| Country | Principal Amount* | Value | ||||||||||||||
| ||||||||||||||||
Corporate Bonds (continued) |
| |||||||||||||||
Household & Personal Products 0.5% |
| |||||||||||||||
Avon Products Inc., senior note, 6.50%, 3/01/19 | United States | 50,000 | $ | 52,284 | ||||||||||||
|
| |||||||||||||||
Insurance 1.6% |
| |||||||||||||||
b Jackson National Life Global Funding, | ||||||||||||||||
secured note, 144A, 2.25%, 4/29/21 | United States | 50,000 | 49,524 | |||||||||||||
secured note, 144A, 2.10%, 10/25/21 | United States | 25,000 | 24,527 | |||||||||||||
b Principal Life Global Funding II, senior secured note, 144A, 2.625%, 11/19/20 | United States | 100,000 | 101,107 | |||||||||||||
|
| |||||||||||||||
|
175,158 |
| ||||||||||||||
|
| |||||||||||||||
Materials 1.4% |
| |||||||||||||||
EI du Pont de Nemours & Co., senior note, 2.20%, 5/01/20 | United States | 50,000 | 50,099 | |||||||||||||
Reynolds Group Holdings Inc., senior bond, 8.125%, 6/15/17 | United States | 100,000 | 101,000 | |||||||||||||
|
| |||||||||||||||
|
151,099 |
| ||||||||||||||
|
| |||||||||||||||
Media 0.9% |
| |||||||||||||||
Viacom Inc., senior bond, 3.125%, 6/15/22 | United States | 100,000 | 100,064 | |||||||||||||
|
| |||||||||||||||
Pharmaceuticals, Biotechnology & Life Sciences 0.9% |
| |||||||||||||||
Baxalta Inc., senior note, 3.60%, 6/23/22 | United States | 100,000 | 103,007 | |||||||||||||
|
| |||||||||||||||
Technology Hardware & Equipment 2.3% |
| |||||||||||||||
Cisco Systems Inc., senior note, 2.20%, 9/20/23 | United States | 100,000 | 97,969 | |||||||||||||
| b Diamond 1 Finance Corp./Diamond 2 Finance Corp., senior secured note, first lien, 144A, 3.48%, 6/01/19 | United States | 50,000 | 51,170 | |||||||||||||
b Sanmina Corp., senior note, first lien, 144A, 4.375%, 6/01/19 | United States | 100,000 | 102,750 | |||||||||||||
|
| |||||||||||||||
|
251,889 |
| ||||||||||||||
|
| |||||||||||||||
Telecommunication Services 0.9% |
| |||||||||||||||
AT&T Inc., senior note, 3.95%, 1/15/25 | United States | 100,000 | 101,426 | |||||||||||||
|
| |||||||||||||||
Transportation 1.4% |
| |||||||||||||||
FedEx Corp., senior bond, 3.20%, 2/01/25 | United States | 50,000 | 50,539 | |||||||||||||
XPO CNW Inc., senior bond, 7.25%, 1/15/18 | United States | 100,000 | 103,500 | |||||||||||||
|
| |||||||||||||||
|
154,039 |
| ||||||||||||||
|
| |||||||||||||||
Utilities 0.9% |
| |||||||||||||||
Dominion Resources Inc., senior bond, 3.90%, 10/01/25 | United States | 50,000 | 51,567 | |||||||||||||
The Southern Co., senior bond, 3.25%, 7/01/26 | United States | 50,000 | 48,760 | |||||||||||||
|
| |||||||||||||||
|
100,327 |
| ||||||||||||||
|
| |||||||||||||||
Total Corporate Bonds (Cost $4,160,327) |
|
4,221,935 |
| |||||||||||||
|
| |||||||||||||||
Foreign Government and Agency Securities 3.1% | ||||||||||||||||
b The Export-Import Bank of China, senior note, 144A, 2.50%, 7/31/19 | China | 200,000 | 202,250 | |||||||||||||
Government of Indonesia, senior bond, FR70, 8.375%, 3/15/24 | Indonesia | 263,000,000 | IDR | 21,214 | ||||||||||||
a United Kingdom Treasury Bond, Reg S, 2.00%, 9/07/25 | United Kingdom | 85,000 | GBP | 119,974 | ||||||||||||
|
| |||||||||||||||
Total Foreign Government and Agency Securities | 343,438 | |||||||||||||||
|
| |||||||||||||||
U.S. Government and Agency Securities (Cost $571,472) 5.3% | ||||||||||||||||
d U.S. Treasury Note, Index Linked, 0.125%, 1/15/23 | United States | 583,560 | 585,076 | |||||||||||||
|
| |||||||||||||||
18 | Annual Report | franklintempleton.com | ||
FRANKLIN STRATEGIC SERIES
STATEMENT OF INVESTMENTS
Franklin Flexible Alpha Bond Fund (continued)
| Country | Principal Amount* | Value | ||||||||||||||
| ||||||||||||||||
Asset-Backed Securities and Commercial Mortgage-Backed Securities 33.0% | ||||||||||||||||
Banks 0.6% |
| |||||||||||||||
c Citigroup Commercial Mortgage Trust, 2007-C6, AM, FRN, 5.701%, 12/10/49 | United States | 20,000 | $ | 20,263 | ||||||||||||
c Impac Secured Assets CMN Owner Trust, 2004-4, M1, FRN, 1.756%, 2/25/35 | United States | 50,000 | 49,300 | |||||||||||||
|
| |||||||||||||||
|
69,563 |
| ||||||||||||||
|
| |||||||||||||||
Diversified Financials 28.4% |
| |||||||||||||||
cAmerican Express Credit Account Secured Note Trust, 2012-4, B, FRN, 1.544%, 5/15/20 | United States | 100,000 | 100,141 | |||||||||||||
Banc of America Commercial Mortgage Trust, 2015-UBS7, A4, 3.705%, 9/15/48 | United States | 100,000 | 105,065 | |||||||||||||
b,c BlueMountain CLO Ltd., 2013-3A, A, 144A, FRN, 2.439%, 10/29/25 | United States | 6,437 | 6,440 | |||||||||||||
c Capital One Multi-Asset Execution Trust, 2004-B3, B3, FRN, 1.724%, 1/18/22 | United States | 150,000 | 150,755 | |||||||||||||
b,c Carlyle Global Market Strategies CLO Ltd., 2014-3A, A1AR, 144A, FRN, 2.32%, 7/27/26 | Cayman Islands | 150,000 | 150,225 | |||||||||||||
b,c Cent CLO, 2013-17A, A1, 144A, FRN, 2.339%, 1/30/25 | United States | 40,000 | 40,079 | |||||||||||||
c COBALT CMBS Commercial Mortgage Trust, 2007-C2, AMFX, FRN, 5.526%, 4/15/47 | United States | 2,551 | 2,571 | |||||||||||||
b,c Colony American Homes, 2015-1A, A, 144A, FRN, 2.194%, 7/17/32 | United States | 108,457 | 108,780 | |||||||||||||
c,e COMM Mortgage Trust, 2014-UBS4, XA, IO, FRN, 1.398%, 8/10/47 | United States | 340,047 | 20,371 | |||||||||||||
c Conseco Finance Securitizations Corp., 2002-2, M1, FRN, 7.424%, 3/01/33 | United States | 86,691 | 96,009 | |||||||||||||
b Core Industrial Trust, 2015-CALW, A, 144A, 3.04%, 2/10/34 | United States | 30,000 | 30,834 | |||||||||||||
b,c Dryden 31 Senior Loan Fund, 2014-31A, AR, 144A, FRN, 2.238%, 4/18/26 | Cayman Islands | 150,000 | 149,820 | |||||||||||||
b,c Dryden 34 Senior Loan Fund, 14-34A, AR, 144A, FRN, 2.318%, 10/15/26 | Cayman Islands | 90,000 | 90,032 | |||||||||||||
b,c Eaton Vance CDO Ltd., 2014-1A, AR, 144A, FRN, 2.358%, 7/15/26 | United States | 24,000 | 24,011 | |||||||||||||
b,c Eleven Madison Trust Mortgage Trust, 2015-11MD, A, 144A, FRN, 3.555%, 9/10/35 | United States | 100,000 | 104,107 | |||||||||||||
c FHLMC Structured Agency Credit Risk Debt Notes, | ||||||||||||||||
2015-DNA1, M2, FRN, 2.841%, 10/25/27 | United States | 250,000 | 256,069 | |||||||||||||
2016-DNA1, M1, FRN, 2.441%, 7/25/28 | United States | 128,871 | 129,439 | |||||||||||||
2016-HQA3, M1, FRN, 1.791%, 3/25/29 | United States | 239,316 | 240,299 | |||||||||||||
c FNMA Connecticut Avenue Securities, | ||||||||||||||||
2013-C01, M1, FRN, 2.991%, 10/25/23 | United States | 42,298 | 42,801 | |||||||||||||
2014-C02, 2M1, FRN, 1.941%, 5/25/24 | United States | 21,485 | 21,531 | |||||||||||||
2014-C02, 2M2, FRN, 3.591%, 5/25/24 | United States | 40,000 | 41,615 | |||||||||||||
2014-C03, 1M2, FRN, 3.991%, 7/25/24 | United States | 50,000 | 52,637 | |||||||||||||
2014-C04, 1M1, FRN, 5.891%, 11/25/24 | United States | 60,000 | 68,499 | |||||||||||||
2014-C04, 2M2, FRN, 5.991%, 11/25/24 | United States | 46,304 | 52,000 | |||||||||||||
2015-C01, 1M2, FRN, 5.291%, 2/25/25 | United States | 44,540 | 48,666 | |||||||||||||
2015-C01, 2M2, FRN, 5.541%, 2/25/25 | United States | 62,401 | 67,755 | |||||||||||||
2015-C02, 1M2, FRN, 4.991%, 5/25/25 | United States | 9,216 | 9,998 | |||||||||||||
2015-C02, 2M2, FRN, 4.991%, 5/25/25 | United States | 22,478 | 24,125 | |||||||||||||
2015-C03, 1M2, FRN, 5.991%, 7/25/25 | United States | 49,730 | 55,219 | |||||||||||||
2015-C03, 2M2, FRN, 5.991%, 7/25/25 | United States | 50,000 | 55,718 | |||||||||||||
2017-C01, 1B1, FRN, 6.741%, 7/25/29 | United States | 33,000 | 35,283 | |||||||||||||
b,c Galaxy XV CLO Ltd., 2013-15A, A, 144A, FRN, 2.408%, 4/15/25 | United States | 99,000 | 99,195 | |||||||||||||
b,c Invitation Homes Trust, | ||||||||||||||||
2015-SFR1, A, 144A, FRN, 2.444%, 3/17/32 | United States | 95,754 | 96,026 | |||||||||||||
2015-SFR2, A, 144A, FRN, 2.344%, 6/17/32 | United States | 97,732 | 98,047 | |||||||||||||
franklintempleton.com | Annual Report | 19 | ||
FRANKLIN STRATEGIC SERIES
STATEMENT OF INVESTMENTS
Franklin Flexible Alpha Bond Fund (continued)
| Country | Principal Amount* | Value | ||||||||||||||
| ||||||||||||||||
Asset-Backed Securities and Commercial Mortgage-Backed Securities (continued) | ||||||||||||||||
Diversified Financials (continued) | ||||||||||||||||
c IXIS Real Estate Capital Trust, 2005-HE4, A3, FRN, 1.671%, 2/25/36 | United States | 124 | $ | 124 | ||||||||||||
c,e JPMDB Commercial Mortgage Securities Trust, 2017-C5, XA, IO, FRN, 1.184%, | United States | 199,927 | 15,097 | |||||||||||||
b,c Madison Park Funding XVIII Ltd., 2015-18A, C, 144A, FRN, 4.156%, 10/21/26 | United States | 100,000 | 100,967 | |||||||||||||
b,c Octagon Investment Partners XXIII Ltd., | ||||||||||||||||
2015-1A, A1, 144A, FRN, 2.578%, 7/15/27 | United States | 18,490 | 18,545 | |||||||||||||
2015-1A, A2, 144A, FRN, 2.578%, 7/15/27 | United States | 17,554 | 17,607 | |||||||||||||
b,c PPM Grayhawk CLO Ltd., 07-1A, B, 144A, FRN, 1.858%, 4/18/21 | United States | 43,216 | 43,248 | |||||||||||||
b,c Resource Capital Corp. Ltd., 2015-CRE4, A, 144A, FRN, 2.394%, 8/15/32 | United States | 40,697 | 40,758 | |||||||||||||
c Thornburg Mortgage Securities Trust, 2005-1, A3, FRN, 3.073%, 4/25/45 | United States | 36,813 | 36,838 | |||||||||||||
b,c Towd Point Mortgage Trust, | ||||||||||||||||
2016-3, A1, 144A, FRN, 2.25%, 4/25/56 | United States | 80,574 | 80,247 | |||||||||||||
2016-5, A1, 144A, FRN, 2.50%, 10/25/56 | United States | 93,428 | 93,408 | |||||||||||||
|
| |||||||||||||||
|
3,121,001 |
| ||||||||||||||
|
| |||||||||||||||
Real Estate 4.0% |
| |||||||||||||||
b BAMLL Commercial Mortgage Securities Trust, 2012-PARK, A, 144A, 2.959%, | United States | 100,000 | 101,872 | |||||||||||||
b Colony MFM Trust, 2014-1, A, 144A, 2.543%, 4/20/50 | United States | 73,720 | 73,440 | |||||||||||||
b,c SWAY Residential Trust, 2014-1, A, 144A, FRN, 2.294%, 1/17/32 | United States | 68,728 | 69,096 | |||||||||||||
b,c Tricon American Homes Trust, | ||||||||||||||||
2015-SFR1, A, 144A, FRN, 2.244%, 5/17/32 | United States | 91,661 | 91,894 | |||||||||||||
2015-SFR1, C, 144A, FRN, 2.894%, 5/17/32 | United States | 100,000 | 99,852 | |||||||||||||
|
| |||||||||||||||
|
436,154 |
| ||||||||||||||
|
| |||||||||||||||
Total Asset-Backed Securities and Commercial Mortgage- Backed Securities (Cost $3,588,053) | 3,626,718 | |||||||||||||||
|
| |||||||||||||||
Municipal Bonds 5.4% | ||||||||||||||||
California Statewide CDA, PCR, Southern California Edison Co., Mandatory Put 12/01/23, Refunding, Series D, 2.625%, 11/01/33 | United States | 5,000 | 5,136 | |||||||||||||
Cincinnati GO, Various Purpose, Improvement and Refunding, Series A, 5.00%, 12/01/25 | United States | 100,000 | 120,453 | |||||||||||||
Citizens Property Insurance Corp. Revenue, Coastal Account, senior secured, Series A1, 5.00%, 6/01/22 | United States | 125,000 | 143,568 | |||||||||||||
Clark County School District GO, Refunding, Series D, 5.00%, 6/15/23 | United States | 25,000 | 29,471 | |||||||||||||
Colorado State Board of Governors University Enterprise System Revenue, Green Bonds, Series E-2, 5.00%, 3/01/25 | United States | 100,000 | 120,110 | |||||||||||||
Denver City and County Airport System Revenue, Refunding, Series A, 5.00%, 11/15/25 | United States | 5,000 | 6,049 | |||||||||||||
Minnesota State GO, Refunding, Series D, 5.00%, 8/01/25 | United States | 5,000 | 6,139 | |||||||||||||
New York State Dormitory Authority State Personal Income Tax Revenue, General Purpose, Refunding, Series A, 5.00%, 2/15/25 | United States | 15,000 | 17,893 | |||||||||||||
Providence St. Joseph Health Obligated Group, 2.746%, 10/01/26 | United States | 15,000 | 14,371 | |||||||||||||
Teays Valley Local School District GO, Pickaway Fairfield and Franklin Counties, Refunding, 4.00%, 12/01/26 | United States | 100,000 | 110,707 | |||||||||||||
Texas State GO, Transportation Commission-Highway Improvement, Series A, 5.00%, 4/01/21 | United States | 5,000 | 5,701 | |||||||||||||
University of Texas Revenue, Series J, 5.00%, 8/15/25 | United States | 15,000 | 18,342 | |||||||||||||
|
| |||||||||||||||
Total Municipal Bonds (Cost $580,745) | 597,940 | |||||||||||||||
|
| |||||||||||||||
20 | Annual Report | franklintempleton.com | ||
FRANKLIN STRATEGIC SERIES
STATEMENT OF INVESTMENTS
Franklin Flexible Alpha Bond Fund (continued)
| Exchange | Number of Contracts | Value | ||||||||||||||
| ||||||||||||||||
Options Purchased 0.1% | ||||||||||||||||
Calls - Exchange-Traded | ||||||||||||||||
Options on Interest Rate Futures 0.0%† | ||||||||||||||||
Euro-Bund, May Strike Price 161 EUR, Expires 5/26/17 | EUX | 1 | $ | 1,514 | ||||||||||||
|
| |||||||||||||||
| Counterparty | Notional Amount* | |||||||||||||||
Calls - Over-the-Counter | ||||||||||||||||
Currency Options 0.0%† | ||||||||||||||||
USD/JPY, June Strike Price 113 JPY, Expires 6/26/17 | BOFA | 27,000 | 207 | |||||||||||||
|
| |||||||||||||||
Puts - Over-the-Counter | ||||||||||||||||
Credit Default Swaptions 0.1% | ||||||||||||||||
Buy protection on CDX.NA.HY.28, Premium Rate 5.00%, Strike Price $104, Expires | CITI | 300,000 | 3,393 | |||||||||||||
Buy protection on CDX.NA.IG.28, Premium Rate 1.00%, Strike Price $80, Expires | JPHQ | 400,000 | 908 | |||||||||||||
|
| |||||||||||||||
|
4,301 |
| ||||||||||||||
|
| |||||||||||||||
Interest Rate Swaptions 0.0%† | ||||||||||||||||
Receive float 3 month USD LIBOR, pay fixed 2.26%, Expires 7/21/17 | HSBK | 400,000 | 823 | |||||||||||||
Receive float 3 month USD LIBOR, pay fixed 2.30%, Expires 5/08/17 | CITI | 300,000 | 1 | |||||||||||||
Receive float 3 month USD LIBOR, pay fixed 2.45%, Expires 5/02/17 | JPHQ | 300,000 | 4 | |||||||||||||
Receive float 3 month USD LIBOR, pay fixed 2.51%, Expires 7/21/17 | HSBK | 200,000 | 1,086 | |||||||||||||
Receive float 3 month USD LIBOR, pay fixed 2.65%, Expires 5/08/17 | CITI | 200,000 | 1 | |||||||||||||
|
| |||||||||||||||
|
1,915 |
| ||||||||||||||
|
| |||||||||||||||
Total Options Purchased (Cost $17,721) |
|
7,937 |
| |||||||||||||
|
| |||||||||||||||
Total Investments before Short Term Investments (Cost $9,459,377) | 9,575,453 | |||||||||||||||
|
| |||||||||||||||
| Country | Shares | |||||||||||||||
Short Term Investments (Cost $1,305,181) 11.9% | ||||||||||||||||
Money Market Funds 11.9% | ||||||||||||||||
f,g Institutional Fiduciary Trust Money Market Portfolio, 0.37% | United States | 1,305,181 | 1,305,181 | |||||||||||||
|
| |||||||||||||||
Total Investments (Cost $10,764,558) 99.0% | 10,880,634 | |||||||||||||||
Options Written 0.0% | — | |||||||||||||||
Other Assets, less Liabilities 1.0% | 109,535 | |||||||||||||||
|
| |||||||||||||||
Net Assets 100.0% | $ | 10,990,169 | ||||||||||||||
|
| |||||||||||||||
| Counterparty | Notional Amount* | |||||||||||||||
h Options Written (Premiums received $957) 0.0% | ||||||||||||||||
Puts - Over-the-Counter | ||||||||||||||||
Interest Rate Swaptions 0.0% | ||||||||||||||||
Receive float 3 month USD LIBOR, pay fixed 2.45%, Expires 5/02/17 | JPHQ | 300,000 | — | |||||||||||||
|
| |||||||||||||||
franklintempleton.com | Annual Report | 21 | ||
FRANKLIN STRATEGIC SERIES
STATEMENT OF INVESTMENTS
Franklin Flexible Alpha Bond Fund (continued)
†Rounds to less than 0.1% of net assets.
*The principal/notional amount is stated in U.S. dollars unless otherwise indicated.
aSecurity was purchased pursuant to Regulation S under the Securities Act of 1933, which exempts from registration securities offered and sold outside of the United States. Such a security cannot be sold in the United States without either an effective registration statement filed pursuant to the Securities Act of 1933, or pursuant to an exemption from registration. These securities have been deemed liquid under guidelines approved by the Trust’s Board of Trustees. At April 30, 2017, the aggregate value of these securities was $230,796, representing 2.1% of net assets.
bSecurity was purchased pursuant to Rule 144A under the Securities Act of 1933 and may be sold in transactions exempt from registration only to qualified institutional buyers or in a public offering registered under the Securities Act of 1933. These securities have been deemed liquid under guidelines approved by the Trust’s Board of Trustees. At April 30, 2017, the aggregate value of these securities was $2,809,657, representing 25.6% of net assets.
cThe coupon rate shown represents the rate at period end.
dPrincipal amount of security is adjusted for inflation. See Note 1(f).
eInvestment in an interest-only security entities holders to receive only the interest payments on the underlying mortgages. The principal amount shown is the notional amount of the underlying mortgages. The rate represents the coupon rate.
fSee Note 3(f) regarding investments in affiliated management investment companies.
gThe rate shown is the annualized seven-day yield at period end.
hSee Note 1(c) regarding written options.
22 | Annual Report | franklintempleton.com | ||
FRANKLIN STRATEGIC SERIES
STATEMENT OF INVESTMENTS
Franklin Flexible Alpha Bond Fund (continued)
At April 30, 2017, the Fund had the following futures contracts outstanding. See Note 1(c).
Futures Contracts
| Description | Type | Number of Contracts | Notional Value | Expiration Date | Unrealized Appreciation | Unrealized Depreciation | ||||||||||||||||||
| ||||||||||||||||||||||||
Interest Rate Contracts | ||||||||||||||||||||||||
Australian 10 Yr. Bond | Long | 1 | $ | 97,127 | 6/15/17 | $2,857 | $ — | |||||||||||||||||
Canadian 10 Yr. Bond | Long | 1 | 102,250 | 6/21/17 | 2,291 | — | ||||||||||||||||||
Long Gilt | Long | 1 | 166,148 | 6/28/17 | 2,848 | — | ||||||||||||||||||
U.S. Treasury 2 Yr. Note | Short | 11 | 2,382,703 | 6/30/17 | — | (715 | ) | |||||||||||||||||
U.S. Treasury 5 Yr. Note | Short | 17 | 2,012,906 | 6/30/17 | — | (5,622 | ) | |||||||||||||||||
U.S. Treasury 10 Yr. Note | Short | 8 | 1,005,750 | 6/21/17 | — | (5,646 | ) | |||||||||||||||||
U.S. Treasury 10 Yr. Ultra | Short | 1 | 135,453 | 6/21/17 | — | (1,190 | ) | |||||||||||||||||
U.S. Treasury 30 Yr. Bond | Short | 1 | 152,969 | 6/21/17 | — | (1,104 | ) | |||||||||||||||||
|
| |||||||||||||||||||||||
Total Futures Contracts |
|
$7,996 |
| $(14,277 | ) | |||||||||||||||||||
|
| |||||||||||||||||||||||
Net unrealized appreciation (depreciation) |
|
$ (6,281 |
) | |||||||||||||||||||||
|
| |||||||||||||||||||||||
At April 30, 2017, the Fund had the following forward exchange contracts outstanding. See Note 1(c).
Forward Exchange Contracts
| Currency | Counterpartya | Type | Quantity | Contract Amount | Settlement Date | Unrealized Appreciation | Unrealized Depreciation | |||||||||||||||||||||||||
| ||||||||||||||||||||||||||||||||
OTC Forward Exchange Contracts | ||||||||||||||||||||||||||||||||
British Pound | UBSW | Sell | 12,000 | $ | 14,749 | 5/05/17 | $ | — | $ | (798 | ) | |||||||||||||||||||||
Swedish Krona | UBSW | Buy | 200,000 | 22,316 | 5/05/17 | 272 | — | |||||||||||||||||||||||||
Norwegian Krone | JPHQ | Buy | 185,000 | 21,423 | 5/11/17 | 133 | — | |||||||||||||||||||||||||
Swedish Krona | JPHQ | Sell | 195,000 | 21,553 | 5/11/17 | — | (477 | ) | ||||||||||||||||||||||||
British Pound | UBSW | Sell | 13,000 | 16,242 | 5/16/17 | — | (606 | ) | ||||||||||||||||||||||||
Australian Dollar | UBSW | Buy | 53,000 | 39,868 | 6/13/17 | — | (218 | ) | ||||||||||||||||||||||||
Australian Dollar | UBSW | Sell | 206,000 | 155,147 | 6/13/17 | 1,034 | — | |||||||||||||||||||||||||
British Pound | UBSW | Sell | 109,000 | 136,786 | 6/22/17 | — | (4,632 | ) | ||||||||||||||||||||||||
Indian Rupee | RBS | Buy | 3,400,000 | 49,722 | 7/05/17 | 2,776 | — | |||||||||||||||||||||||||
South African Rand | RBS | Buy | 220,000 | 16,956 | 7/05/17 | — | (690 | ) | ||||||||||||||||||||||||
South African Rand | RBS | Sell | 220,000 | 15,983 | 7/05/17 | — | (283 | ) | ||||||||||||||||||||||||
Canadian Dollar | RBS | Sell | 91,000 | 68,472 | 7/10/17 | 1,725 | — | |||||||||||||||||||||||||
Euro | UBSW | Buy | 39,000 | 41,705 | 7/10/17 | 939 | — | |||||||||||||||||||||||||
Euro | UBSW | Sell | 129,000 | 138,640 | 7/10/17 | — | (2,415 | ) | ||||||||||||||||||||||||
Chilean Peso | UBSW | Sell | 13,000,000 | 19,713 | 7/14/17 | 288 | — | |||||||||||||||||||||||||
Singapore Dollar | RBS | Sell | 77,000 | 54,206 | 7/14/17 | — | (953 | ) | ||||||||||||||||||||||||
Mexican Peso | RBS | Buy | 1,930,000 | 92,967 | 7/17/17 | 8,183 | — | |||||||||||||||||||||||||
Mexican Peso | RBS | Sell | 700,000 | 35,907 | 7/17/17 | — | (780 | ) | ||||||||||||||||||||||||
Japanese Yen | UBSW | Sell | 2,365,074 | 21,486 | 7/19/17 | 189 | — | |||||||||||||||||||||||||
South Korean Won | RBS | Sell | 85,000,000 | 74,405 | 8/03/17 | — | (412 | ) | ||||||||||||||||||||||||
Japanese Yen | JPHQ | Buy | 35,719,260 | 324,259 | 12/17/18 | 6,864 | — | |||||||||||||||||||||||||
Japanese Yen | JPHQ | Sell | 35,719,260 | 324,187 | 12/17/18 | — | (6,936 | ) | ||||||||||||||||||||||||
British Pound | JPHQ | Sell | 86,300 | 115,081 | 8/15/19 | 235 | — | |||||||||||||||||||||||||
|
|
| ||||||||||||||||||||||||||||||
Total Forward Exchange Contracts |
|
$ |
22,638 |
| $ | (19,200 | ) | |||||||||||||||||||||||||
|
|
| ||||||||||||||||||||||||||||||
Net unrealized appreciation (depreciation) |
|
$ |
3,438 |
| ||||||||||||||||||||||||||||
|
|
| ||||||||||||||||||||||||||||||
aMay be comprised of multiple contracts with the same counterparty, currency and settlement date.
franklintempleton.com | Annual Report | 23 | ||
FRANKLIN STRATEGIC SERIES
STATEMENT OF INVESTMENTS
Franklin Flexible Alpha Bond Fund (continued)
At April 30, 2017, the Fund had the following credit default swap contracts outstanding. See Note 1(c).
Credit Default Swap Contracts
| Description | Periodic Payment Rate | Counter- party/ Exchange | Notional Amounta | Expiration Date | Unamortized Upfront Payments (Receipts) | Unrealized Appreciation | Unrealized Depreciation | Value | Ratingb | |||||||||||||||||||||||||||
| ||||||||||||||||||||||||||||||||||||
Centrally Cleared Swap Contracts |
| |||||||||||||||||||||||||||||||||||
Contracts to Buy Protection |
| |||||||||||||||||||||||||||||||||||
Single Name | ||||||||||||||||||||||||||||||||||||
Olin Corp. | 1.00 | % | ICE | $10,000 | 12/20/21 | $ 535 | $ — | $ (301 | ) | $ 234 | ||||||||||||||||||||||||||
|
| |||||||||||||||||||||||||||||||||||
Contracts to Sell Protectionc |
| |||||||||||||||||||||||||||||||||||
Single Name |
| |||||||||||||||||||||||||||||||||||
Freeport-McMoRan Inc. | 1.00 | % | ICE | 15,000 | 12/20/21 | (889 | ) | — | (313 | ) | (1,202 | ) | BB- | |||||||||||||||||||||||
|
| |||||||||||||||||||||||||||||||||||
Total Centrally Cleared Swap Contracts |
| $ (354 | ) | $ — | $ (614 | ) | $ (968 | ) | ||||||||||||||||||||||||||||
|
| |||||||||||||||||||||||||||||||||||
OTC Swap Contracts |
| |||||||||||||||||||||||||||||||||||
Contracts to Buy Protection |
| |||||||||||||||||||||||||||||||||||
Single Name |
| |||||||||||||||||||||||||||||||||||
The AES Corp. | 5.00 | % | JPHQ | $30,000 | 6/20/21 | $ (2,763 | ) | $ — | $ (1,378 | ) | $ (4,141 | ) | ||||||||||||||||||||||||
The AES Corp. | 5.00 | % | JPHQ | 35,000 | 6/20/22 | (4,857 | ) | — | (143 | ) | (5,000 | ) | ||||||||||||||||||||||||
Avon Products Inc. | 5.00 | % | JPHQ | 50,000 | 3/20/19 | (3,361 | ) | — | (376 | ) | (3,737 | ) | ||||||||||||||||||||||||
Best Buy Co. Inc. | 5.00 | % | CITI | 10,000 | 6/20/22 | (1,617 | ) | — | (167 | ) | (1,784 | ) | ||||||||||||||||||||||||
CalAtlantic Group Inc. | 5.00 | % | BZWS | 250,000 | 6/20/18 | (11,388 | ) | — | (3,749 | ) | (15,137 | ) | ||||||||||||||||||||||||
KB Home | 5.00 | % | JPHQ | 100,000 | 3/20/20 | (10,284 | ) | — | (1,481 | ) | (11,765 | ) | ||||||||||||||||||||||||
Olin Corp. | 1.00 | % | GSCO | 25,000 | 6/20/21 | 1,668 | — | (1,514 | ) | 154 | ||||||||||||||||||||||||||
Pactiv LLC | 5.00 | % | CITI | 100,000 | 6/20/17 | (258 | ) | — | (973 | ) | (1,231 | ) | ||||||||||||||||||||||||
PHH Corp. | 5.00 | % | BZWS | 200,000 | 9/20/19 | (2,144 | ) | — | (14,946 | ) | (17,090 | ) | ||||||||||||||||||||||||
Sanmina Corp. | 5.00 | % | BZWS | 100,000 | 6/20/19 | (9,206 | ) | — | (1,333 | ) | (10,539 | ) | ||||||||||||||||||||||||
Springleaf Finance Corp. | 5.00 | % | GSCO | 100,000 | 6/20/20 | (3,791 | ) | — | (2,881 | ) | (6,672 | ) | ||||||||||||||||||||||||
Staples Inc. | 1.00 | % | CITI | 10,000 | 6/20/22 | 615 | — | (86 | ) | 529 | ||||||||||||||||||||||||||
Tenet Healthcare Corp. | 5.00 | % | BZWS | 100,000 | 3/20/19 | (4,271 | ) | — | (601 | ) | (4,872 | ) | ||||||||||||||||||||||||
Tenet Healthcare Corp. | 5.00 | % | GSCO | 50,000 | 3/20/19 | (2,089 | ) | — | (347 | ) | (2,436 | ) | ||||||||||||||||||||||||
Universal Health Services Inc. | 5.00 | % | BZWS | 50,000 | 9/20/19 | (4,962 | ) | — | (827 | ) | (5,789 | ) | ||||||||||||||||||||||||
XPO CNW Inc. | 5.00 | % | JPHQ | 100,000 | 3/20/18 | (2,144 | ) | — | (2,167 | ) | (4,311 | ) | ||||||||||||||||||||||||
Contracts to Sell Protectionc |
| |||||||||||||||||||||||||||||||||||
Single Name |
| |||||||||||||||||||||||||||||||||||
American Tower Corp. | 1.00 | % | GSCO | 100,000 | 3/20/21 | (1,456 | ) | 86 | — | (1,370 | ) | BBB- | ||||||||||||||||||||||||
Calpine Corp. | 5.00 | % | JPHQ | 30,000 | 6/20/21 | 1,460 | 1,708 | — | 3,168 | B | ||||||||||||||||||||||||||
Calpine Corp. | 5.00 | % | JPHQ | 35,000 | 6/20/22 | 2,606 | 146 | — | 2,752 | B | ||||||||||||||||||||||||||
Enterprise Products Operating LLC | 1.00 | % | GSCO | 50,000 | 3/20/23 | (740 | ) | 469 | — | (271 | ) | BBB+ | ||||||||||||||||||||||||
Government of Mexico | 1.00 | % | JPHQ | 10,000 | 9/20/20 | (142 | ) | 250 | — | 108 | BBB+ | |||||||||||||||||||||||||
Simon Property Group LP | 1.00 | % | CITI | 20,000 | 6/20/22 | 67 | 13 | — | 80 | A | ||||||||||||||||||||||||||
Sprint Communications Inc. | 5.00 | % | JPHQ | 12,000 | 9/20/20 | - | 1,269 | — | 1,269 | B | ||||||||||||||||||||||||||
Traded Index |
| |||||||||||||||||||||||||||||||||||
dCitibank Bespoke 58 IG/42 HY Equity Tranche 0-3% Index | 0.00 | % | CITI | 10,000 | 6/20/19 | (2,532 | ) | 523 | — | (2,009 | ) | Non- | ||||||||||||||||||||||||
| Investment | ||||||||||||||||||||||||||||||||||||
| Grade | ||||||||||||||||||||||||||||||||||||
24 | Annual Report | franklintempleton.com | ||
FRANKLIN STRATEGIC SERIES
STATEMENT OF INVESTMENTS
Franklin Flexible Alpha Bond Fund (continued)
Credit Default Swap Contracts (continued)
| Description | Periodic Payment Rate | Counter- party/ Exchange | Notional Amounta | Expiration Date | Unamortized Upfront Payments (Receipts) | Unrealized Appreciation | Unrealized Depreciation | Value | Ratingb | |||||||||||||||||||
OTC Swap Contracts (continued) | ||||||||||||||||||||||||||||
Contracts to Sell Protectionc (continued) | ||||||||||||||||||||||||||||
Traded Index (continued) | ||||||||||||||||||||||||||||
dCitibank Bespoke Dec-18 Hong Kong Tranche Index | 1.00% | CITI | $ 30,000 | 12/20/18 | $ | (1,054 | ) | $ | 629 | $ | — | $ | (425 | ) | Non- | |||||||||||||
|
| |||||||||||||||||||||||||||
| Investment | ||||||||||||||||||||||||||||
| Grade | ||||||||||||||||||||||||||||
Total OTC Swap Contracts | $ | (62,643 | ) | $ | 5,093 | $ | (32,969) | $ | (90,519 | ) | ||||||||||||||||||
|
| |||||||||||||||||||||||||||
Total Credit Default Swap Contracts |
$ |
(62,997 |
) | $ | 5,093 | $ | (33,583) | $ | (91,487 | ) | ||||||||||||||||||
|
| |||||||||||||||||||||||||||
Net unrealized appreciation (depreciation) |
$ |
(28,490) |
| |||||||||||||||||||||||||
|
| |||||||||||||||||||||||||||
aIn U.S. dollars unless otherwise indicated. For contracts to sell protection, the notional amount is equal to the maximum potential amount of the future payments and no recourse provisions have been entered into in association with the contracts.
bBased on Standard and Poor’s (S&P) Rating for single name swaps and internal ratings for index swaps. Internal ratings based on mapping into equivalent ratings from external vendors.
cThe Fund enters contracts to sell protection to create a long credit position. Performance triggers include default, bankruptcy or restructuring for single name swaps, and failure to pay or bankruptcy of the underlying securities for traded index swaps.
dRepresents a custom index comprised of a basket of underlying issuers.
At April 30, 2017, the Fund had the following total return swap contracts outstanding. See Note 1(c).
Total Return Swap Contracts
| Notional | Expiration | Unrealized | Unrealized | |||||||||||||||||||||
| Underlying Instruments | Financing Rate | Counterparty | Value | Date | Appreciation | Depreciation | ||||||||||||||||||
OTC Swap Contracts | ||||||||||||||||||||||||
Long | ||||||||||||||||||||||||
Receive Markit iBoxx USD Liquid Leveraged Loan Index | | Pay 3-Month BBA USD LIBOR | | GSCO | $160,000 | 9/20/17 | $ — | $(1,123 | ) | |||||||||||||||
|
| |||||||||||||||||||||||
At April 30, 2017, the Fund had the following cross-currency swap contracts outstanding. See Note 1(c).
Cross Currency Swap Contracts
| Counter- | Notional | Expiration | Unrealized | Unrealized | ||||||||||||||||
| Description | party | Amount | Date | Appreciation | Depreciation | |||||||||||||||
OTC Swap Contracts | ||||||||||||||||||||
Receive Floating Quarterly 3-month USD BBA LIBOR +1.53% | CITI | 106,500 | USD | 3/03/22 | $ — | $(1,498 | ) | |||||||||||||
Pay Fixed Annual 1.00% | 100,000 | EUR | ||||||||||||||||||
|
| |||||||||||||||||||
See Notes 6 and 8 regarding investment transactions and other derivative information, respectively.
See Abbreviations on page 44.
franklintempleton.com | The accompanying notes are an integral part of these financial statements. | Annual Report | 25 | ||
FRANKLIN STRATEGIC SERIES
Statement of Assets and Liabilities
April 30, 2017
Franklin Flexible Alpha Bond Fund
Assets: | ||||
Investments in securities: | ||||
Cost - Unaffiliated issuers | $ | 9,459,377 | ||
Cost - Non-controlled affiliates (Note 3f) | 1,305,181 | |||
|
| |||
Total cost of investments |
$ |
10,764,558 |
| |
|
| |||
Value - Unaffiliated issuers |
$ |
9,575,453 |
| |
Value - Non-controlled affiliates (Note 3f) | 1,305,181 | |||
|
| |||
Total value of investments |
|
10,880,634 |
| |
Cash | 21 | |||
Foreign currency, at value (cost $531) | 532 | |||
Receivables: | ||||
Investment securities sold | 243,809 | |||
Capital shares sold | 5,000 | |||
Interest | 59,129 | |||
Affiliates | 212,117 | |||
Due from brokers | 56,366 | |||
Variation margin | 2,455 | |||
OTC swap contracts (upfront payments $7,033) | 6,416 | |||
Unrealized appreciation on OTC forward exchange contracts | 22,638 | |||
Unrealized appreciation on OTC swap contracts | 5,093 | |||
|
| |||
Total assets |
|
11,494,210 |
| |
|
| |||
Liabilities: | ||||
Payables: | ||||
Investment securities purchased | 295,131 | |||
Capital shares redeemed | 136 | |||
Distribution fees | 490 | |||
Transfer agent fees | 30 | |||
Professional fees | 62,039 | |||
Distributions to shareholders | 7,984 | |||
OTC swap contracts (upfront receipts $103,985) | 69,059 | |||
Options written, at value (premiums received $957) | — | |||
Unrealized depreciation on OTC forward exchange contracts | 19,200 | |||
Unrealized depreciation on OTC swap contracts | 35,590 | |||
Accrued expenses and other liabilities | 14,382 | |||
|
| |||
Total liabilities |
|
504,041 |
| |
|
| |||
Net assets, at value |
$ |
10,990,169 |
| |
|
| |||
Net assets consist of: | ||||
Paid-in capital | $ | 11,090,099 | ||
Distributions in excess of net investment income | (33,482 | ) | ||
Net unrealized appreciation (depreciation) | 77,613 | |||
Accumulated net realized gain (loss) | (144,061 | ) | ||
|
| |||
Net assets, at value |
$ |
10,990,169 |
| |
|
|
26 | Annual Report | | The accompanying notes are an integral part of these financial statements. | franklintempleton.com | |||
FRANKLIN STRATEGIC SERIES
FINANCIAL STATEMENTS
Statement of Assets and Liabilities (continued)
April 30, 2017
Franklin Flexible Alpha Bond Fund
Class A: | ||||
Net assets, at value | $10,442,840 | |||
|
| |||
Shares outstanding | 1,058,939 | |||
|
| |||
Net asset value per sharea | $9.86 | |||
|
| |||
Maximum offering price per share (net asset value per share ÷ 95.75%) | $10.30 | |||
|
| |||
Class C: | ||||
Net assets, at value | $ 245,207 | |||
|
| |||
Shares outstanding | 25,011 | |||
|
| |||
Net asset value and maximum offering price per sharea | $9.80 | |||
|
| |||
Class R: | ||||
Net assets, at value | $ 60,116 | |||
|
| |||
Shares outstanding | 6,100 | |||
|
| |||
Net asset value and maximum offering price per share | $9.86 | |||
|
| |||
Class R6: | ||||
Net assets, at value | $ 9,856 | |||
|
| |||
Shares outstanding | 1,000 | |||
|
| |||
Net asset value and maximum offering price per share | $9.86 | |||
|
| |||
Advisor Class: | ||||
Net assets, at value | $ 232,150 | |||
|
| |||
Shares outstanding | 23,558 | |||
|
| |||
Net asset value and maximum offering price per share | $9.85 | |||
|
|
aRedemption price is equal to net asset value less contingent deferred sales charges, if applicable.
franklintempleton.com | The accompanying notes are an integral part of these financial statements. | | Annual Report | 27 | |||
FRANKLIN STRATEGIC SERIES
FINANCIAL STATEMENTS
Statement of Operations
for the year ended April 30, 2017
Franklin Flexible Alpha Bond Fund
Investment income: | ||||
Dividends: | ||||
Unaffiliated issuers | $ | 7,044 | ||
Non-controlled affiliates (Note 3f) | 778 | |||
Interest | 265,440 | |||
|
| |||
Total investment income |
|
273,262 |
| |
|
| |||
Expenses: | ||||
Management fees (Note 3a) | 60,038 | |||
Distribution fees: (Note 3c) | ||||
Class C | 1,436 | |||
Class R | 37 | |||
Transfer agent fees: (Note 3e) | ||||
Class A | 1,782 | |||
Class C | 37 | |||
Class R | 5 | |||
Class R6 | 201 | |||
Advisor Class | 52 | |||
Custodian fees (Note 4) | 789 | |||
Reports to shareholders | 14,364 | |||
Registration and filing fees | 70,687 | |||
Professional fees | 75,530 | |||
Amortization of offering costs (Note 1g) | 57,329 | |||
Pricing fees | 43,956 | |||
Other | 20,772 | |||
|
| |||
Total expenses |
|
347,015 |
| |
Expense reductions (Note 4) | (32 | ) | ||
Expenses waived/paid by affiliates (Note 3f and 3g) | (272,355 | ) | ||
|
| |||
Net expenses |
|
74,628 |
| |
|
| |||
Net investment income |
|
198,634 |
| |
|
| |||
Realized and unrealized gains (losses): | ||||
Net realized gain (loss) from: | ||||
Investments | 10,134 | |||
Written options | 17,433 | |||
Foreign currency transactions | (16,328 | ) | ||
Futures contracts | (22,375 | ) | ||
Swap contracts | 4,357 | |||
|
| |||
Net realized gain (loss) |
|
(6,779 |
) | |
|
| |||
Net change in unrealized appreciation (depreciation) on: | ||||
Investments | (8,443 | ) | ||
Translation of other assets and liabilities denominated in foreign currencies | 38,733 | |||
Written options | (4,539 | ) | ||
Futures contracts | 12,608 | |||
Swap contracts | (12,554 | ) | ||
|
| |||
Net change in unrealized appreciation (depreciation) |
|
25,805 |
| |
|
| |||
Net realized and unrealized gain (loss) |
|
19,026 |
| |
|
| |||
Net increase (decrease) in net assets resulting from operations |
$ |
217,660 |
| |
|
|
28 | Annual Report | | The accompanying notes are an integral part of these financial statements. | franklintempleton.com | |||
FRANKLIN STRATEGIC SERIES
FINANCIAL STATEMENTS
Statements of Changes in Net Assets
Franklin Flexible Alpha Bond Fund
| Year Ended April 30, | ||||||||
| 2017 | 2016a | |||||||
Increase (decrease) in net assets: | ||||||||
Operations: | ||||||||
Net investment income | $ | 198,634 | $ | 104,677 | ||||
Net realized gain (loss) | (6,779 | ) | (178,148 | ) | ||||
Net change in unrealized appreciation (depreciation) | 25,805 | 51,808 | ||||||
|
| |||||||
Net increase (decrease) in net assets resulting from operations |
|
217,660 |
|
|
(21,663 |
) | ||
|
| |||||||
Distributions to shareholders from: | ||||||||
Net investment income: | ||||||||
Class A | (228,517 | ) | (98,481 | ) | ||||
Class C | (3,853 | ) | (1,140 | ) | ||||
Class R | (1,041 | ) | (85 | ) | ||||
Class R6 | (220 | ) | (105 | ) | ||||
Advisor Class | (6,710 | ) | (1,870 | ) | ||||
|
| |||||||
Total distributions to shareholders |
|
(240,341 |
) |
|
(101,681 |
) | ||
|
| |||||||
Capital share transactions: (Note 2) | ||||||||
Class A | 263,641 | 10,322,042 | ||||||
Class C | 42,152 | 204,600 | ||||||
Class R | 50,835 | 10,000 | ||||||
Class R6 | — | 10,000 | ||||||
Advisor Class | (111,111 | ) | 344,035 | |||||
|
| |||||||
Total capital share transactions |
|
245,517 |
|
|
10,890,677 |
| ||
|
| |||||||
Net increase (decrease) in net assets |
|
222,836 |
|
|
10,767,333 |
| ||
Net assets: | ||||||||
Beginning of year | 10,767,333 | — | ||||||
|
| |||||||
End of year |
$ |
10,990,169 |
|
$ |
10,767,333 |
| ||
|
| |||||||
Undistributed net investment income included in net assets: | ||||||||
End of year | $ | — | $ | 17,623 | ||||
|
| |||||||
Distributions in excess of net investment income included in net assets: | ||||||||
End of year | $ | (33,482 | ) | $ | — | |||
|
| |||||||
aFor the period August 3, 2015 (commencement of operations) to April 30, 2016.
franklintempleton.com | The accompanying notes are an integral part of these financial statements. | | Annual Report | 29 | |||
FRANKLIN STRATEGIC SERIES
Franklin Flexible Alpha Bond Fund
1. Organization and Significant Accounting Policies
Franklin Strategic Series (Trust) is registered under the Investment Company Act of 1940 (1940 Act) as an open-end management investment company, consisting of nine separate funds and applies the specialized accounting and reporting guidance in U.S. Generally Accepted Accounting Principles (U.S. GAAP). Franklin Flexible Alpha Bond Fund (Fund) is included in this report. The financial statements of the remaining funds in the Trust are presented separately. The Fund offers five classes of shares: Class A, Class C, Class R, Class R6, and Advisor Class. Each class of shares may differ by its initial sales load, contingent deferred sales charges, voting rights on matters affecting a single class, its exchange privilege and fees primarily due to differing arrangements for distribution and transfer agent fees.
The following summarizes the Fund’s significant accounting policies.
a. Financial Instrument Valuation
The Fund’s investments in financial instruments are carried at fair value daily. Fair value is the price that would be received to sell an asset or paid to transfer a liability in an orderly transaction between market participants on the measurement date. The Fund calculates the net asset value (NAV) per share as of 4 p.m. Eastern time each day the New York Stock Exchange (NYSE) is open for trading. Under compliance policies and procedures approved by the Trust’s Board of Trustees (the Board), the Fund’s administrator has responsibility for oversight of valuation, including leading the cross-functional Valuation Committee (VC). The VC provides administration and oversight of the Fund’s valuation policies and procedures, which are approved annually by the Board. Among other things, these procedures allow the Fund to utilize independent pricing services, quotations from securities and financial instrument dealers, and other market sources to determine fair value.
Equity securities, exchange traded funds, and derivative financial instruments listed on an exchange or on the NASDAQ National Market System are valued at the last quoted sale price or the official closing price of the day, respectively. Over-the-counter (OTC) securities are valued within the range of the most recent quoted bid and ask prices. Securities that trade in multiple markets or on multiple exchanges are valued
according to the broadest and most representative market. Certain equity securities are valued based upon fundamental characteristics or relationships to similar securities.
Debt securities generally trade in the OTC market rather than on a securities exchange. The Fund’s pricing services use multiple valuation techniques to determine fair value. In instances where sufficient market activity exists, the pricing services may utilize a market-based approach through which quotes from market makers are used to determine fair value. In instances where sufficient market activity may not exist or is limited, the pricing services also utilize proprietary valuation models which may consider market characteristics such as benchmark yield curves, credit spreads, estimated default rates, anticipated market interest rate volatility, coupon rates, anticipated timing of principal repayments, underlying collateral, and other unique security features in order to estimate the relevant cash flows, which are then discounted to calculate the fair value. Securities denominated in a foreign currency are converted into their U.S. dollar equivalent at the foreign exchange rate in effect at 4 p.m. Eastern time on the date that the values of the foreign debt securities are determined.
Investments in open-end mutual funds are valued at the closing NAV.
Certain derivative financial instruments are centrally cleared or trade in the OTC market. The Fund’s pricing services use various techniques including industry standard option pricing models and proprietary discounted cash flow models to determine the fair value of those instruments. The Fund’s net benefit or obligation under the derivative contract, as measured by the fair value of the contract, is included in net assets.
The Fund has procedures to determine the fair value of financial instruments for which market prices are not reliable or readily available. Under these procedures, the VC convenes on a regular basis to review such financial instruments and considers a number of factors, including significant unobservable valuation inputs, when arriving at fair value. The VC primarily employs a market-based approach which may use related or comparable assets or liabilities, recent transactions, market multiples, book values, and other relevant information for the investment to determine the fair value of the investment. An income-based valuation approach may also be used in which the anticipated future cash flows of the investment are discounted to calculate fair value. Discounts may also be applied due to the nature or duration of any restrictions on the disposition of the
30 | Annual Report | franklintempleton.com | ||
FRANKLIN STRATEGIC SERIES
NOTES TO FINANCIAL STATEMENTS
Franklin Flexible Alpha Bond Fund (continued)
investments. Due to the inherent uncertainty of valuations of such investments, the fair values may differ significantly from the values that would have been used had an active market existed. The VC employs various methods for calibrating these valuation approaches including a regular review of key inputs and assumptions, transactional back-testing or disposition analysis, and reviews of any related market activity.
Trading in securities on foreign securities stock exchanges and OTC markets may be completed before 4 p.m. Eastern time. In addition, trading in certain foreign markets may not take place on every Fund’s business day. Occasionally, events occur between the time at which trading in a foreign security is completed and 4 p.m. Eastern time that might call into question the reliability of the value of a portfolio security held by the Fund. As a result, differences may arise between the value of the Fund’s portfolio securities as determined at the foreign market close and the latest indications of value at 4 p.m. Eastern time. In order to minimize the potential for these differences, the VC monitors price movements following the close of trading in foreign stock markets through a series of country specific market proxies (such as baskets of American Depositary Receipts, futures contracts and exchange traded funds). These price movements are measured against established trigger thresholds for each specific market proxy to assist in determining if an event has occurred that may call into question the reliability of the values of the foreign securities held by the Fund. If such an event occurs, the securities may be valued using fair value procedures, which may include the use of independent pricing services.
When the last day of the reporting period is a non-business day, certain foreign markets may be open on those days that the Fund’s NAV is not calculated, which could result in differences between the value of the Fund’s portfolio securities on the last business day and the last calendar day of the reporting period. Any significant security valuation changes due to an open foreign market are adjusted and reflected by the Fund for financial reporting purposes.
b. Foreign Currency Translation
Portfolio securities and other assets and liabilities denominated in foreign currencies are translated into U.S. dollars based on the exchange rate of such currencies against U.S. dollars on the date of valuation. The Fund may enter into foreign currency exchange contracts to facilitate transactions denominated in a foreign currency. Purchases and sales of securities, income and
expense items denominated in foreign currencies are translated into U.S. dollars at the exchange rate in effect on the transaction date. Portfolio securities and assets and liabilities denominated in foreign currencies contain risks that those currencies will decline in value relative to the U.S. dollar. Occasionally, events may impact the availability or reliability of foreign exchange rates used to convert the U.S. dollar equivalent value. If such an event occurs, the foreign exchange rate will be valued at fair value using procedures established and approved by the Board.
The Fund does not separately report the effect of changes in foreign exchange rates from changes in market prices on securities held. Such changes are included in net realized and unrealized gain or loss from investments in the Statement of Operations.
Realized foreign exchange gains or losses arise from sales of foreign currencies, currency gains or losses realized between the trade and settlement dates on securities transactions and the difference between the recorded amounts of dividends, interest, and foreign withholding taxes and the U.S. dollar equivalent of the amounts actually received or paid. Net unrealized foreign exchange gains and losses arise from changes in foreign exchange rates on foreign denominated assets and liabilities other than investments in securities held at the end of the reporting period.
c. Derivative Financial Instruments
The Fund invested in derivative financial instruments in order to manage risk or gain exposure to various other investments or markets. Derivatives are financial contracts based on an underlying or notional amount, require no initial investment or an initial net investment that is smaller than would normally be required to have a similar response to changes in market factors, and require or permit net settlement. Derivatives contain various risks including the potential inability of the counterparty to fulfill their obligations under the terms of the contract, the potential for an illiquid secondary market, and/or the potential for market movements which expose the Fund to gains or losses in excess of the amounts shown in the Statement of Assets and Liabilities. Realized gain and loss and unrealized appreciation and depreciation on these contracts for the period are included in the Statement of Operations.
Derivative counterparty credit risk is managed through a formal evaluation of the creditworthiness of all potential counterparties. The Fund attempts to reduce its exposure to
franklintempleton.com | Annual Report | 31 | ||
FRANKLIN STRATEGIC SERIES
NOTES TO FINANCIAL STATEMENTS
Franklin Flexible Alpha Bond Fund (continued)
1. Organization and Significant Accounting Policies (continued)
c. Derivative Financial Instruments (continued)
counterparty credit risk on OTC derivatives, whenever possible, by entering into International Swaps and Derivatives Association (ISDA) master agreements with certain counterparties. These agreements contain various provisions, including but not limited to collateral requirements, events of default, or early termination. Termination events applicable to the counterparty include certain deteriorations in the credit quality of the counterparty. Termination events applicable to the Fund include failure of the Fund to maintain certain net asset levels and/or limit the decline in net assets over various periods of time. In the event of default or early termination, the ISDA master agreement gives the non-defaulting party the right to net and close-out all transactions traded, whether or not arising under the ISDA agreement, to one net amount payable by one counterparty to the other. However, absent an event of default or early termination, OTC derivative assets and liabilities are presented gross and not offset in the Statement of Assets and Liabilities. Early termination by the counterparty may result in an immediate payment by the Fund of any net liability owed to that counterparty under the ISDA agreement.
Collateral requirements differ by type of derivative. Collateral or initial margin requirements are set by the broker or exchange clearing house for exchange traded and centrally cleared derivatives. Initial margin deposited is held at the exchange and can be in the form of cash and/or securities. For OTC derivatives traded under an ISDA master agreement, posting of collateral is required by either the Fund or the applicable counterparty if the total net exposure of all OTC derivatives with the applicable counterparty exceeds the minimum transfer amount, which typically ranges from $100,000 to $250,000, and can vary depending on the counterparty and the type of the agreement. Generally, collateral is determined at the close of Fund business each day and any additional collateral required due to changes in derivative values may be delivered by the Fund or the counterparty the next business day, or within a few business days. Collateral pledged and/or received by the Fund for OTC derivatives, if any, is held in segregated accounts with the Fund’s custodian/counterparty broker and can be in the form of cash and/or securities. Unrestricted cash may be invested according to the Fund’s investment objectives. To the extent
that the amounts due to the Fund from its counterparties are not subject to collateralization or are not fully collateralized, the Fund bears the risk of loss from counterparty non-performance.
The Fund entered into exchange traded futures contracts primarily to manage and/or gain exposure to interest rate risk. A futures contract is an agreement between the Fund and a counterparty to buy or sell an asset at a specified price on a future date. Required initial margins are pledged by the Fund, and the daily change in fair value is accounted for as a variation margin payable or receivable in the Statement of Assets and Liabilities.
The Fund entered into OTC forward exchange contracts primarily to manage and/or gain exposure to certain foreign currencies. A forward exchange contract is an agreement between the Fund and a counterparty to buy or sell a foreign currency at a specific exchange rate on a future date.
The Fund entered into credit default swap contracts primarily to manage and/or gain exposure to credit risk. A credit default swap is an agreement between the Fund and a counterparty whereby the buyer of the contract receives credit protection and the seller of the contract guarantees the credit worthiness of a referenced debt obligation. These agreements may be privately negotiated in the over-the-counter market (OTC credit default swaps) or may be executed in a multilateral trade facility platform, such as a registered exchange (centrally cleared credit default swaps). The underlying referenced debt obligation may be a single issuer of corporate or sovereign debt, a credit index, a basket of issuers or indices, or a tranche of a credit index or basket of issuers or indices. In the event of a default of the underlying referenced debt obligation, the buyer is entitled to receive the notional amount of the credit default swap contract from the seller in exchange for the referenced debt obligation, a net settlement amount equal to the notional amount of the credit default swap less the recovery value of the referenced debt obligation, or other agreed upon amount. For centrally cleared credit default swaps, required initial margins are pledged by the Fund, and the daily change in fair value is accounted for as a variation margin payable or receivable in the Statement of Assets and Liabilities. Over the term of the contract, the buyer pays the seller a periodic stream of payments, provided that no event of default has occurred. Such periodic payments are accrued daily as an unrealized appreciation or depreciation until the payments are made, at which time they are realized. Upfront payments and receipts are reflected in the Statement of Assets and Liabilities and represent compensating factors between
32 | Annual Report | franklintempleton.com | ||
FRANKLIN STRATEGIC SERIES
NOTES TO FINANCIAL STATEMENTS
Franklin Flexible Alpha Bond Fund (continued)
stated terms of the credit default swap agreement and prevailing market conditions (credit spreads and other relevant factors). These upfront payments and receipts are amortized over the term of the contract as a realized gain or loss in the Statement of Operations.
The Fund entered into OTC cross currency swap contracts primarily to manage and/or gain exposure to interest rate risk and certain foreign currencies. A cross currency swap is an agreement between the Fund and a counterparty to exchange cash flows (determined using either a fixed or floating rate) based on the notional amounts of two different currencies. The notional amounts are typically determined based on the spot exchange rates at the opening of the contract. Cross currency swaps may require the exchange of notional amounts at the opening and/or closing of the contract. Over the term of the contract, contractually required payments to be paid and to be received are accrued daily and recorded as unrealized depreciation and appreciation until the payments are made, at which time they are realized. Upfront payments and receipts are reflected in the Statement of Assets and Liabilities and represent compensating factors between stated terms of the cross currency swap contract and prevailing market conditions (interest rate spreads and other relevant factors). These upfront payments and receipts are amortized over the term of the contract as a realized gain or loss in the Statement of Operations.
The Fund entered into interest rate swap contracts primarily to manage interest rate risk. An interest rate swap is an agreement between the Fund and a counterparty to exchange cash flows based on the difference between two interest rates, applied to a notional amount. These agreements may be privately negotiated in the over-the-counter market (OTC interest rate swaps) or may be executed on a registered exchange (centrally cleared interest rate swaps). For centrally cleared interest rate swaps, required initial margins are pledged by the Fund, and the daily change in fair value is accounted for as a variation margin payable or receivable in the Statement of Assets and Liabilities. Over the term of the contract, contractually required payments to be paid and to be received are accrued daily and recorded as unrealized depreciation and appreciation until the payments are made, at which time they are realized.
The Fund entered into OTC total return swap contracts primarily to manage and/or gain exposure to interest rate risk of an underlying instrument such as a stock, bond, index or basket of securities or indices. A total return swap is an agreement between the Fund and a counterparty to exchange a return
linked to an underlying instrument for a floating or fixed rate payment, both based upon a notional amount. Over the term of the contract, contractually required payments to be paid or received are accrued daily and recorded as unrealized appreciation or depreciation until the payments are made, at which time they are recognized as realized gain or loss.
The Fund purchased or wrote exchange traded and/or OTC option contracts primarily to manage and/or gain exposure to interest rate, foreign exchange rate, and credit risk. An option is a contract entitling the holder to purchase or sell a specific amount of shares or units of an asset or notional amount of a swap (swaption), at a specified price. When an option is purchased or written, an amount equal to the premium paid or received is recorded as an asset or liability, respectively. Certain option contracts are marked-to-market daily and the daily change in fair value is accounted for as variation margin payable or receivable in the Statement of Assets and Liabilities. Upon exercise of an option, the acquisition cost or sales proceeds of the underlying investment is adjusted by any premium received or paid. Upon expiration of an option, any premium received or paid is recorded as a realized gain or loss. Upon closing an option other than through expiration or exercise, the difference between the premium received or paid and the cost to close the position is recorded as a realized gain or loss.
See Notes 6 and 8 regarding investment transactions and other derivative information, respectively.
d. Mortgage Dollar Rolls
The Fund enters into mortgage dollar rolls, typically on a TBA basis. Mortgage dollar rolls are agreements between the Fund and a financial institution where the Fund sells (or buys) mortgage-backed securities for delivery on a specified date and simultaneously contracts to repurchase (or sell) substantially similar (same type, coupon, and maturity) securities at a future date and at a predetermined price. Gains or losses are realized on the initial sale, and the difference between the repurchase price and the sale price is recorded as an unrealized gain or loss to the Fund upon entering into the mortgage dollar roll. In addition, the Fund may invest the cash proceeds that are received from the initial sale. During the period between the sale and repurchase, the Fund is not entitled to principal and interest paid on the mortgage backed securities. Transactions in mortgage dollar rolls are accounted for as purchases and sales
franklintempleton.com | Annual Report | 33 | ||
FRANKLIN STRATEGIC SERIES
NOTES TO FINANCIAL STATEMENTS
Franklin Flexible Alpha Bond Fund (continued)
1. Organization and Significant Accounting Policies (continued)
d. Mortgage Dollar Rolls (continued)
and may result in an increase to the Fund’s portfolio turnover rate. The risks of mortgage dollar roll transactions include the potential inability of the counterparty to fulfill its obligations.
e. Income and Deferred Taxes
It is the Fund’s policy to qualify as a regulated investment company under the Internal Revenue Code. The Fund intends to distribute to shareholders substantially all of its taxable income and net realized gains to relieve it from federal income and excise taxes. As a result, no provision for U.S. federal income taxes is required.
The Fund may be subject to foreign taxation related to income received, capital gains on the sale of securities and certain foreign currency transactions in the foreign jurisdictions in which it invests. Foreign taxes, if any, are recorded based on the tax regulations and rates that exist in the foreign markets in which the Fund invests. When a capital gain tax is determined to apply, the Fund records an estimated deferred tax liability in an amount that would be payable if the securities were disposed of on the valuation date.
The Fund may recognize an income tax liability related to its uncertain tax positions under U.S. GAAP when the uncertain tax position has a less than 50% probability that it will be sustained upon examination by the tax authorities based on its technical merits. As of April 30, 2017, the Fund has determined that no tax liability is required in its financial statements related to uncertain tax positions for any open tax years (or expected to be taken in future tax years). Open tax years are those that remain subject to examination and are based on each tax jurisdiction’s statute of limitation.
f. Security Transactions, Investment Income, Expenses and Distributions
Security transactions are accounted for on trade date. Realized gains and losses on security transactions are determined on a specific identification basis. Interest income and estimated expenses are accrued daily. Amortization of premium and accretion of discount on debt securities are included in interest income. Paydown gains and losses are recorded as an adjustment to interest income. Dividend income is recorded on the ex-dividend date. Dividends from net investment income are
normally declared daily; these dividends may be reinvested or paid monthly to shareholders. Distributions from realized capital gains and other distributions, if any, are recorded on the ex-dividend date. Distributions to shareholders are determined according to income tax regulations (tax basis). Distributable earnings determined on a tax basis may differ from earnings recorded in accordance with U.S. GAAP. These differences may be permanent or temporary. Permanent differences are reclassified among capital accounts to reflect their tax character. These reclassifications have no impact on net assets or the results of operations. Temporary differences are not reclassified, as they may reverse in subsequent periods.
Common expenses incurred by the Trust are allocated among the Funds based on the ratio of net assets of each Fund to the combined net assets of the Trust. Fund specific expenses are charged directly to the Fund that incurred the expense.
Net investment income, not including class specific expenses, is allocated daily to each class of shares based upon the relative value of the settled shares of each class. Realized and unrealized gains and losses are allocated daily to each class of shares based upon the relative proportion of net assets of each class. Differences in per share distributions, by class, are generally due to differences in class specific expenses.
Inflation-indexed bonds are adjusted for inflation through periodic increases or decreases in the security’s interest accruals, face amount, or principal redemption value, by amounts corresponding to the rate of inflation as measured by an index. Any increase or decrease in the face amount or principal redemption value will be included as interest income in the Statement of Operations.
g. Offering Costs
Offering costs are amortized on a straight line basis over twelve months.
h. Accounting Estimates
The preparation of financial statements in accordance with U.S. GAAP requires management to make estimates and assumptions that affect the reported amounts of assets and liabilities at the date of the financial statements and the amounts of income and expenses during the reporting period. Actual results could differ from those estimates.
34 | Annual Report | franklintempleton.com | ||
FRANKLIN STRATEGIC SERIES
NOTES TO FINANCIAL STATEMENTS
Franklin Flexible Alpha Bond Fund (continued)
i. Guarantees and Indemnifications
Under the Trust’s organizational documents, its officers and trustees are indemnified by the Trust against certain liabilities arising out of the performance of their duties to the Trust. Additionally, in the normal course of business, the Trust, on behalf of the Fund, enters into contracts with service providers
that contain general indemnification clauses. The Trust’s maximum exposure under these arrangements is unknown as this would involve future claims that may be made against the Trust that have not yet occurred. Currently, the Trust expects the risk of loss to be remote.
2. Shares of Beneficial Interest
At April 30, 2017, there were an unlimited number of shares authorized (without par value). Transactions in the Fund’s shares were as follows:
| Year Ended April 30, | ||||||||||||||||
| 2017 | 2016a | |||||||||||||||
| Shares | Amount | Shares | Amount | |||||||||||||
Class A Shares: | ||||||||||||||||
Shares sold | 33,507 | $ | 331,682 | 1,055,699 | $ | 10,552,738 | ||||||||||
Shares issued in reinvestment of distributions | 1,227 | 12,100 | 319 | 3,152 | ||||||||||||
Shares redeemed | (8,135 | ) | (80,141 | ) | (23,678 | ) | (233,848 | ) | ||||||||
Net increase (decrease) |
|
26,599 |
| $ | 263,641 | 1,032,340 | $ | 10,322,042 | ||||||||
Class C Shares: | ||||||||||||||||
Shares sold | 20,061 | $ | 197,723 | 44,749 | $ | 442,689 | ||||||||||
Shares issued in reinvestment of distributions | 393 | 3,853 | 108 | 1,064 | ||||||||||||
Shares redeemed | (16,105 | ) | (159,424 | ) | (24,195 | ) | (239,153 | ) | ||||||||
Net increase (decrease) |
|
4,349 |
| $ | 42,152 | 20,662 | $ | 204,600 | ||||||||
Class R Shares: | ||||||||||||||||
Shares sold | 5,015 | $ | 50,000 | 1,000 | $ | 10,000 | ||||||||||
Shares issued in reinvestment of distributions | 85 | 835 | — | — | ||||||||||||
Net increase (decrease) |
|
5,100 |
| $ | 50,835 | 1,000 | $ | 10,000 | ||||||||
Class R6 Shares: | ||||||||||||||||
Shares sold | — | $ | — | 1,000 | $ | 10,000 | ||||||||||
Net increase (decrease) |
|
— |
| $ | — | 1,000 | $ | 10,000 | ||||||||
Advisor Class Shares: | ||||||||||||||||
Shares sold | 4,318 | $ | 42,500 | 45,294 | $ | 447,368 | ||||||||||
Shares issued in reinvestment of distributions | 662 | 6,531 | 177 | 1,748 | ||||||||||||
Shares redeemed | (16,269 | ) | (160,142 | ) | (10,624 | ) | (105,081 | ) | ||||||||
Net increase (decrease) |
|
(11,289 |
) | $ | (111,111 | ) | 34,847 | $ | 344,035 | |||||||
aFor the period August 3, 2015 (commencement of operations) to April 30, 2016.
franklintempleton.com | Annual Report | 35 | ||
FRANKLIN STRATEGIC SERIES
NOTES TO FINANCIAL STATEMENTS
Franklin Flexible Alpha Bond Fund (continued)
3. Transactions with Affiliates
Franklin Resources, Inc. is the holding company for various subsidiaries that together are referred to as Franklin Templeton Investments. Certain officers and trustees of the Trust are also officers and/or directors of the following subsidiaries:
| Subsidiary | Affiliation | |
| Franklin Advisers, Inc. (Advisers) | Investment manager | |
| Franklin Templeton Institutional, LLC (FT Institutional) | Investment manager | |
| Franklin Templeton Services, LLC (FT Services) | Administrative manager | |
| Franklin Templeton Distributors, Inc. (Distributors) | Principal underwriter | |
| Franklin Templeton Investor Services, LLC (Investor Services) | Transfer agent |
a. Management Fees
The Fund pays an investment management fee to Advisers based on the average daily net assets of the Fund as follows:
| Annualized Fee Rate | Net Assets | |
| 0.550% | Up to and including $1 billion | |
| 0.500% | Over $1 billion, up to and including $5 billion | |
| 0.450% | Over $5 billion, up to and including $10 billion | |
| 0.445% | Over $10 billion, up to and including $15 billion | |
| 0.440% | Over $15 billion, up to and including $20 billion | |
| 0.435% | In excess of $20 billion |
For the year ended April 30, 2017, the effective investment management fee rate was 0.550% of the Fund’s average daily net assets.
Under a subadvisory agreement, FT Instituitional, an affiliate of Advisers, provides subadvisory services to the Fund. The subadvisory fee is paid by Advisers based on the Fund’s average daily net assets, and is not an additional expense of the Fund.
b. Administrative Fees
Under an agreement with Advisers, FT Services provides administrative services to the Fund. The fee is paid by Advisers based on the Fund’s average daily net assets, and is not an additional expense of the Fund.
c. Distribution Fees
The Board has adopted distribution plans for each share class, with the exception of Class R6 and Advisor Class shares, pursuant to Rule 12b-1 under the 1940 Act. Under the Fund’s Class A reimbursement distribution plan, the Fund reimburses Distributors for costs incurred in connection with the servicing, sale and distribution of the Fund’s shares up to the maximum annual plan rate. Under the Class A reimbursement distribution plan, costs exceeding the maximum for the current plan year cannot be reimbursed in subsequent periods. In addition, under the Fund’s Class C and R compensation distribution plans, the Fund pays Distributors for costs incurred in connection with the servicing, sale and distribution of the Fund’s shares up to the maximum annual plan rate for each class. The plan year, for purposes of monitoring compliance with the maximum annual plan rates, is February 1 through January 31.
The maximum annual plan rates, based on the average daily net assets, for each class, are as follows:
Class A | 0.25 | % | ||
Class C | 0.65 | % | ||
Class R | 0.50 | % |
36 | Annual Report | franklintempleton.com | ||
FRANKLIN STRATEGIC SERIES
NOTES TO FINANCIAL STATEMENTS
Franklin Flexible Alpha Bond Fund (continued)
d. Sales Charges/Underwriting Agreements
Front-end sales charges and contingent deferred sales charges (CDSC) do not represent expenses of the Fund. These charges are deducted from the proceeds of sales of Fund shares prior to investment or from redemption proceeds prior to remittance, as applicable. Distributors has advised the Fund of the following commission transactions related to the sales and redemptions of the Fund’s shares for the year:
Sales charges retained net of commissions paid to unaffiliated brokers/dealers | $ | 139 | ||
CDSC retained | $ | 155 |
e. Transfer Agent Fees
Each class of shares, except for Class R6, pays transfer agent fees to Investor Services for its performance of shareholder servicing obligations and reimburses Investor Services for out of pocket expenses incurred, including shareholder servicing fees paid to third parties. These fees are allocated daily based upon their relative proportion of such classes’ aggregate net assets. Class R6 pays Investor Services transfer agent fees specific to that class.
For the year ended April 30, 2017, the Fund paid transfer agent fees of $2,077, of which $1,459 was retained by Investor Services.
f. Investments in Affiliated Management Investment Companies
The Fund invests in one or more affiliated management investment companies for purposes other than exercising a controlling influence over the management or policies. Management fees paid by the Fund are waived on assets invested in the affiliated management investment companies, as noted in the Statement of Operations, in an amount not to exceed the management and administrative fees paid directly or indirectly by each affiliate. During the year ended April 30, 2017, the Fund held investments in affiliated management investment companies as follows:
| Number of Shares Held at Beginning of Year | Gross Additions | Gross Reductions | Number of Shares Held at End of Year | Value at End of Year | Investment Income | Realized Gain (Loss) | % of Affiliated Fund Shares Outstanding Held at End of Year | |||||||||||||||||||||||||
Non-Controlled Affiliates | ||||||||||||||||||||||||||||||||
Institutional Fiduciary Trust Money Market Portfolio, 0.37% | 2,033,538 | 3,825,783 | (4,554,140 | ) | 1,305,181 | $ | 1,305,181 | $778 | $– | 0.0 | %a | |||||||||||||||||||||
aRounds to less than 0.1%.
g. Waiver and Expense Reimbursements
Advisers and Investor Services have contractually agreed in advance to waive or limit their respective fees and to assume as their own expense certain expenses otherwise payable by the Fund so that the expenses (excluding distribution fees, and acquired fund fees and expenses) for Class A, Class C, Class R and Advisor Class of the Fund do not exceed 0.85% and Class R6 does not exceed 0.71% based on the average net assets of each class (other than certain non-routine expenses or costs, including those relating to litigation, indemnification, reorganizations, and liquidations) until August 31, 2017. Total expenses waived or paid are not subject to recapture subsequent to the Fund’s fiscal year end.
h. Other Affiliated Transactions
At April 30, 2017, Franklin Resources, Inc. owned 89.5% of the Fund’s outstanding shares. Investment activities of this shareholder could have a material impact on the Fund.
franklintempleton.com | Annual Report | 37 | ||
FRANKLIN STRATEGIC SERIES
NOTES TO FINANCIAL STATEMENTS
Franklin Flexible Alpha Bond Fund (continued)
4. Expense Offset Arrangement
The Fund has entered into an arrangement with its custodian whereby credits realized as a result of uninvested cash balances are used to reduce a portion of the Fund’s custodian expenses. During the year ended April 30, 2017, the custodian fees were reduced as noted in the the Statement of Operations.
5. Income Taxes
For tax purposes, capital losses may be carried over to offset future capital gains, if any.
At April 30, 2017, the capital loss carryforwards were as follows:
Capital loss carryforwards: | ||||
Short term | $ | 124,272 | ||
Long term | 31,677 | |||
|
| |||
Total capital loss carryforwards |
$ |
155,949 |
| |
|
|
During the year ended April 30, 2017, the Fund utilized $20,029 of capital loss carryforwards.
The tax character of distributions paid during the years ended April 30, 2017 and 2016, was as follows:
| 2017 | 2016 | |||||||
Distributions paid from ordinary income |
$ |
240,341 |
| $ | 101,681 | |||
At April 30, 2017, the cost of investments, net unrealized appreciation (depreciation) and undistributed ordinary income for income tax purposes were as follows:
Cost of investments | $ | 10,797,787 | ||
|
| |||
Unrealized appreciation |
$ |
148,068 |
| |
Unrealized depreciation | (65,221 | ) | ||
|
| |||
Net unrealized appreciation (depreciation) |
$ |
82,847 |
| |
|
| |||
Distributable earnings - undistributed ordinary income |
$ |
4,212 |
| |
|
|
Differences between income and/or capital gains as determined on a book basis and a tax basis are primarily due to differing treatments of foreign currency transactions, bond discounts and premiums and financial futures transactions.
6. Investment Transactions
Purchases and sales of investments (excluding short term securities) for the year ended April 30, 2017, aggregated $10,030,852 and $8,520,014, respectively.
38 | Annual Report | franklintempleton.com | ||
FRANKLIN STRATEGIC SERIES
NOTES TO FINANCIAL STATEMENTS
Franklin Flexible Alpha Bond Fund (continued)
Transactions in options written during the year ended April 30, 2017, were as follows:
| Options | ||||||||
Notional
| Premiums
| |||||||
Options outstanding at April 30, 2016 | $ | 1,470,000 | $ | 9,744 | ||||
Options written | 3,450,000 | 13,161 | ||||||
Options expired | (2,720,000 | ) | (11,352 | ) | ||||
Options exercised | — | — | ||||||
Options closed | (1,900,000 | ) | (10,596 | ) | ||||
Options outstanding at April 30, 2017 |
$ |
300,000 |
| $ | 957 | |||
See Notes 1(c) and 8 regarding derivative financial instruments and other derivative information, respectively.
7. Credit Risk
At April 30, 2017, the Fund had 17.7% of its portfolio invested in high yield or other securities rated below investment grade and unrated securities, if any. These securities may be more sensitive to economic conditions causing greater price volatility and are potentially subject to a greater risk of loss due to default than higher rated securities.
8. Other Derivative Information
At April 30, 2017, the Fund’s investments in derivative contracts are reflected in the Statement of Assets and Liabilities as follows:
| Asset Derivatives | Liability Derivatives | |||||||||||
Derivative Contracts Not Accounted for as Hedging Instruments
| Statement of Assets and Liabilities Location
| Fair Value
| Statement of Assets and Liabilities Location
| Fair Value
| ||||||||
Interest rate contracts | Investments in securities, at value | $ | 3,429 | a | ||||||||
Variation margin | 7,996 | b | Variation margin | $ | 14,277 | b | ||||||
Unrealized depreciation on OTC swap contracts | 2,621 | |||||||||||
Foreign exchange contracts | Investments in securities, at value | 207 | a | |||||||||
Unrealized appreciation on OTC | 22,638 | Unrealized depreciation on OTC | 19,200 | |||||||||
forward exchange contracts | forward exchange contracts | |||||||||||
Credit contracts | Investments in securities, at value | 4,301 | a | |||||||||
Variation margin | 614 | b | ||||||||||
OTC swap contracts (premium paid) | 6,416 | OTC swap contracts (premium received) | 69,059 | |||||||||
Unrealized appreciation on OTC swap contracts | 5,093 | Unrealized depreciation on OTC swap contracts | 32,969 | |||||||||
|
|
|
| |||||||||
Totals | $ | 50,080 | $ | 138,740 | ||||||||
|
|
|
| |||||||||
aPurchased option contracts are included in investments in securities, at value in the Statement of Assets and Liabilities.
bThis amount reflects the cumulative appreciation (depreciation) of futures contracts and centrally cleared swap contracts as reported in the Statement of Investments. Only the variation margin receivable/payable at year end is separately reported within the Statement of Assets and Liabilities. Prior variation margin movements were recorded to cash upon receipt or payment.
franklintempleton.com | Annual Report | 39 | ||
FRANKLIN STRATEGIC SERIES
NOTES TO FINANCIAL STATEMENTS
Franklin Flexible Alpha Bond Fund (continued)
8. Other Derivative Information (continued)
For the year ended April 30, 2017, the effect of derivative contracts in the Fund’s Statement of Operations was as follows:
Derivative Contracts Not Accounted for as Hedging Instruments
| Statement of Operations Locations
| Net Realized
| Statement of Operations Locations
| Net Change
| ||||||||
Net realized gain (loss) from: | Net change in unrealized | |||||||||||
| appreciation (depreciation) on: | ||||||||||||
Interest rate contracts | Investments | $ 21,316 | a | Investments | $(10,765 | )a | ||||||
| Written options | 1,211 | Written options | 257 | |||||||||
| Futures contracts | (22,375 | ) | Futures contracts | 12,608 | ||||||||
| Swap contracts | 30,692 | Swap contracts | 4,544 | |||||||||
Foreign exchange contracts | Investments | (6,375 | )a | Investments | 5,057 | a | ||||||
| Written options | 2,609 | Written options | (2,560 | ) | ||||||||
| Foreign currency transactions | (15,333 | )b | Translation of other assets and liabilities denominated in foreign currencies | 39,335 | b | |||||||
Credit contracts | Investments | (38,707 | )a | Investments | 3,424 | a | ||||||
| Written options | 13,613 | Written options | (2,236 | ) | ||||||||
| Swap contracts | (26,335 | ) | Swap contracts | (17,098 | ) | |||||||
Totals | $(39,684 | ) | $ 32,566 | |||||||||
aPurchased option contracts are included in net realized gain (loss) from investments and net change in unrealized appreciation (depreciation) on investments in the Statements of Operations.
bForward exchange contracts are included in net realized gain (loss) from foreign currency transactions and net change in unrealized appreciation (depreciation) on translation of other assets and liabilities denominated in foreign currencies in the Statement of Operations.
For the year ended April 30, 2017, the average month end fair value of derivatives represented 1.0% of average month end net assets. The average month end number of open derivatives contracts for the year was 81.
At April 30, 2017, the Fund’s OTC derivative assets and liabilities are as follows:
Gross and Net Amounts of Assets and Liabilities Presented | ||||||||
Assetsa
| Liabilitiesa
| |||||||
Derivatives | ||||||||
Forward exchange contracts | $22,638 | $ 19,200 | ||||||
Options purchased | 6,423 | — | ||||||
Swap contracts | 11,509 | 104,649 | ||||||
Total |
|
$40,570 |
| $123,849 | ||||
aAbsent an event of default or early termination, OTC derivative assets and liabilities are presented gross and not offset in the Statement of Assets and Liabilities.
40 | Annual Report | franklintempleton.com | ||
FRANKLIN STRATEGIC SERIES
NOTES TO FINANCIAL STATEMENTS
Franklin Flexible Alpha Bond Fund (continued)
At April 30, 2017, the Fund’s OTC derivative assets, which may be offset against the Fund’s OTC derivative liabilities and collateral received from the counterparty, are as follows:
| Amounts Not Offset in the | ||||||||||||||||||||
| Statement of Assets and Liabilities | ||||||||||||||||||||
Gross Amounts of Assets Presented in
| Financial
| Financial
| Cash
| Net Amount
| ||||||||||||||||
Counterparty | ||||||||||||||||||||
BOFA | $ 207 | $ — | $ — | $ — | $ 207 | |||||||||||||||
CITI | 5,242 | (5,242 | ) | — | — | — | ||||||||||||||
GSCO | 2,223 | (2,223 | ) | — | — | — | ||||||||||||||
HSBK | 1,909 | — | — | — | 1,909 | |||||||||||||||
JPHQ | 15,583 | (15,583 | ) | — | — | — | ||||||||||||||
RBS | 12,684 | (3,118 | ) | — | — | 9,566 | ||||||||||||||
UBSW | 2,722 | (2,722 | ) | — | — | — | ||||||||||||||
Total |
|
$40,570 |
| $(28,888 | ) | $ — | $ — | $11,682 | ||||||||||||
At April 30, 2017, the Fund’s OTC derivative liabilities, which may be offset against the Fund’s OTC derivative assets and collateral pledged to the counterparty, are as follows:
| Amounts Not Offset in the | ||||||||||||||||||||
| Statement of Assets and Liabilities | ||||||||||||||||||||
Gross Amounts of Liabilities Presented in | Financial Instruments Available for Offset | Financial Instruments Collateral Pledged | Cash Collateral Pledged | Net Amount (Not less than zero) | ||||||||||||||||
Counterparty | ||||||||||||||||||||
BZWS | $ 53,427 | $ — | $ — | $ — | $53,427 | |||||||||||||||
CITI | 8,185 | (5,242 | ) | — | — | 2,943 | ||||||||||||||
GSCO | 13,941 | (2,223 | ) | — | — | 11,718 | ||||||||||||||
JPHQ | 36,509 | (15,583 | ) | — | — | 20,926 | ||||||||||||||
RBS | 3,118 | (3,118 | ) | — | — | — | ||||||||||||||
UBSW | 8,669 | (2,722 | ) | — | — | 5,947 | ||||||||||||||
Total |
|
$123,849 |
| $(28,888 | ) | $ — | $ — | $94,961 | ||||||||||||
See Notes 1(c) and 6 regarding derivative financial instruments and investment transactions, respectively.
See Abbreviations on page 44.
9. Credit Facility
The Fund, together with other U.S. registered and foreign investment funds (collectively, Borrowers), managed by Franklin Templeton Investments, are borrowers in a joint syndicated senior unsecured credit facility totaling $2 billion (Global Credit Facility) which matures on February 9, 2018. This Global Credit Facility provides a source of funds to the Borrowers for temporary and emergency purposes, including the ability to meet future unanticipated or unusually large redemption requests.
franklintempleton.com | Annual Report | 41 | ||
FRANKLIN STRATEGIC SERIES
NOTES TO FINANCIAL STATEMENTS
Franklin Flexible Alpha Bond Fund (continued)
9. Credit Facility (continued)
Under the terms of the Global Credit Facility, the Fund shall, in addition to interest charged on any borrowings made by the Fund and other costs incurred by the Fund, pay its share of fees and expenses incurred in connection with the implementation and maintenance of the Global Credit Facility, based upon its relative share of the aggregate net assets of all of the Borrowers, including an annual commitment fee of 0.15% based upon the unused portion of the Global Credit Facility. These fees are reflected in other expenses in the Statement of Operations. During the year ended April 30, 2017, the Fund did not use the Global Credit Facility.
10. Fair Value Measurements
The Fund follows a fair value hierarchy that distinguishes between market data obtained from independent sources (observable inputs) and the Fund’s own market assumptions (unobservable inputs). These inputs are used in determining the value of the Fund’s financial instruments and are summarized in the following fair value hierarchy:
| • | Level 1 – quoted prices in active markets for identical financial instruments |
| • | Level 2 – other significant observable inputs (including quoted prices for similar financial instruments, interest rates, prepayment speed, credit risk, etc.) |
| • | Level 3 – significant unobservable inputs (including the Fund’s own assumptions in determining the fair value of financial instruments) |
The input levels are not necessarily an indication of the risk or liquidity associated with financial instruments at that level.
For movements between the levels within the fair value hierarchy, the Fund has adopted a policy of recognizing the transfers as of the date of the underlying event which caused the movement.
42 | Annual Report | franklintempleton.com | ||
FRANKLIN STRATEGIC SERIES
NOTES TO FINANCIAL STATEMENTS
Franklin Flexible Alpha Bond Fund (continued)
A summary of inputs used as of April 30, 2017, in valuing the Fund’s assets and liabilities carried at fair value, is as follows:
| Level 1 | Level 2 | Level 3 | Total | |||||||||||||
Assets: | ||||||||||||||||
Investments in Securities: | ||||||||||||||||
Management Investment Companies | $ | 192,409 | $ | — | $ | — | $ | 192,409 | ||||||||
Corporate Bonds | — | 4,221,935 | — | 4,221,935 | ||||||||||||
Foreign Government and Agency Securities | — | 343,438 | — | 343,438 | ||||||||||||
U.S. Government and Agency Securities | — | 585,076 | — | 585,076 | ||||||||||||
Asset-Backed Securities and Commercial | ||||||||||||||||
Mortgage-Backed Securities | — | 3,626,718 | — | 3,626,718 | ||||||||||||
Municipal Bonds | — | 597,940 | — | 597,940 | ||||||||||||
Options Purchased | 1,514 | 6,423 | — | 7,937 | ||||||||||||
Short Term Investments | 1,305,181 | — | — | 1,305,181 | ||||||||||||
Total Investments in Securities |
$ |
1,499,104 |
| $ | 9,381,530 | $ | — | $ | 10,880,634 | |||||||
Other Financial Instruments: | ||||||||||||||||
Futures Contracts | $ | 7,996 | $ | — | $ | — | $ | 7,996 | ||||||||
Forward Exchange Contracts | — | 22,638 | — | 22,638 | ||||||||||||
Swap Contracts | — | 5,093 | — | 5,093 | ||||||||||||
Total Other Financial Instruments |
$ |
7,996 |
| $ | 27,731 | $ | — | $ | 35,727 | |||||||
Liabilities: | ||||||||||||||||
Other Financial Instruments: | ||||||||||||||||
Options Written | $ | — | $ | — | a | $ | — | $ | — | |||||||
Futures Contracts | 14,277 | — | — | 14,277 | ||||||||||||
Forward Exchange Contracts | — | 19,200 | — | 19,200 | ||||||||||||
Swap Contracts | — | 36,204 | — | 36,204 | ||||||||||||
Total Other Financial Instruments |
$ |
14,277 |
| $ | 55,404 | $ | — | $ | 69,681 | |||||||
aIncludes securities determined to have no value at April 30, 2017.
11. New Accounting Pronouncements
In March 2017, the Financial Accounting Standards Board (FASB) issued Accounting Standards Update (ASU) No. 2017-08, Receivables—Nonrefundable Fees and Other Costs (Subtopic 310-20): Premium Amortization on Purchased Callable Debt Securities. The amendments in the ASU shorten the amortization period for certain callable debt securities, held at a premium, to be amortized to the earliest call date. The ASU does not require an accounting change for securities held at a discount; which continues to be amortized to maturity. The ASU is effective for fiscal years and interim periods within those fiscal years beginning after December 15, 2018. Management is currently evaluating the impact, if any, of applying this provision.
12. Investment Company Reporting Modernization
In October 2016, the U.S. Securities and Exchange Commission adopted new rules and amended existing rules (together, final rules) intended to modernize the reporting and disclosure of information by registered investment companies. In part, the final rules amend Regulation S-X and require standardized, enhanced disclosures about derivatives in investment company financial statements, as well as other amendments. The compliance date for the amendments to Regulation S-X is August 1, 2017. Management is currently evaluating the impact that the adoption of the amendments to Regulation S-X will have on the Fund’s financial statements and related disclosures.
franklintempleton.com | Annual Report | 43 | ||
FRANKLIN STRATEGIC SERIES
NOTES TO FINANCIAL STATEMENTS
Franklin Flexible Alpha Bond Fund (continued)
13. Subsequent Events
The Fund has evaluated subsequent events through the issuance of the financial statements and determined that no events have occurred that require disclosure.
Abbreviations
| Counterparty/Exchange | Currency | Selected Portfolio | ||||||||
BOFA | Bank of America, N.A. | EUR | Euro | BBA | British Bankers Association | |||||
BZWS | Barclays Bank PLC | GBP | British Pound | CDA | Community Development Authority/Agency | |||||
CITI | Citigroup, Inc. | IDR | Indonesian Rupiah | CDO | Collateralized Debt Obligation | |||||
EUX | Eurex | JPY | Japanese Yen | CLO | Collateralized Loan Obligation | |||||
GSCO | Goldman Sachs Group, Inc. | USD | United States Dollar | ETF | Exchange Traded Fund | |||||
HSBK | HSBC Bank PLC | FHLMC | Federal Home Loan Mortgage Corp | |||||||
ICE | Intercontinental Exchange | FNMA | Federal National Mortgage Association | |||||||
JPHQ | JP Morgan Chase & Co. | FRN | Floating Rate Note | |||||||
RBS | Royal Bank of Scotland PLC | GO | General Obligation | |||||||
UBSW | UBS AG | IO | Interest Only | |||||||
LIBOR | London InterBank Offered Rate | |||||||||
MFM | Multi-Family Mortgage | |||||||||
PCR | Pollution Control Revenue | |||||||||
SFR | Single Family Revenue | |||||||||
Index Abbreviations
| ||
CDX.NA.HY.Series number | CDX North America High Yield Index | |
CDX.NA.IG.Series number | CDX North America Investment Grade Index |
44 | Annual Report | franklintempleton.com | ||
FRANKLIN STRATEGIC SERIES
Report of Independent Registered Public Accounting Firm
To the Board of Trustees of Franklin Strategic Series and Shareholders of the Franklin Flexible Alpha Bond Fund:
In our opinion, the accompanying statement of assets and liabilities, including the statement of investments, and the related statements of operations and of changes in net assets and the financial highlights present fairly, in all material respects, the financial position of the Franklin Flexible Alpha Bond Fund (the “Fund”) as of April 30, 2017, the results of its operations, the changes in its net assets and the financial highlights for each of the periods indicated, in conformity with accounting principles generally accepted in the United States of America. These financial statements and financial highlights (hereafter referred to as “financial statements”) are the responsibility of the Fund’s management. Our responsibility is to express an opinion on these financial statements based on our audits. We conducted our audits of these financial statements in accordance with the standards of the Public Company Accounting Oversight Board (United States). Those standards require that we plan and perform the audit to obtain reasonable assurance about whether the financial statements are free of material misstatement. An audit includes examining, on a test basis, evidence supporting the amounts and disclosures in the financial statements, assessing the accounting principles used and significant estimates made by management, and evaluating the overall financial statement presentation. We believe that our audit, which included confirmation of securities as of April 30, 2017 by correspondence with the custodian, transfer agent and brokers, provide a reasonable basis for our opinion.
| PricewaterhouseCoopers LLP |
| San Francisco, California |
| June 20, 2017 |
franklintempleton.com | Annual Report | 45 | ||
Under Section 871(k)(1)(C) of the Internal Revenue Code (Code), the Fund hereby reports the maximum amount allowable but no less than $191,386 as interest related dividends for purposes of the tax imposed under Section 871(a)(1)(A) of the Code for the fiscal year ended April 30, 2017.
46 | Annual Report | franklintempleton.com | ||
The name, year of birth and address of the officers and board members, as well as their affiliations, positions held with the Fund, principal occupations during at least the past five years and number of U.S. registered portfolios overseen in the Franklin Templeton Investments fund complex, are shown below. Generally, each board member serves until that person’s successor is elected and qualified.
Independent Board Members
Name, Year of Birth and Address
| Position
| Length of Time Served
| Number of Portfolios in
| Other Directorships Held
| ||||
| Harris J. Ashton (1932) | Trustee | Since 1991 | 142 | Bar-S Foods (meat packing company) | ||||
| One Franklin Parkway | (1981-2010). | |||||||
| San Mateo, CA 94403-1906 | ||||||||
| Principal Occupation During at Least the Past 5 Years: | ||||||||
| Director of various companies; and formerly, Director, RBC Holdings, Inc. (bank holding company) (until 2002); and President, Chief Executive | ||||||||
Officer and Chairman of the Board, General Host Corporation (nursery and craft centers) (until 1998).
| ||||||||
Mary C. Choksi (1950) One Franklin Parkway San Mateo, CA 94403-1906 | Trustee | Since 2014 | 136 | Avis Budget Group Inc. (car rental) (2007-present), Omnicom Group Inc. (advertising and marketing communications services) (2011-present) and H.J. Heinz Company (processed foods and allied products) (1998-2006) | ||||
| Principal Occupation During at Least the Past 5 Years: | ||||||||
Senior Advisor, Strategic Investment Group (investment management group) (2015-present); director of various companies; and formerly, Founding Partner and Senior Managing Director, Strategic Investment Group (1987–2015); Founding Partner and Managing Director, Emerging Markets Management LLC (investment management firm) (1987-2011); and Loan Officer/Senior Loan Officer/Senior Pension Investment Officer, World Bank Group (international financial institution) (1977-1987).
| ||||||||
Edith E. Holiday (1952) One Franklin Parkway San Mateo, CA 94403-1906 | Trustee | Since 1998 | 142 | Hess Corporation (exploration and refining of oil and gas) (1993-present), Canadian National Railway (railroad) (2001-present), White Mountains Insurance Group, Ltd. (holding company) (2004-present), Santander Consumer USA Holdings, Inc. (consumer finance) (2016-present), RTI International Metals, Inc. (manufacture and distribution of titanium) (1999-2015) and H.J. Heinz Company (processed foods and allied products) (1994-2013). | ||||
| Principal Occupation During at Least the Past 5 Years: | ||||||||
Director or Trustee of various companies and trusts; and formerly, Assistant to the President of the United States and Secretary of the Cabinet (1990-1993); General Counsel to the United States Treasury Department (1989-1990); and Counselor to the Secretary and Assistant Secretary for Public Affairs and Public Liaison – United States Treasury Department (1988-1989).
| ||||||||
J. Michael Luttig (1954) One Franklin Parkway San Mateo, CA 94403-1906 | Trustee | Since 2009 | 142 | Boeing Capital Corporation (aircraft financing) (2006-2013). | ||||
| Principal Occupation During at Least the Past 5 Years: | ||||||||
Executive Vice President, General Counsel and member of the Executive Council, The Boeing Company (aerospace company)(2006-present);and formerly, Federal Appeals Court Judge, U.S. Court of Appeals for the Fourth Circuit (1991-2006).
| ||||||||
franklintempleton.com | Annual Report | 47 | ||
Independent Board Members (continued)
Name, Year of Birth and Address
| Position
| Length of
| Number of Portfolios in
| Other Directorships Held During at Least the Past 5 Years
| ||||
Larry D. Thompson (1945) One Franklin Parkway San Mateo, CA 94403-1906 | Trustee | Since 2007 | 142 | The Southern Company (energy company) (2014-present; previously 2010-2012), Graham Holdings Company (education and media organization) (2011-present) and Cbeyond, Inc. (business communications provider) (2010-2012). | ||||
| Principal Occupation During at Least the Past 5 Years: | ||||||||
Director of various companies; John A. Sibley Professor of Corporate and Business Law, University of Georgia School of Law (2015-present; previously 2011-2012); and formerly, Executive Vice President – Government Affairs, General Counsel and Corporate Secretary, PepsiCo, Inc. (consumer products) (2012-2014); Senior Vice President – Government Affairs, General Counsel and Secretary, PepsiCo, Inc. (2004-2011); Senior Fellow of The Brookings Institution (2003-2004); Visiting Professor, University of Georgia School of Law (2004); and Deputy Attorney General, U.S. Department of Justice (2001-2003).
| ||||||||
John B. Wilson (1959) One Franklin Parkway San Mateo, CA 94403-1906 | Lead Independent Trustee | Trustee since 2006 and Lead Independent Trustee since 2008 | 116 | None | ||||
| Principal Occupation During at Least the Past 5 Years: | ||||||||
President, Staples Europe (office supplies) (2012-present); President and Founder, Hyannis Port Capital, Inc. (real estate and private equity investing); serves on private and non-profit boards; and formerly, Chief Operating Officer and Executive Vice President, Gap, Inc. (retail) (1996-2000); Chief Financial Officer and Executive Vice President – Finance and Strategy, Staples, Inc. (1992-1996); Senior Vice President – Corporate Planning, Northwest Airlines, Inc. (airlines) (1990-1992); and Vice President and Partner, Bain & Company (consulting firm) (1986-1990).
| ||||||||
Interested Board Members and Officers
Name, Year of Birth and Address
| Position
| Length of
| Number of Portfolios in
| Other Directorships Held During at Least the Past 5 Years
| ||||
**Gregory E. Johnson (1961) One Franklin Parkway San Mateo, CA 94403-1906 | Trustee | Since 2013 | 158 | None | ||||
| Principal Occupation During at Least the Past 5 Years: | ||||||||
Chairman of the Board, Member - Office of the Chairman, Director and Chief Executive Officer, Franklin Resources, Inc.; officer and/or director or trustee, as the case may be, of some of the other subsidiaries of Franklin Resources, Inc. and of 44 of the investment companies in Franklin Templeton Investments; Vice Chairman, Investment Company Institute; and formerly, President, Franklin Resources, Inc. (1994-2015).
| ||||||||
**Rupert H. Johnson, Jr. (1940) One Franklin Parkway San Mateo, CA 94403-1906 | Chairman of the Board and Trustee | Chairman of the Board since 2013 and Trustee since 1991 | 142 | None | ||||
| Principal Occupation During at Least the Past 5 Years: | ||||||||
Vice Chairman, Member – Office of the Chairman and Director, Franklin Resources, Inc.; Director, Franklin Advisers, Inc.; Senior Vice President, Franklin Advisory Services, LLC; and officer and/or director or trustee, as the case may be, of some of the other subsidiaries of Franklin Resources, Inc. and of 42 of the investment companies in Franklin Templeton Investments.
| ||||||||
Alison E. Baur (1964) One Franklin Parkway San Mateo, CA 94403-1906 | Vice President | Since 2012 | Not Applicable | Not Applicable | ||||
| Principal Occupation During at Least the Past 5 Years: | ||||||||
Deputy General Counsel, Franklin Templeton Investments; and officer of some of the other subsidiaries of Franklin Resources, Inc. and of 45 of the investment companies in Franklin Templeton Investments.
| ||||||||
48 | Annual Report | franklintempleton.com | ||
Interested Board Members and Officers (continued)
Name, Year of Birth and Address
| Position
| Length of
| Number of Portfolios in
| Other Directorships Held During at Least the Past 5 Years
| ||||
Laura F. Fergerson (1962) One Franklin Parkway San Mateo, CA 94403-1906 | Chief Executive Officer – Finance and Administration | Since 2009 | Not Applicable | Not Applicable | ||||
| Principal Occupation During at Least the Past 5 Years: | ||||||||
Senior Vice President, Franklin Templeton Services, LLC; Vice President, Franklin Advisers, Inc. and Franklin Templeton Institutional, LLC; and officer of 45 of the investment companies in Franklin Templeton Investments.
| ||||||||
Gaston Gardey (1967) One Franklin Parkway San Mateo, CA 94403-1906 | Treasurer, Chief Financial Officer and Chief Accounting Officer | Since 2009 | Not Applicable | Not Applicable | ||||
| Principal Occupation During at Least the Past 5 Years: | ||||||||
Treasurer, U.S. Fund Administration & Reporting, Franklin Templeton Investments; and officer of 27 of the investment companies in Franklin Templeton Investments.
| ||||||||
Aliya S. Gordon (1973) One Franklin Parkway San Mateo, CA 94403-1906 | Vice President | Since 2009 | Not Applicable | Not Applicable | ||||
| Principal Occupation During at Least the Past 5 Years: | ||||||||
Senior Associate General Counsel, Franklin Templeton Investments; and officer of 45 of the investment companies in Franklin Templeton Investments.
| ||||||||
Steven J. Gray (1955) One Franklin Parkway San Mateo, CA 94403-1906 | Vice President | Since 2009 | Not Applicable | Not Applicable | ||||
| Principal Occupation During at Least the Past 5 Years: | ||||||||
Senior Associate General Counsel, Franklin Templeton Investments; Vice President, Franklin Templeton Distributors, Inc.; and officer of 45 of the investment companies in Franklin Templeton Investments.
| ||||||||
Edward B. Jamieson (1948) One Franklin Parkway San Mateo, CA 94403-1906 | President and Chief Executive Officer – Investment Management | Since 2010 | Not Applicable | Not Applicable | ||||
| Principal Occupation During at Least the Past 5 Years: | ||||||||
President and Director, Franklin Advisers, Inc.; Executive Vice President, Franklin Templeton Institutional, LLC; and officer and/or trustee, as the case may be, of some of the other subsidiaries of Franklin Resources, Inc. and of 10 of the investment companies in Franklin Templeton Investments.
| ||||||||
Robert Lim (1948) One Franklin Parkway San Mateo, CA 94403-1906 | Vice President – AML Compliance | Since 2016 | Not Applicable | Not Applicable | ||||
| Principal Occupation During at Least the Past 5 Years: | ||||||||
Vice President, Franklin Templeton Companies, LLC; Chief Compliance Officer, Franklin Templeton Distributors, Inc. and Franklin Templeton Investor Services, LLC; and officer of 45 of the investment companies in Franklin Templeton Investments.
| ||||||||
Christopher J. Molumphy (1962) One Franklin Parkway San Mateo, CA 94403-1906 | Vice President | Since 2000 | Not Applicable | Not Applicable | ||||
| Principal Occupation During at Least the Past 5 Years: | ||||||||
Director and Executive Vice President, Franklin Advisers, Inc.; Executive Vice President, Franklin Templeton Institutional, LLC; and officer of some of the other subsidiaries of Franklin Resources, Inc. and of 22 of the investment companies in Franklin Templeton Investments.
| ||||||||
franklintempleton.com | Annual Report | 49 | ||
Interested Board Members and Officers (continued)
Name, Year of Birth and Address
| Position
| Length of
| Number of Portfolios in
| Other Directorships Held During at Least the Past 5 Years
| ||||
Kimberly H. Novotny (1972) 300 S.E. 2nd Street Fort Lauderdale, FL 33301-1923 | Vice President | Since 2013 | Not Applicable | Not Applicable | ||||
| Principal Occupation During at Least the Past 5 Years: | ||||||||
Associate General Counsel, Franklin Templeton Investments; Vice President and Corporate Secretary, Fiduciary Trust International of the South; Vice President, Templeton Investment Counsel, LLC; Assistant Secretary, Franklin Resources, Inc.; and officer of 45 of the investment companies in Franklin Templeton Investments.
| ||||||||
Robert C. Rosselot (1960) 300 S.E. 2nd Street Fort Lauderdale, FL 33301-1923 | Chief Compliance Officer | Since 2013 | Not Applicable | Not Applicable | ||||
| Principal Occupation During at Least the Past 5 Years: | ||||||||
Director, Global Compliance, Franklin Templeton Investments; Vice President, Franklin Templeton Companies, LLC; officer of 45 of the investment companies in Franklin Templeton Investments; and formerly, Senior Associate General Counsel, Franklin Templeton Investments (2007-2013); and Secretary and Vice President, Templeton Group of Funds (2004-2013).
| ||||||||
Karen L. Skidmore (1952) One Franklin Parkway San Mateo, CA 94403-1906 | Vice President and Secretary | Since 2006 | Not Applicable | Not Applicable | ||||
| Principal Occupation During at Least the Past 5 Years: | ||||||||
Senior Associate General Counsel, Franklin Templeton Investments; and officer of 45 of the investment companies in Franklin Templeton Investments.
| ||||||||
Navid J. Tofigh (1972) One Franklin Parkway San Mateo, CA 94403-1906 | Vice President | Since 2015 | Not Applicable | Not Applicable | ||||
| Principal Occupation During at Least the Past 5 Years: | ||||||||
Associate General Counsel, Franklin Templeton Investments; and officer of 45 of the investment companies in Franklin Templeton Investments.
| ||||||||
Craig S. Tyle (1960) One Franklin Parkway San Mateo, CA 94403-1906 | Vice President | Since 2005 | Not Applicable | Not Applicable | ||||
| Principal Occupation During at Least the Past 5 Years: | ||||||||
General Counsel and Executive Vice President, Franklin Resources, Inc.; and officer of some of the other subsidiaries of Franklin Resources, Inc. and of 45 of the investment companies in Franklin Templeton Investments.
| ||||||||
Lori A. Weber (1964) 300 S.E. 2nd Street Fort Lauderdale, FL 33301-1923 | Vice President | Since 2011 | Not Applicable | Not Applicable | ||||
| Principal Occupation During at Least the Past 5 Years: | ||||||||
Senior Associate General Counsel, Franklin Templeton Investments; Assistant Secretary, Franklin Resources, Inc.; Vice President and Secretary, Templeton Investment Counsel, LLC; and officer of 45 of the investment companies in Franklin Templeton Investments.
| ||||||||
*We base the number of portfolios on each separate series of the U.S. registered investment companies within the Franklin Templeton Investments fund complex. These portfolios have a common investment manager or affiliated investment managers.
**Gregory E. Johnson is considered to be an interested person of the Fund under the federal securities laws due to his position as an officer and director of Franklin Resources, Inc. (Resources), which is the parent company of the Fund’s investment manager and distributor. Rupert H. Johnson, Jr. is considered to be an interested person of the Fund under the federal securities laws due to his position as officer and director and major shareholder of Resources.
Note 1: Rupert H. Johnson, Jr. is the uncle of Gregory E. Johnson.
Note 2: Officer information is current as of the date of this report. It is possible that after this date, information about officers may change.
Note 3: Effective November 1, 2016, Frank Olson ceased to be a trustee of the trust.
The Sarbanes-Oxley Act of 2002 and Rules adopted by the Securities and Exchange Commission require the Fund to disclose whether the Fund’s Audit Committee includes at least one member who is an audit committee financial expert within the meaning of such Act and Rules. The Fund’s Board has determined that there is at least one such financial expert on the Audit Committee and has designated John B. Wilson as its audit committee financial expert. The Board believes that Mr. Wilson qualifies as such an expert in view of his extensive business background and experience, including service as chief financial officer of Staples, Inc. from 1992 to 1996. Mr. Wilson has been a Member and Chairman of the Fund’s Audit Committee since 2006. As a result of such background and
50 | Annual Report | franklintempleton.com | ||
Interested Board Members and Officers (continued)
experience, the Board believes that Mr. Wilson has acquired an understanding of generally accepted accounting principles and financial statements, the general application of such principles in connection with the accounting estimates, accruals and reserves, and analyzing and evaluating financial statements that present a breadth and level of complexity of accounting issues generally comparable to those of the Fund, as well as an understanding of internal controls and procedures for financial reporting and an understanding of audit committee functions. Mr. Wilson is an independent Board member as that term is defined under the relevant Securities and Exchange Commission Rules and Releases.
The Statement of Additional Information (SAI) includes additional information about the board members and is available, without charge, upon request. Shareholders may call (800) DIAL BEN/342-5236 to request the SAI.
franklintempleton.com | Annual Report | 51 | ||
FRANKLIN STRATEGIC SERIES
FRANKLIN FLEXIBLE ALPHA BOND FUND
Board Approval of Investment Management Agreements
FRANKLIN STRATEGIC SERIES
Franklin Flexible Alpha Bond Fund (Fund)
At an in-person meeting held on April 18, 2017 (Meeting), the Board of Trustees (Board) of Franklin Strategic Series, including a majority of the trustees who are not “interested persons” as defined in the Investment Company Act of 1940 (Independent Trustees), reviewed and approved the continuance of the investment management agreement between Franklin Advisers, Inc. (FAI) and the Fund and the investment sub-advisory agreement between FAI and Franklin Templeton Institutional, LLC (Sub-Adviser), an affiliate of FAI, on behalf of the Fund (each a Management Agreement) for an additional one-year period. The Independent Trustees received advice from and met separately with Independent Trustee counsel in considering whether to approve the continuation of each Management Agreement. FAI and the Sub-Adviser are each referred to herein as a Manager.
In considering the continuation of each Management Agreement, the Board reviewed and considered information provided by each Manager at the Meeting and throughout the year at meetings of the Board and its committees. The Board also reviewed and considered information provided in response to a detailed set of requests for information submitted to each Manager by Independent Trustee counsel on behalf of the Independent Trustees in connection with the annual contract renewal process. In addition, prior to the Meeting, the Independent Trustees held a telephonic contract renewal meeting at which the Independent Trustees conferred amongst themselves and Independent Trustee counsel about contract renewal matters. The Board reviewed and considered all of the factors it deemed relevant in approving the continuance of each Management Agreement, including, but not limited to: (i) the nature, extent, and quality of the services provided by each Manager; (ii) the investment performance of the Fund; (iii) the costs of the services provided and profits realized by each Manager and its affiliates from the relationship with the Fund; (iv) the extent to which economies of scale are realized as the Fund grows; and (v) whether fee levels reflect these economies of scale for the benefit of Fund investors.
In approving the continuance of each Management Agreement, the Board, including a majority of the Independent Trustees, determined that the existing management fees are fair and reasonable and that the continuance of such Management
Agreement is in the interests of the Fund and its shareholders. While attention was given to all information furnished, the following discusses some primary factors relevant to the Board’s determination.
Nature, Extent and Quality of Services
The Board reviewed and considered information regarding the nature, extent and quality of investment management services provided by each Manager and its affiliates to the Fund and its shareholders. This information included, among other things, the qualifications, background and experience of the senior management and investment personnel of each Manager; the structure of investment personnel compensation; oversight of third-party service providers; investment performance reports and related financial information for the Fund; reports on expenses, shareholder services, marketing support payments made to financial intermediaries and third party servicing arrangements; legal and compliance matters; risk controls; pricing and other services provided by each Manager and its affiliates; and management fees charged by each Manager and its affiliates to U.S. funds and other accounts, including management’s explanation of differences among accounts where relevant. The Board noted management’s continual efforts and expenditures in establishing effective business continuity plans and developing strategies to address areas of heightened concern in the mutual fund industry, such as cybersecurity, derivatives and liquidity risk management.
The Board also reviewed and considered the benefits provided to Fund shareholders of investing in a fund that is part of the Franklin Templeton family of funds. The Board noted the financial position of Franklin Resources, Inc. (FRI), the Managers’ parent, and its commitment to the mutual fund business as evidenced by its continued introduction of new funds, reassessment of the fund offerings in response to the market environment and project initiatives and capital investments relating to the services provided to the Fund by the Franklin Templeton Investments (FTI) organization.
Following consideration of such information, the Board was satisfied with the nature, extent and quality of services provided by each Manager and its affiliates to the Fund and its shareholders.
Fund Performance
The Board reviewed and considered the performance results of the Fund over various time periods ended January 31, 2017. The Board considered the performance returns for the Fund in comparison to the performance returns of mutual funds deemed comparable to the Fund included in a universe (Performance
52 | Annual Report | franklintempleton.com | ||
FRANKLIN STRATEGIC SERIES
FRANKLIN FLEXIBLE ALPHA BOND FUND
SHAREHOLDER INFORMATION
Universe) selected by Broadridge Financial Solutions, Inc. (Broadridge), an independent provider of investment company data. The Board received a description of the methodology used by Broadridge to select the mutual funds included in a Performance Universe. The Board also reviewed and considered Fund performance reports provided and discussions that occurred with portfolio managers at Board meetings throughout the year. A summary of the Fund’s performance results is below.
The Performance Universe for the Fund included the Fund and all alternative credit focus funds underlying variable insurance products (VIPs). The Fund commenced operations on August 3, 2015, and thus has been in operation for less than two years. The Board noted that the Fund’s annualized income return and annualized total return for the one-year period were below the medians of its Performance Universe. The Board concluded that the Fund’s performance was acceptable given its short period of operation. In doing so, the Board noted that the Fund’s Performance Universe represents diverse risk profiles.
Comparative Fees and Expenses
The Board reviewed and considered information regarding the Fund’s actual total expense ratio and its various components, including, as applicable, management fees; transfer agent expenses; underlying fund expenses; Rule 12b-1 and non-Rule 12b-1 service fees; and other non-management fees. The Board also noted that at its February meeting each year, it receives an annual report on all marketing support payments made by FTI to financial intermediaries. The Board considered the actual total expense ratio and, separately, the contractual management fee rate, without the effect of fee waivers, if any (Management Rate) of the Fund in comparison to the median ratio and median Management Rate, respectively, of other mutual funds deemed comparable to and with a similar expense structure as the Fund selected by Broadridge (Expense Group). Broadridge fee and expense data is based upon information taken from the fund’s most recent annual report, which reflects historical asset levels that may be quite different from those currently existing, particularly in a period of market volatility. While recognizing such inherent limitation and the fact that expense ratios and Management Rates generally increase as assets decline and decrease as assets grow, the Board believed the independent analysis conducted by Broadridge to be an appropriate measure of comparative fees and expenses. The Broadridge Management Rate includes administrative charges, and the actual total expense ratio, for comparative consistency, was shown for Class A shares for funds with multiple classes of shares. The Board received a description of the methodology
used by Broadridge to select the mutual funds included in an Expense Group.
The Expense Group for the Fund included the Fund and 10 other alternative credit focus funds underlying VIPs. The Board noted that the Management Rate and actual total expense ratio for the Fund were below the medians of its Expense Group. The Board concluded that the Management Rate charged to the Fund is fair and reasonable. In doing so, the Board noted that the Fund’s actual total expense ratio reflected a fee waiver from management and that the Sub-Adviser was paid by FAI out of the management fee FAI received from the Fund.
Profitability
The Board reviewed and considered information regarding the profits realized by each Manager and its affiliates in connection with the operation of the Fund. In this respect, the Board considered the Fund profitability analysis provided by each Manager that addresses the overall profitability of FTI’s U.S. fund business, as well as its profits in providing investment management and other services to each of the individual funds during the 12-month period ended September 30, 2016, being the most recent fiscal year-end for FRI. The Board noted that although management continually makes refinements to its methodologies used in calculating profitability in response to organizational and product related changes, the overall methodology has remained consistent with that used in the Fund’s profitability report presentations from prior years. Additionally, the Fund’s independent registered public accounting firm has been engaged by each Manager to periodically review the reasonableness of the allocation methodologies to be used solely by the Fund’s Board with respect to the profitability analysis.
The Board noted management’s belief that costs incurred in establishing the infrastructure necessary for the type of mutual fund operations conducted by each Manager and its affiliates may not be fully reflected in the expenses allocated to the Fund in determining its profitability, as well as the fact that the level of profits, to a certain extent, reflected operational cost savings and efficiencies initiated by management. The Board also noted management’s expenditures in improving shareholder services provided to the Fund, as well as the need to implement systems and meet additional regulatory and compliance requirements resulting from recent SEC and other regulatory requirements.
The Board also considered the extent to which each Manager and its affiliates might derive ancillary benefits from fund operations, including revenues generated from transfer agent services, potential benefits resulting from personnel and
franklintempleton.com | Annual Report | 53 | ||
FRANKLIN STRATEGIC SERIES
FRANKLIN FLEXIBLE ALPHA BOND FUND
SHAREHOLDER INFORMATION
systems enhancements necessitated by fund growth, as well as increased leverage with service providers and counterparties. Based upon its consideration of all these factors, the Board concluded that the level of profits realized by each Manager and its affiliates from providing services to the Fund was not excessive in view of the nature, quality and extent of services provided to the Fund.
Economies of Scale
The Board reviewed and considered the extent to which each Manager may realize economies of scale, if any, as the Fund grows larger and whether the Fund’s management fee structure reflects any economies of scale for the benefit of shareholders. With respect to possible economies of scale, the Board noted the existence of management fee breakpoints, which operate generally to share any economies of scale with a Fund’s shareholders by reducing the Fund’s effective management fees as the Fund grows in size. The Board considered each Manager’s view that any analyses of potential economies of scale in managing a particular fund are inherently limited in light of the joint and common costs and investments each Manager incurs across the Franklin Templeton family of funds as a whole. The Board concluded that to the extent economies of scale may be realized by each Manager and its affiliates, the Fund’s management fee structure provided a sharing of benefits with the Fund and its shareholders as the Fund grows.
Conclusion
Based on its review, consideration and evaluation of all factors it believed relevant, including the above-described factors and conclusions, the Board unanimously approved the continuation of each Management Agreement for an additional one-year period.
Proxy Voting Policies and Procedures
The Fund’s investment manager has established Proxy Voting Policies and Procedures (Policies) that the Fund uses to determine how to vote proxies relating to portfolio securities. Shareholders may view the Fund’s complete Policies online at franklintempleton.com. Alternatively, shareholders may request copies of the Policies free of charge by calling the Proxy Group collect at (954) 527-7678 or by sending a written request to: Franklin Templeton Companies, LLC, 300 S.E. 2nd Street, Fort Lauderdale, FL 33301, Attention: Proxy Group. Copies of the Fund’s proxy voting records are also made available online at franklintempleton.com and posted on the U.S. Securities and Exchange Commission’s website at sec.gov and reflect the most recent 12-month period ended June 30.
Quarterly Statement of Investments
The Trust, on behalf of the Fund, files a complete statement of investments with the U.S. Securities and Exchange Commission for the first and third quarters for each fiscal year on Form N-Q. Shareholders may view the filed Form N-Q by visiting the Commission’s website at sec.gov. The filed form may also be viewed and copied at the Commission’s Public Reference Room in Washington, DC. Information regarding the operations of the Public Reference Room may be obtained by calling (800) SEC-0330.
Householding of Reports and Prospectuses
You will receive the Fund’s financial reports every six months as well as an annual updated summary prospectus (prospectus available upon request). To reduce Fund expenses, we try to identify related shareholders in a household and send only one copy of the financial reports and summary prospectus. This process, called “householding,” will continue indefinitely unless you instruct us otherwise. If you prefer not to have these documents householded, please call us at (800) 632-2301. At any time you may view current prospectuses/summary prospectuses and financial reports on our website. If you choose, you may receive these documents through electronic delivery.
54 | Annual Report | franklintempleton.com | ||
This page intentionally left blank.
This page intentionally left blank.
 | Annual Report and Shareholder Letter | |
Franklin Flexible Alpha Bond Fund | ||
Investment Manager | ||
Franklin Advisers, Inc. | ||
Subadvisor | ||
Franklin Templeton Institutional, LLC | ||
Distributor | ||
Franklin Templeton Distributors, Inc. | ||
(800) DIAL BEN® / 342-5236 franklintempleton.com | ||
Shareholder Services | ||
(800) 632-2301 |
Authorized for distribution only when accompanied or preceded by a summary prospectus and/or prospectus. Investors should carefully consider a fund’s investment goals, risks, charges and expenses before investing. A prospectus contains this and other information; please read it carefully before investing.
To help ensure we provide you with quality service, all calls to and from our service areas are monitored and/or recorded.
| © 2017 Franklin Templeton Investments. All rights reserved. | 953 A 06/17 |

Franklin Templeton Investments
Gain From Our Perspective®
At Franklin Templeton Investments, we’re dedicated to one goal: delivering exceptional asset management for our clients. By bringing together multiple, world-class investment teams in a single firm, we’re able to offer specialized expertise across styles and asset classes, all supported by the strength and resources of one of the world’s largest asset managers. This has helped us to become a trusted partner to individual and institutional investors across the globe.
Dear Shareholder:
During the 12 months ended April 30, 2017, mostly upbeat economic data, improved U.S. corporate earnings and supportive monetary policies were positives for the securities markets. After maintaining its target interest rate in the 0.25%–0.50% range for nearly a year, the U.S. Federal Reserve (Fed) increased its target range for the federal funds rate twice, in December 2016 and March 2017, to 0.75%–1.00%, noting improved employment and higher inflation. The 10-year U.S. Treasury yield began the period at 1.83% and ended the period at 2.29%. In this environment, U.S. stocks, as measured by the Standard & Poor’s 500® Index, generated a +17.92% total return for the 12-month period. Investment-grade bonds, as measured by the Bloomberg Barclays U.S. Aggregate Bond Index, posted a +0.83% total return.1
In all economic environments, we are committed to our long-term perspective and disciplined investment approach as we conduct a diligent, fundamental analysis of securities with a regular emphasis on investment risk management.
We believe active, professional investment management serves investors well. We also recognize the important role of financial advisors in today’s markets and encourage investors to continue to seek their advice. Amid changing markets and economic conditions, we are confident investors with a well-diversified portfolio and a patient, long-term outlook should be well positioned for the years ahead.
In addition, Franklin Strategic Income Fund’s annual report includes more detail about prevailing conditions and a discussion about investment decisions during the period. Please remember all securities markets fluctuate, as do mutual fund share prices.
We thank you for investing with Franklin Templeton, welcome your questions and comments, and look forward to serving your future investment needs.
Sincerely,

Edward B. Jamieson
President and Chief Executive Officer – Investment
Management
Franklin Strategic Series
This letter reflects our analysis and opinions as of April 30, 2017, unless otherwise indicated. The information is not a complete analysis of every aspect of any market, country, industry, security or fund. Statements of fact are from sources considered reliable.
1. Source: Morningstar.
See www.franklintempletondatasources.com for additional data provider information.
| Not FDIC Insured | May Lose Value | No Bank Guarantee |
franklintempleton.com | Not part of the annual report | 1 | ||
Visit franklintempleton.com for fund updates, to access your account, or to find helpful financial planning tools.
2 | Annual Report | franklintempleton.com | ||
Franklin Strategic Income Fund
We are pleased to bring you Franklin Strategic Income Fund’s annual report for the fiscal year ended April 30, 2017.
Your Fund’s Goal and Main Investments
The Fund seeks a high level of current income, with capital appreciation over the long term as a secondary objective. The Fund uses an active asset allocation process and under normal market conditions invests at least 65% of its assets in U.S. and foreign debt securities, including those in emerging markets. The Fund may invest in all varieties of fixed and floating rate income securities, including bonds, corporate loans (and loan participations), mortgage-backed securities and other asset-backed securities and convertible securities.
Performance Overview
The Fund’s Class A shares delivered a +7.50% cumulative total return for the 12 months under review. In comparison, the Bloomberg Barclays U.S. Aggregate Bond Index, which represents the U.S. investment-grade fixed rate taxable bond market, generated a +0.83% total return.1 The Lipper Multi-Sector Income Funds Classification Average, which consists of funds chosen by Lipper that seek current income by allocating assets among different fixed income securities sectors, with a significant portion rated below investment grade, produced a +6.42% total return.2 You can find more of the Fund’s performance data in the Performance Summary beginning on page 7.
Performance data represent past performance, which does not guarantee future results. Investment return and principal value will fluctuate, and you may have a gain or loss when you sell your shares. Current performance may differ from figures shown. For most recent month-end performance, go to franklintempleton.com or call (800) 342-5236.
Economic and Market Overview
The U.S. economy expanded during the 12 months under review. The economy strengthened in 2016’s third quarter, but moderated in the next two quarters, largely due to declines in private inventory investment and government spending. The manufacturing sector generally expanded and the services sector also continued to grow. The unemployment rate decreased from 5.0% in April 2016 to 4.4% at period-end.3 Monthly retail sales were volatile, but grew during most of the period. Annual inflation, as measured by the Consumer Price Index, increased from 1.1% to 2.2% during the period.
After maintaining its target interest rate in 0.25%–0.50% range for nearly a year, the U.S. Federal Reserve (Fed), at its December meeting, increased its target range for the federal funds rate to 0.50%–0.75%, as policymakers noted improvement in U.S. labor market and inflation. The Fed kept its interest rate unchanged at its February meeting, but incoming economic data, along with statements by Fed officials in late February and early March, heightened many investors’ expectations for a March interest-rate hike. The Fed, at its March meeting, made the widely anticipated increase in its federal funds target rate to 0.75%–1.00%.
The 10-year Treasury yield, which moves inversely to its price, shifted throughout the period. Treasury yields declined earlier in the period due to negative interest rates in Japan and Europe, central banks’ purchases of government bonds and the U.K.’s historic referendum to leave the European Union in June 2016 (also known as “the Brexit”). Geopolitical tensions in the Middle East and the Korean peninsula pulled the yield further down. However, the yield rose in October due to positive economic data and signals from the Fed about the possibility of an increase in interest rates in the near term. The yield further increased in November and December, amid a bond market sell-off, based on investor expectations that possible expansionary fiscal policies under new U.S. President Donald
1. Source: Morningstar.
2. Source: Lipper, a Thomson Reuters Company. For the 12-month period ended April 30, 2017, this category consisted of 325 funds. Lipper calculations do not include sales charges or expense subsidization by a fund’s manager. Fund performance relative to the average may have differed if these or other factors had been considered. The indexes are unmanaged and include reinvestment of any income or distributions. They do not reflect any fees, expenses or sales charges. One cannot invest directly in an index, and an index is not representative of the Fund’s portfolio.
3. Source: Bureau of Labor Statistics.
See www.franklintempletondatasources.com for additional data provider information.
The dollar value, number of shares or principal amount, and names of all portfolio holdings are listed in the Fund’s Consolidated Statement of Investments (SOI). The Consolidated SOI begins on page 16.
franklintempleton.com | Annual Report | 3 | ||
FRANKLIN STRATEGIC INCOME FUND
Portfolio Composition*
Based on Total Net Assets
| 4/30/17 | 4/30/16 | |||||||
High Yield Corporate Bonds | 28.8% | 28.6% | ||||||
Investment-Grade Corporate Bonds | 17.0% | 10.3% | ||||||
Floating-Rate Loans | 16.6% | 19.6% | ||||||
Mortgage-Backed Securities | 12.8% | 8.5% | ||||||
International Government & Agency Bonds | 8.5% | 14.5% | ||||||
U.S. Treasury Securities | 6.5% | 4.2% | ||||||
Collateral Loan Obiligations | 4.1% | 1.5% | ||||||
Other | 2.5% | 1.4% | ||||||
Asset-Backed Securities | 2.3% | 0.1% | ||||||
Municipal Bonds | 2.1% | 1.1% | ||||||
Commercial Mortgage-Backed Securities | 2.0% | 4.0% | ||||||
Equities | 0.0% | ** | 0.2% | |||||
Short-Term Investments & Other Net Assets | -3.2% | 6.0% | ||||||
*Figures reflect certain derivatives held in the portfolio (or their underlying reference assets) and may not total 100% or may be negative due to rounding, use of any derivatives, unsettled trades or other factors. The compostion may not macth the SOI.
**Rounds to less than 0.1% of total net assets.
Trump could lead to a stronger economy and higher inflation. Overall, the U.S. Treasury yield rose from 1.83% at the beginning of the period to 2.29% at period-end.
Investment Strategy
We use an active asset allocation strategy to try to achieve the Fund’s investment goals. We employ a top-down analysis of macroeconomic trends combined with a bottom-up fundamental analysis of market sectors, industries and issuers to try to take advantage of varying sector reactions to economic events. We regularly enter into various currency-related transactions involving derivative instruments, including currency and cross currency forwards, currency swaps, currency and currency index futures contracts and currency options. We may also enter into interest-rate and credit-related transactions involving derivative instruments, including interest-rate, fixed income total return and credit default swaps and interest rate and/or bond futures contracts.
What is a currency forward contract?
|
A currency forward contract is an agreement between the Fund and a counterparty to buy or sell a foreign currency in exchange for another currency at a specific exchange rate on a future date.
|
Manager’s Discussion
For global fixed income markets, the first half of the 12 months under review were generally characterized by low levels of
What are swap agreements?
|
Swap agreements, such as interest-rate, currency and credit default swaps, are contracts between the Fund and another party (the swap counterparty). In a basic swap transaction, the Fund agrees with the swap counterparty to exchange the returns (or differentials in rates of return) earned or realized on a particular “notional amount” of underlying instruments. The notional amount is the set amount selected by the parties as the basis on which to calculate the obligations that they have agreed to exchange. The parties typically do not actually exchange the notional amount. Instead, they agree to exchange the returns that would be earned or realized if the notional amount were invested in given instruments or at given interest rates.
|
What is a futures contract?
|
A futures contract is an agreement between the Fund and a counterparty made through a U.S. or foreign futures exchange to buy or sell an underlying instrument or asset at a specific price on a future date.
|
What is an option?
|
An option is a contract to buy or sell a specific financial product known as the option’s underlying instrument at a specific price. The buyer of an option has the right, but not the obligation, to buy or sell the underlying instrument at or until a specified expiration date. Conversely, the seller (“writer”) of an option who opens a transaction is obligated to buy or sell the underlying instrument should the option holder exercise that right.
|
volatility and an increase in risk appetite amid low and negative global interest rates. Interest rates fluctuated with rates moving marginally higher on the short end of the U.S. Treasury yield curve and rising on the longer end. Starting in the second half of the period, rising global bond yields accelerated over the rest of 2016, mainly due to Donald Trump’s U.S. presidential victory and speculation about the likelihood of new spending and tax cuts in 2017 to stimulate the U.S. economy. Investors reassessed their outlook on global inflation and interest rates, and upbeat U.S. economic data persuaded the Fed to raise rates twice during the remainder of the period. U.S. Treasury yields stayed relatively stable during the first four months of 2017, although they increased ahead of the Fed’s March rate hike. However, yields fell again after subsequent dovish statements from the Fed and the retraction of President Trump’s health care reform legislation. Outside the U.S., many major economies reduced or kept their interest rates untouched during the period.
4 | Annual Report | franklintempleton.com | ||
FRANKLIN STRATEGIC INCOME FUND
What is duration?
|
Duration is a measure of a bond’s price sensitivity to interest-rate changes. In general, a portfolio of securities with a lower duration can be expected to be less sensitive to interest-rate changes than a portfolio with a higher duration.
|
What is the yield curve?
|
The yield curve is a line that plots the interest rates, at a set point in time, of bonds having equal credit quality but differing maturity dates. The most frequently reported yield curve compares three-month, two-year and 30-year U.S. Treasury debt.
|
In this environment, many global fixed income sectors outpaced U.S. Treasuries on a duration-matched basis. Corporate credit, particularly high yield bonds, were among the strongest performers, as were hard- and local-currency emerging market debt securities.
Distributions*
5/1/16–4/30/17
| Distributions per Share (cents)** | ||||||||||||||||||||
| Month | Class A | Class C | Class R | Class R6 | Advisor Class | |||||||||||||||
May | 2.45 | 2.13 | 2.25 | 2.77 | 2.65 | |||||||||||||||
June | 2.55 | 2.24 | 2.36 | 2.86 | 2.74 | |||||||||||||||
July | 2.26 | 1.95 | 2.06 | 2.59 | 2.46 | |||||||||||||||
August | 1.28 | 0.96 | 1.09 | 1.60 | 1.48 | |||||||||||||||
September | 1.12 | 0.80 | 0.92 | 1.44 | 1.32 | |||||||||||||||
October | 0.91 | 0.61 | 0.72 | 1.22 | 1.10 | |||||||||||||||
November | 0.91 | 0.59 | 0.71 | 1.24 | 1.12 | |||||||||||||||
December | 1.27 | 0.95 | 1.08 | 1.58 | 1.47 | |||||||||||||||
January | 1.10 | 0.78 | 0.91 | 1.42 | 1.30 | |||||||||||||||
February | 1.15 | 0.83 | 0.95 | 1.47 | 1.36 | |||||||||||||||
March | 1.15 | 0.82 | 0.95 | 1.47 | 1.35 | |||||||||||||||
April | 1.15 | 0.82 | 0.95 | 1.47 | 1.35 | |||||||||||||||
Total | 17.30 | 13.48 | 14.95 | 21.13 | 19.70 | |||||||||||||||
*The distribution amount is the sum of all distributions to shareholders for the period shown and includes only net investment income. All Fund distributions will vary depending upon current market conditions and past distributions are not indicative of future trends.
**Distributions were reduced duirng the period to meet federal income tax and excise tax requirements as a result of the impact of net foreign currency losses.
During the period, the Fund’s overweighted exposure to corporate credit provided a significant boost to performance, with senior secured floating rate loans being the primary contributor. Additionally, our positions in foreign currencies also added to results. Non-U.S. duration exposure and
non-agency residential mortgage-backed securities (RMBS) also benefited returns. In contrast, our exposure to emerging market sovereign debt and non-U.S. dollar-denominated debt hurt performance. The Fund’s more defensive duration positioning on the U.S. yield curve also detracted.
Corporate credit fundamentals remained generally supportive and technical conditions continued to be strong as the low interest-rate backdrop provided strong demand for corporate credit. We remained allocated across spread sectors, both corporate and securitized. Over the period, we increased our exposure to high yield and investment-grade corporate credit, treasury inflation protected securities (TIPS) and fixed-rate agency mortgage-backed securities (MBS).
We pared our allocation to emerging market debt securities and commercial MBS debt. We continued to find what we considered opportunities in global bond markets outside the U.S, and maintained exposure to international bonds and currencies.
Thank you for your continued participation in Franklin Strategic Income Fund. We look forward to serving your future investment needs.
 |
Christopher J. Molumphy, CFA | |
 |
Roger A. Bayston, CFA | |
| Patricia O’Connor, CFA | ||
| Portfolio Management Team | ||


CFA® is a trademark owned by CFA Institute.
franklintempleton.com | Annual Report | 5 | ||
FRANKLIN STRATEGIC INCOME FUND
The foregoing information reflects our analysis, opinions and portfolio holdings as of April 30, 2017, the end of the reporting period. The way we implement our main investment strategies and the resulting portfolio holdings may change depending on factors such as market and economic conditions. These opinions may not be relied upon as investment advice or an offer for a particular security. The information is not a complete analysis of every aspect of any market, country, industry, security or the Fund. Statements of fact are from sources considered reliable, but the investment manager makes no representation or warranty as to their completeness or accuracy. Although historical performance is no guarantee of future results, these insights may help you understand our investment management philosophy.
6 | Annual Report | franklintempleton.com | ||
FRANKLIN STRATEGIC INCOME FUND
Performance Summary as of April 30, 2017
The performance tables and graphs do not reflect any taxes that a shareholder would pay on Fund dividends, capital gain distributions, if any, or any realized gains on the sale of Fund shares. Total return reflects reinvestment of the Fund’s dividends and capital gain distributions, if any, and any unrealized gains or losses. Your dividend income will vary depending on dividends or interest paid by securities in the Fund’s portfolio, adjusted for operating expenses of each class. Capital gain distributions are net profits realized from the sale of portfolio securities.
Performance as of 4/30/171
Cumulative total return excludes sales charges. Average annual total return include maximum sales charges. Sales charges will vary depending on the size of the investment and the class of share purchased. The maximum is 4.25% and the minimum is 0%. Class A: 4.25% maximum initial sales charge; Advisor Class: no sales charges. For other share classes, visit franklintempleton.com.
Share Class
| Cumulative Total Return2
| Average Annual Total Return3
| ||
A
| ||||
1-Year
| +7.50% | +2.97% | ||
5-Year
| +18.46% | +2.54% | ||
10-Year
| +62.92% | +4.54% | ||
Advisor
| ||||
1-Year
| +7.76% | +7.76% | ||
5-Year
| +19.93% | +3.70% | ||
10-Year
| +67.13% | +5.27% | ||
| Distribution | 30-Day Standardized Yield5 | |||||||||||||||
| Share Class | Rate4 | (with waiver) | (without waiver) | |||||||||||||
A
| 1.88% | 3.70% | 3.65% | |||||||||||||
Advisor
| 2.23% | 4.11% | 4.06% | |||||||||||||
Performance data represent past performance, which does not guarantee future results. Investment return and principal value will fluctuate, and you may have a gain or loss when you sell your shares. Current performance may differ from figures shown. For most recent month-end performance, go to franklintempleton.com or call (800) 342-5236.
See page 9 for Performance Summary footnotes.
franklintempleton.com | Annual Report | 7 | ||
FRANKLIN STRATEGIC INCOME FUND
PERFORMANCE SUMMARY
Total Return Index Comparison for a Hypothetical $10,000 Investment1
Total return represents the change in value of an investment over the periods shown. It includes any applicable maximum sales charge, Fund expenses, account fees and reinvested distributions. The unmanaged indexes include reinvestment of any income or distributions. They differ from the Fund in composition and do not pay management fees or expenses. One cannot invest directly in an index.
Class A (5/1/07–4/30/17)

Advisor Class (5/1/07–4/30/17)
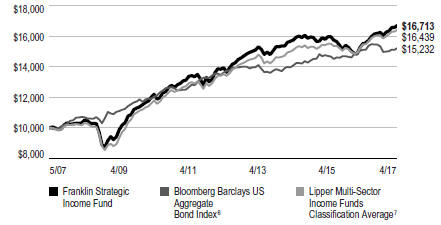
See page 9 for Performance Summary footnotes.
8 | Annual Report | franklintempleton.com | ||
FRANKLIN STRATEGIC INCOME FUND
PERFORMANCE SUMMARY
Distributions (5/1/16–4/30/17)
Share Class
| Net Investment Income
| |||
A
|
|
$0.1730 |
| |
C
| $0.1348 | |||
R
| $0.1495 | |||
R6
| $0.2113 | |||
Advisor
| $0.1970 | |||
Total Annual Operating Expenses8
Share Class
| With Waiver
| Without Waiver
| ||||||
A
| 0.88% | 0.92% | ||||||
Advisor
| 0.63% | 0.67% | ||||||
Each class of shares is available to certain eligible investors and has different annual fees and expenses, as described in the prospectus.
All investments involve risks, including possible loss of principal. Bond prices generally move in the opposite direction of interest rates. Thus, as prices of bonds in the Fund adjust to a rise in interest rates, the Fund’s share price may decline. Changes in the financial strength of a bond issuer or in a bond’s credit rating may affect its value. High yields reflect the higher credit risks associated with certain lower rated securities held in the portfolio. Floating rate loans and high yield corporate bonds are rated below investment grade and are subject to greater risk of default, which could result in loss of principal—a risk that may be heightened in a slowing economy. The risks of foreign securities include currency fluctuations and political uncertainty. Investing in derivative securities and the use of foreign currency techniques involve special risks as such may not achieve the anticipated benefits and/or may result in losses to the Fund. The Fund is actively managed but there is no guarantee that the manager’s investment decisions will produce the desired results. The Fund’s prospectus also includes a description of the main investment risks.
1. The Fund has a fee waiver associated with any investment it makes in a Franklin Templeton money fund and/or other Franklin Templeton fund, contractually guaranteed through 8/31/17. Fund investment results reflect the fee waiver; without this waiver, the results would have been lower.
2. Cumulative total return represents the change in value of an investment over the periods indicated.
3. Average annual total return represents the average annual change in value of an investment over the periods indicated. Return for less than one year, if any, has not been annualized.
4. Distribution rate is based on the sum of the respective class’s dividend distributions over the past 12 months and the maximum offering price (NAV for Advisor Class) per share on 4/30/17.
5. The Fund’s 30-day standardized yield is calculated over a trailing 30-day period using the yield to maturity on bonds and/or the dividends accrued on stocks. It may not equal the Fund’s actual income distribution rate, which reflects the Fund’s past dividends paid to shareholders.
6. Source: Morningstar. The Bloomberg Barclays U.S. Aggregate Bond Index is a market capitalization-weighted index representing the U.S. investment-grade, fixed-rate, taxable bond market with index components for government and corporate, mortgage pass-through and asset-backed securities. All issues included are SEC-registered, taxable, dollar denominated and nonconvertible, must have at least one year to final maturity, and must be rated investment grade (Baa3/BBB-/BBB- or above) using the middle rating of Moody’s, Standard & Poor’s and Fitch, respectively.
7. Source: Lipper, a Thomson Reuters Company. The Lipper Multi-Sector Income Funds Classification Average is calculated by averaging the total returns of all funds within the Lipper Multi-Sector Income Funds classification in the Lipper Open-End underlying funds universe. Lipper Multi-Sector Incomes Funds are defined as funds that seek current income by allocating assets among different fixed income securities sectors (not primarily in one sector except for defensive purposes), including U.S. and foreign governments, with a significant portion rated below investment grade. For the 12-month period ended 4/30/17, there were 325 funds in this category. Lipper calculations do not include sales charges, but include reinvestment of any income or distributions. Fund performance relative to the average may have differed if these and other factors had been considered.
8. Figures are as stated in the Fund’s current prospectus and may differ from the expense ratios disclosed in the Your Fund’s Expenses and Financial Highlights sections in this report. In periods of market volatility, assets may decline significantly, causing total annual Fund operating expenses to become higher than the figures shown.
See www.franklintempletondatasources.com for additional data provider information.
franklintempleton.com | Annual Report | 9 | ||
FRANKLIN STRATEGIC INCOME FUND
As a Fund shareholder, you can incur two types of costs: (1) transaction costs, including sales charges (loads) on Fund purchases and redemptions; and (2) ongoing Fund costs, including management fees, distribution and service (12b-1) fees, and other Fund expenses. All mutual funds have ongoing costs, sometimes referred to as operating expenses. The table below shows ongoing costs of investing in the Fund and can help you understand these costs and compare them with those of other mutual funds. The table assumes a $1,000 investment held for the six months indicated.
Actual Fund Expenses
The table below provides information about actual account values and actual expenses in the columns under the heading “Actual.” In these columns the Fund’s actual return, which includes the effect of Fund expenses, is used to calculate the “Ending Account Value” for each class of shares. You can estimate the expenses you paid during the period by following these steps (of course, your account value and expenses will differ from those in this illustration): Divide your account value by $1,000 (if your account had an $8,600 value, then $8,600 ÷ $1,000 = 8.6). Then multiply the result by the number in the row for your class of shares under the headings “Actual” and “Expenses Paid During Period” (if Actual Expenses Paid During Period were $7.50, then 8.6 x $7.50 = $64.50). In this illustration, the actual expenses paid this period are $64.50.
Hypothetical Example for Comparison with Other Funds
Under the heading “Hypothetical” in the table, information is provided about hypothetical account values and hypothetical expenses based on the Fund’s actual expense ratio and an assumed rate of return of 5% per year before expenses, which is not the Fund’s actual return. This information may not be used to estimate the actual ending account balance or expenses you paid for the period, but it can help you compare ongoing costs of investing in the Fund with those of other funds. To do so, compare this 5% hypothetical example for the class of shares you hold with the 5% hypothetical examples that appear in the shareholder reports of other funds.
Please note that expenses shown in the table are meant to highlight ongoing costs and do not reflect any transactional costs. Therefore, information under the heading “Hypothetical” is useful in comparing ongoing costs only, and will not help you compare total costs of owning different funds. In addition, if transactional costs were included, your total costs would have been higher.
Actual (actual return after expenses) | Hypothetical (5% annual return before expenses) | |||||||||||||||||
Share Class | Beginning Account Value 11/1/16 | Ending Account Value 4/30/17 | Expenses Paid During Period 11/1/16–4/30/171,2 | Ending Account Value 4/30/17 | Expenses Paid During 11/1/16–4/30/171,2 | Net Annualized Ratio2 | ||||||||||||
A | $1,000 | $1,026.80 | $4.12 | $1,020.73 | $4.11 | 0.82% | ||||||||||||
C | $1,000 | $1,024.70 | $6.12 | $1,018.74 | $6.06 | 1.22% | ||||||||||||
R | $1,000 | $1,025.60 | $5.37 | $1,019.49 | $5.36 | 1.07% | ||||||||||||
R6 | $1,000 | $1,028.80 | $2.16 | $1,022.66 | $2.16 | 0.43% | ||||||||||||
Advisor | $1,000 | $1,028.00 | $2.87 | $1,021.97 | $2.86 | 0.57% | ||||||||||||
1. Expenses are equal to the annualized expense ratio for the six-month period as indicated above—in the far right column—multiplied by the simple average account value over the period indicated, and then multiplied by 181/365 to reflect the one-half year period.
2. Reflects expenses after fee waivers and expense reimbursements. Does not include acquired fund fees and expenses.
10 | Annual Report | franklintempleton.com | ||
FRANKLIN STRATEGIC SERIES
Consolidated Financial Highlights
Franklin Strategic Income Fund
| Year Ended April 30, | ||||||||||||||||||||
| 2017 | 2016 | 2015 | 2014 | 2013 | ||||||||||||||||
Class A | ||||||||||||||||||||
Per share operating performance | ||||||||||||||||||||
(for a share outstanding throughout the year) | ||||||||||||||||||||
Net asset value, beginning of year | $9.32 | $10.04 | $10.57 | $10.86 | $10.48 | |||||||||||||||
Income from investment operationsa: | ||||||||||||||||||||
Net investment incomeb | 0.39 | 0.42 | 0.42 | 0.44 | 0.45 | |||||||||||||||
Net realized and unrealized gains (losses) | 0.30 | (0.74 | ) | (0.30 | ) | (0.18 | ) | 0.54 | ||||||||||||
Total from investment operations | 0.69 | (0.32 | ) | 0.12 | 0.26 | 0.99 | ||||||||||||||
Less distributions from: | ||||||||||||||||||||
Net investment income and net foreign currency gains | (0.17 | ) | (0.40 | ) | (0.55 | ) | (0.45 | ) | (0.57 | ) | ||||||||||
Net realized gains | — | — | (0.10 | ) | (0.10 | ) | (0.04 | ) | ||||||||||||
Total distributions | (0.17 | ) | (0.40 | ) | (0.65 | ) | (0.55 | ) | (0.61 | ) | ||||||||||
Net asset value, end of year | $9.84 | $9.32 | $10.04 | $10.57 | $10.86 | |||||||||||||||
Total returnc | 7.50% | (3.14 | )% | 1.16% | 2.52% | 9.70% | ||||||||||||||
Ratios to average net assets | ||||||||||||||||||||
Expenses before waiver and payments by affiliates | 0.88% | 0.88% | 0.86% | 0.86% | 0.87% | |||||||||||||||
Expenses net of waiver and payments by affiliatesd | 0.82% | 0.84% | 0.85% | 0.86% | e | 0.87% | ||||||||||||||
Net investment income | 4.08% | 4.44% | 4.03% | 4.16% | 4.21% | |||||||||||||||
Supplemental data | ||||||||||||||||||||
Net assets, end of year (000’s) | $3,833,786 | $4,500,752 | $5,242,844 | $5,182,490 | $4,966,834 | |||||||||||||||
Portfolio turnover rate | 140.83% | 88.04% | 72.51% | 54.11% | 47.27% | |||||||||||||||
Portfolio turnover rate excluding mortgage dollar rollsf | 87.33% | 48.33% | 49.36% | 54.11% | 44.33% | |||||||||||||||
aThe amount shown for a share outstanding throughout the period may not correlate with the Consolidated Statement of Operations for the period due to the timing of sales and repurchases of the Fund’s shares in relation to income earned and/or fluctuating fair value of the investments of the Fund.
bBased on average daily shares outstanding.
cTotal return does not reflect sales commissions or contingent deferred sales charges, if applicable.
dBenefit of expense reduction rounds to less than 0.01%.
eBenefit of waiver and payments by affiliates rounds to less than 0.01%.
fSee Note 1(h) regarding mortgage dollar rolls.
franklintempleton.com | The accompanying notes are an integral part of these consolidated financial statements. | | Annual Report | 11 | |||
FRANKLIN STRATEGIC SERIES
CONSOLIDATED FINANCIAL HIGHLIGHTS
Franklin Strategic Income Fund (continued)
| Year Ended April 30, | ||||||||||||||||||||
| 2017 | 2016 | 2015 | 2014 | 2013 | ||||||||||||||||
Class C | ||||||||||||||||||||
Per share operating performance | ||||||||||||||||||||
(for a share outstanding throughout the year) | ||||||||||||||||||||
Net asset value, beginning of year | $9.31 | $10.04 | $10.57 | $10.85 | $10.48 | |||||||||||||||
Income from investment operationsa: | ||||||||||||||||||||
Net investment incomeb | 0.35 | 0.38 | 0.38 | 0.40 | 0.41 | |||||||||||||||
Net realized and unrealized gains (losses) | 0.31 | (0.75 | ) | (0.30 | ) | (0.17 | ) | 0.53 | ||||||||||||
Total from investment operations | 0.66 | (0.37 | ) | 0.08 | 0.23 | 0.94 | ||||||||||||||
Less distributions from: | ||||||||||||||||||||
Net investment income and net foreign currency gains | (0.13 | ) | (0.36 | ) | (0.51 | ) | (0.41 | ) | (0.53 | ) | ||||||||||
Net realized gains | — | — | (0.10 | ) | (0.10 | ) | (0.04 | ) | ||||||||||||
Total distributions | (0.13 | ) | (0.36 | ) | (0.61 | ) | (0.51 | ) | (0.57 | ) | ||||||||||
Net asset value, end of year | $9.84 | $9.31 | $10.04 | $10.57 | $10.85 | |||||||||||||||
Total returnc | 7.19% | (3.64 | )% | 0.76% | 2.20% | 9.17% | ||||||||||||||
Ratios to average net assets | ||||||||||||||||||||
Expenses before waiver and payments by affiliates | 1.28% | 1.28% | 1.26% | 1.26% | 1.27% | |||||||||||||||
Expenses net of waiver and payments by affiliatesd | 1.22% | 1.24% | 1.25% | 1.26% | e | 1.27% | ||||||||||||||
Net investment income | 3.68% | 4.04% | 3.63% | 3.76% | 3.81% | |||||||||||||||
Supplemental data | ||||||||||||||||||||
Net assets, end of year (000’s) | $1,385,981 | $1,645,852 | $2,070,739 | $2,109,049 | $2,108,962 | |||||||||||||||
Portfolio turnover rate | 140.83% | 88.04% | 72.51% | 54.11% | 47.27% | |||||||||||||||
Portfolio turnover rate excluding mortgage dollar rollsf | 87.33% | 48.33% | 49.36% | 54.11% | 44.33% | |||||||||||||||
aThe amount shown for a share outstanding throughout the period may not correlate with the Consolidated Statement of Operations for the period due to the timing of sales and repurchases of the Fund’s shares in relation to income earned and/or fluctuating fair value of the investments of the Fund.
bBased on average daily shares outstanding.
cTotal return does not reflect sales commissions or contingent deferred sales charges, if applicable.
dBenefit of expense reduction rounds to less than 0.01%.
eBenefit of waiver and payments by affiliates rounds to less than 0.01%.
fSee Note 1(h) regarding mortgage dollar rolls.
12 | Annual Report | | The accompanying notes are an integral part of these consolidated financial statements. | franklintempleton.com | |||
FRANKLIN STRATEGIC SERIES
CONSOLIDATED FINANCIAL HIGHLIGHTS
Franklin Strategic Income Fund (continued)
| Year Ended April 30, | ||||||||||||||||||||
| 2017 | 2016 | 2015 | 2014 | 2013 | ||||||||||||||||
Class R | ||||||||||||||||||||
Per share operating performance | ||||||||||||||||||||
(for a share outstanding throughout the year) | ||||||||||||||||||||
Net asset value, beginning of year | $9.28 | $10.01 | $10.54 | $10.82 | $10.45 | |||||||||||||||
Income from investment operationsa: | ||||||||||||||||||||
Net investment incomeb | 0.37 | 0.39 | 0.39 | 0.41 | 0.42 | |||||||||||||||
Net realized and unrealized gains (losses) | 0.31 | (0.74 | ) | (0.29 | ) | (0.17 | ) | 0.53 | ||||||||||||
Total from investment operations | 0.68 | (0.35 | ) | 0.10 | 0.24 | 0.95 | ||||||||||||||
Less distributions from: | ||||||||||||||||||||
Net investment income and net foreign currency gains | (0.15 | ) | (0.38 | ) | (0.53 | ) | (0.42 | ) | (0.54 | ) | ||||||||||
Net realized gains | — | — | (0.10 | ) | (0.10 | ) | (0.04 | ) | ||||||||||||
Total distributions | (0.15 | ) | (0.38 | ) | (0.63 | ) | (0.52 | ) | (0.58 | ) | ||||||||||
Net asset value, end of year | $9.81 | $9.28 | $10.01 | $10.54 | $10.82 | |||||||||||||||
Total return | 7.38% | (3.50 | )% | 0.91% | 2.36% | 9.36% | ||||||||||||||
Ratios to average net assets | ||||||||||||||||||||
Expenses before waiver and payments by affiliates | 1.13% | 1.13% | 1.11% | 1.11% | 1.12% | |||||||||||||||
Expenses net of waiver and payments by affiliatesc | 1.07% | 1.09% | 1.10% | 1.11% | d | 1.12% | ||||||||||||||
Net investment income | 3.83% | 4.19% | 3.78% | 3.91% | 3.96% | |||||||||||||||
Supplemental data | ||||||||||||||||||||
Net assets, end of year (000’s) | $146,552 | $181,671 | $223,758 | $227,359 | $260,647 | |||||||||||||||
Portfolio turnover rate | 140.83% | 88.04% | 72.51% | 54.11% | 47.27% | |||||||||||||||
Portfolio turnover rate excluding mortgage dollar rollse | 87.33% | 48.33% | 49.36% | 54.11% | 44.33% | |||||||||||||||
aThe amount shown for a share outstanding throughout the period may not correlate with the Consolidated Statement of Operations for the period due to the timing of sales and repurchases of the Fund’s shares in relation to income earned and/or fluctuating fair value of the investments of the Fund.
bBased on average daily shares outstanding.
cBenefit of expense reduction rounds to less than 0.01%.
dBenefit of waiver and payments by affiliates rounds to less than 0.01%.
eSee Note 1(h) regarding mortgage dollar rolls.
franklintempleton.com | The accompanying notes are an integral part of these consolidated financial statements. | | Annual Report | 13 | |||
FRANKLIN STRATEGIC SERIES
CONSOLIDATED FINANCIAL HIGHLIGHTS
Franklin Strategic Income Fund (continued)
| Year Ended April 30, | ||||||||||||||||
| 2017 | 2016 | 2015 | 2014a | |||||||||||||
Class R6 | ||||||||||||||||
Per share operating performance | ||||||||||||||||
(for a share outstanding throughout the year) | ||||||||||||||||
Net asset value, beginning of year | $9.33 | $10.05 | $10.58 | $10.87 | ||||||||||||
Income from investment operationsb: | ||||||||||||||||
Net investment incomec | 0.43 | 0.46 | 0.46 | 0.49 | ||||||||||||
Net realized and unrealized gains (losses) | 0.31 | (0.74 | ) | (0.30 | ) | (0.19 | ) | |||||||||
Total from investment operations | 0.74 | (0.28 | ) | 0.16 | 0.30 | |||||||||||
Less distributions from: | ||||||||||||||||
Net investment income and net foreign currency gains | (0.21 | ) | (0.44 | ) | (0.59 | ) | (0.49 | ) | ||||||||
Net realized gains | — | — | (0.10 | ) | (0.10 | ) | ||||||||||
Total distributions | (0.21 | ) | (0.44 | ) | (0.69 | ) | (0.59 | ) | ||||||||
Net asset value, end of year | $9.86 | $9.33 | $10.05 | $10.58 | ||||||||||||
Total return | 8.03% | (2.76 | )% | 1.54% | 2.90% | |||||||||||
Ratios to average net assets | ||||||||||||||||
Expenses before waiver and payments by affiliates | 0.48% | 0.49% | 0.48% | 0.48% | ||||||||||||
Expenses net of waiver and payments by affiliatesd | 0.42% | 0.45% | 0.47% | 0.48% | e | |||||||||||
Net investment income | 4.48% | 4.83% | 4.41% | 4.54% | ||||||||||||
Supplemental data | ||||||||||||||||
Net assets, end of year (000’s) | $369,106 | $286,503 | $253,929 | $247,007 | ||||||||||||
Portfolio turnover rate | 140.83% | 88.04% | 72.51% | 54.11% | ||||||||||||
Portfolio turnover rate excluding mortgage dollar rollsf | 87.33% | 48.33% | 49.36% | 54.11% | ||||||||||||
aFor the year May 1, 2013 (effective date) to April 30, 2014.
bThe amount shown for a share outstanding throughout the period may not correlate with the Consolidated Statement of Operations for the period due to the timing of sales and repurchases of the Fund’s shares in relation to income earned and/or fluctuating fair value of the investments of the Fund.
cBased on average daily shares outstanding.
dBenefit of expense reduction rounds to less than 0.01%.
eBenefit of waiver and payments by affiliates rounds to less than 0.01%.
fSee Note 1(h) regarding mortgage dollar rolls.
14 | Annual Report | | The accompanying notes are an integral part of these consolidated financial statements. | franklintempleton.com | |||
FRANKLIN STRATEGIC SERIES
CONSOLIDATED FINANCIAL HIGHLIGHTS
Franklin Strategic Income Fund (continued)
| Year Ended April 30, | ||||||||||||||||||||
| 2017 | 2016 | 2015 | 2014 | 2013 | ||||||||||||||||
Advisor Class | ||||||||||||||||||||
Per share operating performance | ||||||||||||||||||||
(for a share outstanding throughout the year) | ||||||||||||||||||||
Net asset value, beginning of year | $9.33 | $10.05 | $10.58 | $10.86 | $10.49 | |||||||||||||||
Income from investment operationsa: | ||||||||||||||||||||
Net investment incomeb | 0.42 | 0.44 | 0.44 | 0.47 | 0.48 | |||||||||||||||
Net realized and unrealized gains (losses) | 0.30 | (0.74 | ) | (0.29 | ) | (0.17 | ) | 0.53 | ||||||||||||
Total from investment operations | 0.72 | (0.30 | ) | 0.15 | 0.30 | 1.01 | ||||||||||||||
Less distributions from: | ||||||||||||||||||||
Net investment income and net foreign currency gains | (0.20 | ) | (0.42 | ) | (0.58 | ) | (0.48 | ) | (0.60 | ) | ||||||||||
Net realized gains | — | — | (0.10 | ) | (0.10 | ) | (0.04 | ) | ||||||||||||
Total distributions | (0.20 | ) | (0.42 | ) | (0.68 | ) | (0.58 | ) | (0.64 | ) | ||||||||||
Net asset value, end of year | $9.85 | $9.33 | $10.05 | $10.58 | $10.86 | |||||||||||||||
Total return | 7.76% | (2.89 | )% | 1.41% | 2.87% | 9.87% | ||||||||||||||
Ratios to average net assets | ||||||||||||||||||||
Expenses before waiver and payments by affiliates | 0.63% | 0.63% | 0.61% | 0.61% | 0.62% | |||||||||||||||
Expenses net of waiver and payments by affiliatesc | 0.57% | 0.59% | 0.60% | 0.61% | d | 0.62% | ||||||||||||||
Net investment income | 4.33% | 4.69% | 4.28% | 4.41% | 4.46% | |||||||||||||||
Supplemental data | ||||||||||||||||||||
Net assets, end of year (000’s) | $1,070,103 | $904,899 | $1,130,796 | $1,010,755 | $956,001 | |||||||||||||||
Portfolio turnover rate | 140.83% | 88.04% | 72.51% | 54.11% | 47.27% | |||||||||||||||
Portfolio turnover rate excluding mortgage dollar rollse | 87.33% | 48.33% | 49.36% | 54.11% | 44.33% | |||||||||||||||
aThe amount shown for a share outstanding throughout the period may not correlate with the Consolidated Statement of Operations for the period due to the timing of sales and repurchases of the Fund’s shares in relation to income earned and/or fluctuating fair value of the investments of the Fund.
bBased on average daily shares outstanding.
cBenefit of expense reduction rounds to less than 0.01%.
dBenefit of waiver and payments by affiliates rounds to less than 0.01%.
eSee Note 1(h) regarding mortgage dollar rolls.
franklintempleton.com | The accompanying notes are an integral part of these consolidated financial statements. | | Annual Report | 15 | |||
FRANKLIN STRATEGIC SERIES
Consolidated Statement of Investments, April 30, 2017
Franklin Strategic Income Fund
| Country | Shares/ Warrants | Value | ||||||||||||||
| ||||||||||||||||
Common Stocks and Other Equity Interests 1.2% |
| |||||||||||||||
Consumer Services 0.4% |
| |||||||||||||||
a,b,c Turtle Bay Resort | United States | 5,579,939 | $ | 25,946,719 | ||||||||||||
|
| |||||||||||||||
Energy 0.7% |
| |||||||||||||||
a Chaparral Energy Inc., A | United States | 448,417 | 11,210,425 | |||||||||||||
a,d Chaparral Energy Inc., A, 144A | United States | 3,418 | 86,719 | |||||||||||||
a Chaparral Energy Inc., B | United States | 94,305 | 2,357,625 | |||||||||||||
a,e CHC Group LLC | Cayman Islands | 168,355 | 2,020,260 | |||||||||||||
a Energy XXI Gulf Coast Inc. | United States | 244,178 | 6,714,895 | |||||||||||||
a Energy XXI Gulf Coast Inc., wts., 12/30/21 | United States | 47,227 | 247,942 | |||||||||||||
a,d Halcon Resources Corp. | United States | 955,276 | 6,141,864 | |||||||||||||
a Halcon Resources Corp., wts., 9/09/20 | United States | 75,770 | 79,558 | |||||||||||||
a Linn Energy Inc. | United States | 239,823 | 6,722,239 | |||||||||||||
a Midstates Petroleum Co. Inc. | United States | 6,826 | 126,690 | |||||||||||||
a,f Midstates Petroleum Co. Inc., wts., 4/21/20 | United States | 48,362 | 4,072 | |||||||||||||
a Penn Virginia Corp. | United States | 187,985 | 7,442,307 | |||||||||||||
a W&T Offshore Inc. | United States | 936,100 | 1,909,644 | |||||||||||||
|
| |||||||||||||||
|
45,064,240 |
| ||||||||||||||
|
| |||||||||||||||
Materials 0.0%† |
| |||||||||||||||
a Verso Corp., A | United States | 38,905 | 236,153 | |||||||||||||
a Verso Corp., wts., 7/25/23 | United States | 4,095 | 614 | |||||||||||||
a,d Warrior Met Coal Inc. | United States | 211,824 | 3,638,294 | |||||||||||||
|
| |||||||||||||||
|
3,875,061 |
| ||||||||||||||
|
| |||||||||||||||
Retailing 0.0%† |
| |||||||||||||||
a,d Holdco 2, A | South Africa | 125,940,079 | 94,224 | |||||||||||||
a,d Holdco 2, B | South Africa | 12,532,822 | 9,377 | |||||||||||||
|
| |||||||||||||||
|
103,601 |
| ||||||||||||||
|
| |||||||||||||||
Transportation 0.0%† |
| |||||||||||||||
a,f CEVA Holdings LLC | United States | 1,570 | 313,994 | |||||||||||||
|
| |||||||||||||||
Utilities 0.1% |
| |||||||||||||||
Vistra Energy Corp. | United States | 513,779 | 7,680,996 | |||||||||||||
|
| |||||||||||||||
Total Common Stocks and Other Equity Interests | 82,984,611 | |||||||||||||||
|
| |||||||||||||||
Management Investment Companies 7.2% | ||||||||||||||||
Diversified Financials 7.2% |
| |||||||||||||||
g Franklin Lower Tier Floating Rate Fund | United States | 25,361,119 | 267,559,803 | |||||||||||||
g Franklin Middle Tier Floating Rate Fund | United States | 21,833,687 | 219,646,896 | |||||||||||||
|
| |||||||||||||||
Total Management Investment Companies | 487,206,699 | |||||||||||||||
|
| |||||||||||||||
Convertible Preferred Stocks 0.0%† | ||||||||||||||||
Transportation 0.0%† |
| |||||||||||||||
a,f CEVA Holdings LLC, cvt. pfd., A-1 | United States | 62 | 20,150 | |||||||||||||
a,f CEVA Holdings LLC, cvt. pfd., A-2 | United States | 3,399 | 764,676 | |||||||||||||
|
| |||||||||||||||
Total Convertible Preferred Stocks | 784,826 | |||||||||||||||
|
| |||||||||||||||
16 | Annual Report | franklintempleton.com | ||
FRANKLIN STRATEGIC SERIES
CONSOLIDATED STATEMENT OF INVESTMENTS
Franklin Strategic Income Fund (continued)
| Country | Principal Amount* | Value | ||||||||||||||
| ||||||||||||||||
Convertible Bonds (Cost $16,016,242) 0.2% |
| |||||||||||||||
Energy 0.2% |
| |||||||||||||||
CHC Group LLC/CHC Finance Ltd., cvt., zero cpn., 10/01/20 | Cayman Islands | 8,657,428 | $ | 15,972,955 | ||||||||||||
|
| |||||||||||||||
Corporate Bonds 46.2% |
| |||||||||||||||
Automobiles & Components 1.2% |
| |||||||||||||||
Fiat Chrysler Automobiles NV, senior note, 5.25%, 4/15/23 | United Kingdom | 35,000,000 | 36,132,950 | |||||||||||||
Ford Motor Credit Co. LLC, senior note, 3.096%, 5/04/23 | United States | 20,400,000 | 20,103,404 | |||||||||||||
The Goodyear Tire & Rubber Co., senior bond, 5.00%, 5/31/26 | United States | 19,400,000 | 19,957,750 | |||||||||||||
senior note, 5.125%, 11/15/23 | United States | 5,400,000 | 5,694,192 | |||||||||||||
|
| |||||||||||||||
|
81,888,296 |
| ||||||||||||||
|
| |||||||||||||||
Banks 4.3% | ||||||||||||||||
Bank of America Corp., senior note, 6.40%, 8/28/17 | United States | 10,000,000 | 10,159,350 | |||||||||||||
senior note, 7.75%, 4/30/18 | United States | 3,700,000 | GBP | 5,123,779 | ||||||||||||
senior note, 5.65%, 5/01/18 | United States | 5,000,000 | 5,189,765 | |||||||||||||
senior note, 3.50%, 4/19/26 | United States | 46,000,000 | 45,986,568 | |||||||||||||
CIT Group Inc., senior note, 5.375%, 5/15/20 | United States | 6,900,000 | 7,443,375 | |||||||||||||
senior note, 5.00%, 8/15/22 | United States | 18,000,000 | 19,409,400 | |||||||||||||
Citigroup Inc., senior note, 3.875%, 10/25/23 | United States | 20,000,000 | 20,917,140 | |||||||||||||
senior note, 3.30%, 4/27/25 | United States | 2,500,000 | 2,488,420 | |||||||||||||
senior note, 3.40%, 5/01/26 | United States | 23,300,000 | 23,033,984 | |||||||||||||
sub. bond, 5.50%, 9/13/25 | United States | 10,000,000 | 11,064,890 | |||||||||||||
sub. note, 4.05%, 7/30/22 | United States | 5,000,000 | 5,242,230 | |||||||||||||
JPMorgan Chase & Co., hjunior sub. bond, R, 6.00% to 8/01/23, FRN thereafter, Perpetual | United States | 10,000,000 | 10,650,000 | |||||||||||||
hjunior sub. bond, X, 6.10% to 10/01/24, FRN thereafter, Perpetual . | United States | 5,000,000 | 5,368,750 | |||||||||||||
senior bond, 3.30%, 4/01/26 | United States | 10,000,000 | 9,892,550 | |||||||||||||
senior bond, 3.20%, 6/15/26 | United States | 7,000,000 | 6,870,164 | |||||||||||||
senior note, 4.25%, 10/15/20 | United States | 10,000,000 | 10,648,370 | |||||||||||||
senior note, 3.25%, 9/23/22 | United States | 5,000,000 | 5,127,450 | |||||||||||||
sub. note, 3.375%, 5/01/23 | United States | 10,000,000 | 10,081,650 | |||||||||||||
sub. note, 3.875%, 9/10/24 | United States | 10,000,000 | 10,258,690 | |||||||||||||
Royal Bank of Scotland Group PLC, sub. note, 5.125%, 5/28/24 | United Kingdom | 2,600,000 | 2,674,217 | |||||||||||||
Wells Fargo & Co., hjunior sub. bond, S, 5.90% to 6/15/24, FRN thereafter, Perpetual | United States | 21,000,000 | 22,286,250 | |||||||||||||
senior note, 2.60%, 7/22/20 | United States | 10,000,000 | 10,129,200 | |||||||||||||
senior note, 3.00%, 4/22/26 | United States | 36,000,000 | 34,864,020 | |||||||||||||
|
| |||||||||||||||
|
294,910,212 |
| ||||||||||||||
|
| |||||||||||||||
Capital Goods 1.3% | ||||||||||||||||
Aircastle Ltd., senior note, 4.125%, 5/01/24 | United States | 25,500,000 | 25,997,250 | |||||||||||||
i Cortes NP Acquisition Corp., senior note, 144A, 9.25%, 10/15/24 | United States | 16,900,000 | 18,230,875 | |||||||||||||
Navistar International Corp., senior bond, 8.25%, 11/01/21 | United States | 11,400,000 | 11,599,500 | |||||||||||||
i Terex Corp., senior note, 144A, 5.625%, 2/01/25 | United States | 4,600,000 | 4,709,250 | |||||||||||||
TransDigm Inc., senior sub. bond, 6.50%, 7/15/24 | United States | 4,000,000 | 4,120,000 | |||||||||||||
senior sub. bond, 6.50%, 5/15/25 | United States | 2,500,000 | 2,562,500 | |||||||||||||
senior sub. bond, 6.375%, 6/15/26 | United States | 15,000,000 | 15,150,000 | |||||||||||||
senior sub. note, 6.00%, 7/15/22 | United States | 4,000,000 | 4,130,000 | |||||||||||||
|
| |||||||||||||||
|
86,499,375 |
| ||||||||||||||
|
| |||||||||||||||
franklintempleton.com | Annual Report | 17 | ||
FRANKLIN STRATEGIC SERIES
CONSOLIDATED STATEMENT OF INVESTMENTS
Franklin Strategic Income Fund (continued)
| Country | Principal Amount* | Value | ||||||||||||||
| ||||||||||||||||
Corporate Bonds (continued) |
| |||||||||||||||
Commercial & Professional Services 0.3% |
| |||||||||||||||
United Rentals North America Inc., senior bond, 5.875%, 9/15/26 | United States | 20,500,000 | $ | 21,704,375 | ||||||||||||
|
| |||||||||||||||
Consumer Durables & Apparel 1.0% |
| |||||||||||||||
i Hanesbrands Inc., senior bond, 144A, 4.875%, 5/15/26 | United States | 25,100,000 | 25,100,000 | |||||||||||||
KB Home, senior bond, 7.50%, 9/15/22 | United States | 5,000,000 | 5,678,125 | |||||||||||||
senior note, 7.00%, 12/15/21 | United States | 10,000,000 | 11,137,500 | |||||||||||||
PulteGroup Inc., senior bond, 5.00%, 1/15/27 | United States | 24,600,000 | 24,999,750 | |||||||||||||
|
| |||||||||||||||
|
66,915,375 |
| ||||||||||||||
|
| |||||||||||||||
Consumer Services 2.1% |
| |||||||||||||||
i 1011778 BC ULC/New Red Finance Inc., secured note, second lien, 144A, | Canada | 20,000,000 | 20,900,000 | |||||||||||||
GLP Capital LP/GLP Financing II Inc., senior note, 5.375%, 4/15/26 | United States | 6,100,000 | 6,450,750 | |||||||||||||
i International Game Technology PLC, senior secured bond, 144A, 6.50%, 2/15/25 | United States | 13,200,000 | 14,503,500 | |||||||||||||
senior secured note, 144A, 6.25%, 2/15/22 | United States | 20,500,000 | 22,419,415 | |||||||||||||
i KFC Holding Co./Pizza Hut Holdings LLC/Taco Bell of America LLC, senior note, 144A, 5.00%, 6/01/24 | United States | 8,900,000 | 9,211,500 | |||||||||||||
senior note, 144A, 5.25%, 6/01/26 | United States | 9,100,000 | 9,350,250 | |||||||||||||
Marriott International Inc., senior bond, 3.75%, 10/01/25 | United States | 30,000,000 | 30,548,070 | |||||||||||||
i Wynn Las Vegas LLC/Wynn Las Vegas Capital Corp., senior bond, 144A, | United States | 13,700,000 | 14,282,250 | |||||||||||||
i Wynn Macau Ltd., senior note, 144A, 5.25%, 10/15/21 | Macau | 12,700,000 | 13,081,000 | |||||||||||||
|
| |||||||||||||||
|
140,746,735 |
| ||||||||||||||
|
| |||||||||||||||
Diversified Financials 2.8% | ||||||||||||||||
Capital One Financial Corp., senior note, 3.20%, 2/05/25 | United States | 20,000,000 | 19,436,240 | |||||||||||||
i,j,k Eagle Holdings Co. II LLC, senior note, 144A, PIK, 7.625%, 5/15/22 | United States | 3,300,000 | 3,300,000 | |||||||||||||
The Goldman Sachs Group Inc., senior note, 3.50%, 1/23/25 | United States | 33,800,000 | 34,004,051 | |||||||||||||
senior note, 3.75%, 2/25/26 | United States | 15,000,000 | 15,266,745 | |||||||||||||
i Lincoln Finance Ltd., senior secured note, 144A, 6.875%, 4/15/21 | Netherlands | 8,400,000 | EUR | 9,856,189 | ||||||||||||
Morgan Stanley, senior note, 3.875%, 1/27/26 | United States | 43,100,000 | 44,144,184 | |||||||||||||
sub. bond, 3.95%, 4/23/27 | United States | 10,000,000 | 10,062,330 | |||||||||||||
Navient Corp., senior note, 5.875%, 3/25/21 | United States | 5,000,000 | 5,200,000 | |||||||||||||
senior note, 6.625%, 7/26/21 | United States | 8,000,000 | 8,490,000 | |||||||||||||
senior note, 6.125%, 3/25/24 | United States | 10,000,000 | 9,950,000 | |||||||||||||
i Park Aerospace Holdings Ltd., senior note, 144A, 5.25%, 8/15/22 | Ireland | 7,200,000 | 7,605,000 | |||||||||||||
senior note, 144A, 5.50%, 2/15/24 | Ireland | 12,400,000 | 13,131,600 | |||||||||||||
i Transurban Finance Co. Pty. Ltd., 144A, 3.375%, 3/22/27 | Australia | 11,400,000 | 11,104,540 | |||||||||||||
|
| |||||||||||||||
|
191,550,879 |
| ||||||||||||||
|
| |||||||||||||||
Energy 3.9% | ||||||||||||||||
c,l BreitBurn Energy Partners LP/BreitBurn Finance Corp., senior bond, 7.875%, | United States | 12,500,000 | 6,156,250 | |||||||||||||
i California Resources Corp., secured note, second lien, 144A, 8.00%, 12/15/22 | United States | 7,852,000 | 6,075,485 | |||||||||||||
i Calumet Specialty Products Partners LP/Calumet Finance Corp., senior note, | United States | 8,900,000 | 10,368,500 | |||||||||||||
18 | Annual Report | franklintempleton.com | ||
FRANKLIN STRATEGIC SERIES
CONSOLIDATED STATEMENT OF INVESTMENTS
Franklin Strategic Income Fund (continued)
| Country | Principal Amount* | Value | ||||||||||||||
| ||||||||||||||||
Corporate Bonds (continued) |
| |||||||||||||||
Energy (continued) | ||||||||||||||||
i Cheniere Corpus Christi Holdings LLC, senior secured note, 144A, 7.00%, 6/30/24 | United States | 8,800,000 | $ | 9,876,944 | ||||||||||||
senior secured note, first lien, 144A, 5.875%, 3/31/25 | United States | 8,200,000 | 8,763,750 | |||||||||||||
CONSOL Energy Inc., senior note, 5.875%, 4/15/22 | United States | 20,000,000 | 19,600,000 | |||||||||||||
Energy Transfer Equity LP, senior note, first lien, 7.50%, 10/15/20 | United States | 11,000,000 | 12,450,625 | |||||||||||||
Energy Transfer Partners LP, senior note, 5.20%, 2/01/22 | United States | 10,000,000 | 10,836,810 | |||||||||||||
i,j EnQuest PLC, 144A, PIK, 8.00%, 10/15/23 | United Kingdom | 12,000,395 | 9,628,841 | |||||||||||||
i,m Gaz Capital SA, (OJSC Gazprom), loan participation, senior note, 144A, | Russia | 20,000,000 | 20,366,000 | |||||||||||||
Kinder Morgan Inc., senior bond, 4.30%, 6/01/25 | United States | 17,000,000 | 17,736,729 | |||||||||||||
senior note, 7.00%, 6/15/17 | United States | 3,500,000 | 3,521,483 | |||||||||||||
senior note, 6.50%, 9/15/20 | United States | 9,000,000 | 10,074,060 | |||||||||||||
Martin Midstream Partners LP/Martin Midstream Finance Corp., senior note, 7.25%, 2/15/21 | United States | 20,000,000 | 20,600,000 | |||||||||||||
Regency Energy Partners LP/Regency Energy Finance Corp., senior bond, 5.50%, 4/15/23 | United States | 5,000,000 | 5,230,450 | |||||||||||||
senior note, 5.875%, 3/01/22 | United States | 1,300,000 | 1,433,207 | |||||||||||||
senior note, 5.00%, 10/01/22 | United States | 10,000,000 | 10,676,470 | |||||||||||||
Sabine Pass Liquefaction LLC, first lien, 5.625%, 2/01/21 | United States | 20,000,000 | 21,767,820 | |||||||||||||
first lien, 5.625%, 4/15/23 | United States | 6,200,000 | 6,845,947 | |||||||||||||
senior secured note, first lien, 5.625%, 3/01/25 | United States | 5,000,000 | 5,474,455 | |||||||||||||
Sanchez Energy Corp., senior note, 6.125%, 1/15/23 | United States | 6,000,000 | 5,549,940 | |||||||||||||
i,j W&T Offshore Inc., second lien, 144A, PIK, 10.75%, 5/15/20 | United States | 5,050,512 | 4,286,325 | |||||||||||||
senior secured note, third lien, 144A, PIK, 10.00%, 6/15/21 | United States | 4,519,777 | 3,486,996 | |||||||||||||
Weatherford International Ltd., senior note, 7.75%, 6/15/21 | United States | 9,000,000 | 9,630,000 | |||||||||||||
senior note, 8.25%, 6/15/23 | United States | 10,500,000 | 11,405,625 | |||||||||||||
i Woodside Finance Ltd., senior note, 144A, 3.70%, 9/15/26 | Australia | 12,500,000 | 12,348,875 | |||||||||||||
|
| |||||||||||||||
|
264,191,587 |
| ||||||||||||||
|
| |||||||||||||||
Food & Staples Retailing 0.7% | ||||||||||||||||
Kroger Co., senior bond, 2.65%, 10/15/26 | United States | 15,300,000 | 14,266,975 | |||||||||||||
Walgreens Boots Alliance Inc., senior note, 3.80%, 11/18/24 | United States | 30,000,000 | 30,871,950 | |||||||||||||
|
| |||||||||||||||
|
45,138,925 |
| ||||||||||||||
|
| |||||||||||||||
Food, Beverage & Tobacco 1.9% | ||||||||||||||||
Anheuser-Busch InBev Finance Inc., senior note, 3.30%, 2/01/23 | Belgium | 15,700,000 | 16,119,221 | |||||||||||||
i Imperial Brands Finance PLC, senior note, 144A, 3.50%, 2/11/23 | United Kingdom | 20,400,000 | 20,783,214 | |||||||||||||
i JBS USA LLC/Finance Inc., senior bond, 144A, 5.875%, 7/15/24 | United States | 6,800,000 | 7,123,000 | |||||||||||||
senior note, 144A, 8.25%, 2/01/20 | United States | 11,000,000 | 11,324,500 | |||||||||||||
senior note, 144A, 5.75%, 6/15/25 | United States | 5,000,000 | 5,187,500 | |||||||||||||
Kraft Heinz Foods Co., senior bond, 3.00%, 6/01/26 | United States | 25,400,000 | 24,188,014 | |||||||||||||
i Lamb Weston Holdings Inc., senior note, 144A, 4.625%, 11/01/24 | United States | 6,500,000 | 6,727,500 | |||||||||||||
senior note, 144A, 4.875%, 11/01/26 | United States | 16,500,000 | 17,056,875 | |||||||||||||
franklintempleton.com | Annual Report | 19 | ||
FRANKLIN STRATEGIC SERIES
CONSOLIDATED STATEMENT OF INVESTMENTS
Franklin Strategic Income Fund (continued)
| Country | Principal Amount* | Value | ||||||||||||||
| ||||||||||||||||
Corporate Bonds (continued) |
| |||||||||||||||
Food, Beverage & Tobacco (continued) | ||||||||||||||||
i Post Holdings Inc., senior note, 144A, 6.00%, 12/15/22 | United States | 10,000,000 | $ | 10,712,500 | ||||||||||||
senior note, 144A, 7.75%, 3/15/24 | United States | 9,000,000 | 10,046,250 | |||||||||||||
|
| |||||||||||||||
|
129,268,574 |
| ||||||||||||||
|
| |||||||||||||||
Health Care Equipment & Services 1.6% | ||||||||||||||||
Centene Corp., senior note, 4.75%, 5/15/22 | United States | 12,000,000 | 12,510,000 | |||||||||||||
CHS/Community Health Systems Inc., senior note, 7.125%, 7/15/20 | United States | 2,000,000 | 1,802,500 | |||||||||||||
senior note, 6.875%, 2/01/22 | United States | 8,300,000 | 6,899,375 | |||||||||||||
senior secured note, first lien, 6.25%, 3/31/23 | United States | 3,900,000 | 3,982,875 | |||||||||||||
DaVita Inc., senior bond, 5.125%, 7/15/24 | United States | 10,000,000 | �� | 10,300,050 | ||||||||||||
senior bond, 5.00%, 5/01/25 | United States | 9,300,000 | 9,393,000 | |||||||||||||
HCA Inc., senior bond, 5.875%, 5/01/23 | United States | 15,000,000 | 16,360,500 | |||||||||||||
senior bond, 5.875%, 2/15/26 | United States | 3,000,000 | 3,195,000 | |||||||||||||
senior secured bond, first lien, 5.875%, 3/15/22 | United States | 5,000,000 | 5,556,250 | |||||||||||||
senior secured bond, first lien, 5.25%, 4/15/25 | United States | 10,000,000 | 10,771,900 | |||||||||||||
i MPH Acquisition Holdings LLC, senior note, 144A, 7.125%, 6/01/24 | United States | 11,100,000 | 11,960,250 | |||||||||||||
Stryker Corp., senior bond, 3.50%, 3/15/26 | United States | 4,800,000 | 4,897,656 | |||||||||||||
Tenet Healthcare Corp., senior note, 5.50%, 3/01/19 | United States | 7,000,000 | 7,105,000 | |||||||||||||
senior note, 8.125%, 4/01/22 | United States | 5,000,000 | 5,100,000 | |||||||||||||
senior note, 6.75%, 6/15/23 | United States | 2,700,000 | 2,585,250 | |||||||||||||
|
| |||||||||||||||
|
112,419,606 |
| ||||||||||||||
|
| |||||||||||||||
Household & Personal Products 0.3% | ||||||||||||||||
The Procter & Gamble Co., senior note, 2.45%, 11/03/26 | United States | 19,000,000 | 18,425,725 | |||||||||||||
|
| |||||||||||||||
Insurance 1.1% | ||||||||||||||||
MetLife Inc., senior note, 3.60%, 4/10/24 | United States | 24,200,000 | 25,245,053 | |||||||||||||
senior note, 3.00%, 3/01/25 | United States | 2,400,000 | 2,391,542 | |||||||||||||
i Nippon Life Insurance Co., sub. bond, 144A, 5.10% to 10/16/24, FRN thereafter, 10/16/44 | Japan | 35,000,000 | 37,228,625 | |||||||||||||
Prudential Financial Inc., 3.50%, 5/15/24 | United States | 9,900,000 | 10,299,069 | |||||||||||||
|
| |||||||||||||||
|
75,164,289 |
| ||||||||||||||
|
| |||||||||||||||
Materials 5.4% | ||||||||||||||||
ArcelorMittal, senior note, 6.25%, 3/01/21 | France | 17,600,000 | 19,252,640 | |||||||||||||
senior note, 6.125%, 6/01/25 | France | 2,700,000 | 3,040,875 | |||||||||||||
i,j ARD Finance SA, senior secured note, 144A, PIK, 7.125%, 9/15/23 | Luxembourg | 1,300,000 | 1,355,250 | |||||||||||||
i Ardagh Packaging Finance PLC/Ardagh MP Holdings USA Inc., senior note, 144A, 6.00%, 6/30/21 | Luxembourg | 5,100,000 | 5,291,250 | |||||||||||||
senior note, 144A, 6.00%, 2/15/25 | Luxembourg | 11,500,000 | 11,701,250 | |||||||||||||
i Barminco Finance Pty. Ltd., senior note, 144A, 9.00%, 6/01/18 | Australia | 15,000,000 | 16,143,750 | |||||||||||||
i BWAY Holding Co., senior note, 144A, 7.25%, 4/15/25 | United States | 21,200,000 | 21,226,500 | |||||||||||||
i Cemex Finance LLC, senior secured note, first lien, 144A, 6.00%, 4/01/24 | Mexico | 5,800,000 | 6,157,599 | |||||||||||||
i Cemex SAB de CV, first lien, 144A, 5.70%, 1/11/25 | Mexico | 15,000,000 | 15,782,475 | |||||||||||||
senior secured bond, first lien, 144A, 6.125%, 5/05/25 | Mexico | 4,000,000 | 4,297,180 | |||||||||||||
20 | Annual Report | franklintempleton.com | ||
FRANKLIN STRATEGIC SERIES
CONSOLIDATED STATEMENT OF INVESTMENTS
Franklin Strategic Income Fund (continued)
| Country | Principal Amount* | Value | ||||||||||||||
| ||||||||||||||||
Corporate Bonds (continued) |
| |||||||||||||||
Materials (continued) | ||||||||||||||||
i Ceramtec Group GmbH, senior note, 144A, 8.25%, 8/15/21 | Germany | 11,900,000 | EUR | $ | 13,780,939 | |||||||||||
The Chemours Co., senior note, 6.625%, 5/15/23 | United States | 21,000,000 | 22,575,000 | |||||||||||||
i First Quantum Minerals Ltd., senior note, 144A, 7.00%, 2/15/21 | Canada | 10,000,000 | 10,400,000 | |||||||||||||
senior note, 144A, 7.25%, 4/01/23 | Canada | 5,300,000 | 5,409,313 | |||||||||||||
Freeport-McMoRan Inc., senior note, 4.55%, 11/14/24 | United States | 26,000,000 | 24,557,000 | |||||||||||||
i Glencore Finance Canada Ltd., senior bond, 144A, 4.95%, 11/15/21 | Switzerland | 13,300,000 | 14,306,065 | |||||||||||||
i Glencore Funding LLC, senior note, 144A, 4.125%, 5/30/23 | Switzerland | 5,000,000 | 5,143,925 | |||||||||||||
senior note, 144A, 4.625%, 4/29/24 | Switzerland | 2,500,000 | 2,622,218 | |||||||||||||
i INVISTA Finance LLC, senior secured note, 144A, 4.25%, 10/15/19 | United States | 30,000,000 | 30,975,000 | |||||||||||||
LYB International Finance BV, senior note, 4.00%, 7/15/23 | United States | 20,400,000 | 21,443,154 | |||||||||||||
i Novelis Corp., senior bond, 144A, 5.875%, 9/30/26 | United States | 15,400,000 | 15,862,000 | |||||||||||||
i Owens-Brockway Glass Container Inc., senior note, 144A, 5.00%, 1/15/22 | United States | 7,800,000 | 8,131,500 | |||||||||||||
senior note, 144A, 5.875%, 8/15/23 | United States | 12,500,000 | 13,398,437 | |||||||||||||
Reynolds Group Issuer Inc./Reynolds Group Issuer LLC/Reynolds Group Issuer Luxembourg SA, first lien, 5.75%, 10/15/20 | United States | 6,600,000 | 6,806,250 | |||||||||||||
ifirst lien, 144A, 5.125%, 7/15/23 | United States | 5,900,000 | 6,158,125 | |||||||||||||
isenior note, 144A, 7.00%, 7/15/24 | United States | 5,600,000 | 6,037,500 | |||||||||||||
i,nsenior secured note, first lien, 144A, FRN, 4.658%, 7/15/21 | United States | 6,500,000 | 6,662,500 | |||||||||||||
i Sealed Air Corp., senior bond, 144A, 5.125%, 12/01/24 | United States | 11,300,000 | 11,893,250 | |||||||||||||
senior bond, 144A, 5.50%, 9/15/25 | United States | 2,600,000 | 2,788,500 | |||||||||||||
senior note, 144A, 4.875%, 12/01/22 | United States | 11,300,000 | 11,822,625 | |||||||||||||
Steel Dynamics Inc., senior bond, 5.50%, 10/01/24 | United States | 9,700,000 | 10,269,875 | |||||||||||||
senior note, 5.125%, 10/01/21 | United States | 9,200,000 | 9,545,000 | |||||||||||||
|
| |||||||||||||||
|
364,836,945 |
| ||||||||||||||
|
| |||||||||||||||
Media 5.2% | ||||||||||||||||
21st Century Fox America Inc., senior note, 3.00%, 9/15/22 | United States | 6,100,000 | 6,188,249 | |||||||||||||
i Altice U.S. Finance I Corp., senior secured bond, 144A, 5.50%, 5/15/26 | United States | 22,000,000 | 22,797,500 | |||||||||||||
AMC Networks Inc., senior note, 5.00%, 4/01/24 | United States | 18,000,000 | 18,281,700 | |||||||||||||
CCO Holdings LLC/CCO Holdings Capital Corp., senior bond, 5.25%, 9/30/22 | United States | 15,000,000 | 15,600,000 | |||||||||||||
isenior bond, 144A, 5.375%, 5/01/25 | United States | 13,000,000 | 13,585,000 | |||||||||||||
Clear Channel Worldwide Holdings Inc., senior note, 6.50%, 11/15/22 | United States | 3,000,000 | 3,075,000 | |||||||||||||
senior note, 6.50%, 11/15/22 | United States | 5,000,000 | 5,206,250 | |||||||||||||
senior sub. note, 7.625%, 3/15/20 | United States | 900,000 | 897,750 | |||||||||||||
senior sub. note, 7.625%, 3/15/20 | United States | 6,400,000 | 6,496,000 | |||||||||||||
CSC Holdings LLC, senior note, 6.75%, 11/15/21 | United States | 22,000,000 | 24,255,000 | |||||||||||||
DISH DBS Corp., senior bond, 5.00%, 3/15/23 | United States | 10,000,000 | 10,050,000 | |||||||||||||
senior note, 6.75%, 6/01/21 | United States | 4,000,000 | 4,360,000 | |||||||||||||
senior note, 5.875%, 7/15/22 | United States | 3,000,000 | 3,185,370 | |||||||||||||
senior note, 5.875%, 11/15/24 | United States | 5,000,000 | 5,262,500 | |||||||||||||
franklintempleton.com | Annual Report | 21 | ||
FRANKLIN STRATEGIC SERIES
CONSOLIDATED STATEMENT OF INVESTMENTS
Franklin Strategic Income Fund (continued)
| Country | Principal Amount* | Value | ||||||||||||||
| ||||||||||||||||
Corporate Bonds (continued) |
| |||||||||||||||
Media (continued) | ||||||||||||||||
iHeartCommunications Inc., senior secured bond, first lien, 9.00%, 3/01/21 | United States | 13,000,000 | $ | 9,928,750 | ||||||||||||
senior secured note, first lien, 9.00%, 9/15/22 | United States | 8,100,000 | 6,145,875 | |||||||||||||
i Nexstar Broadcasting Inc., senior note, 144A, 5.625%, 8/01/24 | United States | 21,300,000 | 21,885,750 | |||||||||||||
i Sirius XM Radio Inc., senior bond, 144A, 6.00%, 7/15/24 | United States | 14,600,000 | 15,658,500 | |||||||||||||
senior bond, 144A, 5.375%, 4/15/25 | United States | 10,000,000 | 10,287,500 | |||||||||||||
Tegna Inc., senior bond, 6.375%, 10/15/23 | United States | 12,000,000 | 12,795,000 | |||||||||||||
isenior bond, 144A, 5.50%, 9/15/24 | United States | 2,800,000 | 2,884,000 | |||||||||||||
senior note, 5.125%, 7/15/20 | United States | 9,800,000 | 10,130,750 | |||||||||||||
Time Warner Cable LLC, senior note, 4.00%, 9/01/21 | United States | 15,600,000 | 16,305,963 | |||||||||||||
Time Warner Inc., senior bond, 2.95%, 7/15/26 | United States | 25,400,000 | 23,877,143 | |||||||||||||
i Unitymedia Hessen GmbH & Co. KG/Unitymedia NRW GmbH, senior secured bond, first lien, 144A, 5.75%, 1/15/23 | Germany | 2,997,000 | EUR | 3,463,040 | ||||||||||||
senior secured note, first lien, 144A, 5.625%, 4/15/23 | Germany | 1,520,000 | EUR | 1,764,874 | ||||||||||||
i Unitymedia KabelBW GmbH, senior bond, 144A, 6.125%, 1/15/25 | Germany | 18,000,000 | 19,215,000 | |||||||||||||
i Univision Communications Inc., senior secured note, first lien, 144A, 5.125%, 2/15/25 | United States | 25,000,000 | 25,000,000 | |||||||||||||
i Virgin Media Finance PLC, senior bond, 144A, 6.375%, 10/15/24 | United Kingdom | 9,600,000 | GBP | 13,401,630 | ||||||||||||
i Virgin Media Secured Finance PLC, senior secured bond, first lien, 144A, 5.50%, 1/15/25 | United Kingdom | 14,000,000 | 14,472,500 | |||||||||||||
i Ziggo Secured Finance BV, senior secured bond, 144A, 4.25%, 1/15/27 | Netherlands | 8,600,000 | EUR | 9,910,246 | ||||||||||||
|
| |||||||||||||||
|
356,366,840 |
| ||||||||||||||
|
| |||||||||||||||
Pharmaceuticals, Biotechnology & Life Sciences 1.7% | ||||||||||||||||
Actavis Funding SCS, senior bond, 3.80%, 3/15/25 | United States | 25,000,000 | 25,485,300 | |||||||||||||
Baxalta Inc., senior note, 4.00%, 6/23/25 | United States | 25,000,000 | 25,756,425 | |||||||||||||
Biogen Inc., senior note, 3.625%, 9/15/22 | United States | 14,900,000 | 15,542,399 | |||||||||||||
i Endo Dac/Endo Finance LLC/Endo Finco Inc., senior bond, 144A, 6.00%, 2/01/25 | United States | 11,900,000 | 10,109,050 | |||||||||||||
senior note, 144A, 6.00%, 7/15/23 | United States | 5,000,000 | 4,406,250 | |||||||||||||
i Jaguar Holding Co. II/Pharmaceutical Product Development LLC, senior note, 144A, 6.375%, 8/01/23 | United States | 12,900,000 | 13,480,500 | |||||||||||||
i Valeant Pharmaceuticals International, senior note, 144A, 6.375%, 10/15/20 | United States | 9,000,000 | 7,773,750 | |||||||||||||
i Valeant Pharmaceuticals International Inc., senior bond, 144A, 6.125%, 4/15/25 | United States | 3,100,000 | 2,300,200 | |||||||||||||
senior note, 144A, 5.50%, 3/01/23 | United States | 8,000,000 | 5,940,000 | |||||||||||||
senior note, 144A, 7.00%, 3/15/24 | United States | 2,100,000 | 2,147,250 | |||||||||||||
|
| |||||||||||||||
|
112,941,124 |
| ||||||||||||||
|
| |||||||||||||||
Real Estate 0.9% | ||||||||||||||||
American Tower Corp., senior bond, 3.375%, 10/15/26 | United States | 28,900,000 | 28,203,568 | |||||||||||||
Equinix Inc., senior bond, 5.375%, 4/01/23 | United States | 25,000,000 | 26,156,250 | |||||||||||||
MPT Operating Partnership LP/MPT Finance Corp., senior bond, 5.25%, 8/01/26 | United States | 4,200,000 | 4,326,000 | |||||||||||||
|
| |||||||||||||||
|
58,685,818 |
| ||||||||||||||
|
| |||||||||||||||
22 | Annual Report | franklintempleton.com | ||
FRANKLIN STRATEGIC SERIES
CONSOLIDATED STATEMENT OF INVESTMENTS
Franklin Strategic Income Fund (continued)
| Country | Principal Amount* | Value | ||||||||||||||
| ||||||||||||||||
Corporate Bonds (continued) |
| |||||||||||||||
Retailing 0.8% | ||||||||||||||||
Home Depot Inc., senior note, 2.125%, 9/15/26 | United States | 15,000,000 | $ | 14,095,260 | ||||||||||||
i,j K2016470219 South Africa Ltd., senior secured note, 144A, PIK, 3.00%, 12/31/22 | South Africa | 9,289,110 | 882,465 | |||||||||||||
i,j K2016740260 South Africa Ltd., senior secured note, 144A, PIK, 25.00%, 12/31/22 | South Africa | 1,341,707 | 1,818,013 | |||||||||||||
Netflix Inc., senior bond, 5.875%, 2/15/25 | United States | 10,000,000 | 10,875,000 | |||||||||||||
isenior bond, 144A, 4.375%, 11/15/26 | United States | 11,800,000 | 11,652,500 | |||||||||||||
i PetSmart Inc., senior note, 144A, 7.125%, 3/15/23 | United States | 20,000,000 | 18,300,000 | |||||||||||||
|
| |||||||||||||||
|
57,623,238 |
| ||||||||||||||
|
| |||||||||||||||
Semiconductors & Semiconductor Equipment 0.2% | ||||||||||||||||
Qorvo Inc., senior bond, 7.00%, 12/01/25 | United States | 4,300,000 | 4,794,500 | |||||||||||||
senior note, 6.75%, 12/01/23 | United States | 10,000,000 | 10,887,500 | |||||||||||||
|
| |||||||||||||||
|
15,682,000 |
| ||||||||||||||
|
| |||||||||||||||
Software & Services 1.3% | ||||||||||||||||
i BMC Software Finance Inc., senior note, 144A, 8.125%, 7/15/21 | United States | 22,000,000 | 22,481,360 | |||||||||||||
i First Data Corp., second lien, 144A, 5.75%, 1/15/24 | United States | 22,400,000 | 23,324,000 | |||||||||||||
senior note, 144A, 7.00%, 12/01/23 | United States | 7,500,000 | 8,060,250 | |||||||||||||
Fiserv Inc., senior bond, 3.85%, 6/01/25 | United States | 8,400,000 | 8,718,385 | |||||||||||||
Infor (U.S.) Inc., senior note, 6.50%, 5/15/22 | United States | 20,000,000 | 20,900,000 | |||||||||||||
i Symantec Corp., senior note, 144A, 5.00%, 4/15/25 | United States | 5,500,000 | 5,699,375 | |||||||||||||
|
| |||||||||||||||
|
89,183,370 |
| ||||||||||||||
|
| |||||||||||||||
Technology Hardware & Equipment 0.9% | ||||||||||||||||
i CommScope Technologies LLC, senior bond, 144A, 6.00%, 6/15/25 | United States | 16,600,000 | 17,782,750 | |||||||||||||
i Diamond 1 Finance Corp./Diamond 2 Finance Corp., senior note, 144A, 5.875%, 6/15/21 | United States | 2,500,000 | 2,656,250 | |||||||||||||
senior note, 144A, 7.125%, 6/15/24 | United States | 12,600,000 | 13,933,975 | |||||||||||||
Western Digital Corp., senior note, 10.50%, 4/01/24 | United States | 25,700,000 | 30,390,250 | |||||||||||||
|
| |||||||||||||||
|
64,763,225 |
| ||||||||||||||
|
| |||||||||||||||
Telecommunication Services 3.6% | ||||||||||||||||
AT&T Inc., senior bond, 3.40%, 5/15/25 | United States | 20,000,000 | 19,509,800 | |||||||||||||
CenturyLink Inc., senior bond, 6.75%, 12/01/23 | United States | 5,000,000 | 5,375,000 | |||||||||||||
senior bond, 5.625%, 4/01/25 | United States | 10,000,000 | 9,800,000 | |||||||||||||
senior note, 5.80%, 3/15/22. | United States | 2,000,000 | 2,100,000 | |||||||||||||
i Digicel Group Ltd., senior note, 144A, 8.25%, 9/30/20 | Bermuda | 10,000,000 | 9,203,150 | |||||||||||||
senior note, 144A, 7.125%, 4/01/22 | Bermuda | 3,000,000 | 2,520,270 | |||||||||||||
i Digicel Ltd., senior note, 144A, 6.00%, 4/15/21 | Bermuda | 10,000,000 | 9,545,450 | |||||||||||||
i Hughes Satellite Systems Corp., senior bond, 144A, 6.625%, 8/01/26 | United States | 17,200,000 | 17,716,000 | |||||||||||||
�� Intelsat Jackson Holdings SA, senior note, 7.25%, 10/15/20 | Luxembourg | 15,000,000 | 14,118,000 | |||||||||||||
senior note, 7.50%, 4/01/21 | Luxembourg | 5,000,000 | 4,600,000 | |||||||||||||
franklintempleton.com | Annual Report | 23 | ||
FRANKLIN STRATEGIC SERIES
CONSOLIDATED STATEMENT OF INVESTMENTS
Franklin Strategic Income Fund (continued)
| Country | Principal Amount* | Value | ||||||||||||||
| ||||||||||||||||
Corporate Bonds (continued) |
| |||||||||||||||
Telecommunication Services (continued) | ||||||||||||||||
i Millicom International Cellular SA, senior note, 144A, 6.625%, 10/15/21 | Luxembourg | 21,800,000 | $ | 22,853,812 | ||||||||||||
Sprint Communications Inc., senior note, 6.00%, 11/15/22 | United States | 10,000,000 | 10,443,750 | |||||||||||||
isenior note, 144A, 9.00%, 11/15/18 | United States | 2,200,000 | 2,411,750 | |||||||||||||
isenior note, 144A, 7.00%, 3/01/20 | United States | 5,000,000 | 5,475,000 | |||||||||||||
i Sprint Spectrum Co. LLC/Sprint Spectrum Co. II LLC, 144A, 3.36%, 3/20/23 | United States | 15,800,000 | 15,945,519 | |||||||||||||
T-Mobile USA Inc., senior bond, 6.50%, 1/15/24 | United States | 5,000,000 | 5,425,000 | |||||||||||||
senior bond, 6.375%, 3/01/25 | United States | 14,700,000 | 16,101,204 | |||||||||||||
senior note, 6.125%, 1/15/22 | United States | 2,000,000 | 2,117,500 | |||||||||||||
senior note, 6.00%, 4/15/24 | United States | 4,200,000 | 4,561,200 | |||||||||||||
senior note, 5.125%, 4/15/25 | United States | 6,000,000 | 6,337,500 | |||||||||||||
Verizon Communications Inc., senior note, 5.15%, 9/15/23 | United States | 22,000,000 | 24,333,474 | |||||||||||||
i Wind Acquisition Finance SA, senior secured note, 144A, 4.00%, 7/15/20 | Italy | 14,400,000 | EUR | 15,937,131 | ||||||||||||
senior secured note, 144A, 7.00%, 4/23/21 | Italy | 17,300,000 | EUR | 19,616,684 | ||||||||||||
|
| |||||||||||||||
|
246,047,194 |
| ||||||||||||||
|
| |||||||||||||||
Transportation 0.8% | ||||||||||||||||
FedEx Corp., senior bond, 3.25%, 4/01/26. | United States | 25,400,000 | 25,494,336 | |||||||||||||
i Florida East Coast Holdings Corp., secured note, first lien, 144A, 6.75%, 5/01/19 | United States | 7,600,000 | 7,831,800 | |||||||||||||
senior note, 144A, 9.75%, 5/01/20 | United States | 4,000,000 | 4,280,000 | |||||||||||||
United Airlines Pass Through Trust, second lien, 2016-1, A, 3.45%, 1/07/30 | United States | 13,800,000 | 13,886,250 | |||||||||||||
|
| |||||||||||||||
|
51,492,386 |
| ||||||||||||||
|
| |||||||||||||||
Utilities 2.9% | ||||||||||||||||
Calpine Corp., senior bond, 5.75%, 1/15/25 | United States | 9,000,000 | 8,685,000 | |||||||||||||
senior note, 5.375%, 1/15/23 | United States | 10,000,000 | 9,900,000 | |||||||||||||
isenior secured bond, first lien, 144A, 5.875%, 1/15/24 | United States | 2,000,000 | 2,110,000 | |||||||||||||
Dominion Resources Inc., senior bond, 2.85%, 8/15/26 | United States | 11,400,000 | 10,812,022 | |||||||||||||
i Dynegy Inc., senior note, 144A, 8.00%, 1/15/25 | United States | 28,300,000 | 26,248,250 | |||||||||||||
h,i EDF SA, junior sub. bond, 144A, 5.625% to 1/22/24, FRN thereafter, Perpetual | France | 5,000,000 | 4,992,700 | |||||||||||||
sub. note, 144A, 5.25% to 1/29/23, FRN thereafter, Perpetual | France | 25,000,000 | 25,019,500 | |||||||||||||
Exelon Corp., senior bond, 3.95%, 6/15/25 | United States | 18,500,000 | 19,245,236 | |||||||||||||
i InterGen NV, secured bond, 144A, 7.00%, 6/30/23 | Netherlands | 25,000,000 | 23,375,000 | |||||||||||||
Sempra Energy, senior bond, 3.55%, 6/15/24 | United States | 8,800,000 | 9,018,583 | |||||||||||||
senior note, 3.75%, 11/15/25 | United States | 12,300,000 | 12,644,904 | |||||||||||||
The Southern Co., senior bond, 3.25%, 7/01/26 | United States | 32,300,000 | 31,499,025 | |||||||||||||
i Talen Energy Supply LLC, senior note, 144A, 9.50%, 7/15/22 | United States | 13,400,000 | 12,562,500 | |||||||||||||
|
| |||||||||||||||
|
196,112,720 |
| ||||||||||||||
|
| |||||||||||||||
Total Corporate Bonds (Cost $3,118,313,689) |
|
3,142,558,813 |
| |||||||||||||
|
| |||||||||||||||
24 | Annual Report | franklintempleton.com | ||
FRANKLIN STRATEGIC SERIES
CONSOLIDATED STATEMENT OF INVESTMENTS
Franklin Strategic Income Fund (continued)
| Country | Principal Amount* | Value | ||||||||||||||
| ||||||||||||||||
n,o Senior Floating Rate Interests 9.5% |
| |||||||||||||||
Automobiles & Components 0.4% | ||||||||||||||||
The Goodyear Tire & Rubber Co., Second Lien Term Loan, 2.99%, 4/30/19 | United States | 1,665,012 | $ | 1,685,131 | ||||||||||||
TI Group Automotive Systems LLC, Initial US Term Loan, 3.743%, 6/30/22 | United States | 23,846,549 | 24,025,397 | |||||||||||||
|
| |||||||||||||||
| 25,710,528 | ||||||||||||||||
|
| |||||||||||||||
Capital Goods 0.2% | ||||||||||||||||
p Allison Transmission Inc., Term Loans, 2.99%, 9/23/22 | United States | 8,700,050 | 8,797,326 | |||||||||||||
Doncasters U.S. Finance LLC, Second Lien Term Loan, 9.50%, 10/09/20 | United States | 736,591 | 713,879 | |||||||||||||
Harsco Corp., Initial Term Loan, 6.00%, 11/02/23 | United States | 2,313,871 | 2,364,487 | |||||||||||||
Leidos (Abacus Innovations Corp.), B Term Loan, 3.25%, 8/16/23 | United States | 1,595,978 | 1,613,932 | |||||||||||||
|
| |||||||||||||||
| 13,489,624 | ||||||||||||||||
|
| |||||||||||||||
Commercial & Professional Services 0.1% | ||||||||||||||||
KAR Auction Services Inc., Tranche B-3 Term Loans, 4.50%, 3/09/23 | United States | 9,418,827 | 9,537,975 | |||||||||||||
Ventia Pty. Ltd., Term B Loans (USD), 4.662%, 5/21/22 | Australia | 837,670 | 846,047 | |||||||||||||
|
| |||||||||||||||
| 10,384,022 | ||||||||||||||||
|
| |||||||||||||||
Consumer Services 0.9% | ||||||||||||||||
Aristocrat Technologies Inc., Tranche B-2 Loans, 3.406%, 10/20/21 | United States | 1,676,538 | 1,692,916 | |||||||||||||
Avis Budget Car Rental LLC, Tranche B Term Loan, 3.15%, 3/15/22 | United States | 3,801,458 | 3,811,437 | |||||||||||||
p Caesars Entertainment Operating Co. LLC., Term B Loans, 5.75%, 8/31/24 | United States | 1,496,438 | 1,488,332 | |||||||||||||
p Eldorado Resorts Inc., Initial Term Loan, 5.25%, 4/17/24 | United States | 5,317,262 | 5,323,909 | |||||||||||||
Fitness International LLC, Term A Loan, 4.243%, 4/01/20 | United States | 31,843,975 | 31,843,974 | |||||||||||||
p Greektown Holdings LLC, Initial Term Loan, 6.00%, 4/25/24 | United States | 3,040,885 | 3,047,855 | |||||||||||||
Prime Security Services Borrower LLC, 2016-2 Refinancing Term B-1 Loan, 4.25%, 5/02/22 | United States | 6,570,938 | 6,645,446 | |||||||||||||
c,j Turtle Bay Holdings LLC, Term Loan B, PIK, 3.75%, 6/30/17 | United States | 4,653,944 | 4,589,952 | |||||||||||||
|
| |||||||||||||||
| 58,443,821 | ||||||||||||||||
|
| |||||||||||||||
Diversified Financials 0.1% | ||||||||||||||||
First Eagle Investment Management LLC, Initial Term Loans, 4.656%, 12/01/22 | United States | 5,255,414 | 5,283,336 | |||||||||||||
Russell Investments US Institutional Holdco Inc., Initial Term Loan, 6.75%, 6/01/23 | United States | 3,578,420 | 3,614,204 | |||||||||||||
|
| |||||||||||||||
| 8,897,540 | ||||||||||||||||
|
| |||||||||||||||
Energy 1.7% | ||||||||||||||||
Bowie Resource Holdings LLC, pFirst Lien Initial Term Loan, 6.75%, 8/14/20 | United States | 27,584,963 | 26,849,355 | |||||||||||||
Second Lien Initial Term Loan, 11.75%, 2/16/21 | United States | 16,060,827 | 14,824,144 | |||||||||||||
p Fieldwood Energy LLC, Loans, 3.875%, 10/01/18 | United States | 47,867,295 | 46,850,115 | |||||||||||||
International Seaways Inc., Initial Term Loan, 5.79%, 8/05/19 | United States | 17,322,009 | 17,307,579 | |||||||||||||
McDermott Finance LLC, Term Loan, 8.397%, 4/16/19 | United States | 1,520,032 | 1,543,783 | |||||||||||||
OSG Bulk Ships Inc., Initial Term Loan, 5.29%, 8/05/19 | United States | 9,459,728 | 9,325,712 | |||||||||||||
p UTEX Industries Inc., First Lien Initial Term Loan, 5.00%, 5/21/21 | United States | 2,279,105 | 2,111,734 | |||||||||||||
|
| |||||||||||||||
| 118,812,422 | ||||||||||||||||
|
| |||||||||||||||
Food & Staples Retailing 0.1% | ||||||||||||||||
p Aramark Corp., U.S. Term A Loan, 4.75%, 3/28/22 | United States | 6,284,308 | 6,305,914 | |||||||||||||
|
| |||||||||||||||
franklintempleton.com | Annual Report | 25 | ||
FRANKLIN STRATEGIC SERIES
CONSOLIDATED STATEMENT OF INVESTMENTS
Franklin Strategic Income Fund (continued)
| Country | Principal Amount* | Value | ||||||||||||||
| ||||||||||||||||
n,o Senior Floating Rate Interests (continued) |
| |||||||||||||||
Food, Beverage & Tobacco 0.1% | ||||||||||||||||
JBS USA LUX SA, New Initial Term Loans, 3.483%, 10/30/22 | Brazil | 1,980,891 | $ | 1,990,487 | ||||||||||||
Pinnacle Foods Finance LLC, Initial Term Loans, 2.983%, 2/03/24 | United States | 1,758,624 | 1,771,681 | |||||||||||||
|
| |||||||||||||||
| 3,762,168 | ||||||||||||||||
|
| |||||||||||||||
Health Care Equipment & Services 0.1% | ||||||||||||||||
Carestream Health Inc., Term Loan, 5.147%, 6/07/19 | United States | 4,741,176 | 4,713,028 | |||||||||||||
|
| |||||||||||||||
Household & Personal Products 0.0%† | ||||||||||||||||
Spectrum Brands Inc., Term Loans, 2.852% - 3.486%, 6/23/22 | United States | 359,358 | 362,727 | |||||||||||||
|
| |||||||||||||||
Materials 0.8% | ||||||||||||||||
Chemours Co., Tranche B-1 US Term Loans, 3.49%, 5/12/22 | United States | 28,914,054 | 29,108,327 | |||||||||||||
Cyanco Intermediate Corp., Initial Term Loan, 5.50%, 5/01/20 | United States | 7,750,335 | 7,793,931 | |||||||||||||
p FMG America Finance Inc. (Fortescue Metals Group), Loans, 3.75%, 6/30/19 | Australia | 8,997,073 | 9,063,454 | |||||||||||||
Huntsman International LLC, 2015 Extended Term B Dollar Loan, 3.993%, 4/19/19 | United States | 1,192,471 | 1,198,930 | |||||||||||||
OCI Beaumont LLC, Term B-3 Loan, 8.025%, 8/20/19 | United States | 8,784,994 | 9,059,525 | |||||||||||||
|
| |||||||||||||||
| 56,224,167 | ||||||||||||||||
|
| |||||||||||||||
Media 0.5% | ||||||||||||||||
Altice US Finance I Corp., March 2017 Refinancing TL Commitments, 3.241%, | United States | 1,986,110 | 1,986,606 | |||||||||||||
AMC Entertainment Holdings Inc., | ||||||||||||||||
2016 Incremental Term Commitments, 3.742%, 12/15/23 | United States | 771,290 | 777,750 | |||||||||||||
Initial Term Loans, 3.744%, 12/15/22 | United States | 1,203,538 | 1,212,063 | |||||||||||||
Charter Communications Operating LLC (CCO Safari), Term Loan A-1, 2.75%, 5/18/21 | United States | 9,576,000 | 9,579,419 | |||||||||||||
CSC Holdings LLC, March 2017 Incremental Term Loans, 3.244%, 7/17/25 | United States | 12,958,602 | 12,967,711 | |||||||||||||
Lions Gate Entertainment Corp., Term A Loan, 3.482%, 12/08/21 | United States | 5,314,041 | 5,343,933 | |||||||||||||
Live Nation Entertainment Inc., Term B-2 Loans, 3.50%, 10/31/23 | United States | 769,357 | 775,483 | |||||||||||||
UPC Financing Partnership, Facility AP, 3.744%, 4/15/25 | United States | 3,052,838 | 3,067,720 | |||||||||||||
|
| |||||||||||||||
| 35,710,685 | ||||||||||||||||
|
| |||||||||||||||
Pharmaceuticals, Biotechnology & Life Sciences 1.0% | ||||||||||||||||
p Endo Luxembourg Finance Co. I S.A.R.L and Endo LLC, Initial Term Loans, 7.25%, 4/27/24 | United States | 20,011,200 | 20,139,391 | |||||||||||||
Grifols Worldwide Operations USA Inc., Tranche B Term Loan, 3.195%, 1/31/25 | United States | 26,150,888 | 26,265,351 | |||||||||||||
RPI Finance Trust, Term A-2 Term Loan, 3.397%, 10/14/20 | United States | 6,528,435 | 6,540,676 | |||||||||||||
Valeant Pharmaceuticals International Inc., Series F Tranche B Term Loan, 5.74%, 4/01/22 | United States | 13,500,484 | 13,586,266 | |||||||||||||
|
| |||||||||||||||
| 66,531,684 | ||||||||||||||||
|
| |||||||||||||||
Retailing 0.9% | ||||||||||||||||
Ascena Retail Group Inc., Tranche B Term Loan, 5.50%, 8/21/22 | United States | 35,667,667 | 32,323,823 | |||||||||||||
Dollar Tree Inc., Term A-1 Loans, 2.75%, 7/06/20 | United States | 5,965,587 | 5,948,734 | |||||||||||||
p PetSmart Inc., Tranche B-2 Loans, 4.02%, 3/11/22 | United States | 21,848,935 | 20,169,298 | |||||||||||||
|
| |||||||||||||||
| 58,441,855 | ||||||||||||||||
|
| |||||||||||||||
26 | Annual Report | franklintempleton.com | ||
FRANKLIN STRATEGIC SERIES
CONSOLIDATED STATEMENT OF INVESTMENTS
Franklin Strategic Income Fund (continued)
| Country | Principal Amount* | Value | ||||||||||||||
| ||||||||||||||||
n,o Senior Floating Rate Interests (continued) |
| |||||||||||||||
Semiconductors & Semiconductor Equipment 0.4% | ||||||||||||||||
MACOM Technology Solutions Holdings Inc., Initial Term Loans, 3.989%, 5/07/21 | United States | 7,200,956 | $ | 7,308,970 | ||||||||||||
MKS Instruments Inc., Tranche B-2 Term Loans, 3.743%, 5/01/23 | United States | 4,492,375 | 4,545,722 | |||||||||||||
ON Semiconductor Corp., 2017 Replacement Term Loans, 3.243%, 3/31/23 | United States | 18,172,822 | 18,299,378 | |||||||||||||
|
| |||||||||||||||
| 30,154,070 | ||||||||||||||||
|
| |||||||||||||||
Software & Services 0.7% | ||||||||||||||||
Global Payments Inc., Delayed Draw Term Loan (A-2), 3.196%, 10/31/21 | United States | 11,053,194 | 11,073,919 | |||||||||||||
MoneyGram International Inc., Term Loan, 4.397%, 3/27/20 | United States | 34,128,636 | 34,206,859 | |||||||||||||
Rackspace Hosting Inc., 2016 Refinancing Term B Loan, 4.535%, 11/03/23 | United States | 3,856,451 | 3,888,186 | |||||||||||||
|
| |||||||||||||||
| 49,168,964 | ||||||||||||||||
|
| |||||||||||||||
Technology Hardware & Equipment 0.4% | ||||||||||||||||
Ciena Corp., Refinancing Term Loan, 3.493%, 1/28/22 | United States | 1,858,782 | 1,873,885 | |||||||||||||
Dell International LLC, Term A-3 Loan, 3.00%, 12/31/18 | United States | 9,738,459 | 9,763,818 | |||||||||||||
Western Digital Corp., US Term B-2 Loan, 3.743%, 4/29/23 | United States | 9,835,105 | 9,926,079 | |||||||||||||
Zebra Technologies Corp., Second Amendment Refinancing Term Loan, 3.60%, 10/27/21 | United States | 3,036,717 | 3,069,942 | |||||||||||||
|
| |||||||||||||||
| 24,633,724 | ||||||||||||||||
|
| |||||||||||||||
Telecommunication Services 0.1% | ||||||||||||||||
Consolidated Communications Inc., Initial Term Loan, 4.00%, 10/05/23 | United States | 2,396,019 | 2,416,385 | |||||||||||||
Global Tel*Link Corp., Term Loan, 5.00%, 5/23/20 | United States | 2,834,035 | 2,834,035 | |||||||||||||
|
| |||||||||||||||
| 5,250,420 | ||||||||||||||||
|
| |||||||||||||||
Transportation 0.5% | ||||||||||||||||
Air Canada, Term Loan, 3.90%, 10/06/23 | Canada | 550,559 | 554,918 | |||||||||||||
p The Hertz Corp., Tranche B-1 Term Loan, 3.743%, 6/30/23 | United States | 18,323,122 | 18,367,501 | |||||||||||||
Navios Maritime Midstream Partners LP and Navios Maritime Midstream Partners Finance (US) Inc., Term Loan, 5.66%, 6/18/20 | Marshall Islands | 13,297,885 | 13,297,885 | |||||||||||||
United Air Lines Inc., Class B Term Loans, 3.422%, 4/01/24 | United States | 3,173,715 | 3,187,105 | |||||||||||||
XPO Logistics Inc., Loans, 3.405%, 11/01/21 | United States | 940,478 | 945,533 | |||||||||||||
|
| |||||||||||||||
| 36,352,942 | ||||||||||||||||
|
| |||||||||||||||
Utilities 0.5% | ||||||||||||||||
Calpine Construction Finance Co. LP, Term B-1 Loan, 3.24%, 5/03/20 .. | United States | 13,234,307 | 13,283,935 | |||||||||||||
EFS Cogen Holdings I LLC (Linden), Term B Advance, 4.65%, 6/28/23. | United States | 1,700,074 | 1,714,949 | |||||||||||||
Lightstone Holdco LLC, | ||||||||||||||||
Initial Term B Loan, 5.539%, 1/30/24 | United States | 8,936,884 | 8,999,121 | |||||||||||||
Initial Term C Loan, 5.50%, 1/30/24 | United States | 551,340 | 555,180 | |||||||||||||
NRG Energy Inc., Term Loans, 3.243%, 6/30/23 | United States | 8,565,275 | 8,612,564 | |||||||||||||
|
| |||||||||||||||
| 33,165,749 | ||||||||||||||||
|
| |||||||||||||||
Total Senior Floating Rate Interests | 646,516,054 | |||||||||||||||
|
| |||||||||||||||
franklintempleton.com | Annual Report | 27 | ||
FRANKLIN STRATEGIC SERIES
CONSOLIDATED STATEMENT OF INVESTMENTS
Franklin Strategic Income Fund (continued)
| Country | Principal Amount* | Value | ||||||||||||
| ||||||||||||||
Foreign Government and Agency Securities 8.6% |
| |||||||||||||
Government of the Philippines, senior note, 3-21, 2.875%, 5/22/17 | Philippines | 900,000,000 | PHP | $ | 17,944,889 | |||||||||
Government of Hungary, 5.375%, 2/21/23 | Hungary | 16,250,000 | 18,042,781 | |||||||||||
Government of Indonesia, | ||||||||||||||
FR28, 10.00%, 7/15/17 | Indonesia | 10,200,000,000 | IDR | 773,057 | ||||||||||
FR34, 12.80%, 6/15/21 | Indonesia | 169,210,000,000 | IDR | 15,475,084 | ||||||||||
FR36, 11.50%, 9/15/19 | Indonesia | 35,400,000,000 | IDR | 2,941,368 | ||||||||||
senior bond, FR39, 11.75%, 8/15/23 | Indonesia | 29,150,000,000 | IDR | 2,711,830 | ||||||||||
senior bond, FR44, 10.00%, 9/15/24 | Indonesia | 8,340,000,000 | IDR | 728,366 | ||||||||||
senior bond, FR56, 8.375%, 9/15/26 | Indonesia | 750,000,000,000 | IDR | 61,304,325 | ||||||||||
senior bond, FR70, 8.375%, 3/15/24 | Indonesia | 140,000,000,000 | IDR | 11,292,694 | ||||||||||
Government of Malaysia, senior bond, 4.24%, 2/07/18 | Malaysia | 66,300,000 | MYR | 15,398,522 | ||||||||||
senior note, 3.58%, 9/28/18 | Malaysia | 39,800,000 | MYR | 9,211,853 | ||||||||||
Government of Mexico, | ||||||||||||||
7.75%, 12/14/17 | Mexico | 4,000,000 | q | MXN | 21,393,281 | |||||||||
M, 4.75%, 6/14/18 | Mexico | 10,000,000 | q | MXN | 51,974,240 | |||||||||
senior note, 8.50%, 12/13/18 | Mexico | 11,540,000 | q | MXN | 62,890,131 | |||||||||
senior note, M, 5.00%, 6/15/17 | Mexico | 9,500,000 | q | MXN | 50,392,511 | |||||||||
i Government of Serbia, senior note, 144A, 4.875%, 2/25/20 | Serbia | 29,400,000 | 30,693,747 | |||||||||||
senior note, 144A, 7.25%, 9/28/21 | Serbia | 15,000,000 | 17,296,425 | |||||||||||
i Government of Ukraine, | ||||||||||||||
144A, 7.75%, 9/01/22 | Ukraine | 2,200,000 | 2,172,500 | |||||||||||
144A, 7.75%, 9/01/23 | Ukraine | 4,355,000 | 4,232,625 | |||||||||||
144A, 7.75%, 9/01/24 | Ukraine | 4,355,000 | 4,169,499 | |||||||||||
144A, 7.75%, 9/01/25 | Ukraine | 4,355,000 | 4,145,285 | |||||||||||
144A, 7.75%, 9/01/26 | Ukraine | 4,355,000 | 4,112,862 | |||||||||||
144A, 7.75%, 9/01/27 | Ukraine | 4,354,000 | 4,101,033 | |||||||||||
a,r144A, VRI, GDP Linked Security, 5/31/40 | Ukraine | 20,490,000 | 7,256,738 | |||||||||||
Korea Monetary Stabilization Bond, senior note, 1.56%, 10/02/17 | South Korea | 33,000,000,000 | KRW | 29,039,654 | ||||||||||
Nota Do Tesouro Nacional, | ||||||||||||||
10.00%, 1/01/21 | Brazil | 80,000 | s | BRL | 25,273,633 | |||||||||
10.00%, 1/01/23 | Brazil | 123,902 | s | BRL | 38,872,091 | |||||||||
tIndex Linked, 6.00%, 8/15/18 | Brazil | 34,550 | s | BRL | 32,951,910 | |||||||||
tIndex Linked, 6.00%, 5/15/23 | Brazil | 33,800 | s | BRL | 32,897,331 | |||||||||
senior note, 10.00%, 1/01/19 | Brazil | 25,000 | s | BRL | 7,957,895 | |||||||||
|
| |||||||||||||
Total Foreign Government and Agency Securities | 587,648,160 | |||||||||||||
|
| |||||||||||||
U.S. Government and Agency Securities 6.4% | ||||||||||||||
U.S. Treasury Bond, | ||||||||||||||
4.50%, 5/15/17 | United States | 8,000,000 | 8,011,776 | |||||||||||
7.125%, 2/15/23 | United States | 3,000,000 | 3,852,831 | |||||||||||
6.25%, 8/15/23 | United States | 4,000,000 | 5,008,124 | |||||||||||
6.875%, 8/15/25 | United States | 1,000,000 | 1,358,027 | |||||||||||
6.50%, 11/15/26 | United States | 34,000,000 | 46,364,848 | |||||||||||
5.25%, 2/15/29 | United States | 1,750,000 | 2,266,010 | |||||||||||
3.00%, 11/15/45 | United States | 50,000,000 | 50,371,100 | |||||||||||
uIndex Linked, 0.625%, 1/15/24 | United States | 52,143,606 | 53,617,288 | |||||||||||
uIndex Linked, 2.375%, 1/15/25 | United States | 32,951,384 | 38,150,717 | |||||||||||
28 | Annual Report | franklintempleton.com | ||
FRANKLIN STRATEGIC SERIES
CONSOLIDATED STATEMENT OF INVESTMENTS
Franklin Strategic Income Fund (continued)
| Country | Principal Amount* | Value | ||||||||||||||
| ||||||||||||||||
U.S. Government and Agency Securities (continued) |
| |||||||||||||||
U.S. Treasury Note, | ||||||||||||||||
4.75%, 8/15/17 | United States | 7,000,000 | $ | 7,077,791 | ||||||||||||
3.875%, 5/15/18 | United States | 22,000,000 | 22,612,304 | |||||||||||||
3.75%, 11/15/18 | United States | 39,000,000 | 40,496,781 | |||||||||||||
2.75%, 2/15/24 | United States | 33,000,000 | 34,407,648 | |||||||||||||
2.375%, 8/15/24 | United States | 5,000,000 | 5,083,495 | |||||||||||||
uIndex Linked, 2.125%, 1/15/19 | United States | 9,076,026 | 9,485,328 | |||||||||||||
uIndex Linked, 0.625%, 7/15/21 | United States | 10,807,233 | 11,207,436 | |||||||||||||
uIndex Linked, 0.125%, 7/15/24 | United States | 92,878,024 | 92,480,785 | |||||||||||||
|
| |||||||||||||||
Total U.S. Government and Agency Securities | 431,852,289 | |||||||||||||||
|
| |||||||||||||||
Asset-Backed Securities and Commercial Mortgage- | ||||||||||||||||
Banks 1.5% | ||||||||||||||||
Banc of America Commercial Mortgage Trust, 2006-4, AJ, 5.695%, 7/10/46 | United States | 5,883,862 | 5,873,082 | |||||||||||||
n Bear Stearns ARM Trust, 2004-4, A6, FRN, 3.195%, 6/25/34 | United States | 12,024,538 | 12,167,967 | |||||||||||||
Bear Stearns Commercial Mortgage Securities Trust, 2006-PW13, AJ, 5.611%, 9/11/41 | United States | 1,186,514 | 1,185,792 | |||||||||||||
n Citibank Credit Card Issuance Trust, | ||||||||||||||||
2013-A2, A2, FRN, 1.268%, 5/26/20 | United States | 7,230,000 | 7,245,802 | |||||||||||||
2013-A4, A4, FRN, 1.408%, 7/24/20 | United States | 7,666,000 | 7,696,224 | |||||||||||||
Citigroup Commercial Mortgage Trust, | ||||||||||||||||
2006-C5, AJ, 5.482%, 10/15/49 | United States | 12,245,532 | 11,613,271 | |||||||||||||
n2007-C6, AM, FRN, 5.701%, 12/10/49 | United States | 14,650,000 | 14,842,772 | |||||||||||||
n Commercial Mortgage Trust, 2006-GG7, AJ, FRN, 5.759%, 7/10/38 | United States | 12,633,000 | 10,711,794 | |||||||||||||
CSAIL Commercial Mortgage Trust, 2015-C1, A4, 3.505%, 4/15/50 | United States | 10,050,000 | 10,389,220 | |||||||||||||
n CWABS Asset-Backed Certificates Trust, 2005-11, AF4, FRN, 4.685%, 3/25/34 | United States | 2,800,000 | 2,822,922 | |||||||||||||
n Merrill Lynch Mortgage Investors Trust, 2005-A6, 2A3, FRN, 1.371%, 8/25/35 | United States | 2,692,413 | 2,609,517 | |||||||||||||
n Morgan Stanley Capital I Trust, | ||||||||||||||||
2007-IQ16, AM, FRN, 6.11%, 12/12/49 | United States | 3,102,000 | 3,149,786 | |||||||||||||
2007-IQ16, AMA, FRN, 6.106%, 12/12/49 | United States | 12,415,000 | 12,642,638 | |||||||||||||
|
| |||||||||||||||
| 102,950,787 | ||||||||||||||||
|
| |||||||||||||||
Diversified Financials 10.2% | ||||||||||||||||
i,n Ares Enhanced Loan Investment Strategy IR Ltd., | ||||||||||||||||
2013-IRAR, A2A, 144A, FRN, 3.053%, 7/23/25 | Cayman Islands | 8,410,000 | 8,434,770 | |||||||||||||
2013-IRAR, BR, 144A, FRN, 4.053%, 7/23/25 | United States | 9,000,000 | 9,064,530 | |||||||||||||
i,n Atrium VIII, | ||||||||||||||||
8A, BR, 144A, FRN, 3.053%, 10/23/24 | Cayman Islands | 4,520,000 | 4,558,420 | |||||||||||||
8A, CR, 144A, FRN, 3.653%, 10/23/24 | Cayman Islands | 6,080,000 | 6,110,096 | |||||||||||||
i,n Atrium X, 10A, C, 144A, FRN, 3.758%, 7/16/25 | United States | 13,950,000 | 14,025,609 | |||||||||||||
i,n Atrium XI, 11A, CR, 144A, FRN, 3.303%, 10/23/25 | Cayman Islands | 15,440,000 | 15,439,846 | |||||||||||||
Banc of America Commercial Mortgage Trust, | ||||||||||||||||
2015-UBS7, A3, 3.441%, 9/15/48 | United States | 10,920,000 | 11,286,529 | |||||||||||||
2015-UBS7, A4, 3.705%, 9/15/48 | United States | 12,450,000 | 13,080,558 | |||||||||||||
franklintempleton.com | Annual Report | 29 | ||
FRANKLIN STRATEGIC SERIES
CONSOLIDATED STATEMENT OF INVESTMENTS
Franklin Strategic Income Fund (continued)
| Country | Principal Amount* | Value | ||||||||||||||
| ||||||||||||||||
Asset-Backed Securities and Commercial Mortgage- | ||||||||||||||||
Diversified Financials (continued) | ||||||||||||||||
n Bank of America Credit Card Trust, 2005-A1, A, FRN, 1.324%, 6/15/20 | United States | 9,175,000 | $ | 9,193,389 | ||||||||||||
i,n BCAP LLC Trust, 2009-RR1, 2A2, 144A, FRN, 3.098%, 5/26/35 | United States | 9,473,234 | 8,960,267 | |||||||||||||
i BlueMountain CLO Ltd., n2012-2A, BR, 144A, FRN, 2.952%, 11/20/28 | Cayman Islands | 6,710,000 | 6,744,556 | |||||||||||||
2012-2A, CR, 144A, 3.652%, 11/20/28 | Cayman Islands | 2,730,000 | 2,746,435 | |||||||||||||
i,n Burnham Park CLO Ltd., | ||||||||||||||||
2016-1A, A, 144A, FRN, 2.586%, 10/20/29 | Cayman Islands | 4,590,000 | 4,591,331 | |||||||||||||
2016-1A, B, 144A, FRN, 2.956%, 10/20/29 | Cayman Islands | 6,000,000 | 5,981,640 | |||||||||||||
2016-1A, C, 144A, FRN, 3.556%, 10/20/29 | Cayman Islands | 6,000,000 | 6,007,260 | |||||||||||||
n Capital One Multi-Asset Execution Trust, | ||||||||||||||||
2014-A3, A3, FRN, 1.374%, 1/18/22 | United States | 4,265,000 | 4,286,331 | |||||||||||||
2016-A1, A1, FRN, 1.444%, 2/15/22 | United States | 32,250,000 | 32,465,133 | |||||||||||||
2016-A2, A2, FRN, 1.624%, 2/15/24 | United States | 44,033,000 | 44,607,133 | |||||||||||||
i,n Carlyle Global Market Strategies CLO Ltd., | ||||||||||||||||
2012-4A, BR, 144A, FRN, 3.056%, 1/20/29 | United States | 6,540,000 | 6,576,362 | |||||||||||||
2012-4A, C1R, 144A, FRN, 3.756%, 1/20/29 | United States | 6,330,000 | 6,359,055 | |||||||||||||
i,n Catamaran CLO Ltd., | ||||||||||||||||
2013-1A, C, 144A, FRN, 3.77%, 1/27/25 | United States | 11,250,000 | 11,250,900 | |||||||||||||
2014-2A, BR, 144A, FRN, 4.108%, 10/18/26 | Cayman Islands | 11,770,000 | 11,798,954 | |||||||||||||
i,n Cent CDO Ltd., 2007-15A, A2B, 144A, FRN, 1.46%, 3/11/21 | United States | 3,881,000 | 3,758,011 | |||||||||||||
i,n Cent CLO 20 Ltd., 13-20A, AR, 144A, FRN, 2.256%, 1/25/26 | Cayman Islands | 2,000,000 | 2,000,000 | |||||||||||||
i,n Cent CLO LP, | ||||||||||||||||
2013-17A, B, 144A, FRN, 4.039%, 1/30/25 | United States | 7,450,980 | 7,468,564 | |||||||||||||
2014-22A, A2AR, 144A, FRN, 2.984%, 11/07/26 | Cayman Islands | 5,224,000 | 5,248,553 | |||||||||||||
2014-22A, BR, 144A, FRN, 3.984%, 11/07/26 | United States | 4,416,410 | 4,417,072 | |||||||||||||
n Chase Issuance Trust, | ||||||||||||||||
2012-A10, A10, FRN, 1.254%, 12/16/19 | United States | 5,205,000 | 5,211,139 | |||||||||||||
2013-A6, A6, FRN, 1.414%, 7/15/20 | United States | 12,040,000 | 12,086,453 | |||||||||||||
i,n Cole Park CLO Ltd., 15-1A, B, 144A, FRN, 3.406%, 10/20/28 | Cayman Islands | 3,530,000 | 3,557,287 | |||||||||||||
i Core Industrial Trust, 2015-CALW, A, 144A, 3.04%, 2/10/34 | United States | 15,065,000 | 15,483,599 | |||||||||||||
i,n Cumberland Park CLO Ltd., | ||||||||||||||||
2015-2A, B, 144A, FRN, 3.256%, 7/20/26 | United States | 12,270,000 | 12,319,693 | |||||||||||||
2015-2A, C, 144A, FRN, 4.006%, 7/20/26 | United States | 1,850,000 | 1,854,181 | |||||||||||||
n Discover Card Execution Note Trust, 2016-A2, A2, FRN, 1.534%, 9/15/21 | United States | 32,250,000 | 32,497,570 | |||||||||||||
i,n Dryden 33 Senior Loan Fund, | ||||||||||||||||
2014-33A, BR, 144A, FRN, 3.008%, 10/15/28 | Cayman Islands | 7,030,000 | 7,038,506 | |||||||||||||
2014-33A, CR, 144A, FRN, 3.658%, 10/15/28 | United States | 3,530,000 | 3,556,440 | |||||||||||||
i,n Dryden 34 Senior Loan Fund, 14-34A, AR, 144A, FRN, 2.318%, 10/15/26 | Cayman Islands | 2,000,000 | 2,000,720 | |||||||||||||
i,n Dryden XXV Senior Loan Fund, 2012-25A, CR, 144A, FRN, 3.658%, 1/15/25 | Cayman Islands | 4,949,000 | 4,973,696 | |||||||||||||
i,n Eaton Vance CDO Ltd., 2014-1A, AR, 144A, FRN, 2.358%, 7/15/26 | United States | 17,022,000 | 17,029,830 | |||||||||||||
i,n Eleven Madison Trust Mortgage Trust, 2015-11MD, A, 144A, FRN, 3.555%, 9/10/35 | United States | 14,920,000 | 15,532,738 | |||||||||||||
n FHLMC Structured Agency Credit Risk Debt Notes, | ||||||||||||||||
2014-DN1, M2, FRN, 3.191%, 2/25/24 | United States | 13,000,000 | 13,375,981 | |||||||||||||
2014-DN4, M3, FRN, 5.541%, 10/25/24 | United States | 8,100,000 | 8,936,202 | |||||||||||||
2014-HQ2, M2, FRN, 3.191%, 9/25/24 | United States | 14,600,000 | 15,064,738 | |||||||||||||
2015-HQ1, M2, FRN, 3.191%, 3/25/25 | United States | 6,214,224 | 6,300,610 | |||||||||||||
30 | Annual Report | franklintempleton.com | ||
FRANKLIN STRATEGIC SERIES
CONSOLIDATED STATEMENT OF INVESTMENTS
Franklin Strategic Income Fund (continued)
| Country | Principal Amount* | Value | ||||||||||||||
| ||||||||||||||||
Asset-Backed Securities and Commercial Mortgage- Backed Securities (continued) | ||||||||||||||||
Diversified Financials (continued) | ||||||||||||||||
n FHLMC Structured Agency Credit Risk Debt Notes, (continued) | ||||||||||||||||
2015-HQ1, M3, FRN, 4.791%, 3/25/25 | United States | 3,880,000 | $ | 4,213,315 | ||||||||||||
i,n Flagship CLO VIII Ltd., 2014-8A, AR, 144A, FRN, 2.408%, 1/16/26 | Cayman Islands | 6,880,000 | 6,890,526 | |||||||||||||
n FNMA Connecticut Avenue Securities, | ||||||||||||||||
2014-C03, 1M2, FRN, 3.991%, 7/25/24 | United States | 7,360,000 | 7,748,230 | |||||||||||||
2015-C01, 1M2, FRN, 5.291%, 2/25/25 | United States | 9,941,260 | 10,862,191 | |||||||||||||
2015-C01, 2M2, FRN, 5.541%, 2/25/25 | United States | 21,232,958 | 23,054,711 | |||||||||||||
2015-C02, 1M2, FRN, 4.991%, 5/25/25 | United States | 12,036,663 | 13,057,131 | |||||||||||||
2015-C02, 2M2, FRN, 4.991%, 5/25/25 | United States | 14,588,558 | 15,657,433 | |||||||||||||
2015-C03, 2M2, FRN, 5.991%, 7/25/25 | United States | 20,410,000 | 22,744,190 | |||||||||||||
2017-C01, 1M2, FRN, 4.541%, 7/25/29 | United States | 20,720,000 | 21,496,086 | |||||||||||||
i,n Galaxy CLO Ltd., | ||||||||||||||||
2014-17A, AR, 144A, FRN, 2.558%, 7/15/26 | Cayman Islands | 9,540,000 | 9,570,719 | |||||||||||||
2014-17A, BR, 144A, FRN, 2.958%, 7/15/26 | Cayman Islands | 6,190,000 | 6,206,837 | |||||||||||||
2014-17A, C1R, 144A, FRN, 3.558%, 7/15/26 | Cayman Islands | 3,070,000 | 3,055,295 | |||||||||||||
i G-Force LLC, 2005-RRA, C, 144A, 5.20%, 8/22/36 | United States | 11,144,000 | 10,939,952 | |||||||||||||
n Impac Secured Assets Trust, 2007-2, FRN, 1.241%, 4/25/37 | United States | 2,382,638 | 2,341,692 | |||||||||||||
i,n Invitation Homes Trust, 2015-SFR1, A, 144A, FRN, 2.444%, 3/17/32 | United States | 8,905,114 | 8,930,454 | |||||||||||||
JP Morgan Chase Commercial Mortgage Securities Trust, 2006-CB17, AM, 5.464%, 12/12/43 | United States | 1,031,299 | 1,031,082 | |||||||||||||
i,n LCM XVI LP, 16A, B, 144A, FRN, 3.158%, 7/15/26 | Cayman Islands | 7,650,000 | 7,657,038 | |||||||||||||
i,n LCM XVII LP, | ||||||||||||||||
2017A, BR, 144A, FRN, 3.008%, 10/15/26 | United States | 4,590,000 | 4,608,727 | |||||||||||||
2017A, CR, 144A, FRN, 3.658%, 10/15/26 | United States | 4,240,000 | 4,249,625 | |||||||||||||
n MortgageIT Trust, | ||||||||||||||||
2004-1, A2, FRN, 1.891%, 11/25/34 | United States | 3,259,879 | 3,114,812 | |||||||||||||
2005-5, A1, FRN, 1.251%, 12/25/35 | United States | 2,757,937 | 2,573,763 | |||||||||||||
i,n Octagon Investment Partners XVII Ltd., 2013-1A, B1, 144A, FRN, 2.856%, 10/25/25 | Cayman Islands | 5,660,000 | 5,674,490 | |||||||||||||
i,k,n Octagon Investment Partners XX Ltd., 2014-1A, AR, 144A, FRN, 0.00%, 8/12/26 | Cayman Islands | 6,800,000 | 6,800,000 | |||||||||||||
i,n Octagon Investment Partners XXIII Ltd., 2015-1A, B, 144A, FRN, 3.158%, 7/15/27 | Cayman Islands | 4,590,000 | 4,594,406 | |||||||||||||
n Opteum Mortgage Acceptance Corp. Trust, 2005-4, 1APT, FRN, 1.301%, 11/25/35 | United States | 4,642,314 | 4,454,191 | |||||||||||||
n Structured Asset Mortgage Investments Trust, 2003-AR2, A1, FRN, 1.734%, 12/19/33 | United States | 4,473,529 | 4,312,190 | |||||||||||||
n Structured Asset Securities Corp., 2005-2XS, 2A2, FRN, 2.483%, 2/25/35 | United States | 3,302,231 | 3,170,778 | |||||||||||||
n Thornburg Mortgage Securities Trust, | ||||||||||||||||
2005-1, A3, FRN, 3.073%, 4/25/45 | United States | 4,617,329 | 4,620,372 | |||||||||||||
2005-2, A1, FRN, 2.769%, 7/25/45 | United States | 2,642,263 | 2,564,484 | |||||||||||||
i,n Voya CLO Ltd., | ||||||||||||||||
2013-1A, B, 144A, FRN, 4.058%, 4/15/24 | United States | 2,740,000 | 2,745,617 | |||||||||||||
2013-2A, B, 144A, FRN, 3.836%, 4/25/25 | United States | 10,770,000 | 10,814,157 | |||||||||||||
2015-2A, B, 144A, FRN, 3.133%, 7/23/27 | United States | 9,290,000 | 9,306,443 | |||||||||||||
Wells Fargo Mortgage Backed Securities Trust, n2004-W, A9, FRN, 3.004%, 11/25/34 | United States | 1,969,948 | 1,998,017 | |||||||||||||
2007-3, 3A1, 5.50%, 4/25/22 | United States | 443,048 | 453,449 | |||||||||||||
franklintempleton.com | Annual Report | 31 | ||
FRANKLIN STRATEGIC SERIES
CONSOLIDATED STATEMENT OF INVESTMENTS
Franklin Strategic Income Fund (continued)
| Country | Principal Amount* | Value | ||||||||||||||
| ||||||||||||||||
Asset-Backed Securities and Commercial Mortgage- | ||||||||||||||||
Diversified Financials (continued) | ||||||||||||||||
i,n Westchester CLO Ltd., 2007-1A, A1A, 144A, FRN, 1.259%, 8/01/22 | United States | 662,707 | $ | 662,521 | ||||||||||||
|
| |||||||||||||||
| 695,455,611 | ||||||||||||||||
|
| |||||||||||||||
Total Asset-Backed Securities and Commercial Mortgage-Backed Securities (Cost $794,137,574) | 798,406,398 | |||||||||||||||
|
| |||||||||||||||
Mortgage-Backed Securities 9.5% | ||||||||||||||||
n Federal Home Loan Mortgage Corp. (FHLMC) Adjustable Rate 0.0%† | ||||||||||||||||
FHLMC, 2.957%, 1/01/33 | United States | 53,850 | 55,717 | |||||||||||||
|
| |||||||||||||||
Federal Home Loan Mortgage Corp. (FHLMC) Fixed Rate 4.2% | ||||||||||||||||
FHLMC Gold 15 Year, 4.50%, 10/01/18 - 9/01/19 | United States | 191,313 | 196,882 | |||||||||||||
FHLMC Gold 15 Year, 5.00%, 12/01/17 - 7/01/22 | United States | 312,206 | 324,658 | |||||||||||||
FHLMC Gold 15 Year, 5.50%, 7/01/17 - 2/01/19 | United States | 7,763 | 7,842 | |||||||||||||
v FHLMC Gold 30 Year, 3.00%, 5/01/47 | United States | 77,000,000 | 76,905,253 | |||||||||||||
FHLMC Gold 30 Year, 3.50%, 8/01/46 | United States | 36,371,916 | 37,443,974 | |||||||||||||
v FHLMC Gold 30 Year, 3.50%, 5/01/47 | United States | 52,000,000 | 53,472,875 | |||||||||||||
FHLMC Gold 30 Year, 4.00%, 3/01/47 | United States | 110,201,087 | 116,153,811 | |||||||||||||
FHLMC Gold 30 Year, 4.50%, 10/01/40 | United States | 209,237 | 225,966 | |||||||||||||
FHLMC Gold 30 Year, 5.00%, 5/01/27 - 2/01/38 | United States | 1,750,331 | 1,920,380 | |||||||||||||
FHLMC Gold 30 Year, 5.50%, 6/01/33 - 6/01/36 | United States | 1,204,184 | 1,355,374 | |||||||||||||
FHLMC Gold 30 Year, 6.00%, 6/01/33 - 6/01/37 | United States | 352,592 | 399,979 | |||||||||||||
FHLMC Gold 30 Year, 6.50%, 10/01/21 - 6/01/36 | United States | 232,001 | 259,669 | |||||||||||||
FHLMC Gold 30 Year, 7.00%, 9/01/21 - 8/01/32 | United States | 35,049 | 37,021 | |||||||||||||
FHLMC Gold 30 Year, 7.50%, 1/01/26 - 1/01/31 | United States | 7,662 | 8,804 | |||||||||||||
FHLMC Gold 30 Year, 8.00%, 11/01/25 - 1/01/26 | United States | 219 | 226 | |||||||||||||
FHLMC Gold 30 Year, 9.00%, 12/01/24 | United States | 117 | 131 | |||||||||||||
|
| |||||||||||||||
| 288,712,845 | ||||||||||||||||
|
| |||||||||||||||
n Federal National Mortgage Association (FNMA) Adjustable Rate 0.0%† | ||||||||||||||||
FNMA, 2.784% - 2.955%, 4/01/20 - 12/01/34 | United States | 204,539 | 215,133 | |||||||||||||
|
| |||||||||||||||
Federal National Mortgage Association (FNMA) Fixed Rate 3.5% | ||||||||||||||||
FNMA 15 Year, 2.50%, 7/01/27 | United States | 414,776 | 421,292 | |||||||||||||
FNMA 15 Year, 4.50%, 3/01/20 | United States | 45,167 | 46,367 | |||||||||||||
FNMA 15 Year, 5.00%, 1/01/18 - 6/01/18 | United States | 29,972 | 30,784 | |||||||||||||
FNMA 15 Year, 5.50%, 5/01/17 - 4/01/22 | United States | 90,494 | 94,026 | |||||||||||||
v FNMA 30 Year, 3.00%, 5/01/47 | United States | 90,000,000 | 89,922,657 | |||||||||||||
FNMA 30 Year, 3.50%, 7/01/46 | United States | 53,158,591 | 54,729,155 | |||||||||||||
v FNMA 30 Year, 3.50%, 5/01/47 | United States | 53,000,000 | 54,503,044 | |||||||||||||
v FNMA 30 Year, 4.00%, 5/01/47 | United States | 25,000,000 | 26,332,030 | |||||||||||||
FNMA 30 Year, 4.50%, 3/01/28 - 2/01/41 | United States | 673,398 | 727,694 | |||||||||||||
FNMA 30 Year, 5.00%, 9/01/23 - 10/01/35 | United States | 1,928,361 | 2,116,049 | |||||||||||||
FNMA 30 Year, 5.50%, 9/01/33 - 12/01/35 | United States | 1,670,354 | 1,875,874 | |||||||||||||
FNMA 30 Year, 6.00%, 6/01/34 - 5/01/38 | United States | 3,306,960 | 3,759,406 | |||||||||||||
FNMA 30 Year, 6.50%, 3/01/28 - 10/01/37 | United States | 496,015 | 559,409 | |||||||||||||
FNMA 30 Year, 7.50%, 10/01/29. | United States | 7,810 | 9,284 | |||||||||||||
FNMA 30 Year, 8.00%, 1/01/25 - 5/01/26 | United States | 3,997 | 4,668 | |||||||||||||
FNMA 30 Year, 8.50%, 7/01/25 | United States | 483 | 497 | |||||||||||||
|
| |||||||||||||||
| 235,132,236 | ||||||||||||||||
|
| |||||||||||||||
32 | Annual Report | franklintempleton.com | ||
FRANKLIN STRATEGIC SERIES
CONSOLIDATED STATEMENT OF INVESTMENTS
Franklin Strategic Income Fund (continued)
| Country | Principal Amount* | Value | ||||||||||||
| ||||||||||||||
Mortgage-Backed Securities (continued) | ||||||||||||||
Government National Mortgage Association (GNMA) Fixed Rate 1.8% | ||||||||||||||
GNMA I SF 30 Year, 5.00%, 6/15/34 - 7/15/34 | United States | 204,596 | $ | 227,255 | ||||||||||
GNMA I SF 30 Year, 5.50%, 2/15/33 - 6/15/36 | United States | 585,247 | 660,027 | |||||||||||
GNMA I SF 30 Year, 6.00%, 8/15/36 | United States | 45,142 | 51,293 | |||||||||||
GNMA I SF 30 Year, 6.50%, 12/15/28 - 3/15/32 | United States | 46,326 | 51,956 | |||||||||||
GNMA I SF 30 Year, 7.00%, 11/15/27 - 5/15/28 | United States | 21,397 | 23,186 | |||||||||||
GNMA I SF 30 Year, 7.50%, 9/15/23 - 5/15/27 | United States | 2,267 | 2,482 | |||||||||||
GNMA I SF 30 Year, 8.00%, 2/15/25 - 9/15/27 | United States | 4,461 | 4,926 | |||||||||||
GNMA I SF 30 Year, 8.50%, 8/15/24 | United States | 73 | 81 | |||||||||||
GNMA I SF 30 Year, 9.00%, 1/15/25 | United States | 275 | 276 | |||||||||||
GNMA I SF 30 Year, 9.50%, 6/15/25 | United States | 492 | 494 | |||||||||||
v GNMA II SF 30 Year, 3.00%, 5/01/47 | United States | 57,000,000 | 57,772,619 | |||||||||||
GNMA II SF 30 Year, 3.50%, 2/20/47 | United States | 37,371,948 | 38,892,515 | |||||||||||
v GNMA II SF 30 Year, 3.50%, 5/01/47 | United States | 20,000,000 | 20,780,468 | |||||||||||
GNMA II SF 30 Year, 5.00%, 9/20/33 - 11/20/33 | United States | 300,682 | 336,031 | |||||||||||
GNMA II SF 30 Year, 5.50%, 6/20/34 | United States | 151,227 | 169,555 | |||||||||||
GNMA II SF 30 Year, 6.00%, 11/20/34 | United States | 139,494 | 161,505 | |||||||||||
GNMA II SF 30 Year, 6.50%, 7/20/28 - 12/20/31 | United States | 74,875 | 86,530 | |||||||||||
GNMA II SF 30 Year, 7.50%, 4/20/32 | United States | 18,647 | 20,998 | |||||||||||
|
| |||||||||||||
| 119,242,197 | ||||||||||||||
|
| |||||||||||||
Total Mortgage-Backed Securities | 643,358,128 | |||||||||||||
|
| |||||||||||||
Municipal Bonds 2.1% | ||||||||||||||
California State GO, Refunding, 5.00%, 9/01/29 | United States | 17,200,000 | 20,520,460 | |||||||||||
California Statewide CDA, PCR, Southern California Edison Co., Mandatory Put 12/01/23, Refunding, Series D, 2.625%, 11/01/33 | United States | 4,000,000 | 4,108,480 | |||||||||||
Clark County School District GO, Refunding, Series D, 5.00%, 6/15/23 | United States | 15,300,000 | 18,036,099 | |||||||||||
Denver City and County Airport System Revenue, Refunding, Series A, 5.00%, 11/15/25 | United States | 2,145,000 | 2,595,085 | |||||||||||
Illinois State GO, Build America Bonds, 7.35%, 7/01/35 | United States | 8,000,000 | 8,383,360 | |||||||||||
Minnesota State GO, Refunding, Series D, 5.00%, 8/01/25 | United States | 8,550,000 | 10,497,690 | |||||||||||
New Jersey EDA Revenue, School Facilities Construction, Refunding, Series NN, 5.00%, 3/01/30 | United States | 5,200,000 | 5,283,668 | |||||||||||
New York City HDC Capital Fund Grant Program Revenue, New York City Housing Authority Program, Series B1, 5.00%, 7/01/33 | United States | 3,500,000 | 3,895,115 | |||||||||||
New York State Dormitory Authority State Personal Income Tax Revenue, General Purpose, Refunding, Series A, 5.00%, 2/15/25 | United States | 9,410,000 | 11,225,001 | |||||||||||
Port Authority of New York and New Jersey Revenue, Consolidated, One Hundred Ninety-First Series, 4.823%, 6/01/45 | United States | 14,165,000 | 14,970,564 | |||||||||||
Puerto Rico Electric Power Authority Power Revenue, | ||||||||||||||
Series A, 6.75%, 7/01/36 | United States | 30,900,000 | 22,016,250 | |||||||||||
Series XX, 5.25%, 7/01/40 | United States | 15,000,000 | 10,612,500 | |||||||||||
University of Texas Revenue, Series J, 5.00%, 8/15/25 | United States | 9,800,000 | 11,983,440 | |||||||||||
|
| |||||||||||||
Total Municipal Bonds (Cost $145,920,959) | 144,127,712 | |||||||||||||
|
| |||||||||||||
franklintempleton.com | Annual Report | 33 | ||
FRANKLIN STRATEGIC SERIES
CONSOLIDATED STATEMENT OF INVESTMENTS
Franklin Strategic Income Fund (continued)
| Country | Shares | Value | ||||||||||||||
| ||||||||||||||||
Escrows and Litigation Trusts 0.0%† | ||||||||||||||||
a,f Midstates Petroleum Co. Inc./Midstates Petroleum Co. LLC, Escrow Account | United States | 15,000,000 | $ | — | ||||||||||||
a,f NewPage Corp., Litigation Trust | United States | 14,000,000 | — | |||||||||||||
a Penn Virginia Corp., Escrow Account | United States | 15,000,000 | 375,000 | |||||||||||||
a,f Vistra Energy Corp., Escrow Account | United States | 30,000,000 | 348,000 | |||||||||||||
a Vistra Energy Corp., Escrow Account, TRA | United States | 513,780 | 706,447 | |||||||||||||
|
| |||||||||||||||
Total Escrows and Litigation Trusts | 1,429,447 | |||||||||||||||
|
| |||||||||||||||
Total Investments before Short Term Investments | 6,982,846,092 | |||||||||||||||
|
| |||||||||||||||
| Principal Amount* | ||||||||||||||||
Short Term Investments 3.1% | ||||||||||||||||
U.S. Government and Agency Securities (Cost $3,880,937) 0.1% | ||||||||||||||||
w,x U.S. Treasury Bill, 8/17/17 | United States | 3,890,000 | 3,880,765 | |||||||||||||
|
| |||||||||||||||
Total Investments before Money Market Funds | 6,986,726,857 | |||||||||||||||
|
| |||||||||||||||
| Shares | ||||||||||||||||
Money Market Funds (Cost $204,828,690) 3.0% | ||||||||||||||||
g,y Institutional Fiduciary Trust Money Market Portfolio, 0.37% | United States | 204,828,690 | 204,828,690 | |||||||||||||
|
| |||||||||||||||
Total Investments (Cost $7,271,314,945) 105.7% | 7,191,555,547 | |||||||||||||||
Other Assets, less Liabilities (5.7)% | (386,028,590 | ) | ||||||||||||||
|
| |||||||||||||||
Net Assets 100.0% | $ | 6,805,526,957 | ||||||||||||||
|
| |||||||||||||||
34 | Annual Report | franklintempleton.com | ||
FRANKLIN STRATEGIC SERIES
CONSOLIDATED STATEMENT OF INVESTMENTS
Franklin Strategic Income Fund (continued)
†Rounds to less than 0.1% of net assets.
*The principal amount is stated in U.S. dollars unless otherwise indicated.
aNon-income producing.
bThe security is owned by FT Holdings Corporation II, a wholly-owned subsidiary of the Fund. See Note 1(g).
cAt April 30, 2017, pursuant to the Fund’s policies and the requirements of applicable securities law, the Fund is restricted from trading these securities at year end.
dSee Note 8 regarding restricted securities.
eSee Note 11 regarding holdings of 5% voting securities.
fSecurity has been deemed illiquid because it may not be able to be sold within seven days. At April 30, 2017, the aggregate value of these securities was $1,450,892, representing less than 0.1% of net assets.
gSee Note 3(f) regarding investments in affiliated management investment companies.
hPerpetual security with no stated maturity date.
iSecurity was purchased pursuant to Rule 144A under the Securities Act of 1933 and may be sold in transactions exempt from registration only to qualified institutional buyers or in a public offering registered under the Securities Act of 1933. These securities have been deemed liquid under guidelines approved by the Trust’s Board of Trustees. At April 30, 2017, the aggregate value of these securities was $1,657,978,886, representing 24.4% of net assets.
jIncome may be received in additional securities and/or cash.
kSecurity purchased on a when-issued basis. See Note 1(c).
lSee Note 7 regarding defaulted securities.
mSee Note 1(f) regarding loan participation notes.
nThe coupon rate shown represents the rate at period end.
oSee Note 1(i) regarding senior floating rate interests.
pA portion or all of the security purchased on a delayed delivery basis. See Note 1(c).
qPrincipal amount is stated in 100 Mexican Peso Units.
rThe principal represents the notional amount. See Note 1(d) regarding value recovery instruments.
sPrincipal amount is stated in 1,000 Brazilian Real Units.
tRedemption price at maturity is adjusted for inflation. See Note 1(k).
uPrincipal amount of security is adjusted for inflation. See Note 1(k).
vSecurity purchased on a to-be-announced (TBA) basis. See Note 1(c).
wThe security was issued on a discount basis with no stated coupon rate.
xA portion or all of the security has been segregated as collateral for open future contracts. At April 30, 2017, the value of this security and/or cash pledged amounted to $3,559,168, representing less than 0.1% of net assets.
yThe rate shown is the annualized seven-day yield at period end.
franklintempleton.com | Annual Report | 35 | ||
FRANKLIN STRATEGIC SERIES
CONSOLIDATED STATEMENT OF INVESTMENTS
Franklin Strategic Income Fund (continued)
At April 30, 2017, the Fund had the following futures contracts outstanding. See Note 1(d).
Futures Contracts
| Description | Type | Number of Contracts | Notional Value | Expiration Date | Unrealized Appreciation | Unrealized Depreciation | ||||||||||||||||||
| ||||||||||||||||||||||||
Interest Rate Contracts | ||||||||||||||||||||||||
Euro-Bund | Long | 145 | $ | 25,552,910 | 6/08/17 | $ | 73,929 | $ — | ||||||||||||||||
Long Gilt | Long | 496 | 82,409,476 | 6/28/17 | 1,412,685 | — | ||||||||||||||||||
U.S. Treasury 10 Yr. Ultra | Long | 361 | 48,898,578 | 6/21/17 | 836,676 | — | ||||||||||||||||||
U.S. Treasury 30 Yr. Bond | Long | 214 | 32,735,312 | 6/21/17 | 686,575 | — | ||||||||||||||||||
|
| |||||||||||||||||||||||
Total Futures Contracts |
$ |
3,009,865 |
| $ — | ||||||||||||||||||||
|
| |||||||||||||||||||||||
Net unrealized appreciation (depreciation) |
$ |
3,009,865 |
| |||||||||||||||||||||
|
| |||||||||||||||||||||||
At April 30, 2017, the Fund had the following forward exchange contracts outstanding. See Note 1(d).
Forward Exchange Contracts
| Currency | Counterpartya | Type | Quantity | Contract Amount* | Settlement Date | Unrealized Appreciation | Unrealized Depreciation | |||||||||||||||||||||||||
| ||||||||||||||||||||||||||||||||
OTC Forward Exchange Contracts |
| |||||||||||||||||||||||||||||||
British Pound | DBAB | Sell | 28,000,000 | 35,019,600 | 5/18/17 | $ | — | $ | (1,270,355 | ) | ||||||||||||||||||||||
Canadian Dollar | JPHQ | Sell | 50,000,000 | 38,018,188 | 5/18/17 | 1,375,087 | — | |||||||||||||||||||||||||
Philippine Peso | JPHQ | Buy | 41,860,000 | 835,529 | 5/18/17 | — | (2,834 | ) | ||||||||||||||||||||||||
South Korean Won | JPHQ | Buy | 23,000,000,000 | 20,089,968 | 5/18/17 | 135,443 | — | |||||||||||||||||||||||||
South Korean Won | JPHQ | Sell | 57,100,000,000 | 49,054,140 | 5/18/17 | — | (1,157,641 | ) | ||||||||||||||||||||||||
Australian Dollar | JPHQ | Buy | 9,000,000 | 6,712,110 | 8/17/17 | 14,583 | — | |||||||||||||||||||||||||
Australian Dollar | JPHQ | Sell | 72,000,000 | 55,176,120 | 8/17/17 | 1,362,577 | — | |||||||||||||||||||||||||
British Pound | JPHQ | Sell | 6,500,000 | 8,163,513 | 8/17/17 | — | (283,792 | ) | ||||||||||||||||||||||||
Euro | JPHQ | Buy | 9,500,000 | 10,398,225 | 8/17/17 | 10,927 | — | |||||||||||||||||||||||||
Euro | JPHQ | Sell | 144,500,000 | 155,612,772 | 8/17/17 | — | (2,715,902 | ) | ||||||||||||||||||||||||
Japanese Yen | JPHQ | Buy | 1,100,000,000 | 9,914,644 | 8/17/17 | 4,716 | — | |||||||||||||||||||||||||
Japanese Yen | JPHQ | Sell | 5,500,000,000 | 48,920,633 | 8/17/17 | — | (676,168 | ) | ||||||||||||||||||||||||
Indian Rupee | JPHQ | Buy | 2,329,000,000 | 34,038,759 | 8/18/17 | 1,733,063 | — | |||||||||||||||||||||||||
Indonesian Rupiah | JPHQ | Buy | 146,000,000,000 | 10,715,596 | 8/18/17 | 100,331 | — | |||||||||||||||||||||||||
Indonesian Rupiah | JPHQ | Sell | 146,000,000,000 | 10,842,926 | 8/18/17 | 26,999 | — | |||||||||||||||||||||||||
Australian Dollar | DBAB | Sell | 72,000,000 | 54,093,096 | 10/23/17 | 325,370 | — | |||||||||||||||||||||||||
Australian Dollar | JPHQ | Sell | 21,200,000 | 15,917,808 | 10/23/17 | 86,200 | — | |||||||||||||||||||||||||
Euro | DBAB | Sell | 99,200,000 | 107,708,384 | 10/23/17 | — | (1,390,630 | ) | ||||||||||||||||||||||||
Euro | JPHQ | Sell | 14,400,000 | 15,650,640 | 10/23/17 | — | (186,314 | ) | ||||||||||||||||||||||||
Indian Rupee | DBAB | Buy | 2,886,000,000 | 43,718,132 | 10/23/17 | 239,958 | — | |||||||||||||||||||||||||
Japanese Yen | DBAB | Sell | 15,400,000,000 | 142,017,946 | 10/23/17 | 2,676,859 | — | |||||||||||||||||||||||||
British Pound | JPHQ | Sell | 13,300,000 | 152,711,044 | SEK | 10/26/17 | 93,333 | — | ||||||||||||||||||||||||
British Pound | JPHQ | Sell | 8,300,000 | 10,951,850 | 8/15/18 | 37,094 | — | |||||||||||||||||||||||||
|
| |||||||||||||||||||||||||||||||
Total Forward Exchange Contracts |
| $ | 8,222,540 | $ | (7,683,636 | ) | ||||||||||||||||||||||||||
|
| |||||||||||||||||||||||||||||||
Net unrealized appreciation (depreciation) |
| $ | 538,904 | |||||||||||||||||||||||||||||
|
| |||||||||||||||||||||||||||||||
*In U.S. dollars unless otherwise indicated. |
aMay be comprised of multiple contracts with the same counterparty, currency and settlement date. |
36 | Annual Report | franklintempleton.com | ||
FRANKLIN STRATEGIC SERIES
CONSOLIDATED STATEMENT OF INVESTMENTS
Franklin Strategic Income Fund (continued)
At April 30, 2017, the Fund had the following credit default swap contracts outstanding. See Note 1(d).
Credit Default Swap Contracts
| Description | Periodic Payment Rate | Counter- party/ Exchange | Notional Amounta | Expiration Date | Unamortized Upfront Payments (Receipts) | Unrealized Appreciation | Unrealized Depreciation | Value | Ratingb | |||||||||||||||||||
| ||||||||||||||||||||||||||||
Centrally Cleared Swap Contracts | ||||||||||||||||||||||||||||
Contracts to Buy Protection | ||||||||||||||||||||||||||||
Traded Index | ||||||||||||||||||||||||||||
CDX.NA.HY.28 | 5.00% | ICE | $89,000,000 | 6/20/22 | $ | (6,401,498 | ) | $ | — | $ | (956,924 | ) | $ | (7,358,422 | ) | |||||||||||||
|
| |||||||||||||||||||||||||||
OTC Swap Contracts | ||||||||||||||||||||||||||||
Contracts to Sell Protectionc | ||||||||||||||||||||||||||||
Traded Index | ||||||||||||||||||||||||||||
Citibank Bespoke 58 IG/42 HY Equity Tranche 0-3% Index | 0.00% | CITI | 5,440,000 | 6/20/19 | (1,377,111 | ) | 284,325 | — | (1,092,786 | ) | Non- | |||||||||||||||||
| Investment | ||||||||||||||||||||||||||||
| Grade | ||||||||||||||||||||||||||||
MCDX.NA.28 | 1.00% | CITI | 61,430,000 | 6/20/22 | 969,147 | 274,422 | — | 1,243,569 | Investment | |||||||||||||||||||
|
| |||||||||||||||||||||||||||
| Grade | ||||||||||||||||||||||||||||
Total OTC Swap Contracts | $ | (407,964 | ) | $ | 558,747 | $ | — | $ | 150,783 | |||||||||||||||||||
|
| |||||||||||||||||||||||||||
Total Credit Default Swap Contracts |
$ |
(6,809,462 |
) | $ | 558,747 | $ | (956,924 | ) | $ | (7,207,639 | ) | |||||||||||||||||
|
| |||||||||||||||||||||||||||
Net unrealized appreciation (depreciation) |
$ |
(398,177 |
) | |||||||||||||||||||||||||
|
| |||||||||||||||||||||||||||
aFor contracts to sell protection, the notional amount is equal to the maximum potential amount of the future payments and no recourse provisions have been entered into in association with the contracts.
bBased on internal ratings for index swaps. Internal ratings based on mapping into equivalent ratings from external vendors.
cThe Fund enters contracts to sell protection to create a long credit position. Performance triggers include failure to pay or bankruptcy of the underlying securities for traded index swaps.
See Note 10 regarding other derivative information.
See Abbreviations on page 58.
franklintempleton.com | The accompanying notes are an integral part of these consolidated financial statements. | Annual Report | 37 | ||
FRANKLIN STRATEGIC SERIES
Consolidated Financial Statements
Consolidated Statement of Assets and Liabilities
April 30, 2017
Franklin Strategic Income Fund
Assets: | ||||
Investments in securities: | ||||
Cost - Unaffiliated issuers | $ | 6,593,086,378 | ||
Cost - Controlled affiliates (Note 3f) | 470,958,729 | |||
Cost - Non-controlled affiliates (Note 3f and 11) | 207,269,838 | |||
|
| |||
Total cost of investments | $ | 7,271,314,945 | ||
|
| |||
Value - Unaffiliated issuers | $ | 6,497,499,898 | ||
Value - Controlled affiliates (Note 3f) | 487,206,699 | |||
Value - Non-controlled affiliates (Note 3f and 11) | 206,848,950 | |||
|
| |||
Total value of investments | 7,191,555,547 | |||
Cash. | 2,069,833 | |||
Restricted Cash (Note 1e) | 1,525,000 | |||
Foreign currency, at value (cost $796,418) | 796,226 | |||
Receivables: | ||||
Investment securities sold | 13,646,630 | |||
Capital shares sold | 5,596,411 | |||
Dividends and interest | 61,351,447 | |||
Due from brokers | 6,452,327 | |||
OTC swap contracts (upfront payments $981,538) | 969,147 | |||
Unrealized appreciation on OTC forward exchange contracts | 8,222,540 | |||
Unrealized appreciation on OTC swap contracts | 558,747 | |||
Unrealized appreciation on unfunded loan commitments (Note 9) | 44,003 | |||
Other assets | 10,741 | |||
|
| |||
Total assets |
|
7,292,798,599 |
| |
|
| |||
Liabilities: | ||||
Payables: | ||||
Investment securities purchased | 452,285,205 | |||
Capital shares redeemed | 15,876,598 | |||
Management fees | 2,281,628 | |||
Distribution fees | 1,574,659 | |||
Transfer agent fees | 1,515,821 | |||
Distributions to shareholders | 527,147 | |||
Variation margin | 79,729 | |||
OTC swap contracts (upfront receipts $1,468,800) | 1,377,111 | |||
Due to brokers | 3,048,000 | |||
Unrealized depreciation on OTC forward exchange contracts | 7,683,636 | |||
Deferred tax. | 446,453 | |||
Accrued expenses and other liabilities. | 575,655 | |||
|
| |||
Total liabilities | 487,271,642 | |||
|
| |||
Net assets, at value |
$ |
6,805,526,957 |
| |
|
| |||
Net assets consist of: | ||||
Paid-in capital | $ | 7,267,763,805 | ||
Distributions in excess of net investment income | (118,770,181 | ) | ||
Net unrealized appreciation (depreciation) | (76,980,576 | ) | ||
Accumulated net realized gain (loss) | (266,486,091 | ) | ||
|
| |||
Net assets, at value |
$ |
6,805,526,957 |
| |
|
|
38 | Annual Report | | The accompanying notes are an integral part of these consolidated financial statements. | franklintempleton.com | |||
FRANKLIN STRATEGIC SERIES
CONSOLIDATED FINANCIAL STATEMENTS
Franklin Strategic Income Fund (continued)
Class A: | ||||
Net assets, at value | $3,833,785,559 | |||
|
| |||
Shares outstanding | 389,521,240 | |||
|
| |||
Net asset value per sharea | $9.84 | |||
|
| |||
Maximum offering price per share (net asset value per share ÷ 95.75%) | $10.28 | |||
|
| |||
Class C: | ||||
Net assets, at value | $1,385,980,715 | |||
|
| |||
Shares outstanding | 140,839,928 | |||
|
| |||
Net asset value and maximum offering price per sharea | $9.84 | |||
|
| |||
Class R: | ||||
Net assets, at value | $ 146,551,739 | |||
|
| |||
Shares outstanding | 14,944,509 | |||
|
| |||
Net asset value and maximum offering price per share | $9.81 | |||
|
| |||
Class R6: | ||||
Net assets, at value | $ 369,106,386 | |||
|
| |||
Shares outstanding | 37,446,072 | |||
|
| |||
Net asset value and maximum offering price per share | $9.86 | |||
|
| |||
Advisor Class: | ||||
Net assets, at value | $1,070,102,558 | |||
|
| |||
Shares outstanding | 108,612,471 | |||
|
| |||
Net asset value and maximum offering price per share | $9.85 | |||
|
|
aRedemption price is equal to net asset value less contingent deferred sales charges, if applicable.
franklintempleton.com | The accompanying notes are an integral part of these consolidated financial statements. | | Annual Report | 39 | |||
FRANKLIN STRATEGIC SERIES
CONSOLIDATED FINANCIAL STATEMENTS
Consolidated Statement of Operations
for the year ended April 30, 2017
Franklin Strategic Income Fund
Investment income: | ||||
Dividends: | ||||
Unaffiliated issuers | $ | 2,919,890 | ||
Controlled affiliates (Note 3f) | 53,275,635 | |||
Non-controlled affiliates (Note 3f and 11) | 109,263 | |||
Interest | 301,604,468 | |||
|
| |||
Total investment income | 357,909,256 | |||
|
| |||
Expenses: | ||||
Management fees (Note 3a) | 33,148,598 | |||
Distribution fees: (Note 3c) | ||||
Class A | 10,499,147 | |||
Class C | 9,863,918 | |||
Class R | 827,064 | |||
Transfer agent fees: (Note 3e) | ||||
Class A | 6,198,875 | |||
Class C | 2,253,518 | |||
Class R | 244,382 | |||
Class R6 | 2,912 | |||
Advisor Class | 1,429,001 | |||
Custodian fees (Note 4) | 334,165 | |||
Reports to shareholders | 739,192 | |||
Registration and filing fees. | 209,221 | |||
Professional fees | 284,150 | |||
Trustees’ fees and expenses | 74,422 | |||
Other | 533,567 | |||
|
| |||
Total expenses | 66,642,132 | |||
Expense reductions (Note 4) | (55,060 | ) | ||
Expenses waived/paid by affiliates (Note 3f) | (4,731,183 | ) | ||
|
| |||
Net expenses | 61,855,889 | |||
|
| |||
Net investment income | 296,053,367 | |||
|
| |||
Realized and unrealized gains (losses): | ||||
Net realized gain (loss) from: | ||||
Investments: | ||||
Unaffiliated issuers | (166,259,743 | ) | ||
Controlled affiliates (Note 3f) | 4,959,209 | |||
Foreign currency transactions. | (7,542,859 | ) | ||
Futures contracts | (7,478,050 | ) | ||
Swap contracts | (2,275,156 | ) | ||
|
| |||
Net realized gain (loss) | (178,596,599 | ) | ||
|
| |||
Net change in unrealized appreciation (depreciation) on: | ||||
Investments | 363,035,034 | |||
Translation of other assets and liabilities denominated in foreign currencies | 46,165,474 | |||
Futures contracts | 3,009,865 | |||
Swap contracts | (743,033 | ) | ||
Change in deferred taxes on unrealized appreciation | 123,654 | |||
|
| |||
Net change in unrealized appreciation (depreciation) | 411,590,994 | |||
|
| |||
Net realized and unrealized gain (loss) | 232,994,395 | |||
|
| |||
Net increase (decrease) in net assets resulting from operations | $ | 529,047,762 | ||
|
|
40 | Annual Report | | The accompanying notes are an integral part of these consolidated financial statements. | franklintempleton.com | |||
FRANKLIN STRATEGIC SERIES
CONSOLIDATED FINANCIAL STATEMENTS
Consolidated Statements of Changes in Net Assets
Franklin Strategic Income Fund
| Year Ended April 30, | ||||||||
| 2017 | 2016 | |||||||
Increase (decrease) in net assets: | ||||||||
Operations: | ||||||||
Net investment income | $ 296,053,367 | $ 355,162,709 | ||||||
Net realized gain (loss) | (178,596,599 | ) | (321,053,396 | ) | ||||
Net change in unrealized appreciation (depreciation) | 411,590,994 | (343,721,849 | ) | |||||
|
| |||||||
Net increase (decrease) in net assets resulting from operations |
|
529,047,762 |
| (309,612,536 | ) | |||
|
| |||||||
Distributions to shareholders from: | ||||||||
Net investment income: | ||||||||
Class A | (76,684,998 | ) | (203,235,139 | ) | ||||
Class C | (21,849,570 | ) | (69,997,315 | ) | ||||
Class R | (2,644,424 | ) | (8,052,939 | ) | ||||
Class R6 | (9,361,333 | ) | (12,383,078 | ) | ||||
Advisor Class | (19,738,810 | ) | (45,388,450 | ) | ||||
|
| |||||||
Total distributions to shareholders | (130,279,135 | ) | (339,056,921 | ) | ||||
|
| |||||||
Capital share transactions: (Note 2) | ||||||||
Class A | (898,775,869 | ) | (361,847,394 | ) | ||||
Class C | (344,124,057 | ) | (276,223,074 | ) | ||||
Class R | (44,210,930 | ) | (25,817,388 | ) | ||||
Class R6 | 61,813,436 | 52,377,445 | ||||||
Advisor Class | 112,378,776 | (142,209,084 | ) | |||||
|
| |||||||
Total capital share transactions | (1,112,918,644 | ) | (753,719,495 | ) | ||||
|
| |||||||
Net increase (decrease) in net assets | (714,150,017 | ) | (1,402,388,952 | ) | ||||
Net assets: | ||||||||
Beginning of year | 7,519,676,974 | 8,922,065,926 | ||||||
|
| |||||||
End of year | $6,805,526,957 | $ 7,519,676,974 | ||||||
|
| |||||||
Distributions in excess of net investment income included in net assets: | ||||||||
End of year | $ (118,770,181 | ) | $ (145,570,016 | ) | ||||
|
| |||||||
franklintempleton.com | The accompanying notes are an integral part of these consolidated financial statements. | | Annual Report | 41 | |||
FRANKLIN STRATEGIC SERIES
Notes to Consolidated Financial Statements
Franklin Strategic Income Fund
1. Organization and Significant Accounting Policies
Franklin Strategic Series (Trust) is registered under the Investment Company Act of 1940 (1940 Act) as an open-end management investment company, consisting of nine separate funds and applies the specialized accounting and reporting guidance in U.S. Generally Accepted Accounting Principles (U.S. GAAP). Franklin Strategic Income Fund (Fund) is included in this report. The financial statements of the remaining funds in the Trust are presented separately. The Fund offers five classes of shares: Class A, Class C, Class R, Class R6, and Advisor Class. Each class of shares may differ by its initial sales load, contingent deferred sales charges, voting rights on matters affecting a single class, its exchange privilege and fees primarily due to differing arrangements for distribution and transfer agent fees.
The following summarizes the Fund’s significant accounting policies.
a. Financial Instrument Valuation
The Fund’s investments in financial instruments are carried at fair value daily. Fair value is the price that would be received to sell an asset or paid to transfer a liability in an orderly transaction between market participants on the measurement date. The Fund calculates the net asset value (NAV) per share as of 4 p.m. Eastern time each day the New York Stock Exchange (NYSE) is open for trading. Under compliance policies and procedures approved by the Trust’s Board of Trustees (the Board), the Fund’s administrator has responsibility for oversight of valuation, including leading the cross-functional Valuation Committee (VC). The VC provides administration and oversight of the Fund’s valuation policies and procedures, which are approved annually by the Board. Among other things, these procedures allow the Fund to utilize independent pricing services, quotations from securities and financial instrument dealers, and other market sources to determine fair value.
Equity securities and derivative financial instruments listed on an exchange or on the NASDAQ National Market System are valued at the last quoted sale price or the official closing price of the day, respectively. Foreign equity securities are valued as of the close of trading on the foreign stock exchange on which the security is primarily traded, or as of 4 p.m. Eastern time. The value is then converted into its U.S. dollar equivalent at the foreign exchange rate in effect at 4 p.m. Eastern time on the day
that the value of the security is determined. Over-the-counter (OTC) securities are valued within the range of the most recent quoted bid and ask prices. Securities that trade in multiple markets or on multiple exchanges are valued according to the broadest and most representative market. Certain equity securities are valued based upon fundamental characteristics or relationships to similar securities.
Debt securities generally trade in the OTC market rather than on a securities exchange. The Fund’s pricing services use multiple valuation techniques to determine fair value. In instances where sufficient market activity exists, the pricing services may utilize a market-based approach through which quotes from market makers are used to determine fair value. In instances where sufficient market activity may not exist or is limited, the pricing services also utilize proprietary valuation models which may consider market characteristics such as benchmark yield curves, credit spreads, estimated default rates, anticipated market interest rate volatility, coupon rates, anticipated timing of principal repayments, underlying collateral, and other unique security features in order to estimate the relevant cash flows, which are then discounted to calculate the fair value. Securities denominated in a foreign currency are converted into their U.S. dollar equivalent at the foreign exchange rate in effect at 4 p.m. Eastern time on the date that the values of the foreign debt securities are determined.
Investments in open-end mutual funds are valued at the closing NAV.
Certain derivative financial instruments are centrally cleared or traded in the OTC market. The Fund’s pricing services use various techniques including industry standard option pricing models and proprietary discounted cash flow models to determine the fair value of those instruments. The Fund’s net benefit or obligation under the derivative contract, as measured by the fair value of the contract, is included in net assets.
The Fund has procedures to determine the fair value of financial instruments for which market prices are not reliable or readily available. Under these procedures, the VC convenes on a regular basis to review such financial instruments and considers a number of factors, including significant unobservable valuation inputs, when arriving at fair value. The VC primarily employs a market-based approach which may use related or comparable assets or liabilities, recent transactions, market multiples, book values, and other relevant information for the investment to determine the fair value of the investment. An
42 | Annual Report | franklintempleton.com | ||
FRANKLIN STRATEGIC SERIES
NOTES TO CONSOLIDATED FINANCIAL STATEMENTS
Franklin Strategic Income Fund (continued)
income-based valuation approach may also be used in which the anticipated future cash flows of the investment are discounted to calculate fair value. Discounts may also be applied due to the nature or duration of any restrictions on the disposition of the investments. Due to the inherent uncertainty of valuations of such investments, the fair values may differ significantly from the values that would have been used had an active market existed. The VC employs various methods for calibrating these valuation approaches including a regular review of key inputs and assumptions, transactional back-testing or disposition analysis, and reviews of any related market activity.
Trading in securities on foreign securities stock exchanges and OTC markets may be completed before 4 p.m. Eastern time. In addition, trading in certain foreign markets may not take place on every Fund’s business day. Occasionally, events occur between the time at which trading in a foreign security is completed and 4 p.m. Eastern time that might call into question the reliability of the value of a portfolio security held by the Fund. As a result, differences may arise between the value of the Fund’s portfolio securities as determined at the foreign market close and the latest indications of value at 4 p.m. Eastern time. In order to minimize the potential for these differences, the VC monitors price movements following the close of trading in foreign stock markets through a series of country specific market proxies (such as baskets of American Depositary Receipts, futures contracts and exchange traded funds). These price movements are measured against established trigger thresholds for each specific market proxy to assist in determining if an event has occurred that may call into question the reliability of the values of the foreign securities held by the Fund. If such an event occurs, the securities may be valued using fair value procedures, which may include the use of independent pricing services.
When the last day of the reporting period is a non-business day, certain foreign markets may be open on those days that the Fund’s NAV is not calculated, which could result in differences between the value of the Fund’s portfolio securities on the last business day and the last calendar day of the reporting period. Any significant security valuation changes due to an open foreign market are adjusted and reflected by the Fund for financial reporting purposes.
b. Foreign Currency Translation
Portfolio securities and other assets and liabilities denominated in foreign currencies are translated into U.S. dollars based on the exchange rate of such currencies against U.S. dollars on the date of valuation. The Fund may enter into foreign currency exchange contracts to facilitate transactions denominated in a foreign currency. Purchases and sales of securities, income and expense items denominated in foreign currencies are translated into U.S. dollars at the exchange rate in effect on the transaction date. Portfolio securities and assets and liabilities denominated in foreign currencies contain risks that those currencies will decline in value relative to the U.S. dollar. Occasionally, events may impact the availability or reliability of foreign exchange rates used to convert the U.S. dollar equivalent value. If such an event occurs, the foreign exchange rate will be valued at fair value using procedures established and approved by the Board.
The Fund does not separately report the effect of changes in foreign exchange rates from changes in market prices on securities held. Such changes are included in net realized and unrealized gain or loss from investments in the Consolidated Statement of Operations.
Realized foreign exchange gains or losses arise from sales of foreign currencies, currency gains or losses realized between the trade and settlement dates on securities transactions and the difference between the recorded amounts of dividends, interest, and foreign withholding taxes and the U.S. dollar equivalent of the amounts actually received or paid. Net unrealized foreign exchange gains and losses arise from changes in foreign exchange rates on foreign denominated assets and liabilities other than investments in securities held at the end of the reporting period.
c. Securities Purchased on a When-Issued, Delayed Delivery and TBA Basis
The Fund purchases securities on a when-issued or delayed delivery and to-be-announced (TBA) basis, with payment and delivery scheduled for a future date. These transactions are subject to market fluctuations and are subject to the risk that the value at delivery may be more or less than the trade date purchase price. Although the Fund will generally purchase these securities with the intention of holding the securities, it may sell the securities before the settlement date. Sufficient assets have been segregated for these securities and collateral has been pledged and/or received for open TBA trades.
franklintempleton.com | Annual Report | 43 | ||
FRANKLIN STRATEGIC SERIES
NOTES TO CONSOLIDATED FINANCIAL STATEMENTS
Franklin Strategic Income Fund (continued)
1. Organization and Significant Accounting Policies (continued)
d. Derivative Financial Instruments
The Fund invested in derivative financial instruments in order to manage risk or gain exposure to various other investments or markets. Derivatives are financial contracts based on an underlying or notional amount, require no initial investment or an initial net investment that is smaller than would normally be required to have a similar response to changes in market factors, and require or permit net settlement. Derivatives contain various risks including the potential inability of the counterparty to fulfill their obligations under the terms of the contract, the potential for an illiquid secondary market, and/or the potential for market movements which expose the Fund to gains or losses in excess of the amounts shown in the Consolidated Statement of Assets and Liabilities. Realized gain and loss and unrealized appreciation and depreciation on these contracts for the period are included in the Consolidated Statement of Operations.
Derivative counterparty credit risk is managed through a formal evaluation of the creditworthiness of all potential counterparties. The Fund attempts to reduce its exposure to counterparty credit risk on OTC derivatives, whenever possible, by entering into International Swaps and Derivatives Association (ISDA) master agreements with certain counterparties. These agreements contain various provisions, including but not limited to collateral requirements, events of default, or early termination. Termination events applicable to the counterparty include certain deteriorations in the credit quality of the counterparty. Termination events applicable to the Fund include failure of the Fund to maintain certain net asset levels and/or limit the decline in net assets over various periods of time. In the event of default or early termination, the ISDA master agreement gives the non-defaulting party the right to net and close-out all transactions traded, whether or not arising under the ISDA agreement, to one net amount payable by one counterparty to the other. However, absent an event of default or early termination, OTC derivative assets and liabilities are presented gross and not offset in the Consolidated Statement of Assets and Liabilities. Early termination by the counterparty may result in an immediate payment by the Fund of any net liability owed to that counterparty under the ISDA agreement.
Collateral requirements differ by type of derivative. Collateral or initial margin requirements are set by the broker or exchange clearing house for exchange traded and centrally cleared derivatives. Initial margin deposited is held at the exchange and
can be in the form of cash and/or securities. For OTC derivatives traded under an ISDA master agreement, posting of collateral is required by either the Fund or the applicable counterparty if the total net exposure of all OTC derivatives with the applicable counterparty exceeds the minimum transfer amount, which typically ranges from $100,000 to $250,000, and can vary depending on the counterparty and the type of the agreement. Generally, collateral is determined at the close of Fund business each day and any additional collateral required due to changes in derivative values may be delivered by the Fund or the counterparty the next business day, or within a few business days. Collateral pledged and/or received by the Fund for OTC derivatives, if any, is held in segregated accounts with the Fund’s custodian/counterparty broker and can be in the form of cash and/or securities. Unrestricted cash may be invested according to the Fund’s investment objectives. To the extent that the amounts due to the Fund from its counterparties are not subject to collateralization or are not fully collateralized, the Fund bears the risk of loss from counterparty non-performance.
The Fund entered into exchange traded futures contracts primarily to manage and/or gain exposure to interest rate risk. A futures contract is an agreement between the Fund and a counterparty to buy or sell an asset at a specified price on a future date. Required initial margins are pledged by the Fund, and the daily change in fair value is accounted for as a variation margin payable or receivable in the Consolidated Statement of Assets and Liabilities.
The Fund entered into OTC forward exchange contracts primarily to manage and/or gain exposure to certain foreign currencies. A forward exchange contract is an agreement between the Fund and a counterparty to buy or sell a foreign currency at a specific exchange rate on a future date.
The Fund entered into credit default swap contracts primarily to manage exposure to credit risk. A credit default swap is an agreement between the Fund and a counterparty whereby the buyer of the contract receives credit protection and the seller of the contract guarantees the credit worthiness of a referenced debt obligation. These agreements may be privately negotiated in the over-the-counter market (OTC credit default swaps) or may be executed in a multilateral trade facility platform, such as a registered exchange (centrally cleared credit default swaps). The underlying referenced debt obligation may be a single issuer of corporate or sovereign debt, a credit index, a basket of issuers or indices, or a tranche of a credit index or basket of issuers or indices. In the event of a default of the underlying
44 | Annual Report | franklintempleton.com | ||
FRANKLIN STRATEGIC SERIES
NOTES TO CONSOLIDATED FINANCIAL STATEMENTS
Franklin Strategic Income Fund (continued)
referenced debt obligation, the buyer is entitled to receive the notional amount of the credit default swap contract from the seller in exchange for the referenced debt obligation, a net settlement amount equal to the notional amount of the credit default swap less the recovery value of the referenced debt obligation, or other agreed upon amount. For centrally cleared credit default swaps, required initial margins are pledged by the Fund, and the daily change in fair value is accounted for as a variation margin payable or receivable in the Consolidated Statement of Assets and Liabilities. Over the term of the contract, the buyer pays the seller a periodic stream of payments, provided that no event of default has occurred. Such periodic payments are accrued daily as an unrealized appreciation or depreciation until the payments are made, at which time they are realized. Upfront payments and receipts are reflected in the Consolidated Statement of Assets and Liabilities and represent compensating factors between stated terms of the credit default swap agreement and prevailing market conditions (credit spreads and other relevant factors). These upfront payments and receipts are amortized over the term of the contract as a realized gain or loss in the Consolidated Statement of Operations.
The Fund entered into OTC total return swap contracts primarily to manage and/or gain exposure to interest rate risk of an underlying instrument such as a stock, bond, index or basket of securities or indices. A total return swap is an agreement between the Fund and a counterparty to exchange a return linked to an underlying instrument for a floating or fixed rate payment, both based upon a notional amount. Over the term of the contract, contractually required payments to be paid or received are accrued daily and recorded as unrealized appreciation or depreciation until the payments are made, at which time they are recognized as realized gain or loss.
The Fund purchased or wrote OTC option contracts primarily to manage and/or gain exposure to foreign exchange rate and credit risk. An option is a contract entitling the holder to purchase or sell a specific amount of shares or units of an asset or notional amount of a swap (swaption), at a specified price. When an option is purchased or written, an amount equal to the premium paid or received is recorded as an asset or liability, respectively. Upon exercise of an option, the acquisition cost or sales proceeds of the underlying investment is adjusted by any premium received or paid. Upon expiration of an option, any premium received or paid is recorded as a realized gain or loss.
Upon closing an option other than through expiration or exercise, the difference between the premium received or paid and the cost to close the position is recorded as a realized gain or loss.
The Fund invests in value recovery instruments (VRI) primarily to gain exposure to growth risk. Periodic payments from VRI are dependent on established benchmarks for underlying variables. VRI has a notional amount, which is used to calculate amounts of payments to holders. Payments are recorded upon receipt as realized gains in the Consolidated Statement of Operations. The risks of investing in VRI include growth risk, liquidity, and the potential loss of investment.
See Note 10 regarding other derivative information.
e. Restricted Cash
At April 30, 2017, the Fund held restricted cash in connection with investments in certain derivative securities. Restricted cash is held in a segregated account with the Fund’s custodian and is reflected in the Consolidated Statement of Assets and Liabilities.
f. Loan Participation Notes
The Fund invests in loan participation notes (Participations). Participations are loans originally issued to a borrower by one or more financial institutions (the Lender) and subsequently sold to other investors, such as the Fund. Participations typically result in the Fund having a contractual relationship only with the Lender and not with the borrower. The Fund has the right to receive from the Lender any payments of principal, interest and fees which the Lender received from the borrower. The Fund generally has no rights to either enforce compliance by the borrower with the terms of the loan agreement or to any collateral relating to the original loan. As a result, the Fund assumes the credit risk of both the borrower and the Lender that is selling the Participation. The Participations may also involve interest rate risk and liquidity risk, including the potential default or insolvency of the borrower and/or the Lender.
g. FT Holdings Corporation II (FT Subsidiary)
The Fund invests in certain financial instruments through its investment in FT subsidiary. FT subsidiary is a Delaware Corporation, is a wholly-owned subsidiary of the Fund, and is able to invest in certain financial instruments consistent with the investment objective of the Fund. At April 30, 2017, FT subsidiary’s investment, Turtle Bay Resort, as well as any other
franklintempleton.com | Annual Report | 45 | ||
FRANKLIN STRATEGIC SERIES
NOTES TO CONSOLIDATED FINANCIAL STATEMENTS
Franklin Strategic Income Fund (continued)
1. Organization and Significant Accounting Policies (continued)
g. FT Holdings Corporation II (FT Subsidiary) (continued)
assets and liabilities of FT subsidiary are reflected in the Fund’s Consolidated Statement of Investments and Consolidated Statement of Assets and Liabilities. The financial statements have been consolidated and include the accounts of the Fund and FT subsidiary. All intercompany transactions and balances have been eliminated. At April 30, 2017, the net assets of FT subsidiary were $26,516,818, representing less than 1% of the Fund’s consolidated net assets. The Fund’s investments in FT subsidiary is limited to 25% of consolidated assets.
h. Mortgage Dollar Rolls
The Fund enters into mortgage dollar rolls, typically on a TBA basis. Mortgage dollar rolls are agreements between the Fund and a financial institution where the Fund sells (or buys) mortgage-backed securities for delivery on a specified date and simultaneously contracts to repurchase (or sell) substantially similar (same type, coupon, and maturity) securities at a future date and at a predetermined price. Gains or losses are realized on the initial sale, and the difference between the repurchase price and the sale price is recorded as an unrealized gain or loss to the Fund upon entering into the mortgage dollar roll. In addition, the Fund may invest the cash proceeds that are received from the initial sale. During the period between the sale and repurchase, the Fund is not entitled to principal and interest paid on the mortgage backed securities. Transactions in mortgage dollar rolls are accounted for as purchases and sales and may result in an increase to the Fund’s portfolio turnover rate. The risks of mortgage dollar roll transactions include the potential inability of the counterparty to fulfill its obligations.
i. Senior Floating Rate Interests
The Fund invests in senior secured corporate loans that pay interest at rates which are periodically reset by reference to a base lending rate plus a spread. These base lending rates are generally the prime rate offered by a designated U.S. bank or the London InterBank Offered Rate (LIBOR). Senior secured corporate loans often require prepayment of principal from excess cash flows or at the discretion of the borrower. As a result, actual maturity may be substantially less than the stated maturity. Senior secured corporate loans in which the Fund invests are generally readily marketable, but may be subject to certain restrictions on resale.
j. Income and Deferred Taxes
It is the Fund’s policy to qualify as a regulated investment company under the Internal Revenue Code. The Fund intends to distribute to shareholders substantially all of its taxable income and net realized gains to relieve it from federal income and excise taxes. As a result, no provision for U.S. federal income taxes is required.
The Fund may be subject to foreign taxation related to income received, capital gains on the sale of securities and certain foreign currency transactions in the foreign jurisdictions in which it invests. Foreign taxes, if any, are recorded based on the tax regulations and rates that exist in the foreign markets in which the Fund invests. When a capital gain tax is determined to apply, the Fund records an estimated deferred tax liability in an amount that would be payable if the securities were disposed of on the valuation date.
The Fund may recognize an income tax liability related to its uncertain tax positions under U.S. GAAP when the uncertain tax position has a less than 50% probability that it will be sustained upon examination by the tax authorities based on its technical merits. As of April 30, 2017, the Fund has determined that no tax liability is required in its financial statements related to uncertain tax positions for any open tax years (or expected to be taken in future tax years). Open tax years are those that remain subject to examination and are based on each tax jurisdiction’s statute of limitation.
k. Security Transactions, Investment Income, Expenses and Distributions
Security transactions are accounted for on trade date. Realized gains and losses on security transactions are determined on a specific identification basis. Interest income and estimated expenses are accrued daily. Amortization of premium and accretion of discount on debt securities are included in interest income. Paydown gains and losses are recorded as an adjustment to interest income. Facility fees are recognized as income over the expected term of the loan. Dividend income is recorded on the ex-dividend date except for certain dividends from securities where the dividend rate is not available. In such cases, the dividend is recorded as soon as the information is received by the Fund. Distributions to shareholders are recorded on the ex-dividend date and are determined according to income tax regulations (tax basis). Distributable earnings determined on a tax basis may differ from earnings recorded in accordance with U.S. GAAP. These differences may be permanent or
46 | Annual Report | franklintempleton.com | ||
FRANKLIN STRATEGIC SERIES
NOTES TO CONSOLIDATED FINANCIAL STATEMENTS
Franklin Strategic Income Fund (continued)
temporary. Permanent differences are reclassified among capital accounts to reflect their tax character. These reclassifications have no impact on net assets or the results of operations. Temporary differences are not reclassified, as they may reverse in subsequent periods.
Common expenses incurred by the Trust are allocated among the Funds based on the ratio of net assets of each Fund to the combined net assets of the Trust. Fund specific expenses are charged directly to the Fund that incurred the expense.
Realized and unrealized gains and losses and net investment income, not including class specific expenses, are allocated daily to each class of shares based upon the relative proportion of net assets of each class. Differences in per share distributions, by class, are generally due to differences in class specific expenses.
Inflation-indexed bonds are adjusted for inflation through periodic increases or decreases in the security’s interest accruals, face amount, or principal redemption value, by amounts corresponding to the rate of inflation as measured by an index. Any increase or decrease in the face amount or principal redemption value will be included as interest income in the Consolidated Statement of Operations.
l. Accounting Estimates
The preparation of financial statements in accordance with U.S. GAAP requires management to make estimates and assumptions that affect the reported amounts of assets and liabilities at the date of the financial statements and the amounts of income and expenses during the reporting period. Actual results could differ from those estimates.
m. Guarantees and Indemnifications
Under the Trust’s organizational documents, its officers and trustees are indemnified by the Trust against certain liabilities arising out of the performance of their duties to the Trust. Additionally, in the normal course of business, the Trust, on behalf of the Fund, enters into contracts with service providers that contain general indemnification clauses. The Trust’s maximum exposure under these arrangements is unknown as this would involve future claims that may be made against the Trust that have not yet occurred. Currently, the Trust expects the risk of loss to be remote.
2. Shares of Beneficial Interest
At April 30, 2017, there were an unlimited number of shares authorized (without par value). Transactions in the Fund’s shares were as follows:
| Year Ended April 30, | ||||||||||||||||
| 2017 | 2016 | |||||||||||||||
| Shares | Amount | Shares | Amount | |||||||||||||
Class A Shares: | ||||||||||||||||
Shares sold | 52,682,489 | $ | 505,267,299 | 86,621,299 | $ | 820,474,987 | ||||||||||
Shares issued in reinvestment of distributions | 7,476,400 | 71,451,152 | 19,950,107 | 187,902,460 | ||||||||||||
Shares redeemed | (153,723,653 | ) | (1,475,494,320 | ) | (145,536,164 | ) | (1,370,224,841 | ) | ||||||||
Net increase (decrease) | (93,564,764 | ) | $ | (898,775,869 | ) | (38,964,758 | ) | $ | (361,847,394 | ) | ||||||
Class C Shares: | ||||||||||||||||
Shares sold | 12,084,940 | $ | 115,680,760 | 23,699,305 | $ | 225,556,988 | ||||||||||
Shares issued in reinvestment of distributions | 2,077,286 | 19,824,729 | 6,662,132 | 62,783,652 | ||||||||||||
Shares redeemed | (50,018,546 | ) | (479,629,546 | ) | (59,915,146 | ) | (564,563,714 | ) | ||||||||
Net increase (decrease) | (35,856,320 | ) | $ | (344,124,057 | ) | (29,553,709 | ) | $ | (276,223,074 | ) | ||||||
Class R Shares: | ||||||||||||||||
Shares sold | 3,506,082 | $ | 33,582,209 | 3,750,305 | $ | 35,486,868 | ||||||||||
Shares issued in reinvestment of distributions | 270,945 | 2,577,967 | 836,414 | 7,856,192 | ||||||||||||
Shares redeemed | (8,402,262 | ) | (80,371,106 | ) | (7,375,237 | ) | (69,160,448 | ) | ||||||||
Net increase (decrease) | (4,625,235 | ) | $ | (44,210,930 | ) | (2,788,518 | ) | $ | (25,817,388 | ) | ||||||
franklintempleton.com | Annual Report | 47 | ||
FRANKLIN STRATEGIC SERIES
NOTES TO CONSOLIDATED FINANCIAL STATEMENTS
Franklin Strategic Income Fund (continued)
2. Shares of Beneficial Interest (continued)
| Year Ended April 30, | ||||||||||||||||
| 2017 | 2016 | |||||||||||||||
| Shares | Amount | Shares | Amount | |||||||||||||
Class R6 Shares: | ||||||||||||||||
Shares sold | 29,445,785 | $ | 281,752,337 | 7,061,535 | $ | 67,749,297 | ||||||||||
Shares issued in reinvestment of distributions | 939,596 | 9,020,539 | 1,263,743 | 11,900,261 | ||||||||||||
Shares redeemed | (23,650,469 | ) | (228,959,440 | ) | (2,868,916 | ) | (27,272,113 | ) | ||||||||
Net increase (decrease) | 6,734,912 | $ | 61,813,436 | 5,456,362 | $ | 52,377,445 | ||||||||||
Advisor Class Shares: | ||||||||||||||||
Shares sold | 56,693,852 | $ | 545,767,778 | 29,938,042 | $ | 283,540,799 | ||||||||||
Shares issued in reinvestment of distributions | 1,934,521 | 18,551,538 | 4,428,844 | 41,793,674 | ||||||||||||
Shares redeemed | (47,049,436 | ) | (451,940,540 | ) | (49,826,590 | ) | (467,543,557 | ) | ||||||||
Net increase (decrease) | 11,578,937 | $ | 112,378,776 | (15,459,704 | ) | $ | (142,209,084 | ) | ||||||||
3. Transactions with Affiliates
Franklin Resources, Inc. is the holding company for various subsidiaries that together are referred to as Franklin Templeton Investments. Certain officers and trustees of the Trust are also officers and/or directors of the following subsidiaries:
| Subsidiary | Affiliation | |
| Franklin Advisers, Inc. (Advisers) | Investment manager | |
| Franklin Templeton Services, LLC (FT Services) | Administrative manager | |
| Franklin Templeton Distributors, Inc. (Distributors) | Principal underwriter | |
| Franklin Templeton Investor Services, LLC (Investor Services) | Transfer agent |
a. Management Fees
The Fund pays an investment management fee to Advisers based on the average daily net assets of the Fund as follows:
| Annualized Fee Rate | Net Assets | |
| 0.625% | Up to and including $100 million | |
| 0.500% | Over $100 million, up to and including $250 million | |
| 0.450% | Over $250 million, up to and including $7.5 billion | |
| 0.440% | Over $7.5 billion, up to and including $10 billion | |
| 0.430% | Over $10 billion, up to and including $12.5 billion | |
| 0.420% | Over $12.5 billion, up to and including $15 billion | |
| 0.400% | Over $15 billion, up to and including $17.5 billion | |
| 0.380% | Over $17.5 billion, up to and including $20 billion | |
| 0.360% | Over $20 billion, up to and including $35 billion | |
| 0.355% | Over $35 billion, up to and including $50 billion | |
| 0.350% | In excess of $50 billion |
For the year ended April 30, 2017, the effective investment management fee rate was 0.453% of the Fund’s average daily net assets.
48 | Annual Report | franklintempleton.com | ||
FRANKLIN STRATEGIC SERIES
NOTES TO CONSOLIDATED FINANCIAL STATEMENTS
Franklin Strategic Income Fund (continued)
b. Administrative Fees
Under an agreement with Advisers, FT Services provides administrative services to the Fund. The fee is paid by Advisers based on the Fund’s average daily net assets, and is not an additional expense of the Fund.
c. Distribution Fees
The Board has adopted distribution plans for each share class, with the exception of Class R6 and Advisor Class shares, pursuant to Rule 12b-1 under the 1940 Act. Under the Fund’s Class A reimbursement distribution plan, the Fund reimburses Distributors for costs incurred in connection with the servicing, sale and distribution of the Fund’s shares up to the maximum annual plan rate. Under the Class A reimbursement distribution plan, costs exceeding the maximum for the current plan year cannot be reimbursed in subsequent periods. In addition, under the Fund’s Class C and R compensation distribution plans, the Fund pays Distributors for costs incurred in connection with the servicing, sale and distribution of the Fund’s shares up to the maximum annual plan rate for each class. The plan year, for purposes of monitoring compliance with the maximum annual plan rates, is February 1 through January 31.
The maximum annual plan rates, based on the average daily net assets, for each class, are as follows:
Class A | 0.25 | % | ||
Class C | 0.65 | % | ||
Class R | 0.50 | % |
d. Sales Charges/Underwriting Agreements
Front-end sales charges and contingent deferred sales charges (CDSC) do not represent expenses of the Fund. These charges are deducted from the proceeds of sales of Fund shares prior to investment or from redemption proceeds prior to remittance, as applicable. Distributors has advised the Fund of the following commission transactions related to the sales and redemptions of the Fund’s shares for the year:
Sales charges retained net of commissions paid to unaffiliated brokers/dealers | $ | 903,032 | ||
CDSC retained | $ | 102,352 |
e. Transfer Agent Fees
Each class of shares, except for Class R6, pays transfer agent fees to Investor Services for its performance of shareholder servicing obligations and reimburses Investor Services for out of pocket expenses incurred, including shareholder servicing fees paid to third parties. These fees are allocated daily based upon their relative proportion of such classes’ aggregate net assets. Class R6 pays Investor Services transfer agent fees specific to that class.
For the year ended April 30, 2017, the Fund paid transfer agent fees of $10,128,688, of which $4,398,034 was retained by Investor Services.
franklintempleton.com | Annual Report | 49 | ||
FRANKLIN STRATEGIC SERIES
NOTES TO CONSOLIDATED FINANCIAL STATEMENTS
Franklin Strategic Income Fund (continued)
3. Transactions with Affiliates (continued)
f. Investments in Affiliated Management Investment Companies
The Fund invests in one or more affiliated management investment companies for purposes other than exercising a controlling influence over the management or policies. Management fees paid by the Fund are waived on assets invested in the affiliated management investment companies, as noted in the Consolidated Statement of Operations, in an amount not to exceed the management and administrative fees paid directly or indirectly by each affiliate. Prior to May 1, 2013, the waiver was accounted for as a reduction to management fees. During the year ended April 30, 2017, the Fund held investments in affiliated management investment companies as follows:
| Number of Shares Held at Beginning of Year | Gross Additions | Gross Reductions | Number of Shares Held at End of Year | Value at End of Year | Investment Income | Realized Gain (Loss) | % of Affiliated Fund Shares Outstanding Held at End of Year | |||||||||||||||||
Controlled Affiliates | ||||||||||||||||||||||||
Franklin Lower Tier Floating Rate Fund | 38,346,600 | — | (12,985,481) | 25,361,119 | $ | 267,559,803 | $ | 35,276,773 | $ | 5,141,681 | 82.8 | % | ||||||||||||
Franklin Middle Tier Floating Rate Fund | 29,441,483 | — | (7,607,796) | 21,833,687 | 219,646,896 | 17,998,862 | (182,472 | ) | 77.3 | % | ||||||||||||||
Non-Controlled Affiliates | ||||||||||||||||||||||||
Institutional Fiduciary Trust Money Market Portfolio, 0.37% | 910,963,589 | 1,701,085,992 | (2,407,220,891) | 204,828,690 | $ | 204,828,690 | $ | 109,263 | $ | — | 1.1 | % | ||||||||||||
Total |
$ |
692,035,389 |
| $ | 53,384,898 | $ | 4,959,209 | |||||||||||||||||
g. Waiver and Expense Reimbursements
Investor Services has contractually agreed in advance to waive or limit its fees so that the Class R6 transfer agent fees do not exceed 0.01% until August 31, 2017. There were no Class R6 transfer agent fees waived during the year ended April 30, 2017.
h. Interfund Transactions
The Fund engaged in purchases and sales of investments with funds or other accounts that have common investment managers (or affiliated investment managers), directors, trustees or officers. During the year ended April 30, 2017, the purchase and sale transactions aggregated $0 and $8,183,250, respectively.
4. Expense Offset Arrangement
The Fund has entered into an arrangement with its custodian whereby credits realized as a result of uninvested cash balances are used to reduce a portion of the Fund’s custodian expenses. During the year ended April 30, 2017, the custodian fees were reduced as noted in the Consolidated Statement of Operations.
50 | Annual Report | franklintempleton.com | ||
FRANKLIN STRATEGIC SERIES
NOTES TO CONSOLIDATED FINANCIAL STATEMENTS
Franklin Strategic Income Fund (continued)
5. Income Taxes
For tax purposes, capital losses may be carried over to offset future capital gains, if any. At April 30, 2017, the capital loss carryforwards were as follows:
Capital loss carryforwards: | ||||
Short Term | $ | 17,059,753 | ||
Long Term | 246,333,535 | |||
|
| |||
Total capital loss carryforwards | $ | 263,393,288 | ||
|
|
For tax purposes, the Fund may elect to defer any portion of a late-year ordinary loss to the first day of the following fiscal year. At April 30, 2017, the Fund deferred late-year ordinary losses of $84,249,471.
The tax character of distributions paid during the years ended April 30, 2017 and 2016, was as follows:
| 2017 | 2016 | |||||||
Distributions paid from ordinary income |
$ |
130,279,135 |
| $ | 339,056,921 | |||
At April 30, 2017, the cost of investments and net unrealized appreciation (depreciation) for income tax purposes were as follows:
Cost of investments. | $ | 7,300,580,680 | ||
|
|
| ||
Unrealized appreciation | $ | 188,697,390 | ||
Unrealized depreciation | (297,722,523) | |||
|
|
| ||
Net unrealized appreciation (depreciation) | $ | (109,025,133) | ||
|
|
| ||
Differences between income and/or capital gains as determined on a book basis and a tax basis are primarily due to differing treatments of defaulted securities, foreign currency transactions, bond discounts and premiums and inflation related adjustments on foreign securities.
6. Investment Transactions
Purchases and sales of investments (excluding short term securities) for the year ended April 30, 2017, aggregated $10,157,062,872 and $10,323,330,874, respectively.
7. Credit Risk and Defaulted Securities
At April 30, 2017, the Fund had 49.8% of its portfolio invested in high yield, senior secured floating rate notes, or other securities rated below investment grade and unrated securities, if any. These securities may be more sensitive to economic conditions causing greater price volatility and are potentially subject to a greater risk of loss due to default than higher rated securities.
The Fund held a defaulted security and/or other securities for which the income has been deemed uncollectible. At April 30, 2017, the value of this security was $6,156,250, representing 0.1% of the Fund’s net assets. The Fund discontinues accruing income on securities for which income has been deemed uncollectible and provides an estimate for losses on interest receivable. The security has been identified in the accompanying Consolidated Statement of Investments.
franklintempleton.com | Annual Report | 51 | ||
FRANKLIN STRATEGIC SERIES
NOTES TO CONSOLIDATED FINANCIAL STATEMENTS
Franklin Strategic Income Fund (continued)
8. Restricted Securities
The Fund invests in securities that are restricted under the Securities Act of 1933 (1933 Act) or which are subject to legal, contractual, or other agreed upon restrictions on resale. Restricted securities are often purchased in private placement transactions, and cannot be sold without prior registration unless the sale is pursuant to an exemption under the 1933 Act. Disposal of these securities may require greater effort and expense, and prompt sale at an acceptable price may be difficult. The Fund may have registration rights for restricted securities. The issuer generally incurs all registration costs.
At April 30, 2017, investments in restricted securities, excluding certain securities exempt from registration under the 1933 Act deemed to be liquid, were as follows:
| Shares | Issuer | Acquisition Date | Cost | Value | ||||||||||
| ||||||||||||||
3,418 | a Chaparral Energy Inc., A, 144A | 3/21/17 | $ | 86,048 | $ | 86,719 | ||||||||
955,276 | b Halcon Resources Corp. | 10/23/12 - 11/24/15 | 24,687,967 | 6,141,864 | ||||||||||
125,940,079 | Holdco 2, A | 2/08/13 - 2/01/17 | 977,122 | 94,224 | ||||||||||
12,532,822 | Holdco 2, B | 2/01/17 | 9,305 | 9,377 | ||||||||||
211,824 | Warrior Met Coal Inc. | 5/28/14 - 11/13/14 | 29,562,025 | 3,638,294 | ||||||||||
Total Restricted Securities (Value is 0.1% of Net Assets) | $ | 55,322,467 | $ | 9,970,478 | ||||||||||
aThe Fund also invests in unrestricted securities or other investments in the issuer, valued at $13,568,050 as of April 30, 2017.
bThe Fund also invests in unrestricted securities or other investments in the issuer, valued at $79,558 as of April 30, 2017.
9. Unfunded Loan Commitments
The Fund enters into certain credit agreements, all or a portion of which may be unfunded. The Fund is obligated to fund these loan commitments at the borrowers’ discretion. Unfunded loan commitments and funded portions of credit agreements are marked to market daily and any unrealized appreciation or depreciation is included in the Consolidated Statement of Assets and Liabilities and the Consolidated Statement of Operations. Funded portions of credit agreements are presented in the Consolidated Statement of Investments.
At April 30, 2017, unfunded commitments were as follows:
| Borrower | Unfunded Commitment | |||
Global Tel*Link Corp, Revolving Commitment | $1,478,221 | |||
10. Other Derivative Information
At April 30, 2017, the Fund’s investments in derivative contracts are reflected in the Consolidated Statement of Assets and Liabilities as follows:
| Asset Derivatives | Liability Derivatives | |||||||||||
Derivative Contracts Not Accounted for as Hedging Instruments | Consolidated Statement of Assets and Liabilities Location | Fair Value | Consolidated Statement of Assets and Liabilities Location | Fair Value | ||||||||
Interest rate contracts | Variation margin | $ | 3,009,865 | a | Variation margin | $ | — | |||||
Foreign exchange contracts | Unrealized appreciation on OTC forward exchange contracts | 8,222,540 | Unrealized depreciation on OTC forward exchange contracts | 7,683,636 | ||||||||
Credit contracts | Variation margin | — | Variation margin | 956,924 | a | |||||||
OTC swap contracts (upfront payments) | 969,147 | OTC swap contracts (upfront receipts) | 1,377,111 | |||||||||
52 | Annual Report | franklintempleton.com | ||
FRANKLIN STRATEGIC SERIES
NOTES TO CONSOLIDATED FINANCIAL STATEMENTS
Franklin Strategic Income Fund (continued)
| Asset Derivatives | Liability Derivatives | |||||||||||
Derivative Contracts Not Accounted for as Hedging Instruments
| Consolidated Statement of Assets and Liabilities Location
| Fair Value
| Consolidated Statement of Assets and Liabilities Location
| Fair Value
| ||||||||
| Unrealized appreciation on OTC swap contracts | 558,747 | Unrealized depreciation on OTC swap contracts | — | |||||||||
Value recovery instruments | Investments in securities, at value | 7,256,738 | Investments in securities, at value | — | ||||||||
|
|
|
| |||||||||
Totals | $ | 20,017,037 | $ | 10,017,671 | ||||||||
|
|
|
| |||||||||
aThis amount reflects the cumulative appreciation (depreciation) of futures contracts and centrally cleared swap contracts as reported in the Consolidated Statement of Investments. Only the variation margin receivable/payable at period end is separately reported within the Consolidated Statement of Assets and Liabilities. Prior variation margin movements were recorded to cash upon receipt or payment.
For the year ended April 30, 2017, the effect of derivative contracts in the Fund’s Consolidated Statement of Operations was as follows:
Derivative Contracts Not Accounted for as Hedging Instruments
| Consolidated Statement of Operations Locations
| Net Realized
| Consolidated Statement of
| Net Change in
| ||||||||
Net realized gain (loss) from: | Net change in unrealized | |||||||||||
| appreciation (depreciation) on: | ||||||||||||
Interest rate contracts | Futures contracts | $ | (7,478,050) | Futures contracts | $ | 3,009,865 | ||||||
Swap contracts | 1,302,484 |
Swap contracts | — | |||||||||
Foreign exchange contracts | Investments | (221,720) | a | Investments | — | |||||||
Foreign currency transactions | (5,138,233) | b |
Translation of other assets and | 46,907,815 | b | |||||||
| liabilities denominated in | ||||||||||||
| foreign currencies | ||||||||||||
Credit contracts | Investments | (478,800) | a |
Investments | — | |||||||
Swap contracts | (3,577,640) |
Swap contracts | (743,033) | |||||||||
Value recovery instruments | Investments | — |
Investments | 822,878 | ||||||||
|
|
|
| |||||||||
Totals | $ | (15,591,959 | $ | 49,997,525 | ||||||||
|
|
|
| |||||||||
aPurchased option contracts are included in net realized gain (loss) from investments and net change in unrealized appreciation (depreciation) on investments in the Consolidated Statement of Operations.
bForward exchange contracts are included in net realized gain (loss) from foreign currency transactions and net change in unrealized appreciation (depreciation) on translation of other assets and liabilities denominated in foreign currencies in the Consolidated Statement of Operations.
At April 30, 2017, the Fund’s OTC derivative assets and liabilities are as follows:
Gross and Net Amounts of Assets and Liabilities Presented in the Consolidated Statement of Assets and Liabilities | ||||||||
Assetsa
| Liabilitiesa
| |||||||
Derivatives | ||||||||
Forward exchange contracts | $8,222,540 | $7,683,636 | ||||||
Swap contracts | 1,527,894 | 1,377,111 | ||||||
Total | $9,750,434 | $9,060,747 | ||||||
aAbsent an event of default or early termination, OTC derivative assets and liabilities are presented gross and not offset in the Consolidated Statement of Assets and Liabilities.
franklintempleton.com | Annual Report | 53 | ||
FRANKLIN STRATEGIC SERIES
NOTES TO CONSOLIDATED FINANCIAL STATEMENTS
Franklin Strategic Income Fund (continued)
10. Other Derivative Information (continued)
At April 30, 2017, the Fund’s OTC derivative assets, which may be offset against the Fund’s OTC derivative liabilities and collateral received from the counterparty, are as follows:
| Amounts Not Offset in the | ||||||||||||||||||||
| Consolidated Statement of Assets and Liabilities | ||||||||||||||||||||
Gross Amounts of Assets Presented in the Consolidated Statement of
| Financial
| Financial
| Cash
| Net Amount
| ||||||||||||||||
Counterparty | ||||||||||||||||||||
CITI | $1,527,894 | $(1,377,111 | ) | $ — | $ — | $150,783 | ||||||||||||||
DBAB | 3,242,187 | (2,660,985 | ) | — | (581,202 | ) | — | |||||||||||||
JPHQ | 4,980,353 | (4,980,353 | ) | — | — | — | ||||||||||||||
Total | $9,750,434 | $(9,018,449 | ) | $ — | $(581,202 | ) | $150,783 | |||||||||||||
At April 30, 2017, the Fund’s OTC derivative liabilities, which may be offset against the Fund’s OTC derivative assets and collateral pledged to the counterparty, are as follows:
| Amounts Not Offset in the | ||||||||||||||||||||
| Consolidated Statement of Assets and Liabilities | ||||||||||||||||||||
Gross Amounts of | Financial Instruments Available for Offset | Financial Instruments Collateral Pledged | Cash Collateral Pledgedb | Net Amount (Not less than zero) | ||||||||||||||||
Counterparty | ||||||||||||||||||||
CITI | $1,377,111 | $(1,377,111 | ) | $ — | $ — | $ — | ||||||||||||||
DBAB | 2,660,985 | (2,660,985 | ) | — | — | — | ||||||||||||||
JPHQ | 5,022,651 | (4,980,353 | ) | — | — | 42,298 | ||||||||||||||
Total | $9,060,747 | $(9,018,449 | ) | $ — | $ — | $ 42,298 | ||||||||||||||
bIn some instances, the collateral amounts disclosed in the table above were adjusted due to the requirement to limit the collateral amounts to avoid the effect of overcollateralization. Actual collateral received and/or pledged may be more than the amounts disclosed herein.
For the year ended April 30, 2017, the average month end fair value of derivatives represented 0.8% of average month end net assets. The average month end number of open derivative contracts for the period was 57.
See Note 1(d) regarding derivative financial instruments.
See Abbreviations on page 58.
11. Holdings of 5% Voting Securities of Portfolio Companies
The 1940 Act defines “affiliated companies” to include investments in portfolio companies in which a fund owns 5% or more of the outstanding voting securities. During the year ended April 30, 2017, investments in “affiliated companies” were as follows:
54 | Annual Report | franklintempleton.com | ||
FRANKLIN STRATEGIC SERIES
NOTES TO CONSOLIDATED FINANCIAL STATEMENTS
Franklin Strategic Income Fund (continued)
| Name of Issuer | Number of at Beginning of Year | Gross Additions | Gross Reductions | Number of Held at End | Value at End of Year | Investment Income | Realized Gain (Loss) | |||||||||||||||||||
| ||||||||||||||||||||||||||
Non-Controlled Affiliates | ||||||||||||||||||||||||||
CHC Group LLC (Value is 0.0%a of Net Assets) | — | 168,355 | b | — | 168,355 | $2,020,260 | $— | $— | ||||||||||||||||||
|
| |||||||||||||||||||||||||
aRounds to less than 0.1% of net assets.
bGross addition was the result of a corporate action.
12. Credit Facility
The Fund, together with other U.S. registered and foreign investment funds (collectively, Borrowers), managed by Franklin Templeton Investments, are borrowers in a joint syndicated senior unsecured credit facility totaling $2 billion (Global Credit Facility) which matures on February 9, 2018. This Global Credit Facility provides a source of funds to the Borrowers for temporary and emergency purposes, including the ability to meet future unanticipated or unusually large redemption requests.
Under the terms of the Global Credit Facility, the Fund shall, in addition to interest charged on any borrowings made by the Fund and other costs incurred by the Fund, pay its share of fees and expenses incurred in connection with the implementation and maintenance of the Global Credit Facility, based upon its relative share of the aggregate net assets of all of the Borrowers, including an annual commitment fee of 0.15% based upon the unused portion of the Global Credit Facility. These fees are reflected in other expenses in the Consolidated Statement of Operations. During the year ended April 30, 2017, the Fund did not use the Global Credit Facility.
13. Fair Value Measurements
The Fund follows a fair value hierarchy that distinguishes between market data obtained from independent sources (observable inputs) and the Fund’s own market assumptions (unobservable inputs). These inputs are used in determining the value of the Fund’s financial instruments and are summarized in the following fair value hierarchy:
| • | Level 1 – quoted prices in active markets for identical financial instruments |
| • | Level 2 – other significant observable inputs (including quoted prices for similar financial instruments, interest rates, prepayment speed, credit risk, etc.) |
| • | Level 3 – significant unobservable inputs (including the Fund’s own assumptions in determining the fair value of financial instruments) |
The input levels are not necessarily an indication of the risk or liquidity associated with financial instruments at that level.
For movements between the levels within the fair value hierarchy, the Fund has adopted a policy of recognizing the transfers as of the date of the underlying event which caused the movement.
franklintempleton.com | Annual Report | 55 | ||
FRANKLIN STRATEGIC SERIES
NOTES TO CONSOLIDATED FINANCIAL STATEMENTS
Franklin Strategic Income Fund (continued)
13. Fair Value Measurements (continued)
A summary of inputs used as of April 30, 2017, in valuing the Fund’s assets and liabilities carried at fair value, is as follows:
Level 1
| Level 2
| Level 3
| Total
| |||||||||||||
Assets: | ||||||||||||||||
Investments in Securities: | ||||||||||||||||
Equity Investments:a | ||||||||||||||||
Consumer Services | $ | — | $ | — | $ | 25,946,719 | $ | 25,946,719 | ||||||||
Energy. | 23,243,275 | 15,588,310 | 6,232,655 | 45,064,240 | ||||||||||||
Materials | 236,767 | — | 3,638,294 | 3,875,061 | ||||||||||||
Retailing | — | — | 103,601 | 103,601 | ||||||||||||
Transportation | — | 1,098,820 | — | 1,098,820 | ||||||||||||
All Other Equity Investmentsb | 494,887,695 | — | — | 494,887,695 | ||||||||||||
Convertible Bonds | — | 15,972,955 | — | 15,972,955 | ||||||||||||
Corporate Bonds | — | 3,142,558,813 | — | 3,142,558,813 | ||||||||||||
Senior Floating Rate Interests | — | 646,516,054 | c | — | 646,516,054 | |||||||||||
Foreign Government and Agency Securities | — | 587,648,160 | — | 587,648,160 | ||||||||||||
U.S. Government and Agency Securities | — | 431,852,289 | — | 431,852,289 | ||||||||||||
Asset-Backed Securities and Commercial | ||||||||||||||||
Mortgage-Backed Securities | — | 798,406,398 | — | 798,406,398 | ||||||||||||
Mortgage-Backed Securities | — | 643,358,128 | — | 643,358,128 | ||||||||||||
Municipal Bonds | — | 144,127,712 | — | 144,127,712 | ||||||||||||
Escrows and Litigation Trusts | — | 1,081,447 | 348,000 | c | 1,429,447 | |||||||||||
Short Term Investments | 208,709,455 | — | — | 208,709,455 | ||||||||||||
Total Investments in Securities | $ | 727,077,192 | $ | 6,428,209,086 | $ | 36,269,269 | $ | 7,191,555,547 | ||||||||
Other Financial Instruments: | ||||||||||||||||
Futures Contracts | $ | 3,009,865 | $ | — | $ | — | $ | 3,009,865 | ||||||||
Forward Exchange Contracts | — | 8,222,540 | — | 8,222,540 | ||||||||||||
Swap Contracts. | — | 558,747 | — | 558,747 | ||||||||||||
Unfunded Loan Commitments | — | 44,003 | — | 44,003 | ||||||||||||
Total Other Financial Instruments | $ | 3,009,865 | $ | 8,825,290 | $ | — | $ | 11,835,155 | ||||||||
Liabilities: | ||||||||||||||||
Other Financial Instruments: | ||||||||||||||||
Forward Exchange Contracts | $ | — | $ | 7,683,636 | $ | — | $ | 7,683,636 | ||||||||
Swap Contracts. | — | 956,924 | — | 956,924 | ||||||||||||
Total Other Financial Instruments | $ | — | $ | 8,640,560 | $ | — | $ | 8,640,560 | ||||||||
aIncludes common and convertible preferred stocks and management investment companies as well as other equity investments.
bFor detailed categories, see the accompanying Consolidated Statement of Investments.
cIncludes securities determined to have no value at April 30, 2017.
A reconciliation of assets in which Level 3 inputs are used in determining fair value is presented when there are significant Level 3 financial instruments at the end of the year.
14. New Accounting Pronouncements
In March 2017, the Financial Accounting Standards Board (FASB) issued Accounting Standards Update (ASU) No. 2017-08, Receivables—Nonrefundable Fees and Other Costs (Subtopic 310-20): Premium Amortization on Purchased Callable Debt Securities. The amendments in the ASU shorten the amortization period for certain callable debt securities, held at a premium, to be amortized to the earliest call date. The ASU does not require an accounting change for securities held at a discount; which continues to be amortized to maturity. The ASU is effective for fiscal years and interim periods within those fiscal years beginning after December 15, 2018. Management is currently evaluating the impact, if any, of applying this provision.
56 | Annual Report | franklintempleton.com | ||
FRANKLIN STRATEGIC SERIES
NOTES TO CONSOLIDATED FINANCIAL STATEMENTS
Franklin Strategic Income Fund (continued)
15. Investment Company Reporting Modernization
In October 2016, the U.S. Securities and Exchange Commission adopted new rules and amended existing rules (together, final rules) intended to modernize the reporting and disclosure of information by registered investment companies. In part, the final rules amend Regulation S-X and require standardized, enhanced disclosures about derivatives in investment company financial statements, as well as other amendments. The compliance date for the amendments to Regulation S-X is August 1, 2017. Management is currently evaluating the impact that the adoption of the amendments to Regulation S-X will have on the Fund’s financial statements and related disclosures.
16. Subsequent Events
The Fund has evaluated subsequent events through the issuance of the financial statements and determined that no events have occurred that require disclosure.
franklintempleton.com | Annual Report | 57 | ||
FRANKLIN STRATEGIC SERIES
NOTES TO CONSOLIDATED FINANCIAL STATEMENTS
Franklin Strategic Income Fund (continued)
Abbreviations
Counterparty/Exchange
| Currency
| Selected Portfolio
| ||||||||
CITI | Citigroup, Inc. | BRL | Brazilian Real | ARM | Adjustable Rate Mortgage | |||||
DBAB | Deutsche Bank AG | EUR | Euro | CDA | Community Development Authority/Agency | |||||
ICE | Intercontinental Exchange | GBP | British Pound | CDO | Collateralized Debt Obligation | |||||
JPHQ | JP Morgan Chase & Co. | IDR | Indonesian Rupiah | CLO | Collateralized Loan Obligation | |||||
| KRW | South Korean Won | EDA | Economic Development Authority | |||||||
| MXN | Mexican Peso | FRN | Floating Rate Note | |||||||
| MYR | Malaysian Ringgit | GDP | Gross Domestic Product | |||||||
| PHP | Philippine Peso | GO | General Obligation | |||||||
| SEK | Swedish Krona | HDC | Housing Development Corp. | |||||||
| USD | United States Dollar | PCR | Pollution Control Revenue | |||||||
PIK | Payment-In-Kind | |||||||||
SF | Single Family | |||||||||
TRA | Tax Receivable Agreement Right | |||||||||
VRI | Value Recovery Instruments | |||||||||
Index
| ||
CDX.NA.HY.28 | CDX North America High Yield Index | |
MCDX.NA.28 | MCDX North America Index |
58 | Annual Report | franklintempleton.com | ||
FRANKLIN STRATEGIC SERIES
Report of Independent Registered Public Accounting Firm
To the Board of Trustees of Franklin Strategic Series and Shareholders of the Franklin Strategic Income Fund:
In our opinion, the accompanying consolidated statement of assets and liabilities, including the consolidated statement of investments, and the related consolidated statements of operations and of changes in net assets and the financial highlights present fairly, in all material respects, the financial position of the Franklin Strategic Income Fund (the “Fund”) as of April 30, 2017, the results of its operations for the year then ended, the changes in its net assets for each of the two years in the period then ended and the consolidated financial highlights for each of the periods indicated, in conformity with accounting principles generally accepted in the United States of America. These consolidated financial statements and consolidated financial highlights (hereafter referred to as “financial statements”) are the responsibility of the Fund’s management. Our responsibility is to express an opinion on these financial statements based on our audits. We conducted our audits of these financial statements in accordance with the standards of the Public Company Accounting Oversight Board (United States). Those standards require that we plan and perform the audit to obtain reasonable assurance about whether the financial statements are free of material misstatement. An audit includes examining, on a test basis, evidence supporting the amounts and disclosures in the financial statements, assessing the accounting principles used and significant estimates made by management, and evaluating the overall financial statement presentation. We believe that our audits, which included confirmation of securities as of April 30, 2017 by correspondence with the custodian, transfer agent and brokers, provide a reasonable basis for our opinion.
| PricewaterhouseCoopers LLP |
| San Francisco, California |
| June 20, 2017 |
franklintempleton.com | Annual Report | 59 | ||
FRANKLIN STRATEGIC SERIES
The name, year of birth and address of the officers and board members, as well as their affiliations, positions held with the Trust, principal occupations during at least the past five years and number of U.S. registered portfolios overseen in the Franklin Templeton Investments fund complex, are shown below. Generally, each board member serves until that person’s successor is elected and qualified.
Independent Board Members
Name, Year of Birth and Address
| Position
| Length of
| Number of Portfolios in
| Other Directorships Held During at Least the Past 5 Years
| ||||
Harris J. Ashton (1932) One Franklin Parkway San Mateo, CA 94403-1906 | Trustee | Since 1991 | 142 | Bar-S Foods (meat packing company) (1981-2010). | ||||
| Principal Occupation During at Least the Past 5 Years: | ||||||||
| Director of various companies; and formerly, Director, RBC Holdings, Inc. (bank holding company) (until 2002); and President, Chief Executive Officer and Chairman of the Board, General Host Corporation (nursery and craft centers) (until 1998). | ||||||||
| Mary C. Choksi (1950) | Trustee | Since 2014 | 136 | Avis Budget Group Inc. (car rental) | ||||
One Franklin Parkway San Mateo, CA 94403-1906 | (2007-present), Omnicom Group Inc. (advertising and marketing communications services) (2011-present) and H.J. Heinz Company (processed foods and allied products) (1998-2006) | |||||||
| Principal Occupation During at Least the Past 5 Years: | ||||||||
| Senior Advisor, Strategic Investment Group (investment management group) (2015-present); director of various companies; and formerly, Founding Partner and Senior Managing Director, Strategic Investment Group (1987–2015); Founding Partner and Managing Director, Emerging Markets Management LLC (investment management firm) (1987-2011); and Loan Officer/Senior Loan Officer/Senior Pension Investment Officer, World Bank Group (international financial institution) (1977-1987). | ||||||||
| Edith E. Holiday (1952) | Trustee | Since 1998 | 142 | Hess Corporation (exploration and | ||||
One Franklin Parkway San Mateo, CA 94403-1906 | refining of oil and gas) (1993-present), Canadian National Railway (railroad) (2001-present), White Mountains Insurance Group, Ltd. (holding company) (2004-present), Santander Consumer USA Holdings, Inc. (consumer finance) (2016-present), RTI International Metals, Inc. (manufacture and distribution of titanium) (1999-2015) and H.J. Heinz Company (processed foods and allied products) (1994-2013). | |||||||
| Principal Occupation During at Least the Past 5 Years: | ||||||||
| Director or Trustee of various companies and trusts; and formerly, Assistant to the President of the United States and Secretary of the Cabinet (1990-1993); General Counsel to the United States Treasury Department (1989-1990); and Counselor to the Secretary and Assistant Secretary for Public Affairs and Public Liaison – United States Treasury Department (1988-1989). | ||||||||
| J. Michael Luttig (1954) | Trustee | Since 2009 | 142 | Boeing Capital Corporation (aircraft | ||||
One Franklin Parkway San Mateo, CA 94403-1906 | financing) (2006-2013). | |||||||
| Principal Occupation During at Least the Past 5 Years: | ||||||||
| Executive Vice President, General Counsel and member of the Executive Council, The Boeing Company (aerospace company)(2006-present);and formerly, Federal Appeals Court Judge, U.S. Court of Appeals for the Fourth Circuit (1991-2006). | ||||||||
60 | Annual Report | franklintempleton.com | ||
FRANKLIN STRATEGIC SERIES
Independent Board Members (continued)
Name, Year of Birth and Address
| Position
| Length of
| Number of Portfolios in
| Other Directorships Held During at Least the Past 5 Years
| ||||
Larry D. Thompson (1945) One Franklin Parkway San Mateo, CA 94403-1906 | Trustee | Since 2007 | 142 | The Southern Company (energy company) (2014-present; previously 2010-2012), Graham Holdings Company (education and media organization) (2011-present) and Cbeyond, Inc. (business communications provider) (2010-2012). | ||||
| Principal Occupation During at Least the Past 5 Years: | ||||||||
| Director of various companies; John A. Sibley Professor of Corporate and Business Law, University of Georgia School of Law (2015-present;previously 2011-2012); and formerly, Executive Vice President – Government Affairs, General Counsel and Corporate Secretary, PepsiCo, Inc. (consumer products) (2012-2014); Senior Vice President – Government Affairs, General Counsel and Secretary, PepsiCo, Inc. (2004-2011); Senior Fellow of The Brookings Institution (2003-2004); Visiting Professor, University of Georgia School of Law (2004); and Deputy Attorney General, U.S. Department of Justice (2001-2003). | ||||||||
John B. Wilson (1959) One Franklin Parkway San Mateo, CA 94403-1906 | Lead Independent Trustee | Trustee since 2006 and Lead Independent Trustee since 2008 | 116 | None | ||||
| Principal Occupation During at Least the Past 5 Years: | ||||||||
| President, Staples Europe (office supplies) (2012-present); President and Founder, Hyannis Port Capital, Inc. (real estate and private equity investing); serves on private and non-profit boards; and formerly, Chief Operating Officer and Executive Vice President, Gap, Inc. (retail) (1996-2000); Chief Financial Officer and Executive Vice President – Finance and Strategy, Staples, Inc. (1992-1996); Senior Vice President – Corporate Planning, Northwest Airlines, Inc. (airlines) (1990-1992); and Vice President and Partner, Bain & Company (consulting firm) (1986-1990). | ||||||||
Interested Board Members and Officers
Name,Year of Birth and Address
| Position
| Length of
| Number of Portfolios in
| Other Directorships Held During at Least the Past 5
| ||||
**Gregory E. Johnson (1961) One Franklin Parkway San Mateo, CA 94403-1906 | Trustee | Since 2013 | 158 | None | ||||
| Principal Occupation During at Least the Past 5 Years: | ||||||||
| Chairman of the Board, Member - Office of the Chairman, Director and Chief Executive Officer, Franklin Resources, Inc.; officer and/or director or trustee, as the case may be, of some of the other subsidiaries of Franklin Resources, Inc. and of 44 of the investment companies in Franklin Templeton Investments; Vice Chairman, Investment Company Institute; and formerly, President, Franklin Resources, Inc. (1994-2015). | ||||||||
**Rupert H. Johnson, Jr. (1940) San Mateo, CA 94403-1906 | Chairman of the Board and Trustee | Chairman of the Board since 2013 and Trustee since 1991 | 142 | None | ||||
| Principal Occupation During at Least the Past 5 Years: | ||||||||
| Vice Chairman, Member – Office of the Chairman and Director, Franklin Resources, Inc.; Director, Franklin Advisers, Inc.; Senior Vice President, Franklin Advisory Services, LLC; and officer and/or director or trustee, as the case may be, of some of the other subsidiaries of Franklin Resources, Inc. and of 42 of the investment companies in Franklin Templeton Investments. | ||||||||
Alison E. Baur (1964) One Franklin Parkway San Mateo, CA 94403-1906 | Vice President | Since 2012 | Not Applicable | Not Applicable | ||||
| Principal Occupation During at Least the Past 5 Years: | ||||||||
| Deputy General Counsel, Franklin Templeton Investments; and officer of some of the other subsidiaries of Franklin Resources, Inc. and of 45 of the investment companies in Franklin Templeton Investments. | ||||||||
franklintempleton.com | Annual Report | 61 | ||
FRANKLIN STRATEGIC SERIES
Interested Board Members and Officers (continued)
Name, Year of Birth and Address
| Position
| Length of
| Number of Portfolios in
| Other Directorships Held During at Least the Past 5 Years
| ||||
Laura F. Fergerson (1962) One Franklin Parkway San Mateo, CA 94403-1906 | Chief Executive Officer – Finance and Administration | Since 2009 | Not Applicable | Not Applicable | ||||
| Principal Occupation During at Least the Past 5 Years: | ||||||||
| Senior Vice President, Franklin Templeton Services, LLC; Vice President, Franklin Advisers, Inc. and Franklin Templeton Institutional, LLC; and officer of 45 of the investment companies in Franklin Templeton Investments. | ||||||||
Gaston Gardey (1967) One Franklin Parkway San Mateo, CA 94403-1906 | Treasurer, Chief Financial Officer and Chief Accounting Officer | Since 2009 | Not Applicable | Not Applicable | ||||
| Principal Occupation During at Least the Past 5 Years: | ||||||||
| Treasurer, U.S. Fund Administration & Reporting, Franklin Templeton Investments; and officer of 27 of the investment companies in Franklin Templeton Investments. | ||||||||
Aliya S. Gordon (1973) One Franklin Parkway San Mateo, CA 94403-1906 | Vice President | Since 2009 | Not Applicable | Not Applicable | ||||
| Principal Occupation During at Least the Past 5 Years: | ||||||||
| Senior Associate General Counsel, Franklin Templeton Investments; and officer of 45 of the investment companies in Franklin Templeton Investments. | ||||||||
Steven J. Gray (1955) One Franklin Parkway San Mateo, CA 94403-1906 | Vice President | Since 2009 | Not Applicable | Not Applicable | ||||
| Principal Occupation During at Least the Past 5 Years: | ||||||||
| Senior Associate General Counsel, Franklin Templeton Investments; Vice President, Franklin Templeton Distributors, Inc.; and officer of 45 of the investment companies in Franklin Templeton Investments. | ||||||||
Edward B. Jamieson (1948) One Franklin Parkway San Mateo, CA 94403-1906 | President and Chief Executive Officer – Investment Management | Since 2010 | Not Applicable | Not Applicable | ||||
| Principal Occupation During at Least the Past 5 Years: | ||||||||
| President and Director, Franklin Advisers, Inc.; Executive Vice President, Franklin Templeton Institutional, LLC; and officer and/or trustee, as the case may be, of some of the other subsidiaries of Franklin Resources, Inc. and of 10 of the investment companies in Franklin Templeton Investments. | ||||||||
Robert Lim (1948) One Franklin Parkway San Mateo, CA 94403-1906 | Vice President –AML Compliance | Since 2016 | Not Applicable | Not Applicable | ||||
| Principal Occupation During at Least the Past 5 Years: | ||||||||
| Vice President, Franklin Templeton Companies, LLC; Chief Compliance Officer, Franklin Templeton Distributors, Inc. and Franklin Templeton Investor Services, LLC; and officer of 45 of the investment companies in Franklin Templeton Investments. | ||||||||
Christopher J. Molumphy (1962) One Franklin Parkway San Mateo, CA 94403-1906 | Vice President | Since 2000 | Not Applicable | Not Applicable | ||||
| Principal Occupation During at Least the Past 5 Years: | ||||||||
| Director and Executive Vice President, Franklin Advisers, Inc.; Executive Vice President, Franklin Templeton Institutional, LLC; and officer of some of the other subsidiaries of Franklin Resources, Inc. and of 22 of the investment companies in Franklin Templeton Investments. | ||||||||
62 | Annual Report | franklintempleton.com | ||
FRANKLIN STRATEGIC SERIES
Interested Board Members and Officers (continued)
Name, Year of Birth and Address
| Position
| Length of
| Number of Portfolios in
| Other Directorships Held During at Least the Past 5 Years
| ||||
Kimberly H. Novotny (1972) 300 S.E. 2nd Street Fort Lauderdale, FL 33301-1923 | Vice President | Since 2013 | Not Applicable | Not Applicable | ||||
| Principal Occupation During at Least the Past 5 Years: | ||||||||
| Associate General Counsel, Franklin Templeton Investments; Vice President and Corporate Secretary, Fiduciary Trust International of the South; Vice President, Templeton Investment Counsel, LLC; Assistant Secretary, Franklin Resources, Inc.; and officer of 45 of the investment companies in Franklin Templeton Investments. | ||||||||
Robert C. Rosselot (1960) 300 S.E. 2nd Street Fort Lauderdale, FL 33301-1923 | Chief Compliance Officer | Since 2013 | Not Applicable | Not Applicable | ||||
| Principal Occupation During at Least the Past 5 Years: | ||||||||
| Director, Global Compliance, Franklin Templeton Investments; Vice President, Franklin Templeton Companies, LLC; officer of 45 of the investment companies in Franklin Templeton Investments; and formerly, Senior Associate General Counsel, Franklin Templeton Investments (2007-2013); and Secretary and Vice President, Templeton Group of Funds (2004-2013). | ||||||||
Karen L. Skidmore (1952) One Franklin Parkway San Mateo, CA 94403-1906 | Vice President and Secretary | Since 2006 | Not Applicable | Not Applicable | ||||
| Principal Occupation During at Least the Past 5 Years: | ||||||||
| Senior Associate General Counsel, Franklin Templeton Investments; and officer of 45 of the investment companies in Franklin Templeton Investments. | ||||||||
Navid J. Tofigh (1972) One Franklin Parkway San Mateo, CA 94403-1906 | Vice President | Since 2015 | Not Applicable | Not Applicable | ||||
| Principal Occupation During at Least the Past 5 Years: | ||||||||
| Associate General Counsel, Franklin Templeton Investments; and officer of 45 of the investment companies in Franklin Templeton Investments. | ||||||||
Craig S. Tyle (1960) One Franklin Parkway San Mateo, CA 94403-1906 | Vice President | Since 2005 | Not Applicable | Not Applicable | ||||
| Principal Occupation During at Least the Past 5 Years: | ||||||||
| General Counsel and Executive Vice President, Franklin Resources, Inc.; and officer of some of the other subsidiaries of Franklin Resources, Inc. and of 45 of the investment companies in Franklin Templeton Investments. | ||||||||
Lori A. Weber (1964) 300 S.E. 2nd Street Fort Lauderdale, FL 33301-1923 | Vice President | Since 2011 | Not Applicable | Not Applicable | ||||
| Principal Occupation During at Least the Past 5 Years: | ||||||||
| Senior Associate General Counsel, Franklin Templeton Investments; Assistant Secretary, Franklin Resources, Inc.; Vice President and Secretary, Templeton Investment Counsel, LLC; and officer of 45 of the investment companies in Franklin Templeton Investments. | ||||||||
*We base the number of portfolios on each separate series of the U.S. registered investment companies within the Franklin Templeton Investments fund complex. These portfolios have a common investment manager or affiliated investment managers.
**Gregory E. Johnson is considered to be an interested person of the Fund under the federal securities laws due to his position as an officer and director of Franklin Resources, Inc. (Resources), which is the parent company of the Fund’s investment manager and distributor. Rupert H. Johnson, Jr. is considered to be an interested person of the Fund under the federal securities laws due to his position as officer and director and major shareholder of Resources.
Note 1: Rupert H. Johnson, Jr. is the uncle of Gregory E. Johnson.
Note 2: Officer information is current as of the date of this report. It is possible that after this date, information about officers may change.
Note 3: Effective November 1, 2016, Frank Olson ceased to be a trustee of the trust.
The Sarbanes-Oxley Act of 2002 and Rules adopted by the Securities and Exchange Commission require the Fund to disclose whether the Fund’s Audit Committee includes at least one member who is an audit committee financial expert within the meaning of such Act and Rules. The Fund’s Board has determined that there is at least one such financial expert on the Audit Committee and has designated John B. Wilson as its audit committee financial expert. The Board believes that Mr. Wilson qualifies as such an expert in view of his extensive business background and experience, including service as chief financial officer of Staples, Inc. from 1992 to 1996. Mr. Wilson has been a Member and Chairman of the Fund’s Audit Committee since 2006. As a result of such background and
franklintempleton.com | Annual Report | 63 | ||
FRANKLIN STRATEGIC SERIES
Interested Board Members and Officers (continued)
experience, the Board believes that Mr. Wilson has acquired an understanding of generally accepted accounting principles and financial statements, the general application of such principles in connection with the accounting estimates, accruals and reserves, and analyzing and evaluating financial statements that present a breadth and level of complexity of accounting issues generally comparable to those of the Fund, as well as an understanding of internal controls and procedures for financial reporting and an understanding of audit committee functions. Mr. Wilson is an independent Board member as that term is defined under the relevant Securities and Exchange Commission Rules and Releases.
The Statement of Additional Information (SAI) includes additional information about the board members and is available, without charge, upon request. Shareholders may call (800) DIAL BEN/342-5236 to request the SAI.
64 | Annual Report | franklintempleton.com | ||
FRANKLIN STRATEGIC SERIES
FRANKLIN STRATEGIC INCOME FUND
Board Approval of Investment Management Agreements
FRANKLIN STRATEGIC SERIES
Franklin Strategic Income Fund
(Fund)
At an in-person meeting held on April 18, 2017 (Meeting), the Board of Trustees (Board) of Franklin Strategic Series, including a majority of the trustees who are not “interested persons” as defined in the Investment Company Act of 1940 (Independent Trustees), reviewed and approved the continuance of the investment management agreement between Franklin Advisers, Inc. (Manager) and the Fund (Management Agreement) for an additional one-year period. The Independent Trustees received advice from and met separately with Independent Trustee counsel in considering whether to approve the continuation of the Management Agreement.
In considering the continuation of the Management Agreement, the Board reviewed and considered information provided by the Manager at the Meeting and throughout the year at meetings of the Board and its committees. The Board also reviewed and considered information provided in response to a detailed set of requests for information submitted to the Manager by Independent Trustee counsel on behalf of the Independent Trustees in connection with the annual contract renewal process. In addition, prior to the Meeting, the Independent Trustees held a telephonic contract renewal meeting at which the Independent Trustees conferred amongst themselves and Independent Trustee counsel about contract renewal matters. The Board reviewed and considered all of the factors it deemed relevant in approving the continuance of the Management Agreement, including, but not limited to: (i) the nature, extent, and quality of the services provided by the Manager; (ii) the investment performance of the Fund; (iii) the costs of the services provided and profits realized by the Manager and its affiliates from the relationship with the Fund; (iv) the extent to which economies of scale are realized as the Fund grows; and (v) whether fee levels reflect these economies of scale for the benefit of Fund investors.
In approving the continuance of the Management Agreement, the Board, including a majority of the Independent Trustees, determined that the existing management fees are fair and reasonable and that the continuance of such Management Agreement is in the interests of the Fund and its shareholders. While attention was given to all information furnished, the following discusses some primary factors relevant to the Board’s determination.
Nature, Extent and Quality of Services
The Board reviewed and considered information regarding the nature, extent and quality of investment management services provided by the Manager and its affiliates to the Fund and its shareholders. This information included, among other things, the qualifications, background and experience of the senior management and investment personnel of the Manager; the structure of investment personnel compensation; oversight of third-party service providers; investment performance reports and related financial information for the Fund; reports on expenses, shareholder services, marketing support payments made to financial intermediaries and third party servicing arrangements; legal and compliance matters; risk controls; pricing and other services provided by the Manager and its affiliates; and management fees charged by the Manager and its affiliates to U.S. funds and other accounts, including management’s explanation of differences among accounts where relevant. The Board noted management’s continual efforts and expenditures in establishing effective business continuity plans and developing strategies to address areas of heightened concern in the mutual fund industry, such as cybersecurity, derivatives and liquidity risk management.
The Board also reviewed and considered the benefits provided to Fund shareholders of investing in a fund that is part of the Franklin Templeton family of funds. The Board noted the financial position of Franklin Resources, Inc. (FRI), the Manager’s parent, and its commitment to the mutual fund business as evidenced by its continued introduction of new funds, reassessment of the fund offerings in response to the market environment and project initiatives and capital investments relating to the services provided to the Fund by the Franklin Templeton Investments (FTI) organization.
Following consideration of such information, the Board was satisfied with the nature, extent and quality of services provided by the Manager and its affiliates to the Fund and its shareholders.
Fund Performance
The Board reviewed and considered the performance results of the Fund over various time periods ended January 31, 2017. The Board considered the performance returns for the Fund in comparison to the performance returns of mutual funds deemed comparable to the Fund included in a universe (Performance Universe) selected by Broadridge Financial Solutions, Inc. (Broadridge), an independent provider of investment company data. The Board received a description of the methodology used by Broadridge to select the mutual funds included in a
franklintempleton.com | Annual Report | 65 | ||
FRANKLIN STRATEGIC SERIES
FRANKLIN STRATEGIC INCOME FUND
SHAREHOLDER INFORMATION
Performance Universe. The Board also reviewed and considered Fund performance reports provided and discussions that occurred with portfolio managers at Board meetings throughout the year. A summary of the Fund’s performance results is below.
The Performance Universe for the Fund included the Fund and all retail and institutional multi-sector income funds. The Board noted that the Fund’s annualized income return for the one-year period was below the median of its Performance Universe, but for the three-, five- and 10-year periods was above the median of its Performance Universe. The Board also noted that the Fund’s annualized total return for the for the one- and 10-year periods was above the median of its Performance Universe, but for the three- and five-year periods was below the median of its Performance Universe. Given the Fund’s income-oriented investment objective, the Board concluded that the Fund’s performance was acceptable. In doing so, the Board noted the Fund’s positive longer term relative performance.
Comparative Fees and Expenses
The Board reviewed and considered information regarding the Fund’s actual total expense ratio and its various components, including, as applicable, management fees; transfer agent expenses; underlying fund expenses; Rule 12b-1 and non-Rule 12b-1 service fees; and other non-management fees. The Board also noted that at its February meeting each year, it receives an annual report on all marketing support payments made by FTI to financial intermediaries. The Board considered the actual total expense ratio and, separately, the contractual management fee rate, without the effect of fee waivers, if any (Management Rate) of the Fund in comparison to the median ratio and median Management Rate, respectively, of other mutual funds deemed comparable to and with a similar expense structure as the Fund selected by Broadridge (Expense Group). Broadridge fee and expense data is based upon information taken from the fund’s most recent annual report, which reflects historical asset levels that may be quite different from those currently existing, particularly in a period of market volatility. While recognizing such inherent limitation and the fact that expense ratios and Management Rates generally increase as assets decline and decrease as assets grow, the Board believed the independent analysis conducted by Broadridge to be an appropriate measure of comparative fees and expenses. The Broadridge Management Rate includes administrative charges, and the actual total expense ratio, for comparative consistency, was shown for Class A shares for funds with multiple classes of shares. The Board received a description of the methodology
used by Broadridge to select the mutual funds included in an Expense Group.
The Expense Group for the Fund included the Fund and seven other multi-sector income funds. The Board noted that the Management Rate and actual total expense ratio for the Fund were below the medians of its Expense Group. The Board concluded that the Management Rate charged to the Fund is fair and reasonable.
Profitability
The Board reviewed and considered information regarding the profits realized by the Manager and its affiliates in connection with the operation of the Fund. In this respect, the Board considered the Fund profitability analysis provided by the Manager that addresses the overall profitability of FTI’s U.S. fund business, as well as its profits in providing investment management and other services to each of the individual funds during the 12-month period ended September 30, 2016, being the most recent fiscal year-end for FRI. The Board noted that although management continually makes refinements to its methodologies used in calculating profitability in response to organizational and product related changes, the overall methodology has remained consistent with that used in the Fund’s profitability report presentations from prior years. Additionally, the Fund’s independent registered public accounting firm has been engaged by the Manager to periodically review the reasonableness of the allocation methodologies to be used solely by the Fund’s Board with respect to the profitability analysis.
The Board noted management’s belief that costs incurred in establishing the infrastructure necessary for the type of mutual fund operations conducted by the Manager and its affiliates may not be fully reflected in the expenses allocated to the Fund in determining its profitability, as well as the fact that the level of profits, to a certain extent, reflected operational cost savings and efficiencies initiated by management. The Board also noted management’s expenditures in improving shareholder services provided to the Fund, as well as the need to implement systems and meet additional regulatory and compliance requirements resulting from recent SEC and other regulatory requirements.
The Board also considered the extent to which the Manager and its affiliates might derive ancillary benefits from fund operations, including revenues generated from transfer agent services, potential benefits resulting from personnel and systems enhancements necessitated by fund growth, as well as increased leverage with service providers and counterparties. Based upon its consideration of all these factors, the Board
66 | Annual Report | franklintempleton.com | ||
FRANKLIN STRATEGIC SERIES
FRANKLIN STRATEGIC INCOME FUND
SHAREHOLDER INFORMATION
concluded that the level of profits realized by the Manager and its affiliates from providing services to the Fund was not excessive in view of the nature, quality and extent of services provided to the Fund.
Economies of Scale
The Board reviewed and considered the extent to which the Manager may realize economies of scale, if any, as the Fund grows larger and whether the Fund’s management fee structure reflects any economies of scale for the benefit of shareholders. With respect to possible economies of scale, the Board noted the existence of management fee breakpoints, which operate generally to share any economies of scale with a Fund’s shareholders by reducing the Fund’s effective management fees as the Fund grows in size. The Board considered the Manager’s view that any analyses of potential economies of scale in managing a particular fund are inherently limited in light of the joint and common costs and investments the Manager incurs across the Franklin Templeton family of funds as a whole. The Board concluded that to the extent economies of scale may be realized by the Manager and its affiliates, the Fund’s management fee structure provided a sharing of benefits with the Fund and its shareholders as the Fund grows.
Conclusion
Based on its review, consideration and evaluation of all factors it believed relevant, including the above-described factors and conclusions, the Board unanimously approved the continuation of the Management Agreement for an additional one-year period.
Proxy Voting Policies and Procedures
The Fund’s investment manager has established Proxy Voting Policies and Procedures (Policies) that the Fund uses to determine how to vote proxies relating to portfolio securities. Shareholders may view the Fund’s complete Policies online at franklintempleton.com. Alternatively, shareholders may request copies of the Policies free of charge by calling the Proxy Group collect at (954) 527-7678 or by sending a written request to: Franklin Templeton Companies, LLC, 300 S.E. 2nd Street, Fort Lauderdale, FL 33301, Attention: Proxy Group. Copies of the Fund’s proxy voting records are also made available online at franklintempleton.com and posted on the U.S. Securities and Exchange Commission’s website at sec.gov and reflect the most recent 12-month period ended June 30.
Quarterly Statement of Investments
The Trust, on behalf of the Fund, files a complete statement of investments with the U.S. Securities and Exchange Commission for the first and third quarters for each fiscal year on Form N-Q. Shareholders may view the filed Form N-Q by visiting the Commission’s website at sec.gov. The filed form may also be viewed and copied at the Commission’s Public Reference Room in Washington, DC. Information regarding the operations of the Public Reference Room may be obtained by calling (800) SEC-0330.
Householding of Reports and Prospectuses
You will receive the Fund’s financial reports every six months as well as an annual updated summary prospectus (prospectus available upon request). To reduce Fund expenses, we try to identify related shareholders in a household and send only one copy of the financial reports and summary prospectus. This process, called “householding,” will continue indefinitely unless you instruct us otherwise. If you prefer not to have these documents householded, please call us at (800) 632-2301. At any time you may view current prospectuses/summary prospectuses and financial reports on our website. If you choose, you may receive these documents through electronic delivery.
franklintempleton.com | Annual Report | 67 | ||
This page intentionally left blank.
| Annual Report and Shareholder Letter | |
| Franklin Strategic Income Fund | ||
Investment Manager | ||
| Franklin Advisers, Inc. | ||
Distributor | ||
| Franklin Templeton Distributors, Inc. | ||
| (800) DIAL BEN® / 342-5236 | ||
| franklintempleton.com | ||
Shareholder Services | ||
| (800) 632-2301 |
Authorized for distribution only when accompanied or preceded by a summary prospectus and/or prospectus. Investors should carefully consider a fund’s investment goals, risks, charges and expenses before investing. A prospectus contains this and other information; please read it carefully before investing.
To help ensure we provide you with quality service, all calls to and from our service areas are monitored and/or recorded.
© 2017 Franklin Templeton Investments. All rights reserved. | 194 A 06/17 | |||||
Franklin Templeton Investments
Gain From Our Perspective®
At Franklin Templeton Investments, we’re dedicated to one goal: delivering exceptional asset management for our clients. By bringing together multiple, world-class investment teams in a single firm, we’re able to offer specialized expertise across styles and asset classes, all supported by the strength and resources of one of the world’s largest asset managers. This has helped us to become a trusted partner to individual and institutional investors across the globe.
Dear Shareholder:
During the 12 months ended April 30, 2017, the global economy expanded amid a stronger recovery in some developed markets and encouraging economic data in certain emerging markets. Improving growth expectations led to higher interest rates. In this environment, global government bonds, as measured by the Citigroup World Government Bond Index, recorded modest losses.
In all economic environments, we are committed to our long-term perspective and disciplined investment approach as we conduct a diligent, fundamental analysis of securities with a regular emphasis on investment risk management.
We believe active, professional investment management serves investors well. We also recognize the important role of financial advisors in today’s markets and encourage investors to continue to seek their advice. Amid changing markets and economic conditions, we are confident investors with a well-diversified portfolio and a patient, long-term outlook should be well positioned for the years ahead.
Franklin Global Government Bond Fund’s annual report includes more detail about prevailing conditions and a discussion about investment decisions during the period. Please remember all securities markets fluctuate, as do mutual fund share prices.
As previously communicated, on February 28, 2017, the Board of Trustees of Franklin Strategic Series, on behalf of Franklin
Global Government Bond Fund, approved a proposal to terminate and liquidate the Fund. The liquidation is anticipated to occur on or about June 16, 2017, but may be delayed if unforeseen circumstances arise.
Thank you for your trust and participation in Franklin Global Government Bond Fund. It has been our privilege to serve you.
Sincerely,

Edward B. Jamieson
President and Chief Executive Officer -
Investment Management
Franklin Strategic Series
This letter reflects our analysis and opinions as of April 30, 2017, unless otherwise indicated. The information is not a complete analysis of every aspect of any market, country, industry, security or fund. Statements of fact are from sources considered reliable.
| Not FDIC Insured | May Lose Value | No Bank Guarantee |
franklintempleton.com | Not part of the annual report | 1 | ||
| 3 | ||||
| 7 | ||||
| 10 | ||||
| 11 | ||||
| 18 | ||||
| 22 | ||||
| 33 |
| ||
| 34 | ||||
| 39 | ||||
Visit franklintempleton.com for fund updates, to access your account, or to find helpful financial planning tools.
2 | Annual Report | franklintempleton.com | ||
Franklin Global Government Bond Fund
This annual report for Franklin Global Government Bond Fund covers the fiscal year ended April 30, 2017. As previously communicated, on February 28, 2017, the Board of Trustees of Franklin Strategic Series, on behalf of Franklin Global Government Bond Fund, approved a proposal to terminate and liquidate the Fund. The liquidation is anticipated to occur on or about June 16, 2017, but may be delayed if unforeseen circumstances arise. Effective April 12, 2017, the Fund closed to all new investors.
Your Fund’s Goal and Main Investments
The Fund seeks total return, consisting of interest income and capital appreciation. Under normal market conditions, the Fund invests at least 80% of its net assets in “government bonds” of issuers located around the world. Government bonds include floating, variable and fixed-rate debt securities of any maturity, such as bonds, notes, bills and debentures, issued or guaranteed by governments, government agencies or instrumentalities, including government-sponsored entities, supra-national entities and public-private partnerships.
Portfolio Composition*
Based on Total Net Assets as of 4/30/17
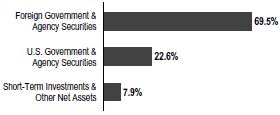
*Figures represent the net Fund exposure and include certain derivatives held in the portfolio (or their underlying reference assets) or unsettled trades and may not total 100% or may be negative due to rounding, use of any derivatives or other factors.
Performance Overview
For the 12 months under review, the Fund’s Class A shares had a -3.55% cumulative total return. In comparison, global government bonds, as measured by the Fund’s benchmark, the
Citigroup World Government Bond Index (WGBI), had a -3.61% cumulative total return for the same period.1 You can find more of the Fund’s performance data in the Performance Summary beginning on page 7.
Performance data represent past performance, which does not guarantee future results. Investment return and principal value will fluctuate, and you may have a gain or loss when you sell your shares. Current performance may differ from figures shown. For most recent month-end performance, go to franklintempleton.com or call (800) 342-5236.
Geographic Composition*
Based on Total Net Assets as of 4/30/17
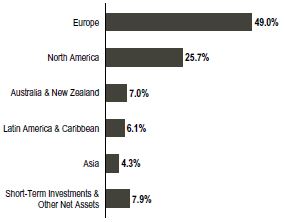
*Figures represent the net Fund exposure and include certain derivatives held in the portfolio (or their underlying reference assets) or unsettled trades and may not total 100% or may be negative due to rounding, use of any derivatives or other factors.
Economic and Market Overview
During the 12 months under review, global government bond performance weakened significantly, as measured by the Citigroup WGBI, with most of the losses sustained in late 2016. At the beginning of the period, data suggested the U.S. economy was picking up, and the U.S. Federal Reserve (Fed) signaled the strong possibility of an increase in interest rates.
1. Source: Morningstar.
The index is unmanaged and includes reinvestment of any income or distributions. It does not reflect any fees, expenses or sales charges. One cannot invest directly in an index, and an index is not representative of the Fund’s portfolio.
See www.franklintempletondatasources.com for additional data provider information.
The dollar value, number of shares or principal amount, and names of all portfolio holdings are listed in the Fund’s Statement of Investments (SOI). The SOI begins on page 16.
franklintempleton.com | Annual Report | 3 | ||
FRANKLIN GLOBAL GOVERNMENT BOND FUND
However, a far weaker-than-expected monthly U.S. payroll report quashed such speculation, and was swiftly followed by the unexpected outcome of a referendum in the U.K., in which voters opted to leave the European Union (also known as “Brexit”). In the aftermath of this result, demand for perceived safe-haven assets surged globally, driving the yields of many sovereign bonds down to historic lows. Over the following months, confidence among investors gradually returned, as it became apparent that the global economic and financial impact of the U.K. decision was more limited than originally feared, and therefore yields subsequently retraced much of their downward move.
Distributions*
5/1/16–4/30/17**
| Distributions per Share (cents) | ||||||||||||||||||||
Month |
| Class A
|
|
| Class C |
|
| Class R |
|
| Class R6 |
| | Advisor Class |
| |||||
May | 1.56 | 1.08 | 1.22 | 1.70 | 1.62 | |||||||||||||||
June | 0.24 | — | — | 0.30 | 0.28 | |||||||||||||||
July | 0.26 | 0.01 | 0.14 | 0.57 | 0.55 | |||||||||||||||
August | 0.26 | — | — | 0.33 | 0.31 | |||||||||||||||
September | 0.26 | — | — | 0.33 | 0.32 | |||||||||||||||
October | 0.09 | — | — | 0.34 | 0.32 | |||||||||||||||
November | 0.19 | — | — | 0.48 | 0.42 | |||||||||||||||
December | 0.21 | 0.06 | 0.13 | 0.49 | 0.47 | |||||||||||||||
Total | 3.07 | 1.15 | 1.49 | 4.54 | 4.29 | |||||||||||||||
*The distribution amount is the sum of all distributions to shareholders for the period shown and includes only net investment income. All Fund distributions will vary depending upon current market conditions, and past distributions are not indicative of future trends.
**No distributions for the months of January through April 2017.
This rise in global bond yields picked up speed over the rest of 2016, mainly due to Donald Trump’s victory in November’s U.S. presidential election, which caused investors to reassess their outlook on global inflation and interest rates. Indications about the incoming administration’s policies suggested a likely fiscal stimulus through infrastructure spending, as well as tax cuts to stimulate U.S. economic growth. Many market participants speculated that such developments would also require the Fed to review its previously dovish stance. With risk appetites surging in the aftermath of the election result, a steady flow of upbeat data from the U.S. economy persuaded the Fed to raise U.S. interest rates at its last meeting of 2016.
Nevertheless, the U.S. Treasury market predominantly remained confined to a tight trading range during the first four months of 2017. Benchmark yields did rise to their highest level of the year ahead of a widely anticipated decision to raise U.S. interest rates in March, but sentiment swiftly reversed after the Fed’s accompanying statement turned out to be more
dovish than expected. Treasury yields fell further following the retraction of President Trump’s health care reform legislation, which raised concerns that planned tax reforms might face similar problems.
Political uncertainty in Europe remained high for much of the review period, and the European Central Bank announced an extension of its monetary easing program at the end of 2016, pledging to maintain its bond purchases until at least the end of 2017. However, the outcome of the first round of the French presidential elections in April 2017, which allayed fears about a potential surge of support for populism among French voters and pointed to a likely eventual victory for the centrist candidate Emmanuel Macron, improved sentiment among investors, pushing up eurozone bond yields toward the end of the period.
Investment Strategy
We invest selectively in bonds around the world based upon our assessment of changing market, political and economic conditions. While seeking opportunities, we consider various factors including interest rates, currency exchange rates and credit risks. We use top-down macroeconomic research, bottom-up sector-specific research and quantitative analysis to identify and to seek to exploit market inefficiencies while employing a disciplined risk management process. We may use various currency-related derivative instruments, including currency forward and currency futures contracts, as well as various interest rate/bond-related derivative instruments, including interest rate/bond futures contracts and swap agreements.
What is a currency forward contract?
A currency forward contract is an agreement between the Fund and a counterparty to buy or sell a foreign currency in exchange for another currency at a specific exchange rate on a future date.
What is a futures contract?
A futures contract is an agreement between the Fund and a counterparty made through a U.S. or foreign futures exchange to buy or sell an underlying instrument or asset at a specific price on a future date.
Manager’s Discussion
During the 12 months ended April 30 2017, the Fund performed slightly better than its benchmark, the Citigroup WGBI. The Fund’s currency allocation was the most significant contributor to relative performance, although this
4 | Annual Report | franklintempleton.com | ||
FRANKLIN GLOBAL GOVERNMENT BOND FUND
What are swap agreements?
Swap agreements, such as interest-rate, currency and credit default swaps, are contracts between the Fund and another party (the swap counterparty). In a basic swap transaction, the Fund agrees with the swap counterparty to exchange the returns (or differentials in rates of return) earned or realized on a particular “notional amount” of underlying instruments. The notional amount is the set amount selected by the parties as the basis on which to calculate the obligations that they have agreed to exchange. The parties typically do not actually exchange the notional amount. Instead, they agree to exchange the returns that would be earned or realized if the notional amount were invested in given instruments or at given interest rates.
was partially offset by the negative impact of duration and yield-curve positioning.
What is duration?
Duration is a measure of a bond’s price sensitivity to interest-rate changes. In general, a portfolio of securities with a lower duration can be expected to be less sensitive to interest-rate changes than a portfolio with a higher duration.
What is the yield curve?
The yield curve is a line that plots the interest rates, at a set point in time, of bonds having equal credit quality but differing maturity dates. The most frequently reported yield curve compares three-month, two-year and 30-year U.S. Treasury debt.
The Fund’s currency positioning contributed to relative returns, mainly due to an overweighted allocation to a stronger U.S. dollar, which received a boost from speculation about potentially tighter U.S. monetary policy in the wake of Donald Trump’s victory in the U.S. presidential elections.
The Fund’s positions denominated in currencies other than the U.S. dollar, euro, Japanese yen and the British pound also enhanced relative results, helped by holdings in local-currency Polish bonds. The Fund’s exposure to emerging-market bonds further added to relative performance.
In contrast, the Fund’s duration and yield-curve positioning held back relative performance, hurt by underweighted duration positioning in Japanese and U.S. government bonds.
The Fund’s security selection among government bonds also weighed slightly on relative returns.
CFA® is a trademark owned by CFA Institute.
Currency Composition*
4/30/17
% of Total Net Assets | ||||
North America | 54.8 | % | ||
U.S. Dollar | 51.5 | % | ||
Canadian Dollar | 3.3 | % | ||
Europe | 30.8 | % | ||
Euro | 18.7 | % | ||
British Pound Sterling | 5.8 | % | ||
Polish Zloty | 3.6 | % | ||
Swedish Krona | 2.7 | % | ||
Asia | 9.3 | % | ||
Japanese Yen | 6.9 | % | ||
Malaysian Ringitt | 2.4 | % | ||
Latin America & Caribbean | 5.2 | % | ||
Mexican Peso | 5.2 | % | ||
Australia & New Zealand | -0.1 | % | ||
Australian Dollar | -0.1 | % | ||
*Figures represent the net Fund exposure and include certain derivatives held in the portfolio (or their underlying reference assets) or unsettled trades and may not total 100% or may be negative due to rounding, use of any derivatives or other factors.
Thank you for your participation in Franklin Global Government Bond Fund. It has been a pleasure serving your investment needs.
 |
John W. Beck | |
 |
David Zahn, CFA | |
| Portfolio Management Team | ||


franklintempleton.com | Annual Report | 5 | ||
FRANKLIN GLOBAL GOVERNMENT BOND FUND
The foregoing information reflects our analysis, opinions and portfolio holdings as of April 30, 2017, the end of the reporting period. The way we implement our main investment strategies and the resulting portfolio holdings may change depending on factors such as market and economic conditions. These opinions may not be relied upon as investment advice or an offer for a particular security. The information is not a complete analysis of every aspect of any market, country, industry, security or the Fund. Statements of fact are from sources considered reliable, but the investment manager makes no representation or warranty as to their completeness or accuracy. Although historical performance is no guarantee of future results, these insights may help you understand our investment management philosophy.
6 | Annual Report | franklintempleton.com | ||
FRANKLIN GLOBAL GOVERNMENT BOND FUND
Performance Summary as of April 30, 2017
The performance table and graphs do not reflect any taxes that a shareholder would pay on Fund dividends, capital gain distributions, if any, or any realized gains on the sale of Fund shares. Total return reflects reinvestment of the Fund’s dividends and capital gain distributions, if any, and any unrealized gains or losses. Your dividend income will vary depending on dividends or interest paid by securities in the Fund’s portfolio, adjusted for operating expenses of each class. Capital gain distributions are net profits realized from the sale of portfolio securities.
Performance as of 4/30/171
Cumulative total return excludes sales charges. Average annual total return include maximum sales charges. Sales charges will vary depending on the size of the investment and the class of share purchased. The maximum is 4.25% and the minimum is 0%. Class A: 4.25% maximum initial sales charge; Advisor Class: no sales charges. For other share classes, visit franklintempleton.com.
| Share Class | Cumulative Total Return2
| Average Annual Total Return3 | ||
A | ||||
1-Year | -3.55%
| -7.69%
| ||
3-Year | -4.58%
| -2.95%
| ||
Since Inception (9/6/13) | +0.96%
| -0.92%
| ||
Advisor | ||||
1-Year | -3.31%
| -3.31%
| ||
3-Year | -4.30%
| -1.46%
| ||
Since Inception (9/6/13) | +1.67%
| +0.45%
| ||
| Distribution | 30-Day Standardized Yield5 | |||||
| Share Class | Rate4 | (with waiver) | (without waiver) | |||
A | 0.26% | 1.09% | -0.35% | |||
Advisor | 0.61% | 1.28% | -0.22% | |||
Performance data represent past performance, which does not guarantee future results. Investment return and principal value will fluctuate, and you may have a gain or loss when you sell your shares. Current performance may differ from figures shown. For most recent month-end performance, go to franklintempleton.com or call (800) 342-5236.
See page 9 for Performance Summary footnotes.
franklintempleton.com | Annual Report | 7 | ||
FRANKLIN GLOBAL GOVERNMENT BOND FUND
PERFORMANCE SUMMARY
Total Return Index Comparison for a Hypothetical $10,000 Investment1
Total return represents the change in value of an investment over the periods shown. It includes any applicable maximum sales charge, Fund expenses, account fees and reinvested distributions. The unmanaged index includes reinvestment of any income or distributions. It differs from the Fund in composition and does not pay management fees or expenses. One cannot invest directly in an index.
Class A (9/6/13–4/30/17)
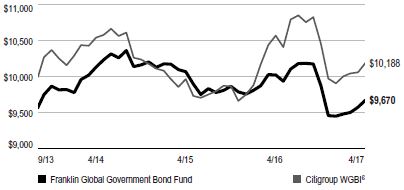
Advisor Class (9/6/13–4/30/17)
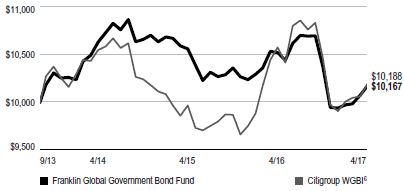
See page 9 for Performance Summary footnotes.
8 | Annual Report | franklintempleton.com | ||
FRANKLIN GLOBAL GOVERNMENT BOND FUND
PERFORMANCE SUMMARY
Distributions (5/1/16–4/30/17)
| Share Class | Net Investment Income | |||
A |
$ |
0.0307 |
| |
C | $ | 0.0115 | ||
R | $ | 0.0149 | ||
R6 | $ | 0.0454 | ||
Advisor | $ | 0.0429 | ||
Total Annual Operating Expenses7
| Share Class | With Waiver | Without Waiver | ||||||
A | 0.86% | 2.17% | ||||||
Advisor | 0.61% | 1.92% | ||||||
Each class of shares is available to certain eligible investors and has different annual fees and expenses, as described in the prospectus.
All investments involve risks, including possible loss of principal. Special risks are associated with investing in foreign securities, including risks associated with political and economic developments, trading practices, availability of information, limited markets and currency exchange rate fluctuations and policies. Sovereign debt securities are subject to various risks in addition to those relating to debt securities and foreign securities generally, including, but not limited to, the risk that a governmental entity may be unwilling or unable to pay interest and repay principal on its sovereign debt. Investments in emerging market countries are subject to all of the risks of foreign investing generally and have additional heightened risks due to a lack of established legal, political, business and social frameworks to support securities markets. Changes in interest rates will affect the value of the Fund’s portfolio and its share price and yield. Bond prices generally move in the opposite direction of interest rates. Thus, as prices of bonds in the Fund adjust to a rise in interest rates, the Fund’s share price may decline. Derivatives, including currency management strategies, involve costs and can create economic leverage in the portfolio that may result in significant volatility and cause the Fund to participate in losses (as well as gains) in an amount that exceeds the Fund’s initial investment. The Fund is actively managed but there is no guarantee that the manager’s investment decisions will produce the desired results. The Fund’s prospectus also includes a description of the main investment risks.
1. The Fund has an expense reduction and a fee waiver associated with any investments it makes in a Franklin Templeton money fund and/or other Franklin Templeton fund, contractually guaranteed through 8/31/17. Fund investment results reflect the expense reduction and fee waiver; without these reductions, the results would have been lower.
2. Cumulative total return represents the change in value of an investment over the periods indicated.
3. Average annual total return represents the average annual change in value of an investment over the periods indicated. Return for less than one year, if any, has not been annualized.
4. Distribution rate is based on an annualization of the respective class’s December dividend and the maximum offering price (NAV for Advisor Class) per share on 12/31/16.
5. The Fund’s 30-day standardized yield is calculated over a trailing 30-day period using the yield to maturity on bonds and/or the dividends accrued on stocks. It may not equal the Fund’s actual income distribution rate, which reflects the Fund’s past dividends paid to shareholders.
6. Source: Morningstar. The Citigroup WGBI is a market capitalization-weighted index consisting of investment-grade world government bond markets.
7. Figures are as stated in the Fund’s current prospectus and may differ from the expense ratios disclosed in the Your Fund’s Expenses and Financial Highlights sections in this report. In periods of market volatility, assets may decline significantly, causing total annual Fund operating expenses to become higher than the figures shown.
See www.franklintempletondatasources.com for additional data provider information.
See page 9 for Performance Summary footnotes.
franklintempleton.com | Annual Report | 9 | ||
FRANKLIN GLOBAL GOVERNMENT BOND FUND
As a Fund shareholder, you can incur two types of costs: (1) transaction costs, including sales charges (loads) on Fund purchases and redemptions; and (2) ongoing Fund costs, including management fees, distribution and service (12b-1) fees, and other Fund expenses. All mutual funds have ongoing costs, sometimes referred to as operating expenses. The table below shows ongoing costs of investing in the Fund and can help you understand these costs and compare them with those of other mutual funds. The table assumes a $1,000 investment held for the six months indicated.
Actual Fund Expenses
The table below provides information about actual account values and actual expenses in the columns under the heading “Actual.” In these columns the Fund’s actual return, which includes the effect of Fund expenses, is used to calculate the “Ending Account Value” for each class of shares. You can estimate the expenses you paid during the period by following these steps (of course, your account value and expenses will differ from those in this illustration): Divide your account value by $1,000 (if your account had an $8,600 value, then $8,600 ÷ $1,000 = 8.6). Then multiply the result by the number in the row for your class of shares under the headings “Actual” and “Expenses Paid During Period” (if Actual Expenses Paid During Period were $7.50, then 8.6 x $7.50 = $64.50). In this illustration, the actual expenses paid this period are $64.50.
Hypothetical Example for Comparison with Other Funds
Under the heading “Hypothetical” in the table, information is provided about hypothetical account values and hypothetical expenses based on the Fund’s actual expense ratio and an assumed rate of return of 5% per year before expenses, which is not the Fund’s actual return. This information may not be used to estimate the actual ending account balance or expenses you paid for the period, but it can help you compare ongoing costs of investing in the Fund with those of other funds. To do so, compare this 5% hypothetical example for the class of shares you hold with the 5% hypothetical examples that appear in the shareholder reports of other funds.
Please note that expenses shown in the table are meant to highlight ongoing costs and do not reflect any transactional costs. Therefore, information under the heading “Hypothetical” is useful in comparing ongoing costs only, and will not help you compare total costs of owning different funds. In addition, if transactional costs were included, your total costs would have been higher.
Actual (actual return after expenses) | Hypothetical (5% annual return before expenses) | |||||||||||||||||
Share Class | Beginning Account Value 11/1/16 | Ending Account Value 4/30/17 | Expenses Paid During Period 11/1/16–4/30/171,2 | Ending Account Value 4/30/17 | Expenses Paid During 11/1/16–4/30/171,2 | Net Annualized Ratio2 | ||||||||||||
A | $1,000 | $979.20 | $3.78 | $1,020.98 | $3.86 | 0.77% | ||||||||||||
C | $1,000 | $976.70 | $6.13 | $1,018.60 | $6.26 | 1.25% | ||||||||||||
R | $1,000 | $981.10 | $2.75 | $1,022.02 | $2.81 | 0.56% | ||||||||||||
R6 | $1,000 | $980.90 | $2.65 | $1,022.12 | $2.71 | 0.54% | ||||||||||||
Advisor | $1,000 | $980.80 | $2.95 | $1,021.82 | $3.01 | 0.60% | ||||||||||||
1. Expenses are equal to the annualized expense ratio for the six-month period as indicated above—in the far right column—multiplied by the simple average account value over the period indicated, and then multiplied by 181/365 to reflect the one-half year period.
2. Reflects expenses after fee waivers and expense reimbursements. Does not include acquired fund fees and expenses.
10 | Annual Report | franklintempleton.com | ||
FRANKLIN STRATEGIC SERIES
Franklin Global Government Bond Fund
| Year Ended April 30, | ||||||||||||||||
| 2017 | 2016 | 2015 | 2014a | |||||||||||||
Class A | ||||||||||||||||
Per share operating performance | ||||||||||||||||
(for a share outstanding throughout the year) | ||||||||||||||||
Net asset value, beginning of year | $ 9.59 | $ 9.81 | $10.45 | $10.00 | ||||||||||||
Income from investment operationsb: | ||||||||||||||||
Net investment incomec | 0.12 | 0.12 | 0.17 | 0.11 | ||||||||||||
Net realized and unrealized gains (losses) | (0.46 | ) | (0.17 | ) | (0.24 | ) | 0.47 | |||||||||
Total from investment operations | (0.34 | ) | (0.05 | ) | (0.07 | ) | 0.58 | |||||||||
Less distributions from: | ||||||||||||||||
Net investment income and net foreign currency gains | (0.03 | ) | (0.17 | ) | (0.40 | ) | (0.13 | ) | ||||||||
Net realized gains | — | — | (0.17 | ) | — | |||||||||||
Total distributions | (0.03 | ) | (0.17 | ) | (0.57 | ) | (0.13 | ) | ||||||||
Net asset value, end of year | $ 9.22 | $ 9.59 | $ 9.81 | $10.45 | ||||||||||||
Total returnd | (3.55)% | (0.44)% | (0.64)% | 5.81% | ||||||||||||
Ratios to average net assetse | ||||||||||||||||
Expenses before waiver and payments by affiliates | 2.11% | 1.98% | 2.37% | 3.22% | ||||||||||||
Expenses net of waiver and payments by affiliates | 0.77% | 0.67% | 0.64% | 0.57% | ||||||||||||
Net investment income | 1.29% | 1.23% | 1.63% | 1.62% | ||||||||||||
Supplemental data | ||||||||||||||||
Net assets, end of year (000’s) | $ 10,905 | $13,356 | $11,487 | $11,232 | ||||||||||||
Portfolio turnover rate | 40.33% | 37.97% | 60.28% | 13.24% | ||||||||||||
aFor the period September 6, 2013 (commencement of operations) to April 30, 2014.
bThe amount shown for a share outstanding throughout the period may not correlate with the Statement of Operations for the period due to the timing of sales and repurchases of the Fund’s shares in relation to income earned and/or fluctuating fair value of the investments of the Fund.
cBased on average daily shares outstanding.
dTotal return does not reflect sales commissions or contingent deferred sales charges, if applicable, and is not annualized for periods less than one year.
eRatios are annualized for periods less than one year.
franklintempleton.com | The accompanying notes are an integral part of these financial statements. | Annual Report | 11 | ||||
FRANKLIN STRATEGIC SERIES
FINANCIAL HIGHLIGHTS
Franklin Global Government Bond Fund (continued)
| Year Ended April 30, | ||||||||||||||||
| 2017 | 2016 | 2015 | 2014a | |||||||||||||
Class C | ||||||||||||||||
Per share operating performance | ||||||||||||||||
(for a share outstanding throughout the year) | ||||||||||||||||
Net asset value, beginning of year | $ 9.57 | $ 9.79 | $10.44 | $10.00 | ||||||||||||
Income from investment operationsb: | ||||||||||||||||
Net investment incomec | 0.08 | 0.06 | 0.10 | 0.08 | ||||||||||||
Net realized and unrealized gains (losses) | (0.46 | ) | (0.16 | ) | (0.24 | ) | 0.46 | |||||||||
Total from investment operations | (0.38 | ) | (0.10 | ) | (0.14 | ) | 0.54 | |||||||||
Less distributions from: | ||||||||||||||||
Net investment income and net foreign currency gains | (0.01 | ) | (0.12 | ) | (0.34 | ) | (0.10 | ) | ||||||||
Net realized gains | — | — | (0.17 | ) | — | |||||||||||
Total distributions | (0.01 | ) | (0.12 | ) | (0.51 | ) | (0.10 | ) | ||||||||
Net asset value, end of year | $ 9.18 | $ 9.57 | $ 9.79 | $10.44 | ||||||||||||
Total returnd | (3.96)% | (1.03)% | (1.34)% | 5.46% | ||||||||||||
Ratios to average net assetse | ||||||||||||||||
Expenses before waiver and payments by affiliates | 2.59% | 2.56% | 2.95% | 3.81% | ||||||||||||
Expenses net of waiver and payments by affiliates | 1.25% | 1.25% | 1.22% | 1.16% | ||||||||||||
Net investment income | 0.81% | 0.65% | 1.05% | 1.03% | ||||||||||||
Supplemental data | ||||||||||||||||
Net assets, end of year (000’s) | $275 | $509 | $292 | $156 | ||||||||||||
Portfolio turnover rate | 40.33% | 37.97% | 60.28% | 13.24% | ||||||||||||
aFor the period September 6, 2013 (commencement of operations) to April 30, 2014.
bThe amount shown for a share outstanding throughout the period may not correlate with the Statement of Operations for the period due to the timing of sales and repurchases of the Fund’s shares in relation to income earned and/or fluctuating fair value of the investments of the Fund.
cBased on average daily shares outstanding.
dTotal return does not reflect sales commissions or contingent deferred sales charges, if applicable, and is not annualized for periods less than one year.
eRatios are annualized for periods less than one year.
12 | Annual Report | The accompanying notes are an integral part of these financial statements. | franklintempleton.com | ||
FRANKLIN STRATEGIC SERIES
FINANCIAL HIGHLIGHTS
Franklin Global Government Bond Fund (continued)
| Year Ended April 30, | ||||||||||||||||
| 2017 | 2016 | 2015 | 2014a | |||||||||||||
Class R | ||||||||||||||||
Per share operating performance | ||||||||||||||||
(for a share outstanding throughout the year) | ||||||||||||||||
Net asset value, beginning of year | $ 9.58 | $ 9.80 | $10.44 | $10.00 | ||||||||||||
Income from investment operationsb: | ||||||||||||||||
Net investment incomec | 0.15 | 0.08 | 0.12 | 0.08 | ||||||||||||
Net realized and unrealized gains (losses) | (0.47 | ) | (0.16 | ) | (0.23 | ) | 0.47 | |||||||||
Total from investment operations | (0.32 | ) | (0.08 | ) | (0.11 | ) | 0.55 | |||||||||
Less distributions from: | ||||||||||||||||
Net investment income and net foreign currency gains | (0.01 | ) | (0.14 | ) | (0.36 | ) | (0.11 | ) | ||||||||
Net realized gains | — | — | (0.17 | ) | — | |||||||||||
Total distributions | (0.01 | ) | (0.14 | ) | (0.53 | ) | (0.11 | ) | ||||||||
Net asset value, end of year | $ 9.25 | $ 9.58 | $ 9.80 | $10.44 | ||||||||||||
Total returnd | (3.19)% | (0.90)% | (1.07)% | 5.52% | ||||||||||||
Ratios to average net assetse | ||||||||||||||||
Expenses before waiver and payments by affiliates | 1.94% | 2.39% | 2.82% | 3.66% | ||||||||||||
Expenses net of waiver and payments by affiliates | 0.60% | 1.08% | 1.09% | 1.01% | ||||||||||||
Net investment income | 1.46% | 0.82% | 1.18% | 1.18% | ||||||||||||
Supplemental data | ||||||||||||||||
Net assets, end of year (000’s) | $9 | $10 | $10 | $10 | ||||||||||||
Portfolio turnover rate | 40.33% | 37.97% | 60.28% | 13.24% | ||||||||||||
aFor the period September 6, 2013 (commencement of operations) to April 30, 2014.
bThe amount shown for a share outstanding throughout the period may not correlate with the Statement of Operations for the period due to the timing of sales and repurchases of the Fund’s shares in relation to income earned and/or fluctuating fair value of the investments of the Fund.
cBased on average daily shares outstanding.
dTotal return is not annualized for periods less than one year.
eRatios are annualized for periods less than one year.
franklintempleton.com | The accompanying notes are an integral part of these financial statements. | Annual Report | 13 | ||
FRANKLIN STRATEGIC SERIES
FINANCIAL HIGHLIGHTS
Franklin Global Government Bond Fund (continued)
| Year Ended April 30, | ||||||||||||||||
| 2017 | 2016 | 2015 | 2014a | |||||||||||||
Class R6 | ||||||||||||||||
Per share operating performance | ||||||||||||||||
(for a share outstanding throughout the year) | ||||||||||||||||
Net asset value, beginning of year | $ 9.59 | $ 9.81 | $10.45 | $10.00 | ||||||||||||
Income from investment operationsb: | ||||||||||||||||
Net investment incomec | 0.14 | 0.13 | 0.18 | 0.11 | ||||||||||||
Net realized and unrealized gains (losses) | (0.45 | ) | (0.17 | ) | (0.24 | ) | 0.48 | |||||||||
Total from investment operations | (0.31 | ) | (0.04 | ) | (0.06 | ) | 0.59 | |||||||||
Less distributions from: | ||||||||||||||||
Net investment income and net foreign currency gains | (0.05 | ) | (0.18 | ) | (0.41 | ) | (0.14 | ) | ||||||||
Net realized gains | — | — | (0.17 | ) | — | |||||||||||
Total distributions | (0.05 | ) | (0.18 | ) | (0.58 | ) | (0.14 | ) | ||||||||
Net asset value, end of year | $ 9.23 | $ 9.59 | $ 9.81 | $10.45 | ||||||||||||
Total returnd | (3.29)% | (0.38)% | (0.62)% | 5.91% | ||||||||||||
Ratios to average net assetse | ||||||||||||||||
Expenses before waiver and payments by affiliates | 2.60% | 2.82% | 3.04% | 3.78% | ||||||||||||
Expenses net of waiver and payments by affiliates | 0.52% | 0.59% | 0.57% | 0.51% | ||||||||||||
Net investment income | 1.54% | 1.31% | 1.70% | 1.68% | ||||||||||||
Supplemental data | ||||||||||||||||
Net assets, end of year (000’s) | $9 | $10 | $10 | $10 | ||||||||||||
Portfolio turnover rate | 40.33% | 37.97% | 60.28% | 13.24% | ||||||||||||
aFor the period September 6, 2013 (commencement of operations) to April 30, 2014.
bThe amount shown for a share outstanding throughout the period may not correlate with the Statement of Operations for the period due to the timing of sales and repurchases of the Fund’s shares in relation to income earned and/or fluctuating fair value of the investments of the Fund.
cBased on average daily shares outstanding.
dTotal return is not annualized for periods less than one year.
eRatios are annualized for periods less than one year.
14 | Annual Report | The accompanying notes are an integral part of these financial statements. | franklintempleton.com | ||
FRANKLIN STRATEGIC SERIES
FINANCIAL HIGHLIGHTS
Franklin Global Government Bond Fund (continued)
| Year Ended April 30, | ||||||||||||||||
| 2017 | 2016 | 2015 | 2014a | |||||||||||||
Advisor Class | ||||||||||||||||
Per share operating performance | ||||||||||||||||
(for a share outstanding throughout the year) | ||||||||||||||||
Net asset value, beginning of year | $ 9.61 | $ 9.83 | $10.49 | $10.00 | ||||||||||||
Income from investment operationsb: | ||||||||||||||||
Net investment incomec | 0.14 | 0.12 | 0.17 | 0.10 | ||||||||||||
Net realized and unrealized gains (losses) | (0.46 | ) | (0.16 | ) | (0.24 | ) | 0.52 | |||||||||
Total from investment operations | (0.32 | ) | (0.04 | ) | (0.07 | ) | 0.62 | |||||||||
Less distributions from: | ||||||||||||||||
Net investment income and net foreign currency gains | (0.04 | ) | (0.18 | ) | (0.42 | ) | (0.13 | ) | ||||||||
Net realized gains | — | — | (0.17 | ) | — | |||||||||||
Total distributions | (0.04 | ) | (0.18 | ) | (0.59 | ) | (0.13 | ) | ||||||||
Net asset value, end of year | $ 9.25 | $ 9.61 | $ 9.83 | $10.49 | ||||||||||||
Total returnd | (3.31)% | (0.38)% | (0.65)% | 6.24% | ||||||||||||
Ratios to average net assetse | ||||||||||||||||
Expenses before waiver and payments by affiliates | 1.94% | 1.91% | 2.30% | 3.16% | ||||||||||||
Expenses net of waiver and payments by affiliates | 0.60% | 0.60% | 0.57% | 0.51% | ||||||||||||
Net investment income | 1.46% | 1.30% | 1.70% | 1.68% | ||||||||||||
Supplemental data | ||||||||||||||||
Net assets, end of year (000’s) | $275 | $10 | $10 | $10 | ||||||||||||
Portfolio turnover rate | 40.33% | 37.97% | 60.28% | 13.24% | ||||||||||||
aFor the period September 6, 2013 (commencement of operations) to April 30, 2014.
bThe amount shown for a share outstanding throughout the period may not correlate with the Statement of Operations for the period due to the timing of sales and repurchases of the Fund’s shares in relation to income earned and/or fluctuating fair value of the investments of the Fund.
cBased on average daily shares outstanding.
dTotal return is not annualized for periods less than one year.
eRatios are annualized for periods less than one year.
franklintempleton.com | The accompanying notes are an integral part of these financial statements. | Annual Report | 15 | ||
FRANKLIN STRATEGIC SERIES
Statement of Investments, April 30, 2017
Franklin Global Government Bond Fund
| Country | Principal Amount* | Value | ||||||||||||||
Foreign Government and Agency Securities 69.5% | ||||||||||||||||
Government of Canada, 2.75%, 6/01/22 | Canada | 450,000 | CAD | $ | 357,531 | |||||||||||
Government of Chile, 3.875%, 8/05/20 | Chile | 100,000 | 105,745 | |||||||||||||
a Government of Finland, senior bond, Reg S, 2.00%, 4/15/24 | Finland | 350,000 | EUR | 431,590 | ||||||||||||
a Government of France, Reg S, 1.00%, 5/25/19 | France | 160,000 | EUR | 179,898 | ||||||||||||
a Government of Indonesia, Reg S, 4.875%, 5/05/21 | Indonesia | 200,000 | 214,979 | |||||||||||||
a Government of Lithuania, senior note, Reg S, 6.625%, 2/01/22 | Lithuania | 200,000 | 235,455 | |||||||||||||
Government of Malaysia, | ||||||||||||||||
senior bond, 4.24%, 2/07/18 | Malaysia | 650,000 | MYR | 150,966 | ||||||||||||
senior note, 3.654%, 10/31/19 | Malaysia | 550,000 | MYR | 127,771 | ||||||||||||
Government of Mexico, | ||||||||||||||||
7.75%, 12/14/17 | Mexico | 30,000 | b | MXN | 160,450 | |||||||||||
8.00%, 12/07/23 | Mexico | 30,000 | b | MXN | 166,934 | |||||||||||
Government of Peru, senior bond, 6.55%, 3/14/37 | Peru | 200,000 | 263,561 | |||||||||||||
Government of Poland, | ||||||||||||||||
3.25%, 7/25/19 | Poland | 1,400,000 | PLN | 369,971 | ||||||||||||
4.00%, 10/25/23 | Poland | 1,150,000 | PLN | 313,044 | ||||||||||||
2.50%, 7/25/26 | Poland | 2,000,000 | PLN | 482,897 | ||||||||||||
a Government of Spain, | ||||||||||||||||
senior bond, Reg S, 4.40%, 10/31/23 | Spain | 180,000 | EUR | 240,084 | ||||||||||||
senior bond, Reg S, 2.15%, 10/31/25 | Spain | 350,000 | EUR | 403,751 | ||||||||||||
senior bond, Reg S, 5.15%, 10/31/28 | Spain | 200,000 | EUR | 292,766 | ||||||||||||
Italy Treasury Bond, | ||||||||||||||||
aReg S, 3.50%, 3/01/30 | Italy | 700,000 | EUR | 843,988 | ||||||||||||
senior bond, 4.25%, 9/01/19 | Italy | 160,000 | EUR | 190,653 | ||||||||||||
senior bond, 5.50%, 9/01/22 | Italy | 450,000 | EUR | 600,984 | ||||||||||||
senior bond, 1.25%, 12/01/26 | Italy | 375,000 | EUR | 378,263 | ||||||||||||
a Queensland Treasury Corp., senior bond, Reg S, 5.75%, 7/22/24 | Australia | 600,000 | AUD | 537,530 | ||||||||||||
senior note, Reg S, 6.00%, 7/21/22 | Australia | 300,000 | AUD | 263,964 | ||||||||||||
a United Kingdom Treasury Bond, Reg S, 4.25%, 6/07/32 | United Kingdom | 230,000 | GBP | 410,008 | ||||||||||||
a United Kingdom Treasury Note, Reg S, 1.25%, 7/22/18 | United Kingdom | 190,000 | GBP | 249,747 | ||||||||||||
|
| |||||||||||||||
Total Foreign Government and Agency Securities | ||||||||||||||||
(Cost $8,476,810) | 7,972,530 | |||||||||||||||
|
| |||||||||||||||
U.S. Government and Agency Securities 22.6% | ||||||||||||||||
U.S. Treasury Bond, | ||||||||||||||||
4.375%, 11/15/39 | United States | 140,000 | 176,036 | |||||||||||||
2.50%, 2/15/45 | United States | 140,000 | 127,575 | |||||||||||||
cIndex Linked, 3.375%, 4/15/32 | United States | 164,672 | 232,901 | |||||||||||||
U.S. Treasury Note, | ||||||||||||||||
1.875%, 8/31/17 | United States | 700,000 | 702,211 | |||||||||||||
1.25%, 11/15/18 | United States | 300,000 | 300,146 | |||||||||||||
2.625%, 11/15/20 | United States | 850,000 | 880,182 | |||||||||||||
cIndex Linked, 1.25%, 7/15/20 | United States | 167,534 | 176,647 | |||||||||||||
|
| |||||||||||||||
Total U.S. Government and Agency Securities | ||||||||||||||||
(Cost $2,562,306) | 2,595,698 | |||||||||||||||
|
| |||||||||||||||
Total Investments before Short Term Investments | ||||||||||||||||
(Cost $11,039,116) | 10,568,228 | |||||||||||||||
|
| |||||||||||||||
16 | Annual Report | franklintempleton.com | ||
FRANKLIN STRATEGIC SERIES
STATEMENT OF INVESTMENTS
Franklin Global Government Bond Fund (continued)
| Country | Shares | Value | ||||||||||
Short Term Investments (Cost $610,946) 5.3% | ||||||||||||
Money Market Funds 5.3% | ||||||||||||
d,e Institutional Fiduciary Trust Money Market Portfolio, 0.37% | United States | 610,946 | $ 610,946 | |||||||||
|
| |||||||||||
Total Investments (Cost $11,650,062) 97.4% |
|
11,179,174 |
| |||||||||
Other Assets, less Liabilities 2.6% | 293,529 | |||||||||||
|
| |||||||||||
Net Assets 100.0% |
|
$11,472,703 |
| |||||||||
|
| |||||||||||
*The principal amount is stated in U.S. dollars unless otherwise indicated.
aSecurity was purchased pursuant to Regulation S under the Securities Act of 1933, which exempts from registration securities offered and sold outside of the United States. Such a security cannot be sold in the United States without either an effective registration statement filed pursuant to the Securities Act of 1933, or pursuant to an exemption from registration. These securities have been deemed liquid under guidelines approved by the Trust’s Board of Trustees. At April 30, 2017, the aggregate value of these securities was $4,303,760, representing 37.5% of net assets.
bPrincipal amount is stated in 100 Mexican Peso Units.
cPrincipal amount of security is adjusted for inflation. See Note 1(e).
dSee Note 3(f) regarding investments in affiliated management investment companies.
eThe rate shown is the annualized seven-day yield at period end.
At April 30, 2017, the Fund had the following forward exchange contracts outstanding. See Note 1(c).
Forward Exchange Contracts
Currency | Counterpartya | Type
| Quantity | Contract Amount* | Settlement Date | Unrealized Appreciation
| Unrealized Depreciation | |||||||||||||||||||||||||
OTC Forward Exchange Contracts | ||||||||||||||||||||||||||||||||
Australian Dollar | BZWS | Sell | 1,100,000 | 827,813 | 6/13/17 | $ 4,879 | $ — | |||||||||||||||||||||||||
Euro | CITI | Sell | 1,010,000 | 1,070,721 | 6/13/17 | — | (32,117 | ) | ||||||||||||||||||||||||
Japanese Yen | CITI | Buy | 88,000,000 | 770,897 | 6/13/17 | 20,272 | — | |||||||||||||||||||||||||
Malaysian Ringgit | BZWS | Sell | 900,000 | 200,245 | 6/13/17 | — | (7,253 | ) | ||||||||||||||||||||||||
Mexican Peso | RBCCM | Buy | 5,000,000 | 251,442 | 6/13/17 | 12,021 | — | |||||||||||||||||||||||||
Polish Zloty | BZWS | Sell | 2,900,000 | 709,376 | 6/13/17 | — | (37,821 | ) | ||||||||||||||||||||||||
Singapore Dollar | CITI | Buy | 350,000 | 251,374 | 6/13/17 | — | (730 | ) | ||||||||||||||||||||||||
Singapore Dollar | CITI | Sell | 350,000 | 246,967 | 6/13/17 | — | (3,677 | ) | ||||||||||||||||||||||||
Swedish Krona | BZWS | Buy | 2,750,000 | 288,793 | EUR | 6/13/17 | — | (4,097 | ) | |||||||||||||||||||||||
|
| |||||||||||||||||||||||||||||||
Total Forward Exchange Contracts | $ 37,172 | $ (85,695 | ) | |||||||||||||||||||||||||||||
|
| |||||||||||||||||||||||||||||||
Net unrealized appreciation (depreciation) |
| $ (48,523 | ) | |||||||||||||||||||||||||||||
|
| |||||||||||||||||||||||||||||||
*In U.S. dollars unless otherwise indicated.
aMay be comprised of multiple contracts with the same counterparty, currency and settlement date.
See Abbreviations on page 32.
franklintempleton.com | The accompanying notes are an integral part of these financial statements. | Annual Report | 17 | ||
FRANKLIN STRATEGIC SERIES
Statement of Assets and Liabilities
April 30, 2017
Franklin Global Government Bond Fund
Assets: | ||||
Investments in securities: | ||||
Cost - Unaffiliated issuers | $ | 11,039,116 | ||
Cost - Non-controlled affiliates (Note 3f) | 610,946 | |||
Total cost of investments |
$ |
11,650,062 |
| |
Value - Unaffiliated issuers | $ | 10,568,228 | ||
Value - Non-controlled affiliates (Note 3f) | 610,946 | |||
Total value of investments |
|
11,179,174 |
| |
Cash | 7,832 | |||
Foreign currency, at value (cost $239,111) | 239,375 | |||
Receivables: | ||||
Capital shares sold | 13 | |||
Interest | 115,207 | |||
Affiliates | 89,736 | |||
Unrealized appreciation on OTC forward exchange contracts | 37,172 | |||
Other assets. | 10 | |||
Total assets | 11,668,519 | |||
Liabilities: | ||||
Payables: | ||||
Capital shares redeemed | 56,079 | |||
Distribution fees | 826 | |||
Transfer agent fees | 1,305 | |||
Professional fees. | 44,548 | |||
Unrealized depreciation on OTC forward exchange contracts | 85,695 | |||
Accrued expenses and other liabilities | 7,363 | |||
Total liabilities |
|
195,816 |
| |
Net assets, at value. |
$ |
11,472,703 |
| |
Net assets consist of: | ||||
Paid-in capital. | $ | 12,531,688 | ||
Distributions in excess of net investment income. | (356,302 | ) | ||
Net unrealized appreciation (depreciation) | (517,375 | ) | ||
Accumulated net realized gain (loss) | (185,308 | ) | ||
Net assets, at value. |
$ |
11,472,703 |
| |
18 | Annual Report | The accompanying notes are an integral part of these financial statements. | franklintempleton.com | ||
FRANKLIN STRATEGIC SERIES
FINANCIAL STATEMENTS
Statement of Assets and Liabilities (continued)
April 30, 2017
Franklin Global Government Bond Fund
Class A: | ||||
Net assets, at value | $ | 10,904,500 | ||
|
| |||
Shares outstanding | 1,182,448 | |||
|
| |||
Net asset value per sharea | $ | 9.22 | ||
|
| |||
Maximum offering price per share (net asset value per share ÷ 95.75%) | $ | 9.63 | ||
|
| |||
Class C: | ||||
Net assets, at value | $ | 274,954 | ||
|
| |||
Shares outstanding | 29,954 | |||
|
| |||
Net asset value and maximum offering price per sharea | $9.18 | |||
|
| |||
Class R: | ||||
Net assets, at value | $ | 9,251 | ||
|
| |||
Shares outstanding | 1,000 | |||
|
| |||
Net asset value and maximum offering price per share | $9.25 | |||
|
| |||
Class R6: | ||||
Net assets, at value | $ | 9,228 | ||
|
| |||
Shares outstanding | 1,000 | |||
|
| |||
Net asset value and maximum offering price per share | $9.23 | |||
|
| |||
Advisor Class: | ||||
Net assets, at value | $ | 274,770 | ||
|
| |||
Shares outstanding | 29,697 | |||
|
| |||
Net asset value and maximum offering price per share | $9.25 | |||
|
|
aRedemption price is equal to net asset value less contingent deferred sales charges, if applicable.
franklintempleton.com | The accompanying notes are an integral part of these financial statements. | Annual Report | 19 | ||
FRANKLIN STRATEGIC SERIES
FINANCIAL STATEMENTS
Statement of Operations
for the year ended April 30, 2017
Franklin Global Government Bond Fund
Investment income: | ||||
Dividends from non-controlled affliates (Note 3f) | $ | 687 | ||
Interest | 268,693 | |||
|
| |||
Total investment income |
|
269,380 |
| |
|
| |||
Expenses: | ||||
Management fees (Note 3a) | 85,036 | |||
Distribution fees: (Note 3c) | ||||
Class A | 20,985 | |||
Class C | 2,504 | |||
Transfer agent fees: (Note 3e) | ||||
Class A | 11,385 | |||
Class C | 354 | |||
Class R | 9 | |||
Class R6 | 70 | |||
Advisor Class | 233 | |||
Custodian fees (Note 4) | 2,066 | |||
Reports to shareholders | 13,986 | |||
Registration and filing fees | 72,361 | |||
Professional fees | 57,686 | |||
Other | 10,195 | |||
|
| |||
Total expenses |
|
276,870 |
| |
Expenses waived/paid by affiliates (Note 3g) | (174,772 | ) | ||
|
| |||
Net expenses |
|
102,098 |
| |
|
| |||
Net investment income |
|
167,282 |
| |
|
| |||
Realized and unrealized gains (losses): | ||||
Net realized gain (loss) from: | ||||
Investments | (247,864 | ) | ||
Foreign currency transactions | (124,193 | ) | ||
|
| |||
Net realized gain (loss) |
|
(372,057 |
) | |
|
| |||
Net change in unrealized appreciation (depreciation) on: | ||||
Investments | (427,236 | ) | ||
Translation of other assets and liabilities denominated in foreign currencies | 122,621 | |||
|
| |||
Net change in unrealized appreciation (depreciation) |
|
(304,615 |
) | |
|
| |||
Net realized and unrealized gain (loss) |
|
(676,672 |
) | |
|
| |||
Net increase (decrease) in net assets resulting from operations |
$ |
(509,390 |
) | |
|
|
20 | Annual Report | The accompanying notes are an integral part of these financial statements. | franklintempleton.com | ||
FRANKLIN STRATEGIC SERIES
FINANCIAL STATEMENTS
Statements of Changes in Net Assets
Franklin Global Government Bond Fund
| Year Ended April 30, | ||||||||
| 2017 | 2016 | |||||||
Increase (decrease) in net assets: | ||||||||
Operations: | ||||||||
Net investment income | $ | 167,282 | $ | 146,029 | ||||
Net realized gain (loss) | (372,057 | ) | (259,529) | |||||
Net change in unrealized appreciation (depreciation) | (304,615 | ) | 94,403 | |||||
Net increase (decrease) in net assets resulting from operations |
|
(509,390 |
) | (19,097) | ||||
Distributions to shareholders from: | ||||||||
Net investment income: | ||||||||
Class A | (42,454 | ) | (207,807) | |||||
Class C | (599 | ) | (4,106) | |||||
Class R | (15 | ) | (139) | |||||
Class R6 | (45 | ) | (179) | |||||
Advisor Class | (566 | ) | (196) | |||||
Total distributions to shareholders |
|
(43,679 |
) | (212,427) | ||||
Capital share transactions: (Note 2) | ||||||||
Class A | (1,928,442 | ) | 2,094,584 | |||||
Class C | (217,799 | ) | 222,515 | |||||
Advisor Class | 278,096 | 25 | ||||||
Total capital share transactions |
|
(1,868,145 |
) | 2,317,124 | ||||
Net increase (decrease) in net assets | (2,421,214 | ) | 2,085,600 | |||||
Net assets: | ||||||||
Beginning of year. | 13,893,917 | 11,808,317 | ||||||
End of year |
$ |
11,472,703 |
| $ | 13,893,917 | |||
Distributions in excess of net investment income included in net assets: | ||||||||
End of year | $ | (356,302 | ) | $ | (193,628) | |||
franklintempleton.com | The accompanying notes are an integral part of these financial statements. | | Annual Report | 21 | |||
FRANKLIN STRATEGIC SERIES
Franklin Global Government Bond Fund
1. Organization and Significant Accounting Policies
Franklin Strategic Series (Trust) is registered under the Investment Company Act of 1940 (1940 Act) as an open-end management investment company, consisting of nine separate funds and applies the specialized accounting and reporting guidance in U.S. Generally Accepted Accounting Principles (U.S. GAAP). Franklin Global Government Bond Fund (Fund) is included in this report. The financial statements of the remaining funds in the Trust are presented separately. The Fund offers five classes of shares: Class A, Class C, Class R, Class R6, and Advisor Class. Each class of shares may differ by its initial sales load, contingent deferred sales charges, voting rights on matters affecting a single class, its exchange privilege and fees primarily due to differing arrangements for distribution and transfer agent fees.
The Fund was closed to new investors with limited exceptions effective at the close of market April 12, 2017.
The following summarizes the Fund’s significant accounting policies.
a. Financial Instrument Valuation
The Fund’s investments in financial instruments are carried at fair value daily. Fair value is the price that would be received to sell an asset or paid to transfer a liability in an orderly transaction between market participants on the measurement date. The Fund calculates the net asset value (NAV) per share as of 4 p.m. Eastern time each day the New York Stock Exchange (NYSE) is open for trading. Under compliance policies and procedures approved by the Trust’s Board of Trustees (the Board), the Fund’s administrator has responsibility for oversight of valuation, including leading the cross-functional Valuation Committee (VC). The VC provides administration and oversight of the Fund’s valuation policies and procedures, which are approved annually by the Board. Among other things, these procedures allow the Fund to utilize independent pricing services, quotations from securities and financial instrument dealers, and other market sources to determine fair value.
Debt securities generally trade in the over-the-counter (OTC) market rather than on a securities exchange. The Fund’s pricing services use multiple valuation techniques to determine fair value. In instances where sufficient market activity exists, the pricing services may utilize a market-based approach through
which quotes from market makers are used to determine fair value. In instances where sufficient market activity may not exist or is limited, the pricing services also utilize proprietary valuation models which may consider market characteristics such as benchmark yield curves, credit spreads, estimated default rates, anticipated market interest rate volatility, coupon rates, anticipated timing of principal repayments, underlying collateral, and other unique security features in order to estimate the relevant cash flows, which are then discounted to calculate the fair value. Securities denominated in a foreign currency are converted into their U.S. dollar equivalent at the foreign exchange rate in effect at 4 p.m. Eastern time on the date that the values of the foreign debt securities are determined.
Investments in open-end mutual funds are valued at the closing NAV.
Certain derivative financial instruments trade in the OTC market. The Fund’s pricing services use various techniques including industry standard option pricing models and proprietary discounted cash flow models to determine the fair value of those instruments. The Fund’s net benefit or obligation under the derivative contract, as measured by the fair value of the contract, is included in net assets.
The Fund has procedures to determine the fair value of financial instruments for which market prices are not reliable or readily available. Under these procedures, the VC convenes on a regular basis to review such financial instruments and considers a number of factors, including significant unobservable valuation inputs, when arriving at fair value. The VC primarily employs a market-based approach which may use related or comparable assets or liabilities, recent transactions, market multiples, book values, and other relevant information for the investment to determine the fair value of the investment. An income-based valuation approach may also be used in which the anticipated future cash flows of the investment are discounted to calculate fair value. Discounts may also be applied due to the nature or duration of any restrictions on the disposition of the investments. Due to the inherent uncertainty of valuations of such investments, the fair values may differ significantly from the values that would have been used had an active market existed. The VC employs various methods for calibrating these valuation approaches including a regular review of key inputs and assumptions, transactional back-testing or disposition analysis, and reviews of any related market activity.
22 | Annual Report | franklintempleton.com | ||
FRANKLIN STRATEGIC SERIES
NOTES TO FINANCIAL STATEMENTS
Franklin Global Government Bond Fund (continued)
Trading in securities on foreign securities stock exchanges and OTC markets may be completed before 4 p.m. Eastern time. In addition, trading in certain foreign markets may not take place on every Fund’s business day. Occasionally, events occur between the time at which trading in a foreign security is completed and 4 p.m. Eastern time that might call into question the reliability of the value of a portfolio security held by the Fund. As a result, differences may arise between the value of the Fund’s portfolio securities as determined at the foreign market close and the latest indications of value at 4 p.m. Eastern time. In order to minimize the potential for these differences, the VC monitors price movements following the close of trading in foreign stock markets through a series of country specific market proxies (such as baskets of American Depositary Receipts, futures contracts and exchange traded funds). These price movements are measured against established trigger thresholds for each specific market proxy to assist in determining if an event has occurred that may call into question the reliability of the values of the foreign securities held by the Fund. If such an event occurs, the securities may be valued using fair value procedures, which may include the use of independent pricing services.
When the last day of the reporting period is a non-business day, certain foreign markets may be open on those days that the Fund’s NAV is not calculated, which could result in differences between the value of the Fund’s portfolio securities on the last business day and the last calendar day of the reporting period. Any significant security valuation changes due to an open foreign market are adjusted and reflected by the Fund for financial reporting purposes.
b. Foreign Currency Translation
Portfolio securities and other assets and liabilities denominated in foreign currencies are translated into U.S. dollars based on the exchange rate of such currencies against U.S. dollars on the date of valuation. The Fund may enter into foreign currency exchange contracts to facilitate transactions denominated in a foreign currency. Purchases and sales of securities, income and expense items denominated in foreign currencies are translated into U.S. dollars at the exchange rate in effect on the transaction date. Portfolio securities and assets and liabilities denominated in foreign currencies contain risks that those currencies will decline in value relative to the U.S. dollar. Occasionally, events may impact the availability or reliability of foreign exchange
rates used to convert the U.S. dollar equivalent value. If such an event occurs, the foreign exchange rate will be valued at fair value using procedures established and approved by the Board.
The Fund does not separately report the effect of changes in foreign exchange rates from changes in market prices on securities held. Such changes are included in net realized and unrealized gain or loss from investments in the Statement of Operations.
Realized foreign exchange gains or losses arise from sales of foreign currencies, currency gains or losses realized between the trade and settlement dates on securities transactions and the difference between the recorded amounts of dividends, interest, and foreign withholding taxes and the U.S. dollar equivalent of the amounts actually received or paid. Net unrealized foreign exchange gains and losses arise from changes in foreign exchange rates on foreign denominated assets and liabilities other than investments in securities held at the end of the reporting period.
c. Derivative Financial Instruments
The Fund invested in derivative financial instruments in order to manage risk or gain exposure to various other investments or markets. Derivatives are financial contracts based on an underlying or notional amount, require no initial investment or an initial net investment that is smaller than would normally be required to have a similar response to changes in market factors, and require or permit net settlement. Derivatives contain various risks including the potential inability of the counterparty to fulfill their obligations under the terms of the contract, the potential for an illiquid secondary market, and/or the potential for market movements which expose the Fund to gains or losses in excess of the amounts shown in the Statement of Assets and Liabilities. Realized gain and loss and unrealized appreciation and depreciation on these contracts for the period are included in the Statement of Operations.
Derivative counterparty credit risk is managed through a formal evaluation of the creditworthiness of all potential counter-parties. The Fund attempts to reduce its exposure to counterparty credit risk on OTC derivatives, whenever possible, by entering into International Swaps and Derivatives Association (ISDA) master agreements with certain counterparties. These agreements contain various provisions, including but not limited to collateral requirements, events of default, or early termination. Termination events applicable to
franklintempleton.com | Annual Report | 23 | ||
FRANKLIN STRATEGIC SERIES
NOTES TO FINANCIAL STATEMENTS
Franklin Global Government Bond Fund (continued)
1. Organization and Significant Accounting
Policies (continued)
c. Derivative Financial Instruments (continued)
the counterparty include certain deteriorations in the credit quality of the counterparty. Termination events applicable to the Fund include failure of the Fund to maintain certain net asset levels and/or limit the decline in net assets over various periods of time. In the event of default or early termination, the ISDA master agreement gives the non-defaulting party the right to net and close-out all transactions traded, whether or not arising under the ISDA agreement, to one net amount payable by one counterparty to the other. However, absent an event of default or early termination, OTC derivative assets and liabilities are presented gross and not offset in the Statement of Assets and Liabilities. Early termination by the counterparty may result in an immediate payment by the Fund of any net liability owed to that counterparty under the ISDA agreement.
Collateral requirements differ by type of derivative. Collateral terms are contract specific for OTC derivatives. For OTC derivatives traded under an ISDA master agreement, posting of collateral is required by either the Fund or the applicable counterparty if the total net exposure of all OTC derivatives with the applicable counterparty exceeds the minimum transfer amount, which typically ranges from $100,000 to $250,000, and can vary depending on the counterparty and the type of the agreement. Generally, collateral is determined at the close of Fund business each day and any additional collateral required due to changes in derivative values may be delivered by the Fund or the counterparty the next business day, or within a few business days. Collateral pledged and/or received by the Fund, if any, is held in segregated accounts with the Fund’s custodian/counterparty broker and can be in the form of cash and/or securities. Unrestricted cash may be invested according to the Fund’s investment objectives. To the extent that the amounts due to the Fund from its counterparties are not subject to collateralization or are not fully collateralized, the Fund bears the risk of loss from counterparty non-performance.
The Fund entered into OTC forward exchange contracts primarily to manage and/or gain exposure to certain foreign currencies. A forward exchange contract is an agreement between the Fund and a counterparty to buy or sell a foreign currency at a specific exchange rate on a future date.
See Note 8 regarding other derivative information.
d. Income and Deferred Taxes
It is the Fund’s policy to qualify as a regulated investment company under the Internal Revenue Code. The Fund intends to distribute to shareholders substantially all of its taxable income and net realized gains to relieve it from federal income and excise taxes. As a result, no provision for U.S. federal income taxes is required.
The Fund may be subject to foreign taxation related to income received, capital gains on the sale of securities and certain foreign currency transactions in the foreign jurisdictions in which it invests. Foreign taxes, if any, are recorded based on the tax regulations and rates that exist in the foreign markets in which the Fund invests. When a capital gain tax is determined to apply, the Fund records an estimated deferred tax liability in an amount that would be payable if the securities were disposed of on the valuation date.
The Fund may recognize an income tax liability related to its uncertain tax positions under U.S. GAAP when the uncertain tax position has a less than 50% probability that it will be sustained upon examination by the tax authorities based on its technical merits. As of April 30, 2017, the Fund has determined that no tax liability is required in its financial statements related to uncertain tax positions for any open tax years (or expected to be taken in future tax years). Open tax years are those that remain subject to examination and are based on each tax jurisdiction’s statute of limitation.
e. Security Transactions, Investment Income, Expenses and Distributions
Security transactions are accounted for on trade date. Realized gains and losses on security transactions are determined on a specific identification basis. Interest income and estimated expenses are accrued daily. Amortization of premium and accretion of discount on debt securities are included in interest income. Distributions to shareholders are recorded on the ex-dividend date and are determined according to income tax regulations (tax basis). Distributable earnings determined on a tax basis may differ from earnings recorded in accordance with U.S. GAAP. These differences may be permanent or temporary. Permanent differences are reclassified among capital accounts to reflect their tax character. These reclassifications have no impact on net assets or the results of operations. Temporary differences are not reclassified, as they may reverse in subsequent periods.
24 | Annual Report | franklintempleton.com | ||
FRANKLIN STRATEGIC SERIES
NOTES TO FINANCIAL STATEMENTS
Franklin Global Government Bond Fund (continued)
Common expenses incurred by the Trust are allocated among the Funds based on the ratio of net assets of each Fund to the combined net assets of the Trust. Fund specific expenses are charged directly to the Fund that incurred the expense.
Realized and unrealized gains and losses and net investment income, not including class specific expenses, are allocated daily to each class of shares based upon the relative proportion of net assets of each class. Differences in per share distributions, by class, are generally due to differences in class specific expenses.
Inflation-indexed bonds are adjusted for inflation through periodic increases or decreases in the security’s interest accruals, face amount, or principal redemption value, by amounts corresponding to the rate of inflation as measured by an index. Any increase or decrease in the face amount or principal redemption value will be included as interest income in the Statement of Operations.
f. Accounting Estimates
The preparation of financial statements in accordance with U.S. GAAP requires management to make estimates and assumptions that affect the reported amounts of assets and
liabilities at the date of the financial statements and the amounts of income and expenses during the reporting period. Actual results could differ from those estimates.
g. Guarantees and Indemnifications
Under the Trust’s organizational documents, its officers and trustees are indemnified by the Trust against certain liabilities arising out of the performance of their duties to the Trust. Additionally, in the normal course of business, the Trust, on behalf of the Fund, enters into contracts with service providers that contain general indemnification clauses. The Trust’s maximum exposure under these arrangements is unknown as this would involve future claims that may be made against the Trust that have not yet occurred. Currently, the Trust expects the risk of loss to be remote.
2. Shares of Beneficial Interest
At April 30, 2017, there were an unlimited number of shares authorized (without par value). Transactions in the Fund’s shares were as follows:
| Year Ended April 30, | ||||||||||||||||
| 2017a | 2016a | |||||||||||||||
| Shares | Amount | Shares | Amount | |||||||||||||
Class A Shares: | ||||||||||||||||
Shares sold | 402,621 | $ | 3,810,870 | 332,524 | $ | 3,141,724 | ||||||||||
Shares issued in reinvestment of distributions | 1,486 | 14,111 | 3,698 | 35,024 | ||||||||||||
Shares redeemed | (614,975 | ) | (5,753,423 | ) | (114,211 | ) | (1,082,164 | ) | ||||||||
Net increase (decrease) | (210,868 | ) | $ | (1,928,442 | ) | 222,011 | $ | 2,094,584 | ||||||||
Class C Shares: | ||||||||||||||||
Shares sold | 22,275 | $ | 208,140 | 44,024 | $ | 416,435 | ||||||||||
Shares issued in reinvestment of distributions | 63 | 599 | 421 | 3,989 | ||||||||||||
Shares redeemed | (45,551 | ) | (426,538 | ) | (21,056 | ) | (197,909 | ) | ||||||||
Net increase (decrease) | (23,213 | ) | $ | (217,799 | ) | 23,389 | $ | 222,515 | ||||||||
franklintempleton.com | Annual Report | 25 | ||
FRANKLIN STRATEGIC SERIES
NOTES TO FINANCIAL STATEMENTS
Franklin Global Government Bond Fund (continued)
2. Shares of Beneficial Interest (continued)
| Year Ended April 30, | ||||||||||||||||
| 2017a | 2016a | |||||||||||||||
| Shares | Amount | Shares | Amount | |||||||||||||
Advisor Class Shares: | ||||||||||||||||
Shares sold | 68,523 | $ | 649,193 | 1,207 | $ | 11,435 | ||||||||||
Shares issued in reinvestment of distributions | 57 | 523 | — | — | ||||||||||||
Shares redeemed | (39,883 | ) | (371,620 | ) | (1,207 | ) | (11,410 | ) | ||||||||
Net increase (decrease) | 28,697 | $ | 278,096 | — | $ | 25 | ||||||||||
aDuring the year Class R and Class R6 did not report any share transactions.
3. Transactions with Affiliates
Franklin Resources, Inc. is the holding company for various subsidiaries that together are referred to as Franklin Templeton Investments. Certain officers and trustees of the Fund are also officers and/or directors of the following subsidiaries:
Subsidiary | Affiliation | |
Franklin Templeton Investment Management Limited (FTIML) | Investment manager | |
Franklin Templeton Services, LLC (FT Services) | Administrative manager | |
Franklin Templeton Distributors, Inc. (Distributors) | Principal underwriter | |
Franklin Templeton Investor Services, LLC (Investor Services) | Transfer agent |
a. Management Fees
The Fund pays an investment management fee to FTIML based on the average daily net assets of the Fund as follows:
| Annualized Fee Rate | Net Assets | |
0.650% | Up to and including $1 billion | |
0.600% | Over $1 billion, up to and including $5 billion | |
0.550% | Over $5 billion, up to and including $10 billion | |
0.545% | Over $10 billion, up to and including $15 billion | |
0.540% | Over $15 billion, up to and including $20 billion | |
0.535% | In excess of $20 billion |
For the year ended April 30, 2017, the effective investment management fee rate was 0.650% of the Fund’s average daily net assets.
b. Administrative Fees
Under an agreement with FTIML, FT Services provides administrative services to the Fund. The fee is paid by FTIML based on the Fund’s average daily net assets, and is not an additional expense of the Fund.
c. Distribution Fees
The Board has adopted distribution plans for each share class, with the exception of Class R6 and Advisor Class shares, pursuant to Rule 12b-1 under the 1940 Act. Under the Fund’s Class A reimbursement distribution plan, the Fund reimburses Distributors for costs incurred in connection with the servicing, sale and distribution of the Fund’s shares up to the maximum annual plan rate. Under the Class A reimbursement distribution plan, costs exceeding the maximum for the current plan year cannot be reimbursed in
26 | Annual Report | franklintempleton.com | ||
FRANKLIN STRATEGIC SERIES
NOTES TO FINANCIAL STATEMENTS
Franklin Global Government Bond Fund (continued)
subsequent periods. In addition, under the Fund’s Class C and R compensation distribution plans, the Fund pays Distributors for costs incurred in connection with the servicing, sale and distribution of each Fund’s shares up to the maximum annual plan rate for each class. The plan year, for purposes of monitoring compliance with the maximum annual plan rates, is February 1 through January 31.
The maximum annual plan rates, based on the average daily net assets, for each class, are as follows:
Class A | 0.25 | % | ||
Class C | 0.65 | % | ||
Class R | 0.50 | % |
d. Sales Charges/Underwriting Agreements
Front-end sales charges and contingent deferred sales charges (CDSC) do not represent expenses of the Fund. These charges are deducted from the proceeds of sales of Fund shares prior to investment or from redemption proceeds prior to remittance, as applicable. Distributors has advised the Fund of the following commission transactions related to the sales and redemptions of the Fund’s shares for the year:
Sales charges retained net of commissions paid to unaffiliated brokers/dealers | $ | 2,886 | ||
CDSC retained | $ | 33 |
e. Transfer Agent Fees
Each class of shares, except for Class R6, pays transfer agent fees to Investor Services for its performance of shareholder servicing obligations and reimburses Investor Services for out of pocket expenses incurred, including shareholder servicing fees paid to third parties. These fees are allocated daily based upon their relative proportion of such classes’ aggregate net assets. Class R6 pays Investor Services transfer agent fees specific to that class.
For the year ended April 30, 2017, the Fund paid transfer agent fees of $12,051, of which $7,884 was retained by Investor Services.
f. Investments in Affiliated Management Investment Companies
The Fund invests in one or more affiliated management investment companies for purposes other than exercising a controlling influence over the management or policies. Management fees paid by the Fund are waived on assets invested in the affiliated management investment companies, as noted in the Statement of Operations, in an amount not to exceed the management and administrative fees paid directly or indirectly by each affiliate. During the year ended April 30, 2017, the Fund held investments in affiliated management investment companies as follows:
| Number of Shares Held at Beginning of Year | Gross Additions | Gross Reductions | Number of Shares Held at End of Year | Value at End of Year | Investment Income | Realized Gain (Loss) | % of Affiliated Fund Shares Outstanding Held at End of Year | |||||||||||||||||||||||||
Non-Controlled Affiliates | ||||||||||||||||||||||||||||||||
Institutional Fiduciary Trust Money Market | ||||||||||||||||||||||||||||||||
Portfolio, 0.37% | 2,527,951 | 5,891,610 | (7,808,615 | ) | 610,946 | $610,946 | $687 | $– | – | %a | ||||||||||||||||||||||
aRounds to less than 0.1%. | ||||||||||||||||||||||||||||||||
franklintempleton.com | Annual Report | 27 | ||
FRANKLIN STRATEGIC SERIES
NOTES TO FINANCIAL STATEMENTS
Franklin Global Government Bond Fund (continued)
3. Transactions with Affiliates (continued)
g. Waiver and Expense Reimbursements
FTIML and Investor Services have contractually agreed in advance to waive or limit their respective fees and to assume as their own expense certain expenses otherwise payable by the Fund so that the expenses (excluding distribution fees, and acquired fund fees and expenses) for Class A, Class C, Class R and Advisor Class of the Fund do not exceed 0.60%, and Class R6 does not exceed 0.59% based on the average net assets of each class (other than certain non-routine expenses or costs, including those relating to litigation, indemnification, reorganizations, and liquidations) until August 31, 2017. Total expenses waived or paid are not subject to recapture subsequent to the Fund’s fiscal year end.
h. Other Affiliated Transactions
At April 30, 2017, Franklin Advisers, Inc. an affiliate of FTIML, owned 64.16% of the Fund’s outstanding shares. Investment activities of this shareholder could have a material impact on the Fund.
4. Expense Offset Arrangement
The Fund has entered into an arrangement with its custodian whereby credits realized as a result of uninvested cash balances are used to reduce a portion of the Fund’s custodian expenses. During the year ended April 30, 2017, there were no credits earned.
5. Income Taxes
For tax purposes, capital losses may be carried over to offset future capital gains, if any. At April 30, 2017, the capital loss carryforwards were as follows:
Capital loss carryforwards not subject to expiration: | ||||
Short term | $ | 142,081 | ||
Long term | 43,227 | |||
Total capital loss carryforwards | $ | 185,308 |
For tax purposes, the Fund may elect to defer any portion of a late-year ordinary loss to the first day of the following fiscal year. At April 30, 2017, the Fund deferred late-year ordinary losses of $203,678.
The tax character of distributions paid during the years ended April 30, 2017 and 2016, was as follows:
| 2017 | 2016 | |||||||
Distributions paid from ordinary income | $ | 43,679 | $ | 212,427 | ||||
At April 30, 2017, the cost of investments and net unrealized appreciation (depreciation) for income tax purposes were as follows:
Cost of investments | $ | 11,835,244 | ||
Unrealized appreciation | $ | 186,036 | ||
Unrealized depreciation | (842,106 | ) | ||
Net unrealized appreciation (depreciation) | $ | (656,070 | ) |
Differences between income and/or capital gains as determined on a book basis and a tax basis are primarily due to differing treatments of bond discounts and premiums, foreign currency transactions, and tax straddles.
28 | Annual Report | franklintempleton.com | ||
FRANKLIN STRATEGIC SERIES
NOTES TO FINANCIAL STATEMENTS
Franklin Global Government Bond Fund (continued)
6. Investment Transactions
Purchases and sales of investments (excluding short term securities) for the year ended April 30, 2017, aggregated $4,962,997 and $4,694,682, respectively.
7. Concentration of Risk
Investing in foreign securities may include certain risks and considerations not typically associated with investing in U.S. securities, such as fluctuating currency values and changing local and regional economic, political and social conditions, which may result in greater market volatility. In addition, certain foreign securities may not be as liquid as U.S. securities.
8. Other Derivative Information
At April 30, 2017, the Fund’s investments in derivative contracts are reflected in the Statement of Assets and Liabilities as follows:
| Asset Derivatives | Liability Derivatives | |||||||||||
Derivative Contracts Not Accounted for as Hedging Instruments | Statement of Assets and Liabilities Location | Fair Value | Statement of Assets and Liabilities Location | Fair Value | ||||||||
Foreign exchange contracts | Unrealized appreciation on OTC forward exchange contracts | | $37,172 | | Unrealized depreciation on OTC forward exchange contracts | | $85,695 | | ||||
For the year ended April 30, 2017, the effect of derivative contracts in the Fund’s Statement of Operations was as follows:
Derivative Contracts Not Accounted for as Hedging Instruments | Statement of Operations Locations | Net Realized Gain (Loss) for the Year | Statement of Operations Locations | Net Change in Unrealized Appreciation for the Year | ||||||||
| Net realized gain (loss) from: | Net change in unrealized appreciation (depreciation) on: | |||||||||||
Foreign exchange contracts | Foreign currency transactions | $ | (89,016 | )a | Translation of other assets and liabilities denominated in foreign currencies | $ | 122,440 | a | ||||
aForward exchange contracts are included in net realized gain (loss) from foreign currency transactions and net change in unrealized appreciation (depreciation) on translation of other assets and liabilities denominated in foreign currencies in the Statement of Operations.
At April 30, 2017, the Fund’s OTC derivative assets and liabilities, are as follows:
| Gross Amounts of | ||||||||
| Assets and Liabilities Presented | ||||||||
| in the Statement of Assets and Liabilities | ||||||||
| Assetsa | Liabilitiesa | |||||||
Derivatives | ||||||||
Forward exchange contracts | $37,172 | $85,695 | ||||||
aAbsent an event of default or early termination, OTC derivative assets and liabilities are presented gross and not offset in the Statement of Assets and Liabilities.
franklintempleton.com | Annual Report | 29 | ||
FRANKLIN STRATEGIC SERIES
NOTES TO FINANCIAL STATEMENTS
Franklin Global Government Bond Fund (continued)
8. Other Derivative Information (continued)
At April 30, 2017, the Fund’s OTC derivative assets which may be offset against the Fund’s OTC derivative liabilities and collateral received from the counterparty, is as follows:
| Amounts Not Offset in the | ||||||||||||||||||||
| Statement of Assets and Liabilities | ||||||||||||||||||||
Gross Amounts of
| Financial
| Financial
| Cash
| Net Amount
| ||||||||||||||||
Counterparty | ||||||||||||||||||||
BZWS | $4,879 | $(4,879 | ) | $ — | $ — | $ — | ||||||||||||||
CITI | 20,272 | (20,272 | ) | — | — | — | ||||||||||||||
RBCCM | 12,021 | — | — | — | 12,021 | |||||||||||||||
Total | $37,172 | $(25,151 | ) | $ — | $ — | $12,021 | ||||||||||||||
At April 30, 2017, the Fund’s OTC derivative liabilities which may be offset against the Fund’s OTC derivative assets and collateral pledged to the counterparty, is as follows:
| Amounts Not Offset in the | ||||||||||||||||||||
| Statement of Assets and Liabilities | ||||||||||||||||||||
Gross Amounts of
| Financial
| Financial
| Cash
| Net Amount
| ||||||||||||||||
Counterparty | ||||||||||||||||||||
BZWS | $49,171 | $(4,879 | ) | $ — | $ — | $44,292 | ||||||||||||||
CITI | 36,524 | (20,272 | ) | — | — | 16,252 | ||||||||||||||
RBCCM | — | — | — | — | — | |||||||||||||||
Total | $85,695 | $(25,151 | ) | $ — | $ — | $60,544 | ||||||||||||||
For the year ended April 30, 2017, the average month end fair value of derivatives represented 0.7% of average month end net assets. The average month end number of open derivatives contracts for the year was 8.
See Note 1(c) regarding derivative financial instruments.
See Abbreviations on page 32.
9. Credit Facility
The Fund, together with other U.S. registered and foreign investment funds (collectively, Borrowers), managed by Franklin Templeton Investments, are borrowers in a joint syndicated senior unsecured credit facility totaling $2 billion (Global Credit Facility) which matures on February 9, 2018. This Global Credit Facility provides a source of funds to the Borrowers for temporary and emergency purposes, including the ability to meet future unanticipated or unusually large redemption requests.
Under the terms of the Global Credit Facility, the Fund shall, in addition to interest charged on any borrowings made by the Fund and other costs incurred by the Fund, pay its share of fees and expenses incurred in connection with the implementation and maintenance of the Global Credit Facility, based upon its relative share of the aggregate net assets of all of the Borrowers, including an annual commitment fee of 0.15% based upon the unused portion of the Global Credit Facility. These fees are reflected in other expenses in the Statement of Operations. During the year ended April 30, 2017, the Fund did not use the Global Credit Facility.
30 | Annual Report | franklintempleton.com | ||
FRANKLIN STRATEGIC SERIES
NOTES TO FINANCIAL STATEMENTS
Franklin Global Government Bond Fund (continued)
10. Fair Value Measurements
The Fund follows a fair value hierarchy that distinguishes between market data obtained from independent sources (observable inputs) and the Fund’s own market assumptions (unobservable inputs). These inputs are used in determining the value of the Fund’s financial instruments and are summarized in the following fair value hierarchy:
| • | Level 1 – quoted prices in active markets for identical financial instruments |
| • | Level 2 – other significant observable inputs (including quoted prices for similar financial instruments, interest rates, prepayment speed, credit risk, etc.) |
| • | Level 3 – significant unobservable inputs (including the Fund’s own assumptions in determining the fair value of financial instruments) |
The input levels are not necessarily an indication of the risk or liquidity associated with financial instruments at that level.
For movements between the levels within the fair value hierarchy, the Fund has adopted a policy of recognizing the transfers as of the date of the underlying event which caused the movement.
A summary of inputs used as of April 30, 2017, in valuing the Fund’s assets and liabilities carried at fair value, is as follows:
Level 1
| Level 2
| Level 3
| Total
| |||||||||||||
Assets: | ||||||||||||||||
Investments in Securities: | ||||||||||||||||
Foreign Government and Agency Securities | $ | — | $ | 7,972,530 | $ | — | $ | 7,972,530 | ||||||||
U.S. Government and Agency Securities | — | 2,595,698 | — | 2,595,698 | ||||||||||||
Short Term Investments | 610,946 | — | — | 610,946 | ||||||||||||
Total Investments in Securities | $ | 610,946 | $ | 10,568,228 | $ | — | $ | 11,179,174 | ||||||||
Other Financial Instruments: | ||||||||||||||||
Forward Exchange Contracts | $ | — | $ | 37,172 | $ | — | $ | 37,172 | ||||||||
Liabilities: | ||||||||||||||||
Other Financial Instruments: | ||||||||||||||||
Forward Exchange Contracts | $ | — | $ | 85,695 | $ | — | $ | 85,695 | ||||||||
11. New Accounting Pronouncements
In March 2017, the Financial Accounting Standards Board (FASB) issued Accounting Standards Update (ASU) No. 2017-08, Receivables—Nonrefundable Fees and Other Costs (Subtopic 310-20): Premium Amortization on Purchased Callable Debt Securities. The amendments in the ASU shorten the amortization period for certain callable debt securities, held at a premium, to be amortized to the earliest call date. The ASU does not require an accounting change for securities held at a discount; which continues to be amortized to maturity. The ASU is effective for fiscal years and interim periods within those fiscal years beginning after December 15, 2018. Management is currently evaluating the impact, if any, of applying this provision.
franklintempleton.com | Annual Report | 31 | ||
FRANKLIN STRATEGIC SERIES
NOTES TO FINANCIAL STATEMENTS
Franklin Global Government Bond Fund (continued)
12. Investment Company Reporting Modernization
In October 2016, the U.S. Securities and Exchange Commission adopted new rules and amended existing rules (together, final rules) intended to modernize the reporting and disclosure of information by registered investment companies. In part, the final rules amend Regulation S-X and require standardized, enhanced disclosures about derivatives in investment company financial statements, as well as other amendments. The compliance date for the amendments to Regulation S-X is August 1, 2017. Management is currently evaluating the impact that the adoption of the amendments to Regulation S-X will have on the Fund’s financial statements and related disclosures.
13. Subsequent Events
The Fund has evaluated subsequent events through the issuance of the financial statements and determined that no events have occurred that require disclosure, except for the following:
On February 28, 2017, the Board approved a proposal to liquidate the Fund. The Fund liquidated on June 16, 2017.
Abbreviations
| Counterparty | Currency | |||||
| BZWS | Barclays Bank PLC | AUD | Australian Dollar | |||
| CITI | Citigroup, Inc. | CAD | Canadian Dollar | |||
| RBCCM | Royal Bank of Canada | EUR | Euro | |||
| GBP | British Pound | |||||
| MXN | Mexican Peso | |||||
| MYR | Malaysian Ringgit | |||||
| PLN | Polish Zloty | |||||
32 | Annual Report | franklintempleton.com | ||
FRANKLIN STRATEGIC SERIES
Report of Independent Registered Public Accounting Firm
To the Board of Trustees of Franklin Strategic Series and Shareholders of the Franklin Global Government Bond Fund:
In our opinion, the accompanying statement of assets and liabilities, including the statement of investments, and the related statements of operations and of changes in net assets and the financial highlights present fairly, in all material respects, the financial position of the Franklin Global Government Bond Fund (the “Fund”) as of April 30, 2017, the results of its operations for the year then ended, the changes in its net assets for each of the two years in the period then ended and the financial highlights for each of the periods indicated, in conformity with accounting principles generally accepted in the United States of America. These financial statements and financial highlights (hereafter referred to as “financial statements”) are the responsibility of the Fund’s management. Our responsibility is to express an opinion on these financial statements based on our audits. We conducted our audits of these financial statements in accordance with the standards of the Public Company Accounting Oversight Board (United States). Those standards require that we plan and perform the audit to obtain reasonable assurance about whether the financial statements are free of material misstatement. An audit includes examining, on a test basis, evidence supporting the amounts and disclosures in the financial statements, assessing the accounting principles used and significant estimates made by management, and evaluating the overall financial statement presentation. We believe that our audits, which included confirmation of securities as of April 30, 2017 by correspondence with the custodian, transfer agent and brokers, provide a reasonable basis for our opinion.
As discussed in Note 13, the Investment Manager liquidated the Fund. Our opinion is not modified with respect to this matter.
PricewaterhouseCoopers LLP
San Francisco, California
June 20, 2017
franklintempleton.com | Annual Report | 33 | ||
FRANKLIN STRATEGIC SERIES
The name, year of birth and address of the officers and board members, as well as their affiliations, positions held with the Trust, principal occupations during at least the past five years and number of U.S. registered portfolios overseen in the Franklin Templeton Investments fund complex, are shown below. Generally, each board member serves until that person’s successor is elected and qualified.
Independent Board Members
Name, Year of Birth and Address | Position | Length of Time Served | Number of Portfolios in Fund Complex Overseen by Board Member* | Other Directorships Held During at Least the Past 5 Years | ||||
| ||||||||
Harris J. Ashton (1932) One Franklin Parkway San Mateo, CA 94403-1906 | Trustee | Since 1991 | 142 | Bar-S Foods (meat packing company) (1981-2010). | ||||
| Principal Occupation During at Least the Past 5 Years: | ||||||||
| Director of various companies; and formerly, Director, RBC Holdings, Inc. (bank holding company) (until 2002); and President, Chief Executive Officer and Chairman of the Board, General Host Corporation (nursery and craft centers) (until 1998). | ||||||||
| ||||||||
Mary C. Choksi (1950) One Franklin Parkway San Mateo, CA 94403-1906 | Trustee | Since 2014 | 136 | Avis Budget Group Inc. (car rental) (2007-present), Omnicom Group Inc. (advertising and marketing communications services) (2011-present) and H.J. Heinz Company (processed foods and allied products) (1998-2006) | ||||
| Principal Occupation During at Least the Past 5 Years: | ||||||||
| Senior Advisor, Strategic Investment Group (investment management group) (2015-present); director of various companies; and formerly, Founding Partner and Senior Managing Director, Strategic Investment Group (1987–2015); Founding Partner and Managing Director, Emerging Markets Management LLC (investment management firm) (1987-2011); and Loan Officer/Senior Loan Officer/Senior Pension Investment Officer, World Bank Group (international financial institution) (1977-1987). | ||||||||
| ||||||||
Edith E. Holiday (1952) One Franklin Parkway San Mateo, CA 94403-1906 | Trustee | Since 1998 | 142 | Hess Corporation (exploration and refining of oil and gas) (1993-present), Canadian National Railway (railroad) (2001-present), White Mountains Insurance Group, Ltd. (holding company) (2004-present), Santander Consumer USA Holdings, Inc. (consumer finance) (2016-present), RTI International Metals, Inc. (manufacture and distribution of titanium) (1999-2015) and H.J. Heinz Company (processed foods and allied products) (1994-2013). | ||||
| Principal Occupation During at Least the Past 5 Years: | ||||||||
| Director or Trustee of various companies and trusts; and formerly, Assistant to the President of the United States and Secretary of the Cabinet (1990-1993); General Counsel to the United States Treasury Department (1989-1990); and Counselor to the Secretary and Assistant Secretary for Public Affairs and Public Liaison – United States Treasury Department (1988-1989). | ||||||||
| ||||||||
J. Michael Luttig (1954) One Franklin Parkway San Mateo, CA 94403-1906 | Trustee | Since 2009 | 142 | Boeing Capital Corporation (aircraft financing) (2006-2013). | ||||
| Principal Occupation During at Least the Past 5 Years: | ||||||||
| Executive Vice President, General Counsel and member of the Executive Council, The Boeing Company (aerospace company)(2006-present);and formerly, Federal Appeals Court Judge, U.S. Court of Appeals for the Fourth Circuit (1991-2006). | ||||||||
| ||||||||
34 | Annual Report | franklintempleton.com | ||
FRANKLIN STRATEGIC SERIES
Independent Board Members (continued)
Name, Year of Birth and Address | Position | Length of Time Served | Number of Portfolios in Fund Complex Overseen by Board Member* | Other Directorships Held During at Least the Past 5 Years | ||||
| ||||||||
Larry D. Thompson (1945) One Franklin Parkway San Mateo, CA 94403-1906 | Trustee | Since 2007 | 142 | The Southern Company (energy company) (2014-present; previously 2010-2012), Graham Holdings Company (education and media organization) (2011-present) and Cbeyond, Inc. (business communications provider) (2010-2012). | ||||
| Principal Occupation During at Least the Past 5 Years: | ||||||||
| Director of various companies; John A. Sibley Professor of Corporate and Business Law, University of Georgia School of Law (2015-present;previously 2011-2012); and formerly, Executive Vice President – Government Affairs, General Counsel and Corporate Secretary, PepsiCo, Inc. (consumer products) (2012-2014); Senior Vice President – Government Affairs, General Counsel and Secretary, PepsiCo, Inc. (2004-2011); Senior Fellow of The Brookings Institution (2003-2004); Visiting Professor, University of Georgia School of Law (2004); and Deputy Attorney General, U.S. Department of Justice (2001-2003). | ||||||||
| ||||||||
John B. Wilson (1959) One Franklin Parkway San Mateo, CA 94403-1906 | Lead Independent Trustee | Trustee since 2006 and Lead Independent Trustee since 2008 | 116 | None | ||||
| Principal Occupation During at Least the Past 5 Years: | ||||||||
| President, Staples Europe (office supplies) (2012-present); President and Founder, Hyannis Port Capital, Inc. (real estate and private equity investing); serves on private and non-profit boards; and formerly, Chief Operating Officer and Executive Vice President, Gap, Inc. (retail) (1996-2000); Chief Financial Officer and Executive Vice President – Finance and Strategy, Staples, Inc. (1992-1996); Senior Vice President – Corporate Planning, Northwest Airlines, Inc. (airlines) (1990-1992); and Vice President and Partner, Bain & Company (consulting firm) (1986-1990). | ||||||||
| ||||||||
Interested Board Members and Officers
| ||||||||
Name, Year of Birth and Address | Position | Length of Time Served | Number of Portfolios in Fund Complex Overseen by Board Member* | Other Directorships Held During at Least the Past 5 Years | ||||
| ||||||||
**Gregory E. Johnson (1961) One Franklin Parkway | Trustee | Since 2013 | 158 | None | ||||
| Principal Occupation During at Least the Past 5 Years: | ||||||||
| Chairman of the Board, Member - Office of the Chairman, Director and Chief Executive Officer, Franklin Resources, Inc.; officer and/or director or trustee, as the case may be, of some of the other subsidiaries of Franklin Resources, Inc. and of 44 of the investment companies in Franklin Templeton Investments; Vice Chairman, Investment Company Institute; and formerly, President, Franklin Resources, Inc. (1994-2015). | ||||||||
| ||||||||
**Rupert H. Johnson, Jr. (1940) One Franklin Parkway San Mateo, CA 94403-1906 | Chairman of the Board and Trustee | Chairman of the Board since 2013 and Trustee since 1991 | 142 | None | ||||
| Principal Occupation During at Least the Past 5 Years: | ||||||||
| Vice Chairman, Member – Office of the Chairman and Director, Franklin Resources, Inc.; Director, Franklin Advisers, Inc.; Senior Vice President, Franklin Advisory Services, LLC; and officer and/or director or trustee, as the case may be, of some of the other subsidiaries of Franklin Resources, Inc. and of 42 of the investment companies in Franklin Templeton Investments. | ||||||||
| ||||||||
Alison E. Baur (1964) One Franklin Parkway San Mateo, CA 94403-1906 | Vice President | Since 2012 | Not Applicable | Not Applicable | ||||
| Principal Occupation During at Least the Past 5 Years: | ||||||||
| Deputy General Counsel, Franklin Templeton Investments; and officer of some of the other subsidiaries of Franklin Resources, Inc. and of 45 of the investment companies in Franklin Templeton Investments. | ||||||||
| ||||||||
franklintempleton.com | Annual Report | 35 | ||
FRANKLIN STRATEGIC SERIES
Interested Board Members and Officers (continued)
Name, Year of Birth and Address | Position | Length of Time Served | Number of Portfolios in Fund Complex Overseen by Board Member* | Other Directorships Held During at Least the Past 5 Years | ||||
| ||||||||
Laura F. Fergerson (1962) One Franklin Parkway San Mateo, CA 94403-1906 | Chief Executive Officer – Finance and Administration | Since 2009 | Not Applicable | Not Applicable | ||||
| Principal Occupation During at Least the Past 5 Years: | ||||||||
| Senior Vice President, Franklin Templeton Services, LLC; Vice President, Franklin Advisers, Inc. and Franklin Templeton Institutional, LLC; and officer of 45 of the investment companies in Franklin Templeton Investments. | ||||||||
| ||||||||
Gaston Gardey (1967) One Franklin Parkway San Mateo, CA 94403-1906 | Treasurer, Chief Financial Officer and Chief Accounting Officer | Since 2009 | Not Applicable | Not Applicable | ||||
| Principal Occupation During at Least the Past 5 Years: | ||||||||
| Treasurer, U.S. Fund Administration & Reporting, Franklin Templeton Investments; and officer of 27 of the investment companies in Franklin Templeton Investments. | ||||||||
| ||||||||
Aliya S. Gordon (1973) One Franklin Parkway San Mateo, CA 94403-1906 | Vice President | Since 2009 | Not Applicable | Not Applicable | ||||
| Principal Occupation During at Least the Past 5 Years: | ||||||||
| Senior Associate General Counsel, Franklin Templeton Investments; and officer of 45 of the investment companies in Franklin Templeton Investments. | ||||||||
| ||||||||
Steven J. Gray (1955) One Franklin Parkway San Mateo, CA 94403-1906 | Vice President | Since 2009 | Not Applicable | Not Applicable | ||||
| Principal Occupation During at Least the Past 5 Years: | ||||||||
| Senior Associate General Counsel, Franklin Templeton Investments; Vice President, Franklin Templeton Distributors, Inc.; and officer of 45 of the investment companies in Franklin Templeton Investments. | ||||||||
| ||||||||
Edward B. Jamieson (1948) One Franklin Parkway San Mateo, CA 94403-1906 | President and Chief Executive Officer – Investment Management | Since 2010 | Not Applicable | Not Applicable | ||||
| Principal Occupation During at Least the Past 5 Years: | ||||||||
| President and Director, Franklin Advisers, Inc.; Executive Vice President, Franklin Templeton Institutional, LLC; and officer and/or trustee, as the case may be, of some of the other subsidiaries of Franklin Resources, Inc. and of 10 of the investment companies in Franklin Templeton Investments. | ||||||||
| ||||||||
Robert Lim (1948) One Franklin Parkway San Mateo, CA 94403-1906 | Vice President –AML Compliance | Since 2016 | Not Applicable | Not Applicable | ||||
| Principal Occupation During at Least the Past 5 Years: | ||||||||
| Vice President, Franklin Templeton Companies, LLC; Chief Compliance Officer, Franklin Templeton Distributors, Inc. and Franklin Templeton Investor Services, LLC; and officer of 45 of the investment companies in Franklin Templeton Investments. | ||||||||
| ||||||||
Christopher J. Molumphy (1962) One Franklin Parkway San Mateo, CA 94403-1906 | Vice President | Since 2000 | Not Applicable | Not Applicable | ||||
| Principal Occupation During at Least the Past 5 Years: | ||||||||
| Director and Executive Vice President, Franklin Advisers, Inc.; Executive Vice President, Franklin Templeton Institutional, LLC; and officer of some of the other subsidiaries of Franklin Resources, Inc. and of 22 of the investment companies in Franklin Templeton Investments. | ||||||||
| ||||||||
36 | Annual Report | franklintempleton.com | ||
FRANKLIN STRATEGIC SERIES
Interested Board Members and Officers (continued)
Name, Year of Birth and Address | Position | Length of Time Served | Number of Portfolios in Fund Complex Overseen by Board Member* | Other Directorships Held During at Least the Past 5 Years | ||||
| ||||||||
Kimberly H. Novotny (1972) 300 S.E. 2nd Street Fort Lauderdale, FL 33301-1923 | Vice President | Since 2013 | Not Applicable | Not Applicable | ||||
| Principal Occupation During at Least the Past 5 Years: | ||||||||
| Associate General Counsel, Franklin Templeton Investments; Vice President and Corporate Secretary, Fiduciary Trust International of the South; Vice President, Templeton Investment Counsel, LLC; Assistant Secretary, Franklin Resources, Inc.; and officer of 45 of the investment companies in Franklin Templeton Investments. | ||||||||
| ||||||||
Robert C. Rosselot (1960) 300 S.E. 2nd Street Fort Lauderdale, FL 33301-1923 | Chief Compliance Officer | Since 2013 | Not Applicable | Not Applicable | ||||
| Principal Occupation During at Least the Past 5 Years: | ||||||||
| Director, Global Compliance, Franklin Templeton Investments; Vice President, Franklin Templeton Companies, LLC; officer of 45 of the investment companies in Franklin Templeton Investments; and formerly, Senior Associate General Counsel, Franklin Templeton Investments (2007-2013); and Secretary and Vice President, Templeton Group of Funds (2004-2013). | ||||||||
| ||||||||
Karen L. Skidmore (1952) One Franklin Parkway San Mateo, CA 94403-1906 | Vice President and Secretary | Since 2006 | Not Applicable | Not Applicable | ||||
| Principal Occupation During at Least the Past 5 Years: | ||||||||
| Senior Associate General Counsel, Franklin Templeton Investments; and officer of 45 of the investment companies in Franklin Templeton Investments. | ||||||||
| ||||||||
Navid J. Tofigh (1972) One Franklin Parkway San Mateo, CA 94403-1906 | Vice President | Since 2015 | Not Applicable | Not Applicable | ||||
| Principal Occupation During at Least the Past 5 Years: | ||||||||
| Associate General Counsel, Franklin Templeton Investments; and officer of 45 of the investment companies in Franklin Templeton Investments. | ||||||||
| ||||||||
Craig S. Tyle (1960) One Franklin Parkway San Mateo, CA 94403-1906 | Vice President | Since 2005 | Not Applicable | Not Applicable | ||||
| Principal Occupation During at Least the Past 5 Years: | ||||||||
| General Counsel and Executive Vice President, Franklin Resources, Inc.; and officer of some of the other subsidiaries of Franklin Resources, Inc. and of 45 of the investment companies in Franklin Templeton Investments. | ||||||||
| ||||||||
Lori A. Weber (1964) 300 S.E. 2nd Street Fort Lauderdale, FL 33301-1923 | Vice President | Since 2011 | Not Applicable | Not Applicable | ||||
| Principal Occupation During at Least the Past 5 Years: | ||||||||
| Senior Associate General Counsel, Franklin Templeton Investments; Assistant Secretary, Franklin Resources, Inc.; Vice President and Secretary, Templeton Investment Counsel, LLC; and officer of 45 of the investment companies in Franklin Templeton Investments. | ||||||||
| ||||||||
*We base the number of portfolios on each separate series of the U.S. registered investment companies within the Franklin Templeton Investments fund complex. These portfolios have a common investment manager or affiliated investment managers.
**Gregory E. Johnson is considered to be an interested person of the Fund under the federal securities laws due to his position as an officer and director of Franklin Resources, Inc. (Resources), which is the parent company of the Fund’s investment manager and distributor. Rupert H. Johnson, Jr. is considered to be an interested person of the Fund under the federal securities laws due to his position as officer and director and major shareholder of Resources.
Note 1: Rupert H. Johnson, Jr. is the uncle of Gregory E. Johnson.
Note 2: Officer information is current as of the date of this report. It is possible that after this date, information about officers may change.
Note 3: Effective November 1, 2016, Frank Olson ceased to be a trustee of the trust.
The Sarbanes-Oxley Act of 2002 and Rules adopted by the Securities and Exchange Commission require the Fund to disclose whether the Fund’s Audit Committee includes at least one member who is an audit committee financial expert within the meaning of such Act and Rules. The Fund’s Board has determined that there is at least one such financial expert on the Audit Committee and has designated John B. Wilson as its audit committee financial expert. The Board believes that Mr. Wilson qualifies as such an expert in view of his extensive business background and experience, including service as chief financial officer of Staples, Inc. from 1992 to 1996. Mr. Wilson has been a Member and Chairman of the Fund’s Audit Committee since 2006. As a result of such background and
franklintempleton.com | Annual Report | 37 | ||
FRANKLIN STRATEGIC SERIES
Interested Board Members and Officers (continued)
experience, the Board believes that Mr. Wilson has acquired an understanding of generally accepted accounting principles and financial statements, the general application of such principles in connection with the accounting estimates, accruals and reserves, and analyzing and evaluating financial statements that present a breadth and level of complexity of accounting issues generally comparable to those of the Fund, as well as an understanding of internal controls and procedures for financial reporting and an understanding of audit committee functions. Mr. Wilson is an independent Board member as that term is defined under the relevant Securities and Exchange Commission Rules and Releases.
The Statement of Additional Information (SAI) includes additional information about the board members and is available, without charge, upon request. Shareholders may call (800) DIAL BEN/342-5236 to request the SAI.
38 | Annual Report | franklintempleton.com | ||
FRANKLIN STRATEGIC SERIES
FRANKLIN GLOBAL GOVERNMENT BOND FUN
Board Approval of Investment Management Agreements
FRANKLIN STRATEGIC SERIES
Franklin Global Government Bond Fund
(Fund)
At an in-person meeting held on April 18, 2017 (Meeting), the Board of Trustees (Board) of Franklin Strategic Series, including a majority of the trustees who are not “interested persons” as defined in the Investment Company Act of 1940 (Independent Trustees), reviewed and approved the continuance of the investment management agreement between Franklin Templeton Investment Management Limited (Manager) and the Fund (Management Agreement) for the shorter of an additional one-year period or the date on which the Fund is liquidated. The Independent Trustees received advice from and met separately with Independent Trustee counsel in considering whether to approve the continuation of the Management Agreement. The Board noted that effective at the close of market on April 12, 2017, the Fund was closed to new investors and that effective on or about June 9, 2017 the Fund will close to all investors. The Board further noted that the Fund is expected to be liquidated on or about June 16, 2017 (Liquidation).
In considering the continuation of the Management Agreement, the Board reviewed and considered information provided by the Manager at the Meeting and throughout the year at meetings of the Board and its committees. The Board also reviewed and considered information provided in response to a detailed set of requests for information submitted to the Manager by Independent Trustee counsel on behalf of the Independent Trustees in connection with the annual contract renewal process. In addition, prior to the Meeting, the Independent Trustees held a telephonic contract renewal meeting at which the Independent Trustees conferred amongst themselves and Independent Trustee counsel about contract renewal matters. The Board reviewed and considered all of the factors it deemed relevant in approving the continuance of the Management Agreement, including, but not limited to: (i) the nature, extent, and quality of the services provided by the Manager; (ii) the investment performance of the Fund; (iii) the costs of the services provided and profits realized by the Manager and its affiliates from the relationship with the Fund; (iv) the extent to which economies of scale are realized as the Fund grows; and (v) whether fee levels reflect these economies of scale for the benefit of Fund investors.
In approving the continuance of the Management Agreement, the Board, including a majority of the Independent Trustees, determined that the existing management fees are fair and reasonable and that the continuance of such Management Agreement is in the interests of the Fund and its shareholders. While attention was given to all information furnished, the following discusses some primary factors relevant to the Board’s determination.
Nature, Extent and Quality of Services
The Board reviewed and considered information regarding the nature, extent and quality of investment management services provided by the Manager and its affiliates to the Fund and its shareholders. This information included, among other things, the qualifications, background and experience of the senior management and investment personnel of the Manager; the structure of investment personnel compensation; oversight of third-party service providers; investment performance reports and related financial information for the Fund; reports on expenses, shareholder services, marketing support payments made to financial intermediaries and third party servicing arrangements; legal and compliance matters; risk controls; pricing and other services provided by the Manager and its affiliates; and management fees charged by the Manager and its affiliates to U.S. funds and other accounts, including management’s explanation of differences among accounts where relevant. The Board noted management’s continual efforts and expenditures in establishing effective business continuity plans and developing strategies to address areas of heightened concern in the mutual fund industry, such as cybersecurity, derivatives and liquidity risk management.
The Board also reviewed and considered the benefits provided to Fund shareholders of investing in a fund that is part of the Franklin Templeton family of funds. The Board noted the financial position of Franklin Resources, Inc. (FRI), the Manager’s parent, and its commitment to the mutual fund business as evidenced by its continued introduction of new funds, reassessment of the fund offerings in response to the market environment and project initiatives and capital investments relating to the services provided to the Fund by the Franklin Templeton Investments (FTI) organization.
Following consideration of such information, the Board was satisfied with the nature, extent and quality of services provided by the Manager and its affiliates to the Fund and its shareholders.
Fund Performance
The Board reviewed and considered the performance results of
franklintempleton.com | Annual Report | 39 | ||
FRANKLIN STRATEGIC SERIES
FRANKLIN GLOBAL GOVERNMENT BOND FUND
SHAREHOLDER INFORMATION
the Fund over various time periods ended January 31, 2017. The Board considered the performance returns for the Fund in comparison to the performance returns of mutual funds deemed comparable to the Fund included in a universe (Performance Universe) selected by Broadridge Financial Solutions, Inc. (Broadridge), an independent provider of investment company data. The Board received a description of the methodology used by Broadridge to select the mutual funds included in a Performance Universe. The Board also reviewed and considered Fund performance reports provided and discussions that occurred with portfolio managers at Board meetings throughout the year. A summary of the Fund’s performance results is below.
The Performance Universe for the Fund included the Fund and all retail and institutional global income funds. The Fund has been in operation for less than five years. The Board noted that the Fund’s annualized total return for the one- and three-year periods was below the median and in the fifth quintile of its Performance Universe. The Board concluded that the Fund’s performance was unacceptable and noted that it had approved the Liquidation, especially in light of the Fund’s nominal assets of approximately $12 million as of the end of 2016.
Comparative Fees and Expenses
The Board reviewed and considered information regarding the Fund’s actual total expense ratio and its various components, including, as applicable, management fees; transfer agent expenses; underlying fund expenses; Rule 12b-1 and non-Rule 12b-1 service fees; and other non-management fees. The Board also noted that at its February meeting each year, it receives an annual report on all marketing support payments made by FTI to financial intermediaries. The Board considered the actual total expense ratio and, separately, the contractual management fee rate, without the effect of fee waivers, if any (Management Rate) of the Fund in comparison to the median ratio and median Management Rate, respectively, of other mutual funds deemed comparable to and with a similar expense structure as the Fund selected by Broadridge (Expense Group). Broadridge fee and expense data is based upon information taken from the fund’s most recent annual report, which reflects historical asset levels that may be quite different from those currently existing, particularly in a period of market volatility. While recognizing such inherent limitation and the fact that expense ratios and Management Rates generally increase as assets decline and decrease as assets grow, the Board believed the independent analysis conducted by Broadridge to be an appropriate measure of comparative fees and expenses. The Broadridge Management Rate includes administrative charges,
and the actual total expense ratio, for comparative consistency, was shown for Class A shares for funds with multiple classes of shares. The Board received a description of the methodology used by Broadridge to select the mutual funds included in an Expense Group.
The Expense Group for the Fund included the Fund and six other global income funds. The Board noted that the Management Rate for the Fund was above the median of its Expense Group, but its actual total expense ratio was below the median and in the first quintile of its Expense Group. The Board concluded that the Management Rate charged to the Fund is fair and reasonable. In doing so, the Board noted that the Fund’s actual total expense ratio reflected a fee waiver from management and that the Board had approved the Liquidation.
Profitability
The Board reviewed and considered information regarding the profits realized by the Manager and its affiliates in connection with the operation of the Fund. In this respect, the Board considered the Fund profitability analysis provided by the Manager that addresses the overall profitability of FTI’s U.S. fund business, as well as its profits in providing investment management and other services to each of the individual funds during the 12-month period ended September 30, 2016, being the most recent fiscal year-end for FRI. The Board noted that although management continually makes refinements to its methodologies used in calculating profitability in response to organizational and product related changes, the overall methodology has remained consistent with that used in the Fund’s profitability report presentations from prior years. Additionally, the Fund’s independent registered public accounting firm has been engaged by the Manager to periodically review the reasonableness of the allocation methodologies to be used solely by the Fund’s Board with respect to the profitability analysis.
The Board noted management’s belief that costs incurred in establishing the infrastructure necessary for the type of mutual fund operations conducted by the Manager and its affiliates may not be fully reflected in the expenses allocated to the Fund in determining its profitability, as well as the fact that the level of profits, to a certain extent, reflected operational cost savings and efficiencies initiated by management. The Board also noted management’s expenditures in improving shareholder services provided to the Fund, as well as the need to implement systems and meet additional regulatory and compliance requirements resulting from recent SEC and other regulatory requirements.
40 | Annual Report | franklintempleton.com | ||
FRANKLIN STRATEGIC SERIES
FRANKLIN GLOBAL GOVERNMENT BOND FUND
SHAREHOLDER INFORMATION
The Board also considered the extent to which the Manager and its affiliates might derive ancillary benefits from fund operations, including revenues generated from transfer agent services, potential benefits resulting from personnel and systems enhancements necessitated by fund growth, as well as increased leverage with service providers and counterparties. Based upon its consideration of all these factors, the Board concluded that the level of profits realized by the Manager and its affiliates from providing services to the Fund was not excessive in view of the nature, quality and extent of services provided to the Fund.
Economies of Scale
The Board reviewed and considered the extent to which the Manager may realize economies of scale, if any, as the Fund grows larger and whether the Fund’s management fee structure reflects any economies of scale for the benefit of shareholders. With respect to possible economies of scale, the Board noted the existence of management fee breakpoints, which operate generally to share any economies of scale with a Fund’s shareholders by reducing the Fund’s effective management fees as the Fund grows in size. The Board considered the Manager’s view that any analyses of potential economies of scale in managing a particular fund are inherently limited in light of the joint and common costs and investments the Manager incurs across the Franklin Templeton family of funds as a whole. The Board concluded that the Fund is not expected to experience economies of scale prior to Liquidation.
Conclusion
Based on its review, consideration and evaluation of all factors it believed relevant, including the above-described factors and conclusions, the Board unanimously approved the continuation of the Management Agreement for the shorter of an additional one-year period or the date on which the Fund is liquidated.
Proxy Voting Policies and Procedures
The Fund’s investment manager has established Proxy Voting Policies and Procedures (Policies) that the Fund uses to determine how to vote proxies relating to portfolio securities. Shareholders may view the Fund’s complete Policies online at franklintempleton.com. Alternatively, shareholders may request copies of the Policies free of charge by calling the Proxy Group collect at (954) 527-7678 or by sending a written request to: Franklin Templeton Companies, LLC, 300 S.E. 2nd Street, Fort Lauderdale, FL 33301, Attention: Proxy Group. Copies of the Fund’s proxy voting records are also made available online at franklintempleton.com and posted on the U.S. Securities and
Exchange Commission’s website at sec.gov and reflect the most recent 12-month period ended June 30.
Quarterly Statement of Investments
The Trust, on behalf of the Fund, files a complete statement of investments with the U.S. Securities and Exchange Commission for the first and third quarters for each fiscal year on Form N-Q. Shareholders may view the filed Form N-Q by visiting the Commission’s website at sec.gov. The filed form may also be viewed and copied at the Commission’s Public Reference Room in Washington, DC. Information regarding the operations of the Public Reference Room may be obtained by calling (800) SEC-0330.
Householding of Reports and Prospectuses
You will receive the Fund’s financial reports every six months as well as an annual updated summary prospectus (prospectus available upon request). To reduce Fund expenses, we try to identify related shareholders in a household and send only one copy of the financial reports and summary prospectus. This process, called “householding,” will continue indefinitely unless you instruct us otherwise. If you prefer not to have these documents householded, please call us at (800) 632-2301. At any time you may view current prospectuses/summary prospectuses and financial reports on our website. If you choose, you may receive these documents through electronic delivery.
franklintempleton.com | Annual Report | 41 | ||
This page intentionally left blank.
This page intentionally left blank.
This page intentionally left blank.
 | Annual Report and Shareholder Letter | |
| Franklin Global Government Bond Fund | ||
Investment Manager | ||
| Franklin Templeton Investment Management Limited | ||
Distributor | ||
| Franklin Templeton Distributors, Inc. | ||
(800) DIAL BEN® / 342-5236 franklintempleton.com | ||
Shareholder Services | ||
| (800) 632-2301 | ||
Authorized for distribution only when accompanied or preceded by a summary prospectus and/or prospectus. Investors should carefully consider a fund’s investment goals, risks, charges and expenses before investing. A prospectus contains this and other information; please read it carefully before investing.
To help ensure we provide you with quality service, all calls to and from our service areas are monitored and/or recorded.
| © 2017 Franklin Templeton Investments. All rights reserved. | 058 A 06/17 |
Item 2. Code of Ethics.
(a) The Registrant has adopted a code of ethics that applies to its principal executive officers and principal financial and accounting officer.
| (c) | N/A |
| (d) | N/A |
(f) Pursuant to Item 12(a)(1), the Registrant is attaching as an exhibit a copy of its code of ethics that applies to its principal executive officers and principal financial and accounting officer.
Item 3. Audit Committee Financial Expert.
(a) (1) The Registrant has an audit committee financial expert serving on its audit committee.
(2) The audit committee financial expert is John B. Wilson and he is “independent” as defined under the relevant Securities and Exchange Commission Rules and Releases.
Item 4. Principal Accountant Fees and Services.
(a) Audit Fees
The aggregate fees paid to the principal accountant for professional services rendered by the principal accountant for the audit of the registrant’s annual financial statements or for services that are normally provided by the principal accountant in connection with statutory and regulatory filings or engagements were $436,510 for the fiscal year ended April 30, 2017 and $469,079 for the fiscal year ended April 30, 2016.
(b) Audit-Related Fees
There were no fees paid to the principal accountant for assurance and related services rendered by the principal accountant to the registrant that are reasonably related to the performance of the audit of the registrant’s financial statements and are not reported under paragraph (a) of Item 4.
There were no fees paid to the principal accountant for assurance and related services rendered by the principal accountant to the registrant’s investment adviser and any entity controlling, controlled by or under common control with the investment adviser that provides ongoing services to the registrant that are reasonably related to the performance of the audit of their financial statements.
(c) Tax Fees
There were no fees paid to the principal accountant for professional services rendered by the principal accountant to the registrant for tax compliance, tax advice and tax planning.
There were no fees paid to the principal accountant for professional services rendered by the principal accountant to the registrant’s investment adviser and any entity controlling, controlled by or under common control with the investment adviser that provides ongoing services to the registrant for tax compliance, tax advice and tax planning.
(d) All Other Fees
The aggregate fees paid to the principal accountant for products and services rendered by the principal accountant to the registrant not reported in paragraphs (a)-(c) of Item 4 were $0 for the fiscal year ended April 30, 2017 and $6,913 for the fiscal year ended April 30, 2016. The services for which these fees were paid include review of materials provided to the fund Board in connection with the investment management contract renewal process.
The aggregate fees paid to the principal accountant for products and services rendered by the principal accountant to the registrant’s investment adviser and any entity controlling, controlled by or under common control with the investment adviser that provides ongoing services to the registrant other than services reported in paragraphs (a)-(c) of Item 4 were $258,717 for the fiscal year ended April 30, 2017 and $676,383 for the fiscal year ended April 30, 2016. The services for which these fees were paid included preparation and review of materials provided to the fund Board in connection with the investment management contract renewal process and derivatives assessment, and the review of system processes related to fixed income securities. Other services include compliance examination for Investment Advisor Act rule 204-2 and 206-4(2).
(e) (1) The registrant’s audit committee is directly responsible for approving the services to be provided by the auditors, including:
(i) pre-approval of all audit and audit related services;
(ii) pre-approval of all non-audit related services to be provided to the Fund by the auditors;
(iii) pre-approval of all non-audit related services to be provided to the registrant by the auditors to the registrant’s investment adviser or to any entity that controls, is controlled by or is under common control with the registrant’s investment adviser and that provides ongoing services to the registrant where the non-audit services relate directly to the operations or financial reporting of the registrant; and
(iv) establishment by the audit committee, if deemed necessary or appropriate, as an alternative to committee pre-approval of services to be provided by the auditors, as required by paragraphs (ii) and (iii) above, of policies and procedures to permit such services to be pre-approved by other means, such as through establishment of guidelines or by action of a designated member or members of the committee; provided the policies and procedures are detailed as to the particular service and the committee is informed of each service and such policies and procedures do not include delegation of audit committee responsibilities, as contemplated under the Securities Exchange Act of 1934, to management; subject, in the case of (ii) through (iv), to any waivers, exceptions or exemptions that may be available under applicable law or rules.
(e) (2) None of the services provided to the registrant described in paragraphs (b)-(d) of Item 4 were approved by the audit committee pursuant to paragraph (c)(7)(i)(C) of Rule 2-01 of regulation S-X.
| (f) | No disclosures are required by this Item 4(f). |
(g) The aggregate non-audit fees paid to the principal accountant for services rendered by the principal accountant to the registrant and the registrant’s investment adviser and any entity controlling, controlled by or under common control with the investment adviser that provides ongoing services to the registrant were $258,717 for the fiscal year ended April 30, 2017 and $683,296 for the fiscal year ended April 30, 2016.
(h) The registrant’s audit committee of the board has considered whether the provision of non-audit services that were rendered to the registrant’s investment adviser (not including any sub-adviser whose role is primarily portfolio management and is subcontracted with or overseen by another investment adviser), and any entity controlling, controlled by, or under common control with the investment adviser that provides ongoing services to the registrant that were not pre-approved pursuant to paragraph (c)(7)(ii) of Rule 2-01 of Regulation S-X is compatible with maintaining the principal accountant’s independence.
Item 5. Audit Committee of Listed Registrants. N/A
Item 6. Schedule of Investments. N/A
Item 7. Disclosure of Proxy Voting Policies and Procedures for Closed-End Management Investment Companies. N/A
Item 8. Portfolio Managers of Closed-End Management Investment Companies. N/A
Item 9. Purchases of Equity Securities by Closed-End Management Investment Company and Affiliated Purchasers. N/A
Item 10. Submission of Matters to a Vote of Security Holders.
There have been no changes to the procedures by which shareholders may recommend nominees to the Registrant’s Board of Trustees that would require disclosure herein.
Item 11. Controls and Procedures.
(a) Evaluation of Disclosure Controls and Procedures. The Registrant maintains disclosure controls and procedures that are designed to ensure that information required to be disclosed in the Registrant’s filings under the Securities Exchange Act of 1934 and the Investment Company Act of 1940 is recorded, processed, summarized and reported within the periods specified in the rules and forms of the Securities and Exchange Commission. Such information is accumulated and communicated to the Registrant’s management, including its principal executive officer and principal financial officer, as appropriate, to allow timely decisions regarding required disclosure. The Registrant’s management, including the principal executive officer and the principal financial officer, recognizes that any set of controls and procedures, no matter how well designed and operated, can provide only reasonable assurance of achieving the desired control objectives.
Within 90 days prior to the filing date of this Shareholder Report on Form N-CSR, the Registrant had carried out an evaluation, under the supervision and with the participation of the Registrant’s management, including the Registrant’s principal executive officer and the Registrant’s principal financial officer, of the effectiveness of the design and operation of the Registrant’s disclosure controls and procedures. Based on such evaluation, the Registrant’s principal executive officer and principal financial officer concluded that the Registrant’s disclosure controls and procedures are effective.
(b) Changes in Internal Controls. There have been no changes in the Registrant’s internal controls or in other factors that could materially affect the internal controls over financial reporting subsequent to the date of their evaluation in connection with the preparation of this Shareholder Report on Form N-CSR.
Item 12. Exhibits.
(a) (1) Code of Ethics
(a) (2) Certifications pursuant to Section 302 of the Sarbanes-Oxley Act of 2002 of Matthew T. Hinkle, Chief Executive Officer - Finance and Administration, and Gaston Gardey, Chief Financial Officer and Chief Accounting Officer
(b) Certifications pursuant to Section 906 of the Sarbanes-Oxley Act of 2002 of Matthew T. Hinkle, Chief Executive Officer - Finance and Administration, and Gaston Gardey, Chief Financial Officer and Chief Accounting Officer
SIGNATURES
Pursuant to the requirements of the Securities Exchange Act of 1934 and the Investment Company Act of 1940, the registrant has duly caused this report to be signed on its behalf by the undersigned, thereunto duly authorized.
FRANKLIN STRATEGIC SERIES
| By | /S/ MATTHEW T. HINKLE | |
| Matthew T. Hinkle | ||
| Chief Executive Officer – | ||
| Finance and Administration | ||
| Date | June 26, 2017 | |
Pursuant to the requirements of the Securities Exchange Act of 1934 and the Investment Company Act of 1940, this report has been signed below by the following persons on behalf of the registrant and in the capacities and on the dates indicated.
| By | /S/ MATTHEW T. HINKLE | |
| Matthew T. Hinkle | ||
| Chief Executive Officer – | ||
| Finance and Administration | ||
| Date | June 26, 2017 | |
| By | /S/ GASTON GARDEY | |
| Gaston Gardey | ||
| Chief Financial Officer and | ||
| Chief Accounting Officer | ||
| Date | June 26, 2017 | |