UNITED STATES
SECURITIES AND EXCHANGE COMMISSION
Washington, DC 20549
FORM N-CSR
CERTIFIED SHAREHOLDER REPORT OF REGISTERED MANAGEMENT INVESTMENT COMPANIES
Investment Company Act file number 811-06243
Franklin Strategic Series
(Exact name of registrant as specified in charter)
_One Franklin Parkway, San Mateo, Ca 94403-1906
(Address of principal executive offices) (Zip code)
_Craig S. Tyle, One Franklin Parkway, San Mateo, CA 94403-1906
(Name and address of agent for service)
Registrant's telephone number, including area code: 650 312-2000
Date of fiscal year end: 4/30
Date of reporting period: 4/30/16
Item 1. Reports to Stockholders.
| Contents | |
| Annual Report | |
| Economic and Market Overview | 3 |
| Franklin Flex Cap Growth Fund | 4 |
| Franklin Focused Core Equity Fund | 14 |
| Franklin Growth Opportunities Fund | 24 |
| Franklin Small Cap Growth Fund | 34 |
| Franklin Small-Mid Cap Growth Fund | 44 |
| Financial Highlights and Statements of Investments | 54 |
| Financial Statements | 95 |
| Notes to Financial Statements | 104 |
| Report of Independent Registered | |
| Public Accounting Firm | 121 |
| Tax Information | 122 |
| Board Members and Officers | 123 |
| Shareholder Information | 128 |
Visit franklintempleton.com for fund updates, to access your account, or to find helpful financial planning tools.
2 Annual Report
franklintempleton.com
Annual Report
Economic and Market Overview
The U.S. economy moderated during the 12 months under review. After strengthening in 2015’s second quarter, the economy moderated in the third and fourth quarters. Growth slowed further in 2016’s first quarter as exports, business investment and federal government spending declined. The manufacturing sector expanded in March and April after contracting for five consecutive months, while the services sector expanded throughout the 12-month period. Growth in services contributed to new jobs and helped the unemployment rate decrease from 5.4% in April 2015 to 5.0% at period-end.1 Home sales and prices rose amid relatively low mortgage rates. Monthly retail sales grew during most of the review period and rose to the highest level in April in more than a year, driven mainly by automobile sales. Inflation, as measured by the Consumer Price Index, remained relatively subdued due to low energy prices.
After maintaining a near-zero interest rate for seven years to support the U.S. economy’s recovery, the U.S. Federal Reserve (Fed) raised its target range for the federal funds rate to 0.25%–0.50% at its December meeting. At the time of the increase, policymakers cited the labor market’s considerable improvement and were reasonably confident that inflation would move back to the Fed’s 2.00% medium-term objective. The Fed maintained the rate through period-end, indicating it would monitor domestic and global developments and their implications on the labor markets as it tracks actual and expected progression toward its employment and inflation goals.
U.S. stock markets experienced sell-offs during the period under review, resulting from investor concerns about the timing of the Fed’s interest rate increases, global economic growth, China’s slowing economy and tumbling stock market, geopolitical tensions in certain regions and a plunge in crude oil prices. Investors generally remained confident, however, as the Fed remained cautious about further interest rate increases, the euro-zone economy improved, the European Central Bank expanded its quantitative easing measures and cut its benchmark interest rate to zero, the People’s Bank of China introduced further easing measures, and the Bank of Japan adopted a negative interest rate policy. The rally in crude oil prices toward period-end also boosted investor sentiment. Despite periods of volatility, the broad U.S. stock market ended the 12-month period relatively flat, as measured by the Standard & Poor’s 500 Index. Large capitalization growth stocks also ended the period relatively flat, as measured by the Russell 1000® Growth Index, while small capitalization growth stocks registered a loss, as measured by the Russell 2000® Growth Index.
The foregoing information reflects our analysis and opinions as of April 30, 2016. The information is not a complete analysis of every aspect of any market, country, industry, security or fund. Statements of fact are from sources considered reliable.
1. Source: Bureau of Labor Statistics.
Russell Investment Group is the source and owner of the trademarks, service marks and copyrights related to the Russell Indexes. Russell® is a trademark of Russell
Investment Group.
franklintempleton.com
Annual Report
3
Franklin Flex Cap Growth Fund
This annual report for Franklin Flex Cap Growth Fund covers the fiscal year ended April 30, 2016. Effective at the close of market on April 25, 2016, the Fund closed to all new investors with limited exceptions. As previously communicated, if the reorganization of the Fund with and into Franklin Growth Opportunities Fund is approved by shareholders at a meeting expected to be held on or about August 5, 2016, the Fund is expected to close to all additional purchases on or about August 19, 2016, shortly before the completion of the transaction on or about August 26, 2016.
Your Fund’s Goal and Main Investments
The Fund seeks capital appreciation. The Fund normally invests predominantly in equity securities of companies that the manager believes have the potential for capital appreciation. The Fund has flexibility to invest in companies located, headquartered or operating inside and outside the U.S., across the entire market capitalization spectrum from small, emerging growth companies to well-established, large cap companies.
Performance Overview
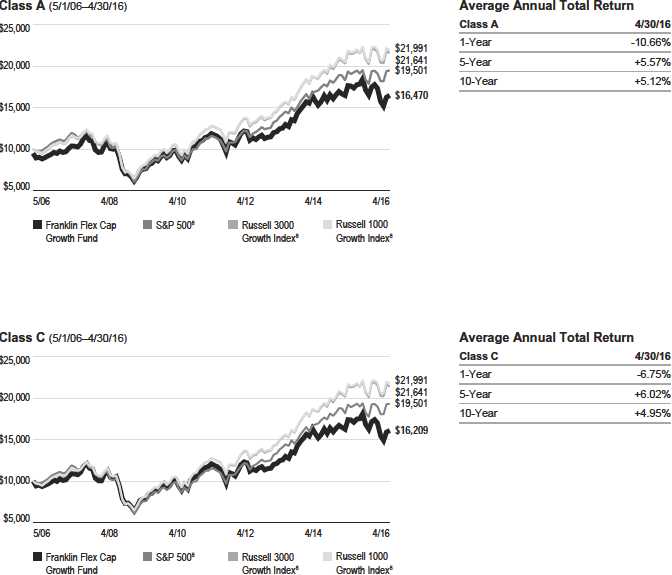
For the 12 months under review, the Fund’s Class A shares had a -5.20% cumulative total return. In comparison, the Fund’s narrow benchmark, the Russell 3000® Growth Index, which measures performance of Russell 3000® Index companies with higher price-to-book ratios and higher forecasted growth values, generated a +0.32% total return.1 Also in comparison, the Russell 1000® Growth Index, which tracks performance of the largest companies in the Russell 3000® Index with higher price-to-book ratios and higher forecasted growth values, produced a +1.07% total return.1 Additionally, the Fund’s broad benchmark, the Standard & Poor’s 500 Index (S&P 500®), which tracks the broad U.S. stock market, posted a +1.21% total return.1 You can find the Fund’s long-term performance data in the Performance Summary beginning on page 7.
Performance data represent past performance, which does not guarantee future results. Investment return and principal value will fluctuate, and you may have a gain or loss when you sell your shares. Current performance may differ from figures shown. For most recent performance, go to franklintempleton.com or call (800) 342-5236.
1. Source: Morningstar.
The indexes are unmanaged and include reinvestment of any income or distributions. They do not reflect any fees, expenses or sales charges. One cannot invest directly in an
index, and an index is not representative of the Fund’s portfolio.
The dollar value, number of shares or principal amount, and names of all portfolio holdings are listed in the Fund’s Statement of Investments (SOI). The SOI
begins on page 59.
4 Annual Report
franklintempleton.com
FRANKLIN FLEX CAP GROWTH FUND
| Top 10 Holdings | ||
| 4/30/16 | ||
| Company | % of Total | |
| Sector/Industry | Net Assets | |
| Facebook Inc. | 5.0 | % |
| Internet Software & Services | ||
| Alphabet Inc. | 3.6 | % |
| Internet Software & Services | ||
| Amazon.com Inc. | 3.6 | % |
| Internet & Catalog Retail | ||
| MasterCard Inc. | 3.3 | % |
| IT Services | ||
| Celgene Corp. | 2.7 | % |
| Biotechnology | ||
| Constellation Brands Inc. | 2.4 | % |
| Beverages | ||
| NXP Semiconductors NV (Netherlands) | 2.4 | % |
| Semiconductors & Semiconductor Equipment | ||
| Fortune Brands Home & Security Inc. | 2.4 | % |
| Building Products | ||
| HD Supply Holdings Inc. | 2.3 | % |
| Trading Companies & Distributors | ||
| ServiceNow Inc. | 2.3 | % |
| Software |
Investment Strategy
We use fundamental, bottom-up research to seek companies meeting our criteria of growth potential, quality and valuation. In seeking sustainable growth characteristics, we look for companies we believe can produce sustainable earnings and cash flow growth, evaluating the long-term market opportunity and competitive structure of an industry to target leaders and emerging leaders. We define quality companies as those with strong and improving competitive positions in attractive markets. We also believe important attributes of quality are experienced and talented management teams as well as financial strength reflected in the capital structure, gross and operating margins, free cash flow generation and returns on capital employed. Our valuation analysis includes a range of potential outcomes based on an assessment of multiple scenarios. In assessing value, we consider whether security prices fully reflect the balance of the sustainable growth opportunities relative to business and financial risks.
Manager’s Discussion
During the 12 months under review, key contributors to the Fund’s performance relative to the Russell 3000® Growth Index included an underweighting and stock selection in the energy sector, as well as stock selection in the materials and consumer discretionary sectors.2
In energy, independent oil and gas company Cabot Oil & Gas performed well over the past year due to its low-cost natural gas assets in the Marcellus Shale, which helped the company maintain a strong balance sheet amid lower natural gas prices.3 The company was also able to raise funds in early 2016, which helped fortify its balance sheet and future pipeline spending in 2017 and beyond. Cabot’s position at the low end of the natural gas cost curve has made it attractive to many investors who believe that the company could potentially weather lower natural gas prices for a longer time and still be able to generate profits at lower price levels, compared with its higher cost peers.
In the materials sector, specialty materials and chemicals company Cytec Industries contributed to relative returns.4 Cytec’s shares performed well due to an announced acquisition of the company by Belgium-based Solvay at a premium to Cytec’s share price. The acquisition was completed in December 2015.
Among consumer discretionary holdings, online retail shopping services provider Amazon.com and footwear, apparel and equipment manufacturer NIKE contributed to relative results. Amazon.com experienced a substantial increase in its operating income during the period, driven by the company’s retail and cloud computing businesses. NIKE has continued to grow, despite its large size, as it increased market share in existing markets, while increasing the categories and markets in which it has products. The company has benefited from the rising participation in sports as the middle class continues to grow in China and other emerging markets. In developed markets, there has been a shift in trends to wearing more athletic apparel and footwear, referred to as “athleisure.” NIKE’s scale and innovative manufacturing techniques continued to drive profit margins higher, further improving earnings growth.
Elsewhere, Facebook contributed to performance. The social media network delivered strong fourth quarter 2015 results that exceeded analysts’ expectations. Advertising revenue accelerated based on Facebook’s successful strategy for capitalizing on the consumer shift from personal computers to mobile devices, leading the company to generate a substantial portion of its revenue from mobile advertising. Additionally, the company benefited from a highly engaged user base with strong data, targeting and measurement capabilities, which prompted
2. The energy sector comprises oil, gas and consumable fuels in the SOI. The materials sector comprises chemicals in the SOI. The consumer discretionary sector comprises
automobiles; hotels, restaurants and leisure; household durables; Internet and catalog retail; media; specialty retail; and textiles, apparel and luxury goods in the SOI.
3. New holding this period.
4. No longer held at period-end.
franklintempleton.com
Annual Report
5
FRANKLIN FLEX CAP GROWTH FUND
advertisers to continue to shift more of their budgets toward Facebook advertising. Constellation Brands also helped the Fund’s performance. The company is the industry leader in the Mexican beer market. It has significant growth opportunities, in our view, including expanding into underpenetrated can and draft packaging formats, and increasing its distribution points in the convenience-store channel. In addition, Constellation has benefited from U.S. demographic trends.
In contrast, key detractors from the Fund’s relative performance during the reporting period included stock selection in the health care and financials sectors, as well as stock selection and an overweighting in the information technology (IT) sector.5
In health care, our positions in multinational specialty pharmaceutical company Valeant Pharmaceuticals International,4,6 health care services provider Envision Healthcare Holdings and drug distribution company McKesson hurt relative performance. Valeant’s shares came under pressure when the company had to delay filing its annual report with the U.S. Securities and Exchange Commission, which was eventually filed near period-end. Envision experienced a share price decline due to lower-than-expected revenues, which dampened investor confidence. McKesson’s share price declined due to concerns about the profitability of drug distributors in a deflationary generic drug environment, as well as some company-specific issues such as loss of clients resulting from mergers and acquisitions.
Our holding in asset management company Affiliated Managers Group detracted from relative performance in the financials sector. For much of the reporting period, the company experienced weaker investment flows and lower performance fees, although the company’s stock has rebounded in 2016’s first four months amid improving inflows.
In the IT sector, our position in LinkedIn hindered results. Shares of the business-oriented social networking services firm suffered from a disappointing 2016 preliminary outlook that indicated a more rapid deceleration in growth and lower profitability than many investors expected.
Elsewhere, our holding in Spirit Airlines hindered relative results. The company’s shares suffered as fares across the airline industry generally fell in 2015. Despite recent fare increases, many airlines delivered record profits as fuel prices declined. However, investors seemed concerned that airlines will not be able to increase fares further if fuel prices rise.
Thank you for your participation in Franklin Flex Cap Growth Fund. It has been our pleasure serving your investment needs.

The foregoing information reflects our analysis, opinions and portfolio holdings as of April 30, 2016, the end of the reporting period. The way we implement our main investment strategies and the resulting portfolio holdings may change depending on factors such as market and economic conditions. These opinions may not be relied upon as investment advice or an offer for a particular security. The information is not a complete analysis of every aspect of any market, country, industry, security or the Fund. Statements of fact are from sources considered reliable, but the investment manager makes no representation or warranty as to their completeness or accuracy. Although historical performance is no guarantee of future results, these insights may help you understand our investment management philosophy.
5. The health care sector comprises biotechnology, health care equipment and supplies, health care equipment and supplies, health care providers and services, health care
technology, life sciences tools and services, and pharmaceuticals in the SOI. The financials sector comprises banks, capital markets, consumer finance, diversified financial
services and real estate investment trusts in the SOI. The IT sector comprises communications equipment; Internet software and services; IT services; semiconductors and
semiconductor equipment; software; and technology hardware, storage and peripherals in the SOI.
6. Not part of the index.
See www.franklintempletondatasources.com for additional data provider information.
CFA® is a trademark owned by CFA Institute.
6 Annual Report
franklintempleton.com
FRANKLIN FLEX CAP GROWTH FUND
Performance Summary as of April 30, 2016
Your dividend income will vary depending on dividends or interest paid by securities in the Fund’s portfolio, adjusted for operating expenses of each class. Capital gain distributions are net profits realized from the sale of portfolio securities. The performance table and graphs do not reflect any taxes that a shareholder would pay on Fund dividends, capital gain distributions, if any, or any realized gains on the sale of Fund shares. Total return reflects reinvestment of the Fund’s dividends and capital gain distributions, if any, and any unrealized gains or losses.
| Net Asset Value | ||||||
| Share Class (Symbol) | 4/30/16 | 4/30/15 | Change | |||
| A (FKCGX) | $ | 43.03 | $ | 51.56 | -$ | 8.53 |
| C (FCIIX) | $ | 34.70 | $ | 43.10 | -$ | 8.40 |
| R (FRCGX) | $ | 40.69 | $ | 49.22 | -$ | 8.53 |
| R6 (FFCRX) | $ | 45.26 | $ | 53.67 | -$ | 8.41 |
| Advisor (FKCAX) | $ | 44.88 | $ | 53.38 | -$ | 8.50 |
| Distributions1 (5/1/15–4/30/16) | ||
| Long-Term | ||
| Share Class | Capital Gain | |
| A | $ | 6.1380 |
| C | $ | 6.1380 |
| R | $ | 6.1380 |
| R6 | $ | 6.1380 |
| Advisor | $ | 6.1380 |
franklintempleton.com
Annual Report
7
FRANKLIN FLEX CAP GROWTH FUND
PERFORMANCE SUMMARY
Performance as of 4/30/162
Cumulative total return excludes sales charges. Average annual total returns and value of $10,000 investment include maximum sales charges. Class A: 5.75% maximum initial sales charge; Class C: 1% contingent deferred sales charge in first year only;
Class R/R6/Advisor Class: no sales charges.
| Average Annual | ||||||||||
| Cumulative | Average Annual | Value of $10,000 | Total Return | Total Annual | ||||||
| Share Class | Total Return3 | Total Return4 | Investment5 | (3/31/16 | )6 | Operating Expenses7 | ||||
| A | 0.94 | % | ||||||||
| 1-Year | -5.20 | % | -10.66 | % | $ | 8,934 | -13.15 | % | ||
| 5-Year | +39.12 | % | +5.57 | % | $ | 13,112 | +5.92 | % | ||
| 10-Year | +74.75 | % | +5.12 | % | $ | 16,470 | +4.92 | % | ||
| C | 1.69 | % | ||||||||
| 1-Year | -5.94 | % | -6.75 | % | $ | 9,325 | -9.34 | % | ||
| 5-Year | +33.96 | % | +6.02 | % | $ | 13,396 | +6.37 | % | ||
| 10-Year | +62.09 | % | +4.95 | % | $ | 16,209 | +4.76 | % | ||
| R | 1.19 | % | ||||||||
| 1-Year | -5.46 | % | -5.46 | % | $ | 9,454 | -8.08 | % | ||
| 5-Year | +37.35 | % | +6.55 | % | $ | 13,735 | +6.91 | % | ||
| 10-Year | +70.43 | % | +5.48 | % | $ | 17,043 | +5.28 | % | ||
| R6 | 0.48 | % | ||||||||
| 1-Year | -4.75 | % | -4.75 | % | $ | 9,525 | -7.43 | % | ||
| Since Inception (5/1/13) | +35.13 | % | +10.57 | % | $ | 13,513 | +10.34 | % | ||
| Advisor | 0.69 | % | ||||||||
| 1-Year | -4.96 | % | -4.96 | % | $ | 9,504 | -7.62 | % | ||
| 5-Year | +40.90 | % | +7.10 | % | $ | 14,090 | +7.45 | % | ||
| 10-Year | +79.23 | % | +6.01 | % | $ | 17,923 | +5.81 | % |
Performance data represent past performance, which does not guarantee future results. Investment return and principal value will fluctuate, and you may have a gain or loss when you sell your shares. Current performance may differ from figures shown. For most recent month-end performance, go to franklintempleton.com or call (800) 342-5236.
8 Annual Report
franklintempleton.com
FRANKLIN FLEX CAP GROWTH FUND
PERFORMANCE SUMMARY
Total Return Index Comparison for a Hypothetical $10,000 Investment2
Total return represents the change in value of an investment over the periods shown. It includes any applicable maximum sales charge, Fund expenses, account fees and reinvested distributions. The unmanaged indexes include reinvestment of any income or distributions. They differ from the Fund in composition and do not pay management fees or expenses. One cannot invest directly in an index.
franklintempleton.com
Annual Report
9
FRANKLIN FLEX CAP GROWTH FUND
PERFORMANCE SUMMARY
Total Return Index Comparison for a Hypothetical $10,000 Investment2 (continued)
10 Annual Report
franklintempleton.com

All investments involve risks, including possible loss of principal. Growth stock prices reflect projections of future earnings or revenues, and can, therefore, fall dramatically if the company fails to meet those projections. Smaller, midsized and relatively new or unseasoned companies can be particularly sensitive to changing economic conditions, and their prospects for growth are less certain than those of larger, more established companies. Historically, these securities have experienced more price volatility than larger company stocks, especially over the short term. To the extent the Fund focuses on particular countries, regions, industries, sectors or types of investment from time to time, it may be subject to greater risks of adverse developments in such areas of focus than a fund that invests in a wider variety of countries, regions, industries, sectors or investments. Foreign securities involve special risks, including currency fluctuations and economic and political uncertainties. The Fund is actively managed but there is no guarantee that the manager’s investment decisions will produce the desired results. The Fund’s prospectus also includes a description of the main investment risks.
| Class C: | These shares have higher annual fees and expenses than Class A shares. |
| Class R: | Shares are available to certain eligible investors as described in the prospectus. These shares have higher annual fees and expenses than Class A shares. |
| Class R6: | Shares are available to certain eligible investors as described in the prospectus. |
| Advisor Class: | Shares are available to certain eligible investors as described in the prospectus. |
1. The distribution amount is the sum of the dividend payments to shareholders for the period shown and includes only estimated tax-basis capital gain.
2. The Fund has a fee waiver associated with any investment in a Franklin Templeton money fund, contractually guaranteed through at least its current fiscal year-end. Fund
investment results reflect the fee waiver, to the extent applicable; without this reduction, the results would have been lower.
3. Cumulative total return represents the change in value of an investment over the periods indicated.
4. Average annual total return represents the average annual change in value of an investment over the periods indicated. Return for less than one year, if any, has not
been annualized.
5. These figures represent the value of a hypothetical $10,000 investment in the Fund over the periods indicated.
6. In accordance with SEC rules, we provide standardized average annual total return information through the latest calendar quarter.
7. Figures are as stated in the Fund’s current prospectus and may differ from the expense ratios disclosed in the Financial Highlights in this report. In periods of market vola-
tility, assets may decline significantly, causing total annual Fund operating expenses to become higher than the figures shown.
8. Source: Morningstar. The S&P 500 is a market capitalization-weighted index of 500 stocks designed to measure total U.S. equity market performance. The Russell 1000
Growth Index is market capitalization weighted and measures performance of those Russell 1000 Index companies with higher price-to-book ratios and higher forecasted
growth values. The Russell 3000 Growth Index is market capitalization weighted and measures performance of those Russell 3000 Index companies with higher price-to-book
ratios and higher forecasted growth values.
See www.franklintempletondatasources.com for additional data provider information.
franklintempleton.com
Annual Report
11
FRANKLIN FLEX CAP GROWTH FUND
Your Fund’s Expenses
As a Fund shareholder, you can incur two types of costs:
- Transaction costs, including sales charges (loads) on Fund purchases; and
- Ongoing Fund costs, including management fees, distribution and service (12b-1) fees, and other Fund expenses. All mutual funds have ongoing costs, sometimes referred to as operating expenses.
The following table shows ongoing costs of investing in the Fund and can help you understand these costs and compare them with those of other mutual funds. The table assumes a $1,000 investment held for the six months indicated.
Actual Fund Expenses
The first line (Actual) for each share class listed in the table provides actual account values and expenses. The “Ending Account Value” is derived from the Fund’s actual return, which includes the effect of Fund expenses.
You can estimate the expenses you paid during the period by following these steps. Of course, your account value and expenses will differ from those in this illustration:
1. Divide your account value by $1,000.
If an account had an $8,600 value, then $8,600 ÷ $1,000 = 8.6.
2. Multiply the result by the number under the heading “Expenses Paid During Period.”
If Expenses Paid During Period were $7.50, then 8.6 × $7.50 = $64.50.
In this illustration, the estimated expenses paid this period are $64.50.
Hypothetical Example for Comparison with Other Funds
Information in the second line (Hypothetical) for each class in the table can help you compare ongoing costs of investing in the Fund with those of other mutual funds. This information may not be used to estimate the actual ending account balance or expenses you paid during the period. The hypothetical “Ending Account Value” is based on the actual expense ratio for each class and an assumed 5% annual rate of return before expenses, which does not represent the Fund’s actual return. The figure under the heading “Expenses Paid During Period” shows the hypothetical expenses your account would have incurred under this scenario. You can compare this figure with the 5% hypothetical examples that appear in shareholder reports of other funds.
Please note that expenses shown in the table are meant to highlight ongoing costs and do not reflect any transaction costs, such as sales charges. Therefore, the second line for each class is useful in comparing ongoing costs only, and will not help you compare total costs of owning different funds. In addition, if transaction costs were included, your total costs would have been higher. Please refer to the Fund prospectus for additional information on operating expenses.
12 Annual Report
franklintempleton.com
FRANKLIN FLEX CAP GROWTH FUND
YOUR FUND’S EXPENSES
| Beginning Account | Ending Account | Expenses Paid During | ||||
| Share Class | Value 11/1/15 | Value 4/30/16 | Period* 11/1/15–4/30/16 | |||
| A | ||||||
| Actual | $ | 1,000 | $ | 940.70 | $ | 4.63 |
| Hypothetical (5% return before expenses) | $ | 1,000 | $ | 1,020.09 | $ | 4.82 |
| C | ||||||
| Actual | $ | 1,000 | $ | 936.70 | $ | 8.23 |
| Hypothetical (5% return before expenses) | $ | 1,000 | $ | 1,016.36 | $ | 8.57 |
| R | ||||||
| Actual | $ | 1,000 | $ | 939.30 | $ | 5.83 |
| Hypothetical (5% return before expenses) | $ | 1,000 | $ | 1,018.85 | $ | 6.07 |
| R6 | ||||||
| Actual | $ | 1,000 | $ | 943.00 | $ | 2.27 |
| Hypothetical (5% return before expenses) | $ | 1,000 | $ | 1,022.53 | $ | 2.36 |
| Advisor | ||||||
| Actual | $ | 1,000 | $ | 941.80 | $ | 3.43 |
| Hypothetical (5% return before expenses) | $ | 1,000 | $ | 1,021.33 | $ | 3.57 |
*Expenses are calculated using the most recent six-month expense ratio, net of expense waivers, annualized for each class (A: 0.96%;
C: 1.71%; R: 1.21%; R6: 0.47%; and Advisor: 0.71%), multiplied by the average account value over the period, multiplied by 182/366 to reflect
the one-half year period.
franklintempleton.com
Annual Report
13
Franklin Focused Core Equity Fund
This annual report for Franklin Focused Core Equity Fund covers the fiscal year ended April 30, 2016.
Your Fund’s Goal and Main Investments
The Fund seeks capital appreciation by normally investing at least 80% of its net assets in equity securities. The Fund normally invests primarily to predominantly in equity securities of large capitalization companies, which are similar in size to those in the Standard & Poor’s 500 Index (S&P 500).
Performance Overview
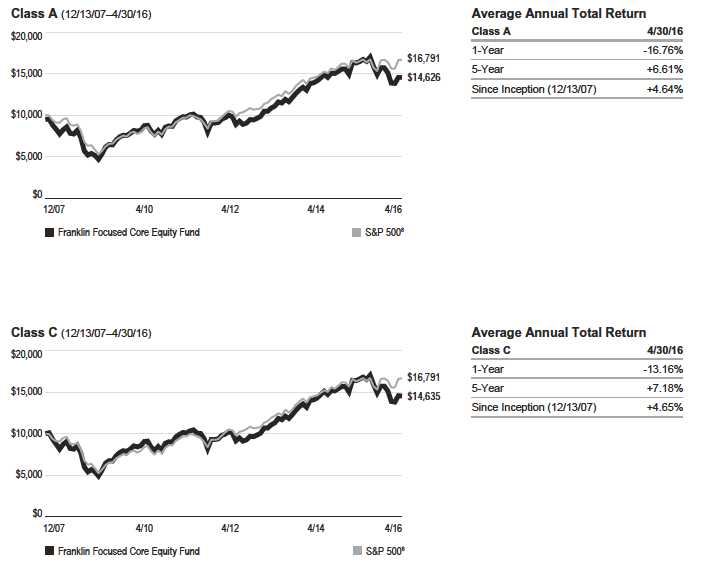
For the 12 months under review, the Fund’s Class A shares had a cumulative total return of -11.70%. In comparison, the S&P 500, which tracks the broad U.S. stock market, generated a +1.21% total return.1 You can find the Fund’s long-term performance data in the Performance Summary beginning on page 17.
Performance data represent past performance, which does not guarantee future results. Investment return and principal value will fluctuate, and you may have a gain or loss when you sell your shares. Current performance may differ from figures shown. For most recent performance data, go to franklintempleton.com or call (800) 342-5236.
Investment Strategy
We are research-driven, bottom-up, fundamental investors. Our investment approach is opportunistic and contrarian, and we seek to identify mispriced companies using fundamental analysis. We seek to take advantage of price dislocations that result from the market’s short-term focus. Our analysis includes the investigation of the valuation for each investment based upon the view that the price paid for the security is a critical factor determining long-term success. We rely on a team of analysts to help provide in-depth industry expertise and use both qualitative and quantitative analysis to evaluate companies. Our analysts identify each company’s market opportunity, competitive position, management and financial strength, business and financial risks, and valuation. We choose to invest in those companies that, in our opinion, offer the best trade-off between growth opportunity, business and financial risk, and valuation.
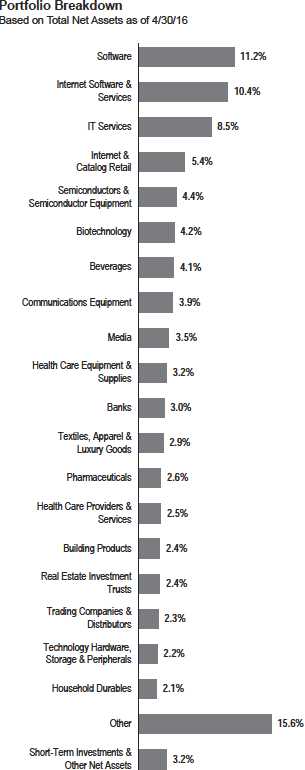
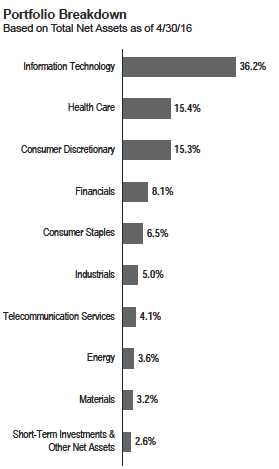
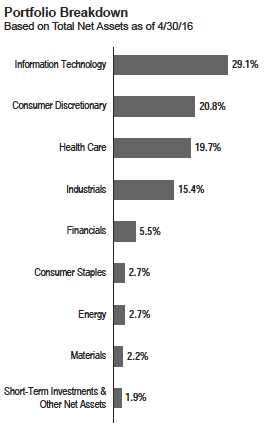
Portfolio Breakdown*
Based on Total Net Assets as of 4/30/16
*Figures are stated as a percentage of total and may not equal 100% or may be
negative due to rounding, use of any derivatives, unsettled trades or other factors.
Manager’s Discussion
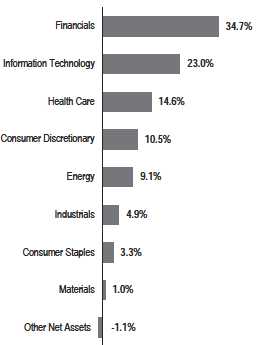
During the 12 months under review, key detractors from the Fund’s absolute performance included holdings in the health care, materials and consumer discretionary sectors.
In health care, our positions in multinational specialty pharmaceutical company Valeant Pharmaceuticals International and pharmaceutical firm Allergan hurt performance. Valeant’s shares came under pressure when the company had to delay filing its annual report with the U.S. Securities and Exchange Commission, which was eventually filed near period-end. Allergan’s share price fell following the termination of its merger with Pfizer after the U.S. Treasury Department placed constraints on tax inversions.
In the materials sector, our position in chemicals and building products manufacturer Axiall hindered results.2 The company’s earnings have been under pressure due to the significant drop in crude oil prices. Our holding in Netherlands-based
1. Source: Morningstar.
The index is unmanaged and includes reinvestment of any income or distributions. It does not reflect any fees, expenses or sales charges. One cannot invest directly in an
index, and an index is not representative of the Fund’s portfolio.
2. No longer held at period-end.
See www.franklintempletondatasources.com for additional data provider information.
The dollar value, number of shares or principal amount, and names of all portfolio holdings are listed in the Fund’s Statement of Investments (SOI). The SOI
begins on page 67.
14 Annual Report
franklintempleton.com
FRANKLIN FOCUSED CORE EQUITY FUND
| Top 10 Holdings | ||
| 4/30/16 | ||
| Company | % of Total | |
| Sector/Industry | Net Assets | |
| Allergan PLC | 5.7 | % |
| Health Care | ||
| Microsoft Corp. | 5.3 | % |
| Information Technology | ||
| Equinix Inc. | 4.8 | % |
| Financials | ||
| The Hartford Financial Services Group Inc. | 4.6 | % |
| Financials | ||
| Willis Towers Watson PLC | 4.4 | % |
| Financials | ||
| Twenty-First Century Fox Inc. | 3.9 | % |
| Consumer Discretionary | ||
| Alphabet Inc. | 3.8 | % |
| Information Technology | ||
| The Charles Schwab Corp. | 3.8 | % |
| Financials | ||
| QUALCOMM Inc. | 3.6 | % |
| Information Technology | ||
| Genesee & Wyoming Inc. | 3.6 | % |
| Industrials |
multinational cable and telecommunications company Altice detracted from the Fund’s returns in the consumer discretionary sector. Shares of Altice declined as the company’s French cable business and Portuguese telecommunications business faced increased competition, driving product pricing lower and increasing customer turnover. The company also has a highly leveraged balance sheet and, during the high-yield credit market’s weakness in the late summer and fall of 2015, the company’s stock faced pressure along with other highly leveraged companies.
Elsewhere, our position in LPL Financial Holdings hindered returns. The independent financial advisory firm was negatively affected by the Department of Labor’s revised fiduciary rule pertaining to clients’ retirement savings. The company also leveraged its balance sheet to buy back shares, leading to investor concerns about potential breaching of debt covenants. In addition, core fundamental trends, such as broker growth, client activity levels and net new asset generation, have weakened.
Conversely, contributors to the Fund’s absolute performance included holdings in the information technology (IT), industrials and consumer staples sectors.
In the IT sector, top contributors included Motorola Solutions and Alphabet. Motorola Solutions, a communications equipment company, performed well as company management has continued to cut costs and return capital to shareholders through share buybacks. The company recently acquired U.K.-based Airwaves, a public safety company, which we believe should contribute to Motorola’s earnings. Alphabet, the parent company of Internet-related services and products provider Google, performed well. This positive performance was based on acceleration in Google’s core advertising business, better cost controls and new policies that made the company friendlier toward its shareholders.
In the industrials sector, a notable contributor included security services firm ADT, which agreed to be acquired by private-equity firm Apollo Global Management. The acquisition was expected to be completed shortly after period-end. CVS Health, in the consumer staples sector, boosted results. During the reporting period, the company continued to successfully execute its strategy of combining its roles of pharmacy benefits manager and retail pharmacy. The strategy continued to resonate with clients, leading to market share gains and strong stock performance.
Elsewhere, our investment in Equinix aided results as the data center provider benefited from the rising adoption of cloud computing technology. The company also acquired data center and colocation center company TelecityGroup, which we believe could provide Equinix with a dominant position in the European market.
franklintempleton.com
Annual Report
15
FRANKLIN FOCUSED CORE EQUITY FUND
Thank you for your continued participation in Franklin Focused Core Equity Fund. We look forward to serving your future investment needs.

The foregoing information reflects our analysis, opinions and portfolio holdings as of April 30, 2016, the end of the reporting period. The way we implement our main investment strategies and the resulting portfolio holdings may change depending on factors such as market and economic conditions. These opinions may not be relied upon as investment advice or an offer for a particular security. The information is not a complete analysis of every aspect of any market, country, industry, security or the Fund. Statements of fact are from sources considered reliable, but the investment manager makes no representation or warranty as to their completeness or accuracy. Although historical performance is no guarantee of future results, these insights may help you understand our investment management philosophy.
16 Annual Report
franklintempleton.com
FRANKLIN FOCUSED CORE EQUITY FUND
Performance Summary as of April 30, 2016
Your dividend income will vary depending on dividends or interest paid by securities in the Fund’s portfolio, adjusted for operating expenses of each class. Capital gain distributions are net profits realized from the sale of portfolio securities. The performance table and graphs do not reflect any taxes that a shareholder would pay on Fund dividends, capital gain distributions, if any, or any realized gains on the sale of Fund shares. Total return reflects reinvestment of the Fund’s dividends and capital gain distributions, if any, and any unrealized gains or losses.
| Net Asset Value | ||||||||||
| Share Class (Symbol) | 4/30/16 | 4/30/15 | Change | |||||||
| A (FCEQX) | $ | 13.12 | $ | 15.29 | -$ | 2.17 | ||||
| C (FCEDX) | $ | 12.58 | $ | 14.73 | -$ | 2.15 | ||||
| R (FCERX) | $ | 12.98 | $ | 15.15 | -$ | 2.17 | ||||
| R6 (FEFCX) | $ | 13.27 | $ | 15.46 | -$ | 2.19 | ||||
| Advisor (FCEZX) | $ | 13.25 | $ | 15.44 | -$ | 2.19 | ||||
| Distributions1 (5/1/15–4/30/16) | ||||||||||
| Dividend | Short-Term | Long-Term | ||||||||
| Share Class | Income | Capital Gain | Capital Gain | Total | ||||||
| A | $ | 0.0561 | $ | 0.0856 | $ | 0.2634 | $ | 0.4051 | ||
| C | — | $ | 0.0856 | $ | 0.2634 | $ | 0.3490 | |||
| R | $ | 0.0390 | $ | 0.0856 | $ | 0.2634 | $ | 0.3880 | ||
| R6 | $ | 0.1053 | $ | 0.0856 | $ | 0.2634 | $ | 0.4543 | ||
| Advisor | $ | 0.0871 | $ | 0.0856 | $ | 0.2634 | $ | 0.4361 | ||
franklintempleton.com
Annual Report
17
FRANKLIN FOCUSED CORE EQUITY FUND
PERFORMANCE SUMMARY
Performance as of 4/30/162
Cumulative total return excludes sales charges. Average annual total returns and value of $10,000 investment include maximum sales charges. Class A: 5.75% maximum initial sales charge; Class C: 1% contingent deferred sales charge in first year only;
Class R/R6/Advisor Class: no sales charges.
| Average Annual | ||||||||||||
| Cumulative | Average Annual | Value of $10,000 | Total Return | Total Annual Operating Expenses7 | ||||||||
| Share Class | Total Return3 | Total Return4 | Investment5 | (3/31/16 | )6 | (with waiver) | (without waiver) | |||||
| A | 1.25 | % | 1.50 | % | ||||||||
| 1-Year | -11.70 | % | -16.76 | % | $ | 8,324 | -15.76 | % | ||||
| 5-Year | +46.08 | % | +6.61 | % | $ | 13,770 | +7.22 | % | ||||
| Since Inception (12/13/07) | +55.18 | % | +4.64 | % | $ | 14,626 | +4.70 | % | ||||
| C | 2.00 | % | 2.25 | % | ||||||||
| 1-Year | -12.31 | % | -13.16 | % | $ | 8,684 | -12.14 | % | ||||
| 5-Year | +41.42 | % | +7.18 | % | $ | 14,142 | +7.75 | % | ||||
| Since Inception (12/13/07) | +46.35 | % | +4.65 | % | $ | 14,635 | +4.71 | % | ||||
| R | 1.50 | % | 1.75 | % | ||||||||
| 1-Year | -11.91 | % | -11.91 | % | $ | 8,809 | -10.78 | % | ||||
| 5-Year | +44.75 | % | +7.68 | % | $ | 14,475 | +8.28 | % | ||||
| Since Inception (12/13/07) | +52.21 | % | +5.14 | % | $ | 15,221 | +5.21 | % | ||||
| R6 | 0.85 | % | 1.10 | % | ||||||||
| 1-Year | -11.32 | % | -11.32 | % | $ | 8,868 | -10.27 | % | ||||
| Since Inception (5/1/13) | +35.85 | % | +10.76 | % | $ | 13,585 | +11.08 | % | ||||
| Advisor | 1.00 | % | 1.25 | % | ||||||||
| 1-Year | -11.45 | % | -11.45 | % | $ | 8,855 | -10.34 | % | ||||
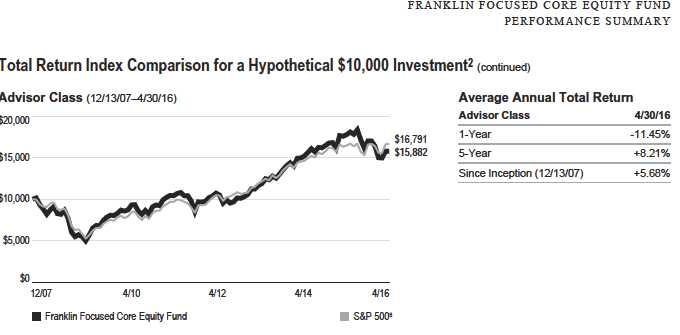
| 5-Year | +48.39 | % | +8.21 | % | $ | 14,839 | +8.80 | % | ||||
| Since Inception (12/13/07) | +58.82 | % | +5.68 | % | $ | 15,882 | +5.74 | % | ||||
Performance data represent past performance, which does not guarantee future results. Investment return and principal value will fluctuate, and you may have a gain or loss when you sell your shares. Current performance may differ from figures shown. For most recent month-end performance, go to franklintempleton.com or call (800) 342-5236.
18 Annual Report
franklintempleton.com
FRANKLIN FOCUSED CORE EQUITY FUND
PERFORMANCE SUMMARY
Total Return Index Comparison for a Hypothetical $10,000 Investment2
Total return represents the change in value of an investment over the periods shown. It includes any applicable maximum sales charge, Fund expenses, account fees and reinvested distributions. The unmanaged index includes reinvestment of any income or distributions. It differs from the Fund in composition and does not pay management fees or expenses. One cannot invest directly in an index.
franklintempleton.com
Annual Report
19
FRANKLIN FOCUSED CORE EQUITY FUND
PERFORMANCE SUMMARY
Total Return Index Comparison for a Hypothetical $10,000 Investment2 (continued)
20 Annual Report
franklintempleton.com
All investments involve risks, including possible loss of principal. To the extent the Fund focuses on particular countries, regions, industries, sectors or types of investment from time to time, it may be subject to greater risks of adverse developments in such areas of focus than a fund that invests in a wider variety of countries, regions, industries, sectors or investments. The Fund may have investments in both growth and value stocks, or in stocks with characteristics of both. Growth stock prices reflect projections of future earnings or revenues, and can, therefore, fall dramatically if the company fails to meet those projections. A value stock may not increase in price as anticipated by the investment manager if other investors fail to recognize the company’s value and bid up the price, the markets favor faster growing companies, or the factors that the investment manager believes will increase the price of the security do not occur. Foreign securities involve special risks, including currency fluctuations and economic and political uncertainties. The Fund is actively managed but there is no guarantee that the manager’s investment decisions will produce the desired results. The Fund’s prospectus also includes a description of the main investment risks.
| Class C: | These shares have higher annual fees and expenses than Class A shares. |
| Class R: | Shares are available to certain eligible investors as described in the prospectus. These shares have higher annual fees and expenses than Class A shares. |
| Class R6: | Shares are available to certain eligible investors as described in the prospectus. |
| Advisor Class: | Shares are available to certain eligible investors as described in the prospectus. |
1. The distribution amount is the sum of the dividend payments to shareholders for the period shown and includes only estimated tax-basis net investment income and
capital gain.
2. The Fund has an expense reduction contractually guaranteed through at least 8/31/16 and a fee waiver associated with any investment in a Franklin Templeton money fund,
contractually guaranteed through at least its current fiscal year-end. Fund investment results reflect the expense reduction and fee waiver, to the extent applicable; without
these reductions, the results would have been lower.
3. Cumulative total return represents the change in value of an investment over the periods indicated.
4. Average annual total return represents the average annual change in value of an investment over the periods indicated. Return for less than one year, if any, has not
been annualized.
5. These figures represent the value of a hypothetical $10,000 investment in the Fund over the periods indicated.
6. In accordance with SEC rules, we provide standardized average annual total return information through the latest calendar quarter.
7. Figures are as stated in the Fund’s current prospectus and may differ from the expense ratios disclosed in the Financial Highlights in this report. In periods of market vola-
tility, assets may decline significantly, causing total annual Fund operating expenses to become higher than the figures shown.
8. Source: Morningstar. The S&P 500 is a market capitalization-weighted index of 500 stocks designed to measure total U.S. equity market performance.
See www.franklintempletondatasources.com for additional data provider information.
franklintempleton.com
Annual Report
21
FRANKLIN FOCUSED CORE EQUITY FUND
Your Fund’s Expenses
As a Fund shareholder, you can incur two types of costs:
- Transaction costs, including sales charges (loads) on Fund purchases; and
- Ongoing Fund costs, including management fees, distribution and service (12b-1) fees, and other Fund expenses. All mutual funds have ongoing costs, sometimes referred to as operating expenses.
The following table shows ongoing costs of investing in the Fund and can help you understand these costs and compare them with those of other mutual funds. The table assumes a $1,000 investment held for the six months indicated.
Actual Fund Expenses
The first line (Actual) for each share class listed in the table provides actual account values and expenses. The “Ending Account Value” is derived from the Fund’s actual return, which includes the effect of Fund expenses.
You can estimate the expenses you paid during the period by following these steps. Of course, your account value and expenses will differ from those in this illustration:
1. Divide your account value by $1,000.
If an account had an $8,600 value, then $8,600 ÷ $1,000 = 8.6.
2. Multiply the result by the number under the heading “Expenses Paid During Period.”
If Expenses Paid During Period were $7.50, then 8.6 × $7.50 = $64.50.
In this illustration, the estimated expenses paid this period are $64.50.
Hypothetical Example for Comparison with Other Funds
Information in the second line (Hypothetical) for each class in the table can help you compare ongoing costs of investing in the Fund with those of other mutual funds. This information may not be used to estimate the actual ending account balance or expenses you paid during the period. The hypothetical “Ending Account Value” is based on the actual expense ratio for each class and an assumed 5% annual rate of return before expenses, which does not represent the Fund’s actual return. The figure under the heading “Expenses Paid During Period” shows the hypothetical expenses your account would have incurred under this scenario. You can compare this figure with the 5% hypothetical examples that appear in shareholder reports of other funds.
Please note that expenses shown in the table are meant to highlight ongoing costs and do not reflect any transaction costs, such as sales charges. Therefore, the second line for each class is useful in comparing ongoing costs only, and will not help you compare total costs of owning different funds. In addition, if transaction costs were included, your total costs would have been higher. Please refer to the Fund prospectus for additional information on operating expenses.
22 Annual Report
franklintempleton.com
FRANKLIN FOCUSED CORE EQUITY FUND
YOUR FUND’S EXPENSES
| Beginning Account | Ending Account | Expenses Paid During | ||||
| Share Class | Value 11/1/15 | Value 4/30/16 | Period* 11/1/15–4/30/16 | |||
| A | ||||||
| Actual | $ | 1,000 | $ | 926.70 | $ | 6.04 |
| Hypothetical (5% return before expenses) | $ | 1,000 | $ | 1,018.60 | $ | 6.32 |
| C | ||||||
| Actual | $ | 1,000 | $ | 923.30 | $ | 9.61 |
| Hypothetical (5% return before expenses) | $ | 1,000 | $ | 1,014.87 | $ | 10.07 |
| R | ||||||
| Actual | $ | 1,000 | $ | 925.40 | $ | 7.13 |
| Hypothetical (5% return before expenses) | $ | 1,000 | $ | 1,017.45 | $ | 7.47 |
| R6 | ||||||
| Actual | $ | 1,000 | $ | 928.90 | $ | 4.08 |
| Hypothetical (5% return before expenses) | $ | 1,000 | $ | 1,020.64 | $ | 4.27 |
| Advisor | ||||||
| Actual | $ | 1,000 | $ | 927.50 | $ | 4.84 |
| Hypothetical (5% return before expenses) | $ | 1,000 | $ | 1,019.84 | $ | 5.07 |
*Expenses are calculated using the most recent six-month expense ratio, net of expense waivers, annualized for each class (A: 1.26%;
C: 2.01%; R: 1.49%; R6: 0.85%; and Advisor: 1.01%), multiplied by the average account value over the period, multiplied by 182/366 to reflect
the one-half year period.
franklintempleton.com
Annual Report
23
Franklin Growth Opportunities Fund
This annual report for Franklin Growth Opportunities Fund covers the fiscal year ended April 30, 2016.
Your Fund’s Goal and Main Investments
The Fund seeks capital appreciation by normally investing substantially in equity securities of companies demonstrating accelerating growth, increasing profitability, or above-average growth or growth potential, when compared with the overall economy.
Performance Overview
For the 12 months under review, the Fund’s Class A shares had a -6.36% cumulative total return. In comparison, the Fund’s narrow benchmark, the Russell 3000® Growth Index, which measures performance of Russell 3000® Index companies with higher price-to-book ratios and higher forecasted growth values, generated a +0.32% total return.1 The Fund’s broad benchmark, the Standard & Poor’s 500 Index (S&P 500), which tracks the broad U.S. stock market, produced a +1.21% total return.1 You can find the Fund’s long-term performance data in the Performance Summary beginning on page 27.
Performance data represent past performance, which does not guarantee future results. Investment return and principal value will fluctuate, and you may have a gain or loss when you sell your shares. Current performance may differ from figures shown. For most recent month-end performance, go to franklintempleton.com or call (800) 342-5236 for most recent month-end performance.
Investment Strategy
We use fundamental, bottom-up research to seek companies meeting our criteria of growth potential, quality and valuation. In seeking sustainable growth characteristics, we look for companies we believe can produce sustainable earnings and cash flow growth, evaluating the long-term market opportunity and competitive structure of an industry to target leaders and emerging leaders. We define quality companies as those with strong and improving competitive positions in attractive markets. We also believe important attributes of quality are experienced and talented management teams as well as financial strength reflected in the capital structure, gross and operating margins, free cash flow generation and returns on capital employed. Our valuation analysis includes a range of potential
outcomes based on an assessment of multiple scenarios. In assessing value, we consider whether security prices fully reflect the balance of the sustainable growth opportunities relative to business and financial risks.
Manager’s Discussion
During the 12 months under review, key contributors to the Fund’s performance relative to the Russell 3000® Growth Index included stock selection in the information technology (IT) and materials sectors.
In IT, our positions in Apple and Facebook helped relative performance. Our underweighting in Apple helped performance relative to the index as shares of the smartphone and media device designer and manufacturer declined during the reporting period due to disappointing iPhone 6s sales. Social media network Facebook delivered strong fourth quarter 2015 results that
1. Source: Morningstar.
The indexes are unmanaged and include reinvestment of any income or distributions. They do not reflect any fees, expenses or sales charges. One cannot invest directly in an
index, and an index is not representative of the Fund’s portfolio.
The dollar value, number of shares or principal amount, and names of all portfolio holdings are listed in the Fund’s Statement of Investments (SOI). The SOI
begins on page 74.
24 Annual Report
franklintempleton.com
FRANKLIN GROWTH OPPORTUNITIES FUND
exceeded analysts’ expectations. Advertising revenue accelerated based on Facebook’s successful strategy for capitalizing on the consumer shift from personal computers to mobile devices, leading the company to generate a substantial portion of its revenue from mobile advertising. Additionally, the company benefited from a highly engaged user base with strong data, targeting and measurement capabilities, which prompted advertisers to continue to shift more of their budgets toward Facebook advertising.
In the materials sector, building materials company Martin Marietta Materials boosted performance. A stronger residential construction environment and the passage of a federal highway bill in December 2015 supported strong demand for cement and other construction materials. The company has enjoyed solid profit margins and meaningful pricing growth for its products. In addition, Martin Marietta sold its California cement plant, which contributed to profit margin expansion, and purchased additional assets in Colorado, which led the company to benefit from the Denver metropolitan area’s strong housing environment. Share buybacks also supported the company’s share price, as did disciplined capital allocation, in our view.
Elsewhere, online retail shopping services provider Amazon.com contributed to relative results. Amazon.com experienced a substantial increase in its operating income during the period, driven by the company’s retail and cloud computing businesses. Constellation Brands also helped the Fund’s performance. The company is the industry leader in the Mexican beer market. It has significant growth opportunities, in our view, including expanding into underpenetrated can and draft packaging formats, and increasing its distribution points in the convenience-store channel. In addition, Constellation has benefited from U.S. demographic trends.
In contrast, key detractors from relative results included stock selection in the health care sector. Stock selection in the industrials sector hindered relative results to a lesser extent, as did stock selection and an underweighting in the consumer staples sector.
In health care, our holdings in multinational specialty pharmaceutical company Valeant Pharmaceuticals International2,3 and pharmaceutical firm Allergan detracted from the Fund’s returns. Valeant’s shares came under pressure when the company had to delay filing its annual report with the U.S. Securities and Exchange Commission, which was eventually filed near
| Top 10 Holdings | ||
| 4/30/16 | ||
| Company | % of Total | |
| Sector/Industry | Net Assets | |
| Alphabet Inc. | 4.5 | % |
| Information Technology | ||
| Visa Inc. | 4.0 | % |
| Information Technology | ||
| Facebook Inc. | 4.0 | % |
| Information Technology | ||
| MasterCard Inc. | 3.5 | % |
| Information Technology | ||
| Celgene Corp. | 3.5 | % |
| Health Care | ||
| SBA Communications Corp. | 3.2 | % |
| Telecommunication Services | ||
| Amazon.com Inc. | 3.0 | % |
| Consumer Discretionary | ||
| Allergan PLC | 2.7 | % |
| Health Care | ||
| Apple Inc. | 2.6 | % |
| Information Technology | ||
| Microsoft Corp. | 2.3 | % |
| Information Technology |
period-end. Allergan’s share price fell following the termination of its merger with Pfizer after the U.S. Treasury Department placed constraints on tax inversions.
In the industrials sector, our position in Flowserve hindered results.2 The company designs and manufactures pumps, valves and seals, primarily for the refinery and pipeline segments of the petroleum, chemical processing, power generation and water treatment industries. The plunge in oil prices caused many of Flowserve’s customers to reduce their capital expenditures, which led to a reduction in sales and earnings for Flowserve. Baby formula and children’s nutrition products company Mead Johnson Nutrition detracted from results in the consumer staples sector.2 The company has faced problems in its China business as the country’s economic slowdown and lower dairy costs have pressured manufacturers and retailers to cut prices. In addition, a shift to e-commerce has led to market share losses as competing brands currently have better e-commerce distribution networks.
Elsewhere, our position in Anadarko Petroleum hindered the Fund’s performance. Anadarko’s share price dropped after news emerged that the company made an unsolicited preliminary
2. No longer held at period-end.
3. Not part of the index.
See www.franklintempletondatasources.com for additional data provider information.
franklintempleton.com
Annual Report
25
FRANKLIN GROWTH OPPORTUNITIES FUND
offer to buy petroleum and natural gas producer Apache. The news sparked a sell-off as investors previously saw Anadarko as a potential acquisition target by larger oil companies. LinkedIn also hindered results.3 Shares of the business-oriented social networking services firm suffered from a disappointing 2016 preliminary outlook that indicated a more rapid deceleration in growth and lower profitability than many investors expected.
Thank you for your continued participation in Franklin Growth Opportunities Fund. We look forward to serving your future investment needs.

The foregoing information reflects our analysis, opinions and portfolio holdings as of April 30, 2016, the end of the reporting period. The way we implement our main investment strategies and the resulting portfolio holdings may change depending on factors such as market and economic conditions. These opinions may not be relied upon as investment advice or an offer for a particular security. The information is not a complete analysis of every aspect of any market, country, industry, security or the Fund. Statements of fact are from sources considered reliable, but the investment manager makes no representation or warranty as to their completeness or accuracy. Although historical performance is no guarantee of future results, these insights may help you understand our investment management philosophy.
Sara Araghi has been a portfolio manager of the Fund since May 2016, providing research and advice on the purchases and sales of individual securities, and portfolio risk assessment. She joined Franklin Templeton Investments in 2003.
26 Annual Report
franklintempleton.com
FRANKLIN GROWTH OPPORTUNITIES FUND
Performance Summary as of April 30, 2016
Your dividend income will vary depending on dividends or interest paid by securities in the Fund’s portfolio, adjusted for operating expenses of each class. Capital gain distributions are net profits realized from the sale of portfolio securities. The performance table and graphs do not reflect any taxes that a shareholder would pay on Fund dividends, capital gain distributions, if any, or any realized gains on the sale of Fund shares. Total return reflects reinvestment of the Fund’s dividends and capital gain distributions, if any, and any unrealized gains or losses.
| Net Asset Value | ||||||
| Share Class (Symbol) | 4/30/16 | 4/30/15 | Change | |||
| A (FGRAX) | $ | 30.40 | $ | 33.13 | -$ | 2.73 |
| C (FKACX) | $ | 26.59 | $ | 29.27 | -$ | 2.68 |
| R (FKARX) | $ | 29.37 | $ | 32.10 | -$ | 2.73 |
| R6 (FOPPX) | $ | 32.39 | $ | 35.09 | -$ | 2.70 |
| Advisor (FRAAX) | $ | 32.20 | $ | 34.96 | -$ | 2.76 |
| Distributions1 (5/1/15–4/30/16) | ||
| Long-Term | ||
| Share Class | Capital Gain | |
| A | $ | 0.6579 |
| C | $ | 0.6579 |
| R | $ | 0.6579 |
| R6 | $ | 0.6579 |
| Advisor | $ | 0.6579 |
franklintempleton.com
Annual Report
27
FRANKLIN GROWTH OPPORTUNITIES FUND
PERFORMANCE SUMMARY
Performance as of 4/30/162
Cumulative total return excludes sales charges. Average annual total returns and value of $10,000 investment include maximum sales charges. Class A: 5.75% maximum initial sales charge; Class C: 1% contingent deferred sales charge in first year only;
Class R/R6/Advisor Class: no sales charges.
| Average Annual | ||||||||||
| Cumulative | Average Annual | Value of $10,000 | Total Return | Total Annual | ||||||
| Share Class | Total Return3 | Total Return4 | Investment5 | (3/31/16 | )6 | Operating Expenses7 | ||||
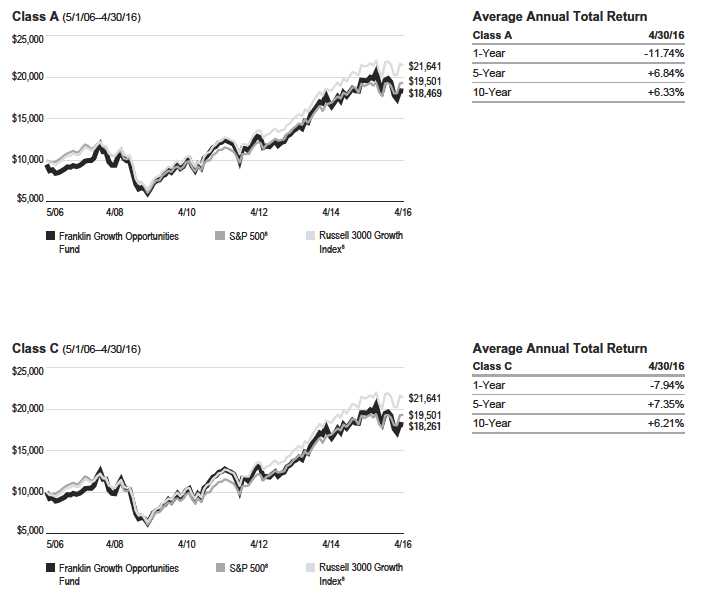
| A | 1.13 | % | ||||||||
| 1-Year | -6.36 | % | -11.74 | % | $ | 8,826 | -11.87 | % | ||
| 5-Year | +47.72 | % | +6.84 | % | $ | 13,923 | +7.45 | % | ||
| 10-Year | +95.99 | % | +6.33 | % | $ | 18,469 | +6.30 | % | ||
| C | 1.88 | % | ||||||||
| 1-Year | -7.03 | % | -7.94 | % | $ | 9,206 | -8.08 | % | ||
| 5-Year | +42.58 | % | +7.35 | % | $ | 14,258 | +7.95 | % | ||
| 10-Year | +82.61 | % | +6.21 | % | $ | 18,261 | +6.18 | % | ||
| R | 1.38 | % | ||||||||
| 1-Year | -6.60 | % | -6.60 | % | $ | 9,340 | -6.72 | % | ||
| 5-Year | +46.12 | % | +7.88 | % | $ | 14,612 | +8.49 | % | ||
| 10-Year | +92.00 | % | +6.74 | % | $ | 19,200 | +6.72 | % | ||
| R6 | 0.68 | % | ||||||||
| 1-Year | -5.94 | % | -5.94 | % | $ | 9,406 | -6.09 | % | ||
| Since Inception (5/1/13) | +38.10 | % | +11.37 | % | $ | 13,810 | +11.77 | % | ||
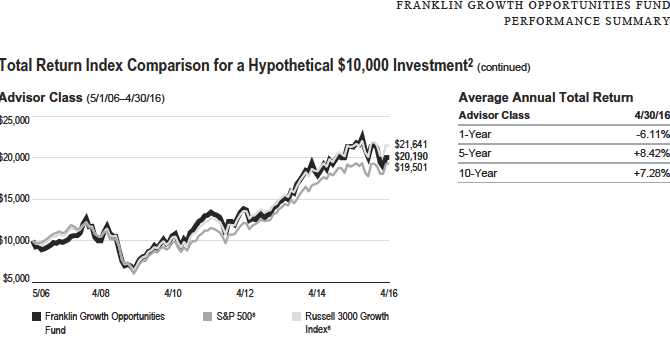
| Advisor | 0.88 | % | ||||||||
| 1-Year | -6.11 | % | -6.11 | % | $ | 9,389 | -6.23 | % | ||
| 5-Year | +49.84 | % | +8.42 | % | $ | 14,984 | +9.04 | % | ||
| 10-Year | +101.90 | % | +7.28 | % | $ | 20,190 | +7.25 | % |
Performance data represent past performance, which does not guarantee future results. Investment return and principal value will fluctuate, and you may have a gain or loss when you sell your shares. Current performance may differ from figures shown. For most recent month-end performance, go to franklintempleton.com or call (800) 342-5236.
28 Annual Report
franklintempleton.com
FRANKLIN GROWTH OPPORTUNITIES FUND
PERFORMANCE SUMMARY
Total Return Index Comparison for a Hypothetical $10,000 Investment2
Total return represents the change in value of an investment over the periods shown. It includes any applicable maximum sales charge, Fund expenses, account fees and reinvested distributions. The unmanaged indexes include reinvestment of any income or distributions. They differ from the Fund in composition and do not pay management fees or expenses. One cannot invest directly in an index.
franklintempleton.com
Annual Report
29
FRANKLIN GROWTH OPPORTUNITIES FUND
PERFORMANCE SUMMARY
Total Return Index Comparison for a Hypothetical $10,000 Investment2 (continued)
30 Annual Report
franklintempleton.com
All investments involve risks, including possible loss of principal. Growth stock prices reflect projections of future earnings or revenues, and can, therefore, fall dramatically if the company fails to meet those projections. Smaller, midsized and relatively new or unseasoned companies can be particularly sensitive to changing economic conditions, and their prospects for growth are less certain than those of larger, more established companies. Historically, these securities have experienced more price volatility than larger company stocks, especially over the short term. To the extent the Fund focuses on particular countries, regions, industries, sectors or types of investment from time to time, it may be subject to greater risks of adverse developments in such areas of focus than a fund that invests in a wider variety of countries, regions, industries, sectors or investments. The Fund is actively managed but there is no guarantee that the manager’s investment decisions will produce the desired results. The Fund’s prospectus also includes a description of the main investment risks.
| Class C: | These shares have higher annual fees and expenses than Class A shares. |
| Class R: | Shares are available to certain eligible investors as described in the prospectus. These shares have higher annual fees and expenses than Class A shares. |
| Class R6: | Shares are available to certain eligible investors as described in the prospectus. |
| Advisor Class: | Shares are available to certain eligible investors as described in the prospectus. |
1. The distribution amount is the sum of the dividend payments to shareholders for the period shown and includes only estimated tax-basis capital gain.
2. The Fund has a fee waiver associated with any investment in a Franklin Templeton money fund, contractually guaranteed through at least its current fiscal year-end. Fund
investment results reflect the fee waiver, to the extent applicable; without this reduction, the results would have been lower.
3. Cumulative total return represents the change in value of an investment over the periods indicated.
4. Average annual total return represents the average annual change in value of an investment over the periods indicated. Return for less than one year, if any, has not
been annualized.
5. These figures represent the value of a hypothetical $10,000 investment in the Fund over the periods indicated.
6. In accordance with SEC rules, we provide standardized average annual total return information through the latest calendar quarter.
7. Figures are as stated in the Fund’s current prospectus and may differ from the expense ratios disclosed in the Financial Highlights in this report. In periods of market vola-
tility, assets may decline significantly, causing total annual Fund operating expenses to become higher than the figures shown.
8. Source: Morningstar. The S&P 500 is a market capitalization-weighted index of 500 stocks designed to measure total U.S. equity market performance. The Russell 3000
Growth Index is market capitalization weighted and measures performance of those Russell 3000 Index companies with higher price-to-book ratios and higher forecasted
growth values.
See www.franklintempletondatasources.com for additional data provider information.
franklintempleton.com
Annual Report
31
FRANKLIN GROWTH OPPORTUNITIES FUND
Your Fund’s Expenses
As a Fund shareholder, you can incur two types of costs:
- Transaction costs, including sales charges (loads) on Fund purchases; and
- Ongoing Fund costs, including management fees, distribution and service (12b-1) fees, and other Fund expenses. All mutual funds have ongoing costs, sometimes referred to as operating expenses.
The following table shows ongoing costs of investing in the Fund and can help you understand these costs and compare them with those of other mutual funds. The table assumes a $1,000 investment held for the six months indicated.
Actual Fund Expenses
The first line (Actual) for each share class listed in the table provides actual account values and expenses. The “Ending Account Value” is derived from the Fund’s actual return, which includes the effect of Fund expenses.
You can estimate the expenses you paid during the period by following these steps. Of course, your account value and expenses will differ from those in this illustration:
1. Divide your account value by $1,000.
If an account had an $8,600 value, then $8,600 ÷ $1,000 = 8.6.
2. Multiply the result by the number under the heading “Expenses Paid During Period.”
If Expenses Paid During Period were $7.50, then 8.6 × $7.50 = $64.50.
In this illustration, the estimated expenses paid this period are $64.50.
Hypothetical Example for Comparison with Other Funds
Information in the second line (Hypothetical) for each class in the table can help you compare ongoing costs of investing in the Fund with those of other mutual funds. This information may not be used to estimate the actual ending account balance or expenses you paid during the period. The hypothetical “Ending Account Value” is based on the actual expense ratio for each class and an assumed 5% annual rate of return before expenses, which does not represent the Fund’s actual return. The figure under the heading “Expenses Paid During Period” shows the hypothetical expenses your account would have incurred under this scenario. You can compare this figure with the 5% hypothetical examples that appear in shareholder reports of other funds.
Please note that expenses shown in the table are meant to highlight ongoing costs and do not reflect any transaction costs, such as sales charges. Therefore, the second line for each class is useful in comparing ongoing costs only, and will not help you compare total costs of owning different funds. In addition, if transaction costs were included, your total costs would have been higher. Please refer to the Fund prospectus for additional information on operating expenses.
32 Annual Report
franklintempleton.com
FRANKLIN GROWTH OPPORTUNITIES FUND
YOUR FUND’S EXPENSES
| Beginning Account | Ending Account | Expenses Paid During | ||||
| Share Class | Value 11/1/15 | Value 4/30/16 | Period* 11/1/15–4/30/16 | |||
| A | ||||||
| Actual | $ | 1,000 | $ | 932.20 | $ | 5.28 |
| Hypothetical (5% return before expenses) | $ | 1,000 | $ | 1,019.39 | $ | 5.52 |
| C | ||||||
| Actual | $ | 1,000 | $ | 928.70 | $ | 8.82 |
| Hypothetical (5% return before expenses) | $ | 1,000 | $ | 1,015.71 | $ | 9.22 |
| R | ||||||
| Actual | $ | 1,000 | $ | 930.90 | $ | 6.43 |
| Hypothetical (5% return before expenses) | $ | 1,000 | $ | 1,018.20 | $ | 6.72 |
| R6 | ||||||
| Actual | $ | 1,000 | $ | 934.20 | $ | 3.17 |
| Hypothetical (5% return before expenses) | $ | 1,000 | $ | 1,021.58 | $ | 3.32 |
| Advisor | ||||||
| Actual | $ | 1,000 | $ | 933.30 | $ | 4.04 |
| Hypothetical (5% return before expenses) | $ | 1,000 | $ | 1,020.69 | $ | 4.22 |
*Expenses are calculated using the most recent six-month expense ratio, net of expense waivers, annualized for each class (A: 1.10%;
C: 1.84%; R: 1.34%; R6: 0.66%; and Advisor: 0.84%), multiplied by the average account value over the period, multiplied by 182/366 to reflect
the one-half year period.
franklintempleton.com
Annual Report
33
Franklin Small Cap Growth Fund
This annual report for Franklin Small Cap Growth Fund covers the fiscal year ended April 30, 2016. At the market close on February 12, 2015, the Fund closed to new investors with limited exceptions. Existing shareholders may add to their accounts. We believe this closure can help us effectively manage our current level of assets.
Your Fund’s Goal and Main Investments
The Fund seeks long-term capital growth by normally investing at least 80% of its net assets in equity securities of small cap companies, which for this Fund are those with market capitalizations not exceeding $1.5 billion or that of the highest market capitalization in the Russell 2000® Index, whichever is greater, at the time of purchase.1
Performance Overview
For the 12 months under review, the Fund’s Class A shares had a cumulative total return of -11.28%. In comparison, the Russell 2000® Growth Index, which measures performance of small cap companies with higher price-to-book ratios and higher forecasted growth values, had a cumulative total return of -8.27%.2 The Standard & Poor’s 500 Index (S&P 500), which tracks the broad U.S. stock market, generated a +1.21% total return.2 You can find the Fund’s long-term performance data in the Performance Summary beginning on page 37.
Performance data represent past performance, which does not guarantee future results. Investment return and principal value will fluctuate, and you may have a gain or loss when you sell your shares. Current performance may differ from figures shown. For most recent month-end performance, go to franklintempleton.com or call (800) 342-5236.
Investment Strategy
We use fundamental, bottom-up research to seek companies meeting our criteria of growth potential, quality and valuation. In seeking sustainable growth characteristics, we look for companies we believe can produce sustainable earnings and cash flow growth, evaluating the long-term market opportunity and competitive structure of an industry to target leaders and emerging leaders. We define quality companies as those with strong and improving competitive positions in attractive markets. We also believe important attributes of quality are
experienced and talented management teams as well as financial strength reflected in the capital structure, gross and operating margins, free cash flow generation and returns on capital employed. Our valuation analysis includes a range of potential outcomes based on an assessment of multiple scenarios. In assessing value, we consider whether security prices fully reflect the balance of the sustainable growth opportunities relative to business and financial risks.
Manager’s Discussion
During the 12 months under review, major detractors from the Fund’s performance relative to the Russell 2000® Growth Index included stock selection in the health care and consumer staples sectors and an overweighting in the energy sector.
Within health care, detractors included Celldex Therapeutics, a development-stage biotechnology company with several clinical compounds. Its lead pipeline drug, Rintega, failed in a phase 3
1. The Russell 2000 Index is market capitalization weighted and measures performance of the 2,000 smallest companies in the Russell 3000 Index, which represent a small
amount of the total market capitalization of the Russell 3000 Index.
2. Source: Morningstar.
The indexes are unmanaged and include reinvestment of any income or distributions. They do not reflect any fees, expenses or sales charges. One cannot invest directly in an
index, and an index is not representative of the Fund’s portfolio.
The dollar value, number of shares or principal amount, and names of all portfolio holdings are listed in the Fund’s Statement of Investments (SOI). The SOI
begins on page 82.
34 Annual Report
franklintempleton.com
FRANKLIN SMALL CAP GROWTH FUND
trial for the treatment of newly diagnosed glioblastoma, a malignant central nervous system tumor. The company stopped the clinical trial in March and discontinued the drug’s development. Biological research equipment provider Fluidigm also hurt relative results. In 2015’s first half, the company encountered operational issues, particularly in its production genomics and applied markets businesses, which led to lower-than-expected revenue growth. The company stabilized the business during 2015’s second half, and we are optimistic that growth can resume in 2016.
In the energy sector, key detractors from the Fund’s relative results included oil and gas companies Sanchez Energy and Rex Energy, whose shares lost value as crude oil and natural gas prices fell.3 Fresh and refrigerated pet food manufacturer and distributor Freshpet detracted from performance in the consumer staples sector.3 A lack of visibility in company-owned refrigerator growth has derailed our original thesis regarding a sustainable, robust long-term growth rate.
Elsewhere, The Advisory Board, which provides business services to the health care and higher education industries, detracted from relative results. In August 2015, the former management team of Royall (a recent acquisition by The Advisory Board) left the company much sooner than anticipated, and the near-term growth outlook for Royall was sharply revised lower. In February 2016, The Advisory Board reported that its core health care business had poor fourth-quarter 2015 sales results and provided a 2016 growth outlook that fell substantially short of market expectations. However, the initiatives that company management implemented to turn Royall and the core health care business around are showing early signs of success.
Conversely, contributors to the Fund’s relative performance included stock selection in the information technology (IT), materials and consumer discretionary sectors.
In IT, Alarm.com Holdings and Callidus Software helped results. Alarm.com, a cloud-based software solutions provider for connected homes, has been successful at launching proprietary, low-priced home automation products, such as smart thermostats and high-definition video cameras, which customers are increasingly choosing to include when buying or installing a new home security system. Its international expansion has been progressing well, with the company recently adding large partners in Europe and Australia. In addition, Alarm.com reported better-than-expected growth in fourth quarter 2015 and provided 2016 guidance that meaningfully
| Top 10 Holdings | ||
| 4/30/16 | ||
| Company | % of Total | |
| Sector/Industry | Net Assets | |
| 2U Inc. | 3.0 | % |
| Consumer Discretionary | ||
| Demandware Inc. | 1.9 | % |
| Information Technology | ||
| US Ecology Inc. | 1.8 | % |
| Industrials | ||
| Paylocity Holding Corp. | 1.8 | % |
| Information Technology | ||
| Callidus Software Inc. | 1.7 | % |
| Information Technology | ||
| DigitalGlobe Inc. | 1.7 | % |
| Industrials | ||
| Zendesk Inc. | 1.7 | % |
| Information Technology | ||
| Grand Canyon Education Inc. | 1.7 | % |
| Consumer Discretionary | ||
| TreeHouse Foods Inc. | 1.7 | % |
| Consumer Staples | ||
| Adeptus Health Inc. | 1.6 | % |
| Health Care |
exceeded market expectations, including faster-than-expected growth in recurring revenue and higher-than-expected profit margins. Cloud software provider Callidus has consistently grown its Software as a Service (SaaS) solutions, driving profits. Its “Lead to Money” suite approach has helped the company successfully transition most customers from its legacy license and maintenance model, while sustaining a healthy operating profit during the transition.
In the materials sector, H.B. Fuller contributed to results as the company made progress in improving the performance of its North American and European operations. In consumer discretionary, Tile Shop Holdings boosted performance. The specialty retailer increased sales at existing locations, while adding new stores, and it continued to gain market share in the highly fragmented retail tile industry. The company also benefited from increased consumer spending on home repairs and remodeling.
Elsewhere, independent emergency room operator Adeptus Health contributed to results. During the reporting period, the company grew rapidly by developing free-standing emergency rooms and forming joint ventures with other health care facility operators. Its stock price and valuation rose as the company continued to successfully execute its growth strategy.
3. No longer held at period-end.
See www.franklintempletondatasources.com for additional data provider information.
franklintempleton.com
Annual Report
35
FRANKLIN SMALL CAP GROWTH FUND
Thank you for your continued participation in Franklin Small Cap Growth Fund. We look forward to serving your future investment needs.

The foregoing information reflects our analysis, opinions and portfolio holdings as of April 30, 2016, the end of the reporting period. The way we implement our main investment strategies and the resulting portfolio holdings may change depending on factors such as market and economic conditions. These opinions may not be relied upon as investment advice or an offer for a particular security. The information is not a complete analysis of every aspect of any market, country, industry, security or the Fund. Statements of fact are from sources considered reliable, but the investment manager makes no representation or warranty as to their completeness or accuracy. Although historical performance is no guarantee of future results, these insights may help you understand our investment management philosophy.
36 Annual Report
franklintempleton.com
FRANKLIN SMALL CAP GROWTH FUND
Performance Summary as of April 30, 2016
Your dividend income will vary depending on dividends or interest paid by securities in the Fund’s portfolio, adjusted for operating expenses of each class. Capital gain distributions are net profits realized from the sale of portfolio securities. The performance table and graphs do not reflect any taxes that a shareholder would pay on Fund dividends, capital gain distributions, if any, or any realized gains on the sale of Fund shares. Total return reflects reinvestment of the Fund’s dividends and capital gain distributions, if any, and any unrealized gains or losses.
| Net Asset Value | ||||||
| Share Class (Symbol) | 4/30/16 | 4/30/15 | Change | |||
| A (FSGRX) | $ | 16.37 | $ | 18.83 | -$ | 2.46 |
| C (FCSGX) | $ | 14.07 | $ | 16.36 | -$ | 2.29 |
| R (FSSRX) | $ | 15.70 | $ | 18.11 | -$ | 2.41 |
| R6 (FSMLX) | $ | 17.52 | $ | 20.02 | -$ | 2.50 |
| Advisor (FSSAX) | $ | 17.41 | $ | 19.94 | -$ | 2.53 |
| Distributions1 (5/1/15–4/30/16) | ||||||
| Short-Term | Long-Term | |||||
| Share Class | Capital Gain | Capital Gain | Total | |||
| A | $ | 0.1853 | $ | 0.1642 | $ | 0.3495 |
| C | $ | 0.1853 | $ | 0.1642 | $ | 0.3495 |
| R | $ | 0.1853 | $ | 0.1642 | $ | 0.3495 |
| R6 | $ | 0.1853 | $ | 0.1642 | $ | 0.3495 |
| Advisor | $ | 0.1853 | $ | 0.1642 | $ | 0.3495 |
franklintempleton.com
Annual Report
37
FRANKLIN SMALL CAP GROWTH FUND
PERFORMANCE SUMMARY
Performance as of 4/30/162
Cumulative total return excludes sales charges. Average annual total returns and value of $10,000 investment include maximum sales charges. Class A: 5.75% maximum initial sales charge; Class C: 1% contingent deferred sales charge in first year only;
Class R/R6/Advisor Class: no sales charges.
| Average Annual | ||||||||||
| Cumulative | Average Annual | Value of $10,000 | Total Return | Total Annual | ||||||
| Share Class | Total Return3 | Total Return4 | Investment5 | (3/31/16 | )6 | Operating Expenses7 | ||||
| A | 1.12 | % | ||||||||
| 1-Year | -11.28 | % | -16.39 | % | $ | 8,361 | -20.80 | % | ||
| 5-Year | +43.51 | % | +6.23 | % | $ | 13,530 | +6.26 | % | ||
| 10-Year | +84.78 | % | +5.70 | % | $ | 17,413 | +5.35 | % | ||
| C | 1.87 | % | ||||||||
| 1-Year | -11.95 | % | -12.81 | % | $ | 8,719 | -17.43 | % | ||
| 5-Year | +38.58 | % | +6.74 | % | $ | 13,858 | +6.76 | % | ||
| 10-Year | +72.03 | % | +5.58 | % | $ | 17,203 | +5.22 | % | ||
| R | 1.37 | % | ||||||||
| 1-Year | -11.46 | % | -11.46 | % | $ | 8,854 | -16.20 | % | ||
| 5-Year | +42.11 | % | +7.28 | % | $ | 14,211 | +7.29 | % | ||
| 10-Year | +80.97 | % | +6.11 | % | $ | 18,097 | +5.74 | % | ||
| R6 | 0.66 | % | ||||||||
| 1-Year | -10.81 | % | -10.81 | % | $ | 8,919 | -15.54 | % | ||
| Since Inception (5/1/13) | +31.91 | % | +9.68 | % | $ | 13,191 | +8.79 | % | ||
| Advisor | 0.87 | % | ||||||||
| 1-Year | -11.06 | % | -11.06 | % | $ | 8,894 | -15.75 | % | ||
| 5-Year | +45.59 | % | +7.80 | % | $ | 14,559 | +7.83 | % | ||
| 10-Year | +90.16 | % | +6.64 | % | $ | 19,016 | +6.27 | % |
Performance data represent past performance, which does not guarantee future results. Investment return and principal value will fluctuate, and you may have a gain or loss when you sell your shares. Current performance may differ from figures shown. For most recent month-end performance, go to franklintempleton.com or call (800) 342-5236.
38 Annual Report
franklintempleton.com
FRANKLIN SMALL CAP GROWTH FUND
PERFORMANCE SUMMARY
Total Return Index Comparison for a Hypothetical $10,000 Investment2
Total return represents the change in value of an investment over the periods shown. It includes any applicable maximum sales charge, Fund expenses, account fees and reinvested distributions. The unmanaged indexes include reinvestment of any income or distributions. They differ from the Fund in composition and do not pay management fees or expenses. One cannot invest directly in an index.
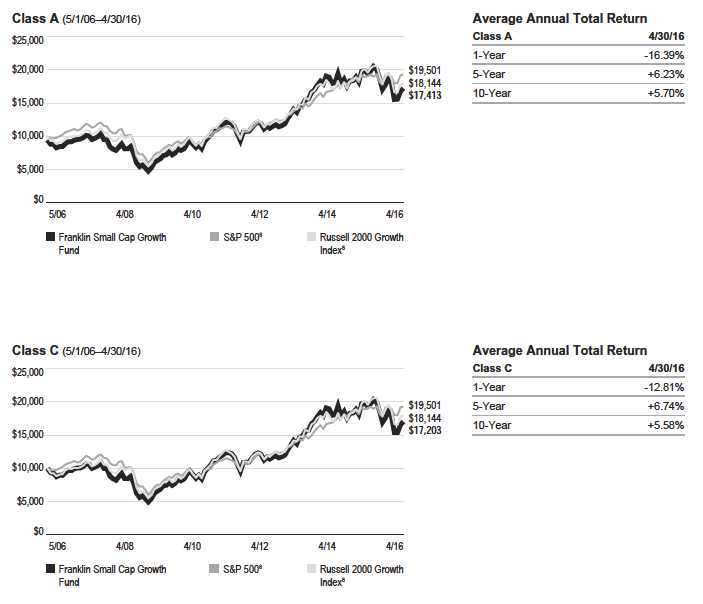
franklintempleton.com
Annual Report
39
FRANKLIN SMALL CAP GROWTH FUND
PERFORMANCE SUMMARY
Total Return Index Comparison for a Hypothetical $10,000 Investment2 (continued)
40 Annual Report
franklintempleton.com
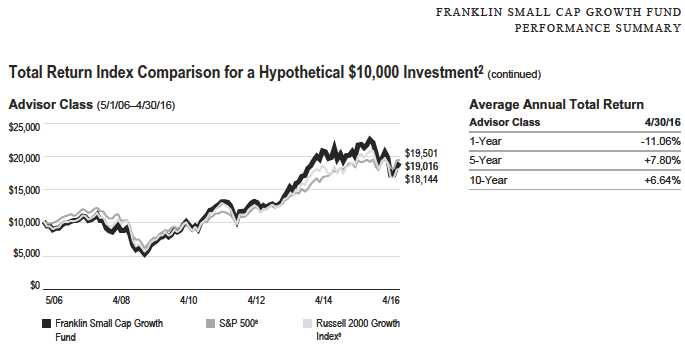
All investments involve risks, including possible loss of principal. Smaller, midsized and relatively new or unseasoned companies can be particularly sensitive to changing economic conditions, and their prospects for growth are less certain than those of larger, more established companies. Historically, these securities have experienced more price volatility than larger company stocks, especially over the short term. Growth stock prices reflect projections of future earnings or revenues, and can, therefore, fall dramatically if the company fails to meet those projections. To the extent the Fund focuses on particular countries, regions, industries, sectors or types of investment from time to time, it may be subject to greater risks of adverse developments in such areas of focus than a fund that invests in a wider variety of countries, regions, industries, sectors or investments. From time to time, the trading market for a particular security or type of security in which the Fund invests may become less liquid or even illiquid. The Fund is actively managed but there is no guarantee that the manager’s investment decisions will produce the desired results. The Fund’s prospectus also includes a description of the main investment risks.
| Class C: | These shares have higher annual fees and expenses than Class A shares. |
| Class R: | Shares are available to certain eligible investors as described in the prospectus. These shares have higher annual fees and expenses than Class A shares. |
| Class R6: | Shares are available to certain eligible investors as described in the prospectus. |
| Advisor Class: | Shares are available to certain eligible investors as described in the prospectus. |
1. The distribution amount is the sum of the dividend payments to shareholders for the period shown and includes only estimated tax-basis capital gain.
2. The Fund has a fee waiver associated with any investment in a Franklin Templeton money fund, contractually guaranteed through at least its current fiscal year-end. Fund
investment results reflect the fee waiver, to the extent applicable; without this reduction, the results would have been lower.
3. Cumulative total return represents the change in value of an investment over the periods indicated.
4. Average annual total return represents the average annual change in value of an investment over the periods indicated. Return for less than one year, if any, has not
been annualized.
5. These figures represent the value of a hypothetical $10,000 investment in the Fund over the periods indicated.
6. In accordance with SEC rules, we provide standardized average annual total return information through the latest calendar quarter.
7. Figures are as stated in the Fund’s current prospectus and may differ from the expense ratios disclosed in the Financial Highlights in this report. In periods of market vola-
tility, assets may decline significantly, causing total annual Fund operating expenses to become higher than the figures shown.
8. Source: Morningstar. The S&P 500 is a market capitalization-weighted index of 500 stocks designed to measure total U.S. equity market performance. The Russell 2000
Growth Index is market capitalization weighted and measures performance of those Russell 2000 Index companies with higher price-to-book ratios and higher forecasted
growth values.
See www.franklintempletondatasources.com for additional data provider information.
franklintempleton.com
Annual Report
41
FRANKLIN SMALL CAP GROWTH FUND
Your Fund’s Expenses
As a Fund shareholder, you can incur two types of costs:
- Transaction costs, including sales charges (loads) on Fund purchases; and
- Ongoing Fund costs, including management fees, distribution and service (12b-1) fees, and other Fund expenses. All mutual funds have ongoing costs, sometimes referred to as operating expenses.
The following table shows ongoing costs of investing in the Fund and can help you understand these costs and compare them with those of other mutual funds. The table assumes a $1,000 investment held for the six months indicated.
Actual Fund Expenses
The first line (Actual) for each share class listed in the table provides actual account values and expenses. The “Ending Account Value” is derived from the Fund’s actual return, which includes the effect of Fund expenses.
You can estimate the expenses you paid during the period by following these steps. Of course, your account value and expenses will differ from those in this illustration:
1. Divide your account value by $1,000.
If an account had an $8,600 value, then $8,600 ÷ $1,000 = 8.6.
2. Multiply the result by the number under the heading “Expenses Paid During Period.”
If Expenses Paid During Period were $7.50, then 8.6 × $7.50 = $64.50.
In this illustration, the estimated expenses paid this period are $64.50.
Hypothetical Example for Comparison with Other Funds
Information in the second line (Hypothetical) for each class in the table can help you compare ongoing costs of investing in the Fund with those of other mutual funds. This information may not be used to estimate the actual ending account balance or expenses you paid during the period. The hypothetical “Ending Account Value” is based on the actual expense ratio for each class and an assumed 5% annual rate of return before expenses, which does not represent the Fund’s actual return. The figure under the heading “Expenses Paid During Period” shows the hypothetical expenses your account would have incurred under this scenario. You can compare this figure with the 5% hypothetical examples that appear in shareholder reports of other funds.
Please note that expenses shown in the table are meant to highlight ongoing costs and do not reflect any transaction costs, such as sales charges. Therefore, the second line for each class is useful in comparing ongoing costs only, and will not help you compare total costs of owning different funds. In addition, if transaction costs were included, your total costs would have been higher. Please refer to the Fund prospectus for additional information on operating expenses.
42 Annual Report
franklintempleton.com
FRANKLIN SMALL CAP GROWTH FUND
YOUR FUND’S EXPENSES
| Beginning Account | Ending Account | Expenses Paid During | ||||
| Share Class | Value 11/1/15 | Value 4/30/16 | Period* 11/1/15–4/30/16 | |||
| A | ||||||
| Actual | $ | 1,000 | $ | 971.80 | $ | 5.79 |
| Hypothetical (5% return before expenses) | $ | 1,000 | $ | 1,019.00 | $ | 5.92 |
| C | ||||||
| Actual | $ | 1,000 | $ | 968.00 | $ | 9.49 |
| Hypothetical (5% return before expenses) | $ | 1,000 | $ | 1,015.22 | $ | 9.72 |
| R | ||||||
| Actual | $ | 1,000 | $ | 970.70 | $ | 7.06 |
| Hypothetical (5% return before expenses) | $ | 1,000 | $ | 1,017.70 | $ | 7.22 |
| R6 | ||||||
| Actual | $ | 1,000 | $ | 974.70 | $ | 3.04 |
| Hypothetical (5% return before expenses) | $ | 1,000 | $ | 1,021.78 | $ | 3.12 |
| Advisor | ||||||
| Actual | $ | 1,000 | $ | 972.90 | $ | 4.61 |
| Hypothetical (5% return before expenses) | $ | 1,000 | $ | 1,020.19 | $ | 4.72 |
*Expenses are calculated using the most recent six-month expense ratio, net of expense waivers, annualized for each class (A: 1.18%;
C: 1.94%; R: 1.44%; R6: 0.62%; and Advisor: 0.94%), multiplied by the average account value over the period, multiplied by 182/366 to reflect
the one-half year period.
franklintempleton.com
Annual Report
43
Franklin Small-Mid Cap Growth Fund
This annual report for Franklin Small-Mid Cap Growth Fund covers the fiscal year ended April 30, 2016.
Your Fund’s Goal and Main Investments
The Fund seeks long-term capital growth by normally investing at least 80% of its net assets in equity securities of small-cap and mid-cap companies. The Fund defines small-cap companies as those within the market capitalization range of companies in the Russell 2500™ Index at the time of purchase, and mid-cap companies as those within the market capitalization range of the Russell Midcap® Index at the time of purchase.1
Performance Overview
For the 12 months under review, the Fund’s Class A shares had a -9.02% cumulative total return. In comparison, the Russell Midcap® Growth Index, which measures performance of companies in the Russell Midcap® Index with higher price-to-book ratios and higher forecasted growth values, had a -4.13% total return.2 Also in comparison, the Standard & Poor’s 500 Index (S&P 500), which tracks the broad U.S. stock market, produced a +1.21% total return.2 You can find the Fund’s long-term performance data in the Performance Summary beginning on page 47.
Performance data represent past performance, which does not guarantee future results. Investment return and principal value will fluctuate, and you may have a gain or loss when you sell your shares. Current performance may differ from figures shown. For most recent month-end performance, go to franklintempleton.com or call (800) 342-5236.
Investment Strategy
We use fundamental, bottom-up research to seek companies meeting our criteria of growth potential, quality and valuation. In seeking sustainable growth characteristics, we look for companies we believe can produce sustainable earnings and cash flow growth, evaluating the long-term market opportunity and competitive structure of an industry to target leaders and emerging leaders. We define quality companies as those with strong and improving competitive positions in attractive markets. We also believe important attributes of quality are

experienced and talented management teams as well as financial strength reflected in the capital structure, gross and operating margins, free cash flow generation and returns on capital employed. Our valuation analysis includes a range of potential outcomes based on an assessment of multiple scenarios. In assessing value, we consider whether security prices fully reflect the balance of the sustainable growth opportunities relative to business and financial risks.
Manager’s Discussion
During the 12 months under review, key detractors from the Fund’s performance relative to the Russell Midcap® Growth Index included stock selection in the industrials, health care and consumer discretionary sectors.
1. The Russell 2500 Index is market capitalization weighted and measures performance of the 2,500 smallest companies in the Russell 3000 Index, which represent a modest
amount of the Russell 3000 Index’s total market capitalization. The Russell Midcap Index is market capitalization weighted and measures performance of the smallest
companies in the Russell 1000 Index, which represent a modest amount of the Russell 1000 Index’s total market capitalization.
2. Source: Morningstar.
The indexes are unmanaged and include reinvestment of any income or distributions. They do not reflect any fees, expenses or sales charges. One cannot invest directly in an
index, and an index is not representative of the Fund’s portfolio.
The dollar value, number of shares or principal amount, and names of all portfolio holdings are listed in the Fund’s Statement of Investments (SOI). The SOI
begins on page 91.
44 Annual Report
franklintempleton.com
FRANKLIN SMALL-MID CAP GROWTH FUND
In industrials, our positions in business services company The Advisory Board,3,4 which provides business services to the health care and higher education industries, and low-fare airline operator Spirit Airlines3 detracted from relative results. In August 2015, the former management team of Royall (a recent acquisition by The Advisory Board) left the company much sooner than anticipated, and the near-term growth outlook for Royall was sharply revised lower. In February 2016, The Advi sory Board reported that its core health care business had poor fourth-quarter 2015 sales results and provided a 2016 growth outlook that fell substantially short of market expectations. Spi rit Airlines’ shares suffered as fares across the airline industry generally fell in 2015. Despite recent fare increases, many airlines delivered record profits as fuel prices declined; however, investors seemed concerned that airlines will not be able to increase fares further if fuel prices rise.
In the health care sector, our holdings in Perrigo and Celldex Therapeutics4 hindered relative results. Perrigo’s shares fell after the over-the-counter (OTC) consumer goods and pharmaceutical company lowered its 2016 earnings guidance amid pressures in its U.S. generic drug business and its recently acquired European OTC products business. In addition, the company’s chief executive officer resigned late in the reporting period. Celldex Therapeutics is a development-stage bio-technology company with several clinical compounds. Its lead pipeline drug, Rintega, failed in a phase 3 trial for the treatment of newly diagnosed glioblastoma, a malignant central nervous system tumor. The company stopped the clinical trial in March and discontinued the drug’s development.
Among consumer discretionary holdings, Global Eagle Entertainment detracted from results.4 The company, which provides content, connectivity and digital media solutions for the global travel industry, reported a loss for fourth quarter 2015, missing consensus estimates for positive earnings. Elsewhere, fresh and refrigerated pet food manufacturer and distributor Freshpet detracted from performance.3 A lack of visibility in company-owned refrigerator growth has derailed our original thesis regarding a sustainable, robust long-term growth rate.
Conversely, contributors to the Fund’s relative performance included stock selection in the information technology (IT), energy and materials sectors.
In IT, satellite and wireless networking equipment company ViaSat4 and electronic payment processing services provider Vantiv helped relative results. ViaSat continued its effort to
| Top 10 Holdings | ||
| 4/30/16 | ||
| Company | % of Total | |
| Sector/Industry | Net Assets | |
| NXP Semiconductors NV (Netherlands) | 2.4 | % |
| Information Technology | ||
| Constellation Brands Inc. | 2.0 | % |
| Consumer Staples | ||
| Roper Technologies Inc. | 1.8 | % |
| Industrials | ||
| Edwards Lifesciences Corp. | 1.7 | % |
| Health Care | ||
| Willis Towers Watson PLC | 1.7 | % |
| Financials | ||
| Concho Resources Inc. | 1.6 | % |
| Energy | ||
| Electronic Arts Inc. | 1.6 | % |
| Information Technology | ||
| Monster Beverage Corp. | 1.6 | % |
| Consumer Staples | ||
| Intercontinental Exchange Inc. | 1.6 | % |
| Financials | ||
| Equinix Inc. | 1.6 | % |
| Financials |
build a low-cost, high-speed satellite Internet constellation. Its stock performed well recently amid news of several airline connectivity deals. Vantiv showed broad-based strength across business segments, particularly the merchant segment, which experienced accelerating growth in 2016’s first quarter. The segment benefited from Vantiv’s 2014 acquisition of Mercury Payment Systems, which provided point-of-sale technology and solutions that are in high demand by retailers as they sort through the increasing complexity of mobile wallets and customer loyalty offerings. Vantiv increased its market share and has good cash flow generation.
In the energy sector, oilfield services firm Superior Energy Services contributed to relative results. During the reporting period, the Fund initiated a position in the company following a significant share price decline. The shares rebounded beginning in February 2016, in large part due to a recovery in commodity prices and company management’s efforts to lower costs and enhance profitability. These efforts, combined with the company’s relatively strong balance sheet, led many investors to look past current earnings challenges in anticipation of an eventual recovery in resource development spending. In the materials sector, specialty materials and chemicals company Cytec
3. No longer held at period-end.
4. Not part of the index.
See www.franklintempletondatasources.com for additional data provider information.
franklintempleton.com
Annual Report
45
FRANKLIN SMALL-MID CAP GROWTH FUND
Industries contributed to relative returns.3 Cytec’s shares performed well due to an announced acquisition of the company by Belgium-based Solvay at a premium to Cytec’s share price. The acquisition was completed in December 2015.
Elsewhere, medical devices company Edwards Lifesciences contributed to relative results. Its stock price rose due to the company’s greater-than-expected sales and profits in 2015’s third and fourth quarters as well as company management’s higher guidance for 2016 sales and profits. In addition, the company released data showing low mortality and stroke rates in studies of its transcatheter heart valves in patients deemed to be under intermediate risk for potential traditional surgical valve replacement procedures. Constellation Brands in the consumer staples sector also helped the Fund’s performance. The company is the industry leader in the Mexican beer market. It has significant growth opportunities, in our view, including expanding into underpenetrated can and draft packaging formats, and increasing its distribution points in the convenience-store channel. Constellation has benefited from U.S. demographic trends.
Thank you for your continued participation in Franklin Small-Mid Cap Growth Fund. We look forward to serving your future investment needs.

The foregoing information reflects our analysis, opinions and portfolio holdings as of April 30, 2016, the end of the reporting period. The way we implement our main investment strategies and the resulting portfolio holdings may change depending on factors such as market and economic conditions. These opinions may not be relied upon as investment advice or an offer for a particular security. The information is not a complete analysis of every aspect of any market, country, industry, security or the Fund. Statements of fact are from sources considered reliable, but the investment manager makes no representation or warranty as to their completeness or accuracy. Although historical performance is no guarantee of future results, these insights may help you understand our investment management philosophy.
46 Annual Report
franklintempleton.com
FRANKLIN SMALL-MID CAP GROWTH FUND
Performance Summary as of April 30, 2016
Your dividend income will vary depending on dividends or interest paid by securities in the Fund’s portfolio, adjusted for operating expenses of each class. Capital gain distributions are net profits realized from the sale of portfolio securities. The performance table and graphs do not reflect any taxes that a shareholder would pay on Fund dividends, capital gain distributions, if any, or any realized gains on the sale of Fund shares. Total return reflects reinvestment of the Fund’s dividends and capital gain distributions, if any, and any unrealized gains or losses.
| Net Asset Value | ||||||
| Share Class (Symbol) | 4/30/16 | 4/30/15 | Change | |||
| A (FRSGX) | $ | 31.84 | $ | 38.38 | -$ | 6.54 |
| C (FRSIX) | $ | 24.40 | $ | 30.43 | -$ | 6.03 |
| R (FSMRX) | $ | 29.75 | $ | 36.18 | -$ | 6.43 |
| R6 (FMGGX) | $ | 34.43 | $ | 41.04 | -$ | 6.61 |
| Advisor (FSGAX) | $ | 34.15 | $ | 40.83 | -$ | 6.68 |
| Distributions1 (5/1/15–4/30/16) | ||
| Long-Term | ||
| Share Class | Capital Gain | |
| A | $ | 3.1354 |
| C | $ | 3.1354 |
| R | $ | 3.1354 |
| R6 | $ | 3.1354 |
| Advisor | $ | 3.1354 |
franklintempleton.com
Annual Report
47
| F R A N K L I N S M A L L - M I D C A P G R O W T H F U N D |
| P E R F O R M A N C E S U M M A R Y |
Performance as of 4/30/162
Cumulative total return excludes sales charges. Average annual total returns and value of $10,000 investment include maximum sales charges. Class A: 5.75% maximum initial sales charge; Class C: 1% contingent deferred sales charge in first year only;
Class R/R6/Advisor Class: no sales charges.
| Average Annual | ||||||||||
| Cumulative | Average Annual | Value of $10,000 | Total Return | Total Annual | ||||||
| Share Class | Total Return3 | Total Return4 | Investment5 | (3/31/16 | )6 | Operating Expenses7 | ||||
| A | 0.94 | % | ||||||||
| 1-Year | -9.02 | % | -14.24 | % | $ | 8,576 | -16.39 | % | ||
| 5-Year | +36.45 | % | +5.16 | % | $ | 12,860 | +5.37 | % | ||
| 10-Year | +79.68 | % | +5.41 | % | $ | 16,933 | +5.22 | % | ||
| C | 1.69 | % | ||||||||
| 1-Year | -9.72 | % | -10.53 | % | $ | 8,947 | -12.75 | % | ||
| 5-Year | +31.35 | % | +5.60 | % | $ | 13,135 | +5.82 | % | ||
| 10-Year | +66.64 | % | +5.24 | % | $ | 16,664 | +5.05 | % | ||
| R | 1.19 | % | ||||||||
| 1-Year | -9.24 | % | -9.24 | % | $ | 9,076 | -11.54 | % | ||
| 5-Year | +34.74 | % | +6.15 | % | $ | 13,474 | +6.35 | % | ||
| 10-Year | +75.21 | % | +5.77 | % | $ | 17,521 | +5.57 | % | ||
| R6 | 0.48 | % | ||||||||
| 1-Year | -8.54 | % | -8.54 | % | $ | 9,146 | -10.86 | % | ||
| Since Inception (5/1/13) | +32.38 | % | +9.81 | % | $ | 13,238 | +9.52 | % | ||
| Advisor | 0.69 | % | ||||||||
| 1-Year | -8.79 | % | -8.79 | % | $ | 9,121 | -11.04 | % | ||
| 5-Year | +38.19 | % | +6.68 | % | $ | 13,819 | +6.90 | % | ||
| 10-Year | +84.29 | % | +6.30 | % | $ | 18,429 | +6.11 | % |
Performance data represent past performance, which does not guarantee future results. Investment return and principal value will fluctuate, and you may have a gain or loss when you sell your shares. Current performance may differ from figures shown. For most recent month-end performance, go to franklintempleton.com or call (800) 342-5236.
48 Annual Report
franklintempleton.com
FRANKLIN SMALL-MID CAP GROWTH FUND
PERFORMANCE SUMMARY
Total Return Index Comparison for a Hypothetical $10,000 Investment2
Total return represents the change in value of an investment over the periods shown. It includes any applicable maximum sales charge, Fund expenses, account fees and reinvested distributions. The unmanaged indexes include reinvestment of any income or distributions. They differ from the Fund in composition and do not pay management fees or expenses. One cannot invest directly in an index.
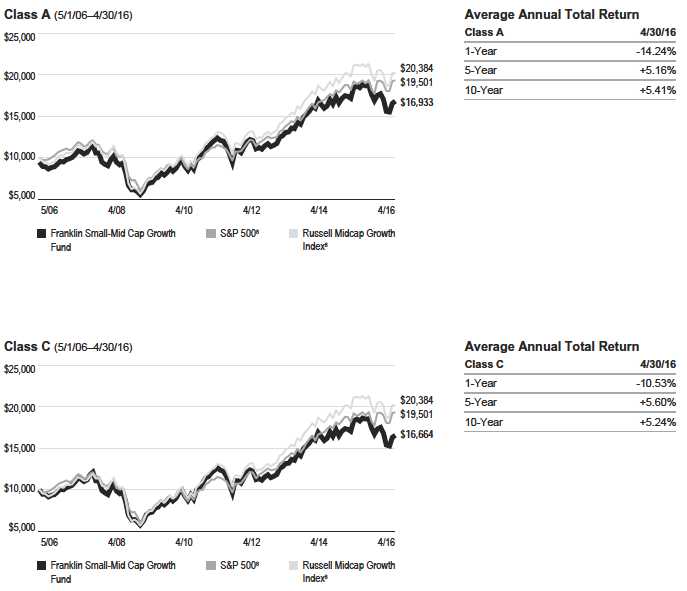
franklintempleton.com
Annual Report
49
FRANKLIN SMALL-MID CAP GROWTH FUND
PERFORMANCE SUMMARY
50 Annual Report
franklintempleton.com
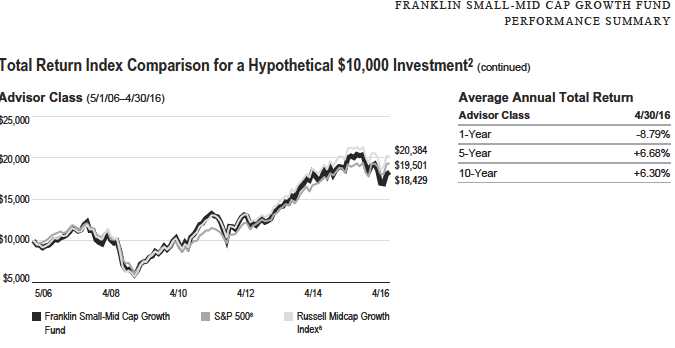
All investments involve risks, including possible loss of principal. Growth stock prices reflect projections of future earnings or revenues, and can, therefore, fall dramatically if the company fails to meet those projections. Smaller, midsized and relatively new or unseasoned companies can be particularly sensitive to changing economic conditions, and their prospects for growth are less certain than those of larger, more established companies. Historically, these securities have experienced more price volatility than larger company stocks, especially over the short term. To the extent the Fund focuses on particular countries, regions, industries, sectors or types of investment from time to time, it may be subject to greater risks of adverse developments in such areas of focus than a fund that invests in a wider variety of countries, regions, industries, sectors or investments. From time to time, the trading market for a particular security or type of security in which the Fund invests may become less liquid or even illiquid. The Fund is actively managed but there is no guarantee that the manager’s investment decisions will produce the desired results. The Fund’s prospectus also includes a description of the main investment risks.
| Class C: | These shares have higher annual fees and expenses than Class A shares. |
| Class R: | Shares are available to certain eligible investors as described in the prospectus. These shares have higher annual fees and expenses than Class A shares. |
| Class R6: | Shares are available to certain eligible investors as described in the prospectus. |
| Advisor Class: | Shares are available to certain eligible investors as described in the prospectus. |
1. The distribution amount is the sum of the dividend payments to shareholders for the period shown and includes only estimated tax-basis capital gain.
2. The Fund has a fee waiver associated with any investment in a Franklin Templeton money fund, contractually guaranteed through at least its current fiscal year-end. Fund
investment results reflect the fee waiver, to the extent applicable; without this reduction, the results would have been lower.
3. Cumulative total return represents the change in value of an investment over the periods indicated.
4. Average annual total return represents the average annual change in value of an investment over the periods indicated. Return for less than one year, if any, has not
been annualized.
5. These figures represent the value of a hypothetical $10,000 investment in the Fund over the periods indicated.
6. In accordance with SEC rules, we provide standardized average annual total return information through the latest calendar quarter.
7. Figures are as stated in the Fund’s current prospectus and may differ from the expense ratios disclosed in the Financial Highlights in this report. In periods of market
volatility, assets may decline significantly, causing total annual Fund operating expenses to become higher than the figures shown.
8. Source: Morningstar. The S&P 500 is a market capitalization-weighted index of 500 stocks designed to measure total U.S. equity market performance. The Russell Midcap
Growth Index is market capitalization weighted and measures performance of those Russell Midcap Index companies with higher price-to-book ratios and higher forecasted
growth values.
See www.franklintempletondatasources.com for additional data provider information.
franklintempleton.com
Annual Report
51
FRANKLIN SMALL-MID CAP GROWTH FUND
Your Fund’s Expenses
As a Fund shareholder, you can incur two types of costs:
- Transaction costs, including sales charges (loads) on Fund purchases; and
- Ongoing Fund costs, including management fees, distribution and service (12b-1) fees, and other Fund expenses. All mutual funds have ongoing costs, sometimes referred to as operating expenses.
The following table shows ongoing costs of investing in the Fund and can help you understand these costs and compare them with those of other mutual funds. The table assumes a $1,000 investment held for the six months indicated.
Actual Fund Expenses
The first line (Actual) for each share class listed in the table provides actual account values and expenses. The “Ending Account Value” is derived from the Fund’s actual return, which includes the effect of Fund expenses.
You can estimate the expenses you paid during the period by following these steps. Of course, your account value and expenses will differ from those in this illustration:
1. Divide your account value by $1,000.
If an account had an $8,600 value, then $8,600 ÷ $1,000 = 8.6.
2. Multiply the result by the number under the heading “Expenses Paid During Period.”
If Expenses Paid During Period were $7.50, then 8.6 × $7.50 = $64.50.
In this illustration, the estimated expenses paid this period are $64.50.
Hypothetical Example for Comparison with Other Funds
Information in the second line (Hypothetical) for each class in the table can help you compare ongoing costs of investing in the Fund with those of other mutual funds. This information may not be used to estimate the actual ending account balance or expenses you paid during the period. The hypothetical “Ending Account Value” is based on the actual expense ratio for each class and an assumed 5% annual rate of return before expenses, which does not represent the Fund’s actual return. The figure under the heading “Expenses Paid During Period” shows the hypothetical expenses your account would have incurred under this scenario. You can compare this figure with the 5% hypothetical examples that appear in shareholder reports of other funds.
Please note that expenses shown in the table are meant to highlight ongoing costs and do not reflect any transaction costs, such as sales charges. Therefore, the second line for each class is useful in comparing ongoing costs only, and will not help you compare total costs of owning different funds. In addition, if transaction costs were included, your total costs would have been higher. Please refer to the Fund prospectus for additional information on operating expenses.
52 Annual Report
franklintempleton.com
FRANKLIN SMALL-MID CAP GROWTH FUND
YOUR FUND’S EXPENSES
| Beginning Account | Ending Account | Expenses Paid During | ||||
| Share Class | Value 11/1/15 | Value 4/30/16 | Period* 11/1/15–4/30/16 | |||
| A | ||||||
| Actual | $ | 1,000 | $ | 959.60 | $ | 4.73 |
| Hypothetical (5% return before expenses) | $ | 1,000 | $ | 1,020.04 | $ | 4.87 |
| C | ||||||
| Actual | $ | 1,000 | $ | 955.50 | $ | 8.41 |
| Hypothetical (5% return before expenses) | $ | 1,000 | $ | 1,016.26 | $ | 8.67 |
| R | ||||||
| Actual | $ | 1,000 | $ | 958.50 | $ | 5.99 |
| Hypothetical (5% return before expenses) | $ | 1,000 | $ | 1,018.75 | $ | 6.17 |
| R6 | ||||||
| Actual | $ | 1,000 | $ | 962.20 | $ | 2.29 |
| Hypothetical (5% return before expenses) | $ | 1,000 | $ | 1,022.53 | $ | 2.36 |
| Advisor | ||||||
| Actual | $ | 1,000 | $ | 960.90 | $ | 3.51 |
| Hypothetical (5% return before expenses) | $ | 1,000 | $ | 1,021.28 | $ | 3.62 |
*Expenses are calculated using the most recent six-month expense ratio, net of expense waivers, annualized for each class (A: 0.97%;
C: 1.73%; R: 1.23%; R6: 0.47%; and Advisor: 0.72%), multiplied by the average account value over the period, multiplied by 182/366 to reflect
the one-half year period.
franklintempleton.com
Annual Report
53
| F R A N K L I N S T R A T E G I C S E R I E S | |||||||||||||||
| Financial Highlights | |||||||||||||||
| Franklin Flex Cap Growth Fund | |||||||||||||||
| Year Ended April 30, | |||||||||||||||
| 2016 | 2015 | 2014 | 2013 | 2012 | |||||||||||
| Class A | |||||||||||||||
| Per share operating performance | |||||||||||||||
| (for a share outstanding throughout the year) | |||||||||||||||
| Net asset value, beginning of year | $ | 51.56 | $ | 53.93 | $ | 51.21 | $ | 51.12 | $ | 52.42 | |||||
| Income from investment operationsa: | |||||||||||||||
| Net investment income (loss)b | (0.23 | ) | (0.21 | ) | (0.16 | ) | 0.04 | c | (0.05 | ) | |||||
| Net realized and unrealized gains (losses) | (2.16 | ) | 6.87 | 11.51 | 1.69 | 0.67 | |||||||||
| Total from investment operations | (2.39 | ) | 6.66 | 11.35 | 1.73 | 0.62 | |||||||||
| Less distributions from: | |||||||||||||||
| Net investment income | — | — | — | (0.01 | ) | — | |||||||||
| Net realized gains | (6.14 | ) | (9.03 | ) | (8.63 | ) | (1.63 | ) | (1.92 | ) | |||||
| Total distributions | (6.14 | ) | (9.03 | ) | (8.63 | ) | (1.64 | ) | (1.92 | ) | |||||
| Net asset value, end of year | $ | 43.03 | $ | 51.56 | $ | 53.93 | $ | 51.21 | $ | 51.12 | |||||
| Total returnd | (5.20 | )% | 13.59 | % | 22.31 | % | 3.70 | % | 1.86 | % | |||||
| Ratios to average net assets | |||||||||||||||
| Expenses before waiver and payments by affiliates | 0.95 | % | 0.94 | % | 0.97 | % | 0.99 | % | 0.98 | % | |||||
| Expenses net of waiver and payments by affiliates | 0.94 | % | 0.94 | %e | 0.97 | %e | 0.99 | % | 0.98 | % | |||||
| Net investment income (loss) | (0.48 | )% | (0.38 | )% | (0.27 | )% | 0.09 | %c | (0.10 | )% | |||||
| Supplemental data | |||||||||||||||
| Net assets, end of year (000’s) | $ | 1,951,973 | $ | 2,245,756 | $ | 2,171,053 | $ | 2,080,349 | $ | 2,094,119 | |||||
| Portfolio turnover rate | 61.36 | % | 74.72 | % | 41.08 | % | 63.09 | % | 49.59 | % | |||||
aThe amount shown for a share outstanding throughout the period may not correlate with the Statement of Operations for the period due to the timing of sales and repurchases
of the Fund’s shares in relation to income earned and/or fluctuating fair value of the investments of the Fund.
bBased on average daily shares outstanding.
cNet investment income per share includes approximately $0.07 per share related to income received in the form of special dividends in connection with certain Fund holdings.
Excluding these amounts, the ratio of net investment income to average net assets would have been (0.06)%.
dTotal return does not reflect sales commissions or contingent deferred sales charges, if applicable.
eBenefit of waiver and payments by affiliates and expense reduction rounds to less than 0.01%.
54 Annual Report | The accompanying notes are an integral part of these financial statements.
franklintempleton.com
FRANKLIN STRATEGIC SERIES
FINANCIAL H IGHLIGHTS
| Franklin Flex Cap Growth Fund (continued) | |||||||||||||||
| Year Ended April 30, | |||||||||||||||
| 2016 | 2015 | 2014 | 2013 | 2012 | |||||||||||
| Class C | |||||||||||||||
| Per share operating performance | |||||||||||||||
| (for a share outstanding throughout the year) | |||||||||||||||
| Net asset value, beginning of year | $ | 43.10 | $ | 46.79 | $ | 45.70 | $ | 46.14 | $ | 47.88 | |||||
| Income from investment operationsa: | |||||||||||||||
| Net investment income (loss)b | (0.49 | ) | (0.53 | ) | (0.52 | ) | (0.29 | )c | (0.37 | ) | |||||
| Net realized and unrealized gains (losses) | (1.77 | ) | 5.87 | 10.24 | 1.48 | 0.55 | |||||||||
| Total from investment operations | (2.26 | ) | 5.34 | 9.72 | 1.19 | 0.18 | |||||||||
| Less distributions from net realized gains | (6.14 | ) | (9.03 | ) | (8.63 | ) | (1.63 | ) | (1.92 | ) | |||||
| Net asset value, end of year | $ | 34.70 | $ | 43.10 | $ | 46.79 | $ | 45.70 | $ | 46.14 | |||||
| Total returnd | (5.94 | )% | 12.76 | % | 21.38 | % | 2.92 | % | 1.10 | % | |||||
| Ratios to average net assets | |||||||||||||||
| Expenses before waiver and payments by affiliates | 1.70 | % | 1.69 | % | 1.72 | % | 1.74 | % | 1.73 | % | |||||
| Expenses net of waiver and payments by affiliates | 1.69 | % | 1.69 | %e | 1.72 | %e | 1.74 | % | 1.73 | % | |||||
| Net investment income (loss) | (1.23 | )% | (1.13 | )% | (1.02 | )% | (0.66 | )%c | (0.85 | )% | |||||
| Supplemental data | |||||||||||||||
| Net assets, end of year (000’s) | $ | 315,556 | $ | 363,532 | $ | 348,040 | $ | 298,253 | $ | 323,249 | |||||
| Portfolio turnover rate | 61.36 | % | 74.72 | % | 41.08 | % | 63.09 | % | 49.59 | % | |||||
aThe amount shown for a share outstanding throughout the period may not correlate with the Statement of Operations for the period due to the timing of sales and repurchases
of the Fund’s shares in relation to income earned and/or fluctuating fair value of the investments of the Fund.
bBased on average daily shares outstanding.
cNet investment income per share includes approximately $0.07 per share related to income received in the form of special dividends in connection with certain Fund holdings.
Excluding these amounts, the ratio of net investment income to average net assets would have been (0.81)%.
dTotal return does not reflect sales commissions or contingent deferred sales charges, if applicable.
eBenefit of waiver and payments by affiliates and expense reduction rounds to less than 0.01%.
franklintempleton.com
The accompanying notes are an integral part of these financial statements. | Annual Report 55
FRANKLIN STRATEGIC SERIES
FINANCIAL H IGHLIGHTS
| Franklin Flex Cap Growth Fund (continued) | |||||||||||||||
| Year Ended April 30, | |||||||||||||||
| 2016 | 2015 | 2014 | 2013 | 2012 | |||||||||||
| Class R | |||||||||||||||
| Per share operating performance | |||||||||||||||
| (for a share outstanding throughout the year) | |||||||||||||||
| Net asset value, beginning of year | $ | 49.22 | $ | 51.99 | $ | 49.74 | $ | 49.82 | $ | 51.27 | |||||
| Income from investment operationsa: | |||||||||||||||
| Net investment income (loss)b | (0.34 | ) | (0.32 | ) | (0.28 | ) | (0.08 | )c | (0.16 | ) | |||||
| Net realized and unrealized gains (losses) | (2.05 | ) | 6.58 | 11.16 | 1.63 | 0.63 | |||||||||
| Total from investment operations | (2.39 | ) | 6.26 | 10.88 | 1.55 | 0.47 | |||||||||
| Less distributions from net realized gains | (6.14 | ) | (9.03 | ) | (8.63 | ) | (1.63 | ) | (1.92 | ) | |||||
| Net asset value, end of year | $ | 40.69 | $ | 49.22 | $ | 51.99 | $ | 49.74 | $ | 49.82 | |||||
| Total return | (5.46 | )% | 13.31 | % | 22.01 | % | 3.43 | % | 1.60 | % | |||||
| Ratios to average net assets | |||||||||||||||
| Expenses before waiver and payments by affiliates | 1.20 | % | 1.19 | % | 1.22 | % | 1.24 | % | 1.23 | % | |||||
| Expenses net of waiver and payments by affiliates | 1.19 | % | 1.19 | %d | 1.22 | %d | 1.24 | % | 1.23 | % | |||||
| Net investment income (loss) | (0.73 | )% | (0.63 | )% | (0.52 | )% | (0.16 | )%c | (0.35 | )% | |||||
| Supplemental data | |||||||||||||||
| Net assets, end of year (000’s) | $ | 30,157 | $ | 45,269 | $ | 56,274 | $ | 63,134 | $ | 76,340 | |||||
| Portfolio turnover rate | 61.36 | % | 74.72 | % | 41.08 | % | 63.09 | % | 49.59 | % | |||||
aThe amount shown for a share outstanding throughout the period may not correlate with the Statement of Operations for the period due to the timing of sales and repurchases
of the Fund’s shares in relation to income earned and/or fluctuating fair value of the investments of the Fund.
bBased on average daily shares outstanding.
cNet investment income per share includes approximately $0.07 per share related to income received in the form of special dividends in connection with certain Fund holdings.
Excluding these amounts, the ratio of net investment income to average net assets would have been (0.31)%.
dBenefit of waiver and payments by affiliates and expense reduction rounds to less than 0.01%.
56 Annual Report | The accompanying notes are an integral part of these financial statements.
franklintempleton.com
FRANKLIN STRATEGIC SERIES
FINANCIAL H IGHLIGHTS
| Franklin Flex Cap Growth Fund (continued) | |||||||||
| Year Ended April 30, | |||||||||
| 2016 | 2015 | 2014 | a | ||||||
| Class R6 | |||||||||
| Per share operating performance | |||||||||
| (for a share outstanding throughout the year) | |||||||||
| Net asset value, beginning of year | $ | 53.67 | $ | 55.54 | $ | 51.70 | |||
| Income from investment operationsb: | |||||||||
| Net investment income (loss)c | (0.01 | ) | 0.06 | 0.11 | |||||
| Net realized and unrealized gains (losses) | (2.26 | ) | 7.10 | 12.36 | |||||
| Total from investment operations | (2.27 | ) | 7.16 | 12.47 | |||||
| Less distributions from net realized gains | (6.14 | ) | (9.03 | ) | (8.63 | ) | |||
| Net asset value, end of year | $ | 45.26 | $ | 53.67 | $ | 55.54 | |||
| Total return | (4.75 | )% | 14.12 | % | 24.32 | % | |||
| Ratios to average net assets | |||||||||
| Expenses before waiver and payments by affiliates | 0.48 | % | 0.48 | % | 0.48 | % | |||
| Expenses net of waiver and payments by affiliates | 0.47 | % | 0.48 | %d | 0.48 | %d | |||
| Net investment income (loss) | (0.01 | )% | 0.08 | % | 0.22 | % | |||
| Supplemental data | |||||||||
| Net assets, end of year (000’s) | $ | 185,995 | $ | 295,822 | $ | 376,607 | |||
| Portfolio turnover rate | 61.36 | % | 74.72 | % | 41.08 | % | |||
aFor the year May 1, 2013 (effective date) to April 30, 2014.
bThe amount shown for a share outstanding throughout the period may not correlate with the Statement of Operations for the period due to the timing of sales and repurchases
of the Fund’s shares in relation to income earned and/or fluctuating fair value of the investments of the Fund.
cBased on average daily shares outstanding.
dBenefit of waiver and payments by affiliates and expense reduction rounds to less than 0.01%.
franklintempleton.com
The accompanying notes are an integral part of these financial statements. | Annual Report 57
FRANKLIN STRATEGIC SERIES
FINANCIAL H IGHLIGHTS
| Franklin Flex Cap Growth Fund (continued) | |||||||||||||||
| Year Ended April 30, | |||||||||||||||
| 2016 | 2015 | 2014 | 2013 | 2012 | |||||||||||
| Advisor Class | |||||||||||||||
| Per share operating performance | |||||||||||||||
| (for a share outstanding throughout the year) | |||||||||||||||
| Net asset value, beginning of year | $ | 53.38 | $ | 55.40 | $ | 52.29 | $ | 52.12 | $ | 53.26 | |||||
| Income from investment operationsa: | |||||||||||||||
| Net investment income (loss)b | (0.12 | ) | (0.08 | ) | 0.03 | 0.18 | c | 0.07 | |||||||
| Net realized and unrealized gains (losses) | (2.24 | ) | 7.09 | 11.71 | 1.71 | 0.71 | |||||||||
| Total from investment operations | (2.36 | ) | 7.01 | 11.74 | 1.89 | 0.78 | |||||||||
| Less distributions from: | |||||||||||||||
| Net investment income | — | — | — | (0.09 | ) | — | |||||||||
| Net realized gains | (6.14 | ) | (9.03 | ) | (8.63 | ) | (1.63 | ) | (1.92 | ) | |||||
| Total distributions | (6.14 | ) | (9.03 | ) | (8.63 | ) | (1.72 | ) | (1.92 | ) | |||||
| Net asset value, end of year | $ | 44.88 | $ | 53.38 | $ | 55.40 | $ | 52.29 | $ | 52.12 | |||||
| Total return | (4.96 | )% | 13.88 | % | 22.63 | % | 3.94 | % | 2.13 | % | |||||
| Ratios to average net assets | |||||||||||||||
| Expenses before waiver and payments by affiliates | 0.70 | % | 0.69 | % | 0.72 | % | 0.74 | % | 0.73 | % | |||||
| Expenses net of waiver and payments by affiliates | 0.69 | % | 0.69 | %d | 0.72 | %d | 0.74 | % | 0.73 | % | |||||
| Net investment income (loss) | (0.23 | )% | (0.13 | )% | (0.02 | )%e | 0.34 | %c | 0.15 | % | |||||
| Supplemental data | |||||||||||||||
| Net assets, end of year (000’s) | $ | 304,027 | $ | 393,961 | $ | 329,671 | $ | 836,225 | $ | 1,162,624 | |||||
| Portfolio turnover rate | 61.36 | % | 74.72 | % | 41.08 | % | 63.09 | % | 49.59 | % | |||||
aThe amount shown for a share outstanding throughout the period may not correlate with the Statement of Operations for the period due to the timing of sales and repurchases
of the Fund’s shares in relation to income earned and/or fluctuating fair value of the investments of the Fund.
bBased on average daily shares outstanding.
cNet investment income per share includes approximately $0.07 per share related to income received in the form of special dividends in connection with certain Fund holdings.
Excluding these amounts, the ratio of net investment income to average net assets would have been 0.19%.
dBenefit of waiver and payments by affiliates and expense reduction rounds to less than 0.01%.
eRatio is calculated based on the Fund level net investment income, and adjusted for class specific expenses. The amount may not correlate with the per share amount due to
the timing of income earned and/or fluctuating fair value of the investments of the Fund in relation to the timing of sales and repurchases of Fund shares.
58 Annual Report | The accompanying notes are an integral part of these financial statements.
franklintempleton.com
FRANKLIN STRATEGIC SERIES
| Statement of Investments, April 30, 2016 | |||
| Franklin Flex Cap Growth Fund | |||
| Shares | Value | ||
| Common Stocks 96.8% | |||
| Aerospace & Defense 0.8% | |||
| Honeywell International Inc | 200,000 | $ | 22,854,000 |
| Airlines 0.4% | |||
| a Spirit Airlines Inc | 225,000 | 9,884,250 | |
| Automobiles 0.6% | |||
| a,b Tesla Motors Inc | 75,000 | 18,057,000 | |
| Banks 3.0% | |||
| a Signature Bank | 460,000 | 63,401,800 | |
| a SVB Financial Group | 190,000 | 19,813,200 | |
| 83,215,000 | |||
| Beverages 4.1% | |||
| Constellation Brands Inc., A | 435,000 | 67,886,100 | |
| a Monster Beverage Corp | 330,000 | 47,592,600 | |
| 115,478,700 | |||
| Biotechnology 4.2% | |||
| a Biogen Inc | 110,000 | 30,248,900 | |
| a Celgene Corp | 725,000 | 74,972,250 | |
| a Regeneron Pharmaceuticals Inc | 35,000 | 13,184,850 | |
| 118,406,000 | |||
| Building Products 2.4% | |||
| Fortune Brands Home & Security Inc | 1,200,000 | 66,492,000 | |
| Capital Markets 1.0% | |||
| a Affiliated Managers Group Inc | 165,000 | 28,102,800 | |
| Chemicals 1.5% | |||
| Ecolab Inc | 375,000 | 43,117,500 | |
| Commercial Services & Supplies 0.5% | |||
| a Stericycle Inc | 150,000 | 14,334,000 | |
| Communications Equipment 3.9% | |||
| Harris Corp | 610,000 | 48,806,100 | |
| a Palo Alto Networks Inc | 400,000 | 60,348,000 | |
| 109,154,100 | |||
| Consumer Finance 0.5% | |||
| a PRA Group Inc | 450,000 | 14,931,000 | |
| Diversified Financial Services 1.3% | |||
| Intercontinental Exchange Inc | 150,000 | 36,004,500 | |
| Food & Staples Retailing 1.1% | |||
| CVS Health Corp | 300,000 | 30,150,000 | |
| Health Care Equipment & Supplies 3.2% | |||
| a DexCom Inc | 210,000 | 13,519,800 | |
| a Edwards Lifesciences Corp | 350,000 | 37,173,500 | |
| Medtronic PLC | 310,000 | 24,536,500 | |
| a Nevro Corp | 200,000 | 13,450,000 | |
| 88,679,800 | |||
| Health Care Providers & Services 2.5% | |||
| a Envision Healthcare Holdings Inc | 700,000 | 15,841,000 | |
| McKesson Corp | 325,000 | 54,541,500 | |
| 70,382,500 | |||
franklintempleton.com
Annual Report
59
FRANKLIN STRATEGIC SERIES
STATEMENT O F INVESTMENTS
| Franklin Flex Cap Growth Fund (continued) | |||
| Shares | Value | ||
| Common Stocks (continued) | |||
| Health Care Technology 0.8% | |||
| a Cerner Corp | 375,000 | $ | 21,052,500 |
| Hotels, Restaurants & Leisure 1.9% | |||
| Starbucks Corp | 950,000 | 53,418,500 | |
| Household Durables 2.1% | |||
| a TRI Pointe Group Inc | 5,000,000 | 58,000,000 | |
| Industrial Conglomerates 0.9% | |||
| Roper Technologies Inc | 150,000 | 26,413,500 | |
| Internet & Catalog Retail 5.4% | |||
| a Amazon.com Inc | 150,000 | 98,938,500 | |
| a The Priceline Group Inc | 37,500 | 50,387,250 | |
| 149,325,750 | |||
| Internet Software & Services 10.4% | |||
| a Alphabet Inc., C | 145,000 | 100,486,450 | |
| a CoStar Group Inc | 135,000 | 26,636,850 | |
| a Envestnet Inc | 246,627 | 7,739,155 | |
| a Facebook Inc., A | 1,175,000 | 138,156,500 | |
| a LinkedIn Corp., A | 125,000 | 15,663,750 | |
| 288,682,705 | |||
| IT Services 8.5% | |||
| a Cognizant Technology Solutions Corp., A | 325,000 | 18,970,250 | |
| a EPAM Systems Inc | 325,000 | 23,702,250 | |
| a FleetCor Technologies Inc | 290,000 | 44,857,200 | |
| MasterCard Inc., A | 955,000 | 92,625,450 | |
| Visa Inc., A | 725,000 | 55,999,000 | |
| 236,154,150 | |||
| Life Sciences Tools & Services 0.5% | |||
| a Illumina Inc | 100,000 | 13,499,000 | |
| Media 3.5% | |||
| a,b Charter Communications Inc., A | 110,000 | 23,346,400 | |
| a Global Eagle Entertainment Inc | 1,000,000 | 8,010,000 | |
| a IMAX Corp | 425,000 | 13,600,000 | |
| The Walt Disney Co | 500,000 | 51,630,000 | |
| 96,586,400 | |||
| Oil, Gas & Consumable Fuels 1.0% | |||
| Cabot Oil & Gas Corp., A | 1,200,000 | 28,080,000 | |
| Pharmaceuticals 2.6% | |||
| a Allergan PLC | 100,000 | 21,656,000 | |
| Bristol-Myers Squibb Co | 615,000 | 44,390,700 | |
| a Revance Therapeutics Inc | 300,000 | 5,514,000 | |
| 71,560,700 | |||
| Professional Services 1.2% | |||
| a IHS Inc., A | 260,000 | 32,026,800 | |
| Real Estate Investment Trusts (REITs) 2.4% | |||
| American Tower Corp | 285,000 | 29,890,800 | |
| Equinix Inc | 110,000 | 36,338,500 | |
| 66,229,300 | |||
60 Annual Report
franklintempleton.com
FRANKLIN STRATEGIC SERIES
STATEMENT O F INVESTMENTS
| Franklin Flex Cap Growth Fund (continued) | ||||
| Shares | Value | |||
| Common Stocks (continued) | ||||
| Semiconductors & Semiconductor Equipment 4.4% | ||||
| a Cavium Inc | 550,000 | $ | 27,153,500 | |
| a M/A-COM Technology Solutions Holdings Inc | 475,000 | 19,422,751 | ||
| a Nanometrics Inc | 500,000 | 8,930,000 | ||
| a NXP Semiconductors NV (Netherlands) | 790,000 | 67,371,200 | ||
| 122,877,451 | ||||
| Software 11.2% | ||||
| a Electronic Arts Inc | 225,000 | 13,916,250 | ||
| a Ellie Mae Inc | 175,000 | 14,630,000 | ||
| Microsoft Corp | 825,000 | 41,142,750 | ||
| a,b Mobileye NV | 400,000 | 15,260,000 | ||
| a Paylocity Holding Corp | 1,000,000 | 38,270,000 | ||
| a Salesforce.com Inc | 750,000 | 56,850,000 | ||
| a ServiceNow Inc | 900,000 | 64,332,000 | ||
| a Tyler Technologies Inc | 325,000 | 47,583,250 | ||
| a Zendesk Inc | 950,000 | 21,470,000 | ||
| 313,454,250 | ||||
| Specialty Retail 1.6% | ||||
| Advance Auto Parts Inc | 125,000 | 19,512,500 | ||
| Tractor Supply Co | 250,000 | 23,665,000 | ||
| 43,177,500 | ||||
| Technology Hardware, Storage & Peripherals 2.2% | ||||
| Apple Inc | 650,000 | 60,931,000 | ||
| Textiles, Apparel & Luxury Goods 2.9% | ||||
| NIKE Inc., B | 1,025,000 | 60,413,500 | ||
| a Under Armour Inc., A | 250,000 | 10,985,000 | ||
| a Under Armour Inc., C | 250,000 | 10,200,000 | ||
| 81,598,500 | ||||
| Trading Companies & Distributors 2.3% | ||||
| a HD Supply Holdings Inc | 1,900,000 | 65,132,000 | ||
| Total Common Stocks (Cost $1,828,064,783) | 2,697,443,156 | |||
| Short Term Investments 5.6% | ||||
| Money Market Funds (Cost $95,875,266) 3.4% | ||||
| a,c Institutional Fiduciary Trust Money Market Portfolio | 95,875,266 | 95,875,266 | ||
| d Investments from Cash Collateral Received for Loaned Securities 2.2% | ||||
| Money Market Funds (Cost $61,292,950) | ||||
| a,c Institutional Fiduciary Trust Money Market Portfolio | 61,292,950 | 61,292,950 | ||
| Total Investments (Cost $1,985,232,999) 102.4% | 2,854,611,372 | |||
| Other Assets, less Liabilities (2.4)% | (66,903,205 | ) | ||
| Net Assets 100.0% | $ | 2,787,708,167 | ||
| aNon-income producing. | ||||
| bA portion or all of the security is on loan at April 30, 2016. See Note 1(c). | ||||
| cSee Note 3(f) regarding investments in affiliated management investment companies. | ||||
| dSee Note 1(c) regarding securities on loan. | ||||
franklintempleton.com
The accompanying notes are an integral part of these financial statements. | Annual Report 61
FRANKLIN STRATEGIC SERIES
| Financial Highlights | |||||||||||||||
| Franklin Focused Core Equity Fund | |||||||||||||||
| Year Ended April 30, | |||||||||||||||
| 2016 | 2015 | 2014 | 2013 | 2012 | |||||||||||
| Class A | |||||||||||||||
| Per share operating performance | |||||||||||||||
| (for a share outstanding throughout the year) | |||||||||||||||
| Net asset value, beginning of year | $ | 15.29 | $ | 13.38 | $ | 10.63 | $ | 9.47 | $ | 10.35 | |||||
| Income from investment operationsa: | |||||||||||||||
| Net investment income (loss)b | 0.07 | c | (0.01 | ) | 0.03 | 0.07 | 0.02 | ||||||||
| Net realized and unrealized gains (losses) | (1.83 | ) | 2.23 | 2.92 | 1.16 | (0.31 | ) | ||||||||
| Total from investment operations | (1.76 | ) | 2.22 | 2.95 | 1.23 | (0.29 | ) | ||||||||
| Less distributions from: | |||||||||||||||
| Net investment income | (0.06 | ) | — | (0.07 | ) | — | (0.11 | ) | |||||||
| Net realized gains | (0.35 | ) | (0.31 | ) | (0.13 | ) | (0.07 | ) | (0.48 | ) | |||||
| Total distributions | (0.41 | ) | (0.31 | ) | (0.20 | ) | (0.07 | ) | (0.59 | ) | |||||
| Net asset value, end of year | $ | 13.12 | $ | 15.29 | $ | 13.38 | $ | 10.63 | $ | 9.47 | |||||
| Total returnd | (11.70 | )% | 16.84 | % | 28.00 | % | 13.08 | % | (2.17 | )% | |||||
| Ratios to average net assets | |||||||||||||||
| Expenses before waiver and payments by affiliates | 1.46 | % | 1.54 | % | 1.73 | % | 1.89 | % | 1.81 | % | |||||
| Expenses net of waiver and payments by affiliates | 1.25 | % | 1.28 | % | 1.22 | % | 1.19 | % | 1.21 | % | |||||
| Net investment income (loss) | 0.48 | %c | (0.07 | )% | 0.23 | % | 0.76 | % | 0.25 | % | |||||
| Supplemental data | |||||||||||||||
| Net assets, end of year (000’s) | $ | 100,483 | $ | 92,612 | $ | 40,372 | $ | 19,029 | $ | 26,253 | |||||
| Portfolio turnover rate | 35.56 | % | 25.55 | % | 43.30 | % | 74.50 | % | 51.85 | % | |||||
aThe amount shown for a share outstanding throughout the period may not correlate with the Statement of Operations for the period due to the timing of sales and repurchases
of the Fund’s shares in relation to income earned and/or fluctuating fair value of the investments of the Fund.
bBased on average daily shares outstanding.
cNet investment income per share includes approximately $0.06 per share related to income received in the form of special dividends in connection with certain Fund holdings.
Excluding these amounts, the ratio of net investment income to average net assets would have been 0.02%.
dTotal return does not reflect sales commissions or contingent deferred sales charges, if applicable.
62 Annual Report | The accompanying notes are an integral part of these financial statements.
franklintempleton.com
FRANKLIN STRATEGIC SERIES
FINANCIAL H IGHLIGHTS
| Franklin Focused Core Equity Fund (continued) | |||||||||||||||
| Year Ended April 30, | |||||||||||||||
| 2016 | 2015 | 2014 | 2013 | 2012 | |||||||||||
| Class C | |||||||||||||||
| Per share operating performance | |||||||||||||||
| (for a share outstanding throughout the year) | |||||||||||||||
| Net asset value, beginning of year | $ | 14.73 | $ | 12.98 | $ | 10.36 | $ | 9.29 | $ | 10.14 | |||||
| Income from investment operationsa: | |||||||||||||||
| Net investment income (loss)b | (0.04 | )c | (0.11 | ) | (0.06 | ) | 0.01 | (0.04 | ) | ||||||
| Net realized and unrealized gains (losses) | (1.76 | ) | 2.17 | 2.84 | 1.13 | (0.29 | ) | ||||||||
| Total from investment operations | (1.80 | ) | 2.06 | 2.78 | 1.14 | (0.33 | ) | ||||||||
| Less distributions from: | |||||||||||||||
| Net investment income | — | — | (0.03 | ) | — | (0.04 | ) | ||||||||
| Net realized gains | (0.35 | ) | (0.31 | ) | (0.13 | ) | (0.07 | ) | (0.48 | ) | |||||
| Total distributions | (0.35 | ) | (0.31 | ) | (0.16 | ) | (0.07 | ) | (0.52 | ) | |||||
| Net asset value, end of year | $ | 12.58 | $ | 14.73 | $ | 12.98 | $ | 10.36 | $ | 9.29 | |||||
| Total returnd | (12.31 | )% | 16.12 | % | 26.99 | % | 12.36 | % | (2.66 | )% | |||||
| Ratios to average net assets | |||||||||||||||
| Expenses before waiver and payments by affiliates | 2.20 | % | 2.24 | % | 2.43 | % | 2.59 | % | 2.50 | % | |||||
| Expenses net of waiver and payments by affiliates | 1.99 | % | 1.98 | % | 1.92 | % | 1.89 | % | 1.90 | % | |||||
| Net investment income (loss) | (0.26 | )%c | (0.77 | )% | (0.47 | )% | 0.06 | % | (0.44 | )% | |||||
| Supplemental data | |||||||||||||||
| Net assets, end of year (000’s) | $ | 25,119 | $ | 18,758 | $ | 6,666 | $ | 2,502 | $ | 3,265 | |||||
| Portfolio turnover rate | 35.56 | % | 25.55 | % | 43.30 | % | 74.50 | % | 51.85 | % | |||||
aThe amount shown for a share outstanding throughout the period may not correlate with the Statement of Operations for the period due to the timing of sales and repurchases
of the Fund’s shares in relation to income earned and/or fluctuating fair value of the investments of the Fund.
bBased on average daily shares outstanding.
cNet investment income per share includes approximately $0.06 per share related to income received in the form of special dividends in connection with certain Fund holdings.
Excluding these amounts, the ratio of net investment income to average net assets would have been (0.72)%.
dTotal return does not reflect sales commissions or contingent deferred sales charges, if applicable.
franklintempleton.com
The accompanying notes are an integral part of these financial statements. | Annual Report 63
FRANKLIN STRATEGIC SERIES
FINANCIAL H IGHLIGHTS
| Franklin Focused Core Equity Fund (continued) | |||||||||||||||
| Year Ended April 30, | |||||||||||||||
| 2016 | 2015 | 2014 | 2013 | 2012 | |||||||||||
| Class R | |||||||||||||||
| Per share operating performance | |||||||||||||||
| (for a share outstanding throughout the year) | |||||||||||||||
| Net asset value, beginning of year | $ | 15.15 | $ | 13.28 | $ | 10.56 | $ | 9.43 | $ | 10.30 | |||||
| Income from investment operationsa: | |||||||||||||||
| Net investment income (loss)b | 0.03 | c | (0.04 | ) | 0.01 | 0.05 | 0.02 | ||||||||
| Net realized and unrealized gains (losses) | (1.81 | ) | 2.22 | 2.90 | 1.15 | (0.32 | ) | ||||||||
| Total from investment operations | (1.78 | ) | 2.18 | 2.91 | 1.20 | (0.30 | ) | ||||||||
| Less distributions from: | |||||||||||||||
| Net investment income | (0.04 | ) | — | (0.06 | ) | — | (0.09 | ) | |||||||
| Net realized gains | (0.35 | ) | (0.31 | ) | (0.13 | ) | (0.07 | ) | (0.48 | ) | |||||
| Total distributions | (0.39 | ) | (0.31 | ) | (0.19 | ) | (0.07 | ) | (0.57 | ) | |||||
| Net asset value, end of year | $ | 12.98 | $ | 15.15 | $ | 13.28 | $ | 10.56 | $ | 9.43 | |||||
| Total return | (11.91 | )% | 16.66 | % | 27.70 | % | 12.81 | % | (2.22 | )% | |||||
| Ratios to average net assets | |||||||||||||||
| Expenses before waiver and payments by affiliates | 1.69 | % | 1.74 | % | 1.93 | % | 2.09 | % | 1.99 | % | |||||
| Expenses net of waiver and payments by affiliates | 1.48 | % | 1.48 | % | 1.42 | % | 1.39 | % | 1.39 | % | |||||
| Net investment income (loss) | 0.25 | %c | (0.27 | )% | 0.03 | % | 0.56 | % | 0.07 | % | |||||
| Supplemental data | |||||||||||||||
| Net assets, end of year (000’s) | $ | 273 | $ | 169 | $ | 124 | $ | 76 | $ | 41 | |||||
| Portfolio turnover rate | 35.56 | % | 25.55 | % | 43.30 | % | 74.50 | % | 51.85 | % | |||||
aThe amount shown for a share outstanding throughout the period may not correlate with the Statement of Operations for the period due to the timing of sales and repurchases
of the Fund’s shares in relation to income earned and/or fluctuating fair value of the investments of the Fund.
bBased on average daily shares outstanding.
cNet investment income per share includes approximately $0.06 per share related to income received in the form of special dividends in connection with certain Fund holdings.
Excluding these amounts, the ratio of net investment income to average net assets would have been (0.21)%.
64 Annual Report | The accompanying notes are an integral part of these financial statements.
franklintempleton.com
FRANKLIN STRATEGIC SERIES
FINANCIAL H IGHLIGHTS
| Franklin Focused Core Equity Fund (continued) | |||||||||
| Year Ended April 30, | |||||||||
| 2016 | 2015 | 2014 | a | ||||||
| Class R6 | |||||||||
| Per share operating performance | |||||||||
| (for a share outstanding throughout the year) | |||||||||
| Net asset value, beginning of year | $ | 15.46 | $ | 13.49 | $ | 10.54 | |||
| Income from investment operationsb: | |||||||||
| Net investment incomec | 0.12 | d | 0.05 | 0.07 | |||||
| Net realized and unrealized gains (losses) | (1.85 | ) | 2.27 | 3.11 | |||||
| Total from investment operations | (1.73 | ) | 2.32 | 3.18 | |||||
| Less distributions from: | |||||||||
| Net investment income | (0.11 | ) | (0.04 | ) | (0.10 | ) | |||
| Net realized gains | (0.35 | ) | (0.31 | ) | (0.13 | ) | |||
| Total distributions | (0.46 | ) | (0.35 | ) | (0.23 | ) | |||
| Net asset value, end of year | $ | 13.27 | $ | 15.46 | $ | 13.49 | |||
| Total return | (11.32 | )% | 17.45 | % | 30.43 | % | |||
| Ratios to average net assets | |||||||||
| Expenses before waiver and payments by affiliates | 1.04 | % | 1.09 | % | 2.28 | % | |||
| Expenses net of waiver and payments by affiliates | 0.85 | % | 0.83 | % | 0.77 | % | |||
| Net investment income | 0.88 | %d | 0.38 | % | 0.68 | % | |||
| Supplemental data | |||||||||
| Net assets, end of year (000’s) | $ | 33,640 | $ | 25,739 | $ | 14 | |||
| Portfolio turnover rate | 35.56 | % | 25.55 | % | 43.30 | % | |||
aFor the year May 1, 2013 (effective date) to April 30, 2014.
bThe amount shown for a share outstanding throughout the period may not correlate with the Statement of Operations for the period due to the timing of sales and repurchases
of the Fund’s shares in relation to income earned and/or fluctuating fair value of the investments of the Fund.
cBased on average daily shares outstanding.
dNet investment income per share includes approximately $0.06 per share related to income received in the form of special dividends in connection with certain Fund holdings.
Excluding these amounts, the ratio of net investment income to average net assets would have been 0.42%.
franklintempleton.com
The accompanying notes are an integral part of these financial statements. | Annual Report 65
FRANKLIN STRATEGIC SERIES
FINANCIAL H IGHLIGHTS
| Franklin Focused Core Equity Fund (continued) | |||||||||||||||
| Year Ended April 30, | |||||||||||||||
| 2016 | 2015 | 2014 | 2013 | 2012 | |||||||||||
| Advisor Class | |||||||||||||||
| Per share operating performance | |||||||||||||||
| (for a share outstanding throughout the year) | |||||||||||||||
| Net asset value, beginning of year | $ | 15.44 | $ | 13.48 | $ | 10.70 | $ | 9.50 | $ | 10.37 | |||||
| Income from investment operationsa: | |||||||||||||||
| Net investment incomeb | 0.10 | c | 0.04 | 0.07 | 0.10 | 0.06 | |||||||||
| Net realized and unrealized gains (losses) | (1.85 | ) | 2.25 | 2.93 | 1.17 | (0.32 | ) | ||||||||
| Total from investment operations | (1.75 | ) | 2.29 | 3.00 | 1.27 | (0.26 | ) | ||||||||
| Less distributions from: | |||||||||||||||
| Net investment income | (0.09 | ) | (0.02 | ) | (0.09 | ) | — | (0.13 | ) | ||||||
| Net realized gains | (0.35 | ) | (0.31 | ) | (0.13 | ) | (0.07 | ) | (0.48 | ) | |||||
| Total distributions | (0.44 | ) | (0.33 | ) | (0.22 | ) | (0.07 | ) | (0.61 | ) | |||||
| Net asset value, end of year | $ | 13.25 | $ | 15.44 | $ | 13.48 | $ | 10.70 | $ | 9.50 | |||||
| Total return | (11.45 | )% | 17.25 | % | 28.27 | % | 13.46 | % | (1.80 | )% | |||||
| Ratios to average net assets | |||||||||||||||
| Expenses before waiver and payments by affiliates | 1.20 | % | 1.24 | % | 1.43 | % | 1.59 | % | 1.49 | % | |||||
| Expenses net of waiver and payments by affiliates | 0.99 | % | 0.98 | % | 0.92 | % | 0.89 | % | 0.89 | % | |||||
| Net investment income | 0.74 | %c | 0.23 | % | 0.53 | % | 1.06 | % | 0.57 | % | |||||
| Supplemental data | |||||||||||||||
| Net assets, end of year (000’s) | $ | 10,736 | $ | 9,914 | $ | 6,990 | $ | 4,347 | $ | 3,188 | |||||
| Portfolio turnover rate | 35.56 | % | 25.55 | % | 43.30 | % | 74.50 | % | 51.85 | % | |||||
aThe amount shown for a share outstanding throughout the period may not correlate with the Statement of Operations for the period due to the timing of sales and repurchases
of the Fund’s shares in relation to income earned and/or fluctuating fair value of the investments of the Fund.
bBased on average daily shares outstanding.
cNet investment income per share includes approximately $0.06 per share related to income received in the form of special dividends in connection with certain Fund holdings.
Excluding these amounts, the ratio of net investment income to average net assets would have been 0.28%.
66 Annual Report | The accompanying notes are an integral part of these financial statements.
franklintempleton.com
FRANKLIN STRATEGIC SERIES
| Statement of Investments, April 30, 2016 | ||||
| Franklin Focused Core Equity Fund | ||||
| Country | Shares | Value | ||
| Common Stocks 101.1% | ||||
| Consumer Discretionary 10.5% | ||||
| a Altice NV, A | Netherlands | 290,500 | $ | 4,407,826 |
| BorgWarner Inc | United States | 84,070 | 3,019,794 | |
| Twenty-First Century Fox Inc., B | United States | 221,470 | 6,670,676 | |
| The Walt Disney Co | United States | 37,110 | 3,831,979 | |
| 17,930,275 | ||||
| Consumer Staples 3.3% | ||||
| CVS Health Corp | United States | 56,190 | 5,647,095 | |
| Energy 9.1% | ||||
| Anadarko Petroleum Corp | United States | 87,240 | 4,602,782 | |
| Pioneer Natural Resources Co | United States | 34,740 | 5,770,314 | |
| Schlumberger Ltd | United States | 63,040 | 5,064,634 | |
| 15,437,730 | ||||
| Financials 34.7% | ||||
| BlackRock Inc | United States | 14,747 | 5,254,798 | |
| a CBRE Group Inc | United States | 167,030 | 4,949,099 | |
| The Charles Schwab Corp | United States | 228,880 | 6,502,481 | |
| Citigroup Inc | United States | 97,820 | 4,527,110 | |
| Equinix Inc | United States | 24,851 | 8,209,528 | |
| The Hartford Financial Services Group Inc | United States | 175,280 | 7,778,926 | |
| JPMorgan Chase & Co | United States | 83,313 | 5,265,382 | |
| LPL Financial Holdings Inc | United States | 69,800 | 1,842,720 | |
| Moody’s Corp | United States | 21,970 | 2,102,968 | |
| a Synchrony Financial | United States | 167,655 | 5,125,213 | |
| Willis Towers Watson PLC | United States | 60,200 | 7,518,980 | |
| 59,077,205 | ||||
| Health Care 14.6% | ||||
| Aetna Inc | United States | 53,480 | 6,004,200 | |
| a Allergan PLC | United States | 45,084 | 9,763,391 | |
| a Horizon Pharma PLC | United States | 198,810 | 3,055,710 | |
| Medtronic PLC | United States | 56,450 | 4,468,017 | |
| a Valeant Pharmaceuticals International Inc | United States | 44,260 | 1,476,514 | |
| 24,767,832 | ||||
| Industrials 4.9% | ||||
| The ADT Corp | United States | 10,380 | 435,752 | |
| a Genesee & Wyoming Inc | United States | 93,010 | 6,055,881 | |
| a IHS Inc., A | United States | 15,310 | 1,885,886 | |
| 8,377,519 | ||||
| Information Technology 23.0% | ||||
| a Adobe Systems Inc | United States | 62,810 | 5,917,958 | |
| a Alphabet Inc., A | United States | 4,560 | 3,227,933 | |
| a Alphabet Inc., C | United States | 4,770 | 3,305,658 | |
| a Blackhawk Network Holdings Inc | United States | 60,670 | 1,949,327 | |
| MasterCard Inc., A | United States | 57,670 | 5,593,413 | |
| Microsoft Corp | United States | 180,690 | 9,011,010 | |
| Motorola Solutions Inc | United States | 54,130 | 4,070,035 | |
| QUALCOMM Inc | United States | 120,370 | 6,081,093 | |
| 39,156,427 | ||||
franklintempleton.com
Annual Report
67
FRANKLIN STRATEGIC SERIES
STATEMENT O F INVESTMENTS
| Franklin Focused Core Equity Fund (continued) | |||||
| Country | Shares | Value | |||
| Common Stocks (continued) | |||||
| Materials 1.0% | |||||
| Agrium Inc | Canada | 20,510 | $ | 1,766,321 | |
| Total Common Stocks (Cost $169,938,110) | 172,160,404 | ||||
| Other Assets, less Liabilities (1.1)% | (1,909,302 | ) | |||
| Net Assets 100.0% | $ | 170,251,102 |
aNon-income producing.
68 Annual Report | The accompanying notes are an integral part of these financial statements.
franklintempleton.com
FRANKLIN STRATEGIC SERIES
| Financial Highlights | |||||||||||||||
| Franklin Growth Opportunities Fund | |||||||||||||||
| Year Ended April 30, | |||||||||||||||
| 2016 | 2015 | 2014 | 2013 | 2012 | |||||||||||
| Class A | |||||||||||||||
| Per share operating performance | |||||||||||||||
| (for a share outstanding throughout the year) | |||||||||||||||
| Net asset value, beginning of year | $ | 33.13 | $ | 28.48 | $ | 24.29 | $ | 23.02 | $ | 24.28 | |||||
| Income from investment operationsa: | |||||||||||||||
| Net investment income (loss)b | (0.19 | ) | (0.19 | ) | (0.19 | ) | (0.12 | ) | (0.16 | ) | |||||
| Net realized and unrealized gains (losses) | (1.88 | ) | 5.50 | 5.11 | 1.95 | 0.40 | |||||||||
| Total from investment operations | (2.07 | ) | 5.31 | 4.92 | 1.83 | 0.24 | |||||||||
| Less distributions from net realized gains | (0.66 | ) | (0.66 | ) | (0.73 | ) | (0.56 | ) | (1.50 | ) | |||||
| Net asset value, end of year | $ | 30.40 | $ | 33.13 | $ | 28.48 | $ | 24.29 | $ | 23.02 | |||||
| Total returnc | (6.36 | )% | 18.87 | % | 20.26 | % | 8.29 | % | 1.90 | % | |||||
| Ratios to average net assets | |||||||||||||||
| Expenses before waiver and payments by affiliates | 1.11 | % | 1.18 | % | 1.17 | % | 1.25 | % | 1.28 | % | |||||
| Expenses net of waiver and payments by affiliates | 1.10 | % | 1.18 | %d | 1.17 | %d,e | 1.25 | % | 1.28 | % | |||||
| Net investment income (loss) | (0.58 | )% | (0.59 | )% | (0.70 | )% | (0.56 | )% | (0.71 | )% | |||||
| Supplemental data | |||||||||||||||
| Net assets, end of year (000’s) | $ | 548,871 | $ | 457,619 | $ | 349,343 | $ | 213,639 | $ | 209,382 | |||||
| Portfolio turnover rate | 25.56 | % | 40.64 | % | 36.64 | % | 58.76 | % | 63.57 | % | |||||
aThe amount shown for a share outstanding throughout the period may not correlate with the Statement of Operations for the period due to the timing of sales and repurchases
of the Fund’s shares in relation to income earned and/or fluctuating fair value of the investments of the Fund.
bBased on average daily shares outstanding.
cTotal return does not reflect sales commissions or contingent deferred sales charges, if applicable.
dBenefit of waiver and payments by affiliates rounds to less than 0.01%.
eBenefit of expense reduction rounds to less than 0.01%.
franklintempleton.com
The accompanying notes are an integral part of these financial statements. | Annual Report 69
FRANKLIN STRATEGIC SERIES
FINANCIAL H IGHLIGHTS
| Franklin Growth Opportunities Fund (continued) | |||||||||||||||
| Year Ended April 30, | |||||||||||||||
| 2016 | 2015 | 2014 | 2013 | 2012 | |||||||||||
| Class C | |||||||||||||||
| Per share operating performance | |||||||||||||||
| (for a share outstanding throughout the year) | |||||||||||||||
| Net asset value, beginning of year | $ | 29.27 | $ | 25.41 | $ | 21.89 | $ | 20.95 | $ | 22.40 | |||||
| Income from investment operationsa: | |||||||||||||||
| Net investment income (loss)b | (0.37 | ) | (0.36 | ) | (0.35 | ) | (0.26 | ) | (0.29 | ) | |||||
| Net realized and unrealized gains (losses) | (1.65 | ) | 4.88 | 4.60 | 1.76 | 0.34 | |||||||||
| Total from investment operations | (2.02 | ) | 4.52 | 4.25 | 1.50 | 0.05 | |||||||||
| Less distributions from net realized gains | (0.66 | ) | (0.66 | ) | (0.73 | ) | (0.56 | ) | (1.50 | ) | |||||
| Net asset value, end of year | $ | 26.59 | $ | 29.27 | $ | 25.41 | $ | 21.89 | $ | 20.95 | |||||
| Total returnc | (7.03 | )% | 18.04 | % | 19.42 | % | 7.47 | % | 1.24 | % | |||||
| Ratios to average net assets | |||||||||||||||
| Expenses before waiver and payments by affiliates | 1.85 | % | 1.88 | % | 1.87 | % | 1.97 | % | 1.99 | % | |||||
| Expenses net of waiver and payments by affiliates | 1.84 | % | 1.88 | %d | 1.87 | %d,e | 1.97 | % | 1.99 | % | |||||
| Net investment income (loss) | (1.32 | )% | (1.29 | )% | (1.40 | )% | (1.28 | )% | (1.42 | )% | |||||
| Supplemental data | |||||||||||||||
| Net assets, end of year (000’s) | $ | 137,882 | $ | 110,513 | $ | 85,883 | $ | 51,719 | $ | 50,453 | |||||
| Portfolio turnover rate | 25.56 | % | 40.64 | % | 36.64 | % | 58.76 | % | 63.57 | % | |||||
aThe amount shown for a share outstanding throughout the period may not correlate with the Statement of Operations for the period due to the timing of sales and repurchases
of the Fund’s shares in relation to income earned and/or fluctuating fair value of the investments of the Fund.
bBased on average daily shares outstanding.
cTotal return does not reflect sales commissions or contingent deferred sales charges, if applicable.
dBenefit of waiver and payments by affiliates rounds to less than 0.01%.
eBenefit of expense reduction rounds to less than 0.01%.
70 Annual Report | The accompanying notes are an integral part of these financial statements.
franklintempleton.com
FRANKLIN STRATEGIC SERIES
FINANCIAL H IGHLIGHTS
| Franklin Growth Opportunities Fund (continued) | |||||||||||||||
| Year Ended April 30, | |||||||||||||||
| 2016 | 2015 | 2014 | 2013 | 2012 | |||||||||||
| Class R | |||||||||||||||
| Per share operating performance | |||||||||||||||
| (for a share outstanding throughout the year) | |||||||||||||||
| Net asset value, beginning of year | $ | 32.10 | $ | 27.67 | $ | 23.67 | $ | 22.49 | $ | 23.81 | |||||
| Income from investment operationsa: | |||||||||||||||
| Net investment income (loss)b | (0.26 | ) | (0.24 | ) | (0.24 | ) | (0.17 | ) | (0.20 | ) | |||||
| Net realized and unrealized gains (losses) | (1.81 | ) | 5.33 | 4.97 | 1.91 | 0.38 | |||||||||
| Total from investment operations | (2.07 | ) | 5.09 | 4.73 | 1.74 | 0.18 | |||||||||
| Less distributions from net realized gains | (0.66 | ) | (0.66 | ) | (0.73 | ) | (0.56 | ) | (1.50 | ) | |||||
| Net asset value, end of year | $ | 29.37 | $ | 32.10 | $ | 27.67 | $ | 23.67 | $ | 22.49 | |||||
| Total return | (6.60 | )% | 18.63 | % | 19.99 | % | 8.03 | % | 1.73 | % | |||||
| Ratios to average net assets | |||||||||||||||
| Expenses before waiver and payments by affiliates | 1.35 | % | 1.38 | % | 1.37 | % | 1.47 | % | 1.49 | % | |||||
| Expenses net of waiver and payments by affiliates | 1.34 | % | 1.38 | %c | 1.37 | %c,d | 1.47 | % | 1.49 | % | |||||
| Net investment income (loss) | (0.82 | )% | (0.79 | )% | (0.90 | )% | (0.78 | )% | (0.92 | )% | |||||
| Supplemental data | |||||||||||||||
| Net assets, end of year (000’s) | $ | 39,786 | $ | 48,266 | $ | 42,953 | $ | 34,399 | $ | 33,783 | |||||
| Portfolio turnover rate | 25.56 | % | 40.64 | % | 36.64 | % | 58.76 | % | 63.57 | % | |||||
aThe amount shown for a share outstanding throughout the period may not correlate with the Statement of Operations for the period due to the timing of sales and repurchases
of the Fund’s shares in relation to income earned and/or fluctuating fair value of the investments of the Fund.
bBased on average daily shares outstanding.
cBenefit of waiver and payments by affiliates rounds to less than 0.01%.
dBenefit of expense reduction rounds to less than 0.01%.
franklintempleton.com
The accompanying notes are an integral part of these financial statements. | Annual Report 71
FRANKLIN STRATEGIC SERIES
FINANCIAL H IGHLIGHTS
| Franklin Growth Opportunities Fund (continued) | |||||||||
| Year Ended April 30, | |||||||||
| 2016 | 2015 | 2014 | a | ||||||
| Class R6 | |||||||||
| Per share operating performance | |||||||||
| (for a share outstanding throughout the year) | |||||||||
| Net asset value, beginning of year | $ | 35.09 | $ | 29.98 | $ | 24.99 | |||
| Income from investment operationsb: | |||||||||
| Net investment income (loss)c | (0.05 | ) | (0.03 | ) | (0.07 | ) | |||
| Net realized and unrealized gains (losses) | (1.99 | ) | 5.80 | 5.79 | |||||
| Total from investment operations | (2.04 | ) | 5.77 | 5.72 | |||||
| Less distributions from net realized gains | (0.66 | ) | (0.66 | ) | (0.73 | ) | |||
| Net asset value, end of year | $ | 32.39 | $ | 35.09 | $ | 29.98 | |||
| Total return | (5.94 | )% | 19.47 | % | 22.90 | % | |||
| Ratios to average net assets | |||||||||
| Expenses before waiver and payments by affiliates | 0.67 | % | 0.68 | % | 0.71 | % | |||
| Expenses net of waiver and payments by affiliates | 0.66 | % | 0.68 | %d | 0.71 | %d,e | |||
| Net investment income (loss) | (0.14 | )% | (0.09 | )% | (0.24 | )% | |||
| Supplemental data | |||||||||
| Net assets, end of year (000’s) | $ | 235,620 | $ | 246,911 | $ | 180,843 | |||
| Portfolio turnover rate | 25.56 | % | 40.64 | % | 36.64 | % | |||
aFor the year May 1, 2013 (effective date) to April 30, 2014.
bThe amount shown for a share outstanding throughout the period may not correlate with the Statement of Operations for the period due to the timing of sales and repurchases
of the Fund’s shares in relation to income earned and/or fluctuating fair value of the investments of the Fund.
cBased on average daily shares outstanding.
dBenefit of waiver and payments by affiliates rounds to less than 0.01%.
eBenefit of expense reduction rounds to less than 0.01%.
72 Annual Report | The accompanying notes are an integral part of these financial statements.
franklintempleton.com
FRANKLIN STRATEGIC SERIES
FINANCIAL H IGHLIGHTS
| Franklin Growth Opportunities Fund (continued) | |||||||||||||||
| Year Ended April 30, | |||||||||||||||
| 2016 | 2015 | 2014 | 2013 | 2012 | |||||||||||
| Advisor Class | |||||||||||||||
| Per share operating performance | |||||||||||||||
| (for a share outstanding throughout the year) | |||||||||||||||
| Net asset value, beginning of year | $ | 34.96 | $ | 29.93 | $ | 25.43 | $ | 23.99 | $ | 25.16 | |||||
| Income from investment operationsa: | |||||||||||||||
| Net investment income (loss)b | (0.11 | ) | (0.10 | ) | (0.13 | ) | (0.06 | ) | (0.10 | ) | |||||
| Net realized and unrealized gains (losses) | (1.99 | ) | 5.79 | 5.36 | 2.06 | 0.43 | |||||||||
| Total from investment operations | (2.10 | ) | 5.69 | 5.23 | 2.00 | 0.33 | |||||||||
| Less distributions from net realized gains | (0.66 | ) | (0.66 | ) | (0.73 | ) | (0.56 | ) | (1.50 | ) | |||||
| Net asset value, end of year | $ | 32.20 | $ | 34.96 | $ | 29.93 | $ | 25.43 | $ | 23.99 | |||||
| Total return | (6.11 | )% | 19.23 | % | 20.58 | % | 8.62 | % | 2.20 | % | |||||
| Ratios to average net assets | |||||||||||||||
| Expenses before waiver and payments by affiliates | 0.85 | % | 0.88 | % | 0.87 | % | 0.97 | % | 0.99 | % | |||||
| Expenses net of waiver and payments by affiliates | 0.84 | % | 0.88 | %c | 0.87 | %c,d | 0.97 | % | 0.99 | % | |||||
| Net investment income (loss) | (0.32 | )% | (0.29 | )% | (0.40 | )% | (0.28 | )% | (0.42 | )% | |||||
| Supplemental data | |||||||||||||||
| Net assets, end of year (000’s) | $ | 256,377 | $ | 269,887 | $ | 224,469 | $ | 182,954 | $ | 154,708 | |||||
| Portfolio turnover rate | 25.56 | % | 40.64 | % | 36.64 | % | 58.76 | % | 63.57 | % | |||||
aThe amount shown for a share outstanding throughout the period may not correlate with the Statement of Operations for the period due to the timing of sales and repurchases
of the Fund’s shares in relation to income earned and/or fluctuating fair value of the investments of the Fund.
bBased on average daily shares outstanding.
cBenefit of waiver and payments by affiliates rounds to less than 0.01%.
dBenefit of expense reduction rounds to less than 0.01%.
franklintempleton.com
The accompanying notes are an integral part of these financial statements. | Annual Report 73
| F R A N K L I N S T R A T E G I C S E R I E S | ||||
| Statement of Investments, April 30, 2016 | ||||
| Franklin Growth Opportunities Fund | ||||
| Country | Shares | Value | ||
| Common Stocks 97.1% | ||||
| Consumer Discretionary 15.3% | ||||
| a Amazon.com Inc | United States | 54,785 | $ | 36,135,638 |
| a Buffalo Wild Wings Inc | United States | 38,101 | 5,092,580 | |
| a Chipotle Mexican Grill Inc | United States | 19,170 | 8,069,995 | |
| Hanesbrands Inc | United States | 224,034 | 6,503,707 | |
| Harman International Industries Inc | United States | 79,400 | 6,094,744 | |
| Lowe’s Cos. Inc | United States | 171,869 | 13,065,481 | |
| NIKE Inc., B | United States | 307,568 | 18,128,058 | |
| a The Priceline Group Inc | United States | 13,493 | 18,130,004 | |
| Starbucks Corp | United States | 503,104 | 28,289,538 | |
| Time Warner Cable Inc | United States | 48,654 | 10,320,000 | |
| a Under Armour Inc., A | United States | 145,240 | 6,381,846 | |
| a Under Armour Inc., C | United States | 145,240 | 5,925,792 | |
| The Walt Disney Co | United States | 239,221 | 24,701,960 | |
| 186,839,343 | ||||
| Consumer Staples 6.5% | ||||
| Constellation Brands Inc., A | United States | 165,840 | 25,880,990 | |
| a Monster Beverage Corp | United States | 165,134 | 23,815,625 | |
| Reynolds American Inc | United States | 291,608 | 14,463,757 | |
| a WhiteWave Foods Co., A | United States | 363,637 | 14,621,844 | |
| 78,782,216 | ||||
| Energy 3.6% | ||||
| Anadarko Petroleum Corp | United States | 460,006 | 24,269,917 | |
| a Diamondback Energy Inc | United States | 158,209 | 13,697,735 | |
| Halliburton Co | United States | 150,984 | 6,237,149 | |
| 44,204,801 | ||||
| Financials 8.1% | ||||
| a Affiliated Managers Group Inc | United States | 77,057 | 13,124,348 | |
| American Tower Corp | United States | 157,678 | 16,537,268 | |
| BlackRock Inc | United States | 28,312 | 10,088,415 | |
| a CBRE Group Inc | United States | 461,163 | 13,664,260 | |
| The Charles Schwab Corp | United States | 626,122 | 17,788,126 | |
| Equinix Inc | United States | 29,417 | 9,717,906 | |
| a Signature Bank | United States | 123,601 | 17,035,926 | |
| 97,956,249 | ||||
| Health Care 15.4% | ||||
| a,b Acerta Pharma BV | Netherlands | 35,601,435 | 1,856,472 | |
| a Allergan PLC | United States | 152,708 | 33,070,445 | |
| a Alnylam Pharmaceuticals Inc | United States | 43,715 | 2,930,654 | |
| a Anacor Pharmaceuticals Inc | United States | 69,105 | 4,335,648 | |
| a Biogen Inc | United States | 65,576 | 18,032,744 | |
| a Celgene Corp | United States | 409,832 | 42,380,727 | |
| a Edwards Lifesciences Corp | United States | 217,962 | 23,149,744 | |
| a Envision Healthcare Holdings Inc | United States | 436,750 | 9,883,653 | |
| Gilead Sciences Inc | United States | 271,302 | 23,931,549 | |
| a,c Heron Therapeutics Inc | United States | 339,319 | 7,274,999 | |
| a Illumina Inc | United States | 76,627 | 10,343,879 | |
| a Impax Laboratories Inc | United States | 136,306 | 4,545,805 | |
| a Incyte Corp | United States | 81,833 | 5,914,071 | |
| 187,650,390 | ||||
74 Annual Report
franklintempleton.com
FRANKLIN STRATEGIC SERIES
STATEMENT O F INVESTMENTS
| Franklin Growth Opportunities Fund (continued) | ||||
| Country | Shares | Value | ||
| Common Stocks (continued) | ||||
| Industrials 5.0% | ||||
| Allegiant Travel Co | United States | 47,945 | $ | 7,698,529 |
| a DigitalGlobe Inc | United States | 172,415 | 3,820,716 | |
| FedEx Corp | United States | 42,334 | 6,989,767 | |
| General Electric Co | United States | 422,750 | 12,999,563 | |
| Hexcel Corp | United States | 122,870 | 5,562,325 | |
| a IHS Inc., A | United States | 124,475 | 15,332,830 | |
| Roper Technologies Inc | United States | 50,249 | 8,848,346 | |
| 61,252,076 | ||||
| Information Technology 35.9% | ||||
| a Adobe Systems Inc | United States | 194,237 | 18,301,010 | |
| a Alphabet Inc., A | United States | 46,744 | 33,089,143 | |
| a Alphabet Inc., C | United States | 31,531 | 21,851,298 | |
| Apple Inc | United States | 335,226 | 31,424,085 | |
| Broadcom Ltd | Singapore | 152,692 | 22,254,859 | |
| a BroadSoft Inc | United States | 156,349 | 6,123,409 | |
| a Cognizant Technology Solutions Corp., A | United States | 219,707 | 12,824,298 | |
| a Electronic Arts Inc | United States | 334,637 | 20,697,298 | |
| a Facebook Inc., A | United States | 414,755 | 48,766,893 | |
| MasterCard Inc., A | United States | 438,833 | 42,562,413 | |
| Microsoft Corp | United States | 572,866 | 28,568,827 | |
| a,c Mobileye NV | United States | 106,302 | 4,055,421 | |
| a NXP Semiconductors NV | Netherlands | 304,221 | 25,943,967 | |
| a Palo Alto Networks Inc | United States | 87,979 | 13,273,392 | |
| a Red Hat Inc | United States | 168,252 | 12,344,649 | |
| a Salesforce.com Inc | United States | 180,355 | 13,670,909 | |
| a ServiceNow Inc | United States | 154,771 | 11,063,031 | |
| a Tyler Technologies Inc | United States | 88,202 | 12,913,655 | |
| a ViaSat Inc | United States | 111,504 | 8,552,357 | |
| Visa Inc., A | United States | 636,819 | 49,187,899 | |
| 437,468,813 | ||||
| Materials 3.2% | ||||
| a Axalta Coating Systems Ltd | United States | 529,386 | 15,071,620 | |
| Ecolab Inc | United States | 84,285 | 9,691,089 | |
| Martin Marietta Materials Inc | United States | 82,608 | 13,979,752 | |
| 38,742,461 | ||||
| Telecommunication Services 4.1% | ||||
| a SBA Communications Corp | United States | 373,917 | 38,528,408 | |
| a T-Mobile U.S. Inc | United States | 287,910 | 11,309,105 | |
| 49,837,513 | ||||
| Total Common Stocks (Cost $893,003,551) | 1,182,733,862 | |||
| Preferred Stocks (Cost $4,000,233) 0.3% | ||||
| Information Technology 0.3% | ||||
| a,b Tanium Inc., pfd., G | United States | 268,600 | 4,000,233 | |
| Total Investments before Short Term Investments | ||||
| (Cost $897,003,784) | 1,186,734,095 | |||
franklintempleton.com
Annual Report
75
FRANKLIN STRATEGIC SERIES
STATEMENT O F INVESTMENTS
| Franklin Growth Opportunities Fund (continued) | |||||
| Country | Shares | Value | |||
| Short Term Investments 4.3% | |||||
| Money Market Funds (Cost $40,858,493) 3.4% | |||||
| a,d Institutional Fiduciary Trust Money Market Portfolio | United States | 40,858,493 | $ | 40,858,493 | |
| e Investments from Cash Collateral Received for Loaned Securities | |||||
| (Cost $11,257,625) 0.9% | |||||
| Money Market Funds 0.9% | |||||
| a,d Institutional Fiduciary Trust Money Market Portfolio | United States | 11,257,625 | 11,257,625 | ||
| Total Investments (Cost $949,119,902) 101.7% | 1,238,850,213 | ||||
| Other Assets, less Liabilities (1.7)% | (20,314,156 | ) | |||
| Net Assets 100.0% | $ | 1,218,536,057 |
aNon-income producing.
bSee Note 7 regarding restricted securities.
cA portion or all of the security is on loan at April 30, 2016. See Note 1(c).
dSee Note 3(f) regarding investments in affiliated management investment companies.
eSee Note 1(c) regarding securities on loan.
76 Annual Report | The accompanying notes are an integral part of these financial statements.
franklintempleton.com
FRANKLIN STRATEGIC SERIES
| Financial Highlights | |||||||||||||||
| Franklin Small Cap Growth Fund | |||||||||||||||
| Year Ended April 30, | |||||||||||||||
| 2016 | 2015 | 2014 | 2013 | 2012 | |||||||||||
| Class A | |||||||||||||||
| Per share operating performance | |||||||||||||||
| (for a share outstanding throughout the year) | |||||||||||||||
| Net asset value, beginning of year | $ | 18.83 | $ | 18.20 | $ | 14.26 | $ | 12.84 | $ | 13.02 | |||||
| Income from investment operationsa: | |||||||||||||||
| Net investment income (loss)b | (0.08 | ) | (0.12 | ) | (0.15 | ) | (0.09 | ) | (0.07 | ) | |||||
| Net realized and unrealized gains (losses) | (2.03 | ) | 1.57 | 4.75 | 1.87 | (0.11 | ) | ||||||||
| Total from investment operations | (2.11 | ) | 1.45 | 4.60 | 1.78 | (0.18 | ) | ||||||||
| Less distributions from net realized gains | (0.35 | ) | (0.82 | ) | (0.66 | ) | (0.36 | ) | — | ||||||
| Net asset value, end of year | $ | 16.37 | $ | 18.83 | $ | 18.20 | $ | 14.26 | $ | 12.84 | |||||
| Total returnc | (11.28 | )% | 8.34 | % | 32.40 | % | 14.35 | % | (1.38 | )% | |||||
| Ratios to average net assets | |||||||||||||||
| Expenses before waiver and payments by affiliates | 1.13 | % | 1.16 | % | 1.20 | % | 1.33 | % | 1.37 | % | |||||
| Expenses net of waiver and payments by affiliates | 1.11 | % | 1.16 | %d | 1.20 | %d | 1.33 | % | 1.37 | % | |||||
| Net investment income (loss) | (0.44 | )% | (0.66 | )% | (0.85 | )% | (0.68 | )% | (0.60 | )% | |||||
| Supplemental data | |||||||||||||||
| Net assets, end of year (000’s) | $ | 792,072 | $ | 1,164,218 | $ | 851,317 | $ | 327,882 | $ | 244,570 | |||||
| Portfolio turnover rate | 43.99 | % | 30.15 | % | 40.35 | % | 41.02 | % | 50.08 | % | |||||
aThe amount shown for a share outstanding throughout the period may not correlate with the Statement of Operations for the period due to the timing of sales and repurchases
of the Fund’s shares in relation to income earned and/or fluctuating fair value of the investments of the Fund.
bBased on average daily shares outstanding.
cTotal return does not reflect sales commissions or contingent deferred sales charges, if applicable.
dBenefit of waiver and payments by affiliates and expense reduction rounds to less than 0.01%.
franklintempleton.com
The accompanying notes are an integral part of these financial statements. | Annual Report 77
FRANKLIN STRATEGIC SERIES
FINANCIAL H IGHLIGHTS
| Franklin Small Cap Growth Fund (continued) | |||||||||||||||
| Year Ended April 30, | |||||||||||||||
| 2016 | 2015 | 2014 | 2013 | 2012 | |||||||||||
| Class C | |||||||||||||||
| Per share operating performance | |||||||||||||||
| (for a share outstanding throughout the year) | |||||||||||||||
| Net asset value, beginning of year | $ | 16.36 | $ | 16.03 | $ | 12.70 | $ | 11.57 | $ | 11.80 | |||||
| Income from investment operationsa: | |||||||||||||||
| Net investment income (loss)b | (0.18 | ) | (0.22 | ) | (0.24 | ) | (0.16 | ) | (0.14 | ) | |||||
| Net realized and unrealized gains (losses) | (1.76 | ) | 1.37 | 4.23 | 1.65 | (0.09 | ) | ||||||||
| Total from investment operations | (1.94 | ) | 1.15 | 3.99 | 1.49 | (0.23 | ) | ||||||||
| Less distributions from net realized gains | (0.35 | ) | (0.82 | ) | (0.66 | ) | (0.36 | ) | — | ||||||
| Net asset value, end of year | $ | 14.07 | $ | 16.36 | $ | 16.03 | $ | 12.70 | $ | 11.57 | |||||
| Total returnc | (11.95 | )% | 7.58 | % | 31.57 | % | 13.41 | % | (1.95 | )% | |||||
| Ratios to average net assets | |||||||||||||||
| Expenses before waiver and payments by affiliates | 1.88 | % | 1.87 | % | 1.90 | % | 2.03 | % | 2.07 | % | |||||
| Expenses net of waiver and payments by affiliates | 1.86 | % | 1.87 | %d | 1.90 | %d | 2.03 | % | 2.07 | % | |||||
| Net investment income (loss) | (1.19 | )% | (1.37 | )% | (1.55 | )% | (1.38 | )% | (1.30 | )% | |||||
| Supplemental data | |||||||||||||||
| Net assets, end of year (000’s) | $ | 157,175 | $ | 225,105 | $ | 187,271 | $ | 77,644 | $ | 67,212 | |||||
| Portfolio turnover rate | 43.99 | % | 30.15 | % | 40.35 | % | 41.02 | % | 50.08 | % | |||||
aThe amount shown for a share outstanding throughout the period may not correlate with the Statement of Operations for the period due to the timing of sales and repurchases
of the Fund’s shares in relation to income earned and/or fluctuating fair value of the investments of the Fund.
bBased on average daily shares outstanding.
cTotal return does not reflect sales commissions or contingent deferred sales charges, if applicable.
dBenefit of waiver and payments by affiliates and expense reduction rounds to less than 0.01%.
78 Annual Report | The accompanying notes are an integral part of these financial statements.
franklintempleton.com
FRANKLIN STRATEGIC SERIES
FINANCIAL H IGHLIGHTS
| Franklin Small Cap Growth Fund (continued) | |||||||||||||||
| Year Ended April 30, | |||||||||||||||
| 2016 | 2015 | 2014 | 2013 | 2012 | |||||||||||
| Class R | |||||||||||||||
| Per share operating performance | |||||||||||||||
| (for a share outstanding throughout the year) | |||||||||||||||
| Net asset value, beginning of year | $ | 18.11 | $ | 17.57 | $ | 13.81 | $ | 12.48 | $ | 12.67 | |||||
| Income from investment operationsa: | |||||||||||||||
| Net investment income (loss)b | (0.12 | ) | (0.16 | ) | (0.18 | ) | (0.11 | ) | (0.09 | ) | |||||
| Net realized and unrealized gains (losses) | (1.94 | ) | 1.52 | 4.60 | 1.80 | (0.10 | ) | ||||||||
| Total from investment operations | (2.06 | ) | 1.36 | 4.42 | 1.69 | (0.19 | ) | ||||||||
| Less distributions from net realized gains | (0.35 | ) | (0.82 | ) | (0.66 | ) | (0.36 | ) | — | ||||||
| Net asset value, end of year | $ | 15.70 | $ | 18.11 | $ | 17.57 | $ | 13.81 | $ | 12.48 | |||||
| Total return | (11.46 | )% | 8.12 | % | 32.15 | % | 14.04 | % | (1.50 | )% | |||||
| Ratios to average net assets | |||||||||||||||
| Expenses before waiver and payments by affiliates | 1.38 | % | 1.37 | % | 1.40 | % | 1.53 | % | 1.57 | % | |||||
| Expenses net of waiver and payments by affiliates | 1.36 | % | 1.37 | %c | 1.40 | %c | 1.53 | % | 1.57 | % | |||||
| Net investment income (loss) | (0.69 | )% | (0.87 | )% | (1.05 | )% | (0.88 | )% | (0.80 | )% | |||||
| Supplemental data | |||||||||||||||
| Net assets, end of year (000’s) | $ | 79,929 | $ | 92,455 | $ | 51,190 | $ | 15,783 | $ | 8,489 | |||||
| Portfolio turnover rate | 43.99 | % | 30.15 | % | 40.35 | % | 41.02 | % | 50.08 | % | |||||
aThe amount shown for a share outstanding throughout the period may not correlate with the Statement of Operations for the period due to the timing of sales and repurchases
of the Fund’s shares in relation to income earned and/or fluctuating fair value of the investments of the Fund.
bBased on average daily shares outstanding.
cBenefit of waiver and payments by affiliates and expense reduction rounds to less than 0.01%.
franklintempleton.com
The accompanying notes are an integral part of these financial statements. | Annual Report 79
FRANKLIN STRATEGIC SERIES
FINANCIAL H IGHLIGHTS
| Franklin Small Cap Growth Fund (continued) | |||||||||
| Year Ended April 30, | |||||||||
| 2016 | 2015 | 2014 | a | ||||||
| Class R6 | |||||||||
| Per share operating performance | |||||||||
| (for a share outstanding throughout the year) | |||||||||
| Net asset value, beginning of year | $ | 20.02 | $ | 19.21 | $ | 14.64 | |||
| Income from investment operationsb: | |||||||||
| Net investment income (loss)c | 0.01 | (0.03 | ) | (0.06 | ) | ||||
| Net realized and unrealized gains (losses) | (2.16 | ) | 1.66 | 5.29 | |||||
| Total from investment operations | (2.15 | ) | 1.63 | 5.23 | |||||
| Less distributions from net realized gains | (0.35 | ) | (0.82 | ) | (0.66 | ) | |||
| Net asset value, end of year | $ | 17.52 | $ | 20.02 | $ | 19.21 | |||
| Total return | (10.81 | )% | 8.91 | % | 35.80 | % | |||
| Ratios to average net assets | |||||||||
| Expenses before waiver and payments by affiliates | 0.63 | % | 0.66 | % | 0.72 | % | |||
| Expenses net of waiver and payments by affiliates | 0.61 | % | 0.66 | %d | 0.72 | %d | |||
| Net investment income (loss) | 0.06 | % | (0.16 | )% | (0.37 | )% | |||
| Supplemental data | |||||||||
| Net assets, end of year (000’s) | $ | 846,724 | $ | 844,293 | $ | 87,777 | |||
| Portfolio turnover rate | 43.99 | % | 30.15 | % | 40.35 | % | |||
aFor the year May 1, 2013 (effective date) to April 30, 2014.
bThe amount shown for a share outstanding throughout the period may not correlate with the Statement of Operations for the period due to the timing of sales and repurchases
of the Fund’s shares in relation to income earned and/or fluctuating fair value of the investments of the Fund.
cBased on average daily shares outstanding.
dBenefit of waiver and payments by affiliates and expense reduction rounds to less than 0.01%.
80 Annual Report | The accompanying notes are an integral part of these financial statements.
franklintempleton.com
FRANKLIN STRATEGIC SERIES
FINANCIAL H IGHLIGHTS
| Franklin Small Cap Growth Fund (continued) | |||||||||||||||
| Year Ended April 30, | |||||||||||||||
| 2016 | 2015 | 2014 | 2013 | 2012 | |||||||||||
| Advisor Class | |||||||||||||||
| Per share operating performance | |||||||||||||||
| (for a share outstanding throughout the year) | |||||||||||||||
| Net asset value, beginning of year | $ | 19.94 | $ | 19.17 | $ | 14.94 | $ | 13.41 | $ | 13.55 | |||||
| Income from investment operationsa: | |||||||||||||||
| Net investment income (loss)b | (0.04 | ) | (0.07 | ) | (0.11 | ) | (0.05 | ) | (0.04 | ) | |||||
| Net realized and unrealized gains (losses) | (2.14 | ) | 1.66 | 5.00 | 1.94 | (0.10 | ) | ||||||||
| Total from investment operations | (2.18 | ) | 1.59 | 4.89 | 1.89 | (0.14 | ) | ||||||||
| Less distributions from net realized gains | (0.35 | ) | (0.82 | ) | (0.66 | ) | (0.36 | ) | — | ||||||
| Net asset value, end of year | $ | 17.41 | $ | 19.94 | $ | 19.17 | $ | 14.94 | $ | 13.41 | |||||
| Total return | (11.06 | )% | 8.65 | % | 32.87 | % | 14.56 | % | (1.03 | )% | |||||
| Ratios to average net assets | |||||||||||||||
| Expenses before waiver and payments by affiliates | 0.88 | % | 0.87 | % | 0.90 | % | 1.03 | % | 1.07 | % | |||||
| Expenses net of waiver and payments by affiliates | 0.86 | % | 0.87 | %c | 0.90 | %c | 1.03 | % | 1.07 | % | |||||
| Net investment income (loss) | (0.19 | )% | (0.37 | )% | (0.55 | )% | (0.38 | )% | (0.30 | )% | |||||
| Supplemental data | |||||||||||||||
| Net assets, end of year (000’s) | $ | 850,975 | $ | 1,077,822 | $ | 427,406 | $ | 91,687 | $ | 49,159 | |||||
| Portfolio turnover rate | 43.99 | % | 30.15 | % | 40.35 | % | 41.02 | % | 50.08 | % | |||||
aThe amount shown for a share outstanding throughout the period may not correlate with the Statement of Operations for the period due to the timing of sales and repurchases
of the Fund’s shares in relation to income earned and/or fluctuating fair value of the investments of the Fund.
bBased on average daily shares outstanding.
cBenefit of waiver and payments by affiliates and expense reduction rounds to less than 0.01%.
franklintempleton.com
The accompanying notes are an integral part of these financial statements. | Annual Report 81
FRANKLIN STRATEGIC SERIES
| Statement of Investments, April 30, 2016 | |||
| Franklin Small Cap Growth Fund | |||
| Shares | Value | ||
| Common Stocks 97.4% | |||
| Consumer Discretionary 20.1% | |||
| a,b 2U Inc | 2,955,523 | $ | 82,843,310 |
| a Buffalo Wild Wings Inc | 204,800 | 27,373,568 | |
| a Five Below Inc | 618,800 | 25,803,960 | |
| a Global Eagle Entertainment Inc | 2,049,456 | 16,416,143 | |
| a Grand Canyon Education Inc | 1,066,800 | 46,651,164 | |
| a,b,c The Habit Restaurants Inc., A | 1,218,700 | 20,413,225 | |
| a IMAX Corp | 900,200 | 28,806,400 | |
| c KB Home | 1,583,700 | 21,490,809 | |
| Lithia Motors Inc | 168,600 | 13,997,172 | |
| a,b M/I Homes Inc | 1,385,700 | 27,852,570 | |
| a,c Mattress Firm Holding Corp | 625,500 | 24,407,010 | |
| a,c Nord Anglia Education Inc. (Hong Kong) | 874,936 | 18,574,891 | |
| a Shutterfly Inc | 427,500 | 19,656,450 | |
| a,b Sportsman’s Warehouse Holdings Inc | 2,972,800 | 33,830,464 | |
| a Tenneco Inc | 586,400 | 31,255,120 | |
| a Tile Shop Holdings Inc | 1,920,000 | 34,252,800 | |
| a Wingstop Inc | 1,060,929 | 26,459,569 | |
| Wolverine World Wide Inc | 1,126,300 | 21,343,385 | |
| a,c Zoe’s Kitchen Inc | 735,200 | 27,562,648 | |
| 548,990,658 | |||
| Consumer Staples 2.7% | |||
| a Smart & Final Stores Inc | 1,780,600 | 28,347,152 | |
| a TreeHouse Foods Inc | 517,800 | 45,773,520 | |
| 74,120,672 | |||
| Energy 2.7% | |||
| a Callon Petroleum Co | 2,030,882 | 21,344,570 | |
| a Matador Resources Co | 1,391,139 | 29,979,045 | |
| Superior Energy Services Inc | 1,348,700 | 22,739,082 | |
| 74,062,697 | |||
| Financials 5.5% | |||
| Evercore Partners Inc | 470,600 | 24,301,784 | |
| b Houlihan Lokey Inc | 827,300 | 20,856,233 | |
| Pinnacle Financial Partners Inc | 461,800 | 22,706,706 | |
| a PRA Group Inc | 767,400 | 25,462,332 | |
| Talmer Bancorp Inc., A | 1,323,000 | 25,666,200 | |
| a Western Alliance Bancorp | 799,300 | 29,238,394 | |
| 148,231,649 | |||
| Health Care 19.7% | |||
| a,c Aclaris Therapeutics Inc | 673,535 | 12,446,927 | |
| a,c Adeptus Health Inc., A | 622,200 | 42,384,264 | |
| a,c Aduro Biotech Inc | 286,320 | 3,707,844 | |
| a American Renal Associates Holdings Inc | 416,600 | 11,714,792 | |
| a Anacor Pharmaceuticals Inc | 185,400 | 11,631,996 | |
| a,b Aratana Therapeutics Inc | 2,697,019 | 16,209,084 | |
| a,c Celldex Therapeutics Inc | 1,719,100 | 6,876,400 | |
| a,c Collegium Pharmaceutical Inc | 793,700 | 15,127,922 | |
| a,c ConforMIS Inc | 675,700 | 8,371,923 | |
| a,c Corium International Inc | 760,450 | 3,406,816 | |
| a DexCom Inc | 242,800 | 15,631,464 | |
| a,c Edge Therapeutics Inc | 583,400 | 4,801,382 | |
82 Annual Report
franklintempleton.com
FRANKLIN STRATEGIC SERIES
STATEMENT O F INVESTMENTS
| Franklin Small Cap Growth Fund (continued) | |||
| Shares | Value | ||
| Common Stocks (continued) | |||
| Health Care (continued) | |||
| a,c Fluidigm Corp | 1,022,200 | $ | 9,792,676 |
| a Foamix Pharmaceuticals Ltd. (Israel) | 457,580 | 2,887,330 | |
| a Greatbatch Inc | 731,100 | 25,442,280 | |
| a Halozyme Therapeutics Inc | 978,600 | 10,324,230 | |
| a HealthEquity Inc | 787,616 | 19,808,542 | |
| a HealthStream Inc | 130,369 | 2,948,947 | |
| a HeartWare International Inc | 519,438 | 17,328,452 | |
| a,c Heron Therapeutics Inc | 1,127,593 | 24,175,594 | |
| a Impax Laboratories Inc | 799,200 | 26,653,320 | |
| a Karyopharm Therapeutics Inc | 1,373,386 | 12,772,490 | |
| a,c Natera Inc | 255,100 | 2,505,082 | |
| a Neogen Corp | 514,100 | 24,286,084 | |
| a Neos Therapeutics Inc | 487,442 | 4,421,099 | |
| a,c Nevro Corp | 509,200 | 34,243,700 | |
| a Ophthotech Corp | 226,909 | 10,605,726 | |
| a PAREXEL International Corp | 489,900 | 29,932,890 | |
| a Pfenex Inc | 1,175,631 | 9,593,149 | |
| a Portola Pharmaceuticals Inc | 327,000 | 7,769,520 | |
| a,c Revance Therapeutics Inc | 1,148,500 | 21,109,430 | |
| a Sage Therapeutics Inc | 378,700 | 14,273,203 | |
| a,b The Spectranetics Corp | 2,276,600 | 38,702,200 | |
| a Tandem Diabetes Care Inc | 1,381,000 | 15,370,530 | |
| a,c TherapeuticsMD Inc | 2,239,900 | 18,479,175 | |
| 535,736,463 | |||
| Industrials 15.4% | |||
| a The Advisory Board Co | 1,097,800 | 34,734,392 | |
| Allegiant Travel Co | 165,048 | 26,501,757 | |
| Altra Industrial Motion Corp | 953,900 | 27,376,930 | |
| a,b Astronics Corp | 1,071,982 | 39,609,735 | |
| a Beacon Roofing Supply Inc | 605,800 | 25,885,834 | |
| a DigitalGlobe Inc | 2,128,500 | 47,167,560 | |
| a Huron Consulting Group Inc | 463,900 | 25,797,479 | |
| Interface Inc | 1,656,000 | 28,185,120 | |
| a,b,c The KEYW Holding Corp | 3,851,460 | 26,536,559 | |
| Mobile Mini Inc | 939,300 | 30,292,425 | |
| a Proto Labs Inc | 189,400 | 11,331,802 | |
| a Spirit Airlines Inc | 552,200 | 24,258,146 | |
| Steelcase Inc., A | 1,361,423 | 20,775,315 | |
| b US Ecology Inc | 1,119,090 | 50,392,623 | |
| 418,845,677 | |||
| Information Technology 29.1% | |||
| a A10 Networks Inc | 2,555,751 | 15,257,834 | |
| a,c Alarm.com Holdings Inc | 1,595,124 | 36,384,779 | |
| a Bazaarvoice Inc | 3,790,700 | 12,698,845 | |
| a Bottomline Technologies Inc | 1,384,804 | 34,010,786 | |
| a BroadSoft Inc | 705,674 | 27,637,722 | |
| a Callidus Software Inc | 2,590,400 | 47,404,320 | |
| a Cavium Inc | 551,200 | 27,212,744 | |
| Cognex Corp | 832,000 | 29,560,960 | |
| a Demandware Inc | 1,136,900 | 52,388,352 | |
| a Envestnet Inc | 1,043,522 | 32,745,720 | |
franklintempleton.com
Annual Report
83
FRANKLIN STRATEGIC SERIES
STATEMENT O F INVESTMENTS
| Franklin Small Cap Growth Fund (continued) | |||||
| Shares | Value | ||||
| Common Stocks (continued) | |||||
| Information Technology (continued) | |||||
| a FARO Technologies Inc | 453,500 | $ | 13,169,640 | ||
| a Guidewire Software Inc | 600,900 | 34,233,273 | |||
| a Hubspot Inc | 635,129 | 28,129,864 | |||
| a Integrated Device Technology Inc | 1,335,700 | 25,752,296 | |||
| Intersil Corp., A | 2,514,000 | 29,388,660 | |||
| a Ixia | 2,131,700 | 21,572,804 | |||
| a,b Lattice Semiconductor Corp | 6,466,700 | 36,019,519 | |||
| a M/A-COM Technology Solutions Holdings Inc | 937,100 | 38,318,019 | |||
| a Mercury Systems Inc | 834,300 | 17,536,986 | |||
| a,b Nanometrics Inc | 1,610,800 | 28,768,888 | |||
| a Paylocity Holding Corp | 1,264,211 | 48,381,355 | |||
| a Proofpoint Inc | 693,500 | 40,403,310 | |||
| a,c Pure Storage Inc., A | 2,053,500 | 29,878,425 | |||
| a Shoretel Inc | 1,261,800 | 7,722,216 | |||
| a Silicon Laboratories Inc | 183,500 | 8,587,800 | |||
| a ViaSat Inc | 320,383 | 24,573,376 | |||
| a Zendesk Inc | 2,069,014 | 46,759,716 | |||
| 794,498,209 | |||||
| Materials 2.2% | |||||
| H.B. Fuller Co | 714,300 | 31,943,496 | |||
| Quaker Chemical Corp | 319,900 | 28,490,294 | |||
| 60,433,790 | |||||
| Total Common Stocks (Cost $2,516,910,617) | 2,654,919,815 | ||||
| Preferred Stocks 0.4% | |||||
| Consumer Discretionary 0.4% | |||||
| a,d DraftKings Inc., pfd., D | 825,201 | 3,111,008 | |||
| a,d DraftKings Inc., pfd., D-1 | 2,029,318 | 7,650,529 | |||
| Total Preferred Stocks (Cost $19,999,997) | 10,761,537 | ||||
| Principal | |||||
| Amount | |||||
| Convertible Bonds (Cost $5,000,000) 0.3% | |||||
| Consumer Discretionary 0.3% | |||||
| d DraftKings Inc., cvt., E, 5.00%, 12/23/16 | $ | 5,000,000 | 9,726,750 | ||
| Total Investments before Short Term Investments | |||||
| (Cost $2,541,910,614) | 2,675,408,102 | ||||
| Shares | |||||
| Short Term Investments 10.5% | |||||
| Money Market Funds (Cost $42,617,518) 1.6% | |||||
| a,e Institutional Fiduciary Trust Money Market Portfolio | 42,617,518 | 42,617,518 | |||
| f Investments from Cash Collateral Received for Loaned Securities | |||||
| (Cost $244,245,900) 8.9% | |||||
| Money Market Funds 8.9% | |||||
| a,e Institutional Fiduciary Trust Money Market Portfolio | 244,245,900 | 244,245,900 | |||
| Total Investments (Cost $2,828,774,032) 108.6% | 2,962,271,520 | ||||
| Other Assets, less Liabilities (8.6)% | (235,395,289 | ) | |||
| Net Assets 100.0% | $ | 2,726,876,231 | |||
84 Annual Report
franklintempleton.com
FRANKLIN STRATEGIC SERIES
STATEMENT O F INVESTMENTS
Franklin Small Cap Growth Fund (continued)
aNon-income producing.
bSee Note 8 regarding holdings of 5% voting securities.
cA portion or all of the security is on loan at April 30, 2016. See Note 1(c).
dSee Note 7 regarding restricted securities.
eSee Note 3(f) regarding investments in affiliated management investment companies.
fSee Note 1(c) regarding securities on loan.
franklintempleton.com
The accompanying notes are an integral part of these financial statements. | Annual Report 85
FRANKLIN STRATEGIC SERIES
| Financial Highlights | |||||||||||||||
| Franklin Small-Mid Cap Growth Fund | |||||||||||||||
| Year Ended April 30, | |||||||||||||||
| 2016 | 2015 | 2014 | 2013 | 2012 | |||||||||||
| Class A | |||||||||||||||
| Per share operating performance | |||||||||||||||
| (for a share outstanding throughout the year) | |||||||||||||||
| Net asset value, beginning of year | $ | 38.38 | $ | 40.42 | $ | 38.01 | $ | 38.51 | $ | 41.47 | |||||
| Income from investment operationsa: | |||||||||||||||
| Net investment income (loss)b | (0.03 | )c | (0.14 | ) | (0.20 | ) | (0.10 | ) | (0.14 | ) | |||||
| Net realized and unrealized gains (losses) | (3.37 | ) | 5.71 | 8.39 | 3.08 | (1.18 | ) | ||||||||
| Total from investment operations | (3.40 | ) | 5.57 | 8.19 | 2.98 | (1.32 | ) | ||||||||
| Less distributions from net realized gains | (3.14 | ) | (7.61 | ) | (5.78 | ) | (3.48 | ) | (1.64 | ) | |||||
| Net asset value, end of year | $ | 31.84 | $ | 38.38 | $ | 40.42 | $ | 38.01 | $ | 38.51 | |||||
| Total returnd | (9.02 | )% | 15.78 | % | 21.99 | % | 8.95 | % | (2.54 | )% | |||||
| Ratios to average net assets | |||||||||||||||
| Expenses before waiver and payments by affiliates | 0.96 | % | 0.94 | % | 0.96 | % | 0.98 | % | 0.99 | % | |||||
| Expenses net of waiver and payments by affiliates | 0.95 | % | 0.94 | %e | 0.96 | %e,f | 0.98 | % | 0.99 | % | |||||
| Net investment income (loss) | (0.08 | )%c | (0.35 | )% | (0.48 | )% | (0.27 | )% | (0.38 | )% | |||||
| Supplemental data | |||||||||||||||
| Net assets, end of year (000’s) | $ | 2,231,822 | $ | 2,535,853 | $ | 2,371,448 | $ | 2,355,507 | $ | 2,492,205 | |||||
| Portfolio turnover rate | 38.72 | % | 47.98 | % | 40.82 | % | 43.72 | % | 47.37 | % | |||||
aThe amount shown for a share outstanding throughout the period may not correlate with the Statement of Operations for the period due to the timing of sales and repurchases
of the Fund’s shares in relation to income earned and/or fluctuating fair value of the investments of the Fund.
bBased on average daily shares outstanding.
cNet investment income per share includes approximately $0.11 per share related to income received in the form of special dividends in connection with certain Fund holdings.
Excluding these amounts, the ratio of net investment income to average net assets would have been (0.38)%.
dTotal return does not reflect sales commissions or contingent deferred sales charges, if applicable.
eBenefit of waiver and payments by affiliates rounds to less than 0.01%.
fBenefit of expense reduction rounds to less than 0.01%.
86 Annual Report | The accompanying notes are an integral part of these financial statements.
franklintempleton.com
FRANKLIN STRATEGIC SERIES
FINANCIAL H IGHLIGHTS
| Franklin Small-Mid Cap Growth Fund (continued) | |||||||||||||||
| Year Ended April 30, | |||||||||||||||
| 2016 | 2015 | 2014 | 2013 | 2012 | |||||||||||
| Class C | |||||||||||||||
| Per share operating performance | |||||||||||||||
| (for a share outstanding throughout the year) | |||||||||||||||
| Net asset value, beginning of year | $ | 30.43 | $ | 33.78 | $ | 32.80 | $ | 33.97 | $ | 37.10 | |||||
| Income from investment operationsa: | |||||||||||||||
| Net investment income (loss)b | (0.23 | )c | (0.36 | ) | (0.43 | ) | (0.32 | ) | (0.37 | ) | |||||
| Net realized and unrealized gains (losses) | (2.66 | ) | 4.62 | 7.19 | 2.63 | (1.12 | ) | ||||||||
| Total from investment operations | (2.89 | ) | 4.26 | 6.76 | 2.31 | (1.49 | ) | ||||||||
| Less distributions from net realized gains | (3.14 | ) | (7.61 | ) | (5.78 | ) | (3.48 | ) | (1.64 | ) | |||||
| Net asset value, end of year | $ | 24.40 | $ | 30.43 | $ | 33.78 | $ | 32.80 | $ | 33.97 | |||||
| Total returnd | (9.72 | )% | 14.96 | % | 21.04 | % | 8.11 | % | (3.28 | )% | |||||
| Ratios to average net assets | |||||||||||||||
| Expenses before waiver and payments by affiliates | 1.71 | % | 1.69 | % | 1.71 | % | 1.73 | % | 1.74 | % | |||||
| Expenses net of waiver and payments by affiliates | 1.70 | % | 1.69 | %e | 1.71 | %e,f | 1.73 | % | 1.74 | % | |||||
| Net investment income (loss) | (0.83 | )%c | (1.10 | )% | (1.23 | )% | (1.02 | )% | (1.13 | )% | |||||
| Supplemental data | |||||||||||||||
| Net assets, end of year (000’s) | $ | 377,024 | $ | 448,722 | $ | 404,923 | $ | 348,144 | $ | 367,272 | |||||
| Portfolio turnover rate | 38.72 | % | 47.98 | % | 40.82 | % | 43.72 | % | 47.37 | % | |||||
aThe amount shown for a share outstanding throughout the period may not correlate with the Statement of Operations for the period due to the timing of sales and repurchases
of the Fund’s shares in relation to income earned and/or fluctuating fair value of the investments of the Fund.
bBased on average daily shares outstanding.
cNet investment income per share includes approximately $0.11 per share related to income received in the form of special dividends in connection with certain Fund holdings.
Excluding these amounts, the ratio of net investment income to average net assets would have been (1.13)%.
dTotal return does not reflect sales commissions or contingent deferred sales charges, if applicable.
eBenefit of waiver and payments by affiliates rounds to less than 0.01%.
fBenefit of expense reduction rounds to less than 0.01%.
franklintempleton.com
The accompanying notes are an integral part of these financial statements. | Annual Report 87
FRANKLIN STRATEGIC SERIES
FINANCIAL H IGHLIGHTS
| Franklin Small-Mid Cap Growth Fund (continued) | |||||||||||||||
| Year Ended April 30, | |||||||||||||||
| 2016 | 2015 | 2014 | 2013 | 2012 | |||||||||||
| Class R | |||||||||||||||
| Per share operating performance | |||||||||||||||
| (for a share outstanding throughout the year) | |||||||||||||||
| Net asset value, beginning of year | $ | 36.18 | $ | 38.61 | $ | 36.61 | $ | 37.32 | $ | 40.35 | |||||
| Income from investment operationsa: | |||||||||||||||
| Net investment income (loss)b | (0.11 | )c | (0.23 | ) | (0.29 | ) | (0.18 | ) | (0.23 | ) | |||||
| Net realized and unrealized gains (losses) | (3.18 | ) | 5.41 | 8.07 | 2.95 | (1.16 | ) | ||||||||
| Total from investment operations | (3.29 | ) | 5.18 | 7.78 | 2.77 | (1.39 | ) | ||||||||
| Less distributions from net realized gains | (3.14 | ) | (7.61 | ) | (5.78 | ) | (3.48 | ) | (1.64 | ) | |||||
| Net asset value, end of year | $ | 29.75 | $ | 36.18 | $ | 38.61 | $ | 36.61 | $ | 37.32 | |||||
| Total return | (9.24 | )% | 15.52 | % | 21.66 | % | 8.66 | % | (2.79 | )% | |||||
| Ratios to average net assets | |||||||||||||||
| Expenses before waiver and payments by affiliates | 1.21 | % | 1.19 | % | 1.21 | % | 1.23 | % | 1.24 | % | |||||
| Expenses net of waiver and payments by affiliates | 1.20 | % | 1.19 | %d | 1.21 | %d,e | 1.23 | % | 1.24 | % | |||||
| Net investment income (loss) | (0.33 | )%c | (0.60 | )% | (0.73 | )% | (0.52 | )% | (0.63 | )% | |||||
| Supplemental data | |||||||||||||||
| Net assets, end of year (000’s) | $ | 86,989 | $ | 96,593 | $ | 85,921 | $ | 65,397 | $ | 64,743 | |||||
| Portfolio turnover rate | 38.72 | % | 47.98 | % | 40.82 | % | 43.72 | % | 47.37 | % | |||||
aThe amount shown for a share outstanding throughout the period may not correlate with the Statement of Operations for the period due to the timing of sales and repurchases
of the Fund’s shares in relation to income earned and/or fluctuating fair value of the investments of the Fund.
bBased on average daily shares outstanding.
cNet investment income per share includes approximately $0.11 per share related to income received in the form of special dividends in connection with certain Fund holdings.
Excluding these amounts, the ratio of net investment income to average net assets would have been (0.63)%.
dBenefit of waiver and payments by affiliates rounds to less than 0.01%.
eBenefit of expense reduction rounds to less than 0.01%.
88 Annual Report | The accompanying notes are an integral part of these financial statements.
franklintempleton.com
FRANKLIN STRATEGIC SERIES
FINANCIAL H IGHLIGHTS
| Franklin Small-Mid Cap Growth Fund (continued) | |||||||||
| Year Ended April 30, | |||||||||
| 2016 | 2015 | 2014 | a | ||||||
| Class R6 | |||||||||
| Per share operating performance | |||||||||
| (for a share outstanding throughout the year) | |||||||||
| Net asset value, beginning of year | $ | 41.04 | $ | 42.53 | $ | 38.96 | |||
| Income from investment operationsb: | |||||||||
| Net investment incomec | 0.15 | d | 0.05 | 0.01 | |||||
| Net realized and unrealized gains (losses) | (3.62 | ) | 6.07 | 9.34 | |||||
| Total from investment operations | (3.47 | ) | 6.12 | 9.35 | |||||
| Less distributions from net realized gains | (3.14 | ) | (7.61 | ) | (5.78 | ) | |||
| Net asset value, end of year | $ | 34.43 | $ | 41.04 | $ | 42.53 | |||
| Total return | (8.54 | )% | 16.32 | % | 24.43 | % | |||
| Ratios to average net assets | |||||||||
| Expenses before waiver and payments by affiliates | 0.48 | % | 0.48 | % | 0.47 | % | |||
| Expenses net of waiver and payments by affiliates | 0.47 | % | 0.48 | %e | 0.47 | %e,f | |||
| Net investment income | 0.40 | %d | 0.11 | % | 0.01 | % | |||
| Supplemental data | |||||||||
| Net assets, end of year (000’s) | $ | 242,237 | $ | 206,548 | $ | 157,153 | |||
| Portfolio turnover rate | 38.72 | % | 47.98 | % | 40.82 | % | |||
aFor the year May 1, 2013 (effective date) to April 30, 2014.
bThe amount shown for a share outstanding throughout the period may not correlate with the Statement of Operations for the period due to the timing of sales and repurchases
of the Fund’s shares in relation to income earned and/or fluctuating fair value of the investments of the Fund.
cBased on average daily shares outstanding.
dNet investment income per share includes approximately $0.11 per share related to income received in the form of special dividends in connection with certain Fund holdings.
Excluding these amounts, the ratio of net investment income to average net assets would have been 0.10%.
eBenefit of waiver and payments by affiliates rounds to less than 0.01%.
fBenefit of expense reduction rounds to less than 0.01%.
franklintempleton.com
The accompanying notes are an integral part of these financial statements. | Annual Report 89
FRANKLIN STRATEGIC SERIES
FINANCIAL H IGHLIGHTS
| Franklin Small-Mid Cap Growth Fund (continued) | |||||||||||||||
| Year Ended April 30, | |||||||||||||||
| 2016 | 2015 | 2014 | 2013 | 2012 | |||||||||||
| Advisor Class | |||||||||||||||
| Per share operating performance | |||||||||||||||
| (for a share outstanding throughout the year) | |||||||||||||||
| Net asset value, beginning of year | $ | 40.83 | $ | 42.44 | $ | 39.56 | $ | 39.83 | $ | 42.73 | |||||
| Income from investment operationsa: | |||||||||||||||
| Net investment income (loss)b | 0.06 | c | (0.04 | ) | (0.10 | ) | (0.01 | ) | (0.05 | ) | |||||
| Net realized and unrealized gains (losses) | (3.60 | ) | 6.04 | 8.76 | 3.22 | (1.21 | ) | ||||||||
| Total from investment operations | (3.54 | ) | 6.00 | 8.66 | 3.21 | (1.26 | ) | ||||||||
| Less distributions from net realized gains | (3.14 | ) | (7.61 | ) | (5.78 | ) | (3.48 | ) | (1.64 | ) | |||||
| Net asset value, end of year | $ | 34.15 | $ | 40.83 | $ | 42.44 | $ | 39.56 | $ | 39.83 | |||||
| Total return | (8.79 | )% | 16.09 | % | 22.30 | % | 9.21 | % | (2.29 | )% | |||||
| Ratios to average net assets | |||||||||||||||
| Expenses before waiver and payments by affiliates | 0.71 | % | 0.69 | % | 0.71 | % | 0.73 | % | 0.74 | % | |||||
| Expenses net of waiver and payments by affiliates | 0.70 | % | 0.69 | %d | 0.71 | %d,e | 0.73 | % | 0.74 | % | |||||
| Net investment income (loss) | 0.17 | %c | (0.10 | )% | (0.23 | )% | (0.02 | )% | (0.13 | )% | |||||
| Supplemental data | |||||||||||||||
| Net assets, end of year (000’s) | $ | 551,176 | $ | 708,617 | $ | 650,426 | $ | 909,895 | $ | 822,827 | |||||
| Portfolio turnover rate | 38.72 | % | 47.98 | % | 40.82 | % | 43.72 | % | 47.37 | % | |||||
aThe amount shown for a share outstanding throughout the period may not correlate with the Statement of Operations for the period due to the timing of sales and repurchases
of the Fund’s shares in relation to income earned and/or fluctuating fair value of the investments of the Fund.
bBased on average daily shares outstanding.
cNet investment income per share includes approximately $0.11 per share related to income received in the form of special dividends in connection with certain Fund holdings.
Excluding these amounts, the ratio of net investment income to average net assets would have been (0.13)%.
dBenefit of waiver and payments by affiliates rounds to less than 0.01%.
eBenefit of expense reduction rounds to less than 0.01%.
90 Annual Report | The accompanying notes are an integral part of these financial statements.
franklintempleton.com
| F R A N K L I N S T R A T E G I C S E R I E S | |||
| Statement of Investments, April 30, 2016 | |||
| Franklin Small-Mid Cap Growth Fund | |||
| Shares | Value | ||
| Common Stocks 97.2% | |||
| Consumer Discretionary 16.9% | |||
| a,b 2U Inc | 1,036,800 | $ | 29,061,504 |
| Advance Auto Parts Inc | 150,400 | 23,477,440 | |
| a Buffalo Wild Wings Inc | 185,800 | 24,834,028 | |
| a,b Charter Communications Inc., A | 178,000 | 37,778,720 | |
| Delphi Automotive PLC (United Kingdom) | 344,400 | 25,358,172 | |
| Dick’s Sporting Goods Inc | 867,600 | 40,204,584 | |
| a Dollar Tree Inc | 506,600 | 40,381,086 | |
| a Global Eagle Entertainment Inc | 1,737,084 | 13,914,043 | |
| a Grand Canyon Education Inc | 624,600 | 27,313,758 | |
| Hanesbrands Inc | 1,336,700 | 38,804,401 | |
| a IMAX Corp | 901,400 | 28,844,800 | |
| L Brands Inc | 594,800 | 46,566,892 | |
| b Marriott International Inc., A | 391,800 | 27,461,262 | |
| Newell Brands Inc | 554,776 | 25,264,499 | |
| a Norwegian Cruise Line Holdings Ltd | 538,700 | 26,337,043 | |
| a NVR Inc | 3,300 | 5,482,257 | |
| a O’Reilly Automotive Inc | 72,700 | 19,096,836 | |
| Polaris Industries Inc | 186,400 | 18,244,832 | |
| Ross Stores Inc | 120,000 | 6,813,600 | |
| Tractor Supply Co | 382,000 | 36,160,120 | |
| a Under Armour Inc., A | 323,700 | 14,223,378 | |
| a Under Armour Inc., C | 323,700 | 13,206,960 | |
| a,b Zoe’s Kitchen Inc | 567,500 | 21,275,575 | |
| 590,105,790 | |||
| Consumer Staples 5.7% | |||
| Constellation Brands Inc., A | 448,500 | 69,992,910 | |
| a Monster Beverage Corp | 387,600 | 55,899,672 | |
| Pinnacle Foods Inc | 69,200 | 2,947,228 | |
| a TreeHouse Foods Inc | 376,500 | 33,282,600 | |
| a WhiteWave Foods Co., A | 928,100 | 37,318,901 | |
| 199,441,311 | |||
| Energy 4.7% | |||
| Cabot Oil & Gas Corp., A | 1,164,510 | 27,249,534 | |
| a Concho Resources Inc | 494,500 | 57,446,065 | |
| EQT Corp | 403,500 | 28,285,350 | |
| a Matador Resources Co | 881,800 | 19,002,790 | |
| Superior Energy Services Inc | 1,882,000 | 31,730,520 | |
| 163,714,259 | |||
| Financials 11.7% | |||
| a Affiliated Managers Group Inc | 276,800 | 47,144,576 | |
| Arthur J. Gallagher & Co | 726,300 | 33,438,852 | |
| a CBRE Group Inc | 963,400 | 28,545,542 | |
| Equinix Inc | 164,178 | 54,236,202 | |
| Intercontinental Exchange Inc | 227,048 | 54,498,332 | |
| Lazard Ltd., A | 866,200 | 31,226,510 | |
| S&P Global Inc | 260,200 | 27,802,370 | |
| a Signature Bank | 349,200 | 48,130,236 | |
| a SVB Financial Group | 240,000 | 25,027,200 | |
| Willis Towers Watson PLC | 472,900 | 59,065,210 | |
| 409,115,030 | |||
franklintempleton.com
Annual Report
91
FRANKLIN STRATEGIC SERIES
STATEMENT O F INVESTMENTS
| Franklin Small-Mid Cap Growth Fund (continued) | |||
| Shares | Value | ||
| Common Stocks (continued) | |||
| Health Care 19.0% | |||
| a Akorn Inc | 1,119,600 | $ | 28,493,820 |
| a Anacor Pharmaceuticals Inc | 157,796 | 9,900,121 | |
| a BioMarin Pharmaceutical Inc | 197,066 | 16,687,549 | |
| a,b Celldex Therapeutics Inc | 793,900 | 3,175,600 | |
| a Cerner Corp | 582,600 | 32,707,164 | |
| The Cooper Cos. Inc | 295,300 | 45,204,524 | |
| a DaVita HealthCare Partners Inc | 459,900 | 33,986,610 | |
| DENTSPLY SIRONA Inc | 442,000 | 26,343,200 | |
| a DexCom Inc | 504,114 | 32,454,859 | |
| a Edwards Lifesciences Corp | 574,200 | 60,985,782 | |
| a,b Heron Therapeutics Inc | 492,411 | 10,557,292 | |
| a Hologic Inc | 1,193,300 | 40,082,947 | |
| a Impax Laboratories Inc | 547,000 | 18,242,450 | |
| a Incyte Corp | 205,200 | 14,829,804 | |
| a Insulet Corp | 359,917 | 11,985,236 | |
| a Mallinckrodt PLC | 489,300 | 30,591,036 | |
| a Medivation Inc | 307,228 | 17,757,779 | |
| a Mettler-Toledo International Inc | 104,500 | 37,405,775 | |
| a Nevro Corp | 441,400 | 29,684,150 | |
| a,b Penumbra Inc | 168,647 | 9,191,262 | |
| Perrigo Co. PLC | 360,817 | 34,880,179 | |
| a Pfenex Inc | 955,500 | 7,796,880 | |
| a Quintiles Transnational Holdings Inc | 728,400 | 50,310,588 | |
| a,b Revance Therapeutics Inc | 623,900 | 11,467,282 | |
| a SciClone Pharmaceuticals Inc | 573,400 | 7,568,880 | |
| St. Jude Medical Inc | 428,000 | 32,613,600 | |
| a TherapeuticsMD Inc | 681,300 | 5,620,725 | |
| 660,525,094 | |||
| Industrials 14.9% | |||
| Acuity Brands Inc | 98,900 | 24,120,721 | |
| Allegiant Travel Co | 74,209 | 11,915,739 | |
| AMETEK Inc | 1,096,050 | 52,709,045 | |
| B/E Aerospace Inc | 678,400 | 32,990,592 | |
| a DigitalGlobe Inc | 1,441,700 | 31,948,072 | |
| Dun & Bradstreet Corp | 310,100 | 34,238,141 | |
| a Genesee & Wyoming Inc | 680,200 | 44,287,822 | |
| a HD Supply Holdings Inc | 1,348,068 | 46,211,771 | |
| Hexcel Corp | 756,709 | 34,256,216 | |
| a IHS Inc., A | 376,600 | 46,389,588 | |
| J.B. Hunt Transport Services Inc | 227,800 | 18,880,064 | |
| Robert Half International Inc | 995,800 | 38,149,098 | |
| Roper Technologies Inc | 360,530 | 63,485,728 | |
| a Sensata Technologies Holding NV | 489,700 | 18,446,999 | |
| a Verisk Analytics Inc | 292,800 | 22,715,424 | |
| 520,745,020 | |||
| Information Technology 21.0% | |||
| a Akamai Technologies Inc | 184,400 | 9,402,556 | |
| a Alliance Data Systems Corp | 57,600 | 11,710,656 | |
| a ANSYS Inc | 227,100 | 20,613,867 | |
| a,b Atlassian Corp. PLC (United Kingdom) | 253,400 | 5,871,278 | |
| a Bottomline Technologies Inc | 565,600 | 13,891,136 | |
92 Annual Report
franklintempleton.com
FRANKLIN STRATEGIC SERIES
STATEMENT O F INVESTMENTS
| Franklin Small-Mid Cap Growth Fund (continued) | ||||
| Shares | Value | |||
| Common Stocks (continued) | ||||
| Information Technology (continued) | ||||
| Cognex Corp | 1,067,300 | $ | 37,921,169 | |
| a CoStar Group Inc | 234,600 | 46,288,926 | ||
| CSRA Inc | 1,263,547 | 32,801,680 | ||
| a Demandware Inc | 368,100 | 16,962,048 | ||
| a Electronic Arts Inc | 924,800 | 57,198,880 | ||
| Fidelity National Information Services Inc | 428,900 | 28,221,620 | ||
| a FleetCor Technologies Inc | 243,800 | 37,710,984 | ||
| a GoDaddy Inc., A | 845,800 | 25,686,946 | ||
| Intersil Corp., A | 2,174,600 | 25,421,074 | ||
| Lam Research Corp | 236,400 | 18,060,960 | ||
| a LinkedIn Corp., A | 178,300 | 22,342,773 | ||
| a Lumentum Holdings Inc | 249,880 | 6,321,964 | ||
| Microchip Technology Inc | 354,800 | 17,239,732 | ||
| a NXP Semiconductors NV (Netherlands) | 966,193 | 82,396,939 | ||
| a Palo Alto Networks Inc | 254,200 | 38,351,154 | ||
| a Proofpoint Inc | 153,000 | 8,913,780 | ||
| a Red Hat Inc | 495,600 | 36,362,172 | ||
| a ServiceNow Inc | 470,600 | 33,638,488 | ||
| a Vantiv Inc., A | 798,700 | 43,561,098 | ||
| a ViaSat Inc | 499,176 | 38,286,799 | ||
| a Workday Inc | 224,300 | 16,818,014 | ||
| 731,996,693 | ||||
| Materials 2.6% | ||||
| a Axalta Coating Systems Ltd | 1,608,203 | 45,785,539 | ||
| Martin Marietta Materials Inc | 263,300 | 44,558,259 | ||
| 90,343,798 | ||||
| Telecommunication Services 0.7% | ||||
| a SBA Communications Corp | 240,600 | 24,791,424 | ||
| Total Common Stocks (Cost $2,626,351,608) | 3,390,778,419 | |||
| Preferred Stocks 0.2% | ||||
| Consumer Discretionary 0.2% | ||||
| a,c DraftKings Inc., pfd., D | 660,161 | 2,488,807 | ||
| a,c DraftKings Inc., pfd., D-1 | 1,623,455 | 6,120,425 | ||
| Total Preferred Stocks (Cost $16,000,003) | 8,609,232 | |||
| Principal | ||||
| Amount | ||||
| Convertible Bonds (Cost $5,000,000) 0.3% | ||||
| Consumer Discretionary 0.3% | ||||
| c DraftKings Inc., cvt., E, 5.00%, 12/23/16 | $ | 5,000,000 | 9,726,750 | |
| Total Investments before Short Term Investments (Cost $2,647,351,611) | 3,409,114,401 | |||
franklintempleton.com
Annual Report
93
FRANKLIN STRATEGIC SERIES
STATEMENT O F INVESTMENTS
| Franklin Small-Mid Cap Growth Fund (continued) | ||||
| Shares | Value | |||
| Short Term Investments 6.2% | ||||
| Money Market Funds (Cost $109,329,133) 3.1% | ||||
| a,d Institutional Fiduciary Trust Money Market Portfolio | 109,329,133 | $ | 109,329,133 | |
| e Investments from Cash Collateral Received for Loaned Securities | ||||
| (Cost $105,887,415) 3.1% | ||||
| Money Market Funds 3.1% | ||||
| a,d Institutional Fiduciary Trust Money Market Portfolio | 105,887,415 | 105,887,415 | ||
| Total Investments (Cost $2,862,568,159) 103.9% | 3,624,330,949 | |||
| Other Assets, less Liabilities (3.9)% | (135,083,683 | ) | ||
| Net Assets 100.0% | $ | 3,489,247,266 |
aNon-income producing.
bA portion or all of the security is on loan at April 30, 2016. See Note 1(c).
cSee Note 7 regarding restricted securities.
dSee Note 3(f) regarding investments in affiliated management investment companies.
eSee Note 1(c) regarding securities on loan.
94 Annual Report | The accompanying notes are an integral part of these financial statements.
franklintempleton.com
FRANKLIN STRATEGIC SERIES
| Financial Statements | |||||||||
| Statements of Assets and Liabilities | |||||||||
| April 30, 2016 | |||||||||
| Franklin | Franklin | Franklin | |||||||
| Flex Cap | Focused Core | Growth | |||||||
| Growth Fund | Equity Fund | Opportunities Fund | |||||||
| Assets: | |||||||||
| Investments in securities: | |||||||||
| Cost - Unaffiliated issuers | $ | 1,828,064,783 | $ | 169,938,110 | $ | 897,003,784 | |||
| Cost - Non-controlled affiliates (Note 3f) | 157,168,216 | — | 52,116,118 | ||||||
| Total cost of investments | $ | 1,985,232,999 | $ | 169,938,110 | $ | 949,119,902 | |||
| Value - Unaffiliated issuers | $ | 2,697,443,156 | $ | 172,160,404 | $ | 1,186,734,095 | |||
| Value - Non-controlled affiliates (Note 3f) | 157,168,216 | — | 52,116,118 | ||||||
| Total value of investmentsa | 2,854,611,372 | 172,160,404 | 1,238,850,213 | ||||||
| Receivables: | |||||||||
| Investment securities sold | 639,868 | 3,676,158 | 6,062,670 | ||||||
| Capital shares sold | 655,383 | 127,729 | 811,130 | ||||||
| Dividends and interest | 660,971 | 77,259 | 144,511 | ||||||
| Other assets | 1,667 | 108 | 716 | ||||||
| Total assets | 2,856,569,261 | 176,041,658 | 1,245,869,240 | ||||||
| Liabilities: | |||||||||
| Payables: | |||||||||
| Investment securities purchased | — | 2,646,197 | 9,087,704 | ||||||
| Capital shares redeemed | 4,522,062 | 2,320,792 | 5,677,506 | ||||||
| Management fees | 1,040,532 | 90,766 | 630,988 | ||||||
| Distribution fees | 684,542 | 42,611 | 248,767 | ||||||
| Transfer agent fees | 1,028,796 | 15,712 | 279,246 | ||||||
| Funds advanced by custodian | — | 632,769 | — | ||||||
| Payable upon return of securities loaned | 61,292,950 | — | 11,257,625 | ||||||
| Accrued expenses and other liabilities | 292,212 | 41,709 | 151,347 | ||||||
| Total liabilities | 68,861,094 | 5,790,556 | 27,333,183 | ||||||
| Net assets, at value | $ | 2,787,708,167 | $ | 170,251,102 | $ | 1,218,536,057 | |||
| Net assets consist of: | |||||||||
| Paid-in capital | $ | 1,948,325,034 | $ | 176,935,782 | $ | 942,056,346 | |||
| Undistributed net investment income (loss) | (5,173,713 | ) | — | (2,362,629 | ) | ||||
| Distribution in excess of net investment income | — | (48,510 | ) | — | |||||
| Net unrealized appreciation (depreciation) | 869,378,373 | 2,222,294 | 289,633,145 | ||||||
| Accumulated net realized gain (loss) | (24,821,527 | ) | (8,858,464 | ) | (10,790,805 | ) | |||
| Net assets, at value | $ | 2,787,708,167 | $ | 170,251,102 | $ | 1,218,536,057 | |||
| aIncludes securities loaned | $ | 59,344,377 | $ | — | $ | 10,759,447 | |||
franklintempleton.com
The accompanying notes are an integral part of these financial statements. | Annual Report 95
FRANKLIN STRATEGIC SERIES
FINANCIAL STATEMENTS
| Statements of Assets and Liabilities (continued) | |||||||
| April 30, 2016 | |||||||
| Franklin | Franklin | Franklin | |||||
| Flex Cap | Focused Core | Growth | |||||
| Growth Fund | Equity Fund | Opportunities Fund | |||||
| Class A: | |||||||
| Net assets, at value | $ | 1,951,973,125 | $ | 100,483,288 | $ | 548,871,359 | |
| Shares outstanding | 45,368,158 | 7,661,483 | 18,055,586 | ||||
| Net asset value per sharea | $ | 43.03 | $ | 13.12 | $ | 30.40 | |
| Maximum offering price per share (net asset value per share ÷ 94.25%) | $ | 45.66 | $ | 13.92 | $ | 32.25 | |
| Class C: | |||||||
| Net assets, at value | $ | 315,556,446 | $ | 25,118,572 | $ | 137,882,267 | |
| Shares outstanding | 9,093,586 | 1,996,812 | 5,186,161 | ||||
| Net asset value and maximum offering price per sharea | $ | 34.70 | $ | 12.58 | $ | 26.59 | |
| Class R: | |||||||
| Net assets, at value | $ | 30,156,804 | $ | 272,794 | $ | 39,785,662 | |
| Shares outstanding | 741,068 | 21,023 | 1,354,780 | ||||
| Net asset value and maximum offering price per share | $ | 40.69 | $ | 12.98 | $ | 29.37 | |
| Class R6: | |||||||
| Net assets, at value | $ | 185,994,964 | $ | 33,640,231 | $ | 235,619,515 | |
| Shares outstanding | 4,109,913 | 2,534,919 | 7,275,500 | ||||
| Net asset value and maximum offering price per share | $ | 45.26 | $ | 13.27 | $ | 32.39 | |
| Advisor Class: | |||||||
| Net assets, at value | $ | 304,026,828 | $ | 10,736,217 | $ | 256,377,254 | |
| Shares outstanding | 6,774,433 | 810,016 | 7,961,726 | ||||
| Net asset value and maximum offering price per share | $ | 44.88 | $ | 13.25 | $ | 32.20 | |
aRedemption price is equal to net asset value less contingent deferred sales charges, if applicable.
96 Annual Report | The accompanying notes are an integral part of these financial statements.
franklintempleton.com
FRANKLIN STRATEGIC SERIES
FINANCIAL STATEMENTS
| Statements of Assets and Liabilities (continued) | ||||||
| April 30, 2016 | ||||||
| Franklin | Franklin | |||||
| Small Cap | Small-Mid Cap | |||||
| Growth Fund | Growth Fund | |||||
| Assets: | ||||||
| Investments in securities: | ||||||
| Cost - Unaffiliated issuers | $ | 2,106,504,489 | $ | 2,647,351,611 | ||
| Cost - Non-controlled affiliates (Note 3f and 8) | 722,269,543 | 215,216,548 | ||||
| Total cost of investments | $ | 2,828,774,032 | $ | 2,862,568,159 | ||
| Value - Unaffiliated issuers | $ | 2,253,373,692 | $ | 3,409,114,401 | ||
| Value - Non-controlled affiliates (Note 3f and 8) | 708,897,828 | 215,216,548 | ||||
| Total value of investmentsa | 2,962,271,520 | 3,624,330,949 | ||||
| Receivables: | ||||||
| Investment securities sold | 21,968,497 | 2,169,182 | ||||
| Capital shares sold | 1,398,084 | 3,201,657 | ||||
| Dividends and interest | 979,725 | 531,137 | ||||
| Due from custodian | 1,766,646 | — | ||||
| Other assets | 1,544 | 1,967 | ||||
| Total assets | 2,988,386,016 | 3,630,234,892 | ||||
| Liabilities: | ||||||
| Payables: | ||||||
| Investment securities purchased | 7,404,626 | 26,248,271 | ||||
| Capital shares redeemed | 5,143,313 | 5,155,846 | ||||
| Management fees | 1,317,579 | 1,260,332 | ||||
| Distribution fees | 343,692 | 806,367 | ||||
| Transfer agent fees | 1,090,525 | 1,438,606 | ||||
| Payable upon return of securities loaned | 246,012,546 | 105,887,415 | ||||
| Accrued expenses and other liabilities | 197,504 | 190,789 | ||||
| Total liabilities | 261,509,785 | 140,987,626 | ||||
| Net assets, at value | $ | 2,726,876,231 | $ | 3,489,247,266 | ||
| Net assets consist of: | ||||||
| Paid-in capital | $ | 2,797,387,413 | $ | 2,704,893,202 | ||
| Undistributed net investment income (loss) | (2,532,991 | ) | (4,254,714 | ) | ||
| Net unrealized appreciation (depreciation) | 133,497,488 | 761,762,790 | ||||
| Accumulated net realized gain (loss) | (201,475,679 | ) | 26,845,988 | |||
| Net assets, at value | $ | 2,726,876,231 | $ | 3,489,247,266 | ||
| aIncludes securities loaned | $ | 237,721,998 | $ | 104,006,033 | ||
franklintempleton.com
The accompanying notes are an integral part of these financial statements. | Annual Report 97
FRANKLIN STRATEGIC SERIES
FINANCIAL STATEMENTS
| Statements of Assets and Liabilities (continued) | ||||
| April 30, 2016 | ||||
| Franklin | Franklin | |||
| Small Cap | Small-Mid Cap | |||
| Growth Fund | Growth Fund | |||
| Class A: | ||||
| Net assets, at value | $ | 792,072,140 | $ | 2,231,821,510 |
| Shares outstanding | 48,375,427 | 70,099,901 | ||
| Net asset value per sharea | $ | 16.37 | $ | 31.84 |
| Maximum offering price per share (net asset value per share ÷ 94.25%) | $ | 17.37 | $ | 33.78 |
| Class C: | ||||
| Net assets, at value | $ | 157,175,493 | $ | 377,024,001 |
| Shares outstanding | 11,172,004 | 15,454,389 | ||
| Net asset value and maximum offering price per sharea | $ | 14.07 | $ | 24.40 |
| Class R: | ||||
| Net assets, at value | $ | 79,929,331 | $ | 86,989,190 |
| Shares outstanding | 5,092,288 | 2,923,734 | ||
| Net asset value and maximum offering price per share | $ | 15.70 | $ | 29.75 |
| Class R6: | ||||
| Net assets, at value | $ | 846,724,026 | $ | 242,236,690 |
| Shares outstanding | 48,334,812 | 7,035,875 | ||
| Net asset value and maximum offering price per share | $ | 17.52 | $ | 34.43 |
| Advisor Class: | ||||
| Net assets, at value | $ | 850,975,241 | $ | 551,175,875 |
| Shares outstanding | 48,890,879 | 16,138,010 | ||
| Net asset value and maximum offering price per share | $ | 17.41 | $ | 34.15 |
aRedemption price is equal to net asset value less contingent deferred sales charges, if applicable.
98 Annual Report | The accompanying notes are an integral part of these financial statements.
franklintempleton.com
FRANKLIN STRATEGIC SERIES
FINANCIAL STATEMENTS
| Statements of Operations | |||||||||
| for the year ended April 30, 2016 | |||||||||
| Franklin | Franklin | Franklin | |||||||
| Flex Cap | Focused Core | Growth | |||||||
| Growth Fund | Equity Fund | Opportunities Fund | |||||||
| Investment income: | |||||||||
| Dividends | $ | 13,471,800 | $ | 3,206,718 | $ | 6,159,166 | |||
| Income from securities loaned (net of fees and rebates) | 847,078 | — | 182,616 | ||||||
| Total investment income | 14,318,878 | 3,206,718 | 6,341,782 | ||||||
| Expenses: | |||||||||
| Management fees (Note 3a) | 14,088,782 | 1,759,129 | 7,718,268 | ||||||
| Distribution fees: (Note 3c) | |||||||||
| Class A | 5,341,414 | 294,058 | 1,396,152 | ||||||
| Class C | 3,506,834 | 260,161 | 1,352,429 | ||||||
| Class R | 188,092 | 1,529 | 223,095 | ||||||
| Transfer agent fees: (Note 3e) | |||||||||
| Class A | 4,690,711 | 178,710 | 978,366 | ||||||
| Class C | 769,914 | 41,324 | 247,860 | ||||||
| Class R | 82,558 | 493 | 81,751 | ||||||
| Class R6 | 311 | 103 | 612 | ||||||
| Advisor Class | 787,196 | 18,587 | 491,535 | ||||||
| Custodian fees (Note 4) | 28,641 | 2,218 | 12,505 | ||||||
| Reports to shareholders | 386,840 | 25,239 | 99,491 | ||||||
| Registration and filing fees | 149,534 | 92,626 | 154,894 | ||||||
| Professional fees | 57,340 | 44,339 | 44,336 | ||||||
| Trustees’ fees and expenses | 31,533 | 1,710 | 11,688 | ||||||
| Other | 116,039 | 7,652 | 90,023 | ||||||
| Total expenses | 30,225,739 | 2,727,878 | 12,903,005 | ||||||
| Expenses waived/paid by affiliates (Note 3f and 3g) | (216,834 | ) | (387,007 | ) | (76,131 | ) | |||
| Net expenses | 30,008,905 | 2,340,871 | 12,826,874 | ||||||
| Net investment income (loss) | (15,690,027 | ) | 865,847 | (6,485,092 | ) | ||||
| Realized and unrealized gains (losses): | |||||||||
| Net realized gain (loss) from: | |||||||||
| Investments | 77,697,555 | (6,942,364 | ) | (7,678,098 | ) | ||||
| Foreign currency transactions | — | (12,146 | ) | 37,708 | |||||
| Net realized gain (loss) | 77,697,555 | (6,954,510 | ) | (7,640,390 | ) | ||||
| Net change in unrealized appreciation (depreciation) on: | |||||||||
| Investments | (225,895,077 | ) | (20,402,747 | ) | (70,297,495 | ) | |||
| Translation of other assets and liabilities denominated in | |||||||||
| foreign currencies | — | 1,516 | (97,613 | ) | |||||
| Net change in unrealized appreciation (depreciation) | (225,895,077 | ) | (20,401,231 | ) | (70,395,108 | ) | |||
| Net realized and unrealized gain (loss) | (148,197,522 | ) | (27,355,741 | ) | (78,035,498 | ) | |||
| Net increase (decrease) in net assets resulting from operations | $ | (163,887,549 | ) | $ | (26,489,894 | ) | $ | (84,520,590 | ) |
franklintempleton.com
The accompanying notes are an integral part of these financial statements. | Annual Report 99
FRANKLIN STRATEGIC SERIES
FINANCIAL STATEMENTS
| Statements of Operations (continued) | ||||||
| for the year ended April 30, 2016 | ||||||
| Franklin | Franklin | |||||
| Small Cap | Small-Mid Cap | |||||
| Growth Fund | Growth Fund | |||||
| Investment income: | ||||||
| Dividends: | ||||||
| Unaffiliated issuers | $ | 8,132,749 | $ | 29,530,103 | ||
| Non-controlled affiliates (Note 3f and 8) | 1,080,809 | — | ||||
| Interest | 87,671 | 98,820 | ||||
| Income from securities loaned (net of fees and rebates) | 11,964,236 | 2,692,456 | ||||
| Total investment income | 21,265,465 | 32,321,379 | ||||
| Expenses: | ||||||
| Management fees (Note 3a) | 18,934,705 | 16,987,955 | ||||
| Distribution fees: (Note 3c) | ||||||
| Class A | 2,490,772 | 5,890,746 | ||||
| Class C | 1,913,678 | 4,120,410 | ||||
| Class R | 438,575 | 457,797 | ||||
| Transfer agent fees: (Note 3e) | ||||||
| Class A | 2,511,886 | 5,426,842 | ||||
| Class C | 483,424 | 948,979 | ||||
| Class R | 221,586 | 210,863 | ||||
| Class R6 | 18,769 | 2,262 | ||||
| Advisor Class | 2,451,890 | 1,457,978 | ||||
| Custodian fees (Note 4) | 27,421 | 32,229 | ||||
| Reports to shareholders | 363,225 | 288,700 | ||||
| Registration and filing fees | 349,362 | 277,494 | ||||
| Professional fees | 57,676 | 59,534 | ||||
| Trustees’ fees and expenses | 31,794 | 37,775 | ||||
| Other | 44,291 | 52,603 | ||||
| Total expenses | 30,339,054 | 36,252,167 | ||||
| Expense reductions (Note 4) | (125 | ) | (29 | ) | ||
| Expenses waived/paid by affiliates (Note 3f) | (468,587 | ) | (340,116 | ) | ||
| Net expenses | 29,870,342 | 35,912,022 | ||||
| Net investment income (loss) | (8,604,877 | ) | (3,590,643 | ) | ||
| Realized and unrealized gains (losses): | ||||||
| Net realized gain (loss) from: | ||||||
| Investments: | ||||||
| Unaffiliated issuers | (134,664,091 | ) | 192,892,797 | |||
| Non-controlled affiliates (Note 3f and 8) | (61,231,015 | ) | — | |||
| Net realized gain (loss) | (195,895,106 | ) | 192,892,797 | |||
| Net change in unrealized appreciation (depreciation) on investments | (189,905,421 | ) | (552,669,162 | ) | ||
| Net realized and unrealized gain (loss) | (385,800,527 | ) | (359,776,365 | ) | ||
| Net increase (decrease) in net assets resulting from operations | $ | (394,405,404 | ) | $ | (363,367,008 | ) |
100 Annual Report | The accompanying notes are an integral part of these financial statements.
franklintempleton.com
FRANKLIN STRATEGIC SERIES
FINANCIAL STATEMENTS
| Statements of Changes in Net Assets | ||||||||||||||
| Franklin | Franklin | |||||||||||||
| Flex Cap Growth Fund | Focused Core Equity Fund | |||||||||||||
| Year Ended April 30, | Year Ended April 30, | |||||||||||||
| 2016 | 2015 | 2016 | 2015 | |||||||||||
| Increase (decrease) in net assets: | ||||||||||||||
| Operations: | ||||||||||||||
| Net investment income (loss) | $ | (15,690,027 | ) | $ | (13,082,959 | ) | $ | 865,847 | $ | (55,707 | ) | |||
| Net realized gain (loss) | 77,697,555 | 487,591,360 | (6,954,510 | ) | 4,914,783 | |||||||||
| Net change in unrealized appreciation (depreciation) | (225,895,077 | ) | (48,517,586 | ) | (20,401,231 | ) | 10,554,990 | |||||||
| Net increase (decrease) in net assets resulting | ||||||||||||||
| from operations | (163,887,549 | ) | 425,990,815 | (26,489,894 | ) | 15,414,066 | ||||||||
| Distributions to shareholders from: | ||||||||||||||
| Net investment income: | ||||||||||||||
| Class A | — | — | (497,875 | ) | — | |||||||||
| Class R | — | — | (953 | ) | — | |||||||||
| Class R6 | — | — | (285,880 | ) | (54,580 | ) | ||||||||
| Advisor Class | — | — | (75,820 | ) | (12,538 | ) | ||||||||
| Net realized gains: | ||||||||||||||
| Class A | (259,003,276 | ) | (342,846,125 | ) | (3,097,294 | ) | (1,515,213 | ) | ||||||
| Class C | (51,497,509 | ) | (64,406,445 | ) | (753,648 | ) | (294,362 | ) | ||||||
| Class R | (4,467,935 | ) | (8,219,922 | ) | (8,526 | ) | (3,890 | ) | ||||||
| Class R6 | (22,496,307 | ) | (55,730,307 | ) | (947,505 | ) | (466,176 | ) | ||||||
| Advisor Class | (41,094,908 | ) | (61,364,271 | ) | (303,800 | ) | (197,864 | ) | ||||||
| Total distributions to shareholders | (378,559,935 | ) | (532,567,070 | ) | (5,971,301 | ) | (2,544,623 | ) | ||||||
| Capital share transactions: (Note 2) | ||||||||||||||
| Class A | 79,881,168 | 136,476,026 | 27,607,644 | 43,753,093 | ||||||||||
| Class C | 25,404,125 | 36,940,650 | 10,981,811 | 10,579,825 | ||||||||||
| Class R | (8,612,325 | ) | (9,432,569 | ) | 158,571 | 25,410 | ||||||||
| Class R6 | (79,076,586 | ) | (69,772,541 | ) | 14,106,218 | 24,014,926 | ||||||||
| Advisor Class | (31,780,787 | ) | 75,060,076 | 2,665,730 | 1,784,405 | |||||||||
| Total capital share transactions | (14,184,405 | ) | 169,271,642 | 55,519,974 | 80,157,659 | |||||||||
| Net increase (decrease) in net assets | (556,631,889 | ) | 62,695,387 | 23,058,779 | 93,027,102 | |||||||||
| Net assets: | ||||||||||||||
| Beginning of year | 3,344,340,056 | 3,281,644,669 | 147,192,323 | 54,165,221 | ||||||||||
| End of year | $ | 2,787,708,167 | $ | 3,344,340,056 | $ | 170,251,102 | $ | 147,192,323 | ||||||
| Undistributed net investment income (loss) included in net | ||||||||||||||
| assets, end of year | $ | (5,173,713 | ) | $ | (6,551,185 | ) | $ | — | $ | (109,547 | ) | |||
| Distributions in excess of net investment income included in | ||||||||||||||
| net assets, end of year | $ | — | $ | — | $ | (48,510 | ) | $ | — | |||||
franklintempleton.com
The accompanying notes are an integral part of these financial statements. | Annual Report 101
FRANKLIN STRATEGIC SERIES
FINANCIAL STATEMENTS
| Statements of Changes in Net Assets (continued) | |||||||||||||
| Franklin | Franklin | ||||||||||||
| Growth Opportunities Fund | Small Cap Growth Fund | ||||||||||||
| Year Ended April 30, | Year Ended April 30, | ||||||||||||
| 2016 | 2015 | 2016 | 2015 | ||||||||||
| Increase (decrease) in net assets: | |||||||||||||
| Operations: | |||||||||||||
| Net investment income (loss) | $ | (6,485,092 | ) | $ | (4,882,012 | ) | $ | (8,604,877 | ) | $ | (13,731,218 | ) | |
| Net realized gain (loss) | (7,640,390 | ) | 30,869,769 | (195,895,106 | ) | 100,910,675 | |||||||
| Net change in unrealized appreciation (depreciation) | (70,395,108 | ) | 145,265,407 | (189,905,421 | ) | 117,033,709 | |||||||
| Net increase (decrease) in net assets resulting | |||||||||||||
| from operations | (84,520,590 | ) | 171,253,164 | (394,405,404 | ) | 204,213,166 | |||||||
| Distributions to shareholders from: | |||||||||||||
| Net realized gains: | |||||||||||||
| Class A | (11,684,036 | ) | (8,226,701 | ) | (18,855,133 | ) | (45,578,212 | ) | |||||
| Class C | (3,434,327 | ) | (2,289,412 | ) | (4,317,704 | ) | (10,662,075 | ) | |||||
| Class R | (919,987 | ) | (1,046,546 | ) | (1,825,810 | ) | (3,386,123 | ) | |||||
| Class R6 | (4,559,642 | ) | (4,459,467 | ) | (16,908,538 | ) | (15,120,957 | ) | |||||
| Advisor Class | (5,175,160 | ) | (5,048,872 | ) | (17,868,315 | ) | (33,104,015 | ) | |||||
| Total distributions to shareholders | (25,773,152 | ) | (21,070,998 | ) | (59,775,500 | ) | (107,851,382 | ) | |||||
| Capital share transactions: (Note 2) | |||||||||||||
| Class A | 142,478,599 | 51,147,182 | (221,885,481 | ) | 273,601,463 | ||||||||
| Class C | 42,387,168 | 11,203,177 | (37,262,306 | ) | 32,688,066 | ||||||||
| Class R | (4,630,356 | ) | (1,590,662 | ) | 564,740 | 38,786,269 | |||||||
| Class R6 | 7,201,428 | 32,429,351 | 124,630,820 | 743,017,911 | |||||||||
| Advisor Class | 8,197,076 | 6,333,425 | (88,883,508 | ) | 614,477,070 | ||||||||
| Total capital share transactions | 195,633,915 | 99,522,473 | (222,835,735 | ) | 1,702,570,779 | ||||||||
| Net increase (decrease) in net assets | 85,340,173 | 249,704,639 | (677,016,639 | ) | 1,798,932,563 | ||||||||
| Net assets: | |||||||||||||
| Beginning of year | 1,133,195,884 | 883,491,245 | 3,403,892,870 | 1,604,960,307 | |||||||||
| End of year | $ | 1,218,536,057 | $ | 1,133,195,884 | $ | 2,726,876,231 | $ | 3,403,892,870 | |||||
| Undistributed net investment income (loss) included in | |||||||||||||
| net assets: | |||||||||||||
| End of year | $ | (2,362,629 | ) | $ | (2,383,730 | ) | $ | (2,532,991 | ) | $ | — | ||
102 Annual Report | The accompanying notes are an integral part of these financial statements.
franklintempleton.com
FRANKLIN STRATEGIC SERIES
FINANCIAL STATEMENTS
| Statements of Changes in Net Assets (continued) | ||||||
| Franklin | ||||||
| Small-Mid Cap Growth Fund | ||||||
| Year Ended April 30, | ||||||
| 2016 | 2015 | |||||
| Increase (decrease) in net assets: | ||||||
| Operations: | ||||||
| Net investment income (loss) | $ | (3,590,643 | ) | $ | (14,296,448 | ) |
| Net realized gain (loss) | 192,892,797 | 501,686,791 | ||||
| Net change in unrealized appreciation (depreciation) | (552,669,162 | ) | 64,843,012 | |||
| Net increase (decrease) in net assets resulting from operations | (363,367,008 | ) | 552,233,355 | |||
| Distributions to shareholders from: | ||||||
| Net realized gains: | ||||||
| Class A | (203,767,135 | ) | (417,947,469 | ) | ||
| Class C | (45,252,717 | ) | (89,717,291 | ) | ||
| Class R | (8,434,665 | ) | (17,750,873 | ) | ||
| Class R6 | (20,262,074 | ) | (31,845,395 | ) | ||
| Advisor Class | (49,942,277 | ) | (113,021,649 | ) | ||
| Total distributions to shareholders | (327,658,868 | ) | (670,282,677 | ) | ||
| Capital share transactions: (Note 2) | ||||||
| Class A | 128,177,630 | 230,068,449 | ||||
| Class C | 17,363,176 | 73,872,191 | ||||
| Class R | 8,280,172 | 14,705,787 | ||||
| Class R6 | 75,185,512 | 53,747,705 | ||||
| Advisor Class | (45,066,011 | ) | 72,116,723 | |||
| Total capital share transactions | 183,940,479 | 444,510,855 | ||||
| Net increase (decrease) in net assets | (507,085,397 | ) | 326,461,533 | |||
| Net assets: | ||||||
| Beginning of year | 3,996,332,663 | 3,669,871,130 | ||||
| End of year | $ | 3,489,247,266 | $ | 3,996,332,663 | ||
| Undistributed net investment income (loss) included in net assets: | ||||||
| End of year | $ | (4,254,714 | ) | $ | (4,043,161 | ) |
franklintempleton.com
The accompanying notes are an integral part of these financial statements. | Annual Report 103
FRANKLIN STRATEGIC SERIES
Notes to Financial Statements
1. Organization and Significant Accounting Policies
Franklin Strategic Series (Trust) is registered under the Investment Company Act of 1940 (1940 Act) as an open-end management investment company, consisting of ten separate funds, five of which are included in this report (Funds) and applies the specialized accounting and reporting guidance in U.S. Generally Accepted Accounting Principles (U.S. GAAP). The financial statements of the remaining funds in the Trust are presented separately. The Funds offer five classes of shares: Class A, Class C, Class R, Class R6, and Advisor Class. Each class of shares differs by its initial sales load, contingent deferred sales charges, voting rights on matters affecting a single class, its exchange privilege and fees primarily due to differing arrangements for distribution and transfer agent fees. Franklin Flex Cap Growth Fund and Franklin Small Cap Growth Fund were closed to new investors with limited exceptions effective at the close of market April 25, 2016 and February 12, 2015, respectively.
The following summarizes the Funds’ significant accounting policies.
a. Financial Instrument Valuation
The Funds’ investments in financial instruments are carried at fair value daily. Fair value is the price that would be received to sell an asset or paid to transfer a liability in an orderly transaction between market participants on the measurement date. The Funds calculate the net asset value (NAV) per share as of 4 p.m. Eastern time each day the New York Stock Exchange (NYSE) is open for trading. Under compliance policies and procedures approved by the Trust’s Board of Trustees (the Board), the Funds’ administrator has responsibility for oversight of valuation, including leading the cross-functional Valuation and Liquidity Oversight Committee (VLOC). The VLOC provides administration and oversight of the Funds’ valuation policies and procedures, which are approved annually by the Board. Among other things, these procedures allow the Funds to utilize independent pricing services, quotations from securities and financial instrument dealers, and other market sources to determine fair value.
Equity securities listed on an exchange or on the NASDAQ National Market System are valued at the last quoted sale price or the official closing price of the day, respectively. Foreign equity securities are valued as of the close of trading on the foreign stock exchange on which the security is primarily traded or as of 4 p.m. Eastern time, whichever is earlier. The value is then converted into its U.S. dollar equivalent at the foreign exchange rate in effect at 4 p.m. Eastern time on the day that the value of the security is determined. Over-the-counter (OTC) securities are valued within the range of the most recent quoted bid and ask prices. Securities that trade in multiple markets or on multiple exchanges are valued according to the broadest and most representative market. Certain equity securities are valued based upon fundamental characteristics or relationships to similar securities.
Debt securities generally trade in the OTC market rather than on a securities exchange. The Funds’ pricing services use multiple valuation techniques to determine fair value. In instances where sufficient market activity exists, the pricing services may utilize a market-based approach through which quotes from market makers are used to determine fair value. In instances where sufficient market activity may not exist or is limited, the pricing services also utilize proprietary valuation models which may consider market characteristics such as benchmark yield curves, credit spreads, estimated default rates, anticipated market interest rate volatility, coupon rates, anticipated timing of principal repayments, underlying collateral, and other unique security features in order to estimate the relevant cash flows, which are then discounted to calculate the fair value.
Investments in open-end mutual funds are valued at the closing NAV.
The Funds have procedures to determine the fair value of financial instruments for which market prices are not reliable or readily available. Under these procedures, the VLOC convenes on a regular basis to review such financial instruments and considers a number of factors, including significant unobservable valuation inputs, when arriving at fair value. The VLOC primarily employs a market-based approach which may use related or comparable assets or liabilities, recent transactions, market multiples, book values, and other relevant information for the investment to determine the fair value of the investment. An income-based valuation approach may also be used in which the anticipated future cash flows of the investment are discounted to calculate fair value. Discounts may also be applied due to the nature or duration of any restrictions on the disposition of the investments. Due to the inherent uncertainty of valuations of such investments, the fair values may differ significantly from the values that would have been used had an active market existed. The VLOC employs various
104 Annual Report
franklintempleton.com
FRANKLIN STRATEGIC SERIES
NOTES TO FINANCIAL STATEMENTS
methods for calibrating these valuation approaches including a regular review of key inputs and assumptions, transactional back-testing or disposition analysis, and reviews of any related market activity.
Trading in securities on foreign securities stock exchanges and OTC markets may be completed before 4 p.m. Eastern time. In addition, trading in certain foreign markets may not take place on every NYSE business day. Occasionally, events occur between the time at which trading in a foreign security is completed and the close of the NYSE that might call into question the reliability of the value of a portfolio security held by the Fund. As a result, differences may arise between the value of the Funds’ portfolio securities as determined at the foreign market close and the latest indications of value at the close of the NYSE. In order to minimize the potential for these differences, the VLOC monitors price movements following the close of trading in foreign stock markets through a series of country specific market proxies (such as baskets of American Depositary Receipts, futures contracts and exchange traded funds). These price movements are measured against established trigger thresholds for each specific market proxy to assist in determining if an event has occurred that may call into question the reliability of the values of the foreign securities held by the Funds. If such an event occurs, the securities may be valued using fair value procedures, which may include the use of independent pricing services.
When the last day of the reporting period is a non-business day, certain foreign markets may be open on those days that the NYSE is closed, which could result in differences between the value of the Funds’ portfolio securities on the last business day and the last calendar day of the reporting period. Any significant security valuation changes due to an open foreign market are adjusted and reflected by the Fund for financial reporting purposes.
b. Foreign Currency Translation
Portfolio securities and other assets and liabilities denominated in foreign currencies are translated into U.S. dollars based on the exchange rate of such currencies against U.S. dollars on the date of valuation. The Funds may enter into foreign currency exchange contracts to facilitate transactions denominated in a foreign currency. Purchases and sales of securities, income and expense items denominated in foreign currencies are translated into U.S. dollars at the exchange rate in effect on the transaction date. Portfolio securities and assets and liabilities denominated in foreign currencies contain risks that those currencies will decline in value relative to the U.S. dollar. Occasionally, events may impact the availability or reliability of foreign exchange rates used to convert the U.S. dollar equivalent value. If such an event occurs, the foreign exchange rate will be valued at fair value using procedures established and approved by the Board.
The Funds do not separately report the effect of changes in foreign exchange rates from changes in market prices on securities held. Such changes are included in net realized and unrealized gain or loss from investments in the Statements of Operations.
Realized foreign exchange gains or losses arise from sales of foreign currencies, currency gains or losses realized between the trade and settlement dates on securities transactions and the difference between the recorded amounts of dividends, interest, and foreign withholding taxes and the U.S. dollar equivalent of the amounts actually received or paid. Net unrealized foreign exchange gains and losses arise from changes in foreign exchange rates on foreign denominated assets and liabilities other than investments in securities held at the end of the reporting period.
c. Securities Lending
Certain or all Funds participate in an agency based securities lending program to earn additional income. The Fund receives cash collateral against the loaned securities in an amount equal to at least 102% of the fair value of the loaned securities. Collateral is maintained over the life of the loan in an amount not less than 100% of the fair value of loaned securities, as determined at the close of Fund business each day; any additional collateral required due to changes in security values is delivered to the Fund on the next business day. The collateral is deposited into a joint cash account with other funds and is used to invest in a money market fund managed by Franklin Advisers, Inc., an affiliate of the Funds and/or uninvested cash as included in due from custodian in the Statements of Assets and Liabilities. The Fund may receive income from the investment of cash collateral, in addition to lending fees and rebates paid by the borrower. Income from securities loaned, net of fees paid to the securities lending agent and/or third-party vendor, is reported separately in the Statements of Operations. The Fund bears the market risk with respect to the collateral investment, securities loaned, and the risk that the agent may default on its obligations to the Fund. If the borrower defaults on its obligation to return the securities loaned, the Fund has the right to repurchase the securities in the open market using the collateral
franklintempleton.com
Annual Report
105
FRANKLIN STRATEGIC SERIES
NOTES TO FINANCIAL STATEMENTS
1. Organization and Significant Accounting
Policies (continued)
c. Securities Lending (continued)
received. The securities lending agent has agreed to indemnify the Funds in the event of default by a third party borrower.
d. Income and Deferred Taxes
It is each Fund’s policy to qualify as a regulated investment company under the Internal Revenue Code. Each Fund intends to distribute to shareholders substantially all of its taxable income and net realized gains to relieve it from federal income and excise taxes. As a result, no provision for U.S. federal income taxes is required.
The Funds may be subject to foreign taxation related to income received, capital gains on the sale of securities and certain foreign currency transactions in the foreign jurisdictions in which it invests. Foreign taxes, if any, are recorded based on the tax regulations and rates that exist in the foreign markets in which the Funds invest. When a capital gain tax is determined to apply, certain or all Funds records an estimated deferred tax liability in an amount that would be payable if the securities were disposed of on the valuation date.
Each Fund may recognize an income tax liability related to its uncertain tax positions under U.S. GAAP when the uncertain tax position has a less than 50% probability that it will be sustained upon examination by the tax authorities based on its technical merits. As of April 30, 2016, each Fund has determined that no tax liability is required in its financial statements related to uncertain tax positions for any open tax years (or expected to be taken in future tax years). Open tax years are those that remain subject to examination and are based on each tax jurisdiction’s statute of limitation.
e. Security Transactions, Investment Income, Expenses and Distributions
Security transactions are accounted for on trade date. Realized gains and losses on security transactions are determined on a specific identification basis. Interest income and estimated expenses are accrued daily. Dividend income is recorded on the ex-dividend date except for certain dividends from foreign securities where the dividend rate is not available. In such cases, the dividend is recorded as soon as the information is received by the Funds. Distributions to shareholders are determined according to income tax regulations (tax basis). Distributable earnings determined on a tax basis may differ from earnings recorded in accordance with U.S. GAAP. These differences may be permanent or temporary. Permanent differences are reclassified among capital accounts to reflect their tax character. These reclassifications have no impact on net assets or the results of operations. Temporary differences are not reclassified, as they may reverse in subsequent periods.
Common expenses incurred by the Trust are allocated among the Funds based on the ratio of net assets of each Fund to the combined net assets of the Trust. Fund specific expenses are charged directly to the fund that incurred the expense.
Realized and unrealized gains and losses and net investment income, not including class specific expenses, are allocated daily to each class of shares based upon the relative proportion of net assets of each class. Differences in per share distributions, by class, are generally due to differences in class specific expenses.
f. Accounting Estimates
The preparation of financial statements in accordance with U.S. GAAP requires management to make estimates and assumptions that affect the reported amounts of assets and liabilities at the date of the financial statements and the amounts of income and expenses during the reporting period. Actual results could differ from those estimates.
g. Guarantees and Indemnifications
Under the Trust’s organizational documents, its officers and trustees are indemnified by the Trust against certain liabilities arising out of the performance of their duties to the Trust. Additionally, in the normal course of business, the Trust, on behalf of the Funds, enters into contracts with service providers that contain general indemnification clauses. The Trust’s maximum exposure under these arrangements is unknown as this would involve future claims that may be made against the Trust that have not yet occurred. Currently, the Trust expects the risk of loss to be remote.
106 Annual Report
franklintempleton.com
FRANKLIN STRATEGIC SERIES
NOTES TO FINANCIAL STATEMENTS
2. Shares of Beneficial Interest
At April 30, 2016, there were an unlimited number of shares authorized (without par value). Transactions in the Funds’ shares were as follows:
| Franklin Flex Cap | Franklin Focused Core | |||||||||||
| Growth Fund | Equity Fund | |||||||||||
| Shares | Amount | Shares | Amount | |||||||||
| Class A Shares: | ||||||||||||
| Year ended April 30, 2016 | ||||||||||||
| Shares sold | 5,401,278 | $ | 261,619,712 | 5,194,472 | $ | 76,809,979 | ||||||
| Shares issued in reinvestment of distributions | 5,298,855 | 239,296,293 | 264,790 | 3,590,557 | ||||||||
| Shares redeemed | (8,887,424 | ) | (421,034,837 | ) | (3,853,385 | ) | (52,792,892 | ) | ||||
| Net increase (decrease) | 1,812,709 | $ | 79,881,168 | 1,605,877 | $ | 27,607,644 | ||||||
| Year ended April 30, 2015 | ||||||||||||
| Shares sold | 5,829,133 | $ | 313,652,976 | 4,330,719 | $ | 62,326,695 | ||||||
| Shares issued in reinvestment of distributions | 6,536,512 | 313,687,386 | 108,790 | 1,506,743 | ||||||||
| Shares redeemed | (9,069,735 | ) | (490,864,336 | ) | (1,402,021 | ) | (20,080,345 | ) | ||||
| Net increase (decrease) | 3,295,910 | $ | 136,476,026 | 3,037,488 | $ | 43,753,093 | ||||||
| Class C Shares: | ||||||||||||
| Year ended April 30, 2016 | ||||||||||||
| Shares sold | 1,254,326 | $ | 50,631,034 | 1,399,717 | $ | 19,891,883 | ||||||
| Shares issued in reinvestment of distributions | 1,373,330 | 50,167,747 | 57,646 | 751,703 | ||||||||
| Shares redeemed | (1,969,559 | ) | (75,394,656 | ) | (734,079 | ) | (9,661,775 | ) | ||||
| Net increase (decrease) | 658,097 | $ | 25,404,125 | 723,284 | $ | 10,981,811 | ||||||
| Year ended April 30, 2015 | ||||||||||||
| Shares sold | 806,709 | $ | 37,072,619 | 917,755 | $ | 12,810,782 | ||||||
| Shares issued in reinvestment of distributions | 1,554,274 | 62,512,881 | 21,304 | 285,046 | ||||||||
| Shares redeemed | (1,363,573 | ) | (62,644,850 | ) | (178,945 | ) | (2,516,003 | ) | ||||
| Net increase (decrease) | 997,410 | $ | 36,940,650 | 760,114 | $ | 10,579,825 | ||||||
| Class R Shares: | ||||||||||||
| Year ended April 30, 2016 | ||||||||||||
| Shares sold | 143,961 | $ | 6,665,006 | 25,274 | $ | 366,702 | ||||||
| Shares issued in reinvestment of distributions | 104,006 | 4,447,287 | 706 | 9,480 | ||||||||
| Shares redeemed | (426,574 | ) | (19,724,618 | ) | (16,124 | ) | (217,611 | ) | ||||
| Net increase (decrease) | (178,607 | ) | $ | (8,612,325 | ) | 9,856 | $ | 158,571 | ||||
| Year ended April 30, 2015 | ||||||||||||
| Shares sold | 112,069 | $ | 5,883,467 | 4,453 | $ | 63,598 | ||||||
| Shares issued in reinvestment of distributions | 178,575 | 8,187,653 | 283 | 3,890 | ||||||||
| Shares redeemed | (453,418 | ) | (23,503,689 | ) | (2,901 | ) | (42,078 | ) | ||||
| Net increase (decrease) | (162,774 | ) | $ | (9,432,569 | ) | 1,835 | $ | 25,410 | ||||
| Class R6 Shares: | ||||||||||||
| Year ended April 30, 2016 | ||||||||||||
| Shares sold | 97,992 | $ | 4,895,791 | 1,219,631 | $ | 18,751,979 | ||||||
| Shares issued in reinvestment of distributions | 438,587 | 20,797,794 | 90,028 | 1,233,386 | ||||||||
| Shares redeemed | (1,938,655 | ) | (104,770,171 | ) | (439,680 | ) | (5,879,147 | ) | ||||
| Net increase (decrease) | (1,402,076 | ) | $ | (79,076,586 | ) | 869,979 | $ | 14,106,218 | ||||
| Year ended April 30, 2015 | ||||||||||||
| Shares sold | 208,100 | $ | 11,229,853 | 1,731,134 | $ | 25,050,510 | ||||||
| Shares issued in reinvestment of distributions | 1,074,806 | 53,600,581 | 37,238 | 520,591 | ||||||||
| Shares redeemed | (2,551,233 | ) | (134,602,975 | ) | (104,481 | ) | (1,556,175 | ) | ||||
| Net increase (decrease) | (1,268,327 | ) | $ | (69,772,541 | ) | 1,663,891 | $ | 24,014,926 | ||||
franklintempleton.com
Annual Report
107
FRANKLIN STRATEGIC SERIES
NOTES TO FINANCIAL STATEMENTS
| 2. Shares of Beneficial Interest (continued) | |||||||||||
| Franklin Flex Cap | Franklin Focused Core | ||||||||||
| Growth Fund | Equity Fund | ||||||||||
| Shares | Amount | Shares | Amount | ||||||||
| Advisor Class Shares: | |||||||||||
| Year ended April 30, 2016 | |||||||||||
| Shares sold | 925,420 | $ | 45,147,388 | 433,979 | $ | 6,439,932 | |||||
| Shares issued in reinvestment of distributions | 857,253 | 40,350,886 | 20,306 | 277,987 | |||||||
| Shares redeemed | (2,387,892 | ) | (117,279,061 | ) | (286,239 | ) | (4,052,189 | ) | |||
| Net increase (decrease) | (605,219 | ) | $ | (31,780,787 | ) | 168,046 | $ | 2,665,730 | |||
| Year ended April 30, 2015 | |||||||||||
| Shares sold | 1,687,564 | $ | 95,480,580 | 187,731 | $ | 2,722,580 | |||||
| Shares issued in reinvestment of distributions | 1,215,776 | 60,351,143 | 10,555 | 147,563 | |||||||
| Shares redeemed | (1,474,007 | ) | (80,771,647 | ) | (74,691 | ) | (1,085,738 | ) | |||
| Net increase (decrease) | 1,429,333 | $ | 75,060,076 | 123,595 | $ | 1,784,405 | |||||
| Franklin Growth | Franklin Small Cap | ||||||||||
| Opportunities Fund | Growth Fund | ||||||||||
| Shares | Amount | Shares | Amount | ||||||||
| Class A Shares: | |||||||||||
| Year ended April 30, 2016 | |||||||||||
| Shares sold | 8,456,259 | $ | 274,758,449 | 9,355,935 | $ | 164,566,603 | |||||
| Shares issued in reinvestment of distributions | 351,747 | 11,284,114 | 1,032,714 | 17,618,102 | |||||||
| Shares redeemed | (4,566,206 | ) | (143,563,964 | ) | (23,836,334 | ) | (404,070,186 | ) | |||
| Net increase (decrease) | 4,241,800 | $ | 142,478,599 | (13,447,685 | ) | $ | (221,885,481 | ) | |||
| Year ended April 30, 2015 | |||||||||||
| Shares sold | 4,284,487 | $ | 135,816,417 | 35,113,831 | $ | 646,367,733 | |||||
| Shares issued in reinvestment of distributions | 260,551 | 7,871,257 | 2,517,935 | 43,107,019 | |||||||
| Shares redeemed | (2,999,072 | ) | (92,540,492 | ) | (22,575,043 | ) | (415,873,289 | ) | |||
| Net increase (decrease) | 1,545,966 | $ | 51,147,182 | 15,056,723 | $ | 273,601,463 | |||||
| Class C Shares: | |||||||||||
| Year ended April 30, 2016 | |||||||||||
| Shares sold | 2,651,152 | $ | 76,378,591 | 849,422 | $ | 12,859,934 | |||||
| Shares issued in reinvestment of distributions | 113,685 | 3,199,097 | 266,930 | 3,923,876 | |||||||
| Shares redeemed | (1,354,189 | ) | (37,190,520 | ) | (3,707,026 | ) | (54,046,116 | ) | |||
| Net increase (decrease) | 1,410,648 | $ | 42,387,168 | (2,590,674 | ) | $ | (37,262,306 | ) | |||
| Year ended April 30, 2015 | |||||||||||
| Shares sold | 938,449 | $ | 26,354,628 | 4,518,973 | $ | 72,788,301 | |||||
| Shares issued in reinvestment of distributions | 80,384 | 2,151,087 | 643,984 | 9,601,848 | |||||||
| Shares redeemed | (623,578 | ) | (17,302,538 | ) | (3,082,359 | ) | (49,702,083 | ) | |||
| Net increase (decrease) | 395,255 | $ | 11,203,177 | 2,080,598 | $ | 32,688,066 | |||||
108 Annual Report
franklintempleton.com
FRANKLIN STRATEGIC SERIES
NOTES TO FINANCIAL STATEMENTS
| Franklin Growth | Franklin Small Cap | ||||||||||
| Opportunities Fund | Growth Fund | ||||||||||
| Shares | Amount | Shares | Amount | ||||||||
| Class R Shares: | |||||||||||
| Year ended April 30, 2016 | |||||||||||
| Shares sold | 367,541 | $ | 11,531,931 | 1,467,096 | $ | 24,818,077 | |||||
| Shares issued in reinvestment of distributions | 29,367 | 910,971 | 110,763 | 1,813,185 | |||||||
| Shares redeemed | (545,651 | ) | (17,073,258 | ) | (1,590,105 | ) | (26,066,522 | ) | |||
| Net increase (decrease) | (148,743 | ) | $ | (4,630,356 | ) | (12,246 | ) | $ | 564,740 | ||
| Year ended April 30, 2015 | |||||||||||
| Shares sold | 362,355 | $ | 10,891,578 | 3,379,988 | $ | 60,467,102 | |||||
| Shares issued in reinvestment of distributions | 35,413 | 1,037,235 | 205,380 | 3,384,666 | |||||||
| Shares redeemed | (446,651 | ) | (13,519,475 | ) | (1,393,481 | ) | (25,065,499 | ) | |||
| Net increase (decrease) | (48,883 | ) | $ | (1,590,662 | ) | 2,191,887 | $ | 38,786,269 | |||
| Class R6 Shares: | |||||||||||
| Year ended April 30, 2016 | |||||||||||
| Shares sold | 1,320,454 | $ | 42,825,228 | 16,170,895 | $ | 309,172,532 | |||||
| Shares issued in reinvestment of distributions | 99,392 | 3,391,255 | 871,223 | 15,864,975 | |||||||
| Shares redeemed | (1,180,480 | ) | (39,015,055 | ) | (10,882,040 | ) | (200,406,687 | ) | |||
| Net increase (decrease) | 239,366 | $ | 7,201,428 | 6,160,078 | $ | 124,630,820 | |||||
| Year ended April 30, 2015 | |||||||||||
| Shares sold | 1,338,415 | $ | 43,718,352 | 40,533,757 | $ | 802,392,823 | |||||
| Shares issued in reinvestment of distributions | 103,593 | 3,308,745 | 719,645 | 13,068,756 | |||||||
| Shares redeemed | (438,062 | ) | (14,597,746 | ) | (3,648,550 | ) | (72,443,668 | ) | |||
| Net increase (decrease) | 1,003,946 | $ | 32,429,351 | 37,604,852 | $ | 743,017,911 | |||||
| Advisor Class Shares: | |||||||||||
| Year ended April 30, 2016 | |||||||||||
| Shares sold | 1,484,253 | $ | 49,836,416 | 13,824,812 | $ | 254,897,448 | |||||
| Shares issued in reinvestment of distributions | 149,430 | 5,073,151 | 890,640 | 16,138,402 | |||||||
| Shares redeemed | (1,391,763 | ) | (46,712,491 | ) | (19,867,945 | ) | (359,919,358 | ) | |||
| Net increase (decrease) | 241,920 | $ | 8,197,076 | (5,152,493 | ) | $ | (88,883,508 | ) | |||
| Year ended April 30, 2015 | |||||||||||
| Shares sold | 1,172,189 | $ | 38,291,441 | 44,799,317 | $ | 871,011,128 | |||||
| Shares issued in reinvestment of distributions | 156,179 | 4,972,740 | 1,598,050 | 28,940,693 | |||||||
| Shares redeemed | (1,108,533 | ) | (36,930,756 | ) | (14,643,992 | ) | (285,474,751 | ) | |||
| Net increase (decrease) | 219,835 | $ | 6,333,425 | 31,753,375 | $ | 614,477,070 | |||||
| Franklin Small-Mid Cap | |||||||||||
| Growth Fund | |||||||||||
| Shares | Amount | ||||||||||
| Class A Shares: | |||||||||||
| Year ended April 30, 2016 | |||||||||||
| Shares sold | 12,907,569 | $ | 443,875,701 | ||||||||
| Shares issued in reinvestment of distributions | 5,680,738 | 183,487,832 | |||||||||
| Shares redeemed | (14,552,480 | ) | (499,185,903 | ) | |||||||
| Net increase (decrease) | 4,035,827 | $ | 128,177,630 | ||||||||
| Year ended April 30, 2015 | |||||||||||
| Shares sold | 9,606,826 | $ | 377,655,732 | ||||||||
| Shares issued in reinvestment of distributions | 10,740,727 | 372,273,602 | |||||||||
| Shares redeemed | (12,948,880 | ) | (519,860,885 | ) | |||||||
| Net increase (decrease) | 7,398,673 | $ | 230,068,449 | ||||||||
franklintempleton.com
Annual Report
109
FRANKLIN STRATEGIC SERIES
NOTES TO FINANCIAL STATEMENTS
| 2. Shares of Beneficial Interest (continued) | ||||||
| Franklin Small-Mid Cap | ||||||
| Growth Fund | ||||||
| Shares | Amount | |||||
| Class C Shares: | ||||||
| Year ended April 30, 2016 | ||||||
| Shares sold | 2,150,607 | $ | 59,253,003 | |||
| Shares issued in reinvestment of distributions | 1,699,234 | 42,175,007 | ||||
| Shares redeemed | (3,139,510 | ) | (84,064,834 | ) | ||
| Net increase (decrease) | 710,331 | $ | 17,363,176 | |||
| Year ended April 30, 2015 | ||||||
| Shares sold | 1,922,933 | $ | 61,150,043 | |||
| Shares issued in reinvestment of distributions | 3,007,899 | 82,897,682 | ||||
| Shares redeemed | (2,173,499 | ) | (70,175,534 | ) | ||
| Net increase (decrease) | 2,757,333 | $ | 73,872,191 | |||
| Class R Shares: | ||||||
| Year ended April 30, 2016 | ||||||
| Shares sold | 970,177 | $ | 32,177,674 | |||
| Shares issued in reinvestment of distributions | 271,520 | 8,205,344 | ||||
| Shares redeemed | (987,525 | ) | (32,102,846 | ) | ||
| Net increase (decrease) | 254,172 | $ | 8,280,172 | |||
| Year ended April 30, 2015 | ||||||
| Shares sold | 929,258 | $ | 35,571,744 | |||
| Shares issued in reinvestment of distributions | 531,661 | 17,385,302 | ||||
| Shares redeemed | (1,016,736 | ) | (38,251,259 | ) | ||
| Net increase (decrease) | 444,183 | $ | 14,705,787 | |||
| Class R6 Shares: | ||||||
| Year ended April 30, 2016 | ||||||
| Shares sold | 3,986,227 | $ | 144,238,638 | |||
| Shares issued in reinvestment of distributions | 486,072 | 16,949,319 | ||||
| Shares redeemed | (2,469,832 | ) | (86,002,445 | ) | ||
| Net increase (decrease) | 2,002,467 | $ | 75,185,512 | |||
| Year ended April 30, 2015 | ||||||
| Shares sold | 1,395,483 | $ | 59,630,680 | |||
| Shares issued in reinvestment of distributions | 675,017 | 24,968,887 | ||||
| Shares redeemed | (732,222 | ) | (30,851,862 | ) | ||
| Net increase (decrease) | 1,338,278 | $ | 53,747,705 | |||
| Advisor Class Shares: | ||||||
| Year ended April 30, 2016 | ||||||
| Shares sold | 2,777,179 | $ | 103,360,464 | |||
| Shares issued in reinvestment of distributions | 1,300,049 | 45,007,699 | ||||
| Shares redeemed | (5,295,143 | ) | (193,434,174 | ) | ||
| Net increase (decrease) | (1,217,915 | ) | $ | (45,066,011 | ) | |
| Year ended April 30, 2015 | ||||||
| Shares sold | 2,813,541 | $ | 118,449,511 | |||
| Shares issued in reinvestment of distributions | 2,768,890 | 101,978,223 | ||||
| Shares redeemed | (3,553,308 | ) | (148,311,011 | ) | ||
| Net increase (decrease) | 2,029,123 | $ | 72,116,723 | |||
110 Annual Report
franklintempleton.com
FRANKLIN STRATEGIC SERIES
NOTES TO FINANCIAL STATEMENTS
3. Transactions with Affiliates
Franklin Resources, Inc. is the holding company for various subsidiaries that together are referred to as Franklin Templeton Investments. Certain officers and trustees of the Trust are also officers and/or directors of the following subsidiaries:
| Subsidiary | Affiliation |
| Franklin Advisers, Inc. (Advisers) | Investment manager |
| Franklin Templeton Services, LLC (FT Services) | Administrative manager |
| Franklin Templeton Distributors, Inc. (Distributors) | Principal underwriter |
| Franklin Templeton Investor Services, LLC (Investor Services) | Transfer agent |
a. Management Fees
Franklin Flex Cap Growth Fund and Franklin Small-Mid Cap Growth Fund pay an investment management fee to Advisers based on the average daily net assets of each of the Funds as follows:
| Annualized Fee Rate | Net Assets | |
| 0.625 | % | Up to and including $100 million |
| 0.500 | % | Over $100 million, up to and including $250 million |
| 0.450 | % | Over $250 million, up to and including $7.5 billion |
| 0.440 | % | Over $7.5 billion, up to and including $10 billion |
| 0.430 | % | Over $10 billion, up to and including $12.5 billion |
| 0.420 | % | Over $12.5 billion, up to and including $15 billion |
| 0.400 | % | In excess of $15 billion |
Franklin Focused Core Equity Fund pays an investment management fee to Advisers based on the average daily net assets of the Fund as follows:
| Annualized Fee Rate | Net Assets | |
| 0.950 | % | Up to and including $500 million |
| 0.850 | % | Over $500 million, up to and including $1 billion |
| 0.800 | % | Over $1 billion, up to and including $1.5 billion |
| 0.750 | % | Over $1.5 billion, up to and including $6.5 billion |
| 0.725 | % | Over $6.5 billion, up to and including $11.5 billion |
| 0.700 | % | Over $11.5 billion, up to and including $16.5 billion |
| 0.690 | % | Over $16.5 billion, up to and including $19 billion |
| 0.680 | % | Over $19 billion, up to and including $21.5 billion |
| 0.670 | % | In excess of $21.5 billion |
franklintempleton.com
Annual Report
111
FRANKLIN STRATEGIC SERIES
NOTES TO FINANCIAL STATEMENTS
3. Transactions with Affiliates (continued)
a. Management Fees (continued)
Franklin Growth Opportunities Fund pays an investment management fee to Advisers based on the average daily net assets of the Fund as follows:
| Annualized Fee Rate | Net Assets | |
| 0.700 | % | Up to and including $500 million |
| 0.600 | % | Over $500 million, up to and including $1 billion |
| 0.550 | % | Over $1 billion, up to and including $1.5 billion |
| 0.500 | % | Over $1.5 billion, up to and including $6.5 billion |
| 0.475 | % | Over $6.5 billion, up to and including $11.5 billion |
| 0.450 | % | Over $11.5 billion, up to and including $16.5 billion |
| 0.440 | % | Over $16.5 billion, up to and including $19 billion |
| 0.430 | % | Over $19 billion, up to and including $21.5 billion |
| 0.420 | % | In excess of $21.5 billion |
Franklin Small Cap Growth Fund pays an investment management fee to Advisers based on the average daily net assets of the Fund as follows:
| Annualized Fee Rate | Net Assets | |
| 0.750 | % | Up to and including $500 million |
| 0.650 | % | Over $500 million, up to and including $1 billion |
| 0.600 | % | Over $1 billion, up to and including $1.5 billion |
| 0.550 | % | Over $1.5 billion, up to and including $6.5 billion |
| 0.525 | % | Over $6.5 billion, up to and including $11.5 billion |
| 0.500 | % | Over $11.5 billion, up to and including $16.5 billion |
| 0.490 | % | Over $16.5 billion, up to and including $19 billion |
| 0.480 | % | Over $19 billion, up to and including $21.5 billion |
| 0.470 | % | In excess of $21.5 billion |
For the year ended April 30, 2016, each Fund’s annualized effective investment management fee rate based on average daily net assets was as follows:
| Franklin | |||||||||
| Franklin | Franklin | Growth | Franklin | Franklin | |||||
| Flex Cap | Focused Core | Opportunities | Small Cap | Small-Mid Cap | |||||
| Growth Fund | Equity Fund | Fund | Growth Fund | Growth Fund | |||||
| 0.458 | % | 0.950 | % | 0.632 | % | 0.606 | % | 0.457 | % |
b. Administrative Fees
Under an agreement with Advisers, FT Services provides administrative services to the Funds. The fee is paid by Advisers based on each of the Funds’ average daily net assets, and is not an additional expense of the Funds.
c. Distribution Fees
The Board has adopted distribution plans for each share class, with the exception of Class R6 and Advisor Class shares, pursuant to Rule 12b-1 under the 1940 Act. Under the Funds’ Class A reimbursement distribution plans, the Funds reimburse Distributors for
112 Annual Report
franklintempleton.com
FRANKLIN STRATEGIC SERIES
NOTES TO FINANCIAL STATEMENTS
costs incurred in connection with the servicing, sale and distribution of each Fund’s shares up to the maximum annual plan rate. Under the Class A reimbursement distribution plans, costs exceeding the maximum for the current plan year cannot be reimbursed in subsequent periods. In addition, under the Funds’ Class C and R compensation distribution plans, the Funds pay Distributors for costs incurred in connection with the servicing, sale and distribution of each Fund’s shares up to the maximum annual plan rate for each class. The plan year, for purposes of monitoring compliance with the maximum annual plan rates, is February 1 through January 31 for each Fund.
The maximum annual plan rates, based on the average daily net assets, for each class, are as follows:
| Franklin | ||||||||||
| Franklin | Franklin | Growth | Franklin | Franklin | ||||||
| Flex Cap | Focused Core | Opportunities | Small Cap | Small-Mid Cap | ||||||
| Growth Fund | Equity Fund | Fund | Growth Fund | Growth Fund | ||||||
| Reimbursement Plans: | ||||||||||
| Class A | 0.25 | % | 0.35 | % | 0.35 | % | 0.35 | % | 0.25 | % |
| Compensation Plans: | ||||||||||
| Class C | 1.00 | % | 1.00 | % | 1.00 | % | 1.00 | % | 1.00 | % |
| Class R | 0.50 | % | 0.50 | % | 0.50 | % | 0.50 | % | 0.50 | % |
For Franklin Focused Core Equity Fund, Franklin Growth Opportunities Fund and Franklin Small Cap Growth Fund the Board has set the current rate at 0.25% per year for Class A shares, effective August 1, 2015, until further notice and approval by the Board. Prior to August 1, 2015, the Board had set the rate at 0.30% per year for Class A shares.
d. Sales Charges/Underwriting Agreements
Front-end sales charges and contingent deferred sales charges (CDSC) do not represent expenses of the Funds. These charges are deducted from the proceeds of sales of fund shares prior to investment or from redemption proceeds prior to remittance, as applicable. Distributors has advised the Funds of the following commission transactions related to the sales and redemptions of the Funds’ shares for the year:
| Franklin | ||||||
| Franklin | Franklin | Growth | ||||
| Flex Cap | Focused Core | Opportunities | ||||
| Growth Fund | Equity Fund | Fund | ||||
| Sales charges retained net of commissions paid to | ||||||
| unaffiliated broker/dealers | $ | 696,990 | $ | 110,136 | $ | 502,729 |
| CDSC retained | $ | 23,821 | $ | 9,335 | $ | 34,887 |
| Franklin | Franklin | |||||
| Small Cap | Small-Mid Cap | |||||
| Growth Fund | Growth Fund | |||||
| Sales charges retained net of commissions paid to unaffiliated | ||||||
| broker/dealers | $ | 66,520 | $ | 810,701 | ||
| CDSC retained | $ | 24,441 | $ | 29,668 | ||
e. Transfer Agent Fees
Each class of shares, except for Class R6, pays transfer agent fees to Investor Services for its performance of shareholder servicing obligations and reimburses Investor Services for out of pocket expenses incurred, including shareholder servicing fees paid to third parties. These fees are allocated daily based upon their relative proportion of such classes’ aggregate net assets. Class R6 pays Investor Services transfer agent fees specific to that class.
franklintempleton.com
Annual Report
113
FRANKLIN STRATEGIC SERIES
NOTES TO FINANCIAL STATEMENTS
3. Transactions with Affiliates (continued)
e. Transfer Agent Fees (continued)
For the year ended April 30, 2016, the Funds paid transfer agent fees as noted in the Statements of Operations of which the following amounts were retained by Investor Services:
| Franklin | ||||||||||
| Franklin | Franklin | Growth | Franklin | Franklin | ||||||
| Flex Cap | Focused Core | Opportunities | Small Cap | Small-Mid Cap | ||||||
| Growth Fund | Equity Fund | Fund | Growth Fund | Growth Fund | ||||||
| Transfer agent fees | $ | 3,230,806 | $ | 117,918 | $ | 1,015,080 | $ | 2,194,646 | $ | 3,852,370 |
f. Investments in Affiliated Management Investment Companies
Certain or all Funds invest in an affiliated management investment company for purposes other than exercising a controlling influence over the management or policies. Management fees paid by the Funds are waived on assets invested in the affiliated management investment company, as noted in the Statements of Operations, in an amount not to exceed the management and administrative fees paid directly or indirectly by each affiliate. Prior to May 1, 2013, the waiver was accounted for as a reduction to management fees.
| % of Affiliated | |||||||||||
| Number of | Number of | Fund Shares | |||||||||
| Shares Held | Shares Held | Value | Outstanding | ||||||||
| at Beginning | Gross | Gross | at End | at End | Investment | Realized | Held at End | ||||
| of Year | Additions | Reductions | of Year | of Year | Income Gain (Loss) | of Year | |||||
| Franklin Flex Cap | |||||||||||
| Growth Fund | |||||||||||
| Non-Controlled | |||||||||||
| Affiliates | |||||||||||
| Institutional Fiduciary | |||||||||||
| Trust Money Market | |||||||||||
| Portfolio | 92,368,597 | 1,560,924,955 | (1,496,125,336 | ) | 157,168,216 | $157,168,216 | $ — | $ — | 0.79 | % | |
| Franklin Focused | |||||||||||
| Core Equity Fund | |||||||||||
| Non-Controlled | |||||||||||
| Affiliates | |||||||||||
| Institutional Fiduciary | |||||||||||
| Trust Money Market | |||||||||||
| Portfolio | 8,816,207 | 69,678,109 | (78,494,316 | ) | — $ | — | $ — | $ — | 0.00 | % | |
| Franklin Growth | |||||||||||
| Opportunities Fund | |||||||||||
| Non-Controlled | |||||||||||
| Affiliates | |||||||||||
| Institutional Fiduciary | |||||||||||
| Trust Money Market | |||||||||||
| Portfolio | 31,128,570 | 386,833,708 | (365,846,160 | ) | 52,116,118 $ 52,116,118 | $ — | $ — | 0.26 | % | ||
| Franklin Small Cap | |||||||||||
| Growth Fund | |||||||||||
| Non-Controlled | |||||||||||
| Affiliates | |||||||||||
| Institutional Fiduciary | |||||||||||
| Trust Money Market | |||||||||||
| Portfolio | 403,720,936 | 1,495,383,982 | (1,612,241,500) | 286,863,418 | $286,863,418 | $ — | $ — | 1.45 | % | ||
114 Annual Report
franklintempleton.com
FRANKLIN STRATEGIC SERIES
NOTES TO FINANCIAL STATEMENTS
| % of Affiliated | ||||||||||
| Number of | Number of | Fund Shares | ||||||||
| Shares Held | Shares Held | Value | Outstanding | |||||||
| at Beginning | Gross | Gross | at End | at End Investment | Realized | Held at End | ||||
| of Year | Additions | Reductions | of Year | of Year | Income Gain (Loss) | of Year | ||||
| Franklin Small-Mid Cap | ||||||||||
| Growth Fund | ||||||||||
| Non-Controlled | ||||||||||
| Affiliates | ||||||||||
| Institutional Fiduciary | ||||||||||
| Trust Money Market | ||||||||||
| Portfolio | 190,809,825 | 1,447,232,492 | (1,422,825,769) | 215,216,548 | $215,216,548 | |||||
| $ — | $ — | 1.09 | % | |||||||
g. Waiver and Expense Reimbursements
Advisers and Investor Services have contractually agreed in advance to waive or limit their respective fees and to assume as their own expense certain expenses otherwise payable by Franklin Focused Core Equity Fund so that the expenses (excluding distribution fees, and acquired fund fees and expenses) for Class A, Class C, Class R and Advisor Class of the Fund does not exceed 1.00% and Class R6 does not exceed 0.85% based on the average net assets of each class (other than certain non-routine expenses or costs, including those relating to litigation, indemnification, reorganizations, and liquidations) until August 31, 2016. Total expenses waived or paid are not subject to recapture subsequent to the fund’s fiscal year end.
Additionally, Investor Services has contractually agreed in advance to waive or limit its fees so that the Class R6 transfer agent fees for the Funds, except Franklin Focused Core Equity Fund, do not exceed 0.01% until August 31, 2016. There were no Class R6 transfer agent fees waived during the year ended April 30, 2016.
h. Other Affiliated Transactions
At April 30, 2016, one or more of the funds in Franklin Fund Allocator Series owned a percentage of the following Funds’ outstanding shares as follows:
| Franklin | |||||||
| Franklin | Franklin | Growth | Franklin | ||||
| Flex Cap | Focused Core | Opportunities | Small Cap | ||||
| Growth Fund | Equity Fund | Fund | Growth Fund | ||||
| 5.73 | % | 19.17 | % | 13.56 | % | 2.01 | % |
i. Interfund Transactions
Certain or all Funds engaged in purchases and sales of investments with funds or other accounts that have a common investment manager (or affiliated investment managers), directors, trustees, or officers. Purchases and sales for the year ended April 30, 2016, were as follows:
| Franklin | Franklin | |||
| Flex Cap | Small-Mid Cap | |||
| Growth Fund | Growth Fund | |||
| Purchases | $ | — | $ | 3,973,282 |
| Sales | $ | 2,631,723 | $ | — |
4. Expense Offset Arrangement
The Funds have entered into an arrangement with their custodian whereby credits realized as a result of uninvested cash balances are used to reduce a portion of the Funds’ custodian expenses. During the year ended April 30, 2016, the custodian fees were reduced as noted in the Statements of Operations.
franklintempleton.com
Annual Report
115
FRANKLIN STRATEGIC SERIES
NOTES TO FINANCIAL STATEMENTS
5. Income Taxes
For tax purposes, capital losses may be carried over to offset future capital gains, if any. At April 30, 2016, the capital loss carryfor-wards were as follows:
| Franklin | ||||
| Growth | Franklin | |||
| Opportunities | Small Cap | |||
| Fund | Growth Fund | |||
| Capital loss carryforwards: | ||||
| Short term | $ | 7,179,088 | $ | 6,223,946 |
For tax purposes, the Funds may elect to defer any portion of a post-October capital loss or late-year ordinary loss to the first day of the following fiscal year. At April 30, 2016, the deferred post-October capital losses and late-year ordinary losses were as follows:
| Franklin | ||||||||||
| Franklin | Franklin | Growth | Franklin | Franklin | ||||||
| Flex Cap | Focused Core | Opportunities | Small Cap | Small-Mid Cap | ||||||
| Growth Fund | Equity Fund | Fund | Growth Fund | Growth Fund | ||||||
| Realized capital losses | $ | 13,915,140 | $ | 8,190,676 | $ | — | $ | 190,602,616 | $ | — |
| Late-year ordinary losses | $ | 5,173,715 | $ | 48,511 | $ | 2,362,625 | $ | 2,532,992 | $ | 4,254,714 |
The tax character of distributions paid during the years ended April 30, 2016 and 2015, was as follows:
| Franklin Flex Cap | Franklin Focused Core | Franklin Growth | |||||||||||
| Growth Fund | Equity Fund | Opportunities Fund | |||||||||||
| 2016 | 2015 | 2016 | 2015 | 2016 | 2015 | ||||||||
| Distributions paid from: | |||||||||||||
| Ordinary income | $ | — | $ | 47,149,148 | $ | 2,114,090 | $ | 710,996 | $ | — | $ | — | |
| Long term capital gain | 378,559,935 | 485,417,922 | 3,857,211 | 1,833,627 | 25,773,152 | 21,070,998 | |||||||
| $ | 378,559,935 | $ | 532,567,070 | $ | 5,971,301 | $ | 2,544,623 | $ | 25,773,152 | $ | 21,070,998 | ||
| Franklin Small Cap | Franklin Small-Mid Cap | ||||||||||||
| Growth Fund | Growth Fund | ||||||||||||
| 2016 | 2015 | 2016 | 2015 | ||||||||||
| Distributions paid from: | |||||||||||||
| Ordinary income | $ | 31,688,531 | $ | 49,022,134 | $ | — | $ | 75,776,742 | |||||
| Long term capital gain | 28,081,216 | 58,829,248 | 327,658,868 | 594,505,935 | |||||||||
| $ | 59,769,747 | $ | 107,851,382 | $ | 327,658,868 | $ | 670,282,677 | ||||||
At April 30, 2016, the cost of investments, net unrealized appreciation (depreciation) and undistributed long term capital gains for income tax purposes were as follows:
| Franklin | |||||||||||||||
| Franklin | Franklin | Growth | Franklin | Franklin | |||||||||||
| Flex Cap | Focused Core | Opportunities | Small Cap | Small-Mid Cap | |||||||||||
| Growth Fund | Equity Fund | Fund | Growth Fund | Growth Fund | |||||||||||
| Cost of investments | $ | 1,996,139,384 | $ | 170,605,900 | $ | 952,731,618 | $ | 2,833,423,151 | $ | 2,861,681,102 | |||||
| Unrealized appreciation | $ | 903,240,038 | $ | 17,356,992 | $ | 313,691,969 | $ | 427,542,811 | $ | 909,566,649 | |||||
| Unrealized depreciation | (44,768,050 | ) | (15,802,488 | ) | (27,573,374 | ) | (298,694,442 | ) | (146,916,802 | ) | |||||
| Net unrealized appreciation (depreciation) | $ | 858,471,988 | $ | 1,554,504 | $ | 286,118,595 | $ | 128,848,369 | $ | 762,649,847 | |||||
| Distributable earnings – undistributed long term | |||||||||||||||
| capital gains | $ | — | $ | — | $ | — | $ | — | $ | 25,958,939 |
116 Annual Report
franklintempleton.com
FRANKLIN STRATEGIC SERIES
NOTES TO FINANCIAL STATEMENTS
Differences between income and/or capital gains as determined on a book basis and a tax basis are primarily due to differing treatments of wash sales.
6. Investment Transactions
Purchases and sales of investments (excluding short term securities) for the year ended April 30, 2016, were as follows:
| Franklin | ||||||||||
| Franklin | Franklin | Growth | Franklin | Franklin | ||||||
| Flex Cap | Focused Core | Opportunities | Small Cap | Small-Mid Cap | ||||||
| Growth Fund | Equity Fund | Fund | Growth Fund | Growth Fund | ||||||
| Purchases | $ | 1,832,766,803 | $ | 122,605,155 | $ | 468,260,907 | $ | 1,336,393,773 | $ | 1,392,686,892 |
| Sales | $ | 2,119,391,418 | $ | 62,712,711 | $ | 303,136,484 | $ | 1,386,592,991 | $ | 1,504,006,906 |
At April 30, 2016, in connection with securities lending transactions, certain or all Funds loaned investments and received cash collateral as follows:
| Equity | ||
| Investmentsb | ||
| Securities lending transactions:a | ||
| Franklin Flex Cap Growth Fund | $ | 61,292,950 |
| Franklin Growth Opportunities Fund | $ | 11,257,625 |
| Franklin Small Cap Growth Fund | $ | 244,245,900 |
| Franklin Small-Mid Cap Growth Fund | $ | 105,887,415 |
aThe agreements can be terminated at any time.
bGross amount of recognized liabilities for securities lending transactions is included in payable upon return of securities loaned in the Statements of Assets and Liabilities.
7. Restricted Securities
Certain or all Funds invest in securities that are restricted under the Securities Act of 1933 (1933 Act) or which are subject to legal, contractual, or other agreed upon restrictions on resale. Restricted securities are often purchased in private placement transactions, and cannot be sold without prior registration unless the sale is pursuant to an exemption under the 1933 Act. Disposal of these securities may require greater effort and expense, and prompt sale at an acceptable price may be difficult. The Funds may have registration rights for restricted securities. The issuer generally incurs all registration costs.
At April 30, 2016, the Funds held investments in restricted securities, excluding certain securities exempt from registration under the 1933 Act deemed to be liquid, as follows:
| Shares/ | ||||||
| Principal | Acquisition | |||||
| Amount | Issuer | Date | Cost | Value | ||
| Franklin Growth Opportunities Fund | ||||||
| 35,601,435 | Acerta Pharma BV | 2/01/16 | $ | 2,048,084 | $ | 1,856,472 |
| 268,600 | Tanium Inc., pfd., G | 9/14/15 | 4,000,233 | 4,000,233 | ||
| Total Restricted Securities (Value is 0.48% of Net Assets) | $ | 6,048,317 | $ | 5,856,705 | ||
| Franklin Small Cap Growth Fund | ||||||
| 825,201 | DraftKings Inc., pfd., D | 8/07/15 | $ | 4,444,442 | $ | 3,111,008 |
| 2,029,318 | DraftKings Inc., pfd., D-1 | 8/07/15 | 15,555,554 | 7,650,529 | ||
| 5,000,000 | DraftKings Inc., cvt., E, 5.00%, 12/23/16 | 12/23/15 | 5,000,000 | 9,726,750 | ||
| Total Restricted Securities (Value is 0.75% of Net Assets) | $ | 24,999,996 | $ | 20,488,287 | ||
| Franklin Small-Mid Cap Growth Fund | ||||||
| 660,161 | DraftKings Inc., pfd., D | 8/07/15 | $ | 3,555,556 | $ | 2,488,807 |
| 1,623,455 | DraftKings Inc., pfd., D-1 | 8/07/15 | 12,444,447 | 6,120,425 | ||
| 5,000,000 | DraftKings Inc., cvt., E, 5.00%, 12/23/16 | 12/23/15 | 5,000,000 | 9,726,750 | ||
| Total Restricted Securities (Value is 0.53% of Net Assets) | $ | 21,000,003 | $ | 18,335,982 | ||
franklintempleton.com
Annual Report
117
FRANKLIN STRATEGIC SERIES
NOTES TO FINANCIAL STATEMENTS
8. Holdings of 5% Voting Securities of Portfolio Companies
The 1940 Act defines “affiliated companies” to include investments in portfolio companies in which a fund owns 5% or more of the outstanding voting securities. Investments in “affiliated companies” for certain or all Funds for the year ended April 30, 2016, were as shown below.
| Number of | Number of | ||||||||||||
| Shares Held | Shares Held | Value | |||||||||||
| at Beginning | Gross | Gross | at End | at End | Investment | Realized | |||||||
| Name of Issuer | of Year | Additions | Reductions | of Year | of Year | Income | Gain (Loss) | ||||||
| Franklin Small Cap Growth Fund | |||||||||||||
| Non-Controlled Affiliates | |||||||||||||
| 2U Inc | 1,401,923 | 1,600,600 | (47,000 | ) | 2,955,523 | $ | 82,843,310 | $ | — | $ | (300,116 | ) | |
| Aratana Therapeutics Inc | 2,013,519 | 688,700 | (5,200 | ) | 2,697,019 | 16,209,084 | — | (17,219 | ) | ||||
| Astronics Corp | 749,660 | 533,084 | a | (210,762 | ) | 1,071,982 | 39,609,735 | — | 1,972,276 | ||||
| Bazaarvoice Inc | 4,314,900 | 409,900 | (934,100 | ) | 3,790,700 | —b | — | (5,784,080 | ) | ||||
| Callidus Software Inc | 2,907,900 | 426,800 | (744,300 | ) | 2,590,400 | —b | — | 2,612,557 | |||||
| Callon Petroleum Co | 4,435,282 | 966,500 | (3,370,900 | ) | 2,030,882 | —b | — | 4,351,670 | |||||
| The Habit Restaurants | |||||||||||||
| Inc., A | — | 1,218,700 | — | 1,218,700 | 20,413,225 | — | — | ||||||
| Houlihan Lokey Inc | — | 827,300 | — | 827,300 | 20,856,233 | 248,190 | — | ||||||
| The KEYW Holding Corp | 3,081,560 | 769,900 | — | 3,851,460 | 26,536,559 | — | — | ||||||
| Lattice Semiconductor | |||||||||||||
| Corp | 7,451,500 | 2,044,600 | (3,029,400 | ) | 6,466,700 | 36,019,519 | — | (2,301,150 | ) | ||||
| M/I Homes Inc | 1,280,400 | 301,500 | (196,200 | ) | 1,385,700 | 27,852,570 | — | (487,913 | ) | ||||
| Nanometrics Inc | 2,431,800 | 162,900 | (983,900 | ) | 1,610,800 | 28,768,888 | — | (2,500,493 | ) | ||||
| Potbelly Corp | 1,640,851 | 61,700 | (1,702,551 | ) | — | — | — | (8,109,274 | ) | ||||
| Revance Therapeutics | |||||||||||||
| Inc | 1,344,100 | 138,800 | (334,400 | ) | 1,148,500 | —b | — | 1,198,327 | |||||
| Rex Energy Corp | 5,509,700 | 1,147,400 | (6,657,100 | ) | — | — | — | (50,206,898 | ) | ||||
| The Spectranetics Corp | 1,411,600 | 865,000 | — | 2,276,600 | 38,702,200 | — | — | ||||||
| Sportsman’s Warehouse | |||||||||||||
| Holdings Inc | 2,356,900 | 615,900 | — | 2,972,800 | 33,830,464 | — | — | ||||||
| Tile Shop Holdings Inc | 2,625,700 | 377,100 | (1,082,800 | ) | 1,920,000 | —b | — | (3,473,662 | ) | ||||
| US Ecology Inc | 1,024,990 | 190,900 | (96,800 | ) | 1,119,090 | 50,392,623 | 832,619 | (738,230 | ) | ||||
| Zoe’s Kitchen Inc | 1,025,400 | 164,900 | (455,100 | ) | 735,200 | —b | — | 2,553,190 | |||||
| Total Affiliated Securities (Value is 15.48% of Net Assets) | $ | 422,034,410 | $ | 1,080,809 | $ | (61,231,015 | ) | ||||||
| aGross addition was the result of various corporate actions. | |||||||||||||
| bAs of April 30, 2016, no longer an affiliate. | |||||||||||||
9. Upcoming Acquisitions/Reorganization
On February 24, 2016, the Board for Franklin Strategic Series approved a proposal to reorganize Franklin Flex Cap Growth Fund with and into Franklin Growth Opportunities Fund, subject to approval by the shareholders of Franklin Flex Cap Growth Fund.
10. Credit Facility
Certain or all Funds, together with other U.S. registered and foreign investment funds (collectively, Borrowers), managed by Frank-lin Templeton Investments, are borrowers in a joint syndicated senior unsecured credit facility totaling $2 billion (Global Credit Facility) which, matures on February 10, 2017. This Global Credit Facility provides a source of funds to the Borrowers for temporary and emergency purposes, including the ability to meet future unanticipated or unusually large redemption requests.
Under the terms of the Global Credit Facility, the Funds shall, in addition to interest charged on any borrowings made by the Funds and other costs incurred by the Funds, pay their share of fees and expenses incurred in connection with the implementation and
118 Annual Report
franklintempleton.com
FRANKLIN STRATEGIC SERIES
NOTES TO FINANCIAL STATEMENTS
maintenance of the Global Credit Facility, based upon their relative share of the aggregate net assets of all of the Borrowers, including an annual commitment fee of 0.07% based upon the unused portion of the Global Credit Facility. Effective February 12, 2016, the annual commitment fee is 0.15%. These fees are reflected in other expenses in the Statements of Operations. During the year ended April 30, 2016, the Funds did not use the Global Credit Facility.
11. Fair Value Measurements
The Trust follow a fair value hierarchy that distinguishes between market data obtained from independent sources (observable inputs) and the Trust’s own market assumptions (unobservable inputs). These inputs are used in determining the value of the Funds’ financial instruments and are summarized in the following fair value hierarchy:
- Level 1 – quoted prices in active markets for identical financial instruments
- Level 2 – other significant observable inputs (including quoted prices for similar financial instruments, interest rates, prepay- ment speed, credit risk, etc.)
- Level 3 – significant unobservable inputs (including the Funds’ own assumptions in determining the fair value of financial instruments)
The input levels are not necessarily an indication of the risk or liquidity associated with financial instruments at that level.
For movements between the levels within the fair value hierarchy, the Funds have adopted a policy of recognizing the transfers as of the date of the underlying event which caused the movement.
A summary of inputs used as of April 30, 2016, in valuing the Funds’ assets carried at fair value, is as follows:
| Level 1 | Level 2 | Level 3 | Total | |||||
| Franklin Flex Cap Growth Fund | ||||||||
| Assets: | ||||||||
| Investments in Securities: | ||||||||
| Equity Investmentsa | $ | 2,697,443,156 | $ | — | $ | — | $ | 2,697,443,156 |
| Short Term Investments | 157,168,216 | — | — | 157,168,216 | ||||
| Total Investments in Securities | $ | 2,854,611,372 | $ | — | $ | — | $ | 2,854,611,372 |
| Franklin Focused Core Equity Fund | ||||||||
| Assets: | ||||||||
| Investments in Securities: | ||||||||
| Equity Investmentsa | $ | 172,160,404 | $ | — | $ | — | $ | 172,160,404 |
| Franklin Growth Opportunities Fund | ||||||||
| Assets: | ||||||||
| Investments in Securities: | ||||||||
| Equity Investments:b | ||||||||
| Health Care | $ | — | $ | — | $ | 1,856,472 | $ | 1,856,472 |
| Information Technology | — | — | 4,000,233 | 4,000,233 | ||||
| Other Equity Investmentsa | 1,180,877,390 | 1,180,877,390 | ||||||
| Short Term Investments | 52,116,118 | — | — | 52,116,118 | ||||
| Total Investments in Securities | $ | 1,232,993,508 | $ | — | $ | 5,856,705 | $ | 1,238,850,213 |
| Receivables: | ||||||||
| Investment Securities Sold | $ | — | $ | — | $ | 3,015,748 | $ | 3,015,748 |
franklintempleton.com
Annual Report
119
FRANKLIN STRATEGIC SERIES
NOTES TO FINANCIAL STATEMENTS
| 11. Fair Value Measurements (continued) | ||||||||
| Level 1 | Level 2 | Level 3 | Total | |||||
| Franklin Small Cap Growth Fund | ||||||||
| Assets: | ||||||||
| Investments in Securities: | ||||||||
| Equity Investments:b | ||||||||
| Consumer Discretionary | $ | 548,990,658 | $ | — | $ | 10,761,537 | $ | 559,752,195 |
| Other Equity Investmentsa | 2,105,929,157 | — | — | 2,105,929,157 | ||||
| Convertible Bonds | — | — | 9,726,750 | 9,726,750 | ||||
| Short Term Investments | 286,863,418 | — | — | 286,863,418 | ||||
| Total Investments in Securities | $ | 2,941,783,233 | $ | — | $ | 20,488,287 | $ | 2,962,271,520 |
| Franklin Small-Mid Cap Growth Fund | ||||||||
| Assets: | ||||||||
| Investments in Securities: | ||||||||
| Equity Investments:b | ||||||||
| Consumer Discretionary | $ | 590,105,790 | $ | — | $ | 8,609,232 | $ | 598,715,022 |
| Other Equity Investmentsa | 2,800,672,629 | — | — | 2,800,672,629 | ||||
| Convertible Bonds | — | — | 9,726,750 | 9,726,750 | ||||
| Short Term Investments | 215,216,548 | — | — | 215,216,548 | ||||
| Total Investments in Securities | $ | 3,605,994,967 | $ | — | $ | 18,335,982 | $ | 3,624,330,949 |
| aFor detailed categories, see the accompanying Statement of Investments. | ||||||||
| bIncludes common and preferred stocks. | ||||||||
A reconciliation of assets in which Level 3 inputs are used in determining fair value is presented when there are significant Level 3 financial instruments at the end of the year.
12. Subsequent Events
The Funds have evaluated subsequent events through the issuance of the financial statements and determined that no events have occurred that require disclosure other than those already disclosed in the financial statements.
120 Annual Report
franklintempleton.com
FRANKLIN STRATEGIC SERIES
Report of Independent Registered Public Accounting Firm
To the Board of Trustees and Shareholders of Franklin Strategic Series
In our opinion, the accompanying statements of assets and liabilities, including the statements of investments, and the related statements of operations and of changes in net assets and the financial highlights present fairly, in all material respects, the financial position of Franklin Flex Cap Growth Fund, Franklin Focused Core Equity Fund, Franklin Growth Opportunities Fund, Franklin Small Cap Growth Fund, and Franklin Small-Mid Cap Growth Fund (separate portfolios of Franklin Strategic Series, hereafter referred to as the “Funds”) at April 30, 2016, the results of each of their operations for the year then ended, the changes in each of their net assets for each of the two years in the period then ended and the financial highlights for each of the periods presented, in conformity with accounting principles generally accepted in the United States of America. These financial statements and financial highlights (hereafter referred to as “financial statements”) are the responsibility of the Funds’ management. Our responsibility is to express an opinion on these financial statements based on our audits. We conducted our audits of these financial statements in accordance with the standards of the Public Company Accounting Oversight Board (United States). Those standards require that we plan and perform the audit to obtain reasonable assurance about whether the financial statements are free of material misstatement. An audit includes examining, on a test basis, evidence supporting the amounts and disclosures in the financial statements, assessing the accounting principles used and significant estimates made by management, and evaluating the overall financial statement presentation. We believe that our audit, which included confirmation of securities at April 30, 2016 by correspondence with the custodian, transfer agent and brokers, provide a reasonable basis for our opinion.
PricewaterhouseCoopers LLP
San Francisco, California
June 15, 2016
franklintempleton.com
Annual Report
121
FRANKLIN STRATEGIC SERIES
Tax Information (unaudited)
Under Section 852(b)(3)(C) of the Internal Revenue Code (Code), the Funds hereby report the maximum amount allowable but no less than the following amounts as long term capital gain dividends for the fiscal year ended April 30, 2016:
| Franklin | |||||||||
| Franklin | Franklin | Growth | Franklin | Franklin | |||||
| Flex Cap | Focused Core | Opportunities | Small Cap | Small-Mid Cap | |||||
| Growth Fund | Equity Fund | Fund | Growth Fund | Growth Fund | |||||
| $ | 378,559,935 | $ | 3,857,211 | $ | 25,773,152 | $ | 28,081,216 | $ | 327,658,868 |
Under Section 871(k)(2)(C) of the Code, the Funds hereby report the maximum amount allowable but no less than the following amounts as short term capital gain dividends for purposes of the tax imposed under Section 871(a)(1)(A) of the Code for the fiscal year ended April 30, 2016:
| Franklin | Franklin | ||
| Focused Core | Small Cap | ||
| Equity Fund | Growth Fund | ||
| $ | 1,253,355 | $ | 31,688,531 |
Under Section 854(b)(1)(A) of the Code, the Funds hereby report the following percentage amounts of the ordinary income dividends as income qualifying for the dividends received deduction for the fiscal year ended April 30, 2016:
| Franklin | Franklin | Franklin | |||
| Focused Core | Small Cap | Small-Mid Cap | |||
| Equity Fund | Growth Fund | Growth Fund | |||
| 100.00 | % | 28.84 | % | 100.00 | % |
Under Section 854(b)(1)(B) of the Code, the Funds hereby report the maximum amount allowable but no less than the following amounts as qualified dividends for purposes of the maximum rate under Section 1(h)(11) of the Code for the fiscal year ended April 30, 2016:
| Franklin | |||||||||
| Franklin | Franklin | Growth | Franklin | Franklin | |||||
| Flex Cap | Focused Core | Opportunities | Small Cap | Small-Mid Cap | |||||
| Growth Fund | Equity Fund | Fund | Growth Fund | Growth Fund | |||||
| $ | 11,160,410 | $ | 2,816,005 | $ | 5,860,286 | $ | 9,213,558 | $ | 24,644,742 |
Distributions, including qualified dividend income, paid during calendar year 2016 will be reported to shareholders on
Form 1099-DIV by mid-February 2017. Shareholders are advised to check with their tax advisors for information on the treatment of these amounts on their individual income tax returns.
122 Annual Report
franklintempleton.com
FRANKLIN STRATEGIC SERIES
Board Members and Officers
The name, year of birth and address of the officers and board members, as well as their affiliations, positions held with the Trust, principal occupations during at least the past five years and number of U.S. registered portfolios overseen in the Franklin Templeton Investments fund complex, are shown below. Generally, each board member serves until that person’s successor is elected and qualified.
| Independent Board Members | |||||
| Number of Portfolios in | |||||
| Name, Year of Birth | Length of | Fund Complex Overseen | Other Directorships Held During | ||
| and Address | Position | Time Served | by Board Member* | at Least the Past 5 Years | |
| Harris J. Ashton (1932) | Trustee | Since 1991 | 145 | Bar-S Foods (meat packing company) | |
| One Franklin Parkway | (1981-2010). | ||||
| San Mateo, CA 94403-1906 | |||||
| Principal Occupation During at Least the Past 5 Years: | |||||
| Director of various companies; and formerly, Director, RBC Holdings, Inc. (bank holding company) (until 2002); and President, Chief | |||||
| Executive Officer and Chairman of the Board, General Host Corporation (nursery and craft centers) (until 1998). | |||||
| Mary C. Choksi (1950) | Trustee | Since 2014 | 121 | Avis Budget Group Inc. (car rental) | |
| One Franklin Parkway | (2007-present), Omnicom Group Inc. | ||||
| San Mateo, CA 94403-1906 | (advertising and marketing | ||||
| communications services) | |||||
| (2011-present) and H.J. Heinz | |||||
| Company (processed foods and allied | |||||
| products) (1998-2006). | |||||
| Principal Occupation During at Least the Past 5 Years: | |||||
| Senior Advisor, Strategic Investment Group (investment management group) (2015-present); director of various companies; and formerly, | |||||
| Founding Partner and Senior Managing Director, Strategic Investment Group (1987-2015); Founding Partner and Managing Director, | |||||
| Emerging Markets Management LLC (investment management firm) (1987-2011); and Loan Officer/Senior Loan Officer/Senior Pension | |||||
| Investment Officer, World Bank Group (international financial institution) (1977-1987). | |||||
| Edith E. Holiday (1952) | Trustee | Since 1998 | 145 | Hess Corporation (exploration and | |
| One Franklin Parkway | refining of oil and gas) (1993-present), | ||||
| San Mateo, CA 94403-1906 | Canadian National Railway (railroad) | ||||
| (2001-present), White Mountains | |||||
| Insurance Group, Ltd. (holding | |||||
| company) (2004-present), RTI | |||||
| International Metals, Inc. (manufacture | |||||
| and distribution of titanium) | |||||
| (1999-2015) and H.J. Heinz Company | |||||
| (processed foods and allied products) | |||||
| (1994-2013). | |||||
| Principal Occupation During at Least the Past 5 Years: | |||||
| Director or Trustee of various companies and trusts; and formerly, Assistant to the President of the United States and Secretary of the | |||||
| Cabinet (1990-1993); General Counsel to the United States Treasury Department (1989-1990); and Counselor to the Secretary and Assistant | |||||
| Secretary for Public Affairs and Public Liaison – United States Treasury Department (1988-1989). | |||||
| J. Michael Luttig (1954) | Trustee | Since 2009 | 145 | Boeing Capital Corporation (aircraft | |
| One Franklin Parkway | financing) (2006-2013). | ||||
| San Mateo, CA 94403-1906 | |||||
| Principal Occupation During at Least the Past 5 Years: | |||||
| Executive Vice President, General Counsel and member of the Executive Council, The Boeing Company (aerospace company) | |||||
| (2006-present); and formerly, Federal Appeals Court Judge, U.S. Court of Appeals for the Fourth Circuit (1991-2006). | |||||
| Frank A. Olson (1932) | Trustee | Since 2007 | 145 | Hess Corporation (exploration and | |
| One Franklin Parkway | refining of oil and gas) (1998-2013). | ||||
| San Mateo, CA 94403-1906 | |||||
| Principal Occupation During at Least the Past 5 Years: | |||||
| Director of various companies; and formerly, Chairman of the Board, The Hertz Corporation (car rental) (1980-2000) and Chief Executive | |||||
| Officer (1977-1999); and Chairman of the Board, President and Chief Executive Officer, UAL Corporation (airlines) (June-December 1987). | |||||
| franklintempleton.com | Annual Report | 123 | |||
FRANKLIN STRATEGIC SERIES
| Independent Board Members (continued) | |||||
| Number of Portfolios in | |||||
| Name, Year of Birth | Length of | Fund Complex Overseen | Other Directorships Held During | ||
| and Address | Position | Time Served | by Board Member* | at Least the Past 5 Years | |
| Larry D. Thompson (1945) | Trustee | Since 2007 | 145 | The Southern Company (energy | |
| One Franklin Parkway | company) (2014-present; previously | ||||
| San Mateo, CA 94403-1906 | 2010-2012), Graham Holdings | ||||
| Company (education and media | |||||
| organization) (2011-present) and | |||||
| Cbeyond, Inc. (business | |||||
| communications provider) | |||||
| (2010-2012). | |||||
| Principal Occupation During at Least the Past 5 Years: | |||||
| Director of various companies; John A. Sibley Professor of Corporate and Business Law, University of Georgia School of Law (2015-present; | |||||
| previously 2011-2012); and formerly, Executive Vice President – Government Affairs, General Counsel and Corporate Secretary, PepsiCo, | |||||
| Inc. (consumer products) (2012-2014); Senior Vice President – Government Affairs, General Counsel and Secretary, PepsiCo, Inc. | |||||
| (2004-2011); Senior Fellow of The Brookings Institution (2003-2004); Visiting Professor, University of Georgia School of Law (2004); and | |||||
| Deputy Attorney General, U.S. Department of Justice (2001-2003). | |||||
| John B. Wilson (1959) | Lead | Trustee since | 121 | None | |
| One Franklin Parkway | Independent | 2006 and Lead | |||
| San Mateo, CA 94403-1906 | Trustee | Independent | |||
| Trustee | |||||
| since 2008 | |||||
| Principal Occupation During at Least the Past 5 Years: | |||||
| President, Staples Europe (office supplies) (2012-present); President and Founder, Hyannis Port Capital, Inc. (real estate and private equity | |||||
| investing); serves on private and non-profit boards; and formerly, Chief Operating Officer and Executive Vice President, Gap, Inc. (retail) | |||||
| (1996-2000); Chief Financial Officer and Executive Vice President – Finance and Strategy, Staples, Inc. (1992-1996); Senior Vice President – | |||||
| Corporate Planning, Northwest Airlines, Inc. (airlines) (1990-1992); and Vice President and Partner, Bain & Company (consulting firm) | |||||
| (1986-1990). | |||||
| Interested Board Members and Officers | |||||
| Number of Portfolios in | |||||
| Name, Year of Birth | Length of | Fund Complex Overseen | Other Directorships Held During | ||
| and Address | Position | Time Served | by Board Member* | at Least the Past 5 Years | |
| **Gregory E. Johnson (1961) | Trustee | Since 2013 | 160 | None | |
| One Franklin Parkway | |||||
| San Mateo, CA 94403-1906 | |||||
| Principal Occupation During at Least the Past 5 Years: | |||||
| Chairman of the Board, Member–Office of the Chairman, Director and Chief Executive Officer, Franklin Resources, Inc.; officer and/or director | |||||
| or trustee, as the case may be, of some of the other subsidiaries of Franklin Resources, Inc. and of 44 of the investment companies in Franklin | |||||
| Templeton Investments; Vice Chairman, Investment Company Institute; and formerly, President, Franklin Resources, Inc. (1994-2015). | |||||
| **Rupert H. Johnson, Jr. (1940) | Chairman of | Chairman of the | 145 | None | |
| One Franklin Parkway | the Board | Board since | |||
| San Mateo, CA 94403-1906 | and Trustee | 2013 | and | ||
| Trustee | |||||
| since 1991 | |||||
| Principal Occupation During at Least the Past 5 Years: | |||||
| Vice Chairman, Member – Office of the Chairman and Director, Franklin Resources, Inc.; Director, Franklin Advisers, Inc.; Senior Vice | |||||
| President, Franklin Advisory Services, LLC; and officer and/or director or trustee, as the case may be, of some of the other subsidiaries of | |||||
| Franklin Resources, Inc. and of 42 of the investment companies in Franklin Templeton Investments. | |||||
124 Annual Report
franklintempleton.com
FRANKLIN STRATEGIC SERIES
| Interested Board Members and Officers (continued) | ||||
| Number of Portfolios in | ||||
| Name, Year of Birth | Length of | Fund Complex Overseen | Other Directorships Held During | |
| and Address | Position | Time Served | by Board Member* | at Least the Past 5 Years |
| Alison E. Baur (1964) | Vice | Since 2012 | Not Applicable | Not Applicable |
| One Franklin Parkway | President | |||
| San Mateo, CA 94403-1906 | ||||
| Principal Occupation During at Least the Past 5 Years: | ||||
| Deputy General Counsel, Franklin Templeton Investments; and officer of some of the other subsidiaries of Franklin Resources, Inc. and of 45 | ||||
| of the investment companies in Franklin Templeton Investments. | ||||
| Laura F. Fergerson (1962) | Chief | Since 2009 | Not Applicable | Not Applicable |
| One Franklin Parkway | Executive | |||
| San Mateo, CA 94403-1906 | Officer – | |||
| Finance and | ||||
| Administration | ||||
| Principal Occupation During at Least the Past 5 Years: | ||||
| Senior Vice President, Franklin Templeton Services, LLC; Vice President, Franklin Advisers, Inc. and Franklin Templeton Institutional, LLC; | ||||
| and officer of 45 of the investment companies in Franklin Templeton Investments. | ||||
| Gaston Gardey (1967) | Treasurer, | Since 2009 | Not Applicable | Not Applicable |
| One Franklin Parkway | Chief | |||
| San Mateo, CA 94403-1906 | Financial | |||
| Officer and | ||||
| Chief | ||||
| Accounting | ||||
| Officer | ||||
| Principal Occupation During at Least the Past 5 Years: | ||||
| Treasurer, U.S. Fund Administration & Reporting, Franklin Templeton Investments; and officer of 28 of the investment companies in Franklin | ||||
| Templeton Investments. | ||||
| Aliya S. Gordon (1973) | Vice | Since 2009 | Not Applicable | Not Applicable |
| One Franklin Parkway | President | |||
| San Mateo, CA 94403-1906 | ||||
| Principal Occupation During at Least the Past 5 Years: | ||||
| Senior Associate General Counsel, Franklin Templeton Investments; and officer of 45 of the investment companies in Franklin Templeton | ||||
| Investments. | ||||
| Steven J. Gray (1955) | Vice | Since 2009 | Not Applicable | Not Applicable |
| One Franklin Parkway | President | |||
| San Mateo, CA 94403-1906 | ||||
| Principal Occupation During at Least the Past 5 Years: | ||||
| Senior Associate General Counsel, Franklin Templeton Investments; Vice President, Franklin Templeton Distributors, Inc. and Franklin | ||||
| Alternative Strategies Advisers, LLC; and officer of 45 of the investment companies in Franklin Templeton Investments. | ||||
franklintempleton.com
Annual Report
125
FRANKLIN STRATEGIC SERIES
| Interested Board Members and Officers (continued) | ||||
| Number of Portfolios in | ||||
| Name, Year of Birth | Length of | Fund Complex Overseen | Other Directorships Held During | |
| and Address | Position | Time Served | by Board Member* | at Least the Past 5 Years |
| Edward B. Jamieson (1948) | President and | Since 2010 | Not Applicable | Not Applicable |
| One Franklin Parkway | Chief | |||
| San Mateo, CA 94403-1906 | Executive | |||
| Officer – | ||||
| Investment | ||||
| Management | ||||
| Principal Occupation During at Least the Past 5 Years: | ||||
| President, Chief Investment Officer and Director, Franklin Advisers, Inc.; Executive Vice President, Franklin Templeton Institutional, LLC; and | ||||
| officer and/or trustee, as the case may be, of some of the other subsidiaries of Franklin Resources, Inc. and of 10 of the investment companies | ||||
| in Franklin Templeton Investments. | ||||
| Robert Lim (1948) | Vice | Since | Not Applicable | Not Applicable |
| One Franklin Parkway | President – | May 2016 | ||
| San Mateo, CA | AML | |||
| 94403-1906 | Compliance | |||
| Principal Occupation During at Least the Past 5 Years: | ||||
| Vice President, Franklin Templeton Companies, LLC; Chief Compliance Officer, Franklin Templeton Distributors, Inc. and Franklin Templeton | ||||
| Investor Services, LLC, and officer of 45 of the investment companies in Franklin Templeton Investments. | ||||
| Christopher J. Molumphy (1962) Vice | Since 2000 | Not Applicable | Not Applicable | |
| One Franklin Parkway | President | |||
| San Mateo, CA 94403-1906 | ||||
| Principal Occupation During at Least the Past 5 Years: | ||||
| Director and Executive Vice President, Franklin Advisers, Inc.; Executive Vice President, Franklin Templeton Institutional, LLC; and officer of | ||||
| some of the other subsidiaries of Franklin Resources, Inc. and of 22 of the investment companies in Franklin Templeton Investments. | ||||
| Kimberly H. Novotny (1972) | Vice | Since 2013 | Not Applicable | Not Applicable |
| 300 S.E. 2nd Street | President | |||
| Fort Lauderdale, FL 33301-1923 | ||||
| Principal Occupation During at Least the Past 5 Years: | ||||
| Associate General Counsel, Franklin Templeton Investments; Vice President and Corporate Secretary, Fiduciary Trust International of the | ||||
| South; Vice President, Templeton Investment Counsel, LLC; Assistant Secretary, Franklin Resources, Inc.; and officer of 45 of the investment | ||||
| companies in Franklin Templeton Investments. | ||||
| Robert C. Rosselot (1960) | Chief | Since 2013 | Not Applicable | Not Applicable |
| 300 S.E. 2nd Street | Compliance | |||
| Fort Lauderdale, FL 33301-1923 | Officer | |||
| Principal Occupation During at Least the Past 5 Years: | ||||
| Director, Global Compliance, Franklin Templeton Investments; Vice President, Franklin Templeton Companies, LLC; officer of 45 of the | ||||
| investment companies in Franklin Templeton Investments; and formerly, Senior Associate General Counsel, Franklin Templeton Investments | ||||
| (2007-2013); and Secretary and Vice President, Templeton Group of Funds (2004-2013). | ||||
| Karen L. Skidmore (1952) | Vice | Since 2006 | Not Applicable | Not Applicable |
| One Franklin Parkway | President and | |||
| San Mateo, CA 94403-1906 | Secretary | |||
| Principal Occupation During at Least the Past 5 Years: | ||||
| Senior Associate General Counsel, Franklin Templeton Investments; and officer of 45 of the investment companies in Franklin Templeton | ||||
| Investments. | ||||
126 Annual Report
franklintempleton.com
FRANKLIN STRATEGIC SERIES
| Interested Board Members and Officers (continued) | ||||
| Number of Portfolios in | ||||
| Name, Year of Birth | Length of | Fund Complex Overseen | Other Directorships Held During | |
| and Address | Position | Time Served | by Board Member* | at Least the Past 5 Years |
| Navid Tofigh (1972) | Vice | Since | Not Applicable | Not Applicable |
| One Franklin Parkway | President | November 2015 | ||
| San Mateo, CA 94403-1906 | ||||
| Principal Occupation During at Least the Past 5 Years: | ||||
| Associate General Counsel, Franklin Templeton Investments; and officer of 45 of the investment companies in Franklin Templeton | ||||
| Investments. | ||||
| Craig S. Tyle (1960) | Vice | Since 2005 | Not Applicable | Not Applicable |
| One Franklin Parkway | President | |||
| San Mateo, CA 94403-1906 | ||||
| Principal Occupation During at Least the Past 5 Years: | ||||
| General Counsel and Executive Vice President, Franklin Resources, Inc.; and officer of some of the other subsidiaries of Franklin Resources, | ||||
| Inc. and of 45 of the investment companies in Franklin Templeton Investments. | ||||
| Lori A. Weber (1964) | Vice | Since 2011 | Not Applicable | Not Applicable |
| 300 S.E. 2nd Street | President | |||
| Fort Lauderdale, FL 33301-1923 | ||||
| Principal Occupation During at Least the Past 5 Years: | ||||
| Senior Associate General Counsel, Franklin Templeton Investments; Assistant Secretary, Franklin Resources, Inc.; Vice President and | ||||
| Secretary, Templeton Investment Counsel, LLC; and officer of 45 of the investment companies in Franklin Templeton Investments. | ||||
*We base the number of portfolios on each separate series of the U.S. registered investment companies within the Franklin Templeton Investments fund complex. These
portfolios have a common investment manager or affiliated investment managers.
**Gregory E. Johnson is considered to be an interested person of the Fund under the federal securities laws due to his position as an officer and director of Franklin
Resources, Inc. (Resources), which is the parent company of the Fund’s investment manager and distributor. Rupert H. Johnson, Jr. is considered to be an interested person
of the Fund under the federal securities laws due to his position as officer and director and major shareholder of Resources.
Note 1: Rupert H. Johnson, Jr. is the uncle of Gregory E. Johnson.
Note 2: Officer information is current as of the date of this report. It is possible that after this date, information about officers may change.
The Sarbanes-Oxley Act of 2002 and Rules adopted by the Securities and Exchange Commission require the Fund to disclose whether the Fund’s Audit
Committee includes at least one member who is an audit committee financial expert within the meaning of such Act and Rules. The Fund’s Board has determined
that there is at least one such financial expert on the Audit Committee and has designated John B. Wilson as its audit committee financial expert. The Board
believes that Mr. Wilson qualifies as such an expert in view of his extensive business background and experience, including service as chief financial officer of
Staples, Inc. from 1992 to 1996. Mr. Wilson has been a Member and Chairman of the Fund’s Audit Committee since 2006. As a result of such background and
experience, the Board believes that Mr. Wilson has acquired an understanding of generally accepted accounting principles and financial statements, the general
application of such principles in connection with the accounting estimates, accruals and reserves, and analyzing and evaluating financial statements that present
a breadth and level of complexity of accounting issues generally comparable to those of the Fund, as well as an understanding of internal controls and
procedures for financial reporting and an understanding of audit committee functions. Mr. Wilson is an independent Board member as that term is defined under
the relevant Securities and Exchange Commission Rules and Releases.
The Statement of Additional Information (SAI) includes additional information about the board members and is available, without charge, upon request.
Shareholders may call (800) DIAL BEN/342-5236 to request the SAI.
franklintempleton.com
Annual Report
127
FRANKLIN STRATEGIC SERIES
Shareholder Information
Board Review of Investment Management Agreement
At a meeting held April 12, 2016, the Board of Trustees (Board), including a majority of trustees that are not “interested persons” as such term is defined in section 2(a)(19) of the Investment Company Act of 1940 (hereinafter referred to as “non-interested Trustees” or “independent Trustees”), approved renewal of the investment management agreement for each of the separate funds within the Trust (Fund(s)). In reaching this decision, the Board took into account information furnished throughout the year at regular Board meetings, as well as information prepared specifically in connection with the annual renewal review process. Information furnished and discussed throughout the year included investment performance reports and related financial information for the Fund, along with periodic reports on expenses, shareholder services, legal and compliance matters, risk control, pricing, brokerage commissions and execution, and other services provided by the Investment Manager (Manager) and its affiliates, as well as marketing support payments made to financial intermediaries. Information furnished specifically in connection with the renewal process included a report for each Fund prepared by Broadridge Financial Solutions, Inc. (Broadridge), an independent organization, as well as additional material, including a Fund profitability analysis prepared by management. The Broadridge reports, which utilize data from Lipper, Inc. (Lipper), compared each Fund’s investment performance and expenses with those of other mutual funds deemed comparable to the Fund as selected by Lipper. The Fund profitability analysis discussed the profitability to Franklin Templeton Investments (FTI) from its overall U.S. fund operations, as well as on an individual fund-by-fund basis. Additional material accompanying such profitability analysis included information on a fund-by-fund basis listing portfolio managers and other accounts they manage, as well as information on management fees charged by the Manager and its affiliates to U.S. mutual funds and other accounts, including management’s explanation of differences where relevant. Such material also included a memorandum prepared by management describing project initiatives and capital investments relating to the services provided to the Funds by the FTI organization, as well as a memorandum relating to economies of scale and an analysis concerning transfer agent fees charged by an affiliate of the Manager. The Board also received a report on all marketing support payments made by FTI to financial intermediaries during the past year, as well as a memorandum relating to third-party servicing arrangements in response to a Guidance Update from the U.S. Securities and Exchange Commission (SEC) relating to mutual fund distribution and sub-accounting fees.
In considering such materials, the independent Trustees received assistance and advice from and met separately with independent counsel. While the investment management agreements for all Funds were considered at the same Board meeting, the Board dealt with each Fund separately. In approving continuance of the investment management agreement for each Fund, the Board, including a majority of independent Trustees, determined that the existing management fee structure was fair and reasonable and that continuance of the investment management agreement was in the best interests of such Fund and its shareholders. While attention was given to all information furnished, the following discusses some primary factors relevant to the Board’s decision.
NATURE, EXTENT AND QUALITY OF SERVICES. The Board was satisfied with the nature and quality of the overall services provided by the Manager and its affiliates to the Funds and their shareholders, except as noted later in the discussion of investment performance and expenses. The Board’s opinion was based, in part, upon periodic reports furnished it showing that the investment policies and restrictions for the Fund were consistently complied with as well as other reports periodically furnished the Board covering matters such as the compliance of portfolio managers and other management personnel with the code of ethics adopted throughout the Franklin Templeton fund complex, the adherence to fair value pricing procedures established by the Board, and the accuracy of net asset value calculations. The Board also noted the extent of benefits provided Fund shareholders from being part of the Franklin Templeton family of funds, including the right to exchange investments between the same class of shares of different funds without a sales charge, the ability to reinvest Fund dividends into other funds and the right to combine holdings in other funds to obtain a reduced sales charge. Favorable consideration was given to management’s continual efforts and expenditures in establishing effective business continuity plans and developing strategies to address cybersecurity threats. Additionally, the Board noted the Manager’s continued attention to pricing and valuation issues, particularly with respect to complex securities. Among other factors taken into account by the Board were the Manager’s best execution trading policies, including a favorable report by an independent portfolio trading analytical firm that also covered FOREX transactions. Consideration was also given to the experience of the Fund’s portfolio management team, the number of accounts managed and general method of compensation. In this latter respect, the Board noted that a primary factor in management’s determination of a portfolio manager’s bonus compensation was the relative investment performance of the funds he or she managed and that a portion
128 Annual Report
franklintempleton.com
FRANKLIN STRATEGIC SERIES
SHAREHOLDER INFORMATION
of such bonus was required to be invested in a pre-designated list of funds within such person’s fund management area so as to be aligned with the interests of shareholders. The Board also took into account the quality of transfer agent and shareholder services provided Fund shareholders by an affiliate of the Manager and steps taken by FTI to enhance analytical support to the investment management groups and provide additional oversight of liquidity risk and complex securities. The Board also took into account, among other things, management’s efforts in establishing a global credit facility for the benefit of the Fund and other accounts managed by FTI to provide a source of cash for temporary and emergency purposes or to meet unusual redemption requests as well as the strong financial position of the Manager’s parent company and its commitment to the mutual fund business as evidenced by its continued introduction of new funds and reassessment of the fund offerings in response to the market environment.
INVESTMENT PERFORMANCE. The Board placed significant emphasis on the investment performance of the Fund in view of its importance to shareholders. While consideration was given to performance reports and discussions with portfolio managers at Board meetings throughout the year, particular attention in assessing performance was given to the Broadridge reports furnished for the agreement renewals. The Broadridge reports prepared for each Fund showed the investment performance of its Class A shares in comparison to a performance universe selected by Lipper. Comparative performance for each Fund was shown for the one-year period ended January 31, 2016, and previous periods ended that date of up to 10 years depending on when a particular Fund commenced operations. The following summarizes the performance results for each of these Funds and the Board’s view of such performance.
Franklin Flex Cap Growth Fund — The performance universe for this Fund consisted of the Fund and all retail and institutional multi-cap growth funds as selected by Lipper. The Broadridge report showed the Fund’s total return to be in the middle performing quintile of such performance universe for the one-year period, and on an annualized basis to also be in the middle performing quintile of the performance universe during the previous three-year period, and in the second-lowest performing quintile of such universe during the previous five- and 10-year periods. The Board acknowledged the consideration management has given to the Fund culminating in a recommendation to the Board, which the Board accepted, to reorganize the Fund.
Franklin Focused Core Equity Fund — The performance universe for this Fund consisted of the Fund and all retail and institutional multi-cap core funds as selected by Lipper. The Broadridge report showed the Fund’s total return for the one-year period to be in the second-lowest performing quintile of such performance universe, and on an annualized basis to be in the second-highest performing quintile of such performance universe for the previous three-year period and the second-lowest performing quintile of such universe for the previous five-year period. The Fund has been in operation less than 10 years. The Board found the comparative performance of the Fund as set forth in the Broadridge report to be acceptable, noting its annualized three- and five-year total returns exceeded 10% and 7%, respectively.
Franklin Growth Opportunities Fund — The performance universe for this Fund consisted of the Fund and all retail and institutional multi-cap growth funds as selected by Lipper. The Broadridge report showed the Fund’s total return for the one-year period to be in the middle performing quintile of its performance universe, and on an annualized basis to be in the second-highest performing quintile of such universe during each of the previous three- and 10-year periods, and the middle performing quintile of such universe for the previous five-year period. The Board found the comparative performance of the Fund as set forth in the Broadridge report to be satisfactory.
Franklin Small Cap Growth Fund — The performance universe for this Fund consisted of the Fund and all retail and institutional small-cap growth funds as selected by Lipper. The Broadridge report showed the Fund’s total return to be in the lowest performing quintile of such performance universe during the one-year period, and on an annualized basis to be in the second-highest performing quintile of such universe for the previous three- and 10-year periods, and the middle performing quintile of such universe for the previous five-year period. The Board found the Fund’s investment performance as set forth in the Broadridge report to be acceptable, noting its three- and five-year annualized total returns each exceeded 7%.
Franklin Small-Mid Cap Growth Fund — The performance universe for this Fund consisted of the Fund and all retail and institutional mid-cap growth funds as selected by Lipper. The Broadridge report comparison for the Fund showed its total return during the one-year period to be in the second-lowest performing quintile of such performance universe, and on an annualized basis to be in the second-highest performing quintile of such universe for the previous three-year period, the second-lowest performing quintile of such universe for the previous
franklintempleton.com
Annual Report
129
FRANKLIN STRATEGIC SERIES
SHAREHOLDER INFORMATION
five-year period, and the middle performing quintile of such universe for the previous 10-year period. Management explained its ongoing review of the portfolio and its conviction around the portfolio holdings. The Board found the comparative performance of the Fund as set forth in the Broadridge report to be acceptable, noting that the Fund’s total return met or exceeded that of its median in five of the last 10 years.
COMPARATIVE EXPENSES. Consideration was given to the management fees and total expense ratio of each Fund compared with those of a group of other funds selected by Lipper as its appropriate Lipper expense group. Lipper expense data is based upon information taken from each fund’s most recent annual report, which reflects historical asset levels that may be quite different from those currently existing, particularly in a period of market volatility. While recognizing such inherent limitation and the fact that expense ratios generally increase as assets decline and decrease as assets grow, the Board believed the independent analysis conducted by Lipper to be an appropriate measure of comparative expenses. In reviewing comparative costs, Lipper provides information on each Fund’s contractual investment management fee in comparison with the investment management fee that would have been charged by other funds within its Lipper expense group assuming they were similar in size to the Fund, as well as the actual total expense ratio of each Fund in comparison with those of its Lipper expense group. The Lipper contractual investment management fee analysis includes administrative charges as being part of the investment management fee, and actual total expenses, for comparative consistency, are shown by Lipper for Fund Class A shares for funds with multiple classes of shares. The results of such expense comparisons showed the contractual investment management fee rates and actual total expense ratios for each of Franklin Flex Cap Growth Fund, Franklin Small Cap Growth Fund and Franklin Small-Mid Cap Growth Fund, to be in the least expensive quin-tile of their respective Lipper expense groups. The contractual investment management fee rate for Franklin Growth Opportunities Fund was in the least expensive quintile of its Lipper expense group and its actual total expense ratio was in the second least expensive quintile of such expense group. The Board was satisfied with the contractual management fee rate and total expense ratio of each of these Funds in comparison to their respective expense groups as shown in the Broadridge reports. The contractual investment management fee rate for Franklin Focused Core Equity Fund was in the second most expensive quintile of its Lipper expense group, while its actual total expense ratio was less than 2.5 basis points above the median of such expense group. The Board found the contractual management fee rate and total expense ratio of each of these Funds to be acceptable, noting that the total expenses for each Fund were subsidized by management.
MANAGEMENT PROFITABILITY. The Board also considered the level of profits realized by the Manager and its affiliates in connection with the operation of each Fund. In this respect, the Board reviewed the Fund profitability analysis that addresses the overall profitability of Franklin Templeton’s U.S. fund business, as well as its profits in providing management and other services to each of the individual funds during the 12-month period ended September 30, 2015, being the most recent fiscal year end for Franklin Resources, Inc., the Manager’s parent. In reviewing the analysis, the Board recognized that allocation methodologies are inherently subjective and various allocation methodologies may be reasonable while producing different results. In this respect, the Board noted that while management continually makes refinements to its methodologies in response to organizational and product related changes, the overall approach as defined by the primary drivers and activity measurements has remained consistent with that used in the Funds’ profitability report presentations from prior years. Additionally, the Funds’ independent registered public accounting firm had been engaged by the Manager to periodically review the reasonableness of the allocation methodologies to be used solely by the Funds’ Board in reference to the profitability analysis. In reviewing and discussing such analysis, management discussed with the Board its belief that costs incurred in establishing the infrastructure necessary for the type of mutual fund operations conducted by the Manager and its affiliates may not be fully reflected in the expenses allocated to each Fund in determining its profitability, as well as the fact that the level of profits, to a certain extent, reflected operational cost savings and efficiencies initiated by management. The Board also took into account management’s expenditures in improving shareholder services provided the Funds, as well as the need to implement systems and meet additional regulatory and compliance requirements resulting from statutes such as the Sarbanes-Oxley and Dodd-Frank Acts and recent SEC and other regulatory requirements. In addition, the Board considered a third-party study comparing the profitability of the Manager’s parent on an overall basis to other publicly held managers broken down to show profitability from management operations exclusive of distribution expenses, as well as profitability including distribution expenses. The Board also considered the extent to which the Manager and its affiliates might derive ancillary benefits from fund operations, including revenues generated from transfer agent services, potential benefits resulting from personnel and systems enhancements necessitated by fund growth, as well as increased leverage with
130 Annual Report
franklintempleton.com
FRANKLIN STRATEGIC SERIES
SHAREHOLDER INFORMATION
the service providers and counterparties, allocation of fund brokerage and the use of commission dollars to pay for research. Based upon its consideration of all these factors, the Board determined that the level of profits realized by the Manager and its affiliates from providing services to each Fund was not excessive in view of the nature, quality and extent of services provided.
ECONOMIES OF SCALE. The Board also considered whether economies of scale are realized by the Manager as the Funds grow larger and the extent to which this is reflected in the level of management fees charged. While recognizing that any precise determination is inherently subjective, the Board noted that based upon the Fund profitability analysis, it appears that as some funds get larger, at some point economies of scale do result in the Manager realizing a larger profit margin on management services provided such a fund. The Board noted that economies of scale were shared with each Fund and its shareholders through management fee breakpoints so that as a fund grows in size, its effective management fee rate declines. The fee structure under the investment management agreement for each Fund contains breakpoints that continued to asset levels that exceeded its asset size at December 31, 2015. In view of such fee structure and the favorable expense comparisons of each Fund within its respective expense group, the Board believed that to the extent economies of scale may be realized by the Manager of the Funds and its affiliates, that there was a sharing of benefits with the Funds and their shareholders.
Proxy Voting Policies and Procedures
The Trust’s investment manager has established Proxy Voting Policies and Procedures (Policies) that the Trust uses to determine how to vote proxies relating to portfolio securities. Shareholders may view the Trust’s complete Policies online at franklintempleton.com. Alternatively, shareholders may request copies of the Policies free of charge by calling the Proxy Group collect at (954) 527-7678 or by sending a written request to: Franklin Templeton Companies, LLC, 300 S.E. 2nd Street, Fort Lauderdale, FL 33301, Attention: Proxy Group. Copies of the Trust’s proxy voting records are also made available online at franklintempleton.com and posted on the U.S. Securities and Exchange Commission’s website at sec.gov and reflect the most recent 12-month period ended June 30.
Quarterly Statement of Investments
The Trust files a complete statement of investments with the U.S. Securities and Exchange Commission for the first and third quarters for each fiscal year on Form N-Q. Shareholders may view the filed Form N-Q by visiting the Commission’s website at sec.gov. The filed form may also be viewed and copied at the Commission’s Public Reference Room in Washington, DC. Information regarding the operations of the Public Reference Room may be obtained by calling (800) SEC-0330.
Householding of Reports and Prospectuses
You will receive each Fund’s financial reports every six months as well as an annual updated summary prospectus (prospectus available upon request). To reduce Fund expenses, we try to identify related shareholders in a household and send only one copy of the financial reports and summary prospectus. This process, called “householding,” will continue indefinitely unless you instruct us otherwise. If you prefer not to have these documents householded, please call us at (800) 632-2301. At any time you may view current prospectuses/summary prospectuses and financial reports on our website. If you choose, you may receive these documents through electronic delivery.
franklintempleton.com
Annual Report
131
This page intentionally left blank
| Contents | |
| Annual Report | |
| Economic and Market Overview | 3 |
| Franklin Biotechnology Discovery Fund | 4 |
| Franklin Natural Resources Fund | 14 |
| Financial Highlights and Statements of Investments | 25 |
| Financial Statements | 39 |
| Notes to Financial Statements | 43 |
| Report of Independent Registered | |
| Public Accounting Firm | 55 |
| Tax Information | 56 |
| Board Members and Officers | 57 |
| Shareholder Information | 62 |
Visit franklintempleton.com for fund updates, to access your account, or to find helpful financial planning tools.
2 Annual Report
franklintempleton.com
Annual Report
Economic and Market Overview
The U.S. economy moderated during the 12 months under review. After strengthening in 2015’s second quarter, the economy moderated in the third and fourth quarters. Growth slowed further in 2016’s first quarter as exports, business investment and federal government spending declined. The manufacturing sector expanded in March and April after contracting for five consecutive months, while the services sector expanded throughout the 12-month period. Growth in services contributed to new jobs and helped the unemployment rate decrease from 5.4% in April 2015 to 5.0% at period-end.1 Home sales and prices rose amid relatively low mortgage rates. Monthly retail sales grew during most of the review period and rose to the highest level in April in more than a year, driven mainly by automobile sales. Inflation, as measured by the Consumer Price Index, remained relatively subdued due to low energy prices.
After maintaining a near-zero interest rate for seven years to support the U.S. economy’s recovery, the U.S. Federal Reserve (Fed) raised its target range for the federal funds rate to 0.25%–0.50% at its December meeting. At the time of the increase, policymakers cited the labor market’s considerable improvement and were reasonably confident that inflation would move back to the Fed’s 2.00% medium-term objective. The Fed maintained the rate through period-end, indicating it would monitor domestic and global developments and their implications on the labor markets as it tracks actual and expected progression toward its employment and inflation goals.
U.S. stock markets experienced sell-offs during the period under review, resulting from investor concerns about the timing of the Fed’s interest rate increases, global economic growth, China’s slowing economy and tumbling stock market, geopolitical tensions in certain regions and a plunge in crude oil prices. Investors generally remained confident, however, as the Fed remained cautious about further interest rate increases, the eurozone economy improved, the European Central Bank expanded its quantitative easing measures and cut its benchmark interest rate to zero, the People’s Bank of China introduced further easing measures, and the Bank of Japan adopted a negative interest rate policy. The rally in crude oil prices toward period-end also boosted investor sentiment. Despite periods of volatility, the broad U.S. stock market ended the 12-month period relatively flat, as measured by the Standard & Poor’s 500 Index.
The foregoing information reflects our analysis and opinions as of April 30, 2016. The information is not a complete analysis of every aspect of any market, country, industry, security or fund. Statements of fact are from sources considered reliable.
1. Source: Bureau of Labor Statistics.
franklintempleton.com
Annual Report
3
Franklin Biotechnology Discovery Fund
This annual report for Franklin Biotechnology Discovery Fund covers the fiscal year ended April 30, 2016. Effective July 8, 2014, with limited exceptions, the Fund closed to new investors. Effective May 16, 2016, the Fund reopened to new investors.
Your Fund’s Goal and Main Investments
The Fund seeks capital appreciation by investing at least 80% of its net assets in securities of biotechnology companies and discovery research firms located in the U.S. and other countries.
Performance Overview
The Fund’s Class A shares had a -23.53% cumulative total return for the 12 months under review. In comparison, the NASDAQ Biotechnology Index®, which tracks U.S. and international-based biotechnology stocks, had a -19.51% total return.1 Also in comparison, the Standard & Poor’s 500 (S&P 500®) Index, which is a broad measure of the U.S. stock market, posted a +1.21% total return.1 Finally, domestic and international-based stocks, as measured by the NASDAQ Composite Index®, had a -2.19% total return.1 You can find the Fund’s long-term performance data in the Performance Summary beginning on page 7.
Performance data represent past performance, which does not guarantee future results. Investment return and principal value will fluctuate, and you may have a gain or loss when you sell your shares. Current performance may differ from figures shown. For most recent month-end performance, go to franklintempleton.com or call (800) 342-5236.
Investment Strategy
The Fund is managed using a bottom-up approach to individual stock selection, with a focus on fundamental analysis and primary research. We look for biotechnology, biopharmaceutical and platform technology companies that possess products with favorable competitive profiles, large market opportunities and strong intellectual property, supported by thoughtful clinical and market development strategies. Our assessment of these products is based on extensive primary research and due
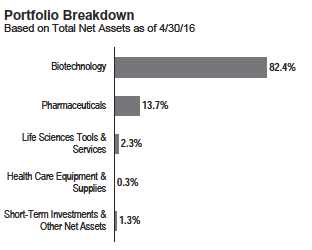
diligence and includes, but is not limited to, a thorough review of medical literature, consultation of community and academic physicians, and attendance at scientific meetings and symposia. Additionally, we favor companies with excellent management, strong financial characteristics and attractive valuations.
Manager’s Discussion
During the 12 months under review, the biotechnology industry remained subject to volatility surrounding drug trial results, and a few positions declined notably following adverse outcomes. Please keep in mind that volatility is not uncommon in the biotechnology sector, and the Fund seeks to take advantage of short-term volatility by initiating investments in or adding to securities we believe to be undervalued.
Key detractors from the Fund’s absolute performance during the reporting period included biotechnology industry holdings Celldex Therapeutics, Anacor Pharmaceuticals and Biogen.
Celldex Therapeutics is a development-stage biotechnology company with several clinical compounds. Its lead pipeline drug, Rintega, failed in a Phase 3 trial, for the treatment of newly diagnosed glioblastoma, a malignant central nervous system tumor. The company stopped the clinical trial in March and discontinued the drug’s development. Anacor focuses on discovering, developing and commercializing novel
1. Source: Morningstar.
The indexes are unmanaged and include reinvestment of any income or distributions. They do not reflect any fees, expenses or sales charges. One cannot invest directly in an
index, and an index is not representative of the Fund’s portfolio.
See www.franklintempletondatasources.com for additional data provider information.
The dollar value, number of shares or principal amount, and names of all portfolio holdings are listed in the Fund’s Statement of Investments (SOI). The SOI
begins on page 29.
4 Annual Report
franklintempleton.com
FRANKLIN BIOTECHNOLOGY DISCOVERY FUND
| Top 10 Holdings | ||
| 4/30/16 | ||
| Company | % of Total | |
| Sector/Industry | Net Assets | |
| Celgene Corp. | 10.0 | % |
| Biotechnology | ||
| Gilead Sciences Inc. | 8.5 | % |
| Biotechnology | ||
| Biogen Inc. | 8.2 | % |
| Biotechnology | ||
| Amgen Inc. | 6.3 | % |
| Biotechnology | ||
| Regeneron Pharmaceuticals Inc. | 3.6 | % |
| Biotechnology | ||
| Medivation | 3.6 | % |
| Biotechnology | ||
| Incyte Corp. | 3.0 | % |
| Biotechnology | ||
| BioMarin Pharmaceutical Inc. | 2.9 | % |
| Biotechnology | ||
| Heron Therapeutics Inc. | 2.7 | % |
| Biotechnology | ||
| Alexion Pharmaceuticals Inc. | 2.5 | % |
| Biotechnology |
small-molecule therapeutics derived from its boron chemistry platform. Anacor’s shares struggled during the period as a potential acquisition of the company by Pfizer did not occur until after period-end. In addition, the company had a financing overhang, which it ultimately addressed, and revenues from its antifungal medication were less than expected. Biogen develops, manufactures and markets therapies for people living with neurological, autoimmune and hematologic disorders. The company’s stock fell following disappointing results early in the reporting period amid slowing sales of its oral multiple sclerosis drug as well as mixed clinical trial results. More recently, Biogen reported solid fourth-quarter 2015 results, with revenues above consensus estimates.
In contrast, key contributors to the Fund’s absolute performance included Acerta Pharma and SciClone Pharmaceuticals in the pharmaceuticals industry and Medivation in the biotechnology industry. Biopharmaceutical company Acerta Pharma, which specializes in oncology, was acquired by AstraZeneca in February 2016. SciClone, a specialty pharmaceuticals company that focuses on treatments for cancer and infectious diseases, performed well late in the reporting period following a settlement with the U.S. government regarding the company’s
regulatory violations, and as the company disclosed it was exploring strategic options and had retained a firm to assist with a potential acquisition. Shares of biopharmaceutical company Medivation, which seeks rapid development of therapies for diseases with limited treatment options, surged late in the reporting period, largely due to rumors that Sanofi and other large pharmaceutical firms had expressed interest in acquiring the company.
Thank you for your continued participation in Franklin Biotechnology Discovery Fund. We look forward to serving your future investment needs.

The foregoing information reflects our analysis, opinions and portfolio holdings as of April 30, 2016, the end of the reporting period. The way we implement our main investment strategies and the resulting portfolio holdings may change depending on factors such as market and economic conditions. These opinions may not be relied upon as investment advice or an offer for a particular security. The information is not a complete analysis of every aspect of any market, country, industry, security or the Fund. Statements of fact are from sources considered reliable, but the investment manager makes no representation or warranty as to their completeness or accuracy. Although historical performance is no guarantee of future results, these insights may help you understand our investment management philosophy.
CFA® is a trademark owned by CFA Institute.
franklintempleton.com
Annual Report 5
FRANKLIN BIOTECHNOLOGY DISCOVERY FUND
Christopher Lee, M.D. is a vice president, research analyst and portfolio manager with Franklin Equity Group and covers biotechnology with a focus on hematology, oncology and immunology. Prior research coverage includes the pharmaceutical, specialty pharmaceutical and medical technology sectors. Dr. Lee joined Franklin Templeton Investments in 2015 and was previously with Capital Group. He has invested in public and private health care companies since 2008 and began his career as a management consultant with McKinsey & Company.
6 Annual Report
franklintempleton.com
FRANKLIN BIOTECHNOLOGY DISCOVERY FUND
Performance Summary as of April 30, 2016
Your dividend income will vary depending on dividends or interest paid by securities in the Fund’s portfolio, adjusted for operating expenses of each class. Capital gain distributions are net profits realized from the sale of portfolio securities. The performance table and graphs do not reflect any taxes that a shareholder would pay on Fund dividends, capital gain distributions, if any, or any realized gains on the sale of Fund shares. Total return reflects reinvestment of the Fund’s dividends and capital gain distributions, if any, and any unrealized gains or losses.
| Net Asset Value | ||||||
| Share Class (Symbol) | 4/30/16 | 4/30/15 | Change | |||
| A (FBDIX) | $ | 128.19 | $ | 182.30 | -$ | 54.11 |
| C (FBTDX) | $ | 125.99 | $ | 180.67 | -$ | 54.68 |
| R6 (FRBRX) | $ | 131.37 | $ | 185.75 | -$ | 54.38 |
| Advisor (FTDZX) | $ | 130.67 | $ | 185.12 | -$ | 54.45 |
| Distributions1 (5/1/15–4/30/16) | ||||||
| Short-Term | Long-Term | |||||
| Share Class | Capital Gain | Capital Gain | Total | |||
| A | $ | 3.8182 | $ | 9.9589 | $ | 13.7771 |
| C | $ | 3.8182 | $ | 9.9589 | $ | 13.7771 |
| R6 | $ | 3.8182 | $ | 9.9589 | $ | 13.7771 |
| Advisor | $ | 3.8182 | $ | 9.9589 | $ | 13.7771 |
See page 11 for Performance Summary footnotes.
franklintempleton.com
Annual Report
7
FRANKLIN BIOTECHNOLOGY DISCOVERY FUND
PERFORMANCE SUMMARY
Performance as of 4/30/162
Cumulative total return excludes sales charges. Average annual total returns and value of $10,000 investment include maximum sales charges. Class A: 5.75% maximum initial sales charge; Class C: 1% contingent deferred sales charge in first year only;
Class R6/Advisor Class: no sales charges.
| Average Annual | ||||||||||
| Cumulative | Average Annual | Value of $10,000 | Total Return | Total Annual | ||||||
| Share Class | Total Return3 | Total Return4 | Investment5 | (3/31/16 | )6 | Operating Expenses7 | ||||
| A | 1.00 | % | ||||||||
| 1-Year | -23.53 | % | -27.93 | % | $ | 7,207 | -34.39 | % | ||
| 5-Year | +130.81 | % | +16.82 | % | $ | 21,752 | +17.69 | % | ||
| 10-Year | +218.29 | % | +11.61 | % | $ | 29,999 | +10.41 | % | ||
| C | 1.75 | % | ||||||||
| 1-Year | -24.08 | % | -24.77 | % | $ | 7,523 | -31.54 | % | ||
| Since Inception (3/4/14) | -10.27 | % | -4.90 | % | $ | 8,973 | -6.78 | % | ||
| R6 | 0.60 | % | ||||||||
| 1-Year | -23.23 | % | -23.23 | % | $ | 7,677 | -30.13 | % | ||
| Since Inception (5/1/13) | +51.73 | % | +14.93 | % | $ | 15,173 | +13.88 | % | ||
| Advisor8 | 0.75 | % | ||||||||
| 1-Year | -23.36 | % | -23.36 | % | $ | 7,664 | -30.22 | % | ||
| 5-Year | +134.01 | % | +18.53 | % | $ | 23,401 | +19.42 | % | ||
| 10-Year | +224.23 | % | +12.48 | % | $ | 32,423 | +11.27 | % |
Performance data represent past performance, which does not guarantee future results. Investment return and principal value will fluctuate, and you may have a gain or loss when you sell your shares. Current performance may differ from figures shown. For most recent month-end performance, go to franklintempleton.com or call (800) 342-5236.
See page 11 for Performance Summary footnotes.
8 Annual Report
franklintempleton.com
FRANKLIN BIOTECHNOLOGY DISCOVERY FUND
PERFORMANCE SUMMARY
Total Return Index Comparison for a Hypothetical $10,000 Investment2
Total return represents the change in value of an investment over the periods shown. It includes any applicable maximum sales charge, Fund expenses, account fees and reinvested distributions. The unmanaged indexes include reinvestment of any income or distributions. They differ from the Fund in composition and do not pay management fees or expenses. One cannot invest directly in an index.

See page 11 for Performance Summary footnotes.
franklintempleton.com
Annual Report 9
FRANKLIN BIOTECHNOLOGY DISCOVERY FUND
PERFORMANCE SUMMARY
Total Return Index Comparison for a Hypothetical $10,000 Investment2 (continued)
See page 11 for Performance Summary footnotes.
10 Annual Report
franklintempleton.com
FRANKLIN BIOTECHNOLOGY DISCOVERY FUND
PERFORMANCE SUMMARY
All investments involve risks, including possible loss of principal. The Fund is a nondiversified fund that concentrates in a single sector, which involves risks such as patent considerations, product liability, government regulatory requirements, and regulatory approval for new drugs and medical products. Bio-technology companies often are small and/or relatively new. Smaller companies can be particularly sensitive to changes in economic conditions and have less certain growth prospects than larger, more established companies and can be volatile, especially over the short term. The Fund may also invest in foreign companies, which involve special risks, including currency fluctuations and political uncertainty. The Fund is actively managed but there is no guarantee that the manager’s investment decisions will produce the desired results. The Fund’s prospectus also includes a description of the main investment risks.
| Class C: | These shares have higher annual fees and expenses than Class A shares. |
| Class R6: | Shares are available to certain eligible investors as described in the prospectus. |
| Advisor Class: | Shares are available to certain eligible investors as described in the prospectus. |
1. The distribution amount is the sum of the dividend payments to shareholders for the period shown and includes only estimated tax-basis capital gain.
2. The Fund has a fee waiver associated with any investment in a Franklin Templeton money fund, contractually guaranteed through at least its current fiscal year-end. Fund
investment results reflect the fee waiver, to the extent applicable; without this reduction, the results would have been lower.
3. Cumulative total return represents the change in value of an investment over the periods indicated.
4. Average annual total return represents the average annual change in value of an investment over the periods indicated. Return for less than one year, if any, has not
been annualized.
5. These figures represent the value of a hypothetical $10,000 investment in the Fund over the periods indicated.
6. In accordance with SEC rules, we provide standardized average annual total return information through the latest calendar quarter.
7. Figures are as stated in the Fund’s current prospectus and may differ from the expense ratios disclosed in the Financial Highlights in this report. In periods of market vola-
tility, assets may decline significantly, causing total annual Fund operating expenses to become higher than the figures shown.
8. Effective 9/1/09, the Fund began offering Advisor Class shares, which do not have sales charges or a Rule 12b-1 plan. Performance quotations for this class reflect the fol-
lowing methods of calculation: (a) For periods prior to 9/1/09, a restated figure is used based upon the Fund’s Class A performance, excluding the effect of Class A’s maximum
initial sales charge, but reflecting the effect of the Class A Rule 12b-1 fees; and (b) for periods after 9/1/09, actual Advisor Class performance is used reflecting all charges and
fees applicable to that class. Since 9/1/09 (commencement of sales), the cumulative and average annual total returns of Advisor Class shares were +220.82% and +19.13%.
9. Source: Morningstar. The S&P 500 is a market capitalization-weighted index of 500 stocks designed to measure total U.S. equity market performance. The NASDAQ Bio-
technology Index is a modified capitalization-weighted index designed to measure performance of all NASDAQ stocks in the biotechnology sector.
See www.franklintempletondatasources.com for additional data provider information.
franklintempleton.com
Annual Report
11
FRANKLIN BIOTECHNOLOGY DISCOVERY FUND
Your Fund’s Expenses
As a Fund shareholder, you can incur two types of costs:
- Transaction costs, including sales charges (loads) on Fund purchases; and
- Ongoing Fund costs, including management fees, distribution and service (12b-1) fees, and other Fund expenses. All mutual funds have ongoing costs, sometimes referred to as operating expenses.
The following table shows ongoing costs of investing in the Fund and can help you understand these costs and compare them with those of other mutual funds. The table assumes a $1,000 investment held for the six months indicated.
Actual Fund Expenses
The first line (Actual) for each share class listed in the table provides actual account values and expenses. The “Ending Account Value” is derived from the Fund’s actual return, which includes the effect of Fund expenses.
You can estimate the expenses you paid during the period by following these steps. Of course, your account value and expenses will differ from those in this illustration:
1. Divide your account value by $1,000.
If an account had an $8,600 value, then $8,600 ÷ $1,000 = 8.6.
2. Multiply the result by the number under the heading “Expenses Paid During Period.”
If Expenses Paid During Period were $7.50, then 8.6 × $7.50 = $64.50.
In this illustration, the estimated expenses paid this period are $64.50.
Hypothetical Example for Comparison with Other Funds
Information in the second line (Hypothetical) for each class in the table can help you compare ongoing costs of investing in the Fund with those of other mutual funds. This information may not be used to estimate the actual ending account balance or expenses you paid during the period. The hypothetical “Ending Account Value” is based on the actual expense ratio for each class and an assumed 5% annual rate of return before expenses, which does not represent the Fund’s actual return. The figure under the heading “Expenses Paid During Period” shows the hypothetical expenses your account would have incurred under this scenario. You can compare this figure with the 5% hypothetical examples that appear in shareholder reports of other funds.
Please note that expenses shown in the table are meant to highlight ongoing costs and do not reflect any transaction costs, such as sales charges. Therefore, the second line for each class is useful in comparing ongoing costs only, and will not help you compare total costs of owning different funds. In addition, if transaction costs were included, your total costs would have been higher. Please refer to the Fund prospectus for additional information on operating expenses.
12 Annual Report
franklintempleton.com
FRANKLIN BIOTECHNOLOGY DISCOVERY FUND
YOUR FUND’S EXPENSES
| Beginning Account | Ending Account | Expenses Paid During | ||||
| Share Class | Value 11/1/15 | Value 4/30/16 | Period* 11/1/15–4/30/16 | |||
| A | ||||||
| Actual | $ | 1,000 | $ | 812.90 | $ | 4.55 |
| Hypothetical (5% return before expenses) | $ | 1,000 | $ | 1,019.84 | $ | 5.07 |
| C | ||||||
| Actual | $ | 1,000 | $ | 810.20 | $ | 7.56 |
| Hypothetical (5% return before expenses) | $ | 1,000 | $ | 1,016.51 | $ | 8.42 |
| R6 | ||||||
| Actual | $ | 1,000 | $ | 814.70 | $ | 2.71 |
| Hypothetical (5% return before expenses) | $ | 1,000 | $ | 1,021.88 | $ | 3.02 |
| Advisor | ||||||
| Actual | $ | 1,000 | $ | 813.90 | $ | 3.47 |
| Hypothetical (5% return before expenses) | $ | 1,000 | $ | 1,021.03 | $ | 3.87 |
*Expenses are calculated using the most recent six-month expense ratio, net of expense waivers, annualized for each class (A: 1.01%;
C: 1.68%; R6: 0.60%; and Advisor: 0.77%), multiplied by the average account value over the period, multiplied by 182/366 to reflect the one-
half year period.
franklintempleton.com
Annual Report
13
Franklin Natural Resources Fund
This annual report for Franklin Natural Resources Fund covers the fiscal year ended April 30, 2016.
Your Fund’s Goal and Main Investments
The Fund seeks high total return (total return consists of capital appreciation and current dividend and interest income) by investing, under normal market conditions, at least 80% of its net assets in equity and debt securities of companies that own, produce, refine, process, transport or market natural resources, as well as those that provide related services for natural resources companies.
Performance Overview
The Fund’s Class A shares had a -19.80% cumulative total return for the 12 months under review. In comparison, the Standard & Poor’s (S&P®) North American Natural Resources Index, which tracks companies involved in industries such as mining, energy, timber and forestry services, and the production of pulp and paper, had a -15.40% total return.1 Also in comparison, the S&P 500 Index, which is a broad measure of the U.S. stock market, posted a +1.21% total return.1 Please note index performance information is provided for reference and we do not attempt to track any index but rather undertake investments on the basis of fundamental research. The Fund’s strategy, which focuses on companies with higher long-term growth potential, differs from the natural resources index’s large weighting in income-oriented companies that typically provide more limited opportunities for growth. This difference may occasionally lead to wide performance discrepancies, especially in periods when investors focus on short-term safety and yield or, conversely, when investors focus more heavily on companies with stronger growth prospects and greater commodity price leverage. Furthermore, the Fund performed in line with certain other natural resources funds with similar strategies. You can find the Fund’s long-term performance data in the Performance Summary beginning on page 18.
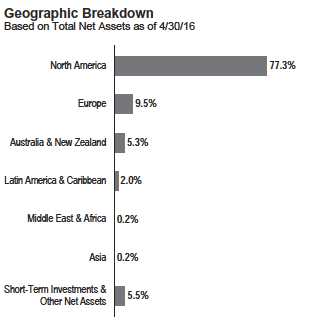
Performance data represent past performance, which does not guarantee future results. Investment return and principal value will fluctuate, and you may have a gain or loss when you sell your shares. Current performance may differ from figures shown. For most recent month-end performance, go to franklintempleton.com or call (800) 342-5236.
Investment Strategy
We use a fundamental, research-driven approach to identify industries in the natural resources sector that we believe offer the strongest underlying attributes including, but not limited to, favorable supply and demand characteristics, barriers to entry and pricing power. Within those industries, we seek to identify individual companies that have identifiable growth drivers and that present, in our opinion, the best trade-off between growth potential, business and financial risk, and valuation. The Fund’s holdings are typically concentrated in the energy sector but also can include investments in metals and mining, chemicals, paper and forest products, and other related sectors.
1. Source: Morningstar.
The indexes are unmanaged and include reinvestment of any income or distributions. They do not reflect any fees, expenses or sales charges. One cannot invest directly in an
index, and an index is not representative of the Fund’s portfolio.
The dollar value, number of shares or principal amount, and names of all portfolio holdings are listed in the Fund’s Statement of Investments (SOI). The SOI
begins on page 36.
14 Annual Report
franklintempleton.com
FRANKLIN NATURAL RESOURCES FUND
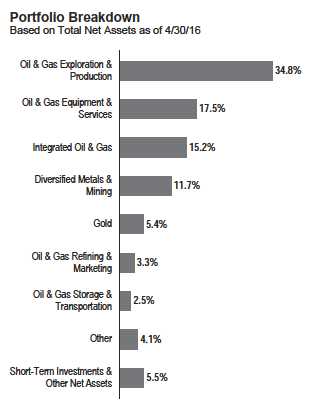
Sector Overview
Global commodity prices generally declined during the 12 months under review due to increased supply, slower demand growth for certain commodities and investor concerns about moderation in global economic expansion. Additionally, U.S. dollar strength exacerbated the impact of weakening supply-and-demand fundamentals during much of the period as market expectations for the U.S. Federal Reserve’s (Fed’s) initial interest rate increase amid other major central banks’ continued monetary easing contributed to the U.S. dollar’s appreciation against many foreign currencies. However, the U.S. dollar declined in 2016 to its lowest level in nearly a year by period-end amid uncertainty about potential interest rate increases as well as potential weakening of various global currencies.
Crude oil prices remained stable early in the period as U.S. crude oil inventories and the number of active U.S. oil rigs declined, global demand grew and investors occasionally became concerned about the potential impact of unrest in the Middle East. However, crude oil prices subsequently fell, dragging many energy-related stocks lower, as China’s disappointing economic data reignited fears about a slowing global economy. Reduced U.S. crude oil production during the period was more than offset by robust Organization of the Oil Exporting Countries oil production, notably in Saudi Arabia and Iraq; potentially increased production from Iran; and anticipation of the Fed’s interest rate hike in December. However, in 2016 an outlook for accelerating declines in U.S. oil production coupled with record demand provided confidence in a rebalanc-ing of global markets despite an ongoing inventory surplus, and prices increased. Nevertheless, oil prices declined overall for the year.
U.S. natural gas spot prices also fell for the period amid a warm North American winter and elevated inventory levels. An increase in natural gas consumption by power plants switching from coal to natural gas helped to partially offset a decline in residential and commercial demand. Colder-than-usual spring weather in the Northeast and a pipeline explosion also caused some short-term increases in natural gas futures, but lower overall demand and higher supply resulted in price declines similar to those experienced for crude oil.
Gold and silver prices experienced weakness for much of the period, as low global inflation and a strong U.S. dollar dimmed the appeal of gold and silver as investments. Further hurting gold prices were solid U.S. economic growth and employment trends and the Fed’s interest rate hike in December 2015. However, in 2016, U.S. dollar weakness, lower-than-expected U.S. economic growth and reduced prospects for higher interest rates increased demand for non-yielding assets. Rising Chinese demand for industrial use of silver also helped silver prices. Prices for platinum and palladium, industrial metals widely used for auto production, also increased during 2016, helped by robust U.S. demand. However, it was not enough to overcome price declines experienced earlier in the period resulting from decelerating auto sales in China and other parts of the world. Many base metals reached multi-year price lows during the period, which significantly impacted related stocks, amid strong supply and fears of slowing demand as China’s economy moderated. Iron ore prices mostly declined during 2015, but increased demand from Chinese steelmakers increased prices for the period.
Manager’s Discussion
During the 12 months under review, a significant decline in commodity prices and equity values occurred as modest oversupply of various commodities was exacerbated by softening demand, both real and perceived. Fund performance peaked early in the period after staging a moderate recovery from lows in December 2014, marking a difficult starting point for the one-year period.
Over the period, investors became increasingly cautious regarding prospects for global growth and for the outlook in China, in particular. Natural resources sector and market weakness reached a low point in January 2016 when economic concerns
franklintempleton.com
Annual Report
15
FRANKLIN NATURAL RESOURCES FUND
| Top 10 Holdings | ||
| 4/30/16 | ||
| Company | % of Total | |
| Sector/Industry, Country | Net Assets | |
| Schlumberger Ltd. | 4.7 | % |
| Oil & Gas Equipment & Services, U.S. | ||
| Occidental Petroleum Corp. | 4.0 | % |
| Integrated Oil & Gas, U.S. | ||
| Royal Dutch Shell PLC | 3.5 | % |
| Integrated Oil & Gas, U.K. | ||
| Noble Energy Inc. | 3.5 | % |
| Oil & Gas Exploration & Production, U.S. | ||
| Pioneer Natural Resources Co. | 3.4 | % |
| Oil & Gas Exploration & Production, U.S. | ||
| EOG Resources Inc. | 3.4 | % |
| Oil & Gas Exploration & Production, U.S. | ||
| Anadarko Petroleum Corp. | 3.4 | % |
| Oil & Gas Exploration & Production, U.S. | ||
| Chevron Corp. | 2.8 | % |
| Integrated Oil & Gas, U.S. | ||
| BHP Billiton PLC | 2.8 | % |
| Diversified Metals & Mining, Australia | ||
| Concho Resources Inc. | 2.6 | % |
| Oil & Gas Exploration & Production, U.S. |
were joined by fears of the potential for a credit market melt-down, which disproportionately impacted companies with even moderate levels of debt. Believing it was a good buying opportunity, we significantly added to the Fund’s holdings in oil and gas exploration and production (E&P) companies that we believed had the ability to survive the downturn and thrive in a recovery. Although many companies in which the Fund did not hold any securities succumbed to financial stress and filed for bankruptcy, while others restricted debt, the sector recovered strongly beginning in mid-January as credit fears were not fully realized, helped by improving economic indicators along with healing in commodity markets. Improving commodity fundamentals stemmed from moderating supply and relatively stable demand and, in some cases, much stronger demand growth than expected, such as for crude oil.
Although our investment actions along with the recovery aided performance after the lows reached in January, it was not enough to recapture performance lost in the first nine months of the period. The diversified metals and mining industry was a leading detractor from the Fund’s absolute performance and performance relative to its benchmark S&P North American Natural Resources Index as prices for most metals reached multi-year lows and a perception of softening economic conditions, including in China, pointed to more of the same. The period saw significant underperformance from even the largest, lowest cost and best capitalized producers such as Australia-based companies BHP Billiton2 and Rio Tinto,2 while companies with smaller to middle market capitalization and those perceived to be of higher credit risk suffered even more, including Glencore2 (Switzerland) and Freeport-McMoRan. In addition, as has been the case over the past couple of years, the diversified metals and mining industry had a substantial impact on relative performance given that the Fund is global in nature and more diversified than the Fund’s benchmark index, which is focused mostly on North America and energy.
Oil and gas equipment and services also detracted from absolute and relative performance. The relative underperformance was primarily due to the Fund’s holdings in small to middle capitalization stocks and those with exposure to the offshore market as opposed to the index, which is primarily comprised of large capitalization, diversified companies. In particular, a relatively small position in C&J Energy Services2 significantly detracted from absolute and relative performance due to the company’s exposure to weak conditions in the U.S. onshore market and relatively high debt levels related to an ill-timed acquisition. The integrated oil and gas industry was another major relative detractor primarily due to the Fund’s underweighting, which is a structural component of our strategy that seeks to invest in companies with stronger prospects for growth. These stocks held up much better in the downturn due to their strong balance sheets, integrated business models and lower sensitivity to commodity prices.
The E&P industry was a leading detractor from the Fund’s absolute performance due to the Fund’s large industry weighting, which we increased over the period as we sought to take advantage of what we perceived to be market mispricing of securities. Although this negatively impacted performance over the period, it allowed the Fund to perform strongly as the industry recovered. Major E&P industry detractors included Anadarko Petroleum and Marathon Oil.
Relative contributors included the oil and gas storage and transportation industry due to the Fund’s significant underweighting. The industry had performed strongly on a relative basis until the spring of 2015 when investors began to question the companies’ growth prospects and ability to sustain promised dividend growth. Industry valuations had been very rich, in our analysis, making the stocks susceptible to a shift in sentiment. An
2. Not part of the index.
See www.franklintempletondatasources.com for additional data provider information.
16 Annual Report
franklintempleton.com
FRANKLIN NATURAL RESOURCES FUND
underweighted allocation and stock selection in the oil and gas refining and marketing industry also contributed to relative performance.
Additionally, gold industry holdings contributed on a relative and absolute basis as the sector, after weakening for most of the period, posted exceptionally strong performance from January lows due to rising gold prices, which benefited from indications that the Fed may hold off on raising interest rates and additional stimulus from other governments, including the European Union. Major contributors included Canada-based companies OceanaGold2 and Barrick Gold. Cash holdings, which we increased strategically in the summer of 2015 as we became concerned with equity valuations, also contributed to relative performance.
Overall, it was a challenging year for commodity markets and commodity-linked equities, and the first part of 2016 felt like a perfect storm. However, commodity markets began improving in late January, and from the beginning of 2016 through period-end the Fund performed well versus its peers and outperformed its benchmark index.
Thank you for your continued participation in Franklin Natural Resources Fund. We look forward to serving your future investment needs.

The foregoing information reflects our analysis, opinions and portfolio holdings as of April 30, 2016, the end of the reporting period. The way we implement our main investment strategies and the resulting portfolio holdings may change depending on factors such as market and economic conditions. These opinions may not be relied upon as investment advice or an offer for a particular security. The information is not a complete analysis of every aspect of any market, country, industry, security or the Fund. Statements of fact are from sources considered reliable, but the investment manager makes no representation or warranty as to their completeness or accuracy. Although historical performance is no guarantee of future results, these insights may help you understand our investment management philosophy.
franklintempleton.com
Annual Report
17
FRANKLIN NATURAL RESOURCES FUND
Performance Summary as of April 30, 2016
Your dividend income will vary depending on dividends or interest paid by securities in the Fund’s portfolio, adjusted for operating expenses of each class. Capital gain distributions are net profits realized from the sale of portfolio securities. The performance table and graphs do not reflect any taxes that a shareholder would pay on Fund dividends, capital gain distributions, if any, or any realized gains on the sale of Fund shares. Total return reflects reinvestment of the Fund’s dividends and capital gain distributions, if any, and any unrealized gains or losses.
| Net Asset Value | ||||||
| Share Class (Symbol) | 4/30/16 | 4/30/15 | Change | |||
| A (FRNRX) | $ | 25.02 | $ | 31.46 | -$ | 6.44 |
| C (FNCRX) | $ | 24.25 | $ | 30.46 | -$ | 6.21 |
| R6 (N/A) | $ | 26.73 | $ | 33.62 | -$ | 6.89 |
| Advisor (FNRAX) | $ | 26.71 | $ | 33.63 | -$ | 6.92 |
| Distributions1 (5/1/15–4/30/16) | ||
| Dividend | ||
| Share Class | Income | |
| A | $ | 0.1756 |
| C | $ | 0.0053 |
| R6 | $ | 0.3441 |
| Advisor | $ | 0.2796 |
See page 22 for Performance Summary footnotes.
18 Annual Report
franklintempleton.com
FRANKLIN NATURAL RESOURCES FUND
PERFORMANCE SUMMARY
Performance as of 4/30/162
Cumulative total return excludes sales charges. Average annual total returns and value of $10,000 investment include maximum sales charges. Class A: 5.75% maximum initial sales charge; Class C: 1% contingent deferred sales charge in first year only;
Class R6/Advisor Class: no sales charges.
| Average Annual | ||||||||||||
| Cumulative | Average Annual | Value of $10,000 | Total Return | Total Annual Operating Expenses7 | ||||||||
| Share Class | Total Return3 | Total Return4 | Investment5 | (3/31/16 | )6 | (with waiver) | (without waiver) | |||||
| A | 1.03 | % | 1.03 | % | ||||||||
| 1-Year | -19.80 | % | -24.41 | % | $ | 7,559 | -26.05 | % | ||||
| 5-Year | -42.43 | % | -11.51 | % | $ | 5,426 | -13.68 | % | ||||
| 10-Year | -7.80 | % | -1.39 | % | $ | 8,690 | -2.07 | % | ||||
| C | 1.78 | % | 1.78 | % | ||||||||
| 1-Year | -20.37 | % | -21.16 | % | $ | 7,884 | -22.92 | % | ||||
| 5-Year | -44.41 | % | -11.08 | % | $ | 5,559 | -13.27 | % | ||||
| 10-Year | -14.12 | % | -1.51 | % | $ | 8,588 | -2.19 | % | ||||
| R6 | 0.54 | % | 0.55 | % | ||||||||
| 1-Year | -19.25 | % | -19.25 | % | $ | 8,075 | -21.08 | % | ||||
| Since Inception (9/20/13) | -27.46 | % | -11.58 | % | $ | 7,254 | -16.34 | % | ||||
| Advisor | 0.78 | % | 0.78 | % | ||||||||
| 1-Year | -19.57 | % | -19.57 | % | $ | 8,043 | -21.36 | % | ||||
| 5-Year | -41.58 | % | -10.19 | % | $ | 5,842 | -12.40 | % | ||||
| 10-Year | -5.07 | % | -0.52 | % | $ | 9,493 | -1.20 | % | ||||
Performance data represent past performance, which does not guarantee future results. Investment return and principal value will fluctuate, and you may have a gain or loss when you sell your shares. Current performance may differ from figures shown. For most recent month-end performance, go to franklintempleton.com or call (800) 342-5236.
See page 22 for Performance Summary footnotes.
franklintempleton.com
Annual Report
19
FRANKLIN NATURAL RESOURCES FUND
PERFORMANCE SUMMARY
Total Return Index Comparison for a Hypothetical $10,000 Investment2
Total return represents the change in value of an investment over the periods shown. It includes any applicable maximum sales charge, Fund expenses, account fees and reinvested distributions. The unmanaged indexes include reinvestment of any income or distributions. They differ from the Fund in composition and do not pay management fees or expenses. One cannot invest directly in an index.
See page 22 for Performance Summary footnotes.
20 Annual Report
franklintempleton.com
FRANKLIN NATURAL RESOURCES FUND
PERFORMANCE SUMMARY
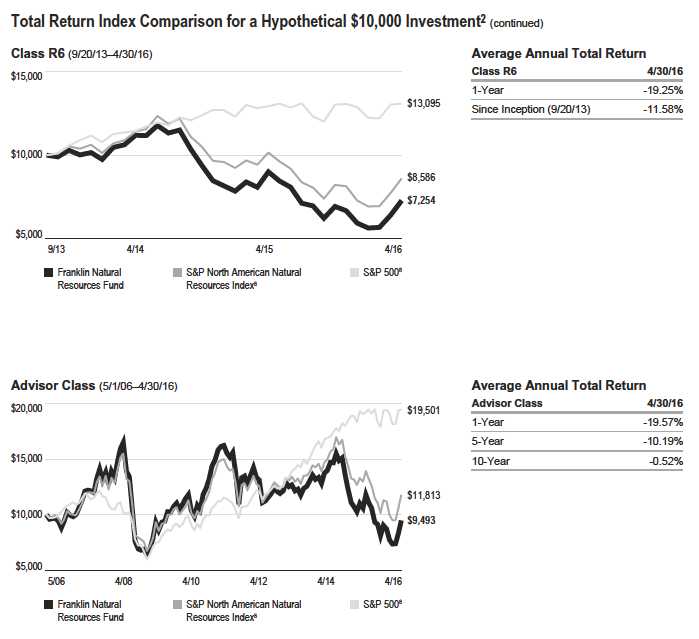
See page 22 for Performance Summary footnotes.
franklintempleton.com
Annual Report
21
FRANKLIN NATURAL RESOURCES FUND
PERFORMANCE SUMMARY
All investments involve risks, including possible loss of principal. Investing in a fund concentrating in the natural resources sector involves special risks, including increased susceptibility to adverse economic and regulatory developments affecting the sector. Smaller companies can be particularly sensitive to changes in economic conditions and have less certain growth prospects than larger, more established companies and can be volatile, especially over the short term. The Fund may also invest in foreign companies, which involve special risks, including currency fluctuations and political uncertainty. The Fund is actively managed but there is no guarantee that the manager’s investment decisions will produce the desired results. The Fund’s prospectus also includes a description of the main investment risks.
| Class C: | These shares have higher annual fees and expenses than Class A shares. |
| Class R6: | Shares are available to certain eligible investors as described in the prospectus. |
| Advisor Class: | Shares are available to certain eligible investors as described in the prospectus. |
1. The distribution amount is the sum of the dividend payments to shareholders for the period shown and includes only estimated tax-basis net investment income.
2. The Fund has a fee waiver associated with any investment in a Franklin Templeton money fund, contractually guaranteed through at least its current fiscal year-end. The
transfer agent has contractually agreed to cap transfer agency fees for Class R6 shares so that transfer agency fees for that class do not exceed 0.01% until at least 8/31/16.
Fund investment results reflect the fee waiver and fee cap, to the extent applicable; without these reductions, the results would have been lower.
3. Cumulative total return represents the change in value of an investment over the periods indicated.
4. Average annual total return represents the average annual change in value of an investment over the periods indicated. Return for less than one year, if any, has not
been annualized.
5. These figures represent the value of a hypothetical $10,000 investment in the Fund over the periods indicated.
6. In accordance with SEC rules, we provide standardized average annual total return information through the latest calendar quarter.
7. Figures are as stated in the Fund’s current prospectus and may differ from the expense ratios disclosed in the Financial Highlights in this report. In periods of market vola-
tility, assets may decline significantly, causing total annual Fund operating expenses to become higher than the figures shown.
8. Source: Morningstar. The S&P 500 Index is a market capitalization-weighted index of 500 stocks designed to measure total U.S. equity market performance. The S&P North
American Natural Resources Index is a modified capitalization-weighted index that includes companies involved in extractive industries (mining), energy and forestry services,
producers of pulp and paper, and owners and operators of timber tracts or plantations.
See www.franklintempletondatasources.com for additional data provider information.
22 Annual Report
franklintempleton.com
FRANKLIN NATURAL RESOURCES FUND
Your Fund’s Expenses
As a Fund shareholder, you can incur two types of costs:
- Transaction costs, including sales charges (loads) on Fund purchases; and
- Ongoing Fund costs, including management fees, distribution and service (12b-1) fees, and other Fund expenses. All mutual funds have ongoing costs, sometimes referred to as operating expenses.
The following table shows ongoing costs of investing in the Fund and can help you understand these costs and compare them with those of other mutual funds. The table assumes a $1,000 investment held for the six months indicated.
Actual Fund Expenses
The first line (Actual) for each share class listed in the table provides actual account values and expenses. The “Ending Account Value” is derived from the Fund’s actual return, which includes the effect of Fund expenses.
You can estimate the expenses you paid during the period by following these steps. Of course, your account value and expenses will differ from those in this illustration:
1. Divide your account value by $1,000.
If an account had an $8,600 value, then $8,600 ÷ $1,000 = 8.6.
2. Multiply the result by the number under the heading “Expenses Paid During Period.”
If Expenses Paid During Period were $7.50, then 8.6 × $7.50 = $64.50.
In this illustration, the estimated expenses paid this period are $64.50.
Hypothetical Example for Comparison with Other Funds
Information in the second line (Hypothetical) for each class in the table can help you compare ongoing costs of investing in the Fund with those of other mutual funds. This information may not be used to estimate the actual ending account balance or expenses you paid during the period. The hypothetical “Ending Account Value” is based on the actual expense ratio for each class and an assumed 5% annual rate of return before expenses, which does not represent the Fund’s actual return. The figure under the heading “Expenses Paid During Period” shows the hypothetical expenses your account would have incurred under this scenario. You can compare this figure with the 5% hypothetical examples that appear in shareholder reports of other funds.
Please note that expenses shown in the table are meant to highlight ongoing costs and do not reflect any transaction costs, such as sales charges. Therefore, the second line for each class is useful in comparing ongoing costs only, and will not help you compare total costs of owning different funds. In addition, if transaction costs were included, your total costs would have been higher. Please refer to the Fund prospectus for additional information on operating expenses.
franklintempleton.com
Annual Report
23
FRANKLIN NATURAL RESOURCES FUND
YOUR FUND’S EXPENSES
| Beginning Account | Ending Account | Expenses Paid During | ||||
| Share Class | Value 11/1/15 | Value 4/30/16 | Period* 11/1/15–4/30/16 | |||
| A | ||||||
| Actual | $ | 1,000 | $ | 1,047.90 | $ | 6.01 |
| Hypothetical (5% return before expenses) | $ | 1,000 | $ | 1,019.00 | $ | 5.92 |
| C | ||||||
| Actual | $ | 1,000 | $ | 1,044.20 | $ | 9.81 |
| Hypothetical (5% return before expenses) | $ | 1,000 | $ | 1,015.27 | $ | 9.67 |
| R6 | ||||||
| Actual | $ | 1,000 | $ | 1,051.40 | $ | 3.21 |
| Hypothetical (5% return before expenses) | $ | 1,000 | $ | 1,021.73 | $ | 3.17 |
| Advisor | ||||||
| Actual | $ | 1,000 | $ | 1,049.20 | $ | 4.74 |
| Hypothetical (5% return before expenses) | $ | 1,000 | $ | 1,020.24 | $ | 4.67 |
*Expenses are calculated using the most recent six-month expense ratio, net of expense waivers, annualized for each class (A: 1.18%;
C: 1.93%; R6: 0.63% and Advisor: 0.93%), multiplied by the average account value over the period, multiplied by 182/366 to reflect the one-half
year period.
24 Annual Report
franklintempleton.com
FRANKLIN STRATEGIC SERIES
| Financial Highlights | |||||||||||||||
| Franklin Biotechnology Discovery Fund | |||||||||||||||
| Year Ended April 30, | |||||||||||||||
| 2016 | 2015 | 2014 | 2013 | 2012 | |||||||||||
| Class A | |||||||||||||||
| Per share operating performance | |||||||||||||||
| (for a share outstanding throughout the year) | |||||||||||||||
| Net asset value, beginning of year | $ | 182.30 | $ | 129.27 | $ | 105.95 | $ | 76.22 | $ | 77.78 | |||||
| Income from investment operationsa: | |||||||||||||||
| Net investment income (loss)b | (0.94 | ) | (1.09 | ) | (1.07 | ) | (0.76 | ) | (0.75 | ) | |||||
| Net realized and unrealized gains (losses) | (39.39 | ) | 60.79 | 33.18 | 30.56 | 9.02 | |||||||||
| Total from investment operations | (40.33 | ) | 59.70 | 32.11 | 29.80 | 8.27 | |||||||||
| Less distributions from: | |||||||||||||||
| Net investment income | — | — | — | (0.07 | ) | (0.52 | ) | ||||||||
| Net realized gains | (13.78 | ) | (6.67 | ) | (8.79 | ) | — | (9.31 | ) | ||||||
| Total distributions | (13.78 | ) | (6.67 | ) | (8.79 | ) | (0.07 | ) | (9.83 | ) | |||||
| Net asset value, end of year | $ | 128.19 | $ | 182.30 | $ | 129.27 | $ | 105.95 | $ | 76.22 | |||||
| Total returnc | (23.55 | )% | 46.81 | % | 30.60 | % | 39.12 | % | 13.18 | % | |||||
| Ratios to average net assets | |||||||||||||||
| Expenses before waiver and payments by affiliates | 0.99 | % | 1.00 | % | 1.10 | % | 1.20 | % | 1.26 | % | |||||
| Expenses net of waiver and payments by affiliates | 0.98 | %d | 1.00 | %d,e | 1.10 | %d,e | 1.20 | % | 1.26 | % | |||||
| Net investment income (loss) | (0.56 | )% | (0.67 | )% | (0.82 | )% | (0.88 | )% | (1.03 | )% | |||||
| Supplemental data | |||||||||||||||
| Net assets, end of year (000’s) | $ | 1,074,903 | $ | 1,601,906 | $ | 1,141,890 | $ | 653,718 | $ | 434,678 | |||||
| Portfolio turnover rate | 22.13 | % | 41.43 | % | 48.70 | % | 33.64 | % | 46.54 | % | |||||
aThe amount shown for a share outstanding throughout the period may not correlate with the Statement of Operations for the period due to the timing of sales and repurchases
of the Fund’s shares in relation to income earned and/or fluctuating fair value of the investments of the Fund.
bBased on average daily shares outstanding.
cTotal return does not reflect sales commissions or contingent deferred sales charges, if applicable.
dBenefit of expense reduction rounds to less than 0.01%.
eBenefit of waiver and payments by affiliates rounds to less than 0.01%.
franklintempleton.com
The accompanying notes are an integral part of these financial statements. | Annual Report 25
FRANKLIN STRATEGIC SERIES
FINANCIAL H IGHLIGHTS
| Franklin Biotechnology Discovery Fund (continued) | |||||||||
| Year Ended April 30, | |||||||||
| 2016 | 2015 | 2014 | a | ||||||
| Class C | |||||||||
| Per share operating performance | |||||||||
| (for a share outstanding throughout the year) | |||||||||
| Net asset value, beginning of year | $ | 180.67 | $ | 129.11 | $ | 159.15 | |||
| Income from investment operationsb: | |||||||||
| Net investment income (loss)c | (2.11 | ) | (2.38 | ) | (0.34 | ) | |||
| Net realized and unrealized gains (losses) | (38.79 | ) | 60.61 | (29.70 | ) | ||||
| Total from investment operations | (40.90 | ) | 58.23 | (30.04 | ) | ||||
| Less distributions from net realized gains | (13.78 | ) | (6.67 | ) | — | ||||
| Net asset value, end of year | $ | 125.99 | $ | 180.67 | $ | 129.11 | |||
| Total returnd | (24.09 | )% | 45.76 | % | (18.88 | )% | |||
| Ratios to average net assetse | |||||||||
| Expenses before waiver and payments by affiliates | 1.71 | % | 1.75 | % | 1.82 | % | |||
| Expenses net of waiver and payments by affiliatesf | 1.70 | % | 1.75 | %g | 1.82 | %g | |||
| Net investment income (loss) | (1.28 | )% | (1.42 | )% | (1.52 | )% | |||
| Supplemental data | |||||||||
| Net assets, end of year (000’s) | $ | 17,562 | $ | 23,051 | $ | 5,486 | |||
| Portfolio turnover rate | 22.13 | % | 41.43 | % | 48.70 | % | |||
aFor the period March 4, 2014 (effective date) to April 30, 2014.
bThe amount shown for a share outstanding throughout the period may not correlate with the Statement of Operations for the period due to the timing of sales and repurchases
of the Fund’s shares in relation to income earned and/or fluctuating fair value of the investments of the Fund.
cBased on average daily shares outstanding.
dTotal return does not reflect sales commissions or contingent deferred sales charges, if applicable, and is not annualized for periods less than one year.
eRatios are annualized for periods less than one year.
fBenefit of expense reduction rounds to less than 0.01%.
gBenefit of waiver and payments by affiliates rounds to less than 0.01%.
26 Annual Report | The accompanying notes are an integral part of these financial statements.
franklintempleton.com
FRANKLIN STRATEGIC SERIES
FINANCIAL H IGHLIGHTS
| Franklin Biotechnology Discovery Fund (continued) | |||||||||
| Year Ended April 30, | |||||||||
| 2016 | 2015 | 2014 | a | ||||||
| Class R6 | |||||||||
| Per share operating performance | |||||||||
| (for a share outstanding throughout the year) | |||||||||
| Net asset value, beginning of year | $ | 185.75 | $ | 131.09 | $ | 104.56 | |||
| Income from investment operationsb: | |||||||||
| Net investment income (loss)c | (0.32 | ) | (0.45 | ) | (0.49 | ) | |||
| Net realized and unrealized gains (losses) | (40.28 | ) | 61.78 | 35.81 | |||||
| Total from investment operations | (40.60 | ) | 61.33 | 35.32 | |||||
| Less distributions from net realized gains | (13.78 | ) | (6.67 | ) | (8.79 | ) | |||
| Net asset value, end of year | $ | 131.37 | $ | 185.75 | $ | 131.09 | |||
| Total returnd | (23.24 | )% | 47.40 | % | 34.10 | % | |||
| Ratios to average net assetse | |||||||||
| Expenses before waiver and payments by affiliates | 0.60 | % | 0.60 | % | 0.63 | % | |||
| Expenses net of waiver and payments by affiliatesf | 0.59 | % | 0.60 | %g | 0.63 | %g | |||
| Net investment income (loss) | (0.17 | )% | (0.27 | )% | (0.35 | )% | |||
| Supplemental data | |||||||||
| Net assets, end of year (000’s) | $ | 5,568 | $ | 76,436 | $ | 50,846 | |||
| Portfolio turnover rate | 22.13 | % | 41.43 | % | 48.70 | % | |||
aFor the period May 1, 2013 (effective date) to April 30, 2014.
bThe amount shown for a share outstanding throughout the period may not correlate with the Statement of Operations for the period due to the timing of sales and repurchases
of the Fund’s shares in relation to income earned and/or fluctuating fair value of the investments of the Fund.
cBased on average daily shares outstanding.
dTotal return is not annualized for periods less than one year.
eRatios are annualized for periods less than one year.
fBenefit of expense reduction rounds to less than 0.01%.
gBenefit of waiver and payments by affiliates rounds to less than 0.01%.
franklintempleton.com
The accompanying notes are an integral part of these financial statements. | Annual Report 27
FRANKLIN STRATEGIC SERIES
FINANCIAL H IGHLIGHTS
| Franklin Biotechnology Discovery Fund (continued) | |||||||||||||||
| Year Ended April 30, | |||||||||||||||
| 2016 | 2015 | 2014 | 2013 | 2012 | |||||||||||
| Advisor Class | |||||||||||||||
| Per share operating performance | |||||||||||||||
| (for a share outstanding throughout the year) | |||||||||||||||
| Net asset value, beginning of year | $ | 185.12 | $ | 130.86 | $ | 106.86 | $ | 76.65 | $ | 78.15 | |||||
| Income from investment operationsa: | |||||||||||||||
| Net investment income (loss)b | (0.55 | ) | (0.70 | ) | (0.69 | ) | (0.52 | ) | (0.53 | ) | |||||
| Net realized and unrealized gains (losses) | (40.12 | ) | 61.63 | 33.48 | 30.80 | 9.05 | |||||||||
| Total from investment operations | (40.67 | ) | 60.93 | 32.79 | 30.28 | 8.52 | |||||||||
| Less distributions from: | |||||||||||||||
| Net investment income | — | — | — | (0.07 | ) | (0.71 | ) | ||||||||
| Net realized gains | (13.78 | ) | (6.67 | ) | (8.79 | ) | — | (9.31 | ) | ||||||
| Total distributions | (13.78 | ) | (6.67 | ) | (8.79 | ) | (0.07 | ) | (10.02 | ) | |||||
| Net asset value, end of year | $ | 130.67 | $ | 185.12 | $ | 130.86 | $ | 106.86 | $ | 76.65 | |||||
| Total return | (23.36 | )% | 47.17 | % | 31.02 | % | 39.51 | % | 13.51 | % | |||||
| Ratios to average net assets | |||||||||||||||
| Expenses before waiver and payments by affiliates | 0.75 | % | 0.75 | % | 0.80 | % | 0.91 | % | 0.97 | % | |||||
| Expenses net of waiver and payments by affiliates | 0.74 | %c | 0.75 | %c,d | 0.80 | %c,d | 0.91 | % | 0.97 | % | |||||
| Net investment income (loss) | (0.32 | )% | (0.42 | )% | (0.52 | )% | (0.59 | )% | (0.74 | )% | |||||
| Supplemental data | |||||||||||||||
| Net assets, end of year (000’s) | $ | 93,263 | $ | 167,035 | $ | 91,012 | $ | 25,744 | $ | 9,330 | |||||
| Portfolio turnover rate | 22.13 | % | 41.43 | % | 48.70 | % | 33.64 | % | 46.54 | % | |||||
aThe amount shown for a share outstanding throughout the period may not correlate with the Statement of Operations for the period due to the timing of sales and repurchases
of the Fund’s shares in relation to income earned and/or fluctuating fair value of the investments of the Fund.
bBased on average daily shares outstanding.
cBenefit of expense reduction rounds to less than 0.01%.
dBenefit of waiver and payments by affiliates rounds to less than 0.01%.
28 Annual Report | The accompanying notes are an integral part of these financial statements.
franklintempleton.com
FRANKLIN STRATEGIC SERIES
| Statement of Investments, April 30, 2016 | ||||
| Franklin Biotechnology Discovery Fund | ||||
| Country | Shares/Warrants | Value | ||
| Common Stocks and Other Equity Interests 98.5% | ||||
| Biotechnology 82.4% | ||||
| a Acadia Pharmaceuticals Inc | United States | 617,000 | $ | 19,929,100 |
| a Acceleron Pharma Inc | United States | 186,700 | 5,591,665 | |
| a,b ADMA Biologics Inc | United States | 135,600 | 932,928 | |
| a Aduro Biotech Inc | United States | 227,573 | 2,947,070 | |
| a Alder Biopharmaceuticals Inc | United States | 94,400 | 2,506,320 | |
| a Alexion Pharmaceuticals Inc | United States | 213,500 | 29,736,280 | |
| a Alnylam Pharmaceuticals Inc | United States | 224,900 | 15,077,296 | |
| Amgen Inc | United States | 471,300 | 74,606,790 | |
| a Amicus Therapeutics Inc | United States | 736,100 | 5,498,667 | |
| a Anacor Pharmaceuticals Inc | United States | 391,600 | 24,568,984 | |
| a,b Anthera Pharmaceuticals Inc | United States | 1,207,262 | 4,466,869 | |
| a,b,c Aptose Biosciences Inc., 144A | Canada | 488,883 | 1,204,616 | |
| a,b Aquinox Pharmaceuticals Inc | Canada | 470,400 | 3,829,056 | |
| a,b,d ARCA biopharma Inc | United States | 478,077 | 2,012,704 | |
| a,d,e ARCA biopharma Inc., wts., 6/16/22 | United States | 1,338,619 | 137,980 | |
| a,b AveXis Inc | United States | 94,300 | 2,357,500 | |
| a,b Axovant Sciences Ltd | United States | 450,882 | 5,861,466 | |
| a Bellicum Pharmaceuticals Inc | United States | 257,000 | 2,605,980 | |
| a Biogen Inc | United States | 356,761 | 98,105,707 | |
| a BioMarin Pharmaceutical Inc | United States | 410,256 | 34,740,478 | |
| a Bluebird Bio Inc | United States | 189,528 | 8,405,567 | |
| a Cara Therapeutics Inc | United States | 202,400 | 1,234,640 | |
| a Celgene Corp | United States | 1,152,700 | 119,200,707 | |
| a Celldex Therapeutics Inc | United States | 1,265,929 | 5,063,716 | |
| a,b Cellectis SA, ADR | France | 97,200 | 2,644,812 | |
| a ChemoCentryx Inc | United States | 817,508 | 1,962,019 | |
| a Concert Pharmaceuticals Inc | United States | 263,800 | 3,677,372 | |
| a,b CytomX Therapeutics Inc | United States | 118,700 | 1,533,604 | |
| a,b CytRx Corp | United States | 589,000 | 1,920,140 | |
| a Dynavax Technologies Corp | United States | 368,070 | 6,040,029 | |
| a,b Edge Therapeutics Inc | United States | 702,846 | 5,784,423 | |
| a Epizyme Inc | United States | 450,800 | 4,697,336 | |
| a,b Fate Therapeutics Inc | United States | 195,700 | 371,830 | |
| a FibroGen Inc | United States | 132,600 | 2,386,800 | |
| a,b Genocea Biosciences Inc | United States | 1,089,800 | 4,795,120 | |
| Gilead Sciences Inc | United States | 1,147,900 | 101,256,259 | |
| a GlycoMimetics Inc | United States | 379,800 | 2,392,740 | |
| a Halozyme Therapeutics Inc | United States | 426,600 | 4,500,630 | |
| a,b Heat Biologics Inc | United States | 517,900 | 353,778 | |
| a,b Heron Therapeutics Inc | United States | 1,477,481 | 31,677,193 | |
| a,c Heron Therapeutics Inc., wts., 144A, 7/01/16 | United States | 278,594 | 4,970,121 | |
| a Immune Design Corp | United States | 303,100 | 4,134,284 | |
| a ImmunoGen Inc | United States | 371,300 | 2,543,405 | |
| a Incyte Corp | United States | 495,500 | 35,809,785 | |
| a,b Inotek Pharmaceuticals Corp | United States | 571,500 | 5,600,700 | |
| a,f Intarcia Therapeutics Inc., DD | United States | 80,195 | 2,987,264 | |
| a Ionis Pharmaceuticals Inc | United States | 235,500 | 9,648,435 | |
| a Karyopharm Therapeutics Inc | United States | 652,554 | 6,068,752 | |
| a Kite Pharma Inc | United States | 115,344 | 5,338,120 | |
| a,b Kura Oncology Inc | United States | 220,900 | 737,806 | |
| a La Jolla Pharmaceutical Co | United States | 364,300 | 6,743,193 | |
| a Lion Biotechnologies Inc | United States | 830,700 | 4,710,069 | |
franklintempleton.com
Annual Report
29
FRANKLIN STRATEGIC SERIES
STATEMENT OF INVESTMENTS
| Franklin Biotechnology Discovery Fund (continued) | ||||
| Country | Shares/Warrants | Value | ||
| Common Stocks and Other Equity Interests (continued) | ||||
| Biotechnology (continued) | ||||
| a MacroGenics Inc | United States | 223,000 | $ | 4,584,880 |
| a,b Mast Therapeutics Inc | United States | 610,227 | 180,261 | |
| a Mast Therapeutics Inc., wts., 6/14/18 | United States | 3,624,600 | 181,230 | |
| a Medivation Inc | United States | 736,008 | 42,541,262 | |
| a Mirati Therapeutics Inc | United States | 236,350 | 4,897,172 | |
| a,b Mirna Therapeutics Inc | United States | 566,838 | 2,647,133 | |
| a,b Natera Inc | United States | 474,962 | 4,664,127 | |
| a Neurocrine Biosciences Inc | United States | 435,600 | 19,854,648 | |
| a,b NewLink Genetics Corp | United States | 205,300 | 3,327,913 | |
| a Nivalis Therapeutics Inc | United States | 182,500 | 771,975 | |
| a,e Northwest Biotherapeutics Inc., wts., 2/20/19 | United States | 223,880 | 70,235 | |
| a Novavax Inc | United States | 1,969,200 | 10,318,608 | |
| a,b OncoMed Pharmaceuticals Inc | United States | 110,900 | 1,375,160 | |
| a Oncothyreon Inc | United States | 2,746,700 | 3,570,710 | |
| a Ophthotech Corp | United States | 125,032 | 5,843,996 | |
| a,b OvaScience Inc | United States | 250,154 | 2,096,291 | |
| a Pfenex Inc | United States | 532,384 | 4,344,253 | |
| a Portola Pharmaceuticals Inc | United States | 354,200 | 8,415,792 | |
| a,b Pronai Therapeutics Inc | Canada | 100,000 | 560,000 | |
| a,b ProQR Therapeutics NV | Netherlands | 123,300 | 681,849 | |
| a,b Proteostasis Therapeutics Inc | United States | 235,700 | 2,130,728 | |
| a PTC Therapeutics Inc | United States | 160,000 | 1,187,200 | |
| a Radius Health Inc | United States | 174,700 | 6,219,320 | |
| a Regeneron Pharmaceuticals Inc | United States | 113,209 | 42,646,962 | |
| a REGENXBIO Inc | United States | 25,200 | 262,584 | |
| a Retrophin Inc | United States | 417,094 | 5,747,555 | |
| a Sage Therapeutics Inc | United States | 339,370 | 12,790,855 | |
| a,b Sorrento Therapeutics Inc | United States | 132,951 | 912,044 | |
| a Stemline Therapeutics Inc | United States | 756,097 | 4,158,534 | |
| a Tesaro Inc | United States | 191,500 | 7,935,760 | |
| a Threshold Pharmaceuticals Inc., wts., 2/12/20 | United States | 439,500 | — | |
| a,b Tobira Therapeutics Inc | United States | 254,200 | 2,000,554 | |
| a,b Tokai Pharmaceuticals Inc | United States | 183,000 | 1,341,390 | |
| a Tonix Pharmaceuticals Holding Corp | United States | 147,281 | 371,148 | |
| a,b Trillium Therapeutics Inc | Canada | 158,100 | 1,772,301 | |
| a Vertex Pharmaceuticals Inc | United States | 344,300 | 29,038,262 | |
| a vTv Therapeutics Inc., A | United States | 370,900 | 2,336,670 | |
| a Xencor Inc | United States | 299,901 | 3,673,787 | |
| 981,361,254 | ||||
| Health Care Equipment & Supplies 0.3% | ||||
| a Derma Sciences Inc | United States | 1,019,400 | 3,547,512 | |
| Life Sciences Tools & Services 2.3% | ||||
| a Illumina Inc | United States | 202,200 | 27,294,978 | |
| Pharmaceuticals 13.5% | ||||
| a,f Acerta Pharma BV | Netherlands | 107,297,280 | 5,595,124 | |
| a,b Aclaris Therapeutics Inc | United States | 330,562 | 6,108,786 | |
| a,b Agile Therapeutics Inc | United States | 526,800 | 3,050,172 | |
| a,b Alcobra Ltd | Israel | 1,367,755 | 5,484,698 | |
| a Aratana Therapeutics Inc | United States | 904,000 | 5,433,040 | |
| a,d BioPharmX Corp | United States | 216,000 | 170,640 | |
| a,c,d BiopharmX Corp., 144A | United States | 1,600,000 | 1,264,000 | |
30 Annual Report
franklintempleton.com
FRANKLIN STRATEGIC SERIES
STATEMENT O F INVESTMENTS
| Franklin Biotechnology Discovery Fund (continued) | |||||
| Country | Shares/Warrants | Value | |||
| Common Stocks and Other Equity Interests (continued) | |||||
| Pharmaceuticals (continued) | |||||
| a,d,e Biopharmx Corp., wts., 3/29/21 | United States | 108,000 | $ | 65,437 | |
| a,b Cynapsus Therapeutics Inc | Canada | 565,300 | 6,806,212 | ||
| a Dermira Inc | United States | 219,800 | 5,558,742 | ||
| a,b Egalet Corp | United States | 863,400 | 5,888,388 | ||
| a,b Flex Pharma Inc | United States | 138,600 | 1,519,056 | ||
| a Foamix Pharmaceuticals Ltd | Israel | 413,800 | 2,611,078 | ||
| a,b GW Pharmaceuticals PLC, ADR | United Kingdom | 43,967 | 3,562,206 | ||
| a Intra-Cellular Therapies Inc | United States | 95,300 | 3,270,696 | ||
| a Jazz Pharmaceuticals PLC | United States | 111,300 | 16,772,910 | ||
| a,b Marinus Pharmaceuticals Inc | United States | 831,820 | 4,566,692 | ||
| a The Medicines Co | United States | 405,700 | 14,438,863 | ||
| a,b Nabriva Therapeutics AG, ADR | Austria | 140,100 | 1,190,850 | ||
| a,c NantKwest Inc., 144A | United States | 409,274 | 3,392,881 | ||
| a Neos Therapeutics Inc | United States | 256,400 | 2,325,548 | ||
| a,b Relypsa Inc | United States | 301,000 | 5,448,100 | ||
| a Revance Therapeutics Inc | United States | 296,100 | 5,442,318 | ||
| a Sagent Pharmaceuticals Inc | United States | 620,357 | 7,220,955 | ||
| a SciClone Pharmaceuticals Inc | United States | 1,660,519 | 21,918,851 | ||
| a TherapeuticsMD Inc | United States | 2,345,640 | 19,351,530 | ||
| a Zogenix Inc | United States | 246,315 | 2,524,729 | ||
| 160,982,502 | |||||
| Total Common Stocks and Other Equity Interests | |||||
| (Cost $812,354,291) | 1,173,186,246 | ||||
| Preferred Stocks (Cost $2,799,999) 0.2% | |||||
| Pharmaceuticals 0.2% | |||||
| a,f G1 Therapeutics Inc., pfd | United States | 942,380 | 2,799,999 | ||
| Total Investments before Short Term Investments | |||||
| (Cost $815,154,290) | 1,175,986,245 | ||||
| Short Term Investments 7.0% | |||||
| Money Market Funds (Cost $6,953,240) 0.6% | |||||
| a,g Institutional Fiduciary Trust Money Market Portfolio | United States | 6,953,240 | 6,953,240 | ||
| h Investments from Cash Collateral Received for | |||||
| Loaned Securities (Cost $75,805,741) 6.4% | |||||
| Money Market Funds 6.4% | |||||
| a,g Institutional Fiduciary Trust Money Market Portfolio | United States | 75,805,741 | 75,805,741 | ||
| Total Investments (Cost $897,913,271) 105.7% | 1,258,745,226 | ||||
| Other Assets, less Liabilities (5.7)% | (67,448,988 | ) | |||
| Net Assets 100.0% | $ | 1,191,296,238 | |||
See Abbreviations on page 54.
aNon-income producing.
bA portion or all of the security is on loan at April 30, 2016. See Note 1(c).
cSecurity was purchased pursuant to Rule 144A under the Securities Act of 1933 and may be sold in transactions exempt from registration only to qualified institutional buyers
or in a public offering registered under the Securities Act of 1933. These securities have been deemed liquid under guidelines approved by the Trust’s Board of Trustees. At
April 30, 2016, the aggregate value of these securities was $10,831,618, representing 0.91% of net assets.
dSee Note 8 regarding holdings of 5% voting securities.
eSecurity has been deemed illiquid because it may not be able to be sold within seven days. At April 30, 2016, the aggregate value of these securities was $273,652,
representing 0.02% of net assets.
fSee Note 7 regarding restricted securities.
gSee Note 3(f) regarding investments in affiliated management investment companies.
hSee Note 1(c) regarding securities on loan.
franklintempleton.com
Annual Report
31
FRANKLIN STRATEGIC SERIES
| Financial Highlights | |||||||||||||||
| Franklin Natural Resources Fund | |||||||||||||||
| Year Ended April 30, | |||||||||||||||
| 2016 | 2015 | 2014 | 2013 | 2012 | |||||||||||
| Class A | |||||||||||||||
| Per share operating performance | |||||||||||||||
| (for a share outstanding throughout the year) | |||||||||||||||
| Net asset value, beginning of year | $ | 31.46 | $ | 39.79 | $ | 33.03 | $ | 35.81 | $ | 44.75 | |||||
| Income from investment operationsa: | |||||||||||||||
| Net investment incomeb | 0.29 | 0.23 | 0.19 | 0.08 | 0.04 | ||||||||||
| Net realized and unrealized gains (losses) | (6.55 | ) | (8.27 | ) | 6.65 | (2.86 | ) | (8.72 | ) | ||||||
| Total from investment operations | (6.26 | ) | (8.04 | ) | 6.84 | (2.78 | ) | (8.68 | ) | ||||||
| Less distributions from net investment income | (0.18 | ) | (0.29 | ) | (0.08 | ) | — | (0.26 | ) | ||||||
| Net asset value, end of year | $ | 25.02 | $ | 31.46 | $ | 39.79 | $ | 33.03 | $ | 35.81 | |||||
| Total returnc | (19.80 | )% | (20.07 | )% | 20.74 | % | (7.76 | )% | (19.36 | )% | |||||
| Ratios to average net assets | |||||||||||||||
| Expenses before waiver and payments by affiliates | 1.14 | % | 1.08 | % | 1.07 | % | 1.08 | % | 1.03 | % | |||||
| Expenses net of waiver and payments by affiliates | 1.13 | % | 1.08 | %d,e | 1.07 | %d,e | 1.08 | % | 1.03 | % | |||||
| Net investment income | 1.22 | % | 0.67 | % | 0.53 | % | 0.26 | % | 0.11 | % | |||||
| Supplemental data | |||||||||||||||
| Net assets, end of year (000’s) | $ | 461,596 | $ | 572,518 | $ | 624,250 | $ | 628,722 | $ | 827,693 | |||||
| Portfolio turnover rate | 35.77 | % | 30.05 | % | 21.03 | % | 20.40 | % | 26.75 | % | |||||
aThe amount shown for a share outstanding throughout the period may not correlate with the Statement of Operations for the period due to the timing of sales and repurchases
of the Fund’s shares in relation to income earned and/or fluctuating fair value of the investments of the Fund.
bBased on average daily shares outstanding.
cTotal return does not reflect sales commissions or contingent deferred sales charges, if applicable.
dBenefit of expense reduction rounds to less than 0.01%.
eBenefit of waiver and payments by affiliates rounds to less than 0.01%.
32 Annual Report | The accompanying notes are an integral part of these financial statements.
franklintempleton.com
FRANKLIN STRATEGIC SERIES
FINANCIAL H IGHLIGHTS
| Franklin Natural Resources Fund (continued) | |||||||||||||||
| Year Ended April 30, | |||||||||||||||
| 2016 | 2015 | 2014 | 2013 | 2012 | |||||||||||
| Class C | |||||||||||||||
| Per share operating performance | |||||||||||||||
| (for a share outstanding throughout the year) | |||||||||||||||
| Net asset value, beginning of year | $ | 30.46 | $ | 38.39 | $ | 32.02 | $ | 34.96 | $ | 43.87 | |||||
| Income from investment operationsa: | |||||||||||||||
| Net investment income (loss)b | 0.11 | (0.01 | ) | (0.06 | ) | (0.14 | ) | (0.22 | ) | ||||||
| Net realized and unrealized gains (losses) | (6.31 | ) | (7.91 | ) | 6.43 | (2.80 | ) | (8.53 | ) | ||||||
| Total from investment operations | (6.20 | ) | (7.92 | ) | 6.37 | (2.94 | ) | (8.75 | ) | ||||||
| Less distributions from net investment income | (0.01 | ) | (0.01 | ) | — | — | (0.16 | ) | |||||||
| Net asset value, end of year | $ | 24.25 | $ | 30.46 | $ | 38.39 | $ | 32.02 | $ | 34.96 | |||||
| Total returnc | (20.37 | )% | (20.63 | )% | 19.89 | % | (8.41 | )% | (19.91 | )% | |||||
| Ratios to average net assets | |||||||||||||||
| Expenses before waiver and payments by affiliates | 1.87 | % | 1.78 | % | 1.76 | % | 1.77 | % | 1.73 | % | |||||
| Expenses net of waiver and payments by affiliates | 1.86 | % | 1.78 | %d,e | 1.76 | %d,e | 1.77 | % | 1.73 | % | |||||
| Net investment income (loss) | 0.49 | % | (0.03 | )% | (0.16 | )% | (0.43 | )% | (0.59 | )% | |||||
| Supplemental data | |||||||||||||||
| Net assets, end of year (000’s) | $ | 107,724 | $ | 123,735 | $ | 126,651 | $ | 130,424 | $ | 176,036 | |||||
| Portfolio turnover rate | 35.77 | % | 30.05 | % | 21.03 | % | 20.40 | % | 26.75 | % | |||||
aThe amount shown for a share outstanding throughout the period may not correlate with the Statement of Operations for the period due to the timing of sales and repurchases
of the Fund’s shares in relation to income earned and/or fluctuating fair value of the investments of the Fund.
bBased on average daily shares outstanding.
cTotal return does not reflect sales commissions or contingent deferred sales charges, if applicable.
dBenefit of expense reduction rounds to less than 0.01%.
eBenefit of waiver and payments by affiliates rounds to less than 0.01%.
franklintempleton.com
The accompanying notes are an integral part of these financial statements. | Annual Report 33
FRANKLIN STRATEGIC SERIES
FINANCIAL H IGHLIGHTS
| Franklin Natural Resources Fund (continued) | |||||||||
| Year Ended April 30, | |||||||||
| 2016 | 2015 | 2014 | a | ||||||
| Class R6 | |||||||||
| Per share operating performance | |||||||||
| (for a share outstanding throughout the year) | |||||||||
| Net asset value, beginning of year | $ | 33.62 | $ | 42.58 | $ | 38.28 | |||
| Income from investment operationsb: | |||||||||
| Net investment incomec | 0.51 | 0.46 | 0.19 | ||||||
| Net realized and unrealized gains (losses) | (7.06 | ) | (8.92 | ) | 4.31 | ||||
| Total from investment operations | (6.55 | ) | (8.46 | ) | 4.50 | ||||
| Less distributions from net investment income | (0.34 | ) | (0.50 | ) | (0.20 | ) | |||
| Net asset value, end of year | $ | 26.73 | $ | 33.62 | $ | 42.58 | |||
| Total returnd | (19.31 | )% | (19.61 | )% | 11.83 | % | |||
| Ratios to average net assetse | |||||||||
| Expenses before waiver and payments by affiliates | 0.60 | % | 0.55 | % | 0.55 | % | |||
| Expenses net of waiver and payments by affiliates | 0.55 | % | 0.54 | %f | 0.53 | %f | |||
| Net investment income | 1.80 | % | 1.21 | % | 1.07 | % | |||
| Supplemental data | |||||||||
| Net assets, end of year (000’s) | $ | 15 | $ | 439 | $ | 939 | |||
| Portfolio turnover rate | 35.77 | % | 30.05 | % | 21.03 | % | |||
aFor the period September 20, 2013 (effective date) to April 30, 2014.
bThe amount shown for a share outstanding throughout the period may not correlate with the Statement of Operations for the period due to the timing of sales and repurchases
of the Fund’s shares in relation to income earned and/or fluctuating fair value of the investments of the Fund.
cBased on average daily shares outstanding.
dTotal return is not annualized for periods less than one year.
eRatios are annualized for periods less than one year.
fBenefit of expense reduction rounds to less than 0.01%.
34 Annual Report | The accompanying notes are an integral part of these financial statements.
franklintempleton.com
FRANKLIN STRATEGIC SERIES
FINANCIAL H IGHLIGHTS
| Franklin Natural Resources Fund (continued) | |||||||||||||||
| Year Ended April 30, | |||||||||||||||
| 2016 | 2015 | 2014 | 2013 | 2012 | |||||||||||
| Advisor Class | |||||||||||||||
| Per share operating performance | |||||||||||||||
| (for a share outstanding throughout the year) | |||||||||||||||
| Net asset value, beginning of year | $ | 33.63 | $ | 42.52 | $ | 35.31 | $ | 38.17 | $ | 47.58 | |||||
| Income from investment operationsa: | |||||||||||||||
| Net investment incomeb | 0.36 | 0.35 | 0.31 | 0.21 | 0.16 | ||||||||||
| Net realized and unrealized gains (losses) | (7.00 | ) | (8.85 | ) | 7.10 | (3.07 | ) | (9.27 | ) | ||||||
| Total from investment operations | (6.64 | ) | (8.50 | ) | 7.41 | (2.86 | ) | (9.11 | ) | ||||||
| Less distributions from net investment income | (0.28 | ) | (0.39 | ) | (0.20 | ) | — | (0.30 | ) | ||||||
| Net asset value, end of year | $ | 26.71 | $ | 33.63 | $ | 42.52 | $ | 35.31 | $ | 38.17 | |||||
| Total return | (19.60 | )% | (19.81 | )% | 21.07 | % | (7.49 | )% | (19.10 | )% | |||||
| Ratios to average net assets | |||||||||||||||
| Expenses before waiver and payments by affiliates | 0.87 | % | 0.78 | % | 0.77 | % | 0.78 | % | 0.73 | % | |||||
| Expenses net of waiver and payments by affiliates | 0.86 | % | 0.78 | %c,d | 0.77 | %c,d | 0.78 | % | 0.73 | % | |||||
| Net investment income | 1.49 | % | 0.97 | % | 0.83 | % | 0.56 | % | 0.41 | % | |||||
| Supplemental data | |||||||||||||||
| Net assets, end of year (000’s) | $ | 90,185 | $ | 79,307 | $ | 94,651 | $ | 117,087 | $ | 235,810 | |||||
| Portfolio turnover rate | 35.77 | % | 30.05 | % | 21.03 | % | 20.40 | % | 26.75 | % | |||||
aThe amount shown for a share outstanding throughout the period may not correlate with the Statement of Operations for the period due to the timing of sales and repurchases
of the Fund’s shares in relation to income earned and/or fluctuating fair value of the investments of the Fund.
bBased on average daily shares outstanding.
cBenefit of expense reduction rounds to less than 0.01%.
dBenefit of waiver and payments by affiliates rounds to less than 0.01%.
franklintempleton.com
The accompanying notes are an integral part of these financial statements. | Annual Report 35
| F R A N K L I N S T R A T E G I C S E R I E S | ||||
| Statement of Investments, April 30, 2016 | ||||
| Franklin Natural Resources Fund | ||||
| Country | Shares | Value | ||
| Common Stocks 93.6% | ||||
| Coal & Consumable Fuels 0.0% | ||||
| a,b Energy Coal Resources, 144A | United States | 199,375 | $ | — |
| Construction Materials 0.6% | ||||
| Martin Marietta Materials Inc | United States | 21,500 | 3,638,445 | |
| Diversified Metals & Mining 11.7% | ||||
| Antofagasta PLC | Chile | 703,700 | 4,968,997 | |
| BHP Billiton PLC, ADR | Australia | 660,200 | 18,201,714 | |
| First Quantum Minerals Ltd | Zambia | 168,200 | 1,433,801 | |
| Freeport-McMoRan Inc., B | United States | 666,700 | 9,333,800 | |
| Glencore PLC | Switzerland | 2,035,700 | 4,846,063 | |
| HudBay Minerals Inc | Canada | 702,600 | 3,507,257 | |
| a Imperial Metals Corp | Canada | 427,700 | 1,974,708 | |
| a Lundin Mining Corp | Canada | 1,722,700 | 6,772,386 | |
| a Nautilus Minerals Inc | Canada | 3,895,831 | 481,523 | |
| Rio Tinto PLC, ADR | United Kingdom | 255,400 | 8,596,764 | |
| Sandfire Resources NL | Australia | 1,323,967 | 5,969,210 | |
| a South32 Ltd | Australia | 1,596,600 | 2,015,066 | |
| a South32 Ltd., ADR | Australia | 274,940 | 1,707,377 | |
| Southern Copper Corp | Mexico | 73,700 | 2,186,679 | |
| c Teck Resources Ltd., B | Canada | 437,600 | 5,360,600 | |
| 77,355,945 | ||||
| Fertilizers & Agricultural Chemicals 1.0% | ||||
| The Mosaic Co | United States | 232,100 | 6,496,479 | |
| Gold 5.4% | ||||
| Agnico Eagle Mines Ltd | Canada | 73,300 | 3,466,706 | |
| Alamos Gold Inc., A | Canada | 356,000 | 2,569,116 | |
| a B2Gold Corp | Canada | 2,050,800 | 4,562,603 | |
| Barrick Gold Corp | Canada | 297,400 | 5,760,638 | |
| G-Resources Group Ltd | Hong Kong | 61,293,060 | 1,406,520 | |
| Goldcorp Inc | Canada | 402,300 | 8,106,345 | |
| a Newcrest Mining Ltd | Australia | 220,700 | 3,183,132 | |
| OceanaGold Corp | Australia | 1,050,110 | 3,759,814 | |
| Randgold Resources Ltd., ADR | Jersey Islands | 30,700 | 3,085,350 | |
| 35,900,224 | ||||
| Integrated Oil & Gas 15.2% | ||||
| BP PLC, ADR | United Kingdom | 144,100 | 4,838,878 | |
| Chevron Corp | United States | 180,800 | 18,474,144 | |
| Exxon Mobil Corp | United States | 139,400 | 12,322,960 | |
| Occidental Petroleum Corp | United States | 341,500 | 26,175,975 | |
| a Petroleo Brasileiro SA, ADR | Brazil | 302,400 | 2,331,504 | |
| Royal Dutch Shell PLC, A | United Kingdom | 149,247 | 3,881,127 | |
| Royal Dutch Shell PLC, A, ADR | United Kingdom | 368,500 | 19,489,965 | |
| Total SA, B, ADR | France | 257,300 | 13,057,975 | |
| 100,572,528 | ||||
| Oil & Gas Drilling 1.9% | ||||
| Ensco PLC, A | United States | 140,519 | 1,680,607 | |
| Noble Corp. PLC | United Kingdom | 147,500 | 1,656,425 | |
| a Pioneer Energy Services Corp | United States | 1,298,922 | 4,039,648 | |
| Rowan Cos. PLC | United States | 265,900 | 5,001,579 | |
| 12,378,259 | ||||
36 Annual Report
franklintempleton.com
FRANKLIN STRATEGIC SERIES
STATEMENT O F INVESTMENTS
| Franklin Natural Resources Fund (continued) | ||||
| Country | Shares | Value | ||
| Common Stocks (continued) | ||||
| Oil & Gas Equipment & Services 17.5% | ||||
| Baker Hughes Inc | United States | 201,600 | $ | 9,749,376 |
| a C&J Energy Services Ltd | United States | 569,700 | 826,065 | |
| Cimarex Energy Co | United States | 81,300 | 8,851,944 | |
| a Dril-Quip Inc | United States | 82,700 | 5,360,614 | |
| a FMC Technologies Inc | United States | 267,000 | 8,140,830 | |
| Halliburton Co | United States | 298,435 | 12,328,350 | |
| a Hornbeck Offshore Services Inc | United States | 151,800 | 1,782,132 | |
| Hunting PLC | United Kingdom | 253,600 | 1,358,243 | |
| Oceaneering International Inc | United States | 230,700 | 8,455,155 | |
| a Oil States International Inc | United States | 141,900 | 4,915,416 | |
| a PHI Inc., non-voting | United States | 103,400 | 2,318,228 | |
| a RigNet Inc | United States | 204,900 | 3,503,790 | |
| c RPC Inc | United States | 164,600 | 2,488,752 | |
| Schlumberger Ltd | United States | 387,147 | 31,103,390 | |
| Superior Energy Services Inc | United States | 629,800 | 10,618,428 | |
| a Weatherford International PLC | United States | 483,500 | 3,930,855 | |
| 115,731,568 | ||||
| Oil & Gas Exploration & Production 33.9% | ||||
| Anadarko Petroleum Corp | United States | 423,500 | 22,343,860 | |
| Cabot Oil & Gas Corp., A | United States | 678,700 | 15,881,580 | |
| California Resources Corp | United States | 30,453 | 66,997 | |
| a Callon Petroleum Co | United States | 455,400 | 4,786,254 | |
| Canadian Natural Resources Ltd | Canada | 366,200 | 11,003,083 | |
| a Cobalt International Energy Inc | United States | 693,200 | 2,239,036 | |
| a Concho Resources Inc | United States | 145,300 | 16,879,501 | |
| ConocoPhillips | United States | 242,900 | 11,608,191 | |
| Devon Energy Corp | United States | 96,600 | 3,350,088 | |
| a Diamondback Energy Inc | United States | 65,100 | 5,636,358 | |
| EOG Resources Inc | United States | 271,200 | 22,406,544 | |
| EQT Corp | United States | 175,200 | 12,281,520 | |
| a Gran Tierra Energy Inc | Colombia | 1,163,700 | 3,444,552 | |
| a Gulfport Energy Corp | United States | 147,400 | 4,613,620 | |
| Hess Corp | United States | 133,000 | 7,929,460 | |
| Marathon Oil Corp | United States | 795,300 | 11,205,777 | |
| a Matador Resources Co | United States | 282,446 | 6,086,711 | |
| Noble Energy Inc | United States | 643,400 | 23,233,174 | |
| a Ophir Energy PLC | United Kingdom | 1,750,000 | 1,926,972 | |
| Pioneer Natural Resources Co | United States | 136,000 | 22,589,600 | |
| a Rice Energy Inc | United States | 277,300 | 4,800,063 | |
| a Sanchez Energy Corp | United States | 239,100 | 2,149,509 | |
| SM Energy Co | United States | 235,500 | 7,338,180 | |
| 223,800,630 | ||||
| Oil & Gas Refining & Marketing 3.3% | ||||
| HollyFrontier Corp | United States | 139,600 | 4,969,760 | |
| Marathon Petroleum Corp | United States | 110,100 | 4,302,708 | |
| Phillips 66 | United States | 76,700 | 6,297,837 | |
| Valero Energy Corp | United States | 104,700 | 6,163,689 | |
| 21,733,994 | ||||
franklintempleton.com
Annual Report
37
FRANKLIN STRATEGIC SERIES
STATEMENT O F INVESTMENTS
| Franklin Natural Resources Fund (continued) | ||||||
| Country | Shares | Value | ||||
| Common Stocks (continued) | ||||||
| Oil & Gas Storage & Transportation 2.5% | ||||||
| Kinder Morgan Inc | United States | 539,800 | $ | 9,586,848 | ||
| Spectra Energy Corp | United States | 155,400 | 4,859,358 | |||
| Tallgrass Energy GP LP | United States | 91,200 | 1,899,696 | |||
| 16,345,902 | ||||||
| Precious Metals & Minerals 0.6% | ||||||
| Tahoe Resources Inc | United States | 258,200 | 3,648,422 | |||
| Total Common Stocks (Cost $579,662,223) | 617,602,396 | |||||
| Convertible Preferred Stocks 0.6% | ||||||
| Oil & Gas Exploration & Production 0.6% | ||||||
| Sanchez Energy Corp., 4.875%, cvt. pfd., A | United States | 92,900 | 1,941,610 | |||
| Sanchez Energy Corp., 6.50%, cvt. pfd., B | United States | 67,300 | 1,706,055 | |||
| Total Convertible Preferred Stocks (Cost $7,397,173) | 3,647,665 | |||||
| Preferred Stocks (Cost $2,376,164) 0.0% | ||||||
| Coal & Consumable Fuels 0.0% | ||||||
| a,b Energy Coal Resources, 144A, pfd | United States | 29,847 | — | |||
| Principal | ||||||
| Amount | ||||||
| Convertible Bonds (Cost $3,512,636) 0.3% | ||||||
| Oil & Gas Exploration & Production 0.3% | ||||||
| Cobalt International Energy Inc., cvt., senior bond, 3.125%, 5/15/24 | United States | $ | 4,787,000 | 2,070,377 | ||
| Total Investments before Short Term Investments | ||||||
| (Cost $592,948,196) | 623,320,438 | |||||
| Shares | ||||||
| Short Term Investments 6.7% | ||||||
| Money Market Funds (Cost $40,508,430) 6.2% | ||||||
| a,d Institutional Fiduciary Trust Money Market Portfolio | United States | 40,508,430 | 40,508,430 | |||
| e Investments from Cash Collateral Received for Loaned | ||||||
| Securities (Cost $3,401,250) 0.5% | ||||||
| Money Market Funds 0.5% | ||||||
| a,d Institutional Fiduciary Trust Money Market Portfolio | United States | 3,401,250 | 3,401,250 | |||
| Total Investments (Cost $636,857,876) 101.2% | 667,230,118 | |||||
| Other Assets, less Liabilities (1.2)% | (7,710,922 | ) | ||||
| Net Assets 100.0% | $ | 659,519,196 | ||||
See Abbreviations on page 54.
aNon-income producing.
bSee Note 7 regarding restricted securities.
cA portion or all of the security is on loan at April 30, 2016. See Note 1(c).
dSee Note 3(f) regarding investments in affiliated management investment companies.
eSee Note 1(c) regarding securities on loan.
38 Annual Report | The accompanying notes are an integral part of these financial statements.
franklintempleton.com
FRANKLIN STRATEGIC SERIES
| Financial Statements | ||||||
| Statements of Assets and Liabilities | ||||||
| April 30, 2016 | ||||||
| Franklin | ||||||
| Biotechnology | Franklin Natural | |||||
| Discovery Fund | Resources Fund | |||||
| Assets: | ||||||
| Investments in securities: | ||||||
| Cost - Unaffiliated issuers | $ | 812,607,090 | $ | 592,948,196 | ||
| Cost - Non-controlled affiliates (Notes 3f and 8) | 85,306,181 | 43,909,680 | ||||
| Total cost of investments | $ | 897,913,271 | $ | 636,857,876 | ||
| Value - Unaffiliated issuers | $ | 1,172,335,484 | $ | 623,320,438 | ||
| Value - Non-controlled affiliates (Notes 3f and 8) | 86,409,742 | 43,909,680 | ||||
| Total value of investments* | 1,258,745,226 | 667,230,118 | ||||
| Receivables: | ||||||
| Investment securities sold (includes securities loaned in the amount of $1,742,999 and | ||||||
| $—, respectively) | 11,836,442 | 9,213,670 | ||||
| Capital shares sold | 598,927 | 1,797,350 | ||||
| Dividends and Interest | 140,940 | 291,358 | ||||
| Other assets | 737 | 32,433 | ||||
| Total assets | 1,271,322,272 | 678,564,929 | ||||
| Liabilities: | ||||||
| Payables: | ||||||
| Investment securities purchased | 89,986 | 13,550,573 | ||||
| Capital shares redeemed | 2,772,582 | 1,301,475 | ||||
| Management fees | 580,593 | 233,589 | ||||
| Distribution fees | 226,409 | 168,023 | ||||
| Transfer agent fees | 435,344 | 293,501 | ||||
| Payable upon return of securities loaned | 75,805,741 | 3,401,250 | ||||
| Accrued expenses and other liabilities | 115,379 | 97,322 | ||||
| Total liabilities | 80,026,034 | 19,045,733 | ||||
| Net assets, at value | $ | 1,191,296,238 | $ | 659,519,196 | ||
| Net assets consist of: | ||||||
| Paid-in capital | $ | 839,775,090 | $ | 768,580,727 | ||
| Undistributed net investment income (loss) | (7,964,127 | ) | 3,830,515 | |||
| Net unrealized appreciation (depreciation) | 360,539,115 | 30,368,728 | ||||
| Accumulated net realized gain (loss) | (1,053,840 | ) | (143,260,774 | ) | ||
| Net assets, at value | $ | 1,191,296,238 | $ | 659,519,196 | ||
| *Includes securities loaned | $ | 68,709,293 | $ | 3,406,095 | ||
franklintempleton.com
The accompanying notes are an integral part of these financial statements. | Annual Report 39
FRANKLIN STRATEGIC SERIES
FINANCIAL STATEMENTS
| Statements of Assets and Liabilities (continued) | ||||||
| April 30, 2016 | ||||||
| Franklin | ||||||
| Biotechnology | Franklin Natural | |||||
| Discovery Fund | Resources Fund | |||||
| Class A: | ||||||
| Net assets, at value | $ | 1,074,903,030 | $ | 461,595,993 | ||
| Shares outstanding | 8,385,342 | 18,446,805 | ||||
| Net asset value per sharea | $ | 128.19 | $ | 25.02 | ||
| Maximum offering price per share (net asset value per share ÷ 94.25%) | $ | 136.01 | $ | 26.55 | ||
| Class C: | ||||||
| Net assets, at value | $ | 17,561,648 | $ | 107,723,522 | ||
| Shares outstanding | 139,394 | 4,441,643 | ||||
| Net asset value and maximum offering price per sharea | $ | 125.99 | $ | 24.25 | ||
| Class R6: | ||||||
| Net assets, at value | $ | 5,568,275 | $ | 14,753 | ||
| Shares outstanding | 42,386 | 552 | ||||
| Net asset value and maximum offering price per share | $ | 131.37 | $ | 26.73 | ||
| Advisor Class: | ||||||
| Net assets, at value | $ | 93,263,285 | $ | 90,184,928 | ||
| Shares outstanding | 713,705 | 3,376,910 | ||||
| Net asset value and maximum offering price per share | $ | 130.67 | $ | 26.71 | ||
aRedemption price is equal to net asset value less contingent deferred sales charges, if applicable.
40 Annual Report | The accompanying notes are an integral part of these financial statements.
franklintempleton.com
FRANKLIN STRATEGIC SERIES
FINANCIAL STATEMENTS
| Statements of Operations | ||||||
| for the year ended April 30, 2016 | ||||||
| Franklin | ||||||
| Biotechnology | Franklin Natural | |||||
| Discovery Fund | Resources Fund | |||||
| Investment income: | ||||||
| Dividends | $ | 4,336,976 | $ | 13,474,603 | ||
| Interest | — | 216,475 | ||||
| Income from securities loaned (net of fees and rebates) | 2,502,712 | 141,118 | ||||
| Total investment income | 6,839,688 | 13,832,196 | ||||
| Expenses: | ||||||
| Management fees (Note 3a) | 9,504,293 | 2,890,713 | ||||
| Distribution fees: (Note 3c) | ||||||
| Class A | 3,470,132 | 1,133,832 | ||||
| Class C | 219,808 | 943,341 | ||||
| Transfer agent fees: (Note 3e) | ||||||
| Class A | 2,121,752 | 1,373,327 | ||||
| Class C | 33,507 | 305,032 | ||||
| Class R6 | 564 | 132 | ||||
| Advisor Class | 212,758 | 220,825 | ||||
| Custodian fees (Note 4) | 15,683 | 16,534 | ||||
| Reports to shareholders | 165,312 | 160,514 | ||||
| Registration and filing fees | 99,148 | 109,930 | ||||
| Professional fees | 55,457 | 41,124 | ||||
| Trustees’ fees and expenses | 17,934 | 6,105 | ||||
| Other | 47,266 | 17,180 | ||||
| Total expenses | 15,963,614 | 7,218,589 | ||||
| Expense reductions (Note 4) | (65 | ) | — | |||
| Expenses waived/paid by affiliates (Note 3f and 3g) | (189,675 | ) | (48,661 | ) | ||
| Net expenses | 15,773,874 | 7,169,928 | ||||
| Net investment income (loss) | (8,934,186 | ) | 6,662,268 | |||
| Realized and unrealized gains (losses): | ||||||
| Net realized gain (loss) from: | ||||||
| Investments: | ||||||
| Unaffiliated issuers | 38,665,026 | (105,744,481 | ) | |||
| Non-controlled affiliates (Note 8) | 2,829,131 | — | ||||
| Foreign currency transactions | 13,905 | (78,807 | ) | |||
| Net realized gain (loss) | 41,508,062 | (105,823,288 | ) | |||
| Net change in unrealized appreciation (depreciation) on: | ||||||
| Investments | (442,755,096 | ) | (46,780,891 | ) | ||
| Translation of other assets and liabilities denominated in foreign currencies | (305,949 | ) | (16,527 | ) | ||
| Net change in unrealized appreciation (depreciation) | (443,061,045 | ) | (46,797,418 | ) | ||
| Net realized and unrealized gain (loss) | (401,552,983 | ) | (152,620,706 | ) | ||
| Net increase (decrease) in net assets resulting from operations | $ | (410,487,169 | ) | $ | (145,958,438 | ) |
franklintempleton.com
The accompanying notes are an integral part of these financial statements. | Annual Report 41
FRANKLIN STRATEGIC SERIES
FINANCIAL STATEMENTS
| Statements of Changes in Net Assets | ||||||||||||
| Franklin | Franklin | |||||||||||
| Biotechnology Discovery Fund | Natural Resources Fund | |||||||||||
| Year Ended April 30, | Year Ended April 30, | |||||||||||
| 2016 | 2015 | 2016 | 2015 | |||||||||
| Increase (decrease) in net assets: | ||||||||||||
| Operations: | ||||||||||||
| Net investment income (loss) | $ | (8,934,186 | ) | $ | (10,534,293 | ) | $ | 6,662,268 | $ | 4,425,478 | ||
| Net realized gain (loss) | 41,508,062 | 141,646,169 | (105,823,288 | ) | 7,959,520 | |||||||
| Net change in unrealized appreciation (depreciation) | (443,061,045 | ) | 467,574,872 | (46,797,418 | ) | (169,659,474 | ) | |||||
| Net increase (decrease) in net assets resulting | ||||||||||||
| from operations | (410,487,169 | ) | 598,686,748 | (145,958,438 | ) | (157,274,476 | ) | |||||
| Distributions to shareholders from: | ||||||||||||
| Net investment income: | ||||||||||||
| Class A | — | — | (3,065,832 | ) | (4,357,432 | ) | ||||||
| Class C | — | — | (21,423 | ) | (26,149 | ) | ||||||
| Class R6 | — | — | (5,056 | ) | (8,714 | ) | ||||||
| Advisor Class | — | — | (880,846 | ) | (881,303 | ) | ||||||
| Net realized gains: | ||||||||||||
| Class A | (115,150,452 | ) | (56,613,547 | ) | — | — | ||||||
| Class C | (1,868,138 | ) | (651,107 | ) | — | — | ||||||
| Class R6 | (555,624 | ) | (2,490,471 | ) | — | — | ||||||
| Advisor Class | (11,496,430 | ) | (5,889,371 | ) | — | — | ||||||
| Total distributions to shareholders | (129,070,644 | ) | (65,644,496 | ) | (3,973,157 | ) | (5,273,598 | ) | ||||
| Capital share transactions: (Note 2) | ||||||||||||
| Class A | (51,384,188 | ) | (1,965,528 | ) | 1,840,165 | 66,759,221 | ||||||
| Class C | 2,640,554 | 13,282,238 | 7,417,245 | 19,081,993 | ||||||||
| Class R6 | (63,450,822 | ) | 3,829,454 | (222,058 | ) | (273,768 | ) | |||||
| Advisor Class | (25,379,192 | ) | 31,005,366 | 24,416,177 | 6,489,242 | |||||||
| Total capital share transactions | (137,573,648 | ) | 46,151,530 | 33,451,529 | 92,056,688 | |||||||
| Net increase (decrease) in net assets | (677,131,461 | ) | 579,193,782 | (116,480,066 | ) | (70,491,386 | ) | |||||
| Net assets: | ||||||||||||
| Beginning of year | 1,868,427,699 | 1,289,233,917 | 775,999,262 | 846,490,648 | ||||||||
| End of year | $ | 1,191,296,238 | $ | 1,868,427,699 | $ | 659,519,196 | $ | 775,999,262 | ||||
| Undistributed net investment income (loss) included in net assets: | ||||||||||||
| End of year | $ | (7,964,127 | ) | $ | (6,715,528 | ) | $ | 3,830,515 | $ | 158,696 | ||
42 Annual Report | The accompanying notes are an integral part of these financial statements.
franklintempleton.com
FRANKLIN STRATEGIC SERIES
Notes to Financial Statements
1. Organization and Significant Accounting Policies
Franklin Strategic Series (Trust) is registered under the Investment Company Act of 1940 (1940 Act) as an open-end management investment company, consisting of ten separate funds, two of which are included in this report (Funds) and applies the specialized accounting and reporting guidance in U.S. Generally Accepted Accounting Principles (U.S. GAAP). The financial statements of the remaining funds in the Trust are presented separately. The Funds offer four classes of shares: Class A, Class C, Class R6, and Advisor Class. Each class of shares differs by its initial sales load, contingent deferred sales charges, voting rights on matters affecting a single class, its exchange privilege and fees primarily due to differing arrangements for distribution and transfer agent fees. Franklin Biotechnology Discovery Fund was closed to new investors with limited exceptions effective at the close of market July 8, 2014. Effective May 16, 2016, the Fund reopened to new investors.
The following summarizes the Funds’ significant accounting policies.
a. Financial Instrument Valuation
The Funds’ investments in financial instruments are carried at fair value daily. Fair value is the price that would be received to sell an asset or paid to transfer a liability in an orderly transaction between market participants on the measurement date. The Funds calculate the net asset value (NAV) per share as of 4 p.m. Eastern time each day the New York Stock Exchange (NYSE) is open for trading. Under compliance policies and procedures approved by the Trust’s Board of Trustees (the Board), the Funds’ administrator has responsibility for oversight of valuation, including leading the cross-functional Valuation and Liquidity Oversight Committee (VLOC). The VLOC provides administration and oversight of the Funds’ valuation policies and procedures, which are approved annually by the Board. Among other things, these procedures allow the Funds to utilize independent pricing services, quotations from securities and financial instrument dealers, and other market sources to determine fair value.
Equity securities listed on an exchange or on the NASDAQ National Market System are valued at the last quoted sale price or the official closing price of the day, respectively. Foreign equity securities are valued as of the close of trading on the foreign stock exchange on which the security is primarily traded or as of 4 p.m. Eastern time, whichever is earlier. The value is then converted into its U.S. dollar equivalent at the foreign exchange rate in effect at 4 p.m. Eastern time on the day that the value of the security is determined. Over-the-counter (OTC) securities are valued within the range of the most recent quoted bid and ask prices. Securities that trade in multiple markets or on multiple exchanges are valued according to the broadest and most representative market. Certain equity securities are valued based upon fundamental characteristics or relationships to similar securities.
Debt securities generally trade in the OTC market rather than on a securities exchange. The Funds’ pricing services use multiple valuation techniques to determine fair value. In instances where sufficient market activity exists, the pricing services may utilize a market-based approach through which quotes from market makers are used to determine fair value. In instances where sufficient market activity may not exist or is limited, the pricing services also utilize proprietary valuation models which may consider market characteristics such as benchmark yield curves, credit spreads, estimated default rates, anticipated market interest rate volatility, coupon rates, anticipated timing of principal repayments, underlying collateral, and other unique security features in order to estimate the relevant cash flows, which are then discounted to calculate the fair value.
Investments in open-end mutual funds are valued at the closing NAV.
The Funds have procedures to determine the fair value of financial instruments for which market prices are not reliable or readily available. Under these procedures, the VLOC convenes on a regular basis to review such financial instruments and considers a number of factors, including significant unobservable valuation inputs, when arriving at fair value. The VLOC primarily employs a market-based approach which may use related or comparable assets or liabilities, recent transactions, market multiples, book values, and other relevant information for the investment to determine the fair value of the investment. An income-based valuation approach may also be used in which the anticipated future cash flows of the investment are discounted to calculate fair value. Discounts may also be applied due to the nature or duration of any restrictions on the disposition of the investments. Due to the inherent uncertainty of valuations of such investments, the fair values may differ significantly from the values that would have been used had an active market existed. The VLOC employs various
franklintempleton.com
Annual Report
43
FRANKLIN STRATEGIC SERIES
NOTES TO FINANCIAL STATEMENTS
1. Organization and Significant Accounting
Policies (continued)
a. Financial Instrument Valuation (continued)
methods for calibrating these valuation approaches including a regular review of key inputs and assumptions, transactional back-testing or disposition analysis, and reviews of any related market activity.
Trading in securities on foreign securities stock exchanges and OTC markets may be completed before 4 p.m. Eastern time. In addition, trading in certain foreign markets may not take place on every NYSE business day. Occasionally, events occur between the time at which trading in a foreign security is completed and the close of the NYSE that might call into question the reliability of the value of a portfolio security held by the Fund. As a result, differences may arise between the value of the Fund’s portfolio securities as determined at the foreign market close and the latest indications of value at the close of the NYSE. In order to minimize the potential for these differences, the VLOC monitors price movements following the close of trading in foreign stock markets through a series of country specific market proxies (such as baskets of American Depositary Receipts, futures contracts and exchange traded funds). These price movements are measured against established trigger thresholds for each specific market proxy to assist in determining if an event has occurred that may call into question the reliability of the values of the foreign securities held by the Funds. If such an event occurs, the securities may be valued using fair value procedures, which may include the use of independent pricing services.
When the last day of the reporting period is a non-business day, certain foreign markets may be open on those days that the NYSE is closed, which could result in differences between the value of the Fund’s portfolio securities on the last business day and the last calendar day of the reporting period. Any significant security valuation changes due to an open foreign market are adjusted and reflected by the Funds for financial reporting purposes.
b. Foreign Currency Translation
Portfolio securities and other assets and liabilities denominated in foreign currencies are translated into U.S. dollars based on the exchange rate of such currencies against U.S. dollars on the date of valuation. The Funds may enter into foreign currency exchange contracts to facilitate transactions denominated in a foreign currency. Purchases and sales of securities, income and expense items denominated in foreign currencies are translated into U.S. dollars at the exchange rate in effect on the transaction date. Portfolio securities and assets and liabilities denominated in foreign currencies contain risks that those currencies will decline in value relative to the U.S. dollar. Occasionally, events may impact the availability or reliability of foreign exchange rates used to convert the U.S. dollar equivalent value. If such an event occurs, the foreign exchange rate will be valued at fair value using procedures established and approved by the Board.
The Funds do not separately report the effect of changes in foreign exchange rates from changes in market prices on securities held. Such changes are included in net realized and unrealized gain or loss from investments in the Statements of Operations.
Realized foreign exchange gains or losses arise from sales of foreign currencies, currency gains or losses realized between the trade and settlement dates on securities transactions and the difference between the recorded amounts of dividends, interest, and foreign withholding taxes and the U.S. dollar equivalent of the amounts actually received or paid. Net unrealized foreign exchange gains and losses arise from changes in foreign exchange rates on foreign denominated assets and liabilities other than investments in securities held at the end of the reporting period.
c. Securities Lending
Certain or all Funds participate in an agency based securities lending program to earn additional income. The Fund receives cash collateral against the loaned securities in an amount equal to at least 102% of the fair value of the loaned securities. Collateral is maintained over the life of the loan in an amount not less than 100% of the fair value of loaned securities, as determined at the close of Fund business each day; any additional collateral required due to changes in security values is delivered to the Fund on the next business day. The collateral is deposited into a joint cash account with other funds and is used to invest in a money market fund managed by Franklin Advisers, Inc., an affiliate of the Funds. The Fund may receive income from the investment of cash collateral, in addition to lending fees and rebates paid by the borrower. Income from securities loaned is reported separately in the Statement of Operations. The Fund bears the market risk with respect to the collateral investment, securities loaned, and the risk that the agent may default on its obligations to the Fund. If the borrower defaults on its obligation to return the securities loaned, the
44 Annual Report
franklintempleton.com
FRANKLIN STRATEGIC SERIES
NOTES TO FINANCIAL STATEMENTS
Fund has the right to repurchase the securities in the open market using the collateral received. The securities lending agent has agreed to indemnify the Fund in the event of default by a third party borrower.
d. Income and Deferred Taxes
It is each Fund’s policy to qualify as a regulated investment company under the Internal Revenue Code. Each Fund intends to distribute to shareholders substantially all of its taxable income and net realized gains to relieve it from federal income and excise taxes. As a result, no provision for U.S. federal income taxes is required.
The Funds may be subject to foreign taxation related to income received, capital gains on the sale of securities and certain foreign currency transactions in the foreign jurisdictions in which the Funds invest. Foreign taxes, if any, are recorded based on the tax regulations and rates that exist in the foreign markets in which the Funds invest. When a capital gain tax is determined to apply, the Funds record an estimated deferred tax liability in an amount that would be payable if the securities were disposed of on the valuation date.
Each Fund may recognize an income tax liability related to its uncertain tax positions under U.S. GAAP when the uncertain tax position has a less than 50% probability that it will be sustained upon examination by the tax authorities based on its technical merits. As of April 31, 2016, the Fund has determined that no tax liability is required in its financial statements related to uncertain tax positions for any open tax years (or expected to be taken on future tax returns). Open tax years are those that remain subject to examination and are based on each tax jurisdiction’s statute of limitation.
e. Security Transactions, Investment Income, Expenses and Distributions
Security transactions are accounted for on trade date. Realized gains and losses on security transactions are determined on a specific identification basis. Interest income and estimated expenses are accrued daily. Dividend income is recorded on the ex-dividend date except for certain dividends from foreign securities where the dividend rate is not available. In such cases, the dividend is recorded as soon as the information is received by the Fund. Distributions to shareholders are recorded on the ex-dividend date and are determined according to income tax regulations (tax basis). Distributable earnings determined on a tax basis may differ from earnings recorded in accordance with U.S. GAAP. These differences may be permanent or temporary. Permanent differences are reclassified among capital accounts to reflect their tax character. These reclassifications have no impact on net assets or the results of operations. Temporary differences are not reclassified, as they may reverse in subsequent periods.
Common expenses incurred by the Trust are allocated among the Funds based on the ratio of net assets of each Fund to the combined net assets of the Trust. Fund specific expenses are charged directly to the fund that incurred the expense.
Realized and unrealized gains and losses and net investment income, not including class specific expenses, are allocated daily to each class of shares based upon the relative proportion of net assets of each class. Differences in per share distributions, by class, are generally due to differences in class specific expenses.
f. Accounting Estimates
The preparation of financial statements in accordance with U.S. GAAP requires management to make estimates and assumptions that affect the reported amounts of assets and liabilities at the date of the financial statements and the amounts of income and expenses during the reporting period. Actual results could differ from those estimates.
g. Guarantees and Indemnifications
Under the Trust’s organizational documents, its officers and trustees are indemnified by the Trust against certain liabilities arising out of the performance of their duties to the Trust. Additionally, in the normal course of business, the Trust, on behalf of the Funds, enters into contracts with service providers that contain general indemnification clauses. The Trust’s maximum exposure under these arrangements is unknown as this would involve future claims that may be made against the Trust that have not yet occurred. Currently, the Trust expects the risk of loss to be remote.
franklintempleton.com
Annual Report
45
FRANKLIN STRATEGIC SERIES
NOTES TO FINANCIAL STATEMENTS
2. Shares of Beneficial Interest
At April 30, 2016, there were an unlimited number of shares authorized (without par value). Transactions in the Funds’ shares were as follows:
| Franklin Biotechnology | Franklin Natural | ||||||||||
| Discovery Fund | Resources Fund | ||||||||||
| Shares | Amount | Shares | Amount | ||||||||
| Class A Shares: | |||||||||||
| Year ended April 30, 2016 | |||||||||||
| Shares sold | 994,554 | $ | 169,501,230 | 5,741,950 | $ | 131,553,976 | |||||
| Shares issued in reinvestment of distributions | 691,137 | 108,930,097 | 143,948 | 2,979,717 | |||||||
| Shares redeemed | (2,087,610 | ) | (329,815,515 | ) | (5,636,208 | ) | (132,693,528 | ) | |||
| Net increase (decrease) | (401,919 | ) | $ | (51,384,188 | ) | 249,690 | $ | 1,840,165 | |||
| Year ended April 30, 2015 | |||||||||||
| Shares sold | 1,717,680 | $ | 276,277,147 | 7,090,471 | $ | 217,913,005 | |||||
| Shares issued in reinvestment of distributions | 326,778 | 53,156,888 | 160,621 | 4,176,142 | |||||||
| Shares redeemed | (2,090,836 | ) | (331,399,563 | ) | (4,744,194 | ) | (155,329,926 | ) | |||
| Net increase (decrease) | (46,378 | ) | $ | (1,965,528 | ) | 2,506,898 | $ | 66,759,221 | |||
| Class C Shares: | |||||||||||
| Year ended April 30, 2016 | |||||||||||
| Shares sold | 35,382 | $ | 6,172,232 | 1,548,932 | $ | 34,012,781 | |||||
| Shares issued in reinvestment of distributions | 12,007 | 1,864,389 | 1,031 | 20,756 | |||||||
| Shares redeemed | (35,581 | ) | (5,396,067 | ) | (1,170,096 | ) | (26,616,292 | ) | |||
| Net increase (decrease) | 11,808 | $ | 2,640,554 | 379,867 | $ | 7,417,245 | |||||
| Year ended April 30, 2015 | |||||||||||
| Shares sold | 99,120 | $ | 15,615,834 | 1,797,408 | $ | 52,747,509 | |||||
| Shares issued in reinvestment of distributions | 4,011 | 648,558 | 992 | 25,030 | |||||||
| Shares redeemed | (18,036 | ) | (2,982,154 | ) | (1,035,528 | ) | (33,690,546 | ) | |||
| Net increase (decrease) | 85,095 | $ | 13,282,238 | 762,872 | $ | 19,081,993 | |||||
| Class R6 Shares: | |||||||||||
| Year ended April 30, 2016 | |||||||||||
| Shares sold | 21,331 | $ | 3,581,555 | 2,400 | $ | 64,684 | |||||
| Shares issued in reinvestment of distributions | 3,445 | 555,624 | 229 | 5,056 | |||||||
| Shares redeemed | (393,884 | ) | (67,588,001 | ) | (15,127 | ) | (291,798 | ) | |||
| Net increase (decrease) | (369,108 | ) | $ | (63,450,822 | ) | (12,498 | ) | $ | (222,058 | ) | |
| Year ended April 30, 2015 | |||||||||||
| Shares sold | 57,247 | $ | 9,282,687 | 1,857 | $ | 71,787 | |||||
| Shares issued in reinvestment of distributions | 15,044 | 2,490,471 | 312 | 8,649 | |||||||
| Shares redeemed | (48,654 | ) | (7,943,704 | ) | (11,163 | ) | (354,204 | ) | |||
| Net increase (decrease) | 23,637 | $ | 3,829,454 | (8,994 | ) | $ | (273,768 | ) | |||
46 Annual Report
franklintempleton.com
FRANKLIN STRATEGIC SERIES
NOTES TO FINANCIAL STATEMENTS
| Franklin Biotechnology | Franklin Natural | |||||||||
| Discovery Fund | Resources Fund | |||||||||
| Shares | Amount | Shares | Amount | |||||||
| Advisor Class Shares: | ||||||||||
| Year ended April 30, 2016 | ||||||||||
| Shares sold | 208,936 | $ | 35,072,346 | 2,472,344 | $ | 59,834,181 | ||||
| Shares issued in reinvestment of distributions | 58,123 | 9,330,443 | 37,248 | 822,065 | ||||||
| Shares redeemed | (455,659 | ) | (69,781,981 | ) | (1,490,983 | ) | (36,240,069 | ) | ||
| Net increase (decrease) | (188,600 | ) | $ | (25,379,192 | ) | 1,018,609 | $ | 24,416,177 | ||
| Year ended April 30, 2015 | ||||||||||
| Shares sold | 470,819 | $ | 73,058,064 | 1,438,440 | $ | 50,510,303 | ||||
| Shares issued in reinvestment of distributions | 29,024 | 4,790,912 | 28,618 | 794,445 | ||||||
| Shares redeemed | (293,017 | ) | (46,843,610 | ) | (1,334,841 | ) | (44,815,506 | ) | ||
| Net increase (decrease) | 206,826 | $ | 31,005,366 | 132,217 | $ | 6,489,242 | ||||
3. Transactions with Affiliates
Franklin Resources, Inc. is the holding company for various subsidiaries that together are referred to as Franklin Templeton Investments. Certain officers and trustees of the Trust are also officers and/or directors of the following subsidiaries:
| Subsidiary | Affiliation |
| Franklin Advisers, Inc. (Advisers) | Investment manager |
| Franklin Templeton Services, LLC (FT Services) | Administrative manager |
| Franklin Templeton Distributors, Inc. (Distributors) | Principal underwriter |
| Franklin Templeton Investor Services, LLC (Investor Services) | Transfer agent |
a. Management Fees
Franklin Biotechnology Discovery Fund pays an investment management fee to Advisers based on the average daily net assets of the Fund as follows:
| Annualized Fee Rate | Net Assets | |
| 0.775 | % | up to and including $100 million |
| 0.650 | % | over $100 million, up to and including $200 million |
| 0.635 | % | over $200 million, up to and including $250 million |
| 0.585 | % | over $250 million, up to and including $700 million |
| 0.550 | % | over $700 million, up to and including $1.2 billion |
| 0.525 | % | over $1.2 billion, up to and including $7.5 billion |
| 0.515 | % | over $7.5 billion, up to and including $10 billion |
| 0.505 | % | over $10 billion, up to and including $12.5 billion |
| 0.495 | % | over $12.5 billion, up to and including $15 billion |
| 0.475 | % | in excess of $15 billion. |
franklintempleton.com
Annual Report
47
FRANKLIN STRATEGIC SERIES
NOTES TO FINANCIAL STATEMENTS
3. Transactions with Affiliates (continued)
a. Management Fees (continued)
Franklin Natural Resources Fund pays an investment management fee to Advisers based on the average daily net assets of the Fund as follows:
| Annualized Fee Rate | Net Assets | |
| 0.625 | % | Up to and including $100 million |
| 0.500 | % | Over $100 million, up to and including $250 million |
| 0.450 | % | Over $250 million, up to and including $7.5 billion |
| 0.440 | % | Over $7.5 billion, up to and including $10 billion |
| 0.430 | % | Over $10 billion, up to and including $12.5 billion |
| 0.420 | % | Over $12.5 billion, up to and including $15 billion |
| 0.400 | % | In excess of $15 billion |
For the year ended April 30, 2016, each Fund’s annualized effective investment management fee rate based on average daily net assets was as follows:
| Franklin | |||
| Biotechnology | Franklin Natural | ||
| Discovery Fund | Resources Fund | ||
| 0.575 | % | 0.493 | % |
b. Administrative Fees
Under an agreement with Advisers, FT Services provides administrative services to the Funds. The fee is paid by Advisers based on the Funds’ average daily net assets, and is not an additional expense of the Funds.
c. Distribution Fees
The Board has adopted distribution plans for each share class, with the exception of Class R6 and Advisor Class shares, pursuant to Rule 12b-1 under the 1940 Act. Under the Funds’ Class A reimbursement distribution plans, the Funds reimburses Distributors for costs incurred in connection with the servicing, sale and distribution of each Fund’s shares up to the maximum annual plan rate for each class. Under the Class A reimbursement distribution plans, costs exceeding the maximum for the current plan year cannot be reimbursed in subsequent periods. In addition, under the Funds’ Class C compensation distribution plans, the Funds pay Distributors for costs incurred in connection with the servicing, sale and distribution of each Fund’s shares up to the maximum annual plan rate for each class. The plan year, for purposes of monitoring compliance with the maximum annual plan rates, is February 1 through January 31 for each Fund.
The maximum annual plan rates, based on the average daily net assets, for each class, are as follows:
| Class A | 0.35 | % |
| Class C | 1.00 | % |
Effective August 1, 2015, the Board has set the current rate at 0.25% per year for Class A shares until further notice and approval by the Board. Prior to August 1, 2015, the Board had set the rate at 0.30% per year for Class A shares.
48 Annual Report
franklintempleton.com
FRANKLIN STRATEGIC SERIES
NOTES TO FINANCIAL STATEMENTS
d. Sales Charges/Underwriting Agreements
Front-end sales charges and contingent deferred sales charges (CDSC) do not represent expenses of the Funds. These charges are deducted from the proceeds of sales of fund shares prior to investment or from redemption proceeds prior to remittance, as applicable. Distributors has advised the Funds of the following commission transactions related to the sales and redemptions of the Funds’ shares for the year:
| Franklin | ||||
| Biotechnology | Franklin Natural | |||
| Discovery Fund | Resources Fund | |||
| Sales charges retained net of commissions | ||||
| paid to unaffiliated broker/dealers | $ | 236,776 | $ | 335,436 |
| CDSC retained | $ | 10,323 | $ | 29,869 |
e. Transfer Agent Fees
Each class of shares, except for Class R6 pays transfer agent fees to Investor Services for its performance of shareholder servicing obligations and reimburses Investor Services for out of pocket expenses incurred, including shareholder servicing fees paid to third parties. These fees are allocated daily based upon their relative proportion of such classes’ aggregate net assets. Class R6 pays Investor Services transfer agent fees specific to that class.
For the year ended April 30, 2016, the Funds paid transfer agent fees as noted in the Statements of Operations of which the following amounts were retained by Investor Services:
| Franklin | ||||
| Biotechnology | Franklin Natural | |||
| Discovery Fund | Resources Fund | |||
| Transfer agent fees | $ | 971,623 | $ | 886,574 |
f. Investments in Affiliated Management Investment Companies
The Funds invest in an affiliated management investment company for purposes other than exercising a controlling influence over the management or policies. Management fees paid by the Funds are waived on assets invested in the affiliated management investment company, as noted in the Statements of Operations, in an amount not to exceed the management and administrative fees paid directly or indirectly by each affiliate. Prior to May 1, 2013, the waiver was accounted for as a reduction to management fees.
| % of Affiliated | |||||||||||
| Number of | Number of | Fund Shares | |||||||||
| Shares Held | Shares Held | Value | Outstanding | ||||||||
| at Beginning | Gross | Gross | at End | at End Investment | Realized | Held at End | |||||
| of Year | Additions | Reductions | of Year | of Year | Income Gain(Loss) | of Year | |||||
| Franklin Biotechnology | |||||||||||
| Discovery Fund | |||||||||||
| Non-Controlled Affiliates | |||||||||||
| Institutional Fiduciary Trust | |||||||||||
| Money Market Portfolio | 201,682,174 | 832,024,242 | (950,947,435) | 82,758,981 | $82,758,981 | $ — | $ — | 0.42% | |||
| Franklin Natural | |||||||||||
| Resources Fund | |||||||||||
| Non-Controlled Affiliates | |||||||||||
| Institutional Fiduciary Trust | |||||||||||
| Money Market Portfolio | 59,323,631 | 287,534,083 | (302,948,034) | 43,909,680 | $43,909,680 | $ — | $ — | 0.22% | |||
g. Waiver and Expense Reimbursements
Investor Services has contractually agreed in advance to waive or limit its fees so that the Class R6 transfer agent fees do not exceed 0.01% until August 31, 2016. For Franklin Biotechnology Discovery Fund, there were no Class R6 transfer agent fees waived during the period ended April 30, 2016.
franklintempleton.com
Annual Report
49
FRANKLIN STRATEGIC SERIES
NOTES TO FINANCIAL STATEMENTS
4. Expense Offset Arrangement
The Funds have entered into an arrangement with their custodian whereby credits realized as a result of uninvested cash balances are used to reduce a portion of the Funds’ custodian expenses. During the year ended April 30, 2016, the custodian fees were reduced as noted in the Statements of Operations.
5. Income Taxes
For tax purposes, capital losses may be carried over to offset future capital gains. Capital loss carryforwards with no expiration, if any, must be fully utilized before those losses with expiration dates.
| At April 30, 2016, the capital loss carryforwards were as follows: | ||
| Franklin Natural | ||
| Resources Fund | ||
| Capital loss carryforwards subject to expiration: | ||
| 2018 | $ | 12,737,677 |
| Capital loss carryforwards not subject to expiration: | ||
| Short term | 18,823,722 | |
| Long term | 95,547,646 | |
| Total capital loss carryforwards | $ | 127,109,045 |
For tax purposes, the Funds may elect to defer any portion of a late-year ordinary loss to the first day of the following fiscal year. At April 30, 2016, Franklin Biotechnology Discovery Fund deferred late-year ordinary losses of $4,945,791.
| The tax character of distributions paid during the years ended April 30, 2016 and 2015, was as follows: | ||||||||
| Franklin Biotechnology | Franklin Natural | |||||||
| Discovery Fund | Resources Fund | |||||||
| 2016 | 2015 | 2016 | 2015 | |||||
| Distributions paid from: | ||||||||
| Ordinary income | $ | 35,788,633 | $ | 36,696,134 | $ | 3,973,157 | $ | 5,273,598 |
| Long term capital gain | 93,282,011 | 28,948,362 | — | — | ||||
| $ | 129,070,644 | $ | 65,644,496 | $ | 3,973,157 | $ | 5,273,598 | |
At April 30, 2016, the cost of investments, net unrealized appreciation (depreciation), undistributed ordinary income and undistributed long term capital gains for income tax purposes were as follows:
| Franklin | ||||||
| Biotechnology | Franklin Natural | |||||
| Discovery Fund | Resources Fund | |||||
| Cost of investments | $ | 904,029,561 | $ | 655,699,534 | ||
| Unrealized appreciation | $ | 505,046,106 | $ | 108,166,427 | ||
| Unrealized depreciation | (150,330,441 | ) | (96,635,843 | ) | ||
| Net unrealized appreciation (depreciation) | $ | 354,715,665 | $ | 11,530,584 | ||
| Undistributed ordinary income | $ | — | $ | 6,520,681 | ||
| Undistributed long term capital gains | 2,044,115 | — | ||||
| Distributable earnings | $ | 2,044,115 | $ | 6,520,681 |
50 Annual Report
franklintempleton.com
FRANKLIN STRATEGIC SERIES
NOTES TO FINANCIAL STATEMENTS
Differences between income and/or capital gains as determined on a book basis and a tax basis are primarily due to differing treatments of passive foreign investment company shares and wash sales.
6. Investment Transactions
Purchases and sales of investments (excluding short term securities) for the year ended April 30, 2016, were as follows:
| Franklin | ||||
| Biotechnology | Franklin Natural | |||
| Discovery Fund | Resources Fund | |||
| Purchases | $ | 352,241,310 | $ | 253,408,229 |
| Sales | $ | 527,117,844 | $ | 204,527,120 |
At April 30, 2016, in connection with securities lending transactions, certain or all Funds loaned investments and received cash collateral as follows:
| Franklin | ||||
| Biotechnology | Franklin Natural | |||
| Discovery Fund | Resources Fund | |||
| Securities lending transactionsa: | ||||
| Equity investmentsb | $ | 75,805,741 | $ | 3,401,250 |
aThe agreements open at year end can be terminated at any time.
bGross amount of recognized liabilities for securities lending transactions is included in payable upon return of securities loaned in the Statements of Assets and Liabilities.
7. Restricted Securities
Certain or all Funds invest in securities that are restricted under the Securities Act of 1933 (1933 Act) or which are subject to legal, contractual, or other agreed upon restrictions on resale. Restricted securities are often purchased in private placement transactions, and cannot be sold without prior registration unless the sale is pursuant to an exemption under the 1933 Act. Disposal of these securities may require greater effort and expense, and prompt sale at an acceptable price may be difficult. The Funds may have registration rights for restricted securities. The issuer generally incurs all registration costs.
At April 30, 2016, the Funds held investments in restricted securities, excluding certain securities exempt from registration under the 1933 Act deemed to be liquid, as follows:
| Acquisition | ||||||
| Shares | Issuer | Dates | Cost | Value | ||
| Franklin Biotechnology Discovery Fund | ||||||
| 107,297,280 | Acerta Pharma BV | 2/01/16 | $ | 6,172,605 | $ | 5,595,124 |
| 80,195 | Intarcia Therapeutics Inc., DD | 3/26/14 | 2,597,516 | 2,987,264 | ||
| 942,380 | G1 Therapeutics Inc., pfd | 4/26/16 | 2,799,999 | 2,799,999 | ||
| Total Restricted Securities (Value is 0.96% of Net Assets) | $ | 11,570,120 | $ | 11,382,387 | ||
| Franklin Natural Resources Fund | ||||||
| 199,375 | Energy Coal Resources, 144A | 11/16/05 - 5/05/06 | $ | 741,939 | $ | — |
| 29,847 | Energy Coal Resources, 144A, pfd | 3/17/09 | 2,376,164 | — | ||
| Total Restricted Securities (Value is 0.00% of Net Assets) | $ | 3,118,103 | $ | — | ||
franklintempleton.com
Annual Report
51
FRANKLIN STRATEGIC SERIES
NOTES TO FINANCIAL STATEMENTS
8. Holdings of 5% Voting Securities of Portfolio Companies
The 1940 Act defines “affiliated companies” to include investments in portfolio companies in which a fund owns 5% or more of the outstanding voting securities. Investments in “affiliated companies” for Franklin Biotechnology Discovery Fund for the year ended April 30, 2016, were as shown below.
| Number of | Number of | |||||||||||
| Shares/Warrants | Shares/Warrants | Value | ||||||||||
| Held at Beginning | Gross | Gross | Held at End | at End | Investment | Realized | ||||||
| Name of Issuer | of Year | Additions | Reductions | of Year | of Year | Income | Gain (Loss) | |||||
| Franklin Biotechnology Discovery Fund | ||||||||||||
| Non-Controlled Affiliates | ||||||||||||
| ARCA biopharma Inc | — | 3,346,547 | (2,868,470 | )a | 478,077 | $ | 2,012,704 | $ | — | $ | — | |
| ARCA biopharma Inc., | ||||||||||||
| wts., 6/16/22 | — | 1,338,619 | — | 1,338,619 | 137,980 | — | — | |||||
| BioPharmX Corp | — | 216,000 | — | 216,000 | 170,640 | — | — | |||||
| BiopharmX Corp., 144A | — | 1,600,000 | — | 1,600,000 | 1,264,000 | — | — | |||||
| Biopharmx Corp., | ||||||||||||
| wts., 3/29/21 | — | 108,000 | — | 108,000 | 65,437 | — | — | |||||
| Heat Biologics Inc | 624,200 | — | (106,300 | ) | 517,900 | —b | — | (947,671 | ) | |||
| Heron Therapeutics Inc | 1,664,710 | 33,200 | (220,429 | ) | 1,477,481 | —b | — | 3,776,802 | ||||
| Heron Therapeutics Inc., | ||||||||||||
| wts., 144A, 7/01/16 | 278,594 | — | — | 278,594 | —b | — | — | |||||
| Total Affiliated Securities (Value is 0.31% of Net Assets) | $ | 3,650,761 | $ | — | $ | 2,829,131 | ||||||
| aGross reduction was the result of a corporate action. | ||||||||||||
| bAs of April 30, 2016 no longer an affiliate. | ||||||||||||
9. Credit Facility
Certain or all Funds, together with other U.S. registered and foreign investment funds (collectively, Borrowers), managed by Franklin Templeton Investments, are borrowers in a joint syndicated senior unsecured credit facility totaling $2 billion (Global Credit Facility) which matures on February 10, 2017. This Global Credit Facility provides a source of funds to the Borrowers for temporary and emergency purposes, including the ability to meet future unanticipated or unusually large redemption requests.
Under the terms of the Global Credit Facility, the Fund shall, in addition to interest charged on any borrowings made by the Fund and other costs incurred by the Fund, pay its share of fees and expenses incurred in connection with the implementation and maintenance of the Global Credit Facility, based upon their relative share of the aggregate net assets of all of the Borrowers, including an annual commitment fee of 0.07% based upon the unused portion of the Global Credit Facility. Effective February 12, 2016, the annual commitment fee is 0.15%. These fees are reflected in other expenses in the Statements of Operations. During the year ended April 30, 2016, the Fund did not use the Global Credit Facility.
10. Fair Value Measurements
The Funds follow a fair value hierarchy that distinguishes between market data obtained from independent sources (observable inputs) and the Funds’ own market assumptions (unobservable inputs). These inputs are used in determining the value of the Funds’ financial instruments and are summarized in the following fair value hierarchy:
- Level 1 – quoted prices in active markets for identical financial instruments
- Level 2 – other significant observable inputs (including quoted prices for similar financial instruments, interest rates, prepay- ment speed, credit risk, etc.)
- Level 3 – significant unobservable inputs (including the Funds’ own assumptions in determining the fair value of financial instruments)
52 Annual Report
franklintempleton.com
FRANKLIN STRATEGIC SERIES
NOTES TO FINANCIAL STATEMENTS
The input levels are not necessarily an indication of the risk or liquidity associated with financial instruments at that level.
For movements between the levels within the fair value hierarchy, the Funds have adopted a policy of recognizing the transfers as of the date of the underlying event which caused the movement.
A summary of inputs used as of April 30, 2016, in valuing the Funds’ assets carried at fair value, is as follows:
| Level 1 | Level 2 | Level 3 | Total | |||||
| Franklin Biotechnology Discovery Fund | ||||||||
| Assets: | ||||||||
| Investments in Securities: | ||||||||
| Equity Investments:a | ||||||||
| Biotechnology | $ | 973,014,424 | $ | 5,151,351 | $ | 3,195,479 | $ | 981,361,254 |
| Pharmaceuticals | 150,665,060 | 4,656,881 | 8,460,560 | 163,782,501 | ||||
| Other Equity Investmentsb | 30,842,490 | — | — | 30,842,490 | ||||
| Short Term Investments | 82,758,981 | — | — | 82,758,981 | ||||
| Total Investments in Securities | $ | 1,237,280,955 | $ | 9,808,232 | $ | 11,656,039 | $ | 1,258,745,226 |
| Receivables: | ||||||||
| Investment Securities Sold | $ | — | $ | — | $ | 9,089,004 | $ | 9,089,004 |
| Franklin Natural Resources Fund | ||||||||
| Assets: | ||||||||
| Investments in Securities | ||||||||
| Equity Investments:a | ||||||||
| Oil & Gas Exploration & Production | $ | 223,800,630 | $ | 3,647,665 | $ | — | $ | 227,448,295 |
| Other Equity Investmentsb | 393,801,766 | — | —c | 393,801,766 | ||||
| Convertible Bonds | — | 2,070,377 | — | 2,070,377 | ||||
| Short Term Investments | 43,909,680 | — | — | 43,909,680 | ||||
| Total Investments in Securities | $ | 661,512,076 | $ | 5,718,042 | $ | — | $ | 667,230,118 |
aIncludes common, preferred and convertible preferred stocks as well as other equity investments.
bFor detailed categories, see the accompanying Statement of Investments.
cIncludes securities determined to have no value at April 30, 2016.
A reconciliation of assets in which Level 3 inputs are used in determining fair value is presented when there are significant Level 3 financial instruments at the end of the year. At April 30, 2016, the reconciliation of assets is as follows:
| Net Change in | ||||||||||||||||||||||||||||||
| Unrealized | ||||||||||||||||||||||||||||||
| Net | Appreciation | |||||||||||||||||||||||||||||
| Balance at | Net | Unrealized | (Depreciation) | |||||||||||||||||||||||||||
| Beginning of | Transfers Into | Transfers Out | Cost Basis | Realized | Appreciation | Balance at on Assets Held | ||||||||||||||||||||||||
| Year | Purchases | Sales | Level 3 | of Level 3a Adjustmentsb Gain (Loss) (Depreciation) | End of Year | at Year End | ||||||||||||||||||||||||
| Assets | ||||||||||||||||||||||||||||||
| Investments in Securities: | ||||||||||||||||||||||||||||||
| Equity Investments:c | ||||||||||||||||||||||||||||||
| Biotechnology | $ | 24,570,623 | $ | — | $ | — | $ | — | $ | (20,616,459 | ) | $ | — | $ | — | $ | (758,685) $ 3,195,479 | $ | (948,525 | ) | ||||||||||
| Pharmaceuticals | — | 28,099,246 | (24,985,845 | ) | — | (8,209,704 | ) | — | 17,441,550 | (3,884,687 | ) | 8,460,560 | (512,044 | ) | ||||||||||||||||
| Total Investments | ||||||||||||||||||||||||||||||
| in Securities | $ | 24,570,623 | $ | 28,099,246 | $ | (24,985,845 | ) | $ | — | $ | (28,826,163 | ) | $ | — | $ | 17,441,550 | $ | (4,643,372) $11,656,039 | $ | (1,460,569 | ) | |||||||||
| Receivables: | ||||||||||||||||||||||||||||||
| Investment Securities | ||||||||||||||||||||||||||||||
| Sold | $ | — | $ | — | $ | — | $ | 8,925,131 | d | $ | — | $ | — | $ | — | $ | 163,873 | $ | 9,089,004 | $ | 163,873 | |||||||||
| aThe investments were transferred out of Level 3 as a result of the availability of a quoted price in an active market for identical securities. | ||||||||||||||||||||||||||||||
| bMay include accretion, amortization, partnership adjustments, and/or other cost basis adjustments. | ||||||||||||||||||||||||||||||
| cIncludes common and preferred stocks as well as other equity investments. | ||||||||||||||||||||||||||||||
| dThe receivable was transferred into Level 3 as a result of it being discounted to reflect the current fair value. | ||||||||||||||||||||||||||||||
franklintempleton.com
Annual Report
53
FRANKLIN STRATEGIC SERIES
NOTES TO FINANCIAL STATEMENTS
10. Fair Value Measurements (continued)
Significant unobservable valuation inputs developed by the VLOC for material Level 3 financial instruments and impact to fair value as a result of changes in unobservable valuation inputs as of April 30, 2016, are as follows:
| Impact to Fair | |||||||
| Fair Value at | Valuation | Value if Input | |||||
| Description | End of Year | Technique | Unobservable Inputs | Amount/Range | Increasesa | ||
| Franklin Biotechnology Discovery Fund | |||||||
| Assets: | |||||||
| Investments in Securities: | |||||||
| Equity Investments:b | |||||||
| Biotechnology | $ | 2,987,264 | Discounted Cash | Free Cash Flow | $13,743 | (mil) | Increasec |
| Flow Model | Cost of Equity | 12.5 | % | Decrease | |||
| Probability Rate | 75 | % | Increase | ||||
| Discount for lack | |||||||
| Market comparables | of marketability | 35 | % | Decrease | |||
| Pharmaceutical | 5,595,124 | Probability Weighted | |||||
| Discounted Cash | Free Cash Flowd | $ 3,000 | (mil) | Increase | |||
| Flow Model | Discount for lack of | ||||||
| marketability | 12.5 | % | Decrease | ||||
| All Other Investmentse | 3,073,651 | ||||||
| Total | $ | 11,656,039 | |||||
| Receivables: | |||||||
| Investment Securities Sold | $ | 9,089,004 | Discounted Cash | ||||
| Flow Model | Discount Rate | 1.2 | % | Decrease | |||
aRepresents the directional change in the fair value of the Level 3 investments that would result from a significant and reasonable increase in the corresponding input. A
significant and reasonable decrease in the input would have the opposite effect. Significant impacts, if any, to fair value and/or net assets have been indicated.
bIncludes preferred stocks.
cRepresents a significant impact to fair value and net assets.
dIncludes probability assumptions for various outcomes of contingent payments for clinical trials and regulatory approvals.
eIncludes fair value of immaterial investments developed using various valuation techniques and unobservable inputs. May also include investments with values derived using
prior transaction prices or third party pricing information without adjustment for which such inputs are also unobservable.
11. Subsequent Events
The Funds have evaluated subsequent events through the issuance of the financial statements and determined that no events have occurred that require disclosure other than those already disclosed in the financial statements.
| Abbreviations | |
| Selected Portfolio | |
| ADR | American Depositary Receipt |
| GP | Graduated Payment |
54 Annual Report
franklintempleton.com
FRANKLIN STRATEGIC SERIES
Report of Independent Registered Public Accounting Firm
To the Board of Trustees and Shareholders of Franklin Strategic Series
In our opinion, the accompanying statements of assets and liabilities, including the statements of investments, and the related statements of operations and of changes in net assets and the financial highlights present fairly, in all material respects, the financial position of Franklin Biotechnology Discovery Fund and Franklin Natural Resources Fund (separate portfolios of Franklin Strategic Series, hereafter referred to as the “Funds”) at April 30, 2016, the results of each of their operations for the year then ended, the changes in each of their net assets for each of the two years in the period then ended and the financial highlights for each of the periods presented, in conformity with accounting principles generally accepted in the United States of America. These financial statements and financial highlights (hereafter referred to as “financial statements”) are the responsibility of the Fund’s management. Our responsibility is to express an opinion on these financial statements based on our audits. We conducted our audits of these financial statements in accordance with the standards of the Public Company Accounting Oversight Board (United States). Those standards require that we plan and perform the audit to obtain reasonable assurance about whether the financial statements are free of material misstatement. An audit includes examining, on a test basis, evidence supporting the amounts and disclosures in the financial statements, assessing the accounting principles used and significant estimates made by management, and evaluating the overall financial statement presentation. We believe that our audit, which included confirmation of securities at April 30, 2016 by correspondence with the custodian, transfer agent and brokers, provide a reasonable basis for our opinion.
PricewaterhouseCoopers LLP
San Francisco, California
June 15, 2016
franklintempleton.com
Annual Report
55
FRANKLIN STRATEGIC SERIES
Tax Information (unaudited)
Under Section 852(b)(3)(C) of the Internal Revenue Code (Code), Franklin Biotechnology Discovery Fund hereby reports the maximum amount allowable but no less than $93,282,011 as long term capital gain dividends for the fiscal year ended April 30, 2016:
Under Section 871(k)(2)(C) of the Code, Franklin Biotechnology Discovery Fund hereby reports the maximum amount allowable but no less than $35,789,543 as short term capital gain dividends for the purposes of the tax imposed under Section 871(a)(1)(A) of the Code for the fiscal year ended April 30, 2016.
Under Section 854(b)(1)(A) of the Code, the Funds hereby report the following percentage amounts of the ordinary income dividends as income qualifying for the dividends received deduction for the fiscal year ended April 30, 2016:
| Franklin | |||
| Biotechnology | Franklin Natural | ||
| Discovery Fund | Resources Fund | ||
| 12.07 | % | 100.00 | % |
Under Section 854(b)(1)(B) of the Code, the Funds hereby report the maximum amount allowable but no less than the following amounts as qualified dividends for purposes of the maximum rate under Section 1(h)(11) of the Code for the fiscal year ended April 30, 2016:
| Franklin | |||
| Biotechnology | Franklin Natural | ||
| Discovery Fund | Resources Fund | ||
| $ | 4,337,860 | $ | 13,184,401 |
Distributions, including qualified dividend income, paid during calendar year 2016 will be reported to shareholders on Form 1099-DIV by mid-February 2017. Shareholders are advised to check with their tax advisors for information on the treatment of these amounts on their individual income tax returns.
56 Annual Report
franklintempleton.com
FRANKLIN STRATEGIC SERIES
Board Members and Officers
The name, year of birth and address of the officers and board members, as well as their affiliations, positions held with the Trust, principal occupations during at least the past five years and number of U.S. registered portfolios overseen in the Franklin Templeton Investments fund complex, are shown below. Generally, each board member serves until that person’s successor is elected and qualified.
| Independent Board Members | ||||
| Number of Portfolios in | ||||
| Name, Year of Birth | Length of | Fund Complex Overseen | Other Directorships Held During | |
| and Address | Position | Time Served | by Board Member* | at Least the Past 5 Years |
| Harris J. Ashton (1932) | Trustee | Since 1991 | 145 | Bar-S Foods (meat packing company) |
| One Franklin Parkway | (1981-2010). | |||
| San Mateo, CA 94403-1906 | ||||
| Principal Occupation During at Least the Past 5 Years: | ||||
| Director of various companies; and formerly, Director, RBC Holdings, Inc. (bank holding company) (until 2002); and President, Chief | ||||
| Executive Officer and Chairman of the Board, General Host Corporation (nursery and craft centers) (until 1998). | ||||
| Mary C. Choksi (1950) | Trustee | Since 2014 | 121 | Avis Budget Group Inc. (car rental) |
| One Franklin Parkway | (2007-present), Omnicom Group Inc. | |||
| San Mateo, CA 94403-1906 | (advertising and marketing | |||
| communications services) | ||||
| (2011-present) and H.J. Heinz | ||||
| Company (processed foods and allied | ||||
| products) (1998-2006). | ||||
| Principal Occupation During at Least the Past 5 Years: | ||||
| Senior Advisor, Strategic Investment Group (investment management group) (2015-present); director of various companies; and formerly, | ||||
| Founding Partner and Senior Managing Director, Strategic Investment Group (1987-2015); Founding Partner and Managing Director, | ||||
| Emerging Markets Management LLC (investment management firm) (1987-2011); and Loan Officer/Senior Loan Officer/Senior Pension | ||||
| Investment Officer, World Bank Group (international financial institution) (1977-1987). | ||||
| Edith E. Holiday (1952) | Trustee | Since 1998 | 145 | Hess Corporation (exploration and |
| One Franklin Parkway | refining of oil and gas) (1993-present), | |||
| San Mateo, CA 94403-1906 | Canadian National Railway (railroad) | |||
| (2001-present), White Mountains | ||||
| Insurance Group, Ltd. (holding | ||||
| company) (2004-present), RTI | ||||
| International Metals, Inc. (manufacture | ||||
| and distribution of titanium) | ||||
| (1999-2015) and H.J. Heinz Company | ||||
| (processed foods and allied products) | ||||
| (1994-2013). | ||||
| Principal Occupation During at Least the Past 5 Years: | ||||
| Director or Trustee of various companies and trusts; and formerly, Assistant to the President of the United States and Secretary of the | ||||
| Cabinet (1990-1993); General Counsel to the United States Treasury Department (1989-1990); and Counselor to the Secretary and Assistant | ||||
| Secretary for Public Affairs and Public Liaison – United States Treasury Department (1988-1989). | ||||
| J. Michael Luttig (1954) | Trustee | Since 2009 | 145 | Boeing Capital Corporation (aircraft |
| One Franklin Parkway | financing) (2006-2013). | |||
| San Mateo, CA 94403-1906 | ||||
| Principal Occupation During at Least the Past 5 Years: | ||||
| Executive Vice President, General Counsel and member of the Executive Council, The Boeing Company (aerospace company) | ||||
| (2006-present); and formerly, Federal Appeals Court Judge, U.S. Court of Appeals for the Fourth Circuit (1991-2006). | ||||
| Frank A. Olson (1932) | Trustee | Since 2007 | 145 | Hess Corporation (exploration and |
| One Franklin Parkway | refining of oil and gas) (1998-2013). | |||
| San Mateo, CA 94403-1906 | ||||
| Principal Occupation During at Least the Past 5 Years: | ||||
| Director of various companies; and formerly, Chairman of the Board, The Hertz Corporation (car rental) (1980-2000) and Chief Executive | ||||
| Officer (1977-1999); and Chairman of the Board, President and Chief Executive Officer, UAL Corporation (airlines) (June-December 1987). | ||||
franklintempleton.com
Annual Report
57
FRANKLIN STRATEGIC SERIES
| Independent Board Members (continued) | |||||
| Number of Portfolios in | |||||
| Name, Year of Birth | Length of | Fund Complex Overseen | Other Directorships Held During | ||
| and Address | Position | Time Served | by Board Member* | at Least the Past 5 Years | |
| Larry D. Thompson (1945) | Trustee | Since 2007 | 145 | The Southern Company (energy | |
| One Franklin Parkway | company) (2014-present; previously | ||||
| San Mateo, CA 94403-1906 | 2010-2012), Graham Holdings | ||||
| Company (education and media | |||||
| organization) (2011-present) and | |||||
| Cbeyond, Inc. (business | |||||
| communications provider) | |||||
| (2010-2012). | |||||
| Principal Occupation During at Least the Past 5 Years: | |||||
| Director of various companies; John A. Sibley Professor of Corporate and Business Law, University of Georgia School of Law (2015-present; | |||||
| previously 2011-2012); and formerly, Executive Vice President – Government Affairs, General Counsel and Corporate Secretary, PepsiCo, | |||||
| Inc. (consumer products) (2012-2014); Senior Vice President – Government Affairs, General Counsel and Secretary, PepsiCo, Inc. | |||||
| (2004-2011); Senior Fellow of The Brookings Institution (2003-2004); Visiting Professor, University of Georgia School of Law (2004); and | |||||
| Deputy Attorney General, U.S. Department of Justice (2001-2003). | |||||
| John B. Wilson (1959) | Lead | Trustee since | 121 | None | |
| One Franklin Parkway | Independent | 2006 and Lead | |||
| San Mateo, CA 94403-1906 | Trustee | Independent | |||
| Trustee | |||||
| since 2008 | |||||
| Principal Occupation During at Least the Past 5 Years: | |||||
| President, Staples Europe (office supplies) (2012-present); President and Founder, Hyannis Port Capital, Inc. (real estate and private equity | |||||
| investing); serves on private and non-profit boards; and formerly, Chief Operating Officer and Executive Vice President, Gap, Inc. (retail) | |||||
| (1996-2000); Chief Financial Officer and Executive Vice President – Finance and Strategy, Staples, Inc. (1992-1996); Senior Vice President – | |||||
| Corporate Planning, Northwest Airlines, Inc. (airlines) (1990-1992); and Vice President and Partner, Bain & Company (consulting firm) | |||||
| (1986-1990). | |||||
| Interested Board Members and Officers | |||||
| Number of Portfolios in | |||||
| Name, Year of Birth | Length of | Fund Complex Overseen | Other Directorships Held During | ||
| and Address | Position | Time Served | by Board Member* | at Least the Past 5 Years | |
| **Gregory E. Johnson (1961) | Trustee | Since 2013 | 160 | None | |
| One Franklin Parkway | |||||
| San Mateo, CA 94403-1906 | |||||
| Principal Occupation During at Least the Past 5 Years: | |||||
| Chairman of the Board, Member–Office of the Chairman, Director and Chief Executive Officer, Franklin Resources, Inc.; officer and/or director | |||||
| or trustee, as the case may be, of some of the other subsidiaries of Franklin Resources, Inc. and of 44 of the investment companies in Franklin | |||||
| Templeton Investments; Vice Chairman, Investment Company Institute; and formerly, President, Franklin Resources, Inc. (1994-2015). | |||||
| **Rupert H. Johnson, Jr. (1940) | Chairman of | Chairman of the | 145 | None | |
| One Franklin Parkway | the Board | Board since | |||
| San Mateo, CA 94403-1906 | and Trustee | 2013 | and | ||
| Trustee | |||||
| since 1991 | |||||
| Principal Occupation During at Least the Past 5 Years: | |||||
| Vice Chairman, Member – Office of the Chairman and Director, Franklin Resources, Inc.; Director, Franklin Advisers, Inc.; Senior Vice | |||||
| President, Franklin Advisory Services, LLC; and officer and/or director or trustee, as the case may be, of some of the other subsidiaries of | |||||
| Franklin Resources, Inc. and of 42 of the investment companies in Franklin Templeton Investments. | |||||
58 Annual Report
franklintempleton.com
FRANKLIN STRATEGIC SERIES
| Interested Board Members and Officers (continued) | ||||
| Number of Portfolios in | ||||
| Name, Year of Birth | Length of | Fund Complex Overseen | Other Directorships Held During | |
| and Address | Position | Time Served | by Board Member* | at Least the Past 5 Years |
| Alison E. Baur (1964) | Vice | Since 2012 | Not Applicable | Not Applicable |
| One Franklin Parkway | President | |||
| San Mateo, CA 94403-1906 | ||||
| Principal Occupation During at Least the Past 5 Years: | ||||
| Deputy General Counsel, Franklin Templeton Investments; and officer of some of the other subsidiaries of Franklin Resources, Inc. and of 45 | ||||
| of the investment companies in Franklin Templeton Investments. | ||||
| Laura F. Fergerson (1962) | Chief | Since 2009 | Not Applicable | Not Applicable |
| One Franklin Parkway | Executive | |||
| San Mateo, CA 94403-1906 | Officer – | |||
| Finance and | ||||
| Administration | ||||
| Principal Occupation During at Least the Past 5 Years: | ||||
| Senior Vice President, Franklin Templeton Services, LLC; Vice President, Franklin Advisers, Inc. and Franklin Templeton Institutional, LLC; | ||||
| and officer of 45 of the investment companies in Franklin Templeton Investments. | ||||
| Gaston Gardey (1967) | Treasurer, | Since 2009 | Not Applicable | Not Applicable |
| One Franklin Parkway | Chief | |||
| San Mateo, CA 94403-1906 | Financial | |||
| Officer and | ||||
| Chief | ||||
| Accounting | ||||
| Officer | ||||
| Principal Occupation During at Least the Past 5 Years: | ||||
| Treasurer, U.S. Fund Administration & Reporting, Franklin Templeton Investments; and officer of 28 of the investment companies in Franklin | ||||
| Templeton Investments. | ||||
| Aliya S. Gordon (1973) | Vice | Since 2009 | Not Applicable | Not Applicable |
| One Franklin Parkway | President | |||
| San Mateo, CA 94403-1906 | ||||
| Principal Occupation During at Least the Past 5 Years: | ||||
| Senior Associate General Counsel, Franklin Templeton Investments; and officer of 45 of the investment companies in Franklin Templeton | ||||
| Investments. | ||||
| Steven J. Gray (1955) | Vice | Since 2009 | Not Applicable | Not Applicable |
| One Franklin Parkway | President | |||
| San Mateo, CA 94403-1906 | ||||
| Principal Occupation During at Least the Past 5 Years: | ||||
| Senior Associate General Counsel, Franklin Templeton Investments; Vice President, Franklin Templeton Distributors, Inc. and Franklin | ||||
| Alternative Strategies Advisers, LLC; and officer of 45 of the investment companies in Franklin Templeton Investments. | ||||
| Robert Lim (1948) | Vice | Since May 2016 | Not Applicable | Not Applicable |
| One Franklin Parkway | President – | |||
| San Mateo, CA 94403-1906 | AML | |||
| Compliance | ||||
| Principal Occupation During at Least the Past 5 Years: | ||||
| Vice President, Franklin Templeton Companies, LLC; Chief Compliance Officer, Franklin Templeton Distributors, Inc. and Franklin Templeton | ||||
| Investor Services, LLC; and officer of 45 of the investment companies in Franklin Templeton Investments. | ||||
franklintempleton.com
Annual Report
59
FRANKLIN STRATEGIC SERIES
| Interested Board Members and Officers (continued) | ||||
| Number of Portfolios in | ||||
| Name, Year of Birth | Length of | Fund Complex Overseen | Other Directorships Held During | |
| and Address | Position | Time Served | by Board Member* | at Least the Past 5 Years |
| Edward B. Jamieson (1948) | President and | Since 2010 | Not Applicable | Not Applicable |
| One Franklin Parkway | Chief | |||
| San Mateo, CA 94403-1906 | Executive | |||
| Officer – | ||||
| Investment | ||||
| Management | ||||
| Principal Occupation During at Least the Past 5 Years: | ||||
| President, Chief Investment Officer and Director, Franklin Advisers, Inc.; Executive Vice President, Franklin Templeton Institutional, LLC; and | ||||
| officer and/or trustee, as the case may be, of some of the other subsidiaries of Franklin Resources, Inc. and of 10 of the investment companies | ||||
| in Franklin Templeton Investments. | ||||
| Christopher J. Molumphy (1962) Vice | Since 2000 | Not Applicable | Not Applicable | |
| One Franklin Parkway | President | |||
| San Mateo, CA 94403-1906 | ||||
| Principal Occupation During at Least the Past 5 Years: | ||||
| Director and Executive Vice President, Franklin Advisers, Inc.; Executive Vice President, Franklin Templeton Institutional, LLC; and officer of | ||||
| some of the other subsidiaries of Franklin Resources, Inc. and of 22 of the investment companies in Franklin Templeton Investments. | ||||
| Kimberly H. Novotny (1972) | Vice | Since 2013 | Not Applicable | Not Applicable |
| 300 S.E. 2nd Street | President | |||
| Fort Lauderdale, FL 33301-1923 | ||||
| Principal Occupation During at Least the Past 5 Years: | ||||
| Associate General Counsel, Franklin Templeton Investments; Vice President and Corporate Secretary, Fiduciary Trust International of the | ||||
| South; Vice President, Templeton Investment Counsel, LLC; Assistant Secretary, Franklin Resources, Inc.; and officer of 45 of the investment | ||||
| companies in Franklin Templeton Investments. | ||||
| Robert C. Rosselot (1960) | Chief | Since 2013 | Not Applicable | Not Applicable |
| 300 S.E. 2nd Street | Compliance | |||
| Fort Lauderdale, FL 33301-1923 | Officer | |||
| Principal Occupation During at Least the Past 5 Years: | ||||
| Director, Global Compliance, Franklin Templeton Investments; Vice President, Franklin Templeton Companies, LLC; officer of 45 of the | ||||
| investment companies in Franklin Templeton Investments; and formerly, Senior Associate General Counsel, Franklin Templeton Investments | ||||
| (2007-2013); and Secretary and Vice President, Templeton Group of Funds (2004-2013). | ||||
| Karen L. Skidmore (1952) | Vice | Since 2006 | Not Applicable | Not Applicable |
| One Franklin Parkway | President and | |||
| San Mateo, CA 94403-1906 | Secretary | |||
| Principal Occupation During at Least the Past 5 Years: | ||||
| Senior Associate General Counsel, Franklin Templeton Investments; and officer of 45 of the investment companies in Franklin Templeton | ||||
| Investments. | ||||
| Navid Tofigh (1972) | Vice | Since | Not Applicable | Not Applicable |
| One Franklin Parkway | President | November 2015 | ||
| San Mateo, CA 94403-1906 | ||||
| Principal Occupation During at Least the Past 5 Years: | ||||
| Associate General Counsel, Franklin Templeton Investments; and officer of 45 of the investment companies in Franklin Templeton | ||||
| Investments. | ||||
60 Annual Report
franklintempleton.com
FRANKLIN STRATEGIC SERIES
| Interested Board Members and Officers (continued) | ||||
| Number of Portfolios in | ||||
| Name, Year of Birth | Length of | Fund Complex Overseen | Other Directorships Held During | |
| and Address | Position | Time Served | by Board Member* | at Least the Past 5 Years |
| Craig S. Tyle (1960) | Vice | Since 2005 | Not Applicable | Not Applicable |
| One Franklin Parkway | President | |||
| San Mateo, CA 94403-1906 | ||||
| Principal Occupation During at Least the Past 5 Years: | ||||
| General Counsel and Executive Vice President, Franklin Resources, Inc.; and officer of some of the other subsidiaries of Franklin Resources, | ||||
| Inc. and of 45 of the investment companies in Franklin Templeton Investments. | ||||
| Lori A. Weber (1964) | Vice | Since 2011 | Not Applicable | Not Applicable |
| 300 S.E. 2nd Street | President | |||
| Fort Lauderdale, FL 33301-1923 | ||||
| Principal Occupation During at Least the Past 5 Years: | ||||
| Senior Associate General Counsel, Franklin Templeton Investments; Assistant Secretary, Franklin Resources, Inc.; Vice President and | ||||
| Secretary, Templeton Investment Counsel, LLC; and officer of 45 of the investment companies in Franklin Templeton Investments. | ||||
*We base the number of portfolios on each separate series of the U.S. registered investment companies within the Franklin Templeton Investments fund complex. These
portfolios have a common investment manager or affiliated investment managers.
**Gregory E. Johnson is considered to be an interested person of the Fund under the federal securities laws due to his position as an officer and director of Franklin
Resources, Inc. (Resources), which is the parent company of the Fund’s investment manager and distributor. Rupert H. Johnson, Jr. is considered to be an interested person
of the Fund under the federal securities laws due to his position as officer and director and major shareholder of Resources.
Note 1: Rupert H. Johnson, Jr. is the uncle of Gregory E. Johnson.
Note 2: Officer information is current as of the date of this report. It is possible that after this date, information about officers may change.
The Sarbanes-Oxley Act of 2002 and Rules adopted by the Securities and Exchange Commission require the Fund to disclose whether the Fund’s Audit
Committee includes at least one member who is an audit committee financial expert within the meaning of such Act and Rules. The Fund’s Board has determined
that there is at least one such financial expert on the Audit Committee and has designated John B. Wilson as its audit committee financial expert. The Board
believes that Mr. Wilson qualifies as such an expert in view of his extensive business background and experience, including service as chief financial officer of
Staples, Inc. from 1992 to 1996. Mr. Wilson has been a Member and Chairman of the Fund’s Audit Committee since 2006. As a result of such background and
experience, the Board believes that Mr. Wilson has acquired an understanding of generally accepted accounting principles and financial statements, the general
application of such principles in connection with the accounting estimates, accruals and reserves, and analyzing and evaluating financial statements that present
a breadth and level of complexity of accounting issues generally comparable to those of the Fund, as well as an understanding of internal controls and
procedures for financial reporting and an understanding of audit committee functions. Mr. Wilson is an independent Board member as that term is defined under
the relevant Securities and Exchange Commission Rules and Releases.
The Statement of Additional Information (SAI) includes additional information about the board members and is available, without charge, upon request.
Shareholders may call (800) DIAL BEN/342-5236 to request the SAI.
franklintempleton.com
Annual Report
61
FRANKLIN STRATEGIC SERIES
Shareholder Information
Board Review of Investment Management Agreement
At a meeting held April 12, 2016, the Board of Trustees (Board), including a majority of trustees that are not “interested persons” as such term is defined in section 2(a)(19) of the Investment Company Act of 1940 (hereinafter referred to as “non-interested Trustees” or “independent Trustees”), approved renewal of the investment management agreement for each of the separate funds within the Trust (Fund(s)). In reaching this decision, the Board took into account information furnished throughout the year at regular Board meetings, as well as information prepared specifically in connection with the annual renewal review process. Information furnished and discussed throughout the year included investment performance reports and related financial information for the Fund, along with periodic reports on expenses, shareholder services, legal and compliance matters, risk control, pricing, brokerage commissions and execution, and other services provided by the Investment Manager (Manager) and its affiliates, as well as marketing support payments made to financial intermediaries. Information furnished specifically in connection with the renewal process included a report for each Fund prepared by Broadridge Financial Solutions, Inc. (Broadridge), an independent organization, as well as additional material, including a Fund profitability analysis prepared by management. The Broadridge reports, which utilize data from Lipper, Inc. (Lipper), compared each Fund’s investment performance and expenses with those of other mutual funds deemed comparable to the Fund as selected by Lipper. The Fund profitability analysis discussed the profitability to Franklin Templeton Investments (FTI) from its overall U.S. fund operations, as well as on an individual fund-by-fund basis. Additional material accompanying such profitability analysis included information on a fund-by-fund basis listing portfolio managers and other accounts they manage, as well as information on management fees charged by the Manager and its affiliates to U.S. mutual funds and other accounts, including management’s explanation of differences where relevant. Such material also included a memorandum prepared by management describing project initiatives and capital investments relating to the services provided to the Funds by the FTI organization, as well as a memorandum relating to economies of scale and an analysis concerning transfer agent fees charged by an affiliate of the Manager. The Board also received a report on all marketing support payments made by FTI to financial intermediaries during the past year, as well as a memorandum relating to third-party servicing arrangements in response to a Guidance Update from the U.S. Securities and Exchange Commission (SEC) relating to mutual fund distribution and sub-accounting fees.
In considering such materials, the independent Trustees received assistance and advice from and met separately with independent counsel. While the investment management agreements for all Funds were considered at the same Board meeting, the Board dealt with each Fund separately. In approving continuance of the investment management agreement for each Fund, the Board, including a majority of independent Trustees, determined that the existing management fee structure was fair and reasonable and that continuance of the investment management agreement was in the best interests of such Fund and its shareholders. While attention was given to all information furnished, the following discusses some primary factors relevant to the Board’s decision.
NATURE, EXTENT AND QUALITY OF SERVICES. The Board was satisfied with the nature and quality of the overall services provided by the Manager and its affiliates to the Funds and their shareholders, except as noted later in the discussion of investment performance and expenses. The Board’s opinion was based, in part, upon periodic reports furnished it showing that the investment policies and restrictions for the Fund were consistently complied with as well as other reports periodically furnished the Board covering matters such as the compliance of portfolio managers and other management personnel with the code of ethics adopted throughout the Franklin Templeton fund complex, the adherence to fair value pricing procedures established by the Board, and the accuracy of net asset value calculations. The Board also noted the extent of benefits provided Fund shareholders from being part of the Franklin Templeton family of funds, including the right to exchange investments between the same class of shares of different funds without a sales charge, the ability to reinvest Fund dividends into other funds and the right to combine holdings in other funds to obtain a reduced sales charge. Favorable consideration was given to management’s continual efforts and expenditures in establishing effective business continuity plans and developing strategies to address cybersecurity threats. Additionally, the Board noted the Manager’s continued attention to pricing and valuation issues, particularly with respect to complex securities. Among other factors taken into account by the Board were the Manager’s best execution trading policies, including a favorable report by an independent portfolio trading analytical firm that also covered FOREX transactions. Consideration was also given to the experience of the Fund’s portfolio management team, the number of accounts managed and general method of compensation. In this latter respect, the Board noted that a primary factor in management’s determination of a portfolio manager’s bonus compensation was the relative investment performance of the funds he or she managed and that a portion
62 Annual Report
franklintempleton.com
FRANKLIN STRATEGIC SERIES
SHAREHOLDER INFORMATION
of such bonus was required to be invested in a pre-designated list of funds within such person’s fund management area so as to be aligned with the interests of shareholders. The Board also took into account the quality of transfer agent and shareholder services provided Fund shareholders by an affiliate of the Manager and steps taken by FTI to enhance analytical support to the investment management groups and provide additional oversight of liquidity risk and complex securities. The Board also took into account, among other things, management’s efforts in establishing a global credit facility for the benefit of the Fund and other accounts managed by FTI to provide a source of cash for temporary and emergency purposes or to meet unusual redemption requests as well as the strong financial position of the Manager’s parent company and its commitment to the mutual fund business as evidenced by its continued introduction of new funds and reassessment of the fund offerings in response to the market environment.
INVESTMENT PERFORMANCE. The Board placed significant emphasis on the investment performance of the Fund in view of its importance to shareholders. While consideration was given to performance reports and discussions with portfolio managers at Board meetings throughout the year, particular attention in assessing performance was given to the Broadridge reports furnished for the agreement renewals. The Broadridge reports prepared for each Fund showed the investment performance of its Class A shares in comparison to a performance universe selected by Lipper. Comparative performance for each Fund was shown for the oneyear period ended January 31, 2016, and previous periods ended that date of up to 10 years depending on when a particular Fund commenced operations. The following summarizes the performance results for each of these Funds and the Board’s view of such performance.
Franklin Biotechnology Discovery Fund – The performance universe for this Fund consisted of the Fund and all retail and institutional health/biotechnology funds as selected by Lipper. The Broadridge report showed the Fund’s total return for the one-year period to be in the lowest performing quintile of its performance universe, and on an annualized basis to be in the secondhighest performing quintile of such universe for the previous three- and 10-year periods and the highest performing quintile of such universe for the previous five-year period. The Board found the Fund’s investment performance as set forth in the Broadridge report to be acceptable, noting its more favorable long term performance and observing that its annualized three- and five-year total returns exceeded 19% and 20%, respectively.
Franklin Natural Resources Fund – The performance universe for this Fund consisted of the Fund and all retail and institutional global natural resources funds as selected by Lipper. The Broad-ridge report comparison for the Fund showed its total return for the one-year period to be in the second-lowest performing quin-tile of its performance universe, and on an annualized basis to also be in the second-lowest performing quintile of such universe for the previous three- and five-year periods, and the middle performing quintile of such universe for the previous 10-year period. The Board discussed with management the relative underperformance of the Fund, the reasons for that underperformance and steps being taken to address it. The Board determined that a portfolio management change was not required in light of management’s ongoing attention to the Fund, but it would continue to monitor the Fund.
COMPARATIVE EXPENSES. Consideration was given to the management fees and total expense ratio of each Fund compared with those of a group of other funds selected by Lipper as its appropriate Lipper expense group. Lipper expense data is based upon information taken from each fund’s most recent annual report, which reflects historical asset levels that may be quite different from those currently existing, particularly in a period of market volatility. While recognizing such inherent limitation and the fact that expense ratios generally increase as assets decline and decrease as assets grow, the Board believed the independent analysis conducted by Lipper to be an appropriate measure of comparative expenses. In reviewing comparative costs, Lipper provides information on each Fund’s contractual investment management fee in comparison with the investment management fee that would have been charged by other funds within its Lipper expense group assuming they were similar in size to the Fund, as well as the actual total expense ratio of each Fund in comparison with those of its Lipper expense group. The Lipper contractual investment management fee analysis includes administrative charges as being part of the investment management fee, and actual total expenses, for comparative consistency, are shown by Lipper for Fund Class A shares for funds with multiple classes of shares. The results of such expense comparisons showed the contractual investment management fee rates and actual total expense ratios for each of Franklin Natural Resources Fund and Franklin Biotechnology Discovery Fund, to be in the least expensive quintile of their respective Lipper expense groups. The Board was satisfied with the contractual management fee rate and total expense ratio of each of these Funds in comparison to their respective expense groups as shown in the Broadridge reports.
Annual Report
63
FRANKLIN STRATEGIC SERIES
SHAREHOLDER INFORMATION
MANAGEMENT PROFITABILITY. The Board also considered the level of profits realized by the Manager and its affiliates in connection with the operation of each Fund. In this respect, the Board reviewed the Fund profitability analysis that addresses the overall profitability of Franklin Templeton’s U.S. fund business, as well as its profits in providing management and other services to each of the individual funds during the 12-month period ended September 30, 2015, being the most recent fiscal year end for Franklin Resources, Inc., the Manager’s parent. In reviewing the analysis, the Board recognized that allocation methodologies are inherently subjective and various allocation methodologies may be reasonable while producing different results. In this respect, the Board noted that while management continually makes refinements to its methodologies in response to organizational and product related changes, the overall approach as defined by the primary drivers and activity measurements has remained consistent with that used in the Funds’ profitability report presentations from prior years. Additionally, the Funds’ independent registered public accounting firm had been engaged by the Manager to periodically review the reasonableness of the allocation methodologies to be used solely by the Funds’ Board in reference to the profitability analysis. In reviewing and discussing such analysis, management discussed with the Board its belief that costs incurred in establishing the infrastructure necessary for the type of mutual fund operations conducted by the Manager and its affiliates may not be fully reflected in the expenses allocated to each Fund in determining its profitability, as well as the fact that the level of profits, to a certain extent, reflected operational cost savings and efficiencies initiated by management. The Board also took into account management’s expenditures in improving shareholder services provided the Funds, as well as the need to implement systems and meet additional regulatory and compliance requirements resulting from statutes such as the Sarbanes-Oxley and Dodd-Frank Acts and recent SEC and other regulatory requirements. In addition, the Board considered a third-party study comparing the profitability of the Manager’s parent on an overall basis to other publicly held managers broken down to show profitability from management operations exclusive of distribution expenses, as well as profitability including distribution expenses. The Board also considered the extent to which the Manager and its affiliates might derive ancillary benefits from fund operations, including revenues generated from transfer agent services, potential benefits resulting from personnel and systems enhancements necessitated by fund growth, as well as increased leverage with the service providers and counterparties, allocation of fund brokerage and the use of commission dollars to pay for research. Based upon its consideration of all these factors, the Board determined that the level of profits realized by the Manager and its affiliates from providing services to each Fund was not excessive in view of the nature, quality and extent of services provided.
ECONOMIES OF SCALE. The Board also considered whether economies of scale are realized by the Manager as the Funds grow larger and the extent to which this is reflected in the level of management fees charged. While recognizing that any precise determination is inherently subjective, the Board noted that based upon the Fund profitability analysis, it appears that as some funds get larger, at some point economies of scale do result in the Manager realizing a larger profit margin on management services provided such a fund. The Board noted that economies of scale were shared with each Fund and its shareholders through management fee breakpoints so that as a fund grows in size, its effective management fee rate declines. The fee structure under the investment management agreement for each Fund contains breakpoints that continued to asset levels that exceeded its asset size at December 31, 2015. In view of such fee structure and the favorable expense comparisons of each Fund within its respective expense group, the Board believed that to the extent economies of scale may be realized by the Manager of the Funds and its affiliates, that there was a sharing of benefits with the Funds and their shareholders.
Proxy Voting Policies and Procedures
The Trust’s investment manager has established Proxy Voting Policies and Procedures (Policies) that the Trust uses to determine how to vote proxies relating to portfolio securities. Shareholders may view the Trust’s complete Policies online at franklintempleton.com. Alternatively, shareholders may request copies of the Policies free of charge by calling the Proxy Group collect at (954) 527-7678 or by sending a written request to: Franklin Templeton Companies, LLC, 300 S.E. 2nd Street, Fort Lauderdale, FL 33301, Attention: Proxy Group. Copies of the Trust’s proxy voting records are also made available online at franklintempleton.com and posted on the U.S. Securities and Exchange Commission’s website at sec.gov and reflect the most recent 12-month period ended June 30.
| 64 | Annual Report |
FRANKLIN STRATEGIC SERIES
SHAREHOLDER INFORMATION
Quarterly Statement of Investments
The Trust files a complete statement of investments with the U.S. Securities and Exchange Commission for the first and third quarters for each fiscal year on Form N-Q. Shareholders may view the filed Form N-Q by visiting the Commission’s website at sec.gov. The filed form may also be viewed and copied at the Commission’s Public Reference Room in Washington, DC. Information regarding the operations of the Public Reference Room may be obtained by calling (800) SEC-0330.
Householding of Reports and Prospectuses
You will receive each Fund’s financial reports every six months as well as an annual updated summary prospectus (prospectus available upon request). To reduce Fund expenses, we try to identify related shareholders in a household and send only one copy of the financial reports and summary prospectus. This process, called “householding,” will continue indefinitely unless you instruct us otherwise. If you prefer not to have these documents householded, please call us at (800) 632-2301. At any time you may view current prospectuses/summary prospectuses and financial reports on our website. If you choose, you may receive these documents through electronic delivery.
Annual Report
65
This page intentionally left blank
This page intentionally left blank
This page intentionally left blank
| Contents | |
| Annual Report | |
| Franklin Flexible Alpha Bond Fund | 3 |
| Performance Summary | 7 |
| Your Fund’s Expenses | 12 |
| Financial Highlights and Statement of Investments | 14 |
| Financial Statements | 27 |
| Notes to Financial Statements | 31 |
| Report of Independent Registered | |
| Public Accounting Firm | 43 |
| Tax Information | 44 |
| Board Members and Officers | 45 |
| Shareholder Information | 50 |
Visit franklintempleton.com for fund updates, to access your account, or to find helpful financial planning tools.
2 Annual Report
franklintempleton.com
Annual Report
Franklin Flexible Alpha Bond Fund
This annual report for Franklin Flexible Alpha Bond Fund covers the period since the Fund’s inception on August 3, 2015, through April 30, 2016.
Your Fund’s Goal and Main Investments
The Fund seeks to provide total return through a combination of current income and capital appreciation by investing at least 80% of its net assets in bonds and investments that provide exposure to bonds, including global debt obligations of any credit quality, maturity or duration, all varieties of fixed income, variable rate and floating rate debt securities and investments, and derivatives. The Fund aims to provide attractive risk-adjusted total returns over a full market cycle. A full market cycle is a period of time that spans a full business and economic cycle, which may include periods of rising and declining interest rates.
What is duration?
Duration is a measure of a bond’s price sensitivity to interest rate changes. In general, a portfolio of securities with a lower duration can be expected to be less sensitive to interest rate changes than a portfolio with a higher duration.
Performance Overview
The Fund’s Class A shares had a -0.34% cumulative total return for the period since the Fund’s inception. In comparison, the LIBOR USD 3-Month Rate Index posted a +0.37% total return.1 The index tracks the interest rate at which banks offer to lend to one another in the wholesale money markets in London and is used to set the cost of various variable-rate loans. You can find more of the Fund’s performance data in the Performance Summary beginning on page 7.
Performance data represent past performance, which does not guarantee future results. Investment return and principal value will fluctuate, and you may have a gain or loss when you sell your shares. Current performance may differ from figures shown. For most recent month-end performance, go to franklintempleton.com or call (800) 342-5236.
| Sector Exposure* | ||
| 4/30/16 | ||
| % of Total | ||
| Investment-Grade Corporate Securities | 23.4 | % |
| Cash & Cash Equivalents | 18.4 | % |
| Residential Mortgage-Backed Securities | 10.3 | % |
| International Bonds | 9.1 | % |
| Floating Rate Loans | 8.1 | % |
| Commercial Mortgage-Backed Securities | 7.1 | % |
| U.S. Treasuries | 5.5 | % |
| Municipal Bonds | 4.9 | % |
| Asset-Backed Securities | 3.3 | % |
| Agency Mortgage-Backed Securities | 2.4 | % |
| Other | 0.0 | %** |
| High Yield Corporate Securities | -1.7 | % |
| Interest-Rate Derivatives | -36.6 | % |
*Sector Exposure is intended to estimate the portfolio’s exposure to various sectors,
including any hedged or increased exposure through certain derivatives held in the
portfolio (or their underlying reference assets) and may not total 100% or may be
negative due to rounding, use of any derivatives, unsettled trades or other factors.
Interest-Rate Derivatives sector consists of Treasury, interest rate and other
derivatives that are primarily used for duration management; a negative number
indicates that the Fund is seeking to hedge interest rate risk.
**Rounds to less than 0.1%.
Economic and Market Overview
The U.S. economy moderated during the period under review. After strengthening in 2015’s second quarter, the economy moderated in the third and fourth quarters. Growth slowed further in 2016’s first quarter as exports, business investment and federal government spending declined. The manufacturing sector expanded in March and April after contracting for five consecutive months, while the services sector expanded throughout the period. Growth in services contributed to new jobs and helped the unemployment rate to be largely stable and end the period at 5.0%.2 Home sales and prices rose amid relatively low mortgage rates. Monthly retail sales grew during most of the review period and rose to the highest level in April in more than a year, driven mainly by automobile sales.
1. Source: Bloomberg LP.
The index is unmanaged and includes reinvestment of any income or distributions. It does not reflect any fees, expenses or sales charges. One cannot invest directly in an
index, and an index is not representative of the Fund’s portfolio.
2. Source: Bureau of Labor Statistics.
See www.franklintempletondatasources.com for additional data provider information.
The dollar value, number of shares or principal amount, and names of all portfolio holdings are listed in the Fund’s Statement of Investments (SOI). The SOI
begins on page 19.
franklintempleton.com
Annual Report
3
FRANKLIN FLEXIBLE ALPHA BOND FUND
| Dividend Distributions* | |||||
| 8/3/15–4/30/16 | |||||
| Dividend per Share (cents) | |||||
| Advisor | |||||
| Month | Class A | Class C | Class R | Class R6 | Class |
| August | 0.1214 | 0.1227 | 0.1190 | 0.1460 | 0.1193 |
| September | 1.0580 | 1.0572 | 1.0540 | 1.1660 | 1.0625 |
| October | 0.8881 | 0.8876 | 0.8870 | 0.9820 | 0.8882 |
| November | 0.8747 | 0.6462 | 0.7260 | 1.0980 | 1.0197 |
| December** | 4.0508 | 3.7425 | 3.8350 | 4.2540 | 4.1497 |
| January | 1.0572 | 0.6443 | 0.7430 | 1.1530 | 1.0660 |
| February | 0.8254 | 0.4844 | 0.5690 | 0.9040 | 0.8310 |
| March | — | — | — | — | — |
| April | 0.6955 | 0.5075 | 0.5460 | 0.7370 | 0.7057 |
| Total | 9.5711 | 8.0924 | 8.4790 | 10.4400 | 9.8421 |
*The distribution amount is the sum of the dividend payments to shareholders for the
period shown and includes only estimated tax-basis net investment income.
Assumes shares were purchased and held for the entire accrual period. Since divi-
dends accrue daily, your actual distributions will vary depending on the date you
purchased your shares and any account activity. All Fund distributions will vary
depending upon current market conditions, and past distributions are not indicative
of future trends.
**Includes an additional 3.05 cent per share distribution to meet excise tax requirements.
Inflation, as measured by the Consumer Price Index, remained relatively subdued due to low energy prices.
After maintaining a near-zero interest rate for seven years to support the U.S. economy’s recovery, the Federal Reserve (Fed) raised its target range for the federal funds rate to 0.25%–0.50% at its December meeting. At the time of the increase, policy-makers cited the labor market’s considerable improvement and were reasonably confident that inflation would move back to the Fed’s 2.00% medium-term objective. The Fed maintained the rate through period-end, indicating it would monitor domestic and global developments and their implications on the labor markets as it tracks actual and expected progression toward its employment and inflation goals.
The 10-year Treasury yield, which moves inversely to price, shifted throughout the period. It rose from 2.16% on August 3, 2015, to a period high of 2.36% in November, and remained relatively high through the rest of 2015, based partly on upbeat domestic and eurozone economic data as well as the Fed’s interest rate increase. However, the yield declined in 2016 and ended the period at 1.83% due to the Fed’s cautious stance on further interest rate increases, investor concerns about domestic and global economic growth and weak oil and commodity prices.
| Currency Breakdown* | ||
| 4/30/16 | ||
| % of Total | ||
| North America | 104.9 | % |
| US Dollar | 105.6 | % |
| Canadian Dollar | -0.7 | % |
| Asia | 0.1 | % |
| Indian Rupee | 0.4 | % |
| Indonesian Rupiah | 0.2 | % |
| Malaysian Ringgit | 0.1 | % |
| Singapore Dollar | -0.2 | % |
| South Korean Won | -0.2 | % |
| Japanese Yen | -0.3 | % |
| Latin America & Caribbean | 0.0 | %** |
| Mexican Peso | 0.5 | % |
| Chilean Peso | -0.5 | % |
| Africa | -0.3 | % |
| South African Rand | -0.3 | % |
| Europe | -2.3 | % |
| Polish Zloty | -0.2 | % |
| Swedish Krona | -0.2 | % |
| Euro | -1.8 | % |
| Australia & New Zealand | -2.4 | % |
| New Zealand Dollar | 0.0 | %** |
| Australian Dollar | -2.3 | % |
*Currency Breakdown is intended to estimate the portfolio’s exposure to various
currencies, including any hedged or increased exposure through certain derivatives
held in the portfolio (or their underlying reference assets) and may not total 100% or
may be negative due to rounding, use of any derivatives, unsettled trades or other
factors.
**Rounds to less than 0.1%.
Investment Strategy
The Fund seeks to generate returns from various sources, other than solely from interest rates, by allocating its portfolio across various risks (such as credit, currency and duration risks). In employing this strategy, the Fund has the flexibility to invest across all debt asset classes without regard to country, sector, quality, maturity or duration and without reference to a benchmark index.
The Fund may engage in active and frequent trading as part of its investment strategies and, at any given time, may have a substantial amount of its assets invested in any class of debt securities, including, but not limited to: U.S. government and agency securities; foreign government and supranational debt securities; corporate bonds; corporate loans (and loan participations); collateralized debt and loan obligations; preferred securities; various types of mortgage-backed securities
4 Annual Report
franklintempleton.com
FRANKLIN FLEXIBLE ALPHA BOND FUND
and other asset-backed securities; municipal securities; and derivatives and other instruments with similar economic characteristics, or that provide exposure, to such debt securities.
Manager’s Discussion
During the period under review, the Fund’s yield curve and duration positioning, as well as basis trades (taking opposing long and short positions in the two securities to profit from the convergence of their values), were the primary contributors to performance. In addition, the Fund’s exposure to commercial mortgage-backed securities (CMBS), residential mortgage-backed securities (RMBS) and non-agency mortgage-backed securities also contributed to performance. The Fund’s exposure to senior floating rate loans (through an investment in an ETF) and municipal bonds were also positive contributors. In contrast, the Fund’s foreign currency exposure was a major detractor from performance. Our limited exposure to the high yield corporate bond sector and our overweighting to the investment-grade corporate bond sector also hindered results. Additionally, the Fund’s exposure to Treasury Inflation Protected Securities (TIPS) detracted slightly over the period.
What is a yield curve?
The yield curve is a line that plots the interest rates, at a set point in time, of bonds having equal credit quality but differing maturity dates. The most frequently reported yield curve compares three-month, two-year and 30-year U.S. Treasury debt.
At period-end, we remained overweighted to the investment-grade corporate bond sector as well as securitized sectors including RMBS and CMBS. We continued to find what we considered value in credit hedged corporate positions as well. We sought to hedge all of the high yield corporate beta (or risk) in the Fund, although we retained exposure to select corporate loans and collateralized loan obligations. We also retained positions in TIPS as well as municipal bonds. The portfolio maintained several currency positions although they did not represent a significant portion of the Fund’s risk allocation.
The Fund utilized derivatives, including credit default and interest rate swaps, currency forwards, Treasury futures, and currency, interest rate swap and credit default swap options, principally as a tool for efficient portfolio management and to manage overall portfolio risk. These derivative transactions may provide the same, or similar, net long or short exposure to select currencies, interest rates, countries, duration or credit risks in a less expensive way than by directly purchasing securities. In markets where portfolio securities are readily available, the cost difference during normal market conditions may be small.
What are swap agreements?
Swap agreements, such as interest rate, currency and credit default swaps, are contracts between the Fund and another party (the swap counterparty). In a basic swap transaction, the Fund agrees with the swap counterparty to exchange the returns (or differentials in rates of return) earned or realized on a particular “notional amount” of underlying instruments. The notional amount is the set amount selected by the parties as the basis on which to calculate the obligations that they have agreed to exchange. The parties typically do not actually exchange the notional amount. Instead, they agree to exchange the returns that would be earned or realized if the notional amount were invested in given instruments or at given interest rates.
What is a currency forward contract?
A currency forward contract is an agreement between the Fund and a counterparty to buy or sell a foreign currency in exchange for another currency at a specific exchange rate on a future date.
What is a futures contract?
A futures contract is an agreement between the Fund and a counterparty made through a U.S. or foreign futures exchange to buy or sell an asset at a specific price on a future date.
What is an option?
An option is a contract to buy or sell a specific financial product known as the option’s underlying instrument at a specific price. The buyer of an option has the right, but not the obligation, to buy or sell the underlying instrument at or until a specified expiration date. Conversely, the seller (“writer”) of an option who opens a transaction is obligated to buy or sell the underlying instrument should the option holder exercise that right.
franklintempleton.com
Annual Report 5
FRANKLIN FLEXIBLE ALPHA BOND FUND
Thank you for your participation in Franklin Flexible Alpha Bond Fund. We look forward to serving your future investment needs.

The foregoing information reflects our analysis, opinions and portfolio holdings as of April 30, 2016, the end of the reporting period. The way we implement our main investment strategies and the resulting portfolio holdings may change depending on factors such as market and economic conditions. These opinions may not be relied upon as investment advice or an offer for a particular security. The information is not a complete analysis of every aspect of any market, country, industry, security or the Fund. Statements of fact are from sources considered reliable, but the investment manager makes no representation or warranty as to their completeness or accuracy. Although historical performance is no guarantee of future results, these insights may help you understand our investment management philosophy.
CFA® is a trademark owned by CFA Institute.
6 Annual Report
franklintempleton.com
FRANKLIN FLEXIBLE ALPHA BOND FUND
Performance Summary as of April 30, 2016
Your dividend income will vary depending on dividends or interest paid by securities in the Fund’s portfolio, adjusted for operating expenses of each class. Capital gain distributions are net profits realized from the sale of portfolio securities. The performance tables and graphs do not reflect any taxes that a shareholder would pay on Fund dividends, capital gain distributions, if any, or any realized gains on the sale of Fund shares. Total return reflects reinvestment of the Fund’s dividends and capital gain distributions, if any, and any unrealized gains or losses.
| Net Asset Value | ||||||
| Share Class (Symbol) | 4/30/16 | 8/3/15 | Change | |||
| A (FABFX) | $ | 9.88 | $ | 10.00 | -$ | 0.12 |
| C (FABDX) | $ | 9.86 | $ | 10.00 | -$ | 0.14 |
| R (FABMX) | $ | 9.86 | $ | 10.00 | -$ | 0.14 |
| R6 (FABNX) | $ | 9.88 | $ | 10.00 | -$ | 0.12 |
| Advisor (FZBAX) | $ | 9.88 | $ | 10.00 | -$ | 0.12 |
| Distributions1 (8/3/15–4/30/16) | ||
| Dividend | ||
| Share Class | Income | |
| A | $ | 0.095711 |
| C | $ | 0.080924 |
| R | $ | 0.084790 |
| R6 | $ | 0.104400 |
| Advisor | $ | 0.098421 |
See page 11 for Performance Summary footnotes.
franklintempleton.com
Annual Report
7
FRANKLIN FLEXIBLE ALPHA BOND FUND
PERFORMANCE SUMMARY
Performance as of 4/30/162
Cumulative total return excludes sales charges. Average annual total returns include maximum sales charges. Class A: 4.25% maximum initial sales charge; Class C: 1% contingent deferred sales charge in first year only; Class R/R6/Advisor Class: no sales charges.
| Cumulative | Average Annual | Average Annual | Total Annual Operating Expenses6 | |||||||
| Share Class | Total Return3 | Total Return4 | Total Return (3/31/16)5 | (with waiver) | (without waiver) | |||||
| A | 1.10 | % | 1.82 | % | ||||||
| Since Inception (8/3/15) | -0.34 | % | -4.54 | % | -4.90 | % | ||||
| C | 1.50 | % | 2.22 | % | ||||||
| Since Inception (8/3/15) | -0.69 | % | -1.68 | % | -1.93 | % | ||||
| R | 1.35 | % | 2.07 | % | ||||||
| Since Inception (8/3/15) | -0.65 | % | -0.65 | % | -1.01 | % | ||||
| R6 | 0.71 | % | 1.43 | % | ||||||
| Since Inception (8/3/15) | -0.15 | % | -0.15 | % | -0.53 | % | ||||
| Advisor | 0.85 | % | 1.57 | % | ||||||
| Since Inception (8/3/15) | -0.31 | % | -0.31 | % | -0.69 | % | ||||
| Distribution | 30-Day Standardized Yield8 | |||||||||
| Share Class | Rate7 | (with waiver) | (without waiver) | |||||||
| A | 0.82 | % | 1.27 | % | -2.35 | % | ||||
| C | 0.63 | % | 0.72 | % | -3.07 | % | ||||
| R | 0.67 | % | 0.85 | % | -2.93 | % | ||||
| R6 | 0.91 | % | 1.49 | % | -2.28 | % | ||||
| Advisor | 0.87 | % | 1.37 | % | -2.43 | % | ||||
Performance data represent past performance, which does not guarantee future results. Investment return and principal value will fluctuate, and you may have a gain or loss when you sell your shares. Current performance may differ from figures shown. For most recent month-end performance, go to franklintempleton.com or call (800) 342-5236.
See page 11 for Performance Summary footnotes.
8 Annual Report
franklintempleton.com
FRANKLIN FLEXIBLE ALPHA BOND FUND
PERFORMANCE SUMMARY
Total Return Index Comparison for a Hypothetical $10,000 Investment2
Total return represents the change in value of an investment over the period shown. It includes any applicable maximum sales charge, Fund expenses, account fees and reinvested distributions. The unmanaged index includes reinvestment of any income or distributions. It differs from the Fund in composition and does not pay management fees or expenses. One cannot invest directly in an index.
See page 11 for Performance Summary footnotes.
franklintempleton.com
Annual Report 9
FRANKLIN FLEXIBLE ALPHA BOND FUND
PERFORMANCE SUMMARY
Total Return Index Comparison for a Hypothetical $10,000 Investment2 (continued)
See page 11 for Performance Summary footnotes.
10 Annual Report
franklintempleton.com
FRANKLIN FLEXIBLE ALPHA BOND FUND
PERFORMANCE SUMMARY
Total Return Index Comparison for a Hypothetical $10,000 Investment2 (continued)
All investments involve risks, including possible loss of principal. Changes in the financial strength of a bond issuer or in a bond’s credit rating may affect its value. Interest rate movements and mortgage prepayments will affect the Fund’s share price and yield. Bond prices generally move in the opposite direction of interest rates. Thus, as the prices of bonds in the Fund adjust to a rise in interest rates, the Fund’s share price may decline. The risks associated with higher yielding, lower rated securities (commonly called junk bonds) include higher risk of default and loss of principal. Derivatives, including currency management strategies, involve costs and can create economic leverage in the portfolio, which may result in significant volatility and cause the Fund to participate in losses (as well as enable gains) in an amount that exceeds the Fund’s initial investment. The Fund may not achieve the anticipated benefits, and may realize losses when a counterparty fails to perform as intended. Investments in foreign securities involve risks such as currency fluctuations, and political and economic uncertainty. The Fund is actively managed but there is no guarantee that the manager’s investment decisions will produce the desired results. The Fund’s prospectus also includes a description of the main investment risks.
| Class C: | These shares have higher annual fees and expenses than Class A shares. |
| Class R: | Shares are available to certain eligible investors as described in the prospectus. These shares have higher annual fees and expenses than Class A shares. |
| Class R6: | Shares are available to certain eligible investors as described in the prospectus. |
| Advisor Class: | Shares are available to certain eligible investors as described in the prospectus. |
1. The distribution amount is the sum of the dividend payments to shareholders for the period shown and includes only estimated tax-basis net investment income.
2. The Fund has an expense reduction contractually guaranteed through at least 8/31/16 and a fee waiver associated with any investment in a Franklin Templeton money fund,
contractually guaranteed through at least its current fiscal year-end. The transfer agent has contractually agreed to cap transfer agency fees for Class R6 shares so that trans-
fer agency fees for that class do not exceed 0.01% until at least 8/31/16. Fund investment results reflect the expense reduction, fee waiver and fee cap, to the extent
applicable; without these reductions, the results would have been lower.
3. Cumulative total return represents the change in value of an investment over the period indicated.
4. Average annual total return represents the average annual change in value of an investment over the period indicated. Return for less than one year, if any, has not been
annualized.
5. In accordance with SEC rules, we provide standardized total return information through the latest calendar quarter.
6. Figures are as stated in the Fund’s current prospectus and may differ from the expense ratios disclosed in the Financial Highlights in this report. In periods of market vola-
tility, assets may decline significantly, causing total annual Fund operating expenses to become higher than the figures shown.
7. Distribution rate is based on an annualization of the sum of the respective class’s past 30 days’ daily distributions and the maximum offering price (NAV for Classes C, R,
R6 and Advisor) per share on 4/30/16.
8. The Fund’s 30-day standardized yield is calculated over a trailing 30-day period using the yield to maturity on bonds and/or the dividends accrued on stocks. It may not
equal the Fund’s actual income distribution rate, which reflects the Fund’s past dividends paid to shareholders.
9. Source: Bloomberg LP. The LIBOR USD 3-Month Rate Index tracks the interest rate at which banks offer to lend to one another in the wholesale money markets in London
and is used to set the cost of various variable-rate loans.
See www.franklintempletondatasources.com for additional data provider information.
franklintempleton.com
Annual Report
11
FRANKLIN FLEXIBLE ALPHA BOND FUND
Your Fund’s Expenses
As a Fund shareholder, you can incur two types of costs:
- Transaction costs, including sales charges (loads) on Fund purchases; and
- Ongoing Fund costs, including management fees, distribution and service (12b-1) fees, and other Fund expenses. All mutual funds have ongoing costs, sometimes referred to as operat- ing expenses.
The following table shows ongoing costs of investing in the Fund and can help you understand these costs and compare them with those of other mutual funds. The table assumes a $1,000 investment held for the six months indicated.
Actual Fund Expenses
The first line (Actual) for each share class listed in the table provides actual account values and expenses. The “Ending Account Value” is derived from the Fund’s actual return, which includes the effect of Fund expenses.
You can estimate the expenses you paid during the period by following these steps. Of course, your account value and expenses will differ from those in this illustration:
1. Divide your account value by $1,000.
If an account had an $8,600 value, then $8,600 ÷ $1,000 = 8.6.
2. Multiply the result by the number under the heading “Expenses Paid During Period.”
If Expenses Paid During Period were $7.50, then 8.6 × $7.50 = $64.50.
In this illustration, the estimated expenses paid this period are $64.50.
Hypothetical Example for Comparison with Other Funds
Information in the second line (Hypothetical) for each class in the table can help you compare ongoing costs of investing in the Fund with those of other mutual funds. This information may not be used to estimate the actual ending account balance or expenses you paid during the period. The hypothetical “Ending Account Value” is based on the actual expense ratio for each class and an assumed 5% annual rate of return before expenses, which does not represent the Fund’s actual return. The figure under the heading “Expenses Paid During Period” shows the hypothetical expenses your account would have incurred under this scenario. You can compare this figure with the 5% hypothetical examples that appear in shareholder reports of other funds.
Please note that expenses shown in the table are meant to highlight ongoing costs and do not reflect any transaction costs, such as sales charges. Therefore, the second line for each class is useful in comparing ongoing costs only, and will not help you compare total costs of owning different funds. In addition, if transaction costs were included, your total costs would have been higher. Please refer to the Fund prospectus for additional information on operating expenses.
12 Annual Report
franklintempleton.com
FRANKLIN FLEXIBLE ALPHA BOND FUND
YOUR FUND’S EXPENSES
| Beginning Account | Ending Account | Expenses Paid During | ||||
| Share Class | Value 11/1/15 | Value 4/30/16 | Period* 11/1/15–4/30/16 | |||
| A | ||||||
| Actual | $ | 1,000 | $ | 999.50 | $ | 3.63 |
| Hypothetical (5% return before expenses) | $ | 1,000 | $ | 1,021.23 | $ | 3.67 |
| C | ||||||
| Actual | $ | 1,000 | $ | 996.00 | $ | 6.35 |
| Hypothetical (5% return before expenses) | $ | 1,000 | $ | 1,018.50 | $ | 6.42 |
| R | ||||||
| Actual | $ | 1,000 | $ | 996.40 | $ | 5.76 |
| Hypothetical (5% return before expenses) | $ | 1,000 | $ | 1,019.10 | $ | 5.82 |
| R6 | ||||||
| Actual | $ | 1,000 | $ | 1,000.20 | $ | 3.18 |
| Hypothetical (5% return before expenses) | $ | 1,000 | $ | 1,021.68 | $ | 3.22 |
| Advisor | ||||||
| Actual | $ | 1,000 | $ | 998.80 | $ | 3.23 |
| Hypothetical (5% return before expenses) | $ | 1,000 | $ | 1,021.63 | $ | 3.27 |
*Expenses are calculated using the most recent six-month expense ratio, net of expense waivers, annualized for each class (A: 0.73%;
C: 1.28%; R: 1.16%; R6: 0.64%; and Advisor: 0.65%), multiplied by the average account value over the period, multiplied by 182/366 to reflect
the one-half year period.
franklintempleton.com
Annual Report
13
FRANKLIN STRATEGIC SERIES
| Financial Highlights | |||
| Franklin Flexible Alpha Bond Fund | |||
| Period Ended | |||
| April 30, 2016a | |||
| Class A | |||
| Per share operating performance | |||
| (for a share outstanding throughout the period) | |||
| Net asset value, beginning of period | $ | 10.00 | |
| Income from investment operationsb: | |||
| Net investment income | 0.099 | ||
| Net realized and unrealized gains (losses) | (0.123 | ) | |
| Total from investment operations | (0.024 | ) | |
| Less distributions from net investment income | (0.096 | ) | |
| Net asset value, end of period | $ | 9.88 | |
| Total returnc | (0.34 | )% | |
| Ratios to average net assetsd | |||
| Expenses before waiver and payments by affiliates | 3.47 | %e | |
| Expenses net of waiver and payments by affiliates | 0.84 | % | |
| Net investment income | 1.37 | % | |
| Supplemental data | |||
| Net assets, end of period (000’s) | $ | 10,200 | |
| Portfolio turnover rate | 40.12 | % | |
aFor the period August 3, 2015 (commencement of operations) to April 30, 2016.
bThe amount shown for a share outstanding throughout the period may not correlate with the Statement of Operations for the period due to the timing of sales and repurchases
of the Fund’s shares in relation to income earned and/or fluctuating fair value of the investments of the Fund.
cTotal return does not reflect sales commissions or contingent deferred sales charges, if applicable, and is not annualized for periods less than one year.
dRatios are annualized for periods less than one year.
eRatios are adjusted to exclude the effects of annualization for non-recurring expenses.
14 Annual Report | The accompanying notes are an integral part of these financial statements.
franklintempleton.com
FRANKLIN STRATEGIC SERIES
FINANCIAL H IGHLIGHTS
| Franklin Flexible Alpha Bond Fund (continued) | |||
| Period Ended | |||
| April 30, 2016a | |||
| Class C | |||
| Per share operating performance | |||
| (for a share outstanding throughout the period) | |||
| Net asset value, beginning of period | $ | 10.00 | |
| Income from investment operationsb: | |||
| Net investment income | 0.072 | ||
| Net realized and unrealized gains (losses) | (0.131 | ) | |
| Total from investment operations | (0.059 | ) | |
| Less distributions from net investment income | (0.081 | ) | |
| Net asset value, end of period | $ | 9.86 | |
| Total returnc | (0.69 | )% | |
| Ratios to average net assetsd | |||
| Expenses before waiver and payments by affiliates | 3.98 | %e | |
| Expenses net of waiver and payments by affiliates | 1.34 | % | |
| Net investment income | 0.87 | % | |
| Supplemental data | |||
| Net assets, end of period (000’s) | $ | 204 | |
| Portfolio turnover rate | 40.12 | % | |
aFor the period August 3, 2015 (commencement of operations) to April 30, 2016.
bThe amount shown for a share outstanding throughout the period may not correlate with the Statement of Operations for the period due to the timing of sales and repurchases
of the Fund’s shares in relation to income earned and/or fluctuating fair value of the investments of the Fund.
cTotal return does not reflect sales commissions or contingent deferred sales charges, if applicable, and is not annualized for periods less than one year.
dRatios are annualized for periods less than one year.
eRatios are adjusted to exclude the effects of annualization for non-recurring expenses.
franklintempleton.com
The accompanying notes are an integral part of these financial statements. | Annual Report 15
FRANKLIN STRATEGIC SERIES
FINANCIAL H IGHLIGHTS
| Franklin Flexible Alpha Bond Fund (continued) | |||
| Period Ended | |||
| April 30, 2016a | |||
| Class R | |||
| Per share operating performance | |||
| (for a share outstanding throughout the period) | |||
| Net asset value, beginning of period | $ | 10.00 | |
| Income from investment operationsb: | |||
| Net investment income | 0.072 | ||
| Net realized and unrealized gains (losses) | (0.127 | ) | |
| Total from investment operations | (0.055 | ) | |
| Less distributions from net investment income | (0.085 | ) | |
| Net asset value, end of period | $ | 9.86 | |
| Total returnc | (0.65 | )% | |
| Ratios to average net assetsd | |||
| Expenses before waiver and payments by affiliates | 3.84 | %e | |
| Expenses net of waiver and payments by affiliates | 1.22 | % | |
| Net investment income | 0.99 | % | |
| Supplemental data | |||
| Net assets, end of period (000’s) | $ | 10 | |
| Portfolio turnover rate | 40.12 | % | |
aFor the period August 3, 2015 (commencement of operations) to April 30, 2016.
bThe amount shown for a share outstanding throughout the period may not correlate with the Statement of Operations for the period due to the timing of sales and repurchases
of the Fund’s shares in relation to income earned and/or fluctuating fair value of the investments of the Fund.
cTotal return is not annualized for periods less than one year.
dRatios are annualized for periods less than one year.
eRatios are adjusted to exclude the effects of annualization for non-recurring expenses.
16 Annual Report | The accompanying notes are an integral part of these financial statements.
franklintempleton.com
FRANKLIN STRATEGIC SERIES
FINANCIAL H IGHLIGHTS
| Franklin Flexible Alpha Bond Fund (continued) | |||
| Period Ended | |||
| April 30, 2016a | |||
| Class R6 | |||
| Per share operating performance | |||
| (for a share outstanding throughout the period) | |||
| Net asset value, beginning of period | $ | 10.00 | |
| Income from investment operationsb: | |||
| Net investment income | 0.108 | ||
| Net realized and unrealized gains (losses) | (0.124 | ) | |
| Total from investment operations | (0.016 | ) | |
| Less distributions from net investment income | (0.104 | ) | |
| Net asset value, end of period | $ | 9.88 | |
| Total returnc | (0.15 | )% | |
| Ratios to average net assetsd | |||
| Expenses before waiver and payments by affiliates | 3.72 | %e | |
| Expenses net of waiver and payments by affiliates | 0.71 | % | |
| Net investment income | 1.50 | % | |
| Supplemental data | |||
| Net assets, end of period (000’s) | $ | 10 | |
| Portfolio turnover rate | 40.12 | % | |
aFor the period August 3, 2015 (commencement of operations) to April 30, 2016.
bThe amount shown for a share outstanding throughout the period may not correlate with the Statement of Operations for the period due to the timing of sales and repurchases
of the Fund’s shares in relation to income earned and/or fluctuating fair value of the investments of the Fund.
cTotal return is not annualized for periods less than one year.
dRatios are annualized for periods less than one year.
eRatios are adjusted to exclude the effects of annualization for non-recurring expenses.
franklintempleton.com
The accompanying notes are an integral part of these financial statements. | Annual Report 17
FRANKLIN STRATEGIC SERIES
FINANCIAL H IGHLIGHTS
| Franklin Flexible Alpha Bond Fund (continued) | |||
| Period Ended | |||
| April 30, 2016a | |||
| Advisor Class | |||
| Per share operating performance | |||
| (for a share outstanding throughout the period) | |||
| Net asset value, beginning of period | $ | 10.00 | |
| Income from investment operationsb: | |||
| Net investment income | 0.107 | ||
| Net realized and unrealized gains (losses) | (0.129 | ) | |
| Total from investment operations | (0.022 | ) | |
| Less distributions from net investment income | (0.098 | ) | |
| Net asset value, end of period | $ | 9.88 | |
| Total returnc | (0.31 | )% | |
| Ratios to average net assetsd | |||
| Expenses before waiver and payments by affiliates | 3.34 | %e | |
| Expenses net of waiver and payments by affiliates | 0.71 | % | |
| Net investment income | 1.50 | % | |
| Supplemental data | |||
| Net assets, end of period (000’s) | $ | 344 | |
| Portfolio turnover rate | 40.12 | % | |
aFor the period August 3, 2015 (commencement of operations) to April 30, 2016.
bThe amount shown for a share outstanding throughout the period may not correlate with the Statement of Operations for the period due to the timing of sales and repurchases
of the Fund’s shares in relation to income earned and/or fluctuating fair value of the investments of the Fund.
cTotal return is not annualized for periods less than one year.
dRatios are annualized for periods less than one year.
eRatios are adjusted to exclude the effects of annualization for non-recurring expenses.
18 Annual Report | The accompanying notes are an integral part of these financial statements.
franklintempleton.com
FRANKLIN STRATEGIC SERIES
| Statement of Investments, April 30, 2016 | ||||
| Franklin Flexible Alpha Bond Fund | ||||
| Country | Shares | Value | ||
| Management Investment Companies (Cost $168,210) 1.5% | ||||
| Diversified Financials 1.5% | ||||
| PowerShares Senior Loan Portfolio ETF | United States | 7,100 | $ | 163,939 |
| Principal | ||||
| Amount* | ||||
| Corporate Bonds 37.6% | ||||
| Banks 12.2% | ||||
| Bank of America Corp., senior note, L, 2.25%, 4/21/20 | United States | 100,000 | 100,116 | |
| Bank of Nova Scotia, secured note, 1.875%, 4/26/21 | Canada | 100,000 | 99,909 | |
| a The Export-Import Bank of China, senior note, 144A, 2.50%, 7/31/19 | China | 200,000 | 204,358 | |
| HSBC USA Inc., senior note, 2.00%, 8/07/18 | United States | 100,000 | 100,603 | |
| Intesa Sanpaolo SpA, senior note, 3.875%, 1/15/19 | Italy | 200,000 | 207,012 | |
| JPMorgan Chase & Co., senior note, 2.25%, 1/23/20 | United States | 100,000 | 100,732 | |
| PHH Corp., senior note, 7.375%, 9/01/19 | United States | 200,000 | 195,500 | |
| Royal Bank of Canada, secured note, 2.10%, 10/14/20 | Canada | 100,000 | 100,643 | |
| a The Toronto-Dominion Bank, secured note, 144A, 2.25%, 3/15/21 | Canada | 200,000 | 203,569 | |
| 1,312,442 | ||||
| Consumer Durables & Apparel 2.6% | ||||
| CalAtlantic Group Inc., senior note, 8.375%, 5/15/18 | United States | 250,000 | 278,750 | |
| Consumer Services 0.9% | ||||
| Marriott International Inc., senior note, 2.875%, 3/01/21 | United States | 100,000 | 101,633 | |
| Diversified Financials 4.6% | ||||
| Capital One Financial Corp., senior note, 3.20%, 2/05/25 | United States | 100,000 | 99,497 | |
| b Deutsche Bank AG, senior note, FRN, 1.928%, 8/20/20 | Germany | 100,000 | 97,152 | |
| b The Goldman Sachs Group Inc., senior note, FRN, 1.834%, 9/15/20 | United States | 100,000 | 99,606 | |
| Morgan Stanley, senior note, 2.65%, 1/27/20 | United States | 100,000 | 101,531 | |
| Springleaf Finance Corp., senior note, 6.00%, 6/01/20 | United States | 100,000 | 96,125 | |
| 493,911 | ||||
| Energy 4.8% | ||||
| Canadian Natural Resources Ltd., senior note, 5.70%, 5/15/17 | Canada | 100,000 | 103,071 | |
| CNOOC Finance 2015 Australia Pty. Ltd., senior note, 2.625%, 5/05/20 | China | 200,000 | 199,494 | |
| Kinder Morgan Energy Partners LP, senior note, 5.95%, 2/15/18 | United States | 200,000 | 210,176 | |
| 512,741 | ||||
| Food & Staples Retailing 0.9% | ||||
| Walgreen Co., senior bond, 3.10%, 9/15/22 | United States | 100,000 | 102,160 | |
| Food, Beverage & Tobacco 1.0% | ||||
| Altria Group Inc., senior bond, 4.25%, 8/09/42 | United States | 100,000 | 105,686 | |
| Health Care Equipment & Services 1.4% | ||||
| Stryker Corp., senior note, 2.00%, 3/08/19 | United States | 50,000 | 50,696 | |
| Tenet Healthcare Corp., senior note, 5.50%, 3/01/19 | United States | 100,000 | 100,500 | |
| 151,196 | ||||
| Insurance 0.5% | ||||
| a Jackson National Life Global Funding, secured note, 144A, 2.25%, 4/29/21 | United States | 50,000 | 50,289 | |
| Materials 3.0% | ||||
| Owens-Illinois Inc., senior note, 7.80%, 5/15/18 | United States | 200,000 | 220,000 | |
| Reynolds Group Holdings Inc., senior note, 8.125%, 6/15/17 | United States | 100,000 | 103,000 | |
| 323,000 | ||||
| Media 0.9% | ||||
| Viacom Inc., senior bond, 3.125%, 6/15/22 | United States | 100,000 | 98,494 | |
franklintempleton.com
Annual Report
19
FRANKLIN STRATEGIC SERIES
STATEMENT O F INVESTMENTS
| Franklin Flexible Alpha Bond Fund (continued) | ||||
| Principal | ||||
| Country | Amount* | Value | ||
| Corporate Bonds (continued) | ||||
| Pharmaceuticals, Biotechnology & Life Sciences 1.9% | ||||
| Actavis Funding SCS, senior bond, 3.80%, 3/15/25 | United States | 100,000 | $ | 102,722 |
| a Baxalta Inc., senior note, 144A, 3.60%, 6/23/22 | United States | 100,000 | 102,841 | |
| 205,563 | ||||
| Real Estate 1.0% | ||||
| American Tower Corp., senior note, 3.30%, 2/15/21 | United States | 100,000 | 103,326 | |
| Technology Hardware & Equipment 0.9% | ||||
| a,b Hewlett Packard Enterprise Co., senior note, 144A, FRN, 2.559%, 10/05/18 | United States | 100,000 | 101,102 | |
| Telecommunication Services 1.0% | ||||
| AT&T Inc., senior note, 3.95%, 1/15/25 | United States | 100,000 | 105,501 | |
| Total Corporate Bonds (Cost $3,978,820) | 4,045,794 | |||
| Foreign Government and Agency Securities 2.5% | ||||
| Government of Malaysia, senior note, 3.394%, 3/15/17 | Malaysia | 130,000 | MYR | 33,474 |
| Government of Mexico, 7.25%, 12/15/16 | Mexico | 5,800c MXN | 34,429 | |
| d Government of New Zealand, senior note, Reg S, 3.00%, 4/15/20 | New Zealand | 280,000 | NZD | 201,448 |
| Total Foreign Government and Agency Securities | ||||
| (Cost $251,273) | 269,351 | |||
| U.S. Government and Agency Securities 5.4% | ||||
| U.S. Treasury Bond, 5.25%, 11/15/28 | United States | 60,000 | 81,656 | |
| e U.S. Treasury Note, Index Linked, 0.125%, 1/15/23 | United States | 491,010 | 496,176 | |
| Total U.S. Government and Agency Securities (Cost $557,990) | 577,832 | |||
| Asset-Backed Securities and Commercial Mortgage-Backed | ||||
| Securities 26.8% | ||||
| Banks 2.5% | ||||
| b Capital One Multi-Asset Execution Trust, 2004-B3, B3, FRN, 1.163%, 1/18/22 | United States | 150,000 | 149,970 | |
| b Citigroup Commercial Mortgage Trust, 2007-C6, AM, FRN, 5.899%, 6/10/17 | United States | 100,000 | 100,625 | |
| a Morgan Stanley Capital I Trust, 2005-RR6, AJ, 144A, 5.233%, 5/24/43 | United States | 21,209 | 21,209 | |
| 271,804 | ||||
| Diversified Financials 24.3% | ||||
| a,b Adirondack Park CLO Ltd., 2013-1A, B, 144A, FRN, 2.628%, 4/15/24 | United States | 100,000 | 99,639 | |
| b American Express Credit Account Secured Note Trust, 2012-4, B, FRN, | ||||
| 0.983%, 5/15/20 | United States | 100,000 | 99,387 | |
| a BAMLL Commercial Mortgage Securities Trust, 2012-PARK, A, 144A, | ||||
| 2.959%, 12/10/30 | United States | 100,000 | 103,005 | |
| Banc of America Commercial Mortgage Trust, 2015-UBS7, A4, 3.705%, 9/15/48 | United States | 100,000 | 107,586 | |
| a,b Bluemountain CLO Ltd., 2013-3A, A, 144A, FRN, 2.038%, 10/29/25 | United States | 6,437 | 6,416 | |
| a,b Carlyle Global Market Strategies Ltd., 2014-2A, B2, 144A, FRN, 2.668%, 5/15/25 | United States | 100,000 | 99,729 | |
| a,b Cent CLO, 13-17A, A1, 144A, FRN, 1.916%, 1/30/25 | United States | 40,000 | 39,295 | |
| b Chase Issuance Trust, 2007-B1, B1, FRN, 0.683%, 4/15/19 | United States | 100,000 | 99,642 | |
| a Colony MFM Trust, 2014-1, A, 144A, 2.543%, 4/20/50 | United States | 151,704 | 151,060 | |
| b Commercial Mortgage Trust, 2005-GG5, AJ, FRN, 5.632%, 4/10/37 | United States | 5,852 | 5,849 | |
| b Conseco Finance Securitizations Corp., 2002-2, M1, FRN, 7.424%, 3/01/33 | United States | 90,000 | 98,008 | |
| a Core Industrial Trust, 2015-CALW, A, 144A, 3.04%, 2/10/34 | United States | 30,000 | 31,156 | |
| a,b Eaton Vance CDO Ltd., 2014-1A, A, 144A, FRN, 2.078%, 7/15/26 | United States | 24,000 | 23,837 | |
| a,b Eleven Madison Trust Mortgage Trust, 2015-11MD, A, 144A, FRN, 3.673%, 9/10/35 | United States | 100,000 | 106,925 | |
| b Fannie Mae Connecticut Avenue Securities, | ||||
| 2013-CO1, M1, FRN, 2.439%, 10/25/23 | United States | 83,565 | 84,020 | |
| 2014-CO2, 2M1, FRN, 1.389%, 5/25/24 | United States | 73,059 | 72,491 | |
| 2014-CO2, 2M2, FRN, 3.039%, 5/25/24 | United States | 40,000 | 37,266 | |
20 Annual Report
franklintempleton.com
FRANKLIN STRATEGIC SERIES
STATEMENT O F INVESTMENTS
| Franklin Flexible Alpha Bond Fund (continued) | ||||
| Principal | ||||
| Country | Amount* | Value | ||
| Asset-Backed Securities and Commercial Mortgage-Backed | ||||
| Securities (continued) | ||||
| Diversified Financials (continued) | ||||
| b FHLMC Structured Agency Credit Risk Debt Notes, | ||||
| 2014-HQ1, M1, FRN, 2.089%, 8/25/24 | United States | 73,658 | $ | 73,888 |
| 2015-DNA1, M2, FRN, 2.289%, 10/25/27 | United States | 250,000 | 248,519 | |
| a,b Galaxy XV CLO Ltd., 2013-15A, A, 144A, FRN, 1.878%, 4/15/25 | United States | 99,000 | 97,902 | |
| a,b Invitation Homes Trust, 2015-SFR1, A, 144A, FRN, 1.886%, 3/17/32 | United States | 96,265 | 96,573 | |
| b IXIS Real Estate Capital Trust, 2005-HE4, A3, FRN, 1.119%, 2/25/36 | United States | 39,480 | 39,200 | |
| a,b LNR CDO Ltd., 2003-1A, EFL, 144A, FRN, 3.439%, 7/23/36 | United States | 28,844 | 28,875 | |
| a,b Madison Park Funding XVIII Ltd., 2015-18A, C, 144A, FRN, 3.635%, 10/21/26 | United States | 100,000 | 99,151 | |
| a,b Octagon Investment Partners XXIII Ltd., 15-1A, | ||||
| A1, 144A, FRN, 2.048%, 7/15/27 | United States | 18,490 | 18,305 | |
| A2, 144A, FRN, 2.048%, 7/15/27 | United States | 17,554 | 17,378 | |
| a,b PPM Grayhawk CLO Ltd., 07-1A, B, 144A, FRN, 1.333%, 4/18/21 | United States | 100,000 | 94,938 | |
| a,b Resource Capital Corp. Ltd., 2015-CRE4, A, 144A, FRN, 1.833%, 8/15/32 | United States | 100,000 | 98,727 | |
| a,b SWAY Residential 2014-1 Trust, 2014-1, A, 144A, FRN, 1.736%, 1/17/32 | United States | 99,130 | 98,666 | |
| b Thornburg Mortgage Securities Trust, 2005-1, A3, FRN, 2.534%, 4/25/45 | United States | 44,805 | 44,281 | |
| a,b Tricon American Homes Trust, 2015-SFR1, | ||||
| A, 144A, FRN, 1.686%, 5/17/32 | United States | 100,000 | 98,563 | |
| C, 144A, FRN, 2.336%, 5/17/32 | United States | 100,000 | 96,819 | |
| a,b Voya CLO Ltd., 2013-3A, A2, 144A, FRN, 2.433%, 1/18/26 | United States | 100,000 | 98,360 | |
| 2,615,456 | ||||
| Total Asset-Backed Securities and Commercial Mortgage-Backed | ||||
| Securities (Cost $2,889,170) | 2,887,260 | |||
| Mortgage-Backed Securities 2.4% | ||||
| Federal Home Loan Mortgage Corp. (FHLMC) Fixed Rate 0.4% | ||||
| f FHLMC Gold 30 Year, 3.50%, 5/01/46 | United States | 25,000 | 26,181 | |
| f FHLMC Gold 30 Year, 4.00%, 5/01/46 | United States | 20,000 | 21,355 | |
| 47,536 | ||||
| Federal National Mortgage Association (FNMA) Fixed Rate 1.3% | ||||
| f FNMA 30 Year, 3.50%, 5/01/46 | United States | 60,000 | 62,881 | |
| f FNMA 30 Year, 4.00%, 5/01/46 | United States | 70,000 | 74,785 | |
| 137,666 | ||||
| Government National Mortgage Association (GNMA) Fixed Rate 0.7% | ||||
| f GNMA II SF 30 Year, 3.00%, 5/01/46 | United States | 20,000 | 20,702 | |
| f GNMA II SF 30 Year, 3.50%, 5/01/46 | United States | 50,000 | 52,803 | |
| 73,505 | ||||
| Total Mortgage-Backed Securities (Cost $258,655) | 258,707 | |||
| Municipal Bonds 4.8% | ||||
| Cincinnati GO, Various Purpose, Improvement and Refunding, Series A, | ||||
| 5.00%, 12/01/25 | United States | 100,000 | 126,394 | |
| Citizens Property Insurance Corp. Revenue, Coastal Account, senior secured, | ||||
| Series A1, 5.00%, 6/01/22 | United States | 125,000 | 148,534 | |
| Colorado State Board of Governors University Enterprise System Revenue, Green | ||||
| Bonds, Series E-2, 5.00%, 3/01/25 | United States | 100,000 | 126,841 | |
| Teays Valley Local School District GO, Pickaway Fairfield and Franklin Counties, | ||||
| Refunding, 4.00%, 12/01/26 | United States | 100,000 | 112,569 | |
| Total Municipal Bonds (Cost $486,631) | 514,338 | |||
franklintempleton.com
Annual Report
21
FRANKLIN STRATEGIC SERIES
STATEMENT O F INVESTMENTS
| Franklin Flexible Alpha Bond Fund (continued) | |||||
| Notional | |||||
| Counterparty | Amount* | Value | |||
| Options Purchased 0.2% | |||||
| Calls – Over-the-Counter | |||||
| Currency Options 0.0%† | |||||
| USD/AUD, July Strike Price 0.698 AUD, Expires 7/06/16 | JPHQ | 150,000 | $ | 429 | |
| USD/CAD, May Strike Price 1.38 CAD, Expires 5/18/16 | JPHQ | 20,000 | — | ||
| 429 | |||||
| Puts – Over-the-Counter 0.2% | |||||
| Credit Default Swaptions 0.1% | |||||
| Buy protection on CDX.NA.HY.26, Premium Rate 5.00%, Strike Price $101, | |||||
| Expires 7/20/16 | CITI | 500,000 | 6,873 | ||
| Buy protection on CDX.NA.HY.26, Premium Rate 5.00%, Strike Price $102.50, | |||||
| Expires 7/20/16 | CITI | 100,000 | 2,028 | ||
| Buy protection on CDX.NA.IG.26, Premium Rate 1.00%, Strike Price $80, | |||||
| Expires 7/20/16 | CITI | 500,000 | 2,072 | ||
| 10,973 | |||||
| Interest Rate Swaptions 0.1% | |||||
| Receive floating 3 month USD LIBOR, Pay fixed 1.75%, Expires 5/18/16 | JPHQ | 200,000 | 993 | ||
| Receive floating 3 month USD LIBOR, Pay fixed 1.85%, Expires 10/04/16 | JPHQ | 600,000 | 11,009 | ||
| 12,002 | |||||
| Total Options Purchased (Cost $30,904) | 23,404 | ||||
| Total Investments before Short Term Investments | |||||
| (Cost $8,621,653) | 8,740,625 | ||||
| Country | Shares | ||||
| Short Term Investments (Cost $2,033,538) 18.9% | |||||
| Money Market Funds 18.9% | |||||
| g,h Institutional Fiduciary Trust Money Market Portfolio | United States | 2,033,538 | 2,033,538 | ||
| Total Investments (Cost $10,655,191) 100.1% | 10,774,163 | ||||
| Options Written (0.1)% | (4,248 | ) | |||
| Other Assets, less Liabilities (0.0)%† | (2,582 | ) | |||
| Net Assets 100.0% | $ | 10,767,333 | |||
| Notional | |||||
| Counterparty | Amount* | ||||
| i Options Written (0.1)% | |||||
| Calls – Over-the-Counter | |||||
| Currency Options (0.0)%† | |||||
| USD/AUD, July Strike Price 0.66 AUD, Expires 7/06/16 | JPHQ | 150,000 | (49 | ) | |
| USD/CAD, May Strike Price 1.48 CAD, Expires 5/18/16 | JPHQ | 20,000 | — | ||
| (49 | ) | ||||
| Puts – Over-the-Counter (0.1)% | |||||
| Credit Default Swaptions (0.1)% | |||||
| Buy protection on CDX.NA.IG.26, Premium Rate 1.00%, Strike Price $100, | |||||
| Expires 7/20/16 | CITI | 500,000 | (773 | ) | |
| Buy protection on CDX.NA.HY.26, Premium Rate 5.00%, Strike Price $97, | |||||
| Expires 7/20/16 | CITI | 500,000 | (2,598 | ) | |
| Buy protection on CDX.NA.HY.26, Premium Rate 5.00%, Strike Price $99, | |||||
| Expires 7/20/16 | CITI | 100,000 | (828 | ) | |
| (4,199 | ) | ||||
22 Annual Report
franklintempleton.com
FRANKLIN STRATEGIC SERIES
STATEMENT O F INVESTMENTS
| Franklin Flexible Alpha Bond Fund (continued) | |||||
| Notional | |||||
| Counterparty | Amount* | Value | |||
| i Options Written (continued) | |||||
| Interest Rate Swaptions (0.0)%† | |||||
| Receive floating 3 month USD LIBOR, Pay fixed 2.75%, Expires 5/18/16 | JPHQ | 200,000 | $ | — | |
| Total Options Written (Premiums Received $9,744) | $ | (4,248 | ) | ||
†Rounds to less than 0.1% of net assets.
*The principal/notional amount is stated in U.S. dollars unless otherwise indicated.
aSecurity was purchased pursuant to Rule 144A under the Securities Act of 1933 and may be sold in transactions exempt from registration only to qualified institutional buyers
or in a public offering registered under the Securities Act of 1933. These securities have been deemed liquid under guidelines approved by the Trust’s Board of Trustees. At
April 30, 2016, the aggregate value of these securities was $2,288,687, representing 21.28% of net assets.
bThe coupon rate shown represents the rate at period end.
cPrincipal amount is stated in 100 Mexican Peso Units.
dSecurity was purchased pursuant to Regulation S under the Securities Act of 1933, which exempts from registration securities offered and sold outside of the United States.
Such a security cannot be sold in the United States without either an effective registration statement filed pursuant to the Securities Act of 1933, or pursuant to an exemption
from registration. This security has been deemed liquid under guidelines approved by the Trust’s Board of Trustees. At April 30, 2016, the value of this security was $201,448,
representing 1.87% of net assets.
ePrincipal amount of security is adjusted for inflation. See Note 1(g).
fSecurity purchased on a to-be-announced (TBA) basis. See Note 1(c).
gNon-income producing.
hSee Note 3(f) regarding investments in affiliated management investment companies.
iSee Note 6 regarding written options.
franklintempleton.com
Annual Report
23
FRANKLIN STRATEGIC SERIES
STATEMENT O F INVESTMENTS
| Franklin Flexible Alpha Bond Fund (continued) | ||||||||||
| At April 30, 2016, the Fund had the following financial futures contracts outstanding. See Note 1(d). | ||||||||||
| Financial Futures Contracts | ||||||||||
| Number of | Notional | Expiration | Unrealized | Unrealized | ||||||
| Description | Type | Contracts | Value | Date | Appreciation | Depreciation | ||||
| Interest Rate Contracts | ||||||||||
| Australia 10 Yr. Bond | Long | 1 | $ | 99,329 | 6/15/16 | $ | 701 | $ | — | |
| Canadian 5 Yr. Bond | Long | 4 | 394,689 | 6/21/16 | — | (4,244 | ) | |||
| Euro-Bund | Long | 2 | 370,754 | 6/08/16 | — | (1,723 | ) | |||
| U.S. Treasury 2 Yr. Note | Short | 11 | 2,404,875 | 6/30/16 | — | (4,325 | ) | |||
| U.S. Treasury 5 Yr. Note | Short | 12 | 1,450,969 | 6/30/16 | — | (6,473 | ) | |||
| U.S. Treasury 10 Yr. Note | Short | 4 | 520,250 | 6/21/16 | — | (2,825 | ) | |||
| Total Financial Futures Contracts | $ | 701 | $ | (19,590 | ) | |||||
| Net unrealized appreciation (depreciation) | $ | (18,889 | ) | |||||||
At April 30, 2016, the Fund had the following forward exchange contracts outstanding. See Note 1(d).
| Forward Exchange Contracts | |||||||||||
| Contract | Settlement | Unrealized | Unrealized | ||||||||
| Currency | Counterpartya Type | Quantity | Amount | Date | Appreciation | Depreciation | |||||
| OTC Forward Exchange Contracts | |||||||||||
| Japanese Yen | JPHQ | Sell | 3,000,000 | $ | 25,578 | 8/18/16 | $ | — | $ | (2,696 | ) |
| Malaysian Ringgit | RBS | Sell | 85,000 | 21,357 | 5/05/16 | — | (400 | ) | |||
| Indian Rupee | RBS | Buy | 3,150,000 | 45,785 | 5/10/16 | 1,544 | — | ||||
| South African Rand | RBS | Sell | 500,000 | 30,862 | 5/10/16 | — | (4,178 | ) | |||
| Mexican Peso | RBS | Buy | 300,000 | 16,799 | 5/16/16 | 623 | — | ||||
| Canadian Dollar | RBS | Sell | 91,000 | 69,073 | 6/14/16 | — | (3,493 | ) | |||
| South Korean Won | RBS | Sell | 25,000,000 | 21,524 | 6/30/16 | — | (280 | ) | |||
| Polish Zloty | RBS | Sell | 80,000 | 21,226 | 6/30/16 | 288 | — | ||||
| New Zealand Dollar | RBS | Sell | 290,000 | 195,547 | 7/11/16 | — | (6,173 | ) | |||
| Indonesian Rupiah | RBS | Buy | 277,000,000 | 20,827 | 7/20/16 | — | (112 | ) | |||
| Singapore Dollar | RBS | Sell | 28,000 | 20,819 | 7/20/16 | 30 | — | ||||
| Australian Dollar | UBSW | Sell | 317,000 | 230,434 | 6/08/16 | — | (10,168 | ) | |||
| Euro | UBSW | Buy | 98,000 | 109,478 | 6/15/16 | 2,914 | — | ||||
| Euro | UBSW | Sell | 270,000 | 298,631 | 6/15/16 | — | (11,020 | ) | |||
| Chilean Peso | UBSW | Sell | 35,855,000 | 51,516 | 6/16/16 | — | (2,516 | ) | |||
| Japanese Yen | UBSW | Buy | 4,250,000 | 37,776 | 6/17/16 | 2,196 | — | ||||
| Japanese Yen | UBSW | Sell | 4,250,000 | 37,674 | 6/17/16 | — | (2,297 | ) | |||
| Swedish Krona | UBSW | Sell | 214,000 | 26,556 | 7/26/16 | — | (159 | ) | |||
| Total Forward Exchange Contracts | $ | 7,595 | $ | (43,492 | ) | ||||||
| Net unrealized appreciation (depreciation) | $ | (35,897 | ) | ||||||||
a May be comprised of multiple contracts with the same counterparty, currency and settlement date.
At April 30, 2016, the Fund had the following credit default swap contracts outstanding. See Note 1(d).
| Credit Default Swap Contracts | |||||||||||||||||
| Unamortized | |||||||||||||||||
| Periodic | Upfront | ||||||||||||||||
| Payment Counterparty/ | Notional | Expiration | Payments | Unrealized | Unrealized | ||||||||||||
| Description | Rate | Exchange | Amounta | Date | (Receipts) | Appreciation | Depreciation | Value | Ratingb | ||||||||
| Centrally Cleared Swap Contracts | |||||||||||||||||
| Contracts to Sell Protectionc | |||||||||||||||||
| Traded Index | |||||||||||||||||
| ITRX.EUR.25 | 1.00 | % | ICE | 50,000 | EUR | 6/20/21 | $ | 568 | $ | 256 | $ | — | $ | 824 | Investment Grade | ||
| ITRX.EUR.SNRFIN.S25 | 1.00 | % | ICE | 120,000 | EUR | 6/20/21 | 849 | — | (5 | ) | 844 | Investment Grade | |||||
| $ | 1,417 | $ | 256 | $ | (5 | ) | $ | 1,668 | |||||||||
| 24 | Annual Report | franklintempleton.com | |||||||||||||||
FRANKLIN STRATEGIC SERIES
STATEMENT O F INVESTMENTS
| Franklin Flexible Alpha Bond Fund (continued) | |||||||||||||||||
| Credit Default Swap Contracts (continued) | |||||||||||||||||
| Unamortized | |||||||||||||||||
| Periodic | Upfront | ||||||||||||||||
| Payment Counterparty/ | Notional | Expiration | Payments | Unrealized | Unrealized | ||||||||||||
| Description | Rate | Exchange | Amounta | Date | (Receipts) | Appreciation | Depreciation | Value | Ratingb | ||||||||
| OTC Swap Contracts | |||||||||||||||||
| Contracts to Buy Protection | |||||||||||||||||
| Single Name | |||||||||||||||||
| CalAtlantic Group Inc | 5.00 | % | BZWS | 250,000 | 6/20/18 | $ | (21,382 | ) | $ | — | $ | (2,604) $ (23,984) | |||||
| Canadian Natural Resources Ltd | 5.00 | % | GSCO | 100,000 | 6/20/17 | (4,145 | ) | — | (1,442 | ) | (5,587 | ) | |||||
| Hartford Financial Services Group | |||||||||||||||||
| Inc | 1.00 | % | CITI | 30,000 | 12/21/20 | (357 | ) | — | (301 | ) | (658 | ) | |||||
| Kinder Morgan Energy Partners LP | 5.00 | % | CITI | 200,000 | 3/20/18 | (14,255 | ) | — | (1,725 | ) | (15,980 | ) | |||||
| Lanxess AG | 1.00 | % | CITI | 20,000 | EUR | 12/20/20 | 169 | — | (583 | ) | (416 | ) | |||||
| LennarCorp | 5.00 | % | JPHQ | 25,000 | 9/20/20 | (3,192 | ) | — | (329 | ) | (3,521 | ) | |||||
| Owens-Illinois Inc | 5.00 | % | CITI | 200,000 | 6/20/18 | (17,059 | ) | — | (4,550 | ) | (21,609 | ) | |||||
| Pactiv LLC | 5.00 | % | CITI | 100,000 | 6/20/17 | (2,107 | ) | — | (3,289 | ) | (5,396 | ) | |||||
| PHHCorp | 5.00 | % | BZWS | 200,000 | 9/20/19 | (3,041 | ) | 5,951 | — | 2,910 | |||||||
| RiteAidCorp | 5.00 | % | JPHQ | 100,000 | 12/20/20 | (16,719 | ) | 115 | — | (16,604 | ) | ||||||
| SpringleafFinanceCorp | 5.00 | % | GSCO | 100,000 | 6/20/20 | (4,998 | ) | 2,332 | — | (2,666 | ) | ||||||
| Tenet Healthcare Corp | 5.00 | % | BZWS | 100,000 | 3/20/19 | (6,534 | ) | — | (1,603 | ) | (8,137 | ) | |||||
| Contracts to Sell Protectionc | |||||||||||||||||
| Single Name | |||||||||||||||||
| Beazer Homes USA Inc | 5.00 | % | JPHQ | 25,000 | 9/20/20 | $ | 355 | $ | — | $ | (2,630 | ) $ | (2,275 | ) | CCC | ||
| Electricite de France SA | 1.00 | % | JPHQ | 25,000 | EUR | 9/20/20 | 533 | — | (87 | ) | 446 | A+ | |||||
| Engie | 1.00 | % | JPHQ | 25,000 | EUR | 9/20/20 | 667 | — | (17 | ) | 650 | A- | |||||
| Government of China | 1.00 | % | JPHQ | 250,000 | 9/20/20 | — | — | (746 | ) | (746 | ) | AA- | |||||
| Government of Mexico | 1.00 | % | JPHQ | 10,000 | 9/20/20 | (184 | ) | 39 | — | (145 | ) | BBB+ | |||||
| MetLife Inc | 1.00 | % | CITI | 30,000 | 12/21/20 | (832 | ) | 706 | — | (126 | ) | A- | |||||
| Orange SA | 1.00 | % | JPHQ | 25,000 | EUR | 9/20/20 | 438 | 87 | — | 525 | BBB+ | ||||||
| Solvay SA | 1.00 | % | CITI | 20,000 | EUR | 12/20/20 | (502 | ) | 705 | — | 203 | BBB- | |||||
| SprintCommunications Inc | 5.00 | % | JPHQ | 12,000 | 9/20/20 | — | — | (2,058 | ) | (2,058 | ) | B | |||||
| Traded Index | |||||||||||||||||
| Citibank Bespoke HY Index 5-10% | 1.12 | % | CITI | 100,000 | 9/20/16 | — | 386 | — | 386 | Non Investment | |||||||
| Tranchedd | Grade | ||||||||||||||||
| Total OTC Swap Contracts | $ | (93,145 | ) | $ | 10,321 | $ | (21,964) $(104,788) | ||||||||||
| Total Credit Default Swap Contracts | $ | (91,728 | ) | $ | 10,577 | $ | (21,969) $(103,120) | ||||||||||
| Net unrealized appreciation (depreciation) | $ | (11,392 | ) | ||||||||||||||
See Notes 1(d) and 8 regarding investment transactions and other derivative information, respectively.
aIn U.S. dollars unless otherwise indicated. For contracts to sell protection, the notional amount is equal to the maximum potential amount of the future payments and no
recourse provisions have been entered into in association with the contracts.
bBased on Standard and Poor’s (S&P) rating for single name swaps and internal ratings for index swaps. Internal ratings based on mapping into equivalent ratings from
external vendors.
cThe Fund enters contracts to sell protection to create a long credit position. Performance triggers include default, bankruptcy or restructuring for single name swaps, and fail-
ure to pay or bankruptcy of the underlying securities for traded index swaps.
dRepresents a custom index comprised of a basket of underlying issues.
franklintempleton.com
Annual Report
25
FRANKLIN STRATEGIC SERIES
STATEMENT O F INVESTMENTS
| Franklin Flexible Alpha Bond Fund (continued) | |||||||||||||||
| At April 30, 2016, the Fund had the following interest rate swap contracts outstanding. See Note 1(d). | |||||||||||||||
| Interest Rate Swap Contracts | |||||||||||||||
| Unamortized | |||||||||||||||
| Upfront | |||||||||||||||
| Counterparty/ | Notional | Expiration | Payments/ | Unrealized | Unrealized | ||||||||||
| Description | Exchange | Amount | Date | (Receipts) | Appreciation | Depreciation | Value | ||||||||
| Centrally Cleared Swap Contracts | |||||||||||||||
| Receive Floating rate USD-LIBOR | |||||||||||||||
| Pay Fixed rate 2.00% | LCH | $ | 720,000 | 6/15/23 | $ | (18,921 | ) | $ | — | $ | (5,356 | ) | $ | (24,277 | ) |
| Receive Floating rate USD-LIBOR | |||||||||||||||
| Pay Fixed rate 3.5575% | LCH | 220,000 | 6/15/26 | (8,800 | ) | — | (1,809 | ) | (10,609 | ) | |||||
| Total Centrally Cleared Swap Contracts | $ | (27,721 | ) | $ | — | $ | (7,165 | ) | $ | (34,886 | ) | ||||
| See Notes 6 and 8 regarding investment transactions and other derivative information, respectively. | |||||||||||||||
| See Abbreviations on page 42. | |||||||||||||||
26 Annual Report
franklintempleton.com
FRANKLIN STRATEGIC SERIES
Financial Statements
Statements of Assets and Liabilities
April 30, 2016
| Franklin Flexible Alpha Bond Fund | |||
| Assets: | |||
| Investments in securities: | |||
| Cost - Unaffiliated issuers | $ | 8,621,653 | |
| Cost - Non-controlled affiliates (Note 3f) | 2,033,538 | ||
| Total cost of investments | $ | 10,655,191 | |
| Value - Unaffiliated issuers | $ | 8,740,625 | |
| Value - Non-controlled affiliates (Note 3f) | 2,033,538 | ||
| Total value of investments | 10,774,163 | ||
| Foreign currency, at value (cost $92,745) | 93,536 | ||
| Receivables: | |||
| Investment securities sold | 1,737 | ||
| Interest | 63,209 | ||
| Affiliates | 189,451 | ||
| Due from brokers | 84,139 | ||
| Offering costs | 57,328 | ||
| OTC swap contracts (Upfront payments $3,942) | 2,162 | ||
| Unrealized appreciation on OTC forward exchange contracts | 7,595 | ||
| Unrealized appreciation on OTC swap contracts | 10,321 | ||
| Other assets | 7 | ||
| Total assets | 11,283,648 | ||
| Liabilities: | |||
| Payables: | |||
| Investment securities purchased | 258,999 | ||
| Capital shares redeemed | 117 | ||
| Distribution fees | 306 | ||
| Transfer agent fees | 357 | ||
| Distributions to shareholders | 6,940 | ||
| Variation margin | 6,869 | ||
| Professional fees | 70,287 | ||
| OTC swap contracts (Upfront receipts $116,575) | 95,307 | ||
| Options written, at value (premiums received $9,744) | 4,248 | ||
| Unrealized depreciation on OTC forward exchange contracts | 43,492 | ||
| Unrealized depreciation on OTC swap contracts | 21,964 | ||
| Accrued expenses and other liabilities | 7,429 | ||
| Total liabilities | 516,315 | ||
| Net assets, at value | $ | 10,767,333 | |
| Net assets consist of: | |||
| Paid-in capital | $ | 10,859,783 | |
| Undistributed net investment income | 17,623 | ||
| Net unrealized appreciation (depreciation) | 51,808 | ||
| Accumulated net realized gain (loss) | (161,881 | ) | |
| Net assets, at value | $ | 10,767,333 | |
franklintempleton.com
The accompanying notes are an integral part of these financial statements. | Annual Report 27
FRANKLIN STRATEGIC SERIES
FINANCIAL STATEMENTS
Statements of Assets and Liabilities (continued)
April 30, 2016
| Franklin Flexible Alpha Bond Fund | ||
| Class A: | ||
| Net assets, at value | $ | 10,199,614 |
| Shares outstanding | 1,032,340 | |
| Net asset value per sharea | $ | 9.88 |
| Maximum offering price per share (net asset value per share ÷ 95.75%) | $ | 10.32 |
| Class C: | ||
| Net assets, at value | $ | 203,735 |
| Shares outstanding | 20,662 | |
| Net asset value and maximum offering price per sharea | $ | 9.86 |
| Class R: | ||
| Net assets, at value | $ | 9,864 |
| Shares outstanding | 1,000 | |
| Net asset value and maximum offering price per share | $ | 9.86 |
| Class R6: | ||
| Net assets, at value | $ | 9,881 |
| Shares outstanding | 1,000 | |
| Net asset value and maximum offering price per share | $ | 9.88 |
| Advisor Class: | ||
| Net assets, at value | $ | 344,239 |
| Shares outstanding | 34,847 | |
| Net asset value and maximum offering price per share | $ | 9.88 |
| aRedemption price is equal to net asset value less contingent deferred sales charges, if applicable. | ||
28 Annual Report | The accompanying notes are an integral part of these financial statements.
franklintempleton.com
FRANKLIN STRATEGIC SERIES
FINANCIAL STATEMENTS
Statements of Operations
for the period ended April 30, 2016a
| Franklin Flexible Alpha Bond Fund | |||
| Investment income: | |||
| Dividends | $ | 8,620 | |
| Interest | 161,689 | ||
| Total investment income | 170,309 | ||
| Expenses: | |||
| Management fees (Note 3a) | 42,435 | ||
| Distribution fees: (Note 3c) | |||
| Class A | 9,922 | ||
| Class C | 619 | ||
| Class R | 37 | ||
| Transfer agent fees: (Note 3e) | |||
| Class A | 969 | ||
| Class C | 13 | ||
| Class R | 1 | ||
| Class R6 | 30 | ||
| Advisor Class | 17 | ||
| Custodian fees (Note 4) | 495 | ||
| Reports to shareholders | 13,514 | ||
| Registration and filing fees | 11,743 | ||
| Professional fees | 89,028 | ||
| Amortization of offering costs | 111,365 | ||
| Other | 17,371 | ||
| Total expenses | 297,559 | ||
| Expense reductions | (12 | ) | |
| Expenses waived/paid by affiliates (Note 3f and 3g) | (231,915 | ) | |
| Net expenses | 65,632 | ||
| Net investment income | 104,677 | ||
| Realized and unrealized gains (losses): | |||
| Net realized gain (loss) from: | |||
| Investments | (120,259 | ) | |
| Written options | 23,844 | ||
| Foreign currency transactions | (9,728 | ) | |
| Futures contracts | (41,296 | ) | |
| Swap contracts | (30,709 | ) | |
| Net realized gain (loss) | (178,148 | ) | |
| Net change in unrealized appreciation (depreciation) on: | |||
| Investments | 118,972 | ||
| Translation of other assets and liabilities denominated in foreign currencies | (35,214 | ) | |
| Written options | 5,496 | ||
| Futures contracts | (18,889 | ) | |
| Swap contracts | (18,557 | ) | |
| Net change in unrealized appreciation (depreciation) | 51,808 | ||
| Net realized and unrealized gain (loss) | (126,340 | ) | |
| Net increase (decrease) in net assets resulting from operations | $ | (21,663 | ) |
| aFor the period August 3, 2015 (commencement of operations) to October 31, 2015. | |||
franklintempleton.com
The accompanying notes are an integral part of these financial statements. | Annual Report 29
FRANKLIN STRATEGIC SERIES
FINANCIAL STATEMENTS
| Statements of Changes in Net Assets | |||
| Franklin Flexible Alpha Bond Fund | |||
| Period Ended | |||
| April 30, 2016a | |||
| Increase (decrease) in net assets: | |||
| Operations: | |||
| Net investment income | $ | 104,677 | |
| Net realized gain (loss) | (178,148 | ) | |
| Net change in unrealized appreciation (depreciation) | 51,808 | ||
| Net increase (decrease) in net assets resulting from operations | (21,663 | ) | |
| Distributions to shareholders from: | |||
| Net investment income: | |||
| Class A | (98,481 | ) | |
| Class C | (1,140 | ) | |
| Class R | (85 | ) | |
| Class R6 | (105 | ) | |
| Advisor Class | (1,870 | ) | |
| Total distributions to shareholders | (101,681 | ) | |
| Capital share transactions: (Note 2) | |||
| Class A | 10,322,042 | ||
| Class C | 204,600 | ||
| Class R | 10,000 | ||
| Class R6 | 10,000 | ||
| Advisor Class | 344,035 | ||
| Total capital share transactions | 10,890,677 | ||
| Net increase (decrease) in net assets | 10,767,333 | ||
| Net assets: | |||
| End of period | $ | 10,767,333 | |
| Undistributed net investment income included in net assets: | |||
| End of period | $ | 17,623 | |
| aFor the period August 3, 2015 (commencement of operations) to October 31, 2015. | |||
30 Annual Report | The accompanying notes are an integral part of these financial statements.
franklintempleton.com
FRANKLIN STRATEGIC SERIES
Notes to Financial Statements
Franklin Flexible Alpha Bond Fund
1. Organization and Significant Accounting Policies
Franklin Strategic Series (Trust) is registered under the Investment Company Act of 1940 (1940 Act) as an open-end management investment company, consisting of ten separate funds and applies the specialized accounting and reporting guidance in U.S. Generally Accepted Accounting Principles (U.S. GAAP). Franklin Flexible Alpha Bond Fund (Fund) is included in this report. The financial statements of the remaining funds in the Trust are presented separately. Effective August 3, 2015, the Fund commenced operations offering five classes of shares: Class A, Class C, Class R, Class R6, and Advisor Class. Each class of shares differs by its initial sales load, contingent deferred sales charges, voting rights on matters affecting a single class, its exchange privilege and fees primarily due to differing arrangements for distribution and transfer agent fees.
The following summarizes the Fund’s significant accounting policies.
a. Financial Instrument Valuation
The Fund’s investments in financial instruments are carried at fair value daily. Fair value is the price that would be received to sell an asset or paid to transfer a liability in an orderly transaction between market participants on the measurement date. The Fund calculates the net asset value (NAV) per share as of 4 p.m. Eastern time each day the New York Stock Exchange (NYSE) is open for trading. Under compliance policies and procedures approved by the Trust’s Board of Trustees (the Board), the Fund’s administrator has responsibility for oversight of valuation, including leading the cross-functional Valuation and Liquidity Oversight Committee (VLOC). The VLOC provides administration and oversight of the Fund’s valuation policies and procedures, which are approved annually by the Board. Among other things, these procedures allow the Fund to utilize independent pricing services, quotations from securities and financial instrument dealers, and other market sources to determine fair value.
Equity securities, exchange traded funds, and derivative financial instruments (derivatives) listed on an exchange or on the NASDAQ National Market System are valued at the last quoted sale price or the official closing price of the day, respectively. Foreign equity securities are valued as of the close of trading on the foreign stock exchange on which the security is primarily traded or as of 4 p.m. Eastern time, whichever is earlier. The value is then converted into its U.S. dollar equivalent at the foreign exchange rate in effect at 4 p.m. Eastern time on the day that the value of the security is determined. Over-the-counter (OTC) securities are valued within the range of the most recent quoted bid and ask prices. Securities that trade in multiple markets or on multiple exchanges are valued according to the broadest and most representative market. Certain equity securities are valued based upon fundamental characteristics or relationships to similar securities.
Debt securities generally trade in the OTC market rather than on a securities exchange. The Fund’s pricing services use multiple valuation techniques to determine fair value. In instances where sufficient market activity exists, the pricing services may utilize a market-based approach through which quotes from market makers are used to determine fair value. In instances where sufficient market activity may not exist or is limited, the pricing services also utilize proprietary valuation models which may consider market characteristics such as benchmark yield curves, credit spreads, estimated default rates, anticipated market interest rate volatility, coupon rates, anticipated timing of principal repayments, underlying collateral, and other unique security features in order to estimate the relevant cash flows, which are then discounted to calculate the fair value. Securities denominated in a foreign currency are converted into their U.S. dollar equivalent at the foreign exchange rate in effect at the NYSE close on the date that the values of the foreign debt securities are determined.
Investments in open-end mutual funds are valued at the closing NAV.
Certain derivatives trade in the OTC market. The Fund’s pricing services use various techniques including industry standard option pricing models and proprietary discounted cash flow models to determine the fair value of those instruments. The Fund’s net benefit or obligation under the derivative contract, as measured by the fair value of the contract, is included in net assets.
The Fund has procedures to determine the fair value of financial instruments for which market prices are not reliable or readily available. Under these procedures, the VLOC convenes on a regular basis to review such financial instruments and considers a number of factors, including significant unobservable valuation inputs, when arriving at fair value. The VLOC primarily employs a market-based approach which may use related or comparable assets or liabilities, recent transactions, market
franklintempleton.com
Annual Report
31
FRANKLIN STRATEGIC SERIES
NOTES TO FINANCIAL STATEMENTS
Franklin Flexible Alpha Bond Fund (continued)
1. Organization and Significant Accounting
Policies (continued)
a. Financial Instrument Valuation (continued)
multiples, book values, and other relevant information for the investment to determine the fair value of the investment. An income-based valuation approach may also be used in which the anticipated future cash flows of the investment are discounted to calculate fair value. Discounts may also be applied due to the nature or duration of any restrictions on the disposition of the investments. Due to the inherent uncertainty of valuations of such investments, the fair values may differ significantly from the values that would have been used had an active market existed. The VLOC employs various methods for calibrating these valuation approaches including a regular review of key inputs and assumptions, transactional back-testing or disposition analysis, and reviews of any related market activity.
b. Foreign Currency Translation
Portfolio securities and other assets and liabilities denominated in foreign currencies are translated into U.S. dollars based on the exchange rate of such currencies against U.S. dollars on the date of valuation. The Fund may enter into foreign currency exchange contracts to facilitate transactions denominated in a foreign currency. Purchases and sales of securities, income and expense items denominated in foreign currencies are translated into U.S. dollars at the exchange rate in effect on the transaction date. Portfolio securities and assets and liabilities denominated in foreign currencies contain risks that those currencies will decline in value relative to the U.S. dollar. Occasionally, events may impact the availability or reliability of foreign exchange rates used to convert the U.S. dollar equivalent value. If such an event occurs, the foreign exchange rate will be valued at fair value using procedures established and approved by the Board.
The Fund does not separately report the effect of changes in foreign exchange rates from changes in market prices on securities held. Such changes are included in net realized and unrealized gain or loss from investments in the Statement of Operations.
Realized foreign exchange gains or losses arise from sales of foreign currencies, currency gains or losses realized between the trade and settlement dates on securities transactions and the difference between the recorded amounts of dividends, interest, and foreign withholding taxes and the U.S. dollar equivalent of the amounts actually received or paid. Net unrealized foreign exchange gains and losses arise from changes in foreign exchange rates on foreign denominated assets and liabilities other than investments in securities held at the end of the reporting period.
c. Securities Purchased on a TBA Basis
The Fund purchases securities on a to-be-announced (TBA) basis, with payment and delivery scheduled for a future date. These transactions are subject to market fluctuations and are subject to the risk that the value at delivery may be more or less than the trade date purchase price. Sufficient assets have been segregated for these securities.
d. Derivative Financial Instruments
The Fund invested in derivatives in order to manage risk or gain exposure to various other investments or markets. Derivatives are financial contracts based on an underlying or notional amount, require no initial investment or an initial net investment that is smaller than would normally be required to have a similar response to changes in market factors, and require or permit net settlement. Derivatives contain various risks including the potential inability of the counterparty to fulfill their obligations under the terms of the contract, the potential for an illiquid secondary market, and/or the potential for market movements which expose the Fund to gains or losses in excess of the amounts shown in the Statement of Assets and Liabilities. Realized gain and loss and unrealized appreciation and depreciation on these contracts for the period are included in the Statement of Operations.
Collateral requirements differ by type of derivative. Collateral or initial margin requirements are set by the broker or exchange clearing house for exchange traded and centrally cleared derivatives. Initial margin deposited is held at the exchange and can be in the form of cash and/or securities. For OTC derivatives traded under an ISDA master agreement, posting of collateral is required by either the Fund or the applicable coun-terparty if the total net exposure of all OTC derivatives with the applicable counterparty exceeds the minimum transfer amount, which typically ranges from $100,000 to $250,000, and can vary depending on the counterparty and the type of the agreement. Generally, collateral is determined at the close of Fund business each day and any additional collateral required due to changes in derivative values may be delivered by the Fund or the counterparty within a few business days. Collateral pledged and/or received by the Fund for OTC derivatives, if any, is held in segregated accounts with the Fund’s custodian/counterparty broker and can be in the form of cash and/or securities. Unrestricted cash may be invested according to the Fund’s
32 Annual Report
franklintempleton.com
FRANKLIN STRATEGIC SERIES
NOTES TO FINANCIAL STATEMENTS
Franklin Flexible Alpha Bond Fund (continued)
investment objectives. To the extent that the amounts due to the Fund from its counterparties are not subject to collateralization or are not fully collateralized, the Fund bears the risk of loss from counterparty non-performance.
The Fund entered into exchange traded financial futures contracts primarily to manage and/or gain exposure to interest rate risk. A futures contract is an agreement between the Fund and a counterparty to buy or sell an asset for a specified price on a future date. Required initial margins are pledged by the Fund, and the daily change in fair value is accounted for as a variation margin payable or receivable in the Statement of Assets and Liabilities.
The Fund entered into OTC forward exchange contracts primarily to manage and/or gain exposure to certain foreign currencies. A forward exchange contract is an agreement between the Fund and a counterparty to buy or sell a foreign currency at a specific exchange rate on a future date.
The Fund entered into credit default swap contracts primarily to manage and/or gain exposure to credit risk. A credit default swap is an agreement between the Fund and a counterparty whereby the buyer of the contract receives credit protection and the seller of the contract guarantees the credit worthiness of a referenced debt obligation. These agreements may be privately negotiated in the over-the-counter market (OTC credit default swaps) or may be executed in a multilateral trade facility platform, such as a registered exchange (centrally cleared credit default swaps). The underlying referenced debt obligation may be a single issuer of corporate or sovereign debt, a credit index, a basket of issuers or indices, or a tranche of a credit index or basket of issuers or indices. In the event of a default of the underlying referenced debt obligation, the buyer is entitled to receive the notional amount of the credit default swap contract from the seller in exchange for the referenced debt obligation, a net settlement amount equal to the notional amount of the credit default swap less the recovery value of the referenced debt obligation, or other agreed upon amount. For centrally cleared credit default swaps, required initial margins are pledged by the Fund, and the daily change in fair value is accounted for as a variation margin payable or receivable in the Statement of Assets and Liabilities. Over the term of the contract, the buyer pays the seller a periodic stream of payments, provided that no event of default has occurred. Such periodic payments are accrued daily as an unrealized appreciation or depreciation until the payments are made, at which time they are realized. Upfront payments and receipts are reflected in the Statements of Assets and Liabilities and represent compensating factors between stated terms of the credit default swap agreement and prevailing market conditions (credit spreads and other relevant factors). These upfront payments and receipts are amortized over the term of the contract as a realized gain or loss in the Statement of Operations.
The Fund entered into interest rate swap contracts primarily to manage interest rate risk. An interest rate swap is an agreement between the Fund and a counterparty to exchange cash flows based on the difference between two interest rates, applied to a notional amount. These agreements may be privately negotiated in the over-the-counter market (OTC interest rate swaps) or may be executed on a registered exchange (centrally cleared interest rate swaps). For centrally cleared interest rate swaps, required initial margins are pledged by the Fund, and the daily change in fair value is accounted for as a variation margin payable or receivable in the Statement of Assets and Liabilities. Over the term of the contract, contractually required payments to be paid and to be received are accrued daily and recorded as unrealized depreciation and appreciation until the payments are made, at which time they are realized.
The Fund purchased or wrote exchange traded and/or OTC option contracts primarily to manage and/or gain exposure to interest rate, foreign exchange rate, and credit risk. An option is a contract entitling the holder to purchase or sell a specific amount of shares or units of an asset or notional amount of a swap (swaption), at a specified price. When an option is purchased or written, an amount equal to the premium paid or received is recorded as an asset or liability, respectively. Upon exercise of an option, the acquisition cost or sales proceeds of the underlying investment is adjusted by any premium received or paid. Upon expiration of an option, any premium received or paid is recorded as a realized gain or loss. Upon closing an option other than through expiration or exercise, the difference between the premium received or paid and the cost to close the position is recorded as a realized gain or loss.
See Notes 6 and 8 regarding investment transactions and other derivative information, respectively.
e. Mortgage Dollar Rolls
The Fund enters into mortgage dollar rolls, typically on a TBA basis. Mortgage dollar rolls are agreements between the Fund and a financial institution where the Fund sells (or buys) mortgage-backed securities for delivery on a specified date and simultaneously contracts to repurchase (or sell) substantially similar (same type, coupon, and maturity) securities at a future
franklintempleton.com
Annual Report
33
FRANKLIN STRATEGIC SERIES
NOTES TO FINANCIAL STATEMENTS
Franklin Flexible Alpha Bond Fund (continued)
1. Organization and Significant Accounting
Policies (continued)
e. Mortgage Dollar Rolls (continued)
date and at a predetermined price. Gains or losses are realized on the initial sale, and the difference between the repurchase price and the sale price is recorded as an unrealized gain or loss to the Fund upon entering into the mortgage dollar roll. In addition, the Fund may invest the cash proceeds that are received from the initial sale. During the period between the sale and repurchase, the Fund is not entitled to principal and interest paid on the mortgage backed securities. Transactions in mortgage dollar rolls are accounted for as purchases and sales and may result in an increase to the Fund’s portfolio turnover rate. The risks of mortgage dollar roll transactions include the potential inability of the counterparty to fulfill its obligations.
f. Income and Deferred Taxes
It is the Fund’s policy to qualify as a regulated investment company under the Internal Revenue Code. The Fund intends to distribute to shareholders substantially all of its taxable income and net realized gains to relieve it from federal income and excise taxes. As a result, no provision for U.S. federal income taxes is required.
The Fund may be subject to foreign taxation related to income received, capital gains on the sale of securities and certain foreign currency transactions in the foreign jurisdictions in which it invests. Foreign taxes, if any, are recorded based on the tax regulations and rates that exist in the foreign markets in which the Fund invests. When a capital gain tax is determined to apply, the Fund records an estimated deferred tax liability in an amount that would be payable if the securities were disposed of on the valuation date.
The Fund may recognize an income tax liability related to its uncertain tax positions under U.S. GAAP when the uncertain tax position has a less than 50% probability that it will be sustained upon examination by the tax authorities based on its technical merits. As of April 30, 2016, the Fund has determined that no tax liability is required in its financial statements related to uncertain tax positions for any open tax years (or expected to be taken on future tax returns). Open tax years are those that remain subject to examination and are based on each tax jurisdiction’s statute of limitation.
g. Security Transactions, Investment Income, Expenses and Distributions
Security transactions are accounted for on trade date. Realized gains and losses on security transactions are determined on a specific identification basis. Interest income and estimated expenses are accrued daily. Amortization of premium and accretion of discount on debt securities are included in interest income. Paydown gains and losses are recorded as an adjustment to interest income. Dividends from net investment income are normally declared daily; these dividends may be reinvested or paid monthly to shareholders. Distributions to shareholders are determined according to income tax regulations (tax basis). Distributable earnings determined on a tax basis may differ from earnings recorded in accordance with U.S. GAAP. These differences may be permanent or temporary. Permanent differences are reclassified among capital accounts to reflect their tax character. These reclassifications have no impact on net assets or the results of operations. Temporary differences are not reclassified, as they may reverse in subsequent periods.
Common expenses incurred by the Trust are allocated among the Funds based on the ratio of net assets of each Fund to the combined net assets of the Trust. Fund specific expenses are charged directly to the fund that incurred the expense.
Net investment income, not including class specific expenses, is allocated daily to each class of shares based upon the relative value of the settled shares of each class. Realized and unrealized gains and losses are allocated daily to each class of shares based upon the relative proportion of net assets of each class. Differences in per share distributions, by class, are generally due to differences in class specific expenses.
Inflation-indexed bonds are adjusted for inflation through periodic increases or decreases in the security’s interest accruals, face amount, or principal redemption value, by amounts corresponding to the rate of inflation as measured by an index. Any increase or decrease in the face amount or principal redemption value will be included as interest income in the Statement of Operations.
h. Offering Costs
Offering costs are amortized on a straight line basis over twelve months.
i. Accounting Estimates
The preparation of financial statements in accordance with U.S. GAAP requires management to make estimates and assumptions that affect the reported amounts of assets and liabilities at
34 Annual Report
franklintempleton.com
FRANKLIN STRATEGIC SERIES
NOTES TO FINANCIAL STATEMENTS
Franklin Flexible Alpha Bond Fund (continued)
the date of the financial statements and the amounts of income and expenses during the reporting period. Actual results could differ from those estimates.
j. Guarantees and Indemnifications
Under the Trust’s organizational documents, its officers and trustees are indemnified by the Trust against certain liabilities arising out of the performance of their duties to the Trust. Addi-
tionally, in the normal course of business, the Trust, on behalf of the Fund, enters into contracts with service providers that contain general indemnification clauses. The Trust’s maximum exposure under these arrangements is unknown as this would involve future claims that may be made against the Trust that have not yet occurred. Currently, the Trust expects the risk of loss to be remote.
2. Shares of Beneficial Interest
At April 30, 2016, there were an unlimited number of shares authorized (without par value). Transactions in the Fund’s shares were as follows:
| Period Ended | ||||||
| April 30, 2016a | ||||||
| Shares | Amount | |||||
| Class A Shares: | ||||||
| Shares sold | 1,055,699 | $ | 10,552,738 | |||
| Shares issued in reinvestment of distributions | 319 | 3,152 | ||||
| Shares redeemed | (23,678 | ) | (233,848 | ) | ||
| Net increase (decrease) | 1,032,340 | $ | 10,322,042 | |||
| Class C Shares: | ||||||
| Shares sold | 44,749 | $ | 442,689 | |||
| Shares issued in reinvestment of distributions | 108 | 1,064 | ||||
| Shares redeemed | (24,195 | ) | (239,153 | ) | ||
| Net increase (decrease) | 20,662 | $ | 204,600 | |||
| Class R Shares: | ||||||
| Shares sold | 1,000 | $ | 10,000 | |||
| Net increase (decrease) | 1,000 | $ | 10,000 | |||
| Class R6 Shares: | ||||||
| Shares sold | 1,000 | $ | 10,000 | |||
| Net increase (decrease) | 1,000 | $ | 10,000 | |||
| Advisor Class Shares: | ||||||
| Shares sold | 45,294 | $ | 447,368 | |||
| Shares issued in reinvestment of distributions | 177 | 1,748 | ||||
| Shares redeemed | (10,624 | ) | (105,081 | ) | ||
| Net increase (decrease) | 34,847 | $ | 344,035 | |||
| aFor the period August 3, 2015 (commencement of operations) to April 30, 2016. | ||||||
franklintempleton.com
Annual Report
35
FRANKLIN STRATEGIC SERIES
NOTES TO FINANCIAL STATEMENTS
Franklin Flexible Alpha Bond Fund (continued)
3. Transactions with Affiliates
Franklin Resources, Inc. is the holding company for various subsidiaries that together are referred to as Franklin Templeton Investments. Certain officers and trustees of the Fund are also officers and/or directors of the following subsidiaries:
| Subsidiary | Affiliation |
| Franklin Advisers, Inc. (Advisers) | Investment manager |
| Franklin Templeton Institutional, LLC (FT Institutional) | Investment manager |
| Franklin Templeton Services, LLC (FT Services) | Administrative manager |
| Franklin Templeton Distributors, Inc. (Distributors) | Principal underwriter |
| Franklin Templeton Investor Services, LLC (Investor Services) | Transfer agent |
a. Management Fees
The Fund pays an investment management fee to Advisers based on the average daily net assets of the Fund as follows:
| Annualized Fee Rate | Net Assets | |
| 0.550 | % | Up to and including $1 billion |
| 0.500 | % | Over $1 billion, up to and including $5 billion |
| 0.450 | % | Over $5 billion, up to and including $10 billion |
| 0.445 | % | Over $10 billion, up to and including $15 billion |
| 0.440 | % | Over $15 billion, up to and including $20 billion |
| 0.435 | % | In excess of $20 billion |
For the period ended April 30, 2016, the effective investment management fee rate was 0.550% of the Fund’s average daily net assets.
Under a subadvisory agreement, FT Instituitional, an affiliate of Advisers, provides subadvisory services to the Fund. The sub-advisory fee is paid by Advisers based on the Fund’s average daily net assets, and is not an additional expense of the Fund.
b. Administrative Fees
Under an agreement with Advisers, FT Services provides administrative services to the Fund. The fee is paid by Advisers based on the Fund’s average daily net assets, and is not an additional expense of the Fund.
c. Distribution Fees
The Board has adopted distribution plans for each share class, with the exception of Class R6 and Advisor Class shares, pursuant to Rule 12b-1 under the 1940 Act. Under the Fund’s Class A reimbursement distribution plan, the Fund reimburses Distributors for costs incurred in connection with the servicing, sale and distribution of the Fund’s shares up to the maximum annual plan rate. Under the Class A reimbursement distribution plan, costs exceeding the maximum for the current plan year cannot be reimbursed in subsequent periods. In addition, under the Fund’s Class C and R compensation distribution plans, the Fund pays Distributors for costs incurred in connection with the servicing, sale and distribution of the Fund’s shares up to the maximum annual plan rate for each class. The plan year, for purposes of monitoring compliance with the maximum annual plan rates, is February 1 through January 31.
The maximum annual plan rates, based on the average daily net assets, for each class, are as follows:
| Class A | 0.25 | % |
| Class C | 0.65 | % |
| Class R | 0.50 | % |
36 Annual Report
franklintempleton.com
FRANKLIN STRATEGIC SERIES
NOTES TO FINANCIAL STATEMENTS
Franklin Flexible Alpha Bond Fund (continued)
d. Sales Charges/Underwriting Agreements
Front-end sales charges and contingent deferred sales charges (CDSC) do not represent expenses of the Fund. These charges are deducted from the proceeds of sales of Fund shares prior to investment or from redemption proceeds prior to remittance, as applicable. Distributors has advised the Fund of the following commission transactions related to the sales and redemptions of the Fund’s shares for the period:
| Sales charges retained net of commissions paid to unaffiliated broker/dealers | $ | 429 |
| CDSC retained | $ | — |
e. Transfer Agent Fees
Each class of shares, except for Class R6, pays transfer agent fees to Investor Services for its performance of shareholder servicing obligations and reimburses Investor Services for out of pocket expenses incurred, including shareholder servicing fees paid to third parties. These fees are allocated daily based upon their relative proportion of such classes’ aggregate net assets. Class R6 pays Investor Services transfer agent fees specific to that class.
For the period ended April 30, 2016, the Fund paid transfer agent fees of $1,030, of which $564 was retained by Investor Services.
f. Investments in Affiliated Management Investment Companies
The Fund invests in an affiliated management investment company for purposes other than exercising a controlling influence over the management or policies. Management fees paid by the Fund are waived on assets invested in the affiliated management investment company, as noted in the Statement of Operations, in an amount not to exceed the management and administrative fees paid directly or indirectly by each affiliate.
| % of Affiliated | |||||||||||
| Number of | Number of | Fund Shares | |||||||||
| Shares Held | Shares Held | Value | Outstanding | ||||||||
| at Beginning | Gross | Gross | at End | at End | Investment | Realized | Held at End | ||||
| of Period | Additions | Reductions | of Period | of Period | Income | Gain (Loss) | of Period | ||||
| Non-Controlled Affiliates | |||||||||||
| Institutional Fiduciary | |||||||||||
| Trust Money Market | |||||||||||
| Portfolio | — | 13,048,530 | (11,014,992 | ) | 2,033,538 | $ | 2,033,538 | $ — | $ — | 0.01 | % |
g. Waiver and Expense Reimbursements
Advisers has contractually agreed in advance to waive or limit its fees and to assume as its own expense certain expenses otherwise payable by the Fund so that the expenses (excluding distribution fees, and acquired fund fees and expenses) for Class A, Class C, Class R and Advisor Class of the Fund do not exceed 0.85%, and Class R6 does not exceed 0.71% based on the average net assets of each class (other than certain non-routine expenses or costs, including those relating to litigation, indemnification, reorganizations, and liquidations) until August 31, 2016.
h. Other Affiliated Transactions
At April 30, 2016, Franklin Resources, Inc. owned 91.57% of the Fund’s outstanding shares.
4. Expense Offset Arrangement
The Funds have entered into an arrangement with their custodian whereby credits realized as a result of uninvested cash balances are used to reduce a portion of the Fund’s custodian expenses. During the period ended April 30, 2016, there were no credits earned.
5. Income Taxes
For tax purposes, capital losses may be carried over to offset future capital gains, if any.
franklintempleton.com
Annual Report
37
FRANKLIN STRATEGIC SERIES
NOTES TO FINANCIAL STATEMENTS
| Franklin Flexible Alpha Bond Fund (continued) | |||
| 5. Income Taxes (continued) | |||
| At April 30, 2016, capital loss carryforwards were as follows: | |||
| Capital loss carryforwards: | |||
| Short term | $ | (140,918 | ) |
| Long term | (35,061 | ) | |
| Total capital loss carryforwards | $ | (175,979 | ) |
The tax character of distributions paid during the period ended April 30, 2016 was as follows:
| Distributions paid from ordinary income | $ | 101,681 |
At April 30, 2016, the cost of investments, net unrealized appreciation (depreciation) and undistributed ordinary income for income tax purposes were as follows:
| Cost of investments | $ | 10,672,924 | |
| Unrealized appreciation | 159,924 | ||
| Unrealized depreciation | (58,685 | ) | |
| Net unrealized appreciation (depreciation) | $ | 101,239 | |
| Distributable earnings – undistributed ordinary income | $ | 19,748 |
Differences between income and/or capital gains as determined on a book basis and a tax basis are primarily due to differing treatments of foreign currency transactions, bond discounts and premiums, and swaps.
6. Investment Transactions
Purchases and sales of investments (excluding short term securities) for the period ended April 30, 2016, aggregated $12,893,578 and $3,347,570, respectively.
Transactions in options and swaptions written during the period ended April 30, 2016, were as follows:
| Options | Swaptions | ||||||||||||||||||
| Notional Notional | Notional | Notional Notional | |||||||||||||||||
| Amount | Amount* | Amount* | Premiums | Amount | Amount* | Premiums | |||||||||||||
| Options outstanding at August 3, | |||||||||||||||||||
| 2015 | $ | — $ | — | $ | — | $ | — | $ | — $ | — | $ | — | |||||||
| Options written | 810,000 | 250,000 | AUD | 500,000 | EUR | 13,655 | 7,600,000 | 300,000 | EUR | 45,415 | |||||||||
| Options expired | (610,000 | ) | — | (250,000 | ) EUR | (6,278 | ) | (2,800,000 | ) | (150,000 | ) EUR | (19,834 | ) | ||||||
| Options exercised | — | — | — | — | — | — | — | ||||||||||||
| Options closed | (30,000 | ) | (250,000 | ) AUD | (250,000 | ) EUR | (4,768 | ) | (3,500,000 | ) | (150,000 | ) EUR | (18,446 | ) | |||||
| Options outstanding at April 30, | |||||||||||||||||||
| 2016 | $ | 170,000 | $ | — | $ | — | $ | 2,609 | $ | 1,300,000 | $ | — | $ | 7,135 | |||||
| *The notional amount is stated in U.S. dollars unless otherwise indicated. | |||||||||||||||||||
See Notes 1(d) and 8 regarding derivative financial instruments and other derivative information, respectively.
7. Credit Risk
At April 30, 2016, the Fund had 12.80% of its portfolio invested in high yield or other securities rated below investment grade. These securities may be more sensitive to economic conditions causing greater price volatility and are potentially subject to a greater risk of loss due to default than higher rated securities.
38 Annual Report
franklintempleton.com
FRANKLIN STRATEGIC SERIES
NOTES TO FINANCIAL STATEMENTS
Franklin Flexible Alpha Bond Fund (continued)
8. Other Derivative Information
At April 30, 2016, the Fund’s investments in derivative contracts are reflected in the Statement of Assets and Liabilities as follows:
| Asset Derivatives | Liability Derivatives | |||||||
| Derivative Contracts | ||||||||
| Not Accounted for as | Statement of Assets and | Statement of Assets and | ||||||
| Hedging Instruments | Liabilities Location | Fair Value | Liabilities Location | Fair Value | ||||
| Interest rate contracts | Variation margin | $ | 701 | a | Variation margin | $ | 26,755 | a |
| Investments in securities, at value | 12,002 | b | ||||||
| Foreign exchange contracts | Investments in securities, at value | 429 | b | Options written, at value | 49 | |||
| Unrealized appreciation on OTC | 7,595 | Unrealized depreciation on OTC | 43,492 | |||||
| forward exchange contracts | forward exchange contracts | |||||||
| Credit contracts | Investments in Securities, at value | 10,973 | b | Options written, at value | 4,199 | |||
| Variation margin | 256 | a | Variation margin | 5 | a | |||
| Unrealized appreciation on OTC | 10,321 | Unrealized depreciation on OTC | 21,964 | |||||
| swap contracts | swap contracts | |||||||
| OTC swap contracts (premiums | 2,162 | OTC swap contracts (premiums | 95,307 | |||||
| paid) | received) | |||||||
| Totals | $ | 44,439 | $ | 191,771 | ||||
aThis amount reflects the cumulative appreciation (depreciation) of future contracts and centrally cleared swaps contracts as reported in the Statement of Investments. Only
the variation margin receivable/payable at period end is separately reported within the Statement of Assets and Liabilities. Prior variation margin movements were recorded to
cash upon receipt or payment.
bPurchased option contracts are included in investments in securities, at value in the Statement of Assets and Liabilities.
For the period ended April 30, 2016, the effect of derivative contracts in the Fund’s Statement of Operations was as follows:
| Net Change in | ||||||||
| Unrealized | ||||||||
| Derivative Contracts | Net Realized | Appreciation | ||||||
| Not Accounted for as | Statement of Operations | Gain (Loss) | Statement of Operations | (Depreciation) | ||||
| Hedging Instruments | Locations | for the Period | Locations | for the Period | ||||
| Net realized gain (loss) from: | Net change in unrealized | |||||||
| appreciation (depreciation) on: | ||||||||
| Interest rate contracts | Written options | $ | — | Written options | $ | 2,609 | ||
| Futures contracts | (41,296 | ) | Futures contracts | (18,889 | ) | |||
| Swap contracts | (28,524 | ) | Swap contracts | (7,165 | ) | |||
| Foreign exchange contracts | Investments | — | Investments | (5,131 | )a | |||
| Written options | — | Written options | 651 | |||||
| Foreign currency | (13,113 | )b | Translation of other assets and | |||||
| transactions | liabilities denominated in | |||||||
| foreign currencies | (35,897 | )b | ||||||
| Credit contracts | Investments | — | Investments | (2,369 | )a | |||
| Written options | 23,844 | Written options | 2,236 | |||||
| Swap contracts | (2,185 | ) | Swap contracts | (11,392 | ) | |||
| Totals | $ | (61,274 | ) | $ | (75,347 | ) |
aPurchased option contracts are included in net realized gain (loss) from investments and net change in unrealized appreciation (depreciation) on investments in the Statement
of Operations.
bForward exchange contracts are included in net realized gain (loss) from foreign currency transactions and net change in unrealized appreciation (depreciation) on translation
of other assets and liabilities denominated in foreign currencies in the Statement of Operations.
franklintempleton.com
Annual Report
39
FRANKLIN STRATEGIC SERIES
NOTES TO FINANCIAL STATEMENTS
Franklin Flexible Alpha Bond Fund (continued)
8. Other Derivative Information (continued)
For the period ended April 30, 2016, the average month end fair value of derivatives represented 1.42% of average month end net assets. The average month end number of open derivative contracts for the period was 75.
At April 30, 2016, the Fund’s OTC derivative assets and liabilities are as follows:
| Gross and Net Amounts | ||||
| of Assets and Liabilities | ||||
| Presented in the | ||||
| Statement of | ||||
| Assets and Liabilities | ||||
| Assetsa | Liabilitiesa | |||
| Derivatives | ||||
| Forward exchange contracts | $ | 7,595 | $ | 43,492 |
| Options purchased | 23,404 | — | ||
| Options Written | — | 4,248 | ||
| Swap Contracts | 12,481 | 117,269 | ||
| Total | $ | 43,480 | $ | 165,009 |
aAbsent an event of default or early termination, OTC derivative assets and liabilities are presented gross and not offset in the Statement of Assets and Liabilities.
At April 30, 2016, the Fund’s OTC derivative assets, which may be offset against the Fund’s OTC derivative liabilities and collateral received from the counterparty, are as follows:
| Amounts Not Offset in the | |||||||||||
| Statement of Assets and Liabilities | |||||||||||
| Gross and Net | |||||||||||
| Amounts of Assets | Financial | ||||||||||
| Presented in the | Financial | Instruments | Cash | ||||||||
| Statement of | Instruments | Collateral | Collateral | Net Amount (Not | |||||||
| Assets and Liabilities | Available for Offset | Received | Received | less than zero) | |||||||
| Counterparty | |||||||||||
| BZWS | $ | 5,951 | $ | (5,951 | ) | $ | — | $ | — | $ | — |
| CITI | 12,937 | (12,937 | ) | — | — | — | |||||
| GSCO | 2,332 | (2,332 | ) | — | — | — | |||||
| JPHQ | 14,665 | (14,665 | ) | — | — | — | |||||
| RBS | 2,485 | (2,485 | ) | — | — | — | |||||
| UBSW | 5,110 | (5,110 | ) | — | — | — | |||||
| Total | $ | 43,480 | $ | (43,480 | ) | $ | — | $ | — | $ | — |
40 Annual Report
franklintempleton.com
FRANKLIN STRATEGIC SERIES
NOTES TO FINANCIAL STATEMENTS
Franklin Flexible Alpha Bond Fund (continued)
At April 30, 2016, the Fund’s OTC derivative liabilities, which may be offset against the Fund’s OTC derivative assets and collateral pledged to the counterparty, are as follows:
| Amounts Not Offset in the | |||||||||||
| Statement of Assets and Liabilities | |||||||||||
| Gross and Net | |||||||||||
| Amounts of Liabilities | Financial | ||||||||||
| Presented in the | Financial | Instruments | Cash | ||||||||
| Statement of | Instruments | Collateral | Collateral | Net Amount (Not | |||||||
| Assets and Liabilities | Available for Offset | Pledged | Pledged | less than zero) | |||||||
| Counterparty | |||||||||||
| BZWS | $ | 35,162 | $ | (5,951 | ) | $ | — | $ | — | $ | 29,211 |
| CITI | 49,759 | (12,937 | ) | — | — | 36,822 | |||||
| GSCO | 10,585 | (2,332 | ) | — | — | 8,253 | |||||
| JPHQ | 28,707 | (14,665 | ) | — | — | 14,042 | |||||
| RBS | 14,636 | (2,485 | ) | — | — | 12,151 | |||||
| UBSW | 26,160 | (5,110 | ) | — | — | 21,050 | |||||
| Total | $ | 165,009 | $ | (43,480 | ) | $ | — | $ | — | $ | 121,529 |
9. Credit Facility
The Fund, together with other U.S. registered and foreign investment funds (collectively, Borrowers), managed by Franklin Temple-ton Investments, are borrowers in a joint syndicated senior unsecured credit facility totaling $2 billion (Global Credit Facility) which matures on February 10, 2017. This Global Credit Facility provides a source of funds to the Borrowers for temporary and emergency purposes, including the ability to meet future unanticipated or unusually large redemption requests. The Fund began participating in the Global Credit Facility on February 12, 2016.
Under the terms of the Global Credit Facility, the Fund shall, in addition to interest charged on any borrowings made by the Fund and other costs incurred by the Fund, pay its share of fees and expenses incurred in connection with the implementation and maintenance of the Global Credit Facility, based upon its relative share of the aggregate net assets of all of the Borrowers, including an annual commitment fee of 0.07% based upon the unused portion of the Global Credit Facility. Effective February 12, 2016, the annual commitment fee is 0.15%. These fees are reflected in other expenses in the Statement of Operations. During the period ended April 30, 2016, the Fund did not use the Global Credit Facility.
10. Fair Value Measurements
The Fund follows a fair value hierarchy that distinguishes between market data obtained from independent sources (observable inputs) and the Fund’s own market assumptions (unobservable inputs). These inputs are used in determining the value of the Fund’s financial instruments and are summarized in the following fair value hierarchy:
- Level 1 – quoted prices in active markets for identical financial instruments
- Level 2 – other significant observable inputs (including quoted prices for similar financial instruments, interest rates, prepay- ment speed, credit risk, etc.)
- Level 3 – significant unobservable inputs (including the Fund’s own assumptions in determining the fair value of finan- cial instruments)
The input levels are not necessarily an indication of the risk or liquidity associated with financial instruments at that level.
For movements between the levels within the fair value hierarchy, the Fund has adopted a policy of recognizing the transfers as of the date of the underlying event which caused the movement.
franklintempleton.com
Annual Report
41
FRANKLIN STRATEGIC SERIES
NOTES TO FINANCIAL STATEMENTS
Franklin Flexible Alpha Bond Fund (continued)
10. Fair Value Measurements (continued)
A summary of inputs used as of April 30, 2016, in valuing the Fund’s assets and liabilities carried at fair value, is as follows:
| Level 1 | Level 2 | Level 3 | Total | |||||
| Assets: | ||||||||
| Investments in Securities | ||||||||
| Management Investment Companies | $ | 163,939 | $ | — | $ | — | $ | 163,939 |
| Corporate Bonds | — | 4,045,794 | — | 4,045,794 | ||||
| Foreign Government and Agency Securities | — | 269,351 | — | 269,351 | ||||
| U.S. Government and Agency Securities | — | 577,832 | — | 577,832 | ||||
| Asset-Backed Securities and Commercial Mortgage-Backed Securities | — | 2,887,260 | — | 2,887,260 | ||||
| Mortgage-Backed Securities | — | 258,707 | — | 258,707 | ||||
| Municipal Bonds | — | 514,338 | — | 514,338 | ||||
| Options Purchased | — | 23,404 | — | 23,404 | ||||
| Short Term Investments | 2,033,538 | — | — | 2,033,538 | ||||
| Total Investments in Securities | $ | 2,197,477 | $ | 8,576,686 | $ | — | $ | 10,774,163 |
| Other Financial Instruments | ||||||||
| Futures Contracts | $ | 701 | $ | — | $ | — | $ | 701 |
| Forward Exchange Contracts | — | 7,595 | — | 7,595 | ||||
| Swap Contracts | — | 10,577 | — | 10,577 | ||||
| Total Other Financial Instruments | $ | 701 | $ | 18,172 | $ | — | $ | 18,873 |
| Liabilities: | ||||||||
| Other Financial Instruments | ||||||||
| Options Written | $ | — | $ | 4,248 | $ | — | $ | 4,248 |
| Futures Contracts | 19,590 | — | — | 19,590 | ||||
| Forward Exchange Contracts | — | 43,492 | — | 43,492 | ||||
| Swap Contracts | — | 29,134 | — | 29,134 | ||||
| Total Other Financial Instruments | $ | 19,590 | $ | 76,874 | $ | — | $ | 96,464 |
11. Subsequent Events
The Fund has evaluated subsequent events through the issuance of the financial statements and determined that no events have occurred that require disclosure.
| Abbreviations | |||||
| Counterparty/Exchange | Currency | Selected Portfolio | |||
| BZWS | Barclays Bank PLC | AUD | Australian Dollar | CDO | Collateralized Debt Obligation |
| CITI | Citigroup, Inc. | CAD | Canadian Dollar | CLO | Collateralized Loan Obligation |
| GSCO | Goldman Sachs Group, Inc. | MXN | Mexican Peso | ETF | Exchange Traded Fund |
| ICE | Intercontinental Exchange | MYR | Malaysian Ringgit | FRN | Floating Rate Note |
| JPHQ | JP Morgan Chase & Co. | NZD | New Zealand Dollar | GO | General Obligation |
| RBS | Royal Bank of Scotland PL | USD | United States Dollar | LIBOR | London InterBank Offered Rate |
| UBSW | UBS AG | MFM | Multi-Family Mortgage | ||
| SF | Single Family | ||||
42 Annual Report
franklintempleton.com
FRANKLIN STRATEGIC SERIES
Report of Independent Registered Public Accounting Firm
To the Board of Trustees and Shareholders of Franklin Flexible Alpha Bond Fund
In our opinion, the accompanying statement of assets and liabilities, including the statement of investments, and the related statements of operations and of changes in net assets and the financial highlights present fairly, in all material respects, the financial position of The Franklin Flexible Alpha Bond Fund (the “Fund”) at April 30, 2016, and the results of its operations, the changes in its net assets and the financial highlights for the period August 3, 2015 (commencement of operations) through April 30, 2016, in conformity with accounting principles generally accepted in the United States of America. These financial statements and financial highlights (hereafter referred to as “financial statements”) are the responsibility of the Fund’s management. Our responsibility is to express an opinion on these financial statements based on our audits. We conducted our audits of these financial statements in accordance with the standards of the Public Company Accounting Oversight Board (United States). Those standards require that we plan and perform the audit to obtain reasonable assurance about whether the financial statements are free of material misstatement. An audit includes examining, on a test basis, evidence supporting the amounts and disclosures in the financial statements, assessing the accounting principles used and significant estimates made by management, and evaluating the overall financial statement presentation. We believe that our audit, which included confirmation of securities at April 30, 2016 by correspondence with the custodian, transfer agent and brokers, provide a reasonable basis for our opinion.
PricewaterhouseCoopers LLP
San Francisco, California
June 15, 2016
franklintempleton.com
Annual Report
43
FRANKLIN STRATEGIC SERIES
Tax Information (unaudited)
Under Section 871(k)(1)(C) of the Internal Revenue Code (Code), the Funds hereby report the maximum amount allowable but no less than $107,041 as interest related dividends for purposes of the tax imposed under Section 871(a)(1)(A) of the Code for the fiscal period ended April 30, 2016:
44 Annual Report
franklintempleton.com
FRANKLIN STRATEGIC SERIES
Board Members and Officers
The name, year of birth and address of the officers and board members, as well as their affiliations, positions held with the Trust, principal occupations during at least the past five years and number of U.S. registered portfolios overseen in the Franklin Templeton Investments fund complex, are shown below. Generally, each board member serves until that person’s successor is elected and qualified.
| Independent Board Members | ||||
| Number of Portfolios in | ||||
| Name, Year of Birth | Length of | Fund Complex Overseen | Other Directorships Held During | |
| and Address | Position | Time Served | by Board Member* | at Least the Past 5 Years |
| Harris J. Ashton (1932) | Trustee | Since 1991 | 145 | Bar-S Foods (meat packing company) |
| One Franklin Parkway | (1981-2010). | |||
| San Mateo, CA 94403-1906 | ||||
| Principal Occupation During at Least the Past 5 Years: | ||||
| Director of various companies; and formerly, Director, RBC Holdings, Inc. (bank holding company) (until 2002); and President, Chief | ||||
| Executive Officer and Chairman of the Board, General Host Corporation (nursery and craft centers) (until 1998). | ||||
| Mary C. Choksi (1950) | Trustee | Since 2014 | 121 | Avis Budget Group Inc. (car rental) |
| One Franklin Parkway | (2007-present), Omnicom Group Inc. | |||
| San Mateo, CA 94403-1906 | (advertising and marketing | |||
| communications services) | ||||
| (2011-present) and H.J. Heinz | ||||
| Company (processed foods and allied | ||||
| products) (1998-2006). | ||||
| Principal Occupation During at Least the Past 5 Years: | ||||
| Senior Advisor, Strategic Investment Group (investment management group) (2015-present); director of various companies; and formerly, | ||||
| Founding Partner and Senior Managing Director, Strategic Investment Group (1987-2015); Founding Partner and Managing Director, | ||||
| Emerging Markets Management LLC (investment management firm) (1987-2011); and Loan Officer/Senior Loan Officer/Senior Pension | ||||
| Investment Officer, World Bank Group (international financial institution) (1977-1987). | ||||
| Edith E. Holiday (1952) | Trustee | Since 1998 | 145 | Hess Corporation (exploration and |
| One Franklin Parkway | refining of oil and gas) (1993-present), | |||
| San Mateo, CA 94403-1906 | Canadian National Railway (railroad) | |||
| (2001-present), White Mountains | ||||
| Insurance Group, Ltd. (holding | ||||
| company) (2004-present), RTI | ||||
| International Metals, Inc. (manufacture | ||||
| and distribution of titanium) | ||||
| (1999-2015) and H.J. Heinz Company | ||||
| (processed foods and allied products) | ||||
| (1994-2013). | ||||
| Principal Occupation During at Least the Past 5 Years: | ||||
| Director or Trustee of various companies and trusts; and formerly, Assistant to the President of the United States and Secretary of the | ||||
| Cabinet (1990-1993); General Counsel to the United States Treasury Department (1989-1990); and Counselor to the Secretary and Assistant | ||||
| Secretary for Public Affairs and Public Liaison – United States Treasury Department (1988-1989). | ||||
| J. Michael Luttig (1954) | Trustee | Since 2009 | 145 | Boeing Capital Corporation (aircraft |
| One Franklin Parkway | financing) (2006-2013). | |||
| San Mateo, CA 94403-1906 | ||||
| Principal Occupation During at Least the Past 5 Years: | ||||
| Executive Vice President, General Counsel and member of the Executive Council, The Boeing Company (aerospace company) | ||||
| (2006-present); and formerly, Federal Appeals Court Judge, U.S. Court of Appeals for the Fourth Circuit (1991-2006). | ||||
| Frank A. Olson (1932) | Trustee | Since 2007 | 145 | Hess Corporation (exploration and |
| One Franklin Parkway | refining of oil and gas) (1998-2013). | |||
| San Mateo, CA 94403-1906 | ||||
| Principal Occupation During at Least the Past 5 Years: | ||||
| Director of various companies; and formerly, Chairman of the Board, The Hertz Corporation (car rental) (1980-2000) and Chief Executive | ||||
| Officer (1977-1999); and Chairman of the Board, President and Chief Executive Officer, UAL Corporation (airlines) (June-December 1987). | ||||
franklintempleton.com
Annual Report
45
FRANKLIN STRATEGIC SERIES
| Independent Board Members (continued) | |||||
| Number of Portfolios in | |||||
| Name, Year of Birth | Length of | Fund Complex Overseen | Other Directorships Held During | ||
| and Address | Position | Time Served | by Board Member* | at Least the Past 5 Years | |
| Larry D. Thompson (1945) | Trustee | Since 2007 | 145 | The Southern Company (energy | |
| One Franklin Parkway | company) (2014-present; previously | ||||
| San Mateo, CA 94403-1906 | 2010-2012), Graham Holdings | ||||
| Company (education and media | |||||
| organization) (2011-present) and | |||||
| Cbeyond, Inc. (business | |||||
| communications provider) | |||||
| (2010-2012). | |||||
| Principal Occupation During at Least the Past 5 Years: | |||||
| Director of various companies; John A. Sibley Professor of Corporate and Business Law, University of Georgia School of Law (2015-present; | |||||
| previously 2011-2012); and formerly, Executive Vice President – Government Affairs, General Counsel and Corporate Secretary, PepsiCo, | |||||
| Inc. (consumer products) (2012-2014); Senior Vice President – Government Affairs, General Counsel and Secretary, PepsiCo, Inc. | |||||
| (2004-2011); Senior Fellow of The Brookings Institution (2003-2004); Visiting Professor, University of Georgia School of Law (2004); and | |||||
| Deputy Attorney General, U.S. Department of Justice (2001-2003). | |||||
| John B. Wilson (1959) | Lead | Trustee since | 121 | None | |
| One Franklin Parkway | Independent | 2006 and Lead | |||
| San Mateo, CA 94403-1906 | Trustee | Independent | |||
| Trustee | |||||
| since 2008 | |||||
| Principal Occupation During at Least the Past 5 Years: | |||||
| President, Staples Europe (office supplies) (2012-present); President and Founder, Hyannis Port Capital, Inc. (real estate and private equity | |||||
| investing); serves on private and non-profit boards; and formerly, Chief Operating Officer and Executive Vice President, Gap, Inc. (retail) | |||||
| (1996-2000); Chief Financial Officer and Executive Vice President – Finance and Strategy, Staples, Inc. (1992-1996); Senior Vice President – | |||||
| Corporate Planning, Northwest Airlines, Inc. (airlines) (1990-1992); and Vice President and Partner, Bain & Company (consulting firm) | |||||
| (1986-1990). | |||||
| Interested Board Members and Officers | |||||
| Number of Portfolios in | |||||
| Name, Year of Birth | Length of | Fund Complex Overseen | Other Directorships Held During | ||
| and Address | Position | Time Served | by Board Member* | at Least the Past 5 Years | |
| **Gregory E. Johnson (1961) | Trustee | Since 2013 | 160 | None | |
| One Franklin Parkway | |||||
| San Mateo, CA 94403-1906 | |||||
| Principal Occupation During at Least the Past 5 Years: | |||||
| Chairman of the Board, Member–Office of the Chairman, Director and Chief Executive Officer, Franklin Resources, Inc.; officer and/or director | |||||
| or trustee, as the case may be, of some of the other subsidiaries of Franklin Resources, Inc. and of 44 of the investment companies in Franklin | |||||
| Templeton Investments; Vice Chairman, Investment Company Institute; and formerly, President, Franklin Resources, Inc. (1994-2015). | |||||
| **Rupert H. Johnson, Jr. (1940) | Chairman of | Chairman of the | 145 | None | |
| One Franklin Parkway | the Board | Board since | |||
| San Mateo, CA 94403-1906 | and Trustee | 2013 and | |||
| Trustee | |||||
| since 1991 | |||||
| Principal Occupation During at Least the Past 5 Years: | |||||
| Vice Chairman, Member – Office of the Chairman and Director, Franklin Resources, Inc.; Director, Franklin Advisers, Inc.; Senior Vice | |||||
| President, Franklin Advisory Services, LLC; and officer and/or director or trustee, as the case may be, of some of the other subsidiaries of | |||||
| Franklin Resources, Inc. and of 42 of the investment companies in Franklin Templeton Investments. | |||||
46 Annual Report
franklintempleton.com
FRANKLIN STRATEGIC SERIES
| Interested Board Members and Officers (continued) | ||||
| Number of Portfolios in | ||||
| Name, Year of Birth | Length of | Fund Complex Overseen | Other Directorships Held During | |
| and Address | Position | Time Served | by Board Member* | at Least the Past 5 Years |
| Alison E. Baur (1964) | Vice | Since 2012 | Not Applicable | Not Applicable |
| One Franklin Parkway | President | |||
| San Mateo, CA 94403-1906 | ||||
| Principal Occupation During at Least the Past 5 Years: | ||||
| Deputy General Counsel, Franklin Templeton Investments; and officer of some of the other subsidiaries of Franklin Resources, Inc. and of 45 | ||||
| of the investment companies in Franklin Templeton Investments. | ||||
| Laura F. Fergerson (1962) | Chief | Since 2009 | Not Applicable | Not Applicable |
| One Franklin Parkway | Executive | |||
| San Mateo, CA 94403-1906 | Officer – | |||
| Finance and | ||||
| Administration | ||||
| Principal Occupation During at Least the Past 5 Years: | ||||
| Senior Vice President, Franklin Templeton Services, LLC; Vice President, Franklin Advisers, Inc. and Franklin Templeton Institutional, LLC; | ||||
| and officer of 45 of the investment companies in Franklin Templeton Investments. | ||||
| Gaston Gardey (1967) | Treasurer, | Since 2009 | Not Applicable | Not Applicable |
| One Franklin Parkway | Chief | |||
| San Mateo, CA 94403-1906 | Financial | |||
| Officer and | ||||
| Chief | ||||
| Accounting | ||||
| Officer | ||||
| Principal Occupation During at Least the Past 5 Years: | ||||
| Treasurer, U.S. Fund Administration & Reporting, Franklin Templeton Investments; and officer of 28 of the investment companies in Franklin | ||||
| Templeton Investments. | ||||
| Aliya S. Gordon (1973) | Vice | Since 2009 | Not Applicable | Not Applicable |
| One Franklin Parkway | President | |||
| San Mateo, CA 94403-1906 | ||||
| Principal Occupation During at Least the Past 5 Years: | ||||
| Senior Associate General Counsel, Franklin Templeton Investments; and officer of 45 of the investment companies in Franklin Templeton | ||||
| Investments. | ||||
| Steven J. Gray (1955) | Vice | Since 2009 | Not Applicable | Not Applicable |
| One Franklin Parkway | President | |||
| San Mateo, CA 94403-1906 | ||||
| Principal Occupation During at Least the Past 5 Years: | ||||
| Senior Associate General Counsel, Franklin Templeton Investments; Vice President, Franklin Templeton Distributors, Inc. and Franklin | ||||
| Alternative Strategies Advisers, LLC; and officer of 45 of the investment companies in Franklin Templeton Investments. | ||||
| Edward B. Jamieson (1948) | President and | Since 2010 | Not Applicable | Not Applicable |
| One Franklin Parkway | Chief | |||
| San Mateo, CA 94403-1906 | Executive | |||
| Officer – | ||||
| Investment | ||||
| Management | ||||
| Principal Occupation During at Least the Past 5 Years: | ||||
| President, Chief Investment Officer and Director, Franklin Advisers, Inc.; Executive Vice President, Franklin Templeton Institutional, LLC; and | ||||
| officer and/or trustee, as the case may be, of some of the other subsidiaries of Franklin Resources, Inc. and of 10 of the investment companies | ||||
| in Franklin Templeton Investments. | ||||
franklintempleton.com
Annual Report
47
FRANKLIN STRATEGIC SERIES
| Interested Board Members and Officers (continued) | ||||
| Number of Portfolios in | ||||
| Name, Year of Birth | Length of | Fund Complex Overseen | Other Directorships Held During | |
| and Address | Position | Time Served | by Board Member* | at Least the Past 5 Years |
| Robert Lim (1948) | Vice | Since May 2016 | Not Applicable | Not Applicable |
| One Franklin Parkway | President – | |||
| San Mateo, CA 94403-1906 | AML | |||
| Compliance | ||||
| Principal Occupation During at Least the Past 5 Years: | ||||
| Vice President, Franklin Templeton Companies, LLC; Chief Compliance Officer, Franklin Templeton Distributors, Inc. and Franklin Templeton | ||||
| Investor Services, LLC; and officer of 45 of the investment companies in Franklin Templeton Investments. | ||||
| Christopher J. Molumphy (1962) Vice | Since 2000 | Not Applicable | Not Applicable | |
| One Franklin Parkway | President | |||
| San Mateo, CA 94403-1906 | ||||
| Principal Occupation During at Least the Past 5 Years: | ||||
| Director and Executive Vice President, Franklin Advisers, Inc.; Executive Vice President, Franklin Templeton Institutional, LLC; and officer of | ||||
| some of the other subsidiaries of Franklin Resources, Inc. and of 22 of the investment companies in Franklin Templeton Investments. | ||||
| Kimberly H. Novotny (1972) | Vice | Since 2013 | Not Applicable | Not Applicable |
| 300 S.E. 2nd Street | President | |||
| Fort Lauderdale, FL 33301-1923 | ||||
| Principal Occupation During at Least the Past 5 Years: | ||||
| Associate General Counsel, Franklin Templeton Investments; Vice President and Corporate Secretary, Fiduciary Trust International of the | ||||
| South; Vice President, Templeton Investment Counsel, LLC; Assistant Secretary, Franklin Resources, Inc.; and officer of 45 of the investment | ||||
| companies in Franklin Templeton Investments. | ||||
| Robert C. Rosselot (1960) | Chief | Since 2013 | Not Applicable | Not Applicable |
| 300 S.E. 2nd Street | Compliance | |||
| Fort Lauderdale, FL 33301-1923 | Officer | |||
| Principal Occupation During at Least the Past 5 Years: | ||||
| Director, Global Compliance, Franklin Templeton Investments; Vice President, Franklin Templeton Companies, LLC; officer of 45 of the | ||||
| investment companies in Franklin Templeton Investments; and formerly, Senior Associate General Counsel, Franklin Templeton Investments | ||||
| (2007-2013); and Secretary and Vice President, Templeton Group of Funds (2004-2013). | ||||
| Karen L. Skidmore (1952) | Vice | Since 2006 | Not Applicable | Not Applicable |
| One Franklin Parkway | President and | |||
| San Mateo, CA 94403-1906 | Secretary | |||
| Principal Occupation During at Least the Past 5 Years: | ||||
| Senior Associate General Counsel, Franklin Templeton Investments; and officer of 45 of the investment companies in Franklin Templeton | ||||
| Investments. | ||||
| Navid Tofigh (1972) | Vice | Since | Not Applicable | Not Applicable |
| One Franklin Parkway | President | November 2015 | ||
| San Mateo, CA 94403-1906 | ||||
| Principal Occupation During at Least the Past 5 Years: | ||||
| Associate General Counsel, Franklin Templeton Investments; and officer of 45 of the investment companies in Franklin Templeton | ||||
| Investments. | ||||
| Craig S. Tyle (1960) | Vice | Since 2005 | Not Applicable | Not Applicable |
| One Franklin Parkway | President | |||
| San Mateo, CA 94403-1906 | ||||
| Principal Occupation During at Least the Past 5 Years: | ||||
| General Counsel and Executive Vice President, Franklin Resources, Inc.; and officer of some of the other subsidiaries of Franklin Resources, | ||||
| Inc. and of 45 of the investment companies in Franklin Templeton Investments. | ||||
48 Annual Report
franklintempleton.com
FRANKLIN STRATEGIC SERIES
| Interested Board Members and Officers (continued) | ||||
| Number of Portfolios in | ||||
| Name, Year of Birth | Length of | Fund Complex Overseen | Other Directorships Held During | |
| and Address | Position | Time Served | by Board Member* | at Least the Past 5 Years |
| Lori A. Weber (1964) | Vice | Since 2011 | Not Applicable | Not Applicable |
| 300 S.E. 2nd Street | President | |||
| Fort Lauderdale, FL 33301-1923 | ||||
| Principal Occupation During at Least the Past 5 Years: | ||||
| Senior Associate General Counsel, Franklin Templeton Investments; Assistant Secretary, Franklin Resources, Inc.; Vice President and | ||||
| Secretary, Templeton Investment Counsel, LLC; and officer of 45 of the investment companies in Franklin Templeton Investments. | ||||
*We base the number of portfolios on each separate series of the U.S. registered investment companies within the Franklin Templeton Investments fund complex. These
portfolios have a common investment manager or affiliated investment managers.
**Gregory E. Johnson is considered to be an interested person of the Fund under the federal securities laws due to his position as an officer and director of Franklin
Resources, Inc. (Resources), which is the parent company of the Fund’s investment manager and distributor. Rupert H. Johnson, Jr. is considered to be an interested person
of the Fund under the federal securities laws due to his position as officer and director and major shareholder of Resources.
Note 1: Rupert H. Johnson, Jr. is the uncle of Gregory E. Johnson.
Note 2: Officer information is current as of the date of this report. It is possible that after this date, information about officers may change.
The Sarbanes-Oxley Act of 2002 and Rules adopted by the Securities and Exchange Commission require the Fund to disclose whether the Fund’s Audit
Committee includes at least one member who is an audit committee financial expert within the meaning of such Act and Rules. The Fund’s Board has determined
that there is at least one such financial expert on the Audit Committee and has designated John B. Wilson as its audit committee financial expert. The Board
believes that Mr. Wilson qualifies as such an expert in view of his extensive business background and experience, including service as chief financial officer of
Staples, Inc. from 1992 to 1996. Mr. Wilson has been a Member and Chairman of the Fund’s Audit Committee since 2006. As a result of such background and
experience, the Board believes that Mr. Wilson has acquired an understanding of generally accepted accounting principles and financial statements, the general
application of such principles in connection with the accounting estimates, accruals and reserves, and analyzing and evaluating financial statements that present
a breadth and level of complexity of accounting issues generally comparable to those of the Fund, as well as an understanding of internal controls and
procedures for financial reporting and an understanding of audit committee functions. Mr. Wilson is an independent Board member as that term is defined under
the relevant Securities and Exchange Commission Rules and Releases.
The Statement of Additional Information (SAI) includes additional information about the board members and is available, without charge, upon request.
Shareholders may call (800) DIAL BEN/342-5236 to request the SAI.
franklintempleton.com
Annual Report
49
FRANKLIN STRATEGIC SERIES
FRANKLIN FLEXIBLE ALPHA BOND FUND
Shareholder Information
Proxy Voting Policies and Procedures
The Fund’s investment manager has established Proxy Voting Policies and Procedures (Policies) that the Fund uses to determine how to vote proxies relating to portfolio securities. Shareholders may view the Trust’s complete Policies online at franklintempleton.com. Alternatively, shareholders may request copies of the Policies free of charge by calling the Proxy Group collect at (954) 527-7678 or by sending a written request to: Franklin Templeton Companies, LLC, 300 S.E. 2nd Street, Fort Lauderdale, FL 33301, Attention: Proxy Group. Copies of the Trust’s proxy voting records are also made available online at franklintempleton.com and posted on the U.S. Securities and Exchange Commission’s website at sec.gov and reflect the most recent 12-month period ended June 30.
Quarterly Statement of Investments
The Trust, on behalf of the Fund, files a complete statement of investments with the U.S. Securities and Exchange Commission for the first and third quarters for each fiscal year on Form N-Q. Shareholders may view the filed Form N-Q by visiting the Commission’s website at sec.gov. The filed form may also be viewed and copied at the Commission’s Public Reference Room in Washington, DC. Information regarding the operations of the Public Reference Room may be obtained by calling (800) SEC-0330.
Householding of Reports and Prospectuses
You will receive each Fund’s financial reports every six months as well as an annual updated summary prospectus (prospectus available upon request). To reduce Fund expenses, we try to identify related shareholders in a household and send only one copy of the financial reports and summary prospectus. This process, called “householding,” will continue indefinitely unless you instruct us otherwise. If you prefer not to have these documents householded, please call us at (800) 632-2301. At any time you may view current prospectuses/summary prospectuses and financial reports on our website. If you choose, you may receive these documents through electronic delivery.
50 Annual Report
franklintempleton.com
This page intentionally left blank
This page intentionally left blank
| Contents | |
| Annual Report | |
| Franklin Strategic Income Fund | 3 |
| Performance Summary | 6 |
| Your Fund’s Expenses | 12 |
| Consolidated Financial Highlights and Consolidated | |
| Statement of Investments | 14 |
| Consolidated Financial Statements | 40 |
| Notes to Consolidated Financial Statements | 44 |
| Report of Independent Registered | |
| Public Accounting Firm | 59 |
| Board Members and Officers | 60 |
| Shareholder Information | 65 |
Visit franklintempleton.com for fund updates, to access your account, or to find helpful financial planning tools.
2 Annual Report
franklintempleton.com
Annual Report
Franklin Strategic Income Fund
This annual report for Franklin Strategic Income Fund covers the fiscal year ended April 30, 2016.
Your Fund’s Goal and Main Investments
The Fund seeks a high level of current income, with capital appreciation over the long term as a secondary objective. The Fund uses an active asset allocation process and under normal market conditions invests at least 65% of its assets in U.S. and foreign debt securities, including those in emerging markets. The Fund may invest in all varieties of fixed and floating rate income securities, including bonds, corporate loans (and loan participations), mortgage-backed securities and other asset-backed securities, convertible securities and municipal securities.
Performance Overview
The Fund’s Class A shares had a -3.14% cumulative total return for the 12 months under review. In comparison, the Barclays U.S. Aggregate Bond Index, which represents the U.S. investment-grade fixed rate taxable bond market, generated a +2.72% total return.1 The Lipper Multi-Sector Income Funds Classification Average, which consists of funds chosen by Lipper that seek current income by allocating assets among different fixed income securities sectors, with a significant portion rated below investment grade, had a -0.56% total return.2 You can find the Fund’s long-term performance data in the Performance Summary beginning on page 6.
Performance data represent past performance, which does not guarantee future results. Investment return and principal value will fluctuate, and you may have a gain or loss when you sell your shares. Current performance may differ from figures shown. For most recent month-end performance, go to franklintempleton.com or call (800) 342-5236.
Economic and Market Overview
The U.S. economy moderated during the 12 months under review. After strengthening in 2015’s second quarter, the economy moderated in the third and fourth quarters. Growth slowed further in 2016’s first quarter as exports, business investment and federal government spending declined. The manufacturing sector expanded in March and April after contracting for five consecutive months, while the services sector expanded throughout the 12-month period. Growth in services contributed to new jobs and helped the unemployment rate decrease from 5.4% in April 2015 to 5.0% at period-end.3 Home sales and prices rose amid relatively low mortgage rates. Monthly retail sales grew during most of the review period and rose to the highest level in April in more than a year, driven mainly by automobile sales. Inflation, as measured by the Consumer Price Index, remained relatively subdued due to low energy prices.
After maintaining a near-zero interest rate for seven years to support the U.S. economy’s recovery, the Federal Reserve (Fed) raised its target range for the federal funds rate to 0.25%–0.50% at its December meeting. At the time of the increase, policymakers cited the labor market’s considerable improvement and were reasonably confident that inflation would move back to the Fed’s 2.00% medium-term objective. The Fed maintained the rate through period-end, indicating it would monitor domestic and global developments and their implications on the labor markets as it tracks actual and expected progression toward its employment and inflation goals.
The 10-year Treasury yield, which moves inversely to price, shifted throughout the period. It rose from 2.05% on April 30, 2015, to a period high of 2.50% in June, and remained relatively high through the rest of 2015, based partly on upbeat domestic and eurozone economic data as well as the Fed’s interest rate increase. However, the yield declined in 2016 and
1. Source: Morningstar.
2. Source: Lipper, a Thomson Reuters Company. For the six-month period ended April 30, 2016, this category consisted of 291 funds. Lipper calculations do not include sales
charges or expense subsidization by a fund’s manager. Fund performance relative to the average may have differed if these or other factors had been considered.
The indexes are unmanaged and include reinvestment of any income or distributions. They do not reflect any fees, expenses or sales charges. One cannot invest directly in an
index, and an index is not representative of the Fund’s portfolio.
3. Source: Bureau of Labor Statistics.
See www.franklintempletondatasources.com for additional data provider information.
The dollar value, number of shares or principal amount, and names of all portfolio holdings are listed in the Fund’s Consolidated Statement of
Investments (SOI). The Consolidated SOI begins on page 19.
franklintempleton.com
Annual Report
3
| FRANKLIN STRATEGIC INCOME FUND | ||||
| Portfolio Breakdown* | ||||
| Based on Total Net Assets | ||||
| 4/30/16 | 4/30/15 | |||
| High Yield Corporate Bonds & | ||||
| Preferred Securities | 28.6 | % | 31.7 | % |
| Floating-Rate Loans | 21.1 | % | 20.4 | % |
| International Government & Agency Bonds | ||||
| (Non-$US) | 12.2 | % | 15.0 | % |
| Investment Grade Corporate Bonds & | ||||
| Preferred Securities | 10.3 | % | 6.5 | % |
| Mortgage-Backed Securities | 8.5 | % | 5.4 | % |
| U.S. Treasury Securities | 4.2 | % | 2.3 | % |
| Commercial Mortgage-Backed Securities | 4.0 | % | 3.1 | % |
| International Government & Agency Bonds | ||||
| ($US) | 2.3 | % | 3.3 | % |
| Other | 1.4 | % | 0.3 | % |
| Municipal Bonds | 1.1 | % | 4.1 | % |
| Equities | 0.2 | % | 0.1 | % |
| Asset-Backed Securities | 0.1 | % | 0.0 | %** |
| Convertible Securities | 0.0 | %** | 0.0 | %** |
| Short-Term Investments & Other Net Assets | 6.0 | % | 7.9 | % |
*Figures reflect certain derivatives held in the portfolio (or their underlying reference
assets) and may not total 100% or may be negative due to rounding, use of any
derivatives, unsettled trades or other factors. The breakdown may not match the
SOI.
**Rounds to less than 0.1% of total net assets.
ended the period at 1.83% due to the Fed’s cautious stance on further interest rate increases, investor concerns about domestic and global economic growth and weak oil and commodity prices.
During the 12 months under review, global government bonds performed strongly, although market volatility was elevated for much of the period. The Bank of Japan’s (BOJ’s) surprise decision to adopt negative interest rates sparked a sharp rally in the Japanese yen, as risk aversion increased and investors doubted whether the BOJ’s new policy would prove effective. Conversely, as had been widely predicted, the European Central Bank (ECB) unveiled a further set of monetary-easing measures to stimulate the eurozone economy, although the impact was limited, since eurozone bond yields had already declined significantly ahead of the ECB’s announcement. Over the period, the U.S. dollar weakened against the euro and Japanese yen, but strengthened against numerous other developed and emerging market currencies.
Investment Strategy
The Fund uses an active asset allocation strategy, investing across the fixed income markets in sectors that may include high yield and investment-grade corporate bonds, international developed and emerging market bonds, U.S. government and
agency securities, mortgage- and other asset-backed securities, corporate bank loans, convertible securities and preferred stocks, and municipal securities. In addition to our bottom-up fundamental analysis of market sectors, industries and issuers, we evaluate country risk, business cycles, yield curves, and values between and within markets as part of our portfolio construction process. We may also enter into various transactions involving certain currency-, interest rate- or credit-related derivative instruments for hedging purposes, to enhance returns or to obtain exposure to various market sectors.
Manager’s Discussion
Over the past 12 months investor sentiment was mixed as uncertainty over global growth, U.S. monetary policy and the generally declining energy sector weighed on financial markets. The Fund’s holdings in investment-grade corporate bonds and sovereign emerging market debt contributed to Fund performance. Additionally, exposure to higher quality agency mortgage-backed securities and tax-exempt municipal bonds further boosted results. Conversely, the Fund’s investments in below investment-grade corporate credit, particularly high yield securities, detracted from returns, with senior secured floating rate debt posting a smaller decline. The Fund’s currency positions and foreign debt holdings also hampered results.
| Dividend Distributions* | |||||
| 5/1/15–4/30/16 | |||||
| Dividend per Share (cents) | |||||
| Advisor | |||||
| Month | Class A | Class C | Class R | Class R6 | Class |
| May | 3.75 | 3.41 | 3.54 | 4.07 | 3.96 |
| June | 3.60 | 3.27 | 3.40 | 3.91 | 3.81 |
| July | 3.76 | 3.43 | 3.55 | 4.08 | 3.97 |
| August | 3.80 | 3.47 | 3.60 | 4.11 | 4.01 |
| September | 3.79 | 3.47 | 3.59 | 4.08 | 3.98 |
| October | 3.78 | 3.46 | 3.58 | 4.08 | 3.98 |
| November | 3.24 | 2.92 | 3.04 | 3.54 | 3.44 |
| December | 3.24 | 2.92 | 3.04 | 3.54 | 3.44 |
| January | 3.17 | 2.86 | 2.98 | 3.47 | 3.36 |
| February | 3.33 | 3.04 | 3.15 | 3.62 | 3.51 |
| March | 2.55 | 2.24 | 2.35 | 2.87 | 2.74 |
| April | 2.07 | 1.76 | 1.88 | 2.38 | 2.26 |
| Total | 40.08 | 36.25 | 37.70 | 43.75 | 42.46 |
*The distribution amount is the sum of the dividend payments to shareholders for
the period shown and includes only estimated tax-basis net investment income. All
Fund distributions will vary depending upon current market conditions, and past
distributions are not indicative of future trends.
At period-end, the Fund remained overweighted in many of the spread sectors, including corporate credit and securitized products, based on our belief that valuations remained
4 Annual Report
franklintempleton.com
FRANKLIN STRATEGIC INCOME FUND
relatively attractive on a longer term basis. We continue to believe opportunities exist in global bond markets outside of the U.S., and although we reduced our exposure over the period, we maintained our allocation to international bonds and currencies.
Thank you for your continued participation in Franklin Strategic Income Fund. We look forward to serving your future investment needs.

The foregoing information reflects our analysis, opinions and portfolio holdings as of April 30, 2016, the end of the reporting period. The way we implement our main investment strategies and the resulting portfolio holdings may change depending on factors such as market and economic conditions. These opinions may not be relied upon as investment advice or an offer for a particular security. The information is not a complete analysis of every aspect of any market, country, industry, security or the Fund. Statements of fact are from sources considered reliable, but the investment manager makes no representation or warranty as to their completeness or accuracy. Although historical performance is no guarantee of future results, these insights may help you understand our investment management philosophy.
Patricia (Tricia) O’Connor is a vice president and portfolio manager for the Franklin Templeton Fixed Income Group. She co-manages multiple US and global high yield funds as well as institutional separate accounts. Prior to joining Franklin Templeton in 1997, Ms. O’Connor worked for Morgan Stanley Asset Management. Ms. O’Connor holds a B.S. in accounting from Lehigh University and an M.B.A. in finance and economics from the University of Chicago. She is a Chartered Financial Analyst (CFA) charterholder, as well as a member of the CFA Society of San Francisco and CFA Institute.
CFA® is a trademark owned by CFA Institute.
franklintempleton.com
Annual Report
5
FRANKLIN STRATEGIC INCOME FUND
Performance Summary as of April 30, 2016
Your dividend income will vary depending on dividends or interest paid by securities in the Fund’s portfolio, adjusted for operating expenses of each class. Capital gain distributions are net profits realized from the sale of portfolio securities. The performance tables and graphs do not reflect any taxes that a shareholder would pay on Fund dividends, capital gain distributions, if any, or any realized gains on the sale of Fund shares. Total return reflects reinvestment of the Fund’s dividends and capital gain distributions, if any, and any unrealized gains or losses.
| Net Asset Value | ||||||
| Share Class (Symbol) | 4/30/16 | 4/30/15 | Change | |||
| A (FRSTX) | $ | 9.32 | $ | 10.04 | -$ | 0.72 |
| C (FSGCX) | $ | 9.31 | $ | 10.04 | -$ | 0.73 |
| R (FKSRX) | $ | 9.28 | $ | 10.01 | -$ | 0.73 |
| R6 (FGKNX) | $ | 9.33 | $ | 10.05 | -$ | 0.72 |
| Advisor (FKSAX) | $ | 9.33 | $ | 10.05 | -$ | 0.72 |
| Distributions1 (5/1/15–4/30/16) | ||||||
| Dividend | ||||||
| Share Class | Income | |||||
| A | $ | 0.4008 | ||||
| C | $ | 0.3625 | ||||
| R | $ | 0.3770 | ||||
| R6 | $ | 0.4375 | ||||
| Advisor | $ | 0.4246 | ||||
See page 11 for Performance Summary footnotes.
6 Annual Report
franklintempleton.com
FRANKLIN STRATEGIC INCOME FUND
PERFORMANCE SUMMARY
Performance as of 4/30/162
Cumulative total return excludes sales charges. Average annual total returns include maximum sales charges. Class A: 4.25% maximum initial sales charge; Class C: 1% contingent deferred sales charge in first year only; Class R/R6/Advisor Class: no sales charges.
| Cumulative | Average Annual | Average Annual | Total Annual Operating Expenses6 | |||||||
| Share Class | Total Return3 | Total Return4 | Total Return (3/31/16)5 | (with waiver) | (without waiver) | |||||
| A | 0.86 | % | 0.87 | % | ||||||
| 1-Year | -3.14 | % | -7.30 | % | -7.75 | % | ||||
| 5-Year | +14.56 | % | +1.88 | % | +1.91 | % | ||||
| 10-Year | +65.33 | % | +4.70 | % | +4.62 | % | ||||
| C | 1.26 | % | 1.27 | % | ||||||
| 1-Year | -3.64 | % | -4.56 | % | -4.99 | % | ||||
| 5-Year | +12.19 | % | +2.33 | % | +2.39 | % | ||||
| 10-Year | +58.70 | % | +4.73 | % | +4.67 | % | ||||
| R | 1.11 | % | 1.12 | % | ||||||
| 1-Year | -3.50 | % | -3.50 | % | -3.93 | % | ||||
| 5-Year | +13.07 | % | +2.49 | % | +2.55 | % | ||||
| 10-Year | +61.14 | % | +4.89 | % | +4.82 | % | ||||
| R6 | 0.48 | % | 0.49 | % | ||||||
| 1-Year | -2.76 | % | -2.76 | % | -3.40 | % | ||||
| Since Inception (5/1/13) | +1.60 | % | +0.53 | % | -0.02 | % | ||||
| Advisor | 0.61 | % | 0.62 | % | ||||||
| 1-Year | -2.89 | % | -2.89 | % | -3.43 | % | ||||
| 5-Year | +15.99 | % | +3.01 | % | +3.05 | % | ||||
| 10-Year | +69.44 | % | +5.41 | % | +5.35 | % | ||||
| Distribution | 30-Day Standardized Yield8 | |||||||||
| Share Class | Rate7 | (with waiver) | (without waiver) | |||||||
| A | 4.50 | % | 4.59 | % | 4.51 | % | ||||
| C | 4.26 | % | 4.39 | % | 4.32 | % | ||||
| R | 4.44 | % | 4.54 | % | 4.46 | % | ||||
| R6 | 5.12 | % | 5.20 | % | 5.13 | % | ||||
| Advisor | 4.97 | % | 5.04 | % | 4.97 | % | ||||
Performance data represent past performance, which does not guarantee future results. Investment return and principal value will fluctuate, and you may have a gain or loss when you sell your shares. Current performance may differ from figures shown. For most recent month-end performance, go to franklintempleton.com or call (800) 342-5236.
See page 11 for Performance Summary footnotes.
franklintempleton.com
Annual Report
7
FRANKLIN STRATEGIC INCOME FUND
PERFORMANCE SUMMARY
Total Return Index Comparison for a Hypothetical $10,000 Investment2
Total return represents the change in value of an investment over the periods shown. It includes any applicable maximum sales charge, Fund expenses, account fees and reinvested distributions. The unmanaged indexes include reinvestment of any income or distributions. They differ from the Fund in composition and do not pay management fees or expenses. One cannot invest directly in an index.
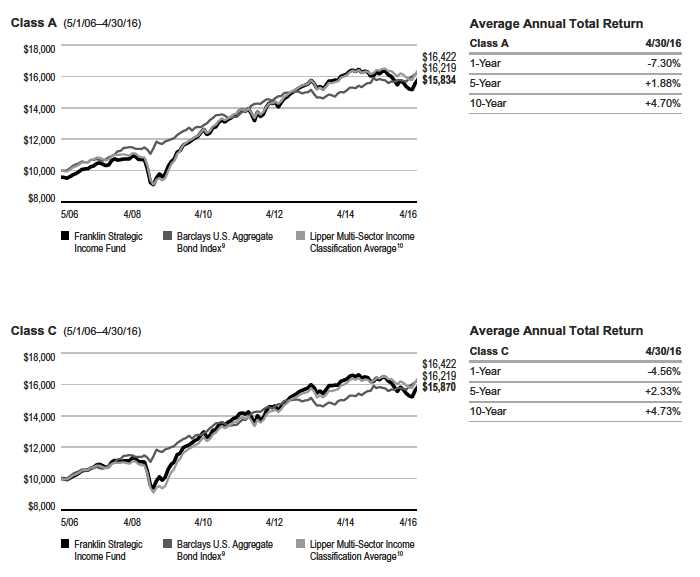
See page 11 for Performance Summary footnotes.
8 Annual Report
franklintempleton.com
FRANKLIN STRATEGIC INCOME FUND PERFORMANCE SUMMARY
Total Return Index Comparison for a Hypothetical $10,000 Investment2 (continued)
See page 11 for Performance Summary footnotes.
franklintempleton.com
Annual Report
9
FRANKLIN STRATEGIC INCOME FUND
PERFORMANCE SUMMARY
Total Return Index Comparison for a Hypothetical $10,000 Investment2 (continued)
See page 11 for Performance Summary footnotes.
10 Annual Report
franklintempleton.com
FRANKLIN STRATEGIC INCOME FUND
PERFORMANCE SUMMARY
All investments involve risks, including possible loss of principal. Bond prices generally move in the opposite direction of interest rates. Thus, as prices of bonds in the Fund adjust to a rise in interest rates, the Fund’s share price may decline. Changes in the financial strength of a bond issuer or in a bond’s credit rating may affect its value. High yields reflect the higher credit risks associated with certain lower rated securities held in the portfolio. Floating rate loans and high yield corporate bonds are rated below investment grade and are subject to greater risk of default, which could result in loss of principal — a risk that may be heightened in a slowing economy. The risks of foreign securities include currency fluctuations and political uncertainty. Investments in developing markets involve heightened risks related to the same factors, in addition to those associated with their relatively small size and lesser liquidity. Investing in derivative securities and the use of foreign currency techniques involve special risks as such may not achieve the anticipated benefits and/or may result in losses to the Fund. The Fund is actively managed but there is no guarantee that the manager’s investment decisions will produce the desired results. The Fund’s prospectus also includes a description of the main investment risks.
| Class C: | These shares have higher annual fees and expenses than Class A shares. |
| Class R: | Shares are available to certain eligible investors as described in the prospectus. These shares have higher annual fees and expenses than Class A shares. |
| Class R6: | Shares are available to certain eligible investors as described in the prospectus. |
| Advisor Class: | Shares are available to certain eligible investors as described in the prospectus. |
1. The distribution amount is the sum of the dividend payments to shareholders for the period shown and includes only estimated tax-basis net investment income.
2. The Fund has fee waivers associated with any investment in a Franklin Templeton money fund and the Franklin Lower and Middle Tier Floating Rate funds, contractually
guaranteed through at least its current fiscal year-end. Fund investment results reflect the fee waivers, to the extent applicable; without these reductions, the results would have
been lower.
3. Cumulative total return represents the change in value of an investment over the periods indicated.
4. Average annual total return represents the average annual change in value of an investment over the periods indicated. Return for less than one year, ifany,hasnotbeen
annualized.
5. In accordance with SEC rules, we provide standardized average annual total return information through the latest calendar quarter.
6. Figures are as stated in the Fund’s current prospectus. In periods of market volatility, assets may decline significantly, causing total annual Fund operating expenses to
become higher than the figures shown.
7. Distribution rate is based on the sum of the respective class’s dividend distributions over the past 12 months and the maximum offering price (NAV for Classes C, R, R6 and
Advisor) per share on 4/30/16.
8. The Fund’s 30-day standardized yield is calculated over a trailing 30-day period using the yield to maturity on bonds and/or the dividends accrued on stocks. It may not equal
the Fund’s actual income distribution rate, which reflects the Fund’s past dividends paid to shareholders.
9. Source: Morningstar. The Barclays U.S. Aggregate Bond Index is a market capitalization-weighted index representing the U.S. investment-grade, fixed-rate, taxable bond
market with index components for government and corporate, mortgage pass-through and asset-backed securities. All issues included are SEC-registered, taxable, dollar
denominated and nonconvertible, must have at least one year to final maturity, and must be rated investment grade (Baa3/BBB-/BBB- or above) using the middle rating of
Moody’s, Standard & Poor’s and Fitch, respectively.
10. Source: Lipper, a Thomson Reuters Company. The Lipper Multi-Sector Income Funds Classification Average is calculated by averaging the total returns of all funds within
the Lipper Multi-Sector Income Funds classification in the Lipper Open-End underlying funds universe. Lipper Multi-Sector Incomes Funds are defined as funds that seek
current income by allocating assets among different fixed income securities sectors (not primarily in one sector except for defensive purposes), including U.S. and foreign
governments, with a significant portion rated below investment grade. For the 12-month period ended 4/30/16, there were 291 funds in this category. Lipper calculations do not
include sales charges, but include reinvestment of any income or distributions. Fund performance relative to the average may have differed if these and other factors had been
considered.
See www.franklintempletondatasources.com for additional data provider information.
franklintempleton.com
Annual Report
11
FRANKLIN STRATEGIC INCOME FUND
Your Fund’s Expenses
As a Fund shareholder, you can incur two types of costs:
- Transaction costs, including sales charges (loads) on Fund purchases; and
- Ongoing Fund costs, including management fees, distribution and service (12b-1) fees, and other Fund expenses. All mutual funds have ongoing costs, sometimes referred to as operating expenses.
The following table shows ongoing costs of investing in the Fund and can help you understand these costs and compare them with those of other mutual funds. The table assumes a $1,000 investment held for the six months indicated.
Actual Fund Expenses
The first line (Actual) for each share class listed in the table provides actual account values and expenses. The “Ending Account Value” is derived from the Fund’s actual return, which includes the effect of Fund expenses.
You can estimate the expenses you paid during the period by following these steps. Of course, your account value and expenses will differ from those in this illustration:
| 1. | Divide your account value by $1,000. |
| If an account had an $8,600 value, then $8,600 ÷ $1,000 = 8.6. | |
| 2. | Multiply the result by the number under the heading “Expenses Paid During Period.” |
| If Expenses Paid During Period were $7.50, then 8.6 x $7.50 = $64.50. |
In this illustration, the estimated expenses paid this period are $64.50.
Hypothetical Example for Comparison with Other Funds
Information in the second line (Hypothetical) for each class in the table can help you compare ongoing costs of investing in the Fund with those of other mutual funds. This information may not be used to estimate the actual ending account balance or expenses you paid during the period. The hypothetical “Ending Account Value” is based on the actual expense ratio for each class and an assumed 5% annual rate of return before expenses, which does not represent the Fund’s actual return. The figure under the heading “Expenses Paid During Period” shows the hypothetical expenses your account would have incurred under this scenario. You can compare this figure with the 5% hypothetical examples that appear in shareholder reports of other funds.
Please note that expenses shown in the table are meant to highlight ongoing costs and do not reflect any transaction costs, such as sales charges. Therefore, the second line for each class is useful in comparing ongoing costs only, and will not help you compare total costs of owning different funds. In addition, if transaction costs were included, your total costs would have been higher. Please refer to the Fund prospectus for additional information on operating expenses.
12 Annual Report
franklintempleton.com
| FRANKLIN STRATEGIC INCOME FUND | ||||||
| YOUR FUND’S EXPENSES | ||||||
| Beginning Account | Ending Account | Expenses Paid During | ||||
| Share Class | Value 11/1/15 | Value 4/30/16 | Period* 11/1/15–4/30/16 | |||
| A | ||||||
| Actual | $ | 1,000 | $ | 1,005.40 | $ | 4.19 |
| Hypothetical (5% return before expenses) | $ | 1,000 | $ | 1,020.69 | $ | 4.22 |
| C | ||||||
| Actual | $ | 1,000 | $ | 1,002.30 | $ | 6.17 |
| Hypothetical (5% return before expenses) | $ | 1,000 | $ | 1,018.70 | $ | 6.22 |
| R | ||||||
| Actual | $ | 1,000 | $ | 1,003.00 | $ | 5.43 |
| Hypothetical (5% return before expenses) | $ | 1,000 | $ | 1,019.44 | $ | 5.47 |
| R6 | ||||||
| Actual | $ | 1,000 | $ | 1,007.30 | $ | 2.15 |
| Hypothetical (5% return before expenses) | $ | 1,000 | $ | 1,022.73 | $ | 2.16 |
| Advisor | ||||||
| Actual | $ | 1,000 | $ | 1,006.60 | $ | 2.94 |
| Hypothetical (5% return before expenses) | $ | 1,000 | $ | 1,021.93 | $ | 2.97 |
*Expenses are calculated using the most recent six-month expense ratio, net of expense waivers, annualized for each class (A: 0.84%;
C: 1.24%; R: 1.09%; R6: 0.43%; and Advisor: 0.59%), multiplied by the average account value over the period, multiplied by 182/366 to reflect
the one-half year period.
franklintempleton.com
Annual Report
13
| FRANKLIN STRATEGIC SERIES | |||||||||||||||
| Consolidated Financial Highlights | |||||||||||||||
| Franklin Strategic Income Fund | |||||||||||||||
| Year Ended April 30, | |||||||||||||||
| 2016 | 2015 | 2014 | 2013 | 2012 | |||||||||||
| Class A | |||||||||||||||
| Per share operating performance | |||||||||||||||
| (for a share outstanding throughout the year) | |||||||||||||||
| Net asset value, beginning of year | $ | 10.04 | $ | 10.57 | $ | 10.86 | $ | 10.48 | $ | 10.68 | |||||
| Income from investment operationsa: | |||||||||||||||
| Net investment incomeb | 0.42 | 0.42 | 0.44 | 0.45 | 0.50 | ||||||||||
| Net realized and unrealized gains (losses) | (0.74 | ) | (0.30 | ) | (0.18 | ) | 0.54 | (0.10 | ) | ||||||
| Total from investment operations | (0.32 | ) | 0.12 | 0.26 | 0.99 | 0.40 | |||||||||
| Less distributions from: | |||||||||||||||
| Net investment income and net foreign currency gains | (0.40 | ) | (0.55 | ) | (0.45 | ) | (0.57 | ) | (0.60 | ) | |||||
| Net realized gains | — | (0.10 | ) | (0.10 | ) | (0.04 | ) | — | |||||||
| Total distributions | (0.40 | ) | (0.65 | ) | (0.55 | ) | (0.61 | ) | (0.60 | ) | |||||
| Net asset value, end of year. | $ | 9.32 | $ | 10.04 | $ | 10.57 | $ | 10.86 | $ | 10.48 | |||||
| Total returnc | (3.14 | )% | 1.16 | % | 2.52 | % | 9.70 | % | 3.97 | % | |||||
| Ratios to average net assets | |||||||||||||||
| Expenses before waiver and payments by affiliates | 0.88 | % | 0.86 | % | 0.86 | % | 0.87 | % | 0.89 | % | |||||
| Expenses net of waiver and payments by affiliatesd | 0.84 | % | 0.85 | % | 0.86 | %e | 0.87 | % | 0.89 | % | |||||
| Net investment income | 4.44 | % | 4.03 | % | 4.16 | % | 4.21 | % | 4.81 | % | |||||
| Supplemental data | |||||||||||||||
| Net assets, end of year (000’s) | $ | 4,500,752 | $ | 5,242,844 | $ | 5,182,490 | $ | 4,966,834 | $ | 3,757,100 | |||||
| Portfolio turnover rate | 88.04 | % | 72.51 | % | 54.11 | % | 47.27 | % | 36.11 | % | |||||
| Portfolio turnover rate excluding mortgage dollar rollsf | 48.33 | % | 49.36 | % | 54.11 | % | 44.33 | % | 36.11 | % | |||||
aThe amount shown for a share outstanding throughout the period may not correlate with the Statement of Operations for the period due to the timing of sales and
repurchases of the Fund’s shares in relation to income earned and/or fluctuating fair value of the investments of the Fund.
bBased on average daily shares outstanding.
cTotal return does not reflect sales commissions or contingent deferred sales charges, if applicable.
dBenefit of expense reduction rounds to less than 0.01%.
eBenefit of waiver and payments by affiliates rounds to less than 0.01%.
fSee Note 1(h) regarding mortgage dollar rolls.
14 Annual Report | The accompanying notes are an integral part of these financial statements.
franklintempleton.com
| FRANKLIN STRATEGIC SERIES | |||||||||||||||
| CONSOLIDATED FINANCIAL HIGHLIGHTS | |||||||||||||||
| Franklin Strategic Income Fund (continued) | |||||||||||||||
| Year Ended April 30, | |||||||||||||||
| 2016 | 2015 | 2014 | 2013 | 2012 | |||||||||||
| Class C | |||||||||||||||
| Per share operating performance | |||||||||||||||
| (for a share outstanding throughout the year) | |||||||||||||||
| Net asset value, beginning of year | $ | 10.04 | $ | 10.57 | $ | 10.85 | $ | 10.48 | $ | 10.68 | |||||
| Income from investment operationsa: | |||||||||||||||
| Net investment incomeb | 0.38 | 0.38 | 0.40 | 0.41 | 0.46 | ||||||||||
| Net realized and unrealized gains (losses) | (0.75 | ) | (0.30 | ) | (0.17 | ) | 0.53 | (0.10 | ) | ||||||
| Total from investment operations | (0.37 | ) | 0.08 | 0.23 | 0.94 | 0.36 | |||||||||
| Less distributions from: | |||||||||||||||
| Net investment income and net foreign currency gains | (0.36 | ) | (0.51 | ) | (0.41 | ) | (0.53 | ) | (0.56 | ) | |||||
| Net realized gains | — | (0.10 | ) | (0.10 | ) | (0.04 | ) | — | |||||||
| Total distributions | (0.36 | ) | (0.61 | ) | (0.51 | ) | (0.57 | ) | (0.56 | ) | |||||
| Net asset value, end of year. | $ | 9.31 | $ | 10.04 | $ | 10.57 | $ | 10.85 | $ | 10.48 | |||||
| Total returnc | (3.64 | )% | 0.76 | % | 2.20 | % | 9.17 | % | 3.56 | % | |||||
| Ratios to average net assets | |||||||||||||||
| Expenses before waiver and payments by affiliates | 1.28 | % | 1.26 | % | 1.26 | % | 1.27 | % | 1.29 | % | |||||
| Expenses net of waiver and payments by affiliatesd | 1.24 | % | 1.25 | % | 1.26 | %e | 1.27 | % | 1.29 | % | |||||
| Net investment income | 4.04 | % | 3.63 | % | 3.76 | % | 3.81 | % | 4.41 | % | |||||
| Supplemental data | |||||||||||||||
| Net assets, end of year (000’s) | $ | 1,645,852 | $ | 2,070,739 | $ | 2,109,049 | $ | 2,108,962 | $ | 1,569,746 | |||||
| Portfolio turnover rate | 88.04 | % | 72.51 | % | 54.11 | % | 47.27 | % | 36.11 | % | |||||
| Portfolio turnover rate excluding mortgage dollar rollsf | 48.33 | % | 49.36 | % | 54.11 | % | 44.33 | % | 36.11 | % | |||||
aThe amount shown for a share outstanding throughout the period may not correlate with the Statement of Operations for the period due to the timing of sales and
repurchases of the Fund’s shares in relation to income earned and/or fluctuating fair value of the investments of the Fund.
bBased on average daily shares outstanding.
cTotal return does not reflect sales commissions or contingent deferred sales charges, if applicable.
dBenefit of expense reduction rounds to less than 0.01%.
eBenefit of waiver and payments by affiliates rounds to less than 0.01%.
fSee Note 1(h) regarding mortgage dollar rolls.
franklintempleton.com
The accompanying notes are an integral part of these financial statements. | Annual Report 15
| FRANKLIN STRATEGIC SERIES | |||||||||||||||
| CONSOLIDATED FINANCIAL HIGHLIGHTS | |||||||||||||||
| Franklin Strategic Income Fund (continued) | |||||||||||||||
| Year Ended April 30, | |||||||||||||||
| 2016 | 2015 | 2014 | 2013 | 2012 | |||||||||||
| Class R | |||||||||||||||
| Per share operating performance | |||||||||||||||
| (for a share outstanding throughout the year) | |||||||||||||||
| Net asset value, beginning of year | $ | 10.01 | $ | 10.54 | $ | 10.82 | $ | 10.45 | $ | 10.65 | |||||
| Income from investment operationsa: | |||||||||||||||
| Net investment incomeb | 0.39 | 0.39 | 0.41 | 0.42 | 0.47 | ||||||||||
| Net realized and unrealized gains (losses) | (0.74 | ) | (0.29 | ) | (0.17 | ) | 0.53 | (0.10 | ) | ||||||
| Total from investment operations | (0.35 | ) | 0.10 | 0.24 | 0.95 | 0.37 | |||||||||
| Less distributions from: | |||||||||||||||
| Net investment income and net foreign currency gains | (0.38 | ) | (0.53 | ) | (0.42 | ) | (0.54 | ) | (0.57 | ) | |||||
| Net realized gains | — | (0.10 | ) | (0.10 | ) | (0.04 | ) | — | |||||||
| Total distributions | (0.38 | ) | (0.63 | ) | (0.52 | ) | (0.58 | ) | (0.57 | ) | |||||
| Net asset value, end of year. | $ | 9.28 | $ | 10.01 | $ | 10.54 | $ | 10.82 | $ | 10.45 | |||||
| Total return | (3.50 | )% | 0.91 | % | 2.36 | % | 9.36 | % | 3.72 | % | |||||
| Ratios to average net assets | |||||||||||||||
| Expenses before waiver and payments by affiliates | 1.13 | % | 1.11 | % | 1.11 | % | 1.12 | % | 1.14 | % | |||||
| Expenses net of waiver and payments by affiliatesc | 1.09 | % | 1.10 | % | 1.11 | %d | 1.12 | % | 1.14 | % | |||||
| Net investment income | 4.19 | % | 3.78 | % | 3.91 | % | 3.96 | % | 4.56 | % | |||||
| Supplemental data | |||||||||||||||
| Net assets, end of year (000’s) | $ | 181,671 | $ | 223,758 | $ | 227,359 | $ | 260,647 | $ | 249,662 | |||||
| Portfolio turnover rate | 88.04 | % | 72.51 | % | 54.11 | % | 47.27 | % | 36.11 | % | |||||
| Portfolio turnover rate excluding mortgage dollar rollse | 48.33 | % | 49.36 | % | 54.11 | % | 44.33 | % | 36.11 | % | |||||
aThe amount shown for a share outstanding throughout the period may not correlate with the Statement of Operations for the period due to the timing of sales and
repurchases of the Fund’s shares in relation to income earned and/or fluctuating fair value of the investments of the Fund.
bBased on average daily shares outstanding.
cBenefit of expense reduction rounds to less than 0.01%.
dBenefit of waiver and payments by affiliates rounds to less than 0.01%.
eSee Note 1(h) regarding mortgage dollar rolls.
16 Annual Report | The accompanying notes are an integral part of these financial statements.
franklintempleton.com
| FRANKLIN STRATEGIC SERIES | |||||||||
| CONSOLIDATED FINANCIAL HIGHLIGHTS | |||||||||
| Franklin Strategic Income Fund (continued) | |||||||||
| Year Ended April 30, | |||||||||
| 2016 | 2015 | 2014 | a | ||||||
| Class R6 | |||||||||
| Per share operating performance | |||||||||
| (for a share outstanding throughout the year) | |||||||||
| Net asset value, beginning of year | $ | 10.05 | $ | 10.58 | $ | 10.87 | |||
| Income from investment operationsb: | |||||||||
| Net investment incomec | 0.46 | 0.46 | 0.49 | ||||||
| Net realized and unrealized gains (losses) | (0.74 | ) | (0.30 | ) | (0.19 | ) | |||
| Total from investment operations. | (0.28 | ) | 0.16 | 0.30 | |||||
| Less distributions from: | |||||||||
| Net investment income and net foreign currency gains | (0.44 | ) | (0.59 | ) | (0.49 | ) | |||
| Net realized gains | — | (0.10 | ) | (0.10 | ) | ||||
| Total distributions | (0.44 | ) | (0.69 | ) | (0.59 | ) | |||
| Net asset value, end of year | $ | 9.33 | $ | 10.05 | $ | 10.58 | |||
| Total return | (2.76 | )% | 1.54 | % | 2.90 | % | |||
| Ratios to average net assets | |||||||||
| Expenses before waiver and payments by affiliates | 0.49 | % | 0.48 | % | 0.48 | % | |||
| Expenses net of waiver and payments by affiliatesd | 0.45 | % | 0.47 | % | 0.48 | %e | |||
| Net investment income. | 4.83 | % | 4.41 | % | 4.54 | % | |||
| Supplemental data | |||||||||
| Net assets, end of year (000’s) | $ | 286,503 | $ | 253,929 | $ | 247,007 | |||
| Portfolio turnover rate | 88.04 | % | 72.51 | % | 54.11 | % | |||
| Portfolio turnover rate excluding mortgage dollar rollsf | 48.33 | % | 49.36 | % | 54.11 | % | |||
aFor the year May 1, 2013 (effective date) to April 30, 2014.
bThe amount shown for a share outstanding throughout the period may not correlate with the Statement of Operations for the period due to the timing of sales and
repurchases of the Fund’s shares in relation to income earned and/or fluctuating fair value of the investments of the Fund.
cBased on average daily shares outstanding.
dBenefit of expense reduction rounds to less than 0.01%.
eBenefit of waiver and payments by affiliates rounds to less than 0.01%.
fSee Note 1(h) regarding mortgage dollar rolls.
franklintempleton.com
The accompanying notes are an integral part of these financial statements. | Annual Report 17
| FRANKLIN STRATEGIC SERIES | |||||||||||||||
| CONSOLIDATED FINANCIAL HIGHLIGHTS | |||||||||||||||
| Franklin Strategic Income Fund (continued) | |||||||||||||||
| Year Ended April 30, | |||||||||||||||
| 2016 | 2015 | 2014 | 2013 | 2012 | |||||||||||
| Advisor Class | |||||||||||||||
| Per share operating performance | |||||||||||||||
| (for a share outstanding throughout the year) | |||||||||||||||
| Net asset value, beginning of year | $ | 10.05 | $ | 10.58 | $ | 10.86 | $ | 10.49 | $ | 10.69 | |||||
| Income from investment operationsa: | |||||||||||||||
| Net investment incomeb | 0.44 | 0.44 | 0.47 | 0.48 | 0.53 | ||||||||||
| Net realized and unrealized gains (losses) | (0.74 | ) | (0.29 | ) | (0.17 | ) | 0.53 | (0.10 | ) | ||||||
| Total from investment operations | (0.30 | ) | 0.15 | 0.30 | 1.01 | 0.43 | |||||||||
| Less distributions from: | |||||||||||||||
| Net investment income and net foreign currency gains | (0.42 | ) | (0.58 | ) | (0.48 | ) | (0.60 | ) | (0.63 | ) | |||||
| Net realized gains | — | (0.10 | ) | (0.10 | ) | (0.04 | ) | — | |||||||
| Total distributions | (0.42 | ) | (0.68 | ) | (0.58 | ) | (0.64 | ) | (0.63 | ) | |||||
| Net asset value, end of year. | $ | 9.33 | $ | 10.05 | $ | 10.58 | $ | 10.86 | $ | 10.49 | |||||
| Total return | (2.89 | )% | 1.41 | % | 2.87 | % | 9.87 | % | 4.22 | % | |||||
| Ratios to average net assets | |||||||||||||||
| Expenses before waiver and payments by affiliates | 0.63 | % | 0.61 | % | 0.61 | % | 0.62 | % | 0.64 | % | |||||
| Expenses net of waiver and payments by affiliatesc | 0.59 | % | 0.60 | % | 0.61 | %d | 0.62 | % | 0.64 | % | |||||
| Net investment income | 4.69 | % | 4.28 | % | 4.41 | % | 4.46 | % | 5.06 | % | |||||
| Supplemental data | |||||||||||||||
| Net assets, end of year (000’s) | $ | 904,899 | $ | 1,130,796 | $ | 1,010,755 | $ | 956,001 | $ | 713,659 | |||||
| Portfolio turnover rate | 88.04 | % | 72.51 | % | 54.11 | % | 47.27 | % | 36.11 | % | |||||
| Portfolio turnover rate excluding mortgage dollar rollse | 48.33 | % | 49.36 | % | 54.11 | % | 44.33 | % | 36.11 | % | |||||
aThe amount shown for a share outstanding throughout the period may not correlate with the Statement of Operations for the period due to the timing of sales and
repurchases of the Fund’s shares in relation to income earned and/or fluctuating fair value of the investments of the Fund.
bBased on average daily shares outstanding.
cBenefit of expense reduction rounds to less than 0.01%.
dBenefit of waiver and payments by affiliates rounds to less than 0.01%.
eSee Note 1(h) regarding mortgage dollar rolls.
18 Annual Report | The accompanying notes are an integral part of these financial statements.
franklintempleton.com
| FRANKLIN STRATEGIC SERIES | |||||
| Consolidated Statement of Investments, April 30, 2016 | |||||
| Franklin Strategic Income Fund | |||||
| Shares/ | |||||
| Country | Units | Value | |||
| Common Stocks and Other Equity Interests 0.2% | |||||
| Consumer Services 0.2% | |||||
| a,b,c Turtle Bay Resort | United States | 5,579,940 | $ | 14,507,843 | |
| Energy 0.0%† | |||||
| a,d Warrior Met Coal LLC, A | United States | 15,189 | 1,531,300 | ||
| Health Care Equipment & Services 0.0%† | |||||
| a New Millennium Holdco Inc | United States | 87,365 | 677,079 | ||
| Transportation 0.0%† | |||||
| a,e CEVA Holdings LLC | United Kingdom | 1,570 | 784,985 | ||
| Total Common Stocks and Other Equity Interests | |||||
| (Cost $38,784,923) | 17,501,207 | ||||
| Management Investment Companies 10.1% | |||||
| Diversified Financials 10.1% | |||||
| f Franklin Lower Tier Floating Rate Fund | United States | 38,346,600 | 374,646,288 | ||
| f Franklin Middle Tier Floating Rate Fund | United States | 29,441,483 | 280,871,745 | ||
| iShares iBoxx High Yield Corporate Bond ETF. | United States | 1,245,000 | 104,393,250 | ||
| Total Management Investment Companies | |||||
| (Cost $783,145,043) | 759,911,283 | ||||
| Convertible Preferred Stocks 0.0%† | |||||
| Transportation 0.0%† | |||||
| a,e CEVA Holdings LLC, cvt. pfd., A-1 | United Kingdom | 62 | 42,160 | ||
| a,e CEVA Holdings LLC, cvt. pfd., A-2 | United Kingdom | 3,399 | 1,699,280 | ||
| Total Convertible Preferred Stocks | |||||
| (Cost $5,149,789) | 1,741,440 | ||||
| Principal | |||||
| Amount* | |||||
| Corporate Bonds 39.2% | |||||
| Automobiles & Components 0.9% | |||||
| g Avis Budget Finance PLC, senior note, 144A, 6.00%, 3/01/21 | United States | 4,900,000 | EUR | 5,827,156 | |
| Fiat Chrysler Automobiles NV, senior note, 5.25%, 4/15/23 | United Kingdom | 35,000,000 | 35,546,000 | ||
| The Goodyear Tire & Rubber Co., | |||||
| senior note, 6.50%, 3/01/21 | United States | 20,000,000 | 21,075,000 | ||
| senior note, 5.125%, 11/15/23 | United States | 5,400,000 | 5,602,500 | ||
| 68,050,656 | |||||
| Banks 3.4% | |||||
| Bank of America Corp., | |||||
| h junior sub. bond, AA, 6.10% to 3/17/25, FRN thereafter, | |||||
| Perpetual | United States | 10,000,000 | 10,018,750 | ||
| h junior sub. bond, M, 8.125% to 5/15/18, FRN thereafter, | |||||
| Perpetual | United States | 16,500,000 | 16,231,875 | ||
| senior note, 6.40%, 8/28/17 | United States | 10,000,000 | 10,614,210 | ||
| senior note, 5.65%, 5/01/18 | United States | 10,000,000 | 10,744,370 | ||
| CIT Group Inc., | |||||
| senior note, 5.375%, 5/15/20 | United States | 6,900,000 | 7,253,625 | ||
| senior note, 5.00%, 8/15/22 | United States | 18,000,000 | 18,900,000 | ||
| g senior note, 144A, 6.625%, 4/01/18. | United States | 4,000,000 | 4,225,000 | ||
franklintempleton.com
Annual Report
19
FRANKLIN STRATEGIC SERIES
CONSOLIDATED STATEMENT OF INVESTMENTS
| Franklin Strategic Income Fund (continued) | ||||
| Principal | ||||
| Country | Amount* | Value | ||
| Corporate Bonds (continued) | ||||
| Banks (continued) | ||||
| Citigroup Inc., | ||||
| h junior sub. bond, M, 6.30% to 5/15/24, FRN thereafter, Perpetual . | United States | 6,900,000 | $ | 6,770,625 |
| h junior sub. bond, O, 5.875% to 3/27/20, FRN thereafter, Perpetual. | United States | 10,000,000 | 9,685,500 | |
| senior note, 3.875%, 10/25/23 | United States | 20,000,000 | 21,160,420 | |
| sub. bond, 5.50%, 9/13/25 | United States | 10,000,000 | 11,092,940 | |
| sub. note, 4.05%, 7/30/22. | United States | 5,000,000 | 5,252,390 | |
| JPMorgan Chase & Co., | ||||
| h junior sub. bond, R, 6.00% to 8/01/23, FRN thereafter, Perpetual . | United States | 10,000,000 | 10,251,000 | |
| h junior sub. bond, V, 5.00% to 7/30/19, FRN thereafter, Perpetual | United States | 5,000,000 | 4,819,250 | |
| h junior sub. bond, X, 6.10% to 10/01/24, FRN thereafter, Perpetual. | United States | 5,000,000 | 5,150,000 | |
| senior note, 4.25%, 10/15/20 | United States | 10,000,000 | 10,822,320 | |
| senior note, 3.25%, 9/23/22 | United States | 5,000,000 | 5,200,550 | |
| sub. note, 3.375%, 5/01/23 | United States | 10,000,000 | 10,123,300 | |
| sub. note, 3.875%, 9/10/24 | United States | 10,000,000 | 10,345,970 | |
| Royal Bank of Scotland Group PLC, | ||||
| sub. note, 6.125%, 12/15/22 | United Kingdom | 10,000,000 | 10,699,750 | |
| sub. note, 5.125%, 5/28/24 | United Kingdom | 2,600,000 | 2,531,373 | |
| Wells Fargo & Co., | ||||
| h junior sub. bond, 5.875% to 6/15/25, FRN thereafter, Perpetual | United States | 22,000,000 | 23,526,250 | |
| h junior sub. bond, S, 5.90% to 6/15/24, FRN thereafter, Perpetual | United States | 21,000,000 | 21,525,000 | |
| senior note, 2.60%, 7/22/20 | United States | 10,000,000 | 10,255,260 | |
| 257,199,728 | ||||
| Capital Goods 0.8% | ||||
| g Bombardier Inc., senior bond, 144A, 7.50%, 3/15/25 | Canada | 30,000,000 | 27,000,000 | |
| e Erickson Air-Crane Inc., Purchase Price Notes, 6.00%, 11/02/20 | United States | 858,802 | 690,197 | |
| g KM Germany Holdings GmbH, senior secured note, first lien, 144A, | ||||
| 8.75%, 12/15/20 | Germany | 8,000,000 | 9,795,156 | |
| Meritor Inc., senior note, 6.75%, 6/15/21 | United States | 4,000,000 | 3,800,000 | |
| Navistar International Corp., senior bond, 8.25%, 11/01/21 | United States | 11,400,000 | 8,208,000 | |
| TransDigm Inc., | �� | |||
| senior sub. bond, 6.50%, 7/15/24 | United States | 4,000,000 | 4,050,000 | |
| senior sub. bond, 6.50%, 5/15/25 | United States | 2,500,000 | 2,521,875 | |
| senior sub. note, 6.00%, 7/15/22 | United States | 4,000,000 | 4,068,800 | |
| 60,134,028 | ||||
| Commercial & Professional Services 0.1% | ||||
| i United Rentals North America Inc., senior bond, 5.875%, 9/15/26 | United States | 7,500,000 | 7,500,000 | |
| Consumer Durables & Apparel 0.3% | ||||
| KB Home, | ||||
| senior bond, 7.50%, 9/15/22 | United States | 5,000,000 | 5,129,500 | |
| senior note, 4.75%, 5/15/19 | United States | 9,400,000 | 9,494,000 | |
| senior note, 7.00%, 12/15/21 | United States | 10,000,000 | 10,250,000 | |
| 24,873,500 | ||||
| Consumer Services 1.5% | ||||
| g 1011778 BC ULC/New Red Finance Inc., secured note, second lien, | ||||
| 144A, 6.00%, 4/01/22 | Canada | 20,000,000 | 20,775,000 | |
| GLP Capital LP/GLP Financing II Inc., senior note, 5.375%, 4/15/26 | United States | 6,100,000 | 6,366,875 | |
| g International Game Technology PLC, | ||||
| senior secured bond, 144A, 6.50%, 2/15/25 | United States | 13,200,000 | 13,431,000 | |
| senior secured note, 144A, 6.25%, 2/15/22 | United States | 20,500,000 | 20,961,250 | |
| Marriott International Inc., senior bond, 3.75%, 10/01/25 | United States | 30,000,000 | 31,179,330 | |
20 Annual Report
franklintempleton.com
FRANKLIN STRATEGIC SERIES
CONSOLIDATED STATEMENT OF INVESTMENTS
| Franklin Strategic Income Fund (continued) | |||||
| Principal | |||||
| Country | Amount* | Value | |||
| Corporate Bonds (continued) | |||||
| Consumer Services (continued) | |||||
| g Wynn Las Vegas LLC/Wynn Las Vegas Capital Corp., senior bond, | |||||
| 144A, 5.50%, 3/01/25 | United States | 8,700,000 | $ | 8,357,437 | |
| g Wynn Macau Ltd., senior note, 144A, 5.25%, 10/15/21 | Macau | 12,700,000 | 12,255,500 | ||
| 113,326,392 | |||||
| Diversified Financials 2.6% | |||||
| AerCap Ireland Capital Ltd./AerCap Global Aviation Trust, | |||||
| senior note, 4.25%, 7/01/20 | Netherlands | 6,200,000 | 6,359,123 | ||
| senior note, 4.625%, 10/30/20 | Netherlands | 5,800,000 | 6,037,191 | ||
| senior note, 5.00%, 10/01/21 | Netherlands | 10,600,000 | 11,200,755 | ||
| senior note, 4.625%, 7/01/22 | Netherlands | 9,100,000 | 9,456,720 | ||
| Deutsche Bank AG, sub. bond, 4.296% to 5/24/23, FRN thereafter, | |||||
| 5/24/28 | Germany | 35,000,000 | 31,262,000 | ||
| E*TRADE Financial Corp., | |||||
| senior note, 5.375%, 11/15/22 | United States | 9,000,000 | 9,576,090 | ||
| senior note, 4.625%, 9/15/23 | United States | 8,100,000 | 8,239,320 | ||
| h The Goldman Sachs Group Inc., junior sub. bond, M, 5.375% to | |||||
| 5/10/20, FRN thereafter, Perpetual | United States | 30,200,000 | 29,180,750 | ||
| g Lincoln Finance Ltd., senior secured note, 144A, 6.875%, 4/15/21 | Netherlands | 6,400,000 | EUR | 7,884,129 | |
| Morgan Stanley, | |||||
| h junior sub. bond, 5.55% to 7/15/20, FRN thereafter, Perpetual | United States | 25,600,000 | 25,376,000 | ||
| sub. bond, 3.95%, 4/23/27 | United States | 10,000,000 | 10,001,190 | ||
| Navient Corp., | |||||
| senior note, 8.45%, 6/15/18 | United States | 10,000,000 | 10,737,500 | ||
| senior note, 5.50%, 1/15/19 | United States | 16,000,000 | 15,900,000 | ||
| senior note, 5.875%, 3/25/21 | United States | 5,000,000 | 4,793,750 | ||
| senior note, 6.125%, 3/25/24 | United States | 10,000,000 | 9,005,000 | ||
| 195,009,518 | |||||
| Energy 4.4% | |||||
| Access Midstream Partner LP/ACMP Finance Corp., senior note, | |||||
| 6.125%, 7/15/22 | United States | 7,300,000 | 7,268,399 | ||
| j BreitBurn Energy Partners LP/BreitBurn Finance Corp., senior bond, | |||||
| 7.875%, 4/15/22 | United States | 25,000,000 | 1,875,000 | ||
| g California Resources Corp., secured note, second lien, 144A, 8.00%, | |||||
| 12/15/22 | United States | 7,852,000 | 5,408,065 | ||
| g Calumet Specialty Products Partners LP/Calumet Finance Corp., | |||||
| senior note, 144A, 11.50%, 1/15/21 | United States | 8,900,000 | 9,701,000 | ||
| CGG SA, | |||||
| senior note, 6.50%, 6/01/21 | France | 12,000,000 | 4,860,000 | ||
| senior note, 6.875%, 1/15/22 | France | 10,000,000 | 4,000,000 | ||
| c,e,j Chaparral Energy Inc., | |||||
| senior bond, 8.25%, 9/01/21 | United States | 8,000,000 | 2,440,000 | ||
| senior bond, 7.625%, 11/15/22 | United States | 1,400,000 | 427,000 | ||
| senior note, 9.875%, 10/01/20 | United States | 5,000,000 | 1,525,000 | ||
| j CHC Helicopter SA, | |||||
| senior note, 9.375%, 6/01/21 | Canada | 5,000,000 | 362,500 | ||
| senior secured note, first lien, 9.25%, 10/15/20 | Canada | 20,001,600 | 9,100,728 | ||
franklintempleton.com
Annual Report
21
FRANKLIN STRATEGIC SERIES
CONSOLIDATED STATEMENT OF INVESTMENTS
| Franklin Strategic Income Fund (continued) | ||||
| Principal | ||||
| Country | Amount* | Value | ||
| Corporate Bonds (continued) | ||||
| Energy (continued) | ||||
| g Chesapeake Energy Corp., secured note, second lien, 144A, 8.00%, | ||||
| 12/15/22 | United States | 8,330,000 | $ | 5,706,050 |
| Clayton Williams Energy Inc., senior note, 7.75%, 4/01/19. | United States | 14,600,000 | 10,293,000 | |
| CONSOL Energy Inc., | ||||
| senior note, 5.875%, 4/15/22 | United States | 20,000,000 | 16,675,000 | |
| senior note, 8.00%, 4/01/23 | United States | 5,000,000 | 4,287,500 | |
| Energy Transfer Equity LP, senior note, first lien, 7.50%, 10/15/20 | United States | 21,000,000 | 21,262,500 | |
| Energy Transfer Partners LP, senior note, 5.20%, 2/01/22 | United States | 10,000,000 | 10,041,640 | |
| j Energy XXI Gulf Coast Inc., | ||||
| senior note, 9.25%, 12/15/17 | United States | 15,000,000 | 459,375 | |
| senior note, 7.50%, 12/15/21 | United States | 2,100,000 | 107,625 | |
| senior note, 6.875%, 3/15/24 | United States | 10,000,000 | 462,500 | |
| g senior secured note, second lien, 144A, 11.00%, 3/15/20 | United States | 5,000,000 | 1,775,000 | |
| g EnQuest PLC, senior note, 144A, 7.00%, 4/15/22. | United Kingdom | 11,200,000 | 6,272,000 | |
| Freeport-McMoRan Oil & Gas LLC/FCX Oil & Gas Inc., senior note, | ||||
| 6.875%, 2/15/23 | United States | 3,816,000 | 3,453,480 | |
| g,k Gaz Capital SA (OJSC Gazprom), loan participation, senior note, | ||||
| 144A, 3.85%, 2/06/20 | Russia | 20,000,000 | 19,796,700 | |
| c Halcon Resources Corp., | ||||
| senior note, 9.75%, 7/15/20 | United States | 4,000,000 | 900,000 | |
| senior note, 8.875%, 5/15/21 | United States | 9,000,000 | 1,980,000 | |
| g senior secured note, third lien, 144A, 13.00%, 2/15/22. | United States | 10,000,000 | 3,250,000 | |
| g Kinder Morgan Finance Co. LLC, senior secured note, 144A, 6.00%, | ||||
| 1/15/18 | United States | 17,000,000 | 17,932,195 | |
| Kinder Morgan Inc., | ||||
| senior note, 7.00%, 6/15/17 | United States | 3,500,000 | 3,659,572 | |
| senior note, 6.50%, 9/15/20 | United States | 9,000,000 | 9,804,609 | |
| c,g,j Linn Energy LLC/Finance Corp., senior secured note, second lien, | ||||
| 144A, 12.00%, 12/15/20 | United States | 20,000,000 | 3,900,000 | |
| g LUKOIL International Finance BV, senior note, 144A, 4.563%, 4/24/23 . | Russia | 25,000,000 | 24,426,125 | |
| Martin Midstream Partners LP/Martin Midstream Finance Corp., senior | ||||
| note, 7.25%, 2/15/21 | United States | 20,000,000 | 18,400,000 | |
| j Midstates Petroleum Co. Inc./LLC, senior note, 9.25%, 6/01/21 | United States | 15,000,000 | 375,000 | |
| PBF Holding Co. LLC, first lien, 8.25%, 2/15/20 | United States | 18,000,000 | 18,832,500 | |
| g,j Peabody Energy Corp., secured note, second lien, 144A, 10.00%, | ||||
| 3/15/22 | United States | 30,000,000 | 3,528,000 | |
| j Penn Virginia Corp., senior note, 8.50%, 5/01/20 | United States | 15,000,000 | 3,150,000 | |
| Regency Energy Partners LP/Regency Energy Finance Corp., | ||||
| senior bond, 5.50%, 4/15/23 | United States | 5,000,000 | 4,731,565 | |
| senior note, 5.875%, 3/01/22 | United States | 1,300,000 | 1,329,888 | |
| senior note, 5.00%, 10/01/22 | United States | 10,000,000 | 9,821,370 | |
| Sabine Pass Liquefaction LLC, | ||||
| first lien, 5.625%, 2/01/21. | United States | 20,000,000 | 19,975,000 | |
| first lien, 5.625%, 4/15/23. | United States | 6,200,000 | 6,091,500 | |
| senior secured note, first lien, 5.75%, 5/15/24. | United States | 3,300,000 | 3,209,250 | |
| senior secured note, first lien, 5.625%, 3/01/25 | United States | 5,000,000 | 4,893,750 | |
| Sanchez Energy Corp., | ||||
| senior note, 7.75%, 6/15/21 | United States | 6,300,000 | 5,213,250 | |
| senior note, 6.125%, 1/15/23 | United States | 6,000,000 | 4,515,000 | |
| W&T Offshore Inc., senior note, 8.50%, 6/15/19 | United States | 22,000,000 | 3,630,000 | |
22 Annual Report
franklintempleton.com
FRANKLIN STRATEGIC SERIES
CONSOLIDATED STATEMENT OF INVESTMENTS
| Franklin Strategic Income Fund (continued) | ||||
| Principal | ||||
| Country | Amount* | Value | ||
| Corporate Bonds (continued) | ||||
| Energy (continued) | ||||
| WPX Energy Inc., senior note, 8.25%, 8/01/23 | United States | 10,900,000 | $ | 10,273,250 |
| 331,381,886 | ||||
| Food & Staples Retailing 0.8% | ||||
| g Cencosud SA, | ||||
| senior note, 144A, 4.875%, 1/20/23. | Chile | 15,000,000 | 15,196,800 | |
| senior note, 144A, 5.15%, 2/12/25. | Chile | 15,000,000 | 15,283,050 | |
| Walgreens Boots Alliance Inc., senior note, 3.80%, 11/18/24 | United States | 30,000,000 | 31,316,850 | |
| 61,796,700 | ||||
| Food, Beverage & Tobacco 1.1% | ||||
| Anheuser-Busch InBev Finance Inc., senior note, 3.30%, 2/01/23 | Belgium | 12,700,000 | 13,363,080 | |
| g JBS USA LLC/Finance Inc., | ||||
| senior bond, 144A, 5.875%, 7/15/24 | United States | 6,800,000 | 6,358,000 | |
| senior note, 144A, 8.25%, 2/01/20. | United States | 19,000,000 | 19,902,500 | |
| senior note, 144A, 5.75%, 6/15/25. | United States | 5,000,000 | 4,625,000 | |
| g Post Holdings Inc., | ||||
| senior note, 144A, 6.75%, 12/01/21. | United States | 15,800,000 | 16,599,954 | |
| senior note, 144A, 6.00%, 12/15/22. | United States | 10,000,000 | 10,306,250 | |
| senior note, 144A, 7.75%, 3/15/24. | United States | 9,000,000 | 9,832,500 | |
| 80,987,284 | ||||
| Health Care Equipment & Services 1.9% | ||||
| Alere Inc., senior sub. note, 6.50%, 6/15/20 | United States | 9,500,000 | 9,428,750 | |
| CHS/Community Health Systems Inc., | ||||
| senior note, 8.00%, 11/15/19 | United States | 10,200,000 | 10,314,750 | |
| senior note, 7.125%, 7/15/20 | United States | 6,000,000 | 5,820,000 | |
| senior note, 6.875%, 2/01/22 | United States | 3,300,000 | 3,017,438 | |
| senior secured note, first lien, 5.125%, 8/15/18 | United States | 6,000,000 | 6,090,000 | |
| DaVita HealthCare Partners Inc., | ||||
| senior bond, 5.125%, 7/15/24 | United States | 10,000,000 | 10,195,950 | |
| senior bond, 5.00%, 5/01/25 | United States | 9,300,000 | 9,323,250 | |
| senior note, 5.75%, 8/15/22 | United States | 10,000,000 | 10,512,500 | |
| HCA Inc., | ||||
| senior bond, 5.875%, 5/01/23 | United States | 15,000,000 | 15,853,125 | |
| senior bond, 5.875%, 2/15/26 | United States | 3,000,000 | 3,120,000 | |
| senior note, 7.50%, 2/15/22 | United States | 5,000,000 | 5,687,500 | |
| senior secured bond, first lien, 5.875%, 3/15/22 | United States | 10,000,000 | 10,950,000 | |
| senior secured bond, first lien, 5.25%, 4/15/25 | United States | 10,000,000 | 10,375,000 | |
| Stryker Corp., senior bond, 3.50%, 3/15/26 | United States | 4,800,000 | 5,040,547 | |
| Tenet Healthcare Corp., | ||||
| senior note, 5.00%, 3/01/19 | United States | 6,700,000 | 6,666,500 | |
| senior note, 5.50%, 3/01/19 | United States | 15,300,000 | 15,376,500 | |
| senior note, 8.125%, 4/01/22 | United States | 5,000,000 | 5,212,500 | |
| senior note, 6.75%, 6/15/23 | United States | 2,700,000 | 2,689,875 | |
| 145,674,185 | ||||
| Insurance 0.9% | ||||
| MetLife Inc., | ||||
| h junior sub. note, 5.25% to 6/15/20, FRN thereafter, Perpetual | United States | 3,200,000 | 3,123,840 | |
| junior sub. note, 6.40% to 12/15/36, FRN thereafter, 12/15/66. | United States | 15,000,000 | 16,021,500 | |
| senior note, 3.00%, 3/01/25 | United States | 2,400,000 | 2,407,658 | |
franklintempleton.com
Annual Report
23
FRANKLIN STRATEGIC SERIES
CONSOLIDATED STATEMENT OF INVESTMENTS
| Franklin Strategic Income Fund (continued) | |||||
| Principal | |||||
| Country | Amount* | Value | |||
| Corporate Bonds (continued) | |||||
| Insurance (continued) | |||||
| g Nippon Life Insurance Co., sub. bond, 144A, 5.10% to 10/16/24, FRN | |||||
| thereafter, 10/16/44 | Japan | 35,000,000 | $ | 38,150,000 | |
| Prudential Financial Inc., 3.50%, 5/15/24. | United States | 9,900,000 | 10,197,406 | ||
| 69,900,404 | |||||
| Materials 5.1% | |||||
| ArcelorMittal, | |||||
| senior note, 6.50%, 3/01/21 | Luxembourg | 17,600,000 | 18,025,216 | ||
| senior note, 7.25%, 2/25/22 | Luxembourg | 10,000,000 | 10,487,100 | ||
| senior note, 6.125%, 6/01/25 | Luxembourg | 3,700,000 | 3,635,250 | ||
| g Ardagh Packaging Finance PLC, senior note, 144A, 9.125%, 10/15/20 . | Luxembourg | 5,000,000 | 5,262,500 | ||
| g Ardagh Packaging Finance PLC/Ardagh MP Holdings USA Inc., | |||||
| senior note, 144A, 7.00%, 11/15/20. | Luxembourg | 1,764,706 | 1,676,471 | ||
| senior note, 144A, 6.75%, 1/31/21. | Luxembourg | 2,400,000 | 2,412,000 | ||
| senior note, 144A, 6.00%, 6/30/21. | Luxembourg | 3,100,000 | 3,061,250 | ||
| l senior secured note, 144A, FRN, 3.634%, 12/15/19 | Luxembourg | 8,700,000 | 8,807,662 | ||
| g Barminco Finance Pty. Ltd., senior note, 144A, 9.00%, 6/01/18 | Australia | 15,000,000 | 11,587,500 | ||
| g Cemex Finance LLC, senior secured note, first lien, 144A, 6.00%, | |||||
| 4/01/24 | Mexico | 5,800,000 | 5,766,099 | ||
| g Cemex SAB de CV, | |||||
| first lien, 144A, 5.70%, 1/11/25 | Mexico | 15,000,000 | 14,502,375 | ||
| secured note, 144A, 5.875%, 3/25/19 | Mexico | 10,000,000 | 10,247,750 | ||
| senior secured bond, first lien, 144A, 6.125%, 5/05/25. | Mexico | 4,000,000 | 3,938,480 | ||
| g Ceramtec Group GmbH, senior note, 144A, 8.25%, 8/15/21 | Germany | 11,900,000 | EUR | 14,699,549 | |
| g The Chemours Co., | |||||
| senior bond, 144A, 7.00%, 5/15/25 | United States | 4,700,000 | 4,100,750 | ||
| senior note, 144A, 6.625%, 5/15/23. | United States | 21,000,000 | 18,480,000 | ||
| g First Quantum Minerals Ltd., | |||||
| senior note, 144A, 6.75%, 2/15/20. | Zambia | 7,500,000 | 6,281,250 | ||
| senior note, 144A, 7.00%, 2/15/21. | Zambia | 10,000,000 | 8,150,000 | ||
| g FMG Resources (August 2006) Pty. Ltd., senior secured note, 144A, | |||||
| 9.75%, 3/01/22 | Australia | 20,800,000 | 21,894,080 | ||
| Freeport-McMoRan Inc., senior note, 4.55%, 11/14/24 | United States | 26,000,000 | 22,002,500 | ||
| g Glencore Finance Canada Ltd., senior bond, 144A, 4.95%, 11/15/21 | Switzerland | 13,300,000 | 12,982,954 | ||
| g Glencore Funding LLC, | |||||
| senior note, 144A, 4.125%, 5/30/23. | Switzerland | 5,000,000 | 4,503,720 | ||
| senior note, 144A, 4.625%, 4/29/24. | Switzerland | 2,500,000 | 2,279,375 | ||
| g INVISTA Finance LLC, senior secured note, 144A, 4.25%, 10/15/19 | United States | 30,000,000 | 29,117,700 | ||
| Novelis Inc., | |||||
| senior note, 8.375%, 12/15/17 | Canada | 9,000,000 | 9,180,000 | ||
| senior note, 8.75%, 12/15/20 | Canada | 8,000,000 | 8,300,000 | ||
| g Owens-Brockway Glass Container Inc., | |||||
| senior note, 144A, 5.00%, 1/15/22. | United States | 7,800,000 | 8,063,250 | ||
| senior note, 144A, 5.875%, 8/15/23. | United States | 12,500,000 | 13,468,750 | ||
| Reynolds Group Issuer Inc./LLC/SA, | |||||
| first lien, 5.75%, 10/15/20. | United States | 6,600,000 | 6,872,250 | ||
| senior note, 8.50%, 5/15/18 | United States | 14,000,000 | 14,034,300 | ||
| senior note, 9.00%, 4/15/19 | United States | 1,000,000 | 1,017,500 | ||
| senior note, 9.875%, 8/15/19 | United States | 400,000 | 414,000 | ||
| senior note, 8.25%, 2/15/21 | United States | 10,000,000 | 10,400,000 | ||
| senior secured note, first lien, 7.125%, 4/15/19 | United States | 4,000,000 | 4,079,520 | ||
24 Annual Report
franklintempleton.com
FRANKLIN STRATEGIC SERIES
CONSOLIDATED STATEMENT OF INVESTMENTS
| Franklin Strategic Income Fund (continued) | |||||
| Principal | |||||
| Country | Amount* | Value | |||
| Corporate Bonds (continued) | |||||
| Materials (continued) | |||||
| g Sealed Air Corp., | |||||
| senior bond, 144A, 5.125%, 12/01/24 | United States | 11,300,000 | $ | 11,907,375 | |
| senior bond, 144A, 5.50%, 9/15/25 | United States | 2,600,000 | 2,765,750 | ||
| senior note, 144A, 6.50%, 12/01/20. | United States | 4,000,000 | 4,555,000 | ||
| senior note, 144A, 4.875%, 12/01/22 | United States | 11,300,000 | 11,780,250 | ||
| Steel Dynamics Inc., | |||||
| senior bond, 5.50%, 10/01/24 | United States | 9,700,000 | 9,881,875 | ||
| senior note, 5.125%, 10/01/21 | United States | 9,200,000 | 9,453,000 | ||
| g U.S. Coatings Acquisition Inc./Flash Dutch 2 BV, 144A, 5.75%, 2/01/21. | United States | 8,000,000 | EUR | 9,544,368 | |
| j Verso Paper Holdings LLC/Inc., senior secured note, first lien, 11.75%, | |||||
| 1/15/19 | United States | 2,523,000 | 321,682 | ||
| 379,940,401 | |||||
| Media 4.1% | |||||
| 21st Century Fox America Inc., senior note, 3.00%, 9/15/22 | United States | 6,100,000 | 6,340,065 | ||
| g Altice U.S. Finance I Corp., senior secured bond, 144A, 5.50%, | |||||
| 5/15/26 | United States | 12,800,000 | 12,960,000 | ||
| AMC Networks Inc., senior note, 5.00%, 4/01/24 | United States | 12,500,000 | 12,546,875 | ||
| Cablevision Systems Corp., senior note, 8.625%, 9/15/17 | United States | 3,000,000 | 3,191,250 | ||
| CCO Holdings LLC/CCO Holdings Capital Corp., | |||||
| senior bond, 5.25%, 9/30/22 | United States | 15,000,000 | 15,525,000 | ||
| g senior bond, 144A, 5.375%, 5/01/25 | United States | 13,000,000 | 13,341,250 | ||
| senior note, 6.50%, 4/30/21 | United States | 8,000,000 | 8,298,400 | ||
| Clear Channel Worldwide Holdings Inc., | |||||
| senior note, 6.50%, 11/15/22 | United States | 3,000,000 | 2,925,000 | ||
| senior note, 6.50%, 11/15/22 | United States | 5,000,000 | 5,050,000 | ||
| senior sub. note, 7.625%, 3/15/20 | United States | 900,000 | 792,000 | ||
| senior sub. note, 7.625%, 3/15/20 | United States | 6,400,000 | 5,964,032 | ||
| CSC Holdings LLC, | |||||
| senior bond, 7.625%, 7/15/18 | United States | 6,000,000 | 6,510,000 | ||
| senior note, 6.75%, 11/15/21 | United States | 22,000,000 | 22,756,250 | ||
| senior note, 5.25%, 6/01/24 | United States | 2,300,000 | 2,098,750 | ||
| DISH DBS Corp., | |||||
| senior bond, 5.00%, 3/15/23 | United States | 10,000,000 | 9,175,000 | ||
| senior note, 6.75%, 6/01/21 | United States | 4,000,000 | 4,130,840 | ||
| senior note, 5.875%, 7/15/22 | United States | 3,000,000 | 2,925,000 | ||
| senior note, 5.875%, 11/15/24 | United States | 5,000,000 | 4,712,500 | ||
| Gannett Co. Inc., | |||||
| senior bond, 6.375%, 10/15/23 | United States | 12,000,000 | 13,005,000 | ||
| g senior bond, 144A, 5.50%, 9/15/24 | United States | 2,800,000 | 2,901,500 | ||
| senior note, 5.125%, 7/15/20 | United States | 9,800,000 | 10,216,500 | ||
| iHeartCommunications Inc., | |||||
| senior secured bond, first lien, 9.00%, 3/01/21 | United States | 23,800,000 | 16,927,750 | ||
| senior secured note, first lien, 9.00%, 9/15/22. | United States | 8,100,000 | 5,720,625 | ||
| g Sirius XM Radio Inc., | |||||
| senior bond, 144A, 6.00%, 7/15/24 | United States | 14,600,000 | 15,440,960 | ||
| senior bond, 144A, 5.375%, 4/15/25 | United States | 10,000,000 | 10,250,000 | ||
| Time Warner Cable Inc., senior note, 4.00%, 9/01/21 | United States | 12,600,000 | 13,451,130 | ||
| g Unitymedia Hessen GmbH & Co. KG/Unitymedia NRW GmbH, | |||||
| senior secured bond, first lien, 144A, 5.75%, 1/15/23 | Germany | 2,997,000 | EUR | 3,705,152 | |
| senior secured note, first lien, 144A, 5.625%, 4/15/23 | Germany | 1,520,000 | EUR | 1,881,619 | |
franklintempleton.com
Annual Report
25
FRANKLIN STRATEGIC SERIES
CONSOLIDATED STATEMENT OF INVESTMENTS
| Franklin Strategic Income Fund (continued) | |||||
| Principal | |||||
| Country | Amount* | Value | |||
| Corporate Bonds (continued) | |||||
| Media (continued) | |||||
| g Unitymedia KabelBW GmbH, senior bond, 144A, 6.125%, 1/15/25 | Germany | 18,000,000 | $ | 18,544,410 | |
| g Univision Communications Inc., senior secured note, first lien, 144A, | |||||
| 5.125%, 2/15/25 | United States | 25,000,000 | 24,781,250 | ||
| g Virgin Media Finance PLC, senior bond, 144A, 6.375%, 10/15/24. | United Kingdom | 9,600,000 | GBP | 14,286,180 | |
| g Virgin Media Secured Finance PLC, | |||||
| senior secured bond, first lien, 144A, 5.50%, 1/15/25 | United Kingdom | 14,000,000 | 14,490,000 | ||
| senior secured note, first lien, 144A, 5.375%, 4/15/21 | United Kingdom | 3,870,000 | 4,022,130 | ||
| 308,866,418 | |||||
| Pharmaceuticals, Biotechnology & Life Sciences 3.2% | |||||
| AbbVie Inc., senior note, 3.60%, 5/14/25 | United States | 30,000,000 | 31,528,710 | ||
| Actavis Funding SCS, senior bond, 3.80%, 3/15/25 | United States | 25,000,000 | 25,680,525 | ||
| g Baxalta Inc., senior note, 144A, 4.00%, 6/23/25 | United States | 30,000,000 | 30,904,770 | ||
| Biogen Inc., senior note, 3.625%, 9/15/22 | United States | 14,900,000 | 15,808,274 | ||
| g Endo Finance LLC/Endo Ltd./Endo Finco Inc., | |||||
| senior bond, 144A, 6.00%, 2/01/25 | United States | 11,900,000 | 11,424,000 | ||
| senior note, 144A, 6.00%, 7/15/23. | United States | 8,000,000 | 7,820,000 | ||
| Gilead Sciences Inc., senior bond, 3.65%, 3/01/26 | United States | 29,800,000 | 31,966,818 | ||
| Grifols Worldwide Operations Ltd., senior note, 5.25%, 4/01/22 | United States | 10,300,000 | 10,660,500 | ||
| g Jaguar Holding Co. II/Pharmaceutical Product Development LLC, | |||||
| senior note, 144A, 6.375%, 8/01/23 | United States | 15,000,000 | 15,622,500 | ||
| g Valeant Pharmaceuticals International, senior note, 144A, 6.375%, | |||||
| 10/15/20 | United States | 16,600,000 | 15,126,750 | ||
| g Valeant Pharmaceuticals International Inc., | |||||
| senior bond, 144A, 6.125%, 4/15/25 | United States | 3,100,000 | 2,580,750 | ||
| senior note, 144A, 5.625%, 12/01/21 | United States | 5,000,000 | 4,262,500 | ||
| senior note, 144A, 5.50%, 3/01/23. | United States | 8,000,000 | 6,840,000 | ||
| Zoetis Inc., senior bond, 3.25%, 2/01/23 | United States | 30,000,000 | 30,263,460 | ||
| 240,489,557 | |||||
| Real Estate 0.4% | |||||
| Equinix Inc., | |||||
| senior bond, 5.375%, 4/01/23 | United States | 25,000,000 | 26,250,000 | ||
| senior bond, 5.875%, 1/15/26 | United States | 2,700,000 | 2,863,674 | ||
| 29,113,674 | |||||
| Retailing 0.7% | |||||
| g Argos Merger Sub Inc., senior note, 144A, 7.125%, 3/15/23 | United States | 15,000,000 | 15,375,000 | ||
| g Dollar Tree Inc., | |||||
| senior note, 144A, 5.25%, 3/01/20. | United States | 1,600,000 | 1,670,000 | ||
| senior note, 144A, 5.75%, 3/01/23. | United States | 6,900,000 | 7,391,625 | ||
| c,g,j Edcon Ltd., secured note, 144A, 9.50%, 3/01/18 | South Africa | 15,325,000 | EUR | 6,142,299 | |
| Netflix Inc., | |||||
| senior bond, 5.875%, 2/15/25 | United States | 10,000,000 | 10,550,000 | ||
| senior note, 5.50%, 2/15/22 | United States | 13,600,000 | 14,280,000 | ||
| 55,408,924 | |||||
| Semiconductors & Semiconductor Equipment 0.2% | |||||
| g Qorvo Inc., | |||||
| senior bond, 144A, 7.00%, 12/01/25 | United States | 4,300,000 | 4,429,000 | ||
| senior note, 144A, 6.75%, 12/01/23. | United States | 10,000,000 | 10,300,000 | ||
| 14,729,000 | |||||
26 Annual Report
franklintempleton.com
FRANKLIN STRATEGIC SERIES
CONSOLIDATED STATEMENT OF INVESTMENTS
| Franklin Strategic Income Fund (continued) | ||||
| Principal | ||||
| Country | Amount* | Value | ||
| Corporate Bonds (continued) | ||||
| Software & Services 0.7% | ||||
| g BMC Software Finance Inc., senior note, 144A, 8.125%, 7/15/21 | United States | 28,000,000 | $ | 20,860,000 |
| g First Data Corp., | ||||
| second lien, 144A, 5.75%, 1/15/24 | United States | 22,400,000 | 22,820,000 | |
| senior note, 144A, 7.00%, 12/01/23. | United States | 7,500,000 | 7,734,375 | |
| 51,414,375 | ||||
| Technology Hardware & Equipment 0.5% | ||||
| g,m CommScope Holdings Co. Inc., senior note, 144A, PIK, 6.625%, | ||||
| 6/01/20 | United States | 1,800,000 | 1,863,536 | |
| g CommScope Technologies Finance LLC, senior bond, 144A, 6.00%, | ||||
| 6/15/25 | United States | 11,600,000 | 11,890,000 | |
| g Western Digital Corp., senior note, 144A, 10.50%, 4/01/24 | United States | 20,700,000 | 20,182,500 | |
| 33,936,036 | ||||
| Telecommunication Services 3.5% | ||||
| AT&T Inc., senior bond, 3.40%, 5/15/25 | United States | 20,000,000 | 20,358,300 | |
| CenturyLink Inc., | ||||
| senior bond, 6.75%, 12/01/23 | United States | 5,000,000 | 4,943,750 | |
| senior bond, 5.625%, 4/01/25 | United States | 10,000,000 | 9,119,900 | |
| senior note, 6.00%, 4/01/17 | United States | 10,000,000 | 10,263,600 | |
| senior note, 6.45%, 6/15/21 | United States | 2,000,000 | 2,055,000 | |
| senior note, 5.80%, 3/15/22 | United States | 2,000,000 | 1,982,500 | |
| g Digicel Group Ltd., | ||||
| senior note, 144A, 8.25%, 9/30/20. | Bermuda | 10,000,000 | 9,106,000 | |
| senior note, 144A, 7.125%, 4/01/22. | Bermuda | 3,000,000 | 2,460,735 | |
| g Digicel Ltd., | ||||
| senior note, 144A, 6.00%, 4/15/21. | Bermuda | 10,000,000 | 9,186,750 | |
| senior note, 144A, 6.75%, 3/01/23. | Bermuda | 4,100,000 | 3,736,207 | |
| Intelsat Jackson Holdings SA, | ||||
| senior bond, 6.625%, 12/15/22 | Luxembourg | 10,000,000 | 6,512,500 | |
| senior bond, 5.50%, 8/01/23 | Luxembourg | 3,000,000 | 1,903,560 | |
| senior note, 7.25%, 10/15/20 | Luxembourg | 15,000,000 | 11,006,250 | |
| senior note, 7.50%, 4/01/21 | Luxembourg | 9,000,000 | 6,446,250 | |
| g Millicom International Cellular SA, senior note, 144A, 6.625%, | ||||
| 10/15/21 | Luxembourg | 21,800,000 | 22,154,250 | |
| Sprint Communications Inc., | ||||
| senior note, 8.375%, 8/15/17 | United States | 17,000,000 | 17,382,500 | |
| senior note, 6.00%, 11/15/22 | United States | 10,000,000 | 7,405,100 | |
| g senior note, 144A, 9.00%, 11/15/18. | United States | 8,000,000 | 8,480,000 | |
| g senior note, 144A, 7.00%, 3/01/20. | United States | 5,000,000 | 5,156,250 | |
| Sprint Corp., | ||||
| senior bond, 7.875%, 9/15/23 | United States | 4,700,000 | 3,689,500 | |
| senior bond, 7.125%, 6/15/24 | United States | 2,700,000 | 2,038,500 | |
| T-Mobile USA Inc., | ||||
| senior bond, 6.50%, 1/15/24 | United States | 5,000,000 | 5,343,750 | |
| senior bond, 6.375%, 3/01/25 | United States | 14,700,000 | 15,490,125 | |
| senior note, 6.542%, 4/28/20 | United States | 5,000,000 | 5,156,310 | |
| senior note, 6.633%, 4/28/21 | United States | 3,500,000 | 3,701,250 | |
| senior note, 6.125%, 1/15/22 | United States | 2,000,000 | 2,111,260 | |
| senior note, 6.731%, 4/28/22 | United States | 3,500,000 | 3,702,055 | |
| senior note, 6.00%, 4/15/24 | United States | 4,200,000 | 4,404,750 | |
| Verizon Communications Inc., senior note, 5.15%, 9/15/23 | United States | 22,000,000 | 25,346,464 | |
franklintempleton.com
Annual Report
27
FRANKLIN STRATEGIC SERIES
CONSOLIDATED STATEMENT OF INVESTMENTS
| Franklin Strategic Income Fund (continued) | |||||
| Principal | |||||
| Country | Amount* | Value | |||
| Corporate Bonds (continued) | |||||
| Telecommunication Services (continued) | |||||
| g Wind Acquisition Finance SA, | |||||
| senior secured note, 144A, 4.00%, 7/15/20 | Italy | 14,400,000 | EUR | $ | 16,169,839 |
| senior secured note, 144A, 7.00%, 4/23/21 | Italy | 17,300,000 | EUR | 18,271,378 | |
| 265,084,583 | |||||
| Transportation 0.4% | |||||
| g Florida East Coast Holdings Corp., | |||||
| secured note, first lien, 144A, 6.75%, 5/01/19 | United States | 7,600,000 | 7,714,000 | ||
| senior note, 144A, 9.75%, 5/01/20. | United States | 4,000,000 | 3,140,000 | ||
| Hertz Corp., senior note, 6.25%, 10/15/22 | United States | 3,700,000 | 3,744,363 | ||
| g Stena International SA, senior secured bond, first lien, 144A, 5.75%, | |||||
| 3/01/24 | Sweden | 15,000,000 | 12,600,000 | ||
| 27,198,363 | |||||
| Utilities 1.7% | |||||
| Calpine Corp., | |||||
| senior bond, 5.75%, 1/15/25 | United States | 9,000,000 | 9,123,750 | ||
| senior note, 5.375%, 1/15/23 | United States | 10,000,000 | 10,137,500 | ||
| g senior secured bond, first lien, 144A, 7.875%, 1/15/23. | United States | 3,490,000 | 3,743,025 | ||
| g senior secured bond, first lien, 144A, 5.875%, 1/15/24. | United States | 2,000,000 | 2,135,000 | ||
| g senior secured note, first lien, 144A, 6.00%, 1/15/22 | United States | 1,300,000 | 1,379,625 | ||
| g,h EDF SA, | |||||
| junior sub. bond, 144A, 5.625% to 1/22/24, FRN thereafter, | |||||
| Perpetual | France | 5,000,000 | 4,820,250 | ||
| sub. note, 144A, 5.25% to 1/29/23, FRN thereafter, Perpetual | France | 25,000,000 | 24,175,000 | ||
| g Exelon Corp., senior bond, 144A, 3.95%, 6/15/25. | United States | 18,500,000 | 19,756,427 | ||
| g InterGen NV, secured bond, 144A, 7.00%, 6/30/23 | Netherlands | 25,000,000 | 17,375,000 | ||
| Sempra Energy, | |||||
| senior bond, 3.55%, 6/15/24 | United States | 8,800,000 | 9,111,098 | ||
| senior note, 3.75%, 11/15/25 | United States | 12,300,000 | 12,880,646 | ||
| g,j Texas Competitive Electric Holdings Co. LLC/Texas Competitive | |||||
| Electric Holdings Finance Inc., senior secured note, first lien, 144A, | |||||
| 11.50%, 10/01/20 | United States | 30,000,000 | 10,125,000 | ||
| 124,762,321 | |||||
| Total Corporate Bonds (Cost $3,191,756,608) | 2,946,777,933 | ||||
| l,n Senior Floating Rate Interests 10.7% | |||||
| Automobiles & Components 0.4% | |||||
| Crowne Group LLC, Term Loan, 6.00%, 9/30/20 | United States | 9,284,014 | 8,959,074 | ||
| o TI Group Automotive Systems LLC, Initial U.S. Term Loan, 4.50%, | |||||
| 6/25/22 | United States | 20,224,302 | 20,224,302 | ||
| 29,183,376 | |||||
| Capital Goods 0.3% | |||||
| Doncasters U.S. Finance LLC, Second Lien Term Loan, 9.50%, | |||||
| 10/09/20 | United States | 736,591 | 690,554 | ||
| Sensus USA Inc., Term Loan, 6.50%, 4/05/23 | United States | 17,780,000 | 17,491,075 | ||
| Ventia Pty. Ltd., Term B Loans, 5.50%, 5/21/22 | Australia | 423,942 | 425,002 | ||
| 18,606,631 | |||||
| Commercial & Professional Services 0.1% | |||||
| Kar Auction Services Inc., Tranche B-3 Term Loan, 4.25%, 3/09/23 | United States | 9,513,966 | 9,549,644 | ||
28 Annual Report
franklintempleton.com
FRANKLIN STRATEGIC SERIES
CONSOLIDATED STATEMENT OF INVESTMENTS
| Franklin Strategic Income Fund (continued) | ||||
| Principal | ||||
| Country | Amount* | Value | ||
| l,n Senior Floating Rate Interests (continued) | ||||
| Consumer Durables & Apparel 0.0%† | ||||
| o Prime Security Services Borrower LLC, Term B-1 Loans, 7.00%, | ||||
| 5/02/22 | United States | 2,093,917 | $ | 2,104,060 |
| Consumer Services 0.6% | ||||
| Fitness International LLC, Term B Loan, 5.50%, 7/01/20 | United States | 43,060,087 | 42,306,535 | |
| c,m Turtle Bay Holdings LLC, Term Loan B, PIK, 3.25%, 6/30/16 | United States | 4,831,215 | 4,630,732 | |
| 46,937,267 | ||||
| Diversified Financials 0.2% | ||||
| First Eagle Investment Management, Initial Term Loans, 4.75%, | ||||
| 12/01/22 | United States | 9,418,935 | 9,360,067 | |
| Guggenheim Partners Investment Management Holdings LLC, Initial | ||||
| Term Loan, 4.25%, 7/22/20 | United States | 8,382,847 | 8,402,060 | |
| 17,762,127 | ||||
| Energy 1.5% | ||||
| Bowie Resource Holdings LLC, | ||||
| First Lien Initial Term Loan, 8.75%, 8/16/20 | United States | 30,495,801 | 27,141,263 | |
| Second Lien Initial Term Loan, 12.50%, 2/16/21 | United States | 16,060,827 | 13,491,095 | |
| c Fieldwood Energy LLC, Loans, 3.875%, 10/01/18. | United States | 37,340,312 | 28,191,935 | |
| Foresight Energy LLC, Term Loans, 7.50%, 8/21/20 | United States | 14,228,000 | 12,520,640 | |
| c McDermott Finance LLC, Term Loan, 5.25%, 4/16/19 | United States | 2,067,034 | 1,995,980 | |
| OSG Bulk Ships Inc., Initial Term Loan, 5.25%, 8/05/19 | United States | 10,685,597 | 10,258,173 | |
| OSG International Inc., Initial Term Loan, 5.75%, 8/05/19 | United States | 20,724,325 | 20,517,082 | |
| 114,116,168 | ||||
| Health Care Equipment & Services 0.5% | ||||
| Community Health Systems Inc., 2018 Term F Loans, 3.685% - | ||||
| 3.886%, 12/31/18 | United States | 20,252,218 | 20,181,011 | |
| Cotiviti Corp., Second Lien Initial Term Loan, 8.00%, 5/13/22. | United States | 2,349,446 | 2,276,026 | |
| Kinetic Concepts Inc., Dollar Term E-1 Loan, 4.50%, 5/04/18. | United States | 10,190,038 | 10,198,954 | |
| New Millennium Holdco Inc., Closing Date Term Loan, 7.50%, | ||||
| 12/18/20 | United States | 2,983,072 | 2,326,796 | |
| 34,982,787 | ||||
| Materials 1.1% | ||||
| The Chemours Co. LLC, Tranche B Term Loan, 3.75%, 5/12/22 | United States | 31,146,356 | 30,445,563 | |
| Cyanco Intermediate Corp., Initial Term Loan, 5.50%, 5/01/20 | United States | 1,994,395 | 1,957,000 | |
| FMG America Finance Inc. (Fortescue Metals Group), Loans, 4.25%, | ||||
| 6/30/19 | Australia | 24,441,207 | 23,130,548 | |
| Huntsman International LLC, Extended Term Loan B, 3.435% - | ||||
| 3.519%, 4/19/19 | United States | 4,438,565 | 4,436,715 | |
| Novelis Inc., Initial Term Loan, 4.00%, 6/02/22 | Canada | 8,261,972 | 8,232,022 | |
| OCI Beaumont LLC, Term B-3 Loan, 7.75%, 8/20/19 | United States | 16,423,047 | 16,587,277 | |
| 84,789,125 | ||||
| Media 1.3% | ||||
| CSC Holdings Inc. (Cablevision), Initial Term Loans, 5.00%, 10/09/22 . | United States | 19,746,441 | 19,867,387 | |
| Gray Television Inc., Term Loan C, 4.25%, 6/13/21 | United States | 9,109,020 | 9,160,258 | |
| Media General Inc., Term B Loan, 4.00%, 7/31/20 | United States | 2,372,360 | 2,374,732 | |
| Radio One Inc., Term Loan B, 5.14%, 12/31/18 | United States | 69,057,037 | 69,531,805 | |
| 100,934,182 | ||||
franklintempleton.com
Annual Report
29
FRANKLIN STRATEGIC SERIES
CONSOLIDATED STATEMENT OF INVESTMENTS
| Franklin Strategic Income Fund (continued) | ||||
| Principal | ||||
| Country | Amount* | Value | ||
| l,n Senior Floating Rate Interests (continued) | ||||
| Pharmaceuticals, Biotechnology & Life Sciences 1.4% | ||||
| Endo Luxembourg Finance Co. I S.A.R.L. and Endo LLC, 2015 | ||||
| Incremental Term B Loans, 3.75%, 9/25/22 | United States | 24,743,712 | $ | 24,702,464 |
| Grifols Worldwide Operations USA Inc., US Tranche B Term Loan, | ||||
| 3.435%, 2/27/21 | United States | 30,366,904 | 30,442,821 | |
| Valeant Pharmaceuticals International Inc., | ||||
| Series C-2 Tranche B Term Loan, 4.75%, 12/11/19 | United States | 1,562,637 | 1,525,524 | |
| Series D-2 Tranche B Term Loan, 4.50%, 2/13/19 | United States | 13,717,575 | 13,403,210 | |
| Series F-1 Tranche B Term Loan, 5.00%, 4/01/22 | United States | 34,087,380 | 33,448,242 | |
| 103,522,261 | ||||
| Retailing 0.6% | ||||
| Ascena Retail Group Inc., Tranche B Term Loan, 5.25%, 8/21/22 | United States | 38,404,459 | 37,847,595 | |
| The Men’s Wearhouse Inc., Tranche B Term Loan, 4.50%, 6/18/21. | United States | 2,480,967 | 2,437,550 | |
| o PetSmart Inc., Term Loans, 4.25%, 3/10/22 | United States | 3,490,000 | 3,483,058 | |
| 43,768,203 | ||||
| Semiconductors & Semiconductor Equipment 0.7% | ||||
| o Avago Technologies Cayman Finance Ltd., Term B-1 Dollar Loans, | ||||
| 4.25%, 2/01/23 | United States | 29,035,582 | 29,106,167 | |
| M/A-COM Technology Solutions Holdings Inc., Initial Term Loan, | ||||
| 4.50%, 5/07/21 | United States | 4,695,564 | 4,695,564 | |
| o MKS Instruments Inc., Term Loan, 6.50%, 4/29/23 | United States | 2,750,436 | 2,765,908 | |
| NXP BV/NXP Funding LLC, Tranche B Loan, 3.75%, 12/07/20. | United States | 1,497,385 | 1,504,405 | |
| ON Semiconductor Corp., Closing Date Term Loans, 5.25%, 3/31/23 | United States | 17,625,431 | 17,742,199 | |
| 55,814,243 | ||||
| Software & Services 1.0% | ||||
| Match Group Inc., Term B-1 Loans, 5.50%, 11/16/22 | United States | 8,558,634 | 8,633,522 | |
| MoneyGram International Inc., Term Loan, 4.25%, 3/27/20 | United States | 50,454,536 | 47,742,605 | |
| Vertafore Inc., Second Lien Term Loan, 9.75%, 10/27/17 | United States | 15,025,339 | 15,074,171 | |
| 71,450,298 | ||||
| Technology Hardware & Equipment 0.4% | ||||
| Ciena Corp., Term Loan, 3.75%, 7/15/19 | United States | 2,309,024 | 2,304,694 | |
| Dell International LLC, Term B-2 Loan, 4.00%, 4/29/20 | United States | 13,871,169 | 13,877,245 | |
| o Western Digital Corp., U.S. Term B Loan, 8.00%, 4/29/23 | United States | 17,016,625 | 16,772,011 | |
| 32,953,950 | ||||
| Telecommunication Services 0.2% | ||||
| Intelsat Jackson Holdings SA, Tranche B-2 Term Loan, 3.75%, | ||||
| 6/30/19 | Luxembourg | 5,739,871 | 5,396,914 | |
| Windstream Corp., Tranche B-5 Term Loan, 3.50%, 8/08/19 | United States | 5,927,887 | 5,863,670 | |
| 11,260,584 | ||||
| Transportation 0.3% | ||||
| Hertz Corp., Credit Linked Deposit, 3.75%, 3/11/18 | United States | 6,855,000 | 6,760,744 | |
| Navios Maritime Midstream Partners LP, Initial Term Loan, 5.50%, | ||||
| 6/18/20 | Marshall Islands | 13,433,232 | 12,157,075 | |
| Navios Maritime Partners LP, Initial Term Loan, 5.25%, 6/27/18 | Marshall Islands | 688,938 | 609,710 | |
| 19,527,529 | ||||
30 Annual Report
franklintempleton.com
FRANKLIN STRATEGIC SERIES
CONSOLIDATED STATEMENT OF INVESTMENTS
| Franklin Strategic Income Fund (continued) | ||||||
| Principal | ||||||
| Country | Amount* | Value | ||||
| l,n Senior Floating Rate Interests (continued) | ||||||
| Utilities 0.1% | ||||||
| Calpine Corp., Term Loan (B6), 4.00%, 1/15/23 | United States | 6,731,365 | $ | 6,720,850 | ||
| Total Senior Floating Rate Interests | ||||||
| (Cost $818,254,935) | 803,983,285 | |||||
| Foreign Government and Agency Securities 13.0% | ||||||
| Government of Hungary, 5.375%, 2/21/23 | Hungary | 16,250,000 | 17,947,719 | |||
| Government of Indonesia, | ||||||
| 6.125%, 5/15/28 | Indonesia | 360,000,000,000 | IDR | 23,802,876 | ||
| FR28, 10.00%, 7/15/17 | Indonesia | 10,200,000,000 | IDR | 802,423 | ||
| FR34, 12.80%, 6/15/21 | Indonesia | 169,210,000,000 | IDR | 15,753,146 | ||
| FR36, 11.50%, 9/15/19 | Indonesia | 35,400,000,000 | IDR | 3,011,751 | ||
| FR39, 11.75%, 8/15/23 | Indonesia | 29,150,000,000 | IDR | 2,699,995 | ||
| FR44, 10.00%, 9/15/24 | Indonesia | 8,340,000,000 | IDR | 719,511 | ||
| senior bond, FR53, 8.25%, 7/15/21 | Indonesia | 467,000,000,000 | IDR | 36,745,148 | ||
| senior bond, FR70, 8.375%, 3/15/24 | Indonesia | 265,000,000,000 | IDR | 20,902,538 | ||
| Government of Malaysia, | ||||||
| senior bond, 4.24%, 2/07/18 | Malaysia | 66,300,000 | MYR | 17,343,564 | ||
| senior note, 3.172%, 7/15/16 | Malaysia | 338,100,000 | MYR | 86,670,959 | ||
| senior note, 3.394%, 3/15/17 | Malaysia | 159,000,000 | MYR | 40,941,533 | ||
| senior note, 4.012%, 9/15/17 | Malaysia | 242,700,000 | MYR | 63,086,468 | ||
| Government of Mexico, | ||||||
| 6.25%, 6/16/16 | Mexico | 12,628,270 | p | MXN | 73,709,353 | |
| 7.25%, 12/15/16 | Mexico | 11,765,870 | p | MXN | 69,842,998 | |
| 7.75%, 12/14/17 | Mexico | 4,000,000 | p | MXN | 24,611,984 | |
| senior note, M, 5.00%, 6/15/17 | Mexico | 9,500,000 | p | MXN | 55,820,099 | |
| g Government of Serbia, | ||||||
| senior note, 144A, 4.875%, 2/25/20. | Serbia | 29,400,000 | 30,174,249 | |||
| senior note, 144A, 7.25%, 9/28/21. | Serbia | 15,000,000 | 17,020,050 | |||
| Government of Sri Lanka, | ||||||
| A, 6.40%, 8/01/16 | Sri Lanka | 48,100,000 | LKR | 326,506 | ||
| B, 6.40%, 10/01/16 | Sri Lanka | 45,400,000 | LKR | 306,420 | ||
| Government of the Philippines, | ||||||
| senior bond, 9.125%, 9/04/16 | Philippines | 41,860,000 | PHP | 907,861 | ||
| senior note, 2.875%, 5/22/17 | Philippines | 900,000,000 | PHP | 19,252,392 | ||
| g Government of Ukraine, | ||||||
| 144A, 7.75%, 9/01/22 | Ukraine | 5,000,000 | 4,784,500 | |||
| 144A, 7.75%, 9/01/23 | Ukraine | 10,155,000 | 9,684,316 | |||
| 144A, 7.75%, 9/01/24 | Ukraine | 10,155,000 | 9,685,331 | |||
| 144A, 7.75%, 9/01/25 | Ukraine | 10,155,000 | 9,609,169 | |||
| 144A, 7.75%, 9/01/26 | Ukraine | 10,155,000 | 9,545,446 | |||
| 144A, 7.75%, 9/01/27 | Ukraine | 10,054,000 | 9,394,458 | |||
| a,q 144A, VRI, GDP Linked Securities, 5/31/40 | Ukraine | 20,490,000 | 6,433,860 | |||
| r Government of Uruguay, | ||||||
| senior bond, Index Linked, 5.00%, 9/14/18 | Uruguay | 160,659,417 | UYU | 5,084,998 | ||
| senior bond, Index Linked, 4.375%, 12/15/28 | Uruguay | 1,997,280,952 | UYU | 59,316,074 | ||
| Korea Monetary Stabilization Bond, | ||||||
| senior note, 1.96%, 2/02/17 | South Korea | 23,000,000,000 | KRW | 20,162,476 | ||
| senior note, 1.56%, 10/02/17 | South Korea | 33,000,000,000 | KRW | 28,860,130 | ||
| Korea Treasury Bond, senior note, 3.00%, 12/10/16 | South Korea | 39,000,000,000 | KRW | 34,372,549 | ||
franklintempleton.com
Annual Report
31
FRANKLIN STRATEGIC SERIES
CONSOLIDATED STATEMENT OF INVESTMENTS
| Franklin Strategic Income Fund (continued) | ||||||
| Principal | ||||||
| Country | Amount* | Value | ||||
| Foreign Government and Agency | ||||||
| Securities (continued) | ||||||
| Nota Do Tesouro Nacional, | ||||||
| 10.00%, 1/01/17 | Brazil | 142,250 | s | BRL | $ | 40,469,631 |
| 10.00%, 1/01/21 | Brazil | 70,000 | s | BRL | 18,838,854 | |
| 10.00%, 1/01/23 | Brazil | 52,000 | s | BRL | 13,602,357 | |
| t Index Linked, 6.00%, 8/15/16 | Brazil | 4,799 | s | BRL | 3,959,769 | |
| t Index Linked, 6.00%, 8/15/18 | Brazil | 34,550 | s | BRL | 28,646,005 | |
| t Index Linked, 6.00%, 5/15/23 | Brazil | 33,800 | s | BRL | 28,018,938 | |
| senior note, 10.00%, 1/01/19 | Brazil | 25,000 | s | BRL | 6,921,704 | |
| g,r Uruguay Notas del Tesoro, 18, Index Linked, 2.25%, 8/23/17 | Uruguay | 134,579,304 | UYU | 4,113,213 | ||
| Total Foreign Government and Agency Securities | ||||||
| (Cost $1,096,710,100) | 973,903,321 | |||||
| U.S. Government and Agency Securities 4.1% | ||||||
| U.S. Treasury Bond, | ||||||
| 4.50%, 5/15/17 | United States | 8,000,000 | 8,319,688 | |||
| 7.125%, 2/15/23 | United States | 3,000,000 | 4,079,940 | |||
| 6.25%, 8/15/23 | United States | 4,000,000 | 5,285,468 | |||
| 6.875%, 8/15/25 | United States | 1,000,000 | 1,439,297 | |||
| 6.50%, 11/15/26 | United States | 34,000,000 | 49,165,190 | |||
| 5.25%, 2/15/29 | United States | 1,750,000 | 2,390,288 | |||
| U.S. Treasury Note, | ||||||
| 4.75%, 8/15/17 | United States | 7,000,000 | 7,368,459 | |||
| 3.875%, 5/15/18 | United States | 22,000,000 | 23,400,784 | |||
| 3.75%, 11/15/18 | United States | 39,000,000 | 41,859,480 | |||
| 2.75%, 2/15/24 | United States | 33,000,000 | 35,612,940 | |||
| 2.50%, 5/15/24 | United States | 64,000,000 | 67,872,512 | |||
| 2.375%, 8/15/24 | United States | 41,000,000 | 43,062,013 | |||
| r Index Linked, 2.125%, 1/15/19 | United States | 8,834,833 | 9,519,762 | |||
| r Index Linked, 0.625%, 7/15/21 | United States | 10,520,032 | 11,051,168 | |||
| Total U.S. Government and Agency Securities | ||||||
| (Cost $300,357,423) | 310,426,989 | |||||
| Asset-Backed Securities and Commercial Mortgage- | ||||||
| Backed Securities 7.3% | ||||||
| Banks 3.5% | ||||||
| Banc of America Commercial Mortgage Trust, 2006-4, AJ, 5.695%, | ||||||
| 7/10/46 | United States | 25,977,000 | 25,799,094 | |||
| l Bear Stearns Adjustable Rate Mortgage Trust, 2004-4, A6, FRN, | ||||||
| 2.827%, 6/25/34 | United States | 15,449,768 | 15,497,213 | |||
| Bear Stearns Commercial Mortgage Securities Inc., | ||||||
| l 2006-PW11, AJ, FRN, 5.426%, 3/11/39 | United States | 19,604,000 | 18,778,225 | |||
| l 2006-PW12, AJ, FRN, 5.885%, 9/11/38 | United States | 19,507,375 | 19,490,076 | |||
| 2006-PW13, AJ, 5.611%, 9/11/41 | United States | 21,925,000 | 21,882,976 | |||
| Citigroup Commercial Mortgage Trust, | ||||||
| 2006-C5, AJ, 5.482%, 10/15/49 | United States | 15,756,000 | 14,161,887 | |||
| l 2007-C6, AM, FRN, 5.711%, 6/10/17. | United States | 25,650,000 | 25,810,313 | |||
| 2015-GC27, A5, 3.137%, 2/10/48 | United States | 6,739,800 | 6,944,800 | |||
32 Annual Report
franklintempleton.com
FRANKLIN STRATEGIC SERIES
CONSOLIDATED STATEMENT OF INVESTMENTS
| Franklin Strategic Income Fund (continued) | ||||
| Principal | ||||
| Country | Amount* | Value | ||
| Asset-Backed Securities and Commercial Mortgage- | ||||
| Backed Securities (continued) | ||||
| Banks (continued) | ||||
| l Citigroup/Deutsche Bank Commercial Mortgage Trust, 2006-CD3, AJ, | ||||
| FRN, 5.688%, 10/15/48 | United States | 21,795,000 | $ | 12,922,909 |
| Countrywide Asset-Backed Certificates, 2005-11, AF4, 5.21%, | ||||
| 3/25/34 | United States | 2,800,000 | 2,801,223 | |
| CSAIL Commercial Mortgage Trust, 2015-C1, A4, 3.505%, 4/15/50 | United States | 10,050,000 | 10,687,405 | |
| Greenwich Capital Commercial Funding Corp., | ||||
| l 2006-GG7, AJ, FRN, 5.921%, 7/10/38 | United States | 25,220,000 | 22,884,787 | |
| 2007-GG9, AM, 5.475%, 3/10/39 | United States | 6,165,000 | 6,282,206 | |
| JP Morgan Chase Commercial Mortgage Securities Trust, | ||||
| 2006-CB17, AM, 5.464%, 12/12/43 | United States | 17,740,000 | 17,574,841 | |
| l 2006-LDP7, AJ, FRN, 5.981%, 4/17/45 | United States | 5,660,000 | 4,261,980 | |
| JPMBB Commercial Mortgage Securities Trust, 2015 C-28, A4, | ||||
| 3.227%, 10/15/48 | United States | 6,110,000 | 6,332,191 | |
| l Merrill Lynch Mortgage Investors Trust, 2005-A6, 2A3, FRN, 0.819%, | ||||
| 8/25/35 | United States | 3,556,097 | 3,223,084 | |
| l Morgan Stanley Capital I Trust, | ||||
| 2006-HQ8, AJ, FRN, 5.423%, 3/12/44 | United States | 3,306,176 | 3,300,223 | |
| 2007-IQ16, AM, FRN, 6.053%, 12/12/49 | United States | 3,102,000 | 3,252,664 | |
| 2007-IQ16, AMA, FRN, 6.049%, 12/12/49 | United States | 12,415,000 | 12,899,802 | |
| Wells Fargo Commercial Mortgage Trust, 2014-LC16, A4, 3.548%, | ||||
| 8/15/50 | United States | 2,440,000 | 2,600,736 | |
| Wells Fargo Mortgage Backed Securities Trust, | ||||
| l 2004-W, A9, FRN, 2.753%, 11/25/34 | United States | 2,745,963 | 2,781,460 | |
| 2007-3, 3A1, 5.50%, 4/25/37 | United States | 619,315 | 627,917 | |
| 260,798,012 | ||||
| Diversified Financials 3.8% | ||||
| g,l ARES CLO XII Ltd., 2007-12A, B, 144A, FRN, 1.629%, 11/25/20 | United States | 3,840,000 | 3,786,662 | |
| g,l Atrium CDO Corp., 10A, C, 144A, FRN, 3.233%, 7/16/25 | United States | 13,950,000 | 13,549,774 | |
| g,l Atrium XI, 11A, C, 144A, FRN, 3.838%, 10/23/25 | Cayman Islands | 15,440,000 | 15,512,105 | |
| Banc of America Commercial Mortgage Trust, | ||||
| 2015-UBS7, A3, 3.441%, 9/15/48 | United States | 10,920,000 | 11,534,667 | |
| 2015-UBS7, A4, 3.705%, 9/15/48 | United States | 12,450,000 | 13,394,459 | |
| g,l BCAP LLC Trust, 2009-RR1, 2A2, 144A, FRN, 2.827%, 5/26/35 | United States | 9,473,234 | 8,781,925 | |
| g,l Catamaran CLO Ltd., 2013-1A, C, 144A, FRN, 3.234%, 1/27/25 | United States | 11,250,000 | 10,630,912 | |
| g,l Cent CDO Ltd., 2007-15A, A2B, 144A, FRN, 0.975%, 3/11/21 | United States | 3,881,000 | 3,717,688 | |
| g,l Cent CLO LP, 2013-17A, D, 144A, FRN, 3.616%, 1/30/25 | United States | 7,450,980 | 7,257,254 | |
| g,l CIFC Funding Ltd., 2007-3A, A1J, 144A, FRN, 1.036%, 7/26/21 | United States | 5,130,000 | 5,054,845 | |
| g Core Industrial Trust, 2015-CALW, A, 144A, 3.04%, 2/10/34 | United States | 27,075,000 | 28,117,940 | |
| g,l CT CDO IV Ltd., 2006-4A, A1, 144A, FRN, 0.749%, 10/20/43 | United States | 677,088 | 675,625 | |
| g,l Cumberland Park CDO Ltd., 2015-2A, B, 144A, FRN, 2.734%, 7/20/26. | United States | 12,270,000 | 11,730,856 | |
| g,l Cumberland Park CLO Ltd., 2015-2A, C, 144A, FRN, 3.484%, 7/20/26 . | United States | 1,850,000 | 1,814,739 | |
| g,l Eaton Vance CDO Ltd., | ||||
| 2014-1A, A, 144A, FRN, 2.078%, 7/15/26 | United States | 17,000,000 | 16,884,740 | |
| 2014-1A, B, 144A, FRN, 2.678%, 7/15/26 | United States | 4,320,500 | 4,227,393 | |
| 2014-1A, C, 144A, FRN, 3.628%, 7/15/26 | United States | 1,420,629 | 1,386,690 | |
franklintempleton.com
Annual Report
33
FRANKLIN STRATEGIC SERIES
CONSOLIDATED STATEMENT OF INVESTMENTS
| Franklin Strategic Income Fund (continued) | ||||
| Principal | ||||
| Country | Amount* | Value | ||
| Asset-Backed Securities and Commercial Mortgage- | ||||
| Backed Securities (continued) | ||||
| Diversified Financials (continued) | ||||
| g,l Eleven Madison Trust Mortgage Trust, 2015-11MD, A, 144A, FRN, | ||||
| 3.555%, 9/10/35 | United States | 14,920,000 | $ | 15,953,203 |
| l FHLMC Structured Agency Credit Risk Debt Notes, | ||||
| 2014-DN1, M2, FRN, 2.639%, 2/25/24. | United States | 13,000,000 | 13,115,474 | |
| 2014-HQ2, M2, FRN, 2.639%, 9/25/24 | United States | 14,600,000 | 14,536,877 | |
| 2015-HQ1, M2, FRN, 2.639%, 3/25/25 | United States | 9,200,000 | 9,286,611 | |
| g G-Force LLC, 2005-RRA, C, 144A, 5.20%, 8/22/36. | United States | 11,144,000 | 10,784,327 | |
| l Impac Secured Assets Trust, 2007-2, FRN, 0.689%, 4/25/37 | United States | 3,540,976 | 3,298,023 | |
| g,l Invitation Homes Trust, 2015-SFR1, A, 144A, FRN, 1.886%, 3/17/32 | United States | 8,952,652 | 8,981,320 | |
| l MortgageIT Trust, | ||||
| 2004-1, A2, FRN, 1.339%, 11/25/34 | United States | 4,346,631 | 4,124,525 | |
| 2005-5, A1, FRN, 0.699%, 12/25/35 | United States | 3,559,208 | 3,203,075 | |
| g,l Newcastle CDO Ltd., 2004-5A, 1, 144A, FRN, 0.968%, 12/24/39 | United States | 106,903 | 106,777 | |
| l Opteum Mortgage Acceptance Corp. Trust, 2005-4, 1APT, FRN, | ||||
| 0.749%, 11/25/35 | United States | 6,247,145 | 5,861,279 | |
| l Structured Asset Mortgage Investments Trust, 2003-AR2, A1, FRN, | ||||
| 1.176%, 12/19/33 | United States | 5,801,851 | 5,582,846 | |
| l Structured Asset Securities Corp., 2005-2XS, 2A2, FRN, 1.934%, | ||||
| 2/25/35 | United States | 4,057,674 | 3,885,191 | |
| l Thornburg Mortgage Securities Trust, | ||||
| 2005-1, A3, FRN, 2.534%, 4/25/45 | United States | 5,619,732 | 5,553,911 | |
| 2005-2, A1, FRN, 2.38%, 7/25/45 | United States | 3,225,373 | 3,122,716 | |
| g,l Voya CLO Ltd., | ||||
| 2013-1A, B, 144A, FRN, 3.528%, 4/15/24 | United States | 2,740,000 | 2,737,644 | |
| 2013-2A, B, 144A, FRN, 3.318%, 4/25/25 | United States | 10,770,000 | 10,476,410 | |
| g,l Westchester CLO Ltd., 2007-1A, A1A, 144A, FRN, 0.841%, 8/01/22 | United States | 7,794,639 | 7,698,842 | |
| 286,367,325 | ||||
| Total Asset-Backed Securities and Commercial | ||||
| Mortgage-Backed Securities (Cost $557,149,535) | 547,165,337 | |||
| Mortgage-Backed Securities 6.8% | ||||
| l Federal Home Loan Mortgage Corp. (FHLMC) Adjustable Rate | ||||
| 0.0%† | ||||
| FHLMC, 2.688%, 1/01/33 | United States | 97,292 | 101,515 | |
| Federal Home Loan Mortgage Corp. (FHLMC) Fixed Rate 1.4% | ||||
| FHLMC Gold 15 Year, 4.50%, 10/01/18 - 9/01/19 | United States | 378,847 | 390,430 | |
| FHLMC Gold 15 Year, 5.00%, 12/01/17 - 7/01/22 | United States | 518,528 | 542,127 | |
| FHLMC Gold 15 Year, 5.50%, 7/01/17 - 2/01/19 | United States | 42,802 | 43,937 | |
| u FHLMC Gold 30 Year, 3.50%, 5/01/46. | United States | 68,191,000 | 71,414,091 | |
| u FHLMC Gold 30 Year, 4.00%, 5/01/46. | United States | 24,250,000 | 25,892,552 | |
| FHLMC Gold 30 Year, 4.50%, 10/01/40 | United States | 279,114 | 304,422 | |
| FHLMC Gold 30 Year, 5.00%, 5/01/27 - 2/01/38 | United States | 2,240,118 | 2,472,717 | |
| FHLMC Gold 30 Year, 5.50%, 6/01/33 - 6/01/36 | United States | 1,465,102 | 1,647,349 | |
| FHLMC Gold 30 Year, 6.00%, 6/01/33 - 6/01/37 | United States | 507,848 | 576,556 | |
| FHLMC Gold 30 Year, 6.50%, 10/01/21 - 6/01/36 | United States | 300,185 | 343,297 | |
| FHLMC Gold 30 Year, 7.00%, 9/01/21 - 8/01/32 | United States | 43,943 | 47,449 | |
| FHLMC Gold 30 Year, 7.50%, 1/01/26 - 1/01/31 | United States | 9,157 | 10,719 | |
| FHLMC Gold 30 Year, 8.00%, 11/01/25 - 1/01/26 | United States | 244 | 254 | |
| FHLMC Gold 30 Year, 9.00%, 12/01/24 | United States | 142 | 165 | |
| 103,686,065 | ||||
34 Annual Report
franklintempleton.com
FRANKLIN STRATEGIC SERIES
CONSOLIDATED STATEMENT OF INVESTMENTS
| Franklin Strategic Income Fund (continued) | ||||
| Principal | ||||
| Country | Amount* | Value | ||
| Mortgage-Backed Securities (continued) | ||||
| l Federal National Mortgage Association (FNMA) Adjustable Rate | ||||
| 0.0%† | ||||
| FNMA, 2.522% - 2.635%, 4/01/20 - 12/01/34 | United States | 283,028 | $ | 295,962 |
| Federal National Mortgage Association (FNMA) Fixed Rate 3.3% | ||||
| FNMA 15 Year, 2.50%, 7/01/27 | United States | 507,706 | 524,270 | |
| FNMA 15 Year, 4.50%, 3/01/20 | United States | 74,123 | 76,956 | |
| FNMA 15 Year, 5.00%, 1/01/18 - 6/01/18 | United States | 71,563 | 73,798 | |
| FNMA 15 Year, 5.50%, 6/01/16 - 4/01/22 | United States | 302,942 | 314,053 | |
| FNMA 15 Year, 6.00%, 7/01/16 - 10/01/16 | United States | 1,209 | 1,213 | |
| u FNMA 30 Year, 3.50%, 5/01/46 | United States | 99,015,000 | 103,768,149 | |
| u FNMA 30 Year, 4.00%, 5/01/46 | United States | 104,000,000 | 111,109,360 | |
| FNMA 30 Year, 4.50%, 3/01/28 - 2/01/41 | United States | 855,354 | 933,181 | |
| u FNMA 30 Year, 4.50%, 5/01/46 | United States | 18,400,000 | 20,035,875 | |
| FNMA 30 Year, 5.00%, 9/01/23 - 10/01/35 | United States | 2,495,424 | 2,766,944 | |
| FNMA 30 Year, 5.50%, 9/01/33 - 12/01/35 | United States | 2,158,349 | 2,443,904 | |
| FNMA 30 Year, 6.00%, 6/01/34 - 5/01/38 | United States | 4,059,427 | 4,647,961 | |
| FNMA 30 Year, 6.50%, 3/01/28 - 10/01/37 | United States | 705,347 | 812,912 | |
| FNMA 30 Year, 7.50%, 10/01/29. | United States | 9,966 | 12,335 | |
| FNMA 30 Year, 8.00%, 1/01/25 - 5/01/26 | United States | 4,659 | 5,604 | |
| FNMA 30 Year, 8.50%, 7/01/25 | United States | 523 | 541 | |
| 247,527,056 | ||||
| Government National Mortgage Association (GNMA) Fixed Rate | ||||
| 2.1% | ||||
| GNMA I SF 30 Year, 5.00%, 6/15/34 - 7/15/34 | United States | 253,219 | 284,091 | |
| GNMA I SF 30 Year, 5.50%, 2/15/33 - 6/15/36 | United States | 716,222 | 813,443 | |
| GNMA I SF 30 Year, 6.00%, 8/15/36 | United States | 58,462 | 66,776 | |
| GNMA I SF 30 Year, 6.50%, 12/15/28 - 3/15/32 | United States | 53,572 | 61,363 | |
| GNMA I SF 30 Year, 7.00%, 11/15/27 - 5/15/28 | United States | 24,986 | 27,549 | |
| GNMA I SF 30 Year, 7.50%, 9/15/23 - 5/15/27 | United States | 3,391 | 3,807 | |
| GNMA I SF 30 Year, 8.00%, 2/15/25 - 9/15/27 | United States | 4,837 | 5,450 | |
| GNMA I SF 30 Year, 8.50%, 8/15/24 | United States | 81 | 91 | |
| GNMA I SF 30 Year, 9.00%, 1/15/25 | United States | 306 | 308 | |
| GNMA I SF 30 Year, 9.50%, 6/15/25 | United States | 529 | 532 | |
| u GNMA II SF 30 Year, 3.00%, 5/01/46 | United States | 29,000,000 | 30,018,397 | |
| u GNMA II SF 30 Year, 3.50%, 5/01/46 | United States | 118,975,000 | 125,644,158 | |
| GNMA II SF 30 Year, 5.00%, 9/20/33 - 11/20/33 | United States | 378,500 | 425,052 | |
| GNMA II SF 30 Year, 5.50%, 6/20/34 | United States | 186,811 | 210,736 | |
| GNMA II SF 30 Year, 6.00%, 11/20/34 | United States | 166,558 | 194,907 | |
| GNMA II SF 30 Year, 6.50%, 7/20/28 - 12/20/31 | United States | 91,253 | 107,208 | |
| GNMA II SF 30 Year, 7.50%, 4/20/32 | United States | 19,596 | 22,525 | |
| 157,886,393 | ||||
| Total Mortgage-Backed Securities | ||||
| (Cost $507,510,406) | 509,496,991 | |||
| Municipal Bonds 1.0% | ||||
| Illinois State GO, Build America Bonds, 7.35%, 7/01/35 | United States | 8,000,000 | 8,869,360 | |
| New Jersey EDA Revenue, School Facilities Construction, Refunding, | ||||
| Series NN, 5.00%, 3/01/30. | United States | 5,200,000 | 5,607,420 | |
| New York City HDC Capital Fund Grant Program Revenue, New York | ||||
| City Housing Authority Program, Series B1, 5.00%, 7/01/33. | United States | 3,500,000 | 4,122,860 | |
| Port Authority of New York and New Jersey Revenue, Consolidated, | ||||
| One Hundred Ninety-First Series, 4.823%, 6/01/45 | United States | 24,150,000 | 25,463,277 | |
franklintempleton.com
Annual Report
35
FRANKLIN STRATEGIC SERIES
CONSOLIDATED STATEMENT OF INVESTMENTS
| Franklin Strategic Income Fund (continued) | |||||
| Principal | |||||
| Country | Amount* | Value | |||
| Municipal Bonds (continued) | |||||
| Puerto Rico Electric Power Authority Power Revenue, | |||||
| Series A, 6.75%, 7/01/36 | United States | 30,900,000 | $ | 18,462,750 | |
| Series XX, 5.25%, 7/01/40 | United States | 15,000,000 | 8,962,500 | ||
| Puerto Rico Sales Tax FICO Sales Tax Revenue, | |||||
| first subordinate, Series A, 5.75%, 8/01/37 | United States | 5,000,000 | 2,000,000 | ||
| first subordinate, Series A, 6.50%, 8/01/44 | United States | 12,155,000 | 5,150,681 | ||
| Total Municipal Bonds (Cost $93,745,054) | 78,638,848 | ||||
| Shares | |||||
| Escrows and Litigation Trusts 0.0%† | |||||
| a,e Comfort Co. Inc., Escrow Account | United States | 63,156 | 30,908 | ||
| a,e NewPage Corp., LitigationTrust | United States | 14,000,000 | — | ||
| Total Escrows and Litigation Trusts (Cost $—) | 30,908 | ||||
| Total Investments before Short Term Investments | |||||
| (Cost $7,392,563,816) | 6,949,577,542 | ||||
| Short Term Investments (Cost $910,963,589) 12.1% | |||||
| Money Market Funds 12.1% | |||||
| a,f Institutional Fiduciary Trust Money Market Portfolio | United States | 910,963,589 | 910,963,589 | ||
| Total Investments (Cost $8,303,527,405) 104.5% | 7,860,541,131 | ||||
| Other Assets, less Liabilities (4.5)%. | (340,864,157 | ) | |||
| Net Assets 100.0%. | $ | 7,519,676,974 | |||
36 Annual Report
franklintempleton.com
FRANKLIN STRATEGIC SERIES
CONSOLIDATED STATEMENT OF INVESTMENTS
Franklin Strategic Income Fund (continued)
†Rounds to less than 0.1% of net assets.
*The principal amount is stated in U.S. dollars unless otherwise indicated.
aNon-income producing.
bThe security is owned by FT Holdings Corporation II, a wholly-owned subsidiary of the Fund. See Note 1(g).
cAt April 30, 2016, pursuant to the Fund’s policies and the requirements of applicable securities law, the Fund is restricted from trading these securities at period end.
dSee Note 8 regarding restricted securities.
eSecurity has been deemed illiquid because it may not be able to be sold within seven days. At April 30, 2016, the aggregate value of these securities was $7,639,530,
representing 0.10% of net assets.
fSee Note 3(f) regarding investments in affiliated management investment companies.
gSecurity was purchased pursuant to Rule 144A under the Securities Act of 1933 and may be sold in transactions exempt from registration only to qualified institutional buyers
or in a public offering registered under the Securities Act of 1933. These securities have been deemed liquid under guidelines approved by the Trust’s Board of Trustees. At
April 30, 2016, the aggregate value of these securities was $1,484,138,080, representing 19.74% of net assets.
hPerpetual security with no stated maturity date.
iA portion or all of the security purchased on a when-issued basis. See Note 1(c).
jSee Note 7 regarding defaulted securities.
kSee Note 1(f) regarding loan participation notes.
lThe coupon rate shown represents the rate at period end.
mIncome may be received in additional securities and/or cash.
nSee Note 1(i) regarding senior floating rate interests.
oA portion or all of the security purchased on a delayed delivery basis. See Note 1(c).
pPrincipal amount is stated in 100 Mexican Peso Units.
qThe principal represents the notional amount. See Note 1(d) regarding value recovery instruments.
rPrincipal amount of security is adjusted for inflation. See Note 1(k).
sPrincipal amount is stated in 1,000 Brazilian Real Peso Units.
tRedemption price at maturity is adjusted for inflation. See Note 1(k).
uA portion or all of the security purchased on a to-be-announced (TBA) basis. See Note 1(c).
At April 30, 2016, the Fund had the following forward exchange contracts outstanding. See Note 1(d).
| Forward Exchange Contracts | |||||||||||
| Contract | Settlement | Unrealized | Unrealized | ||||||||
| Currency | Counterpartya Type | Quantity | Amount | Date | Appreciation | Depreciation | |||||
| OTC Forward Exchange Contracts | |||||||||||
| South Korean Won | JPHQ | Sell | 96,100,000,000 | $ | 77,266,332 | 5/20/16 | $ | — | $ | (6,616,327 | ) |
| Chilean Peso | DBAB | Buy | 2,000,000,000 | 2,787,845 | 6/16/16 | 226,064 | — | ||||
| Chilean Peso | DBAB | Sell | 2,000,000,000 | 2,972,210 | 6/16/16 | — | (41,699 | ) | |||
| Indian Rupee | DBAB | Buy | 1,472,000,000 | 21,417,139 | 6/16/16 | 558,487 | — | ||||
| Japanese Yen | BZWS | Sell | 386,912,500 | 3,202,123 | 6/16/16 | — | (436,676 | ) | |||
| Japanese Yen | DBAB | Sell | 12,762,115,000 | 105,629,159 | 6/16/16 | — | (14,394,810 | ) | |||
| Japanese Yen | JPHQ | Sell | 2,136,360,000 | 17,679,977 | 6/16/16 | — | (2,411,866 | ) | |||
| Japanese Yen | MSCO | Sell | 39,600,000 | 327,722 | 6/16/16 | — | (44,704 | ) | |||
| Malaysian Ringgit | DBAB | Buy | 706,000 | 164,973 | 6/16/16 | 15,602 | — | ||||
| Malaysian Ringgit | HSBK | Buy | 1,130,000 | 263,914 | 6/16/16 | 25,108 | — | ||||
| Australian Dollar | DBAB | Sell | 88,440,154 | 61,736,110 | 8/18/16 | — | (5,197,885 | ) | |||
| Chilean Peso | BZWS | Buy | 2,082,200,000 | 2,823,513 | 8/18/16 | 295,309 | — | ||||
| Chilean Peso | DBAB | Buy | 15,048,750,000 | 20,648,647 | 8/18/16 | 1,892,122 | — | ||||
| Chilean Peso | DBAB | Sell | 15,048,750,000 | 22,235,151 | 8/18/16 | — | (305,617 | ) | |||
| Chilean Peso | JPHQ | Buy | 937,202,000 | 1,292,336 | 8/18/16 | 111,452 | — | ||||
| Chilean Peso | JPHQ | Sell | 937,202,000 | 1,394,127 | 8/18/16 | — | (9,661 | ) | |||
| Chilean Peso | MSCO | Buy | 881,530,000 | 1,215,233 | 8/18/16 | 105,167 | — | ||||
| Chilean Peso | MSCO | Sell | 881,530,000 | 1,311,801 | 8/18/16 | — | (8,599 | ) | |||
franklintempleton.com
Annual Report
37
FRANKLIN STRATEGIC SERIES
CONSOLIDATED STATEMENT OF INVESTMENTS
| Franklin Strategic Income Fund (continued) | ||||||||||||
| Forward Exchange Contracts (continued) | ||||||||||||
| Contract | Settlement | Unrealized | Unrealized | |||||||||
| Currency | Counterpartya Type | Quantity | Amount | Date | Appreciation | Depreciation | ||||||
| OTC Forward Exchange Contracts (continued) | ||||||||||||
| Euro | BZWS | Sell | 23,723,517 | $ | 25,981,951 | 8/18/16 | $ | — | $ | (1,282,829 | ) | |
| Euro | DBAB | Buy | 51,373,505 | 56,845,167 | 8/18/16 | 2,196,976 | — | |||||
| Euro | DBAB | Sell | 166,873,233 | 189,548,590 | 8/18/16 | — | (2,234,182 | ) | ||||
| Euro | GSCO | Sell | 800,000 | 910,360 | 8/18/16 | — | (9,058 | ) | ||||
| Euro | HSBK | Sell | 711,759 | 811,028 | 8/18/16 | — | (6,977 | ) | ||||
| Euro | JPHQ | Buy | 2,099,000 | 2,385,052 | 8/18/16 | 27,271 | — | |||||
| Euro | JPHQ | Sell | 36,186,406 | 40,734,191 | 8/18/16 | — | (853,840 | ) | ||||
| Euro | MSCO | Sell | 2,920,000 | 3,195,794 | 8/18/16 | — | (160,081 | ) | ||||
| Indian Rupee | CITI | Buy | 116,369,000 | 1,688,955 | 8/18/16 | 31,129 | — | |||||
| Indian Rupee | DBAB | Buy | 2,529,734,000 | 36,903,486 | 8/18/16 | 489,242 | — | |||||
| Indian Rupee | HSBK | Buy | 1,380,831,000 | 20,035,273 | 8/18/16 | 375,189 | — | |||||
| Indian Rupee | JPHQ | Buy | 273,412,000 | 3,971,702 | 8/18/16 | 69,679 | — | |||||
| Japanese Yen | BZWS | Sell | 1,046,497,000 | 8,924,586 | 8/18/16 | — | (938,469 | ) | ||||
| Japanese Yen | CITI | Sell | 1,022,550,000 | 8,721,272 | 8/18/16 | — | (916,087 | ) | ||||
| Japanese Yen | DBAB | Buy | 14,271,000,000 | 126,472,230 | 8/18/16 | 8,029,509 | — | |||||
| Japanese Yen | DBAB | Sell | 27,576,098,000 | 244,042,198 | 8/18/16 | — | (15,857,820 | ) | ||||
| Japanese Yen | GSCO | Sell | 755,750,000 | 6,445,629 | 8/18/16 | — | (677,186 | ) | ||||
| Japanese Yen | HSBK | Sell | 2,005,180,000 | 17,474,676 | 8/18/16 | — | (1,423,803 | ) | ||||
| Japanese Yen | JPHQ | Sell | 3,451,671,000 | 30,423,110 | 8/18/16 | — | (2,108,301 | ) | ||||
| Australian Dollar | DBAB | Sell | 19,450,000 | 13,994,275 | 10/20/16 | — | (690,185 | ) | ||||
| British Pound | DBAB | Sell | 9,013,451 | 13,174,962 | 10/20/16 | — | (7,775 | ) | ||||
| British Pound | JPHQ | Sell | 1,000,000 | 1,440,625 | 10/20/16 | — | (21,938 | ) | ||||
| Euro | BZWS | Sell | 14,703,865 | 16,674,918 | 10/20/16 | — | (262,259 | ) | ||||
| Euro | CITI | Sell | 4,494,237 | 5,091,508 | 10/20/16 | — | (85,341 | ) | ||||
| Euro | DBAB | Sell | 6,400,000 | 7,192,000 | 10/20/16 | — | (180,071 | ) | ||||
| Euro | GSCO | Sell | 9,398,000 | 10,681,767 | 10/20/16 | — | (143,658 | ) | ||||
| Euro | JPHQ | Sell | 19,141,245 | 21,691,433 | 10/20/16 | — | (357,100 | ) | ||||
| Japanese Yen | BZWS | Sell | 190,148,000 | 1,724,229 | 10/20/16 | — | (72,108 | ) | ||||
| Japanese Yen | CITI | Sell | 100,563,000 | 910,559 | 10/20/16 | — | (39,465 | ) | ||||
| Japanese Yen | DBAB | Sell | 5,554,349,000 | 50,311,588 | 10/20/16 | — | (2,160,616 | ) | ||||
| Japanese Yen | HSBK | Sell | 467,487,000 | 4,234,062 | 10/20/16 | — | (182,310 | ) | ||||
| Japanese Yen | JPHQ | Sell | 1,733,630,500 | 15,700,615 | 10/20/16 | — | (677,076 | ) | ||||
| Malaysian Ringgit | JPHQ | Buy | 2,290,000 | 584,482 | 10/20/16 | — | (838 | ) | ||||
| Total Forward Exchange Contracts | $ | 14,448,306 | $ | (60,817,217 | ) | |||||||
| Net unrealized appreciation (depreciation) | $ | (46,368,911 | ) | |||||||||
| aMay be comprised of multiple contracts with the same counterparty, currency and settlement date. | ||||||||||||
38 Annual Report
franklintempleton.com
FRANKLIN STRATEGIC SERIES
CONSOLIDATED STATEMENT OF INVESTMENTS
Franklin Strategic Income Fund (continued)
At April 30, 2016, the Fund had the following credit default swap contracts outstanding. See Note 1(d).
| Credit Default Swap Contracts | |||||||||||||||||
| Unamortized | |||||||||||||||||
| Periodic | Counter- | Upfront | |||||||||||||||
| Payment | party/ | Notional | Expiration | Payments | Unrealized | Unrealized | Market | ||||||||||
| Description | Rate | Exchange | Amounta | Date | (Receipts) | Appreciation | Depreciation | Value | Ratingb | ||||||||
| Centrally Cleared Swap Contract | |||||||||||||||||
| Contracts to Buy Protection | |||||||||||||||||
| Traded Index | |||||||||||||||||
| CDX.NA.HY.26 | 5.00 | % | ICE | $ | 3,000,000 | 6/20/21 | $ | (108,850 | ) | $ | 4,313 | $ | — | $ | (104,537 | ) | |
| OTC Swap Contract | |||||||||||||||||
| Contracts to Sell Protectionc | |||||||||||||||||
| Traded Index | |||||||||||||||||
| MCDX.NA.26 | 1.00 | % | GSCO | 105,000,000 | 6/20/21 | 265,476 | 340,543 | — | 606,019 | Non | |||||||
| Investment | |||||||||||||||||
| Grade | |||||||||||||||||
| Total Credit Default Swap Contracts | $ | 156,626 | $ | 344,856 | $ | — | $ | 501,482 | |||||||||
| Net unrealized appreciation (depreciation) | $ | 344,856 | |||||||||||||||
aFor contracts to sell protection, the notional amount is equal to the maximum potential amount of the future payments and no recourse provisions have been entered into in
association with the contracts.
bBased on internal ratings for index swaps. Internal ratings based on mapping into equivalent ratings from external vendors.
cThe fund enters contracts to sell protection to create a long credit position. Performance triggers include failure to pay or bankruptcy of the underlying securities for traded
index swaps.
See Note 9 regarding other derivative information.
See Abbreviations on page 58.
franklintempleton.com
The accompanying notes are an integral part of these financial statements. | Annual Report 39
| FRANKLIN STRATEGIC SERIES | |||
| Consolidated Financial Statements | |||
| Consolidated Statement of Assets and Liabilities | |||
| April 30, 2016 | |||
| Franklin Strategic Income Fund | |||
| Assets: | |||
| Investments in securities: | |||
| Cost - Unaffiliated issuers | $ | 6,715,672,316 | |
| Cost - Controlled affiliates (Note 3f) | 676,891,500 | ||
| Cost - Non-controlled affiliates (Note 3f) | 910,963,589 | ||
| Total cost of investments | $ | 8,303,527,405 | |
| Value - Unaffiliated issuers | $ | 6,294,059,509 | |
| Value - Controlled affiliated issuers (Note 3f) | 655,518,033 | ||
| Value - Non-controlled affiliates (Note 3f) | 910,963,589 | ||
| Total value of investments | 7,860,541,131 | ||
| Cash. | 4,156,416 | ||
| Restricted Cash (Note 1e) | 320,000 | ||
| Foreign currency, at value (cost $38,557,312) | 38,524,771 | ||
| Receivables: | |||
| Investment securities sold | 108,833,499 | ||
| Capital shares sold | 10,794,878 | ||
| Dividends and interest | 74,750,074 | ||
| Due from brokers | 25,641,473 | ||
| Variation margin | 1,113,680 | ||
| OTC swap contracts (upfront payments $269,012) | 265,476 | ||
| Unrealized appreciation on OTC forward exchange contracts | 14,448,306 | ||
| Unrealized appreciation on OTC swap contracts | 340,543 | ||
| Other assets | 7,811 | ||
| Total assets | 8,139,738,058 | ||
| Liabilities: | |||
| Payables: | |||
| Investment securities purchased | 530,861,468 | ||
| Capital shares redeemed | 19,383,205 | ||
| Management fees | 2,331,358 | ||
| Distribution fees | 1,885,819 | ||
| Transfer agent fees | 2,000,892 | ||
| Distributions to shareholders | 1,166,695 | ||
| Due to brokers | 320,000 | ||
| Unrealized depreciation on OTC forward exchange contracts | 60,817,217 | ||
| Deferred tax. | 570,107 | ||
| Accrued expenses and other liabilities. | 724,323 | ||
| Total liabilities | 620,061,084 | ||
| Net assets, at value | $ | 7,519,676,974 | |
| Net assets consist of: | |||
| Paid-in capital | $ | 8,380,682,449 | |
| Distributions in excess of net investment income | (145,570,016 | ) | |
| Net unrealized appreciation (depreciation) | (488,571,570 | ) | |
| Accumulated net realized gain (loss) | (226,863,889 | ) | |
| Net assets, at value | $ | 7,519,676,974 | |
40 Annual Report | The accompanying notes are an integral part of these financial statements.
franklintempleton.com
FRANKLIN STRATEGIC SERIES
CONSOLIDATED FINANCIAL STATEMENTS
| Franklin Strategic Income Fund (continued) | ||
| Class A: | ||
| Net assets, at value | $ | 4,500,751,610 |
| Shares outstanding. | 483,086,004 | |
| Net asset value per sharea | $ | 9.32 |
| Maximum offering price per share (net asset value per share ÷ 95.75%) | $ | 9.73 |
| Class C: | ||
| Net assets, at value | $ | 1,645,852,274 |
| Shares outstanding. | 176,696,248 | |
| Net asset value and maximum offering price per sharea | $ | 9.31 |
| Class R: | ||
| Net assets, at value | $ | 181,671,194 |
| Shares outstanding. | 19,569,744 | |
| Net asset value and maximum offering price per share | $ | 9.28 |
| Class R6: | ||
| Net assets, at value | $ | 286,503,075 |
| Shares outstanding. | 30,711,160 | |
| Net asset value and maximum offering price per share | $ | 9.33 |
| Advisor Class : | ||
| Net assets, at value | $ | 904,898,821 |
| Shares outstanding. | 97,033,534 | |
| Net asset value and maximum offering price per share | $ | 9.33 |
aRedemption price is equal to net asset value less contingent deferred sales charges, if applicable.
franklintempleton.com
The accompanying notes are an integral part of these financial statements. | Annual Report 41
| FRANKLIN STRATEGIC SERIES | |||
| CONSOLIDATED FINANCIAL STATEMENTS | |||
| Consolidated Statement of Operations | |||
| for the year ended April 30, 2016 | |||
| Franklin Strategic Income Fund | |||
| Investment income: | |||
| Dividends: | |||
| Unaffiliated issuers | $ | 5,137,341 | |
| Controlled affiliates (Note 3f) | 20,861,655 | ||
| Interest | 401,910,441 | ||
| Total investment income | 427,909,437 | ||
| Expenses: | |||
| Management fees (Note 3a) | 36,653,113 | ||
| Distribution fees: (Note 3c) | |||
| Class A | 12,008,194 | ||
| Class C | 11,890,446 | ||
| Class R | 1,006,823 | ||
| Transfer agent fees: (Note 3e) | |||
| Class A | 6,832,073 | ||
| Class C | 2,604,635 | ||
| Class R | 286,643 | ||
| Class R6 | 3,255 | ||
| Advisor Class | 1,443,117 | ||
| Custodian fees (Note 4) | 851,901 | ||
| Reports to shareholders | 744,763 | ||
| Registration and filing fees. | 341,286 | ||
| Professional fees | 271,760 | ||
| Trustees’ fees and expenses | 82,119 | ||
| Other | 556,626 | ||
| Total expenses | 75,576,754 | ||
| Expense reductions (Note 4) | (10,936 | ) | |
| Expenses waived/paid by affiliates (Note 3f) | (2,819,090 | ) | |
| Net expenses | 72,746,728 | ||
| Net investment income. | 355,162,709 | ||
| Realized and unrealized gains (losses): | |||
| Net realized gain (loss) from: | |||
| Investments | (364,550,982 | ) | |
| Foreign currency transactions. | 43,291,893 | ||
| Swap contracts | 205,693 | ||
| Net realized gain (loss) | (321,053,396 | ) | |
| Net change in unrealized appreciation (depreciation) on: | |||
| Investments | (237,265,127 | ) | |
| Translation of other assets and liabilities | |||
| denominated in foreign currencies | (106,189,355 | ) | |
| Swap contracts | 77,826 | ||
| Change in deferred taxes on unrealized appreciation | (345,193 | ) | |
| Net change in unrealized appreciation (depreciation) | (343,721,849 | ) | |
| Net realized and unrealized gain (loss) | (664,775,245 | ) | |
| Net increase (decrease) in net assets resulting from operations | $ | (309,612,536 | ) |
42 Annual Report | The accompanying notes are an integral part of these financial statements.
franklintempleton.com
| FRANKLIN STRATEGIC SERIES | ||||||
| CONSOLIDATED FINANCIAL STATEMENTS | ||||||
| Consolidated Statements of Changes in Net Assets | ||||||
| Franklin Strategic Income Fund | ||||||
| Year Ended April 30, | ||||||
| 2016 | 2015 | |||||
| Increase (decrease) in net assets: | ||||||
| Operations: | ||||||
| Net investment income | $ | 355,162,709 | $ | 357,650,518 | ||
| Net realized gain (loss) | (321,053,396 | ) | 138,514,884 | |||
| Net change in unrealized appreciation (depreciation) | (343,721,849 | ) | (401,270,066 | ) | ||
| Net increase (decrease) in net assets resulting from operations | (309,612,536 | ) | 94,895,336 | |||
| Distributions to shareholders from: | ||||||
| Net investment income and net foreign currency gains: | ||||||
| Class A | (203,235,139 | ) | (282,280,270 | ) | ||
| Class C | (69,997,315 | ) | (104,690,062 | ) | ||
| Class R | (8,052,939 | ) | (11,662,658 | ) | ||
| Class R6 | (12,383,078 | ) | (14,834,561 | ) | ||
| Advisor Class | (45,388,450 | ) | (62,495,206 | ) | ||
| Net realized gains: | ||||||
| Class A | — | (49,068,785 | ) | |||
| Class C | — | (19,599,475 | ) | |||
| Class R | — | (2,116,015 | ) | |||
| Class R6 | — | (2,507,121 | ) | |||
| Advisor Class | — | (10,474,079 | ) | |||
| Total distributions to shareholders | (339,056,921 | ) | (559,728,232 | ) | ||
| Capital share transactions: (Note 2) | ||||||
| Class A | (361,847,394 | ) | 331,943,973 | |||
| Class C | (276,223,074 | ) | 70,643,695 | |||
| Class R | (25,817,388 | ) | 8,142,440 | |||
| Class R6 | 52,377,445 | �� | 20,521,455 | |||
| Advisor Class | (142,209,084 | ) | 178,987,572 | |||
| Total capital share transactions | (753,719,495 | ) | 610,239,135 | |||
| Net increase (decrease) in net assets | (1,402,388,952 | ) | 145,406,239 | |||
| Net assets: | ||||||
| Beginning of year. | 8,922,065,926 | 8,776,659,687 | ||||
| End of year | $ | 7,519,676,974 | $ | 8,922,065,926 | ||
| Distributions in excess of net investment income included in net assets: | ||||||
| End of year | $ | (145,570,016 | ) | $ | (57,248,362 | ) |
franklintempleton.com
The accompanying notes are an integral part of these financial statements. | Annual Report 43
FRANKLIN STRATEGIC SERIES
Notes to Consolidated Financial Statements
Franklin Strategic Income Fund
1. Organization and Significant Accounting Policies
Franklin Strategic Series (Trust) is registered under the Investment Company Act of 1940 (1940 Act) as an open-end management investment company, consisting of ten separate funds and applies the specialized accounting and reporting guidance in U.S. Generally Accepted Accounting Principles (U.S. GAAP). Franklin Strategic Income Fund (Fund) is included in this report. The financial statements of the remaining funds in the Trust are presented separately. The Fund offers five classes of shares: Class A, Class C, Class R, Class R6, and Advisor Class. Each class of shares differs by its initial sales load, contingent deferred sales charges, voting rights on matters affecting a single class, its exchange privilege and fees primarily due to differing arrangements for distribution and transfer agent fees.
The following summarizes the Fund’s significant accounting policies.
a. Financial Instrument Valuation
The Fund’s investments in financial instruments are carried at fair value daily. Fair value is the price that would be received to sell an asset or paid to transfer a liability in an orderly transaction between market participants on the measurement date. The Fund calculates the net asset value (NAV) per share as of 4 p.m. Eastern time each day the New York Stock Exchange (NYSE) is open for trading. Under compliance policies and procedures approved by the Trust’s Board of Trustees (the Board), the Fund’s administrator has responsibility for oversight of valuation, including leading the cross-functional Valuation and Liquidity Oversight Committee (VLOC). The VLOC provides administration and oversight of the Fund’s valuation policies and procedures, which are approved annually by the Board. Among other things, these procedures allow the Fund to utilize independent pricing services, quotations from securities and financial instrument dealers, and other market sources to determine fair value.
Equity securities, exchange traded funds and derivative financial instruments (derivatives) listed on an exchange or on the NASDAQ National Market System are valued at the last quoted sale price or the official closing price of the day, respectively. Foreign equity securities are valued as of the close of trading on the foreign stock exchange on which the security is primarily traded or as 4 p.m. Eastern time whichever is earlier. The value is then converted into its U.S. dollar equivalent at the foreign exchange rate in effect at 4 p.m. Eastern time on the day that the value of the security is determined. Over-the-counter (OTC) securities are valued within the range of the most recent quoted bid and ask prices. Securities that trade in multiple markets or on multiple exchanges are valued according to the broadest and most representative market. Certain equity securities are valued based upon fundamental characteristics or relationships to similar securities.
Debt securities generally trade in the OTC market rather than on a securities exchange. The Fund’s pricing services use multiple valuation techniques to determine fair value. In instances where sufficient market activity exists, the pricing services may utilize a market-based approach through which quotes from market makers are used to determine fair value. In instances where sufficient market activity may not exist or is limited, the pricing services also utilize proprietary valuation models which may consider market characteristics such as benchmark yield curves, credit spreads, estimated default rates, anticipated market interest rate volatility, coupon rates, anticipated timing of principal repayments, underlying collateral, and other unique security features in order to estimate the relevant cash flows, which are then discounted to calculate the fair value. Securities denominated in a foreign currency are converted into their U.S. dollar equivalent at the foreign exchange rate in effect at 4 p.m. Eastern time on the date that the values of the foreign debt securities are determined.
Investments in open-end mutual funds are valued at the closing NAV.
Certain derivatives trade in the OTC market. The Fund’s pricing services use various techniques including industry standard option pricing models and proprietary discounted cash flow models to determine the fair value of those instruments. The Fund’s net benefit or obligation under the derivative contract, as measured by the fair value of the contract, is included in net assets.
The Fund has procedures to determine the fair value of financial instruments for which market prices are not reliable or readily available. Under these procedures, the VLOC convenes on a regular basis to review such financial instruments and considers a number of factors, including significant unobservable valuation inputs, when arriving at fair value. The VLOC primarily employs a market-based approach which may use related or comparable assets or liabilities, recent transactions,
44 Annual Report
franklintempleton.com
FRANKLIN STRATEGIC SERIES
NOTES TO CONSOLIDATED FINANCIAL STATEMENTS
Franklin Strategic Income Fund (continued)
market multiples, book values, and other relevant information for the investment to determine the fair value of the investment. An income-based valuation approach may also be used in which the anticipated future cash flows of the investment are discounted to calculate fair value. Discounts may also be applied due to the nature or duration of any restrictions on the disposition of the investments. Due to the inherent uncertainty of valuations of such investments, the fair values may differ significantly from the values that would have been used had an active market existed. The VLOC employs various methods for calibrating these valuation approaches including a regular review of key inputs and assumptions, transactional back-testing or disposition analysis, and reviews of any related market activity.
Trading in securities on foreign securities stock exchanges and OTC markets may be completed before 4 p.m. Eastern time. In addition, trading in certain foreign markets may not take place on every NYSE business day. Occasionally, events occur between the time at which trading in a foreign security is completed and the close of the NYSE that might call into question the reliability of the value of a portfolio security held by the Fund. As a result, differences may arise between the value of the Fund’s portfolio securities as determined at the foreign market close and the latest indications of value at the close of the NYSE. In order to minimize the potential for these differences, the VLOC monitors price movements following the close of trading in foreign stock markets through a series of country specific market proxies (such as baskets of American Depositary Receipts, futures contracts and exchange traded funds). These price movements are measured against established trigger thresholds for each specific market proxy to assist in determining if an event has occurred that may call into question the reliability of the values of the foreign securities held by the Fund. If such an event occurs, the securities may be valued using fair value procedures, which may include the use of independent pricing services.
When the last day of the reporting period is a non-business day, certain foreign markets may be open on those days that the NYSE is closed, which could result in differences between the value of the Fund’s portfolio securities on the last business day and the last calendar day of the reporting period. Any significant security valuation changes due to an open foreign market are adjusted and reflected by the Fund for financial reporting purposes.
b. Foreign Currency Translation
Portfolio securities and other assets and liabilities denominated in foreign currencies are translated into U.S. dollars based on the exchange rate of such currencies against U.S. dollars on the date of valuation. The Fund may enter into foreign currency exchange contracts to facilitate transactions denominated in a foreign currency. Purchases and sales of securities, income and expense items denominated in foreign currencies are translated into U.S. dollars at the exchange rate in effect on the transaction date. Portfolio securities and assets and liabilities denominated in foreign currencies contain risks that those currencies will decline in value relative to the U.S. dollar. Occasionally, events may impact the availability or reliability of foreign exchange rates used to convert the U.S. dollar equivalent value. If such an event occurs, the foreign exchange rate will be valued at fair value using procedures established and approved by the Board.
The Fund does not separately report the effect of changes in foreign exchange rates from changes in market prices on securities held. Such changes are included in net realized and unrealized gain or loss from investments in the Consolidated Statement of Operations.
Realized foreign exchange gains or losses arise from sales of foreign currencies, currency gains or losses realized between the trade and settlement dates on securities transactions and the difference between the recorded amounts of dividends, interest, and foreign withholding taxes and the U.S. dollar equivalent of the amounts actually received or paid. Net unrealized foreign exchange gains and losses arise from changes in foreign exchange rates on foreign denominated assets and liabilities other than investments in securities held at the end of the reporting period.
c. Securities Purchased on a When-Issued, Delayed Delivery and TBA Basis
The Fund purchases securities on a when-issued or delayed delivery and to-be-announced (TBA) basis, with payment and delivery scheduled for a future date. These transactions are subject to market fluctuations and are subject to the risk that the value at delivery may be more or less than the trade date purchase price. Although the Fund will generally purchase these securities with the intention of holding the securities, it may sell the securities before the settlement date. Sufficient assets have been segregated for these securities and collateral has been pledged and/or received for open TBA trades.
franklintempleton.com
Annual Report
45
FRANKLIN STRATEGIC SERIES
NOTES TO CONSOLIDATED FINANCIAL STATEMENTS
Franklin Strategic Income Fund (continued)
1. Organization and Significant Accounting
Policies (continued)
d. Derivative Financial Instruments
The Fund invested in derivatives in order to manage risk or gain exposure to various other investments or markets. Derivatives are financial contracts based on an underlying or notional amount, require no initial investment or an initial net investment that is smaller than would normally be required to have a similar response to changes in market factors, and require or permit net settlement. Derivatives contain various risks including the potential inability of the counterparty to fulfill their obligations under the terms of the contract, the potential for an illiquid secondary market, and/or the potential for market movements which expose the Fund to gains or losses in excess of the amounts shown in the Consolidated Statement of Assets and Liabilities. Realized gain and loss and unrealized appreciation and depreciation on these contracts for the period are included in the Consolidated Statement of Operations.
Derivative counterparty credit risk is managed through a formal evaluation of the creditworthiness of all potential counterparties The Fund attempts to reduce its exposure to counterparty credit risk on OTC derivatives, whenever possible, by entering into International Swaps and Derivatives Association (ISDA) master agreements with certain counterparties. These agreements contain various provisions, including but not limited to collateral requirements, events of default, or early termination. Termination events applicable to the counterparty include certain deteriorations in the credit quality of the counterparty. Termination events applicable to the Fund include failure of the Fund to maintain certain net asset levels and/or limit the decline in net assets over various periods of time. In the event of default or early termination, the ISDA master agreement gives the non-defaulting party the right to net and close-out all transactions traded, whether or not arising under the ISDA agreement, to one net amount payable by one counterparty to the other. However, absent an event of default or early termination, OTC derivative assets and liabilities are presented gross and not offset in the Consolidated Statement of Assets and Liabilities. Early termination by the counterparty may result in an immediate payment by the Fund of any net liability owed to that counterparty under the ISDA agreement.
Collateral requirements differ by type of derivative. Collateral or initial margin requirements are set by the broker or exchange clearing house for exchange traded and centrally cleared derivatives. Initial margin deposited is held at the exchange and can be in the form of cash and/or securities. For OTC derivatives traded under an ISDA master agreement, posting of collateral is required by either the Fund or the applicable counterparty if the total net exposure of all OTC derivatives with the applicable counterparty exceeds the minimum transfer amount, which typically ranges from $100,000 to $250,000, and can vary depending on the counterparty and the type of the agreement. Generally, collateral is determined at the close of Fund business each day and any additional collateral required due to changes in derivative values may be delivered by the Fund or the counterparty within a few business days. Collateral pledged and/or received by the Fund, if any, is held in segregated accounts with the Fund’s custodian/counterparty broker and can be in the form of cash and/or securities. Unrestricted cash may be invested according to the Fund’s investment objectives. To the extent that the amounts due to the Fund from its counterparties are not subject to collateralization or are not fully collateralized, the Fund bears the risk of loss from counterparty non-performance.
The Fund entered into OTC forward exchange contracts primarily to manage and/or gain exposure to certain foreign currencies. A forward exchange contract is an agreement between the Fund and a counterparty to buy or sell a foreign currency at a specific exchange rate on a future date.
The Fund entered into credit default swap contracts primarily to manage exposure to credit risk. A credit default swap is an agreement between the Fund and a counterparty whereby the buyer of the contract receives credit protection and the seller of the contract guarantees the credit worthiness of a referenced debt obligation. These agreements may be privately negotiated in the over-the-counter market (OTC credit default swaps) or may be executed in a multilateral trade facility platform, such as a registered exchange (centrally cleared credit default swaps). The underlying referenced debt obligation may be a single issuer of corporate or sovereign debt, a credit index, a basket of issuers or indices, or a tranche of a credit index or basket of issuers or indices. In the event of a default of the underlying referenced debt obligation, the buyer is entitled to receive the notional amount of the credit default swap contract from the seller in exchange for the referenced debt obligation, a net settlement amount equal to the notional amount of the credit default swap less the recovery value of the referenced debt obligation, or other agreed upon amount. For centrally cleared credit default swaps, required initial margins are pledged by the Fund, and the daily change in fair value is accounted for as a
46 Annual Report
franklintempleton.com
FRANKLIN STRATEGIC SERIES
NOTES TO CONSOLIDATED FINANCIAL STATEMENTS
Franklin Strategic Income Fund (continued)
variation margin payable or receivable in the Consolidated Statement of Assets and Liabilities. Over the term of the contract, the buyer pays the seller a periodic stream of payments, provided that no event of default has occurred. Such periodic payments are accrued daily as an unrealized appreciation or depreciation until the payments are made, at which time they are realized. Upfront payments and receipts are reflected in the Consolidated Statement of Assets and Liabilities and represent compensating factors between stated terms of the credit default swap agreement and prevailing market conditions (credit spreads and other relevant factors). These upfront payments and receipts are amortized over the term of the contract as a realized gain or loss in the Consolidated Statement of Operations.
The Fund invests in value recovery instruments (VRI) primarily to gain exposure to growth risk. Periodic payments from VRI are dependent on established benchmarks for underlying variables. VRI has a notional amount, which is used to calculate amounts of payments to holders. Payments are recorded upon receipt as realized gains in the Consolidated Statement of Operations. The risks of investing in VRI include growth risk, liquidity, and the potential loss of investment.
See Note 9 regarding other derivative information.
e. Restricted Cash
At April 30, 2016, the Fund held restricted cash in connection with investments in certain derivative securities. Restricted cash is held in a segregated account with the Fund’s custodian and is reflected in the Consolidated Statement of Assets and Liabilities.
f. Loan Participation Notes
The Fund invests in loan participation notes (Participations). Participations are loans originally issued to a borrower by one or more financial institutions (the Lender) and subsequently sold to other investors, such as the Fund. Participations typically result in the Fund having a contractual relationship only with the Lender and not with the borrower. The Fund has the right to receive from the Lender any payments of principal, interest and fees which the Lender received from the borrower. The Fund generally has no rights to either enforce compliance by the borrower with the terms of the loan agreement or to any collateral relating to the original loan. As a result, the Fund assumes the credit risk of both the borrower and the Lender that is selling the Participation. The Participations may also involve interest rate risk and liquidity risk, including the potential default or insolvency of the borrower and/or the Lender.
g. FT Holdings Corporation II (FT Subsidiary)
The Fund invests in certain financial instruments through its investment in FT Subsidiary. FT Subsidiary is a Delaware Corporation, is a wholly-owned subsidiary of the Fund, and is able to invest in certain financial instruments consistent with the investment objective of the Fund. At April 30, 2016, FT Subsidiary’s investment, Turtle Bay Resort, as well as any other assets and liabilities of FT Subsidiary are reflected in the Fund’s Consolidated Statement of Investments and Consolidated Statement of Assets and Liabilities. The financial statements have been consolidated and include the accounts of the Fund and FT Subsidiary. All intercompany transactions and balances have been eliminated. At April 30, 2016, the net assets of FT Subsidiary were $14,563,105, representing less than 1% of the Fund’s consolidated net assets. The Fund’s investment in FT Subsidiary is limited to 25% of consolidated assets.
h. Mortgage Dollar Rolls
The Fund enters into mortgage dollar rolls, typically on a TBA basis. Mortgage dollar rolls are agreements between the Fund and a financial institution where the Fund sells (or buys) mortgage-backed securities for delivery on a specified date and simultaneously contracts to repurchase (or sell) substantially similar (same type, coupon, and maturity) securities at a future date and at a predetermined price. Gains or losses are realized on the initial sale, and the difference between the repurchase price and the sale price is recorded as an unrealized gain or loss to the Fund upon entering into the mortgage dollar roll. In addition, the Fund may invest the cash proceeds that are received from the initial sale. During the period between the sale and repurchase, the Fund is not entitled to principal and interest paid on the mortgage backed securities. Transactions in mortgage dollar rolls are accounted for as purchases and sales and may result in an increase to the Fund’s portfolio turnover rate. The risks of mortgage dollar roll transactions include the potential inability of the counterparty to fulfill its obligations.
i. Senior Floating Rate Interests
The Fund invests in senior secured corporate loans that pay interest at rates which are periodically reset by reference to a base lending rate plus a spread. These base lending rates are generally the prime rate offered by a designated U.S. bank or
franklintempleton.com
Annual Report
47
FRANKLIN STRATEGIC SERIES
NOTES TO CONSOLIDATED FINANCIAL STATEMENTS
Franklin Strategic Income Fund (continued)
1. Organization and Significant Accounting
Policies (continued)
i. Senior Floating Rate Interests (continued)
the London InterBank Offered Rate (LIBOR). Senior secured corporate loans often require prepayment of principal from excess cash flows or at the discretion of the borrower. As a result, actual maturity may be substantially less than the stated maturity. Senior secured corporate loans in which the Fund invests are generally readily marketable, but may be subject to certain restrictions on resale.
j. Income and Deferred Taxes
It is the Fund’s policy to qualify as a regulated investment company under the Internal Revenue Code. The Fund intends to distribute to shareholders substantially all of its taxable income and net realized gains to relieve it from federal income and excise taxes. As a result, no provision for U.S. federal income taxes is required.
The Fund may be subject to foreign taxation related to income received, capital gains on the sale of securities and certain foreign currency transactions in the foreign jurisdictions in which it invests. Foreign taxes, if any, are recorded based on the tax regulations and rates that exist in the foreign markets in which the Fund invests. When a capital gain tax is determined to apply, the Fund records an estimated deferred tax liability in an amount that would be payable if the securities were disposed of on the valuation date.
The Fund may recognize an income tax liability related to its uncertain tax positions under U.S. GAAP when the uncertain tax position has a less than 50% probability that it will be sustained upon examination by the tax authorities based on its technical merits. As of April 30, 2016, the Fund has determined that no tax liability is required in its consolidated financial statements related to uncertain tax positions for any open tax years (or expected to be taken in future tax years). Open tax years are those that remain subject to examination and are based on each tax jurisdiction’s statute of limitation.
k. Security Transactions, Investment Income, Expenses and Distributions
Security transactions are accounted for on trade date. Realized gains and losses on security transactions are determined on a specific identification basis. Interest income and estimated expenses are accrued daily. Amortization of premium and accretion of discount on debt securities are included in interest income. Paydown gains and losses are recorded as an adjustment to interest income. Facility fees are recognized as income over the expected term of the loan. Dividend income is recorded on the ex-dividend date. Distributions to shareholders are recorded on the ex-dividend date and are determined according to income tax regulations (tax basis). Distributable earnings determined on a tax basis may differ from earnings recorded in accordance with U.S. GAAP. These differences may be permanent or temporary. Permanent differences are reclassified among capital accounts to reflect their tax character. These reclassifications have no impact on net assets or the results of operations. Temporary differences are not reclassified, as they may reverse in subsequent periods.
Common expenses incurred by the Trust are allocated among the Funds based on the ratio of net assets of each Fund to the combined net assets of the Trust. Fund specific expenses are charged directly to the Fund that incurred the expense.
Realized and unrealized gains and losses and net investment income, not including class specific expenses, are allocated daily to each class of shares based upon the relative proportion of net assets of each class. Differences in per share distributions, by class, are generally due to differences in class specific expenses.
Inflation-indexed bonds are adjusted for inflation through periodic increases or decreases in the security’s interest accruals, face amount, or principal redemption value, by amounts corresponding to the rate of inflation as measured by an index. Any increase or decrease in the face amount or principal redemption value will be included as interest income in the Consolidated Statement of Operations.
l. Accounting Estimates
The preparation of financial statements in accordance with U.S. GAAP requires management to make estimates and assumptions that affect the reported amounts of assets and liabilities at the date of the financial statements and the amounts of income and expenses during the reporting period. Actual results could differ from those estimates.
m. Guarantees and Indemnifications
Under the Trust’s organizational documents, its officers and trustees are indemnified by the Trust against certain liabilities arising out of the performance of their duties to the Trust.
48 Annual Report
franklintempleton.com
FRANKLIN STRATEGIC SERIES
NOTES TO CONSOLIDATED FINANCIAL STATEMENTS
Franklin Strategic Income Fund (continued)
Additionally, in the normal course of business, the Trust, on behalf of the Fund, enters into contracts with service providers that contain general indemnification clauses. The Trust’s maximum exposure under these arrangements is unknown as this would involve future claims that may be made against the Trust that have not yet occurred. Currently, the Trust expects the risk of loss to be remote.
2. Shares of Beneficial Interest
At April 30, 2016, there were an unlimited number of shares authorized (without par value). Transactions in the Fund’s shares were as follows:
| Year Ended April 30, | ||||||||||
| 2016 | 2015 | |||||||||
| Shares | Amount | Shares | Amount | |||||||
| Class A Shares: | ||||||||||
| Shares sold | 86,621,299 | $ | 820,474,987 | 124,483,941 | $ | 1,289,844,127 | ||||
| Shares issued in reinvestment of distributions | 19,950,107 | 187,902,460 | 29,780,955 | 304,820,710 | ||||||
| Shares redeemed | (145,536,164 | ) | (1,370,224,841 | ) | (122,508,169 | ) | (1,262,720,864 | ) | ||
| Net increase (decrease) | (38,964,758 | ) | $ | (361,847,394 | ) | 31,756,727 | $ | 331,943,973 | ||
| Class C Shares: | ||||||||||
| Shares sold | 23,699,305 | $ | 225,556,988 | 41,144,532 | $ | 426,954,807 | ||||
| Shares issued in reinvestment of distributions | 6,662,132 | 62,783,652 | 10,833,393 | 110,798,384 | ||||||
| Shares redeemed | (59,915,146 | ) | (564,563,714 | ) | (45,307,787 | ) | (467,109,496 | ) | ||
| Net increase (decrease) | (29,553,709 | ) | $ | (276,223,074 | ) | 6,670,138 | $ | 70,643,695 | ||
| Class R Shares: | ||||||||||
| Shares sold | 3,750,305 | $ | 35,486,868 | 5,069,436 | $ | 52,401,676 | ||||
| Shares issued in reinvestment of distributions | 836,414 | 7,856,192 | 1,312,515 | 13,385,323 | ||||||
| Shares redeemed | (7,375,237 | ) | (69,160,448 | ) | (5,603,123 | ) | (57,644,559 | ) | ||
| Net increase (decrease) | (2,788,518 | ) | $ | (25,817,388 | ) | 778,828 | $ | 8,142,440 | ||
| Class R6 Shares: | ||||||||||
| Shares sold | 7,061,535 | $ | 67,749,297 | 4,582,309 | $ | 47,822,000 | ||||
| Shares issued in reinvestment of distributions | 1,263,743 | 11,900,261 | 1,591,380 | 16,309,141 | ||||||
| Shares redeemed | (2,868,916 | ) | (27,272,113 | ) | (4,262,404 | ) | (43,609,686 | ) | ||
| Net increase (decrease) | 5,456,362 | $ | 52,377,445 | 1,911,285 | $ | 20,521,455 | ||||
| Advisor Class Shares: | ||||||||||
| Shares sold | 29,938,042 | $ | 283,540,799 | 43,912,372 | $ | 455,843,462 | ||||
| Shares issued in reinvestment of distributions | 4,428,844 | 41,793,674 | 6,465,928 | 66,243,350 | ||||||
| Shares redeemed | (49,826,590 | ) | (467,543,557 | ) | (33,425,788 | ) | (343,099,240 | ) | ||
| Net increase (decrease) | (15,459,704 | ) | $ | (142,209,084 | ) | 16,952,512 | $ | 178,987,572 | ||
franklintempleton.com
Annual Report
49
FRANKLIN STRATEGIC SERIES
NOTES TO CONSOLIDATED FINANCIAL STATEMENTS
Franklin Strategic Income Fund (continued)
3. Transactions with Affiliates
Franklin Resources, Inc. is the holding company for various subsidiaries that together are referred to as Franklin Templeton Investments. Certain officers and trustees of the Trust are also officers and/or directors of the following subsidiaries:
| Subsidiary | Affiliation |
| Franklin Advisers, Inc. (Advisers) | Investment manager |
| Franklin Templeton Services, LLC (FT Services) | Administrative manager |
| Franklin Templeton Distributors, Inc. (Distributors) | Principal underwriter |
| Franklin Templeton Investor Services, LLC (Investor Services) | Transfer agent |
a. Management Fees
The Fund pays an investment management fee to Advisers based on the average daily net assets of the Fund as follows:
| Annualized Fee Rate | Net Assets | |
| 0.625 | % | Up to and including $100 million |
| 0.500 | % | Over $100 million, up to and including $250 million |
| 0.450 | % | Over $250 million, up to and including $7.5 billion |
| 0.440 | % | Over $7.5 billion, up to and including $10 billion |
| 0.430 | % | Over $10 billion, up to and including $12.5 billion |
| 0.420 | % | Over $12.5 billion, up to and including $15 billion |
| 0.400 | % | Over $15 billion, up to and including $17.5 billion |
| 0.380 | % | Over $17.5 billion, up to and including $20 billion |
| 0.360 | % | Over $20 billion, up to and including $35 billion |
| 0.355 | % | Over $35 billion, up to and including $50 billion |
| 0.350 | % | In excess of $50 billion |
For the year ended April 30, 2016, the effective investment management fee rate was 0.453% of the Fund’s average daily net assets.
b. Administrative Fees
Under an agreement with Advisers, FT Services provides administrative services to the Fund. The fee is paid by Advisers based on the Fund’s average daily net assets, and is not an additional expense of the Fund.
c. Distribution Fees
The Board has adopted distribution plans for each share class, with the exception of Class R6 and Advisor Class shares, pursuant to Rule 12b-1 under the 1940 Act. Under the Fund’s Class A reimbursement distribution plan, the Fund reimburses Distributors for costs incurred in connection with the servicing, sale and distribution of the Fund’s shares up to the maximum annual plan rate. Under the Class A reimbursement distribution plan, costs exceeding the maximum for the current plan year cannot be reimbursed in subsequent periods. In addition, under the Fund’s Class C and R compensation distribution plans, the Fund pays Distributors for costs incurred in connection with the servicing, sale and distribution of the Fund’s shares up to the maximum annual plan rate for each class. The plan year, for purposes of monitoring compliance with the maximum annual plan rates, is February 1 through January 31.
50 Annual Report
franklintempleton.com
FRANKLIN STRATEGIC SERIES
NOTES TO CONSOLIDATED FINANCIAL STATEMENTS
Franklin Strategic Income Fund (continued)
The maximum annual plan rates, based on the average daily net assets, for each class, are as follows:
| Class A | 0.25 | % |
| Class C | 0.65 | % |
| Class R | 0.50 | % |
| d. Sales Charges/Underwriting Agreements | ||
Front-end sales charges and contingent deferred sales charges (CDSC) do not represent expenses of the Fund. These charges are deducted from the proceeds of sales of Fund shares prior to investment or from redemption proceeds prior to remittance, as applicable. Distributors has advised the Fund of the following commission transactions related to the sales and redemptions of the Fund’s shares for the year:
| Sales charges retained net of commissions paid to | ||
| unaffiliated brokers/dealers | $ | 1,671,027 |
| CDSC retained | $ | 254,281 |
| e. Transfer Agent Fees | ||
Each class of shares, except for Class R6, pays transfer agent fees to Investor Services for its performance of shareholder servicing obligations and reimburses Investor Services for out of pocket expenses incurred, including shareholder servicing fees paid to third parties. These fees are allocated daily based upon their relative proportion of such classes’ aggregate net assets. Class R6 pays Investor Services transfer agent fees specific to that class.
For the year ended April 30, 2016, the Fund paid transfer agent fees of $11,169,723, of which $4,619,899 was retained by Investor Services.
f. Investments in Affiliated Management Investment Companies
The Fund invests in affiliated management investment companies for purposes other than exercising a controlling influence over the management or policies. Management fees paid by the Fund are waived on assets invested in the affiliated management investment companies, as noted in the Consolidated Statement of Operations, in an amount not to exceed the management and administrative fees paid directly or indirectly by each affiliate. Prior to May 1, 2013, the waiver was accounted for as a reduction to management fees.
| % of | ||||||||||||||
| Affiliated | ||||||||||||||
| Number of | Number of | Fund Shares | ||||||||||||
| Shares Held | Shares | Value | Outstanding | |||||||||||
| at Beginning | Gross | Gross | Held at End | at End | Investment | Realized | Held at End | |||||||
| of Year | Additions | Reductions | of Year | of Year | Income | Gain (Loss) | of Year | |||||||
| Controlled Affiliates | ||||||||||||||
| Franklin Lower Tier | ||||||||||||||
| Floating Rate Fund | — | 38,346,600 | a | — | 38,346,600 | $ | 374,646,288 | $ | 14,148,859 | $ | — | 85.82 | % | |
| Franklin Middle Tier | ||||||||||||||
| Floating Rate Fund | — | 29,441,483 | b | — | 29,441,483 | 280,871,745 | 6,712,796 | — | 80.55 | % | ||||
| Non-Controlled Affiliates | ||||||||||||||
| Institutional Fiduciary | ||||||||||||||
| Trust Money Market | ||||||||||||||
| Portfolio | 1,030,461,214 | 1,777,204,144 | (1,896,701,769 | ) | 910,963,589 | 910,963,589 | — | — | 4.60 | % | ||||
| Total | $ | 1,566,481,622 | $ | 20,861,655 | $ | — | ||||||||
aThe Fund purchased shares of the affiliate through an in-kind transfer of securities. The securities transferred had a market value of $374,291,707 and a cost basis of
$415,862,743 on the date of the transfer.
bThe Fund purchased shares of the affiliate through an in-kind transfer of securities. The securities transferred had a market value of $290,085,114 and acostbasisof
$308,052,151 on the date of the transfer.
franklintempleton.com
Annual Report
51
FRANKLIN STRATEGIC SERIES
NOTES TO CONSOLIDATED FINANCIAL STATEMENTS
Franklin Strategic Income Fund (continued)
| 3. | Transactions with Affiliates (continued) |
| g. | Waiver and Expense Reimbursements |
Investor Services has contractually agreed in advance to waive or limit its fees so that the Class R6 transfer agent fees do not exceed 0.01% until August 31, 2016. There were no Class R6 transfer agent fees waived during the year ended April 30, 2016.
h. Interfund Transactions
The Fund engaged in purchases and sales of investments with funds or other accounts that have a common investment manager (or affiliated investment managers), directors, trustees, or officers. During the year ended April 30, 2016, the purchase and sale transactions aggregated $0 and $11,521,332, respectively.
4. Expense Offset Arrangement
The Fund has entered into an arrangement with its custodian whereby credits realized as a result of uninvested cash balances are used to reduce a portion of the Fund’s custodian expenses. During the year ended April 30, 2016, the custodian fees were reduced as noted in the Consolidated Statement of Operations.
5. Income Taxes
For tax purposes, capital losses may be carried over to offset future capital gains, if any. At April 30, 2016, the capital loss carryforwards were as follows:
| Capital loss carryforwards: | ||
| Short Term | $ | 17,612,779 |
| Long Term | 208,700,025 | |
| Total capital loss carryforwards | $ | 226,312,804 |
For tax purposes, the Fund may elect to defer any portion of a late-year ordinary loss to the first day of the following fiscal year. At April 30, 2016, the Fund deferred late-year ordinary losses of $173,412,246.
The tax character of distributions paid during the years ended April 30, 2016 and 2015, was as follows:
| 2016 | 2015 | |||
| Distributions paid from: | ||||
| Ordinary income | $ | 339,056,921 | $ | 482,779,438 |
| Long term capital gain | — | 76,948,794 | ||
| $ | 339,056,921 | $ | 559,728,232 |
At April 30, 2016, the cost of investments, net unrealized appreciation (depreciation) and undistributed ordinary income for income tax purposes were as follows:
| Cost of investments. | $ | 8,327,525,480 | |
| Unrealized appreciation | $ | 158,080,535 | |
| Unrealized depreciation | (625,064,884 | ) | |
| Net unrealized appreciation (depreciation) | $ | (466,984,349 | ) |
| Distributable earnings - undistributed ordinary | |||
| income | $ | 13,327,307 | |
52 Annual Report
franklintempleton.com
FRANKLIN STRATEGIC SERIES
NOTES TO CONSOLIDATED FINANCIAL STATEMENTS
Franklin Strategic Income Fund (continued)
Differences between income and/or capital gains as determined on a book basis and a tax basis are primarily due to differing treatments of foreign currency transactions and bond discounts and premiums.
6. Investment Transactions
Purchases and sales of investments (excluding short term securities) for the year ended April 30, 2016, aggregated $6,657,800,782 and $7,788,379,574, respectively.
7. Credit Risk and Defaulted Securities
At April 30, 2016, the Fund had 43.91% of its portfolio invested in high yield, senior secured floating rate notes, or other securities rated below investment grade. These securities may be more sensitive to economic conditions causing greater price volatility and are potentially subject to a greater risk of loss due to default than higher rated securities.
The Fund held defaulted securities and/or other securities for which the income has been deemed uncollectible. At April 30, 2016, the aggregate value of these securities was $46,076,709, representing 0.61% of the Fund’s net assets. The Fund discontinues accruing income on securities for which income has been deemed uncollectible and provides an estimate for losses on interest receivable. The securities have been identified in the accompanying Consolidated Statement of Investments.
8. Restricted Securities
The Fund invests in securities that are restricted under the Securities Act of 1933 (1933 Act) or which are subject to legal, contractual, or other agreed upon restrictions on resale. Restricted securities are often purchased in private placement transactions, and cannot be sold without prior registration unless the sale is pursuant to an exemption under the 1933 Act. Disposal of these securities may require greater effort and expense, and prompt sale at an acceptable price may be difficult. The Fund may have registration rights for restricted securities. The issuer generally incurs all registration costs.
At April 30, 2016, the Fund held investments in restricted securities, excluding certain securities exempt from registration under the 1933 Act deemed to be liquid, as follows:
| Acquisition | ||||||
| Shares | Issuer | Dates | Cost | Value | ||
| 15,189 | Warrior Met Coal LLC, A (Value is 0.00% of Net Assets) | 3/31/16 | $ | 29,562,025 | $ | 1,531,300 |
9. Other Derivative Information
At April 30, 2016, the Fund’s investments in derivative contracts are reflected in the Consolidated Statement of Assets and Liabilities as follows:
| Asset Derivatives | Liability Derivatives | ||||||
| Derivative Contracts | Consolidated Statement of | Consolidated Statement of | |||||
| Not Accounted for as | Assets and Liabilities | Assets and Liabilities | |||||
| Hedging Instruments | Location | Fair Value | Location | Fair Value | |||
| Foreign exchange contracts. | Unrealized appreciation on OTC | $ | 14,448,306 | Unrealized depreciation on OTC | $ | 60,817,217 | |
| forward exchange contracts | forward exchange contracts | ||||||
| Credit contracts | Variation margin | 4,313 | a | Variation margin | — | ||
franklintempleton.com
Annual Report
53
FRANKLIN STRATEGIC SERIES
NOTES TO CONSOLIDATED FINANCIAL STATEMENTS
| Franklin Strategic Income Fund (continued) | ||||||
| 9. Other Derivative Information (continued) | ||||||
| Asset Derivatives | Liability Derivatives | |||||
| Derivative Contracts | Consolidated Statement of | Consolidated Statement of | ||||
| Not Accounted for as | Assets and Liabilities | Assets and Liabilities | ||||
| Hedging Instruments | Location | Fair Value | Location | Fair Value | ||
| OTC swap contracts (premium | 265,476 | OTC swap contracts (premium | — | |||
| paid) | received) | |||||
| Unrealized appreciation on OTC | 340,543 | Unrealized depreciation on OTC | — | |||
| swap contracts | swap contracts | |||||
| Value recovery instruments | Investments in securities, at | 6,433,860 | ||||
| value | ||||||
| Totals | $ | 21,492,498 | $ | 60,817,217 | ||
aThis amount reflects the cumulative appreciation (depreciation) of centrally cleared swaps contracts as reported in the Consolidated Statement of Investments. Only the
variation margin receivable/payable at year end is separately reported within the Consolidated Statement of Assets and Liabilities. Prior variation margin movements were
recorded to cash upon receipt or payment.
For the year ended April 30, 2016, the effect of derivative contracts in the Fund’s Consolidated Statement of Operations was as
follows:
| Net Change in | ||||||||
| Unrealized | ||||||||
| Derivative Contacts | Net Realized | Appreciation | ||||||
| Not Accounted for as | Consolidated Statement of | Gain (Loss) for | Consolidated Statement of | (Depreciation) | ||||
| Hedging Instruments | Operations Locations | the Period | Operations Locations | for the Period | ||||
| Net realized gain (loss) from: | Net change in unrealized | |||||||
| appreciation (depreciation) on: | ||||||||
| Foreign exchange contracts | Foreign currency transactions | $ | 47,642,688 | a | Translation of other assets and | $ | (107,368,531 | )a |
| liabilities denominated in | ||||||||
| foreign currencies | ||||||||
| Credit contracts | Swap contracts | 205,693 | Swap contracts | 77,826 | ||||
| Value recovery instruments | Investments | — | Investments | (1,659,690 | ) | |||
| Totals | $ | 47,848,381 | $ | (108,950,395 | ) | |||
aForward exchange contracts are included in net realized gain (loss) from foreign currency transactions and net change in unrealized appreciation (depreciation) on
translation of other assets and liabilities denominated in foreign currencies in the Consolidated Statement of Operations.
At April 30, 2016, the Fund’s OTC derivative assets and liabilities, are as follows:
| Gross and Net Amounts of | ||||
| Assets and Liabilities Presented | ||||
| in the Consolidated Statement of Assets and Liabilities | ||||
| Assetsa | Liabilitiesa | |||
| Derivatives | ||||
| Forward exchange contracts | $ | 14,448,306 | $ | 60,817,217 |
| Swap contracts | 606,019 | — | ||
| Total | $ | 15,054,325 | $ | 60,817,217 |
aAbsent an event of default or early termination, OTC derivative assets and liabilities are presented gross and not offset in the Consolidated Statement of Assets and
Liabilities.
54 Annual Report
franklintempleton.com
FRANKLIN STRATEGIC SERIES
NOTES TO CONSOLIDATED FINANCIAL STATEMENTS
Franklin Strategic Income Fund (continued)
At April 30, 2016, the Fund’s OTC derivative assets which may be offset against the Fund’s OTC derivative liabilities and collateral received from the counterparty, is as follows:
| Amounts Not Offset in the | |||||||||||
| Consolidated Statement of Assets and Liabilities | |||||||||||
| Gross and | |||||||||||
| Net Amounts of | Financial | Financial | |||||||||
| Assets Presented in the | Instruments | Instruments | Cash | Net Amount | |||||||
| Consolidated Statement of | Available for | Collateral | Collateral | (Not less | |||||||
| Assets and Liabilities | Offset | Received | Receiveda | than zero) | |||||||
| Counterparty | |||||||||||
| BZWS | $ | 295,309 | $ | (295,309 | ) | $ | — | $ | — | $ | — |
| CITI | 31,129 | (31,129 | ) | — | — | — | |||||
| DBAB | 13,408,002 | (13,408,002 | ) | — | — | — | |||||
| GSCO | 606,019 | (606,019 | ) | — | — | — | |||||
| HSBC | 400,297 | (400,297 | ) | — | — | — | |||||
| JPHQ | 208,402 | (208,402 | ) | — | — | — | |||||
| MSCO | 105,167 | (105,167 | ) | — | — | — | |||||
| Total | $ | 15,054,325 | $ | (15,054,325 | ) | $ | — | $ | — | $ | — |
aIn some instances, the collateral amounts disclosed in the table above were adjusted due to the requirement to limit the collateral amounts to avoid the effectof
overcollateralization. Actual collateral received and/or pledged may be more than the amounts disclosed herein.
At April 30, 2016, the Fund’s OTC derivative liabilities which may be offset against the Fund’s OTC derivative assets and collateral
pledged to the counterparty, is as follows:
| Amounts Not Offset in the | ||||||||||||
| Consolidated Statement of Assets and Liabilities | ||||||||||||
| Gross and | ||||||||||||
| Net Amounts of | Financial | Financial | ||||||||||
| Liabilities Presented in | Instruments | Instruments | Cash | Net Amount | ||||||||
| the Consolidated Statement of | Available for | Collateral | Collateral | (Not less | ||||||||
| Assets and Liabilities | Offset | Pledged | Pledged | than zero) | ||||||||
| Counterparty | ||||||||||||
| BZWS | $ | 2,992,341 | $ | (295,309 | ) | $ | — | $ | (1,240,000 | ) | $ | 1,457,032 |
| CITI. | 1,040,893 | (31,129 | ) | — | (320,000 | ) | 689,764 | |||||
| DBAB | 41,070,662 | (13,408,002 | ) | — | (14,160,000 | ) | 13,502,660 | |||||
| GSCO | 829,902 | (606,019 | ) | — | (110,000 | ) | 113,883 | |||||
| HSBC | 1,613,090 | (400,297 | ) | — | (510,000 | ) | 702,793 | |||||
| JPHQ | 13,056,945 | (208,402 | ) | — | (8,630,000 | ) | 4,218,543 | |||||
| MSCO | 213,384 | (105,167 | ) | — | — | 108,217 | ||||||
| Total | $ | 60,817,217 | $ | (15,054,325 | ) | $ | — | $ | (24,970,000 | ) | $ | 20,792,892 |
For the year ended April 30, 2016, the average month end fair value of derivatives represented 0.50% of average month end net assets. The average month end number of open derivatives contracts for the year was 76.
See Note 1(d) regarding derivative financial instruments.
See Abbreviations on page 58.
franklintempleton.com
Annual Report
55
FRANKLIN STRATEGIC SERIES
NOTES TO CONSOLIDATED FINANCIAL STATEMENTS
Franklin Strategic Income Fund (continued)
10. Credit Facility
The Fund, together with other U.S. registered and foreign investment funds (collectively, Borrowers), managed by Franklin Templeton Investments, are borrowers in a joint syndicated senior unsecured credit facility totaling $2 billion (Global Credit Facility) which matures on February 10, 2017. This Global Credit Facility provides a source of funds to the Borrowers for temporary and emergency purposes, including the ability to meet future unanticipated or unusually large redemption requests.
Under the terms of the Global Credit Facility, the Fund shall, in addition to interest charged on any borrowings made by the Fund and other costs incurred by the Fund, pay its share of fees and expenses incurred in connection with the implementation and maintenance of the Global Credit Facility, based upon its relative share of the aggregate net assets of all of the Borrowers, including an annual commitment fee of 0.07% based upon the unused portion of the Global Credit Facility. Effective February 12, 2016, the annual commitment fee is 0.15%. These fees are reflected in other expenses in the Consolidated Statement of Operations. During the year ended April 30, 2016, the Fund did not use the Global Credit Facility.
11. Fair Value Measurements
The Fund follows a fair value hierarchy that distinguishes between market data obtained from independent sources (observable inputs) and the Fund’s own market assumptions (unobservable inputs). These inputs are used in determining the value of the Fund’s financial instruments and are summarized in the following fair value hierarchy:
- Level 1 – quoted prices in active markets for identical financial instruments
- Level 2 – other significant observable inputs (including quoted prices for similar financial instruments, interest rates, prepayment speed, credit risk, etc.)
- Level 3 – significant unobservable inputs (including the Fund’s own assumptions in determining the fair value of financial instruments)
The input levels are not necessarily an indication of the risk or liquidity associated with financial instruments at that level.
For movements between the levels within the fair value hierarchy, the Fund has adopted a policy of recognizing the transfers as of the date of the underlying event which caused the movement.
56 Annual Report
franklintempleton.com
FRANKLIN STRATEGIC SERIES
NOTES TO CONSOLIDATED FINANCIAL STATEMENTS
Franklin Strategic Income Fund (continued)
A summary of inputs used as of April 30, 2016, in valuing the Fund’s assets and liabilities carried at fair value, is as follows:
| Level 1 | Level 2 | Level 3 | Total | ||||||
| Assets: | |||||||||
| Investments in Securities: | |||||||||
| Equity Investments:a | |||||||||
| Consumer Services | $ | — | $ | 14,507,843 | $ | — | $ | 14,507,843 | |
| Energy. | — | — | 1,531,300 | 1,531,300 | |||||
| Health Care Equipment & Services | — | 677,079 | — | 677,079 | |||||
| Transportation | — | 2,526,425 | — | 2,526,425 | |||||
| Management Investment Companies. | 759,911,283 | — | — | 759,911,283 | |||||
| Corporate Bonds | — | 2,945,253,361 | 1,524,572 | 2,946,777,933 | |||||
| Senior Floating Rate Interests | — | 803,983,285 | — | 803,983,285 | |||||
| Foreign Government and Agency Securities | — | 973,903,321 | — | 973,903,321 | |||||
| U.S. Government and Agency Securities | — | 310,426,989 | — | 310,426,989 | |||||
| Asset-Backed Securities and Commercial | |||||||||
| Mortgage-Backed Securities. | — | 547,165,337 | — | 547,165,337 | |||||
| Mortgage-Backed Securities | — | 509,496,991 | — | 509,496,991 | |||||
| Municipal Bonds | — | 78,638,848 | — | 78,638,848 | |||||
| Escrows and Litigation Trusts | — | — | 30,908 | b | 30,908 | ||||
| Short Term Investments | 910,963,589 | — | — | 910,963,589 | |||||
| Total Investments in Securities | $ | 1,670,874,872 | $ | 6,186,579,479 | $ | 3,086,780 | $ | 7,860,541,131 | |
| Other Financial Instruments | |||||||||
| Forward Exchange Contracts | $ | — | $ | 14,448,306 | $ | — | $ | 14,448,306 | |
| Swap Contracts. | — | 344,856 | — | 344,856 | |||||
| Total Other Financial Instruments | $ | — | $ | 14,793,162 | $ | — | $ | 14,793,162 | |
| Liabilities: | |||||||||
| Other Financial Instruments | |||||||||
| Forward Exchange Contracts | $ | — | $ | 60,817,217 | $ | — | $ | 60,817,217 | |
aIncludes common and convertible preferred stocks and management investment companies.
bIncludes securities determined to have no value at April 30, 2016.
A reconciliation of assets in which Level 3 inputs are used in determining fair value is presented when there are significant Level 3
financial instruments at the end of the year.
12. Subsequent Events
The Fund has evaluated subsequent events through the issuance of the consolidated financial statements and determined that no events have occurred that require disclosure.
franklintempleton.com
Annual Report
57
FRANKLIN STRATEGIC SERIES
NOTES TO CONSOLIDATED FINANCIAL STATEMENTS
| Franklin Strategic Income Fund (continued) | |||||
| Abbreviations | |||||
| Counterparty | Currency | Selected Portfolio | |||
| BZWS | Barclays Bank PLC | BRL | Brazilian Real | CDO | Collateralized Debt Obligation |
| CITI | Citigroup, Inc. | EUR | Euro | CLO | Collateralized Loan Obligation |
| DBAB | Deutsche Bank AG | GBP | British Pound Sterling | EDA | Economic Development Authority |
| GSCO | The Goldman Sachs Group, Inc. | IDR | Indonesian Rupiah | ETF | Exchange Traded Fund |
| HSBC | HSBC Bank USA, N.A. | KRW | South Korean Won | FHLMC | Federal Home Loan Mortgage Corp. |
| ICE | Intercontinental Exchange | LKR | Sri Lankan Rupee | FICO | Financing Corp. |
| JPHQ | JP Morgan Chase & Co. | MXN | Mexican Peso | FRN | Floating Rate Note |
| MSCO | Morgan Stanley | MYR | Malaysian Ringgit | GDP | Gross Domestic Product |
| PHP | Philippine Peso | GO | General Obligation | ||
| UYU | Uruguayan Peso | HDC | Housing Development Corp. | ||
| PIK | Payment-In-Kind | ||||
| SF | Single Family | ||||
| VRI | Value Recovery Instrument | ||||
58 Annual Report
franklintempleton.com
FRANKLIN STRATEGIC SERIES
Report of Independent Registered Public Accounting Firm
To the Board of Trustees and Shareholders of Franklin Strategic Income Fund
In our opinion, the accompanying consolidated statement of assets and liabilities, including the consolidated statement of investments, and the related consolidated statements of operations and of changes in net assets and the consolidated financial highlights present fairly, in all material respects, the financial position of Franklin Strategic Income Fund (the "Fund") at April 30, 2016, the results of its operations for the year then ended, the changes in its net assets for each of the two years in the period then ended and the consolidated financial highlights for each of the five years in the period then ended, in conformity with accounting principles generally accepted in the United States of America. These consolidated financial statements and consolidated financial highlights (hereafter referred to as "financial statements") are the responsibility of the Fund’s management. Our responsibility is to express an opinion on these financial statements based on our audits. We conducted our audits of these financial statements in accordance with the standards of the Public Company Accounting Oversight Board (United States). Those standards require that we plan and perform the audit to obtain reasonable assurance about whether the financial statements are free of material misstatement. An audit includes examining, on a test basis, evidence supporting the amounts and disclosures in the financial statements, assessing the accounting principles used and significant estimates made by management, and evaluating the overall financial statement presentation. We believe that our audit, which included confirmation of securities at April 30, 2016 by correspondence with the custodian, transfer agent and brokers, provide a reasonable basis for our opinion.
PricewaterhouseCoopers LLP
San Francisco, California
June 15, 2016
franklintempleton.com
Annual Report
59
FRANKLIN STRATEGIC SERIES
Board Members and Officers
The name, year of birth and address of the officers and board members, as well as their affiliations, positions held with the Trust, principal occupations during at least the past five years and number of U.S. registered portfolios overseen in the Franklin Templeton Investments fund complex, are shown below. Generally, each board member serves until that person’s successor is elected and qualified.
| Independent Board Members | ||||
| Number of Portfolios in | ||||
| Name, Year of Birth | Length of | Fund Complex Overseen | Other Directorships Held | |
| and Address | Position | Time Served | by Board Member* | During at Least the Past 5 Years |
| Harris J. Ashton (1932) | Trustee | Since 1991 | 145 | Bar-S Foods (meat packing company) |
| One Franklin Parkway | (1981-2010). | |||
| San Mateo, CA 94403-1906 | ||||
| Principal Occupation During at Least the Past 5 Years: | ||||
| Director of various companies; and formerly, Director, RBC Holdings, Inc. (bank holding company) (until 2002); and President, Chief Executive | ||||
| Officer and Chairman of the Board, General Host Corporation (nursery and craft centers) (until 1998). | ||||
| Mary C. Choksi (1950) | Trustee | Since 2014 | 121 | Avis Budget Group Inc. (car rental) |
| One Franklin Parkway | (2007-present), Omnicom Group Inc. | |||
| San Mateo, CA 94403-1906 | (advertising and marketing | |||
| communications services) | ||||
| (2011-present) and H.J. Heinz | ||||
| Company (processed foods and allied | ||||
| products) (1998-2006) | ||||
| Principal Occupation During at Least the Past 5 Years: | ||||
| Senior Advisor, Strategic Investment Group (investment management group) (2015-present); director of various companies; and formerly, | ||||
| Founding Partner and Senior Managing Director, Strategic Investment Group (1987–2015); Founding Partner and Managing Director, Emerging | ||||
| Markets Management LLC (investment management firm) (1987-2011); and Loan Officer/Senior Loan Officer/Senior Pension Investment | ||||
| Officer, World Bank Group (international financial institution) (1977-1987). | ||||
| Edith E. Holiday (1952) | Trustee | Since 1998 | 145 | Hess Corporation (exploration and |
| One Franklin Parkway | refining of oil and gas) (1993-present), | |||
| San Mateo, CA 94403-1906 | Canadian National Railway (railroad) | |||
| (2001-present), White Mountains | ||||
| Insurance Group, Ltd. (holding | ||||
| company) (2004-present), RTI | ||||
| International Metals, Inc. (manufacture | ||||
| and distribution of titanium) | ||||
| (1999-2015) and H.J. Heinz Company | ||||
| (processed foods and allied products) | ||||
| (1994-2013). | ||||
| Principal Occupation During at Least the Past 5 Years: | ||||
| Director or Trustee of various companies and trusts; and formerly, Assistant to the President of the United States and Secretary of the | ||||
| Cabinet (1990-1993); General Counsel to the United States Treasury Department (1989-1990); and Counselor to the Secretary and Assistant | ||||
| Secretary for Public Affairs and Public Liaison – United States Treasury Department (1988-1989). | ||||
| J. Michael Luttig (1954) | Trustee | Since 2009 | 145 | Boeing Capital Corporation (aircraft |
| One Franklin Parkway | financing) (2006-2013). | |||
| San Mateo, CA 94403-1906 | ||||
| Principal Occupation During at Least the Past 5 Years: | ||||
| Executive Vice President, General Counsel and member of the Executive Council, The Boeing Company (aerospace company)(2006-present); | ||||
| and formerly, Federal Appeals Court Judge, U.S. Court of Appeals for the Fourth Circuit (1991-2006). | ||||
| Frank A. Olson (1932) | Trustee | Since 2007 | 145 | Hess Corporation (exploration and |
| One Franklin Parkway | refining of oil and gas) (1998-2013). | |||
| San Mateo, CA 94403-1906 | ||||
| Principal Occupation During at Least the Past 5 Years: | ||||
| Director of various companies; and formerly, Chairman of the Board, The Hertz Corporation (car rental) (1980-2000) and Chief Executive | ||||
| Officer (1977-1999); and Chairman of the Board, President and Chief Executive Officer, UAL Corporation (airlines) (June - December 1987). | ||||
60 Annual Report
franklintempleton.com
FRANKLIN STRATEGIC SERIES
| Independent Board Members (continued) | ||||
| Number of Portfolios in | ||||
| Name, Year of Birth | Length of | Fund Complex Overseen | Other Directorships Held | |
| and Address | Position | Time Served | by Board Member* | During at Least the Past 5 Years |
| Larry D. Thompson (1945) | Trustee | Since 2007 | 145 | The Southern Company (energy |
| One Franklin Parkway | company) (2014-present; previously | |||
| San Mateo, CA 94403-1906 | 2010-2012), Graham Holdings | |||
| Company (education and media | ||||
| organization) (2011-present) and | ||||
| Cbeyond, Inc. (business | ||||
| communications provider) | ||||
| (2010-2012). | ||||
| Principal Occupation During at Least the Past 5 Years: | ||||
| Director of various companies; John A. Sibley Professor of Corporate and Business Law, University of Georgia School of Law (2015-present; | ||||
| previously 2011-2012); and formerly, Executive Vice President – Government Affairs, General Counsel and Corporate Secretary, PepsiCo, | ||||
| Inc. (consumer products) (2012-2014); Senior Vice President – Government Affairs, General Counsel and Secretary, PepsiCo, Inc. | ||||
| (2004-2011); Senior Fellow of The Brookings Institution (2003-2004); Visiting Professor, University of Georgia School of Law (2004); and | ||||
| Deputy Attorney General, U.S. Department of Justice (2001-2003). | ||||
| John B. Wilson (1959) | Lead | Trustee since | 121 | None |
| One Franklin Parkway | Independent | 2006 and Lead | ||
| San Mateo, CA 94403-1906 | Trustee | Independent | ||
| Trustee since | ||||
| 2008 | ||||
| Principal Occupation During at Least the Past 5 Years: | ||||
| President, Staples Europe (office supplies) (2012-present); President and Founder, Hyannis Port Capital, Inc. (real estate and private equity | ||||
| investing); serves on private and non-profit boards; and formerly, Chief Operating Officer and Executive Vice President, Gap, Inc. (retail) | ||||
| (1996-2000); Chief Financial Officer and Executive Vice President – Finance and Strategy, Staples, Inc. (1992-1996); Senior Vice President – | ||||
| Corporate Planning, Northwest Airlines, Inc. (airlines) (1990-1992); and Vice President and Partner, Bain & Company (consulting firm) | ||||
| (1986-1990). | ||||
| Interested Board Members and Officers | ||||
| Number of Portfolios in | ||||
| Name, Year of Birth | Length of | Fund Complex Overseen | Other Directorships Held | |
| and Address | Position | Time Served | by Board Member* | During at Least the Past 5 Years |
| **Gregory E. Johnson (1961) | Trustee | Since 2013 | 160 | None |
| One Franklin Parkway | ||||
| San Mateo, CA 94403-1906 | ||||
| Principal Occupation During at Least the Past 5 Years: | ||||
| Chairman of the Board, Member - Office of the Chairman, Director and Chief Executive Officer, Franklin Resources, Inc.; officer and/or director | ||||
| or trustee, as the case may be, of some of the other subsidiaries of Franklin Resources, Inc. and of 44 of the investment companies in Franklin | ||||
| Templeton Investments; Vice Chairman, Investment Company Institute; and formerly, President, Franklin Resources, Inc. (1994-2015). | ||||
| **Rupert H. Johnson, Jr. (1940) | Chairman of | Chairman of the | 145 | None |
| One Franklin Parkway | the Board and | Board since | ||
| San Mateo, CA 94403-1906 | Trustee | 2013 and Trustee | ||
| since 1991 | ||||
| Principal Occupation During at Least the Past 5 Years: | ||||
| Vice Chairman, Member – Office of the Chairman and Director, Franklin Resources, Inc.; Director, Franklin Advisers, Inc.; Senior Vice | ||||
| President, Franklin Advisory Services, LLC; and officer and/or director or trustee, as the case may be, of some of the other subsidiaries of | ||||
| Franklin Resources, Inc. and of 42 of the investment companies in Franklin Templeton Investments. | ||||
| Alison E. Baur (1964) | Vice President | Since 2012 | Not Applicable | Not Applicable |
| One Franklin Parkway | ||||
| San Mateo, CA 94403-1906 | ||||
| Principal Occupation During at Least the Past 5 Years: | ||||
| Deputy General Counsel, Franklin Templeton Investments; and officer of some of the other subsidiaries of Franklin Resources, Inc. and of 45 | ||||
| of the investment companies in Franklin Templeton Investments. | ||||
franklintempleton.com
Annual Report
61
FRANKLIN STRATEGIC SERIES
| Interested Board Members and Officers (continued) | ||||
| Number of Portfolios in | ||||
| Name, Year of Birth | Length of | Fund Complex Overseen | Other Directorships Held | |
| and Address | Position | Time Served | by Board Member* | During at Least the Past 5 Years |
| Laura F. Fergerson (1962) | Chief | Since 2009 | Not Applicable | Not Applicable |
| One Franklin Parkway | Executive | |||
| San Mateo, CA 94403-1906 | Officer – | |||
| Finance and | ||||
| Administration | ||||
| Principal Occupation During at Least the Past 5 Years: | ||||
| Senior Vice President, Franklin Templeton Services, LLC; Vice President, Franklin Advisers, Inc. and Franklin Templeton Institutional, LLC; and | ||||
| officer of 45 of the investment companies in Franklin Templeton Investments. | ||||
| Gaston Gardey (1967) | Treasurer, | Since 2009 | Not Applicable | Not Applicable |
| One Franklin Parkway | Chief Financial | |||
| San Mateo, CA 94403-1906 | Officer and | |||
| Chief | ||||
| Accounting | ||||
| Officer | ||||
| Principal Occupation During at Least the Past 5 Years: | ||||
| Treasurer, U.S. Fund Administration & Reporting, Franklin Templeton Investments; and officer of 28 of the investment companies in Franklin | ||||
| Templeton Investments. | ||||
| Aliya S. Gordon (1973) | Vice President | Since 2009 | Not Applicable | Not Applicable |
| One Franklin Parkway | ||||
| San Mateo, CA 94403-1906 | ||||
| Principal Occupation During at Least the Past 5 Years: | ||||
| Senior Associate General Counsel, Franklin Templeton Investments; and officer of 45 of the investment companies in Franklin Templeton | ||||
| Investments. | ||||
| Steven J. Gray (1955) | Vice President | Since 2009 | Not Applicable | Not Applicable |
| One Franklin Parkway | ||||
| San Mateo, CA 94403-1906 | ||||
| Principal Occupation During at Least the Past 5 Years: | ||||
| Senior Associate General Counsel, Franklin Templeton Investments; Vice President, Franklin Templeton Distributors, Inc. and Franklin | ||||
| Alternative Strategies Advisers, LLC; and officer of 45 of the investment companies in Franklin Templeton Investments. | ||||
| Robert Lim (1948) | Vice President | Since May 2016 | Not Applicable | Not Applicable |
| One Franklin Parkway | – AML | |||
| San Mateo, CA 94403-1906 | Compliance | |||
| Principal Occupation During at Least the Past 5 Years: | ||||
| Vice President, Franklin Templeton Companies, LLC; Chief Compliance Officer, Franklin Templeton Distributors, Inc. and Franklin Templeton | ||||
| Investor Services, LLC; and officer of 45 of the investment companies in Franklin Templeton Investments. | ||||
| Edward B. Jamieson (1948) | President and | Since 2010 | Not Applicable | Not Applicable |
| One Franklin Parkway | Chief | |||
| San Mateo, CA 94403-1906 | Executive | |||
| Officer – | ||||
| Investment | ||||
| Management | ||||
| Principal Occupation During at Least the Past 5 Years: | ||||
| President, Chief Investment Officer and Director, Franklin Advisers, Inc.; Executive Vice President, Franklin Templeton Institutional, LLC; and | ||||
| officer and/or trustee, as the case may be, of some of the other subsidiaries of Franklin Resources, Inc. and of 10 of the investment | ||||
| companies in Franklin Templeton Investments. | ||||
| Christopher J. Molumphy | Vice President | Since 2000 | Not Applicable | Not Applicable |
| (1962) | ||||
| One Franklin Parkway | ||||
| San Mateo, CA 94403-1906 | ||||
| Principal Occupation During at Least the Past 5 Years: | ||||
| Director and Executive Vice President, Franklin Advisers, Inc.; Executive Vice President, Franklin Templeton Institutional, LLC; and officer of | ||||
| some of the other subsidiaries of Franklin Resources, Inc. and of 22 of the investment companies in Franklin Templeton Investments. | ||||
62 Annual Report
franklintempleton.com
FRANKLIN STRATEGIC SERIES
| Interested Board Members and Officers (continued) | ||||
| Number of Portfolios in | ||||
| Name, Year of Birth | Length of | Fund Complex Overseen | Other Directorships Held | |
| and Address | Position | Time Served | by Board Member* | During at Least the Past 5 Years |
| Kimberly H. Novotny (1972) | Vice President | Since 2013 | Not Applicable | Not Applicable |
| 300 S.E. 2nd Street | ||||
| Fort Lauderdale, FL 33301-1923 | ||||
| Principal Occupation During at Least the Past 5 Years: | ||||
| Associate General Counsel, Franklin Templeton Investments; Vice President and Corporate Secretary, Fiduciary Trust International of the | ||||
| South; Vice President, Templeton Investment Counsel, LLC; Assistant Secretary, Franklin Resources, Inc.; and officer of 45 of the investment | ||||
| companies in Franklin Templeton Investments. | ||||
| Robert C. Rosselot (1960) | Chief | Since 2013 | Not Applicable | Not Applicable |
| 300 S.E. 2nd Street | Compliance | |||
| Fort Lauderdale, FL 33301-1923 | Officer | |||
| Principal Occupation During at Least the Past 5 Years: | ||||
| Director, Global Compliance, Franklin Templeton Investments; Vice President, Franklin Templeton Companies, LLC; officer of 45 of the | ||||
| investment companies in Franklin Templeton Investments; and formerly, Senior Associate General Counsel, Franklin Templeton Investments | ||||
| (2007-2013); and Secretary and Vice President, Templeton Group of Funds (2004-2013). | ||||
| Karen L. Skidmore (1952) | Vice President | Since 2006 | Not Applicable | Not Applicable |
| One Franklin Parkway | and Secretary | |||
| San Mateo, CA 94403-1906 | ||||
| Principal Occupation During at Least the Past 5 Years: | ||||
| Senior Associate General Counsel, Franklin Templeton Investments; and officer of 45 of the investment companies in Franklin Templeton | ||||
| Investments. | ||||
| Navid Tofigh (1972) | Vice President | Since November | Not Applicable | Not Applicable |
| One Franklin Parkway | 2005 | |||
| San Mateo, CA 94403-1906 | ||||
| Principal Occupation During at Least the Past 5 Years: | ||||
| Associate General Counsel, Franklin Templeton Investments; and officer of 45 of the investment companies in Franklin Templeton Investments. | ||||
| Craig S. Tyle (1960) | Vice President | Since 2005 | Not Applicable | Not Applicable |
| One Franklin Parkway | ||||
| San Mateo, CA 94403-1906 | ||||
| Principal Occupation During at Least the Past 5 Years: | ||||
| General Counsel and Executive Vice President, Franklin Resources, Inc.; and officer of some of the other subsidiaries of Franklin Resources, | ||||
| Inc. and of 45 of the investment companies in Franklin Templeton Investments. | ||||
| Lori A. Weber (1964) | Vice President | Since 2011 | Not Applicable | Not Applicable |
| 300 S.E. 2nd Street | ||||
| Fort Lauderdale, FL 33301-1923 | ||||
| Principal Occupation During at Least the Past 5 Years: | ||||
| Senior Associate General Counsel, Franklin Templeton Investments; Assistant Secretary, Franklin Resources, Inc.; Vice President and | ||||
| Secretary, Templeton Investment Counsel, LLC; and officer of 45 of the investment companies in Franklin Templeton Investments. | ||||
*We base the number of portfolios on each separate series of the U.S. registered investment companies within the Franklin Templeton Investments fund complex. These
portfolios have a common investment manager or affiliated investment managers.
**Gregory E. Johnson is considered to be an interested person of the Fund under the federal securities laws due to his position as an officer and director ofFranklin
Resources, Inc. (Resources), which is the parent company of the Fund’s investment manager and distributor. Rupert H. Johnson, Jr. is considered to be an interested person
of the Fund under the federal securities laws due to his position as officer and director and major shareholder of Resources.
Note 1: Rupert H. Johnson, Jr. is the uncle of Gregory E. Johnson.
Note 2: Officer information is current as of the date of this report. It is possible that after this date, information about officers may change.
The Sarbanes-Oxley Act of 2002 and Rules adopted by the Securities and Exchange Commission require the Fund to disclose whether the Fund’s Audit
Committee includes at least one member who is an audit committee financial expert within the meaning of such Act and Rules. The Fund’s Board has determined
that there is at least one such financial expert on the Audit Committee and has designated John B. Wilson as its audit committee financial expert. The Board
believes that Mr. Wilson qualifies as such an expert in view of his extensive business background and experience, including service as chief financial officer of
Staples, Inc. from 1992 to 1996. Mr. Wilson has been a Member and Chairman of the Fund’s Audit Committee since 2006. As a result of such background and
franklintempleton.com
Annual Report
63
FRANKLIN STRATEGIC SERIES
Interested Board Members and Officers (continued)
experience, the Board believes that Mr. Wilson has acquired an understanding of generally accepted accounting principles and financial statements, the general application of such principles in connection with the accounting estimates, accruals and reserves, and analyzing and evaluating financial statements that present a breadth and level of complexity of accounting issues generally comparable to those of the Fund, as well as an understanding of internal controls and procedures for financial reporting and an understanding of audit committee functions. Mr. Wilson is an independent Board member as that term is defined under the relevant Securities and Exchange Commission Rules and Releases.
The Statement of Additional Information (SAI) includes additional information about the board members and is available, without charge, upon request.
Shareholders may call (800) DIAL BEN/342-5236 to request the SAI.
64 Annual Report
franklintempleton.com
FRANKLIN STRATEGIC SERIES
FRANKLIN STRATEGIC INCOME FUND
Shareholder Information
Board Review of Investment Management Agreement
At a meeting held April 12, 2016, the Board of Trustees (Board), including a majority of trustees that are not “interested persons” as such term is defined in section 2(a)(19) of the Investment Company Act of 1940 (hereinafter referred to as “non-interested Trustees” or “independent Trustees”), approved renewal of the investment management agreement for each of the separate funds within the Trust (Fund(s)). In reaching this decision, the Board took into account information furnished throughout the year at regular Board meetings, as well as information prepared specifically in connection with the annual renewal review process. Information furnished and discussed throughout the year included investment performance reports and related financial information for the Fund, along with periodic reports on expenses, shareholder services, legal and compliance matters, risk control, pricing, brokerage commissions and execution, and other services provided by the Investment Manager (Manager) and its affiliates, as well as marketing support payments made to financial intermediaries. Information furnished specifically in connection with the renewal process included a report for each Fund prepared by Broadridge Financial Solutions, Inc. (Broadridge), an independent organization, as well as additional material, including a Fund profitability analysis prepared by management. The Broadridge reports, which utilize data from Lipper, Inc. (Lipper), compared each Fund’s investment performance and expenses with those of other mutual funds deemed comparable to the Fund as selected by Lipper. The Fund profitability analysis discussed the profitability to Franklin Templeton Investments (FTI) from its overall U.S. fund operations, as well as on an individual fund-by-fund basis. Additional material accompanying such profitability analysis included information on a fund-by-fund basis listing portfolio managers and other accounts they manage, as well as information on management fees charged by the Manager and its affiliates to U.S. mutual funds and other accounts, including management’s explanation of differences where relevant. Such material also included a memorandum prepared by management describing project initiatives and capital investments relating to the services provided to the Funds by the FTI organization, as well as a memorandum relating to economies of scale and an analysis concerning transfer agent fees charged by an affiliate of the Manager. The Board also received a report on all marketing support payments made by FTI to financial intermediaries during the past year, as well as a memorandum relating to third-party servicing arrangements in response to a Guidance Update from the U.S. Securities and Exchange Commission (SEC) relating to mutual fund distribution and sub-accounting fees.
In considering such materials, the independent Trustees received assistance and advice from and met separately with independent counsel. While the investment management agreements for all Funds were considered at the same Board meeting, the Board dealt with each Fund separately. In approving continuance of the investment management agreement for each Fund, the Board, including a majority of independent Trustees, determined that the existing management fee structure was fair and reasonable and that continuance of the investment management agreement was in the best interests of such Fund and its shareholders. While attention was given to all information furnished, the following discusses some primary factors relevant to the Board’s decision.
NATURE, EXTENT AND QUALITY OF SERVICES. The Board was satisfied with the nature and quality of the overall services provided by the Manager and its affiliates to the Funds and their shareholders, except as noted later in the discussion of investment performance and expenses. The Board’s opinion was based, in part, upon periodic reports furnished it showing that the investment policies and restrictions for the Fund were consistently complied with as well as other reports periodically furnished the Board covering matters such as the compliance of portfolio managers and other management personnel with the code of ethics adopted throughout the Franklin Templeton fund complex, the adherence to fair value pricing procedures established by the Board, and the accuracy of net asset value calculations. The Board also noted the extent of benefits provided Fund shareholders from being part of the Franklin Templeton family of funds, including the right to exchange investments between the same class of shares of different funds without a sales charge, the ability to reinvest Fund dividends into other funds and the right to combine holdings in other funds to obtain a reduced sales charge. Favorable consideration was given to management’s continual efforts and expenditures in establishing effective business continuity plans and developing strategies to address cybersecurity threats. Additionally, the Board noted the Manager’s continued attention to pricing and valuation issues, particularly with respect to complex securities. Among other factors taken into
franklintempleton.com
Annual Report
65
FRANKLIN STRATEGIC SERIES FRANKLIN STRATEGIC INCOME FUND SHAREHOLDER INFORMATION
account by the Board were the Manager’s best execution trading policies, including a favorable report by an independent portfolio trading analytical firm that also covered FOREX transactions. Consideration was also given to the experience of the Fund’s portfolio management team, the number of accounts managed and general method of compensation. In this latter respect, the Board noted that a primary factor in management’s determination of a portfolio manager’s bonus compensation was the relative investment performance of the funds he or she managed and that a portion of such bonus was required to be invested in a pre-designated list of funds within such person’s fund management area so as to be aligned with the interests of shareholders. The Board also took into account the quality of transfer agent and shareholder services provided Fund shareholders by an affiliate of the Manager and steps taken by FTI to enhance analytical support to the investment management groups and provide additional oversight of liquidity risk and complex securities. The Board also took into account, among other things, management’s efforts in establishing a global credit facility for the benefit of the Fund and other accounts managed by FTI to provide a source of cash for temporary and emergency purposes or to meet unusual redemption requests as well as the strong financial position of the Manager’s parent company and its commitment to the mutual fund business as evidenced by its continued introduction of new funds and reassessment of the fund offerings in response to the market environment.
INVESTMENT PERFORMANCE. The Board placed significant emphasis on the investment performance of the Fund in view of its importance to shareholders. While consideration was given to performance reports and discussions with portfolio managers at Board meetings throughout the year, particular attention in assessing performance was given to the Broadridge reports furnished for the agreement renewals. The Broadridge reports prepared for the Fund showed the investment performance of its Class A shares in comparison to a performance universe selected by Lipper. Comparative performance for the Fund was shown for the one-year period ended January 31, 2016, and previous periods ended that date of up to 10 years depending on when a particular Fund commenced operations. The following summarizes the performance results for the Fund and the Board’s view of such performance.
The performance universe for this Fund consisted of the Fund and all retail and institutional multi-sector income funds as selected by Lipper. The Broadridge report comparison showed the Fund’s income return for the one-year period to be in the second-highest quintile of its Lipper performance universe, and on an annualized basis to be in the highest quintile of such universe for the previous three-year period, the second-highest quintile of such universe during the previous five-year period, and the highest quintile of such universe during the previous 10-year period. The Broadridge report showed the Fund’s total return for the one-year period to be in the lowest performing quintile of its performance universe, and on an annualized basis to be in the second-lowest performing quintile of such universe for the previous three- and five-year periods, and the middle performing quintile of such universe for the previous 10-year period. The Board was satisfied with the Fund’s investment performance as set forth in the Broadridge report given its income oriented investment objective.
COMPARATIVE EXPENSES. Consideration was given to the management fees and total expense ratio of the Fund compared with those of a group of other funds selected by Lipper as its appropriate Lipper expense group. Lipper expense data is based upon information taken from the Fund’s most recent annual report, which reflects historical asset levels that may be quite different from those currently existing, particularly in a period of market volatility. While recognizing such inherent limitation and the fact that expense ratios generally increase as assets decline and decrease as assets grow, the Board believed the independent analysis conducted by Lipper to be an appropriate measure of comparative expenses. In reviewing comparative costs, Lipper provides information on the Fund’s contractual investment management fee in comparison with the investment management fee that would have been charged by other funds within its Lipper expense group assuming they were similar in size to the Fund, as well as the actual total expense ratio of the Fund in comparison with those of its Lipper expense group. The Lipper contractual investment management fee analysis includes administrative charges as being part of the investment management fee, and actual total expenses, for comparative consistency, are shown by Lipper for Fund Class A shares for funds with multiple classes of shares. The results of such expense comparisons showed the contractual investment
66 Annual Report
franklintempleton.com
FRANKLIN STRATEGIC SERIES
FRANKLIN STRATEGIC INCOME FUND
SHAREHOLDER INFORMATION
management fee rates and actual total expense ratios for Franklin Strategic Income Fund to be in the least expensive quintile of their respective Lipper expense groups. The Board was satisfied with the contractual management fee rate and total expense ratio of the Fund in comparison to its expense group as shown in the Broadridge reports, noting that this Fund benefited from fee waivers.
MANAGEMENT PROFITABILITY. The Board also considered the level of profits realized by the Manager and its affiliates in connection with the operation of the Fund. In this respect, the Board reviewed the Fund profitability analysis that addresses the overall profitability of Franklin Templeton’s U.S. fund business, as well as its profits in providing management and other services to the Fund during the 12-month period ended September 30, 2015, being the most recent fiscal year end for Franklin Resources, Inc., the Manager’s parent. In reviewing the analysis, the Board recognized that allocation methodologies are inherently subjective and various allocation methodologies may be reasonable while producing different results. In this respect, the Board noted that while management continually makes refinements to its methodologies in response to organizational and product related changes, the overall approach as defined by the primary drivers and activity measurements has remained consistent with that used in the Funds’ profitability report presentations from prior years. Additionally, the Funds’ independent registered public accounting firm had been engaged by the Manager to periodically review the reasonableness of the allocation methodologies to be used solely by the Funds’ Board in reference to the profitability analysis. In reviewing and discussing such analysis, management discussed with the Board its belief that costs incurred in establishing the infrastructure necessary for the type of mutual fund operations conducted by the Manager and its affiliates may not be fully reflected in the expenses allocated to the Fund in determining its profitability, as well as the fact that the level of profits, to a certain extent, reflected operational cost savings and efficiencies initiated by management. The Board also took into account management’s expenditures in improving shareholder services provided the Funds, as well as the need to implement systems and meet additional regulatory and compliance requirements resulting from statutes such as the Sarbanes-Oxley and Dodd-Frank Acts and recent SEC and other regulatory requirements. In addition, the Board considered a third-party study comparing the profitability of the Manager’s parent on an overall basis to other publicly held managers broken down to show profitability from management operations exclusive of distribution expenses, as well as profitability including distribution expenses. The Board also considered the extent to which the Manager and its affiliates might derive ancillary benefits from fund operations, including revenues generated from transfer agent services, potential benefits resulting from personnel and systems enhancements necessitated by fund growth, as well as increased leverage with the service providers and counterparties, allocation of fund brokerage and the use of commission dollars to pay for research. Based upon its consideration of all these factors, the Board determined that the level of profits realized by the Manager and its affiliates from providing services to the Fund was not excessive in view of the nature, quality and extent of services provided.
ECONOMIES OF SCALE. The Board also considered whether economies of scale are realized by the Manager as the Funds grow larger and the extent to which this is reflected in the level of management fees charged. While recognizing that any precise determination is inherently subjective, the Board noted that based upon the Fund profitability analysis, it appears that as some funds get larger, at some point economies of scale do result in the Manager realizing a larger profit margin on management services provided such a fund. The Board noted that economies of scale were shared with the Fund and its shareholders through management fee breakpoints so that as a fund grows in size, its effective management fee rate declines. The fee structure under the investment management agreement for the Fund contains breakpoints that continued to asset levels that exceeded its asset size at December 31, 2015. In view of such fee structure and the favorable expense comparisons of the Fund within its respective expense group, the Board believed that to the extent economies of scale may be realized by the Manager of the Funds and its affiliates, that there was a sharing of benefits with the Funds and their shareholders.
franklintempleton.com
Annual Report
67
FRANKLIN STRATEGIC SERIES FRANKLIN STRATEGIC INCOME FUND SHAREHOLDER INFORMATION
Proxy Voting Policies and Procedures
The Fund’s investment manager has established Proxy Voting Policies and Procedures (Policies) that the Fund uses to determine how to vote proxies relating to portfolio securities. Shareholders may view the Fund’s complete Policies online at franklintempleton.com. Alternatively, shareholders may request copies of the Policies free of charge by calling the Proxy Group collect at (954) 527-7678 or by sending a written request to: Franklin Templeton Companies, LLC, 300 S.E. 2nd Street, Fort Lauderdale, FL 33301, Attention: Proxy Group. Copies of the Fund’s proxy voting records are also made available online at franklintempleton.com and posted on the U.S. Securities and Exchange Commission’s website at sec.gov and reflect the most recent 12-month period ended June 30.
Quarterly Statement of Investments
The Trust, on behalf of the Fund, files a complete statement of investments with the U.S. Securities and Exchange Commission for the first and third quarters for each fiscal year on Form N-Q. Shareholders may view the filed Form N-Q by visiting the Commission’s website at sec.gov. The filed form may also be viewed and copied at the Commission’s Public Reference Room in Washington, DC. Information regarding the operations of the Public Reference Room may be obtained by calling (800) SEC-0330.
Householding of Reports and Prospectuses
You will receive the Fund’s financial reports every six months as well as an annual updated summary prospectus (prospectus available upon request). To reduce Fund expenses, we try to identify related shareholders in a household and send only one copy of the financial reports and summary prospectus. This process, called “householding,” will continue indefinitely unless you instruct us otherwise. If you prefer not to have these documents householded, please call us at (800) 632-2301. At any time you may view current prospectuses/summary prospectuses and financial reports on our website. If you choose, you may receive these documents through electronic delivery.
68 Annual Report
franklintempleton.com
| Contents | |
| Annual Report | |
| Franklin Global Government Bond Fund | 3 |
| Performance Summary | 7 |
| Your Fund’s Expenses | 12 |
| Financial Highlights and Statement of Investments | 14 |
| FinancialStatements | 21 |
| Notes to Financial Statements | 25 |
| Report of Independent Registered | |
| Public Accounting Firm | 35 |
| Board Members and Officers | 36 |
| Shareholder Information | 41 |
Visit franklintempleton.com for fund updates, to access your account, or to find helpful financial planning tools.
2 Annual Report
franklintempleton.com
Annual Report
Franklin Global Government Bond Fund
This annual report for Franklin Global Government Bond Fund covers the fiscal year ended April 30, 2016.
Your Fund’s Goal and Main Investments
The Fund seeks total return, consisting of interest income and capital appreciation. Under normal market conditions, the Fund invests at least 80% of its net assets in "government bonds" of issuers located around the world. Government bonds include floating and fixed-rate debt securities of any maturity, such as bonds, notes, bills and debentures, issued or guaranteed by governments, government agencies or instrumentalities, including government-sponsored entities, supra-national entities and public-private partnerships.
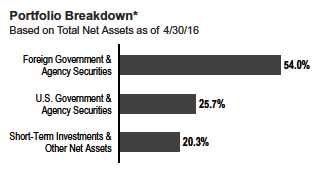
*Figures reflect certain derivatives held in the portfolio (or their underlying reference assets) and may not total 100% or may be negative due to rounding, use of derivatives, unsettled trades or other factors.
Performance Overview
For the 12 months under review, the Fund’s Class A shares had a -0.44% cumulative total return. In comparison, global government bonds, as measured by the Fund’s benchmark, the Citigroup World Government Bond Index (WGBI), posted a +6.09% cumulative total return for the same period.1 You can find more of the Fund’s performance data in the Performance Summary beginning on page 7.
Performance data represent past performance, which does not guarantee future results. Investment return and principal value will fluctuate, and you may have a gain or loss when you sell your shares. Current performance may differ from figures shown. For most recent month-end performance, go to franklintempleton.com or call (800) 342-5236.
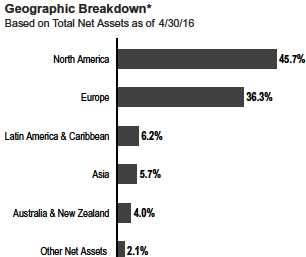
*Figures reflect certain derivatives held in the portfolio (or their underlying reference
assets) and may not total 100% or may be negative due to rounding, use of
derivatives, unsettled trades or other factors.
Economic and Market Overview
During the 12 months under review, global government bonds performed strongly, as measured by the Citigroup WGBI, although market volatility was elevated for much of the period. Initially, signs of improvement in the economic backdrop of both the eurozone and the U.S. prompted a rise in global government bond yields. The U.S. economy promptly recovered from a weather-related setback at the start of 2015 and the U.S. Federal Reserve (Fed) indicated that an increase in U.S. policy rates was growing increasingly likely, helping to push U.S. Treasury yields sharply higher by mid-2015.
1. Source: Morningstar.
The index is unmanaged and includes reinvestment of any income or distributions. It does not reflect any fees, expenses or sales charges. One cannot invest directly in an
index, and an index is not representative of the Fund’s portfolio.
See www.franklintempletondatasources.com for additional data provider information.
The dollar value, number of shares or principal amount, and names of all portfolio holdings are listed in the Fund’s Statement of Investments (SOI).
The SOI begins on page 19.
franklintempleton.com
Annual Report
3
FRANKLIN GLOBAL GOVERNMENT BOND FUND
The change in investor sentiment on the economic outlook led to particular weakness in German bunds and also sparked a rebound in the previously weak euro. Against this backdrop, investors initially showed few signs of concern about a lack of progress in negotiations on a further bailout for Greece. However, as relations between Greece and its creditors deteriorated, the moves in the euro and eurozone bonds partially reversed. A last-minute deal to secure a bailout was finally made in July 2015.
During 2015’s third quarter, investors’ attention was drawn to China, where a devaluation of the Chinese renminbi raised fears that a slowdown in China’s economy might be more pronounced than previously thought. Citing such concerns and the possible adverse effects on the global economy, the Fed refrained from raising U.S. interest rates at its September 2015 meeting. Although the global backdrop remained sluggish, the continued strength of the U.S. labor market and spending by U.S. consumers persuaded the Fed to act in December 2015, raising U.S. policy rates for the first time in nearly 10 years. By the time the Fed confirmed the rate increase, policymakers had already signaled their intentions to the extent that bond markets had more or less discounted the move.
Europe presented a sharply contrasting picture to the U.S., and in December 2015, the European Central Bank (ECB) eased monetary policy to bolster the region’s weak recovery. Ahead of the ECB’s decision, eurozone government bond yields had moved steadily lower as market expectations ramped up significantly, with widespread predictions of a more aggressive policy move, but the announcement of a more limited set of measures prompted a moderate sell-off as expectations were realigned.
At the start of 2016, markets became highly volatile, unsettled by renewed concerns about China, weakening global economic growth and tightening financial conditions, which were seen as potentially tipping the U.S. economy into recession. Oil prices reached their lowest levels for more than a decade by February 2016, while U.S. Treasury yields also declined to multi-year lows, and, as the possibility of further increases in U.S. policy rates appeared to recede, the U.S. dollar weakened. The Bank of Japan’s (BOJ’s) surprise decision to adopt negative interest rates sparked a sharp rally in the Japanese yen, as risk aversion increased and investors doubted whether the BOJ’s new policy would prove effective.
However, onwards from February 2016, robust data about the U.S. labor market and consumers increased confidence that these key drivers of the U.S. economy remained intact. Along with greater stability in oil prices, the data revealed U.S.
Treasuries giving up some of their gains. Although the likelihood of higher U.S. policy rates seemed to have increased, such sentiment was dented by unexpected comments from the Fed in March 2016 implying that it might not raise interest rates in the near future due to ongoing global economic uncertainty, which lead to further U.S. dollar weakness. As had been widely predicted, the ECB unveiled a further set of monetary-easing measures to stimulate the eurozone economy, although the impact was limited, since eurozone bond yields had already declined significantly ahead of the ECB’s announcement.
Dividend Distributions
5/1/15–4/30/16
| Dividend per Share (cents) | |||||
| Advisor | |||||
| Month | Class A | Class C | Class R | Class R6 | Class |
| May | 2.16 | 1.69 | 1.79 | 2.25 | 2.23 |
| June | 1.91 | 1.46 | 1.60 | 1.98 | 1.98 |
| July | 1.95 | 1.41 | 1.55 | 1.94 | 1.94 |
| August | 1.79 | 1.29 | 1.41 | 1.82 | 1.82 |
| September | 1.70 | 1.24 | 1.33 | 1.75 | 1.75 |
| October | 1.59 | 1.10 | 1.24 | 1.64 | 1.63 |
| November | 1.48 | 1.03 | 1.32 | 1.51 | 1.51 |
| December | 1.18 | 0.69 | 1.03 | 1.22 | 1.22 |
| January | 1.10 | 0.66 | 0.98 | 1.17 | 1.18 |
| February | 0.97 | 0.53 | 0.81 | 1.01 | 1.02 |
| March | 0.83 | 0.35 | 0.52 | 0.88 | 0.87 |
| April | 0.68 | 0.25 | 0.31 | 0.74 | 0.73 |
| Total | 17.34 | 11.70 | 13.89 | 17.91 | 17.88 |
*The distribution amount is the sum of the dividend payments to shareholders for
the period shown and includes only estimated tax-basis net investment income. All
Fund distributions will vary depending upon current market conditions, and past
distributions are not indicative of future trends.
Investment Strategy
We invest selectively in bonds around the world based upon our assessment of changing market, political and economic conditions. While seeking opportunities, we consider various factors including interest rates, currency exchange rates and credit risks. We use top-down macroeconomic research, bottom-up sector-specific research and quantitative analysis to identify and to seek to exploit market inefficiencies while employing a disciplined risk management process. We may use various currency-related derivative instruments, including currency forward and currency futures contracts, as well as various interest rate/bond-related derivative instruments, including interest rate/bond futures contracts and swap agreements.
4 Annual Report
franklintempleton.com
FRANKLIN GLOBAL GOVERNMENT BOND FUND
What is a currency forward contract?
A currency forward contract is an agreement between the Fund and a counterparty to buy or sell a foreign currency in exchange for another currency at a specific exchange rate on a future date.
What is a futures contract?
A futures contract, or a future, is an agreement between the Fund and a counterparty made through a U.S. or foreign futures exchange to buy or sell an asset at a specific price on a future date.
What are swap agreements?
Swap agreements, such as interest rate, currency and credit default swaps, are contracts between the Fund and, typically, a brokerage firm, bank, or other financial institution (the swap counterparty). In a basic swap transaction, the Fund agrees with its counterparty to exchange the returns (or differentials in rates of return) earned or realized on a particular notional amount of underlying instruments. The notional amount is the set amount selected by the parties as the basis on which to calculate the obligations that they have agreed to exchange. The parties typically do not actually exchange the notional amount. Instead, they agree to exchange the returns that would be earned or realized if the notional amount were invested in given instruments or given interest rates.
Manager’s Discussion
During the 12 months ended April 30, 2016, the Fund underperformed its benchmark, the Citigroup WGBI. The Fund’s currency allocation was a key detractor from relative performance, while positions denominated in currencies other than the U.S. dollar, euro, Japanese yen and British pound also detracted. However, security selection among government bonds contributed to relative results.
The Fund’s currency positioning detracted from relative performance, mainly due to an underweighted allocation to the stronger Japanese yen. An overweighted exposure to the Mexican peso—which weakened, along with many other emerging market currencies, as global economic growth slowed and commodities declined—also hurt relative returns.
| Currency Breakdown* | ||
| 4/30/16 | ||
| % of Total | ||
| Net Assets | ||
| North America | 76.2 | % |
| U.S. Dollar | 74.3 | % |
| Canadian Dollar | 1.9 | % |
| Europe | 20.4 | % |
| Euro | 15.1 | % |
| British Pound Sterling | 5.5 | % |
| Polish Zloty | -0.2 | % |
| Latin America & Caribbean | 3.0 | % |
| Mexican Peso | 3.0 | % |
| Asia | 0.3 | % |
| Malaysian Ringgit | 0.2 | % |
| Singapore Dollar | 0.1 | % |
| Australia & New Zealand | 0.1 | % |
| Australian Dollar | 0.1 | % |
*Figures reflect certain derivatives held in the portfolio (or their underlying reference
assets) and may not total 100% or may be negative due to rounding, use of
derivatives, unsettled trades or other factors.
The Fund’s underweighted duration positioning in Japanese government bonds held back relative performance, following the strong performance of the Japanese sovereign bond market in the wake of the BOJ’s introduction of negative interest rates in January 2016.
What is duration?
Duration is a measure of a bond’s price sensitivity to interest rate changes. In general, a portfolio of securities with a lower duration can be expected to be less sensitive to interest rate changes than a portfolio with a higher duration.
The Fund’s exposure to emerging market bonds also weighed on relative returns, although this was more than offset by the positive impact of security selection in this area and among other government bonds.
franklintempleton.com
Annual Report
5
FRANKLIN GLOBAL GOVERNMENT BOND FUND
Thank you for your participation in Franklin Global Government Bond Fund. We look forward to serving your future investment needs.

The foregoing information reflects our analysis, opinions and portfolio holdings as of April 30, 2016, the end of the reporting period. The way we implement our main investment strategies and the resulting portfolio holdings may change depending on factors such as market and economic conditions. These opinions may not be relied upon as investment advice or an offer for a particular security. The information is not a complete analysis of every aspect of any market, country, industry, security or the Fund. Statements of fact are from sources considered reliable, but the investment manager makes no representation or warranty as to their completeness or accuracy. Although historical performance is no guarantee of future results, these insights may help you understand our investment management philosophy.
6 Annual Report
franklintempleton.com
FRANKLIN GLOBAL GOVERNMENT BOND FUND
Performance Summary as of April 30, 2016
Your dividend income will vary depending on dividends or interest paid by securities in the Fund’s portfolio, adjusted for operating expenses of each class. Capital gain distributions are net profits realized from the sale of portfolio securities. The performance tables and graphs do not reflect any taxes that a shareholder would pay on Fund dividends, capital gain distributions, if any, or any realized gains on the sale of Fund shares. Total return reflects reinvestment of the Fund’s dividends and capital gain distributions, if any, and any unrealized gains or losses.
| Net Asset Value | ||||||
| Share Class (Symbol) | 4/30/16 | 4/30/15 | Change | |||
| A (FGGAX) | $ | 9.59 | $ | 9.81 | -$ | 0.22 |
| C (N/A) | $ | 9.57 | $ | 9.79 | -$ | 0.22 |
| R (N/A) | $ | 9.58 | $ | 9.80 | -$ | 0.22 |
| R6 (N/A) | $ | 9.59 | $ | 9.81 | -$ | 0.22 |
| Advisor (N/A) | $ | 9.61 | $ | 9.83 | -$ | 0.22 |
| Distributions1 (5/1/15–4/30/16) | ||||||
| Dividend | ||||||
| Share Class | Income | |||||
| A | $ | 0.1734 | ||||
| C | $ | 0.1170 | ||||
| R | $ | 0.1389 | ||||
| R6 | $ | 0.1791 | ||||
| Advisor | $ | 0.1788 | ||||
See page 11 for Performance Summary footnotes.
franklintempleton.com
Annual Report
7
FRANKLIN GLOBAL GOVERNMENT BOND FUND
PERFORMANCE SUMMARY
Performance as of 4/30/162
Cumulative total return excludes sales charges. Average annual total returns include maximum sales charges. Class A: 4.25% maximum initial sales charge; Class C: 1% contingent deferred sales charge in first year only; Class R/R6/Advisor Class: no sales charges.
| Cumulative | Average Annual | Average Annual | Total Annual Operating Expenses6 | |||||||
| Share Class | Total Return3 | Total Return4 | Total Return (3/31/16)5 | (with waiver) | (without waiver) | |||||
| A | 0.85 | % | 2.55 | % | ||||||
| 1-Year | -0.44 | % | -4.71 | % | -4.94 | % | ||||
| Since Inception (9/6/13) | +4.67 | % | +0.10 | % | +0.11 | % | ||||
| C | 1.25 | % | 2.95 | % | ||||||
| 1-Year | -1.03 | % | -2.01 | % | -2.26 | % | ||||
| Since Inception (9/6/13) | +2.98 | % | +1.11 | % | +1.22 | % | ||||
| R | 1.10 | % | 2.80 | % | ||||||
| 1-Year | -0.90 | % | -0.90 | % | -1.06 | % | ||||
| Since Inception (9/6/13) | +3.44 | % | +1.29 | % | +1.40 | % | ||||
| R6 | 0.59 | % | 3.04 | % | ||||||
| 1-Year | -0.38 | % | -0.38 | % | -0.64 | % | ||||
| Since Inception (9/6/13) | +4.86 | % | +1.81 | % | +1.88 | % | ||||
| Advisor | 0.60 | % | 2.30 | % | ||||||
| 1-Year | -0.38 | % | -0.38 | % | -0.54 | % | ||||
| Since Inception (9/6/13) | +5.15 | % | +1.91 | % | +2.03 | % | ||||
| Distribution | 30-Day Standardized Yield8 | |||||
| Share Class | Rate7 | (with waiver) | (without waiver) | |||
| A | 0.81 | % | 0.57 | % | -0.58 | % |
| C | 0.31 | % | 0.02 | % | -1.18 | % |
| R | 0.39 | % | 0.16 | % | -1.04 | % |
| R6 | 0.93 | % | 0.68 | % | -0.45 | % |
| Advisor | 0.91 | % | 0.67 | % | -0.53 | % |
Performance data represent past performance, which does not guarantee future results. Investment return and principal value will fluctuate, and you may have a gain or loss when you sell your shares. Current performance may differ from figures shown. For most recent month-end performance, go to franklintempleton.com or call (800) 342-5236.
See page 11 for Performance Summary footnotes.
8 Annual Report
franklintempleton.com
FRANKLIN GLOBAL GOVERNMENT BOND FUND
PERFORMANCE SUMMARY
Total Return Index Comparison for a Hypothetical $10,000 Investment2
Total return represents the change in value of an investment over the periods shown. It includes any applicable maximum sales charge, Fund expenses, account fees and reinvested distributions. The unmanaged index includes reinvestment of any income or distributions. It differs from the Fund in composition and does not pay management fees or expenses. One cannot invest directly in an index.
See page 11 for Performance Summary footnotes.
franklintempleton.com
Annual Report
9
FRANKLIN GLOBAL GOVERNMENT BOND FUND
PERFORMANCE SUMMARY
Total Return Index Comparison for a Hypothetical $10,000 Investment2 (continued)
See page 11 for Performance Summary footnotes.
10 Annual Report
franklintempleton.com
FRANKLIN GLOBAL GOVERNMENT BOND FUND
PERFORMANCE SUMMARY
Total Return Index Comparison for a Hypothetical $10,000 Investment2 (continued)
All investments involve risks, including possible loss of principal. Special risks are associated with investing in foreign securities, including risks associated with
political and economic developments, trading practices, availability of information, limited markets and currency exchange rate fluctuations and policies.
Sovereign debt securities are subject to various risks in addition to those relating to debt securities and foreign securities generally, including, but not limited to,
the risk that a governmental entity may be unwilling or unable to pay interest and repay principal on its sovereign debt. Investments in emerging market countries
are subject to all of the risks of foreign investing generally and have additional heightened risks due to a lack of established legal, political, business and social
frameworks to support securities markets. Changes in interest rates will affect the value of the Fund’s portfolio and its share price and yield. Bond prices
generally move in the opposite direction of interest rates. Thus, as prices of bonds in the Fund adjust to a rise in interest rates, the Fund’s share price may
decline. Changes in the financial strength of a bond issuer or in a bond’s credit rating may affect its value. The market values of securities or other investments
owned by the Fund will go up or down, sometimes rapidly or unpredictably. Derivatives, including currency management strategies, involve costs and can create
economic leverage in the portfolio that may result in significant volatility and cause the Fund to participate in losses (as well as gains) in an amount that exceeds
the Fund’s initial investment. The Fund may not achieve the anticipated benefits and may realize losses when a counterparty fails to perform as promised. The
Fund is also nondiversified, which involves the risk of greater price fluctuation than a more diversified portfolio. The Fund is actively managed but thereisno
guarantee that the manager’s investment decisions will produce the desired results. The Fund’s prospectus also includes a description of the main investment
risks.
| Class C: | These shares have higher annual fees and expenses than Class A shares. |
| Class R: | Shares are available to certain eligible investors as described in the prospectus. These shares have higher annual fees and expenses than Class A shares. |
| Class R6: | Shares are available to certain eligible investors as described in the prospectus. |
| Advisor Class: | Shares are available to certain eligible investors as described in the prospectus. |
1. The distribution amount is the sum of the dividend payments to shareholders for the period shown and includes only estimated tax-basis net investment income.
2. The Fund has an expense reduction contractually guaranteed through at least 8/31/16 and a fee waiver associated with any investments in a Franklin Templeton money fund,
contractually guaranteed through at least its current fiscal year-end. The transfer agent has contractually agreed to cap transfer agency fees for Class R6 shares so that transfer
agency fees for that class do not exceed 0.01% until at least 8/31/16. Fund investment results reflect the expense reduction, fee waiver and fee cap, to the extent applicable;
without these reductions, the results would have been lower.
3. Cumulative total return represents the change in value of an investment over the periods indicated.
4. Average annual total return represents the average annual change in value of an investment over the periods indicated. Return for less than one year, ifany,hasnotbeen
annualized.
5. In accordance with SEC rules, we provide standardized total return information through the latest calendar quarter.
6. Figures are as stated in the Fund’s current prospectus and may differ from the expense ratios disclosed in the Financial Highlights in this report. In periods of market volatility,
assets may decline significantly, causing total annual Fund operating expenses to become higher than the figures shown.
7. Distribution rate is based on an annualization of the respective class’s April dividend and the maximum offering price (NAV for Classes C, R, R6 and Advisor) per share on
4/30/16.
8. The Fund’s 30-day standardized yield is calculated over a trailing 30-day period using the yield to maturity on bonds and/or the dividends accrued on stocks. It may not equal
the Fund’s actual income distribution rate, which reflects the Fund’s past dividends paid to shareholders.
9. Source: Morningstar. The Citigroup WGBI is a market capitalization-weighted index consisting of investment-grade world government bond markets.
See www.franklintempletondatasources.com for additional data provider information.
See page 11 for Performance Summary footnotes.
franklintempleton.com
Annual Report
11
FRANKLIN GLOBAL GOVERNMENT BOND FUND
Your Fund’s Expenses
As a Fund shareholder, you can incur two types of costs:
- Transaction costs, including sales charges (loads) on Fund purchases; and
- Ongoing Fund costs, including management fees, distribution and service (12b-1) fees, and other Fund expenses. All mutual funds have ongoing costs, sometimes referred to as operating expenses.
The following table shows ongoing costs of investing in the Fund and can help you understand these costs and compare them with those of other mutual funds. The table assumes a $1,000 investment held for the six months indicated.
Actual Fund Expenses
The first line (Actual) for each share class listed in the table provides actual account values and expenses. The “Ending Account Value” is derived from the Fund’s actual return, which includes the effect of Fund expenses.
You can estimate the expenses you paid during the period by following these steps. Of course, your account value and expenses will differ from those in this illustration:
| 1. | Divide your account value by $1,000. |
| If an account had an $8,600 value, then $8,600 ÷ $1,000 = 8.6. | |
| 2. | Multiply the result by the number under the heading “Expenses Paid During Period.” |
| If Expenses Paid During Period were $7.50, then 8.6 x $7.50 = $64.50. |
In this illustration, the estimated expenses paid this period are $64.50.
Hypothetical Example for Comparison with Other Funds
Information in the second line (Hypothetical) for each class in the table can help you compare ongoing costs of investing in the Fund with those of other mutual funds. This information may not be used to estimate the actual ending account balance or expenses you paid during the period. The hypothetical “Ending Account Value” is based on the actual expense ratio for each class and an assumed 5% annual rate of return before expenses, which does not represent the Fund’s actual return. The figure under the heading “Expenses Paid During Period” shows the hypothetical expenses your account would have incurred under this scenario. You can compare this figure with the 5% hypothetical examples that appear in shareholder reports of other funds.
Please note that expenses shown in the table are meant to highlight ongoing costs and do not reflect any transaction costs, such as sales charges. Therefore, the second line for each class is useful in comparing ongoing costs only, and will not help you compare total costs of owning different funds. In addition, if transaction costs were included, your total costs would have been higher. Please refer to the Fund prospectus for additional information on operating expenses.
12 Annual Report
franklintempleton.com
| FRANKLIN GLOBAL GOVERNMENT BOND FUND | ||||||
| YOUR FUND’S EXPENSES | ||||||
| Beginning Account | Ending Account | Expenses Paid During | ||||
| Share Class | Value 11/1/15 | Value 4/30/16 | Period* 11/1/15–4/30/16 | |||
| A | ||||||
| Actual | $ | 1,000 | $ | 1,016.20 | $ | 3.46 |
| Hypothetical (5% return before expenses) | $ | 1,000 | $ | 1,021.43 | $ | 3.47 |
| C | ||||||
| Actual | $ | 1,000 | $ | 1,012.20 | $ | 6.25 |
| Hypothetical (5% return before expenses) | $ | 1,000 | $ | 1,018.65 | $ | 6.27 |
| R | ||||||
| Actual | $ | 1,000 | $ | 1,013.80 | $ | 5.36 |
| Hypothetical (5% return before expenses) | $ | 1,000 | $ | 1,019.54 | $ | 5.37 |
| R6 | ||||||
| Actual | $ | 1,000 | $ | 1,016.50 | $ | 2.96 |
| Hypothetical (5% return before expenses) | $ | 1,000 | $ | 1,021.93 | $ | 2.97 |
| Advisor | ||||||
| Actual | $ | 1,000 | $ | 1,015.40 | $ | 3.01 |
| Hypothetical (5% return before expenses) | $ | 1,000 | $ | 1,021.88 | $ | 3.02 |
*Expenses are calculated using the most recent six-month expense ratio, net of expense waivers, annualized for each class (A: 0.69%;
C: 1.25%; R: 1.07%; R6: 0.59%; and Advisor: 0.60%), multiplied by the average account value over the period, multiplied by 182/366 to reflect
the one-half year period.
franklintempleton.com
Annual Report
13
| FRANKLIN STRATEGIC SERIES | |||||||||
| Financial Highlights | |||||||||
| Franklin Global Government Bond Fund | |||||||||
| Year Ended April 30, | |||||||||
| 2016 | 2015 | 2014 | a | ||||||
| Class A | |||||||||
| Per share operating performance | |||||||||
| (for a share outstanding throughout the year) | |||||||||
| Net asset value, beginning of year | $ | 9.81 | $ | 10.45 | $ | 10.00 | |||
| Income from investment operationsb: | |||||||||
| Net investment incomec | 0.12 | 0.17 | 0.11 | ||||||
| Net realized and unrealized gains (losses) | (0.17 | ) | (0.24 | ) | 0.47 | ||||
| Total from investment operations. | (0.05 | ) | (0.07 | ) | 0.58 | ||||
| Less distributions from: | |||||||||
| Net investment income and net foreign currency gains | (0.17 | ) | (0.40 | ) | (0.13 | ) | |||
| Net realized gains | — | (0.17 | ) | — | |||||
| Total distributions | (0.17 | ) | (0.57 | ) | (0.13 | ) | |||
| Net asset value, end of year | $ | 9.59 | $ | 9.81 | $ | 10.45 | |||
| Total returnd | (0.44 | )% | (0.64 | )% | 5.81 | % | |||
| Ratios to average net assetse | |||||||||
| Expenses before waiver and payments by affiliates | 1.98 | % | 2.37 | % | 3.22 | % | |||
| Expenses net of waiver and payments by affiliates | 0.67 | % | 0.64 | % | 0.57 | % | |||
| Net investment income. | 1.23 | % | 1.63 | % | 1.62 | % | |||
| Supplemental data | |||||||||
| Net assets, end of year (000’s) | $ | 13,356 | $ | 11,487 | $ | 11,232 | |||
| Portfolio turnover rate | 37.97 | % | 60.28 | % | 13.24 | % | |||
aFor the period September 6, 2013 (commencement of operations) to April 30, 2014.
bThe amount shown for a share outstanding throughout the period may not correlate with the Statement of Operations for the period due to the timing of sales and
repurchases of the Fund’s shares in relation to income earned and/or fluctuating fair value of the investments of the Fund.
cBased on average daily shares outstanding.
dTotal return does not reflect sales commissions or contingent deferred sales charges, if applicable, and is not annualized for periods less than one year.
eRatios are annualized for periods less than one year.
14 Annual Report | The accompanying notes are an integral part of these financial statements.
franklintempleton.com
| FRANKLIN STRATEGIC SERIES | |||||||||
| FINANCIAL HIGHLIGHTS | |||||||||
| Franklin Global Government Bond Fund (continued) | |||||||||
| Year Ended April 30, | |||||||||
| 2016 | 2015 | 2014 | a | ||||||
| Class C | |||||||||
| Per share operating performance | |||||||||
| (for a share outstanding throughout the year) | |||||||||
| Net asset value, beginning of year | $ | 9.79 | $ | 10.44 | $ | 10.00 | |||
| Income from investment operationsb: | |||||||||
| Net investment incomec | 0.06 | 0.10 | 0.08 | ||||||
| Net realized and unrealized gains (losses) | (0.16 | ) | (0.24 | ) | 0.46 | ||||
| Total from investment operations. | (0.10 | ) | (0.14 | ) | 0.54 | ||||
| Less distributions from: | |||||||||
| Net investment income and net foreign currency gains | (0.12 | ) | (0.34 | ) | (0.10 | ) | |||
| Net realized gains | — | (0.17 | ) | — | |||||
| Total distributions | (0.12 | ) | (0.51 | ) | (0.10 | ) | |||
| Net asset value, end of year | $ | 9.57 | $ | 9.79 | $ | 10.44 | |||
| Total returnd | (1.03 | )% | (1.34 | )% | 5.46 | % | |||
| Ratios to average net assetse | |||||||||
| Expenses before waiver and payments by affiliates | 2.56 | % | 2.95 | % | 3.81 | % | |||
| Expenses net of waiver and payments by affiliates | 1.25 | % | 1.22 | % | 1.16 | % | |||
| Net investment income. | 0.65 | % | 1.05 | % | 1.03 | % | |||
| Supplemental data | |||||||||
| Net assets, end of year (000’s) | $ | 509 | $ | 292 | $ | 156 | |||
| Portfolio turnover rate | 37.97 | % | 60.28 | % | 13.24 | % | |||
aFor the period September 6, 2013 (commencement of operations) to April 30, 2014.
bThe amount shown for a share outstanding throughout the period may not correlate with the Statement of Operations for the period due to the timing of sales and
repurchases of the Fund’s shares in relation to income earned and/or fluctuating fair value of the investments of the Fund.
cBased on average daily shares outstanding.
dTotal return does not reflect sales commissions or contingent deferred sales charges, if applicable, and is not annualized for periods less than one year.
eRatios are annualized for periods less than one year.
franklintempleton.com
The accompanying notes are an integral part of these financial statements. | Annual Report 15
| FRANKLIN STRATEGIC SERIES | |||||||||
| FINANCIAL HIGHLIGHTS | |||||||||
| Franklin Global Government Bond Fund (continued) | |||||||||
| Year Ended April 30, | |||||||||
| 2016 | 2015 | 2014 | a | ||||||
| Class R | |||||||||
| Per share operating performance | |||||||||
| (for a share outstanding throughout the year) | |||||||||
| Net asset value, beginning of year | $ | 9.80 | $ | 10.44 | $ | 10.00 | |||
| Income from investment operationsb: | |||||||||
| Net investment incomec | 0.08 | 0.12 | 0.08 | ||||||
| Net realized and unrealized gains (losses) | (0.16 | ) | (0.23 | ) | 0.47 | ||||
| Total from investment operations. | (0.08 | ) | (0.11 | ) | 0.55 | ||||
| Less distributions from: | |||||||||
| Net investment income and net foreign currency gains | (0.14 | ) | (0.36 | ) | (0.11 | ) | |||
| Net realized gains | — | (0.17 | ) | — | |||||
| Total distributions | (0.14 | ) | (0.53 | ) | (0.11 | ) | |||
| Net asset value, end of year | $ | 9.58 | $ | 9.80 | $ | 10.44 | |||
| Total returnd | (0.90 | )% | (1.07 | )% | 5.52 | % | |||
| Ratios to average net assetse | |||||||||
| Expenses before waiver and payments by affiliates | 2.39 | % | 2.82 | % | 3.66 | % | |||
| Expenses net of waiver and payments by affiliates | 1.08 | % | 1.09 | % | 1.01 | % | |||
| Net investment income. | 0.82 | % | 1.18 | % | 1.18 | % | |||
| Supplemental data | |||||||||
| Net assets, end of year (000’s) | $ | 10 | $ | 10 | $ | 10 | |||
| Portfolio turnover rate | 37.97 | % | 60.28 | % | 13.24 | % | |||
aFor the period September 6, 2013 (commencement of operations) to April 30, 2014.
bThe amount shown for a share outstanding throughout the period may not correlate with the Statement of Operations for the period due to the timing of sales and
repurchases of the Fund’s shares in relation to income earned and/or fluctuating fair value of the investments of the Fund.
cBased on average daily shares outstanding.
dTotal return is not annualized for periods less than one year.
eRatios are annualized for periods less than one year.
16 Annual Report | The accompanying notes are an integral part of these financial statements.
franklintempleton.com
| FRANKLIN STRATEGIC SERIES | |||||||||
| FINANCIAL HIGHLIGHTS | |||||||||
| Franklin Global Government Bond Fund (continued) | |||||||||
| Year Ended April 30, | |||||||||
| 2016 | 2015 | 2014 | a | ||||||
| Class R6 | |||||||||
| Per share operating performance | |||||||||
| (for a share outstanding throughout the year) | |||||||||
| Net asset value, beginning of year | $ | 9.81 | $ | 10.45 | $ | 10.00 | |||
| Income from investment operationsb: | |||||||||
| Net investment incomec | 0.13 | 0.18 | 0.11 | ||||||
| Net realized and unrealized gains (losses) | (0.17 | ) | (0.24 | ) | 0.48 | ||||
| Total from investment operations. | (0.04 | ) | (0.06 | ) | 0.59 | ||||
| Less distributions from: | |||||||||
| Net investment income and net foreign currency gains | (0.18 | ) | (0.41 | ) | (0.14 | ) | |||
| Net realized gains | — | (0.17 | ) | — | |||||
| Total distributions | (0.18 | ) | (0.58 | ) | (0.14 | ) | |||
| Net asset value, end of year | $ | 9.59 | $ | 9.81 | $ | 10.45 | |||
| Total returnd | (0.38 | )% | (0.62 | )% | 5.91 | % | |||
| Ratios to average net assetse | |||||||||
| Expenses before waiver and payments by affiliates | 2.82 | % | 3.04 | % | 3.78 | % | |||
| Expenses net of waiver and payments by affiliates | 0.59 | % | 0.57 | % | 0.51 | % | |||
| Net investment income. | 1.31 | % | 1.70 | % | 1.68 | % | |||
| Supplemental data | |||||||||
| Net assets, end of year (000’s) | $ | 10 | $ | 10 | $ | 10 | |||
| Portfolio turnover rate | 37.97 | % | 60.28 | % | 13.24 | % | |||
aFor the period September 6, 2013 (commencement of operations) to April 30, 2014.
bThe amount shown for a share outstanding throughout the period may not correlate with the Statement of Operations for the period due to the timing of sales and
repurchases of the Fund’s shares in relation to income earned and/or fluctuating fair value of the investments of the Fund.
cBased on average daily shares outstanding.
dTotal return is not annualized for periods less than one year.
eRatios are annualized for periods less than one year.
franklintempleton.com
The accompanying notes are an integral part of these financial statements. | Annual Report 17
| FRANKLIN STRATEGIC SERIES | |||||||||
| FINANCIAL HIGHLIGHTS | |||||||||
| Franklin Global Government Bond Fund (continued) | |||||||||
| Year Ended April 30, | |||||||||
| 2016 | 2015 | 2014 | a | ||||||
| Advisor Class | |||||||||
| Per share operating performance | |||||||||
| (for a share outstanding throughout the year) | |||||||||
| Net asset value, beginning of year | $ | 9.83 | $ | 10.49 | $ | 10.00 | |||
| Income from investment operationsb: | |||||||||
| Net investment incomec | 0.12 | 0.17 | 0.10 | ||||||
| Net realized and unrealized gains (losses) | (0.16 | ) | (0.24 | ) | 0.52 | ||||
| Total from investment operations. | (0.04 | ) | (0.07 | ) | 0.62 | ||||
| Less distributions from: | |||||||||
| Net investment income and net foreign currency gains | (0.18 | ) | (0.42 | ) | (0.13 | ) | |||
| Net realized gains | — | (0.17 | ) | — | |||||
| Total distributions | (0.18 | ) | (0.59 | ) | (0.13 | ) | |||
| Net asset value, end of year | $ | 9.61 | $ | 9.83 | $ | 10.49 | |||
| Total returnd | (0.38 | )% | (0.65 | )% | 6.24 | % | |||
| Ratios to average net assetse | |||||||||
| Expenses before waiver and payments by affiliates | 1.91 | % | 2.30 | % | 3.16 | % | |||
| Expenses net of waiver and payments by affiliates | 0.60 | % | 0.57 | % | 0.51 | % | |||
| Net investment income. | 1.30 | % | 1.70 | % | 1.68 | % | |||
| Supplemental data | |||||||||
| Net assets, end of year (000’s) | $ | 10 | $ | 10 | $ | 10 | |||
| Portfolio turnover rate | 37.97 | % | 60.28 | % | 13.24 | % | |||
aFor the period September 6, 2013 (commencement of operations) to April 30, 2014.
bThe amount shown for a share outstanding throughout the period may not correlate with the Statement of Operations for the period due to the timing of sales and
repurchases of the Fund’s shares in relation to income earned and/or fluctuating fair value of the investments of the Fund.
cBased on average daily shares outstanding.
dTotal return is not annualized for periods less than one year.
eRatios are annualized for periods less than one year.
18 Annual Report | The accompanying notes are an integral part of these financial statements.
franklintempleton.com
FRANKLIN STRATEGIC SERIES
| Statement of Investments, April 30, 2016 | ||||||
| Franklin Global Government Bond Fund | ||||||
| Principal | ||||||
| Country | Amount* | Value | ||||
| Foreign Government and Agency Securities 54.0% | ||||||
| Government of Canada, 2.75%, 6/01/22. | Canada | 300,000 | CAD | $ | 262,999 | |
| Government of Chile, 3.875%, 8/05/20 | Chile | 100,000 | 108,663 | |||
| a Government of Finland, senior bond, Reg S, 2.00%, 4/15/24 | Finland | 350,000 | EUR | 454,831 | ||
| a Government of France, Reg S, 1.00%, 5/25/19 | France | 160,000 | EUR | 190,745 | ||
| a Government of Germany, Reg S, 1.50%, 2/15/23 | Germany | 375,000 | EUR | 477,055 | ||
| a Government of Indonesia, Reg S, 4.875%, 5/05/21 | Indonesia | 200,000 | 217,042 | |||
| a Government of Lithuania, senior note, Reg S, 6.625%, 2/01/22 | Lithuania | 200,000 | 241,816 | |||
| Government of Malaysia, | ||||||
| senior bond, 4.24%, 2/07/18 | Malaysia | 650,000 | MYR | 170,035 | ||
| senior note, 3.654%, 10/31/19 | Malaysia | 550,000 | MYR | 142,119 | ||
| Government of Mexico, | ||||||
| 7.75%, 12/14/17 | Mexico | 30,000 | b | MXN | 184,590 | |
| 8.00%, 12/07/23 | Mexico | 30,000 | b | MXN | 199,524 | |
| senior bond, 5.95%, 3/19/19 | Mexico | 100,000 | 111,855 | |||
| Government of Peru, senior bond, 6.55%, 3/14/37. | Peru | 200,000 | 258,365 | |||
| Government of Poland, | ||||||
| 3.25%, 7/25/19. | Poland | 1,400,000 | PLN | 383,636 | ||
| 4.00%, 10/25/23 | Poland | 1,150,000 | PLN | 327,002 | ||
| Government of Singapore, 2.375%, 4/01/17 | Singapore | 350,000 | SGD | 263,946 | ||
| a Government of Spain, | ||||||
| senior bond, Reg S, 5.15%, 10/31/44 | Spain | 200,000 | EUR | 337,985 | ||
| senior note, Reg S, 5.15%, 10/31/28 | Spain | 200,000 | EUR | 311,555 | ||
| Italy Treasury Bond, | ||||||
| a Reg S, 3.50%, 3/01/30 | Italy | 400,000 | EUR | 548,057 | ||
| senior bond, 4.25%, 9/01/19 | Italy | 160,000 | EUR | 208,115 | ||
| senior bond, 5.50%, 9/01/22 | Italy | 250,000 | EUR | 368,602 | ||
| a senior bond, Reg S, 5.00%, 8/01/34 | Italy | 270,000 | EUR | 439,762 | ||
| a Queensland Treasury Corp., | ||||||
| senior bond, Reg S, 5.75%, 7/22/24 | Australia | 300,000 | AUD | 277,164 | ||
| senior note, Reg S, 6.00%, 7/21/22. | Australia | 300,000 | AUD | 273,364 | ||
| a United Kingdom Treasury Note, Reg S, 2.00%, 7/22/20 | United Kingdom | 490,000 | GBP | 749,269 | ||
| Total Foreign Government and Agency Securities | ||||||
| (Cost $7,649,817) | 7,508,096 | |||||
| U.S. Government and Agency Securities 25.7% | ||||||
| U.S. Treasury Bond, | ||||||
| 4.375%, 11/15/39 | United States | 230,000 | 307,409 | |||
| c Index Linked, 3.375%, 4/15/32 | United States | 160,296 | 233,287 | |||
| U.S. Treasury Note, | ||||||
| 1.00%, 8/31/16. | United States | 600,000 | 601,266 | |||
| 0.75%, 1/15/17. | United States | 1,100,000 | 1,101,848 | |||
| 1.875%, 8/31/17 | United States | 500,000 | 508,018 | |||
| 2.625%, 11/15/20 | United States | 600,000 | 636,282 | |||
| c Index Linked, 1.25%, 7/15/20 | United States | 163,082 | 175,188 | |||
| Total U.S. Government and Agency Securities | ||||||
| (Cost $3,465,229) | 3,563,298 | |||||
| Total Investments before Short Term Investments | ||||||
| (Cost $11,115,046) | 11,071,394 | |||||
franklintempleton.com
Annual Report
19
FRANKLIN STRATEGIC SERIES
STATEMENT OF INVESTMENTS
| Franklin Global Government Bond Fund (continued) | ||||
| Country | Shares | Value | ||
| Short Term Investments (Cost $2,527,951) 18.2% | ||||
| Money Market Funds 18.2% | ||||
| d,e Institutional Fiduciary Trust Money Market Portfolio | United States | 2,527,951 | $ | 2,527,951 |
| Total Investments (Cost $13,642,997) 97.9% | 13,599,345 | |||
| Other Assets, less Liabilities 2.1% | 294,572 | |||
| Net Assets 100.0% | $ | 13,893,917 |
*The principal amount is stated in U.S. dollars unless otherwise indicated.
aSecurity was purchased pursuant to Regulation S under the Securities Act of 1933, which exempts from registration securities offered and sold outside of the United States.
Such a security cannot be sold in the United States without either an effective registration statement filed pursuant to the Securities Act of 1933, or pursuant to an exemption
from registration. These securities have been deemed liquid under guidelines approved by the Trust’s Board of Trustees. At April 30, 2016, the aggregate value of these
securities was $4,518,645, representing 32.50% of net assets.
bPrincipal amount is stated in 100 Mexican Peso Units.
cPrincipal amount of security is adjusted for inflation. See Note 1(e).
dNon-income producing.
eSee Note 3(f) regarding investments in affiliated management investment companies.
At April 30, 2016, the Fund had the following forward exchange contracts outstanding. See Note 1(c).
| Forward Exchange Contracts | |||||||||||
| Contract | Settlement | Unrealized | Unrealized | ||||||||
| Currency | Counterpartya | Type | Quantity | Amount | Date | Appreciation | Depreciation | ||||
| OTC Forward Exchange Contracts | |||||||||||
| Australian Dollar | BZWS | Sell | 720,000 | $ | 517,573 | 6/15/16 | $ | — | $ | (28,737 | ) |
| Euro | CITI | Sell | 1,120,000 | 1,218,762 | 6/15/16 | — | (65,714 | ) | |||
| Malaysian Ringgit | BZWS | Sell | 2,000,000 | 479,329 | 6/15/16 | — | (32,227 | ) | |||
| Polish Zloty | BZWS | Sell | 2,900,000 | 725,780 | 6/15/16 | — | (33,384 | ) | |||
| Singapore Dollar | CITI | Sell | 350,000 | 249,057 | 6/15/16 | — | (10,901 | ) | |||
| Total Forward Exchange Contracts | $ | — | $ | (170,963 | ) | ||||||
| Net unrealized appreciation (depreciation) | $ | (170,963 | ) | ||||||||
| aMay be comprised of multiple contracts with the same counterparty, currency and settlement date. | |||||||||||
See Abbreviations on page 34.
20 Annual Report | The accompanying notes are an integral part of these financial statements.
franklintempleton.com
FRANKLIN STRATEGIC SERIES
Financial Statements
Statement of Assets and Liabilities
April 30, 2016
| Franklin Global Government Bond Fund | |||
| Assets: | |||
| Investments in securities: | |||
| Cost - Unaffiliated issuers | $ | 11,115,046 | |
| Cost - Non-controlled affiliates (Note 3f) | 2,527,951 | ||
| Total cost of investments | $ | 13,642,997 | |
| Value - Unaffiliated issuers | $ | 11,071,394 | |
| Value - Non-controlled affiliates (Note 3f) | 2,527,951 | ||
| Total value of investments | 13,599,345 | ||
| Foreign currency, at value (cost $358,509) | 358,536 | ||
| Receivables: | |||
| Capital shares sold | 22,406 | ||
| Interest | 98,144 | ||
| Affiliates | 51,313 | ||
| Other assets. | 7 | ||
| Total assets | 14,129,751 | ||
| Liabilities: | |||
| Payables: | |||
| Capital shares redeemed | 12,094 | ||
| Distribution fees | 2,062 | ||
| Transfer agent fees | 1,344 | ||
| Professional fees. | 44,035 | ||
| Unrealized depreciation on OTC forward exchange contracts | 170,963 | ||
| Accrued expenses and other liabilities | 5,336 | ||
| Total liabilities | 235,834 | ||
| Net assets, at value. | $ | 13,893,917 | |
| Net assets consist of: | |||
| Paid-in capital. | $ | 14,399,834 | |
| Distributions in excess of net investment income. | (193,628 | ) | |
| Net unrealized appreciation (depreciation) | (212,760 | ) | |
| Accumulated net realized gain (loss) | (99,529 | ) | |
| Net assets, at value. | $ | 13,893,917 | |
franklintempleton.com
The accompanying notes are an integral part of these financial statements. | Annual Report 21
FRANKLIN STRATEGIC SERIES
FINANCIAL STATEMENTS
Statement of Assets and Liabilities (continued)
April 30, 2016
| Franklin Global Government Bond Fund | ||
| Class A: | ||
| Net assets, at value. | $ | 13,356,296 |
| Shares outstanding | 1,393,316 | |
| Net asset value per sharea | $ | 9.59 |
| Maximum offering price per share (net asset value per share ÷ 95.75%) | $ | 10.02 |
| Class C: | ||
| Net assets, at value. | $ | 508,845 |
| Shares outstanding | 53,167 | |
| Net asset value and maximum offering price per sharea | $ | 9.57 |
| Class R: | ||
| Net assets, at value. | $ | 9,575 |
| Shares outstanding | 1,000 | |
| Net asset value and maximum offering price per share | $ | 9.58 |
| Class R6: | ||
| Net assets, at value. | $ | 9,587 |
| Shares outstanding | 1,000 | |
| Net asset value and maximum offering price per share | $ | 9.59 |
| Advisor Class: | ||
| Net assets, at value. | $ | 9,614 |
| Shares outstanding | 1,000 | |
| Net asset value and maximum offering price per share | $ | 9.61 |
aRedemption price is equal to net asset value less contingent deferred sales charges, if applicable.
22 Annual Report | The accompanying notes are an integral part of these financial statements.
franklintempleton.com
| FRANKLIN STRATEGIC SERIES |
| FINANCIAL STATEMENTS |
Statement of Operations
for the year ended April 30, 2016
| Franklin Global Government Bond Fund | |||
| Investment income: | |||
| Interest | $ | 228,339 | |
| Expenses: | |||
| Management fees (Note 3a) | 77,921 | ||
| Distribution fees: (Note 3c) | |||
| Class A | 7,934 | ||
| Class C | 2,301 | ||
| Class R | 46 | ||
| Transfer agent fees: (Note 3e) | |||
| Class A | 8,714 | ||
| Class C | 265 | ||
| Class R | 7 | ||
| Class R6 | 94 | ||
| Advisor Class | 7 | ||
| Custodian fees (Note 4) | 1,951 | ||
| Reports to shareholders | 10,388 | ||
| Registration and filing fees | 66,185 | ||
| Professional fees | 54,855 | ||
| Other | 8,030 | ||
| Total expenses | 238,698 | ||
| Expenses waived/paid by affiliates (Note 3g) | (156,388 | ) | |
| Net expenses | 82,310 | ||
| Net investment income | 146,029 | ||
| Realized and unrealized gains (losses): | |||
| Net realized gain (loss) from: | |||
| Investments | (386,822 | ) | |
| Foreign currency transactions | 127,293 | ||
| Net realized gain (loss) | (259,529 | ) | |
| Net change in unrealized appreciation (depreciation) on: | |||
| Investments | 167,170 | ||
| Translation of other assets and liabilities | |||
| denominated in foreign currencies | (72,767 | ) | |
| Net change in unrealized appreciation (depreciation) | 94,403 | ||
| Net realized and unrealized gain (loss) | (165,126 | ) | |
| Net increase (decrease) in net assets resulting from operations | $ | (19,097 | ) |
franklintempleton.com
The accompanying notes are an integral part of these financial statements. | Annual Report 23
| FRANKLIN STRATEGIC SERIES | |||||||
| FINANCIAL STATEMENTS | |||||||
| Statements of Changes in Net Assets | |||||||
| Franklin Global Government Bond Fund | |||||||
| Year Ended April 30, | |||||||
| 2016 | 2015 | ||||||
| Increase (decrease) in net assets: | |||||||
| Operations: | |||||||
| Net investment income | $ | 146,029 | $ | 195,279 | |||
| Net realized gain (loss) | (259,529 | ) | 523,701 | ||||
| Net change in unrealized appreciation (depreciation) | 94,403 | (816,742 | ) | ||||
| Net increase (decrease) in net assets resulting from operations | (19,097 | ) | (97,762 | ) | |||
| Distributions to shareholders from: | |||||||
| Net investment income and net foreign currency gains: | |||||||
| Class A | (207,807 | ) | (471,147 | ) | |||
| Class C | (4,106 | ) | (8,576 | ) | |||
| Class R | (139 | ) | (360 | ) | |||
| Class R6 | (179 | ) | (406 | ) | |||
| Advisor Class | (196 | ) | (433 | ) | |||
| Net realized gains: | |||||||
| Class A | — | (208,054 | ) | ||||
| Class C | — | (5,007 | ) | ||||
| Class R | — | (174 | ) | ||||
| Class R6 | — | (174 | ) | ||||
| Advisor Class | — | (174 | ) | ||||
| Total distributions to shareholders | (212,427 | ) | (694,505 | ) | |||
| Capital share transactions: (Note 2) | |||||||
| Class A | 2,094,584 | 1,027,141 | |||||
| Class C | 222,515 | 154,015 | |||||
| Advisor Class | 25 | 30 | |||||
| Total capital share transactions | 2,317,124 | 1,181,186 | |||||
| Net increase (decrease) in net assets | 2,085,600 | 388,919 | |||||
| Net assets: | |||||||
| Beginning of year. | 11,808,317 | 11,419,398 | |||||
| End of year | $ | 13,893,917 | $ | 11,808,317 | |||
| Undistributed net investment income included in net assets: | |||||||
| End of year | $ | — | $ | 37,696 | |||
| Distributions in excess of net investment income included in net assets: | |||||||
| End of year | $ | (193,628 | ) | $ | — | ||
24 Annual Report | The accompanying notes are an integral part of these financial statements.
franklintempleton.com
FRANKLIN STRATEGIC SERIES
Notes to Financial Statements
Franklin Global Government Bond Fund
1. Organization and Significant Accounting Policies
Franklin Strategic Series (Trust) is registered under the Investment Company Act of 1940 (1940 Act) as an open-end management investment company, consisting of ten separate funds and applies the specialized accounting and reporting guidance in U.S. Generally Accepted Accounting Principles (U.S. GAAP). Franklin Global Government Bond Fund (Fund) is included in this report. The financial statements of the remaining funds in the Trust are presented separately. The Fund offers five classes of shares: Class A, Class C, Class R, Class R6, and Advisor Class. Each class of shares differs by its initial sales load, contingent deferred sales charges, voting rights on matters affecting a single class, its exchange privilege and fees primarily due to differing arrangements for distribution and transfer agent fees.
The following summarizes the Fund’s significant accounting policies.
a. Financial Instrument Valuation
The Fund’s investments in financial instruments are carried at fair value daily. Fair value is the price that would be received to sell an asset or paid to transfer a liability in an orderly transaction between market participants on the measurement date. The Fund calculates the net asset value (NAV) per share as of 4 p.m. Eastern time each day the New York Stock Exchange (NYSE) is open for trading. Under compliance policies and procedures approved by the Trust’s Board of Trustees (the Board), the Fund’s administrator has responsibility for oversight of valuation, including leading the cross-functional Valuation and Liquidity Oversight Committee (VLOC). The VLOC provides administration and oversight of the Fund’s valuation policies and procedures, which are approved annually by the Board. Among other things, these procedures allow the Fund to utilize independent pricing services, quotations from securities and financial instrument dealers, and other market sources to determine fair value.
Debt securities generally trade in the over-the-counter (OTC) market rather than on a securities exchange. The Fund’s pricing services use multiple valuation techniques to determine fair value. In instances where sufficient market activity exists, the pricing services may utilize a market-based approach through which quotes from market makers are used to determine fair value. In instances where sufficient market activity may not exist or is limited, the pricing services also utilize proprietary valuation models which may consider market characteristics such as benchmark yield curves, credit spreads, estimated default rates, anticipated market interest rate volatility, coupon rates, anticipated timing of principal repayments, underlying collateral, and other unique security features in order to estimate the relevant cash flows, which are then discounted to calculate the fair value. Securities denominated in a foreign currency are converted into their U.S. dollar equivalent at the foreign exchange rate in effect at 4 p.m. Eastern time on the date that the values of the foreign debt securities are determined.
Investments in open-end mutual funds are valued at the closing NAV.
Certain derivative financial instruments (derivatives) trade in the OTC market. The Fund’s pricing services use various techniques including industry standard option pricing models and proprietary discounted cash flow models to determine the fair value of those instruments. The Fund’s net benefit or obligation under the derivative contract, as measured by the fair value of the contract, is included in net assets.
The Fund has procedures to determine the fair value of financial instruments for which market prices are not reliable or readily available. Under these procedures, the VLOC convenes on a regular basis to review such financial instruments and considers a number of factors, including significant unobservable valuation inputs, when arriving at fair value. The VLOC primarily employs a market-based approach which may use related or comparable assets or liabilities, recent transactions, market multiples, book values, and other relevant information for the investment to determine the fair value of the investment. An income-based valuation approach may also be used in which the anticipated future cash flows of the investment are discounted to calculate fair value. Discounts may also be applied due to the nature or duration of any restrictions on the disposition of the investments. Due to the inherent uncertainty of valuations of such investments, the fair values may differ significantly from the values that would have been used had an active market existed. The VLOC employs various methods for calibrating these valuation approaches including a regular review of key inputs and assumptions, transactional back-testing or disposition analysis, and reviews of any related market activity.
Trading in securities on foreign securities stock exchanges and OTC markets may be completed before 4 p.m. Eastern time. In addition, trading in certain foreign markets may not take place
franklintempleton.com
Annual Report
25
FRANKLIN STRATEGIC SERIES
NOTES TO FINANCIAL STATEMENTS
Franklin Global Government Bond Fund (continued)
1. Organization and Significant Accounting
Policies (continued)
a. Financial Instrument Valuation (continued)
on every NYSE business day. Occasionally, events occur between the time at which trading in a foreign security is completed and the close of the NYSE that might call into question the reliability of the value of a portfolio security held by the Fund. As a result, differences may arise between the value of the Fund’s portfolio securities as determined at the foreign market close and the latest indications of value at the close of the NYSE. In order to minimize the potential for these differences, the VLOC monitors price movements following the close of trading in foreign stock markets through a series of country specific market proxies (such as baskets of American Depositary Receipts, futures contracts and exchange traded funds). These price movements are measured against established trigger thresholds for each specific market proxy to assist in determining if an event has occurred that may call into question the reliability of the values of the foreign securities held by the Fund. If such an event occurs, the securities may be valued using fair value procedures, which may include the use of independent pricing services.
When the last day of the reporting period is a non-business day, certain foreign markets may be open on those days that the NYSE is closed, which could result in differences between the value of the Fund’s portfolio securities on the last business day and the last calendar day of the reporting period. Any significant security valuation changes due to an open foreign market are adjusted and reflected by the Fund for financial reporting purposes.
b. Foreign Currency Translation
Portfolio securities and other assets and liabilities denominated in foreign currencies are translated into U.S. dollars based on the exchange rate of such currencies against U.S. dollars on the date of valuation. The Fund may enter into foreign currency exchange contracts to facilitate transactions denominated in a foreign currency. Purchases and sales of securities, income and expense items denominated in foreign currencies are translated into U.S. dollars at the exchange rate in effect on the transaction date. Portfolio securities and assets and liabilities denominated in foreign currencies contain risks that those currencies will decline in value relative to the U.S. dollar. Occasionally, events may impact the availability or reliability of foreign exchange rates used to convert the U.S. dollar equivalent value. If such an event occurs, the foreign exchange rate will be valued at fair value using procedures established and approved by the Board.
The Fund does not separately report the effect of changes in foreign exchange rates from changes in market prices on securities held. Such changes are included in net realized and unrealized gain or loss from investments in the Statement of Operations.
Realized foreign exchange gains or losses arise from sales of foreign currencies, currency gains or losses realized between the trade and settlement dates on securities transactions and the difference between the recorded amounts of dividends, interest, and foreign withholding taxes and the U.S. dollar equivalent of the amounts actually received or paid. Net unrealized foreign exchange gains and losses arise from changes in foreign exchange rates on foreign denominated assets and liabilities other than investments in securities held at the end of the reporting period.
c. Derivative Financial Instruments
The Fund invested in derivatives in order to manage risk or gain exposure to various other investments or markets. Derivatives are financial contracts based on an underlying or notional amount, require no initial investment or an initial net investment that is smaller than would normally be required to have a similar response to changes in market factors, and require or permit net settlement. Derivatives contain various risks including the potential inability of the counterparty to fulfill their obligations under the terms of the contract, the potential for an illiquid secondary market, and/or the potential for market movements which expose the Fund to gains or losses in excess of the amounts shown in the Statement of Assets and Liabilities. Realized gain and loss and unrealized appreciation and depreciation on these contracts for the period are included in the Statement of Operations.
Derivative counterparty credit risk is managed through a formal evaluation of the creditworthiness of all potential counter-parties. The Fund attempts to reduce its exposure to counterparty credit risk on OTC derivatives, whenever possible, by entering into International Swaps and Derivatives Association (ISDA) master agreements with certain counterparties. These agreements contain various provisions, including but not limited to collateral requirements, events of default, or early termination. Termination events applicable to
26 Annual Report
franklintempleton.com
FRANKLIN STRATEGIC SERIES
NOTES TO FINANCIAL STATEMENTS
Franklin Global Government Bond Fund (continued)
the counterparty include certain deteriorations in the credit quality of the counterparty. Termination events applicable to the Fund include failure of the Fund to maintain certain net asset levels and/or limit the decline in net assets over various periods of time. In the event of default or early termination, the ISDA master agreement gives the non-defaulting party the right to net and close-out all transactions traded, whether or not arising under the ISDA agreement, to one net amount payable by one counterparty to the other. However, absent an event of default or early termination, OTC derivative assets and liabilities are presented gross and not offset in the Statement of Assets and Liabilities. Early termination by the counterparty may result in an immediate payment by the Fund of any net liability owed to that counterparty under the ISDA agreement.
Collateral requirements differ by type of derivative. Collateral terms are contract specific for OTC derivatives. For OTC derivatives traded under an ISDA master agreement, posting of collateral is required by either the Fund or the applicable counterparty if the total net exposure of all OTC derivatives with the applicable counterparty exceeds the minimum transfer amount, which typically ranges from $100,000 to $250,000, and can vary depending on the counterparty and the type of the agreement. Generally, collateral is determined at the close of Fund business each day and any additional collateral required due to changes in derivative values may be delivered by the Fund or the counterparty within a few business days. Collateral pledged and/or received by the Fund, if any, is held in segregated accounts with the Fund’s custodian/counterparty broker and can be in the form of cash and/or securities. Unrestricted cash may be invested according to the Fund’s investment objectives. To the extent that the amounts due to the Fund from its counterparties are not subject to collateralization or are not fully collateralized, the Fund bears the risk of loss from counterparty non-performance.
The Fund entered into OTC forward exchange contracts primarily to manage exposure to certain foreign currencies. A forward exchange contract is an agreement between the Fund and a counterparty to buy or sell a foreign currency at a specific exchange rate on a future date.
See Note 8 regarding other derivative information.
d. Income and Deferred Taxes
It is the Fund’s policy to qualify as a regulated investment company under the Internal Revenue Code. The Fund intends to distribute to shareholders substantially all of its taxable income and net realized gains to relieve it from federal income and excise taxes. As a result, no provision for U.S. federal income taxes is required.
The Fund may be subject to foreign taxation related to income received, capital gains on the sale of securities and certain foreign currency transactions in the foreign jurisdictions in which it invests. Foreign taxes, if any, are recorded based on the tax regulations and rates that exist in the foreign markets in which the Fund invests. When a capital gain tax is determined to apply, the Fund records an estimated deferred tax liability in an amount that would be payable if the securities were disposed of on the valuation date.
The Fund may recognize an income tax liability related to its uncertain tax positions under U.S. GAAP when the uncertain tax position has a less than 50% probability that it will be sustained upon examination by the tax authorities based on its technical merits. As of April 30, 2016, the Fund has determined that no tax liability is required in its financial statements related to uncertain tax positions for any open tax years (or expected to be taken in future tax years). Open tax years are those that remain subject to examination and are based on each tax jurisdiction’s statute of limitation.
e. Security Transactions, Investment Income, Expenses and Distributions
Security transactions are accounted for on trade date. Realized gains and losses on security transactions are determined on a specific identification basis. Interest income and estimated expenses are accrued daily. Amortization of premium and accretion of discount on debt securities are included in interest income. Distributions to shareholders are recorded on the ex-dividend date and are determined according to income tax regulations (tax basis). Distributable earnings determined on a tax basis may differ from earnings recorded in accordance with U.S. GAAP. These differences may be permanent or temporary. Permanent differences are reclassified among capital accounts to reflect their tax character. These reclassifications have no impact on net assets or the results of operations. Temporary differences are not reclassified, as they may reverse in subsequent periods.
franklintempleton.com
Annual Report
27
FRANKLIN STRATEGIC SERIES
NOTES TO FINANCIAL STATEMENTS
Franklin Global Government Bond Fund (continued)
1. Organization and Significant Accounting
Policies (continued)
e. Security Transactions, Investment Income, Expenses and Distributions (continued)
Common expenses incurred by the Trust are allocated among the Funds based on the ratio of net assets of each Fund to the combined net assets of the Trust. Fund specific expenses are charged directly to the Fund that incurred the expense.
Realized and unrealized gains and losses and net investment income, not including class specific expenses, are allocated daily to each class of shares based upon the relative proportion of net assets of each class. Differences in per share distributions, by class, are generally due to differences in class specific expenses.
Inflation-indexed bonds are adjusted for inflation through periodic increases or decreases in the security’s interest accruals, face amount, or principal redemption value, by amounts corresponding to the rate of inflation as measured by an index. Any increase or decrease in the face amount or principal redemption value will be included as interest income in the Statement of Operations.
f. Accounting Estimates
The preparation of financial statements in accordance with U.S. GAAP requires management to make estimates and assumptions that affect the reported amounts of assets and liabilities at the date of the financial statements and the amounts of income and expenses during the reporting period. Actual results could differ from those estimates.
g. Guarantees and Indemnifications
Under the Trust’s organizational documents, its officers and trustees are indemnified by the Trust against certain liabilities arising out of the performance of their duties to the Trust. Additionally, in the normal course of business, the Trust, on behalf of the Fund, enters into contracts with service providers that contain general indemnification clauses. The Trust’s maximum exposure under these arrangements is unknown as this would involve future claims that may be made against the Trust that have not yet occurred. Currently, the Trust expects the risk of loss to be remote.
2. Shares of Beneficial Interest
At April 30, 2016, there were an unlimited number of shares authorized (without par value). Transactions in the Fund’s shares were as follows:
| Year Ended April 30, | ||||||||||
| 2016a | 2015a | |||||||||
| Shares | Amount | Shares | Amount | |||||||
| Class A Shares: | ||||||||||
| Shares sold | 332,524 | $ | 3,141,724 | 170,918 | $ | 1,766,228 | ||||
| Shares issued in reinvestment of distributions | 3,698 | 35,024 | 10,173 | 102,381 | ||||||
| Shares redeemed | (114,211 | ) | (1,082,164 | ) | (84,154 | ) | (841,468 | ) | ||
| Net increase (decrease) | 222,011 | $ | 2,094,584 | 96,937 | $ | 1,027,141 | ||||
| Class C Shares: | ||||||||||
| Shares sold | 44,024 | $ | 416,435 | 28,174 | $ | 290,140 | ||||
| Shares issued in reinvestment of distributions | 421 | 3,989 | 1,297 | 13,025 | ||||||
| Shares redeemed | (21,056 | ) | (197,909 | ) | (14,615 | ) | (149,150 | ) | ||
| Net increase (decrease) | 23,389 | $ | 222,515 | 14,856 | $ | 154,015 | ||||
28 Annual Report
franklintempleton.com
FRANKLIN STRATEGIC SERIES
NOTES TO FINANCIAL STATEMENTS
| Franklin Global Government Bond Fund (continued) | ||||||||||
| Year Ended April 30, | ||||||||||
| 2016a | 2015a | |||||||||
| Shares | Amount | Shares | Amount | |||||||
| Advisor Class Shares: | ||||||||||
| Shares sold | 1,207 | $ | 11,435 | 280 | $ | 2,800 | ||||
| Shares issued in reinvestment of distributions | — | — | 1 | 9 | ||||||
| Shares redeemed | (1,207 | ) | (11,410 | ) | (281 | ) | (2,779 | ) | ||
| Net increase (decrease) | — | $ | 25 | — | $ | 30 | ||||
aDuring the year Class R and Class R6 did not report any share transactions.
3. Transactions with Affiliates
Franklin Resources, Inc. is the holding company for various subsidiaries that together are referred to as Franklin Templeton Investments. Certain officers and trustees of the Fund are also officers and/or directors of the following subsidiaries:
| Subsidiary | Affiliation |
| Franklin Templeton Investment Management Limited (FTIML) | Investment manager |
| Franklin Templeton Services, LLC (FT Services) | Administrative manager |
| Franklin Templeton Distributors, Inc. (Distributors) | Principal underwriter |
| Franklin Templeton Investor Services, LLC (Investor Services) | Transfer agent |
a. Management Fees
The Fund pays an investment management fee to FTIML based on the average daily net assets of the Fund as follows:
| Annualized Fee Rate | Net Assets | |
| 0.650 | % | Up to and including $1 billion |
| 0.600 | % | Over $1 billion up to and including $5 billion |
| 0.550 | % | Over $5 billion up to and including $10 billion |
| 0.545 | % | Over $10 billion up to and including $15 billion |
| 0.540 | % | Over $15 billion up to and including $20 billion |
| 0.535 | % | In excess of $20 billion |
For the year ended April 30, 2016, the effective investment management fee rate was 0.650% of the Fund’s average daily net assets.
b. Administrative Fees
Under an agreement with FTIML, FT Services provides administrative services to the Fund. The fee is paid by FTIML based on the Fund’s average daily net assets, and is not an additional expense of the Fund.
c. Distribution Fees
The Board has adopted distribution plans for each share class, with the exception of Class R6 and Advisor Class shares, pursuant to Rule 12b-1 under the 1940 Act. Under the Fund’s Class A reimbursement distribution plan, the Fund reimburses Distributors for costs incurred in connection with the servicing, sale and distribution of the Fund’s shares up to the maximum annual plan rate. Under the Class A reimbursement distribution plans, costs exceeding the maximum for the current plan year cannot be reimbursed
franklintempleton.com
Annual Report
29
FRANKLIN STRATEGIC SERIES
NOTES TO FINANCIAL STATEMENTS
Franklin Global Government Bond Fund (continued)
| 3. | Transactions with Affiliates (continued) |
| c. | Distribution Fees (continued) |
in subsequent periods. In addition, under the Fund’s Class C and R compensation distribution plans, the Fund pays Distributors for costs incurred in connection with the servicing, sale and distribution of the Fund’s shares up to the maximum annual plan rate for each class. The plan year, for purposes of monitoring compliance with the maximum annual plan rates, is February 1 through January 31.
The maximum annual plan rates, based on the average daily net assets, for each class, are as follows:
| Class A | 0.25 | % |
| Class C | 0.65 | % |
| Class R | 0.50 | % |
d. Sales Charges/Underwriting Agreements
Front-end sales charges and contingent deferred sales charges (CDSC) do not represent expenses of the Fund. These charges are deducted from the proceeds of sales of Fund shares prior to investment or from redemption proceeds prior to remittance, as applicable. Distributors has advised the Fund of the following commission transactions related to the sales and redemptions of the Fund’s shares for the year:
| Sales charges retained net of commissions paid to unaffiliated | ||
| brokers/dealers | $ | 3,227 |
| CDSC retained | $ | 59 |
| e. Transfer Agent Fees | ||
Each class of shares, except for Class R6, pays transfer agent fees to Investor Services for its performance of shareholder servicing obligations and reimburses Investor Services for out of pocket expenses incurred, including shareholder servicing fees paid to third parties. These fees are allocated daily based upon their relative proportion of such classes’ aggregate net assets. Class R6 pays Investor Services transfer agent fees specific to that class.
For the year ended April 30, 2016, the Fund paid transfer agent fees of $9,087, of which $6,992 was retained by Investor Services.
f. Investments in Affiliated Management Investment Companies
The Fund invests in an affiliated management investment company for purposes other than exercising a controlling influence over the management or policies. Management fees paid by the Fund are waived on assets invested in the affiliated management investment company, as noted in the Statement of Operations, in an amount not to exceed the management and administrative fees paid directly or indirectly by each affiliate.
| % of | |||||||||||
| Affiliated | |||||||||||
| Number of | Number of | Fund Shares | |||||||||
| Shares Held | Shares | Value | Outstanding | ||||||||
| at Beginning | Gross | Gross | Held at End | at End | Investment | Realized | Held at End | ||||
| of Year | Additions | Reductions | of Year | of Year | Income | Gain (Loss) | of Year | ||||
| Non-Controlled Affiliates | |||||||||||
| Institutional Fiduciary Trust Money Market Portfolio | 221,129 | 3,872,435 | (1,565,613 | ) | 2,527,951 | $ | 2,527,951 | $— | $— | 0.01 | % |
30 Annual Report
franklintempleton.com
FRANKLIN STRATEGIC SERIES
NOTES TO FINANCIAL STATEMENTS
Franklin Global Government Bond Fund (continued)
g. Waiver and Expense Reimbursements
FTIML and Investor Services have contractually agreed in advance to waive or limit their respective fees and to assume as their own expense certain expenses otherwise payable by the Fund so that the expenses (excluding distribution fees, and acquired fund fees and expenses) for Class A, Class C, Class R and Advisor Class of the Fund do not exceed 0.60%, and Class R6 does not exceed 0.59% based on the average net assets of each class (other than certain non-routine expenses or costs, including those relating to litigation, indemnification, reorganizations, and liquidations) until August 31, 2016. Total expenses waived or paid are not subject to recapture subsequent to the Fund’s fiscal year end.
h. Other Affiliated Transactions
At April 30, 2016, Franklin Advisers, Inc. an affiliate of FTIML, owned 68.99% of the Fund’s outstanding shares. Investment activities of this shareholder could have a material impact on the Fund.
4. Expense Offset Arrangement
The Fund has entered into an arrangement with its custodian whereby credits realized as a result of uninvested cash balances are used to reduce a portion of the Fund’s custodian expenses. During the year ended April 30, 2016, there were no credits earned.
5. Income Taxes
For tax purposes, capital losses may be carried over to offset future capital gains, if any. At April 30, 2016, the capital loss carryforwards were as follows:
| Capital loss carryforwards not subject to expiration: | ||
| Short term | $ | 81,524 |
| Long term | 18,005 | |
| Total capital loss carryforwards | $ | 99,529 |
For tax purposes, the Fund may elect to defer any portion of a late-year ordinary loss to the first day of the following fiscal year. At April 30, 2016, the Fund deferred late-year ordinary losses of $171,179.
The tax character of distributions paid during the years ended April 30, 2016 and 2015, was as follows:
| 2016 | 2015 | |||
| Distributions paid from: | ||||
| Ordinary income | $ | 212,427 | $ | 640,218 |
| Long term capital gain | — | 54,287 | ||
| $ | 212,427 | $ | 694,505 |
At April 30, 2016, the cost of investments and net unrealized appreciation (depreciation) for income tax purposes were as follows:
| Cost of investments | $ | 13,774,188 | |
| Unrealized appreciation | $ | 307,891 | |
| Unrealized depreciation | (482,734 | ) | |
| Net unrealized appreciation (depreciation) | $ | (174,843 | ) |
Differences between income and/or capital gains as determined on a book basis and a tax basis are primarily due to differing treatments of bond discounts and premiums, foreign currency transactions, and tax straddles.
franklintempleton.com
Annual Report
31
FRANKLIN STRATEGIC SERIES
NOTES TO FINANCIAL STATEMENTS
Franklin Global Government Bond Fund (continued)
6. Investment Transactions
Purchases and sales of investments (excluding short term securities) for the year ended April 30, 2016, aggregated $4,080,602 and $4,309,525, respectively.
7. Concentration of Risk
Investing in foreign securities may include certain risks and considerations not typically associated with investing in U.S. securities, such as fluctuating currency values and changing local and regional economic, political and social conditions, which may result in greater market volatility. In addition, certain foreign securities may not be as liquid as U.S. securities.
8. Other Derivative Information
At April 30, 2016, the Fund’s investments in derivative contracts are reflected in the Statement of Assets and Liabilities as follows:
| Asset Derivatives | Liability Derivatives | ||||
| Derivative Contracts | Statement of | Statement of | |||
| Not Accounted for as | Assets and Liabilities | Assets and Liabilities | |||
| Hedging Instruments | Location | Fair Value | Location | Fair Value | |
| Foreign exchange contracts | Unrealized appreciation on OTC | $ — | Unrealized depreciation on OTC | $ | 170,963 |
| forward exchange contracts | forward exchange contracts | ||||
For the year ended April 30, 2016, the effect of derivative contracts in the Fund’s Statement of Operations was as follows:
| Net Change | ||||||||
| in Unrealized | ||||||||
| Derivative Contacts | Net Realized | Appreciation | ||||||
| Not Accounted for as | Statement of | Gain (Loss) | Statement of | (Depreciation) | ||||
| Hedging Instruments | Operations Locations | for the Year | Operations Locations | for the Year | ||||
| Net realized gain (loss) from: | Net change in unrealized | |||||||
| appreciation (depreciation) on: | ||||||||
| Foreign exchange contracts | Foreign currency transactions | $ | 122,346 | a | Translation of other assets and | $ | (74,468 | )a |
| liabilities denominated in foreign | ||||||||
| currencies | ||||||||
aForward exchange contracts are included in net realized gain (loss) from foreign currency transactions and net change in unrealized appreciation (depreciation) on translation of other assets and liabilities denominated in foreign currencies in the Statement of Operations.
For the year ended April 30, 2016, the average month end fair value of derivatives represented 0.79% of average month end net assets. The average month end number of open derivative contracts for the year was 5.
At April 30, 2016, the Fund’s OTC derivative assets and liabilities are as follows:
| Gross and Net Amounts of | |||
| Assets and Liabilities Presented | |||
| in the Statement of Assets and Liabilities | |||
| Assetsa | Liabilitiesa | ||
| Derivatives | |||
| Forward exchange contracts | $ — | $ | 170,963 |
aAbsent an event of default or early termination, OTC derivative assets and liabilities are presented gross and not offset in the Statement of Assets and Liabilities.
32 Annual Report
franklintempleton.com
FRANKLIN STRATEGIC SERIES
NOTES TO FINANCIAL STATEMENTS
Franklin Global Government Bond Fund (continued)
At April 30, 2016, the Fund’s OTC derivative liabilities which may be offset against the Fund’s OTC derivative assets, and collateral pledged to the counterparty, is as follows:
| Amounts Not Offset in the | ||||||||||
| Statement of Assets and Liabilities | ||||||||||
| Gross and | ||||||||||
| Net Amounts of | Financial | Financial | ||||||||
| Liabilities Presented in | Instruments | Instruments | Cash | Net Amount | ||||||
| the Statement of | Available for | Collateral | Collateral | (Not less | ||||||
| Assets and Liabilities | Offset | Pledged | Pledged | than zero) | ||||||
| Counterparty | ||||||||||
| BZWS. | $ | 94,348 | $ | — | $ | — | $ | — | $ | 94,348 |
| CITI | 76,615 | — | — | — | 76,615 | |||||
| Total. | $ | 170,963 | — | — | — | $ | 170,963 | |||
| See Note 1(c) regarding derivative financial instruments. | ||||||||||
9. Credit Facility
The Fund, together with other U.S. registered and foreign investment funds (collectively, Borrowers), managed by Franklin Templeton Investments, are borrowers in a joint syndicated senior unsecured credit facility totaling $2 billion (Global Credit Facility) which, matures on February 10, 2017. This Global Credit Facility provides a source of funds to the Borrowers for temporary and emergency purposes, including the ability to meet future unanticipated or unusually large redemption requests.
Under the terms of the Global Credit Facility, the Fund shall, in addition to interest charged on any borrowings made by the Fund and other costs incurred by the Fund, pay its share of fees and expenses incurred in connection with the implementation and maintenance of the Global Credit Facility, based upon its relative share of the aggregate net assets of all of the Borrowers, including an annual commitment fee of 0.07% based upon the unused portion of the Global Credit Facility. Effective February 12, 2016, the annual commitment fee is 0.15%. These fees are reflected in other expenses in the Statement of Operations. During the year ended April 30, 2016, the Fund did not use the Global Credit Facility.
10. Fair Value Measurements
The Fund follows a fair value hierarchy that distinguishes between market data obtained from independent sources (observable inputs) and the Fund’s own market assumptions (unobservable inputs). These inputs are used in determining the value of the Fund’s financial instruments and are summarized in the following fair value hierarchy:
- Level 1 – quoted prices in active markets for identical financial instruments
- Level 2 – other significant observable inputs (including quoted prices for similar financial instruments, interest rates, prepayment speed, credit risk, etc.)
- Level 3 – significant unobservable inputs (including the Fund’s own assumptions in determining the fair value of financial instruments)
The input levels are not necessarily an indication of the risk or liquidity associated with financial instruments at that level.
For movements between the levels within the fair value hierarchy, the Fund has adopted a policy of recognizing the transfers as of the date of the underlying event which caused the movement.
franklintempleton.com
Annual Report
33
FRANKLIN STRATEGIC SERIES
NOTES TO FINANCIAL STATEMENTS
Franklin Global Government Bond Fund (continued)
10. Fair Value Measurements (continued)
A summary of inputs used as of April 30, 2016, in valuing the Fund’s assets and liabilities carried at fair value, is as follows:
| Level 1 | Level 2 | Level 3 | Total | |||||
| Assets: | ||||||||
| Investments in Securities: | ||||||||
| Foreign Government and Agency Securities | $ | — | $ | 7,508,096 | $ | — | $ | 7,508,096 |
| U.S. Government and Agency Securities | — | 3,563,298 | — | 3,563,298 | ||||
| Short Term Investments | 2,527,951 | — | — | 2,527,951 | ||||
| Total Investments in Securities | $ | 2,527,951 | $ | 11,071,394 | $ | — | $ | 13,599,345 |
| Liabilities: | ||||||||
| Other Financial Instruments | ||||||||
| Forward Exchange Contracts | $ | — | $ | 170,963 | $ | — | $ | 170,963 |
11. Subsequent Events
The Fund has evaluated subsequent events through the issuance of the financial statements and determined that no events have occurred that require disclosure.
| Abbreviations | |||
| Counterparty | Currency | ||
| BZWS | Barclays Bank PLC | AUD | Australian Dollar |
| CITI | Citigroup, Inc. | CAD | Canadian Dollar |
| EUR | Euro | ||
| GBP | British Pound Sterling | ||
| MXN | Mexican Peso | ||
| MYR | Malaysian Ringgit | ||
| PLN | Polish Zloty | ||
| SGD | Singapore Dollar | ||
34 Annual Report
franklintempleton.com
FRANKLIN STRATEGIC SERIES
Report of Independent Registered Public Accounting Firm
To the Board of Trustees and Shareholders of Franklin Global Government Bond Fund
In our opinion, the accompanying statement of assets and liabilities, including the statement of investments, and the related statements of operations and of changes in net assets and the financial highlights present fairly, in all material respects, the financial position of Franklin Global Government Bond Fund (the "Fund") at April 30, 2016, the results of its operations for the year then ended, the changes in its net assets for each of the two years in the period then ended, and the financial highlights for each of the periods presented, in conformity with accounting principles generally accepted in the United States of America. These financial statements and financial highlights (hereafter referred to as "financial statements") are the responsibility of the Fund’s management. Our responsibility is to express an opinion on these financial statements based on our audit. We conducted our audit of these financial statements in accordance with the standards of the Public Company Accounting Oversight Board (United States). Those standards require that we plan and perform the audit to obtain reasonable assurance about whether the financial statements are free of material misstatement. An audit includes examining, on a test basis, evidence supporting the amounts and disclosures in the financial statements, assessing the accounting principles used and significant estimates made by management, and evaluating the overall financial statement presentation. We believe that our audit, which included confirmation of securities at April 30, 2016 by correspondence with the custodian, transfer agent and brokers, provides a reasonable basis for our opinion.
PricewaterhouseCoopers LLP
San Francisco, California
June 15, 2016
franklintempleton.com
Annual Report
35
FRANKLIN STRATEGIC SERIES
Board Members and Officers
The name, year of birth and address of the officers and board members, as well as their affiliations, positions held with the Trust, principal occupations during at least the past five years and number of U.S. registered portfolios overseen in the Franklin Templeton Investments fund complex, are shown below. Generally, each board member serves until that person’s successor is elected and qualified.
| Independent Board Members | ||||
| Number of Portfolios in | ||||
| Name, Year of Birth | Length of | Fund Complex Overseen | Other Directorships Held | |
| and Address | Position | Time Served | by Board Member* | During at Least the Past 5 Years |
| Harris J. Ashton (1932) | Trustee | Since 1991 | 145 | Bar-S Foods (meat packing company) |
| One Franklin Parkway | (1981-2010). | |||
| San Mateo, CA 94403-1906 | ||||
| Principal Occupation During at Least the Past 5 Years: | ||||
| Director of various companies; and formerly, Director, RBC Holdings, Inc. (bank holding company) (until 2002); and President, Chief Executive | ||||
| Officer and Chairman of the Board, General Host Corporation (nursery and craft centers) (until 1998). | ||||
| Mary C. Choksi (1950) | Trustee | Since 2014 | 121 | Avis Budget Group Inc. (car rental) |
| One Franklin Parkway | (2007-present), Omnicom Group Inc. | |||
| San Mateo, CA 94403-1906 | (advertising and marketing | |||
| communications services) | ||||
| (2011-present) and H.J. Heinz | ||||
| Company (processed foods and allied | ||||
| products) (1998-2006) | ||||
| Principal Occupation During at Least the Past 5 Years: | ||||
| Senior Advisor, Strategic Investment Group (investment management group) (2015-present); director of various companies; and formerly, | ||||
| Founding Partner and Senior Managing Director, Strategic Investment Group (1987–2015); Founding Partner and Managing Director, Emerging | ||||
| Markets Management LLC (investment management firm) (1987-2011); and Loan Officer/Senior Loan Officer/Senior Pension Investment | ||||
| Officer, World Bank Group (international financial institution) (1977-1987). | ||||
| Edith E. Holiday (1952) | Trustee | Since 1998 | 145 | Hess Corporation (exploration and |
| One Franklin Parkway | refining of oil and gas) (1993-present), | |||
| San Mateo, CA 94403-1906 | Canadian National Railway (railroad) | |||
| (2001-present), White Mountains | ||||
| Insurance Group, Ltd. (holding | ||||
| company) (2004-present), RTI | ||||
| International Metals, Inc. (manufacture | ||||
| and distribution of titanium) | ||||
| (1999-2015) and H.J. Heinz Company | ||||
| (processed foods and allied products) | ||||
| (1994-2013). | ||||
| Principal Occupation During at Least the Past 5 Years: | ||||
| Director or Trustee of various companies and trusts; and formerly, Assistant to the President of the United States and Secretary of the | ||||
| Cabinet (1990-1993); General Counsel to the United States Treasury Department (1989-1990); and Counselor to the Secretary and Assistant | ||||
| Secretary for Public Affairs and Public Liaison – United States Treasury Department (1988-1989). | ||||
| J. Michael Luttig (1954) | Trustee | Since 2009 | 145 | Boeing Capital Corporation (aircraft |
| One Franklin Parkway | financing) (2006-2013). | |||
| San Mateo, CA 94403-1906 | ||||
| Principal Occupation During at Least the Past 5 Years: | ||||
| Executive Vice President, General Counsel and member of the Executive Council, The Boeing Company (aerospace company)(2006-present); | ||||
| and formerly, Federal Appeals Court Judge, U.S. Court of Appeals for the Fourth Circuit (1991-2006). | ||||
| Frank A. Olson (1932) | Trustee | Since 2007 | 145 | Hess Corporation (exploration and |
| One Franklin Parkway | refining of oil and gas) (1998-2013). | |||
| San Mateo, CA 94403-1906 | ||||
| Principal Occupation During at Least the Past 5 Years: | ||||
| Director of various companies; and formerly, Chairman of the Board, The Hertz Corporation (car rental) (1980-2000) and Chief Executive | ||||
| Officer (1977-1999); and Chairman of the Board, President and Chief Executive Officer, UAL Corporation (airlines) (June - December 1987). | ||||
36 Annual Report
franklintempleton.com
FRANKLIN STRATEGIC SERIES
| Independent Board Members (continued) | ||||
| Number of Portfolios in | ||||
| Name, Year of Birth | Length of | Fund Complex Overseen | Other Directorships Held | |
| and Address | Position | Time Served | by Board Member* | During at Least the Past 5 Years |
| Larry D. Thompson (1945) | Trustee | Since 2007 | 145 | The Southern Company (energy |
| One Franklin Parkway | company) (2014-present; previously | |||
| San Mateo, CA 94403-1906 | 2010-2012), Graham Holdings | |||
| Company (education and media | ||||
| organization) (2011-present) and | ||||
| Cbeyond, Inc. (business | ||||
| communications provider) | ||||
| (2010-2012). | ||||
| Principal Occupation During at Least the Past 5 Years: | ||||
| Director of various companies; John A. Sibley Professor of Corporate and Business Law, University of Georgia School of Law (2015-present; | ||||
| previously 2011-2012); and formerly, Executive Vice President – Government Affairs, General Counsel and Corporate Secretary, PepsiCo, | ||||
| Inc. (consumer products) (2012-2014); Senior Vice President – Government Affairs, General Counsel and Secretary, PepsiCo, Inc. | ||||
| (2004-2011); Senior Fellow of The Brookings Institution (2003-2004); Visiting Professor, University of Georgia School of Law (2004); and | ||||
| Deputy Attorney General, U.S. Department of Justice (2001-2003). | ||||
| John B. Wilson (1959) | Lead | Trustee since | 121 | None |
| One Franklin Parkway | Independent | 2006 and Lead | ||
| San Mateo, CA 94403-1906 | Trustee | Independent | ||
| Trustee since | ||||
| 2008 | ||||
| Principal Occupation During at Least the Past 5 Years: | ||||
| President, Staples Europe (office supplies) (2012-present); President and Founder, Hyannis Port Capital, Inc. (real estate and private equity | ||||
| investing); serves on private and non-profit boards; and formerly, Chief Operating Officer and Executive Vice President, Gap, Inc. (retail) | ||||
| (1996-2000); Chief Financial Officer and Executive Vice President – Finance and Strategy, Staples, Inc. (1992-1996); Senior Vice President – | ||||
| Corporate Planning, Northwest Airlines, Inc. (airlines) (1990-1992); and Vice President and Partner, Bain & Company (consulting firm) | ||||
| (1986-1990). | ||||
| Interested Board Members and Officers | ||||
| Number of Portfolios in | ||||
| Name, Year of Birth | Length of | Fund Complex Overseen | Other Directorships Held | |
| and Address | Position | Time Served | by Board Member* | During at Least the Past 5 Years |
| **Gregory E. Johnson (1961) | Trustee | Since 2013 | 160 | None |
| One Franklin Parkway | ||||
| San Mateo, CA 94403-1906 | ||||
| Principal Occupation During at Least the Past 5 Years: | ||||
| Chairman of the Board, Member - Office of the Chairman, Director and Chief Executive Officer, Franklin Resources, Inc.; officer and/or director | ||||
| or trustee, as the case may be, of some of the other subsidiaries of Franklin Resources, Inc. and of 44 of the investment companies in Franklin | ||||
| Templeton Investments; Vice Chairman, Investment Company Institute; and formerly, President, Franklin Resources, Inc. (1994-2015). | ||||
| **Rupert H. Johnson, Jr. (1940) | Chairman of | Chairman of the | 145 | None |
| One Franklin Parkway | the Board and | Board since | ||
| San Mateo, CA 94403-1906 | Trustee | 2013 and Trustee | ||
| since 1991 | ||||
| Principal Occupation During at Least the Past 5 Years: | ||||
| Vice Chairman, Member – Office of the Chairman and Director, Franklin Resources, Inc.; Director, Franklin Advisers, Inc.; Senior Vice | ||||
| President, Franklin Advisory Services, LLC; and officer and/or director or trustee, as the case may be, of some of the other subsidiaries of | ||||
| Franklin Resources, Inc. and of 42 of the investment companies in Franklin Templeton Investments. | ||||
| Alison E. Baur (1964) | Vice President | Since 2012 | Not Applicable | Not Applicable |
| One Franklin Parkway | ||||
| San Mateo, CA 94403-1906 | ||||
| Principal Occupation During at Least the Past 5 Years: | ||||
| Deputy General Counsel, Franklin Templeton Investments; and officer of some of the other subsidiaries of Franklin Resources, Inc. and of 45 | ||||
| of the investment companies in Franklin Templeton Investments. | ||||
franklintempleton.com
Annual Report
37
FRANKLIN STRATEGIC SERIES
| Interested Board Members and Officers (continued) | ||||
| Number of Portfolios in | ||||
| Name, Year of Birth | Length of | Fund Complex Overseen | Other Directorships Held | |
| and Address | Position | Time Served | by Board Member* | During at Least the Past 5 Years |
| Laura F. Fergerson (1962) | Chief | Since 2009 | Not Applicable | Not Applicable |
| One Franklin Parkway | Executive | |||
| San Mateo, CA 94403-1906 | Officer – | |||
| Finance and | ||||
| Administration | ||||
| Principal Occupation During at Least the Past 5 Years: | ||||
| Senior Vice President, Franklin Templeton Services, LLC; Vice President, Franklin Advisers, Inc. and Franklin Templeton Institutional, LLC; and | ||||
| officer of 45 of the investment companies in Franklin Templeton Investments. | ||||
| Gaston Gardey (1967) | Treasurer, | Since 2009 | Not Applicable | Not Applicable |
| One Franklin Parkway | Chief Financial | |||
| San Mateo, CA 94403-1906 | Officer and | |||
| Chief | ||||
| Accounting | ||||
| Officer | ||||
| Principal Occupation During at Least the Past 5 Years: | ||||
| Treasurer, U.S. Fund Administration & Reporting, Franklin Templeton Investments; and officer of 28 of the investment companies in Franklin | ||||
| Templeton Investments. | ||||
| Aliya S. Gordon (1973) | Vice President | Since 2009 | Not Applicable | Not Applicable |
| One Franklin Parkway | ||||
| San Mateo, CA 94403-1906 | ||||
| Principal Occupation During at Least the Past 5 Years: | ||||
| Senior Associate General Counsel, Franklin Templeton Investments; and officer of 45 of the investment companies in Franklin Templeton | ||||
| Investments. | ||||
| Steven J. Gray (1955) | Vice President | Since 2009 | Not Applicable | Not Applicable |
| One Franklin Parkway | ||||
| San Mateo, CA 94403-1906 | ||||
| Principal Occupation During at Least the Past 5 Years: | ||||
| Senior Associate General Counsel, Franklin Templeton Investments; Vice President, Franklin Templeton Distributors, Inc. and Franklin | ||||
| Alternative Strategies Advisers, LLC; and officer of 45 of the investment companies in Franklin Templeton Investments. | ||||
| Robert Lim (1948) | Vice President | Since May 2016 | Not Applicable | Not Applicable |
| One Franklin Parkway | – AML | |||
| San Mateo, CA 94403-1906 | Compliance | |||
| Principal Occupation During at Least the Past 5 Years: | ||||
| Vice President, Franklin Templeton Companies, LLC; Chief Compliance Officer, Franklin Templeton Distributors, Inc. and Franklin Templeton | ||||
| Investor Services, LLC; and officer of 45 of the investment companies in Franklin Templeton Investments. | ||||
| Edward B. Jamieson (1948) | President and | Since 2010 | Not Applicable | Not Applicable |
| One Franklin Parkway | Chief | |||
| San Mateo, CA 94403-1906 | Executive | |||
| Officer – | ||||
| Investment | ||||
| Management | ||||
| Principal Occupation During at Least the Past 5 Years: | ||||
| President, Chief Investment Officer and Director, Franklin Advisers, Inc.; Executive Vice President, Franklin Templeton Institutional, LLC; and | ||||
| officer and/or trustee, as the case may be, of some of the other subsidiaries of Franklin Resources, Inc. and of 10 of the investment | ||||
| companies in Franklin Templeton Investments. | ||||
| Christopher J. Molumphy | Vice President | Since 2000 | Not Applicable | Not Applicable |
| (1962) | ||||
| One Franklin Parkway | ||||
| San Mateo, CA 94403-1906 | ||||
| Principal Occupation During at Least the Past 5 Years: | ||||
| Director and Executive Vice President, Franklin Advisers, Inc.; Executive Vice President, Franklin Templeton Institutional, LLC; and officer of | ||||
| some of the other subsidiaries of Franklin Resources, Inc. and of 22 of the investment companies in Franklin Templeton Investments. | ||||
38 Annual Report
franklintempleton.com
FRANKLIN STRATEGIC SERIES
| Interested Board Members and Officers (continued) | ||||
| Number of Portfolios in | ||||
| Name, Year of Birth | Length of | Fund Complex Overseen | Other Directorships Held | |
| and Address | Position | Time Served | by Board Member* | During at Least the Past 5 Years |
| Kimberly H. Novotny (1972) | Vice President | Since 2013 | Not Applicable | Not Applicable |
| 300 S.E. 2nd Street | ||||
| Fort Lauderdale, FL 33301-1923 | ||||
| Principal Occupation During at Least the Past 5 Years: | ||||
| Associate General Counsel, Franklin Templeton Investments; Vice President and Corporate Secretary, Fiduciary Trust International of the | ||||
| South; Vice President, Templeton Investment Counsel, LLC; Assistant Secretary, Franklin Resources, Inc.; and officer of 45 of the investment | ||||
| companies in Franklin Templeton Investments. | ||||
| Robert C. Rosselot (1960) | Chief | Since 2013 | Not Applicable | Not Applicable |
| 300 S.E. 2nd Street | Compliance | |||
| Fort Lauderdale, FL 33301-1923 | Officer | |||
| Principal Occupation During at Least the Past 5 Years: | ||||
| Director, Global Compliance, Franklin Templeton Investments; Vice President, Franklin Templeton Companies, LLC; officer of 45 of the | ||||
| investment companies in Franklin Templeton Investments; and formerly, Senior Associate General Counsel, Franklin Templeton Investments | ||||
| (2007-2013); and Secretary and Vice President, Templeton Group of Funds (2004-2013). | ||||
| Karen L. Skidmore (1952) | Vice President | Since 2006 | Not Applicable | Not Applicable |
| One Franklin Parkway | and Secretary | |||
| San Mateo, CA 94403-1906 | ||||
| Principal Occupation During at Least the Past 5 Years: | ||||
| Senior Associate General Counsel, Franklin Templeton Investments; and officer of 45 of the investment companies in Franklin Templeton | ||||
| Investments. | ||||
| Navid Tofigh (1972) | Vice President | Since November | Not Applicable | Not Applicable |
| One Franklin Parkway | 2005 | |||
| San Mateo, CA 94403-1906 | ||||
| Principal Occupation During at Least the Past 5 Years: | ||||
| Associate General Counsel, Franklin Templeton Investments; and officer of 45 of the investment companies in Franklin Templeton Investments. | ||||
| Craig S. Tyle (1960) | Vice President | Since 2005 | Not Applicable | Not Applicable |
| One Franklin Parkway | ||||
| San Mateo, CA 94403-1906 | ||||
| Principal Occupation During at Least the Past 5 Years: | ||||
| General Counsel and Executive Vice President, Franklin Resources, Inc.; and officer of some of the other subsidiaries of Franklin Resources, | ||||
| Inc. and of 45 of the investment companies in Franklin Templeton Investments. | ||||
| Lori A. Weber (1964) | Vice President | Since 2011 | Not Applicable | Not Applicable |
| 300 S.E. 2nd Street | ||||
| Fort Lauderdale, FL 33301-1923 | ||||
| Principal Occupation During at Least the Past 5 Years: | ||||
| Senior Associate General Counsel, Franklin Templeton Investments; Assistant Secretary, Franklin Resources, Inc.; Vice President and | ||||
| Secretary, Templeton Investment Counsel, LLC; and officer of 45 of the investment companies in Franklin Templeton Investments. | ||||
*We base the number of portfolios on each separate series of the U.S. registered investment companies within the Franklin Templeton Investments fund complex. These
portfolios have a common investment manager or affiliated investment managers.
**Gregory E. Johnson is considered to be an interested person of the Fund under the federal securities laws due to his position as an officer and director ofFranklin
Resources, Inc. (Resources), which is the parent company of the Fund’s investment manager and distributor. Rupert H. Johnson, Jr. is considered to be an interested person
of the Fund under the federal securities laws due to his position as officer and director and major shareholder of Resources.
Note 1: Rupert H. Johnson, Jr. is the uncle of Gregory E. Johnson.
Note 2: Officer information is current as of the date of this report. It is possible that after this date, information about officers may change.
The Sarbanes-Oxley Act of 2002 and Rules adopted by the Securities and Exchange Commission require the Fund to disclose whether the Fund’s Audit
Committee includes at least one member who is an audit committee financial expert within the meaning of such Act and Rules. The Fund’s Board has determined
that there is at least one such financial expert on the Audit Committee and has designated John B. Wilson as its audit committee financial expert. The Board
believes that Mr. Wilson qualifies as such an expert in view of his extensive business background and experience, including service as chief financial officer of
Staples, Inc. from 1992 to 1996. Mr. Wilson has been a Member and Chairman of the Fund’s Audit Committee since 2006. As a result of such background and
franklintempleton.com
Annual Report
39
FRANKLIN STRATEGIC SERIES
Interested Board Members and Officers (continued)
experience, the Board believes that Mr. Wilson has acquired an understanding of generally accepted accounting principles and financial statements, the general application of such principles in connection with the accounting estimates, accruals and reserves, and analyzing and evaluating financial statements that present a breadth and level of complexity of accounting issues generally comparable to those of the Fund, as well as an understanding of internal controls and procedures for financial reporting and an understanding of audit committee functions. Mr. Wilson is an independent Board member as that term is defined under the relevant Securities and Exchange Commission Rules and Releases.
The Statement of Additional Information (SAI) includes additional information about the board members and is available, without charge, upon request.
Shareholders may call (800) DIAL BEN/342-5236 to request the SAI.
40 Annual Report
franklintempleton.com
FRANKLIN STRATEGIC SERIES
FRANKLIN GLOBAL GOVERNMENT BOND FUND
Shareholder Information
Board Review of Investment Management Agreement
At a meeting held April 12, 2016, the Board of Trustees (Board), including a majority of trustees that are not “interested persons” as such term is defined in section 2(a)(19) of the Investment Company Act of 1940 (hereinafter referred to as “non-interested Trustees” or “independent Trustees”), approved renewal of the investment management agreement for each of the separate funds within the Trust (Fund(s)). In reaching this decision, the Board took into account information furnished throughout the year at regular Board meetings, as well as information prepared specifically in connection with the annual renewal review process. Information furnished and discussed throughout the year included investment performance reports and related financial information for the Fund, along with periodic reports on expenses, shareholder services, legal and compliance matters, risk control, pricing, brokerage commissions and execution, and other services provided by the Investment Manager (Manager) and its affiliates, as well as marketing support payments made to financial intermediaries. Information furnished specifically in connection with the renewal process included a report for each Fund prepared by Broadridge Financial Solutions, Inc. (Broadridge), an independent organization, as well as additional material, including a Fund profitability analysis prepared by management. The Broadridge reports, which utilize data from Lipper, Inc. (Lipper), compared each Fund’s investment performance and expenses with those of other mutual funds deemed comparable to the Fund as selected by Lipper. The Fund profitability analysis discussed the profitability to Franklin Templeton Investments (FTI) from its overall U.S. fund operations, as well as on an individual fund-by-fund basis. Additional material accompanying such profitability analysis included information on a fund-by-fund basis listing portfolio managers and other accounts they manage, as well as information on management fees charged by the Manager and its affiliates to U.S. mutual funds and other accounts, including management’s explanation of differences where relevant. Such material also included a memorandum prepared by management describing project initiatives and capital investments relating to the services provided to the Funds by the FTI organization, as well as a memorandum relating to economies of scale and an analysis concerning transfer agent fees charged by an affiliate of the Manager. The Board also received a report on all marketing support payments made by FTI to financial intermediaries during the past year, as well as a memorandum relating to third-party servicing arrangements in response to a Guidance Update from the U.S. Securities and Exchange Commission (SEC) relating to mutual fund distribution and sub-accounting fees.
In considering such materials, the independent Trustees received assistance and advice from and met separately with independent counsel. While the investment management agreements for all Funds were considered at the same Board meeting, the Board dealt with each Fund separately. In approving continuance of the investment management agreement for each Fund, the Board, including a majority of independent Trustees, determined that the existing management fee structure was fair and reasonable and that continuance of the investment management agreement was in the best interests of such Fund and its shareholders. While attention was given to all information furnished, the following discusses some primary factors relevant to the Board’s decision.
NATURE, EXTENT AND QUALITY OF SERVICES. The Board was satisfied with the nature and quality of the overall services provided by the Manager and its affiliates to the Funds and their shareholders, except as noted later in the discussion of investment performance and expenses. The Board’s opinion was based, in part, upon periodic reports furnished it showing that the investment policies and restrictions for the Fund were consistently complied with as well as other reports periodically furnished the Board covering matters such as the compliance of portfolio managers and other management personnel with the code of ethics adopted throughout the Franklin Templeton fund complex, the adherence to fair value pricing procedures established by the Board, and the accuracy of net asset value calculations. The Board also noted the extent of benefits provided Fund shareholders from being part of the Franklin Templeton family of funds, including the right to exchange investments between the same class of shares of different funds without a sales charge, the ability to reinvest Fund dividends into other funds and the right to combine holdings in other funds to obtain a reduced sales charge. Favorable consideration was given to management’s continual efforts and expenditures in establishing effective business continuity plans and developing strategies to address cybersecurity threats. Additionally, the Board noted the Manager’s continued attention to pricing and valuation issues, particularly with respect to complex securities. Among other factors taken into
franklintempleton.com
Annual Report
41
FRANKLIN STRATEGIC SERIES
FRANKLIN GLOBAL GOVERNMENT BOND FUND
SHAREHOLDER INFORMATION
account by the Board were the Manager’s best execution trading policies, including a favorable report by an independent portfolio trading analytical firm that also covered FOREX transactions. Consideration was also given to the experience of the Fund’s portfolio management team, the number of accounts managed and general method of compensation. In this latter respect, the Board noted that a primary factor in management’s determination of a portfolio manager’s bonus compensation was the relative investment performance of the funds he or she managed and that a portion of such bonus was required to be invested in a pre-designated list of funds within such person’s fund management area so as to be aligned with the interests of shareholders. The Board also took into account the quality of transfer agent and shareholder services provided Fund shareholders by an affiliate of the Manager and steps taken by FTI to enhance analytical support to the investment management groups and provide additional oversight of liquidity risk and complex securities. The Board also took into account, among other things, management’s efforts in establishing a global credit facility for the benefit of the Fund and other accounts managed by FTI to provide a source of cash for temporary and emergency purposes or to meet unusual redemption requests as well as the strong financial position of the Manager’s parent company and its commitment to the mutual fund business as evidenced by its continued introduction of new funds and reassessment of the fund offerings in response to the market environment.
INVESTMENT PERFORMANCE. The Board placed significant emphasis on the investment performance of the Fund in view of its importance to shareholders. While consideration was given to performance reports and discussions with portfolio managers at Board meetings throughout the year, particular attention in assessing performance was given to the Broadridge reports furnished for the agreement renewals. The Broadridge reports prepared for the Fund showed the investment performance of its Class A shares in comparison to a performance universe selected by Lipper. Comparative performance for the Fund was shown for the one-year period ended January 31, 2016, and previous periods ended that date of up to 10 years depending on when a particular Fund commenced operations. The following summarizes the performance results for the Fund and the Board’s view of such performance.
The performance universe for this Fund consisted of the Fund and all retail and institutional global income funds as selected by Lipper. The Broadridge report showed the Fund’s total return for the one-year period to be in the middle performing quintile of its performance universe. The Board found the Fund’s performance to be satisfactory, taking into account that the Fund has been operational for less than three full years.
COMPARATIVE EXPENSES. Consideration was given to the management fees and total expense ratio of the Fund compared with those of a group of other funds selected by Lipper as its appropriate Lipper expense group. Lipper expense data is based upon information taken from the Fund’s most recent annual report, which reflects historical asset levels that may be quite different from those currently existing, particularly in a period of market volatility. While recognizing such inherent limitation and the fact that expense ratios generally increase as assets decline and decrease as assets grow, the Board believed the independent analysis conducted by Lipper to be an appropriate measure of comparative expenses. In reviewing comparative costs, Lipper provides information on the Fund’s contractual investment management fee in comparison with the investment management fee that would have been charged by other funds within its Lipper expense group assuming they were similar in size to the Fund, as well as the actual total expense ratio of the Fund in comparison with those of its Lipper expense group. The Lipper contractual investment management fee analysis includes administrative charges as being part of the investment management fee, and actual total expenses, for comparative consistency, are shown by Lipper for Fund Class A shares for funds with multiple classes of shares. The contractual investment management fee rate for Franklin Global Government Bond Fund was in the second most expensive quintile of its Lipper expense group, while its actual total expense ratio was in the least expensive quintile of such expense group. The Board found the contractual management fee rate and total expense ratio of the Fund to be acceptable, noting that the total expenses for each Fund were subsidized by management.
42 Annual Report
franklintempleton.com
FRANKLIN STRATEGIC SERIES
FRANKLIN GLOBAL GOVERNMENT BOND FUND
SHAREHOLDER INFORMATION
MANAGEMENT PROFITABILITY. The Board also considered the level of profits realized by the Manager and its affiliates in connection with the operation of the Fund. In this respect, the Board reviewed the Fund profitability analysis that addresses the overall profitability of Franklin Templeton’s U.S. fund business, as well as its profits in providing management and other services to the Fund during the 12-month period ended September 30, 2015, being the most recent fiscal year end for Franklin Resources, Inc., the Manager’s parent. In reviewing the analysis, the Board recognized that allocation methodologies are inherently subjective and various allocation methodologies may be reasonable while producing different results. In this respect, the Board noted that while management continually makes refinements to its methodologies in response to organizational and product related changes, the overall approach as defined by the primary drivers and activity measurements has remained consistent with that used in the Funds’ profitability report presentations from prior years. Additionally, the Funds’ independent registered public accounting firm had been engaged by the Manager to periodically review the reasonableness of the allocation methodologies to be used solely by the Funds’ Board in reference to the profitability analysis. In reviewing and discussing such analysis, management discussed with the Board its belief that costs incurred in establishing the infrastructure necessary for the type of mutual fund operations conducted by the Manager and its affiliates may not be fully reflected in the expenses allocated to the Fund in determining its profitability, as well as the fact that the level of profits, to a certain extent, reflected operational cost savings and efficiencies initiated by management. The Board also took into account management’s expenditures in improving shareholder services provided the Funds, as well as the need to implement systems and meet additional regulatory and compliance requirements resulting from statutes such as the Sarbanes-Oxley and Dodd-Frank Acts and recent SEC and other regulatory requirements. In addition, the Board considered a third-party study comparing the profitability of the Manager’s parent on an overall basis to other publicly held managers broken down to show profitability from management operations exclusive of distribution expenses, as well as profitability including distribution expenses. The Board also considered the extent to which the Manager and its affiliates might derive ancillary benefits from fund operations, including revenues generated from transfer agent services, potential benefits resulting from personnel and systems enhancements necessitated by fund growth, as well as increased leverage with the service providers and counterparties, allocation of fund brokerage and the use of commission dollars to pay for research. Based upon its consideration of all these factors, the Board determined that the level of profits realized by the Manager and its affiliates from providing services to the Fund was not excessive in view of the nature, quality and extent of services provided.
ECONOMIES OF SCALE. The Board also considered whether economies of scale are realized by the Manager as the Funds grow larger and the extent to which this is reflected in the level of management fees charged. While recognizing that any precise determination is inherently subjective, the Board noted that based upon the Fund profitability analysis, it appears that as some funds get larger, at some point economies of scale do result in the Manager realizing a larger profit margin on management services provided such a fund. The Board noted that economies of scale were shared with the Fund and its shareholders through management fee breakpoints so that as a fund grows in size, its effective management fee rate declines. The fee structure under the investment management agreement for the Fund contains breakpoints that continued to asset levels that exceeded its asset size at December 31, 2015. In view of such fee structure and the favorable expense comparisons of the Fund within its respective expense group, the Board believed that to the extent economies of scale may be realized by the Manager of the Funds and its affiliates, that there was a sharing of benefits with the Funds and their shareholders.
franklintempleton.com
Annual Report
43
FRANKLIN STRATEGIC SERIES
FRANKLIN GLOBAL GOVERNMENT BOND FUND
SHAREHOLDER INFORMATION
Proxy Voting Policies and Procedures
The Fund’s investment manager has established Proxy Voting Policies and Procedures (Policies) that the Fund uses to determine how to vote proxies relating to portfolio securities. Shareholders may view the Fund’s complete Policies online at franklintempleton.com. Alternatively, shareholders may request copies of the Policies free of charge by calling the Proxy Group collect at (954) 527-7678 or by sending a written request to: Franklin Templeton Companies, LLC, 300 S.E. 2nd Street, Fort Lauderdale, FL 33301, Attention: Proxy Group. Copies of the Fund’s proxy voting records are also made available online at franklintempleton.com and posted on the U.S. Securities and Exchange Commission’s website at sec.gov and reflect the most recent 12-month period ended June 30.
Quarterly Statement of Investments
The Trust, on behalf of the Fund, files a complete statement of investments with the U.S. Securities and Exchange Commission for the first and third quarters for each fiscal year on Form N-Q. Shareholders may view the filed Form N-Q by visiting the Commission’s website at sec.gov. The filed form may also be viewed and copied at the Commission’s Public Reference Room in Washington, DC. Information regarding the operations of the Public Reference Room may be obtained by calling (800) SEC-0330.
Householding of Reports and Prospectuses
You will receive the Fund’s financial reports every six months as well as an annual updated summary prospectus (prospectus available upon request). To reduce Fund expenses, we try to identify related shareholders in a household and send only one copy of the financial reports and summary prospectus. This process, called “householding,” will continue indefinitely unless you instruct us otherwise. If you prefer not to have these documents householded, please call us at (800) 632-2301. At any time you may view current prospectuses/summary prospectuses and financial reports on our website. If you choose, you may receive these documents through electronic delivery.
44 Annual Report
franklintempleton.com
Item 2. Code of Ethics.
(a) The Registrant has adopted a code of ethics that applies to its principal executive officers and principal financial and accounting officer.
(c) N/A
(d) N/A
(f) Pursuant to Item 12(a)(1), the Registrant is attaching as an exhibit a copy of its code of ethics that applies to its principal executive officers and principal financial and accounting officer.
Item 3. Audit Committee Financial Expert.
(a)(1) The Registrant has an audit committee financial expert serving on its audit committee.
(2) The audit committee financial expert is John B. Wilson and he is "independent" as defined under the relevant Securities and Exchange Commission Rules and Releases.
Item 4. Principal Accountant Fees and Services.
(a) Audit Fees
The aggregate fees paid to the principal accountant for professional services rendered by the principal accountant for the audit of the registrant’s annual financial statements or for services that are normally provided by the principal accountant in connection with statutory and regulatory filings or engagements were $410,182 for the fiscal year ended April 30, 2016 and $452,420 for the fiscal year ended April 30, 2015.
(b) Audit-Related Fees
There were no fees paid to the principal accountant for assurance and related services rendered by the principal accountant to the registrant that are reasonably related to the performance of the audit of the registrant's financial statements and are not reported under paragraph (a) of Item 4.
There were no fees paid to the principal accountant for assurance and related services rendered by the principal accountant to the registrant's investment adviser and any entity controlling, controlled by or under common control with the investment adviser that provides ongoing services to the registrant that are reasonably related to the performance of the audit of their financial statements.
(c) Tax Fees
There were no fees paid to the principal accountant for professional services rendered by the principal accountant to the registrant for tax compliance, tax advice and tax planning.
There were no fees paid to the principal accountant for professional services rendered by the principal accountant to the registrant’s investment adviser and any entity controlling, controlled by or under common control with the investment adviser that provides ongoing services to the registrant for tax compliance, tax advice and tax planning.
(d) All Other Fees
There were no fees paid to the principal accountant for products and services rendered by the principal accountant to the registrant not reported in paragraphs (a)-(c) of Item 4.
The aggregate fees paid to the principal accountant for products and services rendered by the principal accountant to the registrant’s investment adviser and any entity controlling, controlled by or under common control with the investment adviser that provides ongoing services to the registrant other than services reported in paragraphs (a)-(c) of Item 4 were $676,383 for the fiscal year ended April 30, 2016 and $3,519 for the fiscal year ended April 30, 2015. The services for which these fees were paid included preparation and review of materials provided to the fund Board in connection with the investment management contract renewal process and derivatives assessment, the review of system processes related to fixed income securities and XBRL tagging on financial statements. Other services include compliance examination for Investment Advisor Act rule 204-2 and 206-4(2).
(e) (1) The registrant’s audit committee is directly responsible for approving the services to be provided by the auditors, including:
(i) pre-approval of all audit and audit related services;
(ii) pre-approval of all non-audit related services to be provided to the Fund by the auditors;
(iii) pre-approval of all non-audit related services to be provided to the registrant by the auditors to the registrant’s investment adviser or to any entity that controls, is controlled by or is under common control with the registrant’s investment adviser and that provides ongoing services to the registrant where the non-audit services relate directly to the operations or financial reporting of the registrant; and
(iv) establishment by the audit committee, if deemed necessary or appropriate, as an alternative to committee pre-approval of services to be provided by the auditors, as required by paragraphs (ii) and (iii) above, of policies and procedures to permit such services to be pre-approved by other means, such as through establishment of guidelines or by action of a designated member or members of the committee; provided the policies and procedures are detailed as to the particular service and the committee is informed of each service and such policies and procedures do not include delegation of audit committee responsibilities, as contemplated under the Securities Exchange Act of 1934, to management; subject, in the case of (ii) through (iv), to any waivers, exceptions or exemptions that may be available under applicable law or rules.
(e) (2) None of the services provided to the registrant described in paragraphs (b)-(d) of Item 4 were approved by the audit committee pursuant to paragraph (c)(7)(i)(C) of Rule 2-01 of regulation S-X.
(f) No disclosures are required by this Item 4(f).
(g) The aggregate non-audit fees paid to the principal accountant for services rendered by the principal accountant to the registrant and the registrant’s investment adviser and any entity controlling, controlled by or under common control with the investment adviser that provides ongoing services to the registrant were $676,383 for the fiscal year ended April 30, 2016 and $3,519 for the fiscal year ended April 30, 2015.
(h) The registrant’s audit committee of the board has considered whether the provision of non-audit services that were rendered to the registrant’s investment adviser (not including any sub-adviser whose role is primarily portfolio management and is subcontracted with or overseen by another investment adviser), and any entity controlling, controlled by, or under common control with the investment adviser that provides ongoing services to the registrant that were not pre-approved pursuant to paragraph (c)(7)(ii) of Rule 2-01 of Regulation S-X is compatible with maintaining the principal accountant’s independence.
Item 5. Audit Committee of Listed Registrants. N/A
Item 6. Schedule of Investments. N/A
Item 7. Disclosure of Proxy Voting Policies and Procedures for Closed-End Management Investment Companies. N/A
Item 8. Portfolio Managers of Closed-End Management Investment Companies. N/A
Item 9. Purchases of Equity Securities by Closed-End Management Investment Company and Affiliated Purchasers. N/A
Item 10. Submission of Matters to a Vote of Security Holders.
There have been no changes to the procedures by which shareholders may recommend nominees to the Registrant's Board of Trustees that would require disclosure herein.
Item 11. Controls and Procedures.
(a) Evaluation of Disclosure Controls and Procedures. The Registrant maintains disclosure controls and procedures that are designed to ensure that information required to be disclosed in the Registrant’s filings under the Securities Exchange Act of 1934 and the Investment Company Act of 1940 is recorded, processed, summarized and reported within the periods specified in the rules and forms of the Securities and Exchange Commission. Such information is accumulated and communicated to the Registrant’s management, including its principal executive officer and principal financial officer, as appropriate, to allow timely decisions regarding required disclosure. The Registrant’s management, including the principal executive officer and the principal financial officer, recognizes that any set of controls and procedures, no matter how well designed and operated, can provide only reasonable assurance of achieving the desired control objectives.
Within 90 days prior to the filing date of this Shareholder Report on Form N-CSR, the Registrant had carried out an evaluation, under the supervision and with the participation of the Registrant’s management, including the Registrant’s principal executive officer and the Registrant’s principal financial officer, of the effectiveness of the design and operation of the Registrant’s disclosure controls and procedures. Based on such evaluation, the Registrant’s principal executive officer and principal financial officer concluded that the Registrant’s disclosure controls and procedures are effective.
(b) Changes in Internal Controls. There have been no changes in the Registrant’s internal controls or in other factors that could materially affect the internal controls over financial reporting subsequent to the date of their evaluation in connection with the preparation of this Shareholder Report on Form N-CSR.
Item 12. Exhibits.
(a) (1) Code of Ethics
(a) (2) Certifications pursuant to Section 302 of the Sarbanes-Oxley Act of 2002 of Laura F. Fergerson, Chief Executive Officer - Finance and Administration, and Gaston Gardey, Chief Financial Officer and Chief Accounting Officer
(b) Certifications pursuant to Section 906 of the Sarbanes-Oxley Act of 2002 of Laura F. Fergerson, Chief Executive Officer - Finance and Administration, and Gaston Gardey, Chief Financial Officer and Chief Accounting Officer
SIGNATURES
Pursuant to the requirements of the Securities Exchange Act of 1934 and the Investment Company Act of 1940, the registrant has duly caused this report to be signed on its behalf by the undersigned, thereunto duly authorized.
FRANKLIN STRATEGIC SERIES
By /s/Laura F. Fergerson
Laura F. Fergerson
Chief Executive Officer –
Finance and Administration
Date June 24, 2016
Pursuant to the requirements of the Securities Exchange Act of 1934 and the Investment Company Act of 1940, this report has been signed below by the following persons on behalf of the registrant and in the capacities and on the dates indicated.
By /s/Laura F. Fergerson
Laura F. Fergerson
Chief Executive Officer –
Finance and Administration
Date June 24, 2016
By /s/Gaston Gardey
Gaston Gardey
Chief Financial Officer and
Chief Accounting Officer
Date June 24, 2016