UNITED STATES
SECURITIES AND EXCHANGE COMMISSION
Washington, DC 20549
FORM N-CSR
CERTIFIED SHAREHOLDER REPORT OF REGISTERED MANAGEMENT INVESTMENT COMPANIES
Investment Company Act file number 811-06243
Franklin Strategic Series
(Exact name of registrant as specified in charter)
_One Franklin Parkway, San Mateo, Ca 94403-1906
(Address of principal executive offices) (Zip code)
_Craig S. Tyle, One Franklin Parkway, San Mateo, CA 94403-1906
(Name and address of agent for service)
Registrant's telephone number, including area code: 650 312-2000
Date of fiscal year end: 4/30
Date of reporting period: 4/30/15
Item 1. Reports to Stockholders.
Franklin Templeton Investments
Gain From Our Perspective®
At Franklin Templeton Investments, we’re dedicated to one goal: delivering exceptional asset management for our clients. By bringing together multiple, world-class investment teams in a single firm, we’re able to offer specialized expertise across styles and asset classes, all supported by the strength and resources of one of the world’s largest asset managers. This has helped us to become a trusted partner to individual and institutional investors across the globe.
Focus on Investment Excellence
At the core of our firm, you’ll find multiple independent investment teams—each with a focused area of expertise—from traditional to alternative strategies and multi-asset solutions. And because our portfolio groups operate autonomously, their strategies can be combined to deliver true style and asset class diversification.
All of our investment teams share a common commitment to excellence grounded in rigorous, fundamental research and robust, disciplined risk management. Decade after decade, our consistent, research-driven processes have helped Franklin Templeton earn an impressive record of strong, long-term results.
Global Perspective Shaped by Local Expertise
In today’s complex and interconnected world, smart investing demands a global perspective. Franklin Templeton pioneered international investing over 60 years ago, and our expertise in emerging markets spans more than a quarter of a century. Today, our investment professionals are on the ground across the globe, spotting investment ideas and potential risks firsthand. These locally based teams bring in-depth understanding of local companies, economies and cultural nuances, and share their best thinking across our global research network.
Strength and Experience
Franklin Templeton is a global leader in asset management serving clients in over 150 countries.1 We run our business with the same prudence we apply to asset management, staying focused on delivering relevant investment solutions, strong long-term results and reliable, personal service. This approach, focused on putting clients first, has helped us to become one of the most trusted names in financial services.
1. As of 12/31/14. Clients are represented by the total number of shareholder accounts.
Not FDIC Insured | May Lose Value | No Bank Guarantee
| Contents | |
| Shareholder Letter | 1 |
| Annual Report | |
| Economic and Market Overview | 3 |
| Franklin Flex Cap Growth Fund | 4 |
| Franklin Focused Core | |
| Equity Fund | 14 |
| Franklin Growth Opportunities Fund | 24 |
| Franklin Small Cap Growth Fund | 34 |
| Franklin Small-Mid Cap | |
| Growth Fund | 44 |
| Financial Highlights and | |
| Statements of Investments | 54 |
| Financial Statements | 94 |
| Notes to Financial Statements | 103 |
| Report of Independent Registered | |
| Public Accounting Firm | 118 |
| Tax Information | 119 |
| Board Members and Officers | 120 |
| Shareholder Information | 125 |
| franklintempleton.com |
1
Annual Report
Economic and Market Overview
U.S. economic growth moderated during the 12 months ended April 30, 2015, especially in the second half of the review period. The economy grew for most of 2014, supported in some quarters by greater spending by consumers, businesses, and state and local governments, partially offset by the negative impacts of a wider trade deficit and lower federal defense spending. In the first quarter of 2015, factors including low energy prices and U.S. dollar strength led exports to decline. In addition, harsh weather and labor disruptions weighed on business spending. Manufacturing and non-manufacturing activities increased, and the unemployment rate declined to 5.4% at period-end from 6.2% in April 2014.1 Housing market data were positive for most of the period as home sales and prices rose while mortgage rates declined. After a brief slump during the period, retail sales rebounded toward period-end as auto sales surged. Inflation, as measured by the Consumer Price Index, remained subdued during the past 12 months but rose late in the period amid higher energy prices bouncing from recent lows.
The Federal Reserve Board (Fed) ended its bond buying program in October 2014, based on its view that underlying economic strength could support ongoing progress in labor market conditions. Although the Fed had repeatedly stated that it could be patient with regard to raising interest rates, in March 2015, the Fed removed the word “patient” from its monetary policy guidance. It added, however, that it might keep interest rates lower than what it viewed as normal. In its April 2015 meeting, the Fed attributed the economy’s first-quarter slowdown to transitory factors. The Fed reiterated that it would raise interest rates when it saw further improvement in the labor market and was reasonably confident that inflation would move back to its 2% objective over the medium term.
Investor confidence grew during the period as corporate profits remained healthy, the Fed maintained its cautious tone on raising interest rates and China introduced more stimulus measures. The stock markets endured some sell-offs when many investors reacted to political instability in certain emerging markets, Greece’s debt negotiations and relatively weak economic growth in Europe and Japan, as well as less robust growth in China. U.S. stocks rose overall for the 12 months under review as the Standard & Poor’s 500 Index and the Dow Jones Industrial Average reached all-time highs.
The foregoing information reflects our analysis and opinions as of April 30, 2015. The information is not a complete analysis of every aspect of any market, country, industry, security or fund. Statements of fact are from sources considered reliable.
1. Source: Bureau of Labor Statistics.
franklintempleton.com
Annual Report
| 3
Franklin Flex Cap Growth Fund
This annual report for Franklin Flex Cap Growth Fund covers the fiscal year ended April 30, 2015.
Your Fund’s Goal and Main Investments
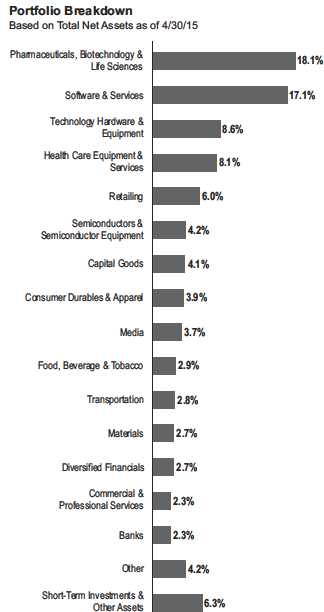
The Fund seeks capital appreciation. The Fund normally invests predominantly in equity securities of companies that the manager believes have the potential for capital appreciation. The Fund has flexibility to invest in companies located, headquartered or operating inside and outside the U.S., across the entire market capitalization spectrum from small, emerging growth companies to well-established, large cap companies.
Performance Overview
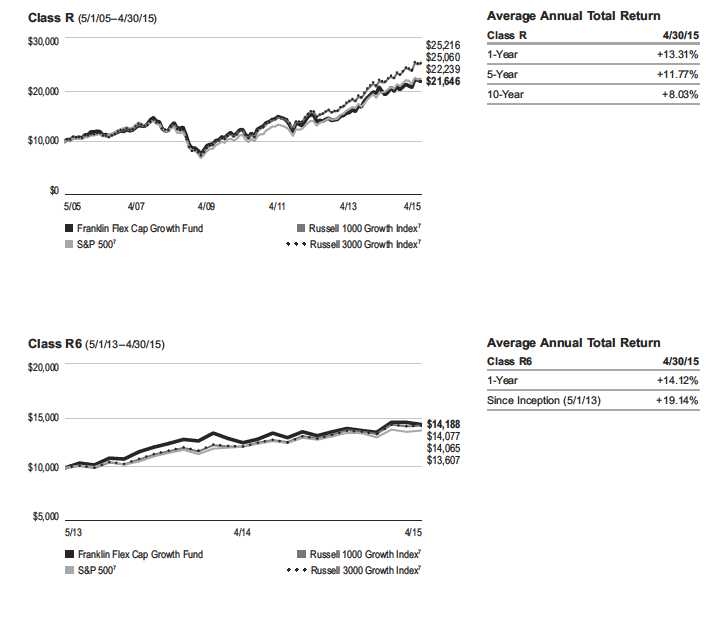
For the 12 months under review, the Fund’s Class A shares delivered a +13.59% cumulative total return. In comparison, the Fund’s narrow benchmark, the Russell 3000® Growth Index, which measures performance of Russell 3000® Index companies with higher price-to-book ratios and higher forecasted growth values, generated a +16.50% total return.1 Also in comparison, the Russell 1000® Growth Index, which tracks performance of the largest companies in the Russell 3000® Index with higher price-to-book ratios and higher forecasted growth values, produced a +16.67% total return.1 Additionally, the Fund’s broad benchmark, the Standard & Poor’s 500 Index (S&P 500®), which tracks the broad U.S. stock market, posted a +12.98% total return.1 You can find the Fund’s long-term performance data in the Performance Summary beginning on page 7.
Performance data represent past performance, which does not guarantee future results. Investment return and principal value will fluctuate, and you may have a gain or loss when you sell your shares. Current performance may differ from figures shown. Please visit franklintempleton.com or call (800) 342-5236 for most recent month-end performance.
Investment Strategy
We use fundamental, bottom-up research to seek companies meeting our criteria of growth potential, quality and valuation. In seeking sustainable growth characteristics, we look for companies we believe can produce sustainable earnings and cash flow growth, evaluating the long-term market opportunity and competitive structure of an industry to target leaders and emerging leaders. We define quality companies as those with
strong and improving competitive positions in attractive markets. We also believe important attributes of quality are experienced and talented management teams as well as financial strength reflected in the capital structure, gross and operating margins, free cash flow generation and returns on capital employed. Our valuation analysis includes a range of potential outcomes based on an assessment of multiple
1. Source: Morningstar. Russell Investment Group is the source and owner of the trademarks, service marks and copyrights related to the Russell Indexes.
Russell® is a trademark of Russell Investment Group.
The indexes are unmanaged and include reinvested dividends. One cannot invest directly in an index, and an index is not representative of the Fund’s portfolio.
The dollar value, number of shares or principal amount, and names of all portfolio holdings are listed in the Fund’s Statement of Investments (SOI).
The SOI begins on page 59.
4 | Annual Report
franklintempleton.com
FRANKLIN FLEX CAP GROWTH FUND
| Top 10 Equity Holdings | ||
| 4/30/15 | ||
| Company | % of Total | |
| Sector/Industry | Net Assets | |
| Apple Inc. | 6.6 | % |
| Technology Hardware & Equipment | ||
| Actavis PLC | 3.9 | % |
| Pharmaceuticals, Biotechnology & Life Sciences | ||
| Biogen Inc. | 3.1 | % |
| Pharmaceuticals, Biotechnology & Life Sciences | ||
| MasterCard Inc., A | 3.0 | % |
| Software & Services | ||
| Celgene Corp. | 2.2 | % |
| Pharmaceuticals, Biotechnology & Life Sciences | ||
| LinkedIn Corp., A | 2.0 | % |
| Software & Services | ||
| Affiliated Managers Group Inc. | 2.0 | % |
| Diversified Financials | ||
| Amazon.com Inc. | 2.0 | % |
| Retailing | ||
| NXP Semiconductors NV (Netherlands) | 2.0 | % |
| Semiconductors & Semiconductor Equipment | ||
| McKesson Corp. | 2.0 | % |
| Health Care Equipment & Services | ||
scenarios. In assessing value, we consider whether security prices fully reflect the balance of the sustainable growth opportunities relative to business and financial risks.
Manager’s Discussion
During the 12 months under review, nearly all sectors represented in the Fund’s portfolio delivered gains and contributed to absolute performance. Relative to the Russell 3000® Growth Index, major contributors included stock selection in the information technology (IT), health care and consumer staples sectors.2
In the IT sector, top performers included game software content and services firm Electronic Arts, cybersecurity company Palo Alto Networks and an off-benchmark investment in integrated circuit manufacturer NXP Semiconductors. Electronic Arts generated fiscal fourth-quarter 2015 results above its guidance, driven by an increase in revenues from its console and mobile platforms, while revenues from its personal computer and other platform segments declined moderately. NXP Semiconductors generated positive 2014 and first-quarter 2015 results, with strong performance across its high-performance mixed signal and standard products segments. Shares surged after the company announced its acquisition of Freescale Semiconductor to expand its market share in the chips industry.
Within health care, our holdings in specialty pharmaceutical company Actavis and medical device company DexCom were among the strongest contributors to relative returns. Actavis’s share price rose as the company reported strong demand for its products and completed several acquisitions during the year. Most notable was the acquisition of aesthetics and dermatology company Allergan. Post the merger the company announced its intention to adopt “Allergan” as its new corporate name. DexCom reported growth in revenues and a lower net loss for 2014 and also generated a profit for the first time in the fourth quarter of 2014. During the period, the company received Food and Drug Administration approval for its continuous glucose monitoring remote mobile communications device, DexCom SHARE. In the consumer staples sector, energy drink company Monster Beverage contributed to relative returns. Monster shares advanced after the company entered into a long-term strategic partnership with Coca-Cola to accelerate growth in the fast-growing energy drink category. Monster’s healthy domestic and international sales growth supported the stock price.
Elsewhere, apparel and footwear manufacturer Under Armour performed well. The company reported growth across all its business segments: apparel, footwear and accessories. Additionally, the company raised its 2015 revenue and operating income guidance as it continues to expand its brand internationally.
In contrast, stock selection in the consumer discretionary, industrials and energy sectors detracted from the Fund’s relative performance.3
In the consumer discretionary sector, our positions in luxury goods maker and retailer Michael Kors Holdings4 and full-service restaurant company Chuy’s Holdings4 hurt relative performance. Michael Kors’s share price suffered as discounts
2. The IT sector comprises semiconductors and semiconductor equipment, software and services, and technology hardware and equipment in the SOI. The health care
sector comprises health care equipment and services; and pharmaceuticals, biotechnology and life sciences in the SOI. The consumer staples sector comprises food
and staples retailing; and food, beverage and tobacco in the SOI.
3. The consumer discretionary sector comprises automobiles and components, consumer durables and apparel, consumer services, media and retailing in the SOI.
The industrials sector comprises capital goods, commercial and professional services, and transportation in the SOI.
4. No longer held at period-end.
See www.franklintempletondatasources.com for additional data provider information.
franklintempleton.com Annual Report | 5
FRANKLIN FLEX CAP GROWTH FUND
on its fall inventory led to narrower margins in the first quarter. The company’s share price declined, despite an increase in its quarterly revenues and earnings, as comparable store sales growth was lower than the company’s estimates. Shares of Chuy’s Holdings declined after the company reported lower-than-expected quarterly earnings and sales growth decreased due to unfavorable weather conditions.
In the industrials sector, our positions in metal components manufacturer Precision Castparts4 and commercial foodservice and heavy equipment manufacturer Manitowoc4 weighed on relative performance. Manitowoc reported disappointing first-quarter 2015 results amid reduced revenues from the food-service and crane segments and an adverse foreign exchange impact. Additionally, the company announced flat revenue guidance for the foodservice segment and a decline in crane revenues for 2015.
Energy stocks generally retreated as crude oil prices fell sharply during the period resulting mainly from excess global supply from North American shale producers. Several of our energy holdings detracted from relative returns, particularly our positions in oil and gas companies Oasis Petroleum4 and Rice Energy.4 Oasis Petroleum’s fourth-quarter 2014 revenues decreased mainly due to falling commodity prices and the company’s average daily oil production exceeding its guidance range.
Other key individual detractors included our position in 3D printing company Stratasys.4 Shares of Stratasys declined after the company projected weak quarterly results and cut its 2015 guidance. The company generated muted first-quarter 2015 revenues and posted a net loss.
Conducting ongoing reviews of our portfolio holdings and investment process are critical elements in our efforts to provide consistently strong results. In recent quarters, these reviews have led us to focus on those investments in which we have the highest levels of conviction. This focus is reflected in larger position sizes in some holdings and an overall reduction in the number of Fund positions. We believe the key strength of our investment strategy is the long-standing emphasis on bottom-up, fundamental research that in our view has the potential to generate superior long-term risk-adjusted returns.
Thank you for your continued participation in Franklin Flex Cap Growth Fund. We look forward to serving your future investment needs.

The foregoing information reflects our analysis, opinions and portfolio holdings as of April 30, 2015, the end of the reporting period. The way we implement our main investment strategies and the resulting portfolio holdings may change depending on factors such as market and economic conditions. These opinions may not be relied upon as investment advice or an offer for a particular security. The information is not a complete analysis of every aspect of any market, country, industry, security or the Fund. Statements of fact are from sources considered reliable, but the investment manager makes no representation or warranty as to their completeness or accuracy. Although historical performance is no guarantee of future results, these insights may help you understand our investment management philosophy.
CFA® is a trademark owned by CFA Institute.
6 | Annual Report
franklintempleton.com
FRANKLIN FLEX CAP GROWTH FUND
Performance Summary as of April 30, 2015
Your dividend income will vary depending on dividends or interest paid by securities in the Fund’s portfolio, adjusted for operating expenses of each class. Capital gain distributions are net profits realized from the sale of portfolio securities. The performance table and graphs do not reflect any taxes that a shareholder would pay on Fund dividends, capital gain distributions, if any, or any realized gains on the sale of Fund shares. Total return reflects reinvestment of the Fund’s dividends and capital gain distributions, if any, and any unrealized gains or losses.
| Net Asset Value | ||||||
| Share Class (Symbol) | 4/30/15 | 4/30/14 | Change | |||
| A (FKCGX) | $ | 51.56 | $ | 53.93 | -$ | 2.37 |
| C (FCIIX) | $ | 43.10 | $ | 46.79 | -$ | 3.69 |
| R (FRCGX) | $ | 49.22 | $ | 51.99 | -$ | 2.77 |
| R6 (FFCRX) | $ | 53.67 | $ | 55.54 | -$ | 1.87 |
| Advisor (FKCAX) | $ | 53.38 | $ | 55.40 | -$ | 2.02 |
| Distributions (5/1/14–4/30/15) | ||||||
| Short-Term | Long-Term | |||||
| Share Class | Capital Gain | Capital Gain | Total | |||
| A | $ | 0.7993 | $ | 8.2279 | $ | 9.0272 |
| C | $ | 0.7993 | $ | 8.2279 | $ | 9.0272 |
| R | $ | 0.7993 | $ | 8.2279 | $ | 9.0272 |
| R6 | $ | 0.7993 | $ | 8.2279 | $ | 9.0272 |
| Advisor | $ | 0.7993 | $ | 8.2279 | $ | 9.0272 |
franklintempleton.com
Annual Report
| 7
FRANKLIN FLEX CAP GROWTH FUND
PERFORMANCE SUMMARY
Performance as of 4/30/151
Cumulative total return excludes sales charges. Average annual total returns and value of $10,000 investment include maximum sales charges. Class A: 5.75% maximum initial sales charge; Class C: 1% contingent deferred sales charge in first year only;
Class R/R6/Advisor Class: no sales charges.
| Cumulative | Average Annual | Value of | Average Annual | Total Annual Operating | ||||||
| Share Class | Total Return2 | Total Return3 | $ | 10,000 Investment4 | Total Return (3/31/15)5 | Operating Expenses6 | ||||
| A | 0.97 | % | ||||||||
| 1-Year | +13.59 | % | +7.06 | % | $ | 10,706 | +5.18 | % | ||
| 5-Year | +76.65 | % | +10.73 | % | $ | 16,648 | +11.27 | % | ||
| 10-Year | +121.93 | % | +7.66 | % | $ | 20,918 | +7.52 | % | ||
| C | 1.72 | % | ||||||||
| 1-Year | +12.76 | % | +11.84 | % | $ | 11,184 | +9.87 | % | ||
| 5-Year | +70.14 | % | +11.21 | % | $ | 17,014 | +11.75 | % | ||
| 10-Year | +105.91 | % | +7.49 | % | $ | 20,591 | +7.35 | % | ||
| R | 1.22 | % | ||||||||
| 1-Year | +13.31 | % | +13.31 | % | $ | 11,331 | +11.33 | % | ||
| 5-Year | +74.45 | % | +11.77 | % | $ | 17,445 | +12.31 | % | ||
| 10-Year | +116.46 | % | +8.03 | % | $ | 21,646 | +7.89 | % | ||
| R6 | 0.48 | % | ||||||||
| 1-Year | +14.12 | % | +14.12 | % | $ | 11,412 | +12.11 | % | ||
| Since Inception (5/1/13) | +41.88 | % | +19.14 | % | $ | 14,188 | +20.94 | % | ||
| Advisor | 0.72 | % | ||||||||
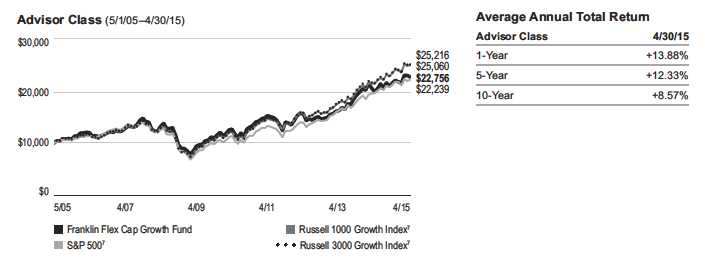
| 1-Year | +13.88 | % | +13.88 | % | $ | 11,388 | +11.88 | % | ||
| 5-Year | +78.88 | % | +12.33 | % | $ | 17,888 | +12.88 | % | ||
| 10-Year | +127.56 | % | +8.57 | % | $ | 22,756 | +8.43 | % |
Performance data represent past performance, which does not guarantee future results. Investment return and principal value will fluctuate, and you may have a gain or loss when you sell your shares. Current performance may differ from figures shown. For most recent month-end performance, go to franklintempleton.com or call (800) 342-5236.
8 | Annual Report
franklintempleton.com
FRANKLIN FLEX CAP GROWTH FUND
PERFORMANCE SUMMARY
Total Return Index Comparison for a Hypothetical $10,000 Investment1
Total return represents the change in value of an investment over the periods shown. It includes any applicable maximum sales charge, Fund expenses, account fees and reinvested distributions. The unmanaged indexes include reinvestment of any income or distributions. They differ from the Fund in composition and do not pay management fees or expenses. One cannot invest directly in an index.
franklintempleton.com
Annual Report
| 9
FRANKLIN FLEX CAP GROWTH FUND
PERFORMANCE SUMMARY
Total Return Index Comparison for a Hypothetical $10,000 Investment1 (continued)
10 | Annual Report
franklintempleton.com
FRANKLIN FLEX CAP GROWTH FUND
PERFORMANCE SUMMARY
Total Return Index Comparison for a Hypothetical $10,000 Investment1 (continued)
All investments involve risks, including possible loss of principal. Growth stock prices reflect projections of future earnings or revenues, and can, therefore,
fall dramatically if the company fails to meet those projections. Smaller, midsized and relatively new or unseasoned companies can be particularly sensitive to
changing economic conditions, and their prospects for growth are less certain than those of larger, more established companies. Historically, these securities
have experienced more price volatility than larger company stocks, especially over the short term. To the extent the Fund focuses on particular countries,
regions, industries, sectors or types of investment from time to time, it may be subject to greater risks of adverse developments in such areas of focus than a
fund that invests in a wider variety of countries, regions, industries, sectors or investments. Foreign securities involve special risks, including currency fluctua-
tions and economic and political uncertainties. The Fund is actively managed but there is no guarantee that the manager’s investment decisions will produce
the desired results. The Fund’s prospectus also includes a description of the main investment risks.
| Class C: | These shares have higher annual fees and expenses than Class A shares. |
| Class R: | Shares are available to certain eligible investors as described in the prospectus. These shares have higher annual fees and expenses than Class A shares. |
| Class R6: | Shares are available to certain eligible investors as described in the prospectus. |
| Advisor Class: | Shares are available to certain eligible investors as described in the prospectus. |
1. The Fund has a fee waiver associated with its investments in a Franklin Templeton money fund, contractually guaranteed through at least its current fiscal year-end.
Class R6 has a fee waiver contractually guaranteed through at least the Fund’s current fiscal year-end. Fund investment results reflect the fee waivers, to the extent
applicable; without these reductions, the results would have been lower.
2. Cumulative total return represents the change in value of an investment over the periods indicated.
3. Average annual total return represents the average annual change in value of an investment over the periods indicated.
4. These figures represent the value of a hypothetical $10,000 investment in the Fund over the periods indicated.
5. In accordance with SEC rules, we provide standardized average annual total return information through the latest calendar quarter.
6. Figures are as stated in the Fund’s current prospectus. In periods of market volatility, assets may decline significantly, causing total annual Fund operating expenses to
become higher than the figures shown.
7. Source: Morningstar. The S&P 500 is a market capitalization-weighted index of 500 stocks designed to measure total U.S. equity market performance. The Russell 1000
Growth Index is market capitalization weighted and measures performance of those Russell 1000 Index companies with higher price-to-book ratios and higher forecasted
growth values. The Russell 3000 Growth Index is market capitalization weighted and measures performance of those Russell 3000 Index companies with higher price-to-
book ratios and higher forecasted growth values.
See www.franklintempletondatasources.com for additional data provider information.
franklintempleton.com
Annual Report
| 11
FRANKLIN FLEX CAP GROWTH FUND
Your Fund’s Expenses
As a Fund shareholder, you can incur two types of costs:
- Transaction costs, including sales charges (loads) on Fund purchases; and
- Ongoing Fund costs, including management fees, distribu- tion and service (12b-1) fees, and other Fund expenses. All mutual funds have ongoing costs, sometimes referred to as operating expenses.
The following table shows ongoing costs of investing in the Fund and can help you understand these costs and compare them with those of other mutual funds. The table assumes a $1,000 investment held for the six months indicated.
Actual Fund Expenses
The first line (Actual) for each share class listed in the table provides actual account values and expenses. The “Ending Account Value” is derived from the Fund’s actual return, which includes the effect of Fund expenses.
You can estimate the expenses you paid during the period by following these steps. Of course, your account value and expenses will differ from those in this illustration:
| 1. | Divide your account value by $1,000. |
| If an account had an $8,600 value, then $8,600 ÷ $1,000 = 8.6. | |
| 2. | Multiply the result by the number under the heading “Expenses Paid During Period.” |
| If Expenses Paid During Period were $7.50, then 8.6 x $7.50 = $64.50. |
In this illustration, the estimated expenses paid this period are $64.50.
Hypothetical Example for Comparison with Other Funds
Information in the second line (Hypothetical) for each class in the table can help you compare ongoing costs of investing in the Fund with those of other mutual funds. This information may not be used to estimate the actual ending account balance or expenses you paid during the period. The hypothetical “Ending Account Value” is based on the actual expense ratio for each class and an assumed 5% annual rate of return before expenses, which does not represent the Fund’s actual return. The figure under the heading “Expenses Paid During Period” shows the hypothetical expenses your account would have incurred under this scenario. You can compare this figure with the 5% hypothetical examples that appear in shareholder reports of other funds.
Please note that expenses shown in the table are meant to highlight ongoing costs and do not reflect any transaction costs, such as sales charges. Therefore, the second line for each class is useful in comparing ongoing costs only, and will not help you compare total costs of owning different funds. In addition, if transaction costs were included, your total costs would have been higher. Please refer to the Fund prospectus for additional information on operating expenses.
12 | Annual Report
franklintempleton.com
FRANKLIN FLEX CAP GROWTH FUND
YOUR FUND’S EXPENSES
| Beginning Account | Ending Account | Expenses Paid During | ||||
| Share Class | Value 11/1/14 | Value 4/30/15 | Period* 11/1/14–4/30/15 | |||
| A | ||||||
| Actual | $ | 1,000 | $ | 1,050.20 | $ | 4.73 |
| Hypothetical (5% return before expenses) | $ | 1,000 | $ | 1,020.18 | $ | 4.66 |
| C | ||||||
| Actual | $ | 1,000 | $ | 1,046.20 | $ | 8.52 |
| Hypothetical (5% return before expenses) | $ | 1,000 | $ | 1,016.46 | $ | 8.40 |
| R | ||||||
| Actual | $ | 1,000 | $ | 1,048.80 | $ | 5.99 |
| Hypothetical (5% return before expenses) | $ | 1,000 | $ | 1,018.94 | $ | 5.91 |
| R6 | ||||||
| Actual | $ | 1,000 | $ | 1,052.40 | $ | 2.49 |
| Hypothetical (5% return before expenses) | $ | 1,000 | $ | 1,022.36 | $ | 2.46 |
| Advisor | ||||||
| Actual | $ | 1,000 | $ | 1,051.30 | $ | 3.46 |
| Hypothetical (5% return before expenses) | $ | 1,000 | $ | 1,021.42 | $ | 3.41 |
*Expenses are calculated using the most recent six-month expense ratio, net of expense waivers, annualized for each class (A: 0.93%;
C: 1.68%; R: 1.18%; R6: 0.49%; and Advisor: 0.68%), multiplied by the average account value over the period, multiplied by 181/365 to
reflect the one-half year period.
franklintempleton.com
Annual Report
| 13
Franklin Focused Core Equity Fund
We are pleased to bring you Franklin Focused Core Equity Fund’s annual report for the fiscal year ended April 30, 2015.
Your Fund’s Goal and Main Investments
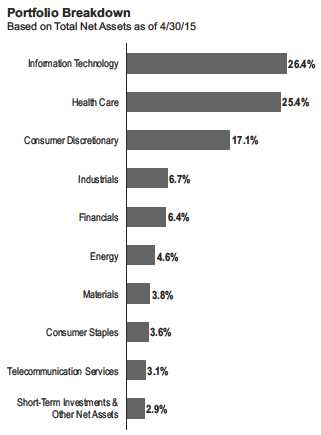
The Fund seeks capital appreciation by normally investing at least 80% of its net assets in equity securities. The Fund normally invests primarily to predominantly in equity securities of large capitalization companies, which are similar in size to those in the Standard & Poor’s 500 Index (S&P 500).
Performance Overview
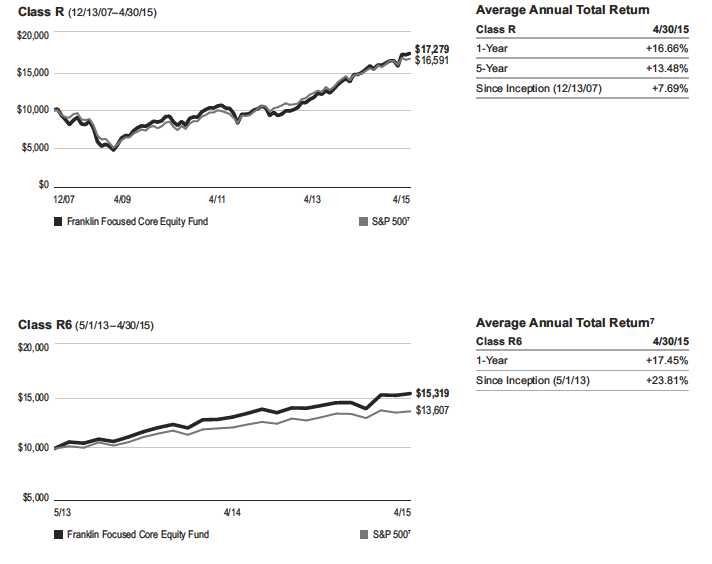
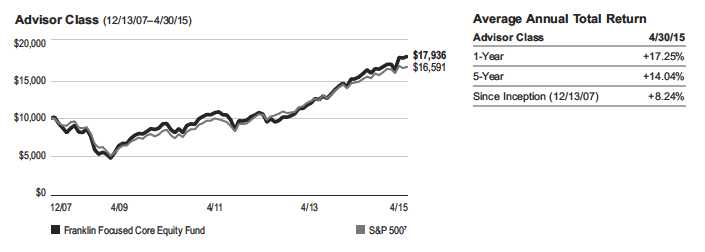
For the 12 months under review, the Fund’s Class A shares delivered a +16.84% cumulative total return. In comparison, the S&P 500, which tracks the broad U.S. stock market, posted a +12.98% total return.1 You can find more of the Fund’s performance data in the Performance Summary beginning on page 17.
Performance data represent past performance, which does not guarantee future results. Investment return and principal value will fluctuate, and you may have a gain or loss when you sell your shares. Current performance may differ from figures shown. Please visit franklintempleton.com or call (800) 342-5236 for most recent month-end performance.
Investment Strategy
We are research-driven, bottom-up, fundamental investors. Our investment approach is opportunistic and contrarian, and we seek to identify mispriced companies using fundamental analysis. We seek to take advantage of price dislocations that result from the market’s short-term focus. Our analysis includes the investigation of the valuation for each investment based upon the view that the price paid for the security is a critical factor determining long-term success. We rely on a team of analysts to help provide in-depth industry expertise and use both qualitative and quantitative analysis to evaluate companies. Our analysts identify each company’s market opportunity, competitive position, management and financial strength, business and financial risks, and valuation. We choose to invest in those companies that, in our opinion, offer the best trade-off between growth opportunity, business and financial risk, and valuation.
Manager’s Discussion
During the 12 months under review, most sectors the Fund invested in contributed to absolute performance led by the health care, information technology (IT) and financials sectors. Holdings in consumer discretionary and consumer staples also benefited absolute performance, but energy detracted.
In the health care sector, pharmaceuticals performed well as shares of Valeant Pharmaceuticals International, Actavis and Allergan2 rallied. Valeant develops drugs for unmet medical needs and distributes generic and branded drugs globally. It posted robust double-digit organic growth for the year, resulting in the company raising its 2015 revenue and earnings guidance. Additionally, the company acquired Salix Pharmaceuticals during the period. Specialty pharmaceutical company Actavis’s share price rose as the company reported strong demand for its products and completed several acquisitions
1. Source: Morningstar.
The index is unmanaged and includes reinvested dividends. One cannot invest directly in an index, and an index is not representative of the Fund’s portfolio.
2. No longer held at period-end.
See www.franklintempletondatasources.com for additional data provider information.
The dollar value, number of shares or principal amount, and names of all portfolio holdings are listed in the Fund’s Statement of Investments (SOI).
The SOI begins on page 67.
14 | Annual Report franklintempleton.com
FRANKLIN FOCUSED CORE EQUITY FUND
| Top 10 Equity Holdings | ||
| 4/30/15 | ||
| Company | % of Total | |
| Sector/Industry | Net Assets | |
| Valeant Pharmaceuticals International Inc. | 6.8 | % |
| Health Care | ||
| Actavis PLC | 5.2 | % |
| Health Care | ||
| The Hartford Financial Services Group Inc. | 4.3 | % |
| Financials | ||
| QUALCOMM Inc. | 3.9 | % |
| Information Technology | ||
| Equinix Inc. | 3.3 | % |
| Information Technology | ||
| Adobe Systems Inc. | 3.1 | % |
| Information Technology | ||
| Microsoft Corp. | 3.1 | % |
| Information Technology | ||
| The Charles Schwab Corp. | 3.1 | % |
| Financials | ||
| Twenty-First Century Fox Inc., B | 3.1 | % |
| Consumer Discretionary | ||
| MasterCard Inc., A | 2.9 | % |
| Information Technology | ||
during the year. Most notable was the acquisition of aesthetics and dermatology company Allergan. Post the merger the company announced its intention to adopt “Allergan” as its new corporate name.
Interconnection and data center company Equinix and digital marketing and digital media solutions provider Adobe Systems were major contributors in the IT sector. Equinix started 2015 as a real estate investment trust, and its first-quarter 2015 results were healthy due to strong demand across geographic regions. Although its 2014 revenues were robust, the company recorded a net loss for the year hurt by higher interest expenses and a loss on debt extinguishment. Adobe reported strong revenues and earnings for 2015’s first quarter and added a significant number of paid Creative Cloud subscribers. Further, the company’s healthy fourth-quarter and full-year 2014 results supported performance. Adobe’s new stock repurchase program and its partnership with Google to provide Creative Cloud for Chromebooks also helped its shares.
In the financials sector, commercial real estate services firm CBRE Group and property and casualty insurer The Hartford
Financial Services Group aided returns. CBRE’s share price advanced following strong 2014 results with double-digit revenue growth in almost all segments. The company’s first-quarter 2015 revenues and earnings also rose, and management estimated higher 2015 earnings than in 2014. Toward period-end, shares rose after the company announced the acquisition of Johnson Controls’ workplace solutions business, which would increase CBRE’s geographical presence for fully integrated real estate and facilities solutions. Hartford’s 2014 core earnings rose, driven by improved revenue from property and casualty underwriting results, which partly offset the decline in investment income. The company sold its Japanese annuity business in 2014, significantly reducing its risk profile.
Although nearly all Fund positions contributed to absolute performance, positions in the energy sector detracted, particularly independent exploration and production company Marathon Oil.2 Stocks in the energy sector generally retreated as crude oil prices fell sharply during the period resulting mainly from excess global supply from North American shale producers. Marathon Oil’s 2014 net revenues increased due to higher production, and the company sold its Angola and Norway businesses during the year. Marathon posted a first-quarter 2015 net loss and reduced its 2015 capital expenditure plan mainly due to falling oil prices.
Other notable detractors included global semiconductor company QUALCOMM and concentrated phosphate and potash producer and marketer The Mosaic Co.2 Although QUAL-COMM reported stronger-than-expected fiscal second-quarter 2015 results, the company lowered its outlook for the second half of the fiscal year. Additionally, the company posted modest results for fiscal year 2014 and the first quarter of 2015. The China National Development and Reform Commission’s fine on QUALCOMM for patent antitrust abuses weighed on the company’s shares. QUALCOMM stock plunged after the chipmaker confirmed that a key customer would not use the company’s chips in one of its flagship phones. Mosaic reported dismal 2014 results due to lower potash prices, and its shares fell when the company announced it would cut phosphate fertilizer production due to high sulfur and ammonia prices. However, first-quarter 2015 revenues and earnings increased, helped by higher phosphate and potash prices, higher phosphate sales volumes and lower potash operating costs.
franklintempleton.com
Annual Report
| 15
FRANKLIN FOCUSED CORE EQUITY FUND
Thank you for your continued participation in Franklin Focused Core Equity Fund. We look forward to serving your future investment needs.

The foregoing information reflects our analysis, opinions and portfolio holdings as of April 30, 2015, the end of the reporting period. The way we implement our main investment strategies and the resulting portfolio holdings may change depending on factors such as market and economic conditions. These opinions may not be relied upon as investment advice or an offer for a particular security. The information is not a complete analysis of every aspect of any market, country, industry, security or the Fund. Statements of fact are from sources considered reliable, but the investment manager makes no representation or warranty as to their completeness or accuracy. Although historical performance is no guarantee of future results, these insights may help you understand our investment management philosophy.
16 | Annual Report
franklintempleton.com
FRANKLIN FOCUSED CORE EQUITY FUND
Performance Summary as of April 30, 2015
Your dividend income will vary depending on dividends or interest paid by securities in the Fund’s portfolio, adjusted for operating expenses of each class. Capital gain distributions are net profits realized from the sale of portfolio securities. The performance table and graphs do not reflect any taxes that a shareholder would pay on Fund dividends, capital gain distributions, if any, or any realized gains on the sale of Fund shares. Total return reflects reinvestment of the Fund’s dividends and capital gain distributions, if any, and any unrealized gains or losses.
| Net Asset Value | ||||||||
| Share Class (Symbol) | 4/30/15 | 4/30/14 | Change | |||||
| A (FCEQX) | $ | 15.29 | $ | 13.38 | +$ | 1.91 | ||
| C (n/a) | $ | 14.73 | $ | 12.98 | +$ | 1.75 | ||
| R (n/a) | $ | 15.15 | $ | 13.28 | +$ | 1.87 | ||
| R6 (FEFCX) | $ | 15.46 | $ | 13.49 | +$ | 1.97 | ||
| Advisor (n/a) | $ | 15.44 | $ | 13.48 | +$ | 1.96 | ||
| Distributions (5/1/14–4/30/15) | ||||||||
| Dividend | Short-Term | Long-Term | ||||||
| Share Class | Income | Capital Gain | Capital Gain | Total | ||||
| A | — | $ | 0.0808 | $ | 0.2301 | $ | 0.3109 | |
| C | — | $ | 0.0808 | $ | 0.2301 | $ | 0.3109 | |
| R | — | $ | 0.0808 | $ | 0.2301 | $ | 0.3109 | |
| R6 | $ | 0.0364 | $ | 0.0808 | $ | 0.2301 | $ | 0.3473 |
| Advisor | $ | 0.0197 | $ | 0.0808 | $ | 0.2301 | $ | 0.3306 |
franklintempleton.com
Annual Report
| 17
FRANKLIN FOCUSED CORE EQUITY FUND
PERFORMANCE SUMMARY
Performance as of 4/30/151
Cumulative total return excludes sales charges. Average annual total returns and value of $10,000 investment include maximum sales charges. Class A: 5.75% maximum initial sales charge; Class C: 1% contingent deferred sales charge in first year only;
Class R/R6/Advisor Class: no sales charges.
| Value of | Average Annual | Total Annual | ||||||||||
| Operating Expenses6 | ||||||||||||
| Cumulative | Average Annual | $ | 10,000 | Total Return | ||||||||
| Share Class | Total Return2 | Total Return3 | Investment4 | (3/31/15 | )5 | (with waiver) | (without waiver) | |||||
| A | 1.30 | % | 1.73 | % | ||||||||
| 1-Year | +16.84 | % | +10.09 | % | $ | 11,009 | +10.74 | % | ||||
| 5-Year | +90.12 | % | +12.38 | % | $ | 17,921 | +12.22 | % | ||||
| Since Inception (12/13/07) | +75.73 | % | +7.08 | % | $ | 16,563 | +6.99 | % | ||||
| C | 2.00 | % | 2.43 | % | ||||||||
| 1-Year | +16.12 | % | +15.12 | % | $ | 11,512 | +15.66 | % | ||||
| 5-Year | +83.75 | % | +12.94 | % | $ | 18,375 | +12.77 | % | ||||
| Since Inception (12/13/07) | +66.90 | % | +7.19 | % | $ | 16,690 | +7.11 | % | ||||
| R | 1.50 | % | 1.93 | % | ||||||||
| 1-Year | +16.66 | % | +16.66 | % | $ | 11,666 | +17.30 | % | ||||
| 5-Year | +88.19 | % | +13.48 | % | $ | 18,819 | +13.32 | % | ||||
| Since Inception (12/13/07) | +72.79 | % | +7.69 | % | $ | 17,279 | +7.62 | % | ||||
| R6 | 0.85 | % | 2.28 | % | ||||||||
| 1-Year | +17.45 | % | +17.45 | % | $ | 11,745 | +18.10 | % | ||||
| Since Inception (5/1/13) | +53.19 | % | +23.81 | % | $ | 15,319 | +24.19 | % | ||||
| Advisor | 1.00 | % | 1.43 | % | ||||||||
| 1-Year | +17.25 | % | +17.25 | % | $ | 11,725 | +17.80 | % | ||||
| 5-Year | +92.84 | % | +14.04 | % | $ | 19,284 | +13.87 | % | ||||
| Since Inception (12/13/07) | +79.36 | % | +8.24 | % | $ | 17,936 | +8.16 | % | ||||
Performance data represent past performance, which does not guarantee future results. Investment return and principal value will fluctuate, and you may have a gain or loss when you sell your shares. Current performance may differ from figures shown. For most recent month-end performance, go to franklintempleton.com or call (800) 342-5236.
18 | Annual Report
franklintempleton.com
FRANKLIN FOCUSED CORE EQUITY FUND
PERFORMANCE SUMMARY
Total Return Index Comparison for a Hypothetical $10,000 Investment1
Total return represents the change in value of an investment over the periods shown. It includes any applicable maximum sales charge, Fund expenses, account fees and reinvested distributions. The unmanaged index includes reinvestment of any income or distributions. It differs from the Fund in composition and does not pay management fees or expenses. One cannot invest directly in an index.
franklintempleton.com
Annual Report
| 19
FRANKLIN FOCUSED CORE EQUITY FUND
PERFORMANCE SUMMARY
Total Return Index Comparison for a Hypothetical $10,000 Investment1 (continued)
20 | Annual Report
franklintempleton.com
FRANKLIN FOCUSED CORE EQUITY FUND
PERFORMANCE SUMMARY
Total Return Index Comparison for a Hypothetical $10,000 Investment1 (continued)
All investments involve risks, including possible loss of principal. To the extent the Fund focuses on particular countries, regions, industries, sectors or types
of investment from time to time, it may be subject to greater risks of adverse developments in such areas of focus than a fund that invests in a wider variety of
countries, regions, industries, sectors or investments. The Fund may have investments in both growth and value stocks, or in stocks with characteristics of
both. Growth stock prices reflect projections of future earnings or revenues, and can, therefore, fall dramatically if the company fails to meet those projections.
A value stock may not increase in price as anticipated by the investment manager if other investors fail to recognize the company’s value and bid up the price,
the markets favor faster growing companies, or the factors that the investment manager believes will increase the price of the security do not occur. Foreign
securities involve special risks, including currency fluctuations and economic and political uncertainties. The Fund is actively managed but there is no guaran-
tee that the manager’s investment decisions will produce the desired results. The Fund’s prospectus also includes a description of the main investment risks.
| Class C: | These shares have higher annual fees and expenses than Class A shares. |
| Class R: | Shares are available to certain eligible investors as described in the prospectus. These shares have higher annual fees and expenses than Class A shares. |
| Class R6: | Shares are available to certain eligible investors as described in the prospectus. |
| Advisor Class: | Shares are available to certain eligible investors as described in the prospectus. |
1. The Fund has an expense reduction contractually guaranteed through at least 8/31/15 and a fee waiver associated with its investments in a Franklin Templeton money
fund, contractually guaranteed through at least its current fiscal year-end. Fund investment results reflect the expense reduction and fee waiver, to the extent applicable;
without these reductions, the results would have been lower.
2. Cumulative total return represents the change in value of an investment over the periods indicated.
3. Average annual total return represents the average annual change in value of an investment over the periods indicated.
4. These figures represent the value of a hypothetical $10,000 investment in the Fund over the periods indicated.
5. In accordance with SEC rules, we provide standardized average annual total return information through the latest calendar quarter.
6. Figures are as stated in the Fund’s current prospectus. In periods of market volatility, assets may decline significantly, causing total annual Fund operating expenses to
become higher than the figures shown.
7. Source: Morningstar. The S&P 500 is a market capitalization-weighted index of 500 stocks designed to measure total U.S. equity market performance.
See www.franklintempletondatasources.com for additional data provider information.
franklintempleton.com
Annual Report
| 21
FRANKLIN FOCUSED CORE EQUITY FUND
Your Fund’s Expenses
As a Fund shareholder, you can incur two types of costs:
- Transaction costs, including sales charges (loads) on Fund purchases; and
- Ongoing Fund costs, including management fees, distribu- tion and service (12b-1) fees, and other Fund expenses. All mutual funds have ongoing costs, sometimes referred to as operating expenses.
The following table shows ongoing costs of investing in the Fund and can help you understand these costs and compare them with those of other mutual funds. The table assumes a $1,000 investment held for the six months indicated.
Actual Fund Expenses
The first line (Actual) for each share class listed in the table provides actual account values and expenses. The “Ending Account Value” is derived from the Fund’s actual return, which includes the effect of Fund expenses.
You can estimate the expenses you paid during the period by following these steps. Of course, your account value and expenses will differ from those in this illustration:
| 1. | Divide your account value by $1,000. |
| If an account had an $8,600 value, then $8,600 ÷ $1,000 = 8.6. | |
| 2. | Multiply the result by the number under the heading “Expenses Paid During Period.” |
| If Expenses Paid During Period were $7.50, then 8.6 x $7.50 = $64.50. |
In this illustration, the estimated expenses paid this period are $64.50.
Hypothetical Example for Comparison with Other Funds
Information in the second line (Hypothetical) for each class in the table can help you compare ongoing costs of investing in the Fund with those of other mutual funds. This information may not be used to estimate the actual ending account balance or expenses you paid during the period. The hypothetical “Ending Account Value” is based on the actual expense ratio for each class and an assumed 5% annual rate of return before expenses, which does not represent the Fund’s actual return. The figure under the heading “Expenses Paid During Period” shows the hypothetical expenses your account would have incurred under this scenario. You can compare this figure with the 5% hypothetical examples that appear in shareholder reports of other funds.
Please note that expenses shown in the table are meant to highlight ongoing costs and do not reflect any transaction costs, such as sales charges. Therefore, the second line for each class is useful in comparing ongoing costs only, and will not help you compare total costs of owning different funds. In addition, if transaction costs were included, your total costs would have been higher. Please refer to the Fund prospectus for additional information on operating expenses.
22 | Annual Report
franklintempleton.com
FRANKLIN FOCUSED CORE EQUITY FUND
YOUR FUND’S EXPENSES
| Beginning Account | Ending Account | Expenses Paid During | ||||
| Share Class | Value 11/1/14 | Value 4/30/15 | Period* 11/1/14–4/30/15 | |||
| A | ||||||
| Actual | $ | 1,000 | $ | 1,078.90 | $ | 6.70 |
| Hypothetical (5% return before expenses) | $ | 1,000 | $ | 1,018.35 | $ | 6.51 |
| C | ||||||
| Actual | $ | 1,000 | $ | 1,075.80 | $ | 10.29 |
| Hypothetical (5% return before expenses) | $ | 1,000 | $ | 1,014.88 | $ | 9.99 |
| R | ||||||
| Actual | $ | 1,000 | $ | 1,078.20 | $ | 7.73 |
| Hypothetical (5% return before expenses) | $ | 1,000 | $ | 1,017.36 | $ | 7.50 |
| R6 | ||||||
| Actual | $ | 1,000 | $ | 1,081.50 | $ | 4.34 |
| Hypothetical (5% return before expenses) | $ | 1,000 | $ | 1,020.63 | $ | 4.21 |
| Advisor | ||||||
| Actual | $ | 1,000 | $ | 1,080.30 | $ | 5.16 |
| Hypothetical (5% return before expenses) | $ | 1,000 | $ | 1,019.84 | $ | 5.01 |
*Expenses are calculated using the most recent six-month expense ratio, net of expense waivers, annualized for each class (A: 1.30%;
C: 2.00%; R: 1.50%; R6: 0.84%; and Advisor: 1.00%), multiplied by the average account value over the period, multiplied by 181/365 to
reflect the one-half year period.
franklintempleton.com
Annual Report
| 23
Franklin Growth Opportunities Fund
We are pleased to bring you Franklin Growth Opportunities Fund’s annual report for the fiscal year ended April 30, 2015.
Your Fund’s Goal and Main Investments
The Fund seeks capital appreciation by normally investing substantially in equity securities of companies demonstrating accelerating growth, increasing profitability, or above-average growth or growth potential, when compared with the overall economy.
Performance Overview
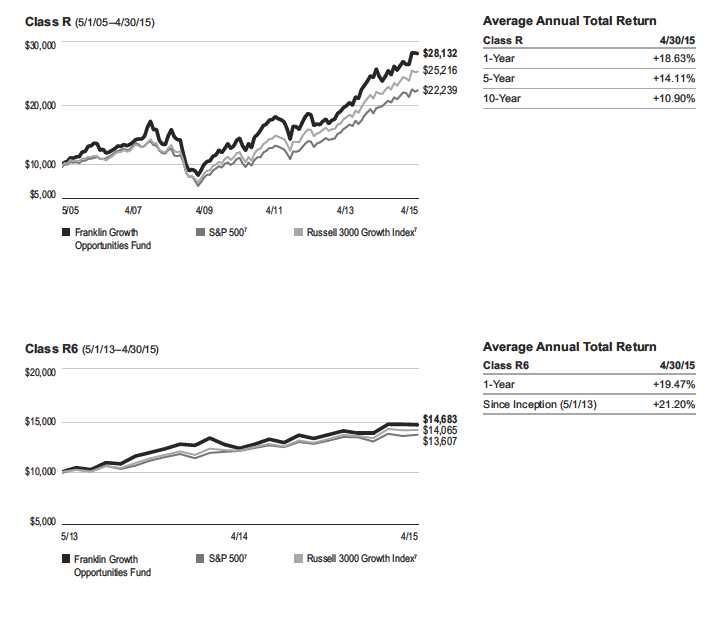
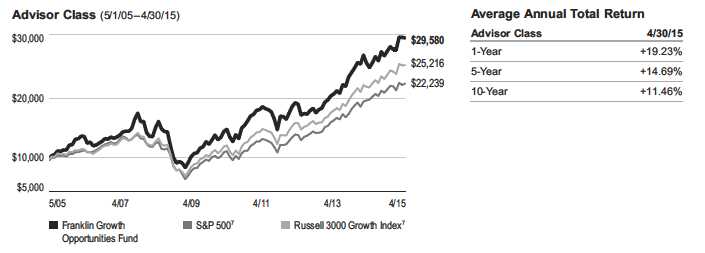
For the 12 months under review, the Fund’s Class A shares delivered a cumulative total return of +18.87%. In comparison, the Fund’s narrow benchmark, the Russell 3000® Growth Index, which measures performance of Russell 3000® Index companies with higher price-to-book ratios and higher forecasted growth values, generated a +16.50% total return.1 The Fund’s broad benchmark, the Standard & Poor’s 500 Index (S&P 500), which tracks the broad U.S. stock market, produced a +12.98% total return.1 You can find the Fund’s long-term performance data in the Performance Summary beginning on page 27.
Performance data represent past performance, which does not guarantee future results. Investment return and principal value will fluctuate, and you may have a gain or loss when you sell your shares. Current performance may differ from figures shown. Please visit franklintempleton.com or call (800) 342-5236 for most recent month-end performance.
Investment Strategy
We use fundamental, bottom-up research to seek companies meeting our criteria of growth potential, quality and valuation. In seeking sustainable growth characteristics, we look for companies we believe can produce sustainable earnings and cash flow growth, evaluating the long-term market opportunity and competitive structure of an industry to target leaders and emerging leaders. We define quality companies as those with strong and improving competitive positions in attractive markets. We also believe important attributes of quality are experienced and talented management teams as well as financial strength reflected in the capital structure, gross and operating margins, free cash flow generation and returns on capital employed. Our valuation analysis includes a range of
potential outcomes based on an assessment of multiple scenarios. In assessing value, we consider whether security prices fully reflect the balance of the sustainable growth opportunities relative to business and financial risks.
Manager’s Discussion
The Fund outperformed its benchmark, the Russell 3000® Growth Index, for the 12 months under review as holdings across several sectors contributed to relative performance. An overweighting and stock selection in the health care sector were particularly beneficial. Additionally, stock selection in consumer staples, telecommunication services and information technology (IT), along with underweightings in materials and energy, added to relative returns.
In health care, biotechnology firm Medivation as well as pharmaceutical companies Valeant Pharmaceuticals International2 and Actavis performed well. Valeant develops drugs for unmet
1. Source: Morningstar.
The indexes are unmanaged and include reinvested dividends. One cannot invest directly in an index, and an index is not representative of the Fund’s portfolio.
2. Not part of the index.
The dollar value, number of shares or principal amount, and names of all portfolio holdings are listed in the Fund’s Statement of Investments (SOI).
The SOI begins on page 74.
24 | Annual Report franklintempleton.com
FRANKLIN GROWTH OPPORTUNITIES FUND
| Top 10 Equity Holdings | ||
| 4/30/15 | ||
| Company | % of Total | |
| Sector/Industry | Net Assets | |
| Actavis PLC | 4.0 | % |
| Health Care | ||
| Celgene Corp. | 3.4 | % |
| Health Care | ||
| MasterCard Inc., A | 3.4 | % |
| Information Technology | ||
| Google Inc., A & C | 3.4 | % |
| Information Technology | ||
| Apple Inc. | 3.1 | % |
| Information Technology | ||
| SBA Communications Corp. | 3.1 | % |
| Telecommunication Services | ||
| Facebook Inc., A | 2.8 | % |
| Information Technology | ||
| Valeant Pharmaceuticals International Inc. | 2.6 | % |
| Health Care | ||
| Amazon.com Inc. | 2.4 | % |
| Consumer Discretionary | ||
| Anadarko Petroleum Corp. | 2.4 | % |
| Energy | ||
medical needs and distributes generic and branded drugs globally. It posted robust double-digit organic growth for the year, resulting in the company’s raising its 2015 revenue and earnings guidance. Additionally, the company acquired Salix Pharmaceuticals during the period. Specialty pharmaceutical company Actavis’s share price rose as the company reported strong demand for its products and completed several acquisitions during the year. Most notable was the acquisition of aesthetics and dermatology company Allergan. Post the merger the company announced its intention to adopt “Allergan” as its new corporate name.
In consumer staples, energy drink company Monster Beverage contributed to relative returns. Monster shares advanced after the company entered into a long-term strategic partnership with Coca-Cola to accelerate growth in the fast-growing energy drink category. Monster’s healthy domestic and international sales growth supported the stock price. Wireless tower operator SBA Communications aided relative returns in the telecommunication services sector, as it continued to benefit from the secular growth trends in wireless usage. Within IT, integrated circuit manufacturer NXP Semiconductors2 and cybersecurity company Palo Alto Networks contributed to relative performance. NXP Semiconductors generated positive 2014 and first-quarter 2015 results, with strong performance across its high-performance mixed signal and standard products segments. Shares surged after the company announced its acquisition of Freescale Semiconductor to expand its market share in the chips industry.
Elsewhere, apparel and footwear manufacturer Under Armour performed well. The company reported growth across all its business segments: apparel, footwear and accessories. Additionally, the company raised its 2015 revenue and operating income guidance as it continues to expand its brand internationally.
In the energy sector, underweightings in oil, gas and consumable fuel companies added to relative returns. Energy stocks retreated as crude oil prices fell sharply during the 12-month period mainly due to excess global supply from North American shale producers.
In contrast, stock selection in industrials and consumer discretionary detracted from the Fund’s performance relative to the benchmark. In the industrials sector, metal components manufacturer Precision Castparts,3 flow control products and services provider Flowserve, and industrial enterprise solutions provider Colfax3 weighed on relative returns. Precision shares fell after the company issued weak fiscal fourth-quarter 2015 guidance amid declining demand in its energy and power businesses. Colfax reported lower first-quarter 2015 revenues as gas- and fluid-handling orders declined, but the company’s 2014 revenues and orders were higher than in the previous year. The weakness in the global energy markets impacted our industrial companies during the year.
Among consumer discretionary holdings, casino and resort operating company Las Vegas Sands and luxury goods maker and retailer Michael Kors Holdings3 hurt relative results. A slowdown in the key gambling market of Macau weighed on Las Vegas Sands shares. The company, however, reported modest 2014 results, driven by growth across its properties. Michael Kors’s share price suffered as discounts on its fall inventory led to narrower margins in the first quarter. The company’s share price declined, despite an increase in its quarterly revenues and earnings, as comparable store sales growth was lower than the company’s estimates.
Other notable detractors included technology solutions company Trimble Navigation3 and onshore energy production services provider Key Energy Services.2,3 Key Energy’s share price fell after the company reported weak revenues and a challenging outlook for the energy end markets it serves.
3. No longer held at period-end.
See www.franklintempletondatasources.com for additional data provider information.
franklintempleton.com
Annual Report
| 25
FRANKLIN GROWTH OPPORTUNITIES FUND
Thank you for your continued participation in Franklin Growth Opportunities Fund. We look forward to serving your future investment needs.

The foregoing information reflects our analysis, opinions and portfolio holdings as of April 30, 2015, the end of the reporting period. The way we implement our main investment strategies and the resulting portfolio holdings may change depending on factors such as market and economic conditions. These opinions may not be relied upon as investment advice or an offer for a particular security. The information is not a complete analysis of every aspect of any market, country, industry, security or the Fund. Statements of fact are from sources considered reliable, but the investment manager makes no representation or warranty as to their completeness or accuracy. Although historical performance is no guarantee of future results, these insights may help you understand our investment management philosophy.
26 | Annual Report
franklintempleton.com
FRANKLIN GROWTH OPPORTUNITIES FUND
Performance Summary as of April 30, 2015
Your dividend income will vary depending on dividends or interest paid by securities in the Fund’s portfolio, adjusted for operating expenses of each class. Capital gain distributions are net profits realized from the sale of portfolio securities. The performance table and graphs do not reflect any taxes that a shareholder would pay on Fund dividends, capital gain distributions, if any, or any realized gains on the sale of Fund shares. Total return reflects reinvestment of the Fund’s dividends and capital gain distributions, if any, and any unrealized gains or losses.
| Net Asset Value | |||||
| Share Class (Symbol) | 4/30/15 | 4/30/14 | Change | ||
| A (FGRAX) | $ | 33.13 | $ | 28.48 | +$4.65 |
| C (FKACX) | $ | 29.27 | $ | 25.41 | +$3.86 |
| R (FKARX) | $ | 32.10 | $ | 27.67 | +$4.43 |
| R6 (FOPPX) | $ | 35.09 | $ | 29.98 | +$5.11 |
| Advisor (FRAAX) | $ | 34.96 | $ | 29.93 | +$5.03 |
| Distributions (5/1/14–4/30/15) | |||||
| Long-Term | |||||
| Share Class | Capital Gain | ||||
| A | $ | 0.6612 | |||
| C | $ | 0.6612 | |||
| R | $ | 0.6612 | |||
| R6 | $ | 0.6612 | |||
| Advisor | $ | 0.6612 | |||
franklintempleton.com
Annual Report
| 27
FRANKLIN GROWTH OPPORTUNITIES FUND
PERFORMANCE SUMMARY
Performance as of 4/30/151
Cumulative total return excludes sales charges. Average annual total return and value of $10,000 investment include maximum sales charges. Class A: 5.75% maximum initial sales charge; Class C: 1% contingent deferred sales charge in first year only;
Class R/R6/Advisor Class: no sales charges.
| Cumulative | Average Annual | Value of | Average Annual | Total Annual Operating | ||||||
| Share Class | Total Return2 | Total Return3 | $ | 10,000 Investment4 | Total Return (3/31/15)5 | Operating Expenses6 | ||||
| A | 1.17 | % | ||||||||
| 1-Year | +18.87 | % | +12.03 | % | $ | 11,203 | +9.15 | % | ||
| 5-Year | +95.52 | % | +13.00 | % | $ | 18,423 | +13.59 | % | ||
| 10-Year | +187.33 | % | +10.48 | % | $ | 27,087 | +10.00 | % | ||
| C | 1.87 | % | ||||||||
| 1-Year | +18.04 | % | +17.04 | % | $ | 11,704 | +13.99 | % | ||
| 5-Year | +88.76 | % | +13.55 | % | $ | 18,876 | +14.15 | % | ||
| 10-Year | +167.56 | % | +10.34 | % | $ | 26,756 | +9.88 | % | ||
| R | 1.37 | % | ||||||||
| 1-Year | +18.63 | % | +18.63 | % | $ | 11,863 | +15.56 | % | ||
| 5-Year | +93.49 | % | +14.11 | % | $ | 19,349 | +14.71 | % | ||
| 10-Year | +181.32 | % | +10.90 | % | $ | 28,132 | +10.43 | % | ||
| R6 | 0.71 | % | ||||||||
| 1-Year | +19.47 | % | +19.47 | % | $ | 11,947 | +16.39 | % | ||
| Since Inception (5/1/13) | +46.83 | % | +21.20 | % | $ | 14,683 | +22.41 | % | ||
| Advisor | 0.87 | % | ||||||||
| 1-Year | +19.23 | % | +19.23 | % | $ | 11,923 | +16.15 | % | ||
| 5-Year | +98.47 | % | +14.69 | % | $ | 19,847 | +15.29 | % | ||
| 10-Year | +195.80 | % | +11.46 | % | $ | 29,580 | +10.99 | % |
Performance data represent past performance, which does not guarantee future results. Investment return and principal value will fluctuate, and you may have a gain or loss when you sell your shares. Current performance may differ from figures shown. For most recent month-end performance, go to franklintempleton.com or call (800) 342-5236.
28 | Annual Report
franklintempleton.com
FRANKLIN GROWTH OPPORTUNITIES FUND
PERFORMANCE SUMMARY
Total Return Index Comparison for a Hypothetical $10,000 Investment1
Total return represents the change in value of an investment over the periods shown. It includes any applicable maximum sales charge, Fund expenses, account fees and reinvested distributions. The unmanaged indexes include reinvestment of any income or distributions. They differ from the Fund in composition and do not pay management fees or expenses. One cannot invest directly in an index.
franklintempleton.com
Annual Report
| 29
FRANKLIN GROWTH OPPORTUNITIES FUND
PERFORMANCE SUMMARY
Total Return Index Comparison for a Hypothetical $10,000 Investment1 (continued)
30 | Annual Report
franklintempleton.com
FRANKLIN GROWTH OPPORTUNITIES FUND
PERFORMANCE SUMMARY
Total Return Index Comparison for a Hypothetical $10,000 Investment1 (continued)
All investments involve risks, including possible loss of principal. Growth stock prices reflect projections of future earnings or revenues, and can, therefore, fall dramatically if the company fails to meet those projections. Smaller, midsized and relatively new or unseasoned companies can be particularly sensitive to changing economic conditions, and their prospects for growth are less certain than those of larger, more established companies. Historically, these securities have experienced more price volatility than larger company stocks, especially over the short term. To the extent the Fund focuses on particular countries, regions, industries, sectors or types of investment from time to time, it may be subject to greater risks of adverse developments in such areas of focus than a fund that invests in a wider variety of countries, regions, industries, sectors or investments. The Fund is actively managed but there is no guarantee that the manager’s investment decisions will produce the desired results. The Fund’s prospectus also includes a description of the main investment risks.
| Class C: | These shares have higher annual fees and expenses than Class A shares. |
| Class R: | Shares are available to certain eligible investors as described in the prospectus. These shares have higher annual fees and expenses than Class A shares. |
| Class R6: | Shares are available to certain eligible investors as described in the prospectus. |
| Advisor Class: | Shares are available to certain eligible investors as described in the prospectus. |
1. The Fund has a fee waiver associated with its investments in a Franklin Templeton money fund, contractually guaranteed through at least its current fiscal year-end.
Class R6 has a fee waiver contractually guaranteed through at least the Fund’s current fiscal year-end. Fund investment results reflect the fee waivers, to the extent
applicable; without these reductions, the results would have been lower.
2. Cumulative total return represents the change in value of an investment over the periods indicated.
3. Average annual total return represents the average annual change in value of an investment over the periods indicated.
4. These figures represent the value of a hypothetical $10,000 investment in the Fund over the periods indicated.
5. In accordance with SEC rules, we provide standardized average annual total return information through the latest calendar quarter.
6. Figures are as stated in the Fund’s current prospectus. In periods of market volatility, assets may decline significantly, causing total annual Fund operating expenses to
become higher than the figures shown.
7. Source: Morningstar. The S&P 500 is a market capitalization-weighted index of 500 stocks designed to measure total U.S. equity market performance. The Russell 3000
Growth Index is market capitalization weighted and measures performance of those Russell 3000 Index companies with higher price-to-book ratios and higher forecasted
growth values.
See www.franklintempletondatasources.com for additional data provider information.
franklintempleton.com
Annual Report
| 31
FRANKLIN GROWTH OPPORTUNITIES FUND
Your Fund’s Expenses
As a Fund shareholder, you can incur two types of costs:
- Transaction costs, including sales charges (loads) on Fund purchases; and
- Ongoing Fund costs, including management fees, distribu- tion and service (12b-1) fees, and other Fund expenses. All mutual funds have ongoing costs, sometimes referred to as operating expenses.
The following table shows ongoing costs of investing in the Fund and can help you understand these costs and compare them with those of other mutual funds. The table assumes a $1,000 investment held for the six months indicated.
Actual Fund Expenses
The first line (Actual) for each share class listed in the table provides actual account values and expenses. The “Ending Account Value” is derived from the Fund’s actual return, which includes the effect of Fund expenses.
You can estimate the expenses you paid during the period by following these steps. Of course, your account value and expenses will differ from those in this illustration:
| 1. | Divide your account value by $1,000. |
| If an account had an $8,600 value, then $8,600 ÷ $1,000 = 8.6. | |
| 2. | Multiply the result by the number under the heading “Expenses Paid During Period.” |
| If Expenses Paid During Period were $7.50, then 8.6 x $7.50 = $64.50. |
In this illustration, the estimated expenses paid this period are $64.50.
Hypothetical Example for Comparison with Other Funds
Information in the second line (Hypothetical) for each class in the table can help you compare ongoing costs of investing in the Fund with those of other mutual funds. This information may not be used to estimate the actual ending account balance or expenses you paid during the period. The hypothetical “Ending Account Value” is based on the actual expense ratio for each class and an assumed 5% annual rate of return before expenses, which does not represent the Fund’s actual return. The figure under the heading “Expenses Paid During Period” shows the hypothetical expenses your account would have incurred under this scenario. You can compare this figure with the 5% hypothetical examples that appear in shareholder reports of other funds.
Please note that expenses shown in the table are meant to highlight ongoing costs and do not reflect any transaction costs, such as sales charges. Therefore, the second line for each class is useful in comparing ongoing costs only, and will not help you compare total costs of owning different funds. In addition, if transaction costs were included, your total costs would have been higher. Please refer to the Fund prospectus for additional information on operating expenses.
32 | Annual Report
franklintempleton.com
FRANKLIN GROWTH OPPORTUNITIES FUND
YOUR FUND’S EXPENSES
| Beginning Account | Ending Account | Expenses Paid During | ||||
| Share Class | Value 11/1/14 | Value 4/30/15 | Period* 11/1/14–4/30/15 | |||
| A | ||||||
| Actual | $ | 1,000 | $ | 1,075.80 | $ | 6.07 |
| Hypothetical (5% return before expenses) | $ | 1,000 | $ | 1,018.94 | $ | 5.91 |
| C | ||||||
| Actual | $ | 1,000 | $ | 1,072.00 | $ | 9.66 |
| Hypothetical (5% return before expenses) | $ | 1,000 | $ | 1,015.47 | $ | 9.39 |
| R | ||||||
| Actual | $ | 1,000 | $ | 1,074.80 | $ | 7.10 |
| Hypothetical (5% return before expenses) | $ | 1,000 | $ | 1,017.95 | $ | 6.90 |
| R6 | ||||||
| Actual | $ | 1,000 | $ | 1,078.50 | $ | 3.50 |
| Hypothetical (5% return before expenses) | $ | 1,000 | $ | 1,021.42 | $ | 3.41 |
| Advisor | ||||||
| Actual | $ | 1,000 | $ | 1,077.50 | $ | 4.53 |
| Hypothetical (5% return before expenses) | $ | 1,000 | $ | 1,020.43 | $ | 4.41 |
*Expenses are calculated using the most recent six-month expense ratio, net of expense waivers, annualized for each class (A: 1.18%;
C: 1.88%; R: 1.38%; R6: 0.68%; and Advisor: 0.88%), multiplied by the average account value over the period, multiplied by 181/365 to
reflect the one-half year period.
franklintempleton.com
Annual Report
| 33
Franklin Small Cap Growth Fund
This annual report for Franklin Small Cap Growth Fund covers the fiscal year ended April 30, 2015. At the market close on February 12, 2015, the Fund closed to new investors with limited exceptions. Existing shareholders may add to their accounts. We believe this closure can help us effectively manage our current level of assets.
Your Fund’s Goal and Main Investments
The Fund seeks long-term capital growth by normally investing at least 80% of its net assets in equity securities of small cap companies, which for this Fund are those with market capitalizations not exceeding $1.5 billion or that of the highest market capitalization in the Russell 2000® Index, whichever is greater, at the time of purchase.1
Performance Overview
For the 12 months under review, the Fund’s Class A shares delivered a cumulative total return of +8.34%. In comparison, the Russell 2000® Growth Index, which measures performance of small cap companies with higher price-to-book ratios and higher forecasted growth values, generated a +14.65% total return.2 The Standard & Poor’s 500 Index (S&P 500), which tracks the broad U.S. stock market, produced a +12.98% total return.2 You can find the Fund’s long-term performance data in the Performance Summary beginning on page 37.
Performance data represent past performance, which does not guarantee future results. Investment return and principal value will fluctuate, and you may have a gain or loss when you sell your shares. Current performance may differ from figures shown. Please visit franklintempleton.com or call (800) 342-5236 for most recent month-end performance.
Investment Strategy
We use fundamental, bottom-up research to seek companies meeting our criteria of growth potential, quality and valuation. In seeking sustainable growth characteristics, we look for companies we believe can produce sustainable earnings and cash flow growth, evaluating the long-term market opportunity and competitive structure of an industry to target leaders and emerging leaders. We define quality companies as those with strong
and improving competitive positions in attractive markets. We also believe important attributes of quality are experienced and talented management teams as well as financial strength reflected in the capital structure, gross and operating margins, free cash flow generation and returns on capital employed. Our valuation analysis includes a range of potential outcomes based on an assessment of multiple scenarios. In assessing value, we consider whether security prices fully reflect the balance of the sustainable growth opportunities relative to business and financial risks.
Manager’s Discussion
During the 12 months under review, most sectors represented in the Fund’s portfolio contributed to absolute performance. Relative to the Russell 2000® Growth Index, stock selection in the consumer staples and industrials sectors contributed to performance. An underweighting in materials also aided relative returns.
1. The Russell 2000 Index is market capitalization weighted and measures performance of the 2,000 smallest companies in the Russell 3000 Index, which represent
a small amount of the total market capitalization of the Russell 3000 Index.
2. Source: Morningstar.
The indexes are unmanaged and include reinvested dividends. One cannot invest directly in an index, and an index is not representative of the Fund’s portfolio.
The dollar value, number of shares or principal amount, and names of all portfolio holdings are listed in the Fund’s Statement of Investments (SOI).
The SOI begins on page 82.
34 | Annual Report franklintempleton.com
FRANKLIN SMALL CAP GROWTH FUND
| Top 10 Equity Holdings | ||
| 4/30/15 | ||
| Company | % of Total | |
| Sector/Industry | Net Assets | |
| Demandware Inc. | 1.6 | % |
| Information Technology | ||
| Astronics Corp. | 1.5 | % |
| Industrials | ||
| DexCom Inc. | 1.4 | % |
| Health Care | ||
| US Ecology Inc. | 1.4 | % |
| Industrials | ||
| Tenneco Inc. | 1.4 | % |
| Consumer Discretionary | ||
| Grand Canyon Education Inc. | 1.4 | % |
| Consumer Discretionary | ||
| The Advisory Board Co. | 1.3 | % |
| Industrials | ||
| Lattice Semiconductor Corp. | 1.3 | % |
| Information Technology | ||
| ViaSat Inc. | 1.3 | % |
| Information Technology | ||
| Cavium Inc. | 1.3 | % |
| Information Technology | ||
In consumer staples, our position in natural and organic food company Annie’s was a major contributor.3 Shares of Annie’s, which we purchased during the period, jumped after the company announced a definitive agreement to be acquired by General Mills, enabling Annie’s to begin a new growth phase and maximize shareholder value.
In the industrials sector, notable contributors included Astronics, a provider of advanced technologies for the global aerospace and defense industries. Astronics’s 2014 and first-quarter 2015 revenues and net incomes grew, resulting from sales growth in its aerospace segment aided by organic growth and acquisitions during the period. The company also forecast robust revenue growth for 2015.
Other key individual contributors included several health care holdings such as medical device company DexCom, operator of freestanding emergency rooms Adeptus Health, and technology-based specialty pharmaceutical company Impax Laboratories. A position in 2U, an education technology company, also helped relative returns.
DexCom reported growth in revenues and a lower net loss for 2014 and also generated a profit for the first time in the fourth quarter of 2014. During the period, the company received Food and Drug Administration (FDA) approval for its continuous glucose monitoring remote mobile communications device, DexCom SHARE. Impax Laboratories posted 2014 revenue growth as sales in its global pharmaceuticals division rose mainly due to a surge in sales of authorized generic drug Renvela. However, its Impax Pharmaceuticals division reported a steep decline in revenues due to lower sales of Zomig. The company’s shares surged after it received FDA approval for Parkinson’s disease treatment drug Rytary, and also after the company announced it had completed the acquisitions of Tower Holdings and Lineage Therapeutics, which were expected to provide a robust product pipeline and a diversified manufacturing base. The company also generated first-quarter 2015 revenue growth as sales increased for existing and acquired products.
In contrast, several sectors detracted from the Fund’s relative performance, particularly the information technology (IT) sector owing to stock selection. Stock selection and an underweighting in health care as well as stock selection in energy also hampered relative results. Stock selection in financials and an overweighting in consumer discretionary further weighed on relative performance. In the IT sector, key detractors included our positions in programmable logic products manufacturer Lattice Semiconductor and application and networking technologies provider A10 Networks. Investor concerns about a slowdown in the semiconductor industry weighed on Lattice Semiconductor’s shares. Further pressuring shares were the company’s lower third- and fourth-quarter 2014 reported revenues. Additionally, the company provided muted first-quarter 2015 revenue guidance and posted a net loss for the same period, mainly due to acquisition-related costs. Lattice Semiconductor acquired Silicon Image, a wireless connectivity solutions provider, during 2015’s first quarter to obtain a diversified global customer base along with business and operational synergies. A10’s share price fell after the company reported a greater-than-expected second-quarter 2014 loss and lowered its third-quarter revenue guidance. In the health care sector, specialty biopharmaceutical company Revance Therapeutics performed poorly.
3. No longer held at period-end.
franklintempleton.com
Annual Report
| 35
FRANKLIN SMALL CAP GROWTH FUND
Stocks in the energy sector generally retreated as crude oil prices fell sharply during the period resulting mainly from excess global supply from North American shale producers. Several of our energy holdings detracted from relative returns, particularly our position in independent energy company Rex Energy and our off-benchmark investment in onshore energy production services provider Key Energy Services.3 Rex Energy reported growth in 2014 operational revenues and production. The company generated robust production volumes for 2015’s first quarter and also raised its 2015 production guidance due to better-than-expected performance of recently completed wells with increased sand concentrations. Key Energy’s share price fell after the company reported weak revenues and a challenging outlook for the energy end markets it serves.
Investment management services provider Virtus Investment Partners in the financials sector hindered relative returns, as did restaurant chain Noodles & Co. in consumer discretionary. Other key individual detractors included our off-benchmark position in commercial foodservice and heavy equipment manufacturer The Manitowoc Co.4 Manitowoc reported disappointing first-quarter 2015 results amid reduced revenues from the foodservice and crane segments and an adverse foreign exchange impact. Additionally, the company announced flat revenue guidance for the foodservice segment and a decline in crane revenues for 2015.
Thank you for your continued participation in Franklin Small Cap Growth Fund. We look forward to serving your future investment needs.

The foregoing information reflects our analysis, opinions and portfolio holdings as of April 30, 2015, the end of the reporting period. The way we implement our main investment strategies and the resulting portfolio holdings may change depending on factors such as market and economic conditions. These opinions may not be relied upon as investment advice or an offer for a particular security. The information is not a complete analysis of every aspect of any market, country, industry, security or the Fund. Statements of fact are from sources considered reliable, but the investment manager makes no representation or warranty as to their completeness or accuracy. Although historical performance is no guarantee of future results, these insights may help you understand our investment management philosophy.
4. Not part of the index.
See www.franklintempletondatasources.com for additional data provider information.
36 | Annual Report
franklintempleton.com
FRANKLIN SMALL CAP GROWTH FUND
Performance Summary as of April 30, 2015
Your dividend income will vary depending on dividends or interest paid by securities in the Fund’s portfolio, adjusted for operating expenses of each class. Capital gain distributions are net profits realized from the sale of portfolio securities. The performance table and graphs do not reflect any taxes that a shareholder would pay on Fund dividends, capital gain distributions, if any, or any realized gains on the sale of Fund shares. Total return reflects reinvestment of the Fund’s dividends and capital gain distributions, if any, and any unrealized gains or losses.
| Net Asset Value | ||||||
| Share Class (Symbol) | 4/30/15 | 4/30/14 | Change | |||
| A (FSGRX) | $ | 18.83 | $ | 18.20 | +$ | 0.63 |
| C (FCSGX) | $ | 16.36 | $ | 16.03 | +$ | 0.33 |
| R (FSSRX) | $ | 18.11 | $ | 17.57 | +$ | 0.54 |
| R6 (FSMLX) | $ | 20.02 | $ | 19.21 | +$ | 0.81 |
| Advisor (FSSAX) | $ | 19.94 | $ | 19.17 | +$ | 0.77 |
| Distributions (5/1/14–4/30/15) | ||||||
| Short-Term | Long-Term | |||||
| Share Class | Capital Gain | Capital Gain | Total | |||
| A | $ | 0.3714 | $ | 0.4457 | $ | 0.8171 |
| C | $ | 0.3714 | $ | 0.4457 | $ | 0.8171 |
| R | $ | 0.3714 | $ | 0.4457 | $ | 0.8171 |
| R6 | $ | 0.3714 | $ | 0.4457 | $ | 0.8171 |
| Advisor | $ | 0.3714 | $ | 0.4457 | $ | 0.8171 |
franklintempleton.com
Annual Report
| 37
FRANKLIN SMALL CAP GROWTH FUND
PERFORMANCE SUMMARY
Performance as of 4/30/151
Cumulative total return excludes sales charges. Average annual total returns and value of $10,000 investment include maximum sales charges. Class A: 5.75% maximum initial sales charge; Class C: 1% contingent deferred sales charge in first year only;
Class R/R6/Advisor Class: no sales charges.
| Value of | Average Annual | Total Annual | ||||||||||
| Operating Expenses6 | ||||||||||||
| Cumulative | Average Annual | $ | 10,000 | Total Return | ||||||||
| Share Class | Total Return2 | Total Return3 | Investment4 | (3/31/15 | )5 | (with waiver) | (without waiver) | |||||
| A | 1.21 | % | 1.22 | % | ||||||||
| 1-Year | +8.34 | % | +2.12 | % | $ | 10,212 | -0.78 | % | ||||
| 5-Year | +110.19 | % | +14.65 | % | $ | 19,813 | +16.40 | % | ||||
| 10-Year | +172.36 | % | +9.88 | % | $ | 25,666 | +9.44 | % | ||||
| C | 1.91 | % | 1.92 | % | ||||||||
| 1-Year | +7.58 | % | +6.58 | % | $ | 10,658 | +3.55 | % | ||||
| 5-Year | +102.98 | % | +15.21 | % | $ | 20,298 | +16.97 | % | ||||
| 10-Year | +153.61 | % | +9.75 | % | $ | 25,361 | +9.30 | % | ||||
| R | 1.41 | % | 1.42 | % | ||||||||
| 1-Year | +8.12 | % | +8.12 | % | $ | 10,812 | +5.07 | % | ||||
| 5-Year | +108.14 | % | +15.79 | % | $ | 20,814 | +17.55 | % | ||||
| 10-Year | +166.63 | % | +10.30 | % | $ | 26,663 | +9.85 | % | ||||
| R6 | 0.73 | % | 0.74 | % | ||||||||
| 1-Year | +8.91 | % | +8.91 | % | $ | 10,891 | +5.79 | % | ||||
| Since Inception (5/1/13) | +47.90 | % | +21.65 | % | $ | 14,790 | +24.17 | % | ||||
| Advisor | 0.91 | % | 0.92 | % | ||||||||
| 1-Year | +8.65 | % | +8.65 | % | $ | 10,865 | +5.55 | % | ||||
| 5-Year | +113.47 | % | +16.38 | % | $ | 21,347 | +18.15 | % | ||||
| 10-Year | +180.37 | % | +10.86 | % | $ | 28,037 | +10.39 | % | ||||
Performance data represent past performance, which does not guarantee future results. Investment return and principal value will fluctuate, and you may have a gain or loss when you sell your shares. Current performance may differ from figures shown. For most recent month-end performance, go to franklintempleton.com or call (800) 342-5236.
38 | Annual Report
franklintempleton.com
FRANKLIN SMALL CAP GROWTH FUND
PERFORMANCE SUMMARY
Total Return Index Comparison for a Hypothetical $10,000 Investment1
Total return represents the change in value of an investment over the periods shown. It includes any applicable maximum sales charge, Fund expenses, account fees and reinvested distributions. The unmanaged indexes include reinvestment of any income or distributions. They differ from the Fund in composition and do not pay management fees or expenses. One cannot invest directly in an index.
franklintempleton.com
Annual Report
| 39
FRANKLIN SMALL CAP GROWTH FUND
PERFORMANCE SUMMARY
Total Return Index Comparison for a Hypothetical $10,000 Investment1 (continued)
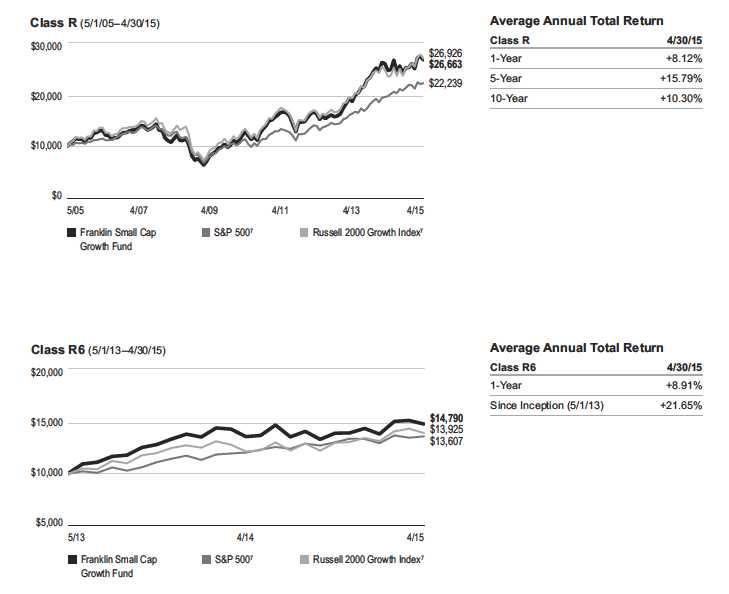
40 | Annual Report
franklintempleton.com
FRANKLIN SMALL CAP GROWTH FUND
PERFORMANCE SUMMARY
Total Return Index Comparison for a Hypothetical $10,000 Investment1 (continued)
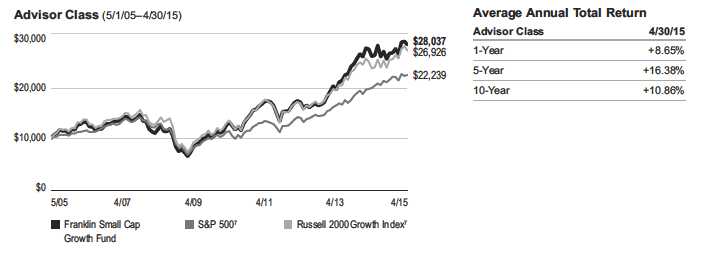
All investments involve risks, including possible loss of principal. Smaller, midsized and relatively new or unseasoned companies can be particularly sensitive to changing economic conditions, and their prospects for growth are less certain than those of larger, more established companies. Historically, these securities have experienced more price volatility than larger company stocks, especially over the short term. Growth stock prices reflect projections of future earnings or revenues, and can, therefore, fall dramatically if the company fails to meet those projections. To the extent the Fund focuses on particular countries, regions, industries, sectors or types of investment from time to time, it may be subject to greater risks of adverse developments in such areas of focus than a fund that invests in a wider variety of countries, regions, industries, sectors or investments. From time to time, the trading market for a particular security or type of security in which the Fund invests may become less liquid or even illiquid. The Fund is actively managed but there is no guarantee that the manager’s investment decisions will produce the desired results. The Fund’s prospectus also includes a description of the main investment risks.
| Class C: | These shares have higher annual fees and expenses than Class A shares. |
| Class R: | Shares are available to certain eligible investors as described in the prospectus. These shares have higher annual fees and expenses than Class A shares. |
| Class R6: | Shares are available to certain eligible investors as described in the prospectus. |
| Advisor Class: | Shares are available to certain eligible investors as described in the prospectus. |
1. The Fund has a fee waiver associated with its investments in a Franklin Templeton money fund, contractually guaranteed through at least its current fiscal year-end.
Class R6 has a fee waiver contractually guaranteed through at least the Fund’s current fiscal year-end. Fund investment results reflect the fee waivers, to the extent
applicable; without these reductions, the results would have been lower.
2. Cumulative total return represents the change in value of an investment over the periods indicated.
3. Average annual total return represents the average annual change in value of an investment over the periods indicated.
4. These figures represent the value of a hypothetical $10,000 investment in the Fund over the periods indicated.
5. In accordance with SEC rules, we provide standardized average annual total return information through the latest calendar quarter.
6. Figures are as stated in the Fund’s current prospectus. In periods of market volatility, assets may decline significantly, causing total annual Fund operating expenses to
become higher than the figures shown.
7. Source: Morningstar. The S&P 500 is a market capitalization-weighted index of 500 stocks designed to measure total U.S. equity market performance. The Russell 2000
Growth Index is market capitalization weighted and measures performance of those Russell 2000 Index companies with higher price-to-book ratios and higher forecasted
growth values.
See www.franklintempletondatasources.com for additional data provider information.
franklintempleton.com
Annual Report
| 41
FRANKLIN SMALL CAP GROWTH FUND
Your Fund’s Expenses
As a Fund shareholder, you can incur two types of costs:
- Transaction costs, including sales charges (loads) on Fund purchases; and
- Ongoing Fund costs, including management fees, distribu- tion and service (12b-1) fees, and other Fund expenses. All mutual funds have ongoing costs, sometimes referred to as operating expenses.
The following table shows ongoing costs of investing in the Fund and can help you understand these costs and compare them with those of other mutual funds. The table assumes a $1,000 investment held for the six months indicated.
Actual Fund Expenses
The first line (Actual) for each share class listed in the table provides actual account values and expenses. The “Ending Account Value” is derived from the Fund’s actual return, which includes the effect of Fund expenses.
You can estimate the expenses you paid during the period by following these steps. Of course, your account value and expenses will differ from those in this illustration:
| 1. | Divide your account value by $1,000. |
| If an account had an $8,600 value, then $8,600 ÷ $1,000 = 8.6. | |
| 2. | Multiply the result by the number under the heading “Expenses Paid During Period.” |
| If Expenses Paid During Period were $7.50, then 8.6 x $7.50 = $64.50. |
In this illustration, the estimated expenses paid this period are $64.50.
Hypothetical Example for Comparison with Other Funds
Information in the second line (Hypothetical) for each class in the table can help you compare ongoing costs of investing in the Fund with those of other mutual funds. This information may not be used to estimate the actual ending account balance or expenses you paid during the period. The hypothetical “Ending Account Value” is based on the actual expense ratio for each class and an assumed 5% annual rate of return before expenses, which does not represent the Fund’s actual return. The figure under the heading “Expenses Paid During Period” shows the hypothetical expenses your account would have incurred under this scenario. You can compare this figure with the 5% hypothetical examples that appear in shareholder reports of other funds.
Please note that expenses shown in the table are meant to highlight ongoing costs and do not reflect any transaction costs, such as sales charges. Therefore, the second line for each class is useful in comparing ongoing costs only, and will not help you compare total costs of owning different funds. In addition, if transaction costs were included, your total costs would have been higher. Please refer to the Fund prospectus for additional information on operating expenses.
42 | Annual Report
franklintempleton.com
FRANKLIN SMALL CAP GROWTH FUND
YOUR FUND’S EXPENSES
| Beginning Account | Ending Account | Expenses Paid During | ||||
| Share Class | Value 11/1/14 | Value 4/30/15 | Period* 11/1/14–4/30/15 | |||
| A | ||||||
| Actual | $ | 1,000 | $ | 1,060.70 | $ | 5.93 |
| Hypothetical (5% return before expenses) | $ | 1,000 | $ | 1,019.04 | $ | 5.81 |
| C | ||||||
| Actual | $ | 1,000 | $ | 1,057.40 | $ | 9.59 |
| Hypothetical (5% return before expenses) | $ | 1,000 | $ | 1,015.47 | $ | 9.39 |
| R | ||||||
| Actual | $ | 1,000 | $ | 1,059.50 | $ | 7.05 |
| Hypothetical (5% return before expenses) | $ | 1,000 | $ | 1,017.95 | $ | 6.90 |
| R6 | ||||||
| Actual | $ | 1,000 | $ | 1,063.60 | $ | 3.33 |
| Hypothetical (5% return before expenses) | $ | 1,000 | $ | 1,021.57 | $ | 3.26 |
| Advisor | ||||||
| Actual | $ | 1,000 | $ | 1,062.20 | $ | 4.50 |
| Hypothetical (5% return before expenses) | $ | 1,000 | $ | 1,020.43 | $ | 4.41 |
*Expenses are calculated using the most recent six-month expense ratio, net of expense waivers, annualized for each class (A: 1.16%;
C: 1.88%; R: 1.38%; R6: 0.65%; and Advisor: 0.88%), multiplied by the average account value over the period, multiplied by 181/365 to
reflect the one-half year period.
franklintempleton.com
Annual Report
| 43
Franklin Small-Mid Cap Growth Fund
This annual report for Franklin Small-Mid Cap Growth Fund covers the fiscal year ended April 30, 2015.
Your Fund’s Goal and Main Investments
The Fund seeks long-term capital growth by normally investing at least 80% of its net assets in equity securities of small-cap and mid-cap companies. The Fund defines small-cap companies as those within the market capitalization range of companies in the Russell 2500™ Index at the time of purchase, and mid-cap companies as those within the market capitalization range of the Russell Midcap® Index at the time of purchase.1
Performance Overview
For the 12 months under review, the Fund’s Class A shares delivered a +15.78% cumulative total return. In comparison, the Russell Midcap® Growth Index, which measures performance of companies in the Russell Midcap® Index with higher price-to-book ratios and higher forecasted growth values, generated a +16.46% total return.2 Also in comparison, the Standard & Poor’s 500 Index (S&P 500), which tracks the broad U.S. stock market, produced a +12.98% total return.2 You can find the Fund’s long-term performance data in the Performance Summary beginning on page 47.
Performance data represent past performance, which does not guarantee future results. Investment return and principal value will fluctuate, and you may have a gain or loss when you sell your shares. Current performance may differ from figures shown. Please visit franklintempleton.com or call (800) 342-5236 for most recent month-end performance.
Investment Strategy
We use fundamental, bottom-up research to seek companies meeting our criteria of growth potential, quality and valuation. In seeking sustainable growth characteristics, we look for companies we believe can produce sustainable earnings and cash flow growth, evaluating the long-term market opportunity and competitive structure of an industry to target leaders and
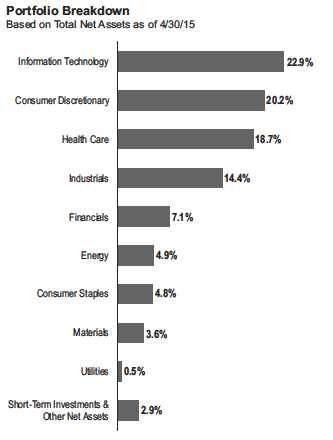
emerging leaders. We define quality companies as those with strong and improving competitive positions in attractive markets. We also believe important attributes of quality are experienced and talented management teams as well as financial strength reflected in the capital structure, gross and operating margins, free cash flow generation and returns on capital employed. Our valuation analysis includes a range of potential outcomes based on an assessment of multiple scenarios. In assessing value, we consider whether security prices fully reflect the balance of the sustainable growth opportunities relative to business and financial risks.
1. The Russell 2500 Index is market capitalization weighted and measures performance of the 2,500 smallest companies in the Russell 3000 Index, which represent
a modest amount of the Russell 3000 Index’s total market capitalization. The Russell Midcap Index is market capitalization weighted and measures performance of the
smallest companies in the Russell 1000 Index, which represent a modest amount of the Russell 1000 Index’s total market capitalization.
2. Source: Morningstar.
The indexes are unmanaged and include reinvested dividends. One cannot invest directly in an index, and an index is not representative of the Fund’s portfolio.
The dollar value, number of shares or principal amount, and names of all portfolio holdings are listed in the Fund’s Statement of Investments (SOI).
The SOI begins on page 90.
44 | Annual Report franklintempleton.com
FRANKLIN SMALL-MID CAP GROWTH FUND
| Top 10 Equity Holdings | ||
| 4/30/15 | ||
| Company | % of Total | |
| Sector/Industry | Net Assets | |
| NXP Semiconductors NV (Netherlands) | 1.7 | % |
| Information Technology | ||
| AMETEK Inc. | 1.4 | % |
| Industrials | ||
| Perrigo Co. PLC | 1.4 | % |
| Health Care | ||
| Affiliated Managers Group Inc. | 1.4 | % |
| Financials | ||
| Impax Laboratories Inc. | 1.4 | % |
| Health Care | ||
| Jarden Corp. | 1.3 | % |
| Consumer Discretionary | ||
| Intercontinental Exchange Inc. | 1.3 | % |
| Financials | ||
| Axalta Coating Systems Ltd. | 1.2 | % |
| Materials | ||
| Electronic Arts Inc. | 1.2 | % |
| Information Technology | ||
| Quintiles Transnational Holdings Inc. | 1.2 | % |
| Health Care | ||
Manager’s Discussion
During the 12 months under review, most sectors in the Fund’s portfolio contributed to absolute performance as the broader stock market rallied. Relative to the Russell Midcap® Growth Index, major contributors to the Fund’s performance included an overweighting in the health care sector, an underweighting and stock selection in materials, and an overweighting and stock selection in information technology (IT).
In the health care sector, key contributors included our investments in technology-based specialty pharmaceutical company Impax Laboratories3 and medical device firm CareFusion,3,4 Impax Laboratories posted 2014 revenue growth as sales in its global pharmaceuticals division rose mainly due to a surge in sales of authorized generic drug Renvela. However, its Impax Pharmaceuticals division reported a steep decline in revenues due to lower sales of Zomig. The company’s shares surged after it got an approval from the Food and Drug Administration for Parkinson’s disease treatment drug Rytary, and also after the company announced it had completed the acquisitions of Tower Holdings and Lineage Therapeutics, which were expected to provide a robust product pipeline and a diversified manufacturing base. The company also generated first-quarter 2015 revenue growth helped by an increase in sales of existing and acquired products. CareFusion reported healthy fiscal first-quarter 2015 results, led by gains in the procedural solutions segment. An acquisition of Vital Signs, which helped the dispensing technologies business line, also supported revenue growth. In addition, the company raised fiscal year 2015 earnings guidance based on a tax settlement with the Internal Revenue Service. Shares of CareFusion advanced after Becton, Dickinson and Co. entered into a deal to acquire the medical device firm in an effort to create a global leader in the medication management and patient safety solutions market.
Within materials, our position in global coatings company Axalta Coating Systems added to relative results. The company’s first-quarter 2015 revenues rose, meeting the company’s estimates, driven by higher volumes. Growth across Axalta’s performance coatings and transportation coatings segments contributed to the company’s performance, although unfavorable currency exchange rates weighed on results. Axalta shares gained after Berkshire Hathaway agreed to purchase 20 million shares of the company. In the IT sector, holdings in integrated circuit manufacturers NXP Semiconductors3 and Freescale Semiconductor, as well as a position in game software content and services firm Electronic Arts, helped relative performance. NXP Semiconductors generated positive 2014 and first-quarter 2015 results, with strong performance across its high-performance mixed signal and standard products segments. Shares surged after the company announced its acquisition of Freescale Semiconductor to expand its market share in the chips industry. Electronic Arts generated fiscal fourth-quarter 2015 results above its guidance, driven by an increase in revenues from its console and mobile platforms, while revenues from its personal computer and other platform segments declined moderately.
Elsewhere, apparel and footwear manufacturer Under Armour performed well. The company reported growth across all its business segments: apparel, footwear and accessories. Additionally, the company raised its 2015 revenue and operating income guidance as it continues to expand its brand internationally.
3. Not part of the index.
4. No longer held at period-end.
See www.franklintempletondatasources.com for additional data provider information.
franklintempleton.com
Annual Report
| 45
FRANKLIN SMALL-MID CAP GROWTH FUND
In contrast, key detractors from the Fund’s relative performance included stock selection in consumer discretionary and industrials. In consumer discretionary, our holdings in home-building company KB Home3 and health and wellness products retailer GNC Holdings4 hampered relative returns. KB Home shares fell after the company projected a sharp drop in gross margins in its 2015 fiscal first quarter amid higher labor and material costs as well as sales incentives. However, for the same quarter, the company reported better-than-expected earnings and higher revenues, led by an increase in orders and selling prices. Additionally, KB Home reported modest results for its 2014 fiscal year ended November 30. Within industrials, our positions in industrial manufacturing and engineering company Colfax4 and commercial foodservice and heavy equipment manufacturer The Manitowoc Co.4 hurt relative performance. Colfax reported lower first-quarter 2015 revenues as gas- and fluid-handling orders declined during the quarter, but the company’s 2014 revenues and orders were higher than in the previous year. The weakness in the global energy markets impacted our industrial companies during the year. Manitowoc reported disappointing first-quarter 2015 results amid reduced revenues from the foodservice and crane segments and an adverse foreign exchange impact. Additionally, the company announced flat revenue guidance for the foodservice segment and a decline in crane revenues for 2015.
Other key individual detractors included our positions in 3D printing company Stratasys,4 oil and gas explorer and producer Oasis Petroleum,4 wireless and technology solutions company Trimble Navigation,4 and online urban guide Yelp. Shares of Stratasys declined after the company projected weak quarterly results and cut its 2015 guidance. The company generated muted first-quarter 2015 revenues and posted a net loss. Oasis Petroleum’s fourth-quarter 2014 revenues decreased mainly due to falling commodity prices and the company’s average daily oil production exceeding its guidance range.
Thank you for your continued participation in Franklin Small-Mid Cap Growth Fund. We look forward to serving your future investment needs.

The foregoing information reflects our analysis, opinions and portfolio holdings as of April 30, 2015, the end of the reporting period. The way we implement our main investment strategies and the resulting portfolio holdings may change depending on factors such as market and economic conditions. These opinions may not be relied upon as investment advice or an offer for a particular security. The information is not a complete analysis of every aspect of any market, country, industry, security or the Fund. Statements of fact are from sources considered reliable, but the investment manager makes no representation or warranty as to their completeness or accuracy. Although historical performance is no guarantee of future results, these insights may help you understand our investment management philosophy.
46 | Annual Report
franklintempleton.com
FRANKLIN SMALL-MID CAP GROWTH FUND
Performance Summary as of April 30, 2015
Your dividend income will vary depending on dividends or interest paid by securities in the Fund’s portfolio, adjusted for operating expenses of each class. Capital gain distributions are net profits realized from the sale of portfolio securities. The performance table and graphs do not reflect any taxes that a shareholder would pay on Fund dividends, capital gain distributions, if any, or any realized gains on the sale of Fund shares. Total return reflects reinvestment of the Fund’s dividends and capital gain distributions, if any, and any unrealized gains or losses.
| Net Asset Value | ||||||
| Share Class (Symbol) | 4/30/15 | 4/30/14 | Change | |||
| A (FRSGX) | $ | 38.38 | $ | 40.42 | -$ | 2.04 |
| C (FRSIX) | $ | 30.43 | $ | 33.78 | -$ | 3.35 |
| R (FSMRX) | $ | 36.18 | $ | 38.61 | -$ | 2.43 |
| R6 (FMGGX) | $ | 41.04 | $ | 42.53 | -$ | 1.49 |
| Advisor (FSGAX) | $ | 40.83 | $ | 42.44 | -$ | 1.61 |
| Distributions (5/1/14–4/30/15) | ||||||
| Short-Term | Long-Term | |||||
| Share Class | Capital Gain | Capital Gain | Total | |||
| A | $ | 0.9032 | $ | 6.7080 | $ | 7.6112 |
| C | $ | 0.9032 | $ | 6.7080 | $ | 7.6112 |
| R | $ | 0.9032 | $ | 6.7080 | $ | 7.6112 |
| R6 | $ | 0.9032 | $ | 6.7080 | $ | 7.6112 |
| Advisor | $ | 0.9032 | $ | 6.7080 | $ | 7.6112 |
franklintempleton.com
Annual Report
| 47
FRANKLIN SMALL-MID CAP GROWTH FUND
PERFORMANCE SUMMARY
Performance as of 4/30/151
Cumulative total return excludes sales charges. Average annual total returns and value of $10,000 investment include maximum sales charges. Class A: 5.75% maximum initial sales charge; Class C: 1% contingent deferred sales charge in first year only;
Class R/R6/Advisor Class: no sales charges.
| Cumulative | Average Annual | Value of | Average Annual | Total Annual Operating | ||||||
| Share Class | Total Return2 | Total Return3 | $ | 10,000 Investment4 | Total Return (3/31/15)5 | Operating Expenses6 | ||||
| A | 0.96 | % | ||||||||
| 1-Year | +15.78 | % | +9.11 | % | $ | 10,911 | +7.05 | % | ||
| 5-Year | +92.61 | % | +12.67 | % | $ | 18,153 | +13.69 | % | ||
| 10-Year | +155.17 | % | +9.17 | % | $ | 24,050 | +8.75 | % | ||
| C | 1.71 | % | ||||||||
| 1-Year | +14.96 | % | +14.06 | % | $ | 11,406 | +11.92 | % | ||
| 5-Year | +85.49 | % | +13.15 | % | $ | 18,549 | +14.18 | % | ||
| 10-Year | +136.77 | % | +9.00 | % | $ | 23,677 | +8.58 | % | ||
| R | 1.21 | % | ||||||||
| 1-Year | +15.52 | % | +15.52 | % | $ | 11,552 | +13.33 | % | ||
| 5-Year | +90.17 | % | +13.72 | % | $ | 19,017 | +14.76 | % | ||
| 10-Year | +148.80 | % | +9.54 | % | $ | 24,880 | +9.12 | % | ||
| R6 | 0.47 | % | ||||||||
| 1-Year | +16.32 | % | +16.32 | % | $ | 11,632 | +14.13 | % | ||
| Since Inception (5/1/13) | +44.74 | % | +20.34 | % | $ | 14,474 | +21.94 | % | ||
| Advisor | 0.71 | % | ||||||||
| 1-Year | +16.09 | % | +16.09 | % | $ | 11,609 | +13.87 | % | ||
| 5-Year | +95.10 | % | +14.30 | % | $ | 19,510 | +15.33 | % | ||
| 10-Year | +161.74 | % | +10.10 | % | $ | 26,174 | +9.67 | % |
Performance data represent past performance, which does not guarantee future results. Investment return and principal value will fluctuate, and you may have a gain or loss when you sell your shares. Current performance may differ from figures shown. For most recent month-end performance, go to franklintempleton.com or call (800) 342-5236.
48 | Annual Report
franklintempleton.com
FRANKLIN SMALL-MID CAP GROWTH FUND
PERFORMANCE SUMMARY
Total Return Index Comparison for a Hypothetical $10,000 Investment1
Total return represents the change in value of an investment over the periods shown. It includes any applicable maximum sales charge, Fund expenses, account fees and reinvested distributions. The unmanaged indexes include reinvestment of any income or distributions. They differ from the Fund in composition and do not pay management fees or expenses. One cannot invest directly in an index.
franklintempleton.com
Annual Report
| 49
FRANKLIN SMALL-MID CAP GROWTH FUND
PERFORMANCE SUMMARY
Total Return Index Comparison for a Hypothetical $10,000 Investment1 (continued)
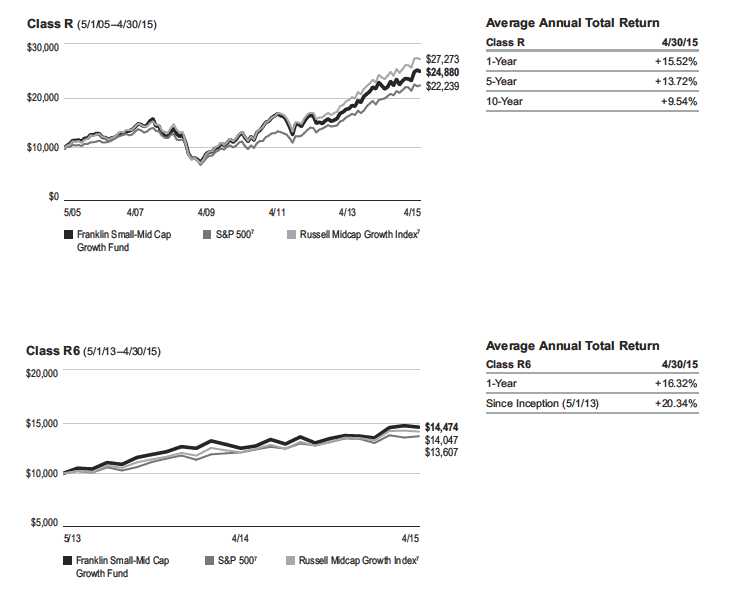
50 | Annual Report franklintempleton.com
FRANKLIN SMALL-MID CAP GROWTH FUND
PERFORMANCE SUMMARY
Total Return Index Comparison for a Hypothetical $10,000 Investment1 (continued)
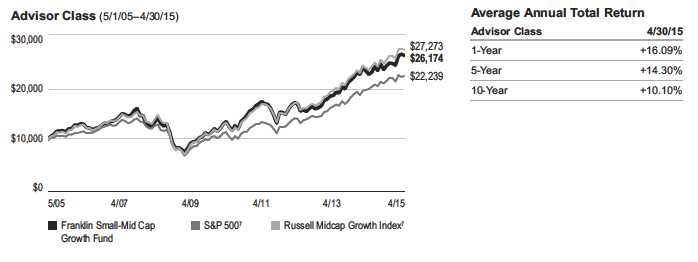
All investments involve risks, including possible loss of principal. Growth stock prices reflect projections of future earnings or revenues, and can, therefore, fall dramatically if the company fails to meet those projections. Smaller, midsized and relatively new or unseasoned companies can be particularly sensitive to changing economic conditions, and their prospects for growth are less certain than those of larger, more established companies. Historically, these securities have experienced more price volatility than larger company stocks, especially over the short term. To the extent the Fund focuses on particular countries, regions, industries, sectors or types of investment from time to time, it may be subject to greater risks of adverse developments in such areas of focus than a fund that invests in a wider variety of countries, regions, industries, sectors or investments. From time to time, the trading market for a particular security or type of security in which the Fund invests may become less liquid or even illiquid. The Fund is actively managed but there is no guarantee that the manager’s investment decisions will produce the desired results. The Fund’s prospectus also includes a description of the main investment risks.
| Class C: | These shares have higher annual fees and expenses than Class A shares. |
| Class R: | Shares are available to certain eligible investors as described in the prospectus. These shares have higher annual fees and expenses than Class A shares. |
| Class R6: | Shares are available to certain eligible investors as described in the prospectus. |
| Advisor Class: | Shares are available to certain eligible investors as described in the prospectus. |
1. The Fund has a fee waiver associated with its investments in a Franklin Templeton money fund, contractually guaranteed through at least its current fiscal year-end.
Class R6 has a fee waiver contractually guaranteed through at least the Fund’s current fiscal year-end. Fund investment results reflect the fee waivers, to the extent
applicable; without these reductions, the results would have been lower.
2. Cumulative total return represents the change in value of an investment over the periods indicated.
3. Average annual total return represents the average annual change in value of an investment over the periods indicated.
4. These figures represent the value of a hypothetical $10,000 investment in the Fund over the periods indicated.
5. In accordance with SEC rules, we provide standardized average annual total return information through the latest calendar quarter.
6. Figures are as stated in the Fund’s current prospectus. In periods of market volatility, assets may decline significantly, causing total annual Fund operating expenses to
become higher than the figures shown.
7. Source: Morningstar. The S&P 500 is a market capitalization-weighted index of 500 stocks designed to measure total U.S. equity market performance. The Russell
Midcap Growth Index is market capitalization weighted and measures performance of those Russell Midcap Index companies with higher price-to-book ratios and higher
forecasted growth values.
See www.franklintempletondatasources.com for additional data provider information.
franklintempleton.com Annual Report | 51
FRANKLIN SMALL-MID CAP GROWTH FUND
Your Fund’s Expenses
As a Fund shareholder, you can incur two types of costs:
- Transaction costs, including sales charges (loads) on Fund purchases; and
- Ongoing Fund costs, including management fees, distribu- tion and service (12b-1) fees, and other Fund expenses. All mutual funds have ongoing costs, sometimes referred to as operating expenses.
The following table shows ongoing costs of investing in the Fund and can help you understand these costs and compare them with those of other mutual funds. The table assumes a $1,000 investment held for the six months indicated.
Actual Fund Expenses
The first line (Actual) for each share class listed in the table provides actual account values and expenses. The “Ending Account Value” is derived from the Fund’s actual return, which includes the effect of Fund expenses.
You can estimate the expenses you paid during the period by following these steps. Of course, your account value and expenses will differ from those in this illustration:
| 1. | Divide your account value by $1,000. |
| If an account had an $8,600 value, then $8,600 ÷ $1,000 = 8.6. | |
| 2. | Multiply the result by the number under the heading “Expenses Paid During Period.” |
| If Expenses Paid During Period were $7.50, then 8.6 x $7.50 = $64.50. |
In this illustration, the estimated expenses paid this period are $64.50.
Hypothetical Example for Comparison with Other Funds
Information in the second line (Hypothetical) for each class in the table can help you compare ongoing costs of investing in the Fund with those of other mutual funds. This information may not be used to estimate the actual ending account balance or expenses you paid during the period. The hypothetical “Ending Account Value” is based on the actual expense ratio for each class and an assumed 5% annual rate of return before expenses, which does not represent the Fund’s actual return. The figure under the heading “Expenses Paid During Period” shows the hypothetical expenses your account would have incurred under this scenario. You can compare this figure with the 5% hypothetical examples that appear in shareholder reports of other funds.
Please note that expenses shown in the table are meant to highlight ongoing costs and do not reflect any transaction costs, such as sales charges. Therefore, the second line for each class is useful in comparing ongoing costs only, and will not help you compare total costs of owning different funds. In addition, if transaction costs were included, your total costs would have been higher. Please refer to the Fund prospectus for additional information on operating expenses.
52 | Annual Report
franklintempleton.com
FRANKLIN SMALL-MID CAP GROWTH FUND
YOUR FUND’S EXPENSES
| Beginning Account | Ending Account | Expenses Paid During | ||||
| Share Class | Value 11/1/14 | Value 4/30/15 | Period* 11/1/14–4/30/15 | |||
| A | ||||||
| Actual | $ | 1,000 | $ | 1,079.30 | $ | 4.79 |
| Hypothetical (5% return before expenses) | $ | 1,000 | $ | 1,020.18 | $ | 4.66 |
| C | ||||||
| Actual | $ | 1,000 | $ | 1,075.40 | $ | 8.65 |
| Hypothetical (5% return before expenses) | $ | 1,000 | $ | 1,016.46 | $ | 8.40 |
| R | ||||||
| Actual | $ | 1,000 | $ | 1,078.10 | $ | 6.08 |
| Hypothetical (5% return before expenses) | $ | 1,000 | $ | 1,018.94 | $ | 5.91 |
| R6 | ||||||
| Actual | $ | 1,000 | $ | 1,081.60 | $ | 2.48 |
| Hypothetical (5% return before expenses) | $ | 1,000 | $ | 1,022.41 | $ | 2.41 |
| Advisor | ||||||
| Actual | $ | 1,000 | $ | 1,080.70 | $ | 3.51 |
| Hypothetical (5% return before expenses) | $ | 1,000 | $ | 1,021.42 | $ | 3.41 |
*Expenses are calculated using the most recent six-month expense ratio, net of expense waivers, annualized for each class (A: 0.93%;
C: 1.68%; R: 1.18%; R6: 0.48%; and Advisor: 0.68%), multiplied by the average account value over the period, multiplied by 181/365 to
reflect the one-half year period.
franklintempleton.com
Annual Report
| 53
| FRANKLIN STRATEGIC SERIES | |||||||||||||||
| Financial Highlights | |||||||||||||||
| Franklin Flex Cap Growth Fund | |||||||||||||||
| Year Ended April 30, | |||||||||||||||
| 2015 | 2014 | 2013 | 2012 | 2011 | |||||||||||
| Class A | |||||||||||||||
| Per share operating performance | |||||||||||||||
| (for a share outstanding throughout the year) | |||||||||||||||
| Net asset value, beginning of year | $ | 53.93 | $ | 51.21 | $ | 51.12 | $ | 52.42 | $ | 43.55 | |||||
| Income from investment operationsa: | |||||||||||||||
| Net investment income (loss)b | (0.21 | ) | (0.16 | ) | 0.04 | c | (0.05 | ) | (0.11 | ) | |||||
| Net realized and unrealized gains (losses) | 6.87 | 11.51 | 1.69 | 0.67 | 8.98 | ||||||||||
| Total from investment operations | 6.66 | 11.35 | 1.73 | 0.62 | 8.87 | ||||||||||
| Less distributions from: | |||||||||||||||
| Net investment income | — | — | (0.01 | ) | — | — | |||||||||
| Net realized gains | (9.03 | ) | (8.63 | ) | (1.63 | ) | (1.92 | ) | — | ||||||
| Total distributions | (9.03 | ) | (8.63 | ) | (1.64 | ) | (1.92 | ) | — | ||||||
| Net asset value, end of year | $ | 51.56 | $ | 53.93 | $ | 51.21 | $ | 51.12 | $ | 52.42 | |||||
| Total returnd | 13.59 | % | 22.31 | % | 3.70 | % | 1.86 | % | 20.37 | % | |||||
| Ratios to average net assets | |||||||||||||||
| Expenses | 0.94 | %e | 0.97 | %e | 0.99 | % | 0.98 | % | 0.98 | % | |||||
| Net investment income (loss) | (0.38 | )% | (0.27 | )% | 0.09 | %c | (0.10 | )% | (0.23 | )% | |||||
| Supplemental data | |||||||||||||||
| Net assets, end of year (000’s) | $ | 2,245,756 | $ | 2,171,053 | $ | 2,080,349 | $ | 2,094,119 | $ | 2,233,642 | |||||
| Portfolio turnover rate | 74.72 | % | 41.08 | % | 63.09 | % | 49.59 | % | 51.32 | % | |||||
aThe amount shown for a share outstanding throughout the period may not correlate with the Statement of Operations for the period due to the timing of sales and
repurchases of the Fund shares in relation to income earned and/or fluctuating fair value of the investments of the Fund.
bBased on average daily shares outstanding.
cNet investment income per share includes approximately $0.07 per share received in the form of special dividends. Excluding these amounts, the ratio of net investment
income to average net assets would have been (0.06)%.
dTotal return does not reflect sales commissions or contingent deferred sales charges, if applicable.
eBenefit of waiver and payments by affiliates and expense reduction rounds to less than 0.01%.
54 | Annual Report | The accompanying notes are an integral part of these financial statements.
franklintempleton.com
| FRANKLIN STRATEGIC SERIES | |||||||||||||||
| FINANCIAL HIGHLIGHTS | |||||||||||||||
| Franklin Flex Cap Growth Fund (continued) | |||||||||||||||
| Year Ended April 30, | |||||||||||||||
| 2015 | 2014 | 2013 | 2012 | 2011 | |||||||||||
| Class C | |||||||||||||||
| Per share operating performance | |||||||||||||||
| (for a share outstanding throughout the year) | |||||||||||||||
| Net asset value, beginning of year | $ | 46.79 | $ | 45.70 | $ | 46.14 | $ | 47.88 | $ | 40.08 | |||||
| Income from investment operationsa: | |||||||||||||||
| Net investment income (loss)b | (0.53 | ) | (0.52 | ) | (0.29 | )c | (0.37 | ) | (0.41 | ) | |||||
| Net realized and unrealized gains (losses) | 5.87 | 10.24 | 1.48 | 0.55 | 8.21 | ||||||||||
| Total from investment operations | 5.34 | 9.72 | 1.19 | 0.18 | 7.80 | ||||||||||
| Less distributions from net realized gains | (9.03 | ) | (8.63 | ) | (1.63 | ) | (1.92 | ) | — | ||||||
| Net asset value, end of year | $ | 43.10 | $ | 46.79 | $ | 45.70 | $ | 46.14 | $ | 47.88 | |||||
| Total returnd | 12.76 | % | 21.38 | % | 2.92 | % | 1.10 | % | 19.46 | % | |||||
| Ratios to average net assets | |||||||||||||||
| Expenses | 1.69 | %e | 1.72 | %e | 1.74 | % | 1.73 | % | 1.73 | % | |||||
| Net investment income (loss) | (1.13 | )% | (1.02 | )% | (0.66 | )%c | (0.85 | )% | (0.98 | )% | |||||
| Supplemental data | |||||||||||||||
| Net assets, end of year (000’s) | $ | 363,532 | $ | 348,040 | $ | 298,253 | $ | 323,249 | $ | 352,282 | |||||
| Portfolio turnover rate | 74.72 | % | 41.08 | % | 63.09 | % | 49.59 | % | 51.32 | % | |||||
aThe amount shown for a share outstanding throughout the period may not correlate with the Statement of Operations for the period due to the timing of sales and
repurchases of the Fund shares in relation to income earned and/or fluctuating fair value of the investments of the Fund.
bBased on average daily shares outstanding.
cNet investment income per share includes approximately $0.07 per share received in the form of special dividends. Excluding these amounts, the ratio of net investment
income to average net assets would have been (0.81)%.
dTotal return does not reflect sales commissions or contingent deferred sales charges, if applicable.
eBenefit of waiver and payments by affiliates and expense reduction rounds to less than 0.01%.
franklintempleton.com The accompanying notes are an integral part of these financial statements. | Annual Report | 55
| FRANKLIN STRATEGIC SERIES | |||||||||||||||
| FINANCIAL HIGHLIGHTS | |||||||||||||||
| Franklin Flex Cap Growth Fund (continued) | |||||||||||||||
| Year Ended April 30, | |||||||||||||||
| 2015 | 2014 | 2013 | 2012 | 2011 | |||||||||||
| Class R | |||||||||||||||
| Per share operating performance | |||||||||||||||
| (for a share outstanding throughout the year) | |||||||||||||||
| Net asset value, beginning of year | $ | 51.99 | $ | 49.74 | $ | 49.82 | $ | 51.27 | $ | 42.70 | |||||
| Income from investment operationsa: | |||||||||||||||
| Net investment income (loss)b | (0.32 | ) | (0.28 | ) | (0.08 | )c | (0.16 | ) | (0.21 | ) | |||||
| Net realized and unrealized gains (losses) | 6.58 | 11.16 | 1.63 | 0.63 | 8.78 | ||||||||||
| Total from investment operations | 6.26 | 10.88 | 1.55 | 0.47 | 8.57 | ||||||||||
| Less distributions from net realized gains | (9.03 | ) | (8.63 | ) | (1.63 | ) | (1.92 | ) | — | ||||||
| Net asset value, end of year | $ | 49.22 | $ | 51.99 | $ | 49.74 | $ | 49.82 | $ | 51.27 | |||||
| Total return | 13.31 | % | 22.01 | % | 3.43 | % | 1.60 | % | 20.07 | % | |||||
| Ratios to average net assets | |||||||||||||||
| Expenses | 1.19 | %d | 1.22 | %d | 1.24 | % | 1.23 | % | 1.23 | % | |||||
| Net investment income (loss) | (0.63 | )% | (0.52 | )% | (0.16 | )%c | (0.35 | )% | (0.48 | )% | |||||
| Supplemental data | |||||||||||||||
| Net assets, end of year (000’s) | $ | 45,269 | $ | 56,274 | $ | 63,134 | $ | 76,340 | $ | 72,532 | |||||
| Portfolio turnover rate | 74.72 | % | 41.08 | % | 63.09 | % | 49.59 | % | 51.32 | % | |||||
aThe amount shown for a share outstanding throughout the period may not correlate with the Statement of Operations for the period due to the timing of sales and
repurchases of the Fund shares in relation to income earned and/or fluctuating fair value of the investments of the Fund.
bBased on average daily shares outstanding.
cNet investment income per share includes approximately $0.07 per share received in the form of special dividends. Excluding these amounts, the ratio of net investment
income to average net assets would have been (0.31)%.
dBenefit of waiver and payments by affiliates and expense reduction rounds to less than 0.01%.
56 | Annual Report | The accompanying notes are an integral part of these financial statements. franklintempleton.com
| FRANKLIN STRATEGIC SERIES |
| FINANCIAL HIGHLIGHTS |
| Franklin Flex Cap Growth Fund (continued) | ||||||
| Year Ended | ||||||
| April 30, | ||||||
| 2015 | 2014 | a | ||||
| Class R6 | ||||||
| Per share operating performance | ||||||
| (for a share outstanding throughout the year) | ||||||
| Net asset value, beginning of year | $ | 55.54 | $ | 51.70 | ||
| Income from investment operationsb: | ||||||
| Net investment incomec | 0.06 | 0.11 | ||||
| Net realized and unrealized gains (losses) | 7.10 | 12.36 | ||||
| Total from investment operations | 7.16 | 12.47 | ||||
| Less distributions from net realized gains | (9.03 | ) | (8.63 | ) | ||
| Net asset value, end of year | $ | 53.67 | $ | 55.54 | ||
| Total return | 14.12 | % | 24.32 | % | ||
| Ratios to average net assets | ||||||
| Expensesd | 0.48 | % | 0.48 | % | ||
| Net investment income | 0.08 | % | 0.22 | % | ||
| Supplemental data | ||||||
| Net assets, end of year (000’s) | $ | 295,822 | $ | 376,607 | ||
| Portfolio turnover rate | 74.72 | % | 41.08 | % | ||
aFor the year May 1, 2013 (effective date) to April 30, 2014.
bThe amount shown for a share outstanding throughout the period may not correlate with the Statement of Operations for the period due to the timing of sales and
repurchases of the Fund shares in relation to income earned and/or fluctuating fair value of the investments of the Fund.
cBased on average daily shares outstanding.
dBenefit of waiver and payments by affiliates and expense reduction rounds to less than 0.01%.
franklintempleton.com The accompanying notes are an integral part of these financial statements. | Annual Report | 57
| FRANKLIN STRATEGIC SERIES | |||||||||||||||
| FINANCIAL HIGHLIGHTS | |||||||||||||||
| Franklin Flex Cap Growth Fund (continued) | |||||||||||||||
| Year Ended April 30, | |||||||||||||||
| 2015 | 2014 | 2013 | 2012 | 2011 | |||||||||||
| Advisor Class | |||||||||||||||
| Per share operating performance | |||||||||||||||
| (for a share outstanding throughout the year) | |||||||||||||||
| Net asset value, beginning of year | $ | 55.40 | $ | 52.29 | $ | 52.12 | $ | 53.26 | $ | 44.14 | |||||
| Income from investment operationsa: | |||||||||||||||
| Net investment income (loss)b | (0.08 | ) | 0.03 | 0.18 | c | 0.07 | 0.01 | ||||||||
| Net realized and unrealized gains (losses) | 7.09 | 11.71 | 1.71 | 0.71 | 9.11 | ||||||||||
| Total from investment operations | 7.01 | 11.74 | 1.89 | 0.78 | 9.12 | ||||||||||
| Less distributions from: | |||||||||||||||
| Net investment income | — | — | (0.09 | ) | — | — | |||||||||
| Net realized gains | (9.03 | ) | (8.63 | ) | (1.63 | ) | (1.92 | ) | — | ||||||
| Total distributions | (9.03 | ) | (8.63 | ) | (1.72 | ) | (1.92 | ) | — | ||||||
| Net asset value, end of year | $ | 53.38 | $ | 55.40 | $ | 52.29 | $ | 52.12 | $ | 53.26 | |||||
| Total return | 13.88 | % | 22.63 | % | 3.94 | % | 2.13 | % | 20.66 | % | |||||
| Ratios to average net assets | |||||||||||||||
| Expenses | 0.69 | %d | 0.72 | %d | 0.74 | % | 0.73 | % | 0.73 | % | |||||
| Net investment income (loss) | (0.13 | )% | (0.02 | )%e | 0.34 | %c | 0.15 | % | 0.02 | % | |||||
| Supplemental data | |||||||||||||||
| Net assets, end of year (000’s) | $ | 393,961 | $ | 329,671 | $ | 836,225 | $ | 1,162,624 | $ | 1,233,168 | |||||
| Portfolio turnover rate | 74.72 | % | 41.08 | % | 63.09 | % | 49.59 | % | 51.32 | % | |||||
aThe amount shown for a share outstanding throughout the period may not correlate with the Statement of Operations for the period due to the timing of sales and
repurchases of the Fund shares in relation to income earned and/or fluctuating fair value of the investments of the Fund.
bBased on average daily shares outstanding.
cNet investment income per share includes approximately $0.07 per share received in the form of special dividends. Excluding these amounts, the ratio of net investment
income to average net assets would have been 0.19%.
dBenefit of waiver and payments by affiliates and expense reduction rounds to less than 0.01%.
eRatio is calculated based on the Fund level net investment income, as reflected in the Statement of Operations, and adjusted for class specific expenses. The amount may
not correlate with the per share amount due to the timing of income earned and/or fluctuating fair value of the investments of the Fund in relation to the timing of sales and
repurchases of Fund shares.
58 | Annual Report | The accompanying notes are an integral part of these financial statements. franklintempleton.com
| FRANKLIN STRATEGIC SERIES | |||
| Statement of Investments, April 30, 2015 | |||
| Franklin Flex Cap Growth Fund | |||
| Shares | Value | ||
| Common Stocks 93.7% | |||
| Automobiles & Components 0.8% | |||
| BorgWarner Inc. | 243,800 | $ | 14,432,960 |
| a,bTesla Motors Inc. | 50,000 | 11,302,500 | |
| 25,735,460 | |||
| Banks 2.3% | |||
| aSignature Bank | 294,775 | 39,526,380 | |
| aSVB Financial Group | 275,000 | 36,509,000 | |
| 76,035,380 | |||
| Capital Goods 4.1% | |||
| aHD Supply Holdings Inc. | 1,825,000 | 60,225,000 | |
| Honeywell International Inc. | 210,000 | 21,193,200 | |
| Pall Corp. | 151,753 | 14,768,602 | |
| aProto Labs Inc. | 62,500 | 4,375,000 | |
| Roper Technologies Inc. | 210,000 | 35,315,700 | |
| 135,877,502 | |||
| Commercial & Professional Services 2.3% | |||
| aIHS Inc., A | 353,500 | 44,353,645 | |
| aStericycle Inc. | 250,000 | 33,357,500 | |
| 77,711,145 | |||
| Consumer Durables & Apparel 3.9% | |||
| NIKE Inc., B | 660,000 | 65,234,400 | |
| aTRI Pointe Homes Inc. | 2,000,000 | 28,560,000 | |
| aUnder Armour Inc., A | 450,000 | 34,897,500 | |
| 128,691,900 | |||
| Consumer Services 1.6% | |||
| aBuffalo Wild Wings Inc. | 175,000 | 27,877,500 | |
| aChipotle Mexican Grill Inc. | 40,000 | 24,853,600 | |
| 52,731,100 | |||
| Diversified Financials 2.7% | |||
| aAffiliated Managers Group Inc. | 300,000 | 67,839,000 | |
| Intercontinental Exchange Inc. | 105,000 | 23,575,650 | |
| 91,414,650 | |||
| Energy 1.0% | |||
| aDiamondback Energy Inc. | 275,000 | 22,706,750 | |
| aFMC Technologies Inc. | 225,000 | 9,922,500 | |
| 32,629,250 | |||
| Food & Staples Retailing 0.8% | |||
| Whole Foods Market Inc. | 525,000 | 25,074,000 | |
| Food, Beverage & Tobacco 2.9% | |||
| aBoston Beer Inc., A | 26,100 | 6,467,580 | |
| aConstellation Brands Inc., A | 360,000 | 41,738,400 | |
| Mead Johnson Nutrition Co., A | 155,000 | 14,867,600 | |
| aMonster Beverage Corp. | 255,000 | 34,963,050 | |
| 98,036,630 | |||
franklintempleton.com Annual Report | 59
| FRANKLIN STRATEGIC SERIES | |||
| STATEMENT OF INVESTMENTS | |||
| Franklin Flex Cap Growth Fund (continued) | |||
| Shares | Value | ||
| Common Stocks (continued) | |||
| Health Care Equipment & Services 8.1% | |||
| aCerner Corp. | 550,000 | $ | 39,495,500 |
| aDexCom Inc. | 450,000 | 30,406,500 | |
| aEdwards Lifesciences Corp. | 210,000 | 26,596,500 | |
| aEnvision Healthcare Holdings Inc. | 1,575,000 | 59,787,000 | |
| aIDEXX Laboratories Inc. | 150,000 | 18,805,500 | |
| McKesson Corp. | 300,000 | 67,020,000 | |
| Medtronic PLC | 400,000 | 29,780,000 | |
| 271,891,000 | |||
| Materials 2.7% | |||
| Cytec Industries Inc. | 725,000 | 40,085,250 | |
| Ecolab Inc. | 460,000 | 51,510,800 | |
| 91,596,050 | |||
| Media 3.7% | |||
| aCharter Communications Inc., A | 180,000 | 33,670,800 | |
| aIMAX Corp. (Canada) | 300,000 | 11,208,000 | |
| Twenty-First Century Fox Inc., B | 600,000 | 20,010,000 | |
| The Walt Disney Co. | 550,000 | 59,796,000 | |
| 124,684,800 | |||
| Pharmaceuticals, Biotechnology & Life Sciences 18.1% | |||
| aActavis PLC | 460,000 | 130,115,600 | |
| bAduro Biotech Inc. | 86,175 | 2,188,845 | |
| aBiogen Inc. | 275,000 | 102,830,750 | |
| aBioMarin Pharmaceutical Inc. | 125,000 | 14,006,250 | |
| Bristol-Myers Squibb Co. | 600,000 | 38,238,000 | |
| aCelgene Corp. | 665,000 | 71,859,900 | |
| aCelldex Therapeutics Inc. | 550,000 | 13,200,000 | |
| a,cFibroGen Inc. | 890,868 | 19,677,056 | |
| aIllumina Inc. | 184,000 | 33,902,000 | |
| aJazz Pharmaceuticals PLC | 125,000 | 22,337,500 | |
| aKaryopharm Therapeutics Inc. | 240,000 | 6,518,400 | |
| aPrestige Brands Holdings Inc. | 633,400 | 24,860,950 | |
| aPuma Biotechnology Inc. | 50,000 | 9,029,000 | |
| aQuintiles Transnational Holdings Inc. | 475,000 | 31,293,000 | |
| aRegeneron Pharmaceuticals Inc. | 42,000 | 19,213,320 | |
| aRevance Therapeutics Inc. | 338,700 | 6,663,922 | |
| aValeant Pharmaceuticals International Inc. | 265,000 | 57,486,450 | |
| 603,420,943 | |||
| Retailing 6.0% | |||
| Advance Auto Parts Inc. | 360,000 | 51,480,000 | |
| aAmazon.com Inc. | 160,000 | 67,484,800 | |
| aNetflix Inc. | 20,000 | 11,130,000 | |
| aThe Priceline Group Inc. | 40,000 | 49,512,400 | |
| Tractor Supply Co. | 260,000 | 22,375,600 | |
| 201,982,800 | |||
| Semiconductors & Semiconductor Equipment 4.2% | |||
| aCavium Inc. | 625,000 | 40,493,750 | |
| aNanometrics Inc. | 500,000 | 7,730,000 | |
60 | Annual Report franklintempleton.com
FRANKLIN STRATEGIC SERIES
STATEMENT OF INVESTMENTS
| Franklin Flex Cap Growth Fund (continued) | |||
| Shares | Value | ||
| Common Stocks (continued) | |||
| Semiconductors & Semiconductor Equipment (continued) | |||
| aNXP Semiconductors NV (Netherlands) | 700,000 | $ | 67,284,000 |
| Skyworks Solutions Inc. | 275,000 | 25,368,750 | |
| 140,876,500 | |||
| Software & Services 17.1% | |||
| aBroadSoft Inc. | 237,000 | 7,498,680 | |
| aCoStar Group Inc. | 165,000 | 33,730,950 | |
| aDemandware Inc. | 175,000 | 10,780,000 | |
| aElectronic Arts Inc. | 800,000 | 46,472,000 | |
| aFacebook Inc., A | 750,000 | 59,077,500 | |
| aFleetCor Technologies Inc. | 335,000 | 53,898,150 | |
| aLinkedIn Corp., A | 270,000 | 68,075,100 | |
| MasterCard Inc., A | 1,110,000 | 100,133,100 | |
| aMobileye NV | 300,000 | 13,458,000 | |
| aSalesforce.com Inc. | 620,000 | 45,148,400 | |
| aServiceNow Inc. | 525,000 | 39,301,500 | |
| aSplunk Inc. | 170,000 | 11,278,650 | |
| aTwitter Inc. | 600,000 | 23,376,000 | |
| Visa Inc., A | 900,000 | 59,445,000 | |
| 571,673,030 | |||
| Technology Hardware & Equipment 8.6% | |||
| Apple Inc. | 1,770,000 | 221,515,500 | |
| Harris Corp. | 150,000 | 12,036,000 | |
| aPalo Alto Networks Inc. | 375,000 | 55,395,000 | |
| 288,946,500 | |||
| Transportation 2.8% | |||
| aGenesee & Wyoming Inc. | 440,000 | 40,898,000 | |
| Kansas City Southern | 80,200 | 8,219,698 | |
| aSpirit Airlines Inc. | 650,000 | 44,505,500 | |
| 93,623,198 | |||
| Total Common Stocks (Cost $2,037,358,388) | 3,132,631,838 | ||
| Short Term Investments 2.7% | |||
| Money Market Funds (Cost $80,463,597) 2.4% | |||
| a,dInstitutional Fiduciary Trust Money Market Portfolio | 80,463,597 | 80,463,597 | |
| eInvestments from Cash Collateral Received for Loaned Securities 0.3% | |||
| Money Market Funds (Cost $11,905,000) 0.3% | |||
| a,dInstitutional Fiduciary Trust Money Market Portfolio | 11,905,000 | 11,905,000 | |
| Total Investments (Cost $2,129,726,985) 96.4% | 3,225,000,435 | ||
| Other Assets, less Liabilities 3.6% | 119,339,621 | ||
| Net Assets 100.0% | $ | 3,344,340,056 |
aNon-income producing.
bA portion or all of the security is on loan at April 30, 2015. See Note 1(c).
cSee Note 7 regarding restricted securities.
dSee Note 3(f) regarding investments in Institutional Fiduciary Trust Money Market Portfolio.
eSee Note 1(c) regarding securities on loan.
franklintempleton.com The accompanying notes are an integral part of these financial statements. | Annual Report | 61
| FRANKLIN STRATEGIC SERIES | |||||||||||||||
| Financial Highlights | |||||||||||||||
| Franklin Focused Core Equity Fund | |||||||||||||||
| Year Ended April 30, | |||||||||||||||
| 2015 | 2014 | 2013 | 2012 | 2011 | |||||||||||
| Class A | |||||||||||||||
| Per share operating performance | |||||||||||||||
| (for a share outstanding throughout the year) | |||||||||||||||
| Net asset value, beginning of year | $ | 13.38 | $ | 10.63 | $ | 9.47 | $ | 10.35 | $ | 9.03 | |||||
| Income from investment operationsa: | |||||||||||||||
| Net investment income (loss)b | (0.01 | ) | 0.03 | 0.07 | 0.02 | 0.06 | |||||||||
| Net realized and unrealized gains (losses) | 2.23 | 2.92 | 1.16 | (0.31 | ) | 1.29 | |||||||||
| Total from investment operations | 2.22 | 2.95 | 1.23 | (0.29 | ) | 1.35 | |||||||||
| Less distributions from: | |||||||||||||||
| Net investment income | — | (0.07 | ) | — | (0.11 | ) | (0.03 | ) | |||||||
| Net realized gains | (0.31 | ) | (0.13 | ) | (0.07 | ) | (0.48 | ) | — | ||||||
| Total distributions | (0.31 | ) | (0.20 | ) | (0.07 | ) | (0.59 | ) | (0.03 | ) | |||||
| Net asset value, end of year | $ | 15.29 | $ | 13.38 | $ | 10.63 | $ | 9.47 | $ | 10.35 | |||||
| Total returnc | 16.84 | % | 28.00 | % | 13.08 | % | (2.17 | )% | 14.92 | % | |||||
| Ratios to average net assets | |||||||||||||||
| Expenses before waiver and payments by affiliates | 1.54 | % | 1.73 | % | 1.89 | % | 1.81 | % | 1.87 | % | |||||
| Expenses net of waiver and payments by affiliates | 1.28 | % | 1.22 | % | 1.19 | % | 1.21 | % | 1.10 | % | |||||
| Net investment income (loss) | (0.07 | )% | 0.23 | % | 0.76 | % | 0.25 | % | 0.61 | % | |||||
| Supplemental data | |||||||||||||||
| Net assets, end of year (000’s) | $ | 92,612 | $ | 40,372 | $ | 19,029 | $ | 26,253 | $ | 14,481 | |||||
| Portfolio turnover rate | 25.55 | % | 43.30 | % | 74.50 | % | 51.85 | % | 63.80 | % | |||||
aThe amount shown for a share outstanding throughout the period may not correlate with the Statement of Operations for the period due to the timing of sales and
repurchases of the Fund shares in relation to income earned and/or fluctuating fair value of the investments of the Fund.
bBased on average daily shares outstanding.
cTotal return does not reflect sales commissions or contingent deferred sales charges, if applicable.
62 | Annual Report | The accompanying notes are an integral part of these financial statements. franklintempleton.com
| FRANKLIN STRATEGIC SERIES | |||||||||||||||
| FINANCIAL HIGHLIGHTS | |||||||||||||||
| Franklin Focused Core Equity Fund (continued) | |||||||||||||||
| Year Ended April 30, | |||||||||||||||
| 2015 | 2014 | 2013 | 2012 | 2011 | |||||||||||
| Class C | |||||||||||||||
| Per share operating performance | |||||||||||||||
| (for a share outstanding throughout the year) | |||||||||||||||
| Net asset value, beginning of year | $ | 12.98 | $ | 10.36 | $ | 9.29 | $ | 10.14 | $ | 8.90 | |||||
| Income from investment operationsa: | |||||||||||||||
| Net investment income (loss)b | (0.11 | ) | (0.06 | ) | 0.01 | (0.04 | ) | (0.01 | ) | ||||||
| Net realized and unrealized gains (losses) | 2.17 | 2.84 | 1.13 | (0.29 | ) | 1.25 | |||||||||
| Total from investment operations | 2.06 | 2.78 | 1.14 | (0.33 | ) | 1.24 | |||||||||
| Less distributions from: | |||||||||||||||
| Net investment income | — | (0.03 | ) | — | (0.04 | ) | — | ||||||||
| Net realized gains | (0.31 | ) | (0.13 | ) | (0.07 | ) | (0.48 | ) | — | ||||||
| Total distributions | (0.31 | ) | (0.16 | ) | (0.07 | ) | (0.52 | ) | — | ||||||
| Net asset value, end of year | $ | 14.73 | $ | 12.98 | $ | 10.36 | $ | 9.29 | $ | 10.14 | |||||
| Total returnc | 16.12 | % | 26.99 | % | 12.36 | % | (2.66 | )% | 13.93 | % | |||||
| Ratios to average net assets | |||||||||||||||
| Expenses before waiver and payments by affiliates | 2.24 | % | 2.43 | % | 2.59 | % | 2.50 | % | 2.66 | % | |||||
| Expenses net of waiver and payments by affiliates | 1.98 | % | 1.92 | % | 1.89 | % | 1.90 | % | 1.89 | % | |||||
| Net investment income (loss) | (0.77 | )% | (0.47 | )% | 0.06 | % | (0.44 | )% | (0.18 | )% | |||||
| Supplemental data | |||||||||||||||
| Net assets, end of year (000’s) | $ | 18,758 | $ | 6,666 | $ | 2,502 | $ | 3,265 | $ | 2,095 | |||||
| Portfolio turnover rate | 25.55 | % | 43.30 | % | 74.50 | % | 51.85 | % | 63.80 | % | |||||
aThe amount shown for a share outstanding throughout the period may not correlate with the Statement of Operations for the period due to the timing of sales and
repurchases of the Fund shares in relation to income earned and/or fluctuating fair value of the investments of the Fund.
bBased on average daily shares outstanding.
cTotal return does not reflect sales commissions or contingent deferred sales charges, if applicable.
franklintempleton.com The accompanying notes are an integral part of these financial statements. | Annual Report | 63
| FRANKLIN STRATEGIC SERIES | |||||||||||||||
| FINANCIAL HIGHLIGHTS | |||||||||||||||
| Franklin Focused Core Equity Fund (continued) | |||||||||||||||
| Year Ended April 30, | |||||||||||||||
| 2015 | 2014 | 2013 | 2012 | 2011 | |||||||||||
| Class R | |||||||||||||||
| Per share operating performance | |||||||||||||||
| (for a share outstanding throughout the year) | |||||||||||||||
| Net asset value, beginning of year | $ | 13.28 | $ | 10.56 | $ | 9.43 | $ | 10.30 | $ | 9.00 | |||||
| Income from investment operationsa: | |||||||||||||||
| Net investment income (loss)b | (0.04 | ) | 0.01 | 0.05 | 0.02 | 0.03 | |||||||||
| Net realized and unrealized gains (losses) | 2.22 | 2.90 | 1.15 | (0.32 | ) | 1.28 | |||||||||
| Total from investment operations | 2.18 | 2.91 | 1.20 | (0.30 | ) | 1.31 | |||||||||
| Less distributions from: | |||||||||||||||
| Net investment income | — | (0.06 | ) | — | (0.09 | ) | (0.01 | ) | |||||||
| Net realized gains | (0.31 | ) | (0.13 | ) | (0.07 | ) | (0.48 | ) | — | ||||||
| Total distributions | (0.31 | ) | (0.19 | ) | (0.07 | ) | (0.57 | ) | (0.01 | ) | |||||
| Net asset value, end of year | $ | 15.15 | $ | 13.28 | $ | 10.56 | $ | 9.43 | $ | 10.30 | |||||
| Total return | 16.66 | % | 27.70 | % | 12.81 | % | (2.22 | )% | 14.51 | % | |||||
| Ratios to average net assets | |||||||||||||||
| Expenses before waiver and payments by affiliates | 1.74 | % | 1.93 | % | 2.09 | % | 1.99 | % | 2.16 | % | |||||
| Expenses net of waiver and payments by affiliates | 1.48 | % | 1.42 | % | 1.39 | % | 1.39 | % | 1.39 | % | |||||
| Net investment income (loss) | (0.27 | )% | 0.03 | % | 0.56 | % | 0.07 | % | 0.32 | % | |||||
| Supplemental data | |||||||||||||||
| Net assets, end of year (000’s) | $ | 169 | $ | 124 | $ | 76 | $ | 41 | $ | 27 | |||||
| Portfolio turnover rate | 25.55 | % | 43.30 | % | 74.50 | % | 51.85 | % | 63.80 | % | |||||
aThe amount shown for a share outstanding throughout the period may not correlate with the Statement of Operations for the period due to the timing of sales and
repurchases of the Fund shares in relation to income earned and/or fluctuating fair value of the investments of the Fund.
bBased on average daily shares outstanding.
64 | Annual Report | The accompanying notes are an integral part of these financial statements. franklintempleton.com
| FRANKLIN STRATEGIC SERIES |
| FINANCIAL HIGHLIGHTS |
| Franklin Focused Core Equity Fund (continued) | ||||||
| Year Ended | ||||||
| April 30, | ||||||
| 2015 | 2014 | a | ||||
| Class R6 | ||||||
| Per share operating performance | ||||||
| (for a share outstanding throughout the year) | ||||||
| Net asset value, beginning of year | $ | 13.49 | $ | 10.54 | ||
| Income from investment operationsb: | ||||||
| Net investment incomec | 0.05 | 0.07 | ||||
| Net realized and unrealized gains (losses) | 2.27 | 3.11 | ||||
| Total from investment operations | 2.32 | 3.18 | ||||
| Less distributions from: | ||||||
| Net investment income | (0.04 | ) | (0.10 | ) | ||
| Net realized gains | (0.31 | ) | (0.13 | ) | ||
| Total distributions | (0.35 | ) | (0.23 | ) | ||
| Net asset value, end of year | $ | 15.46 | $ | 13.49 | ||
| Total return | 17.45 | % | 30.43 | % | ||
| Ratios to average net assets | ||||||
| Expenses before waiver and payments by affiliates | 1.09 | % | 2.28 | % | ||
| Expenses net of waiver and payments by affiliates | 0.83 | % | 0.77 | % | ||
| Net investment income | 0.38 | % | 0.68 | % | ||
| Supplemental data | ||||||
| Net assets, end of year (000’s) | $ | 25,739 | $ | 14 | ||
| Portfolio turnover rate | 25.55 | % | 43.30 | % | ||
aFor the year May 1, 2013 (effective date) to April 30, 2014.
bThe amount shown for a share outstanding throughout the period may not correlate with the Statement of Operations for the period due to the timing of sales and
repurchases of the Fund shares in relation to income earned and/or fluctuating fair value of the investments of the Fund.
cBased on average daily shares outstanding.
franklintempleton.com The accompanying notes are an integral part of these financial statements. | Annual Report | 65
| FRANKLIN STRATEGIC SERIES | |||||||||||||||
| FINANCIAL HIGHLIGHTS | |||||||||||||||
| Franklin Focused Core Equity Fund (continued) | |||||||||||||||
| Year Ended April 30, | |||||||||||||||
| 2015 | 2014 | 2013 | 2012 | 2011 | |||||||||||
| Advisor Class | |||||||||||||||
| Per share operating performance | |||||||||||||||
| (for a share outstanding throughout the year) | |||||||||||||||
| Net asset value, beginning of year | $ | 13.48 | $ | 10.70 | $ | 9.50 | $ | 10.37 | $ | 9.06 | |||||
| Income from investment operationsa: | |||||||||||||||
| Net investment incomeb | 0.04 | 0.07 | 0.10 | 0.06 | 0.08 | ||||||||||
| Net realized and unrealized gains (losses) | 2.25 | 2.93 | 1.17 | (0.32 | ) | 1.28 | |||||||||
| Total from investment operations | 2.29 | 3.00 | 1.27 | (0.26 | ) | 1.36 | |||||||||
| Less distributions from: | |||||||||||||||
| Net investment income | (0.02 | ) | (0.09 | ) | — | (0.13 | ) | (0.05 | ) | ||||||
| Net realized gains | (0.31 | ) | (0.13 | ) | (0.07 | ) | (0.48 | ) | — | ||||||
| Total distributions | (0.33 | ) | (0.22 | ) | (0.07 | ) | (0.61 | ) | (0.05 | ) | |||||
| Net asset value, end of year | $ | 15.44 | $ | 13.48 | $ | 10.70 | $ | 9.50 | $ | 10.37 | |||||
| Total return | 17.25 | % | 28.27 | % | 13.46 | % | (1.80 | )% | 15.08 | % | |||||
| Ratios to average net assets | |||||||||||||||
| Expenses before waiver and payments by affiliates | 1.24 | % | 1.43 | % | 1.59 | % | 1.49 | % | 1.66 | % | |||||
| Expenses net of waiver and payments by affiliates | 0.98 | % | 0.92 | % | 0.89 | % | 0.89 | % | 0.89 | % | |||||
| Net investment income | 0.23 | % | 0.53 | % | 1.06 | % | 0.57 | % | 0.82 | % | |||||
| Supplemental data | |||||||||||||||
| Net assets, end of year (000’s) | $ | 9,914 | $ | 6,990 | $ | 4,347 | $ | 3,188 | $ | 1,966 | |||||
| Portfolio turnover rate | 25.55 | % | 43.30 | % | 74.50 | % | 51.85 | % | 63.80 | % | |||||
aThe amount shown for a share outstanding throughout the period may not correlate with the Statement of Operations for the period due to the timing of sales and
repurchases of the Fund shares in relation to income earned and/or fluctuating fair value of the investments of the Fund.
bBased on average daily shares outstanding.
66 | Annual Report | The accompanying notes are an integral part of these financial statements. franklintempleton.com
FRANKLIN STRATEGIC SERIES
| Statement of Investments, April 30, 2015 | ||||
| Franklin Focused Core Equity Fund | ||||
| Country | Shares | Value | ||
| Common Stocks 94.9% | ||||
| Consumer Discretionary 12.3% | ||||
| aAltice SA | Luxembourg | 31,560 | $ | 3,342,175 |
| BorgWarner Inc. | United States | 48,730 | 2,884,816 | |
| NIKE Inc., B | United States | 34,718 | 3,431,527 | |
| Twenty-First Century Fox Inc., B | United States | 135,720 | 4,526,262 | |
| The Walt Disney Co. | United States | 35,610 | 3,871,519 | |
| 18,056,299 | ||||
| Consumer Staples 2.3% | ||||
| CVS Health Corp. | United States | 34,040 | 3,379,832 | |
| Energy 6.6% | ||||
| Anadarko Petroleum Corp. | United States | 34,310 | 3,228,571 | |
| Pioneer Natural Resources Co. | United States | 16,660 | 2,878,515 | |
| Schlumberger Ltd. | United States | 37,780 | 3,574,366 | |
| 9,681,452 | ||||
| Financials 23.6% | ||||
| BlackRock Inc. | United States | 9,237 | 3,361,714 | |
| aCBRE Group Inc. | United States | 95,780 | 3,672,205 | |
| The Charles Schwab Corp. | United States | 148,880 | 4,540,840 | |
| Citigroup Inc. | United States | 62,060 | 3,309,039 | |
| Discover Financial Services | United States | 53,680 | 3,111,830 | |
| The Hartford Financial Services Group Inc. | United States | 154,590 | 6,302,634 | |
| JPMorgan Chase & Co. | United States | 53,043 | 3,355,500 | |
| LPL Financial Holdings Inc. | United States | 92,820 | 3,756,425 | |
| MetLife Inc. | United States | 65,350 | 3,351,802 | |
| 34,761,989 | ||||
| Health Care 14.9% | ||||
| aActavis PLC | United States | 27,164 | 7,683,609 | |
| Sanofi, ADR | France | 83,771 | 4,234,624 | |
| aValeant Pharmaceuticals International Inc. | United States | 46,300 | 10,043,859 | |
| 21,962,092 | ||||
| Industrials 7.7% | ||||
| The ADT Corp. | United States | 92,470 | 3,476,872 | |
| FedEx Corp. | United States | 12,340 | 2,092,494 | |
| aGenesee & Wyoming Inc. | United States | 42,400 | 3,941,080 | |
| Precision Castparts Corp. | United States | 8,560 | 1,769,266 | |
| 11,279,712 | ||||
| Information Technology 21.5% | ||||
| aAdobe Systems Inc. | United States | 60,080 | 4,569,685 | |
| Equinix Inc. | United States | 18,900 | 4,837,077 | |
| aGoogle Inc., A | United States | 3,660 | 2,008,498 | |
| aGoogle Inc., C | United States | 3,730 | 2,004,278 | |
| MasterCard Inc., A | United States | 47,360 | 4,272,346 | |
| Microsoft Corp. | United States | 93,930 | 4,568,755 | |
| Motorola Solutions Inc. | United States | 60,190 | 3,596,352 | |
| QUALCOMM Inc. | United States | 84,820 | 5,767,760 | |
| 31,624,751 | ||||
franklintempleton.com
Annual Report
| 67
FRANKLIN STRATEGIC SERIES
STATEMENT OF INVESTMENTS
| Franklin Focused Core Equity Fund (continued) | |||||
| Country | Shares | Value | |||
| Common Stocks (continued) | |||||
| Materials 6.0% | |||||
| Agrium Inc. | Canada | 30,110 | $ | 3,120,299 | |
| Axiall Corp. | United States | 69,028 | 2,816,343 | ||
| LyondellBasell Industries NV, A | United States | 28,310 | 2,930,651 | ||
| 8,867,293 | |||||
| Total Common Stocks (Cost $116,988,379) | 139,613,420 | ||||
| Short Term Investments (Cost $8,816,207) 5.9% | |||||
| Money Market Funds 5.9% | |||||
| a,bInstitutional Fiduciary Trust Money Market Portfolio | United States | 8,816,207 | 8,816,207 | ||
| Total Investments (Cost $125,804,586) 100.8% | 148,429,627 | ||||
| Other Assets, less Liabilities (0.8)% | (1,237,304 | ) | |||
| Net Assets 100.0% | $ | 147,192,323 |
See Abbreviations on page 117.
aNon-income producing.
bSee Note 3(f) regarding investments in Institutional Fiduciary Trust Money Market Portfolio.
68 | Annual Report | The accompanying notes are an integral part of these financial statements. franklintempleton.com
| FRANKLIN STRATEGIC SERIES | |||||||||||||||
| Financial Highlights | |||||||||||||||
| Franklin Growth Opportunities Fund | |||||||||||||||
| Year Ended April 30, | |||||||||||||||
| 2015 | 2014 | 2013 | 2012 | 2011 | |||||||||||
| Class A | |||||||||||||||
| Per share operating performance | |||||||||||||||
| (for a share outstanding throughout the year) | |||||||||||||||
| Net asset value, beginning of year | $ | 28.48 | $ | 24.29 | $ | 23.02 | $ | 24.28 | $ | 19.59 | |||||
| Income from investment operationsa: | |||||||||||||||
| Net investment income (loss)b | (0.19 | ) | (0.19 | ) | (0.12 | ) | (0.16 | ) | (0.15 | ) | |||||
| Net realized and unrealized gains (losses) | 5.50 | 5.11 | 1.95 | 0.40 | 4.84 | ||||||||||
| Total from investment operations | 5.31 | 4.92 | 1.83 | 0.24 | 4.69 | ||||||||||
| Less distributions from net realized gains | (0.66 | ) | (0.73 | ) | (0.56 | ) | (1.50 | ) | — | ||||||
| Net asset value, end of year | $ | 33.13 | $ | 28.48 | $ | 24.29 | $ | 23.02 | $ | 24.28 | |||||
| Total returnc | 18.87 | % | 20.26 | % | 8.29 | % | 1.90 | % | 23.94 | % | |||||
| Ratios to average net assets | |||||||||||||||
| Expenses | 1.18 | %d | 1.17 | %d,e | 1.25 | % | 1.28 | % | 1.28 | % | |||||
| Net investment income (loss) | (0.59 | )% | (0.70 | )% | (0.56 | )% | (0.71 | )% | (0.73 | )% | |||||
| Supplemental data | |||||||||||||||
| Net assets, end of year (000’s) | $ | 457,619 | $ | 349,343 | $ | 213,639 | $ | 209,382 | $ | 211,435 | |||||
| Portfolio turnover rate | 40.64 | % | 36.64 | % | 58.76 | % | 63.57 | % | 69.74 | % | |||||
aThe amount shown for a share outstanding throughout the period may not correlate with the Statement of Operations for the period due to the timing of sales and
repurchases of the Fund shares in relation to income earned and/or fluctuating fair value of the investments of the Fund.
bBased on average daily shares outstanding.
cTotal return does not reflect sales commissions or contingent deferred sales charges, if applicable.
dBenefit of waiver and payments by affiliates rounds to less than 0.01%.
eBenefit of expense reduction rounds to less than 0.01%.
franklintempleton.com The accompanying notes are an integral part of these financial statements. | Annual Report | 69
| FRANKLIN STRATEGIC SERIES | |||||||||||||||
| FINANCIAL HIGHLIGHTS | |||||||||||||||
| Franklin Growth Opportunities Fund (continued) | |||||||||||||||
| Year Ended April 30, | |||||||||||||||
| 2015 | 2014 | 2013 | 2012 | 2011 | |||||||||||
| Class C | |||||||||||||||
| Per share operating performance | |||||||||||||||
| (for a share outstanding throughout the year) | |||||||||||||||
| Net asset value, beginning of year | $ | 25.41 | $ | 21.89 | $ | 20.95 | $ | 22.40 | $ | 18.20 | |||||
| Income from investment operationsa: | |||||||||||||||
| Net investment income (loss)b | (0.36 | ) | (0.35 | ) | (0.26 | ) | (0.29 | ) | (0.27 | ) | |||||
| Net realized and unrealized gains (losses) | 4.88 | 4.60 | 1.76 | 0.34 | 4.47 | ||||||||||
| Total from investment operations | 4.52 | 4.25 | 1.50 | 0.05 | 4.20 | ||||||||||
| Less distributions from net realized gains | (0.66 | ) | (0.73 | ) | (0.56 | ) | (1.50 | ) | — | ||||||
| Net asset value, end of year | $ | 29.27 | $ | 25.41 | $ | 21.89 | $ | 20.95 | $ | 22.40 | |||||
| Total returnc | 18.04 | % | 19.42 | % | 7.47 | % | 1.24 | % | 23.08 | % | |||||
| Ratios to average net assets | |||||||||||||||
| Expenses | 1.88 | %d | 1.87 | %d,e | 1.97 | % | 1.99 | % | 1.98 | % | |||||
| Net investment income (loss) | (1.29 | )% | (1.40 | )% | (1.28 | )% | (1.42 | )% | (1.43 | )% | |||||
| Supplemental data | |||||||||||||||
| Net assets, end of year (000’s) | $ | 110,513 | $ | 85,883 | $ | 51,719 | $ | 50,453 | $ | 56,658 | |||||
| Portfolio turnover rate | 40.64 | % | 36.64 | % | 58.76 | % | 63.57 | % | 69.74 | % | |||||
aThe amount shown for a share outstanding throughout the period may not correlate with the Statement of Operations for the period due to the timing of sales and
repurchases of the Fund shares in relation to income earned and/or fluctuating fair value of the investments of the Fund.
bBased on average daily shares outstanding.
cTotal return does not reflect sales commissions or contingent deferred sales charges, if applicable.
dBenefit of waiver and payments by affiliates rounds to less than 0.01%.
eBenefit of expense reduction rounds to less than 0.01%.
70 | Annual Report | The accompanying notes are an integral part of these financial statements. franklintempleton.com
| FRANKLIN STRATEGIC SERIES | |||||||||||||||
| FINANCIAL HIGHLIGHTS | |||||||||||||||
| Franklin Growth Opportunities Fund (continued) | |||||||||||||||
| Year Ended April 30, | |||||||||||||||
| 2015 | 2014 | 2013 | 2012 | 2011 | |||||||||||
| Class R | |||||||||||||||
| Per share operating performance | |||||||||||||||
| (for a share outstanding throughout the year) | |||||||||||||||
| Net asset value, beginning of year | $ | 27.67 | $ | 23.67 | $ | 22.49 | $ | 23.81 | $ | 19.25 | |||||
| Income from investment operationsa: | |||||||||||||||
| Net investment income (loss)b | (0.24 | ) | (0.24 | ) | (0.17 | ) | (0.20 | ) | (0.19 | ) | |||||
| Net realized and unrealized gains (losses) | 5.33 | 4.97 | 1.91 | 0.38 | 4.75 | ||||||||||
| Total from investment operations | 5.09 | 4.73 | 1.74 | 0.18 | 4.56 | ||||||||||
| Less distributions from net realized gains | (0.66 | ) | (0.73 | ) | (0.56 | ) | (1.50 | ) | — | ||||||
| Net asset value, end of year | $ | 32.10 | $ | 27.67 | $ | 23.67 | $ | 22.49 | $ | 23.81 | |||||
| Total return | 18.63 | % | 19.99 | % | 8.03 | % | 1.73 | % | 23.69 | % | |||||
| Ratios to average net assets | |||||||||||||||
| Expenses | 1.38 | %c | 1.37 | %c,d | 1.47 | % | 1.49 | % | 1.48 | % | |||||
| Net investment income (loss) | (0.79 | )% | (0.90 | )% | (0.78 | )% | (0.92 | )% | (0.93 | )% | |||||
| Supplemental data | |||||||||||||||
| Net assets, end of year (000’s) | $ | 48,266 | $ | 42,953 | $ | 34,399 | $ | 33,783 | $ | 29,053 | |||||
| Portfolio turnover rate | 40.64 | % | 36.64 | % | 58.76 | % | 63.57 | % | 69.74 | % | |||||
aThe amount shown for a share outstanding throughout the period may not correlate with the Statement of Operations for the period due to the timing of sales and
repurchases of the Fund shares in relation to income earned and/or fluctuating fair value of the investments of the Fund.
bBased on average daily shares outstanding.
cBenefit of waiver and payments by affiliates rounds to less than 0.01%.
dBenefit of expense reduction rounds to less than 0.01%.
franklintempleton.com The accompanying notes are an integral part of these financial statements. | Annual Report | 71
FRANKLIN STRATEGIC SERIES
FINANCIAL HIGHLIGHTS
| Franklin Growth Opportunities Fund (continued) | ||||||
| Year Ended | ||||||
| April 30, | ||||||
| 2015 | 2014 | a | ||||
| Class R6 | ||||||
| Per share operating performance | ||||||
| (for a share outstanding throughout the year) | ||||||
| Net asset value, beginning of year | $ | 29.98 | $ | 24.99 | ||
| Income from investment operationsb: | ||||||
| Net investment income (loss)c | (0.03 | ) | (0.07 | ) | ||
| Net realized and unrealized gains (losses) | 5.80 | 5.79 | ||||
| Total from investment operations | 5.77 | 5.72 | ||||
| Less distributions from net realized gains | (0.66 | ) | (0.73 | ) | ||
| Net asset value, end of year | $ | 35.09 | $ | 29.98 | ||
| Total return | 19.47 | % | 22.90 | % | ||
| Ratios to average net assets | ||||||
| Expensesd | 0.68 | % | 0.71 | %e | ||
| Net investment income (loss) | (0.09 | )% | (0.24 | )% | ||
| Supplemental data | ||||||
| Net assets, end of year (000’s) | $ | 246,911 | $ | 180,843 | ||
| Portfolio turnover rate | 40.64 | % | 36.64 | % | ||
aFor the year May 1, 2013 (effective date) to April 30, 2014.
bThe amount shown for a share outstanding throughout the period may not correlate with the Statement of Operations for the period due to the timing of sales and
repurchases of the Fund shares in relation to income earned and/or fluctuating fair value of the investments of the Fund.
cBased on average daily shares outstanding.
dBenefit of waiver and payments by affiliates rounds to less than 0.01%.
eBenefit of expense reduction rounds to less than 0.01%.
72 | Annual Report | The accompanying notes are an integral part of these financial statements. franklintempleton.com
| FRANKLIN STRATEGIC SERIES | |||||||||||||||
| FINANCIAL HIGHLIGHTS | |||||||||||||||
| Franklin Growth Opportunities Fund (continued) | |||||||||||||||
| Year Ended April 30, | |||||||||||||||
| 2015 | 2014 | 2013 | 2012 | 2011 | |||||||||||
| Advisor Class | |||||||||||||||
| Per share operating performance | |||||||||||||||
| (for a share outstanding throughout the year) | |||||||||||||||
| Net asset value, beginning of year | $ | 29.93 | $ | 25.43 | $ | 23.99 | $ | 25.16 | $ | 20.24 | |||||
| Income from investment operationsa: | |||||||||||||||
| Net investment income (loss)b | (0.10 | ) | (0.13 | ) | (0.06 | ) | (0.10 | ) | (0.09 | ) | |||||
| Net realized and unrealized gains (losses) | 5.79 | 5.36 | 2.06 | 0.43 | 5.01 | ||||||||||
| Total from investment operations | 5.69 | 5.23 | 2.00 | 0.33 | 4.92 | ||||||||||
| Less distributions from net realized gains | (0.66 | ) | (0.73 | ) | (0.56 | ) | (1.50 | ) | — | ||||||
| Net asset value, end of year | $ | 34.96 | $ | 29.93 | $ | 25.43 | $ | 23.99 | $ | 25.16 | |||||
| Total return | 19.23 | % | 20.58 | % | 8.62 | % | 2.20 | % | 24.31 | % | |||||
| Ratios to average net assets | |||||||||||||||
| Expenses | 0.88 | %c | 0.87 | %c,d | 0.97 | % | 0.99 | % | 0.98 | % | |||||
| Net investment income (loss) | (0.29 | )% | (0.40 | )% | (0.28 | )% | (0.42 | )% | (0.43 | )% | |||||
| Supplemental data | |||||||||||||||
| Net assets, end of year (000’s) | $ | 269,887 | $ | 224,469 | $ | 182,954 | $ | 154,708 | $ | 172,528 | |||||
| Portfolio turnover rate | 40.64 | % | 36.64 | % | 58.76 | % | 63.57 | % | 69.74 | % | |||||
aThe amount shown for a share outstanding throughout the period may not correlate with the Statement of Operations for the period due to the timing of sales and
repurchases of the Fund shares in relation to income earned and/or fluctuating fair value of the investments of the Fund.
bBased on average daily shares outstanding.
cBenefit of waiver and payments by affiliates rounds to less than 0.01%.
dBenefit of expense reduction rounds to less than 0.01%.
franklintempleton.com The accompanying notes are an integral part of these financial statements. | Annual Report | 73
| FRANKLIN STRATEGIC SERIES | ||||
| Statement of Investments, April 30, 2015 | ||||
| Franklin Growth Opportunities Fund | ||||
| Country | Shares | Value | ||
| Common Stocks 97.1% | ||||
| Consumer Discretionary 17.1% | ||||
| aAmazon.com Inc. | United States | 65,778 | $ | 27,743,845 |
| aBuffalo Wild Wings Inc. | United States | 45,700 | 7,280,010 | |
| aChipotle Mexican Grill Inc. | United States | 13,687 | 8,504,281 | |
| aDISH Network Corp., A | United States | 121,665 | 8,231,854 | |
| Hanesbrands Inc. | United States | 280,971 | 8,732,579 | |
| Harman International Industries Inc. | United States | 100,612 | 13,117,792 | |
| Las Vegas Sands Corp. | United States | 145,502 | 7,694,146 | |
| Lowe’s Cos. Inc. | United States | 160,638 | 11,061,533 | |
| NIKE Inc., B | United States | 144,084 | 14,241,262 | |
| aThe Priceline Group Inc. | United States | 15,755 | 19,501,696 | |
| Starbucks Corp. | United States | 472,870 | 23,444,895 | |
| aUnder Armour Inc., A | United States | 225,761 | 17,507,765 | |
| The Walt Disney Co. | United States | 241,868 | 26,295,889 | |
| 193,357,547 | ||||
| Consumer Staples 3.6% | ||||
| aBoston Beer Inc., A | United States | 19,783 | 4,902,227 | |
| aConstellation Brands Inc., A | United States | 103,888 | 12,044,775 | |
| Mead Johnson Nutrition Co., A | United States | 111,431 | 10,688,462 | |
| aMonster Beverage Corp. | United States | 99,544 | 13,648,478 | |
| 41,283,942 | ||||
| Energy 4.6% | ||||
| Anadarko Petroleum Corp. | United States | 294,184 | 27,682,714 | |
| aDiamondback Energy Inc. | United States | 218,724 | 18,060,041 | |
| Schlumberger Ltd. | United States | 64,869 | 6,137,256 | |
| 51,880,011 | ||||
| Financials 6.4% | ||||
| aAffiliated Managers Group Inc. | United States | 57,025 | 12,895,063 | |
| American Tower Corp. | United States | 102,027 | 9,644,613 | |
| BlackRock Inc. | United States | 28,312 | 10,303,869 | |
| aCBRE Group Inc. | United States | 368,470 | 14,127,140 | |
| The Charles Schwab Corp. | United States | 458,851 | 13,994,956 | |
| aSignature Bank | United States | 86,324 | 11,575,185 | |
| Virtu Financial Inc., A | United States | 22,700 | 485,553 | |
| 73,026,379 | ||||
| Health Care 25.4% | ||||
| aActavis PLC | United States | 161,263 | 45,614,852 | |
| aAlnylam Pharmaceuticals Inc. | United States | 43,715 | 4,453,247 | |
| aBiogen Inc. | United States | 59,925 | 22,407,755 | |
| aCelgene Corp. | United States | 358,010 | 38,686,561 | |
| aCelldex Therapeutics Inc. | United States | 265,002 | 6,360,048 | |
| aEnvision Healthcare Holdings Inc. | United States | 298,239 | 11,321,152 | |
| aGilead Sciences Inc. | United States | 224,872 | 22,601,885 | |
| aHMS Holdings Corp. | United States | 283,560 | 4,823,356 | |
| aIllumina Inc. | United States | 95,831 | 17,656,862 | |
| aImpax Laboratories Inc. | United States | 136,306 | 6,169,210 | |
| aIncyte Corp. | United States | 91,062 | 8,847,584 | |
| aJazz Pharmaceuticals PLC | United States | 78,529 | 14,033,132 | |
| aKaryopharm Therapeutics Inc. | United States | 183,481 | 4,983,344 | |
| aMedivation Inc. | United States | 127,261 | 15,365,493 | |
| 74 | Annual Report | franklintempleton.com | |||
FRANKLIN STRATEGIC SERIES
STATEMENT OF INVESTMENTS
| Franklin Growth Opportunities Fund (continued) | ||||
| Country | Shares | Value | ||
| Common Stocks (continued) | ||||
| Health Care (continued) | ||||
| Perrigo Co. PLC | United States | 94,376 | $ | 17,297,233 |
| aPuma Biotechnology Inc. | United States | 30,080 | 5,431,846 | |
| aSagent Pharmaceuticals Inc. | United States | 206,195 | 4,806,406 | |
| aValeant Pharmaceuticals International Inc. | United States | 134,425 | 29,160,815 | |
| aVWR Corp. | United States | 303,700 | 8,060,198 | |
| 288,080,979 | ||||
| Industrials 6.7% | ||||
| Allegiant Travel Co. | United States | 47,945 | 7,372,023 | |
| American Airlines Group Inc. | United States | 273,610 | 13,211,259 | |
| B/E Aerospace Inc. | United States | 120,085 | 7,179,882 | |
| aDigitalGlobe Inc. | United States | 216,700 | 6,971,239 | |
| Flowserve Corp. | United States | 224,023 | 13,112,066 | |
| Hexcel Corp. | United States | 122,870 | 6,161,931 | |
| aIHS Inc., A | United States | 92,352 | 11,587,405 | |
| Kansas City Southern | United States | 98,006 | 10,044,635 | |
| 75,640,440 | ||||
| Information Technology 26.4% | ||||
| aAdobe Systems Inc. | United States | 108,119 | 8,223,531 | |
| Apple Inc. | United States | 282,775 | 35,389,291 | |
| ARM Holdings PLC | United Kingdom | 307,305 | 5,257,965 | |
| Avago Technologies Ltd. | Singapore | 136,568 | 15,962,068 | |
| aBroadSoft Inc. | United States | 227,230 | 7,189,557 | |
| aElectronic Arts Inc. | United States | 148,965 | 8,653,377 | |
| aFacebook Inc., A | United States | 406,976 | 32,057,500 | |
| aFreescale Semiconductor Ltd. | United States | 218,508 | 8,541,478 | |
| aGoogle Inc., A | United States | 38,312 | 21,024,476 | |
| aGoogle Inc., C | United States | 31,531 | 16,942,868 | |
| aLinkedIn Corp., A | United States | 43,424 | 10,948,493 | |
| MasterCard Inc., A | United States | 424,507 | 38,294,776 | |
| aMobileye NV | United States | 106,302 | 4,768,708 | |
| aNetSuite Inc. | United States | 70,325 | 6,720,960 | |
| aNXP Semiconductors NV | Netherlands | 173,112 | 16,639,525 | |
| aPalo Alto Networks Inc. | United States | 79,850 | 11,795,442 | |
| aSalesforce.com Inc. | United States | 133,088 | 9,691,468 | |
| aServiceNow Inc. | United States | 118,198 | 8,848,302 | |
| aViaSat Inc. | United States | 111,504 | 6,703,621 | |
| Visa Inc., A | United States | 381,532 | 25,200,189 | |
| 298,853,595 | ||||
| Materials 3.8% | ||||
| aAxalta Coating Systems Ltd. | United States | 376,446 | 11,549,363 | |
| Ecolab Inc. | United States | 73,801 | 8,264,236 | |
| LyondellBasell Industries NV, A | United States | 123,252 | 12,759,047 | |
| Martin Marietta Materials Inc. | United States | 70,361 | 10,036,997 | |
| 42,609,643 | ||||
| Telecommunication Services 3.1% | ||||
| aSBA Communications Corp. | United States | 302,827 | 35,073,423 | |
| Total Common Stocks (Cost $739,778,154) | 1,099,805,959 |
franklintempleton.com
Annual Report
| 75
FRANKLIN STRATEGIC SERIES
STATEMENT OF INVESTMENTS
| Franklin Growth Opportunities Fund (continued) | ||||
| Country | Shares | Value | ||
| Short Term Investments (Cost $31,128,570) 2.7% | ||||
| Money Market Funds 2.7% | ||||
| a,bInstitutional Fiduciary Trust Money Market Portfolio | United States | 31,128,570 | $ | 31,128,570 |
| Total Investments (Cost $770,906,724) 99.8% | 1,130,934,529 | |||
| Other Assets, less Liabilities 0.2% | 2,261,355 | |||
| Net Assets 100.0% | $ | 1,133,195,884 |
aNon-income producing.
bSee Note 3(f) regarding investments in Institutional Fiduciary Trust Money Market Portfolio.
76 | Annual Report | The accompanying notes are an integral part of these financial statements. franklintempleton.com
| FRANKLIN STRATEGIC SERIES | |||||||||||||||
| Financial Highlights | |||||||||||||||
| Franklin Small Cap Growth Fund | |||||||||||||||
| Year Ended April 30, | |||||||||||||||
| 2015 | 2014 | 2013 | 2012 | 2011 | |||||||||||
| Class A | |||||||||||||||
| Per share operating performance | |||||||||||||||
| (for a share outstanding throughout the year) | |||||||||||||||
| Net asset value, beginning of year | $ | 18.20 | $ | 14.26 | $ | 12.84 | $ | 13.02 | $ | 10.02 | |||||
| Income from investment operationsa: | |||||||||||||||
| Net investment income (loss)b | (0.12 | ) | (0.15 | ) | (0.09 | ) | (0.07 | ) | (0.10 | ) | |||||
| Net realized and unrealized gains (losses) | 1.57 | 4.75 | 1.87 | (0.11 | ) | 3.10 | |||||||||
| Total from investment operations | 1.45 | 4.60 | 1.78 | (0.18 | ) | 3.00 | |||||||||
| Less distributions from net realized gains | (0.82 | ) | (0.66 | ) | (0.36 | ) | — | — | |||||||
| Net asset value, end of year | $ | 18.83 | $ | 18.20 | $ | 14.26 | $ | 12.84 | $ | 13.02 | |||||
| Total returnc | 8.34 | % | 32.40 | % | 14.35 | % | (1.38 | )% | 29.94 | % | |||||
| Ratios to average net assets | |||||||||||||||
| Expenses | 1.16 | %d | 1.20 | %d | 1.33 | % | 1.37 | % | 1.37 | % | |||||
| Net investment income (loss) | (0.66 | )% | (0.85 | )% | (0.68 | )% | (0.60 | )% | (0.94 | )% | |||||
| Supplemental data | |||||||||||||||
| Net assets, end of year (000’s) | $ | 1,164,218 | $ | 851,317 | $ | 327,882 | $ | 244,570 | $ | 270,271 | |||||
| Portfolio turnover rate | 30.15 | % | 40.35 | % | 41.02 | % | 50.08 | % | 63.07 | % | |||||
aThe amount shown for a share outstanding throughout the period may not correlate with the Statement of Operations for the period due to the timing of sales and
repurchases of the Fund shares in relation to income earned and/or fluctuating fair value of the investments of the Fund.
bBased on average daily shares outstanding.
cTotal return does not reflect sales commissions or contingent deferred sales charges, if applicable.
dBenefit of waiver and payments by affiliates and expense reduction rounds to less than 0.01%.
franklintempleton.com The accompanying notes are an integral part of these financial statements. | Annual Report | 77
| FRANKLIN STRATEGIC SERIES | |||||||||||||||
| FINANCIAL HIGHLIGHTS | |||||||||||||||
| Franklin Small Cap Growth Fund (continued) | |||||||||||||||
| Year Ended April 30, | |||||||||||||||
| 2015 | 2014 | 2013 | 2012 | 2011 | |||||||||||
| Class C | |||||||||||||||
| Per share operating performance | |||||||||||||||
| (for a share outstanding throughout the year) | |||||||||||||||
| Net asset value, beginning of year | $ | 16.03 | $ | 12.70 | $ | 11.57 | $ | 11.80 | $ | 9.15 | |||||
| Income from investment operationsa: | |||||||||||||||
| Net investment income (loss)b | (0.22 | ) | (0.24 | ) | (0.16 | ) | (0.14 | ) | (0.16 | ) | |||||
| Net realized and unrealized gains (losses) | 1.37 | 4.23 | 1.65 | (0.09 | ) | 2.81 | |||||||||
| Total from investment operations | 1.15 | 3.99 | 1.49 | (0.23 | ) | 2.65 | |||||||||
| Less distributions from net realized gains | (0.82 | ) | (0.66 | ) | (0.36 | ) | — | — | |||||||
| Net asset value, end of year | $ | 16.36 | $ | 16.03 | $ | 12.70 | $ | 11.57 | $ | 11.80 | |||||
| Total returnc | 7.58 | % | 31.57 | % | 13.41 | % | (1.95 | )% | 28.96 | % | |||||
| Ratios to average net assets | |||||||||||||||
| Expenses | 1.87 | %d | 1.90 | %d | 2.03 | % | 2.07 | % | 2.07 | % | |||||
| Net investment income (loss) | (1.37 | )% | (1.55 | )% | (1.38 | )% | (1.30 | )% | (1.64 | )% | |||||
| Supplemental data | |||||||||||||||
| Net assets, end of year (000’s) | $ | 225,105 | $ | 187,271 | $ | 77,644 | $ | 67,212 | $ | 72,394 | |||||
| Portfolio turnover rate | 30.15 | % | 40.35 | % | 41.02 | % | 50.08 | % | 63.07 | % | |||||
aThe amount shown for a share outstanding throughout the period may not correlate with the Statement of Operations for the period due to the timing of sales and
repurchases of the Fund shares in relation to income earned and/or fluctuating fair value of the investments of the Fund.
bBased on average daily shares outstanding.
cTotal return does not reflect sales commissions or contingent deferred sales charges, if applicable.
dBenefit of waiver and payments by affiliates and expense reduction rounds to less than 0.01%.
78 | Annual Report | The accompanying notes are an integral part of these financial statements. franklintempleton.com
| FRANKLIN STRATEGIC SERIES | |||||||||||||||
| FINANCIAL HIGHLIGHTS | |||||||||||||||
| Franklin Small Cap Growth Fund (continued) | |||||||||||||||
| Year Ended April 30, | |||||||||||||||
| 2015 | 2014 | 2013 | 2012 | 2011 | |||||||||||
| Class R | |||||||||||||||
| Per share operating performance | |||||||||||||||
| (for a share outstanding throughout the year) | |||||||||||||||
| Net asset value, beginning of year | $ | 17.57 | $ | 13.81 | $ | 12.48 | $ | 12.67 | $ | 9.77 | |||||
| Income from investment operationsa: | |||||||||||||||
| Net investment income (loss)b | (0.16 | ) | (0.18 | ) | (0.11 | ) | (0.09 | ) | (0.12 | ) | |||||
| Net realized and unrealized gains (losses) | 1.52 | 4.60 | 1.80 | (0.10 | ) | 3.02 | |||||||||
| Total from investment operations | 1.36 | 4.42 | 1.69 | (0.19 | ) | 2.90 | |||||||||
| Less distributions from net realized gains | (0.82 | ) | (0.66 | ) | (0.36 | ) | — | — | |||||||
| Net asset value, end of year | $ | 18.11 | $ | 17.57 | $ | 13.81 | $ | 12.48 | $ | 12.67 | |||||
| Total return | 8.12 | % | 32.15 | % | 14.04 | % | (1.50 | )% | 29.68 | % | |||||
| Ratios to average net assets | |||||||||||||||
| Expenses | 1.37 | %c | 1.40 | %c | 1.53 | % | 1.57 | % | 1.57 | % | |||||
| Net investment income (loss) | (0.87 | )% | (1.05 | )% | (0.88 | )% | (0.80 | )% | (1.14 | )% | |||||
| Supplemental data | |||||||||||||||
| Net assets, end of year (000’s) | $ | 92,455 | $ | 51,190 | $ | 15,783 | $ | 8,489 | $ | 8,993 | |||||
| Portfolio turnover rate | 30.15 | % | 40.35 | % | 41.02 | % | 50.08 | % | 63.07 | % | |||||
aThe amount shown for a share outstanding throughout the period may not correlate with the Statement of Operations for the period due to the timing of sales and
repurchases of the Fund shares in relation to income earned and/or fluctuating fair value of the investments of the Fund.
bBased on average daily shares outstanding.
cBenefit of waiver and payments by affiliates and expense reduction rounds to less than 0.01%.
franklintempleton.com The accompanying notes are an integral part of these financial statements. | Annual Report | 79
FRANKLIN STRATEGIC SERIES
FINANCIAL HIGHLIGHTS
| Franklin Small Cap Growth Fund (continued) | ||||||
| Year Ended | ||||||
| April 30, | ||||||
| 2015 | 2014 | a | ||||
| Class R6 | ||||||
| Per share operating performance | ||||||
| (for a share outstanding throughout the year) | ||||||
| Net asset value, beginning of year | $ | 19.21 | $ | 14.64 | ||
| Income from investment operationsb: | ||||||
| Net investment income (loss)c | (0.03 | ) | (0.06 | ) | ||
| Net realized and unrealized gains (losses) | 1.66 | 5.29 | ||||
| Total from investment operations | 1.63 | 5.23 | ||||
| Less distributions from net realized gains | (0.82 | ) | (0.66 | ) | ||
| Net asset value, end of year | $ | 20.02 | $ | 19.21 | ||
| Total return | 8.91 | % | 35.80 | % | ||
| Ratios to average net assets | ||||||
| Expensesd | 0.66 | % | 0.72 | % | ||
| Net investment income (loss) | (0.16 | )% | (0.37 | )% | ||
| Supplemental data | ||||||
| Net assets, end of year (000’s) | $ | 844,293 | $ | 87,777 | ||
| Portfolio turnover rate | 30.15 | % | 40.35 | % | ||
aFor the year May 1, 2013 (effective date) to April 30, 2014.
bThe amount shown for a share outstanding throughout the period may not correlate with the Statement of Operations for the period due to the timing of sales and
repurchases of the Fund shares in relation to income earned and/or fluctuating fair value of the investments of the Fund.
cBased on average daily shares outstanding.
dBenefit of waiver and payments by affiliates and expense reduction rounds to less than 0.01%.
80 | Annual Report | The accompanying notes are an integral part of these financial statements. franklintempleton.com
| FRANKLIN STRATEGIC SERIES | |||||||||||||||
| FINANCIAL HIGHLIGHTS | |||||||||||||||
| Franklin Small Cap Growth Fund (continued) | |||||||||||||||
| Year Ended April 30, | |||||||||||||||
| 2015 | 2014 | 2013 | 2012 | 2011 | |||||||||||
| Advisor Class | |||||||||||||||
| Per share operating performance | |||||||||||||||
| (for a share outstanding throughout the year) | |||||||||||||||
| Net asset value, beginning of year | $ | 19.17 | $ | 14.94 | $ | 13.41 | $ | 13.55 | $ | 10.39 | |||||
| Income from investment operationsa: | |||||||||||||||
| Net investment income (loss)b | (0.07 | ) | (0.11 | ) | (0.05 | ) | (0.04 | ) | (0.07 | ) | |||||
| Net realized and unrealized gains (losses) | 1.66 | 5.00 | 1.94 | (0.10 | ) | 3.23 | |||||||||
| Total from investment operations | 1.59 | 4.89 | 1.89 | (0.14 | ) | 3.16 | |||||||||
| Less distributions from net realized gains | (0.82 | ) | (0.66 | ) | (0.36 | ) | — | — | |||||||
| Net asset value, end of year | $ | 19.94 | $ | 19.17 | $ | 14.94 | $ | 13.41 | $ | 13.55 | |||||
| Total return | 8.65 | % | 32.87 | % | 14.56 | % | (1.03 | )% | 30.41 | % | |||||
| Ratios to average net assets | |||||||||||||||
| Expenses | 0.87 | %c | 0.90 | %c | 1.03 | % | 1.07 | % | 1.07 | % | |||||
| Net investment income (loss) | (0.37 | )% | (0.55 | )% | (0.38 | )% | (0.30 | )% | (0.64 | )% | |||||
| Supplemental data | |||||||||||||||
| Net assets, end of year (000’s) | $ | 1,077,822 | $ | 427,406 | $ | 91,687 | $ | 49,159 | $ | 49,489 | |||||
| Portfolio turnover rate | 30.15 | % | 40.35 | % | 41.02 | % | 50.08 | % | 63.07 | % | |||||
aThe amount shown for a share outstanding throughout the period may not correlate with the Statement of Operations for the period due to the timing of sales and
repurchases of the Fund shares in relation to income earned and/or fluctuating fair value of the investments of the Fund.
bBased on average daily shares outstanding.
cBenefit of waiver and payments by affiliates and expense reduction rounds to less than 0.01%.
franklintempleton.com The accompanying notes are an integral part of these financial statements. | Annual Report | 81
| FRANKLIN STRATEGIC SERIES | |||
| Statement of Investments, April 30, 2015 | |||
| Franklin Small Cap Growth Fund | |||
| Shares | Value | ||
| Common Stocks 91.4% | |||
| Consumer Discretionary 18.1% | |||
| a2U Inc. | 1,401,923 | $ | 37,305,171 |
| aAmerican Axle & Manufacturing Holdings Inc. | 1,239,900 | 30,910,707 | |
| aBuffalo Wild Wings Inc. | 138,300 | 22,031,190 | |
| aFive Below Inc. | 650,400 | 21,931,488 | |
| aGlobal Eagle Entertainment Inc. | 1,296,756 | 16,559,574 | |
| aGrand Canyon Education Inc. | 1,052,500 | 47,657,200 | |
| aIMAX Corp. (Canada) | 1,092,500 | 40,815,800 | |
| KB Home | 883,700 | 12,804,813 | |
| Lithia Motors Inc. | 324,795 | 32,391,804 | |
| a,bM/I Homes Inc. | 1,280,400 | 28,885,824 | |
| a,cMattress Firm Holding Corp. | 463,900 | 27,407,212 | |
| a,cNoodles & Co. | 943,735 | 18,893,575 | |
| aNord Anglia Education Inc. (Hong Kong) | 706,724 | 18,410,160 | |
| aParty City Holdco Inc. | 275,300 | 5,723,487 | |
| a,b,cPotbelly Corp. | 1,640,851 | 24,629,174 | |
| aShutterfly Inc. | 911,800 | 40,812,168 | |
| a,b,cSportsman’s Warehouse Holdings Inc. | 2,356,900 | 22,696,947 | |
| aTenneco Inc. | 821,400 | 48,010,830 | |
| a,b,cTile Shop Holdings Inc. | 2,625,700 | 34,055,329 | |
| aTumi Holdings Inc. | 593,200 | 13,874,948 | |
| Wolverine World Wide Inc. | 1,301,000 | 39,979,730 | |
| a,b,cZoe’s Kitchen Inc. | 1,025,400 | 31,408,002 | |
| 617,195,133 | |||
| Consumer Staples 2.9% | |||
| aBoston Beer Inc., A | 117,500 | 29,116,500 | |
| a,cFreshpet Inc. | 748,500 | 16,227,480 | |
| aSmart & Final Stores Inc. | 1,126,900 | 19,517,908 | |
| aTreeHouse Foods Inc. | 401,500 | 32,625,890 | |
| 97,487,778 | |||
| Energy 5.2% | |||
| aC&J Energy Services Ltd. | 1,184,700 | 20,673,015 | |
| a,bCallon Petroleum Co. | 4,435,282 | 39,651,421 | |
| aMatador Resources Co. | 1,089,239 | 30,193,705 | |
| a,b,cRex Energy Corp. | 5,509,700 | 27,548,500 | |
| aRigNet Inc. | 704,800 | 26,401,808 | |
| a,cSanchez Energy Corp. | 2,174,900 | 31,949,281 | |
| 176,417,730 | |||
| Financials 4.9% | |||
| BBCN Bancorp Inc. | 469,500 | 6,662,205 | |
| aEssent Group Ltd. | 772,631 | 19,277,143 | |
| Evercore Partners Inc. | 497,000 | 23,975,280 | |
| aSquare 1 Financial Inc., A | 963,600 | 24,918,696 | |
| Talmer Bancorp Inc., A | 1,822,500 | 28,030,050 | |
| Virtus Investment Partners Inc. | 244,503 | 32,670,491 | |
| aWestern Alliance Bancorp | 967,200 | 29,905,824 | |
| 165,439,689 | |||
| Health Care 19.3% | |||
| aAdeptus Health Inc., A | 516,200 | 32,763,214 | |
| cAduro Biotech Inc. | 257,420 | 6,538,468 | |
| 82 | Annual Report | franklintempleton.com | ||
FRANKLIN STRATEGIC SERIES
STATEMENT OF INVESTMENTS
| Franklin Small Cap Growth Fund (continued) | |||
| Shares | Value | ||
| Common Stocks (continued) | |||
| Health Care (continued) | |||
| a,bAratana Therapeutics Inc. | 2,013,519 | $ | 25,994,530 |
| aCelldex Therapeutics Inc. | 1,366,600 | 32,798,400 | |
| aCorium International Inc. | 628,550 | 5,656,950 | |
| aDexCom Inc. | 719,000 | 48,582,830 | |
| a,cExact Sciences Corp. | 387,213 | 8,092,752 | |
| aFluidigm Corp. | 795,300 | 29,791,938 | |
| aFoamix Pharmaceuticals Ltd. (Israel) | 437,780 | 4,342,778 | |
| aGreatbatch Inc. | 596,000 | 32,136,320 | |
| aHalozyme Therapeutics Inc. | 791,400 | 11,768,118 | |
| HealthEquity Inc. | 889,916 | 23,324,698 | |
| aHealthStream Inc. | 477,500 | 13,818,850 | |
| aHeartWare International Inc. | 426,800 | 32,313,028 | |
| aHeron Therapeutics Inc. | 739,593 | 7,987,604 | |
| aHMS Holdings Corp. | 2,082,900 | 35,430,129 | |
| aImpax Laboratories Inc. | 850,300 | 38,484,578 | |
| aKaryopharm Therapeutics Inc. | 968,686 | 26,309,512 | |
| a,cKeryx Biopharmaceuticals Inc. | 2,110,000 | 22,492,600 | |
| aNeogen Corp. | 703,900 | 31,351,706 | |
| aNevro Corp. | 333,700 | 15,023,174 | |
| aOphthotech Corp. | 149,709 | 6,778,824 | |
| aPAREXEL International Corp. | 624,900 | 39,728,017 | |
| Pfenex Inc. | 860,600 | 11,489,010 | |
| a,bRevance Therapeutics Inc. | 1,344,100 | 26,445,168 | |
| aSage Therapeutics Inc. | 166,400 | 8,819,200 | |
| aSagent Pharmaceuticals Inc. | 964,500 | 22,482,495 | |
| aThe Spectranetics Corp. | 1,411,600 | 36,207,540 | |
| aTandem Diabetes Care Inc. | 1,264,500 | 16,881,075 | |
| aTherapeuticsMD Inc. | 761,900 | 4,937,112 | |
| 658,770,618 | |||
| Industrials 16.0% | |||
| aThe Advisory Board Co. | 880,900 | 45,709,901 | |
| Allegiant Travel Co. | 132,448 | 20,365,204 | |
| Altra Industrial Motion Corp. | 1,302,100 | 34,336,377 | |
| aAstronics Corp. | 749,660 | 50,459,615 | |
| aBeacon Roofing Supply Inc. | 862,000 | 25,618,640 | |
| aDigitalGlobe Inc. | 1,314,200 | 42,277,814 | |
| Exponent Inc. | 262,308 | 23,243,112 | |
| aHub Group Inc., A | 950,300 | 37,916,970 | |
| aHuron Consulting Group Inc. | 201,700 | 12,227,054 | |
| Interface Inc. | 1,846,000 | 40,113,580 | |
| a,b,cThe KEYW Holding Corp. | 3,081,560 | 29,737,054 | |
| The Manitowoc Co. Inc. | 594,864 | 11,736,667 | |
| Mobile Mini Inc. | 719,900 | 27,744,946 | |
| aPaylocity Holding Corp. | 723,711 | 20,372,465 | |
| aProto Labs Inc. | 340,400 | 23,828,000 | |
| aSpirit Airlines Inc. | 155,900 | 10,674,473 | |
| Steelcase Inc., A | 1,679,200 | 29,503,544 | |
| US Ecology Inc. | 1,024,990 | 48,082,281 | |
| a,cVirgin America Inc. | 330,430 | 9,496,558 | |
| 543,444,255 |
franklintempleton.com Annual Report | 83
FRANKLIN STRATEGIC SERIES
STATEMENT OF INVESTMENTS
| Franklin Small Cap Growth Fund (continued) | ||||
| Shares | Value | |||
| Common Stocks (continued) | ||||
| Information Technology 22.7% | ||||
| a,cA10 Networks Inc. | 2,129,800 | $ | 9,690,590 | |
| a,bBazaarvoice Inc. | 4,314,900 | 23,214,162 | ||
| aBorderfree Inc. | 1,286,968 | 8,133,638 | ||
| aBottomline Technologies Inc. | 1,572,004 | 42,066,827 | ||
| aBroadSoft Inc. | 1,350,974 | 42,744,817 | ||
| a,bCallidus Software Inc. | 2,907,900 | 35,912,565 | ||
| aCavium Inc. | 660,700 | 42,806,753 | ||
| aCognex Corp. | 875,500 | 39,301,195 | ||
| aCoherent Inc. | 521,300 | 31,278,000 | ||
| aDemandware Inc. | 858,700 | 52,895,920 | ||
| aFARO Technologies Inc. | 729,000 | 29,036,070 | ||
| aGuidewire Software Inc. | 595,500 | 29,745,225 | ||
| aHomeAway Inc. | 1,372,800 | 38,369,760 | ||
| a,cHubspot Inc. | 511,729 | 19,809,030 | ||
| Intersil Corp., A | 2,812,000 | 37,540,200 | ||
| aIxia | 2,671,000 | 31,998,580 | ||
| a,bLattice Semiconductor Corp. | 7,451,500 | 44,187,395 | ||
| aM/A-COM Technology Solutions Holdings Inc. | 851,700 | 25,951,299 | ||
| a,cMobile Iron Inc. | 1,609,628 | 9,689,960 | ||
| a,bNanometrics Inc. | 2,431,800 | 37,595,628 | ||
| aSemtech Corp. | 1,086,500 | 25,304,585 | ||
| aShoretel Inc. | 1,173,900 | 8,170,344 | ||
| aSilicon Laboratories Inc. | 637,300 | 32,929,291 | ||
| aViaSat Inc. | 727,400 | 43,731,288 | ||
| aZendesk Inc. | 1,349,514 | 31,119,793 | ||
| 773,222,915 | ||||
| Materials 2.3% | ||||
| H.B. Fuller Co. | 976,600 | 40,792,582 | ||
| Quaker Chemical Corp. | 465,400 | 38,730,588 | ||
| 79,523,170 | ||||
| Total Common Stocks (Cost $2,788,098,379) | 3,111,501,288 | |||
| Short Term Investments 11.9% | ||||
| Money Market Funds (Cost $183,750,044) 5.4% | ||||
| a,dInstitutional Fiduciary Trust Money Market Portfolio | 183,750,044 | 183,750,044 | ||
| eInvestments from Cash Collateral Received for Loaned Securities | ||||
| (Cost $219,970,892) 6.5% | ||||
| Money Market Funds 6.5% | ||||
| a,dInstitutional Fiduciary Trust Money Market Portfolio | 219,970,892 | 219,970,892 | ||
| Total Investments (Cost $3,191,819,315) 103.3% | 3,515,222,224 | |||
| Other Assets, less Liabilities (3.3)% | (111,329,354 | ) | ||
| Net Assets 100.0% | $ | 3,403,892,870 |
aNon-income producing.
bSee Note 8 regarding holdings of 5% voting securities.
cA portion or all of the security is on loan at April 30, 2015. See Note 1(c).
dSee Note 3(f) regarding investments in Institutional Fiduciary Trust Money Market Portfolio.
eSee Note 1(c) regarding securities on loan.
84 | Annual Report | The accompanying notes are an integral part of these financial statements. franklintempleton.com
| FRANKLIN STRATEGIC SERIES | |||||||||||||||
| Financial Highlights | |||||||||||||||
| Franklin Small-Mid Cap Growth Fund | |||||||||||||||
| Year Ended April 30, | |||||||||||||||
| 2015 | 2014 | 2013 | 2012 | 2011 | |||||||||||
| Class A | |||||||||||||||
| Per share operating performance | |||||||||||||||
| (for a share outstanding throughout the year) | |||||||||||||||
| Net asset value, beginning of year | $ | 40.42 | $ | 38.01 | $ | 38.51 | $ | 41.47 | $ | 32.29 | |||||
| Income from investment operationsa: | |||||||||||||||
| Net investment income (loss)b | (0.14 | ) | (0.20 | ) | (0.10 | ) | (0.14 | ) | (0.11 | ) | |||||
| Net realized and unrealized gains (losses) | 5.71 | 8.39 | 3.08 | (1.18 | ) | 9.29 | |||||||||
| Total from investment operations | 5.57 | 8.19 | 2.98 | (1.32 | ) | 9.18 | |||||||||
| Less distributions from net realized gains | (7.61 | ) | (5.78 | ) | (3.48 | ) | (1.64 | ) | — | ||||||
| Net asset value, end of year | $ | 38.38 | $ | 40.42 | $ | 38.01 | $ | 38.51 | $ | 41.47 | |||||
| Total returnc | 15.78 | % | 21.99 | % | 8.95 | % | (2.54 | )% | 28.43 | % | |||||
| Ratios to average net assets | |||||||||||||||
| Expenses | 0.94 | %d | 0.96 | %d,e | 0.98 | % | 0.99 | % | 0.99 | % | |||||
| Net investment income (loss) | (0.35 | )% | (0.48 | )% | (0.27 | )% | (0.38 | )% | (0.31 | )% | |||||
| Supplemental data | |||||||||||||||
| Net assets, end of year (000’s) | $ | 2,535,853 | $ | 2,371,448 | $ | 2,355,507 | $ | 2,492,205 | $ | 2,939,925 | |||||
| Portfolio turnover rate | 47.98 | % | 40.82 | % | 43.72 | % | 47.37 | % | 44.42 | % | |||||
aThe amount shown for a share outstanding throughout the period may not correlate with the Statement of Operations for the period due to the timing of sales and
repurchases of the Fund shares in relation to income earned and/or fluctuating fair value of the investments of the Fund.
bBased on average daily shares outstanding.
cTotal return does not reflect sales commissions or contingent deferred sales charges, if applicable.
dBenefit of waiver and payments by affiliates rounds to less than 0.01%.
eBenefit of expense reduction rounds to less than 0.01%.
franklintempleton.com The accompanying notes are an integral part of these financial statements. | Annual Report | 85
| FRANKLIN STRATEGIC SERIES | |||||||||||||||
| FINANCIAL HIGHLIGHTS | |||||||||||||||
| Franklin Small-Mid Cap Growth Fund (continued) | |||||||||||||||
| Year Ended April 30, | |||||||||||||||
| 2015 | 2014 | 2013 | 2012 | 2011 | |||||||||||
| Class C | |||||||||||||||
| Per share operating performance | |||||||||||||||
| (for a share outstanding throughout the year) | |||||||||||||||
| Net asset value, beginning of year | $ | 33.78 | $ | 32.80 | $ | 33.97 | $ | 37.10 | $ | 29.10 | |||||
| Income from investment operationsa: | |||||||||||||||
| Net investment income (loss)b | (0.36 | ) | (0.43 | ) | (0.32 | ) | (0.37 | ) | (0.33 | ) | |||||
| Net realized and unrealized gains (losses) | 4.62 | 7.19 | 2.63 | (1.12 | ) | 8.33 | |||||||||
| Total from investment operations | 4.26 | 6.76 | 2.31 | (1.49 | ) | 8.00 | |||||||||
| Less distributions from net realized gains | (7.61 | ) | (5.78 | ) | (3.48 | ) | (1.64 | ) | — | ||||||
| Net asset value, end of year | $ | 30.43 | $ | 33.78 | $ | 32.80 | $ | 33.97 | $ | 37.10 | |||||
| Total returnc | 14.96 | % | 21.04 | % | 8.11 | % | (3.28 | )% | 27.49 | % | |||||
| Ratios to average net assets | |||||||||||||||
| Expenses | 1.69 | %d | 1.71 | %d,e | 1.73 | % | 1.74 | % | 1.74 | % | |||||
| Net investment income (loss) | (1.10 | )% | (1.23 | )% | (1.02 | )% | (1.13 | )% | (1.06 | )% | |||||
| Supplemental data | |||||||||||||||
| Net assets, end of year (000’s) | $ | 448,722 | $ | 404,923 | $ | 348,144 | $ | 367,272 | $ | 426,526 | |||||
| Portfolio turnover rate | 47.98 | % | 40.82 | % | 43.72 | % | 47.37 | % | 44.42 | % | |||||
aThe amount shown for a share outstanding throughout the period may not correlate with the Statement of Operations for the period due to the timing of sales and
repurchases of the Fund shares in relation to income earned and/or fluctuating fair value of the investments of the Fund.
bBased on average daily shares outstanding.
cTotal return does not reflect sales commissions or contingent deferred sales charges, if applicable.
dBenefit of waiver and payments by affiliates rounds to less than 0.01%.
eBenefit of expense reduction rounds to less than 0.01%.
86 | Annual Report | The accompanying notes are an integral part of these financial statements. franklintempleton.com
| FRANKLIN STRATEGIC SERIES | |||||||||||||||
| FINANCIAL HIGHLIGHTS | |||||||||||||||
| Franklin Small-Mid Cap Growth Fund (continued) | |||||||||||||||
| Year Ended April 30, | |||||||||||||||
| 2015 | 2014 | 2013 | 2012 | 2011 | |||||||||||
| Class R | |||||||||||||||
| Per share operating performance | |||||||||||||||
| (for a share outstanding throughout the year) | |||||||||||||||
| Net asset value, beginning of year | $ | 38.61 | $ | 36.61 | $ | 37.32 | $ | 40.35 | $ | 31.50 | |||||
| Income from investment operationsa: | |||||||||||||||
| Net investment income (loss)b | (0.23 | ) | (0.29 | ) | (0.18 | ) | (0.23 | ) | (0.19 | ) | |||||
| Net realized and unrealized gains (losses) | 5.41 | 8.07 | 2.95 | (1.16 | ) | 9.04 | |||||||||
| Total from investment operations | 5.18 | 7.78 | 2.77 | (1.39 | ) | 8.85 | |||||||||
| Less distributions from net realized gains | (7.61 | ) | (5.78 | ) | (3.48 | ) | (1.64 | ) | — | ||||||
| Net asset value, end of year | $ | 36.18 | $ | 38.61 | $ | 36.61 | $ | 37.32 | $ | 40.35 | |||||
| Total return | 15.52 | % | 21.66 | % | 8.66 | % | (2.79 | )% | 28.10 | % | |||||
| Ratios to average net assets | |||||||||||||||
| Expenses | 1.19 | %c | 1.21 | %c,d | 1.23 | % | 1.24 | % | 1.24 | % | |||||
| Net investment income (loss) | (0.60 | )% | (0.73 | )% | (0.52 | )% | (0.63 | )% | (0.56 | )% | |||||
| Supplemental data | |||||||||||||||
| Net assets, end of year (000’s) | $ | 96,593 | $ | 85,921 | $ | 65,397 | $ | 64,743 | $ | 86,814 | |||||
| Portfolio turnover rate | 47.98 | % | 40.82 | % | 43.72 | % | 47.37 | % | 44.42 | % | |||||
aThe amount shown for a share outstanding throughout the period may not correlate with the Statement of Operations for the period due to the timing of sales and
repurchases of the Fund shares in relation to income earned and/or fluctuating fair value of the investments of the Fund.
bBased on average daily shares outstanding.
cBenefit of waiver and payments by affiliates rounds to less than 0.01%.
dBenefit of expense reduction rounds to less than 0.01%.
franklintempleton.com The accompanying notes are an integral part of these financial statements. | Annual Report | 87
FRANKLIN STRATEGIC SERIES
FINANCIAL HIGHLIGHTS
| Franklin Small-Mid Cap Growth Fund (continued) | ||||||
| Year Ended | ||||||
| April 30, | ||||||
| 2015 | 2014 | a | ||||
| Class R6 | ||||||
| Per share operating performance | ||||||
| (for a share outstanding throughout the year) | ||||||
| Net asset value, beginning of year | $ | 42.53 | $ | 38.96 | ||
| Income from investment operationsb: | ||||||
| Net investment incomec | 0.05 | 0.01 | ||||
| Net realized and unrealized gains (losses) | 6.07 | 9.34 | ||||
| Total from investment operations | 6.12 | 9.35 | ||||
| Less distributions from net realized gains | (7.61 | ) | (5.78 | ) | ||
| Net asset value, end of year | $ | 41.04 | $ | 42.53 | ||
| Total return | 16.32 | % | 24.43 | % | ||
| Ratios to average net assets | ||||||
| Expensesd | 0.48 | % | 0.47 | %e | ||
| Net investment income | 0.11 | % | 0.01 | % | ||
| Supplemental data | ||||||
| Net assets, end of year (000’s) | $ | 206,548 | $ | 157,153 | ||
| Portfolio turnover rate | 47.98 | % | 40.82 | % | ||
aFor the year May 1, 2013 (effective date) to April 30, 2014.
bThe amount shown for a share outstanding throughout the period may not correlate with the Statement of Operations for the period due to the timing of sales and
repurchases of the Fund shares in relation to income earned and/or fluctuating fair value of the investments of the Fund.
cBased on average daily shares outstanding.
dBenefit of waiver and payments by affiliates rounds to less than 0.01%.
eBenefit of expense reduction rounds to less than 0.01%.
88 | Annual Report | The accompanying notes are an integral part of these financial statements. franklintempleton.com
| FRANKLIN STRATEGIC SERIES | |||||||||||||||
| FINANCIAL HIGHLIGHTS | |||||||||||||||
| Franklin Small-Mid Cap Growth Fund (continued) | �� | ||||||||||||||
| Year Ended April 30, | |||||||||||||||
| 2015 | 2014 | 2013 | 2012 | 2011 | |||||||||||
| Advisor Class | |||||||||||||||
| Per share operating performance | |||||||||||||||
| (for a share outstanding throughout the year) | |||||||||||||||
| Net asset value, beginning of year | $ | 42.44 | $ | 39.56 | $ | 39.83 | $ | 42.73 | $ | 33.19 | |||||
| Income from investment operationsa: | |||||||||||||||
| Net investment income (loss)b | (0.04 | ) | (0.10 | ) | (0.01 | ) | (0.05 | ) | (0.02 | ) | |||||
| Net realized and unrealized gains (losses) | 6.04 | 8.76 | 3.22 | (1.21 | ) | 9.56 | |||||||||
| Total from investment operations | 6.00 | 8.66 | 3.21 | (1.26 | ) | 9.54 | |||||||||
| Less distributions from net realized gains | (7.61 | ) | (5.78 | ) | (3.48 | ) | (1.64 | ) | — | ||||||
| Net asset value, end of year | $ | 40.83 | $ | 42.44 | $ | 39.56 | $ | 39.83 | $ | 42.73 | |||||
| Total return | 16.09 | % | 22.30 | % | 9.21 | % | (2.29 | )% | 28.74 | % | |||||
| Ratios to average net assets | |||||||||||||||
| Expenses | 0.69 | %c | 0.71 | %c,d | 0.73 | % | 0.74 | % | 0.74 | % | |||||
| Net investment income (loss) | (0.10 | )% | (0.23 | )% | (0.02 | )% | (0.13 | )% | (0.06 | )% | |||||
| Supplemental data | |||||||||||||||
| Net assets, end of year (000’s) | $ | 708,617 | $ | 650,426 | $ | 909,895 | $ | 822,827 | $ | 878,248 | |||||
| Portfolio turnover rate | 47.98 | % | 40.82 | % | 43.72 | % | 47.37 | % | 44.42 | % | |||||
aThe amount shown for a share outstanding throughout the period may not correlate with the Statement of Operations for the period due to the timing of sales and
repurchases of the Fund shares in relation to income earned and/or fluctuating fair value of the investments of the Fund.
bBased on average daily shares outstanding.
cBenefit of waiver and payments by affiliates rounds to less than 0.01%.
dBenefit of expense reduction rounds to less than 0.01%.
franklintempleton.com The accompanying notes are an integral part of these financial statements. | Annual Report | 89
| FRANKLIN STRATEGIC SERIES | |||
| Statement of Investments, April 30, 2015 | |||
| Franklin Small-Mid Cap Growth Fund | |||
| Shares | Value | ||
| Common Stocks 97.1% | |||
| Consumer Discretionary 20.2% | |||
| Advance Auto Parts Inc. | 100,000 | $ | 14,300,000 |
| BorgWarner Inc. | 559,800 | 33,140,160 | |
| aBuffalo Wild Wings Inc. | 155,600 | 24,787,080 | |
| aCharter Communications Inc., A | 151,900 | 28,414,414 | |
| aChipotle Mexican Grill Inc. | 72,500 | 45,047,150 | |
| Dick’s Sporting Goods Inc. | 620,400 | 33,662,904 | |
| aDollar Tree Inc. | 420,600 | 32,138,046 | |
| aGlobal Eagle Entertainment Inc. | 1,449,000 | 18,503,730 | |
| aGrand Canyon Education Inc. | 624,600 | 28,281,888 | |
| Hanesbrands Inc. | 721,000 | 22,408,680 | |
| Harman International Industries Inc. | 282,400 | 36,819,312 | |
| aIMAX Corp. (Canada) | 576,300 | 21,530,568 | |
| aJarden Corp. | 998,292 | 51,092,585 | |
| bKB Home | 2,133,200 | 30,910,068 | |
| L Brands Inc. | 465,100 | 41,561,336 | |
| Marriott International Inc., A | 573,900 | 45,940,695 | |
| aMGM Resorts International | 988,319 | 20,902,947 | |
| aNetflix Inc. | 84,930 | 47,263,545 | |
| Nordstrom Inc. | 409,100 | 30,911,596 | |
| Polaris Industries Inc. | 151,000 | 20,680,960 | |
| aShutterfly Inc. | 253,802 | 11,360,177 | |
| aTenneco Inc. | 673,500 | 39,366,075 | |
| Tiffany & Co. | 241,100 | 21,091,428 | |
| Tractor Supply Co. | 408,800 | 35,181,328 | |
| aUnder Armour Inc., A | 394,400 | 30,585,720 | |
| Wolverine World Wide Inc. | 712,900 | 21,907,417 | |
| a,bZoe’s Kitchen Inc. | 609,500 | 18,668,985 | |
| 806,458,794 | |||
| Consumer Staples 4.8% | |||
| aBoston Beer Inc., A | 121,800 | 30,182,040 | |
| aConstellation Brands Inc., A | 391,700 | 45,413,698 | |
| a,bFreshpet Inc. | 1,103,200 | 23,917,376 | |
| aMonster Beverage Corp. | 325,000 | 44,560,750 | |
| aTreeHouse Foods Inc. | 376,500 | 30,594,390 | |
| Whole Foods Market Inc. | 325,528 | 15,547,217 | |
| 190,215,471 | |||
| Energy 4.9% | |||
| Cabot Oil & Gas Corp., A | 1,357,010 | 45,894,078 | |
| aConcho Resources Inc. | 349,000 | 44,204,340 | |
| aDiamondback Energy Inc. | 421,200 | 34,778,484 | |
| EQT Corp. | 403,500 | 36,290,790 | |
| aMatador Resources Co. | 829,600 | 22,996,512 | |
| Oceaneering International Inc. | 227,300 | 12,526,503 | |
| 196,690,707 | |||
| Financials 7.1% | |||
| aAffiliated Managers Group Inc. | 251,800 | 56,939,534 | |
| Arthur J. Gallagher & Co. | 524,400 | 25,082,052 | |
| Brown & Brown Inc. | 672,800 | 21,495,960 | |
| Intercontinental Exchange Inc. | 227,048 | 50,979,087 | |
| Jones Lang LaSalle Inc. | 105,300 | 17,486,118 | |
| 90 | Annual Report | franklintempleton.com | ||
FRANKLIN STRATEGIC SERIES
STATEMENT OF INVESTMENTS
| Franklin Small-Mid Cap Growth Fund (continued) | |||
| Shares | Value | ||
| Common Stocks (continued) | |||
| Financials (continued) | |||
| Lazard Ltd., A | 724,800 | $ | 38,436,144 |
| aSignature Bank | 349,200 | 46,824,228 | |
| T. Rowe Price Group Inc. | 296,900 | 24,102,342 | |
| Virtu Financial Inc., A | 103,500 | 2,213,865 | |
| 283,559,330 | |||
| Health Care 18.7% | |||
| Aduro Biotech Inc. | 199,100 | 5,057,140 | |
| aBioMarin Pharmaceutical Inc. | 239,600 | 26,847,180 | |
| aCelldex Therapeutics Inc. | 793,900 | 19,053,600 | |
| aCerner Corp. | 588,000 | 42,224,280 | |
| The Cooper Cos. Inc. | 243,800 | 43,413,466 | |
| aDaVita HealthCare Partners Inc. | 459,900 | 37,297,890 | |
| DENTSPLY International Inc. | 442,000 | 22,542,000 | |
| aDexCom Inc. | 282,300 | 19,075,011 | |
| aEdwards Lifesciences Corp. | 253,000 | 32,042,450 | |
| aEnvision Healthcare Holdings Inc. | 1,071,700 | 40,681,732 | |
| aHCA Holdings Inc. | 620,200 | 45,901,002 | |
| HealthEquity Inc. | 337,500 | 8,845,875 | |
| aHeartWare International Inc. | 118,230 | 8,951,193 | |
| aHMS Holdings Corp. | 228,100 | 3,879,981 | |
| aHologic Inc. | 1,081,300 | 36,483,062 | |
| aIllumina Inc. | 154,900 | 28,540,325 | |
| aImpax Laboratories Inc. | 1,232,000 | 55,760,320 | |
| aIncyte Corp. | 205,200 | 19,937,232 | |
| Inovalon Holdings Inc., A | 359,300 | 9,072,325 | |
| aInsulet Corp. | 109,000 | 3,253,650 | |
| aKaryopharm Therapeutics Inc. | 240,300 | 6,526,548 | |
| a,bKeryx Biopharmaceuticals Inc. | 398,100 | 4,243,746 | |
| aMettler-Toledo International Inc. | 104,500 | 33,127,545 | |
| aNevro Corp. | 88,750 | 3,995,525 | |
| Perrigo Co. PLC | 310,817 | 56,966,540 | |
| Pfenex Inc. | 650,500 | 8,684,175 | |
| aPuma Biotechnology Inc. | 73,800 | 13,326,804 | |
| aQuintiles Transnational Holdings Inc. | 728,400 | 47,986,992 | |
| a,bRevance Therapeutics Inc. | 623,900 | 12,275,233 | |
| St. Jude Medical Inc. | 428,000 | 29,981,400 | |
| aTandem Diabetes Care Inc. | 233,200 | 3,113,220 | |
| aVertex Pharmaceuticals Inc. | 133,700 | 16,482,536 | |
| 745,569,978 | |||
| Industrials 14.4% | |||
| Acuity Brands Inc. | 135,300 | 22,588,335 | |
| aThe Advisory Board Co. | 498,700 | 25,877,543 | |
| Allegiant Travel Co. | 61,110 | 9,396,274 | |
| AMETEK Inc. | 1,096,050 | 57,454,941 | |
| B/E Aerospace Inc. | 530,500 | 31,718,595 | |
| aDigitalGlobe Inc. | 853,300 | 27,450,661 | |
| Flowserve Corp. | 484,400 | 28,351,932 | |
| aGenesee & Wyoming Inc. | 300,200 | 27,903,590 | |
| aHD Supply Holdings Inc. | 872,000 | 28,776,000 | |
| Hexcel Corp. | 756,709 | 37,948,956 | |
| franklintempleton.com | Annual Report | 91 | ||
FRANKLIN STRATEGIC SERIES
STATEMENT OF INVESTMENTS
| Franklin Small-Mid Cap Growth Fund (continued) | |||
| Shares | Value | ||
| Common Stocks (continued) | |||
| Industrials (continued) | |||
| aIHS Inc., A | 320,600 | $ | 40,225,682 |
| J.B. Hunt Transport Services Inc. | 237,800 | 20,736,160 | |
| Kansas City Southern | 246,900 | 25,304,781 | |
| Robert Half International Inc. | 834,900 | 46,295,205 | |
| Roper Technologies Inc. | 268,830 | 45,209,141 | |
| aSpirit Airlines Inc. | 501,900 | 34,365,093 | |
| Towers Watson & Co. | 167,500 | 21,256,587 | |
| aWABCO Holdings Inc. | 367,400 | 45,722,930 | |
| 576,582,406 | |||
| Information Technology 22.9% | |||
| aAlliance Data Systems Corp. | 54,600 | 16,233,126 | |
| aANSYS Inc. | 227,100 | 19,494,264 | |
| Applied Materials Inc. | 1,626,600 | 32,190,414 | |
| Avago Technologies Ltd. (Singapore) | 387,500 | 45,291,000 | |
| aBottomline Technologies Inc. | 565,600 | 15,135,456 | |
| aCognex Corp. | 761,800 | 34,197,202 | |
| aCoStar Group Inc. | 206,200 | 42,153,466 | |
| aDemandware Inc. | 347,100 | 21,381,360 | |
| aElectronic Arts Inc. | 833,700 | 48,429,633 | |
| Equinix Inc. | 133,069 | 34,056,349 | |
| Fidelity National Information Services Inc. | 272,900 | 17,053,521 | |
| aFleetCor Technologies Inc. | 243,800 | 39,224,982 | |
| aFortinet Inc. | 424,500 | 16,020,630 | |
| aFreescale Semiconductor Ltd. | 713,700 | 27,898,533 | |
| bGoDaddy Inc., A | 100,200 | 2,512,014 | |
| aHomeAway Inc. | 833,300 | 23,290,735 | |
| Intersil Corp., A | 2,174,600 | 29,030,910 | |
| aJDS Uniphase Corp. | 1,980,400 | 25,071,864 | |
| Lam Research Corp. | 236,400 | 17,867,112 | |
| aLinkedIn Corp., A | 128,600 | 32,423,918 | |
| aNetSuite Inc. | 169,800 | 16,227,786 | |
| aNXP Semiconductors NV (Netherlands) | 714,900 | 68,716,188 | |
| aPalo Alto Networks Inc. | 100,000 | 14,772,000 | |
| aPandora Media Inc. | 1,196,200 | 21,340,208 | |
| aRed Hat Inc. | 442,800 | 33,325,128 | |
| aServiceNow Inc. | 386,000 | 28,895,960 | |
| aTwitter Inc. | 851,000 | 33,154,960 | |
| aVantiv Inc., A | 672,600 | 26,298,660 | |
| aVeriFone Systems Inc. | 840,400 | 30,061,108 | |
| aViaSat Inc. | 637,896 | 38,350,308 | |
| aWorkday Inc. | 200,800 | 18,314,968 | |
| Xilinx Inc. | 564,100 | 24,459,376 | |
| aYelp Inc. | 547,800 | 21,577,842 | |
| 914,450,981 | |||
| Materials 3.6% | |||
| aAxalta Coating Systems Ltd. | 1,579,270 | 48,452,004 | |
| Cytec Industries Inc. | 721,800 | 39,908,322 | |
| H.B. Fuller Co. | 556,333 | 23,238,029 | |
| Martin Marietta Materials Inc. | 235,500 | 33,594,075 | |
| 145,192,430 |
92 | Annual Report franklintempleton.com
FRANKLIN STRATEGIC SERIES
STATEMENT OF INVESTMENTS
| Franklin Small-Mid Cap Growth Fund (continued) | ||||
| Shares | Value | |||
| Common Stocks (continued) | ||||
| Utilities 0.5% | ||||
| aCalpine Corp. | 997,600 | $ | 21,757,656 | |
| Total Common Stocks (Cost $2,566,045,801) | 3,880,477,753 | |||
| Short Term Investments 4.8% | ||||
| Money Market Funds (Cost $142,198,800) 3.6% | ||||
| a,cInstitutional Fiduciary Trust Money Market Portfolio | 142,198,800 | 142,198,800 | ||
| dInvestments from Cash Collateral Received for Loaned Securities | ||||
| (Cost $48,611,025) 1.2% | ||||
| Money Market Funds 1.2% | ||||
| a,cInstitutional Fiduciary Trust Money Market Portfolio | 48,611,025 | 48,611,025 | ||
| Total Investments (Cost $2,756,855,626) 101.9% | 4,071,287,578 | |||
| Other Assets, less Liabilities (1.9)% | (74,954,915 | ) | ||
| Net Assets 100.0% | $ | 3,996,332,663 |
aNon-income producing.
bA portion or all of the security is on loan at April 30, 2015. See Note 1(c).
cSee Note 3(f) regarding investments in Institutional Fiduciary Trust Money Market Portfolio.
dSee Note 1(c) regarding securities on loan.
franklintempleton.com The accompanying notes are an integral part of these financial statements. | Annual Report | 93
| FRANKLIN STRATEGIC SERIES | |||||||||
| Financial Statements | |||||||||
| Statements of Assets and Liabilities | |||||||||
| April 30, 2015 | |||||||||
| Franklin Flex Cap | Franklin Focused | Franklin Growth | |||||||
| Growth Fund | Core Equity Fund | Opportunities Fund | |||||||
| Assets: | |||||||||
| Investments in securities: | |||||||||
| Cost - Unaffiliated issuers | $ | 2,037,358,388 | $ | 116,988,379 | $ | 739,778,154 | |||
| Cost - Sweep Money Fund (Note 3f) | 92,368,597 | 8,816,207 | 31,128,570 | ||||||
| Total cost of investments | $ | 2,129,726,985 | $ | 125,804,586 | $ | 770,906,724 | |||
| Value - Unaffiliated issuers | $ | 3,132,631,838 | $ | 139,613,420 | $ | 1,099,805,959 | |||
| Value - Sweep Money Fund (Note 3f) | 92,368,597 | 8,816,207 | 31,128,570 | ||||||
| Total value of investmentsa | 3,225,000,435 | 148,429,627 | 1,130,934,529 | ||||||
| Receivables: | |||||||||
| Investment securities sold | 243,065,862 | 148,128 | 10,993,173 | ||||||
| Capital shares sold | 2,866,692 | 314,305 | 1,260,599 | ||||||
| Dividends and interest | 469,963 | 50,603 | 165,876 | ||||||
| Other assets | 1,735 | 65 | 554 | ||||||
| Total assets | 3,471,404,687 | 148,942,728 | 1,143,354,731 | ||||||
| Liabilities: | |||||||||
| Payables: | |||||||||
| Investment securities purchased | 108,693,184 | 1,578,508 | 8,221,627 | ||||||
| Capital shares redeemed | 3,296,243 | 21,672 | 877,427 | ||||||
| Management fees | 1,283,511 | 84,531 | 597,925 | ||||||
| Distribution fees | 798,536 | 37,240 | 225,250 | ||||||
| Transfer agent fees | 886,527 | 20,119 | 193,868 | ||||||
| Payable upon return of securities loaned | 11,905,000 | — | — | ||||||
| Accrued expenses and other liabilities | 201,630 | 8,335 | 42,750 | ||||||
| Total liabilities | 127,064,631 | 1,750,405 | 10,158,847 | ||||||
| Net assets, at value | $ | 3,344,340,056 | $ | 147,192,323 | $ | 1,133,195,884 | |||
| Net assets consist of: | |||||||||
| Paid-in capital | $ | 1,979,576,938 | $ | 121,483,880 | $ | 753,388,146 | |||
| Undistributed net investment income (loss) | (6,551,185 | ) | (109,547 | ) | (2,383,730 | ) | |||
| Net unrealized appreciation (depreciation) | 1,095,273,450 | 22,623,525 | 360,028,253 | ||||||
| Accumulated net realized gain (loss) | 276,040,853 | 3,194,465 | 22,163,215 | ||||||
| Net assets, at value | $ | 3,344,340,056 | $ | 147,192,323 | $ | 1,133,195,884 | |||
| aIncludes securities loaned | $ | 11,308,875 | $ | — | $ | — | |||
94 | Annual Report | The accompanying notes are an integral part of these financial statements. franklintempleton.com
| FRANKLIN STRATEGIC SERIES | ||||||||
| FINANCIAL STATEMENTS | ||||||||
| Statements of Assets and Liabilities (continued) | ||||||||
| April 30, 2015 | ||||||||
| Franklin Flex Cap | Franklin Focused | Franklin Growth | ||||||
| Growth Fund | Core Equity Fund | Opportunities Fund | ||||||
| Class A: | �� | |||||||
| Net assets, at value | $ | 2,245,755,844 | $ | 92,611,880 | $ | 457,618,644 | ||
| Shares outstanding | 43,555,449 | 6,055,606 | 13,813,786 | |||||
| Net asset value per sharea | $ | 51.56 | $ | 15.29 | $ | 33.13 | ||
| Maximum offering price per share (net asset value | ||||||||
| per share ÷ 94.25%) | $ | 54.71 | $ | 16.22 | $ | 35.15 | ||
| Class C: | ||||||||
| Net assets, at value | $ | 363,531,992 | $ | 18,757,598 | $ | 110,513,114 | ||
| Shares outstanding | 8,435,489 | 1,273,528 | 3,775,513 | |||||
| Net asset value and maximum offering price per sharea | $ | 43.10 | $ | 14.73 | $ | 29.27 | ||
| Class R: | ||||||||
| Net assets, at value | $ | 45,268,898 | $ | 169,157 | $ | 48,266,044 | ||
| Shares outstanding | 919,675 | 11,167 | 1,503,523 | |||||
| Net asset value and maximum offering price per share | $ | 49.22 | $ | 15.15 | $ | 32.10 | ||
| Class R6: | ||||||||
| Net assets, at value | $ | 295,822,010 | $ | 25,739,190 | $ | 246,911,084 | ||
| Shares outstanding | 5,511,989 | 1,664,940 | 7,036,134 | |||||
| Net asset value and maximum offering price per share | $ | 53.67 | $ | 15.46 | $ | 35.09 | ||
| Advisor Class: | ||||||||
| Net assets, at value | $ | 393,961,312 | $ | 9,914,498 | $ | 269,886,998 | ||
| Shares outstanding | 7,379,652 | 641,970 | 7,719,806 | |||||
| Net asset value and maximum offering price per share | $ | 53.38 | $ | 15.44 | $ | 34.96 | ||
aRedemption price is equal to net asset value less contingent deferred sales charges, if applicable.
franklintempleton.com The accompanying notes are an integral part of these financial statements. | Annual Report | 95
| FRANKLIN STRATEGIC SERIES | |||||
| FINANCIAL STATEMENTS | |||||
| Statements of Assets and Liabilities (continued) | |||||
| April 30, 2015 | |||||
| Franklin Small Cap | Franklin Small-Mid Cap | ||||
| Growth Fund | Growth Fund | ||||
| Assets: | |||||
| Investments in securities: | |||||
| Cost - Unaffiliated issuers | $ | 2,309,693,255 | $ | 2,566,045,801 | |
| Cost - Non-controlled affiliated issuers (Note 8) | 478,405,124 | — | |||
| Cost - Sweep Money Fund (Note 3f) | 403,720,936 | 190,809,825 | |||
| Total cost of investments | $ | 3,191,819,315 | $ | 2,756,855,626 | |
| Value - Unaffiliated issuers | $ | 2,679,539,589 | $ | 3,880,477,753 | |
| Value - Non-controlled affiliated issuers (Note 8) | 431,961,699 | — | |||
| Value - Sweep Money Fund (Note 3f) | 403,720,936 | 190,809,825 | |||
| Total value of investmentsa | 3,515,222,224 | 4,071,287,578 | |||
| Receivables: | |||||
| Investment securities sold | 16,335,681 | 2,933,310 | |||
| Capital shares sold | 129,490,303 | 4,961,837 | |||
| Dividends and interest | 1,218,688 | 1,095,966 | |||
| Due from custodian | 1,421,425 | 190,650 | |||
| Other assets | 1,516 | 1,994 | |||
| Total assets | 3,663,689,837 | 4,080,471,335 | |||
| Liabilities: | |||||
| Payables: | |||||
| Investment securities purchased | 27,977,800 | 26,215,986 | |||
| Capital shares redeemed | 7,462,562 | 5,196,825 | |||
| Management fees | 1,630,538 | 1,513,570 | |||
| Distribution fees | 471,586 | 950,248 | |||
| Transfer agent fees | 737,754 | 1,286,824 | |||
| Payable upon return of securities loaned | 221,392,317 | 48,801,675 | |||
| Accrued expenses and other liabilities | 124,410 | 173,544 | |||
| Total liabilities | 259,796,967 | 84,138,672 | |||
| Net assets, at value | $ | 3,403,892,870 | $ | 3,996,332,663 | |
| Net assets consist of: | |||||
| Paid-in capital | $ | 3,026,300,786 | $ | 2,525,998,873 | |
| Undistributed net investment income (loss) | — | (4,043,161 | ) | ||
| Net unrealized appreciation (depreciation) | 323,402,909 | 1,314,431,952 | |||
| Accumulated net realized gain (loss) | 54,189,175 | 159,944,999 | |||
| Net assets, at value | $ | 3,403,892,870 | $ | 3,996,332,663 | |
| aIncludes securities loaned | $ | 211,301,814 | $ | 46,784,095 | |
96 | Annual Report | The accompanying notes are an integral part of these financial statements.
franklintempleton.com
| FRANKLIN STRATEGIC SERIES | ||||||
| FINANCIAL STATEMENTS | ||||||
| Statements of Assets and Liabilities (continued) | ||||||
| April 30, 2015 | ||||||
| Franklin Small Cap | Franklin Small-Mid Cap | |||||
| Growth Fund | Growth Fund | |||||
| Class A: | ||||||
| Net assets, at value | $ | 1,164,217,992 | $ | 2,535,853,203 | ||
| Shares outstanding | 61,823,112 | 66,064,074 | ||||
| Net asset value per sharea | $ | 18.83 | $ | 38.38 | ||
| Maximum offering price per share (net asset value per share ÷ 94.25%) | $ | 19.98 | $ | 40.72 | ||
| Class C: | ||||||
| Net assets, at value | $ | 225,105,488 | $ | 448,721,694 | ||
| Shares outstanding | 13,762,678 | 14,744,058 | ||||
| Net asset value and maximum offering price per sharea | $ | 16.36 | $ | 30.43 | ||
| Class R: | ||||||
| Net assets, at value | $ | 92,454,509 | $ | 96,592,657 | ||
| Shares outstanding | 5,104,534 | 2,669,562 | ||||
| Net asset value and maximum offering price per share | $ | 18.11 | $ | 36.18 | ||
| Class R6: | ||||||
| Net assets, at value | $ | 844,292,878 | $ | 206,547,836 | ||
| Shares outstanding | 42,174,734 | 5,033,408 | ||||
| Net asset value and maximum offering price per share | $ | 20.02 | $ | 41.04 | ||
| Advisor Class: | ||||||
| Net assets, at value | $ | 1,077,822,003 | $ | 708,617,273 | ||
| Shares outstanding | 54,043,372 | 17,355,925 | ||||
| Net asset value and maximum offering price per share | $ | 19.94 | $ | 40.83 | ||
aRedemption price is equal to net asset value less contingent deferred sales charges, if applicable.
franklintempleton.com The accompanying notes are an integral part of these financial statements. | Annual Report | 97
| FRANKLIN STRATEGIC SERIES | |||||||||
| FINANCIAL STATEMENTS | |||||||||
| Statements of Operations | |||||||||
| for the year ended April 30, 2015 | |||||||||
| Franklin Flex Cap | Franklin Focused | Franklin Growth | |||||||
| Growth Fund | Core Equity Fund | Opportunities Fund | |||||||
| Investment income: | |||||||||
| Dividends | $ | 16,912,188 | $ | 1,209,982 | $ | 5,562,203 | |||
| Income from securities loaned | 2,027,170 | — | 293,740 | ||||||
| Total investment income | 18,939,358 | 1,209,982 | 5,855,943 | ||||||
| Expenses: | |||||||||
| Management fees (Note 3a) | 15,463,437 | 945,420 | 6,492,010 | ||||||
| Distribution fees: (Note 3c) | |||||||||
| Class A | 5,567,315 | 193,877 | 1,167,008 | ||||||
| Class C | 3,602,925 | 119,209 | 965,439 | ||||||
| Class R | 263,949 | 763 | 236,122 | ||||||
| Transfer agent fees: (Note 3e) | |||||||||
| Class A | 4,638,734 | 94,021 | 784,028 | ||||||
| Class C | 750,505 | 17,351 | 194,605 | ||||||
| Class R | 109,977 | 222 | 95,197 | ||||||
| Class R6 | 587 | 131 | 1,170 | ||||||
| Advisor Class | 807,537 | 12,473 | 507,965 | ||||||
| Custodian fees (Note 4) | 30,693 | 1,429 | 9,562 | ||||||
| Reports to shareholders | 451,197 | 14,012 | 87,461 | ||||||
| Registration and filing fees | 233,232 | 76,419 | 137,044 | ||||||
| Professional fees | 65,747 | 41,822 | 45,513 | ||||||
| Trustees’ fees and expenses | 37,187 | 706 | 10,387 | ||||||
| Other | 48,653 | 8,983 | 21,115 | ||||||
| Total expenses | 32,071,675 | 1,526,838 | 10,754,626 | ||||||
| Expense reductions (Note 4) | (59 | ) | — | — | |||||
| Expenses waived/paid by affiliates (Notes 3f and 3g) | (49,299 | ) | (261,149 | ) | (16,671 | ) | |||
| Net expenses | 32,022,317 | 1,265,689 | 10,737,955 | ||||||
| Net investment income (loss) | (13,082,959 | ) | (55,707 | ) | (4,882,012 | ) | |||
| Realized and unrealized gains (losses): | |||||||||
| Net realized gain (loss) from: | |||||||||
| Investments | 487,591,360 | 4,915,224 | 30,871,066 | ||||||
| Foreign currency transactions | — | (441 | ) | (1,297 | ) | ||||
| Net realized gain (loss) | 487,591,360 | 4,914,783 | 30,869,769 | ||||||
| Net change in unrealized appreciation (depreciation) on: | |||||||||
| Investments | (48,517,586 | ) | 10,557,832 | 145,265,246 | |||||
| Translation of other assets and liabilities denominated in | |||||||||
| foreign currencies | — | (2,842 | ) | 161 | |||||
| Net change in unrealized appreciation (depreciation) | (48,517,586 | ) | 10,554,990 | 145,265,407 | |||||
| Net realized and unrealized gain (loss) | 439,073,774 | 15,469,773 | 176,135,176 | ||||||
| Net increase (decrease) in net assets resulting from | |||||||||
| operations | $ | 425,990,815 | $ | 15,414,066 | $ | 171,253,164 | |||
98 | Annual Report | The accompanying notes are an integral part of these financial statements. franklintempleton.com
| FRANKLIN STRATEGIC SERIES | ||||||
| FINANCIAL STATEMENTS | ||||||
| Statements of Operations (continued) | ||||||
| for the year ended April 30, 2015 | ||||||
| Franklin Small Cap | Franklin Small-Mid Cap | |||||
| Growth Fund | Growth Fund | |||||
| Investment income: | ||||||
| Dividends | $ | 6,795,866 | $ | 20,267,809 | ||
| Income from securities loaned | 5,161,438 | 1,984,960 | ||||
| Total investment income | 11,957,304 | 22,252,769 | ||||
| Expenses: | ||||||
| Management fees (Note 3a) | 15,143,792 | 17,364,552 | ||||
| Distribution fees: (Note 3c) | ||||||
| Class A | 2,963,572 | 6,053,930 | ||||
| Class C | 2,117,318 | 4,249,567 | ||||
| Class R | 359,205 | 465,973 | ||||
| Transfer agent fees: (Note 3e) | ||||||
| Class A | 2,134,820 | 5,174,291 | ||||
| Class C | 437,773 | 907,920 | ||||
| Class R | 148,545 | 199,152 | ||||
| Class R6 | 12,008 | 1,023 | ||||
| Advisor Class | 1,612,940 | 1,445,785 | ||||
| Custodian fees (Note 4) | 21,312 | 35,118 | ||||
| Reports to shareholders | 319,016 | 345,355 | ||||
| Registration and filing fees | 428,989 | 228,689 | ||||
| Professional fees | 52,758 | 63,118 | ||||
| Trustees’ fees and expenses | 21,718 | 41,128 | ||||
| Other | 29,324 | 53,577 | ||||
| Total expenses | 25,803,090 | 36,629,178 | ||||
| Expense reductions (Note 4) | (36 | ) | — | |||
| Expenses waived/paid by affiliates (Note 3f) | (114,532 | ) | (79,961 | ) | ||
| Net expenses | 25,688,522 | 36,549,217 | ||||
| Net investment income (loss) | (13,731,218 | ) | (14,296,448 | ) | ||
| Realized and unrealized gains (losses): | ||||||
| Net realized gain (loss) from: | ||||||
| Investments: | ||||||
| Unaffiliated issuers | 101,307,993 | 501,684,738 | ||||
| Non-controlled affiliated issuers (Note 8) | (397,318 | ) | — | |||
| Foreign currency transactions | — | 2,053 | ||||
| Net realized gain (loss) | 100,910,675 | 501,686,791 | ||||
| Net change in unrealized appreciation (depreciation) on investments | 117,033,709 | 64,843,012 | ||||
| Net realized and unrealized gain (loss) | 217,944,384 | 566,529,803 | ||||
| Net increase (decrease) in net assets resulting from operations | $ | 204,213,166 | $ | 552,233,355 | ||
franklintempleton.com The accompanying notes are an integral part of these financial statements. | Annual Report | 99
| FRANKLIN STRATEGIC SERIES | ||||||||||||
| FINANCIAL STATEMENTS | ||||||||||||
| Statements of Changes in Net Assets | ||||||||||||
| Franklin | Franklin | |||||||||||
| Flex Cap Growth Fund | Focused Core Equity Fund | |||||||||||
| Year Ended April 30, | Year Ended April 30, | |||||||||||
| 2015 | 2014 | 2015 | 2014 | |||||||||
| Increase (decrease) in net assets: | ||||||||||||
| Operations: | ||||||||||||
| Net investment income (loss) | $ | (13,082,959 | ) | $ | (9,087,281 | ) | $ | (55,707 | ) | $ | 80,297 | |
| Net realized gain (loss) from investments and foreign | ||||||||||||
| currency transactions | 487,591,360 | 547,040,961 | 4,914,783 | 3,001,159 | ||||||||
| Net change in unrealized appreciation (depreciation) on | ||||||||||||
| investments and translation of other assets and liabilities | ||||||||||||
| denominated in foreign currencies | (48,517,586 | ) | 149,336,366 | 10,554,990 | 6,359,861 | |||||||
| Net increase (decrease) in net assets resulting from | ||||||||||||
| operations | 425,990,815 | 687,290,046 | 15,414,066 | 9,441,317 | ||||||||
| Distributions to shareholders from: | ||||||||||||
| Net investment income: | ||||||||||||
| Class A | — | — | — | (192,481 | ) | |||||||
| Class C | — | — | — | (11,368 | ) | |||||||
| Class R | — | — | — | (445 | ) | |||||||
| Class R6 | — | — | (54,580 | ) | (49 | ) | ||||||
| Advisor Class | — | — | (12,538 | ) | (39,406 | ) | ||||||
| Net realized gains: | ||||||||||||
| Class A | (342,846,125 | ) | (301,818,476 | ) | (1,515,213 | ) | (346,062 | ) | ||||
| Class C | (64,406,445 | ) | (54,830,001 | ) | (294,362 | ) | (51,272 | ) | ||||
| Class R | (8,219,922 | ) | (9,202,542 | ) | (3,890 | ) | (1,074 | ) | ||||
| Class R6 | (55,730,307 | ) | (49,991,855 | ) | (466,176 | ) | (63 | ) | ||||
| Advisor Class | (61,364,271 | ) | (52,429,221 | ) | (197,864 | ) | (57,087 | ) | ||||
| Total distributions to shareholders | (532,567,070 | ) | (468,272,095 | ) | (2,544,623 | ) | (699,307 | ) | ||||
| Capital share transactions: (Note 2) | ||||||||||||
| Class A | 136,476,026 | (40,787,141 | ) | 43,753,093 | 14,846,786 | |||||||
| Class C | 36,940,650 | 41,930,551 | 10,579,825 | 3,202,995 | ||||||||
| Class R | (9,432,569 | ) | (10,211,593 | ) | 25,410 | 25,544 | ||||||
| Class R6 | (69,772,541 | ) | 351,377,703 | 24,014,926 | 12,502 | |||||||
| Advisor Class | 75,060,076 | (557,643,800 | ) | 1,784,405 | 1,381,150 | |||||||
| Total capital share transactions | 169,271,642 | (215,334,280 | ) | 80,157,659 | 19,468,977 | |||||||
| Net increase (decrease) in net assets | 62,695,387 | 3,683,671 | 93,027,102 | 28,210,987 | ||||||||
| Net assets: | ||||||||||||
| Beginning of year | 3,281,644,669 | 3,277,960,998 | 54,165,221 | 25,954,234 | ||||||||
| End of year | $ | 3,344,340,056 | $ | 3,281,644,669 | $ | 147,192,323 | $ | 54,165,221 | ||||
| Undistributed net investment income (loss) included in | ||||||||||||
| net assets: | ||||||||||||
| End of year | $ | (6,551,185 | ) | $ | — | $ | (109,547 | ) | $ | 13,720 | ||
100 | Annual Report | The accompanying notes are an integral part of these financial statements.
franklintempleton.com
| FRANKLIN STRATEGIC SERIES | |||||||||||||
| FINANCIAL STATEMENTS | |||||||||||||
| Statements of Changes in Net Assets (continued) | |||||||||||||
| Franklin Growth | Franklin Small Cap | ||||||||||||
| Opportunities Fund | Growth Fund | ||||||||||||
| Year Ended April 30, | Year Ended April 30, | ||||||||||||
| 2015 | 2014 | 2015 | 2014 | ||||||||||
| Increase (decrease) in net assets: | |||||||||||||
| Operations: | |||||||||||||
| Net investment income (loss) | $ | (4,882,012 | ) | $ | (4,328,922 | ) | $ | (13,731,218 | ) | $ | (9,044,371 | ) | |
| Net realized gain (loss) from investments and foreign | |||||||||||||
| currency transactions | 30,869,769 | 34,734,849 | 100,910,675 | 118,376,734 | |||||||||
| Net change in unrealized appreciation (depreciation) | |||||||||||||
| on investments and translation of other assets and | |||||||||||||
| liabilities denominated in foreign currencies | 145,265,407 | 72,755,872 | 117,033,709 | 102,087,491 | |||||||||
| Net increase (decrease) in net assets resulting | |||||||||||||
| from operations | 171,253,164 | 103,161,799 | 204,213,166 | 211,419,854 | |||||||||
| Distributions to shareholders from: | |||||||||||||
| Net realized gains: | |||||||||||||
| Class A | (8,226,701 | ) | (7,721,877 | ) | (45,578,212 | ) | (24,165,547 | ) | |||||
| Class C | (2,289,412 | ) | (2,096,347 | ) | (10,662,075 | ) | (6,035,996 | ) | |||||
| Class R | (1,046,546 | ) | (1,119,208 | ) | (3,386,123 | ) | (1,265,928 | ) | |||||
| Class R6 | (4,459,467 | ) | (3,094,887 | ) | (15,120,957 | ) | (1,954,443 | ) | |||||
| Advisor Class | (5,048,872 | ) | (5,609,140 | ) | (33,104,015 | ) | (8,618,047 | ) | |||||
| Total distributions to shareholders | (21,070,998 | ) | (19,641,459 | ) | (107,851,382 | ) | (42,039,961 | ) | |||||
| Capital share transactions: (Note 2) | |||||||||||||
| Class A | 51,147,182 | 97,823,516 | 273,601,463 | 418,746,753 | |||||||||
| Class C | 11,203,177 | 25,708,687 | 32,688,066 | 87,582,326 | |||||||||
| Class R | (1,590,662 | ) | 2,812,217 | 38,786,269 | 30,683,689 | ||||||||
| Class R6 | 32,429,351 | 160,891,720 | 743,017,911 | 77,135,611 | |||||||||
| Advisor Class | 6,333,425 | 30,022,943 | 614,477,070 | 308,435,474 | |||||||||
| Total capital share transactions | 99,522,473 | 317,259,083 | 1,702,570,779 | 922,583,853 | |||||||||
| Net increase (decrease) in net assets | 249,704,639 | 400,779,423 | 1,798,932,563 | 1,091,963,746 | |||||||||
| Net assets: | |||||||||||||
| Beginning of year | 883,491,245 | 482,711,822 | 1,604,960,307 | 512,996,561 | |||||||||
| End of year | $ | 1,133,195,884 | $ | 883,491,245 | $ | 3,403,892,870 | $ | 1,604,960,307 | |||||
| Undistributed net investment income (loss) included in | |||||||||||||
| net assets: | |||||||||||||
| End of year | $ | (2,383,730 | ) | $ | (1,886,845 | ) | $ | — | $ | — | |||
franklintempleton.com The accompanying notes are an integral part of these financial statements. | Annual Report | 101
| FRANKLIN STRATEGIC SERIES | ||||||
| FINANCIAL STATEMENTS | ||||||
| Statements of Changes in Net Assets (continued) | ||||||
| Franklin Small-Mid Cap | ||||||
| Growth Fund | ||||||
| Year Ended April 30, | ||||||
| 2015 | 2014 | |||||
| Increase (decrease) in net assets: | ||||||
| Operations: | ||||||
| Net investment income (loss) | $ | (14,296,448 | ) | $ | (18,790,409 | ) |
| Net realized gain (loss) from investments and foreign currency transactions | 501,686,791 | 731,676,246 | ||||
| Net change in unrealized appreciation (depreciation) on investments | 64,843,012 | 39,368,824 | ||||
| Net increase (decrease) in net assets resulting from operations | 552,233,355 | 752,254,661 | ||||
| Distributions to shareholders from: | ||||||
| Net realized gains: | ||||||
| Class A | (417,947,469 | ) | (308,312,450 | ) | ||
| Class C | (89,717,291 | ) | (59,893,715 | ) | ||
| Class R | (17,750,873 | ) | (10,409,543 | ) | ||
| Class R6 | (31,845,395 | ) | (13,191,566 | ) | ||
| Advisor Class | (113,021,649 | ) | (87,681,400 | ) | ||
| Total distributions to shareholders | (670,282,677 | ) | (479,488,674 | ) | ||
| Capital share transactions: (Note 2) | ||||||
| Class A | 230,068,449 | (158,638,312 | ) | |||
| Class C | 73,872,191 | 44,837,913 | ||||
| Class R | 14,705,787 | 17,358,312 | ||||
| Class R6 | 53,747,705 | 157,466,945 | ||||
| Advisor Class | 72,116,723 | (342,862,855 | ) | |||
| Total capital share transactions | 444,510,855 | (281,837,997 | ) | |||
| Net increase (decrease) in net assets | 326,461,533 | (9,072,010 | ) | |||
| Net assets: | ||||||
| Beginning of year | 3,669,871,130 | 3,678,943,140 | ||||
| End of year | $ | 3,996,332,663 | $ | 3,669,871,130 | ||
| Undistributed net investment income (loss) included in net assets: | ||||||
| End of year | $ | (4,043,161 | ) | $ | 260,343 | |
102 | Annual Report | The accompanying notes are an integral part of these financial statements. franklintempleton.com
FRANKLIN STRATEGIC SERIES
Notes to Financial Statements
1. Organization and Significant Accounting Policies
Franklin Strategic Series (Trust) is registered under the Investment Company Act of 1940, as amended, (1940 Act) as an open-end management investment company, consisting of nine separate funds, five of which are included in this report (Funds) and applies the specialized accounting and reporting guidance in U.S. Generally Accepted Accounting Principles (U.S. GAAP). The financial statements of the remaining funds in the Trust are presented separately. The Funds offer five classes of shares: Class A, Class C, Class R, Class R6, and Advisor Class. Each class of shares differs by its initial sales load, contingent deferred sales charges, voting rights on matters affecting a single class, its exchange privilege and fees primarily due to differing arrangements for distribution and transfer agent fees. Franklin Small Cap Growth Fund was closed to new investors with limited exceptions effective at the close of market February 12, 2015.
The following summarizes the Funds’ significant accounting policies.
a. Financial Instrument Valuation
The Funds’ investments in financial instruments are carried at fair value daily. Fair value is the price that would be received to sell an asset or paid to transfer a liability in an orderly transaction between market participants on the measurement date. The Funds’ calculate the net asset value (NAV) per share at the close of the New York Stock Exchange (NYSE), generally at 4 p.m. Eastern time (NYSE close) on each day the NYSE is open for trading. Under compliance policies and procedures approved by the Trust’s Board of Trustees (the Board), the Funds’ administrator has responsibility for oversight of valuation, including leading the cross-functional Valuation and Liquidity Oversight Committee (VLOC). The VLOC provides administration and oversight of the Funds’ valuation policies and procedures, which are approved annually by the Board. Among other things, these procedures allow the Funds to utilize independent pricing services, quotations from securities and financial instrument dealers, and other market sources to determine fair value.
Equity securities listed on an exchange or on the NASDAQ National Market System are valued at the last quoted sale price or the official closing price of the day respectively. Foreign equity securities are valued as of the close of trading on the foreign stock exchange on which the security is primarily traded or as of the NYSE close, whichever is earlier. The value is then converted into its U.S. dollar equivalent at the foreign exchange rate in effect at the NYSE close on the day that the value of the security is determined. Over-the-counter (OTC) securities are valued within the range of the most recent quoted bid and ask prices. Securities that trade in multiple markets or on multiple exchanges are valued according to the broadest and most representative market. Certain equity securities are valued based upon fundamental characteristics or relationships to similar securities. Investments in open-end mutual funds are valued at the closing NAV.
The Funds have procedures to determine the fair value of financial instruments for which market prices are not reliable or readily available. Under these procedures, the VLOC convenes on a regular basis to review such financial instruments and considers a number of factors, including significant unobservable valuation inputs, when arriving at fair value. The VLOC primarily employs a market-based approach which may use related or comparable assets or liabilities, recent transactions, market multiples, book values, and other relevant information for the investment to determine the fair value of the investment. An income-based valuation approach may also be used in which the anticipated future cash flows of the investment are discounted to calculate fair value. Discounts may also be applied due to the nature or duration of any restrictions on the disposition of the investments. Due to the inherent uncertainty of valuations of such investments, the fair values may differ significantly from the values that would have been used had an active market existed. The VLOC employs various methods for calibrating these valuation approaches including a regular review of key inputs and assumptions, transactional back-testing or disposition analysis, and reviews of any related market activity.
Trading in securities on foreign securities stock exchanges and OTC markets may be completed before the daily NYSE close. In addition, trading in certain foreign markets may not take place on every NYSE business day. Occasionally, events occur between the time at which trading in a foreign security is completed and the close of the NYSE that might call into question the reliability of the value of a portfolio security held by the fund. As a result, differences may arise between the value of the Funds’ portfolio securities as determined at the foreign market close and the latest indications of value at the close of the NYSE. In order to minimize the potential for these differences, the VLOC monitors price movements following the close of trading in foreign stock markets through a series of country specific market proxies (such as baskets of American Depositary Receipts, futures contracts and exchange traded
franklintempleton.com Annual Report | 103
FRANKLIN STRATEGIC SERIES
NOTES TO FINANCIAL STATEMENTS
1. Organization and Significant Accounting
Policies (continued)
a. Financial Instrument Valuation (continued)
funds). These price movements are measured against established trigger thresholds for each specific market proxy to assist in determining if an event has occurred that may call into question the reliability of the values of the foreign securities held by the Funds. If such an event occurs, the securities may be valued using fair value procedures, which may include the use of independent pricing services.
When the last day of the reporting period is a non-business day, certain foreign markets may be open on those days that the NYSE is closed, which could result in differences between the value of the Funds’ portfolio securities on the last business day and the last calendar day of the reporting period. Any significant security valuation changes due to an open foreign market are adjusted and reflected by the Funds for financial reporting purposes.
b. Foreign Currency Translation
Portfolio securities and other assets and liabilities denominated in foreign currencies are translated into U.S. dollars based on the exchange rate of such currencies against U.S. dollars on the date of valuation. The Funds may enter into foreign currency exchange contracts to facilitate transactions denominated in a foreign currency. Purchases and sales of securities, income and expense items denominated in foreign currencies are translated into U.S. dollars at the exchange rate in effect on the transaction date. Portfolio securities and assets and liabilities denominated in foreign currencies contain risks that those currencies will decline in value relative to the U.S. dollar. Occasionally, events may impact the availability or reliability of foreign exchange rates used to convert the U.S. dollar equivalent value. If such an event occurs, the foreign exchange rate will be valued at fair value using procedures established and approved by the Board.
The Funds do not separately report the effect of changes in foreign exchange rates from changes in market prices on securities held. Such changes are included in net realized and unrealized gain or loss from investments in the Statements of Operations.
Realized foreign exchange gains or losses arise from sales of foreign currencies, currency gains or losses realized between the trade and settlement dates on securities transactions and the difference between the recorded amounts of dividends, interest, and foreign withholding taxes and the U.S. dollar equivalent of the amounts actually received or paid. Net unrealized foreign exchange gains and losses arise from changes in foreign exchange rates on foreign denominated assets and liabilities other than investments in securities held at the end of the reporting period.
c. Securities Lending
Certain funds participate in an agency based securities lending program to earn additional income. The fund receives cash collateral against the loaned securities in an amount equal to at least 102% of the fair value of the loaned securities. Collateral is maintained over the life of the loan in an amount not less than 100% of the fair value of loaned securities, as determined at the close of fund business each day; any additional collateral required due to changes in security values is delivered to the fund on the next business day. The collateral is deposited into a joint cash account with other funds and is used to invest in a money market fund managed by Franklin Advisers, Inc., an affiliate of the funds. The total cash collateral received at year end was $11,905,000, $221,392,317 and $48,801,675 for Franklin Flex Cap Growth Fund, Franklin Small Cap Growth Fund and Franklin Small-Mid Cap Growth Fund, respectively of which $1,421,425 and $190,650 was uninvested cash included in due from custodian in the Statements of Assets and Liabilities for Franklin Small Cap Growth Fund and Franklin Small-Mid Cap Growth Fund, respectively. The fund may receive income from the investment of cash collateral, in addition to lending fees and rebates paid by the borrower. Income from securities loaned is reported separately in the Statements of Operations. The fund bears the market risk with respect to the collateral investment, securities loaned, and the risk that the agent may default on its obligations to the fund. If the borrower defaults on its obligation to return the securities loaned, the fund has the right to repurchase the securities in the open market using the collateral received. The securities lending agent has agreed to indemnify the fund in the event of default by a third party borrower.
d. Income and Deferred Taxes
It is each fund’s policy to qualify as a regulated investment company under the Internal Revenue Code. Each fund intends to distribute to shareholders substantially all of its taxable income and net realized gains to relieve it from federal income and excise taxes. As a result, no provision for U.S. federal income taxes is required.
104 | Annual Report franklintempleton.com
FRANKLIN STRATEGIC SERIES
NOTES TO FINANCIAL STATEMENTS
The Funds may be subject to foreign taxation related to income received, capital gains on the sale of securities and certain foreign currency transactions in the foreign jurisdictions in which it invests. Foreign taxes, if any, are recorded based on the tax regulations and rates that exist in the foreign markets in which the Funds invest. When a capital gain tax is determined to apply, the Funds record an estimated deferred tax liability in an amount that would be payable if the securities were disposed of on the valuation date.
Each fund recognizes the tax benefits of uncertain tax positions only when the position is “more likely than not” to be sustained upon examination by the tax authorities based on the technical merits of the tax position. As of April 30, 2015, and for all open tax years, each fund has determined that no liability for unrecognized tax benefits is required in each fund’s financial statements related to uncertain tax positions taken on a tax return (or expected to be taken on future tax returns). Open tax years are those that remain subject to examination and are based on each tax jurisdiction’s statute of limitation.
e. Security Transactions, Investment Income, Expenses and Distributions
Security transactions are accounted for on trade date. Realized gains and losses on security transactions are determined on a specific identification basis. Estimated expenses are accrued daily. Dividend income is recorded on the ex-dividend date except for certain dividends from foreign securities where the dividend rate is not available. In such cases, the dividend is recorded as soon as the information is received by the Funds. Distributions to shareholders are recorded on the ex-dividend date and are determined according to income tax regulations (tax basis). Distributable earnings determined on a tax basis may differ from earnings recorded in accordance with U.S. GAAP. These differences may be permanent or temporary. Permanent differences are reclassified among capital accounts to reflect their tax character. These reclassifications have no impact on net assets or the results of operations. Temporary differences are not reclassified, as they may reverse in subsequent periods.
Common expenses incurred by the Trust are allocated among the Funds based on the ratio of net assets of each fund to the combined net assets of the Trust. Fund specific expenses are charged directly to the fund that incurred the expense.
Realized and unrealized gains and losses and net investment income, not including class specific expenses, are allocated daily to each class of shares based upon the relative proportion of net assets of each class. Differences in per share distributions, by class, are generally due to differences in class specific expenses.
f. Accounting Estimates
The preparation of financial statements in accordance with U.S. GAAP requires management to make estimates and assumptions that affect the reported amounts of assets and liabilities at the date of the financial statements and the amounts of income and expenses during the reporting period. Actual results could differ from those estimates.
g. Guarantees and Indemnifications
Under the Trust’s organizational documents, its officers and trustees are indemnified by the Trust against certain liabilities arising out of the performance of their duties to the Trust. Additionally, in the normal course of business, the Trust, on behalf of the Funds, enters into contracts with service providers that contain general indemnification clauses. The Trust’s maximum exposure under these arrangements is unknown as this would involve future claims that may be made against the Trust that have not yet occurred. Currently, the Trust expects the risk of loss to be remote.
franklintempleton.com Annual Report | 105
FRANKLIN STRATEGIC SERIES
NOTES TO FINANCIAL STATEMENTS
2. Shares of Beneficial Interest
At April 30, 2015, there were an unlimited number of shares authorized (without par value). Transactions in the Funds’ shares were as follows:
| Franklin | Franklin Focused Core | |||||||||||
| Flex Cap Growth Fund | Equity Fund | |||||||||||
| Shares | Amount | Shares | Amount | |||||||||
| Class A Shares: | ||||||||||||
| Year ended April 30, 2015 | ||||||||||||
| Shares sold | 5,829,133 | $ | 313,652,976 | 4,330,719 | $ | 62,326,695 | ||||||
| Shares issued in reinvestment of distributions | 6,536,512 | 313,687,386 | 108,790 | 1,506,743 | ||||||||
| Shares redeemed | (9,069,735 | ) | (490,864,336 | ) | (1,402,021 | ) | (20,080,345 | ) | ||||
| Net increase (decrease) | 3,295,910 | $ | 136,476,026 | 3,037,488 | $ | 43,753,093 | ||||||
| Year ended April 30, 2014 | ||||||||||||
| Shares sold | 6,700,704 | $ | 375,096,611 | 2,207,069 | $ | 26,644,238 | ||||||
| Shares issued in reinvestment of distributions | 5,171,210 | 276,039,156 | 43,741 | 534,953 | ||||||||
| Shares redeemed | (12,236,062 | ) | (691,922,908 | ) | (1,023,326 | ) | (12,332,405 | ) | ||||
| Net increase (decrease) | (364,148 | ) | $ | (40,787,141 | ) | 1,227,484 | $ | 14,846,786 | ||||
| Class C Shares: | ||||||||||||
| Year ended April 30, 2015 | ||||||||||||
| Shares sold | 806,709 | $ | 37,072,619 | 917,755 | $ | 12,810,782 | ||||||
| Shares issued in reinvestment of distributions | 1,554,274 | 62,512,881 | 21,304 | 285,046 | ||||||||
| Shares redeemed | (1,363,573 | ) | (62,644,850 | ) | (178,945 | ) | (2,516,003 | ) | ||||
| Net increase (decrease) | 997,410 | $ | 36,940,650 | 760,114 | $ | 10,579,825 | ||||||
| Year ended April 30, 2014 | ||||||||||||
| Shares sold | 893,299 | $ | 44,126,041 | 351,843 | $ | 4,174,110 | ||||||
| Shares issued in reinvestment of distributions | 1,140,917 | 52,995,741 | 5,240 | 62,354 | ||||||||
| Shares redeemed | (1,121,933 | ) | (55,191,231 | ) | (85,283 | ) | (1,033,469 | ) | ||||
| Net increase (decrease) | 912,283 | $ | 41,930,551 | 271,800 | $ | 3,202,995 | ||||||
| Class R Shares: | ||||||||||||
| Year ended April 30, 2015 | ||||||||||||
| Shares sold | 112,069 | $ | 5,883,467 | 4,453 | $ | 63,598 | ||||||
| Shares issued in reinvestment of distributions | 178,575 | 8,187,653 | 283 | 3,890 | ||||||||
| Shares redeemed | (453,418 | ) | (23,503,689 | ) | (2,901 | ) | (42,078 | ) | ||||
| Net increase (decrease) | (162,774 | ) | $ | (9,432,569 | ) | 1,835 | $ | 25,410 | ||||
| Year ended April 30, 2014 | ||||||||||||
| Shares sold | 165,427 | $ | 9,014,678 | 1,978 | $ | 24,090 | ||||||
| Shares issued in reinvestment of distributions | 178,238 | 9,181,050 | 125 | 1,519 | ||||||||
| Shares redeemed | (530,379 | ) | (28,407,321 | ) | (5 | ) | (65 | ) | ||||
| Net increase (decrease) | (186,714 | ) | $ | (10,211,593 | ) | 2,098 | $ | 25,544 | ||||
| Class R6 Shares: | ||||||||||||
| Year ended April 30, 2015 | ||||||||||||
| Shares sold | 208,100 | $ | 11,229,853 | 1,731,134 | $ | 25,050,510 | ||||||
| Shares issued in reinvestment of distributions | 1,074,806 | 53,600,581 | 37,238 | 520,591 | ||||||||
| Shares redeemed | (2,551,233 | ) | (134,602,975 | ) | (104,481 | ) | (1,556,175 | ) | ||||
| Net increase (decrease) | (1,268,327 | ) | $ | (69,772,541 | ) | 1,663,891 | $ | 24,014,926 | ||||
| Year ended April 30, 2014a | ||||||||||||
| Shares soldb | 6,538,546 | $ | 339,702,428 | 1,049 | $ | 12,502 | ||||||
| Shares issued in reinvestment of distributions | 910,764 | 49,991,855 | — | — | ||||||||
| Shares redeemed | (668,994 | ) | (38,316,580 | ) | — | — | ||||||
| Net increase (decrease) | 6,780,316 | $ | 351,377,703 | 1,049 | $ | 12,502 | ||||||
106 | Annual Report franklintempleton.com
FRANKLIN STRATEGIC SERIES
NOTES TO FINANCIAL STATEMENTS
| Franklin | Franklin Focused Core | |||||||||||
| Flex Cap Growth Fund | Equity Fund | |||||||||||
| Shares | Amount | Shares | Amount | |||||||||
| Advisor Class Shares: | ||||||||||||
| Year ended April 30, 2015 | ||||||||||||
| Shares sold | 1,687,564 | $ | 95,480,580 | 187,731 | $ | 2,722,580 | ||||||
| Shares issued in reinvestment of distributions | 1,215,776 | 60,351,143 | 10,555 | 147,563 | ||||||||
| Shares redeemed | (1,474,007 | ) | (80,771,647 | ) | (74,691 | ) | (1,085,738 | ) | ||||
| Net increase (decrease) | 1,429,333 | $ | 75,060,076 | 123,595 | $ | 1,784,405 | ||||||
| Year ended April 30, 2014 | ||||||||||||
| Shares sold | 1,105,318 | $ | 63,767,861 | 151,580 | $ | 1,862,457 | ||||||
| Shares issued in reinvestment of distributions | 941,204 | 51,568,568 | 7,778 | 95,825 | ||||||||
| Shares redeemedb | (12,088,944 | ) | (672,980,229 | ) | (47,289 | ) | (577,132 | ) | ||||
| Net increase (decrease) | (10,042,422 | ) | $ | (557,643,800 | ) | 112,069 | $ | 1,381,150 | ||||
| Franklin Growth | Franklin | |||||||||||
| Opportunities Fund | Small Cap Growth Fund | |||||||||||
| Shares | Amount | Shares | Amount | |||||||||
| Class A Shares: | ||||||||||||
| Year ended April 30, 2015 | ||||||||||||
| Shares sold | 4,284,487 | $ | 135,816,417 | 35,113,831 | $ | 646,367,733 | ||||||
| Shares issued in reinvestment of distributions | 260,551 | 7,871,257 | 2,517,935 | 43,107,019 | ||||||||
| Shares redeemed | (2,999,072 | ) | (92,540,492 | ) | (22,575,043 | ) | (415,873,289 | ) | ||||
| Net increase (decrease) | 1,545,966 | $ | 51,147,182 | 15,056,723 | $ | 273,601,463 | ||||||
| Year ended April 30, 2014 | ||||||||||||
| Shares sold | 5,335,483 | $ | 149,644,541 | 32,871,636 | $ | 580,436,703 | ||||||
| Shares issued in reinvestment of distributions | 259,497 | 7,351,542 | 1,287,541 | 22,969,714 | ||||||||
| Shares redeemed | (2,121,489 | ) | (59,172,567 | ) | (10,393,514 | ) | (184,659,664 | ) | ||||
| Net increase (decrease) | 3,473,491 | $ | 97,823,516 | 23,765,663 | $ | 418,746,753 | ||||||
| Class C Shares: | ||||||||||||
| Year ended April 30, 2015 | ||||||||||||
| Shares sold | 938,449 | $ | 26,354,628 | 4,518,973 | $ | 72,788,301 | ||||||
| Shares issued in reinvestment of distributions | 80,384 | 2,151,087 | 643,984 | 9,601,848 | ||||||||
| Shares redeemed | (623,578 | ) | (17,302,538 | ) | (3,082,359 | ) | (49,702,083 | ) | ||||
| Net increase (decrease) | 395,255 | $ | 11,203,177 | 2,080,598 | $ | 32,688,066 | ||||||
| Year ended April 30, 2014 | ||||||||||||
| Shares sold | 1,424,840 | $ | 35,757,550 | 6,739,782 | $ | 105,854,080 | ||||||
| Shares issued in reinvestment of distributions | 78,027 | 1,977,203 | 347,196 | 5,468,331 | ||||||||
| Shares redeemed | (485,128 | ) | (12,026,066 | ) | (1,517,438 | ) | (23,740,085 | ) | ||||
| Net increase (decrease) | 1,017,739 | $ | 25,708,687 | 5,569,540 | $ | 87,582,326 | ||||||
| Class R Shares: | ||||||||||||
| Year ended April 30, 2015 | ||||||||||||
| Shares sold | 362,355 | $ | 10,891,578 | 3,379,988 | $ | 60,467,102 | ||||||
| Shares issued in reinvestment of distributions | 35,413 | 1,037,235 | 205,380 | 3,384,666 | ||||||||
| Shares redeemed | (446,651 | ) | (13,519,475 | ) | (1,393,481 | ) | (25,065,499 | ) | ||||
| Net increase (decrease) | (48,883 | ) | $ | (1,590,662 | ) | 2,191,887 | $ | 38,786,269 | ||||
| Year ended April 30, 2014 | ||||||||||||
| Shares sold | 545,166 | $ | 14,740,941 | 2,300,867 | $ | 39,848,549 | ||||||
| Shares issued in reinvestment of distributions | 40,261 | 1,108,798 | 73,430 | 1,265,928 | ||||||||
| Shares redeemed | (486,471 | ) | (13,037,522 | ) | (604,595 | ) | (10,430,788 | ) | ||||
| Net increase (decrease) | 98,956 | $ | 2,812,217 | 1,769,702 | $ | 30,683,689 | ||||||
franklintempleton.com Annual Report | 107
FRANKLIN STRATEGIC SERIES
NOTES TO FINANCIAL STATEMENTS
| 2. Shares of Beneficial Interest (continued) | |||||||||||
| Franklin Growth | Franklin | ||||||||||
| Opportunities Fund | Small Cap Growth Fund | ||||||||||
| Shares | Amount | Shares | Amount | ||||||||
| Class R6 Shares: | |||||||||||
| Year ended April 30, 2015 | |||||||||||
| Shares sold | 1,338,415 | $ | 43,718,352 | 40,533,757 | $ | 802,392,823 | |||||
| Shares issued in reinvestment of distributions | 103,593 | 3,308,745 | 719,645 | 13,068,756 | |||||||
| Shares redeemed | (438,062 | ) | (14,597,746 | ) | (3,648,550 | ) | (72,443,668 | ) | |||
| Net increase (decrease) | 1,003,946 | $ | 32,429,351 | 37,604,852 | $ | 743,017,911 | |||||
| Year ended April 30, 2014a | |||||||||||
| Shares soldb | 6,199,116 | $ | 165,959,115 | 4,726,169 | $ | 80,264,676 | |||||
| Shares issued in reinvestment of distributions | 103,960 | 3,094,887 | 104,015 | 1,954,443 | |||||||
| Shares redeemed | (270,888 | ) | (8,162,282 | ) | (260,302 | ) | (5,083,508 | ) | |||
| Net increase (decrease) | 6,032,188 | $ | 160,891,720 | 4,569,882 | $ | 77,135,611 | |||||
| Advisor Class Shares: | |||||||||||
| Year ended April 30, 2015 | |||||||||||
| Shares sold | 1,172,189 | $ | 38,291,441 | 44,799,317 | $ | 871,011,128 | |||||
| Shares issued in reinvestment of distributions | 156,179 | 4,972,740 | 1,598,050 | 28,940,693 | |||||||
| Shares redeemed | (1,108,533 | ) | (36,930,756 | ) | (14,643,992 | ) | (285,474,751 | ) | |||
| Net increase (decrease) | 219,835 | $ | 6,333,425 | 31,753,375 | $ | 614,477,070 | |||||
| Year ended April 30, 2014 | |||||||||||
| Shares sold | 6,718,925 | $ | 202,105,098 | 21,984,752 | $ | 414,137,550 | |||||
| Shares issued in reinvestment of distributions | 187,091 | 5,564,089 | 373,668 | 7,013,753 | |||||||
| Shares redeemedb | (6,601,759 | ) | (177,646,244 | ) | (6,203,491 | ) | (112,715,829 | ) | |||
| Net increase (decrease) | 304,257 | $ | 30,022,943 | 16,154,929 | $ | 308,435,474 | |||||
| Franklin Small-Mid Cap | ||||||
| Growth Fund | ||||||
| Shares | Amount | |||||
| Class A Shares: | ||||||
| Year ended April 30, 2015 | ||||||
| Shares sold | 9,606,826 | $ | 377,655,732 | |||
| Shares issued in reinvestment of distributions | 10,740,727 | 372,273,602 | ||||
| Shares redeemed | (12,948,880 | ) | (519,860,885 | ) | ||
| Net increase (decrease) | 7,398,673 | $ | 230,068,449 | |||
| Year ended April 30, 2014 | ||||||
| Shares sold | 8,518,651 | $ | 352,913,687 | |||
| Shares issued in reinvestment of distributions | 7,034,330 | 277,011,793 | ||||
| Shares redeemed | (18,857,338 | ) | (788,563,792 | ) | ||
| Net increase (decrease) | (3,304,357 | ) | $ | (158,638,312 | ) | |
| Class C Shares: | ||||||
| Year ended April 30, 2015 | ||||||
| Shares sold | 1,922,933 | $ | 61,150,043 | |||
| Shares issued in reinvestment of distributions | 3,007,899 | 82,897,682 | ||||
| Shares redeemed | (2,173,499 | ) | (70,175,534 | ) | ||
| Net increase (decrease) | 2,757,333 | $ | 73,872,191 | |||
| Year ended April 30, 2014 | ||||||
| Shares sold | 1,311,930 | $ | 46,282,012 | |||
| Shares issued in reinvestment of distributions | 1,665,263 | 54,953,680 | ||||
| Shares redeemed | (1,603,672 | ) | (56,397,779 | ) | ||
| Net increase (decrease) | 1,373,521 | $ | 44,837,913 | |||
108 | Annual Report franklintempleton.com
FRANKLIN STRATEGIC SERIES
NOTES TO FINANCIAL STATEMENTS
| Franklin Small-Mid Cap | ||||||
| Growth Fund | ||||||
| Shares | Amount | |||||
| Class R Shares: | ||||||
| Year ended April 30, 2015 | ||||||
| Shares sold | 929,258 | $ | 35,571,744 | |||
| Shares issued in reinvestment of distributions | 531,661 | 17,385,302 | ||||
| Shares redeemed | (1,016,736 | ) | (38,251,259 | ) | ||
| Net increase (decrease) | 444,183 | $ | 14,705,787 | |||
| Year ended April 30, 2014 | ||||||
| Shares sold | 827,089 | $ | 33,172,661 | |||
| Shares issued in reinvestment of distributions | 273,999 | 10,316,051 | ||||
| Shares redeemed | (661,910 | ) | (26,130,400 | ) | ||
| Net increase (decrease) | 439,178 | $ | 17,358,312 | |||
| Class R6 Shares: | ||||||
| Year ended April 30, 2015 | ||||||
| Shares sold | 1,395,483 | $ | 59,630,680 | |||
| Shares issued in reinvestment of distributions | 675,017 | 24,968,887 | ||||
| Shares redeemed | (732,222 | ) | (30,851,862 | ) | ||
| Net increase (decrease) | 1,338,278 | $ | 53,747,705 | |||
| Year ended April 30, 2014a | ||||||
| Shares sold | 3,770,614 | $ | 161,755,908 | |||
| Shares issued in reinvestment of distributions | 318,927 | 13,190,824 | ||||
| Shares redeemed | (394,411 | ) | (17,479,787 | ) | ||
| Net increase (decrease) | 3,695,130 | $ | 157,466,945 | |||
| Advisor Class Shares: | ||||||
| Year ended April 30, 2015 | ||||||
| Shares sold | 2,813,541 | $ | 118,449,511 | |||
| Shares issued in reinvestment of distributions | 2,768,890 | 101,978,223 | ||||
| Shares redeemed | (3,553,308 | ) | (148,311,011 | ) | ||
| Net increase (decrease) | 2,029,123 | $ | 72,116,723 | |||
| Year ended April 30, 2014 | ||||||
| Shares sold | 3,625,676 | $ | 157,249,867 | |||
| Shares issued in reinvestment of distributions | 1,961,538 | 81,031,144 | ||||
| Shares redeemed | (13,258,411 | ) | (581,143,866 | ) | ||
| Net increase (decrease) | (7,671,197 | ) | $ | (342,862,855 | ) | |
aFor the year May 1, 2013 (effective date) to April 30, 2014.
bEffective May 1, 2013, a portion of Advisor Class shares were exchanged into Class R6 for Franklin Flex Cap Growth Fund, Franklin Growth Opportunities Fund, and
Franklin Small Cap Growth Fund.
3. Transactions with Affiliates
Franklin Resources, Inc. is the holding company for various subsidiaries that together are referred to as Franklin Templeton Investments. Certain officers and trustees of the Trust are also officers and/or directors of the following subsidiaries:
| Subsidiary | Affiliation |
| Franklin Advisers, Inc. (Advisers) | Investment manager |
| Franklin Templeton Services, LLC (FT Services) | Administrative manager |
| Franklin Templeton Distributors, Inc. (Distributors) | Principal underwriter |
| Franklin Templeton Investor Services, LLC (Investor Services) | Transfer agent |
franklintempleton.com Annual Report | 109
FRANKLIN STRATEGIC SERIES
NOTES TO FINANCIAL STATEMENTS
3. Transactions with Affiliates (continued)
a. Management Fees
Franklin Flex Cap Growth Fund and Franklin Small-Mid Cap Growth Fund pay an investment management fee to Advisers based on the average daily net assets of each of the funds as follows:
| Annualized Fee Rate | Net Assets | |
| 0.625 | % | Up to and including $100 million |
| 0.500 | % | Over $100 million, up to and including $250 million |
| 0.450 | % | Over $250 million, up to and including $7.5 billion |
| 0.440 | % | Over $7.5 billion, up to and including $10 billion |
| 0.430 | % | Over $10 billion, up to and including $12.5 billion |
| 0.420 | % | Over $12.5 billion, up to and including $15 billion |
| 0.400 | % | In excess of $15 billion |
Franklin Focused Core Equity Fund pays an investment management fee to Advisers based on the average daily net assets of the fund as follows:
| Annualized Fee Rate | Net Assets | |
| 0.950 | % | Up to and including $500 million |
| 0.850 | % | Over $500 million, up to and including $1 billion |
| 0.800 | % | Over $1 billion, up to and including $1.5 billion |
| 0.750 | % | Over $1.5 billion, up to and including $6.5 billion |
| 0.725 | % | Over $6.5 billion, up to and including $11.5 billion |
| 0.700 | % | Over $11.5 billion, up to and including $16.5 billion |
| 0.690 | % | Over $16.5 billion, up to and including $19 billion |
| 0.680 | % | Over $19 billion, up to and including $21.5 billion |
| 0.670 | % | In excess of $21.5 billion |
Franklin Growth Opportunities Fund pays an investment management fee to Advisers based on the average daily net assets of the fund as follows:
| Annualized Fee Rate | Net Assets | |
| 0.700 | % | Up to and including $500 million |
| 0.600 | % | Over $500 million, up to and including $1 billion |
| 0.550 | % | Over $1 billion, up to and including $1.5 billion |
| 0.500 | % | Over $1.5 billion, up to and including $6.5 billion |
| 0.475 | % | Over $6.5 billion, up to and including $11.5 billion |
| 0.450 | % | Over $11.5 billion, up to and including $16.5 billion |
| 0.440 | % | Over $16.5 billion, up to and including $19 billion |
| 0.430 | % | Over $19 billion, up to and including $21.5 billion |
| 0.420 | % | In excess of $21.5 billion |
110 | Annual Report
franklintempleton.com
FRANKLIN STRATEGIC SERIES
NOTES TO FINANCIAL STATEMENTS
Franklin Small Cap Growth Fund pays an investment management fee to Advisers based on the average daily net assets of the fund as follows:
| Annualized Fee Rate | Net Assets | |
| 0.750 | % | Up to and including $500 million |
| 0.650 | % | Over $500 million, up to and including $1 billion |
| 0.600 | % | Over $1 billion, up to and including $1.5 billion |
| 0.550 | % | Over $1.5 billion, up to and including $6.5 billion |
| 0.525 | % | Over $6.5 billion, up to and including $11.5 billion |
| 0.500 | % | Over $11.5 billion, up to and including $16.5 billion |
| 0.490 | % | Over $16.5 billion, up to and including $19 billion |
| 0.480 | % | Over $19 billion, up to and including $21.5 billion |
| 0.470 | % | In excess of $21.5 billion |
b. Administrative Fees
Under an agreement with Advisers, FT Services provides administrative services to the Funds. The fee is paid by Advisers based on each of the Funds’ average daily net assets, and is not an additional expense of the Funds.
c. Distribution Fees
The Board has adopted distribution plans for each share class, with the exception of Class R6 and Advisor Class shares, pursuant to Rule 12b-1 under the 1940 Act. Distribution fees are not charged on shares held by affiliates. Under the Funds’ Class A reimbursement distribution plans, the Funds reimburse Distributors for costs incurred in connection with the servicing, sale and distribution of each fund’s shares up to the maximum annual plan rate. Under the Class A reimbursement distribution plans, costs exceeding the maximum for the current plan year cannot be reimbursed in subsequent periods. In addition, under the Funds’ Class C and R compensation distribution plans, the Funds pay Distributors for costs incurred in connection with the servicing, sale and distribution of each fund’s shares up to the maximum annual plan rate for each class. The plan year, for purposes of monitoring compliance with the maximum annual plan rates, is February 1 through January 31 for each fund.
The maximum annual plan rates, based on the average daily net assets, for each class, are as follows:
| Franklin | ||||||||||
| Franklin | Franklin | Growth | Franklin | Franklin | ||||||
| Flex Cap | Focused Core | Opportunities | Small Cap | Small-Mid Cap | ||||||
| Growth Fund | Equity Fund | Fund | Growth Fund | Growth Fund | ||||||
| Reimbursement Plans: | ||||||||||
| Class A | 0.25 | % | 0.35 | % | 0.35 | % | 0.35 | % | 0.25 | % |
| Compensation Plans: | ||||||||||
| Class C | 1.00 | % | 1.00 | % | 1.00 | % | 1.00 | % | 1.00 | % |
| Class R | 0.50 | % | 0.50 | % | 0.50 | % | 0.50 | % | 0.50 | % |
The Board has set the current rate at 0.30% per year for Class A shares for Franklin Focused Core Equity Fund, Franklin Growth Opportunities Fund and Franklin Small Cap Growth Fund until further notice and approval by the Board.
franklintempleton.com
Annual Report
| 111
FRANKLIN STRATEGIC SERIES
NOTES TO FINANCIAL STATEMENTS
3. Transactions with Affiliates (continued)
d. Sales Charges/Underwriting Agreements
Front-end sales charges and contingent deferred sales charges (CDSC) do not represent expenses of the Funds. These charges are deducted from the proceeds of sales of fund shares prior to investment or from redemption proceeds prior to remittance, as applicable. Distributors has advised the Funds of the following commission transactions related to the sales and redemptions of the Funds’ shares for the year:
| Franklin | ||||||||||
| Franklin | Franklin | Growth | Franklin | Franklin | ||||||
| Flex Cap | Focused Core | Opportunities | Small Cap | Small-Mid Cap | ||||||
| Growth Fund | Equity Fund | Fund | Growth Fund | Growth Fund | ||||||
| Sales charges retained net of commissions | ||||||||||
| paid to unaffiliated broker/dealers | $ | 879,132 | $ | 94,244 | $ | 331,324 | $ | 509,073 | $ | 466,920 |
| CDSC retained | $ | 33,129 | $ | 4,071 | $ | 26,943 | $ | 93,517 | $ | 15,146 |
e. Transfer Agent Fees
Each class of shares, except for Class R6, pays transfer agent fees to Investor Services for its performance of shareholder servicing obligations and reimburses Investor Services for out of pocket expenses incurred, including shareholding servicing fees paid to third parties. These fees are allocated daily based upon their relative proportion of such classes’ aggregate net assets. Class R6 pays Investor Services transfer agent fees specific to that class.
For the year ended April 30, 2015, the Funds paid transfer agent fees as noted in the Statements of Operations of which the following amounts were retained by Investor Services:
| Franklin | ||||||||||
| Franklin | Franklin | Growth | Franklin | Franklin | ||||||
| Flex Cap | Focused Core | Opportunities | Small Cap | Small-Mid Cap | ||||||
| Growth Fund | Equity Fund | Fund | Growth Fund | Growth Fund | ||||||
| Transfer agent fees | $ | 3,343,137 | $ | 61,382 | $ | 876,693 | $ | 1,776,204 | $ | 3,833,393 |
f. Investments in Institutional Fiduciary Trust Money Market Portfolio
The Funds invest in Institutional Fiduciary Trust Money Market Portfolio (Sweep Money Fund), an affiliated open-end management investment company. Management fees paid by the Funds are waived on assets invested in the Sweep Money Fund, as noted in the Statements of Operations, in an amount not to exceed the management and administrative fees paid directly or indirectly by the Sweep Money Fund. Prior to May 1, 2013, the waiver was accounted for as a reduction to management fees.
g. Waiver and Expense Reimbursements
Advisers and Investor Services have contractually agreed in advance to waive or limit their respective fees and to assume as their own expense certain expenses otherwise payable by Franklin Focused Core Equity Fund so that the expenses (excluding distribution fees, and acquired fund fees and expenses) for Class A, Class C, Class R and Advisor Class do not exceed 1.00% and Class R6 does not exceed 0.85% based on the average net assets of each class (other than certain non-routine expenses or costs, including those relating to litigation, indemnification, reorganizations, and liquidations) until August 31, 2015.
Additionally, Investor Services has contractually agreed in advance to waive or limit its fees so that the Class R6 transfer agent fees for the Funds, except Franklin Focused Core Equity Fund, do not exceed 0.01% until August 31, 2015. There were no Class R6 transfer agent fees waived during the year ended April 30, 2015.
112 | Annual Report
franklintempleton.com
FRANKLIN STRATEGIC SERIES
NOTES TO FINANCIAL STATEMENTS
h. Other Affiliated Transactions
At April 30, 2015, one or more of the funds in Franklin Fund Allocator Series owned a percentage of the following funds’ outstanding shares:
| Franklin | Franklin | Franklin Growth | Franklin | ||||
| Flex Cap | Focused Core | Opportunities | Small Cap | ||||
| Growth Fund | Equity Fund | Fund | Growth Fund | ||||
| 7.96 | % | 16.30 | % | 15.53 | % | 1.89 | % |
4. Expense Offset Arrangement
The Funds have entered into an arrangement with their custodian whereby credits realized as a result of uninvested cash balances are used to reduce a portion of the Funds’ custodian expenses. During the year ended April 30, 2015, the custodian fees were reduced as noted in the Statements of Operations.
5. Income Taxes
For tax purposes, the Funds may elect to defer any portion of a post-October capital loss or late-year ordinary loss to the first day of the following fiscal year. At April 30, 2015, the deferred post-October capital losses and late-year ordinary losses were as follows:
| Franklin | ||||||||
| Franklin | Franklin | Growth | Franklin | |||||
| Flex Cap | Focused Core | Opportunities | Small-Mid Cap | |||||
| Growth Fund | Equity Fund | Fund | Growth Fund | |||||
| Realized capital losses | $ | — | $ | — | $ | — | $ | 6,952,601 |
| Late-year ordinary losses | $ | 6,551,185 | $ | 109,546 | $ | 2,383,730 | $ | 4,043,161 |
The tax character of distributions paid during the years ended April 30, 2015 and 2014, was as follows:
| Franklin Flex Cap | Franklin Focused Core | Franklin Growth | ||||||||||||
| Growth Fund | Equity Fund | Opportunities Fund | ||||||||||||
| 2015 | 2014 | 2015 | 2014 | 2015 | 2014 | |||||||||
| Distributions paid from: | ||||||||||||||
| Ordinary income | $ | 47,149,148 | $ | 30,002,450 | $ | 710,996 | $ | 243,749 | $ | — | $ | — | ||
| Long term capital gain | 485,417,922 | 438,269,645 | 1,833,627 | 455,558 | 21,070,998 | 19,641,459 | ||||||||
| $ | 532,567,070 | $ | 468,272,095 | $ | 2,544,623 | $ | 699,307 | $ | 21,070,998 | $ | 19,641,459 | |||
| Franklin Small Cap | Franklin Small-Mid Cap | |||||||||||||
| Growth Fund | Growth Fund | |||||||||||||
| 2015 | 2014 | 2015 | 2014 | |||||||||||
| Distributions paid from: | ||||||||||||||
| Ordinary income | $ | 49,022,134 | $ | 9,609,487 | $ | 75,776,742 | $ | 48,006,745 | ||||||
| Long term capital gain | 58,829,248 | 32,430,474 | 594,505,935 | 431,481,929 | ||||||||||
| $ | 107,851,382 | $ | 42,039,961 | $ | 670,282,677 | $ | 479,488,674 | |||||||
franklintempleton.com
Annual Report
| 113
FRANKLIN STRATEGIC SERIES
NOTES TO FINANCIAL STATEMENTS
5. Income Taxes (continued)
At April 30, 2015, the cost of investments, net unrealized appreciation (depreciation), undistributed ordinary income and undistributed long term capital gains for income tax purposes were as follows:
| Franklin | |||||||||||||||
| Franklin | Franklin | Growth | Franklin | Franklin | |||||||||||
| Flex Cap | Focused Core | Opportunities | Small Cap | Small-Mid Cap | |||||||||||
| Growth Fund | Equity Fund | Fund | Growth Fund | Growth Fund | |||||||||||
| Cost of investments | $ | 2,135,260,472 | $ | 126,006,771 | $ | 774,019,430 | $ | 3,197,392,220 | $ | 2,758,813,513 | |||||
| Unrealized appreciation | $ | 1,105,630,734 | $ | 23,463,170 | $ | 361,587,313 | $ | 467,554,309 | $ | 1,350,114,115 | |||||
| Unrealized depreciation | (15,890,771 | ) | (1,040,314 | ) | (4,672,214 | ) | (149,724,305 | ) | (37,640,050 | ) | |||||
| Net unrealized appreciation | |||||||||||||||
| (depreciation) | $ | 1,089,739,963 | $ | 22,422,856 | $ | 356,915,099 | $ | 317,830,004 | $ | 1,312,474,065 | |||||
| Undistributed ordinary income | $ | — | $ | 1,253,355 | $ | — | $ | 31,680,861 | $ | — | |||||
| Undistributed long term capital gains | 281,574,342 | 2,143,294 | 25,275,921 | 28,081,216 | 168,855,494 | ||||||||||
| Distributable earnings | $ | 281,574,342 | $ | 3,396,649 | $ | 25,275,921 | $ | 59,762,077 | $ | 168,855,494 | |||||
Differences between income and/or capital gains as determined on a book basis and a tax basis are primarily due to differing treatments of wash sales.
6. Investment Transactions
Purchases and sales of investments (excluding short term securities) for the year ended April 30, 2015, were as follows:
| Franklin | ||||||||||
| Franklin | Franklin | Growth | Franklin | Franklin | ||||||
| Flex Cap | Focused Core | Opportunities | Small Cap | Small-Mid Cap | ||||||
| Growth Fund | Equity Fund | Fund | Growth Fund | Growth Fund | ||||||
| Purchases | $ | 2,482,722,891 | $ | 96,550,366 | $ | 446,917,405 | $ | 2,071,918,535 | $ | 1,788,043,180 |
| Sales | $ | 3,039,412,921 | $ | 24,201,046 | $ | 401,096,015 | $ | 699,431,477 | $ | 2,086,368,102 |
7. Restricted Securities
Certain funds invest in securities that are restricted under the Securities Act of 1933 (1933 Act) or which are subject to legal, contractual, or other agreed upon restrictions on resale. Restricted securities are often purchased in private placement transactions, and cannot be sold without prior registration unless the sale is pursuant to an exemption under the 1933 Act. Disposal of these securities may require greater effort and expense, and prompt sale at an acceptable price may be difficult. The Funds may have registration rights for restricted securities. The issuer generally incurs all registration costs.
At April 30, 2015, Franklin Flex Cap Growth Fund held investments in restricted securities, excluding certain securities exempt from registration under the 1933 Act deemed to be liquid, as follows:
| Acquisition | ||||||
| Shares | Issuer | Date | Cost | Value | ||
| 890,868 | FibroGen Inc. (Value is 0.59% of Net Assets) | 5/19/00 | $ | 9,999,998 | $ | 19,677,056 |
114 | Annual Report franklintempleton.com
FRANKLIN STRATEGIC SERIES
NOTES TO FINANCIAL STATEMENTS
8. Holdings of 5% Voting Securities of Portfolio Companies
The 1940 Act defines “affiliated companies” to include investments in portfolio companies in which a fund owns 5% or more of the outstanding voting securities. Investments in “affiliated companies” for Franklin Small Cap Growth Fund for the year ended April 30, 2015, were as shown below.
| Number of | Number of | |||||||||||
| Shares Held | Shares | |||||||||||
| at Beginning | Gross | Gross | Held at End | Value at | Investment | Realized | ||||||
| Name of Issuer | of Year | Additions | Reductions | of Year | End of Year | Income | Gain (Loss) | |||||
| Non-Controlled Affiliates | ||||||||||||
| Aratana Therapeutics Inc. | 1,003,436 | 1,010,083 | — | 2,013,519 | $ | 25,994,530 | $ | — | $ | — | ||
| Bazaarvoice Inc. | 2,774,300 | 1,540,600 | — | 4,314,900 | 23,214,162 | — | — | |||||
| Callidus Software Inc. | 849,800 | 2,058,100 | — | 2,907,900 | 35,912,565 | — | — | |||||
| Callon Petroleum Co. | — | 4,435,282 | — | 4,435,282 | 39,651,421 | — | — | |||||
| The KEYW Holding Corp. | 963,013 | 2,118,547 | — | 3,081,560 | 29,737,054 | — | — | |||||
| Lattice Semiconductor Corp. | 3,554,700 | 3,979,500 | (82,700 | ) | 7,451,500 | 44,187,395 | — | 183,495 | ||||
| M/I Homes Inc. | 703,300 | 577,100 | — | 1,280,400 | 28,885,824 | — | — | |||||
| Nanometrics Inc. | 955,471 | 1,476,329 | — | 2,431,800 | 37,595,628 | — | — | |||||
| Potbelly Corp. | 816,500 | 866,200 | (41,849 | ) | 1,640,851 | 24,629,174 | — | (580,813 | ) | |||
| Revance Therapeutics Inc. | — | 1,344,100 | — | 1,344,100 | 26,445,168 | — | — | |||||
| Rex Energy Corp. | 855,700 | 4,654,000 | — | 5,509,700 | 27,548,500 | — | — | |||||
| Sportsman's Warehouse Holdings | ||||||||||||
| Inc. | 808,400 | 1,548,500 | — | 2,356,900 | 22,696,947 | — | — | |||||
| Tile Shop Holdings Inc. | 1,586,800 | 1,038,900 | — | 2,625,700 | 34,055,329 | — | — | |||||
| Zoe's Kitchen Inc. | — | 1,025,400 | — | 1,025,400 | 31,408,002 | — | — | |||||
| Total Affiliated Securities (Value is 12.69% of Net Assets) | $ | 431,961,699 | $ | — | $ | (397,318 | ) | |||||
9. Credit Facility
The Funds, together with other U.S. registered and foreign investment funds (collectively, Borrowers), managed by Franklin Templeton Investments, are borrowers in a joint syndicated senior unsecured credit facility totaling $2 billion (Global Credit Facility) which matures on February 12, 2016. This Global Credit Facility provides a source of funds to the Borrowers for temporary and emergency purposes, including the ability to meet future unanticipated or unusually large redemption requests.
Under the terms of the Global Credit Facility, the Funds shall, in addition to interest charged on any borrowings made by the Funds and other costs incurred by the Funds, pay their share of fees and expenses incurred in connection with the implementation and maintenance of the Global Credit Facility, based upon their relative share of the aggregate net assets of all of the Borrowers, including an annual commitment fee of 0.07% based upon the unused portion of the Global Credit Facility. These fees are reflected in other expenses in the Statements of Operations. During the year ended April 30, 2015, the Funds did not use the Global Credit Facility.
10. Fair Value Measurements
The Trust follows a fair value hierarchy that distinguishes between market data obtained from independent sources (observable inputs) and the Trust’s own market assumptions (unobservable inputs). These inputs are used in determining the value of the Funds’ financial instruments and are summarized in the following fair value hierarchy:
- Level 1 – quoted prices in active markets for identical financial instruments
- Level 2 – other significant observable inputs (including quoted prices for similar financial instruments, interest rates, prepayment speed, credit risk, etc.)
- Level 3 – significant unobservable inputs (including the Funds’ own assumptions in determining the fair value of financial instruments)
franklintempleton.com
Annual Report
| 115
FRANKLIN STRATEGIC SERIES
NOTES TO FINANCIAL STATEMENTS
10. Fair Value Measurements (continued)
The input levels are not necessarily an indication of the risk or liquidity associated with financial instruments at that level.
For movements between the levels within the fair value hierarchy, the Funds have adopted a policy of recognizing the transfers as of the date of the underlying event which caused the movement.
A summary of inputs used as of April 30, 2015, in valuing the Funds’ assets carried at fair value, is as follows:
| Level 1 | Level 2 | Level 3 | Total | |||||
| Franklin Flex Cap Growth Fund | ||||||||
| Assets: | ||||||||
| Investments in Securities: | ||||||||
| Equity Investments: | ||||||||
| Pharmaceuticals, Biotechnology & Life Sciences | $ | 583,743,887 | $ | — | $ | 19,677,056 | $ | 603,420,943 |
| Other Equity Investmentsa | 2,529,210,895 | — | — | 2,529,210,895 | ||||
| Short Term Investments | 92,368,597 | — | — | 92,368,597 | ||||
| Total Investments in Securities | $ | 3,205,323,379 | $ | — | $ | 19,677,056 | $ | 3,225,000,435 |
| Franklin Focused Core Equity Fund | ||||||||
| Assets: | ||||||||
| Investments in Securities: | ||||||||
| Equity Investments:a | $ | 139,613,420 | $ | — | $ | — | $ | 139,613,420 |
| Short Term Investments | 8,816,207 | — | — | 8,816,207 | ||||
| Total Investments in Securities | $ | 148,429,627 | $ | — | $ | — | $ | 148,429,627 |
| Franklin Growth Opportunities Fund | ||||||||
| Assets: | ||||||||
| Investments in Securities: | ||||||||
| Equity Investments:a | $ | 1,099,805,959 | $ | — | $ | — | $ | 1,099,805,959 |
| Short Term Investments | 31,128,570 | — | — | 31,128,570 | ||||
| Total Investments in Securities | $ | 1,130,934,529 | $ | — | $ | — | $ | 1,130,934,529 |
| Franklin Small Cap Growth Fund | ||||||||
| Assets: | ||||||||
| Investments in Securities: | ||||||||
| Equity Investments:a | $ | 3,111,501,288 | $ | — | $ | — | $ | 3,111,501,288 |
| Short Term Investments | 403,720,936 | — | — | 403,720,936 | ||||
| Total Investments in Securities | $ | 3,515,222,224 | $ | — | $ | — | $ | 3,515,222,224 |
| Franklin Small-Mid Cap Growth Fund | ||||||||
| Assets: | ||||||||
| Investments in Securities: | ||||||||
| Equity Investments:a | $ | 3,880,477,753 | $ | — | $ | — | $ | 3,880,477,753 |
| Short Term Investments | 190,809,825 | — | — | 190,809,825 | ||||
| Total Investments in Securities | $ | 4,071,287,578 | $ | — | $ | — | $ | 4,071,287,578 |
aFor detailed categories, see the accompanying Statement of Investments.
A reconciliation of assets in which Level 3 inputs are used in determining fair value is presented when there are significant Level 3 financial instruments at the end of the year.
116 | Annual Report
franklintempleton.com
FRANKLIN STRATEGIC SERIES
NOTES TO FINANCIAL STATEMENTS
11. New Accounting Pronouncements
In June 2014, the Financial Accounting Standards Board issued Accounting Standards Update (ASU) No. 2014-11, Transfers and Servicing (Topic 860), Repurchase-to-Maturity Transactions, Repurchase Financings, and Disclosures. The ASU changes the accounting for certain repurchase agreements and expands disclosure requirements related to repurchase agreements, securities lending, repurchase-to-maturity and similar transactions. The ASU is effective for interim and annual reporting periods beginning after December 15, 2014. Management has reviewed the requirements and believes the adoption of this ASU will not have a material impact on the financial statements.
12. Subsequent Events
The Funds have evaluated subsequent events through the issuance of the financial statements and determined that no events have occurred that require disclosure.
| Abbreviations |
| Selected Portfolio |
| ADR American Depositary Receipt |
franklintempleton.com
Annual Report
| 117
FRANKLIN STRATEGIC SERIES
Report of Independent Registered Public Accounting Firm
To the Board of Trustees and Shareholders of Franklin Strategic Series
In our opinion, the accompanying statements of assets and liabilities, including the statements of investments, and the related statements of operations and of changes in net assets and the financial highlights present fairly, in all material respects, the financial position of Franklin Flex Cap Growth Fund, Franklin Focused Core Equity Fund, Franklin Growth Opportunities Fund, Franklin Small Cap Growth Fund, and Franklin Small-Mid Cap Growth Fund (separate portfolios of Franklin Strategic Series, hereafter referred to as the “Funds”) at April 30, 2015, the results of each of their operations for the year then ended, the changes in each of their net assets for each of the two years in the period then ended and the financial highlights for each of the periods presented, in conformity with accounting principles generally accepted in the United States of America. These financial statements and financial highlights (hereafter referred to as “financial statements”) are the responsibility of the Funds’ management. Our responsibility is to express an opinion on these financial statements based on our audits. We conducted our audits of these financial statements in accordance with the standards of the Public Company Accounting Oversight Board (United States). Those standards require that we plan and perform the audit to obtain reasonable assurance about whether the financial statements are free of material misstatement. An audit includes examining, on a test basis, evidence supporting the amounts and disclosures in the financial statements, assessing the accounting principles used and significant estimates made by management, and evaluating the overall financial statement presentation. We believe that our audits, which included confirmation of securities at April 30, 2015 by correspondence with the custodian, transfer agent and brokers, provide a reasonable basis for our opinion.
PricewaterhouseCoopers LLP
San Francisco, California
June 15, 2015
118 | Annual Report
franklintempleton.com
FRANKLIN STRATEGIC SERIES
Tax Information (unaudited)
Under Section 852(b)(3)(C) of the Internal Revenue Code (Code), the Funds hereby report the maximum amount allowable but no less than the following amounts as long term capital gain dividends for the fiscal year ended April 30, 2015:
| Franklin | Franklin | Franklin Growth | Franklin | Franklin | |||||
| Flex Cap | Focused Core | Opportunities | Small Cap | Small-Mid Cap | |||||
| Growth Fund | Equity Fund | Fund | Growth Fund | Growth Fund | |||||
| $ | 485,417,922 | $ | 1,833,627 | $ | 21,070,998 | $ | 58,829,248 | $ | 594,505,935 |
Under Section 871(k)(2)(C) of the Code, the Funds hereby report the maximum amount allowable but no less than the following amounts as short term capital gain dividends for purposes of the tax imposed under Section 871(a)(1)(A) of the Code for the fiscal year ended April 30, 2015:
| Franklin | Franklin | Franklin | Franklin | ||||
| Flex Cap | Focused Core | Small Cap | Small-Mid Cap | ||||
| Growth Fund | Equity Fund | Growth Fund | Growth Fund | ||||
| $ | 47,149,148 | $ | 643,878 | $ | 49,022,134 | $ | 75,776,742 |
| Under Section 854(b)(1)(A) of the Code, the Funds hereby report the following percentage amounts of the ordinary income |
| dividends as income qualifying for the dividends received deduction for the fiscal year ended April 30, 2015: |
| Franklin | Franklin | Franklin | Franklin | ||||
| Flex Cap | Focused Core | Small Cap | Small-Mid Cap | ||||
| Growth Fund | Equity Fund | Growth Fund | Growth Fund | ||||
| 32.57 | % | 100.00 | % | 13.68 | % | 21.81 | % |
Under Section 854(b)(1)(B) of the Code, the Funds hereby report the maximum amount allowable but no less than the following amounts as qualified dividends for purposes of the maximum rate under Section 1(h)(11) of the Code for the fiscal year ended April 30, 2015:
| Franklin | Franklin | Franklin Growth | Franklin | Franklin | |||||
| Flex Cap | Focused Core | Opportunities | Small Cap | Small-Mid Cap | |||||
| Growth Fund | Equity Fund | Fund | Growth Fund | Growth Fund | |||||
| $ | 16,182,351 | $ | 1,078,358 | $ | 4,392,941 | $ | 6,795,866 | $ | 17,383,285 |
Distributions, including qualified dividend income, paid during calendar year 2015 will be reported to shareholders on Form 1099-DIV by mid-February 2016. Shareholders are advised to check with their tax advisors for information on the treatment of these amounts on their individual income tax returns.
franklintempleton.com
Annual Report
| 119
FRANKLIN STRATEGIC SERIES
Board Members and Officers
The name, year of birth and address of the officers and board members, as well as their affiliations, positions held with the Trust, principal occupations during at least the past five years and number of portfolios overseen in the Franklin Templeton Investments fund complex are shown below. Generally, each board member serves until that person’s successor is elected and qualified.
| Independent Board Members | ||||
| Number of Portfolios in | ||||
| Name, Year of Birth | Length of | Fund Complex Overseen | Other Directorships Held | |
| and Address | Position | Time Served | by Board Member* | During at Least the Past 5 Years |
| Harris J. Ashton (1932) | Trustee | Since 1991 | 145 | Bar-S Foods (meat packing company) |
| One Franklin Parkway | (1981-2010). | |||
| San Mateo, CA 94403-1906 | ||||
| Principal Occupation During at Least the Past 5 Years: | ||||
| Director of various companies; and formerly, Director, RBC Holdings, Inc. (bank holding company) (until 2002); and President, Chief Executive | ||||
| Officer and Chairman of the Board, General Host Corporation (nursery and craft centers) (until 1998). | ||||
| Mary C. Choksi (1950) | Trustee | Since | 119 | Avis Budget Group Inc. (car rental) |
| One Franklin Parkway | October 2014 | (2007-present), Omnicom Group Inc. | ||
| San Mateo, CA 94403-1906 | (advertising and marketing communi- | |||
| cations services) (2011-present) and | ||||
| H.J. Heinz Company (processed foods | ||||
| and allied products) (1998-2006). | ||||
| Principal Occupation During at Least the Past 5 Years: | ||||
| Founding Partner and Senior Managing Director, Strategic Investment Group (investment management group) (1987-present); director of | ||||
| various companies; and formerly, Founding Partner and Managing Director, Emerging Markets Management LLC (investment management | ||||
| firm) (1987-2011); and Loan Officer/Senior Loan Officer/Senior Pension Investment Officer, World Bank Group (international financial | ||||
| institution) (1977-1987). | ||||
| Edith E. Holiday (1952) | Trustee | Since 1998 | 145 | Hess Corporation (exploration and |
| One Franklin Parkway | refining of oil and gas) (1993-present), | |||
| San Mateo, CA 94403-1906 | RTI International Metals, Inc. (manu- | |||
| facture and distribution of titanium) | ||||
| (1999-present), Canadian National | ||||
| Railway (railroad) (2001-present), | ||||
| White Mountains Insurance Group, Ltd. | ||||
| (holding company) (2004-present) and | ||||
| H.J. Heinz Company (processed foods | ||||
| and allied products) (1994-2013). | ||||
| Principal Occupation During at Least the Past 5 Years: | ||||
| Director or Trustee of various companies and trusts; and formerly, Assistant to the President of the United States and Secretary of the | ||||
| Cabinet (1990-1993); General Counsel to the United States Treasury Department (1989-1990); and Counselor to the Secretary and Assistant | ||||
| Secretary for Public Affairs and Public Liaison – United States Treasury Department (1988-1989). | ||||
| J. Michael Luttig (1954) | Trustee | Since 2009 | 145 | Boeing Capital Corporation |
| One Franklin Parkway | (aircraft financing) (2006-2013). | |||
| San Mateo, CA 94403-1906 | ||||
| Principal Occupation During at Least the Past 5 Years: | ||||
| Executive Vice President, General Counsel and member of the Executive Council, The Boeing Company (aerospace company); and | ||||
| formerly, Federal Appeals Court Judge, U.S. Court of Appeals for the Fourth Circuit (1991-2006). | ||||
120 | Annual Report
franklintempleton.com
FRANKLIN STRATEGIC SERIES
| Independent Board Members (continued) | ||||
| Number of Portfolios in | ||||
| Name, Year of Birth | Length of | Fund Complex Overseen | Other Directorships Held | |
| and Address | Position | Time Served | by Board Member* | During at Least the Past 5 Years |
| Frank A. Olson (1932) | Trustee | Since 2007 | 145 | Hess Corporation (exploration and |
| One Franklin Parkway | refining of oil and gas) (1998-2013). | |||
| San Mateo, CA 94403-1906 | ||||
| Principal Occupation During at Least the Past 5 Years: | ||||
| Director of various companies; and formerly, Chairman of the Board, The Hertz Corporation (car rental) (1980-2000) and Chief Executive | ||||
| Officer (1977-1999); and Chairman of the Board, President and Chief Executive Officer, UAL Corporation (airlines) (June-December 1987). | ||||
| Larry D. Thompson (1945) | Trustee | Since 2007 | 145 | Cbeyond, Inc. (business commu- |
| One Franklin Parkway | nications provider) (2010-2012), | |||
| San Mateo, CA 94403-1906 | The Southern Company (energy | |||
| company) (December 2014; | ||||
| previously 2010-2012) and Graham | ||||
| Holdings Company (education and | ||||
| media organization) (2011-present). | ||||
| Principal Occupation During at Least the Past 5 Years: | ||||
| Director of various companies; John A. Sibley Professor of Corporate and Business Law, University of Georgia School of Law (January 2015; | ||||
| previously 2011-2012); and formerly, Executive Vice President – Government Affairs, General Counsel and Corporate Secretary, PepsiCo, | ||||
| Inc. (consumer products) (2012-2014); Senior Vice President – Government Affairs, General Counsel and Secretary, PepsiCo, Inc. | ||||
| (2004-2011); Senior Fellow of The Brookings Institution (2003-2004); Visiting Professor, University of Georgia School of Law (2004); and | ||||
| Deputy Attorney General, U.S. Department of Justice (2001-2003). | ||||
| John B. Wilson (1959) | Lead | Trustee since | 119 | None |
| One Franklin Parkway | Independent | 2006 and Lead | ||
| San Mateo, CA 94403-1906 | Trustee | Independent | ||
| Trustee since 2008 | ||||
| Principal Occupation During at Least the Past 5 Years: | ||||
| President, Staples Europe (office supplies) (2012-present); President and Founder, Hyannis Port Capital, Inc. (real estate and private equity | ||||
| investing); serves on private and non-profit boards; and formerly, Chief Operating Officer and Executive Vice President, Gap, Inc. (retail) | ||||
| (1996-2000); Chief Financial Officer and Executive Vice President – Finance and Strategy, Staples, Inc. (1992-1996); Senior Vice President – | ||||
| Corporate Planning, Northwest Airlines, Inc. (airlines) (1990-1992); and Vice President and Partner, Bain & Company (consulting firm) | ||||
| (1986-1990). | ||||
| Interested Board Members and Officers | ||||
| Number of Portfolios in | ||||
| Name, Year of Birth | Length of | Fund Complex Overseen | Other Directorships Held | |
| and Address | Position | Time Served | by Board Member* | During at Least the Past 5 Years |
| **Gregory E. Johnson (1961) | Trustee | Since June 2013 | 162 | None |
| One Franklin Parkway | ||||
| San Mateo, CA 94403-1906 | ||||
| Principal Occupation During at Least the Past 5 Years: | ||||
| Chairman of the Board, Member – Office of the Chairman, Director, President and Chief Executive Officer, Franklin Resources, Inc.; officer | ||||
| and/or director or trustee, as the case may be, of some of the other subsidiaries of Franklin Resources, Inc. and of 46 of the investment | ||||
| companies in Franklin Templeton Investments; and Vice Chairman, Investment Company Institute. | ||||
franklintempleton.com Annual Report | 121
| FRANKLIN STRATEGIC SERIES | ||||
| Interested Board Members and Officers (continued) | ||||
| Number of Portfolios in | ||||
| Name, Year of Birth | Length of | Fund Complex Overseen | Other Directorships Held | |
| and Address | Position | Time Served | by Board Member* | During at Least the Past 5 Years |
| **Rupert H. Johnson, Jr. (1940) Chairman of | Chairman of | 145 | None | |
| One Franklin Parkway | the Board and | the Board since | ||
| San Mateo, CA 94403-1906 | Trustee | 2013 and Trustee | ||
| since 1991 | ||||
| Principal Occupation During at Least the Past 5 Years: | ||||
| Vice Chairman, Member – Office of the Chairman and Director, Franklin Resources, Inc.; Director, Franklin Advisers, Inc.; Senior Vice | ||||
| President, Franklin Advisory Services, LLC; and officer and/or director or trustee, as the case may be, of some of the other subsidiaries | ||||
| of Franklin Resources, Inc. and of 43 of the investment companies in Franklin Templeton Investments. | ||||
| Alison E. Baur (1964) | Vice President | Since 2012 | Not Applicable | Not Applicable |
| One Franklin Parkway | ||||
| San Mateo, CA 94403-1906 | ||||
| Principal Occupation During at Least the Past 5 Years: | ||||
| Deputy General Counsel, Franklin Templeton Investments; and officer of some of the other subsidiaries of Franklin Resources, Inc. and of | ||||
| 46 of the investment companies in Franklin Templeton Investments. | ||||
| Laura F. Fergerson (1962) | Chief Executive Since 2009 | Not Applicable | Not Applicable | |
| One Franklin Parkway | Officer – | |||
| San Mateo, CA 94403-1906 | Finance and | |||
| Administration | ||||
| Principal Occupation During at Least the Past 5 Years: | ||||
| Senior Vice President, Franklin Templeton Services, LLC; and officer of 46 of the investment companies in Franklin Templeton Investments. | ||||
| Gaston Gardey (1967) | Treasurer, | Since 2009 | Not Applicable | Not Applicable |
| One Franklin Parkway | Chief Financial | |||
| San Mateo, CA 94403-1906 | Officer and | |||
| Chief | ||||
| Accounting | ||||
| Officer | ||||
| Principal Occupation During at Least the Past 5 Years: | ||||
| Treasurer, U.S. Products and Client Services, Franklin Templeton Investments; and officer of 27 of the investment companies in Franklin | ||||
| Templeton Investments. | ||||
| Aliya S. Gordon (1973) | Vice President | Since 2009 | Not Applicable | Not Applicable |
| One Franklin Parkway | ||||
| San Mateo, CA 94403-1906 | ||||
| Principal Occupation During at Least the Past 5 Years: | ||||
| Senior Associate General Counsel, Franklin Templeton Investments; officer of 46 of the investment companies in Franklin Templeton | ||||
| Investments; and formerly, Litigation Associate, Steefel, Levitt & Weiss, LLP (2000-2004). | ||||
| Steven J. Gray (1955) | Vice President | Since 2009 | Not Applicable | Not Applicable |
| One Franklin Parkway | ||||
| San Mateo, CA 94403-1906 | ||||
| Principal Occupation During at Least the Past 5 Years: | ||||
| Senior Associate General Counsel, Franklin Templeton Investments; Vice President, Franklin Templeton Distributors, Inc. and Franklin | ||||
| Alternative Strategies Advisers, LLC; and officer of 46 of the investment companies in Franklin Templeton Investments. | ||||
122 | Annual Report franklintempleton.com
FRANKLIN STRATEGIC SERIES
| Interested Board Members and Officers (continued) | ||||
| Number of Portfolios in | ||||
| Name, Year of Birth | Length of | Fund Complex Overseen | Other Directorships Held | |
| and Address | Position | Time Served | by Board Member* | During at Least the Past 5 Years |
| Selena L. Holmes (1965) | Vice President | Since 2012 | Not Applicable | Not Applicable |
| 100 Fountain Parkway | – AML | |||
| St. Petersburg, FL 33716-1205 | Compliance | |||
| Principal Occupation During at Least the Past 5 Years: | ||||
| Director, Global Compliance Monitoring; Chief Compliance Officer, Franklin Alternative Strategies Advisers, LLC; Vice President, Franklin | ||||
| Templeton Companies, LLC; and officer of 46 of the investment companies in Franklin Templeton Investments. | ||||
| Edward B. Jamieson (1948) | President and | Since 2010 | Not Applicable | Not Applicable |
| One Franklin Parkway | Chief Executive | |||
| San Mateo, CA 94403-1906 | Officer – | |||
| Investment | ||||
| Management | ||||
| Principal Occupation During at Least the Past 5 Years: | ||||
| President, Chief Investment Officer and Director, Franklin Advisers, Inc.; Executive Vice President, Franklin Templeton Institutional, LLC; | ||||
| and officer and/or trustee, as the case may be, of some of the other subsidiaries of Franklin Resources, Inc. and of 10 of the investment | ||||
| companies in Franklin Templeton Investments. | ||||
| Christopher J. Molumphy (1962) Vice President | Since 2000 | Not Applicable | Not Applicable | |
| One Franklin Parkway | ||||
| San Mateo, CA 94403-1906 | ||||
| Principal Occupation During at Least the Past 5 Years: | ||||
| Director and Executive Vice President, Franklin Advisers, Inc.; Executive Vice President, Franklin Templeton Institutional, LLC; and officer | ||||
| of some of the other subsidiaries of Franklin Resources, Inc. and of 22 of the investment companies in Franklin Templeton Investments. | ||||
| Kimberly H. Novotny (1972) | Vice President | Since 2013 | Not Applicable | Not Applicable |
| 300 S.E. 2nd Street | ||||
| Fort Lauderdale, FL 33301-1923 | ||||
| Principal Occupation During at Least the Past 5 Years: | ||||
| Associate General Counsel, Franklin Templeton Investments; Vice President and Secretary, Fiduciary Trust International of the South; Vice | ||||
| President, Templeton Investment Counsel, LLC; Assistant Secretary, Franklin Resources, Inc.; and officer of 46 of the investment companies | ||||
| in Franklin Templeton Investments. | ||||
| Robert C. Rosselot (1960) | Chief | Since 2013 | Not Applicable | Not Applicable |
| 300 S.E. 2nd Street | Compliance | |||
| Fort Lauderdale, FL 33301-1923 | Officer | |||
| Principal Occupation During at Least the Past 5 Years: | ||||
| Director, Global Compliance, Franklin Templeton Investments; Vice President, Franklin Templeton Companies, LLC; officer of 46 of the | ||||
| investment companies in Franklin Templeton Investments; and formerly, Senior Associate General Counsel, Franklin Templeton Investments | ||||
| (2007-2013); and Secretary and Vice President, Templeton Group of Funds (2004-2013). | ||||
| Karen L. Skidmore (1952) | Vice President | Since 2006 | Not Applicable | Not Applicable |
| One Franklin Parkway | and Secretary | |||
| San Mateo, CA 94403-1906 | ||||
| Principal Occupation During at Least the Past 5 Years: | ||||
| Senior Associate General Counsel, Franklin Templeton Investments; and officer of 46 of the investment companies in Franklin Templeton | ||||
| Investments. | ||||
franklintempleton.com Annual Report | 123
FRANKLIN STRATEGIC SERIES
| Interested Board Members and Officers (continued) | ||||
| Number of Portfolios in | ||||
| Name, Year of Birth | Length of | Fund Complex Overseen | Other Directorships Held | |
| and Address | Position | Time Served | by Board Member* | During at Least the Past 5 Years |
| Craig S. Tyle (1960) | Vice President | Since 2005 | Not Applicable | Not Applicable |
| One Franklin Parkway | ||||
| San Mateo, CA 94403-1906 | ||||
| Principal Occupation During at Least the Past 5 Years: | ||||
| General Counsel and Executive Vice President, Franklin Resources, Inc.; and officer of some of the other subsidiaries of Franklin Resources, | ||||
| Inc. and of 46 of the investment companies in Franklin Templeton Investments. | ||||
| Lori A. Weber (1964) | Vice President | Since 2011 | Not Applicable | Not Applicable |
| 300 S.E. 2nd Street | ||||
| Fort Lauderdale, FL 33301-1923 | ||||
| Principal Occupation During at Least the Past 5 Years: | ||||
| Senior Associate General Counsel, Franklin Templeton Investments; Assistant Secretary, Franklin Resources, Inc.; Vice President and | ||||
| Secretary, Templeton Investment Counsel, LLC; Vice President, Fiduciary Trust International of the South; and officer of 46 of the investment | ||||
| companies in Franklin Templeton Investments. | ||||
*We base the number of portfolios on each separate series of the U.S. registered investment companies within the Franklin Templeton Investments fund complex.
These portfolios have a common investment manager or affiliated investment managers.
**Gregory E. Johnson is considered to be an interested person of the Fund under the federal securities laws due to his position as an officer and director of Franklin
Resources, Inc. (Resources), which is the parent company of the Fund’s investment manager and distributor. Rupert H. Johnson, Jr. is considered to be an interested
person of the Fund under the federal securities laws due to his position as officer and director and major shareholder of Resources.
Note 1: Rupert H. Johnson, Jr. is the uncle of Gregory E. Johnson.
Note 2: Officer information is current as of the date of this report. It is possible that after this date, information about officers may change.
Note 3: Effective April 30, 2015, Sam Ginn ceased to be a trustee of the Fund.
The Sarbanes-Oxley Act of 2002 and Rules adopted by the Securities and Exchange Commission require the Fund to disclose whether the Fund’s Audit Committee
includes at least one member who is an audit committee financial expert within the meaning of such Act and Rules. The Fund’s Board has determined that there
is at least one such financial expert on the Audit Committee and has designated John B. Wilson as its audit committee financial expert. The Board believes that
Mr. Wilson qualifies as such an expert in view of his extensive business background and experience, including service as chief financial officer of Staples, Inc.
from 1992 to 1996. Mr. Wilson has been a Member and Chairman of the Fund’s Audit Committee since 2006. As a result of such background and experience, the
Board believes that Mr. Wilson has acquired an understanding of generally accepted accounting principles and financial statements, the general application of
such principles in connection with the accounting estimates, accruals and reserves, and analyzing and evaluating financial statements that present a breadth
and level of complexity of accounting issues generally comparable to those of the Fund, as well as an understanding of internal controls and procedures for
financial reporting and an understanding of audit committee functions. Mr. Wilson is an independent Board member as that term is defined under the relevant
Securities and Exchange Commission Rules and Releases.
The Statement of Additional Information (SAI) includes additional information about the board members and is available, without charge, upon request.
Shareholders may call (800) DIAL BEN/342-5236 to request the SAI.
124 | Annual Report franklintempleton.com
FRANKLIN STRATEGIC SERIES
Shareholder Information
Board Review of Investment Management Agreement
At a meeting held April 14, 2015, the Board of Trustees (Board), including a majority of non-interested or independent Trustees, approved renewal of the investment management agreement for each of the separate funds within the Trust (Fund(s)). In reaching this decision, the Board took into account information furnished throughout the year at regular Board meetings, as well as information prepared specifically in connection with the annual renewal review process. Information furnished and discussed throughout the year included investment performance reports and related financial information for the Funds, along with periodic reports on expenses, shareholder services, legal and compliance matters, pricing, brokerage commissions and execution and other services provided by the Investment Manager (Manager) and its affiliates, as well as marketing support payments made to financial intermediaries. Information furnished specifically in connection with the renewal process included a report for each Fund prepared by Lipper, Inc. (Lipper), an independent organization, as well as additional material, including a Fund profitability analysis prepared by management. The Lipper reports compared each Fund’s investment performance and expenses with those of other mutual funds deemed comparable to the Fund as selected by Lipper. The Fund profitability analysis discussed the profitability to Franklin Templeton Investments (FTI) from its overall U.S. fund operations, as well as on an individual fund-by-fund basis. Additional material accompanying such profitability analysis included information on a fund-by-fund basis listing portfolio managers and other accounts they manage, as well as information on management fees charged by the Manager and its affiliates to U.S. mutual funds and other accounts, including management’s explanation of differences where relevant. Such material also included a memorandum prepared by management describing project initiatives and capital investments relating to the services provided to the Funds by the FTI organization, as well as a memorandum relating to economies of scale and an analysis concerning transfer agent fees charged by an affiliate of the Manager. The Board also noted that at the February meetings each year, it receives an annual report on all marketing support payments made by FTI to financial intermediaries.
In considering such materials, the independent Trustees received assistance and advice from and met separately with independent counsel. While the investment management agreements for all Funds were considered at the same Board meeting, the Board dealt with each Fund separately. In approving continuance of the investment management agreement for each Fund, the Board, including a majority of independent Trustees, determined that the existing management fee structure was fair and reasonable and that continuance of the investment management agreement was in the best interests of each Fund and its shareholders. While attention was given to all information furnished, the following discusses some primary factors relevant to the Board’s decision.
NATURE, EXTENT AND QUALITY OF SERVICE. The Board was satisfied with the nature and quality of the overall services provided by the Manager and its affiliates to the Funds and their shareholders, except as noted later in the discussion of investment performance. The Board’s opinion was based, in part, upon periodic reports furnished it showing that the investment policies and restrictions for the Funds were consistently complied with as well as other reports periodically furnished the Board covering matters such as the compliance of portfolio managers and other management personnel with the code of ethics adopted throughout the Franklin Templeton fund complex, the adherence to fair value pricing procedures established by the Board, and the accuracy of net asset value calculations. The Board also noted the extent of benefits provided Fund shareholders from being part of the Franklin Templeton family of funds, including the right to exchange investments between the same class of shares of different funds without a sales charge, the ability to reinvest Fund dividends into other funds and the right to combine holdings in other funds to obtain a reduced sales charge. Favorable consideration was given to management’s continual efforts and expenditures in establishing effective business continuity plans and developing strategies to address cybersecurity threats. Among other factors taken into account by the Board were the Manager’s best execution trading policies, including a favorable report by an independent portfolio trading analytical firm that also covered FOREX transactions. Consideration was also given to the experience of each Fund’s portfolio management team, the number of accounts managed and general method of compensation. In this latter respect, the Board noted that a primary factor in management’s determination of a portfolio manager’s bonus compensation was the relative investment performance of the funds he or she managed and that a portion of such bonus was required to be invested in a predesignated list of funds within such person’s fund management area so as to be aligned with the interests of shareholders. The Board also took into account the quality of transfer agent and shareholder services provided Fund shareholders by an affiliate of the Manager, noting the
franklintempleton.com Annual Report | 125
FRANKLIN STRATEGIC SERIES
SHAREHOLDER INFORMATION
Board Review of Investment Management
Agreement (continued) changes taking place in the nature of transfer agency services throughout the industry and regulatory initiatives in this area, and the continual enhancements to the Franklin Templeton website. Particular attention was given to management’s conservative approach and diligent risk management procedures, including continual monitoring of counterparty credit risk and attention given to derivatives and other complex instruments, including expanded collateralization requirements. The Board also took into account, among other things, management’s efforts in establishing a global credit facility for the benefit of the Funds and other accounts managed by FTI to provide a source of cash for temporary and emergency purposes or to meet unusual redemption requests as well as the strong financial position of the Manager’s parent company and its commitment to the mutual fund business as evidenced by its continued subsidization of money market funds.
INVESTMENT PERFORMANCE. The Board placed significant emphasis on the investment performance of the Funds in view of its importance to shareholders. While consideration was given to performance reports and discussions with portfolio managers at Board meetings throughout the year, particular attention in assessing performance was given to the Lipper reports furnished for the agreement renewals. The Lipper reports prepared for each Fund showed the investment performance of its Class A shares in comparison to a performance universe selected by Lipper. Comparative performance for each Fund was shown for the one-year period ended January 31, 2015, and previous periods ended that date of up to 10 years depending on when a particular Fund commenced operations. The following summarizes the performance results for each of these Funds and the Board’s view of such performance.
Franklin Flex Cap Growth Fund – The performance universe for this Fund consisted of the Fund and all retail and institutional multi-cap growth funds as selected by Lipper. The Lipper report showed the Fund’s total return to be in the lowest performing quintile of such performance universe for the one-year period, and on an annualized basis to be in the second-lowest performing quintile of the performance universe during the previous three- and 10-year periods, and in the lowest performing quintile of such universe during the previous five-year period. The Board acknowledged the positive impact of steps taken by management in 2012 to commit additional resources to the
Fund and observed that management has undertaken a comprehensive review of the portfolio, given its underperformance in 2014 following strong performance in 2013. The Board found the Fund’s performance as shown in the Lipper report to be acceptable, noting its one-year total return exceeded 6%, and its annualized three- and five-year total returns exceeded 13%.
Franklin Focused Core Equity Fund – The performance universe for this Fund consisted of all retail and institutional multi-cap core funds as selected by Lipper. The Lipper report showed the Fund’s total return for the one-year period to be in the highest performing quintile of such performance universe, and on an annualized basis to be in the middle performing quintile of such performance universe for the previous three-year period and the second-lowest performing quintile of such universe for the previous five-year period. The Board believed that steps that management had taken to improve performance, including a change in the lead portfolio manager, were producing results and that no additional changes to portfolio management were necessary at the present time. The Board found the comparative performance of the Fund as set forth in the Lipper report to be satisfactory.
Franklin Growth Opportunities Fund – The performance universe for this Fund consisted of the Fund and all retail and institutional multi-cap growth funds as selected by Lipper. The Lipper report showed the Fund’s total return for the one-year period to be in the middle performing quintile of its performance universe, and on an annualized basis to be in the middle performing quintile of such universe during each of the previous three- and five-year periods, and the highest performing quintile of such universe for the previous 10-year period. The Board noted management’s focus on its highest conviction investments and found the comparative performance of the Fund as set forth in the Lipper report to be satisfactory.
Franklin Small-Mid Cap Growth Fund – The performance universe for this Fund consisted of all retail and institutional mid-cap growth funds as selected by Lipper. The Lipper report comparison for the Fund showed its total return during the one-year period to be in the middle performing quintile of such performance universe, and on an annualized basis to be in the middle performing quintile of such universe during each of the previous three-, five- and 10-year periods. Management explained its ongoing review of the portfolio and its conviction around the portfolio holdings. The Board found the comparative performance of the Fund as set forth in the Lipper report to be satisfactory.
126 | Annual Report
franklintempleton.com
FRANKLIN STRATEGIC SERIES
SHAREHOLDER INFORMATION
Franklin Small Cap Growth Fund – The performance universe for this Fund consisted of the Fund and a representative class/fund from each retail portfolio in the small-cap growth classification as selected by Lipper. The Lipper report showed the Fund’s total return to be in the middle performing quintile of such performance universe during the one-year period, and on an annualized basis to be in the highest performing quintile of such universe for the previous three- and five-year periods, and the second-highest performing quintile of such universe for the previous 10-year period. The Board was satisfied with the Fund’s investment performance as set forth in the Lipper report.
COMPARATIVE EXPENSES. Consideration was given to a comparative analysis of the management fees and total expense ratio of each Fund compared with those of a group of other funds selected by Lipper as its appropriate Lipper expense group. Lipper expense data is based upon information taken from each fund’s most recent annual report, which reflects historical asset levels that may be quite different from those currently existing, particularly in a period of market volatility. While recognizing such inherent limitation and the fact that expense ratios generally increase as assets decline and decrease as assets grow, the Board believed the independent analysis conducted by Lipper to be an appropriate measure of comparative expenses. In reviewing comparative costs, Lipper provides information on each Fund’s contractual investment management fee in comparison with the investment management fee that would have been charged by other funds within its Lipper expense group assuming they were similar in size to the Fund, as well as the actual total expense ratio of each Fund in comparison with those of its Lipper expense group. The Lipper contractual investment management fee analysis includes administrative charges as being part of the investment management fee, and actual total expenses, for comparative consistency, are shown by Lipper for Fund Class A shares. The results of such expense comparisons showed the contractual investment management fee rates and actual total expense ratio for each of Franklin Flex Cap Growth Fund, Franklin Small Cap Growth Fund and Franklin Small-Mid Cap Growth Fund to be in the least expensive quintile of their respective Lipper expense groups. The contractual investment management fee rate for Franklin Growth Opportunities Fund was in the least expensive quintile of its Lipper expense group and its actual total expense ratio was below the median of such expense group. The contractual investment management fee rate for Franklin Focused Core Equity Fund was in the middle expense quintile of its Lipper expense group, while its actual total expense ratio was in the second least expensive quintile of such expense group. The Board was satisfied with the contractual management fee rate and total expense ratio of each of these Funds in comparison to its respective expense group as shown in the Lipper reports, noting that Franklin Growth Opportunities Fund and Franklin Focused Core Equity Fund benefited from fee waivers.
MANAGEMENT PROFITABILITY. The Board also considered the level of profits realized by the Manager and its affiliates in connection with the operation of each Fund. In this respect, the Board reviewed the Fund profitability analysis that addresses the overall profitability of Franklin Templeton’s U.S. fund business, as well as its profits in providing management and other services to each of the individual funds during the 12-month period ended September 30, 2014, being the most recent fiscal year-end for Franklin Resources, Inc., the Manager’s parent. In reviewing the analysis, the Board recognized that allocation methodologies are inherently subjective and various allocation methodologies may be reasonable while producing different results. In this respect, the Board noted that while management continually makes refinements to its methodologies in response to organizational and product related changes, the overall approach as defined by the primary drivers and activity measurements has remained consistent with that used in the Funds’ profitability report presentations from prior years. Additionally, the Funds’ independent registered public accounting firm had been engaged by the Manager to periodically review the reasonableness of the allocation methodologies to be used solely by the Funds’ Board in reference to the profitability analysis. In reviewing and discussing such analysis, management discussed with the Board its belief that costs incurred in establishing the infrastructure necessary for the type of mutual fund operations conducted by the Manager and its affiliates may not be fully reflected in the expenses allocated to each Fund in determining its profitability, as well as the fact that the level of profits, to a certain extent, reflected operational cost savings and efficiencies initiated by management. The Board also took into account management’s expenditures in improving shareholder services provided the Funds, as well as the need to implement systems and meet additional regulatory and compliance requirements resulting from statutes such as the Sarbanes-Oxley and Dodd-Frank Acts and recent SEC and other regulatory requirements. In addition, the Board considered a third-party study comparing the profitability of the Manager’s parent on an overall basis to other publicly held managers broken down to show profitability from management operations exclusive of distribution expenses, as
franklintempleton.com
Annual Report
| 127
FRANKLIN STRATEGIC SERIES
SHAREHOLDER INFORMATION
Board Review of Investment Management
Agreement (continued) well as profitability including distribution expenses. The Board also considered the extent to which the Manager and its affiliates might derive ancillary benefits from fund operations, including revenues generated from transfer agent services, potential benefits resulting from personnel and systems enhancements necessitated by fund growth, as well as increased leverage with the service providers and counterparties. Based upon its consideration of all these factors, the Board determined that the level of profits realized by the Manager and its affiliates from providing services to each Fund was not excessive in view of the nature, quality and extent of services provided.
ECONOMIES OF SCALE. The Board also considered whether economies of scale are realized by the Manager as the Funds grow larger and the extent to which this is reflected in the level of management fees charged. While recognizing that any precise determination is inherently subjective, the Board noted that based upon the Fund profitability analysis, it appears that as some funds get larger, at some point economies of scale do result in the Manager realizing a larger profit margin on management services provided such a fund. The Board noted that economies of scale were shared with each Fund and its shareholders through management fee breakpoints so that as a fund grows in size, its effective management fee rate declines. The fee structure under the investment management agreement for each Fund contains breakpoints that continued to asset levels that exceeded its asset size at December 31, 2014. Despite the fact that the assets of Franklin Focused Core Equity Fund nearly tripled, amounting to approximately $121 million at December 31, 2014, the Board did not believe such size afforded any economies of scale, noting the still small asset size of the Fund. Even if the asset size grew significantly, the fee schedule provides breakpoints beyond the Fund’s current asset level. In view of such fee structure and the favorable expense comparisons of each Fund within its respective expense group, the Board believed that to the extent economies of scale may be realized by the Manager of the Funds and its affiliates, that there was a sharing of benefits with the Funds and their shareholders.
Proxy Voting Policies and Procedures
The Trust’s investment manager has established Proxy Voting Policies and Procedures (Policies) that the Trust uses to determine how to vote proxies relating to portfolio securities. Shareholders may view the Trust’s complete Policies online at franklintempleton.com. Alternatively, shareholders may request copies of the Policies free of charge by calling the Proxy Group collect at (954) 527-7678 or by sending a written request to: Franklin Templeton Companies, LLC, 300 S.E. 2nd Street, Fort Lauderdale, FL 33301, Attention: Proxy Group. Copies of the Trust’s proxy voting records are also made available online at franklintempleton.com and posted on the U.S. Securities and Exchange Commission’s website at sec.gov and reflect the most recent 12-month period ended June 30.
Quarterly Statement of Investments
The Trust files a complete statement of investments with the U.S. Securities and Exchange Commission for the first and third quarters for each fiscal year on Form N-Q. Shareholders may view the filed Form N-Q by visiting the Commission’s website at sec.gov. The filed form may also be viewed and copied at the Commission’s Public Reference Room in Washington, DC. Information regarding the operations of the Public Reference Room may be obtained by calling (800) SEC-0330.
Householding of Reports and Prospectuses
You will receive each Fund’s financial reports every six months as well as an annual updated summary prospectus (prospectus available upon request). To reduce Fund expenses, we try to identify related shareholders in a household and send only one copy of the financial reports and summary prospectus. This process, called “householding,” will continue indefinitely unless you instruct us otherwise. If you prefer not to have these documents householded, please call us at (800) 632-2301. At any time you may view current prospectuses/summary prospectuses and financial reports on our website. If you choose, you may receive these documents through electronic delivery.
128 | Annual Report
franklintempleton.com
Franklin Templeton Investments
Gain From Our Perspective®
At Franklin Templeton Investments, we’re dedicated to one goal: delivering exceptional asset management for our clients. By bringing together multiple, world-class investment teams in a single firm, we’re able to offer specialized expertise across styles and asset classes, all supported by the strength and resources of one of the world’s largest asset managers. This has helped us to become a trusted partner to individual and institutional investors across the globe.
Focus on Investment Excellence
At the core of our firm, you’ll find multiple independent investment teams—each with a focused area of expertise—from traditional to alternative strategies and multi-asset solutions. And because our portfolio groups operate autonomously, their strategies can be combined to deliver true style and asset class diversification.
All of our investment teams share a common commitment to excellence grounded in rigorous, fundamental research and robust, disciplined risk management. Decade after decade, our consistent, research-driven processes have helped Franklin Templeton earn an impressive record of strong, long-term results.
Global Perspective Shaped by Local Expertise
In today’s complex and interconnected world, smart investing demands a global perspective. Franklin Templeton pioneered international investing over 60 years ago, and our expertise in emerging markets spans more than a quarter of a century. Today, our investment professionals are on the ground across the globe, spotting investment ideas and potential risks firsthand. These locally based teams bring in-depth understanding of local companies, economies and cultural nuances, and share their best thinking across our global research network.
Strength and Experience
Franklin Templeton is a global leader in asset management serving clients in over 150 countries.1 We run our business with the same prudence we apply to asset management, staying focused on delivering relevant investment solutions, strong long-term results and reliable, personal service. This approach, focused on putting clients first, has helped us to become one of the most trusted names in financial services.
1. As of 12/31/14. Clients are represented by the total number of shareholder accounts.
Not FDIC Insured | May Lose Value | No Bank Guarantee
| Contents | |
| Annual Report | |
| Economic and Market Overview | 3 |
| Franklin Biotechnology | |
| Discovery Fund | 4 |
| Franklin Natural Resources Fund | 14 |
| Financial Highlights and | |
| Statements of Investments | 25 |
| Financial Statements | 41 |
| Notes to Financial Statements | 45 |
| Report of Independent Registered | |
| Public Accounting Firm | 57 |
| Tax Information | 58 |
| Board Members and Officers | 59 |
| Shareholder Information | 64 |
franklintempleton.com
1
Annual Report
Economic and Market Overview
U.S. economic growth moderated during the 12 months ended April 30, 2015, especially in the second half of the review period. The economy grew for most of 2014, supported in some quarters by greater spending by consumers, businesses, and state and local governments, partially offset by the negative impacts of a wider trade deficit and lower federal defense spending. In the first quarter of 2015, factors including low energy prices and U.S. dollar strength led exports to decline. In addition, harsh weather and labor disruptions weighed on business spending. Manufacturing and non-manufacturing activities increased, and the unemployment rate declined to 5.4% at period-end from 6.2% in April 2014.1 Housing market data were positive for most of the period as home sales and prices rose while mortgage rates declined. After a brief slump during the period, retail sales rebounded toward period-end as auto sales surged. Inflation, as measured by the Consumer Price Index, remained subdued during the past 12 months but rose toward period-end amid higher energy prices bouncing from recent lows.
The Federal Reserve Board (Fed) ended its bond buying program in October 2014, based on its view that underlying economic strength could support ongoing progress in labor market conditions. Although the Fed had repeatedly stated that it could be patient with regard to raising interest rates, in March 2015, the Fed removed the word “patient” from its monetary policy guidance. It added, however, that it might keep interest rates lower than what it viewed as normal. In its April 2015 meeting, the Fed attributed the economy’s first-quarter slowdown to transitory factors. The Fed reiterated that it would raise interest rates when it saw further improvement in the labor market and was reasonably confident that inflation would move back to its 2% objective over the medium term.
Investor confidence grew during the period as corporate profits remained healthy, the Fed maintained its cautious tone on raising interest rates and China introduced more stimulus measures. The stock markets endured some sell-offs when many investors reacted to political instability in certain emerging markets, Greece’s debt negotiations and relatively weak economic growth in Europe and Japan, as well as less robust growth in China. U.S. stocks rose overall for the 12 months under review as the Standard & Poor’s® 500 Index and the Dow Jones Industrial Average reached all-time highs.
The foregoing information reflects our analysis and opinions as of April 30, 2015. The information is not a complete analysis of every aspect of any market, country, industry, security or fund. Statements of fact are from sources considered reliable.
1. Source: Bureau of Labor Statistics.
franklintempleton.com Annual Report | 3
Franklin Biotechnology Discovery Fund
We are pleased to bring you Franklin Biotechnology Discovery Fund’s annual report for the fiscal year ended April 30, 2015. Effective at the close of market on July 8, 2014, the Fund closed to new investors with limited exceptions. Existing shareholders may continue to add money to their accounts. We believe this closure can help us effectively manage our current level of assets.
Your Fund’s Goal and Main Investments
The Fund seeks capital appreciation by investing at least 80% of its net assets in securities of biotechnology companies and discovery research firms located in the U.S. and other countries.
Performance Overview
The Fund’s Class A shares delivered a +46.81% cumulative total return for the 12 months under review. In comparison, the NASDAQ Biotechnology Index®, which tracks U.S. and international-based biotechnology stocks, generated a +45.62% total return.1 Also in comparison, the Standard & Poor’s 500 Index (S&P 500®), which is a broad measure of the U.S. stock market, generated a +12.98% total return.1 Finally, domestic and international-based stocks, as measured by the NASDAQ Composite Index®, produced a +21.52% total return.1 You can find the Fund’s long-term performance data in the Performance Summary beginning on page 7.
Performance data represent past performance, which does not guarantee future results. Investment return and principal value will fluctuate, and you may have a gain or loss when you sell your shares. Current performance may differ from figures shown. Please visit franklintempleton.com or call (800) 342-5236 for most recent month-end performance.
Investment Strategy
The Fund is managed using a bottom-up approach to individual stock selection, with a focus on fundamental analysis and primary research. We look for biotechnology, biopharmaceutical and platform technology companies that possess products with favorable competitive profiles, large market opportunities and strong intellectual property, supported by thoughtful clinical and market development strategies. Our assessment of these products is based on extensive primary research and due diligence and includes, but is not limited to, a thorough review of
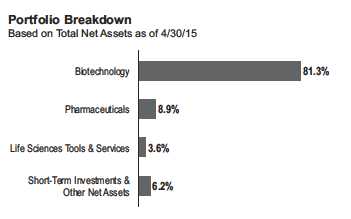
medical literature, consultation of community and academic physicians, and attendance at scientific meetings and symposia. Additionally, we favor companies with excellent management, strong financial characteristics and attractive valuations.
Manager’s Discussion
During the 12 months under review, shares of many bio-technology companies rallied amid clinical and regulatory successes. Within the Fund’s portfolio, the performance of individual stocks varied greatly, with several holdings reaching all-time highs and even delivering triple-digit gains. However, the biotechnology industry remained subject to volatility surrounding trial drug results, and a few positions declined notably following adverse outcomes. Please keep in mind that volatility is not uncommon in the biotechnology sector, and the Fund seeks to take advantage of short-term volatility by initiating investments in or adding to securities we believe to be undervalued.
Leading contributors to the Fund’s absolute performance included Celgene, Medivation and Gilead Sciences. Celgene discovers, develops and sells therapies for treating cancer and immunological diseases. Its shares benefited from the company’s broad pipeline and robust revenue and profit growth, driven by strong sales of its leading product, blood cancer treatment Revlimid. Celgene provided positive 2015 and long-term guidance, noting that recent achievements, including expanded regulatory approvals of several treatments and improved collaboration with certain partners, could help maintain its growth momentum.
1. Source: Morningstar.
The indexes are unmanaged and include reinvested dividends. One cannot invest directly in an index, and an index is not representative of the Fund’s portfolio.
The dollar value, number of shares or principal amount, and names of all portfolio holdings are listed in the Fund’s Statement of Investments (SOI).
The SOI begins on page 29.
4 | Annual Report franklintempleton.com
FRANKLIN BIOTECHNOLOGY DISCOVERY FUND
| Top 10 Holdings | ||
| 4/30/15 | ||
| Company | % of Total | |
| Sector/Industry | Net Assets | |
| Gilead Sciences Inc. | 8.5 | % |
| Biotechnology | ||
| Celgene Corp. | 8.5 | % |
| Biotechnology | ||
| Biogen Inc. | 7.0 | % |
| Biotechnology | ||
| Amgen Inc. | 4.8 | % |
| Biotechnology | ||
| Incyte Corp. | 3.6 | % |
| Biotechnology | ||
| BioMarin Pharmaceutical Inc. | 3.3 | % |
| Biotechnology | ||
| Regeneron Pharmaceuticals Inc. | 3.2 | % |
| Biotechnology | ||
| Medivation Inc. | 3.0 | % |
| Biotechnology | ||
| Illumina Inc. | 2.8 | % |
| Life Sciences Tools & Services | ||
| Puma Biotechnology Inc. | 2.7 | % |
| Biotechnology | ||
Medivation focuses on the development and commercialization of therapies to treat serious diseases for which there are limited treatment options. Its share price doubled during the period as the company generated strong revenue growth for fiscal year 2014, driven by robust sales of its primary product, XTANDI. Prescribers of the prostate cancer treatment increased, particularly in the urology and oncology segments, as regulatory approval expanded to pre-chemotherapy settings.
Gilead Sciences is a research-based biopharmaceutical company that discovers, develops and commercializes medicines to treat HIV/AIDS, liver diseases and serious cardiovascular and respiratory conditions. Its shares rose in value as the company delivered strong earnings results, driven by robust sales of its flagship hepatitis C drug, Sovaldi, as well as its recently launched hepatitis C drug, Harvoni. In April, the company declared its first quarterly cash dividend payment in accordance with its previously announced dividend program.
In contrast, certain Fund holdings weighed slightly on performance, including Repros Therapeutics,2 Keryx Biopharmaceuticals and GlycoMimetics. Repros Therapeutics develops drugs for the treatment of hormonal and reproductive system disorders. The company’s shares plunged during the period’s first half after a Food and Drug Administration (FDA) advisory panel on testosterone replacement therapies expressed concern that doctors were prescribing low-testosterone drugs too broadly, including to middle-aged men who wanted to increase their libidos, and voted to advise the FDA to limit the drugs to a specific medical purpose, only after rigorous and costly cardiovascular tests to determine potential risk factors. Although the FDA advisory panel’s meeting was not about Repros’s leading drug for the treatment of secondary hypogo-nadism, Androxal, shares suffered due to investor concerns that the company might not have enough clinical data in the right patient population to obtain approval for Androxal.
Keryx Biopharmaceuticals, which provides therapies for patients with renal disease, received FDA approval in September for the use of its lead product, ferric citrate (Auryxia), in controlling phosphorus levels in patients with chronic kidney disease and who are on dialysis. Its share price fell, however, because of the slow initial launch of Auryxia. Moreover, a number of limitations and warnings somewhat restricted the drug’s sales potential, adding to the stock’s volatility in recent months. The drug was also being evaluated for use by non-dialysis patients.
GlycoMimetics is a clinical stage biotechnology company focused on the discovery and development of drugs that mimic the function of carbohydrates. Such drugs are designed to address unmet medical needs resulting from diseases in which carbohydrate biology plays a key role. The company has a licensing agreement with Pfizer for the development of riv-ipansel for several indications, including vaso-occlusive crisis (VOC; blockage of blood vessels) associated with sickle cell disease. The share price declined after the company reported weaker-than-expected first-quarter 2014 earnings results in May 2014 and announced in September that Pfizer would delay the start of a phase 3 clinical trial due to a manufacturing issue. Near period-end, the company announced that Pfizer planned to begin a phase 3 trial of rivipansel for the treatment of VOC in mid-2015.
2. Sold by period-end.
See www.franklintempletondatasources.com for additional data provider information.
franklintempleton.com Annual Report | 5
FRANKLIN BIOTECHNOLOGY DISCOVERY FUND
Thank you for your continued participation in Franklin Biotechnology Discovery Fund. We look forward to serving your future investment needs.

The foregoing information reflects our analysis, opinions and portfolio holdings as of April 30, 2015, the end of the reporting period. The way we implement our main investment strategies and the resulting portfolio holdings may change depending on factors such as market and economic conditions. These opinions may not be relied upon as investment advice or an offer for a particular security. The information is not a complete analysis of every aspect of any market, country, industry, security or the Fund. Statements of fact are from sources considered reliable, but the investment manager makes no representation or warranty as to their completeness or accuracy. Although historical performance is no guarantee of future results, these insights may help you understand our investment management philosophy.
CFA® is a trademark owned by CFA Institute.
6 | Annual Report
franklintempleton.com
FRANKLIN BIOTECHNOLOGY DISCOVERY FUND
Performance Summary as of April 30, 2015
Your dividend income will vary depending on dividends or interest paid by securities in the Fund’s portfolio, adjusted for operating expenses of each class. Capital gain distributions are net profits realized from the sale of portfolio securities. The performance table and graphs do not reflect any taxes that a shareholder would pay on Fund dividends, capital gain distributions, if any, or any realized gains on the sale of Fund shares. Total return reflects reinvestment of the Fund’s dividends and capital gain distributions, if any, and any unrealized gains or losses.
| Net Asset Value | ||||||
| Share Class (Symbol) | 4/30/15 | 4/30/14 | Change | |||
| A (FBDIX) | $ | 182.30 | $ | 129.27 | +$ | 53.03 |
| C (FBTDX) | $ | 180.67 | $ | 129.061 | +$ | 51.61 |
| R6 (FRBRX) | $ | 185.75 | $ | 131.09 | +$ | 54.66 |
| Advisor (FTDZX) | $ | 185.12 | $ | 130.86 | +$ | 54.26 |
| Distributions (5/1/14–4/30/15) | ||||||
| Short-Term | Long-Term | |||||
| Share Class | Capital Gain | Capital Gain | Total | |||
| A | $ | 3.7275 | $ | 2.9405 | $ | 6.6680 |
| C | $ | 3.7275 | $ | 2.9405 | $ | 6.6680 |
| R6 | $ | 3.7275 | $ | 2.9405 | $ | 6.6680 |
| Advisor | $ | 3.7275 | $ | 2.9405 | $ | 6.6680 |
franklintempleton.com
Annual Report
| 7
FRANKLIN BIOTECHNOLOGY DISCOVERY FUND
PERFORMANCE SUMMARY
Performance as of 4/30/152
Cumulative total return excludes sales charges. Average annual total returns and value of $10,000 investment include maximum sales charges. Class A: 5.75% maximum initial sales charge; Class C: 1% contingent deferred sales charge in first year only;
Class R6/Advisor Class: no sales charges.
| Cumulative | Average Annual | Value of | Average Annual | Total Annual Operating | ||||||
| Share Class | Total Return3 | Total Return4 | $ | 10,000 Investment5 | Total Return (3/31/15)6 | Operating Expenses7 | ||||
| A | 1.10 | % | ||||||||
| 1-Year | +46.81 | % | +38.37 | % | $ | 13,837 | +35.31 | % | ||
| 5-Year | +260.86 | % | +27.74 | % | $ | 34,011 | +29.47 | % | ||
| 10-Year | +409.98 | % | +17.00 | % | $ | 48,065 | +17.88 | % | ||
| C | 1.80 | % | ||||||||
| 1-Year | +45.76 | %1 | +44.76 | % | $ | 14,476 | +41.49 | % | ||
| Since Inception (3/4/14) | +18.20 | % | +14.72 | % | $ | 11,720 | +22.29 | % | ||
| R6 | 0.63 | % | ||||||||
| 1-Year | +47.40 | % | +47.40 | % | $ | 14,740 | +44.17 | % | ||
| Since Inception (5/1/13) | +97.67 | % | +40.66 | % | $ | 19,767 | +46.98 | % | ||
| Advisor8 | 0.80 | % | ||||||||
| 1-Year | +47.17 | % | +47.17 | % | $ | 14,717 | +43.93 | % | ||
| 5-Year | +265.97 | % | +29.63 | % | $ | 36,597 | +31.39 | % | ||
| 10-Year | +418.24 | % | +17.88 | % | $ | 51,824 | +18.77 | % |
Performance data represent past performance, which does not guarantee future results. Investment return and principal value will fluctuate, and you may have a gain or loss when you sell your shares. Current performance may differ from figures shown. For most recent month-end performance, go to franklintempleton.com or call (800) 342-5236.
8 | Annual Report
franklintempleton.com
FRANKLIN BIOTECHNOLOGY DISCOVERY FUND
PERFORMANCE SUMMARY
Total Return Index Comparison for a Hypothetical $10,000 Investment2
Total return represents the change in value of an investment over the periods shown. It includes any applicable maximum sales charge, Fund expenses, account fees and reinvested distributions. The unmanaged indexes include reinvestment of any income or distributions. They differ from the Fund in composition and do not pay management fees or expenses. One cannot invest directly in an index.
franklintempleton.com Annual Report | 9
FRANKLIN BIOTECHNOLOGY DISCOVERY FUND
PERFORMANCE SUMMARY
Total Return Index Comparison for a Hypothetical $10,000 Investment2 (continued)
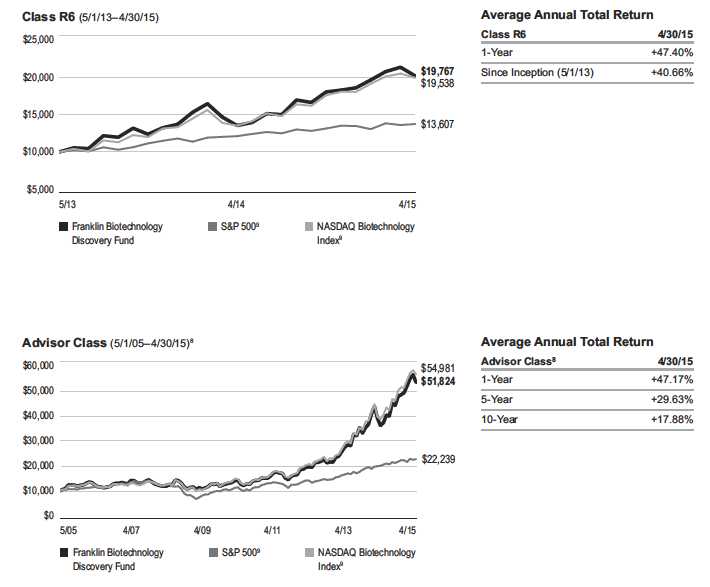
10 | Annual Report franklintempleton.com
FRANKLIN BIOTECHNOLOGY DISCOVERY FUND
PERFORMANCE SUMMARY
All investments involve risks, including possible loss of principal. The Fund is a nondiversified fund that concentrates in a single sector, which involves risks such as patent considerations, product liability, government regulatory requirements, and regulatory approval for new drugs and medical products. Biotechnology companies often are small and/or relatively new. Smaller companies can be particularly sensitive to changes in economic conditions and have less certain growth prospects than larger, more established companies and can be volatile, especially over the short term. The Fund may also invest in foreign companies, which involve special risks, including currency fluctuations and political uncertainty. The Fund is actively managed but there is no guarantee that the manager’s investment decisions will produce the desired results. The Fund’s prospectus also includes a description of the main investment risks.
| Class C: | These shares have higher annual fees and expenses than Class A shares. |
| Class R6: | Shares are available to certain eligible investors as described in the prospectus. |
| Advisor Class: | Shares are available to certain eligible investors as described in the prospectus. |
1. Price and total return information is based on net asset values calculated for shareholder transactions. Certain adjustments were made to Class C shares’ net assets at
4/30/14 for financial reporting purposes, and as a result, Class C shares’ net asset values for shareholder transactions and the total returns based on those net asset values
differ from the adjusted net asset values and total returns reported in the Financial Highlights.
2. The Fund has a fee waiver associated with its investments in a Franklin Templeton money fund, contractually guaranteed through at least its current fiscal year-end.
Class R6 has a fee waiver contractually guaranteed through at least the Fund’s current fiscal year-end. Fund investment results reflect the fee waivers, to the extent
applicable; without these reductions, the results would have been lower.
3. Cumulative total return represents the change in value of an investment over the periods indicated.
4. Average annual total return represents the average annual change in value of an investment over the periods indicated.
5. These figures represent the value of a hypothetical $10,000 investment in the Fund over the periods indicated.
6. In accordance with SEC rules, we provide standardized average annual total return information through the latest calendar quarter.
7. Figures are as stated in the Fund’s current prospectus. In periods of market volatility, assets may decline significantly, causing total annual Fund operating expenses to
become higher than the figures shown.
8. Effective 9/1/09, the Fund began offering Advisor Class shares, which do not have sales charges or a Rule 12b-1 plan. Performance quotations for this class reflect the
following methods of calculation: (a) For periods prior to 9/1/09, a restated figure is used based upon the Fund’s Class A performance, excluding the effect of Class A’s
maximum initial sales charge, but reflecting the effect of the Class A Rule 12b-1 fees; and (b) for periods after 9/1/09, actual Advisor Class performance is used reflecting all
charges and fees applicable to that class. Since 9/1/09 (commencement of sales), the cumulative and average annual total returns of Advisor Class shares were +318.61%
and +28.78%.
9. Source: Morningstar. The S&P 500 is a market capitalization-weighted index of 500 stocks designed to measure total U.S. equity market performance. The NASDAQ
Biotechnology Index is a modified capitalization-weighted index designed to measure performance of all NASDAQ stocks in the biotechnology sector.
See www.franklintempletondatasources.com for additional data provider information.
franklintempleton.com Annual Report | 11
FRANKLIN BIOTECHNOLOGY DISCOVERY FUND
Your Fund’s Expenses
As a Fund shareholder, you can incur two types of costs:
- Transaction costs, including sales charges (loads) on Fund purchases; and
- Ongoing Fund costs, including management fees, distribu- tion and service (12b-1) fees, and other Fund expenses. All mutual funds have ongoing costs, sometimes referred to as operating expenses.
The following table shows ongoing costs of investing in the Fund and can help you understand these costs and compare them with those of other mutual funds. The table assumes a $1,000 investment held for the six months indicated.
Actual Fund Expenses
The first line (Actual) for each share class listed in the table provides actual account values and expenses. The “Ending Account Value” is derived from the Fund’s actual return, which includes the effect of Fund expenses.
You can estimate the expenses you paid during the period by following these steps. Of course, your account value and expenses will differ from those in this illustration:
| 1. | Divide your account value by $1,000. |
| If an account had an $8,600 value, then $8,600 ÷ $1,000 = 8.6. | |
| 2. | Multiply the result by the number under the heading “Expenses Paid During Period.” |
| If Expenses Paid During Period were $7.50, then 8.6 x $7.50 = $64.50. |
In this illustration, the estimated expenses paid this period are $64.50.
Hypothetical Example for Comparison with Other Funds
Information in the second line (Hypothetical) for each class in the table can help you compare ongoing costs of investing in the Fund with those of other mutual funds. This information may not be used to estimate the actual ending account balance or expenses you paid during the period. The hypothetical “Ending Account Value” is based on the actual expense ratio for each class and an assumed 5% annual rate of return before expenses, which does not represent the Fund’s actual return. The figure under the heading “Expenses Paid During Period” shows the hypothetical expenses your account would have incurred under this scenario. You can compare this figure with the 5% hypothetical examples that appear in shareholder reports of other funds.
Please note that expenses shown in the table are meant to highlight ongoing costs and do not reflect any transaction costs, such as sales charges. Therefore, the second line for each class is useful in comparing ongoing costs only, and will not help you compare total costs of owning different funds. In addition, if transaction costs were included, your total costs would have been higher. Please refer to the Fund prospectus for additional information on operating expenses.
12 | Annual Report
franklintempleton.com
| FRANKLIN BIOTECHNOLOGY DISCOVERY FUND | ||||||
| YOUR FUND’S EXPENSES | ||||||
| Beginning Account | Ending Account | Expenses Paid During | ||||
| Share Class | Value 11/1/14 | Value 4/30/15 | Period* 11/1/14–4/30/15 | |||
| A | ||||||
| Actual | $ | 1,000 | $ | 1,112.90 | $ | 4.98 |
| Hypothetical (5% return before expenses) | $ | 1,000 | $ | 1,020.08 | $ | 4.76 |
| C | ||||||
| Actual | $ | 1,000 | $ | 1,108.60 | $ | 9.10 |
| Hypothetical (5% return before expenses) | $ | 1,000 | $ | 1,016.17 | $ | 8.70 |
| R6 | ||||||
| Actual | $ | 1,000 | $ | 1,114.80 | $ | 3.15 |
| Hypothetical (5% return before expenses) | $ | 1,000 | $ | 1,021.82 | $ | 3.01 |
| Advisor | ||||||
| Actual | $ | 1,000 | $ | 1,114.10 | $ | 3.88 |
| Hypothetical (5% return before expenses) | $ | 1,000 | $ | 1,021.12 | $ | 3.71 |
*Expenses are calculated using the most recent six-month expense ratio, net of expense waivers, annualized for each class (A: 0.95%;
C: 1.74%; R6: 0.60% and Advisor: 0.74%), multiplied by the average account value over the period, multiplied by 181/365 to reflect the
one-half year period.
franklintempleton.com
Annual Report
| 13
Franklin Natural Resources Fund
This annual report for Franklin Natural Resources Fund covers the fiscal year ended April 30, 2015.
Your Fund’s Goal and Main Investments
The Fund seeks high total return (total return consists of capital appreciation and current dividend and interest income) by investing, under normal market conditions, at least 80% of its net assets in equity and debt securities of companies that own, produce, refine, process, transport or market natural resources, as well as those that provide related services for natural resources companies.
Performance Overview
The Fund’s Class A shares had a -20.07% cumulative total return for the 12 months under review. In comparison, the Standard & Poor’s (S&P®) North American Natural Resources Index, which tracks companies involved in industries such as mining, energy, timber and forestry services, and the production of pulp and paper, had a -10.98% total return.1 Also in comparison, the S&P 500® Index, which is a broad measure of the U.S. stock market, generated a +12.98% total return.1 Please note index performance information is provided for reference and we do not attempt to track any index but rather undertake investments on the basis of fundamental research. The Fund’s strategy, which focuses on companies with higher long-term growth potential, differs from the natural resources index’s large weighting in income-oriented companies that typically provide more limited opportunities for growth. This difference may occasionally lead to wide performance discrepancies, especially in periods when investors focus on short-term safety and yield or, conversely, when investors focus more heavily on companies with stronger growth prospects, which benefited Fund performance late in the period under review. Furthermore, the Fund’s performance was generally in line with the performance of other natural resources funds with similar strategies. You can find the Fund’s long-term performance data in the Performance Summary beginning on page 18.
Performance data represent past performance, which does not guarantee future results. Investment return and principal value will fluctuate, and you may have a gain or loss when you sell your shares. Current performance may differ from figures shown. Please visit franklintempleton.com or call (800) 342-5236 for most recent month-end performance.
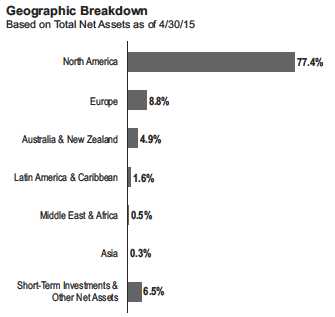
Investment Strategy
We use a fundamental, research-driven approach to identify industries in the natural resources sector that we believe offer the strongest underlying attributes including, but not limited to, favorable supply and demand characteristics, barriers to entry and pricing power. Within those industries, we seek to identify individual companies that have identifiable growth drivers and that present, in our opinion, the best trade-off between growth potential, business and financial risk, and valuation. The Fund’s holdings are typically concentrated in the energy sector but also can include investments in metals and mining, chemicals, paper and forest products, and other related sectors.
Sector Overview
Global commodity prices generally declined during the 12 months under review as a moderating global economy and growing production led to excess supplies of oil and other commodities. In addition, U.S. dollar strength for most of the period under review exacerbated the impact of weakening supply-and-demand fundamentals as diverging monetary policies between the U.S. Federal Reserve Board (Fed) and other major global central banks led to the U.S. dollar’s rapid appreciation against
1. Source: Morningstar.
The indexes are unmanaged and include reinvested dividends. One cannot invest directly in an index, and an index is not representative of the Fund’s portfolio.
The dollar value, number of shares or principal amount, and names of all portfolio holdings are listed in the Fund’s Statement of Investments (SOI).
The SOI begins on page 37.
14 | Annual Report franklintempleton.com
FRANKLIN NATURAL RESOURCES FUND
many foreign currencies. Near period-end, the Fed’s indication that it would remain patient with respect to raising interest rates amid mixed economic reports and the European Central Bank’s (ECB’s) assessment that its monetary stimulus efforts were having the desired effect led the U.S. dollar to retreat from recent highs, helping support global commodity prices.
Strong U.S. crude oil production and softening demand combined with a lack of action by the members of the Organization of the Petroleum Exporting Countries to help balance the market drove oil prices lower in late 2014 and early 2015, dragging many energy-related stocks to multi-year lows. A strengthening U.S. dollar also impacted oil prices as U.S. dollar-priced commodities became more expensive in most foreign currencies, which could negatively impact demand. After reaching a six-year low in March 2015, crude oil prices began to recover in April as U.S. production growth appeared to moderate and refinery demand picked up seasonally, leading U.S. inventories to decline for the first time since November 2014. Also supporting crude oil prices near period-end were concerns of potential supply disruptions in the Middle East due to rising geopolitical risks as Saudi Arabia launched a military campaign in Yemen and battles continued in Iraq and Syria. However, progress in nuclear negotiations with Iran and the potential lifting of sanctions prompted investor concerns related to the potential of Iranian oil returning to the global market, which could increase supply in a market that was moving toward a healthier balance. U.S. natural gas spot prices also fell for the period amid weak seasonal winter demand and rising U.S. natural gas production despite a drop in active rigs. Onshore rigs, in particular, declined sharply, from a peak of 1,876 in late 2014 to a low of 898 near period-end, as new drilling activity slowed, signaling the potential for better supply-and-demand balances over the longer term.2 U.S. crude oil and natural gas production overall remained relatively robust at period-end despite the use of fewer rigs amid technological improvements and a focus on the most promising assets, combined with a lag from drilling to production. However, lower drilling activity is expected to have a greater impact on production in the near future.
Gold and silver prices fell to multi-year lows in November, as low global inflation, a strong U.S. dollar and stronger-than-expected third-quarter U.S. economic growth dimmed the appeal of gold and silver as investments. Gold appreciated early in 2015 as it attracted safe-haven demand amid market
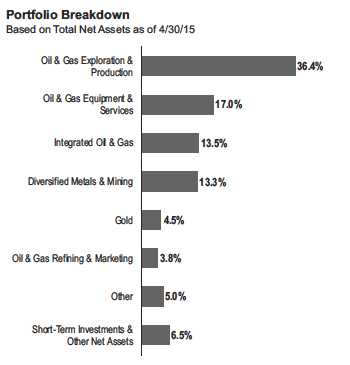
volatility, the ECB’s monetary easing, Greece’s debt negotiations and geopolitical tensions in the Middle East and Ukraine. However, U.S. dollar strength, market expectations that the Fed would raise interest rates sometime in 2015, and India’s decision to maintain an import duty on gold pressured prices near period-end. Prices for platinum and palladium, industrial metals widely used for auto production, also declined for the 12-month period as moderating global economic growth raised concerns about industrial demand, particularly as investors worried that auto sales could fall from recent high levels.
Base metals had mixed performance during the period. Aluminum was supported by rising demand from car, truck and plane manufacturers. Zinc benefited from robust demand created by gains in U.S. construction activity and solid global car sales, while a Colombian mine strike that threatened to constrain supplies also supported prices. Lead prices ended the period higher as producers reduced their output. In contrast, copper prices fell to multi-year lows in January and iron ore prices plunged to a 10-year low in April, amid oversupply and soft demand, which significantly impacted related stocks. However, prices for both metals recovered somewhat by period-end amid a generally improving global economic outlook, a weakening U.S. dollar and hopes that China’s stimulus measures would revive demand in that country.
2. Source: Baker Hughes Incorporated, “North America Rotary Rig Count,” 5/29/15.
franklintempleton.com Annual Report | 15
FRANKLIN NATURAL RESOURCES FUND
Manager’s Discussion
During the 12 months under review, the Fund’s performance was hindered by a difficult period for many commodities, particularly crude oil and natural gas, causing many energy-related stocks to perform poorly. Many exploration and production (E&P) stocks and oilfield services stocks performed well through June 2014, but they reversed course as fears of oil supply disruption faded and a modest global oversupply, largely resulting from robust U.S. oil production, became more evident. Furthermore, as has been the case in the past few years, investors appeared to gravitate toward the stocks of large-capitalization, dividend-paying companies, which contributed to the Fund’s underperformance relative to the benchmark S&P North American Natural Resources Index. The index held sizable positions in large-cap stocks, whereas the Fund had a larger weighting in small- and mid-capitalization stocks that typically have stronger prospects for long-term growth. However, many of the biggest detractors from performance in 2014 recovered strongly toward period-end, benefiting the Fund’s year-to-date performance in 2015.
Overall, stock selection in the E&P industry was among the major detractors from the Fund’s relative performance. Although news stories focused on oil prices, natural gas prices also suffered as reduced summer demand led to a rapid rebuilding of inventory. This decline had a significant negative impact, in absolute and relative terms, on natural gas-focused stocks held in the Fund, such as Rex Energy,3 Eclipse Resources,3 a new holding, and Southwestern Energy. Another area of weakness in absolute and relative terms was the Fund’s holdings in foreign E&P companies such as Tullow Oil,3 Gran Tierra Energy3 and MEG Energy,3 as well as many shale oil E&Ps, particularly Oasis Petroleum. However, several E&P holdings recovered from recent declines and delivered positive returns, notably Diamondback Energy, whose lower production costs and high-quality asset base helped it weather the difficult oil price environment.
Oilfield services holdings also hurt relative performance, largely due to the Fund’s overweighted allocation and stock selection in several U.S. onshore-focused companies. Investors avoided such stocks during most of the period as fears grew that the oil price decline could reduce onshore activity levels, which was confirmed as the U.S. onshore rig count declined
| Top 10 Holdings | ||
| 4/30/15 | ||
| Company | % of Total | |
| Sector/Industry, Country | Net Assets | |
| Anadarko Petroleum Corp. | 3.7 | % |
| Oil & Gas Exploration & Production, U.S. | ||
| Occidental Petroleum Corp. | 3.7 | % |
| Integrated Oil & Gas, U.S. | ||
| Chevron Corp. | 3.3 | % |
| Integrated Oil & Gas, U.S. | ||
| Schlumberger Ltd. | 3.2 | % |
| Oil & Gas Equipment & Services, U.S. | ||
| BHP Billiton PLC, ADR | 3.0 | % |
| Diversified Metals & Mining, Australia | ||
| Cabot Oil & Gas Corp., A | 2.9 | % |
| Oil & Gas Exploration & Production, U.S. | ||
| Marathon Oil Corp. | 2.3 | % |
| Oil & Gas Exploration & Production, U.S. | ||
| Noble Energy Inc. | 2.2 | % |
| Oil & Gas Exploration & Production, U.S. | ||
| Exxon Mobil Corp. | 2.2 | % |
| Integrated Oil & Gas, U.S. | ||
| Freeport-McMoRan Inc., B | 2.1 | % |
| Diversified Metals & Mining, U.S. | ||
precipitously late in the period. Major detractors from absolute and relative performance included Key Energy Services and C&J Energy Services. The Fund did own several stocks in the oilfield services industry that contributed to relative performance, including Dresser-Rand Group (not held at period-end), which received an acquisition offer from Siemens, and RPC, a new holding this period. An underweighting in National Oilwell Varco, which had a double-digit decline, also helped relative performance.
Many investors continued to favor master limited partnerships in the energy sector for their income potential, which bolstered midstream stocks or those in the oil and gas storage and transportation industry. Thus, the Fund’s lack of ownership in these stocks detracted from relative performance, as did an underweighting in oil and gas refining and marketing stocks, notably Valero and Marathon Petroleum. Although conservative, dividend-paying stocks outperformed over the entire 12-month period, they underperformed for the first four months of 2015 when many investors seemed to prefer smaller capitalization energy growth stocks amid tensions in the Middle East, the U.S. dollar’s retreat from recent highs toward period-end and a partial recovery in oil prices.
3. Not part of the index.
See www.franklintempletondatasources.com for additional data provider information.
16 | Annual Report franklintempleton.com
FRANKLIN NATURAL RESOURCES FUND
The diversified metals and mining industry also detracted from relative performance due to the Fund’s overweighted allocation compared to its benchmark’s modest exposure, but this effect was somewhat mitigated by stock selection. Significant detractors included Molycorp, which experienced start-up delays at its Mountain Pass facility, and global mining company BHP Billiton.3 Stocks that performed well included MMG (not held at period-end), which benefited from the completion of the La Bambas acquisition from Glencore (also a Fund holding), and HudBay Minerals, a new holding this period.3 Although metals and mining companies overall weighed on the Fund’s performance, we saw some positive signs near period-end, such as mine closures and capacity growth deferrals, which could help balance supply and demand over the longer term.
We sold several securities in May and June 2014 when we considered them fully valued and built our cash position during the period as we searched for more attractive investment opportunities. Positive contributors to relative performance included the Fund’s cash holdings, our off-benchmark allocation in the commodity chemicals industry, notably our investment in LyondellBassell Industries, and our underweighting in oil and gas drilling companies, particularly our lack of exposures to certain underperforming stocks. Furthermore, our holdings in certain gold stocks that outperformed the index and their peers, particularly Newcrest Mining and G-Resources Group, supported results.3 Although many of the sectors in which we invested were out of favor for most of the period, we believed our strategy of investing in growth-oriented companies in an opportunistic fashion has the potential to provide strong long-term total returns. Meanwhile, the Fund’s cash position provided us with the flexibility to take advantage of what we saw as short-term market volatility and invest in new and existing positions at prices we considered more attractive.
Thank you for your continued participation in Franklin Natural Resources Fund. We look forward to serving your future investment needs.

The foregoing information reflects our analysis, opinions and portfolio holdings as of April 30, 2015, the end of the reporting period. The way we implement our main investment strategies and the resulting portfolio holdings may change depending on factors such as market and economic conditions. These opinions may not be relied upon as investment advice or an offer for a particular security. The information is not a complete analysis of every aspect of any market, country, industry, security or the Fund. Statements of fact are from sources considered reliable, but the investment manager makes no representation or warranty as to their completeness or accuracy. Although historical performance is no guarantee of future results, these insights may help you understand our investment management philosophy.
franklintempleton.com
Annual Report
| 17
FRANKLIN NATURAL RESOURCES FUND
Performance Summary as of April 30, 2015
Your dividend income will vary depending on dividends or interest paid by securities in the Fund’s portfolio, adjusted for operating expenses of each class. Capital gain distributions are net profits realized from the sale of portfolio securities. The performance table and graphs do not reflect any taxes that a shareholder would pay on Fund dividends, capital gain distributions, if any, or any realized gains on the sale of Fund shares. Total return reflects reinvestment of the Fund’s dividends and capital gain distributions, if any, and any unrealized gains or losses.
| Net Asset Value | ||||||
| Share Class (Symbol) | 4/30/15 | 4/30/14 | Change | |||
| A (FRNRX) | $ | 31.46 | $ | 39.79 | -$ | 8.33 |
| C (FNCRX) | $ | 30.46 | $ | 38.39 | -$ | 7.93 |
| R6 (N/A) | $ | 33.62 | $ | 42.58 | -$ | 8.96 |
| Advisor (FNRAX) | $ | 33.63 | $ | 42.52 | -$ | 8.89 |
| Distributions (5/1/14–4/30/15) | ||||||
| Dividend | ||||||
| Share Class | Income | |||||
| A | $ | 0.2856 | ||||
| C | $ | 0.0084 | ||||
| R6 | $ | 0.5021 | ||||
| Advisor | $ | 0.3861 | ||||
18 | Annual Report
franklintempleton.com
FRANKLIN NATURAL RESOURCES FUND
PERFORMANCE SUMMARY
Performance as of 4/30/151
Cumulative total return excludes sales charges. Average annual total returns and value of $10,000 investment include maximum sales charges. Class A: 5.75% maximum initial sales charge; Class C: 1% contingent deferred sales charge in first year only;
Class R6/Advisor Class: no sales charges.
| Value of | Average Annual | Total Annual | ||||||||||
| Operating Expenses6 | ||||||||||||
| Cumulative | Average Annual | $ | 10,000 | Total Return | ||||||||
| Share Class | Total Return2 | Total Return3 | Investment4 | (3/31/15 | )5 | (with waiver) | (without waiver) | |||||
| A | 1.07 | % | 1.07 | % | ||||||||
| 1-Year | -20.07 | % | -24.67 | % | $ | 7,533 | -28.78 | % | ||||
| 5-Year | -1.43 | % | -1.46 | % | $ | 9,290 | -2.97 | % | ||||
| 10-Year | +76.01 | % | +5.19 | % | $ | 16,591 | +3.36 | % | ||||
| C | 1.76 | % | 1.76 | % | ||||||||
| 1-Year | -20.63 | % | -21.42 | % | $ | 7,858 | -25.72 | % | ||||
| 5-Year | -4.86 | % | -0.99 | % | $ | 9,514 | -2.49 | % | ||||
| Since Inception (9/1/05) | +26.69 | % | +2.48 | % | $ | 12,669 | +1.37 | % | ||||
| R6 | 0.53 | % | 0.55 | % | ||||||||
| 1-Year | -19.61 | % | -19.61 | % | $ | 8,039 | -24.03 | % | ||||
| Since Inception (9/20/13) | -10.10 | % | -6.41 | % | $ | 8,990 | -13.09 | % | ||||
| Advisor | 0.77 | % | 0.77 | % | ||||||||
| 1-Year | -19.81 | % | -19.81 | % | $ | 8,019 | -24.20 | % | ||||
| 5-Year | +0.06 | % | +0.01 | % | $ | 10,006 | -1.52 | % | ||||
| 10-Year | +81.30 | % | +6.13 | % | $ | 18,130 | +4.28 | % | ||||
Performance data represent past performance, which does not guarantee future results. Investment return and principal value will fluctuate, and you may have a gain or loss when you sell your shares. Current performance may differ from figures shown. For most recent month-end performance, go to franklintempleton.com or call (800) 342-5236.
franklintempleton.com
Annual Report
| 19
FRANKLIN NATURAL RESOURCES FUND
PERFORMANCE SUMMARY
Total Return Index Comparison for a Hypothetical $10,000 Investment1
Total return represents the change in value of an investment over the periods shown. It includes any applicable maximum sales charge, Fund expenses, account fees and reinvested distributions. The unmanaged indexes include reinvestment of any income or distributions. They differ from the Fund in composition and do not pay management fees or expenses. One cannot invest directly in an index.
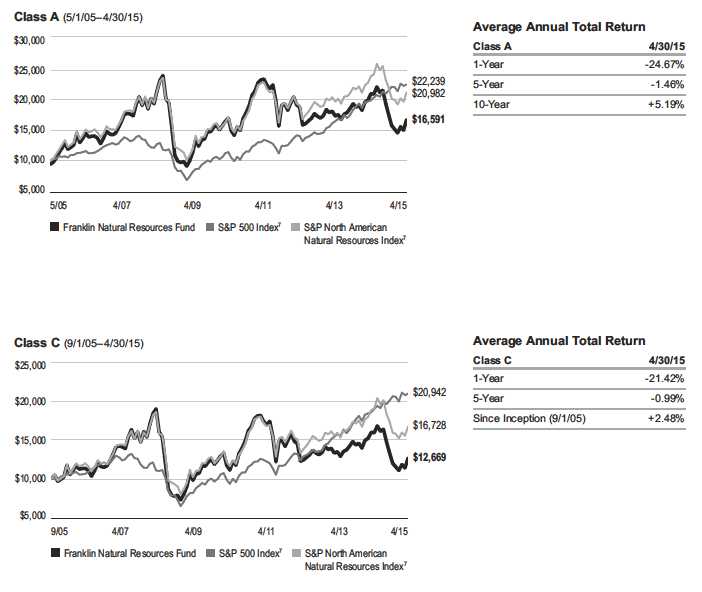
20 | Annual Report franklintempleton.com
FRANKLIN NATURAL RESOURCES FUND
PERFORMANCE SUMMARY
Total Return Index Comparison for a Hypothetical $10,000 Investment1 (continued)
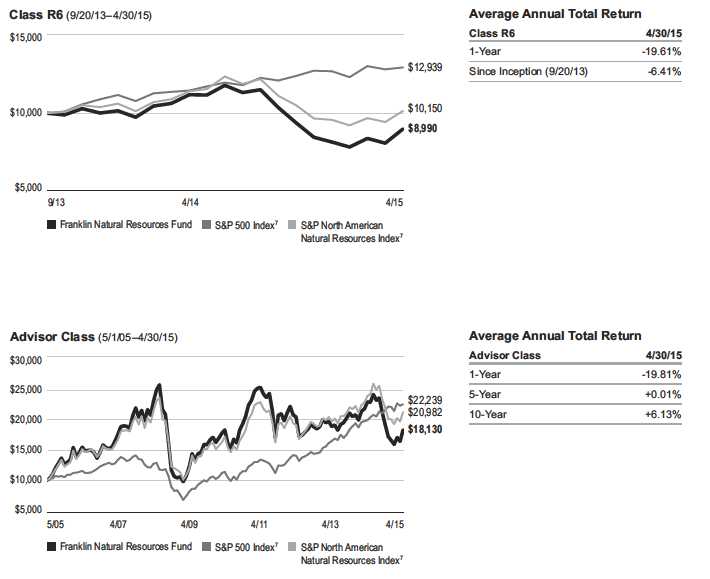
franklintempleton.com Annual Report | 21
FRANKLIN NATURAL RESOURCES FUND
PERFORMANCE SUMMARY
All investments involve risks, including possible loss of principal. Investing in a fund concentrating in the natural resources sector involves special risks, including increased susceptibility to adverse economic and regulatory developments affecting the sector. Smaller companies can be particularly sensitive to changes in economic conditions and have less certain growth prospects than larger, more established companies and can be volatile, especially over the short term. The Fund may also invest in foreign companies, which involve special risks, including currency fluctuations and political uncertainty. The Fund is actively managed but there is no guarantee that the manager’s investment decisions will produce the desired results. The Fund’s prospectus also includes a description of the main investment risks.
Class C: These shares have higher annual fees and expenses than Class A shares.
Class R6: Shares are available to certain eligible investors as described in the prospectus.
Advisor Class: Shares are available to certain eligible investors as described in the prospectus.
1. The Fund has a fee waiver associated with its investments in a Franklin Templeton money fund, contractually guaranteed through at least its current fiscal year-end.
Class R6 has a fee waiver contractually guaranteed through at least 8/31/15. Fund investment results reflect the fee waivers, to the extent applicable; without these
reductions, the results would have been lower.
2. Cumulative total return represents the change in value of an investment over the periods indicated.
3. Average annual total return represents the average annual change in value of an investment over the periods indicated.
4. These figures represent the value of a hypothetical $10,000 investment in the Fund over the periods indicated.
5. In accordance with SEC rules, we provide standardized average annual total return information through the latest calendar quarter.
6. Figures are as stated in the Fund’s current prospectus. In periods of market volatility, assets may decline significantly, causing total annual Fund operating expenses to
become higher than the figures shown.
7. Source: Morningstar. The S&P 500 Index is a market capitalization-weighted index of 500 stocks designed to measure total U.S. equity market performance. The S&P
North American Natural Resources Index is a modified capitalization-weighted index that includes companies involved in extractive industries (mining), energy and forestry
services, producers of pulp and paper, and owners and operators of timber tracts or plantations.
See www.franklintempletondatasources.com for additional data provider information.
22 | Annual Report franklintempleton.com
FRANKLIN NATURAL RESOURCES FUND
Your Fund’s Expenses
As a Fund shareholder, you can incur two types of costs:
- Transaction costs, including sales charges (loads) on Fund purchases; and
- Ongoing Fund costs, including management fees, distribu- tion and service (12b-1) fees, and other Fund expenses. All mutual funds have ongoing costs, sometimes referred to as operating expenses.
The following table shows ongoing costs of investing in the Fund and can help you understand these costs and compare them with those of other mutual funds. The table assumes a $1,000 investment held for the six months indicated.
Actual Fund Expenses
The first line (Actual) for each share class listed in the table provides actual account values and expenses. The “Ending Account Value” is derived from the Fund’s actual return, which includes the effect of Fund expenses.
You can estimate the expenses you paid during the period by following these steps. Of course, your account value and expenses will differ from those in this illustration:
| 1. | Divide your account value by $1,000. |
| If an account had an $8,600 value, then $8,600 ÷ $1,000 = 8.6. | |
| 2. | Multiply the result by the number under the heading “Expenses Paid During Period.” |
| If Expenses Paid During Period were $7.50, then 8.6 x $7.50 = $64.50. |
In this illustration, the estimated expenses paid this period are $64.50.
Hypothetical Example for Comparison with Other Funds
Information in the second line (Hypothetical) for each class in the table can help you compare ongoing costs of investing in the Fund with those of other mutual funds. This information may not be used to estimate the actual ending account balance or expenses you paid during the period. The hypothetical “Ending Account Value” is based on the actual expense ratio for each class and an assumed 5% annual rate of return before expenses, which does not represent the Fund’s actual return. The figure under the heading “Expenses Paid During Period” shows the hypothetical expenses your account would have incurred under this scenario. You can compare this figure with the 5% hypothetical examples that appear in shareholder reports of other funds.
Please note that expenses shown in the table are meant to highlight ongoing costs and do not reflect any transaction costs, such as sales charges. Therefore, the second line for each class is useful in comparing ongoing costs only, and will not help you compare total costs of owning different funds. In addition, if transaction costs were included, your total costs would have been higher. Please refer to the Fund prospectus for additional information on operating expenses.
franklintempleton.com Annual Report | 23
| FRANKLIN NATURAL RESOURCES FUND | ||||||
| YOUR FUND’S EXPENSES | ||||||
| Beginning Account | Ending Account | Expenses Paid During | ||||
| Share Class | Value 11/1/14 | Value 4/30/15 | Period* 11/1/14–4/30/15 | |||
| A | ||||||
| Actual | $ | 1,000 | $ | 955.70 | $ | 5.48 |
| Hypothetical (5% return before expenses) | $ | 1,000 | $ | 1,019.19 | $ | 5.66 |
| C | ||||||
| Actual | $ | 1,000 | $ | 952.20 | $ | 8.86 |
| Hypothetical (5% return before expenses) | $ | 1,000 | $ | 1,015.72 | $ | 9.15 |
| R6 | ||||||
| Actual | $ | 1,000 | $ | 958.50 | $ | 2.62 |
| Hypothetical (5% return before expenses) | $ | 1,000 | $ | 1,022.12 | $ | 2.71 |
| Advisor | ||||||
| Actual | $ | 1,000 | $ | 957.30 | $ | 4.03 |
| Hypothetical (5% return before expenses) | $ | 1,000 | $ | 1,020.68 | $ | 4.16 |
*Expenses are calculated using the most recent six-month expense ratio, net of expense waivers, annualized for each class (A: 1.13%;
C: 1.83%; R6: 0.54%; and Advisor: 0.83%), multiplied by the average account value over the period, multiplied by 181/365 to reflect the
one-half year period.
24 | Annual Report franklintempleton.com
| FRANKLIN STRATEGIC SERIES | |||||||||||||||
| Financial Highlights | |||||||||||||||
| Franklin Biotechnology Discovery Fund | |||||||||||||||
| Year Ended April 30, | |||||||||||||||
| 2015 | 2014 | 2013 | 2012 | 2011 | |||||||||||
| Class A | |||||||||||||||
| Per share operating performance | |||||||||||||||
| (for a share outstanding throughout the year) | |||||||||||||||
| Net asset value, beginning of year | $ | 129.27 | $ | 105.95 | $ | 76.22 | $ | 77.78 | $ | 65.08 | |||||
| Income from investment operationsa: | |||||||||||||||
| Net investment income (loss)b | (1.09 | ) | (1.07 | ) | (0.76 | ) | (0.75 | ) | (0.80 | ) | |||||
| Net realized and unrealized gains (losses) | 60.79 | 33.18 | 30.56 | 9.02 | 13.50 | ||||||||||
| Total from investment operations | 59.70 | 32.11 | 29.80 | 8.27 | 12.70 | ||||||||||
| Less distributions from: | |||||||||||||||
| Net investment income | — | — | (0.07 | ) | (0.52 | ) | — | ||||||||
| Net realized gains | (6.67 | ) | (8.79 | ) | — | (9.31 | ) | — | |||||||
| Total distributions | (6.67 | ) | (8.79 | ) | (0.07 | ) | (9.83 | ) | — | ||||||
| Net asset value, end of year | $ | 182.30 | $ | 129.27 | $ | 105.95 | $ | 76.22 | $ | 77.78 | |||||
| Total returnc | 46.81 | % | 30.60 | % | 39.12 | % | 13.18 | % | 19.51 | % | |||||
| Ratios to average net assets | |||||||||||||||
| Expenses | 1.00 | %d,e | 1.10 | %d,e | 1.20 | % | 1.26 | % | 1.31 | %e | |||||
| Net investment income (loss) | (0.67 | )% | (0.82 | )% | (0.88 | )% | (1.03 | )% | (1.24 | )% | |||||
| Supplemental data | |||||||||||||||
| Net assets, end of year (000’s) | $ | 1,601,906 | $ | 1,141,890 | $ | 653,718 | $ | 434,678 | $ | 402,112 | |||||
| Portfolio turnover rate | 41.43 | % | 48.70 | % | 33.64 | % | 46.54 | % | 235.14 | % | |||||
aThe amount shown for a share outstanding throughout the period may not correlate with the Statement of Operations for the period due to the timing of sales and
repurchases of the Fund’s shares in relation to income earned and/or fluctuating fair value of the investments of the Fund.
bBased on average daily shares outstanding.
cTotal return does not reflect sales commissions or contingent deferred sales charges, if applicable.
dBenefit of waiver and payments by affiliates rounds to less than 0.01%.
eBenefit of expense reduction rounds to less than 0.01%.
franklintempleton.com The accompanying notes are an integral part of these financial statements. | Annual Report | 25
FRANKLIN STRATEGIC SERIES
FINANCIAL HIGHLIGHTS
| Franklin Biotechnology Discovery Fund (continued) | ||||||
| Year Ended | ||||||
| April 30, | ||||||
| 2015 | 2014 | a | ||||
| Class C | ||||||
| Per share operating performance | ||||||
| (for a share outstanding throughout the year) | ||||||
| Net asset value, beginning of year | $ | 129.11 | $ | 159.15 | ||
| Income from investment operationsb: | ||||||
| Net investment income (loss)c | (2.38 | ) | (0.34 | ) | ||
| Net realized and unrealized gains (losses) | 60.61 | (29.70 | ) | |||
| Total from investment operations | 58.23 | (30.04 | ) | |||
| Less distributions from net realized gains | (6.67 | ) | — | |||
| Net asset value, end of year | $ | 180.67 | $ | 129.11 | ||
| Total returnd | 45.76 | % | (18.88 | )% | ||
| Ratios to average net assetse | ||||||
| Expensesf | 1.75 | % | 1.82 | % | ||
| Net investment income (loss) | (1.42 | )% | (1.52 | )% | ||
| Supplemental data | ||||||
| Net assets, end of year (000’s) | $ | 23,051 | $ | 5,486 | ||
| Portfolio turnover rate | 41.43 | % | 48.70 | % | ||
aFor the period March 4, 2014 (effective date) to April 30, 2014.
bThe amount shown for a share outstanding throughout the period may not correlate with the Statement of Operations for the period due to the timing of sales and
repurchases of the Fund’s shares in relation to income earned and/or fluctuating fair value of the investments of the Fund.
cBased on average daily shares outstanding.
dTotal return does not reflect sales commissions or contingent deferred sales charges, if applicable.
eRatios are annualized for periods less than one year.
fBenefit of waiver and payments by affiliates and expense reduction rounds to less than 0.01%.
26 | Annual Report | The accompanying notes are an integral part of these financial statements. franklintempleton.com
| FRANKLIN STRATEGIC SERIES |
| FINANCIAL HIGHLIGHTS |
| Franklin Biotechnology Discovery Fund (continued) | ||||||
| Year Ended | ||||||
| April 30, | ||||||
| 2015 | 2014 | a | ||||
| Class R6 | ||||||
| Per share operating performance | ||||||
| (for a share outstanding throughout the year) | ||||||
| Net asset value, beginning of year | $ | 131.09 | $ | 104.56 | ||
| Income from investment operationsb: | ||||||
| Net investment income (loss)c | (0.45 | ) | (0.49 | ) | ||
| Net realized and unrealized gains (losses) | 61.78 | 35.81 | ||||
| Total from investment operations | 61.33 | 35.32 | ||||
| Less distributions from net realized gains | (6.67 | ) | (8.79 | ) | ||
| Net asset value, end of year | $ | 185.75 | $ | 131.09 | ||
| Total return | 47.40 | % | 34.10 | % | ||
| Ratios to average net assets | ||||||
| Expensesd | 0.60 | % | 0.63 | % | ||
| Net investment income (loss) | (0.27 | )% | (0.35 | )% | ||
| Supplemental data | ||||||
| Net assets, end of year (000’s) | $ | 76,436 | $ | 50,846 | ||
| Portfolio turnover rate | 41.43 | % | 48.70 | % | ||
aFor the period May 1, 2013 (effective date) to April 30, 2014.
bThe amount shown for a share outstanding throughout the period may not correlate with the Statement of Operations for the period due to the timing of sales and
repurchases of the Fund’s shares in relation to income earned and/or fluctuating fair value of the investments of the Fund.
cBased on average daily shares outstanding.
dBenefit of waiver and payments by affiliates and expense reduction rounds to less than 0.01%.
franklintempleton.com The accompanying notes are an integral part of these financial statements. | Annual Report | 27
| FRANKLIN STRATEGIC SERIES | |||||||||||||||
| FINANCIAL HIGHLIGHTS | |||||||||||||||
| Franklin Biotechnology Discovery Fund (continued) | |||||||||||||||
| Year Ended April 30, | |||||||||||||||
| 2015 | 2014 | 2013 | 2012 | 2011 | |||||||||||
| Advisor Class | |||||||||||||||
| Per share operating performance | |||||||||||||||
| (for a share outstanding throughout the year) | |||||||||||||||
| Net asset value, beginning of year | $ | 130.86 | $ | 106.86 | $ | 76.65 | $ | 78.15 | $ | 65.20 | |||||
| Income from investment operationsa: | |||||||||||||||
| Net investment income (loss)b | (0.70 | ) | (0.69 | ) | (0.52 | ) | (0.53 | ) | (0.62 | ) | |||||
| Net realized and unrealized gains (losses) | 61.63 | 33.48 | 30.80 | 9.05 | 13.57 | ||||||||||
| Total from investment operations | 60.93 | 32.79 | 30.28 | 8.52 | 12.95 | ||||||||||
| Less distributions from: | |||||||||||||||
| Net investment income | — | — | (0.07 | ) | (0.71 | ) | — | ||||||||
| Net realized gains | (6.67 | ) | (8.79 | ) | — | (9.31 | ) | — | |||||||
| Total distributions | (6.67 | ) | (8.79 | ) | (0.07 | ) | (10.02 | ) | — | ||||||
| Net asset value, end of year | $ | 185.12 | $ | 130.86 | $ | 106.86 | $ | 76.65 | $ | 78.15 | |||||
| Total return | 47.17 | % | 31.02 | % | 39.51 | % | 13.51 | % | 19.86 | % | |||||
| Ratios to average net assets | |||||||||||||||
| Expenses | 0.75 | %c,d | 0.80 | %c,d | 0.91 | % | 0.97 | % | 1.02 | %d | |||||
| Net investment income (loss) | (0.42 | )% | (0.52 | )% | (0.59 | )% | (0.74 | )% | (0.95 | )% | |||||
| Supplemental data | |||||||||||||||
| Net assets, end of year (000’s) | $ | 167,035 | $ | 91,012 | $ | 25,744 | $ | 9,330 | $ | 5,009 | |||||
| Portfolio turnover rate | 41.43 | % | 48.70 | % | 33.64 | % | 46.54 | % | 235.14 | % | |||||
aThe amount shown for a share outstanding throughout the period may not correlate with the Statement of Operations for the period due to the timing of sales and
repurchases of the Fund’s shares in relation to income earned and/or fluctuating fair value of the investments of the Fund.
bBased on average daily shares outstanding.
cBenefit of waiver and payments by affiliates rounds to less than 0.01%.
dBenefit of expense reduction rounds to less than 0.01%.
28 | Annual Report | The accompanying notes are an integral part of these financial statements. franklintempleton.com
| FRANKLIN STRATEGIC SERIES | ||||
| Statement of Investments, April 30, 2015 | ||||
| Franklin Biotechnology Discovery Fund | ||||
| Shares/ | ||||
| Country | Warrants | Value | ||
| Common Stocks and Other Equity Interests 93.2% | ||||
| Biotechnology 80.7% | ||||
| aAcadia Pharmaceuticals Inc. | United States | 566,800 | $ | 19,367,556 |
| aAcceleron Pharma Inc. | United States | 205,900 | 5,693,135 | |
| aAchillion Pharmaceuticals Inc. | United States | 485,300 | 4,246,375 | |
| a,bADMA Biologics Inc. | United States | 131,700 | 1,107,597 | |
| bAduro Biotech Inc. | United States | 142,480 | 3,618,992 | |
| aAlexion Pharmaceuticals Inc. | United States | 226,600 | 38,347,518 | |
| aAlkermes PLC | United States | 128,600 | 7,120,582 | |
| aAlnylam Pharmaceuticals Inc. | United States | 251,400 | 25,610,118 | |
| Amgen Inc. | United States | 562,600 | 88,840,166 | |
| aAmicus Therapeutics Inc. | United States | 733,700 | 7,381,022 | |
| a,bAnthera Pharmaceuticals Inc. | United States | 932,862 | 4,001,978 | |
| a,cAptose Biosciences Inc., 144A | Canada | 488,883 | 2,795,353 | |
| aAquinox Pharmaceuticals Inc. | Canada | 237,800 | 1,602,772 | |
| a,bBellicum Pharmaceuticals Inc. | United States | 331,600 | 7,951,768 | |
| aBiogen Inc. | United States | 351,461 | 131,421,812 | |
| aBioMarin Pharmaceutical Inc. | United States | 543,456 | 60,894,245 | |
| aBiospecifics Technologies Corp. | United States | 85,550 | 3,277,420 | |
| aBluebird Bio Inc. | United States | 156,128 | 20,794,688 | |
| aCara Therapeutics Inc. | United States | 202,400 | 2,175,800 | |
| a,bCatalyst Pharmaceutical Partners Inc. | United States | 914,000 | 2,888,240 | |
| aCelgene Corp. | United States | 1,462,700 | 158,059,362 | |
| aCelldex Therapeutics Inc. | United States | 1,343,229 | 32,237,496 | |
| a,bCellectis SA, ADR | France | 97,700 | 3,214,330 | |
| a,bChemoCentryx Inc. | United States | 595,308 | 3,982,610 | |
| aConcert Pharmaceuticals Inc. | United States | 263,800 | 3,827,738 | |
| a,bCytRx Corp. | United States | 589,000 | 2,585,710 | |
| a,bDicerna Pharmaceuticals Inc. | United States | 224,823 | 4,512,198 | |
| aDyax Corp. | United States | 306,600 | 7,330,806 | |
| a,bDynavax Technologies Corp. | United States | 306,770 | 6,170,679 | |
| a,bEleven Biotherapeutics Inc. | United States | 386,300 | 4,573,792 | |
| a,dFibroGen Inc. | United States | 451,308 | 9,968,265 | |
| a,bForward Pharma AS, ADR | Denmark | 114,700 | 3,502,938 | |
| aGenocea Biosciences Inc. | United States | 342,700 | 3,509,248 | |
| aGilead Sciences Inc. | United States | 1,582,300 | 159,036,973 | |
| aGlycoMimetics Inc. | United States | 337,000 | 2,793,730 | |
| aHalozyme Therapeutics Inc. | United States | 426,600 | 6,343,542 | |
| a,b,eHeat Biologics Inc. | United States | 624,200 | 3,676,538 | |
| a,eHeron Therapeutics Inc. | United States | 1,664,710 | 17,978,868 | |
| a,c,eHeron Therapeutics Inc., wts., 144A, 7/01/16 | United States | 278,594 | 2,005,879 | |
| aImmune Design Corp. | United States | 327,300 | 7,341,339 | |
| aIncyte Corp. | United States | 695,900 | 67,613,644 | |
| bInotek Pharmaceuticals Corp. | United States | 332,200 | 2,013,132 | |
| a,dIntarcia Therapeutics Inc., DD | United States | 80,195 | 2,970,423 | |
| aIntercept Pharmaceuticals Inc. | United States | 110,600 | 27,960,786 | |
| aIsis Pharmaceuticals Inc. | United States | 240,400 | 13,635,488 | |
| aKaryopharm Therapeutics Inc. | United States | 675,800 | 18,354,728 | |
| a,bKeryx Biopharmaceuticals Inc. | United States | 1,435,500 | 15,302,430 | |
| a,bKite Pharma Inc. | United States | 123,144 | 6,203,995 | |
| aLa Jolla Pharmaceutical Co. | United States | 320,400 | 6,090,804 | |
| a,fLion Biotechnologies Inc. | United States | 830,700 | 9,910,251 | |
| a,fLpath Inc., A | United States | 833,913 | 1,684,504 | |
| franklintempleton.com | Annual Report | 29 | |||
| FRANKLIN STRATEGIC SERIES | ||||
| STATEMENT OF INVESTMENTS | ||||
| Franklin Biotechnology Discovery Fund (continued) | ||||
| Shares/ | ||||
| Country | Warrants | Value | ||
| Common Stocks and Other Equity Interests (continued) | ||||
| Biotechnology (continued) | ||||
| aMacroGenics Inc. | United States | 293,900 | $ | 8,408,479 |
| aMast Therapeutics Inc. | United States | 5,353,500 | 2,730,285 | |
| aMast Therapeutics Inc., wts., 6/14/18 | United States | 4,544,600 | 363,568 | |
| aMedivation Inc. | United States | 464,554 | 56,090,250 | |
| a,bMirati Therapeutics Inc. | Canada | 322,200 | 8,953,938 | |
| aNeurocrine Biosciences Inc. | United States | 541,100 | 18,446,099 | |
| a,bNewLink Genetics Corp. | United States | 231,000 | 10,302,600 | |
| a,gNorthwest Biotherapeutics Inc., wts., 2/20/19 | United States | 223,880 | 1,173,581 | |
| aNovavax Inc. | United States | 1,332,300 | 10,298,679 | |
| a,bOncoMed Pharmaceuticals Inc. | United States | 91,700 | 2,198,966 | |
| aOncothyreon Inc. | United States | 2,973,100 | 4,459,650 | |
| aOphthotech Corp. | United States | 13,632 | 617,257 | |
| a,bOrexigen Therapeutics Inc. | United States | 1,391,623 | 9,142,963 | |
| a,bOvaScience Inc. | United States | 14,800 | 366,226 | |
| a,cOvaScience Inc., 144A | United States | 166,654 | 4,123,853 | |
| Pfenex Inc. | United States | 625,100 | 8,345,085 | |
| aPortola Pharmaceuticals Inc. | United States | 605,400 | 21,606,726 | |
| aProQR Therapeutics NV | Netherlands | 103,700 | 1,967,189 | |
| aPTC Therapeutics Inc. | United States | 160,000 | 9,400,000 | |
| aPuma Biotechnology Inc. | United States | 278,244 | 50,245,301 | |
| aRadius Health Inc. | United States | 168,900 | 6,053,376 | |
| aReceptos Inc. | United States | 128,573 | 18,943,946 | |
| aRegeneron Pharmaceuticals Inc. | United States | 132,209 | 60,480,329 | |
| aRetrophin Inc. | United States | 519,794 | 11,196,363 | |
| aSage Therapeutics Inc. | United States | 197,070 | 10,444,710 | |
| aSangamo BioSciences Inc. | United States | 282,900 | 3,499,473 | |
| aSpark Therapeutics Inc. | United States | 53,000 | 3,035,310 | |
| aStemline Therapeutics Inc. | United States | 606,400 | 8,422,896 | |
| aTargacept Inc. | United States | 191,432 | 440,294 | |
| a,bTekmira Pharmaceuticals Corp. | Canada | 803,000 | 12,422,410 | |
| aTesaro Inc. | United States | 228,100 | 12,424,607 | |
| aThreshold Pharmaceuticals Inc. | United States | 1,055,600 | 3,736,824 | |
| aThreshold Pharmaceuticals Inc., wts., 3/16/16 | United States | 190,476 | 82,286 | |
| aThreshold Pharmaceuticals Inc., wts., 2/12/20 | United States | 439,500 | — | |
| a,bTokai Pharmaceuticals Inc. | United States | 183,000 | 1,830,000 | |
| aTonix Pharmaceuticals Holding Corp. | United States | 147,281 | 905,778 | |
| aTrillium Therapeutics Inc. | Canada | 158,100 | 3,011,805 | |
| aUltragenyx Pharmaceutical Inc. | United States | 82,400 | 4,649,832 | |
| aVertex Pharmaceuticals Inc. | United States | 397,500 | 49,003,800 | |
| aXencor Inc. | United States | 339,701 | 4,830,548 | |
| a,bZafgen Inc. | United States | 313,026 | 9,741,369 | |
| 1,507,926,014 | ||||
| Life Sciences Tools & Services 3.6% | ||||
| aFluidigm Corp. | United States | 440,500 | 16,501,130 | |
| aIllumina Inc. | United States | 280,200 | 51,626,850 | |
| 68,127,980 | ||||
30 | Annual Report
franklintempleton.com
FRANKLIN STRATEGIC SERIES
STATEMENT OF INVESTMENTS
| Franklin Biotechnology Discovery Fund (continued) | |||||
| Shares/ | |||||
| Country | Warrants | Value | |||
| Common Stocks and Other Equity Interests (continued) | |||||
| Pharmaceuticals 8.9% | |||||
| a,bAlcobra Ltd. | Israel | 207,647 | $ | 1,220,964 | |
| aAratana Therapeutics Inc. | United States | 546,000 | 7,048,860 | ||
| aCarbylan Therapeutics Inc. | United States | 675,300 | 3,403,512 | ||
| aDermira Inc. | United States | 159,200 | 2,348,200 | ||
| aFlex Pharma Inc. | United States | 120,200 | 2,009,744 | ||
| aFoamix Pharmaceuticals Ltd. | Israel | 413,800 | 4,104,896 | ||
| a,bGW Pharmaceuticals PLC, ADR | United Kingdom | 94,767 | 9,917,367 | ||
| aIntra-Cellular Therapies Inc. | United States | 146,500 | 2,995,925 | ||
| aJazz Pharmaceuticals PLC | United States | 160,800 | 28,734,960 | ||
| Marinus Pharmaceuticals Inc. | United States | 490,600 | 4,356,528 | ||
| a,bNuvo Research Inc. | Canada | 112,036 | 412,214 | ||
| a,cNuvo Research Inc., 144A | Canada | 52,941 | 194,786 | ||
| aRelypsa Inc. | United States | 271,600 | 7,857,388 | ||
| aRevance Therapeutics Inc. | United States | 274,300 | 5,396,853 | ||
| aSagent Pharmaceuticals Inc. | United States | 597,557 | 13,929,054 | ||
| aSciClone Pharmaceuticals Inc. | United States | 1,669,019 | 13,635,885 | ||
| Shire PLC, ADR | Ireland | 165,400 | 40,276,554 | ||
| aTherapeuticsMD Inc. | United States | 2,320,600 | 15,037,488 | ||
| a,bZogenix Inc. | United States | 2,015,600 | 2,801,684 | ||
| 165,682,862 | |||||
| Total Common Stocks and Other Equity Interests | |||||
| (Cost $942,528,844) | 1,741,736,856 | ||||
| Convertible Preferred Stocks (Cost $854,316) 0.3% | |||||
| Biotechnology 0.3% | |||||
| a,dAduro Biotech Inc., 8.00%, cvt. pfd., D | United States | 316,074 | 5,202,325 | ||
| Preferred Stocks 0.3% | |||||
| Biotechnology 0.3% | |||||
| a,gEdge Therapeutics Inc., pfd. | United States | 688,172 | 3,200,000 | ||
| a,dNatera Inc., pfd. | United States | 258,620 | 2,056,029 | ||
| Total Preferred Stocks (Cost $5,224,998) | 5,256,029 | ||||
| Total Investments before Short Term Investments | |||||
| (Cost $948,608,158) | 1,752,195,210 | ||||
| Short Term Investments 10.8% | |||||
| Money Market Funds (Cost $117,766,042) 6.3% | |||||
| a,hInstitutional Fiduciary Trust Money Market Portfolio | United States | 117,766,042 | 117,766,042 | ||
| iInvestments from Cash Collateral Received for Loaned Securities | |||||
| (Cost $83,916,132) 4.5% | |||||
| Money Market Funds 4.5% | |||||
| a,hInstitutional Fiduciary Trust Money Market Portfolio | United States | 83,916,132 | 83,916,132 | ||
| Total Investments (Cost $1,150,290,332) 104.6% | 1,953,877,384 | ||||
| Other Assets, less Liabilities (4.6)% | (85,449,685 | ) | |||
| Net Assets 100.0% | $ | 1,868,427,699 | |||
franklintempleton.com
Annual Report
| 31
FRANKLIN STRATEGIC SERIES
STATEMENT OF INVESTMENTS
Franklin Biotechnology Discovery Fund (continued)
See Abbreviations on page 56.
aNon-income producing.
bA portion or all of the security is on loan at April 30, 2015. See Note 1(c).
cSecurity was purchased pursuant to Rule 144A under the Securities Act of 1933 and may be sold in transactions exempt from registration only to qualified institutional
buyers or in a public offering registered under the Securities Act of 1933. These securities have been deemed liquid under guidelines approved by the Trust’s Board of
Trustees. At April 30, 2015, the aggregate value of these securities was $9,119,871, representing 0.49% of net assets.
dSee Note 7 regarding restricted securities.
eSee Note 8 regarding holdings of 5% voting securities.
fAt April 30, 2015, pursuant to the Fund’s policies and the requirements of applicable securities law, the Fund may be restricted from trading these securities for a limited
or extended period of time.
gSecurity has been deemed illiquid because it may not be able to be sold within seven days. At April 30, 2015, the aggregate value of these securities was $4,373,581,
representing 0.23% of net assets.
hSee Note 3(f) regarding investments in Institutional Fiduciary Trust Money Market Portfolio.
iSee Note 1(c) regarding securities on loan.
32 | Annual Report | The accompanying notes are an integral part of these financial statements.
franklintempleton.com
| FRANKLIN STRATEGIC SERIES | |||||||||||||||
| Financial Highlights | |||||||||||||||
| Franklin Natural Resources Fund | |||||||||||||||
| Year Ended April 30, | |||||||||||||||
| 2015 | 2014 | 2013 | 2012 | 2011 | |||||||||||
| Class A | |||||||||||||||
| Per share operating performance | |||||||||||||||
| (for a share outstanding throughout the year) | |||||||||||||||
| Net asset value, beginning of year | $ | 39.79 | $ | 33.03 | $ | 35.81 | $ | 44.75 | $ | 33.15 | |||||
| Income from investment operationsa: | |||||||||||||||
| Net investment incomeb | 0.23 | 0.19 | 0.08 | 0.04 | 0.03 | ||||||||||
| Net realized and unrealized gains (losses) | (8.27 | ) | 6.65 | (2.86 | ) | (8.72 | ) | 12.21 | |||||||
| Total from investment operations | (8.04 | ) | 6.84 | (2.78 | ) | (8.68 | ) | 12.24 | |||||||
| Less distributions from net investment income | (0.29 | ) | (0.08 | ) | — | (0.26 | ) | (0.64 | ) | ||||||
| Net asset value, end of year | $ | 31.46 | $ | 39.79 | $ | 33.03 | $ | 35.81 | $ | 44.75 | |||||
| Total returnc | (20.07 | )% | 20.74 | % | (7.76 | )% | (19.36 | )% | 37.31 | % | |||||
| Ratios to average net assets | |||||||||||||||
| Expenses | 1.08 | %d | 1.07 | %d | 1.08 | % | 1.03 | % | 1.00 | % | |||||
| Net investment income | 0.67 | % | 0.53 | % | 0.26 | % | 0.11 | % | 0.07 | % | |||||
| Supplemental data | |||||||||||||||
| Net assets, end of year (000’s) | $ | 572,518 | $ | 624,250 | $ | 628,722 | $ | 827,693 | $ | 1,153,098 | |||||
| Portfolio turnover rate | 30.05 | % | 21.03 | % | 20.40 | % | 26.75 | % | 23.60 | % | |||||
aThe amount shown for a share outstanding throughout the period may not correlate with the Statement of Operations for the period due to the timing of sales and
repurchases of the Fund’s shares in relation to income earned and/or fluctuating fair value of the investments of the Fund.
bBased on average daily shares outstanding.
cTotal return does not reflect sales commissions or contingent deferred sales charges, if applicable.
dBenefit of waiver and payments by affiliates and expense reduction rounds to less than 0.01%.
franklintempleton.com The accompanying notes are an integral part of these financial statements. | Annual Report | 33
| FRANKLIN STRATEGIC SERIES | |||||||||||||||
| FINANCIAL HIGHLIGHTS | |||||||||||||||
| Franklin Natural Resources Fund (continued) | |||||||||||||||
| Year Ended April 30, | |||||||||||||||
| 2015 | 2014 | 2013 | 2012 | 2011 | |||||||||||
| Class C | |||||||||||||||
| Per share operating performance | |||||||||||||||
| (for a share outstanding throughout the year) | |||||||||||||||
| Net asset value, beginning of year | $ | 38.39 | $ | 32.02 | $ | 34.96 | $ | 43.87 | $ | 32.57 | |||||
| Income from investment operationsa: | |||||||||||||||
| Net investment income (loss)b | (0.01 | ) | (0.06 | ) | (0.14 | ) | (0.22 | ) | (0.23 | ) | |||||
| Net realized and unrealized gains (losses) | (7.91 | ) | 6.43 | (2.80 | ) | (8.53 | ) | 11.98 | |||||||
| Total from investment operations | (7.92 | ) | 6.37 | (2.94 | ) | (8.75 | ) | 11.75 | |||||||
| Less distributions from net investment income | (0.01 | ) | — | — | (0.16 | ) | (0.45 | ) | |||||||
| Net asset value, end of year | $ | 30.46 | $ | 38.39 | $ | 32.02 | $ | 34.96 | $ | 43.87 | |||||
| Total returnc | (20.63 | )% | 19.89 | % | (8.41 | )% | (19.91 | )% | 36.30 | % | |||||
| Ratios to average net assets | |||||||||||||||
| Expenses | 1.78 | %d | 1.76 | %d | 1.77 | % | 1.73 | % | 1.70 | % | |||||
| Net investment income (loss) | (0.03 | )% | (0.16 | )% | (0.43 | )% | (0.59 | )% | (0.63 | )% | |||||
| Supplemental data | |||||||||||||||
| Net assets, end of year (000’s) | $ | 123,735 | $ | 126,651 | $ | 130,424 | $ | 176,036 | $ | 241,746 | |||||
| Portfolio turnover rate | 30.05 | % | 21.03 | % | 20.40 | % | 26.75 | % | 23.60 | % | |||||
aThe amount shown for a share outstanding throughout the period may not correlate with the Statement of Operations for the period due to the timing of sales and
repurchases of the Fund’s shares in relation to income earned and/or fluctuating fair value of the investments of the Fund.
bBased on average daily shares outstanding.
cTotal return does not reflect sales commissions or contingent deferred sales charges, if applicable.
dBenefit of waiver and payments by affiliates and expense reduction rounds to less than 0.01%.
34 | Annual Report | The accompanying notes are an integral part of these financial statements. franklintempleton.com
| FRANKLIN STRATEGIC SERIES |
| FINANCIAL HIGHLIGHTS |
| Franklin Natural Resources Fund (continued) | ||||||
| Year Ended | ||||||
| April 30, | ||||||
| 2015 | 2014 | a | ||||
| Class R6 | ||||||
| Per share operating performance | ||||||
| (for a share outstanding throughout the year) | ||||||
| Net asset value, beginning of year | $ | 42.58 | $ | 38.28 | ||
| Income from investment operationsb: | ||||||
| Net investment incomec | 0.46 | 0.19 | ||||
| Net realized and unrealized gains (losses) | (8.92 | ) | 4.31 | |||
| Total from investment operations | (8.46 | ) | 4.50 | |||
| Less distributions from net investment income | (0.50 | ) | (0.20 | ) | ||
| Net asset value, end of year | $ | 33.62 | $ | 42.58 | ||
| Total returnd | (19.61 | )% | 11.83 | % | ||
| Ratios to average net assetse | ||||||
| Expenses before waiver and payments by affiliates | 0.55 | % | 0.55 | % | ||
| Expenses net of waiver and payments by affiliatesf | 0.54 | % | 0.53 | % | ||
| Net investment income | 1.21 | % | 1.07 | % | ||
| Supplemental data | ||||||
| Net assets, end of year (000’s) | $ | 439 | $ | 939 | ||
| Portfolio turnover rate | 30.05 | % | 21.03 | % | ||
aFor the period September 20, 2013 (effective date) to April 30, 2014.
bThe amount shown for a share outstanding throughout the period may not correlate with the Statement of Operations for the period due to the timing of sales and
repurchases of the Fund’s shares in relation to income earned and/or fluctuating fair value of the investments of the Fund.
cBased on average daily shares outstanding.
dTotal return is not annualized for periods less than one year.
eRatios are annualized for periods less than one year.
fBenefit of expense reduction rounds to less than 0.01%.
franklintempleton.com The accompanying notes are an integral part of these financial statements. | Annual Report | 35
| FRANKLIN STRATEGIC SERIES | |||||||||||||||
| FINANCIAL HIGHLIGHTS | |||||||||||||||
| Franklin Natural Resources Fund (continued) | |||||||||||||||
| Year Ended April 30, | |||||||||||||||
| 2015 | 2014 | 2013 | 2012 | 2011 | |||||||||||
| Advisor Class | |||||||||||||||
| Per share operating performance | |||||||||||||||
| (for a share outstanding throughout the year) | |||||||||||||||
| Net asset value, beginning of year | $ | 42.52 | $ | 35.31 | $ | 38.17 | $ | 47.58 | $ | 35.19 | |||||
| Income from investment operationsa: | |||||||||||||||
| Net investment incomeb | 0.35 | 0.31 | 0.21 | 0.16 | 0.14 | ||||||||||
| Net realized and unrealized gains (losses) | (8.85 | ) | 7.10 | (3.07 | ) | (9.27 | ) | 12.98 | |||||||
| Total from investment operations | (8.50 | ) | 7.41 | (2.86 | ) | (9.11 | ) | 13.12 | |||||||
| Less distributions from net investment income | (0.39 | ) | (0.20 | ) | — | (0.30 | ) | (0.73 | ) | ||||||
| Net asset value, end of year | $ | 33.63 | $ | 42.52 | $ | 35.31 | $ | 38.17 | $ | 47.58 | |||||
| Total return | (19.81 | )% | 21.07 | % | (7.49 | )% | (19.10 | )% | 37.70 | % | |||||
| Ratios to average net assets | |||||||||||||||
| Expenses | 0.78 | %c | 0.77 | %c | 0.78 | % | 0.73 | % | 0.70 | % | |||||
| Net investment income | 0.97 | % | 0.83 | % | 0.56 | % | 0.41 | % | 0.37 | % | |||||
| Supplemental data | |||||||||||||||
| Net assets, end of year (000’s) | $ | 79,307 | $ | 94,651 | $ | 117,087 | $ | 235,810 | $ | 243,180 | |||||
| Portfolio turnover rate | 30.05 | % | 21.03 | % | 20.40 | % | 26.75 | % | 23.60 | % | |||||
aThe amount shown for a share outstanding throughout the period may not correlate with the Statement of Operations for the period due to the timing of sales and
repurchases of the Fund’s shares in relation to income earned and/or fluctuating fair value of the investments of the Fund.
bBased on average daily shares outstanding.
cBenefit of waiver and payments by affiliates and expense reduction rounds to less than 0.01%.
36 | Annual Report | The accompanying notes are an integral part of these financial statements. franklintempleton.com
FRANKLIN STRATEGIC SERIES
| Statement of Investments, April 30, 2015 | ||||
| Franklin Natural Resources Fund | ||||
| Country | Shares | Value | ||
| Common Stocks 92.1% | ||||
| Coal & Consumable Fuels 0.3% | ||||
| a,bEnergy Coal Resources, 144A | United States | 199,375 | $ | — |
| Peabody Energy Corp. | United States | 515,650 | 2,439,023 | |
| 2,439,023 | ||||
| Commodity Chemicals 1.2% | ||||
| Axiall Corp. | United States | 106,800 | 4,357,440 | |
| LyondellBasell Industries NV, A | United States | 46,400 | 4,803,328 | |
| 9,160,768 | ||||
| Construction Materials 0.4% | ||||
| Martin Marietta Materials Inc. | United States | 24,400 | 3,480,660 | |
| Diversified Metals & Mining 13.2% | ||||
| cBHP Billiton PLC, ADR | Australia | 474,500 | 22,918,350 | |
| First Quantum Minerals Ltd. | Zambia | 247,700 | 3,793,243 | |
| Freeport-McMoRan Inc., B | United States | 707,900 | 16,472,833 | |
| Glencore PLC | Switzerland | 3,198,000 | 15,238,884 | |
| HudBay Minerals Inc. | Canada | 448,500 | 4,433,897 | |
| aImperial Metals Corp. | Canada | 321,800 | 3,490,667 | |
| aNautilus Minerals Inc. | Canada | 746,000 | 290,549 | |
| PanAust Ltd. | Australia | 3,564,487 | 4,922,220 | |
| Rio Tinto PLC, ADR | United Kingdom | 234,500 | 10,503,255 | |
| Sandfire Resources NL | Australia | 1,648,867 | 6,419,768 | |
| Southern Copper Corp. | Mexico | 110,700 | 3,606,606 | |
| Teck Resources Ltd., B | Canada | 695,200 | 10,553,136 | |
| 102,643,408 | ||||
| Fertilizers & Agricultural Chemicals 0.7% | ||||
| The Mosaic Co. | United States | 127,600 | 5,614,400 | |
| Gold 4.5% | ||||
| Agnico Eagle Mines Ltd. | Canada | 119,500 | 3,616,441 | |
| Alamos Gold Inc. | Canada | 291,100 | 2,011,829 | |
| aB2Gold Corp. | Canada | 2,411,100 | 3,776,241 | |
| Barrick Gold Corp. | Canada | 295,100 | 3,842,202 | |
| aG-Resources Group Ltd. | Hong Kong | 76,942,160 | 2,531,515 | |
| Goldcorp Inc. | Canada | 395,700 | 7,451,031 | |
| aNewcrest Mining Ltd. | Australia | 300,000 | 3,430,502 | |
| Randgold Resources Ltd., ADR | Jersey Islands | 69,800 | 5,316,666 | |
| aRomarco Minerals Inc. | Canada | 6,980,400 | 2,631,930 | |
| 34,608,357 | ||||
| Integrated Oil & Gas 13.5% | ||||
| BP PLC, ADR | United Kingdom | 174,200 | 7,518,472 | |
| Chevron Corp. | United States | 227,800 | 25,299,468 | |
| Exxon Mobil Corp. | United States | 198,200 | 17,316,734 | |
| Occidental Petroleum Corp. | United States | 358,000 | 28,675,800 | |
| a,cPetroleo Brasileiro SA, ADR | Brazil | 302,400 | 2,872,800 | |
| Royal Dutch Shell PLC, A, ADR | United Kingdom | 167,000 | 10,592,810 | |
| Total SA, B, ADR | France | 226,400 | 12,248,240 | |
| 104,524,324 | ||||
franklintempleton.com
Annual Report
| 37
FRANKLIN STRATEGIC SERIES
STATEMENT OF INVESTMENTS
| Franklin Natural Resources Fund (continued) | ||||
| Country | Shares | Value | ||
| Common Stocks (continued) | ||||
| Oil & Gas Drilling 1.9% | ||||
| Ensco PLC, A | United States | 102,619 | $ | 2,799,446 |
| Noble Corp. PLC | United States | 125,000 | 2,163,750 | |
| aPioneer Energy Services Corp. | United States | 709,337 | 5,284,561 | |
| Rowan Cos. PLC | United States | 221,200 | 4,687,228 | |
| 14,934,985 | ||||
| Oil & Gas Equipment & Services 17.0% | ||||
| Baker Hughes Inc. | United States | 163,300 | 11,179,518 | |
| aC&J Energy Services Ltd. | United States | 323,500 | 5,645,075 | |
| aCameron International Corp. | United States | 210,600 | 11,545,092 | |
| aDril-Quip Inc. | United States | 77,800 | 6,202,216 | |
| aFMC Technologies Inc. | United States | 213,600 | 9,419,760 | |
| aForum Energy Technologies Inc. | United States | 116,700 | 2,714,442 | |
| Halliburton Co. | United States | 236,035 | 11,553,913 | |
| aHornbeck Offshore Services Inc. | United States | 151,800 | 3,468,630 | |
| aKey Energy Services Inc. | United States | 773,800 | 1,888,072 | |
| National Oilwell Varco Inc. | United States | 29,500 | 1,605,095 | |
| Oceaneering International Inc. | United States | 225,300 | 12,416,283 | |
| aOil States International Inc. | United States | 70,400 | 3,350,336 | |
| aPHI Inc., non-voting | United States | 93,600 | 2,932,488 | |
| aRigNet Inc. | United States | 164,100 | 6,147,186 | |
| RPC Inc. | United States | 200,600 | 3,191,546 | |
| Schlumberger Ltd. | United States | 265,304 | 25,100,412 | |
| Superior Energy Services Inc. | United States | 311,800 | 7,950,900 | |
| aWeatherford International PLC | United States | 390,900 | 5,687,595 | |
| 131,998,559 | ||||
| Oil & Gas Exploration & Production 35.1% | ||||
| Anadarko Petroleum Corp. | United States | 308,400 | 29,020,440 | |
| Cabot Oil & Gas Corp., A | United States | 660,900 | 22,351,638 | |
| aCallon Petroleum Co. | United States | 749,300 | 6,698,742 | |
| Canadian Natural Resources Ltd. | Canada | 413,700 | 13,743,719 | |
| Cimarex Energy Co. | United States | 83,800 | 10,424,720 | |
| aCobalt International Energy Inc. | United States | 468,100 | 5,008,670 | |
| aConcho Resources Inc. | United States | 111,100 | 14,071,926 | |
| Devon Energy Corp. | United States | 110,500 | 7,537,205 | |
| aDiamondback Energy Inc. | United States | 127,700 | 10,544,189 | |
| aEclipse Resources Corp. | United States | 295,100 | 1,867,983 | |
| EnCana Corp. | Canada | 215,200 | 3,057,992 | |
| EOG Resources Inc. | United States | 115,700 | 11,448,515 | |
| EQT Corp. | United States | 157,900 | 14,201,526 | |
| aGran Tierra Energy Inc. | Colombia | 1,649,000 | 6,134,280 | |
| Hess Corp. | United States | 201,800 | 15,518,420 | |
| Marathon Oil Corp. | United States | 561,500 | 17,462,650 | |
| aMatador Resources Co. | United States | 209,746 | 5,814,159 | |
| aMEG Energy Corp. | Canada | 164,500 | 3,172,086 | |
| Noble Energy Inc. | United States | 343,100 | 17,402,032 | |
| aOasis Petroleum Inc. | United States | 343,100 | 6,155,214 | |
| aOphir Energy PLC | United Kingdom | 1,750,000 | 3,816,711 | |
| Pioneer Natural Resources Co. | United States | 77,400 | 13,373,172 | |
| aRex Energy Corp. | United States | 1,111,900 | 5,559,500 | |
| aRice Energy Inc. | United States | 132,000 | 3,251,160 | |
| SM Energy Co. | United States | 174,900 | 10,138,953 |
38 | Annual Report franklintempleton.com
FRANKLIN STRATEGIC SERIES
STATEMENT OF INVESTMENTS
| Franklin Natural Resources Fund (continued) | ||||||
| Country | Shares | Value | ||||
| Common Stocks (continued) | ||||||
| Oil & Gas Exploration & Production (continued) | ||||||
| aSouthwestern Energy Co. | United States | 402,300 | $ | 11,276,469 | ||
| Tullow Oil PLC | United Kingdom | 488,600 | 3,106,074 | |||
| 272,158,145 | ||||||
| Oil & Gas Refining & Marketing 3.8% | ||||||
| HollyFrontier Corp. | United States | 219,000 | 8,492,820 | |||
| Marathon Petroleum Corp. | United States | 45,100 | 4,445,507 | |||
| Phillips 66 | United States | 141,800 | 11,246,158 | |||
| Valero Energy Corp. | United States | 95,800 | 5,451,020 | |||
| 29,635,505 | ||||||
| Precious Metals & Minerals 0.5% | ||||||
| Tahoe Resources Inc. | United States | 176,600 | 2,495,157 | |||
| dTahoe Resources Inc., 144A | United States | 82,000 | 1,158,566 | |||
| 3,653,723 | ||||||
| Total Common Stocks (Cost $630,752,780) | 714,851,857 | |||||
| Convertible Preferred Stocks 0.8% | ||||||
| Oil & Gas Exploration & Production 0.8% | ||||||
| Sanchez Energy Corp., 4.875%, cvt. pfd. | United States | 92,900 | 3,745,031 | |||
| Sanchez Energy Corp., 6.50%, cvt. pfd., B | United States | 54,500 | 2,360,395 | |||
| Total Convertible Preferred Stocks (Cost $7,072,693) | 6,105,426 | |||||
| Preferred Stocks (Cost $2,376,164) 0.0% | ||||||
| Coal & Consumable Fuels 0.0% | ||||||
| a,bEnergy Coal Resources, 144A, pfd. | United States | 29,847 | — | |||
| Principal | ||||||
| Amount | ||||||
| Convertible Bonds 0.6% | ||||||
| Diversified Metals & Mining 0.1% | ||||||
| Molycorp Inc., cvt., senior note, 6.00%, 9/01/17 | United States | $ | 4,453,000 | 491,665 | ||
| Oil & Gas Exploration & Production 0.5% | ||||||
| Cobalt International Energy Inc., cvt., senior bond, 3.125%, 5/15/24 | United States | 4,787,000 | 3,760,787 | |||
| Total Convertible Bonds (Cost $7,854,966) | 4,252,452 | |||||
| Total Investments before Short Term Investments | ||||||
| (Cost $648,056,603) | 725,209,735 | |||||
| Shares | ||||||
| Short Term Investments 7.6% | ||||||
| Money Market Funds (Cost $52,015,256) 6.7% | ||||||
| a,eInstitutional Fiduciary Trust Money Market Portfolio | United States | 52,015,256 | 52,015,256 | |||
| fInvestments from Cash Collateral Received for Loaned Securities | ||||||
| (Cost $7,308,375) 0.9% | ||||||
| Money Market Funds 0.9% | ||||||
| a,eInstitutional Fiduciary Trust Money Market Portfolio | United States | 7,308,375 | 7,308,375 | |||
| Total Investments (Cost $707,380,234) 101.1% | 784,533,366 | |||||
| Other Assets, less Liabilities (1.1)% | (8,534,104 | ) | ||||
| Net Assets 100.0% | $ | 775,999,262 | ||||
franklintempleton.com Annual Report | 39
FRANKLIN STRATEGIC SERIES
STATEMENT OF INVESTMENTS
Franklin Natural Resources Fund (continued)
See Abbreviations on page 56.
aNon-income producing.
bSee Note 7 regarding restricted securities.
cA portion or all of the security is on loan at April 30, 2015. See Note 1(c).
dSecurity was purchased pursuant to Rule 144A under the Securities Act of 1933 and may be sold in transactions exempt from registration only to qualified institutional
buyers or in a public offering registered under the Securities Act of 1933. This security has been deemed liquid under guidelines approved by the Trust’s Board of Trustees.
At April 30, 2015, the value of this security was $1,158,566, representing 0.15% of net assets.
eSee Note 3(f) regarding investments in Institutional Fiduciary Trust Money Market Portfolio.
fSee Note 1(c) regarding securities on loan.
40 | Annual Report | The accompanying notes are an integral part of these financial statements. franklintempleton.com
| FRANKLIN STRATEGIC SERIES | ||||||
| Financial Statements | ||||||
| Statements of Assets and Liabilities | ||||||
| April 30, 2015 | ||||||
| Franklin | ||||||
| Biotechnology | Franklin Natural | |||||
| Discovery Fund | Resources Fund | |||||
| Assets: | ||||||
| Investments in securities: | ||||||
| Cost - Unaffiliated issuers | $ | 932,068,255 | $ | 648,056,603 | ||
| Cost - Non-controlled affiliated issuers (Note 8) | 16,539,903 | — | ||||
| Cost - Sweep Money Fund (Note 3f) | 201,682,174 | 59,323,631 | ||||
| Total cost of investments | $ | 1,150,290,332 | $ | 707,380,234 | ||
| Value - Unaffiliated issuers | $ | 1,728,533,925 | $ | 725,209,735 | ||
| Value - Non-controlled affiliated issuers (Note 8) | 23,661,285 | — | ||||
| Value - Sweep Money Fund (Note 3f) | 201,682,174 | 59,323,631 | ||||
| Total value of investments* | 1,953,877,384 | 784,533,366 | ||||
| Receivables: | ||||||
| Investment securities sold (includes securities loaned in the amount of $1,001,238 and | ||||||
| $—, respectively) | 2,600,830 | 4,132,838 | ||||
| Capital shares sold | 1,947,947 | 3,013,221 | ||||
| Dividends and Interest | 218,094 | 674,059 | ||||
| Due from custodian | 2,905,275 | — | ||||
| Other assets | 986 | 330 | ||||
| Total assets | 1,961,550,516 | 792,353,814 | ||||
| Liabilities: | ||||||
| Payables: | ||||||
| Investment securities purchased | 322,509 | 6,768,363 | ||||
| Capital shares redeemed | 4,301,271 | 1,444,664 | ||||
| Management fees | 917,188 | 286,012 | ||||
| Distribution fees | 294,663 | 227,708 | ||||
| Transfer agent fees | 381,697 | 260,003 | ||||
| Payable upon return of securities loaned | 86,821,407 | 7,308,375 | ||||
| Accrued expenses and other liabilities | 84,082 | 59,427 | ||||
| Total liabilities | 93,122,817 | 16,354,552 | ||||
| Net assets, at value | $ | 1,868,427,699 | $ | 775,999,262 | ||
| Net assets consist of: | ||||||
| Paid-in capital | $ | 983,000,750 | $ | 735,129,198 | ||
| Undistributed net investment income (loss) | (6,715,528 | ) | 158,696 | |||
| Net unrealized appreciation (depreciation) | 803,600,160 | 77,166,146 | ||||
| Accumulated net realized gain (loss) | 88,542,317 | (36,454,778 | ) | |||
| Net assets, at value | $ | 1,868,427,699 | $ | 775,999,262 | ||
| *Includes securities loaned | $ | 78,895,553 | $ | 7,102,150 | ||
franklintempleton.com
The accompanying notes are an integral part of these financial statements. | Annual Report | 41
| FRANKLIN STRATEGIC SERIES | |||||
| FINANCIAL STATEMENTS | |||||
| Statements of Assets and Liabilities (continued) | |||||
| April 30, 2015 | |||||
| Franklin | |||||
| Biotechnology | Franklin Natural | ||||
| Discovery Fund | Resources Fund | ||||
| Class A: | |||||
| Net assets, at value | $ | 1,601,906,127 | $ | 572,518,309 | |
| Shares outstanding | 8,787,261 | 18,197,115 | |||
| Net asset value per sharea | $ | 182.30 | $ | 31.46 | |
| Maximum offering price per share (net asset value per share ÷ 94.25%) | $ | 193.42 | $ | 33.38 | |
| Class C: | |||||
| Net assets, at value | $ | 23,050,842 | $ | 123,735,069 | |
| Shares outstanding | 127,586 | 4,061,776 | |||
| Net asset value and maximum offering price per sharea | $ | 180.67 | $ | 30.46 | |
| Class R6: | |||||
| Net assets, at value | $ | 76,435,818 | $ | 438,740 | |
| Shares outstanding | 411,494 | 13,050 | |||
| Net asset value and maximum offering price per share | $ | 185.75 | $ | 33.62 | |
| Advisor Class: | |||||
| Net assets, at value | $ | 167,034,912 | $ | 79,307,144 | |
| Shares outstanding | 902,305 | 2,358,301 | |||
| Net asset value and maximum offering price per share | $ | 185.12 | $ | 33.63 | |
| aRedemption price is equal to net asset value less contingent deferred sales charges, if applicable. | |
| 42 | Annual Report | The accompanying notes are an integral part of these financial statements. | franklintempleton.com |
| FRANKLIN STRATEGIC SERIES | ||||||
| FINANCIAL STATEMENTS | ||||||
| Statements of Operations | ||||||
| for the year ended April 30, 2015 | ||||||
| Franklin | ||||||
| Biotechnology | Franklin Natural | |||||
| Discovery Fund | Resources Fund | |||||
| Investment income: | ||||||
| Dividends | $ | 2,094,624 | $ | 12,438,500 | ||
| Interest | — | 362,961 | ||||
| Income from securities loaned | 3,379,178 | 172,658 | ||||
| Total investment income | 5,473,802 | 12,974,119 | ||||
| Expenses: | ||||||
| Management fees (Note 3a) | 9,464,896 | 3,598,382 | ||||
| Distribution fees: (Note 3c) | ||||||
| Class A | 3,560,676 | 1,642,619 | ||||
| Class C | 156,468 | 1,108,118 | ||||
| Transfer agent fees: (Note 3e) | ||||||
| Class A | 2,143,642 | 1,383,614 | ||||
| Class C | 23,560 | 280,726 | ||||
| Class R6 | 701 | 158 | ||||
| Advisor Class | 213,777 | 218,297 | ||||
| Custodian fees (Note 4) | 15,878 | 13,766 | ||||
| Reports to shareholders | 203,346 | 141,056 | ||||
| Registration and filing fees | 184,125 | 119,376 | ||||
| Professional fees | 65,658 | 44,374 | ||||
| Trustees’ fees and expenses | 16,792 | 8,381 | ||||
| Other | 26,786 | 26,081 | ||||
| Total expenses | 16,076,305 | 8,584,948 | ||||
| Expense reductions (Note 4) | (12 | ) | (9 | ) | ||
| Expenses waived/paid by affiliates (Note 3f and 3g) | (68,198 | ) | (36,298 | ) | ||
| Net expenses | 16,008,095 | 8,548,641 | ||||
| Net investment income (loss) | (10,534,293 | ) | 4,425,478 | |||
| Realized and unrealized gains (losses): | ||||||
| Net realized gain (loss) from: | ||||||
| Investments: | ||||||
| Unaffiliated issuers | 142,933,521 | 8,114,188 | ||||
| Non-controlled affiliated issuers (Note 8) | (1,308,156 | ) | — | |||
| Foreign currency transactions | 20,804 | (154,668 | ) | |||
| Net realized gain (loss) | 141,646,169 | 7,959,520 | ||||
| Net change in unrealized appreciation (depreciation) on: | ||||||
| Investments | 467,561,764 | (169,674,547 | ) | |||
| Translation of other assets and liabilities denominated in foreign currencies | 13,108 | 15,073 | ||||
| Net change in unrealized appreciation (depreciation) | 467,574,872 | (169,659,474 | ) | |||
| Net realized and unrealized gain (loss) | 609,221,041 | (161,699,954 | ) | |||
| Net increase (decrease) in net assets resulting from operations | $ | 598,686,748 | $ | (157,274,476 | ) | |
franklintempleton.com
The accompanying notes are an integral part of these financial statements. | Annual Report | 43
| FRANKLIN STRATEGIC SERIES | ||||||||||||||
| FINANCIAL STATEMENTS | ||||||||||||||
| Statements of Changes in Net Assets | ||||||||||||||
| Franklin | Franklin | |||||||||||||
| Biotechnology Discovery Fund | Natural Resources Fund | |||||||||||||
| Year Ended April 30, | Year Ended April 30, | |||||||||||||
| 2015 | 2014 | 2015 | 2014 | |||||||||||
| Increase (decrease) in net assets: | ||||||||||||||
| Operations: | ||||||||||||||
| Net investment income (loss) | $ | (10,534,293 | ) | $ | (8,789,337 | ) | $ | 4,425,478 | $ | 3,888,520 | ||||
| Net realized gain (loss) from investments and foreign | ||||||||||||||
| currency transactions | 141,646,169 | 107,458,155 | 7,959,520 | 19,694,399 | ||||||||||
| Net change in unrealized appreciation (depreciation) on | ||||||||||||||
| investments and translation of other assets and liabilities | ||||||||||||||
| denominated in foreign currencies | 467,574,872 | 121,720,853 | (169,659,474 | ) | 131,394,739 | |||||||||
| Net increase (decrease) in net assets resulting from | ||||||||||||||
| operations | 598,686,748 | 220,389,671 | (157,274,476 | ) | 154,977,658 | |||||||||
| Distributions to shareholders from: | ||||||||||||||
| Net investment income: | ||||||||||||||
| Class A | — | — | (4,357,432 | ) | (1,295,936 | ) | ||||||||
| Class C | — | — | (26,149 | ) | — | |||||||||
| Class R6 | — | — | (8,714 | ) | (1,339 | ) | ||||||||
| Advisor Class | — | — | (881,303 | ) | (479,364 | ) | ||||||||
| Net realized gains: | ||||||||||||||
| Class A | (56,613,547 | ) | (68,524,706 | ) | — | — | ||||||||
| Class C | (651,107 | ) | — | — | — | |||||||||
| Class R6 | (2,490,471 | ) | (3,579,787 | ) | — | — | ||||||||
| Advisor Class | (5,889,371 | ) | (3,829,703 | ) | — | — | ||||||||
| Total distributions to shareholders | (65,644,496 | ) | (75,934,196 | ) | (5,273,598 | ) | (1,776,639 | ) | ||||||
| Capital share transactions: (Note 2) | ||||||||||||||
| Class A | (1,965,528 | ) | 350,198,470 | 66,759,221 | (116,275,300 | ) | ||||||||
| Class C | 13,282,238 | 6,094,568 | 19,081,993 | (25,999,370 | ) | |||||||||
| Class R6 | 3,829,454 | 44,555,564 | (273,768 | ) | 886,459 | |||||||||
| Advisor Class | 31,005,366 | 64,466,934 | 6,489,242 | (41,555,321 | ) | |||||||||
| Total capital share transactions | 46,151,530 | 465,315,536 | 92,056,688 | (182,943,532 | ) | |||||||||
| Net increase (decrease) in net assets | 579,193,782 | 609,771,011 | (70,491,386 | ) | (29,742,513 | ) | ||||||||
| Net assets: | ||||||||||||||
| Beginning of year | 1,289,233,917 | 679,462,906 | 846,490,648 | 876,233,161 | ||||||||||
| End of year | $ | 1,868,427,699 | $ | 1,289,233,917 | $ | 775,999,262 | $ | 846,490,648 | ||||||
| Undistributed net investment income (loss) included in | ||||||||||||||
| net assets, end of year | $ | (6,715,528 | ) | $ | — | $ | 158,696 | $ | — | |||||
| Distributions in excess of net investment Income included in | ||||||||||||||
| net assets, end of year | $ | — | $ | — | $ | — | $ | (597,485 | ) | |||||
44 | Annual Report | The accompanying notes are an integral part of these financial statements. franklintempleton.com
FRANKLIN STRATEGIC SERIES
Notes to Financial Statements
1. Organization and Significant Accounting Policies
Franklin Strategic Series (Trust) is registered under the Investment Company Act of 1940, as amended, (1940 Act) as an open-end management investment company, consisting of nine separate funds, two of which are included in this report (Funds) and applies the specialized accounting and reporting guidance in U.S. Generally Accepted Accounting Principles (U.S. GAAP). The financial statements of the remaining funds in the Trust are presented separately. The Funds offer four classes of shares: Class A, Class C, Class R6, and Advisor Class. Each class of shares differs by its initial sales load, contingent deferred sales charges, voting rights on matters affecting a single class, its exchange privilege and fees primarily due to differing arrangements for distribution and transfer agent fees. Franklin Biotechnology Discovery Fund was closed to new investors with limited exceptions effective at the close of market July 8, 2014.
The following summarizes the Funds’ significant accounting policies.
a. Financial Instrument Valuation
The Funds’ investments in financial instruments are carried at fair value daily. Fair value is the price that would be received to sell an asset or paid to transfer a liability in an orderly transaction between market participants on the measurement date. The Funds calculate the net asset value (NAV) per share at the close of the New York Stock Exchange (NYSE), generally at 4 p.m. Eastern time (NYSE close) on each day the NYSE is open for trading. Under compliance policies and procedures approved by the Trust’s Board of Trustees (the Board), the Funds’ administrator has responsibility for oversight of valuation, including leading the cross-functional Valuation and Liquidity Oversight Committee (VLOC). The VLOC provides administration and oversight of the Funds’ valuation policies and procedures, which are approved annually by the Board. Among other things, these procedures allow the Funds to utilize independent pricing services, quotations from securities and financial instrument dealers, and other market sources to determine fair value.
Equity securities listed on an exchange or on the NASDAQ National Market System are valued at the last quoted sale price or the official closing price of the day, respectively. Foreign equity securities are valued as of the close of trading on the foreign stock exchange on which the security is primarily traded or as of the NYSE close, whichever is earlier. The value is then converted into its U.S. dollar equivalent at the foreign exchange rate in effect at the NYSE close on the day that the value of the security is determined. Over-the-counter (OTC) securities are valued within the range of the most recent quoted bid and ask prices. Securities that trade in multiple markets or on multiple exchanges are valued according to the broadest and most representative market. Certain equity securities are valued based upon fundamental characteristics or relationships to similar securities. Investments in open-end mutual funds and non-registered money market funds are valued at the closing NAV.
Debt securities generally trade in the OTC market rather than on a securities exchange. The Funds’ pricing services use multiple valuation techniques to determine fair value. In instances where sufficient market activity exists, the pricing services may utilize a market-based approach through which quotes from market makers are used to determine fair value. In instances where sufficient market activity may not exist or is limited, the pricing services also utilize proprietary valuation models which may consider market characteristics such as benchmark yield curves, credit spreads, estimated default rates, anticipated market interest rate volatility, coupon rates, anticipated timing of principal repayments, underlying collateral, and other unique security features in order to estimate the relevant cash flows, which are then discounted to calculate the fair value.
The Funds have procedures to determine the fair value of financial instruments for which market prices are not reliable or readily available. Under these procedures, the VLOC convenes on a regular basis to review such financial instruments and considers a number of factors, including significant unobservable valuation inputs, when arriving at fair value. The VLOC primarily employs a market-based approach which may use related or comparable assets or liabilities, recent transactions, market multiples, book values, and other relevant information for the investment to determine the fair value of the investment. An income-based valuation approach may also be used in which the anticipated future cash flows of the investment are discounted to calculate fair value. Discounts may also be applied due to the nature or duration of any restrictions on the disposition of the investments. Due to the inherent uncertainty of valuations of such investments, the fair values may differ significantly from the values that would have been used had an active market existed. The VLOC employs various methods for calibrating these valuation approaches including a regular review of key inputs and assumptions, transactional back-testing or disposition analysis, and reviews of any related market activity.
franklintempleton.com
Annual Report
| 45
FRANKLIN STRATEGIC SERIES
NOTES TO FINANCIAL STATEMENTS
1. Organization and Significant Accounting
Policies (continued)
Trading in securities on foreign securities stock exchanges and OTC markets may be completed before the daily NYSE close. In addition, trading in certain foreign markets may not take place on every NYSE business day. Occasionally, events occur between the time at which trading in a foreign security is completed and the close of the NYSE that might call into question the reliability of the value of a portfolio security held by the fund. As a result, differences may arise between the value of the Funds’ portfolio securities as determined at the foreign market close and the latest indications of value at the close of the NYSE. In order to minimize the potential for these differences, the VLOC monitors price movements following the close of trading in foreign stock markets through a series of country specific market proxies (such as baskets of American Depositary Receipts, futures contracts and exchange traded funds). These price movements are measured against established trigger thresholds for each specific market proxy to assist in determining if an event has occurred that may call into question the reliability of the values of the foreign securities held by the Funds. If such an event occurs, the securities may be valued using fair value procedures, which may include the use of independent pricing services.
When the last day of the reporting period is a non-business day, certain foreign markets may be open on those days that the NYSE is closed, which could result in differences between the value of the Funds’ portfolio securities on the last business day and the last calendar day of the reporting period. Any significant security valuation changes due to an open foreign market are adjusted and reflected by the Funds for financial reporting purposes.
b. Foreign Currency Translation
Portfolio securities and other assets and liabilities denominated in foreign currencies are translated into U.S. dollars based on the exchange rate of such currencies against U.S. dollars on the date of valuation. The Funds may enter into foreign currency exchange contracts to facilitate transactions denominated in a foreign currency. Purchases and sales of securities, income and expense items denominated in foreign currencies are translated into U.S. dollars at the exchange rate in effect on the transaction date. Portfolio securities and assets and liabilities denominated in foreign currencies contain risks that those currencies will decline in value relative to the U.S. dollar. Occasionally, events may impact the availability or reliability of foreign exchange rates used to convert the U.S. dollar equivalent value. If such an event occurs, the foreign exchange rate will be valued at fair value using procedures established and approved by the Board.
The Funds do not separately report the effect of changes in foreign exchange rates from changes in market prices on securities held. Such changes are included in net realized and unrealized gain or loss from investments in the Statements of Operations.
Realized foreign exchange gains or losses arise from sales of foreign currencies, currency gains or losses realized between the trade and settlement dates on securities transactions and the difference between the recorded amounts of dividends, interest, and foreign withholding taxes and the U.S. dollar equivalent of the amounts actually received or paid. Net unrealized foreign exchange gains and losses arise from changes in foreign exchange rates on foreign denominated assets and liabilities other than investments in securities held at the end of the reporting period.
c. Securities Lending
The Funds participate in an agency based securities lending program to earn additional income. The fund receives cash collateral against the loaned securities in an amount equal to at least 102% of the fair value of the loaned securities. Collateral is maintained over the life of the loan in an amount not less than 100% of the fair value of loaned securities, as determined at the close of fund business each day; any additional collateral required due to changes in security values is delivered to the fund on the next business day. The collateral is deposited into a joint cash account with other funds and is used to invest in a money market fund managed by Franklin Advisers, Inc., an affiliate of the Funds. The total cash collateral received at year end was $83,916,132 and $7,308,375 for Franklin Biotechnology Discovery Fund and Franklin Natural Resources Fund, respectively, of which $2,905,275 was uninvested cash included in due from custodian in the Statement of Assets and Liabilities for Franklin Biotechnology Discovery Fund. The fund may receive income from the investment of cash collateral, in addition to lending fees and rebates paid by the borrower. Income from securities loaned is reported separately in the Statements of Operations. The fund bears the market risk with respect to the collateral investment, securities loaned, and the risk that the agent may default on its obligations to the Fund. If the borrower defaults on its obligation to return the securities loaned, the Fund has the right to repurchase the securities in the open
46 | Annual Report
franklintempleton.com
FRANKLIN STRATEGIC SERIES
NOTES TO FINANCIAL STATEMENTS
market using the collateral received. The securities lending agent has agreed to indemnify the fund in the event of default by a third party borrower.
d. Income and Deferred Taxes
It is each fund’s policy to qualify as a regulated investment company under the Internal Revenue Code. Each fund intends to distribute to shareholders substantially all of its taxable income and net realized gains to relieve it from federal income and excise taxes. As a result, no provision for U.S. federal income taxes is required.
The Funds may be subject to foreign taxation related to income received, capital gains on the sale of securities and certain foreign currency transactions in the foreign jurisdictions in which the Funds invest. Foreign taxes, if any, are recorded based on the tax regulations and rates that exist in the foreign markets in which the Funds invest. When a capital gain tax is determined to apply, the Funds record an estimated deferred tax liability in an amount that would be payable if the securities were disposed of on the valuation date.
Each fund recognizes the tax benefits of uncertain tax positions only when the position is “more likely than not” to be sustained upon examination by the tax authorities based on the technical merits of the tax position. As of April 30, 2015, and for all open tax years, each fund has determined that no liability for unrecognized tax benefits is required in each fund’s financial statements related to uncertain tax positions taken on a tax return (or expected to be taken on future tax returns). Open tax years are those that remain subject to examination and are based on each tax jurisdiction’s statute of limitation.
e. Security Transactions, Investment Income, Expenses and Distributions
Security transactions are accounted for on trade date. Realized gains and losses on security transactions are determined on a specific identification basis. Interest income and estimated expenses are accrued daily. Dividend income is recorded on the ex-dividend date except for certain dividends from foreign securities where the dividend rate is not available. In such cases, the dividend is recorded as soon as the information is received by the Funds. Distributions to shareholders are recorded on the ex-dividend date and are determined according to income tax regulations (tax basis). Distributable earnings determined on a tax basis may differ from earnings recorded in accordance with U.S. GAAP. These differences may be permanent or temporary. Permanent differences are reclassified among capital accounts to reflect their tax character. These reclassifications have no impact on net assets or the results of operations. Temporary differences are not reclassified, as they may reverse in subsequent periods.
Common expenses incurred by the Trust are allocated among the funds based on the ratio of net assets of each fund to the combined net assets of the Trust. Fund specific expenses are charged directly to the fund that incurred the expense.
Realized and unrealized gains and losses and net investment income, not including class specific expenses, are allocated daily to each class of shares based upon the relative proportion of net assets of each class. Differences in per share distributions, by class, are generally due to differences in class specific expenses.
f. Accounting Estimates
The preparation of financial statements in accordance with U.S. GAAP requires management to make estimates and assumptions that affect the reported amounts of assets and liabilities at the date of the financial statements and the amounts of income and expenses during the reporting period. Actual results could differ from those estimates.
g. Guarantees and Indemnifications
Under the Trust’s organizational documents, its officers and trustees are indemnified by the Trust against certain liabilities arising out of the performance of their duties to the Trust. Additionally, in the normal course of business, the Trust, on behalf of the Funds, enters into contracts with service providers that contain general indemnification clauses. The Trust’s maximum exposure under these arrangements is unknown as this would involve future claims that may be made against the Trust that have not yet occurred. Currently, the Trust expects the risk of loss to be remote.
franklintempleton.com
Annual Report
| 47
FRANKLIN STRATEGIC SERIES
NOTES TO FINANCIAL STATEMENTS
2. Shares of Beneficial Interest
At April 30, 2015, there were an unlimited number of shares authorized (without par value). Transactions in the Funds’ shares were as follows:
| Franklin Biotechnology | Franklin Natural | |||||||||||
| Discovery Fund | Resources Fund | |||||||||||
| Shares | Amount | Shares | Amount | |||||||||
| Class A Shares: | ||||||||||||
| Year ended April 30, 2015 | ||||||||||||
| Shares sold | 1,717,680 | $ | 276,277,147 | 7,090,471 | $ | 217,913,005 | ||||||
| Shares issued in reinvestment of distributions | 326,778 | 53,156,888 | 160,621 | 4,176,142 | ||||||||
| Shares redeemed | (2,090,836 | ) | (331,399,563 | ) | (4,744,194 | ) | (155,329,926 | ) | ||||
| Net increase (decrease) | (46,378 | ) | $ | (1,965,528 | ) | 2,506,898 | $ | 66,759,221 | ||||
| Year ended April 30, 2014 | ||||||||||||
| Shares sold | 5,217,381 | $ | 685,233,368 | 2,604,685 | $ | 92,042,342 | ||||||
| Shares issued in reinvestment of distributions | 515,565 | 64,316,784 | 35,605 | 1,243,317 | ||||||||
| Shares redeemed | (3,069,325 | ) | (399,351,682 | ) | (5,984,517 | ) | (209,560,959 | ) | ||||
| Net increase (decrease) | 2,663,621 | $ | 350,198,470 | (3,344,227 | ) | $ | (116,275,300 | ) | ||||
| Class C Shares: | ||||||||||||
| Year ended April 30, 2015 | ||||||||||||
| Shares sold | 99,120 | $ | 15,615,834 | 1,797,408 | $ | 52,747,509 | ||||||
| Shares issued in reinvestment of distributions | 4,011 | 648,558 | 992 | 25,030 | ||||||||
| Shares redeemed | (18,036 | ) | (2,982,154 | ) | (1,035,528 | ) | (33,690,546 | ) | ||||
| Net increase (decrease) | 85,095 | $ | 13,282,238 | 762,872 | $ | 19,081,993 | ||||||
| Year ended April 30, 2014a | ||||||||||||
| Shares sold | 44,841 | $ | 6,399,029 | 445,572 | $ | 15,263,971 | ||||||
| Shares redeemed | (2,350 | ) | (304,461 | ) | (1,219,381 | ) | (41,263,341 | ) | ||||
| Net increase (decrease) | 42,491 | $ | 6,094,568 | (773,809 | ) | $ | (25,999,370 | ) | ||||
| Class R6 Shares: | ||||||||||||
| Year ended April 30, 2015 | ||||||||||||
| Shares sold | 57,247 | $ | 9,282,687 | 1,857 | $ | 71,787 | ||||||
| Shares issued in reinvestment of distributions | 15,044 | 2,490,471 | 312 | 8,649 | ||||||||
| Shares redeemed | (48,654 | ) | (7,943,704 | ) | (11,163 | ) | (354,204 | ) | ||||
| Net increase (decrease) | 23,637 | $ | 3,829,454 | (8,994 | ) | $ | (273,768 | ) | ||||
| Year ended April 30, 2014b,c | ||||||||||||
| Shares soldd,e | 431,359 | $ | 50,546,318 | 22,009 | $ | 885,146 | ||||||
| Shares issued in reinvestment of distributions | 28,341 | 3,579,477 | 35 | 1,313 | ||||||||
| Shares redeemed | (71,843 | ) | (9,570,231 | ) | — | — | ||||||
| Net increase (decrease) | 387,857 | $ | 44,555,564 | 22,044 | $ | 886,459 | ||||||
48 | Annual Report
franklintempleton.com
| FRANKLIN STRATEGIC SERIES | ||||||||||||
| NOTES TO FINANCIAL STATEMENTS | ||||||||||||
| Franklin Biotechnology | Franklin Natural | |||||||||||
| Discovery Fund | Resources Fund | |||||||||||
| Shares | Amount | Shares | Amount | |||||||||
| Advisor Class Shares: | ||||||||||||
| Year ended April 30, 2015 | ||||||||||||
| Shares sold | 470,819 | $ | 73,058,064 | 1,438,440 | $ | 50,510,303 | ||||||
| Shares issued in reinvestment of distributions | 29,024 | 4,790,912 | 28,618 | 794,445 | ||||||||
| Shares redeemed | (293,017 | ) | (46,843,610 | ) | (1,334,841 | ) | (44,815,506 | ) | ||||
| Net increase (decrease) | 206,826 | $ | 31,005,366 | 132,217 | $ | 6,489,242 | ||||||
| Year ended April 30, 2014 | ||||||||||||
| Shares sold | 755,324 | $ | 105,199,247 | 824,952 | $ | 31,227,566 | ||||||
| Shares issued in reinvestment of distributions | 24,447 | 3,083,964 | 11,764 | 438,464 | ||||||||
| Shares redeemedd,e | (325,219 | ) | (43,816,277 | ) | (1,926,993 | ) | (73,221,351 | ) | ||||
| Net increase (decrease) | 454,552 | $ | 64,466,934 | (1,090,277 | ) | $ | (41,555,321 | ) | ||||
aFor the period March 4, 2014 (effective date) to April 30, 2014 for Franklin Biotechnology Discovery Fund.
bFor the year May 1, 2013 (effective date) to April 30, 2014 for Franklin Biotechnology Discovery Fund.
cFor the period September 20, 2013 (effective date) to April 30, 2014 for Franklin Natural Resources Fund.
dEffective May 1, 2013, a portion of Advisor Class shares were exchanged into Class R6 for Franklin Biotechnology Discovery Fund.
eEffective September 20, 2013, a portion of Advisor Class shares were exchanged into Class R6 for Franklin Natural Resources Fund.
3. Transactions with Affiliates
Franklin Resources, Inc. is the holding company for various subsidiaries that together are referred to as Franklin Templeton Investments. Certain officers and trustees of the Trust are also officers and/or directors of the following subsidiaries:
| Subsidiary | Affiliation |
| Franklin Advisers, Inc. (Advisers) | Investment manager |
| Franklin Templeton Services, LLC (FT Services) | Administrative manager |
| Franklin Templeton Distributors, Inc. (Distributors) | Principal underwriter |
| Franklin Templeton Investor Services, LLC (Investor Services) | Transfer agent |
a. Management Fees
Franklin Biotechnology Discovery Fund pays an investment management fee to Advisers based on the average daily net assets of the Fund as follows:
| Annualized Fee Rate | Net Assets | |
| 0.775 | % | up to and including $100 million |
| 0.650 | % | over $100 million, up to and including $200 million |
| 0.635 | % | over $200 million, up to and including $250 million |
| 0.585 | % | over $250 million, up to and including $700 million |
| 0.550 | % | over $700 million, up to and including $1.2 billion |
| 0.525 | % | over $1.2 billion, up to and including $7.5 billion |
| 0.515 | % | over $7.5 billion, up to and including $10 billion |
| 0.505 | % | over $10 billion, up to and including $12.5 billion |
| 0.495 | % | over $12.5 billion, up to and including $15 billion |
| 0.475 | % | in excess of $15 billion. |
franklintempleton.com
Annual Report
| 49
FRANKLIN STRATEGIC SERIES
NOTES TO FINANCIAL STATEMENTS
3. Transactions with Affiliates (continued)
a. Management Fees (continued)
Effective May 1, 2014, Franklin Biotechnology Discovery Fund combined its investment management and administration agreements as approved by the Board. The fees paid under the combined agreement do not exceed the aggregate fees that were paid under the separate agreements.
Prior to May 1, 2014, Franklin Biotechnology Discovery Fund paid fees to Advisers based on the average daily net assets of the fund as follows:
| Annualized Fee Rate | Net Assets | |
| 0.625 | % | Up to and including $100 million |
| 0.500 | % | Over $100 million, up to and including $250 million |
| 0.450 | % | Over $250 million, up to and including $7.5 billion |
| 0.440 | % | Over $7.5 billion, up to and including $10 billion |
| 0.430 | % | Over $10 billion, up to and including $12.5 billion |
| 0.420 | % | Over $12.5 billion, up to and including $15 billion |
| 0.400 | % | In excess of $15 billion |
Franklin Natural Resources Fund pays an investment management fee to Advisers based on the average daily net assets of the Fund as follows:
| Annualized Fee Rate | Net Assets | |
| 0.625 | % | Up to and including $100 million |
| 0.500 | % | Over $100 million, up to and including $250 million |
| 0.450 | % | Over $250 million, up to and including $7.5 billion |
| 0.440 | % | Over $7.5 billion, up to and including $10 billion |
| 0.430 | % | Over $10 billion, up to and including $12.5 billion |
| 0.420 | % | Over $12.5 billion, up to and including $15 billion |
| 0.400 | % | In excess of $15 billion |
b. Administrative Fees
Under an agreement with Advisers, FT Services provides administrative services to the Funds. The fee is paid by Advisers based on the Funds’ average daily net assets, and is not an additional expense of the Funds.
Prior to May 1, 2014, before the combining of the investment management and administrative agreements as approved by the Board, Franklin Biotechnology Discovery Fund paid administrative fees to FT Services based on the fund’s average daily net assets as follows:
| Annualized Fee Rate | Net Assets | |
| 0.150 | % | Up to and including $200 million |
| 0.135 | % | Over $200 million, up to and including $700 million |
| 0.100 | % | Over $700 million, up to and including $1.2 billion |
| 0.075 | % | In excess of $1.2 billion |
50 | Annual Report
franklintempleton.com
FRANKLIN STRATEGIC SERIES
NOTES TO FINANCIAL STATEMENTS
c. Distribution Fees
The Board has adopted distribution plans for each share class, with the exception of Class R6 and Advisor Class shares, pursuant to Rule 12b-1 under the 1940 Act. Distribution fees are not charged on shares held by affiliates. Under the Funds’ Class A reimbursement distribution plans, the Funds reimburses Distributors for costs incurred in connection with the servicing, sale and distribution of each fund’s shares up to the maximum annual plan rate for each class. Under the Class A reimbursement distribution plans, costs exceeding the maximum for the current plan year cannot be reimbursed in subsequent periods. In addition, under the Funds’ Class C compensation distribution plans, the Funds pay Distributors for costs incurred in connection with the servicing, sale and distribution of each fund’s shares up to the maximum annual plan rate for each class. The plan year, for purposes of monitoring compliance with the maximum annual plan rates, is February 1 through January 31 for each fund.
The maximum annual plan rates, based on the average daily net assets, for each class, are as follows:
| Class A | 0.35 | % |
| Class C | 1.00 | % |
The Board has set the current rate at 0.30% per year for Class A shares until further notice and approval by the Board.
d. Sales Charges/Underwriting Agreements
Front-end sales charges and contingent deferred sales charges (CDSC) do not represent expenses of the Funds. These charges are deducted from the proceeds of sales of fund shares prior to investment or from redemption proceeds prior to remittance, as applicable. Distributors has advised the Funds of the following commission transactions related to the sales and redemptions of the Funds’ shares for the year:
| Franklin | ||||
| Biotechnology | Franklin Natural | |||
| Discovery Fund | Resources Fund | |||
| Sales charges retained net of commissions paid to | ||||
| unaffiliated broker/dealers | $ | 559,941 | $ | 528,818 |
| CDSC retained | $ | 20,766 | $ | 16,539 |
e. Transfer Agent Fees
Each class of shares, except for Class R6, pays transfer agent fees to Investor Services for its performance of shareholder servicing obligations and reimburses Investor Services for out of pocket expenses incurred, including shareholding servicing fees paid to third parties. These fees are allocated daily based upon their relative proportion of such classes’ aggregate net assets. Class R6 pays Investor Services transfer agent fees specific to that class.
For the year ended April 30, 2015, the Funds paid transfer agent fees as noted in the Statements of Operations of which the following amounts were retained by Investor Services:
| Franklin | ||||
| Biotechnology | Franklin Natural | |||
| Discovery Fund | Resources Fund | |||
| Transfer agent fees | $ | 1,041,602 | $ | 931,206 |
f. Investments in Institutional Fiduciary Trust Money Market Portfolio
The Funds invest in Institutional Fiduciary Trust Money Market Portfolio (Sweep Money Fund), an affiliated open-end management investment company. Management fees paid by the Funds are waived on assets invested in the Sweep Money Fund, as noted in the Statements of Operations, in an amount not to exceed the management and administrative fees paid directly or indirectly by the Sweep Money Fund. Prior to May 1, 2013, the waiver was accounted for as a reduction to management fees.
franklintempleton.com
Annual Report
| 51
FRANKLIN STRATEGIC SERIES
NOTES TO FINANCIAL STATEMENTS
3. Transactions with Affiliates (continued)
g. Waiver and Expense Reimbursements
Investor Services has contractually agreed in advance to waive or limit its fees so that the Class R6 transfer agent fees do not exceed 0.01% until August 31, 2015. For Franklin Biotechnology Discovery Fund, there were no Class R6 transfer agent fees waived during the year ended April 30, 2015.
4. Expense Offset Arrangement
The Funds have entered into an arrangement with their custodian whereby credits realized as a result of uninvested cash balances are used to reduce a portion of the Funds’ custodian expenses. During the year ended April 30, 2015, the custodian fees were reduced as noted in the Statements of Operations.
5. Income Taxes
For tax purposes, capital losses may be carried over to offset future capital gains. Capital loss carryforwards with no expiration, if any, must be fully utilized before those losses with expiration dates.
| At April 30, 2015, the capital loss carryforwards were as follows: | ||
| Franklin Natural | ||
| Resources Fund | ||
| Capital loss carryforwards subject to expiration: | ||
| 2018 | $ | 12,737,677 |
| Capital loss carryforwards not subject to expiration: | ||
| Short term | — | |
| Long term | — | |
| Total capital loss carryforwards | $ | 12,737,677 |
During the year ended April 30, 2015, Franklin Natural Resources Fund utilized $20,586,350 of capital loss carryforwards.
For tax purposes, the Funds may elect to defer any portion of a post-October capital loss to the first day of the following fiscal year. At April 30, 2015, Franklin Natural Resources Fund deferred post-October capital losses of $13,569,447.
The tax character of distributions paid during the years ended April 30, 2015 and 2014, was as follows:
| Franklin Biotechnology | Franklin Natural | |||||||
| Discovery Fund | Resources Fund | |||||||
| 2015 | 2014 | 2015 | 2014 | |||||
| Distributions paid from: | ||||||||
| Ordinary income | $ | 36,696,134 | $ | 13,679,735 | $ | 5,273,598 | $ | 1,776,639 |
| Long term capital gain | 28,948,362 | 62,254,461 | — | — | ||||
| $ | 65,644,496 | $ | 75,934,196 | $ | 5,273,598 | $ | 1,776,639 | |
52 | Annual Report
franklintempleton.com
FRANKLIN STRATEGIC SERIES
NOTES TO FINANCIAL STATEMENTS
At April 30, 2015, the cost of investments, net unrealized appreciation (depreciation), undistributed ordinary income and undistributed long term capital gains for income tax purposes were as follows:
| Franklin | ||||||
| Biotechnology | Franklin Natural | |||||
| Discovery Fund | Resources Fund | |||||
| Cost of investments | $ | 1,166,894,367 | $ | 721,424,709 | ||
| Unrealized appreciation | $ | 817,834,833 | $ | 158,867,785 | ||
| Unrealized depreciation | (30,851,816 | ) | (95,759,128 | ) | ||
| Net unrealized appreciation (depreciation) | $ | 786,983,017 | $ | 63,108,657 | ||
| Undistributed ordinary income | $ | 35,637,575 | $ | 4,055,522 | ||
| Undistributed long term capital gains | 62,786,195 | — | ||||
| Distributable earnings | $ | 98,423,770 | $ | 4,055,522 | ||
Differences between income and/or capital gains as determined on a book basis and a tax basis are primarily due to differing treatments of passive foreign investment company shares and wash sales.
6. Investment Transactions
Purchases and sales of investments (excluding short term securities) for the year ended April 30, 2015, were as follows:
| Franklin | ||||
| Biotechnology | Franklin Natural | |||
| Discovery Fund | Resources Fund | |||
| Purchases | $ | 651,734,460 | $ | 300,537,993 |
| Sales | $ | 789,143,640 | $ | 212,948,779 |
7. Restricted Securities
The Funds invest in securities that are restricted under the Securities Act of 1933 (1933 Act) or which are subject to legal, contractual, or other agreed upon restrictions on resale. Restricted securities are often purchased in private placement transactions, and cannot be sold without prior registration unless the sale is pursuant to an exemption under the 1933 Act. Disposal of these securities may require greater effort and expense, and prompt sale at an acceptable price may be difficult. The Funds may have registration rights for restricted securities. The issuer generally incurs all registration costs.
At April 30, 2015, the Funds held investments in restricted securities, excluding certain securities exempt from registration under the 1933 Act deemed to be liquid, as follows:
| Acquisition | ||||||
| Shares | Issuer | Dates | Cost | Value | ||
| Franklin Biotechnology Discovery Fund | ||||||
| 316,074 | aAduro Biotech Inc., 8.00%, cvt. pfd., D | 12/18/14 | $ | 854,316 | $ | 5,202,325 |
| 451,308 | FibroGen Inc. | 5/19/00 | 5,065,932 | 9,968,265 | ||
| 80,195 | Intarcia Therapeutics Inc., DD | 3/26/14 | 2,597,516 | 2,970,423 | ||
| 258,620 | Natera Inc, pfd. | 11/20/14 | 2,024,998 | 2,056,029 | ||
| Total Restricted Securities (Value is 1.08% of Net Assets) | $ | 10,542,762 | $ | 20,197,042 | ||
| Franklin Natural Resources Fund | ||||||
| 199,375 | Energy Coal Resources, 144A | 11/16/05 - 5/05/06 | $ | 741,939 | $ | — |
| 29,847 | Energy Coal Resources, 144A, pfd. | 3/17/09 | 2,376,164 | — | ||
| Total Restricted Securities (Value is 0.00% of Net Assets) | $ | 3,118,103 | $ | — | ||
| aThe Fund also invests in unrestricted securities of the issuer, valued at $3,618,992 as of April 30, 2015. | ||||||
franklintempleton.com Annual Report | 53
FRANKLIN STRATEGIC SERIES
NOTES TO FINANCIAL STATEMENTS
8. Holdings of 5% Voting Securities of Portfolio Companies
The 1940 Act defines “affiliated companies” to include investments in portfolio companies in which a fund owns 5% or more of the outstanding voting securities. Investments in “affiliated companies” for Franklin Biotechnology Discovery Fund for the year ended April 30, 2015, were as shown below.
| Number of | Number of | |||||||||||
| Shares/ | Shares/ | |||||||||||
| Warrants Held | Warrants | Value at | ||||||||||
| at Beginning | Gross | Gross | Held at End | End of | Investment | Realized | ||||||
| Name of Issuer | of Year | Additions | Reductions | of Year | Year | Income | Gain (Loss) | |||||
| Franklin Biotechnology Discovery Fund | ||||||||||||
| Non-Controlled Affiliates | ||||||||||||
| Celsus Therapeutics PLC, | ||||||||||||
| ADR | 289,817 | — | (289,817 | ) | — | $ | — | $ | — | $ | (1,308,156 | ) |
| Heat Biologics Inc. | 279,200 | 345,000 | — | 624,200 | 3,676,538 | — | — | |||||
| Heron Therapeutics Inc. | 965,010 | 699,700 | — | 1,664,710 | 17,978,868 | — | — | |||||
| Heron Therapeutics Inc., wts., | ||||||||||||
| 144A, 7/01/16 | 278,594 | — | — | 278,594 | 2,005,879 | — | — | |||||
| Total Affiliated Securities (Value is 1.27% of Net Assets) | $ | 23,661,285 | $ | — | $ | (1,308,156 | ) | |||||
9. Credit Facility
The Funds, together with other U.S. registered and foreign investment funds (collectively, Borrowers), managed by Franklin Templeton Investments, are borrowers in a joint syndicated senior unsecured credit facility totaling $1.5 billion (Global Credit Facility) which matured on February 13, 2015. This Global Credit Facility provides a source of funds to the Borrowers for temporary and emergency purposes, including the ability to meet future unanticipated or unusually large redemption requests. Effective February 13, 2015, the Borrowers renewed the Global Credit Facility for a one year term, maturing February 12, 2016, for a total of $2 billion.
Under the terms of the Global Credit Facility, the Funds shall, in addition to interest charged on any borrowings made by the Funds and other costs incurred by the Funds, pay their share of fees and expenses incurred in connection with the implementation and maintenance of the Global Credit Facility, based upon their relative share of the aggregate net assets of all of the Borrowers, including an annual commitment fee of 0.07% based upon the unused portion of the Global Credit Facility. These fees are reflected in other expenses in the Statements of Operations. During the year ended April 30, 2015, the Funds did not use the Global Credit Facility.
10. Fair Value Measurements
The Funds follow a fair value hierarchy that distinguishes between market data obtained from independent sources (observable inputs) and the Funds’ own market assumptions (unobservable inputs). These inputs are used in determining the value of the Funds’ financial instruments and are summarized in the following fair value hierarchy:
- Level 1 – quoted prices in active markets for identical financial instruments
- Level 2 – other significant observable inputs (including quoted prices for similar financial instruments, interest rates, prepayment speed, credit risk, etc.)
- Level 3 – significant unobservable inputs (including the Funds’ own assumptions in determining the fair value of financial instruments)
The input levels are not necessarily an indication of the risk or liquidity associated with financial instruments at that level.
54 | Annual Report
franklintempleton.com
FRANKLIN STRATEGIC SERIES
NOTES TO FINANCIAL STATEMENTS
For movements between the levels within the fair value hierarchy, the Funds have adopted a policy of recognizing the transfers as of the date of the underlying event which caused the movement.
A summary of inputs used as of April 30, 2015, in valuing the Funds’ assets carried at fair value, is as follows:
| Level 1 | Level 2 | Level 3 | Total | |||||
| Franklin Biotechnology Discovery Fund | ||||||||
| Assets: | ||||||||
| Investments in Securities: | ||||||||
| Equity Investments:a | ||||||||
| Biotechnology | $ | 1,491,362,012 | $ | 2,451,733 | $ | 24,570,623 | $ | 1,518,384,368 |
| Other Equity Investmentsb | 233,810,842 | — | — | 233,810,842 | ||||
| Short Term Investments | 201,682,174 | — | — | 201,682,174 | ||||
| Total Investments in Securities | $ | 1,926,855,028 | $ | 2,451,733 | $ | 24,570,623 | $ | 1,953,877,384 |
| Franklin Natural Resources Fund | ||||||||
| Assets: | ||||||||
| Investments in Securities | ||||||||
| Equity Investments:a | ||||||||
| Oil & Gas Exploration & Production | $ | 272,158,145 | $ | 6,105,426 | $ | — | $ | 278,263,571 |
| Other Equity Investmentsb | 442,693,712 | — | —c | 442,693,712 | ||||
| Convertible Bonds | — | 4,252,452 | — | 4,252,452 | ||||
| Short Term Investments | 59,323,631 | — | — | 59,323,631 | ||||
| Total Investments in Securities | $ | 774,175,488 | $ | 10,357,878 | $ | — | $ | 784,533,366 |
aIncludes common, preferred, and convertible preferred stocks as well as other equity investments.
bFor detailed categories, see the accompanying Statement of Investments.
cIncludes securities determined to have no value at April 30, 2015.
A reconciliation of assets in which Level 3 inputs are used in determining fair value is presented when there are significant Level 3 financial instruments at the end of the year. At April 30, 2015, the reconciliation of assets is as follows:
| Unrealized | |||||||||||||||||
| Net | Net | Appreciation | |||||||||||||||
| Balance at | Transfers | Realized | Unrealized | Balance | (Depreciation) | ||||||||||||
| Beginning | Into (Out of) | Cost Basis | Gain | Appreciation | at End | on Assets Held | |||||||||||
| of Year | Purchases | Sales | Level 3 | Adjustments | (Loss) | (Depreciation) | of Year | at Year End | |||||||||
| Franklin Biotechnology Discovery | |||||||||||||||||
| Fund | |||||||||||||||||
| Assets: | |||||||||||||||||
| Investments in Securities: | |||||||||||||||||
| Equity Investments:a | |||||||||||||||||
| Biotechnology | $ | 10,082,727 | $ | 6,079,314 | $ | (9 | ) | $ — | $ — | $ | 5 | $ | 8,408,586 | $ | 24,570,623 | $ | 8,408,586 |
| aIncludes common and preferred stocks as well as other equity investments. | |||||||||||||||||
franklintempleton.com
Annual Report
| 55
FRANKLIN STRATEGIC SERIES
NOTES TO FINANCIAL STATEMENTS
10. Fair Value Measurements (continued)
Significant unobservable valuation inputs developed by the VLOC for material Level 3 financial instruments and impact to fair value as a result of changes in unobservable valuation inputs as of April 30, 2015, are as follows:
| Impact to Fair | ||||||||
| Fair Value at | Valuation | Value if Input | ||||||
| Description | End of Year | Technique | Unobservable Inputs | Amount/Range | Increasesa | |||
| Assets: | ||||||||
| Investments in Securities: | ||||||||
| Equity Investments:b | ||||||||
| Biotechnology | $ | 20,197,042 | Discounted | |||||
| Cash Flow | ||||||||
| Model | Free Cash Flow | $ | 2,364.7–$13,567.7 | mil | Increase | |||
| Cost of Equity | 12.5 | % | Decrease | |||||
| Probability Rate | 75 | % | Increase | |||||
| Market | Discount for lack of | |||||||
| comparables | marketability | 5 | –35% | Decrease | ||||
| All Other Investmentsc | 4,373,581 | |||||||
| Total | $ | 24,570,623 |
aRepresents the expected directional change in the fair value of the Level 3 investments that would result from an increase in the corresponding input. A decrease to the
unobservable input would have the opposite effect. Significant changes in these inputs could result in significantly higher or lower fair value measurement.
bIncludes common and convertible preferred stocks.
cIncludes fair value of immaterial investments developed using various valuation techniques and unobservable inputs. May also include investments with values derived
using prior transaction prices or third party pricing information without adjustment for which such inputs are also unobservable.
11. New Accounting Pronouncements
In June 2014, the Financial Accounting Standards Board issued Accounting Standards Update (ASU) No. 2014-11, Transfers and Servicing (Topic 860), Repurchase-to-Maturity Transactions, Repurchase Financings, and Disclosures. The ASU changes the accounting for certain repurchase agreements and expands disclosure requirements related to repurchase agreements, securities lending, repurchase-to-maturity and similar transactions. The ASU is effective for interim and annual reporting periods beginning after December 15, 2014. Management has reviewed the requirements and believes the adoption of this ASU will not have a material impact on the financial statements.
12. Subsequent Events
The Funds have evaluated subsequent events through the issuance of the financial statements and determined that no events have occurred that require disclosure.
| Abbreviations |
| Selected Portfolio |
| ADR American Depositary Receipt |
56 | Annual Report
franklintempleton.com
FRANKLIN STRATEGIC SERIES
Report of Independent Registered Public Accounting Firm
To the Board of Trustees and Shareholders of Franklin Strategic Series
In our opinion, the accompanying statements of assets and liabilities, including the statements of investments, and the related statements of operations and of changes in net assets and the financial highlights present fairly, in all material respects, the financial position of Franklin Biotechnology Discovery Fund and Franklin Natural Resources Fund (separate portfolios of Franklin Strategic Series, hereafter referred to as the “Funds”) at April 30, 2015, the results of each of their operations for the year then ended, the changes in each of their net assets for each of the two years in the period then ended and the financial highlights for each of the periods presented, in conformity with accounting principles generally accepted in the United States of America. These financial statements and financial highlights (hereafter referred to as “financial statements”) are the responsibility of the Funds’ management. Our responsibility is to express an opinion on these financial statements based on our audits. We conducted our audits of these financial statements in accordance with the standards of the Public Company Accounting Oversight Board (United States). Those standards require that we plan and perform the audit to obtain reasonable assurance about whether the financial statements are free of material misstatement. An audit includes examining, on a test basis, evidence supporting the amounts and disclosures in the financial statements, assessing the accounting principles used and significant estimates made by management, and evaluating the overall financial statement presentation. We believe that our audits, which included confirmation of securities at April 30, 2015 by correspondence with the custodian, transfer agent and brokers, provide a reasonable basis for our opinion.
PricewaterhouseCoopers LLP
San Francisco, California
June 15, 2015
franklintempleton.com
Annual Report
| 57
FRANKLIN STRATEGIC SERIES
Tax Information (unaudited)
Under Section 852(b)(3)(C) of the Internal Revenue Code (Code), Franklin Biotechnology Discovery Fund hereby reports the maximum amount allowable but no less than $28,948,362 as long term capital gain dividends for the fiscal year ended April 30, 2015.
Under Section 871(k)(2)(C) of the Code, Franklin Biotechnology Discovery Fund hereby reports the maximum amount allowable but no less than $36,696,134 as short term capital gain dividends for the purposes of the tax imposed under Section 871(a)(1)(A) of the Code for the fiscal year ended April 30, 2015.
Under Section 854(b)(1)(A) of the Code, the Funds hereby report the following percentage amounts of the ordinary income dividends as income qualifying for the dividends received deduction for the fiscal year ended April 30, 2015:
| Franklin | Franklin | ||
| Biotechnology | Natural | ||
| Discovery Fund | Resources Fund | ||
| 5.09 | % | 100.00 | % |
Under Section 854(b)(1)(B) of the Code, the Funds hereby report the maximum amount allowable but no less than the following amounts as qualified dividends for purposes of the maximum rate under Section 1(h)(11) of the Code for the fiscal year ended April 30, 2015:
| Franklin | Franklin | ||
| Biotechnology | Natural | ||
| Discovery Fund | Resources Fund | ||
| $ | 1,977,620 | $ | 11,492,114 |
Distributions, including qualified dividend income, paid during calendar year 2015 will be reported to shareholders on Form 1099-DIV by mid-February 2016. Shareholders are advised to check with their tax advisors for information on the treatment of these amounts on their individual income tax returns.
58 | Annual Report
franklintempleton.com
FRANKLIN STRATEGIC SERIES
Board Members and Officers
The name, year of birth and address of the officers and board members, as well as their affiliations, positions held with the Trust, principal occupations during at least the past five years and number of portfolios overseen in the Franklin Templeton Investments fund complex are shown below. Generally, each board member serves until that person’s successor is elected and qualified.
| Independent Board Members | ||||
| Number of Portfolios in | ||||
| Name, Year of Birth | Length of | Fund Complex Overseen | Other Directorships Held | |
| and Address | Position | Time Served | by Board Member* | During at Least the Past 5 Years |
| Harris J. Ashton (1932) | Trustee | Since 1991 | 145 | Bar-S Foods (meat packing company) |
| One Franklin Parkway | (1981-2010). | |||
| San Mateo, CA 94403-1906 | ||||
| Principal Occupation During at Least the Past 5 Years: | ||||
| Director of various companies; and formerly, Director, RBC Holdings, Inc. (bank holding company) (until 2002); and President, Chief Executive | ||||
| Officer and Chairman of the Board, General Host Corporation (nursery and craft centers) (until 1998). | ||||
| Mary C. Choksi (1950) | Trustee | Since | 119 | Avis Budget Group Inc. (car rental) |
| One Franklin Parkway | October 2014 | (2007-present), Omnicom Group Inc. | ||
| San Mateo, CA 94403-1906 | (advertising and marketing communi- | |||
| cations services) (2011-present) and | ||||
| H.J. Heinz Company (processed foods | ||||
| and allied products) (1998-2006). | ||||
| Principal Occupation During at Least the Past 5 Years: | ||||
| Founding Partner and Senior Managing Director, Strategic Investment Group (investment management group) (1987-present); director of | ||||
| various companies; and formerly, Founding Partner and Managing Director, Emerging Markets Management LLC (investment management | ||||
| firm) (1987-2011); and Loan Officer/Senior Loan Officer/Senior Pension Investment Officer, World Bank Group (international financial | ||||
| institution) (1977-1987). | ||||
| Edith E. Holiday (1952) | Trustee | Since 1998 | 145 | Hess Corporation (exploration and |
| One Franklin Parkway | refining of oil and gas) (1993-present), | |||
| San Mateo, CA 94403-1906 | RTI International Metals, Inc. (manu- | |||
| facture and distribution of titanium) | ||||
| (1999-present), Canadian National | ||||
| Railway (railroad) (2001-present), | ||||
| White Mountains Insurance Group, Ltd. | ||||
| (holding company) (2004-present) and | ||||
| H.J. Heinz Company (processed foods | ||||
| and allied products) (1994-2013). | ||||
| Principal Occupation During at Least the Past 5 Years: | ||||
| Director or Trustee of various companies and trusts; and formerly, Assistant to the President of the United States and Secretary of the | ||||
| Cabinet (1990-1993); General Counsel to the United States Treasury Department (1989-1990); and Counselor to the Secretary and Assistant | ||||
| Secretary for Public Affairs and Public Liaison – United States Treasury Department (1988-1989). | ||||
| J. Michael Luttig (1954) | Trustee | Since 2009 | 145 | Boeing Capital Corporation |
| One Franklin Parkway | (aircraft financing) (2006-2013). | |||
| San Mateo, CA 94403-1906 | ||||
| Principal Occupation During at Least the Past 5 Years: | ||||
| Executive Vice President, General Counsel and member of the Executive Council, The Boeing Company (aerospace company); and | ||||
| formerly, Federal Appeals Court Judge, U.S. Court of Appeals for the Fourth Circuit (1991-2006). | ||||
franklintempleton.com Annual Report | 59
| FRANKLIN STRATEGIC SERIES | ||||
| Independent Board Members (continued) | ||||
| Number of Portfolios in | ||||
| Name, Year of Birth | Length of | Fund Complex Overseen | Other Directorships Held | |
| and Address | Position | Time Served | by Board Member* | During at Least the Past 5 Years |
| Frank A. Olson (1932) | Trustee | Since 2007 | 145 | Hess Corporation (exploration and |
| One Franklin Parkway | refining of oil and gas) (1998-2013). | |||
| San Mateo, CA 94403-1906 | ||||
| Principal Occupation During at Least the Past 5 Years: | ||||
| Director of various companies; and formerly, Chairman of the Board, The Hertz Corporation (car rental) (1980-2000) and Chief Executive | ||||
| Officer (1977-1999); and Chairman of the Board, President and Chief Executive Officer, UAL Corporation (airlines) (June-December 1987). | ||||
| Larry D. Thompson (1945) | Trustee | Since 2007 | 145 | Cbeyond, Inc. (business commu- |
| One Franklin Parkway | nications provider) (2010-2012), | |||
| San Mateo, CA 94403-1906 | The Southern Company (energy | |||
| company) (December 2014; | ||||
| previously 2010-2012) and Graham | ||||
| Holdings Company (education and | ||||
| media organization) (2011-present). | ||||
| Principal Occupation During at Least the Past 5 Years: | ||||
| Director of various companies; John A. Sibley Professor of Corporate and Business Law, University of Georgia School of Law (January 2015; | ||||
| previously 2011-2012); and formerly, Executive Vice President – Government Affairs, General Counsel and Corporate Secretary, PepsiCo, | ||||
| Inc. (consumer products) (2012-2014); Senior Vice President – Government Affairs, General Counsel and Secretary, PepsiCo, Inc. | ||||
| (2004-2011); Senior Fellow of The Brookings Institution (2003-2004); Visiting Professor, University of Georgia School of Law (2004); and | ||||
| Deputy Attorney General, U.S. Department of Justice (2001-2003). | ||||
| John B. Wilson (1959) | Lead | Trustee since | 119 | None |
| One Franklin Parkway | Independent | 2006 and Lead | ||
| San Mateo, CA 94403-1906 | Trustee | Independent | ||
| Trustee since 2008 | ||||
| Principal Occupation During at Least the Past 5 Years: | ||||
| President, Staples Europe (office supplies) (2012-present); President and Founder, Hyannis Port Capital, Inc. (real estate and private equity | ||||
| investing); serves on private and non-profit boards; and formerly, Chief Operating Officer and Executive Vice President, Gap, Inc. (retail) | ||||
| (1996-2000); Chief Financial Officer and Executive Vice President – Finance and Strategy, Staples, Inc. (1992-1996); Senior Vice President – | ||||
| Corporate Planning, Northwest Airlines, Inc. (airlines) (1990-1992); and Vice President and Partner, Bain & Company (consulting firm) | ||||
| (1986-1990). | ||||
| Interested Board Members and Officers | ||||
| Number of Portfolios in | ||||
| Name, Year of Birth | Length of | Fund Complex Overseen | Other Directorships Held | |
| and Address | Position | Time Served | by Board Member* | During at Least the Past 5 Years |
| **Gregory E. Johnson (1961) | Trustee | Since June 2013 | 162 | None |
| One Franklin Parkway | ||||
| San Mateo, CA 94403-1906 | ||||
| Principal Occupation During at Least the Past 5 Years: | ||||
| Chairman of the Board, Member – Office of the Chairman, Director, President and Chief Executive Officer, Franklin Resources, Inc.; officer | ||||
| and/or director or trustee, as the case may be, of some of the other subsidiaries of Franklin Resources, Inc. and of 46 of the investment | ||||
| companies in Franklin Templeton Investments; and Vice Chairman, Investment Company Institute. | ||||
60 | Annual Report franklintempleton.com
FRANKLIN STRATEGIC SERIES
| Interested Board Members and Officers (continued) | ||||
| Number of Portfolios in | ||||
| Name, Year of Birth | Length of | Fund Complex Overseen | Other Directorships Held | |
| and Address | Position | Time Served | by Board Member* | During at Least the Past 5 Years |
| **Rupert H. Johnson, Jr. (1940) Chairman of | Chairman of | 145 | None | |
| One Franklin Parkway | the Board and | the Board since | ||
| San Mateo, CA 94403-1906 | Trustee | 2013 and Trustee | ||
| since 1991 | ||||
| Principal Occupation During at Least the Past 5 Years: | ||||
| Vice Chairman, Member – Office of the Chairman and Director, Franklin Resources, Inc.; Director, Franklin Advisers, Inc.; Senior Vice | ||||
| President, Franklin Advisory Services, LLC; and officer and/or director or trustee, as the case may be, of some of the other subsidiaries | ||||
| of Franklin Resources, Inc. and of 43 of the investment companies in Franklin Templeton Investments. | ||||
| Alison E. Baur (1964) | Vice President | Since 2012 | Not Applicable | Not Applicable |
| One Franklin Parkway | ||||
| San Mateo, CA 94403-1906 | ||||
| Principal Occupation During at Least the Past 5 Years: | ||||
| Deputy General Counsel, Franklin Templeton Investments; and officer of some of the other subsidiaries of Franklin Resources, Inc. and of | ||||
| 46 of the investment companies in Franklin Templeton Investments. | ||||
| Laura F. Fergerson (1962) | Chief Executive Since 2009 | Not Applicable | Not Applicable | |
| One Franklin Parkway | Officer – | |||
| San Mateo, CA 94403-1906 | Finance and | |||
| Administration | ||||
| Principal Occupation During at Least the Past 5 Years: | ||||
| Senior Vice President, Franklin Templeton Services, LLC; and officer of 46 of the investment companies in Franklin Templeton Investments. | ||||
| Gaston Gardey (1967) | Treasurer, | Since 2009 | Not Applicable | Not Applicable |
| One Franklin Parkway | Chief Financial | |||
| San Mateo, CA 94403-1906 | Officer and | |||
| Chief | ||||
| Accounting | ||||
| Officer | ||||
| Principal Occupation During at Least the Past 5 Years: | ||||
| Treasurer, U.S. Products and Client Services, Franklin Templeton Investments; and officer of 27 of the investment companies in Franklin | ||||
| Templeton Investments. | ||||
| Aliya S. Gordon (1973) | Vice President | Since 2009 | Not Applicable | Not Applicable |
| One Franklin Parkway | ||||
| San Mateo, CA 94403-1906 | ||||
| Principal Occupation During at Least the Past 5 Years: | ||||
| Senior Associate General Counsel, Franklin Templeton Investments; officer of 46 of the investment companies in Franklin Templeton | ||||
| Investments; and formerly, Litigation Associate, Steefel, Levitt & Weiss, LLP (2000-2004). | ||||
| Steven J. Gray (1955) | Vice President | Since 2009 | Not Applicable | Not Applicable |
| One Franklin Parkway | ||||
| San Mateo, CA 94403-1906 | ||||
| Principal Occupation During at Least the Past 5 Years: | ||||
| Senior Associate General Counsel, Franklin Templeton Investments; Vice President, Franklin Templeton Distributors, Inc. and Franklin | ||||
| Alternative Strategies Advisers, LLC; and officer of 46 of the investment companies in Franklin Templeton Investments. | ||||
franklintempleton.com Annual Report | 61
| FRANKLIN STRATEGIC SERIES | ||||
| Interested Board Members and Officers (continued) | ||||
| Number of Portfolios in | ||||
| Name, Year of Birth | Length of | Fund Complex Overseen | Other Directorships Held | |
| and Address | Position | Time Served | by Board Member* | During at Least the Past 5 Years |
| Selena L. Holmes (1965) | Vice President | Since 2012 | Not Applicable | Not Applicable |
| 100 Fountain Parkway | – AML | |||
| St. Petersburg, FL 33716-1205 | Compliance | |||
| Principal Occupation During at Least the Past 5 Years: | ||||
| Director, Global Compliance Monitoring; Chief Compliance Officer, Franklin Alternative Strategies Advisers, LLC; Vice President, Franklin | ||||
| Templeton Companies, LLC; and officer of 46 of the investment companies in Franklin Templeton Investments. | ||||
| Edward B. Jamieson (1948) | President and | Since 2010 | Not Applicable | Not Applicable |
| One Franklin Parkway | Chief Executive | |||
| San Mateo, CA 94403-1906 | Officer – | |||
| Investment | ||||
| Management | ||||
| Principal Occupation During at Least the Past 5 Years: | ||||
| President, Chief Investment Officer and Director, Franklin Advisers, Inc.; Executive Vice President, Franklin Templeton Institutional, LLC; | ||||
| and officer and/or trustee, as the case may be, of some of the other subsidiaries of Franklin Resources, Inc. and of 10 of the investment | ||||
| companies in Franklin Templeton Investments. | ||||
| Christopher J. Molumphy (1962) Vice President | Since 2000 | Not Applicable | Not Applicable | |
| One Franklin Parkway | ||||
| San Mateo, CA 94403-1906 | ||||
| Principal Occupation During at Least the Past 5 Years: | ||||
| Director and Executive Vice President, Franklin Advisers, Inc.; Executive Vice President, Franklin Templeton Institutional, LLC; and officer | ||||
| of some of the other subsidiaries of Franklin Resources, Inc. and of 22 of the investment companies in Franklin Templeton Investments. | ||||
| Kimberly H. Novotny (1972) | Vice President | Since 2013 | Not Applicable | Not Applicable |
| 300 S.E. 2nd Street | ||||
| Fort Lauderdale, FL 33301-1923 | ||||
| Principal Occupation During at Least the Past 5 Years: | ||||
| Associate General Counsel, Franklin Templeton Investments; Vice President and Secretary, Fiduciary Trust International of the South; Vice | ||||
| President, Templeton Investment Counsel, LLC; Assistant Secretary, Franklin Resources, Inc.; and officer of 46 of the investment companies | ||||
| in Franklin Templeton Investments. | ||||
| Robert C. Rosselot (1960) | Chief | Since 2013 | Not Applicable | Not Applicable |
| 300 S.E. 2nd Street | Compliance | |||
| Fort Lauderdale, FL 33301-1923 | Officer | |||
| Principal Occupation During at Least the Past 5 Years: | ||||
| Director, Global Compliance, Franklin Templeton Investments; Vice President, Franklin Templeton Companies, LLC; officer of 46 of the | ||||
| investment companies in Franklin Templeton Investments; and formerly, Senior Associate General Counsel, Franklin Templeton Investments | ||||
| (2007-2013); and Secretary and Vice President, Templeton Group of Funds (2004-2013). | ||||
| Karen L. Skidmore (1952) | Vice President | Since 2006 | Not Applicable | Not Applicable |
| One Franklin Parkway | and Secretary | |||
| San Mateo, CA 94403-1906 | ||||
| Principal Occupation During at Least the Past 5 Years: | ||||
| Senior Associate General Counsel, Franklin Templeton Investments; and officer of 46 of the investment companies in Franklin Templeton | ||||
| Investments. | ||||
62 | Annual Report franklintempleton.com
FRANKLIN STRATEGIC SERIES
| Interested Board Members and Officers (continued) | ||||
| Number of Portfolios in | ||||
| Name, Year of Birth | Length of | Fund Complex Overseen | Other Directorships Held | |
| and Address | Position | Time Served | by Board Member* | During at Least the Past 5 Years |
| Craig S. Tyle (1960) | Vice President | Since 2005 | Not Applicable | Not Applicable |
| One Franklin Parkway | ||||
| San Mateo, CA 94403-1906 | ||||
| Principal Occupation During at Least the Past 5 Years: | ||||
| General Counsel and Executive Vice President, Franklin Resources, Inc.; and officer of some of the other subsidiaries of Franklin Resources, | ||||
| Inc. and of 46 of the investment companies in Franklin Templeton Investments. | ||||
| Lori A. Weber (1964) | Vice President | Since 2011 | Not Applicable | Not Applicable |
| 300 S.E. 2nd Street | ||||
| Fort Lauderdale, FL 33301-1923 | ||||
| Principal Occupation During at Least the Past 5 Years: | ||||
| Senior Associate General Counsel, Franklin Templeton Investments; Assistant Secretary, Franklin Resources, Inc.; Vice President and | ||||
| Secretary, Templeton Investment Counsel, LLC; Vice President, Fiduciary Trust International of the South; and officer of 46 of the investment | ||||
| companies in Franklin Templeton Investments. | ||||
*We base the number of portfolios on each separate series of the U.S. registered investment companies within the Franklin Templeton Investments fund complex.
These portfolios have a common investment manager or affiliated investment managers.
**Gregory E. Johnson is considered to be an interested person of the Fund under the federal securities laws due to his position as an officer and director of Franklin
Resources, Inc. (Resources), which is the parent company of the Fund’s investment manager and distributor. Rupert H. Johnson, Jr. is considered to be an interested person
of the Fund under the federal securities laws due to his position as officer and director and major shareholder of Resources.
Note 1: Rupert H. Johnson, Jr. is the uncle of Gregory E. Johnson.
Note 2: Officer information is current as of the date of this report. It is possible that after this date, information about officers may change.
Note 3: Effective April 30, 2015, Sam Ginn ceased to be a trustee of the Fund.
The Sarbanes-Oxley Act of 2002 and Rules adopted by the Securities and Exchange Commission require the Fund to disclose whether the Fund’s Audit Committee
includes at least one member who is an audit committee financial expert within the meaning of such Act and Rules. The Fund’s Board has determined that there
is at least one such financial expert on the Audit Committee and has designated John B. Wilson as its audit committee financial expert. The Board believes that
Mr. Wilson qualifies as such an expert in view of his extensive business background and experience, including service as chief financial officer of Staples, Inc.
from 1992 to 1996. Mr. Wilson has been a Member and Chairman of the Fund’s Audit Committee since 2006. As a result of such background and experience, the
Board believes that Mr. Wilson has acquired an understanding of generally accepted accounting principles and financial statements, the general application of
such principles in connection with the accounting estimates, accruals and reserves, and analyzing and evaluating financial statements that present a breadth
and level of complexity of accounting issues generally comparable to those of the Fund, as well as an understanding of internal controls and procedures for
financial reporting and an understanding of audit committee functions. Mr. Wilson is an independent Board member as that term is defined under the relevant
Securities and Exchange Commission Rules and Releases.
The Statement of Additional Information (SAI) includes additional information about the board members and is available, without charge, upon request.
Shareholders may call (800) DIAL BEN/342-5236 to request the SAI.
franklintempleton.com Annual Report | 63
FRANKLIN STRATEGIC SERIES
Shareholder Information
Board Review of Investment Management Agreement
At a meeting held April 14, 2015, the Board of Trustees (Board), including a majority of non-interested or independent Trustees, approved renewal of the investment management agreement for each of the separate funds within the Trust (Fund(s)). In reaching this decision, the Board took into account information furnished throughout the year at regular Board meetings, as well as information prepared specifically in connection with the annual renewal review process. Information furnished and discussed throughout the year included investment performance reports and related financial information for the Funds, along with periodic reports on expenses, shareholder services, legal and compliance matters, pricing, brokerage commissions and execution and other services provided by the Investment Manager (Manager) and its affiliates, as well as marketing support payments made to financial intermediaries. Information furnished specifically in connection with the renewal process included a report for each Fund prepared by Lipper, Inc. (Lipper), an independent organization, as well as additional material, including a Fund profitability analysis prepared by management. The Lipper reports compared each Fund’s investment performance and expenses with those of other mutual funds deemed comparable to the Fund as selected by Lipper. The Fund profitability analysis discussed the profitability to Franklin Templeton Investments (FTI) from its overall U.S. fund operations, as well as on an individual fund-by-fund basis. Additional material accompanying such profitability analysis included information on a fund-by-fund basis listing portfolio managers and other accounts they manage, as well as information on management fees charged by the Manager and its affiliates to U.S. mutual funds and other accounts, including management’s explanation of differences where relevant. Such material also included a memorandum prepared by management describing project initiatives and capital investments relating to the services provided to the Funds by the FTI organization, as well as a memorandum relating to economies of scale and an analysis concerning transfer agent fees charged by an affiliate of the Manager. The Board also noted that at the February meetings each year, it receives an annual report on all marketing support payments made by FTI to financial intermediaries.
In considering such materials, the independent Trustees received assistance and advice from and met separately with independent counsel. While the investment management agreements for all Funds were considered at the same Board meeting, the
Board dealt with each Fund separately. In approving continuance of the investment management agreement for each Fund, the Board, including a majority of independent Trustees, determined that the existing management fee structure was fair and reasonable and that continuance of the investment management agreement was in the best interests of each Fund and its shareholders. While attention was given to all information furnished, the following discusses some primary factors relevant to the Board’s decision.
NATURE, EXTENT AND QUALITY OF SERVICE. The Board was satisfied with the nature and quality of the overall services provided by the Manager and its affiliates to the Funds and their shareholders, except as noted later in the discussion of investment performance. The Board’s opinion was based, in part, upon periodic reports furnished it showing that the investment policies and restrictions for the Funds were consistently complied with as well as other reports periodically furnished the Board covering matters such as the compliance of portfolio managers and other management personnel with the code of ethics adopted throughout the Franklin Templeton fund complex, the adherence to fair value pricing procedures established by the Board, and the accuracy of net asset value calculations. The Board also noted the extent of benefits provided Fund shareholders from being part of the Franklin Templeton family of funds, including the right to exchange investments between the same class of shares of different funds without a sales charge, the ability to reinvest Fund dividends into other funds and the right to combine holdings in other funds to obtain a reduced sales charge. Favorable consideration was given to management’s continual efforts and expenditures in establishing effective business continuity plans and developing strategies to address cybersecurity threats. Among other factors taken into account by the Board were the Manager’s best execution trading policies, including a favorable report by an independent portfolio trading analytical firm that also covered FOREX transactions. Consideration was also given to the experience of each Fund’s portfolio management team, the number of accounts managed and general method of compensation. In this latter respect, the Board noted that a primary factor in management’s determination of a portfolio manager’s bonus compensation was the relative investment performance of the funds he or she managed and that a portion of such bonus was required to be invested in a predesignated list of funds within such person’s fund management area so as to be aligned with the interests of shareholders. The Board also took into account the quality of transfer agent and shareholder services provided
64 | Annual Report
franklintempleton.com
FRANKLIN STRATEGIC SERIES
SHAREHOLDER INFORMATION
Fund shareholders by an affiliate of the Manager, noting the changes taking place in the nature of transfer agency services throughout the industry and regulatory initiatives in this area, and the continual enhancements to the Franklin Templeton website. Particular attention was given to management’s conservative approach and diligent risk management procedures, including continual monitoring of counterparty credit risk and attention given to derivatives and other complex instruments, including expanded collateralization requirements. The Board also took into account, among other things, management’s efforts in establishing a global credit facility for the benefit of the Funds and other accounts managed by FTI to provide a source of cash for temporary and emergency purposes or to meet unusual redemption requests as well as the strong financial position of the Manager’s parent company and its commitment to the mutual fund business as evidenced by its continued subsidization of money market funds.
INVESTMENT PERFORMANCE. The Board placed significant emphasis on the investment performance of the Funds in view of its importance to shareholders. While consideration was given to performance reports and discussions with portfolio managers at Board meetings throughout the year, particular attention in assessing performance was given to the Lipper reports furnished for the agreement renewals. The Lipper reports prepared for each Fund showed the investment performance of its Class A shares in comparison to a performance universe selected by Lipper. Comparative performance for each Fund was shown for the one-year period ended January 31, 2015, and previous periods ended that date of up to 10 years depending on when a particular Fund commenced operations. The following summarizes the performance results for each of these Funds and the Board’s view of such performance.
Franklin Biotechnology Discovery Fund – The performance universe for this Fund consisted of the Fund and all retail and institutional health/biotechnology funds as selected by Lipper. The Lipper report showed the Fund’s total return for the one-year period to be in the second-highest performing quintile of its performance universe, and on an annualized basis, to be in the highest performing quintile of such universe for the previous three- and five-year periods, and the second-highest performing quintile of such universe for the previous 10-year period. The Board was satisfied with the Fund’s investment performance as set forth in the Lipper report.
Franklin Natural Resources Fund – The performance universe for this Fund consisted of the Fund and all retail and institutional global natural resources funds as selected by Lipper. The Lipper report comparison for the Fund showed its total return for the one-year period to be in the second-lowest performing quintile of its performance universe, and on an annualized basis to be in the lowest performing quintile of such universe for the previous three-year period, the middle performing quintile of such universe for the previous five-year period, and the second-lowest performing quintile of such universe for the previous 10-year period. The Board found the performance of the Fund to be unacceptable. It discussed with management the investment focus of the Fund, noting its explanation that underperformance was due in part to distress in global commodity markets. Management further explained its ongoing review of the Fund’s sector allocation. The Board determined that a portfolio management change was not required in light of management’s ongoing attention to the Fund, but it would continue to monitor the Fund.
COMPARATIVE EXPENSES. Consideration was given to a comparative analysis of the management fees and total expense ratio of each Fund compared with those of a group of other funds selected by Lipper as its appropriate Lipper expense group. Lipper expense data is based upon information taken from each fund’s most recent annual report, which reflects historical asset levels that may be quite different from those currently existing, particularly in a period of market volatility. While recognizing such inherent limitation and the fact that expense ratios generally increase as assets decline and decrease as assets grow, the Board believed the independent analysis conducted by Lipper to be an appropriate measure of comparative expenses. In reviewing comparative costs, Lipper provides information on each Fund’s contractual investment management fee in comparison with the investment management fee that would have been charged by other funds within its Lipper expense group assuming they were similar in size to the Fund, as well as the actual total expense ratio of each Fund in comparison with those of its Lipper expense group. The Lipper contractual investment management fee analysis includes administrative charges as being part of the investment management fee, and actual total expenses, for comparative consistency, are shown by Lipper for Fund Class A shares. The results of such expense comparisons showed the contractual investment management fee rates and actual total expense ratio for each of Franklin Natural Resources Fund and Franklin Biotechnology
franklintempleton.com
Annual Report
| 65
FRANKLIN STRATEGIC SERIES
SHAREHOLDER INFORMATION
Board Review of Investment Management
Agreement (continued)
Discovery Fund to be in the least expensive quintile of their respective Lipper expense groups. The Board was satisfied with the contractual management fee rate and total expense ratio of each of these Funds in comparison to its respective expense group as shown in the Lipper reports
MANAGEMENT PROFITABILITY. The Board also considered the level of profits realized by the Manager and its affiliates in connection with the operation of each Fund. In this respect, the Board reviewed the Fund profitability analysis that addresses the overall profitability of Franklin Templeton’s U.S. fund business, as well as its profits in providing management and other services to each of the individual funds during the 12-month period ended September 30, 2014, being the most recent fiscal year-end for Franklin Resources, Inc., the Manager’s parent. In reviewing the analysis, the Board recognized that allocation methodologies are inherently subjective and various allocation methodologies may be reasonable while producing different results. In this respect, the Board noted that while management continually makes refinements to its methodologies in response to organizational and product related changes, the overall approach as defined by the primary drivers and activity measurements has remained consistent with that used in the Funds’ profitability report presentations from prior years. Additionally, the Funds’ independent registered public accounting firm had been engaged by the Manager to periodically review the reasonableness of the allocation methodologies to be used solely by the Funds’ Board in reference to the profitability analysis. In reviewing and discussing such analysis, management discussed with the Board its belief that costs incurred in establishing the infrastructure necessary for the type of mutual fund operations conducted by the Manager and its affiliates may not be fully reflected in the expenses allocated to each Fund in determining its profitability, as well as the fact that the level of profits, to a certain extent, reflected operational cost savings and efficiencies initiated by management. The Board also took into account management’s expenditures in improving shareholder services provided the Funds, as well as the need to implement systems and meet additional regulatory and compliance requirements resulting from statutes such as the Sarbanes-Oxley and Dodd-Frank Acts and recent SEC and other regulatory requirements. In addition, the Board considered a third-party study comparing the profitability of the Manager’s parent on an overall basis to other publicly held managers broken down to show profitability from management operations exclusive of distribution expenses, as well as profitability including distribution expenses. The Board also considered the extent to which the Manager and its affiliates might derive ancillary benefits from fund operations, including revenues generated from transfer agent services, potential benefits resulting from personnel and systems enhancements necessitated by fund growth, as well as increased leverage with the service providers and counterparties. Based upon its consideration of all these factors, the Board determined that the level of profits realized by the Manager and its affiliates from providing services to each Fund was not excessive in view of the nature, quality and extent of services provided.
ECONOMIES OF SCALE. The Board also considered whether economies of scale are realized by the Manager as the Funds grow larger and the extent to which this is reflected in the level of management fees charged. While recognizing that any precise determination is inherently subjective, the Board noted that based upon the Fund profitability analysis, it appears that as some funds get larger, at some point economies of scale do result in the Manager realizing a larger profit margin on management services provided such a fund. The Board noted that economies of scale were shared with each Fund and its shareholders through management fee breakpoints so that as a fund grows in size, its effective management fee rate declines. The fee structure under the investment management agreement for each Fund contains breakpoints that continued to asset levels that exceeded its asset size at December 31, 2014. In view of such fee structure and the favorable expense comparisons of each Fund within its respective expense group, the Board believed that to the extent economies of scale may be realized by the Manager of the Funds and its affiliates, that there was a sharing of benefits with the Funds and their shareholders.
Proxy Voting Policies and Procedures
The Trust’s investment manager has established Proxy Voting Policies and Procedures (Policies) that the Trust uses to determine how to vote proxies relating to portfolio securities. Shareholders may view the Trust’s complete Policies online at franklintempleton.com. Alternatively, shareholders may request copies of the Policies free of charge by calling the Proxy Group collect at (954) 527-7678 or by sending a written request to: Franklin Templeton Companies, LLC, 300 S.E. 2nd Street, Fort Lauderdale, FL 33301, Attention: Proxy Group. Copies of the Trust’s proxy voting records are also made available online at franklintempleton.com and posted on the U.S. Securities and Exchange Commission’s website at sec.gov and reflect the most recent 12-month period ended June 30.
66 | Annual Report
franklintempleton.com
FRANKLIN STRATEGIC SERIES
SHAREHOLDER INFORMATION
Quarterly Statement of Investments
The Trust files a complete statement of investments with the U.S. Securities and Exchange Commission for the first and third quarters for each fiscal year on Form N-Q. Shareholders may view the filed Form N-Q by visiting the Commission’s website at sec.gov. The filed form may also be viewed and copied at the Commission’s Public Reference Room in Washington, DC. Information regarding the operations of the Public Reference Room may be obtained by calling (800) SEC-0330.
Householding of Reports and Prospectuses
You will receive each Fund’s financial reports every six months as well as an annual updated summary prospectus (prospectus available upon request). To reduce Fund expenses, we try to identify related shareholders in a household and send only one copy of the financial reports and summary prospectus. This process, called “householding,” will continue indefinitely unless you instruct us otherwise. If you prefer not to have these documents householded, please call us at (800) 632-2301. At any time you may view current prospectuses/summary prospectuses and financial reports on our website. If you choose, you may receive these documents through electronic delivery.
franklintempleton.com
Annual Report
| 67
This page intentionally left blank.
Franklin Templeton Investments
Gain From Our Perspective®
At Franklin Templeton Investments, we’re dedicated to one goal: delivering exceptional asset management for our clients. By bringing together multiple, world-class investment teams in a single firm, we’re able to offer specialized expertise across styles and asset classes, all supported by the strength and resources of one of the world’s largest asset managers. This has helped us to become a trusted partner to individual and institutional investors across the globe.
Focus on Investment Excellence
At the core of our firm, you’ll find multiple independent investment teams—each with a focused area of expertise—from traditional to alternative strategies and multi-asset solutions. And because our portfolio groups operate autonomously, their strategies can be combined to deliver true style and asset class diversification.
All of our investment teams share a common commitment to excellence grounded in rigorous, fundamental research and robust, disciplined risk management. Decade after decade, our consistent, research-driven processes have helped Franklin Templeton earn an impressive record of strong, long-term results.
Global Perspective Shaped by Local Expertise
In today’s complex and interconnected world, smart investing demands a global perspective. Franklin Templeton pioneered international investing over 60 years ago, and our expertise in emerging markets spans more than a quarter of a century. Today, our investment professionals are on the ground across the globe, spotting investment ideas and potential risks firsthand. These locally based teams bring in-depth understanding of local companies, economies and cultural nuances, and share their best thinking across our global research network.
Strength and Experience
Franklin Templeton is a global leader in asset management serving clients in over 150 countries.1 We run our business with the same prudence we apply to asset management, staying focused on delivering relevant investment solutions, strong long-term results and reliable, personal service. This approach, focused on putting clients first, has helped us to become one of the most trusted names in financial services.
1. As of 12/31/14. Clients are represented by the total number of shareholder accounts.
Not FDIC Insured | May Lose Value | No Bank Guarantee
| Contents | |
| Annual Report | |
| Franklin Strategic Income Fund | 3 |
| Performance Summary | 7 |
| Your Fund’s Expenses | 12 |
| Financial Highlights and | |
| Statement of Investments | 14 |
| Financial Statements | 42 |
| Notes to Financial Statements | 46 |
| Report of Independent Registered | |
| Public Accounting Firm | 59 |
| Tax Information | 60 |
| Board Members and Officers | 61 |
| Shareholder Information | 66 |
| franklintempleton.com |
1
Annual Report
Franklin Strategic Income Fund
This annual report for Franklin Strategic Income Fund covers the fiscal year ended April 30, 2015.
Your Fund’s Goals and Main Investments
The Fund seeks a high level of current income, with capital appreciation over the long term as a secondary objective. The Fund uses an active asset allocation process and under normal market conditions invests at least 65% of its assets in U.S. and foreign debt securities, including those in emerging markets. The Fund may invest in all varieties of fixed and floating rate income securities, including bonds, corporate loans (and loan participations), mortgage-backed securities and other asset-backed securities, convertible securities and municipal securities.
Performance Overview
The Fund’s Class A shares posted a +1.16% cumulative total return for the 12 months under review. In comparison, the Barclays U.S. Aggregate Bond Index, which represents the U.S. investment-grade fixed rate taxable bond market, generated a +4.46% total return.1 The Lipper Multi-Sector Income Funds Classification Average, which consists of funds chosen by Lipper that seek current income by allocating assets among different fixed income securities sectors, with a significant portion rated below investment grade, produced a +2.30% total return.2 You can find the Fund’s long-term performance data in the Performance Summary beginning on page 7.
Performance data represent past performance, which does not guarantee future results. Investment return and principal value will fluctuate, and you may have a gain or loss when you sell your shares. Current performance may differ from figures shown. Please visit franklintempleton.com or call (800) 342-5236 for most recent month-end performance.
Economic and Market Overview
U.S. economic growth moderated during the 12 months ended April 30, 2015, especially in the second half of the review period. The economy grew for most of 2014, supported in some quarters by greater spending by consumers, businesses, and state and local governments, partially offset by the negative impacts of a wider trade deficit and lower federal defense spending. In the first quarter of 2015, factors including low energy prices and U.S. dollar strength led export levels to fall. In addition, harsh weather and labor disruptions weighed on business spending. Manufacturing and non-manufacturing activities increased, and the unemployment rate declined to 5.4% at period-end from 6.2% in April 2014.3 Housing market data were positive for most of the period as home sales and prices rose while mortgage rates declined. After a brief slump during the period, retail sales rebounded toward period-end as auto sales surged. Inflation, as measured by the Consumer Price Index, remained subdued during the 12 months but rose late in the period amid higher energy prices bouncing from recent lows.
The Federal Reserve Board (Fed) ended its bond buying program in October 2014, based on its view that underlying economic strength could support ongoing progress in labor market conditions. Although the Fed had repeatedly stated that it could be patient with regard to raising interest rates, in March 2015, the Fed removed the word “patient” from its monetary policy guidance. It added, however, that it might keep interest rates lower than what it viewed as normal. In its April 2015 meeting, the Fed attributed the economy’s first-quarter slowdown to transitory factors. The Fed reiterated that it would raise interest rates when it saw further improvement in the labor market and was reasonably confident that inflation would move back to its 2% objective over the medium term.
1. Source: Morningstar.
2. Source: Lipper, a Thomson Reuters Company. For the 12-month period ended 4/30/15, this category consisted of 261 funds. Lipper calculations do not include sales
charges or expense subsidization by a fund’s manager. Fund performance relative to the average may have differed if these or other factors had been considered.
The indexes are unmanaged and include reinvestment of any income or distributions. One cannot invest directly in an index, and an index is not representative of the
Fund’s portfolio.
3. Source: Bureau of Labor Statistics.
See www.franklintempletondatasources.com for additional data provider information.
The dollar value, number of shares or principal amount, and names of all portfolio holdings are listed in the Fund’s Statement of Investments (SOI).
The SOI begins on page 19.
franklintempleton.com Annual Report | 3
| FRANKLIN STRATEGIC INCOME FUND | ||||
| Portfolio Breakdown* | ||||
| Based on Total Net Assets | ||||
| 4/30/15 | 4/30/14 | |||
| High Yield Corporate Bonds & Preferred | ||||
| Securities | 31.7 | % | 28.3 | % |
| Floating Rate Loans | 20.4 | % | 14.5 | % |
| International Government & Agency Bonds | ||||
| (Non-$US) | 15.0 | % | 20.0 | % |
| Investment-Grade Corporate Bonds | 6.5 | % | 8.2 | % |
| Mortgage-Backed Securities | 5.4 | % | 4.5 | % |
| Municipal Bonds | 4.1 | % | 5.8 | % |
| International Government & Agency Bonds | ||||
| ($US) | 3.3 | % | 2.4 | % |
| Commercial Mortgage-Backed Securities | 3.1 | % | 3.5 | % |
| U.S. Treasury Securities | 2.3 | % | 1.7 | % |
| Other | 0.3 | % | — | |
| Equities | 0.1 | % | 1.2 | % |
| Asset-Backed Securities | 0.0 | %** | 1.5 | % |
| Convertible Securities | 0.0 | %** | 0.1 | % |
| Short-Term Investments & Other Net Assets | 7.9 | % | 8.3 | % |
*Figures reflect certain derivatives held in the portfolio (or their underlying
reference assets) and may not total 100% or may be negative due to rounding,
use of any derivatives, unsettled trades or other factors. The breakdown may not
match the SOI.
**Rounds to less than 0.1% of total net assets.
The 10-year Treasury yield, which moves inversely to price, declined from 2.67% at the start of the period to 2.05% by period-end, as investors sought less risky assets given concerns about the crisis in Ukraine, Greece’s debt negotiations and relatively weak economic growth in Europe and Japan, as well as less robust growth in China. Near period-end, soft domestic data and the Fed’s cautious tone on raising interest rates also supported Treasury prices.
During the period, global financial markets were broadly influenced by the pickup in growth in the U.S., economic stabilization in China, the abundance of global liquidity from the Bank of Japan (BOJ) and European Central Bank (ECB) and the sharp decline in oil prices. The U.S. dollar strengthened against the euro, Japanese yen, and a vast number of developed and emerging market currencies over the six-month period.
As risk aversion increased during November and December, the U.S. dollar broadly strengthened against developed and emerging market currencies. Local-currency sovereign bond yields decreased across the Americas, Europe and Asia while credit spreads widened. This trend persisted through January before sharply reversing course in February; credit spreads tightened as risk appetites returned and local-currency sovereign bond yields broadly shifted higher across the Americas, Europe and Asia. During this time, currencies in certain emerging markets rebounded against the U.S. dollar.
Shortly before the period began, the BOJ introduced a new round of quantitative easing (QE) with an indefinite time horizon. Although Japan’s QE was positive for global risk assets, it contributed to further yen depreciation. In Europe, the ECB began an ambitious QE program in March with the aim of increasing the size of its balance sheet to a level higher than its previous peak. The ECB’s renewed commitment to pursue highly accommodative monetary policies put further pressure on the euro, which depreciated against the U.S. dollar during the period.
Investment Strategy
The Fund uses an active asset allocation strategy, investing across the fixed income markets in sectors that may include high yield and investment-grade corporate bonds, international developed and emerging market bonds, U.S. government and agency securities, mortgage- and other asset-backed securities, corporate bank loans, convertible securities and preferred stocks, and municipal securities. In addition to our bottom-up fundamental analysis of market sectors, industries and issuers, we evaluate country risk, business cycles, yield curves, and values between and within markets as part of our portfolio construction process. We may also enter into various transactions involving certain currency-, interest rate- or credit-related derivative instruments for hedging purposes, to enhance returns or to obtain exposure to various market sectors.
Manager’s Discussion
Over the past year, the global fixed income markets were influenced by two broad themes: declining government bond yields and a strengthening U.S. dollar. A combination of relatively tepid global economic growth combined with QE measures implemented in the eurozone and Japan led to declines for longer term interest rates in many developed markets during the period. Additionally, while Europe and Japan engaged in forms of QE, the U.S. discontinued incremental QE and guided the market toward an expectation of likely increases in the short-term federal funds target rate.
4 | Annual Report
franklintempleton.com
FRANKLIN STRATEGIC INCOME FUND
| Dividend Distributions* | |||||
| 5/1/14–4/30/15 | |||||
| Dividend per Share (cents) | |||||
| Advisor | |||||
| Month | Class A | Class C | Class R | Class R6 | Class |
| May | 3.47 | 3.11 | 3.25 | 3.81 | 3.69 |
| June | 3.50 | 3.15 | 3.28 | 3.83 | 3.72 |
| July | 3.69 | 3.33 | 3.47 | 4.03 | 3.92 |
| August | 3.65 | 3.29 | 3.43 | 3.98 | 3.88 |
| September | 4.63 | 4.28 | 4.41 | 4.95 | 4.85 |
| October | 5.75 | 5.39 | 5.53 | 6.08 | 5.97 |
| November | 5.70 | 5.36 | 5.49 | 6.02 | 5.91 |
| December | 9.82 | 9.47 | 9.60 | 10.14 | 10.04 |
| January | 3.64 | 3.30 | 3.43 | 3.96 | 3.85 |
| February | 3.82 | 3.51 | 3.63 | 4.11 | 4.01 |
| March | 3.82 | 3.48 | 3.61 | 4.15 | 4.03 |
| April | 3.73 | 3.40 | 3.52 | 4.05 | 3.94 |
| Total | 55.22 | 51.07 | 52.65 | 59.11 | 57.81 |
*All Fund distributions will vary depending upon current market conditions, and past
distributions are not indicative of future trends.
As a result, the U.S. dollar generally strengthened. Overall for the period, the 10-year Treasury yield fell from 2.67% to 2.05%. In comparison, 10-year German government bond yields fell below 0.5%, with shorter maturity German bonds effectively offering negative yields. Although periods of risk aversion negatively impacted the broader financial markets, lower rates supported equity markets, and the Standard & Poor’s 500 Index gained 12.98%.1
Although the Fund posted a positive total return for the review period, returns lagged those of the Barclays U.S. Aggregate Bond Index and the Fund’s peers in the Lipper Multi-Sector Income Funds Classification Average. Given the decline in longer term rates, longer duration U.S. fixed income securities performed well. Additionally, high yield corporate bonds underperformed the benchmark index as did certain non-U.S. dollar government bond sectors due to a stronger U.S. dollar. Consequently, relative to its benchmarks, the Fund’s heavier weighting in high yield and global bonds detracted from relative performance, as did its lesser exposure to U.S. interest rate duration. Conversely, the Fund’s net short positions in the Japanese yen and the euro, through the use of currency forwards, aided returns given weakness in these two currencies relative to the U.S. dollar. Also, the Fund’s holdings in longer duration municipal bonds, investment-grade corporate bonds and commercial mortgage-backed securities added to returns, as did its exposure to the leveraged corporate loan sector.
What is duration?
Duration is a measure of a bond’s price sensitivity to interest rate changes. In general, a portfolio of securities with a lower duration can be expected to be less sensitive to interest rate changes than a portfolio with a higher duration.
What is a currency forward contract?
A currency forward contract, or a currency forward, is an agreement between the Fund and a counterparty to buy or sell a foreign currency at a specific exchange rate on a future date.
In the corporate bond sector, U.S. dollar strength, along with a significant decline in energy-related companies’ profitability due to lower commodity prices, negatively impacted first-quarter 2015 earnings. However, the high yield default rate remained below historical averages, and corporate liquidity continued to be robust given the refinancing activity over the past several years that lowered interest costs and, in many cases, boosted cash reserves. Although many senior management teams focused on shareholder-friendly activity, including stock buybacks, dividends, and mergers and acquisitions, since the financial crisis, a greater focus on prudent balance sheet management remained. However, over the past 12 months, the drop in commodity prices weighed on high yield corporate bonds, with their heavy concentrations in the energy and metals and mining sectors. As a result, the high yield sector underper-formed the broader fixed income markets, particularly during 2014’s fourth quarter. Over the past year, we added to the Fund’s leveraged loan and high yield exposures, given our generally favorable outlook for corporate credit fundamentals and valuations we considered reasonable. In particular, we added to our loan positions, as we believed the sector should also be fairly insensitive to potential future interest rate increases.
Outside the U.S., the strong U.S. dollar negatively impacted the Fund’s non-U.S. dollar global bond positions. Although the Fund reduced its exposure to global government bonds over the past year, it was still hampered by its remaining non-U.S. dollar holdings. Conversely, the Fund’s net short positions in the yen and the euro, through the use of currency forwards, helped support performance given the decline in those currencies over the reporting period. The Fund maintained a fairly modest exposure to hard currency emerging market bonds; however, its position in Ukrainian debt securities detracted from performance given that country’s ongoing conflict with Russia.
franklintempleton.com Annual Report | 5
FRANKLIN STRATEGIC INCOME FUND
With the decline in longer term U.S. rates, the more rate-sensitive fixed income sectors, such as Treasuries, agencies and mortgage-backed securities, generally posted positive returns during the period. The Fund maintained a lower exposure to these sectors, preferring higher income opportunities in the corporate credit markets.
The combination of lower U.S. interest rates and some inflows into dedicated municipal bond funds helped support performance in this sector. However, concerns regarding Puerto Rico’s debt burden as well as its prospective treatment of certain municipal obligations in a restructuring scenario pressured certain issues from the U.S. commonwealth over the past year. Given overall strong performance from municipal securities, the Fund reduced its exposure to municipal debt during the period.
Thank you for your continued participation in Franklin Strategic Income Fund. We look forward to serving your future investment needs.

The foregoing information reflects our analysis, opinions and portfolio holdings as of April 30, 2015, the end of the reporting period. The way we implement our main investment strategies and the resulting portfolio holdings may change depending on factors such as market and economic conditions. These opinions may not be relied upon as investment advice or an offer for a particular security. The information is not a complete analysis of every aspect of any market, country, industry, security or the Fund. Statements of fact are from sources considered reliable, but the investment manager makes no representation or warranty as to their completeness or accuracy. Although historical performance is no guarantee of future results, these insights may help you understand our investment management philosophy.
Roger Bayston is a senior vice president of the Franklin Templeton Fixed Income Group. He is also a senior portfolio manager for several fixed income products and private accounts for Franklin Templeton Investments. Mr. Bayston directs a staff performing research and trading responsibilities for government, mortgage-backed and asset-backed securities. He sits on the Fixed Income Policy Committee and helps set portfolio strategy for multi-sector fixed income portfolios. In addition, he leads the team responsible for developing and implementing quantitative-based fixed income strategies of Franklin’s bond portfolios and fixed income products. Before joining Franklin Templeton Investments in 1991, Mr. Bayston managed portfolios of fixed income securities for Bankers Trust Company’s Investment Management Group.
CFA® is a trademark owned by CFA Institute.
6 | Annual Report franklintempleton.com
FRANKLIN STRATEGIC INCOME FUND
Performance Summary as of April 30, 2015
Your dividend income will vary depending on dividends or interest paid by securities in the Fund’s portfolio, adjusted for operating expenses of each class. Capital gain distributions are net profits realized from the sale of portfolio securities. The performance tables and graphs do not reflect any taxes that a shareholder would pay on Fund dividends, capital gain distributions, if any, or any realized gains on the sale of Fund shares. Total return reflects reinvestment of the Fund’s dividends and capital gain distributions, if any, and any unrealized gains or losses.
| Net Asset Value | ||||||||
| Share Class (Symbol) | 4/30/15 | 4/30/14 | Change | |||||
| A (FRSTX) | $ | 10.04 | $ | 10.57 | -$ | 0.53 | ||
| C (FSGCX) | $ | 10.04 | $ | 10.57 | -$ | 0.53 | ||
| R (FKSRX) | $ | 10.01 | $ | 10.54 | -$ | 0.53 | ||
| R6 (FGKNX) | $ | 10.05 | $ | 10.58 | -$ | 0.53 | ||
| Advisor (FKSAX) | $ | 10.05 | $ | 10.58 | -$ | 0.53 | ||
| Distributions (5/1/14–4/30/15) | ||||||||
| Dividend | Short-Term | Long-Term | ||||||
| Share Class | Income | Capital Gain | Capital Gain | Total | ||||
| A | $ | 0.5522 | $ | 0.0077 | $ | 0.0876 | $ | 0.6475 |
| C | $ | 0.5107 | $ | 0.0077 | $ | 0.0876 | $ | 0.6060 |
| R | $ | 0.5265 | $ | 0.0077 | $ | 0.0876 | $ | 0.6218 |
| R6 | $ | 0.5911 | $ | 0.0077 | $ | 0.0876 | $ | 0.6864 |
| Advisor | $ | 0.5781 | $ | 0.0077 | $ | 0.0876 | $ | 0.6734 |
franklintempleton.com
Annual Report
| 7
FRANKLIN STRATEGIC INCOME FUND
PERFORMANCE SUMMARY
Performance as of 4/30/151
Cumulative total return excludes sales charges. Average annual total returns include maximum sales charges. Class A: 4.25% maximum initial sales charge; Class C: 1% contingent deferred sales charge in first year only; Class R/R6/Advisor Class: no sales charges.
| Cumulative | Average Annual | Average Annual | Total Annual | |||||
| Share Class | Total Return2 | Total Return3 | Total Return (3/31/15)4 | Operating Expenses5 | ||||
| A | 0.87 | % | ||||||
| 1-Year | +1.16 | % | -3.15 | % | -3.73 | % | ||
| 5-Year | +29.41 | % | +4.38 | % | +4.50 | % | ||
| 10-Year | +80.39 | % | +5.62 | % | +5.49 | % | ||
| C | 1.27 | % | ||||||
| 1-Year | +0.76 | % | -0.19 | % | -0.79 | % | ||
| 5-Year | +26.88 | % | +4.88 | % | +4.99 | % | ||
| 10-Year | +73.37 | % | +5.66 | % | +5.53 | % | ||
| R | 1.12 | % | ||||||
| 1-Year | +0.91 | % | +0.91 | % | +0.31 | % | ||
| 5-Year | +27.91 | % | +5.05 | % | +5.14 | % | ||
| 10-Year | +76.06 | % | +5.82 | % | +5.69 | % | ||
| R6 | 0.49 | % | ||||||
| 1-Year | +1.54 | % | +1.54 | % | +1.03 | % | ||
| Since Inception (5/1/13) | +4.48 | % | +2.22 | % | +1.78 | % | ||
| Advisor | 0.62 | % | ||||||
| 1-Year | +1.41 | % | +1.41 | % | +0.81 | % | ||
| 5-Year | +31.00 | % | +5.55 | % | +5.66 | % | ||
| 10-Year | +85.04 | % | +6.35 | % | +6.21 | % |
| Distribution | 30-Day Standardized Yield7 | |||||
| Share Class | Rate6 | (with waiver) | (without waiver) | |||
| A | 5.26 | % | 3.96 | % | 3.95 | % |
| C | 5.09 | % | 3.73 | % | 3.72 | % |
| R | 5.26 | % | 3.88 | % | 3.87 | % |
| R6 | 5.88 | % | 4.53 | % | 4.52 | % |
| Advisor | 5.75 | % | 4.39 | % | 4.38 | % |
Performance data represent past performance, which does not guarantee future results. Investment return and principal value will fluctuate, and you may have a gain or loss when you sell your shares. Current performance may differ from figures shown. For most recent month-end performance, go to franklintempleton.com or call (800) 342-5236.
8 | Annual Report
franklintempleton.com
FRANKLIN STRATEGIC INCOME FUND
PERFORMANCE SUMMARY
Total Return Index Comparison for a Hypothetical $10,000 Investment1
Total return represents the change in value of an investment over the periods shown. It includes any applicable maximum sales charge, Fund expenses, account fees and reinvested distributions. The unmanaged indexes include reinvestment of any income or distributions. They differ from the Fund in composition and do not pay management fees or expenses. One cannot invest directly in an index.
franklintempleton.com Annual Report | 9
FRANKLIN STRATEGIC INCOME FUND
PERFORMANCE SUMMARY
Total Return Index Comparison for a Hypothetical $10,000 Investment1 (continued)
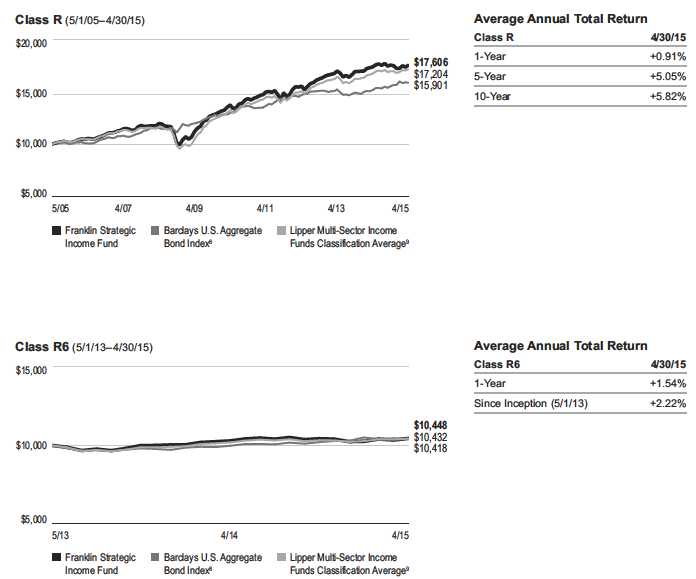
10 | Annual Report
franklintempleton.com
FRANKLIN STRATEGIC INCOME FUND
PERFORMANCE SUMMARY
Total Return Index Comparison for a Hypothetical $10,000 Investment1 (continued)
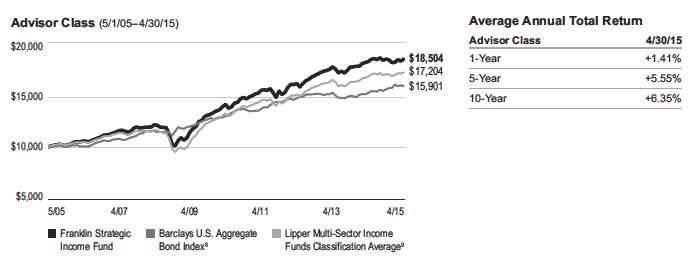
All investments involve risks, including possible loss of principal. Bond prices generally move in the opposite direction of interest rates. Thus, as prices of
bonds in the Fund adjust to a rise in interest rates, the Fund’s share price may decline. Changes in the financial strength of a bond issuer or in a bond’s credit
rating may affect its value. High yields reflect the higher credit risks associated with certain lower rated securities held in the portfolio. Floating rate loans and
high yield corporate bonds are rated below investment grade and are subject to greater risk of default, which could result in loss of principal — a risk that may
be heightened in a slowing economy. The risks of foreign securities include currency fluctuations and political uncertainty. Investments in developing markets
involve heightened risks related to the same factors, in addition to those associated with their relatively small size and lesser liquidity. Investing in derivative
securities and the use of foreign currency techniques involve special risks as such may not achieve the anticipated benefits and/or may result in losses to the
Fund. The Fund is actively managed but there is no guarantee that the manager’s investment decisions will produce the desired results. The Fund’s prospectus
also includes a description of the main investment risks.
| Class C: | These shares have higher annual fees and expenses than Class A shares. |
| Class R: | Shares are available to certain eligible investors as described in the prospectus. These shares have higher annual fees and expenses than Class A shares. |
| Class R6: | Shares are available to certain eligible investors as described in the prospectus. |
| Advisor Class: | Shares are available to certain eligible investors as described in the prospectus. |
1. The Fund has a fee waiver associated with its investments in a Franklin Templeton money fund, contractually guaranteed through at least its current fiscal year-end.
Class R6 has a fee waiver contractually guaranteed through at least the Fund’s current fiscal year-end. Fund investment results reflect the fee waivers, to the extent
applicable; without these reductions, the results would have been lower.
2. Cumulative total return represents the change in value of an investment over the periods indicated.
3. Average annual total return represents the average annual change in value of an investment over the periods indicated.
4. In accordance with SEC rules, we provide standardized average annual total return information through the latest calendar quarter.
5. Figures are as stated in the Fund’s current prospectus. In periods of market volatility, assets may decline significantly, causing total annual Fund operating expenses to
become higher than the figures shown.
6. Distribution rate is based on the sum of the respective class’s dividend distributions over the past 12 months and the maximum offering price (NAV for Classes C, R, R6
and Advisor) per share on 4/30/15.
7. The 30-day standardized yield for the 30 days ended 4/30/15 reflects an estimated yield to maturity (assuming all portfolio securities are held to maturity). It should be
regarded as an estimate of the Fund’s rate of investment income, and it may not equal the Fund’s actual income distribution rate (which reflects the Fund’s past dividends
paid to shareholders) or the income reported in the Fund’s financial statements.
8. Source: Morningstar. The Barclays U.S. Aggregate Bond Index is a market capitalization-weighted index representing the U.S. investment-grade, fixed-rate, taxable bond
market with index components for government and corporate, mortgage pass-through and asset-backed securities. All issues included are SEC-registered, taxable, dollar
denominated and nonconvertible, must have at least one year to final maturity, and must be rated investment grade (Baa3/BBB-/BBB- or above) using the middle rating of
Moody’s, Standard & Poor’s and Fitch, respectively.
9. Source: Lipper, a Thomson Reuters Company. The Lipper Multi-Sector Income Funds Classification Average is calculated by averaging the total returns of all funds within
the Lipper Multi-Sector Income Funds classification in the Lipper Open-End underlying funds universe. Lipper Multi-Sector Income Funds are defined as funds that seek
current income by allocating assets among different fixed income securities sectors (not primarily in one sector except for defensive purposes), including U.S. and foreign
governments, with a significant portion rated below investment grade. For the 12-month period ended 4/30/15, there were 261 funds in this category. Lipper calculations do
not include sales charges, but include reinvestment of any income or distributions. Fund performance relative to the average may have differed if these and other factors
had been considered.
See www.franklintempletondatasources.com for additional data provider information.
franklintempleton.com Annual Report | 11
FRANKLIN STRATEGIC INCOME FUND
Your Fund’s Expenses
As a Fund shareholder, you can incur two types of costs:
- Transaction costs, including sales charges (loads) on Fund purchases; and
- Ongoing Fund costs, including management fees, distribu- tion and service (12b-1) fees, and other Fund expenses. All mutual funds have ongoing costs, sometimes referred to as operating expenses.
The following table shows ongoing costs of investing in the Fund and can help you understand these costs and compare them with those of other mutual funds. The table assumes a $1,000 investment held for the six months indicated.
Actual Fund Expenses
The first line (Actual) for each share class listed in the table provides actual account values and expenses. The “Ending Account Value” is derived from the Fund’s actual return, which includes the effect of Fund expenses.
You can estimate the expenses you paid during the period by following these steps. Of course, your account value and expenses will differ from those in this illustration:
| 1. | Divide your account value by $1,000. |
| If an account had an $8,600 value, then $8,600 ÷ $1,000 = 8.6. | |
| 2. | Multiply the result by the number under the heading “Expenses Paid During Period.” |
| If Expenses Paid During Period were $7.50, then 8.6 x $7.50 = $64.50. |
In this illustration, the estimated expenses paid this period are $64.50.
Hypothetical Example for Comparison with Other Funds
Information in the second line (Hypothetical) for each class in the table can help you compare ongoing costs of investing in the Fund with those of other mutual funds. This information may not be used to estimate the actual ending account balance or expenses you paid during the period. The hypothetical “Ending Account Value” is based on the actual expense ratio for each class and an assumed 5% annual rate of return before expenses, which does not represent the Fund’s actual return. The figure under the heading “Expenses Paid During Period” shows the hypothetical expenses your account would have incurred under this scenario. You can compare this figure with the 5% hypothetical examples that appear in shareholder reports of other funds.
Please note that expenses shown in the table are meant to highlight ongoing costs and do not reflect any transaction costs, such as sales charges. Therefore, the second line for each class is useful in comparing ongoing costs only, and will not help you compare total costs of owning different funds. In addition, if transaction costs were included, your total costs would have been higher. Please refer to the Fund prospectus for additional information on operating expenses.
12 | Annual Report
franklintempleton.com
FRANKLIN STRATEGIC INCOME FUND
YOUR FUND’S EXPENSES
| Beginning Account | Ending Account | Expenses Paid During | ||||
| Share Class | Value 11/1/14 | Value 4/30/15 | Period* 11/1/14–4/30/15 | |||
| A | ||||||
| Actual | $ | 1,000 | $ | 999.60 | $ | 4.21 |
| Hypothetical (5% return before expenses) | $ | 1,000 | $ | 1,020.58 | $ | 4.26 |
| C | ||||||
| Actual | $ | 1,000 | $ | 998.60 | $ | 6.19 |
| Hypothetical (5% return before expenses) | $ | 1,000 | $ | 1,018.60 | $ | 6.26 |
| R | ||||||
| Actual | $ | 1,000 | $ | 999.30 | $ | 5.45 |
| Hypothetical (5% return before expenses) | $ | 1,000 | $ | 1,019.34 | $ | 5.51 |
| R6 | ||||||
| Actual | $ | 1,000 | $ | 1,001.50 | $ | 2.33 |
| Hypothetical (5% return before expenses) | $ | 1,000 | $ | 1,022.46 | $ | 2.36 |
| Advisor | ||||||
| Actual | $ | 1,000 | $ | 1,000.80 | $ | 2.98 |
| Hypothetical (5% return before expenses) | $ | 1,000 | $ | 1,021.82 | $ | 3.01 |
*Expenses are calculated using the most recent six-month expense ratio, net of expense waivers, annualized for each class (A: 0.85%;
C: 1.25%; R: 1.10%; R6: 0.47%; and Advisor: 0.60%), multiplied by the average account value over the period, multiplied by 181/365 to
reflect the one-half year period.
franklintempleton.com
Annual Report
| 13
| FRANKLIN STRATEGIC SERIES | |||||||||||||||
| Financial Highlights | |||||||||||||||
| Franklin Strategic Income Fund | |||||||||||||||
| Year Ended April 30, | |||||||||||||||
| 2015 | 2014 | 2013 | 2012 | 2011 | |||||||||||
| Class A | |||||||||||||||
| Per share operating performance | |||||||||||||||
| (for a share outstanding throughout the year) | |||||||||||||||
| Net asset value, beginning of year | $ | 10.57 | $ | 10.86 | $ | 10.48 | $ | 10.68 | $ | 10.30 | |||||
| Income from investment operationsa: | |||||||||||||||
| Net investment incomeb | 0.42 | 0.44 | 0.45 | 0.50 | 0.55 | ||||||||||
| Net realized and unrealized gains (losses) | (0.30 | ) | (0.18 | ) | 0.54 | (0.10 | ) | 0.39 | |||||||
| Total from investment operations | 0.12 | 0.26 | 0.99 | 0.40 | 0.94 | ||||||||||
| Less distributions from: | |||||||||||||||
| Net investment income and net foreign currency gains | (0.55 | ) | (0.45 | ) | (0.57 | ) | (0.60 | ) | (0.56 | ) | |||||
| Net realized gains | (0.10 | ) | (0.10 | ) | (0.04 | ) | — | — | |||||||
| Total distributions | (0.65 | ) | (0.55 | ) | (0.61 | ) | (0.60 | ) | (0.56 | ) | |||||
| Net asset value, end of year | $ | 10.04 | $ | 10.57 | $ | 10.86 | $ | 10.48 | $ | 10.68 | |||||
| Total returnc | 1.16 | % | 2.52 | % | 9.70 | % | 3.97 | % | 9.41 | % | |||||
| Ratios to average net assets | |||||||||||||||
| Expenses before waiver and payments by affiliates | 0.86 | % | 0.86 | % | 0.87 | % | 0.89 | % | 0.88 | % | |||||
| Expenses net of waiver and payments by affiliatesd | 0.85 | % | 0.86 | %e | 0.87 | % | 0.89 | % | 0.88 | % | |||||
| Net investment income | 4.03 | % | 4.16 | % | 4.21 | % | 4.81 | % | 5.26 | % | |||||
| Supplemental data | |||||||||||||||
| Net assets, end of year (000’s) | $ | 5,242,844 | $ | 5,182,490 | $ | 4,966,834 | $ | 3,757,100 | $ | 3,288,814 | |||||
| Portfolio turnover rate | 72.51 | % | 54.11 | % | 47.27 | % | 36.11 | % | 66.78 | % | |||||
| Portfolio turnover rate excluding mortgage dollar rollsf | 49.36 | % | 54.11 | % | 44.33 | % | 36.11 | % | 66.78 | % | |||||
aThe amount shown for a share outstanding throughout the period may not correlate with the Statement of Operations for the period due to the timing of sales and repurchases
of the Fund shares in relation to income earned and/or fluctuating fair value of the investments of the Fund.
bBased on average daily shares outstanding.
cTotal return does not reflect sales commissions or contingent deferred sales charges, if applicable.
dBenefit of expense reduction rounds to less than 0.01%.
eBenefit of waiver and payments by affiliates rounds to less than 0.01%.
fSee Note 1(h) regarding mortgage dollar rolls.
14 | Annual Report | The accompanying notes are an integral part of these financial statements. franklintempleton.com
| FRANKLIN STRATEGIC SERIES | |||||||||||||||
| FINANCIAL HIGHLIGHTS | |||||||||||||||
| Franklin Strategic Income Fund (continued) | |||||||||||||||
| Year Ended April 30, | |||||||||||||||
| 2015 | 2014 | 2013 | 2012 | 2011 | |||||||||||
| Class C | |||||||||||||||
| Per share operating performance | |||||||||||||||
| (for a share outstanding throughout the year) | |||||||||||||||
| Net asset value, beginning of year | $ | 10.57 | $ | 10.85 | $ | 10.48 | $ | 10.68 | $ | 10.30 | |||||
| Income from investment operationsa: | |||||||||||||||
| Net investment incomeb | 0.38 | 0.40 | 0.41 | 0.46 | 0.50 | ||||||||||
| Net realized and unrealized gains (losses) | (0.30 | ) | (0.17 | ) | 0.53 | (0.10 | ) | 0.40 | |||||||
| Total from investment operations | 0.08 | 0.23 | 0.94 | 0.36 | 0.90 | ||||||||||
| Less distributions from: | |||||||||||||||
| Net investment income and net foreign currency gains | (0.51 | ) | (0.41 | ) | (0.53 | ) | (0.56 | ) | (0.52 | ) | |||||
| Net realized gains | (0.10 | ) | (0.10 | ) | (0.04 | ) | — | — | |||||||
| Total distributions | (0.61 | ) | (0.51 | ) | (0.57 | ) | (0.56 | ) | (0.52 | ) | |||||
| Net asset value, end of year | $ | 10.04 | $ | 10.57 | $ | 10.85 | $ | 10.48 | $ | 10.68 | |||||
| Total returnc | 0.76 | % | 2.20 | % | 9.17 | % | 3.56 | % | 8.98 | % | |||||
| Ratios to average net assets | |||||||||||||||
| Expenses before waiver and payments by affiliates | 1.26 | % | 1.26 | % | 1.27 | % | 1.29 | % | 1.28 | % | |||||
| Expenses net of waiver and payments by affiliatesd | 1.25 | % | 1.26 | %e | 1.27 | % | 1.29 | % | 1.28 | % | |||||
| Net investment income | 3.63 | % | 3.76 | % | 3.81 | % | 4.41 | % | 4.86 | % | |||||
| Supplemental data | |||||||||||||||
| Net assets, end of year (000’s) | $ | 2,070,739 | $ | 2,109,049 | $ | 2,108,962 | $ | 1,569,746 | $ | 1,358,857 | |||||
| Portfolio turnover rate | 72.51 | % | 54.11 | % | 47.27 | % | 36.11 | % | 66.78 | % | |||||
| Portfolio turnover rate excluding mortgage dollar rollsf | 49.36 | % | 54.11 | % | 44.33 | % | 36.11 | % | 66.78 | % | |||||
aThe amount shown for a share outstanding throughout the period may not correlate with the Statement of Operations for the period due to the timing of sales and repurchases
of the Fund shares in relation to income earned and/or fluctuating fair value of the investments of the Fund.
bBased on average daily shares outstanding.
cTotal return does not reflect sales commissions or contingent deferred sales charges, if applicable.
dBenefit of expense reduction rounds to less than 0.01%.
eBenefit of waiver and payments by affiliates rounds to less than 0.01%.
fSee Note 1(h) regarding mortgage dollar rolls.
franklintempleton.com The accompanying notes are an integral part of these financial statements. | Annual Report | 15
| FRANKLIN STRATEGIC SERIES | |||||||||||||||
| FINANCIAL HIGHLIGHTS | |||||||||||||||
| Franklin Strategic Income Fund (continued) | |||||||||||||||
| Year Ended April 30, | |||||||||||||||
| 2015 | 2014 | 2013 | 2012 | 2011 | |||||||||||
| Class R | |||||||||||||||
| Per share operating performance | |||||||||||||||
| (for a share outstanding throughout the year) | |||||||||||||||
| Net asset value, beginning of year | $ | 10.54 | $ | 10.82 | $ | 10.45 | $ | 10.65 | $ | 10.27 | |||||
| Income from investment operationsa: | |||||||||||||||
| Net investment incomeb | 0.39 | 0.41 | 0.42 | 0.47 | 0.52 | ||||||||||
| Net realized and unrealized gains (losses) | (0.29 | ) | (0.17 | ) | 0.53 | (0.10 | ) | 0.39 | |||||||
| Total from investment operations | 0.10 | 0.24 | 0.95 | 0.37 | 0.91 | ||||||||||
| Less distributions from: | |||||||||||||||
| Net investment income and net foreign currency gains | (0.53 | ) | (0.42 | ) | (0.54 | ) | (0.57 | ) | (0.53 | ) | |||||
| Net realized gains | (0.10 | ) | (0.10 | ) | (0.04 | ) | — | — | |||||||
| Total distributions | (0.63 | ) | (0.52 | ) | (0.58 | ) | (0.57 | ) | (0.53 | ) | |||||
| Net asset value, end of year | $ | 10.01 | $ | 10.54 | $ | 10.82 | $ | 10.45 | $ | 10.65 | |||||
| Total return | 0.91 | % | 2.36 | % | 9.36 | % | 3.72 | % | 9.17 | % | |||||
| Ratios to average net assets | �� | ||||||||||||||
| Expenses before waiver and payments by affiliates | 1.11 | % | 1.11 | % | 1.12 | % | 1.14 | % | 1.13 | % | |||||
| Expenses net of waiver and payments by affiliatesc | 1.10 | % | 1.11 | %d | 1.12 | % | 1.14 | % | 1.13 | % | |||||
| Net investment income | 3.78 | % | 3.91 | % | 3.96 | % | 4.56 | % | 5.01 | % | |||||
| Supplemental data | |||||||||||||||
| Net assets, end of year (000’s) | $ | 223,758 | $ | 227,359 | $ | 260,647 | $ | 249,662 | $ | 234,775 | |||||
| Portfolio turnover rate | 72.51 | % | 54.11 | % | 47.27 | % | 36.11 | % | 66.78 | % | |||||
| Portfolio turnover rate excluding mortgage dollar rollse | 49.36 | % | 54.11 | % | 44.33 | % | 36.11 | % | 66.78 | % | |||||
aThe amount shown for a share outstanding throughout the period may not correlate with the Statement of Operations for the period due to the timing of sales and repurchases
of the Fund shares in relation to income earned and/or fluctuating fair value of the investments of the Fund.
bBased on average daily shares outstanding.
cBenefit of expense reduction rounds to less than 0.01%.
dBenefit of waiver and payments by affiliates rounds to less than 0.01%.
eSee Note 1(h) regarding mortgage dollar rolls.
16 | Annual Report | The accompanying notes are an integral part of these financial statements. franklintempleton.com
| FRANKLIN STRATEGIC SERIES |
| FINANCIAL HIGHLIGHTS |
| Franklin Strategic Income Fund (continued) | ||||||
| Year Ended | ||||||
| April 30, | ||||||
| 2015 | 2014 | a | ||||
| Class R6 | ||||||
| Per share operating performance | ||||||
| (for a share outstanding throughout the year) | ||||||
| Net asset value, beginning of year | $ | 10.58 | $ | 10.87 | ||
| Income from investment operationsb: | ||||||
| Net investment incomec | 0.46 | 0.49 | ||||
| Net realized and unrealized gains (losses) | (0.30 | ) | (0.19 | ) | ||
| Total from investment operations | 0.16 | 0.30 | ||||
| Less distributions from: | ||||||
| Net investment income and net foreign currency gains | (0.59 | ) | (0.49 | ) | ||
| Net realized gains | (0.10 | ) | (0.10 | ) | ||
| Total distributions | (0.69 | ) | (0.59 | ) | ||
| Net asset value, end of year | $ | 10.05 | $ | 10.58 | ||
| Total return | 1.54 | % | 2.90 | % | ||
| Ratios to average net assets | ||||||
| Expenses before waiver and payments by affiliates | 0.48 | % | 0.48 | % | ||
| Expenses net of waiver and payments by affiliatesd | 0.47 | % | 0.48 | %e | ||
| Net investment income | 4.41 | % | 4.54 | % | ||
| Supplemental data | ||||||
| Net assets, end of year (000’s) | $ | 253,929 | $ | 247,007 | ||
| Portfolio turnover rate | 72.51 | % | 54.11 | % | ||
| Portfolio turnover rate excluding mortgage dollar rollsf | 49.36 | % | 54.11 | % | ||
aFor the year May 1, 2013 (effective date) to April 30, 2014.
bThe amount shown for a share outstanding throughout the period may not correlate with the Statement of Operations for the period due to the timing of sales and repurchases
of the Fund shares in relation to income earned and/or fluctuating fair value of the investments of the Fund.
cBased on average daily shares outstanding.
dBenefit of expense reduction rounds to less than 0.01%.
eBenefit of waiver and payments by affiliates rounds to less than 0.01%.
fSee Note 1(h) regarding mortgage dollar rolls.
franklintempleton.com The accompanying notes are an integral part of these financial statements. | Annual Report | 17
| FRANKLIN STRATEGIC SERIES | |||||||||||||||
| FINANCIAL HIGHLIGHTS | |||||||||||||||
| Franklin Strategic Income Fund (continued) | |||||||||||||||
| Year Ended April 30, | |||||||||||||||
| 2015 | 2014 | 2013 | 2012 | 2011 | |||||||||||
| Advisor Class | |||||||||||||||
| Per share operating performance | |||||||||||||||
| (for a share outstanding throughout the year) | |||||||||||||||
| Net asset value, beginning of year | $ | 10.58 | $ | 10.86 | $ | 10.49 | $ | 10.69 | $ | 10.31 | |||||
| Income from investment operationsa: | |||||||||||||||
| Net investment incomeb | 0.44 | 0.47 | 0.48 | 0.53 | 0.57 | ||||||||||
| Net realized and unrealized gains (losses) | (0.29 | ) | (0.17 | ) | 0.53 | (0.10 | ) | 0.39 | |||||||
| Total from investment operations | 0.15 | 0.30 | 1.01 | 0.43 | 0.96 | ||||||||||
| Less distributions from: | |||||||||||||||
| Net investment income and net foreign currency gains | (0.58 | ) | (0.48 | ) | (0.60 | ) | (0.63 | ) | (0.58 | ) | |||||
| Net realized gains | (0.10 | ) | (0.10 | ) | (0.04 | ) | — | — | |||||||
| Total distributions | (0.68 | ) | (0.58 | ) | (0.64 | ) | (0.63 | ) | (0.58 | ) | |||||
| Net asset value, end of year | $ | 10.05 | $ | 10.58 | $ | 10.86 | $ | 10.49 | $ | 10.69 | |||||
| Total return | 1.41 | % | 2.87 | % | 9.87 | % | 4.22 | % | 9.67 | % | |||||
| Ratios to average net assets | |||||||||||||||
| Expenses before waiver and payments by affiliates | 0.61 | % | 0.61 | % | 0.62 | % | 0.64 | % | 0.63 | % | |||||
| Expenses net of waiver and payments by affiliatesc | 0.60 | % | 0.61 | %d | 0.62 | % | 0.64 | % | 0.63 | % | |||||
| Net investment income | 4.28 | % | 4.41 | % | 4.46 | % | 5.06 | % | 5.51 | % | |||||
| Supplemental data | |||||||||||||||
| Net assets, end of year (000’s) | $ | 1,130,796 | $ | 1,010,755 | $ | 956,001 | $ | 713,659 | $ | 589,220 | |||||
| Portfolio turnover rate | 72.51 | % | 54.11 | % | 47.27 | % | 36.11 | % | 66.78 | % | |||||
| Portfolio turnover rate excluding mortgage dollar rollse | 49.36 | % | 54.11 | % | 44.33 | % | 36.11 | % | 66.78 | % | |||||
aThe amount shown for a share outstanding throughout the period may not correlate with the Statement of Operations for the period due to the timing of sales and repurchases
of the Fund shares in relation to income earned and/or fluctuating fair value of the investments of the Fund.
bBased on average daily shares outstanding.
cBenefit of expense reduction rounds to less than 0.01%.
dBenefit of waiver and payments by affiliates rounds to less than 0.01%.
eSee Note 1(h) regarding mortgage dollar rolls.
18 | Annual Report | The accompanying notes are an integral part of these financial statements. franklintempleton.com
FRANKLIN STRATEGIC SERIES
| Statement of Investments, April 30, 2015 | |||||
| Franklin Strategic Income Fund | |||||
| Country | Shares | Value | |||
| Common Stocks 0.1% | |||||
| Consumer Services 0.1% | |||||
| a,b,cTurtle Bay Resort | United States | 5,579,939 | $ | 11,076,180 | |
| Materials 0.0%† | |||||
| aVerso Corp | United States | 52,816 | 73,942 | ||
| Transportation 0.0%† | |||||
| aCEVA Holdings LLC | United Kingdom | 1,570 | 1,177,478 | ||
| Total Common Stocks (Cost $8,876,698) | 12,327,600 | ||||
| Convertible Preferred Stocks 0.0%† | |||||
| Transportation 0.0%† | �� | ||||
| aCEVA Holdings LLC, cvt. pfd., A-1 | United Kingdom | 62 | 65,100 | ||
| aCEVA Holdings LLC, cvt. pfd., A-2 | United Kingdom | 3,399 | 2,548,920 | ||
| Total Convertible Preferred Stocks (Cost $5,149,790) | 2,614,020 | ||||
| Principal | |||||
| Amount* | |||||
| Corporate Bonds 38.4% | |||||
| Automobiles & Components 0.5% | |||||
| dAvis Budget Finance PLC, senior note, 144A, 6.00%, 3/01/21 | United States | 9,000,000 | EUR | 10,754,849 | |
| dFiat Chrysler Automobiles NV, senior note, 144A, 5.25%, 4/15/23 | United Kingdom | 17,200,000 | 17,415,000 | ||
| The Goodyear Tire & Rubber Co., senior note, 6.50%, 3/01/21 | United States | 20,000,000 | 21,260,000 | ||
| 49,429,849 | |||||
| Banks 3.2% | |||||
| Bank of America Corp., | |||||
| ejunior sub. bond, AA, 6.10% to 3/17/25, FRN thereafter, Perpetual | United States | 10,000,000 | 10,237,500 | ||
| ejunior sub. bond, M, 8.125% to 5/15/18, FRN thereafter, Perpetual | United States | 22,000,000 | 23,870,000 | ||
| senior note, 6.40%, 8/28/17 | United States | 10,000,000 | 11,055,280 | ||
| senior note, 5.65%, 5/01/18 | United States | 10,000,000 | 11,069,820 | ||
| CIT Group Inc., senior note, | |||||
| 5.375%, 5/15/20 | United States | 6,900,000 | 7,322,625 | ||
| 5.00%, 8/15/22 | United States | 18,000,000 | 18,528,750 | ||
| d144A, 6.625%, 4/01/18 | United States | 7,000,000 | 7,525,000 | ||
| Citigroup Inc., | |||||
| ejunior sub. bond, M, 6.30% to 5/15/24, FRN thereafter, Perpetual | United States | 6,900,000 | 6,998,670 | ||
| ejunior sub. bond, O, 5.875% to 3/27/20, FRN thereafter, Perpetual | United States | 10,000,000 | 10,087,500 | ||
| senior note, 3.875%, 10/25/23 | United States | 20,000,000 | 20,850,500 | ||
| sub. bond, 5.50%, 9/13/25 | United States | 10,000,000 | 11,220,020 | ||
| sub. note, 4.05%, 7/30/22 | United States | 5,000,000 | 5,217,965 | ||
| JPMorgan Chase & Co., | |||||
| ejunior sub. bond, R, 6.00% to 8/01/23, FRN thereafter, Perpetual | United States | 10,000,000 | 10,325,000 | ||
| ejunior sub. bond, V, 5.00% to 7/30/19, FRN thereafter, Perpetual | United States | 5,000,000 | 4,925,000 | ||
| ejunior sub. note, X, 6.10% to 10/01/24, FRN thereafter, Perpetual | United States | 5,000,000 | 5,187,500 | ||
| senior note, 4.25%, 10/15/20 | United States | 10,000,000 | 10,866,350 | ||
| senior note, 3.25%, 9/23/22 | United States | 5,000,000 | 5,080,290 | ||
| sub. note, 3.375%, 5/01/23 | United States | 10,000,000 | 9,996,120 | ||
| sub. note, 3.875%, 9/10/24 | United States | 10,000,000 | 10,140,380 | ||
| Royal Bank of Scotland Group PLC, sub. note, | |||||
| 6.125%, 12/15/22 | United Kingdom | 10,000,000 | 11,106,250 | ||
| 5.125%, 5/28/24 | United Kingdom | 2,600,000 | 2,686,125 | ||
| The Royal Bank of Scotland PLC, sub. note, 6.934%, 4/09/18 | United Kingdom | 13,000,000 | EUR | 16,719,947 | |
franklintempleton.com Annual Report | 19
FRANKLIN STRATEGIC SERIES
STATEMENT OF INVESTMENTS
| Franklin Strategic Income Fund (continued) | |||||
| Principal | |||||
| Country | Amount* | Value | |||
| Corporate Bonds (continued) | |||||
| Banks (continued) | |||||
| eWells Fargo & Co., junior sub. bond, | |||||
| 5.875% to 6/15/25, FRN thereafter, Perpetual | United States | 22,000,000 | $ | 23,485,000 | |
| S, 5.90% to 6/15/24, FRN thereafter, Perpetual | United States | 28,000,000 | 29,400,000 | ||
| 283,901,592 | |||||
| Capital Goods 1.0% | |||||
| dAbengoa Finance SAU, senior note, 144A, | |||||
| 8.875%, 11/01/17 | Spain | 18,000,000 | 18,753,750 | ||
| 7.75%, 2/01/20 | Spain | 1,600,000 | 1,590,000 | ||
| dBombardier Inc., senior bond, 144A, 7.50%, 3/15/25 | Canada | 18,100,000 | 18,009,500 | ||
| dKM Germany Holdings GmbH, senior secured note, first lien, 144A, 8.75%, | |||||
| 12/15/20 | Germany | 9,000,000 | EUR | 11,083,049 | |
| Meritor Inc., senior note, 6.75%, 6/15/21 | United States | 4,000,000 | 4,200,000 | ||
| Navistar International Corp., senior note, 8.25%, 11/01/21 | United States | 12,200,000 | 12,108,500 | ||
| Terex Corp., senior note, 6.00%, 5/15/21 | United States | 15,000,000 | 15,243,750 | ||
| TransDigm Inc., | |||||
| senior sub. bond, 6.50%, 7/15/24 | United States | 4,000,000 | 4,079,400 | ||
| senior sub. note, 6.00%, 7/15/22 | United States | 4,000,000 | 4,060,000 | ||
| 89,127,949 | |||||
| Commercial & Professional Services 0.0%† | |||||
| dAlgeco Scotsman Global Finance PLC, first lien, 144A, 9.00%, 10/15/18 | United Kingdom | 1,200,000 | EUR | 1,337,203 | |
| Consumer Durables & Apparel 0.6% | |||||
| KB Home, | |||||
| senior bond, 7.50%, 9/15/22 | United States | 5,000,000 | 5,250,000 | ||
| senior note, 4.75%, 5/15/19 | United States | 9,400,000 | 9,376,500 | ||
| senior note, 7.00%, 12/15/21 | United States | 13,300,000 | 13,931,750 | ||
| M/I Homes Inc., senior note, 8.625%, 11/15/18 | United States | 2,200,000 | 2,293,500 | ||
| Toll Brothers Finance Corp., senior bond, 5.625%, 1/15/24 | United States | 10,300,000 | 11,252,750 | ||
| Visant Corp., senior note, 10.00%, 10/01/17 | United States | 14,300,000 | 12,548,250 | ||
| 54,652,750 | |||||
| Consumer Services 1.6% | |||||
| d1011778 BC ULC/New Red Finance Inc., secured note, second lien, 144A, | |||||
| 6.00%, 4/01/22 | Canada | 20,000,000 | 20,750,000 | ||
| fCaesars Entertainment Operating Co. Inc., senior secured note, first lien, | |||||
| 11.25%, 6/01/17 | United States | 25,000,000 | 18,875,000 | ||
| d,gFinanciere Quick SAS, | |||||
| 144A, FRN, 7.511%, 10/15/19 | France | 6,600,000 | EUR | 6,518,125 | |
| secured note, 144A, FRN, 4.761%, 4/15/19 | France | 6,900,000 | EUR | 7,169,768 | |
| dInternational Game Technology PLC, | |||||
| senior secured bond, 144A, 6.50%, 2/15/25 | United Kingdom | 15,000,000 | 14,587,500 | ||
| senior secured note, 144A, 6.25%, 2/15/22 | United Kingdom | 20,500,000 | 20,256,562 | ||
| MGM Resorts International, senior note, | |||||
| 6.625%, 7/15/15 | United States | 15,000,000 | 15,131,250 | ||
| 7.50%, 6/01/16 | United States | 1,000,000 | 1,057,500 | ||
| 10.00%, 11/01/16 | United States | 1,000,000 | 1,110,000 | ||
| 8.625%, 2/01/19 | United States | 700,000 | 805,438 | ||
| 6.75%, 10/01/20 | United States | 1,800,000 | 1,946,250 | ||
| 6.625%, 12/15/21 | United States | 10,000,000 | 10,750,000 | ||
| 7.75%, 3/15/22 | United States | 2,000,000 | 2,255,000 | ||
| 6.00%, 3/15/23 | United States | 3,000,000 | 3,120,000 |
20 | Annual Report franklintempleton.com
FRANKLIN STRATEGIC SERIES
STATEMENT OF INVESTMENTS
| Franklin Strategic Income Fund (continued) | |||||
| Principal | |||||
| Country | Amount* | Value | |||
| Corporate Bonds (continued) | |||||
| Consumer Services (continued) | |||||
| Pinnacle Entertainment Inc., | |||||
| senior note, 6.375%, 8/01/21 | United States | 4,900,000 | $ | 5,236,875 | |
| senior sub. note, 7.75%, 4/01/22 | United States | 2,200,000 | 2,453,000 | ||
| dScientific Games International Inc., senior note, 144A, 10.00%, 12/01/22 | United States | 10,900,000 | 10,164,250 | ||
| dWynn Macau Ltd., senior note, 144A, 5.25%, 10/15/21 | Macau | 200,000 | 188,000 | ||
| 142,374,518 | |||||
| Diversified Financials 2.3% | |||||
| dAerCap Ireland Capital Ltd./AerCap Global Aviation Trust, senior note, | |||||
| 144A, 5.00%, 10/01/21 | Netherlands | 10,600,000 | 11,388,375 | ||
| Ally Financial Inc., senior note, 7.50%, 9/15/20 | United States | 19,663,000 | 23,082,396 | ||
| Deutsche Bank AG, sub. bond, 4.296% to 5/24/23, FRN thereafter, | |||||
| 5/24/28 | Germany | 33,000,000 | 32,051,250 | ||
| E*TRADE Financial Corp., senior note, | |||||
| 5.375%, 11/15/22 | United States | 9,000,000 | 9,585,000 | ||
| 4.625%, 9/15/23 | United States | 8,100,000 | 8,292,375 | ||
| eThe Goldman Sachs Group Inc., junior sub. bond, M, 5.375% to 5/10/20, | |||||
| FRN thereafter, Perpetual | United States | 21,900,000 | 21,982,125 | ||
| Morgan Stanley, | |||||
| ejunior sub. bond, 5.55% to 7/15/20, FRN thereafter, Perpetual | United States | 25,600,000 | 25,792,000 | ||
| sub. bond, 3.95%, 4/23/27 | United States | 10,000,000 | 9,803,000 | ||
| Navient Corp., senior note, | |||||
| 8.45%, 6/15/18 | United States | 14,100,000 | 15,766,620 | ||
| 5.50%, 1/15/19 | United States | 16,000,000 | 16,304,000 | ||
| 5.875%, 3/25/21 | United States | 5,000,000 | 4,987,500 | ||
| 6.125%, 3/25/24 | United States | 10,000,000 | 9,750,000 | ||
| dNeuberger Berman Group LLC/Finance Corp., senior note, 144A, | |||||
| 5.625%, 3/15/20 | United States | 4,000,000 | 4,180,200 | ||
| 5.875%, 3/15/22 | United States | 10,000,000 | 10,800,000 | ||
| 203,764,841 | |||||
| Energy 7.8% | |||||
| Access Midstream Partner LP/ACMP Finance Corp., senior note, 6.125%, | |||||
| 7/15/22 | United States | 7,300,000 | 7,850,668 | ||
| BreitBurn Energy Partners LP/BreitBurn Finance Corp., senior bond, | |||||
| 7.875%, 4/15/22 | United States | 28,400,000 | 23,430,000 | ||
| California Resources Corp., | |||||
| senior bond, 6.00%, 11/15/24 | United States | 17,000,000 | 16,065,000 | ||
| senior note, 5.50%, 9/15/21 | United States | 8,400,000 | 8,001,000 | ||
| CGG SA, senior note, | |||||
| 7.75%, 5/15/17 | France | 3,429,000 | 3,377,565 | ||
| 6.50%, 6/01/21 | France | 10,000,000 | 8,150,000 | ||
| 6.875%, 1/15/22 | France | 10,000,000 | 8,187,500 | ||
| d144A, 5.875%, 5/15/20 | France | 3,500,000 | EUR | 3,824,087 | |
| Chaparral Energy Inc., senior note, | |||||
| 9.875%, 10/01/20 | United States | 8,000,000 | 6,940,000 | ||
| 8.25%, 9/01/21 | United States | 8,000,000 | 6,560,000 | ||
| 7.625%, 11/15/22 | United States | 1,400,000 | 1,113,000 | ||
| CHC Helicopter SA, | |||||
| senior note, 9.375%, 6/01/21 | Canada | 5,000,000 | 3,425,000 | ||
| senior secured note, first lien, 9.25%, 10/15/20 | Canada | 20,001,600 | 17,501,400 |
franklintempleton.com Annual Report | 21
FRANKLIN STRATEGIC SERIES
STATEMENT OF INVESTMENTS
| Franklin Strategic Income Fund (continued) | ||||
| Principal | ||||
| Country | Amount* | Value | ||
| Corporate Bonds (continued) | ||||
| Energy (continued) | ||||
| Chesapeake Energy Corp., senior note, | ||||
| 7.25%, 12/15/18 | United States | 1,000,000 | $ | 1,077,500 |
| 6.625%, 8/15/20 | United States | 16,000,000 | 16,560,000 | |
| 6.125%, 2/15/21 | United States | 6,000,000 | 6,060,000 | |
| 5.75%, 3/15/23 | United States | 14,000,000 | 13,510,000 | |
| Clayton Williams Energy Inc., senior note, 7.75%, 4/01/19 | United States | 22,000,000 | 21,175,000 | |
| CONSOL Energy Inc., senior note, | ||||
| 5.875%, 4/15/22 | United States | 20,000,000 | 18,550,000 | |
| d144A, 8.00%, 4/01/23 | United States | 13,700,000 | 13,939,750 | |
| Energy Transfer Equity LP, senior note, first lien, 7.50%, 10/15/20 | United States | 30,000,000 | 33,900,000 | |
| Energy Transfer Partners LP, senior note, 5.20%, 2/01/22 | United States | 10,000,000 | 10,909,050 | |
| Energy XXI Gulf Coast Inc., | ||||
| senior note, 9.25%, 12/15/17 | United States | 15,000,000 | 11,250,000 | |
| senior note, 7.50%, 12/15/21 | United States | 2,100,000 | 879,375 | |
| dsenior note, 144A, 6.875%, 3/15/24 | United States | 15,000,000 | 6,037,500 | |
| dsenior secured note, second lien, 144A, 11.00%, 3/15/20 | United States | 5,000,000 | 4,825,000 | |
| dEnQuest PLC, senior note, 144A, 7.00%, 4/15/22 | United Kingdom | 15,000,000 | 11,690,625 | |
| Freeport-McMoRan Oil & Gas LLC/FCX Oil & Gas Inc., senior note, | ||||
| 6.875%, 2/15/23 | United States | 3,816,000 | 4,111,740 | |
| d,hGaz Capital SA (OJSC Gazprom), loan participation, | ||||
| senior bond, 144A, 6.51%, 3/07/22 | Russia | 8,000,000 | 8,083,744 | |
| senior note, 144A, 5.092%, 11/29/15 | Russia | 7,000,000 | 7,065,625 | |
| senior note, 144A, 3.85%, 2/06/20 | Russia | 20,000,000 | 18,362,500 | |
| Halcon Resources Corp., senior note, | ||||
| 9.75%, 7/15/20 | United States | 4,000,000 | 3,300,000 | |
| 8.875%, 5/15/21 | United States | 15,000,000 | 11,790,000 | |
| 9.25%, 2/15/22 | United States | 5,300,000 | 4,134,000 | |
| dKinder Morgan Finance Co. LLC, senior secured note, 144A, 6.00%, | ||||
| 1/15/18 | United States | 17,000,000 | 18,686,043 | |
| Kinder Morgan Inc., | ||||
| senior bond, 4.30%, 6/01/25 | United States | 5,000,000 | 5,082,035 | |
| senior note, 7.00%, 6/15/17 | United States | 3,500,000 | 3,841,803 | |
| senior note, 6.50%, 9/15/20 | United States | 9,000,000 | 10,470,825 | |
| Linn Energy LLC/Finance Corp., senior note, | ||||
| 6.50%, 5/15/19 | United States | 5,000,000 | 4,387,500 | |
| 6.25%, 11/01/19 | United States | 8,000,000 | 6,820,000 | |
| 8.625%, 4/15/20 | United States | 10,000,000 | 9,125,000 | |
| 7.75%, 2/01/21 | United States | 10,000,000 | 8,650,000 | |
| 6.50%, 9/15/21 | United States | 2,500,000 | 2,050,000 | |
| dLUKOIL International Finance BV, senior note, 144A, 4.563%, 4/24/23 | Russia | 35,000,000 | 31,193,750 | |
| Martin Midstream Partners LP/Martin Midstream Finance Corp., senior note, | ||||
| 7.25%, 2/15/21 | United States | 20,000,000 | 19,900,000 | |
| Midstates Petroleum Co. Inc./LLC, senior note, 9.25%, 6/01/21 | United States | 15,000,000 | 8,025,000 | |
| Oasis Petroleum Inc., senior note, 6.875%, 3/15/22 | United States | 10,400,000 | 10,634,000 | |
| Offshore Group Investment Ltd., | ||||
| senior bond, first lien, 7.125%, 4/01/23 | United States | 10,000,000 | 6,450,000 | |
| senior secured note, first lien, 7.50%, 11/01/19 | United States | 15,000,000 | 9,900,000 | |
| PBF Holding Co. LLC, first lien, 8.25%, 2/15/20 | United States | 20,000,000 | 21,300,000 |
22 | Annual Report franklintempleton.com
FRANKLIN STRATEGIC SERIES
STATEMENT OF INVESTMENTS
| Franklin Strategic Income Fund (continued) | ||||
| Principal | ||||
| Country | Amount* | Value | ||
| Corporate Bonds (continued) | ||||
| Energy (continued) | ||||
| Peabody Energy Corp., | ||||
| dsecond lien, 144A, 10.00%, 3/15/22 | United States | 2,000,000 | $ | 1,700,000 |
| senior note, 6.00%, 11/15/18 | United States | 5,000,000 | 3,924,500 | |
| senior note, 6.50%, 9/15/20 | United States | 8,300,000 | 5,187,500 | |
| senior note, 6.25%, 11/15/21 | United States | 20,000,000 | 12,100,000 | |
| Penn Virginia Corp., senior note, 8.50%, 5/01/20 | United States | 15,000,000 | 14,700,000 | |
| Penn Virginia Resource Partners LP/Penn Virginia Resource Finance | ||||
| Corp., senior note, | ||||
| 8.375%, 6/01/20 | United States | 6,540,000 | 7,202,175 | |
| 6.50%, 5/15/21 | United States | 5,000,000 | 5,362,500 | |
| d,f,gQuicksilver Resources Inc., secured note, second lien, 144A, | ||||
| FRN, 7.00%, 6/21/19 | United States | 12,000,000 | 7,590,000 | |
| Regency Energy Partners LP/Regency Energy Finance Corp., | ||||
| senior bond, 5.50%, 4/15/23 | United States | 5,000,000 | 5,325,000 | |
| senior note, 5.875%, 3/01/22 | United States | 1,300,000 | 1,452,750 | |
| senior note, 5.00%, 10/01/22 | United States | 10,000,000 | 10,725,000 | |
| Sabine Pass Liquefaction LLC, | ||||
| first lien, 5.625%, 2/01/21 | United States | 24,000,000 | 24,665,040 | |
| first lien, 5.625%, 4/15/23 | United States | 6,200,000 | 6,293,000 | |
| senior secured note, first lien, 5.75%, 5/15/24 | United States | 3,300,000 | 3,349,500 | |
| dsenior secured note, first lien, 144A, 5.625%, 3/01/25 | United States | 5,000,000 | 5,043,750 | |
| Sanchez Energy Corp., senior note, | ||||
| 7.75%, 6/15/21 | United States | 12,600,000 | 13,198,500 | |
| 6.125%, 1/15/23 | United States | 12,000,000 | 11,820,000 | |
| W&T Offshore Inc., senior note, 8.50%, 6/15/19 | United States | 22,000,000 | 15,840,000 | |
| Williams Partners LP, senior bond, 4.00%, 9/15/25 | United States | 22,000,000 | 21,749,442 | |
| 695,381,242 | ||||
| Food & Staples Retailing 0.4% | ||||
| dCencosud SA, senior note, 144A, | ||||
| 4.875%, 1/20/23 | Chile | 15,000,000 | 15,294,975 | |
| 5.15%, 2/12/25 | Chile | 20,000,000 | 20,376,300 | |
| 35,671,275 | ||||
| Food, Beverage & Tobacco 0.9% | ||||
| dBarry Callebaut Services SA, senior note, 144A, 5.50%, 6/15/23 | Belgium | 5,300,000 | 5,680,938 | |
| Constellation Brands Inc., senior note, 4.25%, 5/01/23 | United States | 10,600,000 | 10,931,250 | |
| dJBS USA LLC/Finance Inc., | ||||
| senior bond, 144A, 5.875%, 7/15/24 | United States | 6,800,000 | 6,936,000 | |
| senior note, 144A, 8.25%, 2/01/20 | United States | 19,000,000 | 20,282,500 | |
| senior note, 144A, 7.25%, 6/01/21 | United States | 4,500,000 | 4,770,000 | |
| dPost Holdings Inc., senior note, 144A, | ||||
| 6.75%, 12/01/21 | United States | 15,800,000 | 16,021,200 | |
| 6.00%, 12/15/22 | United States | 10,000,000 | 9,787,500 | |
| dSmithfield Foods Inc., senior note, 144A, | ||||
| 5.25%, 8/01/18 | United States | 2,500,000 | 2,565,625 | |
| 5.875%, 8/01/21 | United States | 2,000,000 | 2,103,750 | |
| 79,078,763 |
franklintempleton.com Annual Report | 23
FRANKLIN STRATEGIC SERIES
STATEMENT OF INVESTMENTS
| Franklin Strategic Income Fund (continued) | ||||
| Principal | ||||
| Country | Amount* | Value | ||
| Corporate Bonds (continued) | ||||
| Health Care Equipment & Services 1.8% | ||||
| Alere Inc., senior sub. note, 6.50%, 6/15/20 | United States | 4,900,000 | $ | 5,132,750 |
| AmSurg Corp., senior note, 5.625%, 7/15/22 | United States | 4,100,000 | 4,192,250 | |
| CHS/Community Health Systems Inc., | ||||
| senior note, 8.00%, 11/15/19 | United States | 10,200,000 | 10,837,500 | |
| senior note, 7.125%, 7/15/20 | United States | 6,000,000 | 6,442,500 | |
| senior note, 6.875%, 2/01/22 | United States | 3,300,000 | 3,518,625 | |
| senior secured note, first lien, 5.125%, 8/15/18 | United States | 6,000,000 | 6,240,000 | |
| DaVita HealthCare Partners Inc., | ||||
| senior bond, 5.125%, 7/15/24 | United States | 10,000,000 | 10,195,000 | |
| senior bond, 5.00%, 5/01/25 | United States | 9,300,000 | 9,323,250 | |
| senior note, 5.75%, 8/15/22 | United States | 10,000,000 | 10,662,500 | |
| HCA Inc., | ||||
| senior note, 6.50%, 2/15/16 | United States | 3,000,000 | 3,116,250 | |
| senior note, 7.50%, 2/15/22 | United States | 8,100,000 | 9,497,250 | |
| senior note, 5.875%, 5/01/23 | United States | 15,000,000 | 16,256,250 | |
| senior secured bond, first lien, 5.875%, 3/15/22 | United States | 10,000,000 | 11,212,500 | |
| senior secured bond, first lien, 5.25%, 4/15/25 | United States | 10,000,000 | 10,850,000 | |
| Omnicare Inc., senior note, 4.75%, 12/01/22 | United States | 6,900,000 | 7,572,750 | |
| Tenet Healthcare Corp., | ||||
| first lien, 6.00%, 10/01/20 | United States | 2,700,000 | 2,889,000 | |
| senior note, 8.125%, 4/01/22 | United States | 8,400,000 | 9,187,500 | |
| dsenior note, 144A, 5.00%, 3/01/19 | United States | 6,700,000 | 6,674,875 | |
| dsenior note, 144A, 5.50%, 3/01/19 | United States | 15,300,000 | 15,472,125 | |
| 159,272,875 | ||||
| Insurance 0.6% | ||||
| MetLife Inc., junior sub. note, 6.40% to 12/15/36, FRN thereafter, | ||||
| 12/15/66 | United States | 15,000,000 | 17,737,500 | |
| dNippon Life Insurance Co., sub. bond, 144A, 5.10% to10/16/24, FRN | ||||
| thereafter, 10/16/44 | Japan | 35,000,000 | 38,245,725 | |
| 55,983,225 | ||||
| Materials 4.8% | ||||
| ArcelorMittal, senior note, | ||||
| 6.25%, 3/01/21 | Luxembourg | 20,000,000 | 21,090,000 | |
| 7.00%, 2/25/22 | Luxembourg | 15,000,000 | 16,425,000 | |
| dArdagh Packaging Finance PLC, senior note, 144A, 9.125%, 10/15/20 | Luxembourg | 5,000,000 | 5,393,750 | |
| dArdagh Packaging Finance PLC/Ardagh MP Holdings USA Inc., | ||||
| senior note, 144A, 6.25%, 1/31/19 | Luxembourg | 2,000,000 | 2,050,000 | |
| senior note, 144A, 7.00%, 11/15/20 | Luxembourg | 1,764,706 | 1,814,338 | |
| senior note, 144A, 6.75%, 1/31/21 | Luxembourg | 2,400,000 | 2,496,000 | |
| senior note, 144A, 6.00%, 6/30/21 | Luxembourg | 3,100,000 | 3,177,500 | |
| gsenior secured note, 144A, FRN, 3.271%, 12/15/19 | Luxembourg | 8,700,000 | 8,613,000 | |
| dBarminco Finance Pty. Ltd., senior note, 144A, 9.00%, 6/01/18 | Australia | 15,000,000 | 14,343,750 | |
| dCemex Finance LLC, senior secured note, | ||||
| 144A, 9.375%, 10/12/22 | Mexico | 1,400,000 | 1,600,900 | |
| first lien, 144A, 6.00%, 4/01/24 | Mexico | 5,800,000 | 5,955,875 | |
| dCemex SAB de CV, | ||||
| first lien, 144A, 5.70%, 1/11/25 | Mexico | 15,000,000 | 15,046,875 | |
| secured note, 144A, 5.875%, 3/25/19 | Mexico | 10,000,000 | 10,337,500 | |
| senior secured bond, first lien, 144A, 6.125%, 5/05/25 | Mexico | 4,000,000 | 4,120,000 |
24 | Annual Report franklintempleton.com
FRANKLIN STRATEGIC SERIES
STATEMENT OF INVESTMENTS
| Franklin Strategic Income Fund (continued) | |||||
| Principal | |||||
| Country | Amount* | Value | |||
| Corporate Bonds (continued) | |||||
| Materials (continued) | |||||
| dCeramtec Group GmbH, senior note, 144A, 8.25%, 8/15/21 | Germany | 13,700,000 | EUR | $ | 16,995,761 |
| dFirst Quantum Minerals Ltd., senior note, 144A, | |||||
| 6.75%, 2/15/20 | Canada | 15,000,000 | 14,025,000 | ||
| 7.00%, 2/15/21 | Canada | 20,000,000 | 18,750,000 | ||
| dFMG Resources (August 2006) Pty. Ltd., | |||||
| senior note, 144A, 6.00%, 4/01/17 | Australia | 2,000,000 | 2,063,750 | ||
| senior note, 144A, 6.875%, 2/01/18 | Australia | 5,333,333 | 5,526,667 | ||
| senior secured note, 144A, 9.75%, 3/01/22 | Australia | 32,000,000 | 33,176,800 | ||
| Freeport-McMoRan Inc., senior note, 4.55%, 11/14/24 | United States | 26,000,000 | 25,111,008 | ||
| dGlencore Finance Canada Ltd., senior note, 144A, 4.95%, 11/15/21 | Switzerland | 20,000,000 | 21,606,120 | ||
| dGlencore Funding LLC, senior note, 144A, | |||||
| 4.125%, 5/30/23 | Switzerland | 7,500,000 | 7,576,552 | ||
| 4.625%, 4/29/24 | Switzerland | 5,000,000 | 5,169,550 | ||
| dIneos Finance PLC, senior secured note, 144A, 7.50%, 5/01/20 | Switzerland | 2,000,000 | 2,112,500 | ||
| dIneos Group Holdings SA, senior note, 144A, | |||||
| 6.125%, 8/15/18 | Switzerland | 2,200,000 | 2,249,500 | ||
| 5.875%, 2/15/19 | Switzerland | 700,000 | 710,500 | ||
| dINVISTA Finance LLC, senior secured note, 144A, 4.25%, 10/15/19 | United States | 25,100,000 | 24,899,351 | ||
| Novelis Inc., senior note, | |||||
| 8.375%, 12/15/17 | Canada | 9,000,000 | 9,371,250 | ||
| 8.75%, 12/15/20 | Canada | 8,000,000 | 8,580,000 | ||
| dOwens-Brockway Glass Container Inc., | |||||
| senior bond, 144A, 5.375%, 1/15/25 | United States | 7,600,000 | 7,894,500 | ||
| senior note, 144A, 5.00%, 1/15/22 | United States | 5,700,000 | 5,871,000 | ||
| Reynolds Group Issuer Inc./LLC/SA, | |||||
| first lien, 5.75%, 10/15/20 | United States | 6,600,000 | 6,913,500 | ||
| senior note, 8.50%, 5/15/18 | United States | 14,000,000 | 14,367,500 | ||
| senior note, 9.00%, 4/15/19 | United States | 1,000,000 | 1,052,500 | ||
| senior note, 9.875%, 8/15/19 | United States | 400,000 | 427,000 | ||
| senior note, 8.25%, 2/15/21 | United States | 10,000,000 | 10,687,500 | ||
| senior secured note, first lien, 7.125%, 4/15/19 | United States | 4,000,000 | 4,147,500 | ||
| dSealed Air Corp., | |||||
| senior bond, 144A, 5.125%, 12/01/24 | United States | 11,300,000 | 11,794,375 | ||
| senior note, 144A, 6.50%, 12/01/20 | United States | 4,000,000 | 4,470,000 | ||
| senior note, 144A, 8.375%, 9/15/21 | United States | 4,000,000 | 4,530,000 | ||
| senior note, 144A, 4.875%, 12/01/22 | United States | 11,300,000 | 11,667,250 | ||
| dSteel Dynamics Inc., | |||||
| senior bond, 144A, 5.50%, 10/01/24 | United States | 9,700,000 | 10,039,500 | ||
| senior note, 144A, 5.125%, 10/01/21 | United States | 9,200,000 | 9,453,000 | ||
| dU.S. Coatings Acquisition Inc./Flash Dutch 2 BV, 144A, 5.75%, 2/01/21 | United States | 8,000,000 | EUR | 9,582,307 | |
| Verso Paper Holdings LLC/Inc., senior secured note, first lien, 11.75%, | |||||
| 1/15/19 | United States | 2,523,000 | 2,213,932 | ||
| 425,500,161 | |||||
| Media 3.7% | |||||
| Cablevision Systems Corp., senior note, 8.625%, 9/15/17 | United States | 3,000,000 | 3,390,000 | ||
| CCO Holdings LLC/CCO Holdings Capital Corp., | |||||
| senior bond, 5.25%, 9/30/22 | United States | 10,000,000 | 10,030,000 | ||
| dsenior bond, 144A, 5.375%, 5/01/25 | United States | 13,000,000 | 12,805,000 | ||
| senior note, 6.50%, 4/30/21 | United States | 8,000,000 | 8,328,000 |
franklintempleton.com Annual Report | 25
FRANKLIN STRATEGIC SERIES
STATEMENT OF INVESTMENTS
| Franklin Strategic Income Fund (continued) | |||||
| Principal | |||||
| Country | Amount* | Value | |||
| Corporate Bonds (continued) | |||||
| Media (continued) | |||||
| Clear Channel Worldwide Holdings Inc., | |||||
| senior note, 6.50%, 11/15/22 | United States | 3,000,000 | $ | 3,157,500 | |
| senior note, 6.50%, 11/15/22 | United States | 5,000,000 | 5,312,500 | ||
| senior sub. note, 7.625%, 3/15/20 | United States | 900,000 | 942,750 | ||
| senior sub. note, 7.625%, 3/15/20 | United States | 6,400,000 | 6,752,000 | ||
| CSC Holdings LLC, | |||||
| senior bond, 7.625%, 7/15/18 | United States | 6,000,000 | 6,795,000 | ||
| senior note, 6.75%, 11/15/21 | United States | 22,000,000 | 24,942,500 | ||
| DISH DBS Corp., | |||||
| senior bond, 5.00%, 3/15/23 | United States | 10,000,000 | 9,575,000 | ||
| senior note, 7.125%, 2/01/16 | United States | 13,000,000 | 13,471,250 | ||
| senior note, 6.75%, 6/01/21 | United States | 4,000,000 | 4,245,320 | ||
| senior note, 5.875%, 7/15/22 | United States | 3,000,000 | 3,030,000 | ||
| senior note, 5.875%, 11/15/24 | United States | 5,000,000 | 4,912,500 | ||
| Gannett Co. Inc., | |||||
| senior bond, 6.375%, 10/15/23 | United States | 19,200,000 | 20,856,000 | ||
| dsenior bond, 144A, 5.50%, 9/15/24 | United States | 2,800,000 | 2,919,000 | ||
| senior note, 5.125%, 7/15/20 | United States | 9,800,000 | 10,302,250 | ||
| iHeartCommunications Inc., | |||||
| senior secured bond, first lien, 9.00%, 3/01/21 | United States | 23,800,000 | 22,907,500 | ||
| senior secured note, first lien, 9.00%, 9/15/22 | United States | 8,100,000 | 7,776,000 | ||
| dNielsen Finance LLC/Co., senior note, 144A, 5.00%, 4/15/22 | United States | 3,400,000 | 3,425,500 | ||
| dSirius XM Radio Inc., senior bond, 144A, | |||||
| 6.00%, 7/15/24 | United States | 14,600,000 | 15,184,000 | ||
| 5.375%, 4/15/25 | United States | 9,000,000 | 9,067,500 | ||
| Time Warner Cable Inc., senior note, 4.00%, 9/01/21 | United States | 9,700,000 | 9,663,334 | ||
| dUnitymedia Hessen GmbH & Co. KG/Unitymedia NRW GmbH, | |||||
| senior secured bond, first lien, 144A, 5.75%, 1/15/23 | Germany | 3,330,000 | EUR | 4,061,029 | |
| senior secured note, first lien, 144A, 5.625%, 4/15/23 | Germany | 1,710,000 | EUR | 2,087,791 | |
| dUnitymedia KabelBW GmbH, senior bond, 144A, 6.125%, 1/15/25 | Germany | 18,000,000 | 18,877,500 | ||
| dUnivision Communications Inc., | |||||
| senior secured bond, first lien, 144A, 6.75%, 9/15/22 | United States | 3,622,000 | 3,902,886 | ||
| senior secured note, first lien, 144A, 5.125%, 5/15/23 | United States | 2,000,000 | 2,032,500 | ||
| senior secured note, first lien, 144A, 5.125%, 2/15/25 | United States | 30,000,000 | 30,300,000 | ||
| dVideotron Ltd., senior bond, 144A, 5.375%, 6/15/24 | Canada | 6,400,000 | 6,648,000 | ||
| dVirgin Media Finance PLC, senior bond, 144A, 6.375%, | |||||
| 4/15/23 | United Kingdom | 500,000 | 528,750 | ||
| 10/15/24 | United Kingdom | 9,600,000 | GBP | 15,822,841 | |
| dVirgin Media Secured Finance PLC, | |||||
| senior secured bond, first lien, 144A, 5.50%, 1/15/25 | United Kingdom | 14,000,000 | 14,393,750 | ||
| senior secured note, first lien, 144A, 5.375%, 4/15/21 | United Kingdom | 3,870,000 | 4,051,406 | ||
| dVTR Finance BV, senior secured note, 144A, 6.875%, 1/15/24 | Chile | 7,600,000 | 7,882,720 | ||
| 330,379,577 | |||||
| Pharmaceuticals, Biotechnology & Life Sciences 1.5% | |||||
| Actavis Funding SCS, senior bond, 3.80%, 3/15/25 | United States | 14,900,000 | 15,097,157 | ||
| dEndo Finance LLC/Endo Ltd./Endo Finco Inc., senior bond, 144A, 6.00%, | |||||
| 2/01/25 | United States | 11,900,000 | 12,242,125 | ||
| dGrifols Worldwide Operations Ltd., senior note, 144A, 5.25%, 4/01/22 | United States | 8,000,000 | 8,200,000 | ||
| dinVentiv Health Inc., senior secured note, 144A, 9.00%, 1/15/18 | United States | 700,000 | 738,500 | ||
| d,iJaguar Holding Co. I, senior note, 144A, PIK, 9.375%, 10/15/17 | United States | 24,100,000 | 24,702,500 |
26 | Annual Report franklintempleton.com
FRANKLIN STRATEGIC SERIES
STATEMENT OF INVESTMENTS
| Franklin Strategic Income Fund (continued) | |||||
| Principal | |||||
| Country | Amount* | Value | |||
| Corporate Bonds (continued) | |||||
| Pharmaceuticals, Biotechnology & Life Sciences (continued) | |||||
| dValeant Pharmaceuticals International Inc., | |||||
| senior bond, 144A, 6.125%, 4/15/25 | United States | 3,100,000 | $ | 3,216,250 | |
| senior note, 144A, 7.50%, 7/15/21 | United States | 10,800,000 | 11,745,000 | ||
| senior note, 144A, 5.625%, 12/01/21 | United States | 5,000,000 | 5,131,250 | ||
| senior note, 144A, 5.50%, 3/01/23 | United States | 8,000,000 | 8,100,000 | ||
| dVPI Escrow Corp., senior note, 144A, 6.375%, 10/15/20 | United States | 16,600,000 | 17,554,500 | ||
| Zoetis Inc., senior bond, 3.25%, 2/01/23 | United States | 25,000,000 | 24,871,250 | ||
| 131,598,532 | |||||
| Real Estate 0.1% | |||||
| Crown Castle International Corp., senior bond, 5.25%, 1/15/23 | United States | 5,000,000 | 5,303,000 | ||
| Retailing 0.8% | |||||
| dArgos Merger Sub Inc., senior note, 144A, 7.125%, 3/15/23 | United States | 7,000,000 | 7,367,500 | ||
| dEdcon Holdings Pty. Ltd., senior note, 144A, 13.375%, 6/30/19 | South Africa | 1,800,000 | EUR | 547,841 | |
| dEdcon Pty. Ltd., secured note, 144A, 9.50%, 3/01/18 | South Africa | 15,325,000 | EUR | 14,067,999 | |
| dFamily Tree Escrow LLC, senior note, 144A, | |||||
| 5.25%, 3/01/20 | United States | 1,600,000 | 1,684,000 | ||
| 5.75%, 3/01/23 | United States | 6,900,000 | 7,279,500 | ||
| dNetflix Inc., | |||||
| senior bond, 144A, 5.875%, 2/15/25 | United States | 9,100,000 | 9,737,000 | ||
| senior note, 144A, 5.50%, 2/15/22 | United States | 13,600,000 | 14,382,000 | ||
| dNew Look Bondco I PLC, 144A, 8.75%, 5/14/18 | United Kingdom | 9,100,000 | GBP | 14,657,354 | |
| 69,723,194 | |||||
| Software & Services 1.1% | |||||
| dBMC Software Finance Inc., senior note, 144A, 8.125%, 7/15/21 | United States | 25,000,000 | 23,062,500 | ||
| Equinix Inc., senior bond, 5.375%, 4/01/23 | United States | 25,000,000 | 25,937,500 | ||
| First Data Corp., | |||||
| senior bond, 12.625%, 1/15/21 | United States | 2,000,000 | 2,366,000 | ||
| senior note, 11.25%, 1/15/21 | United States | 3,218,000 | 3,628,295 | ||
| dsenior secured bond, second lien, 144A, 8.25%, 1/15/21 | United States | 28,000,000 | 29,828,680 | ||
| Sterling International Inc., senior note, 11.00%, 10/01/19 | United States | 9,500,000 | 10,117,500 | ||
| 94,940,475 | |||||
| Technology Hardware & Equipment 0.2% | |||||
| dAlcatel-Lucent USA Inc., senior note, 144A, 6.75%, 11/15/20 | France | 20,000,000 | 21,650,000 | ||
| d,iCommScope Holdings Co. Inc., senior note, 144A, PIK, 6.625%, 6/01/20 | United States | 1,800,000 | 1,851,840 | ||
| 23,501,840 | |||||
| Telecommunication Services 3.5% | |||||
| jAT&T Inc., senior bond, 3.40%, 5/15/25 | United States | 18,700,000 | 18,565,416 | ||
| CenturyLink Inc., | |||||
| senior bond, 6.75%, 12/01/23 | United States | 3,300,000 | 3,582,183 | ||
| dsenior bond, 144A, 5.625%, 4/01/25 | United States | 10,000,000 | 10,037,500 | ||
| senior note, 6.00%, 4/01/17 | United States | 12,000,000 | 12,855,000 | ||
| senior note, 6.45%, 6/15/21 | United States | 4,100,000 | 4,428,000 | ||
| senior note, 5.80%, 3/15/22 | United States | 2,000,000 | 2,085,000 | ||
| dDigicel Group Ltd., senior note, 144A, | |||||
| 8.25%, 9/30/20 | Bermuda | 12,000,000 | 12,367,500 | ||
| 7.125%, 4/01/22 | Bermuda | 3,000,000 | 2,850,000 |
franklintempleton.com
Annual Report
| 27
FRANKLIN STRATEGIC SERIES
STATEMENT OF INVESTMENTS
| Franklin Strategic Income Fund (continued) | |||||
| Principal | |||||
| Country | Amount* | Value | |||
| Corporate Bonds (continued) | |||||
| Telecommunication Services (continued) | |||||
| dDigicel Ltd., senior note, 144A, | |||||
| 6.00%, 4/15/21 | Bermuda | 10,000,000 | $ | 9,756,250 | |
| 6.75%, 3/01/23 | Bermuda | 4,100,000 | 4,051,558 | ||
| Frontier Communications Corp., | |||||
| senior bond, 7.625%, 4/15/24 | United States | 5,700,000 | 5,835,375 | ||
| senior note, 8.50%, 4/15/20 | United States | 4,900,000 | 5,451,250 | ||
| senior note, 8.75%, 4/15/22 | United States | 2,700,000 | 2,970,000 | ||
| senior note, 7.125%, 1/15/23 | United States | 1,800,000 | 1,809,000 | ||
| senior note, 7.875%, 1/15/27 | United States | 3,975,000 | 3,965,063 | ||
| Intelsat Jackson Holdings SA, | |||||
| senior bond, 6.625%, 12/15/22 | Luxembourg | 10,000,000 | 9,850,000 | ||
| senior bond, 5.50%, 8/01/23 | Luxembourg | 3,000,000 | 2,848,125 | ||
| senior note, 7.25%, 10/15/20 | Luxembourg | 15,000,000 | 15,504,375 | ||
| senior note, 7.50%, 4/01/21 | Luxembourg | 9,000,000 | 9,382,500 | ||
| dMillicom International Cellular SA, senior note, 144A, 6.625%, 10/15/21 | Luxembourg | 20,000,000 | 21,325,000 | ||
| dPlay Finance 1 SA, senior note, 144A, 6.50%, 8/01/19 | Poland | 3,900,000 | EUR | 4,638,555 | |
| dPlay Finance 2 SA, senior secured note, 144A, 5.25%, 2/01/19 | Poland | 6,700,000 | EUR | 7,806,040 | |
| Sprint Communications Inc., senior note, | |||||
| 8.375%, 8/15/17 | United States | 17,000,000 | 18,615,000 | ||
| 6.00%, 11/15/22 | United States | 10,000,000 | 9,437,500 | ||
| d144A, 9.00%, 11/15/18 | United States | 8,000,000 | 9,122,480 | ||
| d144A, 7.00%, 3/01/20 | United States | 5,000,000 | 5,543,750 | ||
| Sprint Corp., senior bond, | |||||
| 7.875%, 9/15/23 | United States | 4,700,000 | 4,729,375 | ||
| 7.125%, 6/15/24 | United States | 2,700,000 | 2,625,750 | ||
| T-Mobile USA Inc., | |||||
| senior bond, 6.50%, 1/15/24 | United States | 3,500,000 | 3,661,875 | ||
| senior bond, 6.375%, 3/01/25 | United States | 14,700,000 | 15,133,503 | ||
| senior note, 6.542%, 4/28/20 | United States | 5,000,000 | 5,293,500 | ||
| senior note, 6.633%, 4/28/21 | United States | 3,500,000 | 3,705,625 | ||
| senior note, 6.125%, 1/15/22 | United States | 2,000,000 | 2,070,000 | ||
| senior note, 6.731%, 4/28/22 | United States | 3,500,000 | 3,701,250 | ||
| Verizon Communications Inc., senior note, 5.15%, 9/15/23 | United States | 22,000,000 | 24,882,242 | ||
| dWind Acquisition Finance SA, senior secured note, 144A, | |||||
| 4.00%, 7/15/20 | Italy | 14,400,000 | EUR | 16,420,079 | |
| 7.00%, 4/23/21 | Italy | 17,300,000 | EUR | 20,791,037 | |
| 317,696,656 | |||||
| Transportation 0.7% | |||||
| dFlorida East Coast Holdings Corp., | |||||
| secured note, first lien, 144A, 6.75%, 5/01/19 | United States | 7,600,000 | 7,581,000 | ||
| senior note, 144A, 9.75%, 5/01/20 | United States | 4,000,000 | 3,870,000 | ||
| Hertz Corp., senior note, | |||||
| 6.75%, 4/15/19 | United States | 11,900,000 | 12,343,751 | ||
| 5.875%, 10/15/20 | United States | 1,800,000 | 1,840,500 | ||
| 6.25%, 10/15/22 | United States | 12,000,000 | 12,480,000 | ||
| dStena AB, senior bond, 144A, 7.00%, 2/01/24 | Sweden | 7,500,000 | 7,237,500 | ||
| dStena International SA, secured bond, 144A, 5.75%, 3/01/24 | Sweden | 15,000,000 | 14,439,225 | ||
| 59,791,976 |
28 | Annual Report franklintempleton.com
FRANKLIN STRATEGIC SERIES
STATEMENT OF INVESTMENTS
| Franklin Strategic Income Fund (continued) | ||||
| Principal | ||||
| Country | Amount* | Value | ||
| Corporate Bonds (continued) | ||||
| Utilities 1.3% | ||||
| Calpine Corp., | ||||
| senior bond, 5.75%, 1/15/25 | United States | 9,000,000 | $ | 9,079,200 |
| senior note, 5.375%, 1/15/23 | United States | 10,000,000 | 10,137,500 | |
| dsenior secured bond, first lien, 144A, 7.875%, 1/15/23 | United States | 4,256,000 | 4,702,880 | |
| dsenior secured bond, first lien, 144A, 5.875%, 1/15/24 | United States | 4,700,000 | 5,052,500 | |
| dsenior secured note, first lien, 144A, 6.00%, 1/15/22 | United States | 1,300,000 | 1,391,000 | |
| dDynegy Inc., senior bond, 144A, 7.625%, 11/01/24 | United States | 12,600,000 | 13,608,000 | |
| d,eEDF SA, | ||||
| junior sub. bond, 144A, 5.625% to 1/22/24, FRN thereafter, Perpetual | France | 5,000,000 | 5,319,725 | |
| sub. note, 144A, 5.25% to 1/29/23, FRN thereafter, Perpetual | France | 25,000,000 | 26,216,250 | |
| dInterGen NV, secured bond, 144A, 7.00%, 6/30/23 | Netherlands | 25,000,000 | 24,187,500 | |
| d,fTexas Competitive Electric Holdings Co. LLC/Texas Competitive Electric | ||||
| Holdings Finance Inc., senior secured note, first lien, 144A, 11.50%, | ||||
| 10/01/20 | United States | 30,000,000 | 19,875,000 | |
| 119,569,555 | ||||
| Total Corporate Bonds (Cost $3,448,561,618) | 3,427,981,048 | |||
| g,kSenior Floating Rate Interests 18.8% | ||||
| Automobiles & Components 0.8% | ||||
| Crowne Group LLC, Term Loan, 6.00%, 9/30/20 | United States | 16,425,361 | 16,404,829 | |
| FRAM Group Holdings Inc. (Autoparts Holdings), | ||||
| Second Lien Term Loan, 10.50%, 1/29/18 | United States | 12,648,801 | 12,142,849 | |
| Term Loan, 7.00%, 7/29/17 | United States | 31,670,880 | 31,502,644 | |
| Henniges Automotive Holdings Inc., Term Loans, 5.50%, 6/12/21 | United States | 9,371,060 | 9,424,006 | |
| UCI International Inc., Term Loan, 5.50%, 7/26/17 | United States | 5,782,576 | 5,698,249 | |
| 75,172,577 | ||||
| Capital Goods 1.0% | ||||
| Alfred Fueling Systems Inc. (Wayne Fueling), | ||||
| First Lien Initial Term Loan, 4.75%, 6/20/21 | United States | 5,024,881 | 5,062,567 | |
| Second Lien Initial Term Loan, 8.50%, 6/20/22 | United States | 10,800,297 | 10,692,294 | |
| Allison Transmission Inc., Term B-3 Loans, 3.50%, 8/23/19 | United States | 4,725,632 | 4,761,811 | |
| Doncasters U.S. Finance LLC, | ||||
| Second Lien Term Loan, 9.50%, 10/09/20 | United States | 1,202,597 | 1,204,100 | |
| Term B Loans, 4.50%, 4/09/20 | United States | 2,839,629 | 2,847,912 | |
| lErickson Inc., Purchase Price Notes, 6.00%, 11/02/20 | United States | 1,133,618 | 992,074 | |
| jOnsite Rental Group Operations Pty. Ltd., Term B Loan, 5.50%, 7/30/21 | United States | 24,316,824 | 24,043,260 | |
| Sensus USA Inc., | ||||
| First Lien Term Loan, 4.50%, 5/09/17 | United States | 13,352,300 | 13,343,954 | |
| Second Lien Term Loan, 8.50%, 5/09/18 | United States | 18,297,904 | 18,160,670 | |
| Signode Industrial Group U.S. Inc., Initial Term B Loan, 3.75%, 5/01/21 | United States | 4,689,971 | 4,700,965 | |
| TransDigm Inc., | ||||
| Tranche C Term Loan, 3.75%, 2/28/20 | United States | 3,137,426 | 3,148,975 | |
| Tranche D Term Loan, 3.75%, 6/04/21 | United States | 2,718,434 | 2,728,416 | |
| WireCo Worldgroup Inc., Term Loan, 6.00%, 2/15/17 | United States | 432,479 | 433,560 | |
| 92,120,558 | ||||
| Commercial & Professional Services 0.6% | ||||
| AlixPartners LLP, Second Lien 2013 Recapitalization Term Loan, 9.00%, | ||||
| 7/10/21 | United States | 25,353,489 | 25,646,651 | |
| Interactive Data Corp., Term Loan, 4.75%, 5/02/21 | United States | 24,450,983 | 24,645,833 | |
| 50,292,484 |
franklintempleton.com Annual Report | 29
FRANKLIN STRATEGIC SERIES
STATEMENT OF INVESTMENTS
| Franklin Strategic Income Fund (continued) | ||||
| Principal | ||||
| Country | Amount* | Value | ||
| g,kSenior Floating Rate Interests (continued) | ||||
| Consumer Services 2.9% | ||||
| 24 Hour Fitness Worldwide Inc., Term Loan, 4.75%, 5/30/21 | United States | 13,678,943 | $ | 13,687,493 |
| Boyd Gaming Corp., Term A Loan, 3.146%, 8/14/18 | United States | 576,415 | 576,235 | |
| Caesars Entertainment Resort Properties LLC, Term B Loans, 7.00%, | ||||
| 10/11/20 | United States | 57,102,823 | 54,757,553 | |
| Cannery Casino Resorts LLC, | ||||
| Second Lien Term Loan, 10.00%, 10/02/19 | United States | 9,663,335 | 8,397,438 | |
| Term Loan, 6.00%, 10/02/18 | United States | 30,164,461 | 30,126,756 | |
| jFitness International LLC, Term B Loan, 5.50%, 7/01/20 | United States | 37,075,085 | 35,283,135 | |
| jROC Finance LLC, Funded Term B Loans, 5.00%, 6/20/19 | United States | 22,753,062 | 22,639,297 | |
| jSeaworld Parks and Entertainment Inc., Term B-2 Loan, 3.00%, 5/14/20 | United States | 16,773,392 | 16,481,954 | |
| TGI Friday’s Inc., First Lien Initial Term Loan, 5.25%, 7/15/20 | United States | 4,678,962 | 4,708,205 | |
| Town Sports International LLC, Initial Term Loan, 4.50%, 11/15/20 | United States | 12,606,066 | 10,856,974 | |
| Travelport Finance Luxembourg S.A.R.L., Initial Term Loan, 5.75%, | ||||
| 9/02/21 | Luxembourg | 31,609,028 | 31,976,989 | |
| b,iTurtle Bay Holdings LLC, Term Loan B, PIK, 3.00%, 6/30/16 | United States | 26,682,675 | 26,015,608 | |
| 255,507,637 | ||||
| Diversified Financials 0.4% | ||||
| Guggenheim Partners Investment Management Holdings LLC, Initial Term | ||||
| Loan, 4.25%, 7/22/20 | United States | 8,468,825 | 8,527,048 | |
| Trans Union LLC, 2014 Replacement Term Loan, 4.00%, 4/09/21 | United States | 31,306,761 | 31,482,862 | |
| 40,009,910 | ||||
| Energy 2.0% | ||||
| Bowie Resource Holdings LLC, | ||||
| jFirst Lien Initial Term Loan, 6.75%, 8/16/20 | United States | 21,181,993 | 20,599,488 | |
| Second Lien Initial Term Loan, 11.75%, 2/16/21 | United States | 7,582,077 | 7,392,525 | |
| Citgo Petroleum Corp., Term B Loan, 4.50%, 7/29/21 | United States | 2,084,605 | 2,094,378 | |
| jDrillships Ocean Ventures Inc. and Drillships Vent, Term Loan, 5.50%, | ||||
| 7/25/21 | Marshall Islands | 14,386,354 | 12,540,110 | |
| Fieldwood Energy LLC, | ||||
| jLoans, 3.875%, 9/25/18 | United States | 27,636,861 | 27,015,032 | |
| Second Lien Loans, 8.375%, 9/30/20 | United States | 4,524,000 | 3,540,030 | |
| Foresight Energy LLC, Term Loans, 5.50%, 8/23/20 | United States | 10,860,000 | 10,764,975 | |
| McJunkin Red Man Corp., 2013 Term Loan, 5.00%, 11/11/19 | United States | 6,317,150 | 6,248,059 | |
| OSG Bulk Ships Inc., Initial Term Loan, 5.25%, 8/05/19 | United States | 11,869,566 | 11,928,914 | |
| OSG International Inc., Initial Term Loan, (OIN), 5.75%, 8/05/19 | United States | 20,941,937 | 21,125,179 | |
| jPeabody Energy Corp., Term Loan, 4.25%, 9/24/20 | United States | 16,287,746 | 14,740,410 | |
| UTEX Industries Inc., First Lien Initial Term Loan, 5.00%, 5/22/21 | United States | 38,515,439 | 36,637,811 | |
| Westmoreland Coal Co., Term Loan, 7.50%, 12/16/20 | United States | 6,408,696 | 6,344,609 | |
| 180,971,520 | ||||
| Food, Beverage & Tobacco 0.2% | ||||
| AdvancePierre Foods Inc., Second Lien Term Loan, 9.50%, 10/10/17 | United States | 14,572,878 | 14,663,958 | |
| jCSM Bakery Supplies LLC (U.S. Acquisition), Second Lien Term Loan, | ||||
| 8.75%, 7/03/21 | United States | 2,161,805 | 2,032,097 | |
| 16,696,055 | ||||
| Health Care Equipment & Services 1.2% | ||||
| Carestream Health Inc., Second Lien Loan, 9.50%, 12/07/19 | United States | 15,136,000 | 15,192,760 | |
| Connolly LLC, | ||||
| Initial Term Loan, 5.00%, 5/14/21 | United States | 16,286,441 | 16,428,947 | |
| Second Lien Initial Term Loan, 8.00%, 5/14/22 | United States | 2,349,446 | 2,349,446 |
30 | Annual Report franklintempleton.com
FRANKLIN STRATEGIC SERIES
STATEMENT OF INVESTMENTS
| Franklin Strategic Income Fund (continued) | ||||
| Principal | ||||
| Country | Amount* | Value | ||
| g,kSenior Floating Rate Interests (continued) | ||||
| Health Care Equipment & Services (continued) | ||||
| Dialysis Newco Inc., Second Lien Term Loan B, 7.75%, 10/22/21 | United States | 2,417,433 | $ | 2,429,521 |
| jKinetic Concepts Inc., Dollar Term E-1 Loan, 4.50%, 5/04/18 | United States | 10,294,284 | 10,380,066 | |
| Millennium Health LLC, Tranche B Term Loan, 5.25%, 4/16/21 | United States | 22,847,073 | 18,905,953 | |
| Surgery Centers Holdings Inc., Second Lien Term Loan, 8.50%, 11/03/21 | United States | 3,838,600 | 3,829,003 | |
| Truven Health Analytics Inc., New Tranche B Term Loan, 4.50%, 6/06/19 | United States | 21,787,828 | 21,869,271 | |
| U.S. Renal Care Inc., Tranche B-2 Term Loan, 4.25%, 7/03/19 | United States | 16,726,874 | 16,841,872 | |
| 108,226,839 | ||||
| Household & Personal Products 0.9% | ||||
| FGI Operating Co. LLC (Freedom Group), Term B Loans, 5.50%, 4/19/19 | United States | 45,577,269 | 44,741,701 | |
| Revlon Consumer Products Corp., Replacement Term Loan, 3.25%, 11/19/17 | United States | 4,687,202 | 4,695,990 | |
| Sun Products Corp., Tranche B Term Loan, 5.50%, 3/23/20 | United States | 35,931,445 | 34,718,759 | |
| 84,156,450 | ||||
| Materials 2.6% | ||||
| Appvion Inc., Term Loan, 5.75%, 6/28/19 | United States | 19,475,670 | 18,112,373 | |
| Atkore International Inc., Second Lien Initial Term Loan, 7.75%, 10/09/21 | United States | 1,941,300 | 1,839,382 | |
| Caraustar Industries Inc., | ||||
| Term Loan B, 8.00%, 5/01/19 | United States | 21,142,590 | 21,261,517 | |
| Term Loan C, 8.00%, 5/01/19 | United States | 27,341,475 | 27,495,271 | |
| CD&R Millennium U.S. Acquico LLC, Second Lien Initial Term Loan, 8.25%, | ||||
| 7/31/22 | United States | 5,569,613 | 5,527,841 | |
| Cyanco Intermediate Corp., Initial Term Loan, 5.50%, 5/01/20 | United States | 34,550,986 | 34,550,986 | |
| Exopack Holdings SA, USD Term Loan, 5.25%, 5/08/19 | Luxembourg | 37,397,931 | 37,694,011 | |
| jFMG America Finance Inc. (Fortescue Metals Group), Loans, 3.75%, | ||||
| 6/30/19 | Australia | 20,078,726 | 18,186,587 | |
| HII Holding Corp. (Houghton International), Second Lien Term Loan, 9.50%, | ||||
| 12/20/20 | United States | 4,981,150 | 4,999,829 | |
| jIneos U.S. Finance LLC, Dollar Term Loan, 3.75%, 3/31/22 | United States | 4,088,017 | 4,117,218 | |
| jNexeo Solutions LLC, | ||||
| Term B-1 Loan, 6.00%, 9/09/17 | United States | 1,127,852 | 1,115,163 | |
| Term B-3 Loan, 5.75%, 9/09/17 | United States | 17,820 | 17,620 | |
| OCI Beaumont LLC, Term B-3 Loan, 5.50%, 8/20/19 | United States | 9,055,322 | 9,168,513 | |
| Oxbow Carbon LLC, | ||||
| First Lien Tranche B Term Loan, 4.25%, 7/19/19 | United States | 1,786,067 | 1,771,183 | |
| Second Lien Initial Term Loan, 8.00%, 1/19/20 | United States | 2,892,308 | 2,617,538 | |
| OXEA GmbH, Second Lien Term Loan, 8.25%, 7/15/20 | Luxembourg | 11,139,546 | 10,415,476 | |
| Solenis International LP and Solenis Holdings, Second Lien Term Loan, | ||||
| 7.75%, 7/31/22 | United States | 1,665,600 | 1,623,960 | |
| Tronox Pigments (Netherlands) BV, Term Loan, 4.25%, 3/19/20 | Netherlands | 4,857,442 | 4,879,300 | |
| Univar Inc., Term B Loan, 5.00%, 6/30/17 | United States | 2,153,781 | 2,165,224 | |
| jWalter Energy Inc., B Term Loan, 7.25%, 4/01/18 | United States | 31,225,502 | 19,916,031 | |
| 227,475,023 | ||||
| Media 2.0% | ||||
| Cengage Learning Acquisitions Inc., Original Term Loans, 7.00%, 3/31/20 | United States | 28,014,095 | 28,238,796 | |
| jCharter Communications Operating LLC, Term Loan E, (CCO Safari), | ||||
| 4.50%, 7/01/20 | United States | 1,370,000 | 1,363,753 | |
| Cumulus Media Holdings Inc., Term Loans, 4.25%, 12/23/20 | United States | 14,525,506 | 14,347,568 | |
| MediArena Acquisition BV, Second Lien Dollar Term B Loan, 10.00%, | ||||
| 8/13/22 | Netherlands | 6,165,000 | 6,157,294 | |
| Radio One Inc., Term Loan B, 4.78%, 12/31/18 | United States | 69,578,879 | 69,709,339 | |
| jRegal Cinemas Corp., Term Loan, 3.75%, 3/17/22 | United States | 4,825,024 | 4,855,759 |
franklintempleton.com Annual Report | 31
FRANKLIN STRATEGIC SERIES
STATEMENT OF INVESTMENTS
| Franklin Strategic Income Fund (continued) | |||||
| Principal | |||||
| Country | Amount* | Value | |||
| g,kSenior Floating Rate Interests (continued) | |||||
| Media (continued) | |||||
| jSinclair Television Group Inc., Incremental Term Loan B-1, 5.00%, 7/30/21 | United States | 1,690,357 | $ | 1,694,582 | |
| UPC Financing Partnership (UPC Broadband Holdings BV), Term Loan AH, | |||||
| 3.25%, 6/30/21 | Netherlands | 12,556,661 | 12,570,109 | ||
| William Morris Endeavor Entertainment LLC, Term Loans Second Lien, | |||||
| 8.25%, 5/06/22 | United States | 40,714,190 | 40,205,263 | ||
| Zuffa LLC, Initial Term Loan, 3.75%, 2/25/20 | United States | 3,421,983 | 3,388,297 | ||
| 182,530,760 | |||||
| Pharmaceuticals, Biotechnology & Life Sciences 0.5% | |||||
| Grifols Worldwide Operations USA Inc., US Tranche B Term Loan, 3.184%, | |||||
| 2/27/21 | United States | 11,166,790 | 11,216,281 | ||
| jHorizon Pharma Inc., Term Loan B, 5.75%, 5/07/21 | United States | 547,133 | 551,749 | ||
| Valeant Pharmaceuticals International Inc., Series F-1 New Term Loan, | |||||
| 4.00%, 4/01/22 | Canada | 34,814,289 | 35,099,349 | ||
| 46,867,379 | |||||
| Real Estate 0.1% | |||||
| Capital Automotive LP, Second Lien Term Loan, 6.00%, 4/30/20 | United States | 4,432,500 | 4,532,231 | ||
| Retailing 1.4% | |||||
| BJ’s Wholesale Club Inc., | |||||
| 2013 (Nov)Replacement Loans, 4.50%, 9/26/19 | United States | 29,877,509 | 30,080,587 | ||
| Second Lien 2013 (Nov) Replacement Loans, 8.50%, 3/26/20 | United States | 27,346,351 | 27,688,181 | ||
| Dollar Tree Inc., Initial Term B Loans, 4.25%, 3/09/22 | United States | 10,236,748 | 10,383,072 | ||
| Evergreen AcqCo. 1 LP (Savers), Term Loan, 5.00%, 7/09/19 | United States | 35,868,340 | 35,358,328 | ||
| The Men’s Wearhouse Inc., Tranche B Term Loan, 4.50%, 6/18/21 | United States | 6,815,246 | 6,898,311 | ||
| Party City Holdings Inc., 2014 Replacement Term Loan, 4.00%, 7/27/19 | United States | 10,601,255 | 10,643,851 | ||
| 121,052,330 | |||||
| Semiconductors & Semiconductor Equipment 0.1% | |||||
| M/A-COM Technology Solutions Holdings Inc., Initial Term Loan, 4.50%, | |||||
| 5/07/21 | United States | 4,743,356 | 4,790,790 | ||
| Software & Services 1.7% | |||||
| BMC Software Finance Inc., Initial U.S. Term Loans, 5.00%, 9/10/20 | United States | 57,923,492 | 57,018,438 | ||
| MoneyGram International Inc., Term Loan, 4.25%, 3/28/20 | United States | 50,974,686 | 48,096,757 | ||
| Sungard Availability Services Capital Inc., Tranche B Term Loan, 6.00%, | |||||
| 3/31/19 | United States | 29,987,398 | 27,938,269 | ||
| Vertafore Inc., Second Lien Term Loan, 9.75%, 10/27/17 | United States | 15,025,339 | 15,169,326 | ||
| 148,222,790 | |||||
| Technology Hardware & Equipment 0.0%† | |||||
| CIENA Corp., Term Loan, 3.75%, 7/15/19 | United States | 2,332,525 | 2,344,188 | ||
| Telecommunication Services 0.2% | |||||
| Intelsat Jackson Holdings SA, Tranche B-2 Term Loan, 3.75%, 6/30/19 | Luxembourg | 13,643,323 | 13,656,967 | ||
| Utilities 0.2% | |||||
| Calpine Construction Finance Co. LP, | |||||
| jTerm B-1 Loan, 3.00%, 5/03/20 | United States | 13,616,401 | 13,567,042 | ||
| Term B-2 Loan, 3.25%, 1/31/22 | United States | 5,004,450 | 4,995,847 | ||
| 18,562,889 | |||||
| Total Senior Floating Rate Interests | |||||
| (Cost $1,692,612,313) | 1,673,189,377 |
32 | Annual Report franklintempleton.com
| FRANKLIN STRATEGIC SERIES | |||||
| STATEMENT OF INVESTMENTS | |||||
| Franklin Strategic Income Fund (continued) | |||||
| Principal | |||||
| Country | Amount* | Value | |||
| Foreign Government and Agency Securities 17.3% | |||||
| Government of Hungary, | |||||
| 7.75%, 8/24/15 | Hungary | 57,900,000 | HUF | $ | 217,755 |
| 5.50%, 2/12/16 | Hungary | 7,719,020,000 | HUF | 29,373,737 | |
| 5.50%, 12/22/16 | Hungary | 584,040,000 | HUF | 2,292,532 | |
| 4.125%, 2/19/18 | Hungary | 4,390,000 | 4,591,479 | ||
| 6.50%, 6/24/19 | Hungary | 721,600,000 | HUF | 3,049,192 | |
| 7.50%, 11/12/20 | Hungary | 8,507,000,000 | HUF | 38,469,616 | |
| 5.375%, 2/21/23 | Hungary | 16,250,000 | 18,154,094 | ||
| A, 6.75%, 11/24/17 | Hungary | 3,905,920,000 | HUF | 16,196,391 | |
| A, 5.50%, 12/20/18 | Hungary | 426,500,000 | HUF | 1,742,722 | |
| A, 7.00%, 6/24/22 | Hungary | 11,570,000 | HUF | 52,449 | |
| A, 6.00%, 11/24/23 | Hungary | 2,015,870,000 | HUF | 8,864,721 | |
| senior note, 6.25%, 1/29/20 | Hungary | 21,690,000 | 24,834,182 | ||
| senior note, 6.375%, 3/29/21 | Hungary | 10,320,000 | 12,018,466 | ||
| senior note, 5.75%, 11/22/23 | Hungary | 5,000,000 | 5,761,825 | ||
| Government of Indonesia, | |||||
| FR28, 10.00%, 7/15/17 | Indonesia | 10,200,000,000 | IDR | 827,567 | |
| FR34, 12.80%, 6/15/21 | Indonesia | 169,210,000,000 | IDR | 16,294,872 | |
| FR36, 11.50%, 9/15/19 | Indonesia | 35,400,000,000 | IDR | 3,120,620 | |
| FR39, 11.75%, 8/15/23 | Indonesia | 29,150,000,000 | IDR | 2,796,940 | |
| FR44, 10.00%, 9/15/24 | Indonesia | 8,340,000,000 | IDR | 739,904 | |
| Government of Malaysia, | |||||
| 3.835%, 8/12/15 | Malaysia | 52,480,000 | MYR | 14,760,396 | |
| 4.72%, 9/30/15 | Malaysia | 106,594,000 | MYR | 30,112,618 | |
| 3.197%, 10/15/15 | Malaysia | 126,590,000 | MYR | 35,548,604 | |
| senior bond, 4.24%, 2/07/18 | Malaysia | 64,800,000 | MYR | 18,634,024 | |
| senior note, 3.172%, 7/15/16 | Malaysia | 338,100,000 | MYR | 94,862,556 | |
| Government of Mexico, | |||||
| 6.00%, 6/18/15 | Mexico | 94,510m MXN | 618,334 | ||
| 8.00%, 12/17/15 | Mexico | 9,037,850m MXN | 60,677,215 | ||
| j6.25%, 6/16/16 | Mexico | 12,628,270m MXN | 84,766,087 | ||
| 7.25%, 12/15/16 | Mexico | 11,765,870m MXN | 80,910,514 | ||
| Government of Poland, | |||||
| 6.25%, 10/24/15 | Poland | 70,991,000 | PLN | 20,144,135 | |
| 5.00%, 4/25/16 | Poland | 11,250,000 | PLN | 3,224,140 | |
| 4.75%, 10/25/16 | Poland | 265,000,000 | PLN | 76,869,934 | |
| gFRN, 2.01%, 1/25/17 | Poland | 7,098,000 | PLN | 1,971,751 | |
| gFRN, 2.01%, 1/25/21 | Poland | 7,201,000 | PLN | 1,983,573 | |
| Strip, 7/25/15 | Poland | 38,982,000 | PLN | 10,786,380 | |
| Strip, 1/25/16 | Poland | 67,525,000 | PLN | 18,536,012 | |
| dGovernment of Portugal, 144A, 5.125%, 10/15/24 | Portugal | 50,000,000 | 54,277,000 | ||
| dGovernment of Serbia, senior note, 144A, | |||||
| 4.875%, 2/25/20 | Serbia | 29,400,000 | 30,267,741 | ||
| 7.25%, 9/28/21 | Serbia | 21,490,000 | 24,797,741 | ||
| Government of Singapore, senior note, 1.125%, 4/01/16 | Singapore | 135,000,000 | SGD | 102,081,601 | |
| Government of Sri Lanka, | |||||
| A, 6.50%, 7/15/15 | Sri Lanka | 86,940,000 | LKR | 652,370 | |
| A, 11.00%, 8/01/15 | Sri Lanka | 601,300,000 | LKR | 4,557,926 | |
| A, 6.40%, 8/01/16 | Sri Lanka | 48,100,000 | LKR | 359,648 | |
| A, 8.00%, 11/15/18 | Sri Lanka | 198,900,000 | LKR | 1,491,705 | |
| A, 9.00%, 5/01/21 | Sri Lanka | 220,720,000 | LKR | 1,706,945 | |
franklintempleton.com Annual Report | 33
| FRANKLIN STRATEGIC SERIES | ||||||
| STATEMENT OF INVESTMENTS | ||||||
| Franklin Strategic Income Fund (continued) | ||||||
| Principal | ||||||
| Country | Amount* | Value | ||||
| Foreign Government and Agency Securities (continued) | ||||||
| Government of Sri Lanka, (continued) | ||||||
| B, 6.40%, 10/01/16 | Sri Lanka | 45,400,000 | LKR | $ | 338,279 | |
| B, 8.50%, 7/15/18 | Sri Lanka | 54,290,000 | LKR | 415,426 | ||
| C, 8.50%, 4/01/18 | Sri Lanka | 24,240,000 | LKR | 185,030 | ||
| D, 8.50%, 6/01/18 | Sri Lanka | 162,140,000 | LKR | 1,236,065 | ||
| Government of the Philippines, | ||||||
| senior bond, 7.00%, 1/27/16 | Philippines | 1,154,290,000 | PHP | 26,572,579 | ||
| senior bond, 9.125%, 9/04/16 | Philippines | 41,860,000 | PHP | 1,000,282 | ||
| senior note, 1.625%, 4/25/16 | Philippines | 1,442,450,000 | PHP | 32,030,263 | ||
| dGovernment of Ukraine, | ||||||
| 144A, 9.25%, 7/24/17 | Ukraine | 23,720,000 | 10,940,850 | |||
| 144A, 7.75%, 9/23/20 | Ukraine | 25,000,000 | 11,493,875 | |||
| senior bond, 144A, 7.80%, 11/28/22 | Ukraine | 26,860,000 | 12,338,812 | |||
| senior note, 144A, 6.75%, 11/14/17 | Ukraine | 900,000 | 414,000 | |||
| senior note, 144A, 7.95%, 2/23/21 | Ukraine | 13,970,000 | 6,452,394 | |||
| senior note, 144A, 7.50%, 4/17/23 | Ukraine | 12,000,000 | 5,707,500 | |||
| nGovernment of Uruguay, senior bond, Index Linked, | ||||||
| 5.00%, 9/14/18 | Uruguay | 145,319,909 | UYU | 5,638,261 | ||
| 4.375%, 12/15/28 | Uruguay | 1,806,583,717 | UYU | 67,589,167 | ||
| Korea Monetary Stabilization Bond, | ||||||
| senior bond, 2.80%, 8/02/15 | South Korea | 29,565,730,000 | KRW | 27,515,755 | ||
| senior bond, 2.81%, 10/02/15 | South Korea | 23,911,000,000 | KRW | 22,294,251 | ||
| senior note, 2.76%, 6/02/15 | South Korea | 31,746,600,000 | KRW | 29,491,249 | ||
| senior note, 2.07%, 12/02/16 | South Korea | 32,000,000,000 | KRW | 29,844,358 | ||
| Korea Treasury Bond, senior note, | ||||||
| 3.25%, 6/10/15 | South Korea | 7,137,850,000 | KRW | 6,635,452 | ||
| 2.75%, 12/10/15 | South Korea | 53,650,740,000 | KRW | 50,115,757 | ||
| 3.00%, 12/10/16 | South Korea | 65,000,000,000 | KRW | 61,504,170 | ||
| Nota Do Tesouro Nacional, | ||||||
| 10.00%, 1/01/17 | Brazil | 125,850o BRL | 39,784,062 | |||
| 10.00%, 1/01/23 | Brazil | 52,000o BRL | 15,098,314 | |||
| pIndex Linked, 6.00%, 5/15/15 | Brazil | 16,430o BRL | 14,322,336 | |||
| pIndex Linked, 6.00%, 8/15/16 | Brazil | 4,799o BRL | 4,116,851 | |||
| pIndex Linked, 6.00%, 8/15/18 | Brazil | 34,550o BRL | 29,469,601 | |||
| j,pIndex Linked, 6.00%, 5/15/23 | Brazil | 19,500o BRL | 16,775,529 | |||
| senior note, 10.00%, 1/01/19 | Brazil | 25,000o BRL | 7,636,627 | |||
| Uruguay Notas del Tesoro, | ||||||
| 10.25%, 8/22/15 | Uruguay | 395,600,000 | UYU | 14,949,745 | ||
| 9.50%, 1/27/16 | Uruguay | 50,700,000 | UYU | 1,919,445 | ||
| n18, Index Linked, 2.25%, 8/23/17 | Uruguay | 121,729,884 | UYU | 4,390,474 | ||
| nIndex Linked, 4.00%, 6/14/15 | Uruguay | 147,218,994 | UYU | 5,571,873 | ||
| Uruguay Treasury Bill, Strip, | ||||||
| 7/02/15 | Uruguay | 3,560,000 | UYU | 131,697 | ||
| 8/20/15 | Uruguay | 445,261,000 | UYU | 16,197,672 | ||
| Total Foreign Government and Agency Securities | ||||||
| (Cost $1,742,272,739) | 1,544,116,015 | |||||
| U.S. Government and Agency Securities 2.3% | ||||||
| U.S. Treasury Bond, | ||||||
| 4.50%, 5/15/17 | United States | 8,000,000 | 8,631,248 | |||
| 7.125%, 2/15/23 | United States | 3,000,000 | 4,156,407 | |||
| 6.25%, 8/15/23 | United States | 4,000,000 | 5,342,188 | |||
| 6.875%, 8/15/25 | United States | 1,000,000 | 1,448,594 | |||
34 | Annual Report franklintempleton.com
| FRANKLIN STRATEGIC SERIES | ||||
| STATEMENT OF INVESTMENTS | ||||
| Franklin Strategic Income Fund (continued) | ||||
| Principal | ||||
| Country | Amount* | Value | ||
| U.S. Government and Agency Securities (continued) | ||||
| U.S. Treasury Bond, (continued) | ||||
| 6.50%, 11/15/26 | United States | 34,000,000 | $ | 49,135,304 |
| 5.25%, 2/15/29 | United States | 1,750,000 | 2,357,031 | |
| U.S. Treasury Note, | ||||
| 4.75%, 8/15/17 | United States | 7,000,000 | 7,645,862 | |
| 3.875%, 5/15/18 | United States | 22,000,000 | 23,949,068 | |
| 3.75%, 11/15/18 | United States | 39,000,000 | 42,610,542 | |
| 2.75%, 2/15/24 | United States | 33,000,000 | 35,075,403 | |
| nIndex Linked, 2.125%, 1/15/19 | United States | 8,744,797 | 9,644,558 | |
| nIndex Linked, 0.625%, 7/15/21 | United States | 10,412,823 | 10,961,120 | |
| Total U.S. Government and Agency Securities | ||||
| (Cost $196,333,628) | 200,957,325 | |||
| Asset-Backed Securities and Commercial | ||||
| Mortgage-Backed Securities 5.6% | ||||
| Banks 3.3% | ||||
| Banc of America Commercial Mortgage Trust, 2006-4, AJ, 5.695%, | ||||
| 7/10/46 | United States | 25,977,000 | 26,751,244 | |
| gBear Stearns Adjustable Rate Mortgage Trust, 2004-4, A6, FRN, 3.517%, | ||||
| 6/25/34 | United States | 19,795,312 | 20,108,276 | |
| Bear Stearns Commercial Mortgage Securities Inc., | ||||
| g2006-PW11, AJ, FRN, 5.43%, 3/11/39 | United States | 19,604,000 | 20,069,301 | |
| g2006-PW12, AJ, FRN, 5.74%, 9/11/38 | United States | 20,666,000 | 21,259,145 | |
| 2006-PW13, AJ, 5.611%, 9/11/41 | United States | 30,225,000 | 31,102,613 | |
| Citigroup Commercial Mortgage Trust, | ||||
| 2006-C5, AJ, 5.482%, 10/15/49 | United States | 17,791,000 | 17,682,715 | |
| g2007-C6, AM, FRN, 5.711%, 6/10/17 | United States | 25,650,000 | 27,383,222 | |
| gCitigroup/Deutsche Bank Commercial Mortgage Trust, 2006-CD3, AJ, FRN, | ||||
| 5.688%, 10/15/48 | United States | 21,795,000 | 21,279,439 | |
| Countrywide Asset-Backed Certificates, 2005-11, AF4, 5.21%, 3/25/34 | United States | 2,800,000 | 2,738,254 | |
| Greenwich Capital Commercial Funding Corp., | ||||
| g2006-GG7, AJ, FRN, 5.819%, 7/10/38 | United States | 27,020,000 | 27,636,218 | |
| 2007-GG9, AM, 5.475%, 3/10/39 | United States | 6,165,000 | 6,486,255 | |
| JP Morgan Chase Commercial Mortgage Securities Trust, | ||||
| 2006-CB17, AM, 5.464%, 12/12/43 | United States | 17,740,000 | 18,323,291 | |
| g2006-LDP7, AJ, FRN, 5.905%, 4/15/45 | United States | 15,080,000 | 15,228,840 | |
| gMerrill Lynch Mortgage Investors Trust, 2005-A6, 2A3, FRN, 0.561%, | ||||
| 8/25/35 | United States | 4,758,000 | 4,298,444 | |
| gMerrill Lynch Mortgage Trust, 2005-CKI1, AJ, FRN, 5.275%, 11/12/37 | United States | 2,875,000 | 2,916,271 | |
| gMorgan Stanley Capital I Trust, | ||||
| 2006-HQ8, AJ, FRN, 5.498%, 3/12/44 | United States | 7,045,000 | 7,189,785 | |
| 2007-IQ16, AM, FRN, 6.084%, 12/12/49 | United States | 3,102,000 | 3,428,920 | |
| 2007-IQ16, AMA, FRN, 6.08%, 12/12/49 | United States | 12,415,000 | 13,476,036 | |
| Wells Fargo Mortgage Backed Securities Trust, | ||||
| g2004-W, A9, FRN, 2.616%, 11/25/34 | United States | 3,285,632 | 3,344,841 | |
| 2007-3, 3A1, 5.50%, 4/25/37 | United States | 978,580 | 1,012,404 | |
| 291,715,514 | ||||
| Diversified Financials 2.3% | ||||
| d,gARES CLO XII Ltd., 2007-12A, B, 144A, FRN, 1.262%, 11/25/20 | United States | 3,840,000 | 3,816,115 | |
| d,gAtrium CDO Corp., 10A, C, 144A, FRN, 2.876%, 7/16/25 | United States | 13,950,000 | 13,784,971 | |
| d,gAtrium XI, 11A, C, 144A, FRN, 3.477%, 10/23/25 | Cayman Islands | 15,440,000 | 15,511,950 | |
| d,gBCAP LLC Trust, 2009-RR1, 2A2, 144A, FRN, 2.615%, 5/26/35 | United States | 9,473,234 | 9,457,035 | |
franklintempleton.com Annual Report | 35
FRANKLIN STRATEGIC SERIES
STATEMENT OF INVESTMENTS
| Franklin Strategic Income Fund (continued) | |||||
| Principal | |||||
| Country | Amount* | Value | |||
| Asset-Backed Securities and Commercial | |||||
| Mortgage-Backed Securities (continued) | |||||
| Diversified Financials (continued) | |||||
| d,gCatamaran CLO Ltd., 2013-1A, C, 144A, FRN, 2.877%, 1/27/25 | Cayman Islands | 11,250,000 | $ | 10,931,513 | |
| d,gCent CDO Ltd., 2007-15A, A2B, 144A, FRN, 0.607%, 3/11/21 | United States | 3,881,000 | 3,687,105 | ||
| d,gCent CLO LP, 2013-17A, D, 144A, FRN, 3.278%, 1/30/25 | Cayman Islands | 7,450,980 | 7,449,862 | ||
| d,gCIFC Funding Ltd., 2007-3A, A1J, 144A, FRN, 0.677%, 7/26/21 | United States | 5,130,000 | 5,017,961 | ||
| d,gColumbusNova CLO Ltd., 2007-2A, A2, 144A, FRN, 1.275%, 10/15/21 | United States | 2,680,000 | 2,625,194 | ||
| d,gCT CDO IV Ltd., 2006-4A, A1, 144A, FRN, 0.491%, 10/20/43 | United States | 8,636,927 | 8,613,650 | ||
| d,gEaton Vance CDO Ltd., 2014-1A, | |||||
| A, 144A, FRN, 1.725%, 7/15/26 | Cayman Islands | 17,000,000 | 16,963,620 | ||
| B, 144A, FRN, 2.325%, 7/15/26 | United States | 4,320,500 | 4,305,292 | ||
| C, 144A, FRN, 3.275%, 7/15/26 | United States | 1,420,629 | 1,418,029 | ||
| dG-Force LLC, 2005-RRA, C, 144A, 5.20%, 8/22/36 | United States | 11,144,000 | 10,855,482 | ||
| d,gGleneagles CLO Ltd., 2005-1A, A2, 144A, FRN, 0.655%, 11/01/17 | United States | 8,002,000 | 7,964,791 | ||
| gImpac Secured Assets Trust, 2007-2, FRN, 0.431%, 4/25/37 | United States | 4,317,362 | 3,999,884 | ||
| d,gING Investment Management CLO Ltd., | |||||
| 2013-1A, B, 144A, FRN, 3.175%, 4/15/24 | Cayman Islands | 2,740,000 | 2,753,645 | ||
| 2013-1A, C, 144A, FRN, 3.775%, 4/15/24 | Cayman Islands | 4,440,000 | 4,346,938 | ||
| 2013-2A, B, 144A, FRN, 2.957%, 4/25/25 | United States | 10,770,000 | 10,691,918 | ||
| gMortgageIT Trust, | |||||
| 05-5, A1, FRN, 0.441%, 12/25/35 | United States | 4,127,196 | 3,792,291 | ||
| 2004-1, A2, FRN, 1.081%, 11/25/34 | United States | 5,293,379 | 5,086,373 | ||
| d,gNewcastle CDO Ltd., 2004-5A, 1, 144A, FRN, 0.607%, 12/24/39 | United States | 2,606,093 | 2,570,416 | ||
| gOpteum Mortgage Acceptance Corp. Trust, 2005-4, 1APT, FRN, 0.491%, | |||||
| 11/25/35 | United States | 7,865,195 | 7,435,669 | ||
| Residential Asset Securities Corp., 2004-KS1, AI4, 4.213%, 4/25/32 | United States | 38,254 | 38,239 | ||
| gStructured Asset Mortgage Investments Trust, 2003-AR2, A1, FRN, | |||||
| 0.921%, 12/19/33 | United States | 6,733,373 | 6,509,599 | ||
| gStructured Asset Securities Corp., 2005-2XS, 2A2, FRN, 1.679%, | |||||
| 2/25/35 | United States | 4,867,318 | 4,709,349 | ||
| g,qTalisman 6 Finance, Reg S, FRN, 0.191%, 10/22/16 | Germany | 9,341,497 | EUR | 10,405,634 | |
| gThornburg Mortgage Securities Trust, | |||||
| 2005-1, A3, FRN, 2.234%, 4/25/45 | United States | 7,334,082 | 7,388,222 | ||
| 2005-2, A1, FRN, 2.135%, 7/25/45 | United States | 3,941,013 | 3,841,362 | ||
| d,gWestchester CLO Ltd., 2007-1A, A1A, 144A, FRN, 0.48%, 8/01/22 | United States | 12,414,364 | 12,226,411 | ||
| 208,198,520 | |||||
| Total Asset-Backed Securities and Commercial | |||||
| Mortgage-Backed Securities (Cost $487,735,296) | 499,914,034 | ||||
| Mortgage-Backed Securities 4.5% | |||||
| gFederal Home Loan Mortgage Corp. (FHLMC) Adjustable Rate 0.0%† | |||||
| FHLMC, 2.348%, 1/01/33 | United States | 109,408 | 114,437 | ||
| Federal Home Loan Mortgage Corp. (FHLMC) Fixed Rate 0.5% | |||||
| jFHLMC 30 Year, 3.50%, 5/01/45 | United States | 31,991,000 | 33,469,964 | ||
| FHLMC Gold 15 Year, 4.50%, 10/01/18 - 9/01/19 | United States | 635,266 | 666,246 | ||
| FHLMC Gold 15 Year, 5.00%, 12/01/17 - 7/01/22 | United States | 819,371 | 868,720 | ||
| FHLMC Gold 15 Year, 5.50%, 7/01/17 - 2/01/19 | United States | 78,882 | 82,887 | ||
| FHLMC Gold 30 Year, 4.50%, 10/01/40 | United States | 389,958 | 425,311 | ||
| FHLMC Gold 30 Year, 5.00%, 5/01/27 - 2/01/38 | United States | 2,973,250 | 3,310,006 | ||
| FHLMC Gold 30 Year, 5.50%, 6/01/33 - 6/01/36 | United States | 1,886,970 | 2,139,714 | ||
| FHLMC Gold 30 Year, 6.00%, 6/01/33 - 6/01/37 | United States | 747,564 | 852,000 | ||
| FHLMC Gold 30 Year, 6.50%, 10/01/21 - 6/01/36 | United States | 412,152 | 474,612 | ||
| FHLMC Gold 30 Year, 7.00%, 9/01/21 - 8/01/32 | United States | 53,554 | 59,144 | ||
| FHLMC Gold 30 Year, 7.50%, 1/01/26 - 1/01/31 | United States | 10,983 | 12,959 | ||
36 | Annual Report franklintempleton.com
FRANKLIN STRATEGIC SERIES
STATEMENT OF INVESTMENTS
| Franklin Strategic Income Fund (continued) | ||||
| Principal | ||||
| Country | Amount* | Value | ||
| Mortgage-Backed Securities (continued) | ||||
| Federal Home Loan Mortgage Corp. (FHLMC) Fixed Rate (continued) | ||||
| FHLMC Gold 30 Year, 8.00%, 11/01/25 - 1/01/26 | United States | 267 | $ | 279 |
| FHLMC Gold 30 Year, 9.00%, 12/01/24 | United States | 154 | 181 | |
| 42,362,023 | ||||
| gFederal National Mortgage Association (FNMA) Adjustable Rate 0.0%† | ||||
| FNMA, 2.31%, 12/01/34 | United States | 299,328 | 320,084 | |
| FNMA, 2.42%, 4/01/20 | United States | 74,131 | 76,169 | |
| 396,253 | ||||
| Federal National Mortgage Association (FNMA) Fixed Rate 3.2% | ||||
| jFNMA 15 Year, 2.50%, 7/01/27 - 5/01/30 | United States | 70,608,659 | 72,393,487 | |
| FNMA 15 Year, 4.50%, 3/01/20 | United States | 122,416 | 128,495 | |
| FNMA 15 Year, 5.00%, 1/01/18 - 6/01/18 | United States | 146,723 | 154,152 | |
| FNMA 15 Year, 5.50%, 6/01/15 - 4/01/22 | United States | 961,296 | 1,014,686 | |
| FNMA 15 Year, 6.00%, 7/01/16 - 10/01/16 | United States | 5,422 | 5,513 | |
| jFNMA 30 Year, 3.00%, 5/01/45 | United States | 74,933,000 | 76,251,778 | |
| jFNMA 30 Year, 3.50%, 5/01/45 | United States | 107,315,000 | 112,437,610 | |
| jFNMA 30 Year, 4.00%, 5/01/45 | United States | 9,900,000 | 10,579,659 | |
| FNMA 30 Year, 4.50%, 3/01/28 - 2/01/41 | United States | 1,035,843 | 1,131,504 | |
| FNMA 30 Year, 5.00%, 9/01/23 - 10/01/35 | United States | 3,233,176 | 3,605,083 | |
| FNMA 30 Year, 5.50%, 9/01/33 - 12/01/35 | United States | 2,790,910 | 3,179,111 | |
| FNMA 30 Year, 6.00%, 6/01/34 - 5/01/38 | United States | 5,083,211 | 5,830,425 | |
| FNMA 30 Year, 6.50%, 3/01/28 - 10/01/37 | United States | 909,532 | 1,052,400 | |
| FNMA 30 Year, 7.50%, 10/01/29 | United States | 11,449 | 14,236 | |
| FNMA 30 Year, 8.00%, 1/01/25 - 5/01/26 | United States | 5,706 | 6,958 | |
| FNMA 30 Year, 8.50%, 7/01/25 | United States | 558 | 580 | |
| 287,785,677 | ||||
| Government National Mortgage Association (GNMA) Fixed Rate 0.8% | ||||
| GNMA I SF 30 Year, 5.00%, 6/15/34 - 7/15/34 | United States | 304,608 | 344,022 | |
| GNMA I SF 30 Year, 5.50%, 2/15/33 - 6/15/36 | United States | 873,630 | 994,765 | |
| GNMA I SF 30 Year, 6.00%, 8/15/36 | United States | 84,506 | 98,252 | |
| GNMA I SF 30 Year, 6.50%, 12/15/28 - 3/15/32 | United States | 62,957 | 72,674 | |
| GNMA I SF 30 Year, 7.00%, 11/15/27 - 5/15/28 | United States | 28,563 | 31,678 | |
| GNMA I SF 30 Year, 7.50%, 9/15/23 - 5/15/27 | United States | 3,733 | 4,230 | |
| GNMA I SF 30 Year, 8.00%, 2/15/25 - 9/15/27 | United States | 6,462 | 7,370 | |
| GNMA I SF 30 Year, 8.50%, 8/15/24 | United States | 87 | 100 | |
| GNMA I SF 30 Year, 9.00%, 1/15/25 | United States | 335 | 337 | |
| GNMA I SF 30 Year, 9.50%, 6/15/25 | United States | 563 | 566 | |
| jGNMA II SF 30 Year, 3.00%, 5/01/45 | United States | 8,000,000 | 8,226,093 | |
| jGNMA II SF 30 Year, 3.50%, 5/01/45 | United States | 52,575,000 | 55,466,627 | |
| GNMA II SF 30 Year, 5.00%, 9/20/33 - 11/20/33 | United States | 468,469 | 526,792 | |
| GNMA II SF 30 Year, 5.50%, 6/20/34 | United States | 230,349 | 262,559 | |
| GNMA II SF 30 Year, 6.00%, 11/20/34 | United States | 199,867 | 232,424 | |
| GNMA II SF 30 Year, 6.50%, 7/20/28 - 12/20/31 | United States | 111,152 | 131,610 | |
| GNMA II SF 30 Year, 7.50%, 4/20/32 | United States | 27,264 | 31,728 | |
| 66,431,827 | ||||
| Total Mortgage-Backed Securities | ||||
| (Cost $395,035,127) | 397,090,217 | |||
| Municipal Bonds 4.0% | ||||
| Arkansas State GO, Four-Lane Highway Construction and | ||||
| Improvement Bonds, 3.25%, 6/15/22 | United States | 7,300,000 | 7,914,295 | |
franklintempleton.com Annual Report | 37
FRANKLIN STRATEGIC SERIES
STATEMENT OF INVESTMENTS
| Franklin Strategic Income Fund (continued) | ||||
| Principal | ||||
| Country | Amount* | Value | ||
| Municipal Bonds (continued) | ||||
| California State GO, | ||||
| Build America Bonds, Various Purpose, 7.625%, 3/01/40 | United States | 6,200,000 | $ | 9,529,524 |
| Various Purpose, 5.25%, 11/01/40 | United States | 3,375,000 | 3,925,328 | |
| Various Purpose, 7.60%, 11/01/40 | United States | 15,000,000 | 23,347,800 | |
| Various Purpose, Refunding, 5.25%, 3/01/38 | United States | 7,220,000 | 7,988,569 | |
| Various Purpose, Refunding, 5.00%, 4/01/38 | United States | 20,000,000 | 21,815,400 | |
| Various Purpose, Refunding, NATL Insured, 4.50%, 12/01/32 | United States | 1,815,000 | 1,907,710 | |
| Various Purpose, Series 1, AGMC Insured, Pre-Refunded, 4.75%, | ||||
| 9/01/31 | United States | 1,755,000 | 1,820,269 | |
| Chicago GO, | ||||
| Build America Bonds, Direct Payment, Taxable Project, Series B, | ||||
| 7.517%, 1/01/40 | United States | 3,520,000 | 3,777,066 | |
| Taxable Project, Series B, 6.034%, 1/01/42 | United States | 4,975,000 | 4,502,972 | |
| Colorado State ISD, GO, Mitchell and Scurry Counties, School Building, | ||||
| PSF Guarantee, 5.00%, 8/15/43 | United States | 3,105,000 | 3,491,666 | |
| Evansville Local Public Improvement Bond Bank Revenue, Sewage | ||||
| Works Project, Series A, 5.00%, 7/01/36 | United States | 6,320,000 | 7,007,426 | |
| Florida Hurricane Catastrophe Fund Finance Corp. Revenue, Series A, | ||||
| 2.995%, 7/01/20 | United States | 30,000,000 | 30,792,600 | |
| Illinois State GO, | ||||
| 5.877%, 3/01/19 | United States | 20,000,000 | 22,344,400 | |
| Build America Bonds, 7.35%, 7/01/35 | United States | 8,000,000 | 9,440,720 | |
| Massachusetts State GO, Consolidated Loan of 2014, Series A, 4.50%, | ||||
| 12/01/43 | United States | 18,300,000 | 19,487,304 | |
| Minnesota State GO, Various Purpose, Refunding, Series F, 4.00%, | ||||
| 10/01/24 | United States | 21,400,000 | 24,429,170 | |
| Nassau County GO, General Improvement Bonds, Series B, 5.00%, | ||||
| 4/01/39 | United States | 12,500,000 | 13,703,375 | |
| 4/01/43 | United States | 13,000,000 | 14,120,990 | |
| New Jersey EDA Revenue, School Facilities Construction, Refunding, | ||||
| Series NN, 5.00%, 3/01/30 | United States | 5,200,000 | 5,495,932 | |
| New York City HDC Revenue, Series B1, 5.00%, 7/01/33 | United States | 3,500,000 | 3,948,945 | |
| New York City Municipal Water Finance Authority Water and | ||||
| Sewer System Revenue, Second General Resolution, Fiscal 2014, | ||||
| Refunding, Series BB, 5.00%, 6/15/46 | United States | 22,685,000 | 25,272,451 | |
| New York State Urban Development Corp. Revenue, State Personal | ||||
| Income Tax, General Purpose, Series C, 5.00%, 3/15/29 | United States | 19,500,000 | 22,552,335 | |
| Puerto Rico Electric Power Authority Power Revenue, | ||||
| Series A, 6.75%, 7/01/36 | United States | 30,900,000 | 18,619,722 | |
| Series XX, 5.25%, 7/01/40 | United States | 15,000,000 | 9,038,550 | |
| Puerto Rico Sales Tax FICO Revenue, Capital Appreciation, Refunding, | ||||
| Series A, zero cpn., 8/01/26 | United States | 5,565,000 | 1,731,939 | |
| Puerto Rico Sales Tax FICO Sales Tax Revenue, | ||||
| Capital Appreciation, Refunding, Series A, NATL Insured, zero cpn., | ||||
| 8/01/46 | United States | 6,000,000 | 768,600 | |
| Capital Appreciation, Series A, zero cpn., 8/01/25 | United States | 6,480,000 | 2,237,479 | |
| first subordinate, Series A, 5.75%, 8/01/37 | United States | 5,000,000 | 2,867,200 | |
| first subordinate, Series A, 6.50%, 8/01/44 | United States | 18,300,000 | 11,145,615 | |
| Refunding, Series A, NATL Insured, zero cpn., 8/01/45 | United States | 25,700,000 | 3,514,475 | |
| Refunding, Series B, 6.05%, 8/01/37 | United States | 9,150,000 | 6,108,723 | |
| Refunding, Series B, 6.05%, 8/01/38 | United States | 11,230,000 | 7,497,260 | |
| South Carolina State Public Service Authority Revenue, Refunding, | ||||
| Series B, 5.00%, 12/01/38 | United States | 7,200,000 | 7,954,416 | |
| Total Municipal Bonds (Cost $347,226,454) | 360,100,226 | |||
38 | Annual Report franklintempleton.com
FRANKLIN STRATEGIC SERIES
STATEMENT OF INVESTMENTS
| Franklin Strategic Income Fund (continued) | |||||
| Country | Shares | Value | |||
| Escrows and Litigation Trusts 0.0% | |||||
| a,lComfort Co. Inc., Escrow Account | United States | 63,156 | $ | — | |
| a,lNewPage Corp., Litigation Trust | United States | 14,000,000 | — | ||
| Total Escrows and Litigation Trusts (Cost $—) | — | ||||
| Total Investments before Short Term Investments | |||||
| (Cost $8,323,803,663) | 8,118,289,862 | ||||
| Short Term Investments (Cost $1,030,461,214) 11.5% | |||||
| Money Market Funds 11.5% | |||||
| a,rInstitutional Fiduciary Trust Money Market Portfolio | United States | 1,030,461,214 | 1,030,461,214 | ||
| Total Investments (Cost $9,354,264,877) 102.5% | 9,148,751,076 | ||||
| Other Assets, less Liabilities (2.5)% | (226,685,150 | ) | |||
| Net Assets 100.0% | $ | 8,922,065,926 | |||
†Rounds to less than 0.1% of net assets.
*The principal amount is stated in U.S. dollars unless otherwise indicated.
aNon-income producing.
bAt April 30, 2015, pursuant to the Fund’s policies and the requirements of applicable securities law, the Fund may be restricted from trading these securities for a limited
or extended period of time.
cThe security is owned by FT Holdings Corporation II, a wholly-owned subsidiary of the Fund. See Note 1(g).
dSecurity was purchased pursuant to Rule 144A under the Securities Act of 1933 and may be sold in transactions exempt from registration only to qualified institutional
buyers or in a public offering registered under the Securities Act of 1933. These securities have been deemed liquid under guidelines approved by the Trust’s Board of
Trustees. At April 30, 2015, the aggregate value of these securities was $1,761,447,141, representing 19.74% of net assets.
ePerpetual security with no stated maturity date.
fSee Note 7 regarding defaulted securities.
gThe coupon rate shown represents the rate at period end.
hSee Note 1(f) regarding loan participation notes.
iIncome may be received in additional securities and/or cash.
jA portion or all of the security purchased on a when-issued, delayed delivery, or to-be-announced (TBA) basis. See Note 1(c).
kSee Note 1(i) regarding senior floating rate interests.
lSecurity has been deemed illiquid because it may not be able to be sold within seven days. At April 30, 2015, the aggregate value of these securities was $992,074,
representing 0.01% of net assets.
mPrincipal amount is stated in 100 Mexican Peso Units.
nPrincipal amount of security is adjusted for inflation. See Note 1(k).
oPrincipal amount is stated in 1,000 Brazilian Real Units.
pRedemption price at maturity is adjusted for inflation. See Note 1(k).
qSecurity was purchased pursuant to Regulation S under the Securities Act of 1933, which exempts from registration securities offered and sold outside of the United
States. Such a security cannot be sold in the United States without either an effective registration statement filed pursuant to the Securities Act of 1933, or pursuant to an
exemption from registration. This security has been deemed liquid under guidelines approved by the Trust’s Board of Trustees. At April 30, 2015, the value of this security
was $10,405,634, representing 0.12% of net assets.
rSee Note 3(f) regarding investments in Institutional Fiduciary Trust Money Market Portfolio.
franklintempleton.com Annual Report | 39
FRANKLIN STRATEGIC SERIES
STATEMENT OF INVESTMENTS
| Franklin Strategic Income Fund (continued) | |||||||||||
| At April 30, 2015, the Fund had the following forward exchange contracts outstanding. See Note 1(d). | |||||||||||
| Forward Exchange Contracts | |||||||||||
| Contract Settlement | Unrealized | Unrealized | |||||||||
| Currency | Counterpartya Type | Quantity | Amount | Date | Appreciation | Depreciation | |||||
| British Pound | DBAB | Sell | 10,446,924 | $ | 17,002,833 | 5/07/15 | $ | 958,215 | $ | — | |
| Chilean Peso | CITI | Buy | 1,510,671,000 | 2,536,811 | 5/07/15 | — | (69,177 | ) | |||
| Chilean Peso | DBAB | Buy | 3,025,000,000 | 4,991,749 | 5/07/15 | — | (50,505 | ) | |||
| Chilean Peso | JPHQ | Buy | 9,080,770,800 | 15,482,007 | 5/07/15 | — | (648,848 | ) | |||
| Euro | BZWS | Sell | 14,703,865 | 18,864,779 | 5/07/15 | 2,364,782 | — | ||||
| Euro | CITI | Sell | 4,494,237 | 6,061,455 | 5/07/15 | 1,018,230 | — | ||||
| Euro | DBAB | Buy | 39,555,581 | 43,271,542 | 5/07/15 | 1,318,447 | (202,544 | ) | |||
| Euro | DBAB | Sell | 102,293,614 | 135,321,123 | 5/07/15 | 20,531,958 | — | ||||
| Euro | GSCO | Sell | 9,398,000 | 11,929,539 | 5/07/15 | 1,383,538 | — | ||||
| Euro | JPHQ | Sell | 19,141,245 | 25,020,120 | 5/07/15 | 3,540,700 | — | ||||
| Japanese Yen | BZWS | Sell | 190,148,000 | 1,861,139 | 5/07/15 | 268,372 | — | ||||
| Japanese Yen | CITI | Sell | 100,563,000 | 983,809 | 5/07/15 | 141,447 | — | ||||
| Japanese Yen | DBAB | Sell | 5,554,349,000 | 53,150,895 | 5/07/15 | 6,625,112 | — | ||||
| Japanese Yen | HSBC | Sell | 467,487,000 | 4,574,595 | 5/07/15 | 658,709 | — | ||||
| Japanese Yen | JPHQ | Sell | 1,733,630,500 | 16,373,758 | 5/07/15 | 1,852,071 | — | ||||
| Malaysian Ringgit | DBAB | Buy | 30,637,000 | 9,281,127 | 5/07/15 | — | (685,602 | ) | |||
| Malaysian Ringgit | DBAB | Sell | 30,637,000 | 8,329,799 | 5/07/15 | — | (265,726 | ) | |||
| Malaysian Ringgit | HSBC | Buy | 20,429,388 | 6,186,974 | 5/07/15 | — | (455,300 | ) | |||
| Malaysian Ringgit | HSBC | Sell | 20,429,388 | 5,574,185 | 5/07/15 | — | (157,489 | ) | |||
| Malaysian Ringgit | JPHQ | Buy | 2,290,000 | 692,157 | 5/07/15 | — | (49,674 | ) | |||
| Singapore Dollar | DBAB | Buy | 3,355,500 | 2,687,625 | 5/07/15 | — | (153,065 | ) | |||
| Chilean Peso | DBAB | Buy | 2,000,000,000 | 3,299,513 | 6/18/15 | — | (45,675 | ) | |||
| Euro | BZWS | Sell | 2,275,342 | 2,873,120 | 6/18/15 | 318,394 | — | ||||
| Euro | CITI | Sell | 10,316,000 | 12,727,716 | 6/18/15 | 1,145,037 | — | ||||
| Euro | DBAB | Sell | 52,385,585 | 65,478,706 | 6/18/15 | 6,660,809 | — | ||||
| Euro | JPHQ | Sell | 7,402,120 | 9,235,853 | 6/18/15 | 924,843 | — | ||||
| Indian Rupee | DBAB | Buy | 1,472,000,000 | 23,097,442 | 6/18/15 | — | (201,238 | ) | |||
| Japanese Yen | BZWS | Sell | 386,912,500 | 3,549,493 | 6/18/15 | 306,909 | — | ||||
| Japanese Yen | DBAB | Sell | 12,762,115,000 | 110,390,197 | 6/18/15 | 3,435,194 | — | ||||
| Japanese Yen | JPHQ | Sell | 2,136,360,000 | 18,674,496 | 6/18/15 | 860,304 | (89,924 | ) | |||
| Japanese Yen | MSCO | Sell | 39,600,000 | 349,615 | 6/18/15 | 17,741 | — | ||||
| Malaysian Ringgit | DBAB | Buy | 4,726,000 | 1,361,209 | 6/18/15 | — | (39,162 | ) | |||
| Malaysian Ringgit | DBAB | Sell | 4,020,000 | 1,088,841 | 6/18/15 | — | (35,710 | ) | |||
| Malaysian Ringgit | HSBC | Buy | 1,130,000 | 332,177 | 6/18/15 | — | (16,072 | ) | |||
| British Pound | DBAB | Sell | 1,072,503 | 1,625,379 | 7/23/15 | — | (20,914 | ) | |||
| Chilean Peso | BZWS | Buy | 2,082,200,000 | 3,331,520 | 7/23/15 | 45,057 | — | ||||
| Chilean Peso | DBAB | Buy | 5,456,000,000 | 8,715,655 | 7/23/15 | 132,008 | — | ||||
| Euro | BZWS | Sell | 23,056,204 | 27,522,883 | 7/23/15 | 1,623,031 | — | ||||
| Euro | DBAB | Sell | 46,839,791 | 55,942,167 | 7/23/15 | 3,325,369 | — | ||||
| Euro | JPHQ | Sell | 10,916,222 | 13,041,316 | 7/23/15 | 778,736 | — | ||||
| Euro | MSCO | Sell | 2,920,000 | 3,487,327 | 7/23/15 | 207,187 | — | ||||
| Indian Rupee | CITI | Buy | 116,369,000 | 1,835,473 | 7/23/15 | — | (37,344 | ) | |||
| Indian Rupee | DBAB | Buy | 2,529,734,000 | 38,627,791 | 7/23/15 | 461,564 | — | ||||
| Indian Rupee | HSBC | Buy | 1,380,831,000 | 21,065,309 | 7/23/15 | 271,239 | — | ||||
| Indian Rupee | JPHQ | Buy | 273,412,000 | 4,172,318 | 7/23/15 | 52,434 | — | ||||
| Japanese Yen | BZWS | Sell | 1,046,497,000 | 8,829,112 | 7/23/15 | 54,641 | — | ||||
| Japanese Yen | CITI | Sell | 1,022,550,000 | 8,614,647 | 7/23/15 | 40,962 | — | ||||
| Japanese Yen | DBAB | Sell | 6,774,345,000 | 57,048,077 | 7/23/15 | 247,821 | — | ||||
| Japanese Yen | GSCO | Sell | 755,750,000 | 6,387,070 | 7/23/15 | 50,399 | — | ||||
| Japanese Yen | HSBC | Sell | 1,157,280,000 | 9,777,834 | 7/23/15 | 74,490 | — | ||||
| Japanese Yen | JPHQ | Sell | 1,197,711,000 | 10,118,152 | 7/23/15 | 75,810 | — | ||||
| Singapore Dollar | DBAB | Buy | 9,635,500 | 7,182,214 | 7/23/15 | 85,802 | — | ||||
| Singapore Dollar | HSBC | Buy | 4,228,000 | 3,131,388 | 7/23/15 | 57,774 | — | ||||
| Singapore Dollar | JPHQ | Buy | 2,638,000 | 1,953,640 | 7/23/15 | 36,192 | — | ||||
40 | Annual Report franklintempleton.com
| FRANKLIN STRATEGIC SERIES | |||||||||||
| STATEMENT OF INVESTMENTS | |||||||||||
| Franklin Strategic Income Fund (continued) | |||||||||||
| Forward Exchange Contracts (continued) | |||||||||||
| Contract Settlement | Unrealized | Unrealized | |||||||||
| Currency | Counterpartya Type | Quantity | Amount | Date | Appreciation | Depreciation | |||||
| Euro | DBAB | Sell | 56,259,845 | $ | 64,283,847 | 8/27/15 | $ | 1,049,299 | $ | — | |
| Euro | JPHQ | Sell | 20,514,800 | 23,484,625 | 8/27/15 | 426,543 | — | ||||
| Japanese Yen | DBAB | Sell | 2,240,500,000 | 19,129,952 | 8/27/15 | 332,764 | — | ||||
| Japanese Yen | HSBC | Sell | 286,000,000 | 2,443,672 | 8/27/15 | 44,209 | — | ||||
| Japanese Yen | JPHQ | Sell | 605,200,000 | 5,171,045 | 8/27/15 | 93,581 | — | ||||
| British Pound | DBAB | Sell | 6,992,149 | 10,795,879 | 9/17/15 | 66,352 | — | ||||
| Chilean Peso | DBAB | Buy | 9,592,750,000 | 15,154,423 | 9/17/15 | 321,665 | — | ||||
| Chilean Peso | JPHQ | Buy | 937,202,000 | 1,488,213 | 9/17/15 | 23,785 | — | ||||
| Chilean Peso | MSCO | Buy | 881,530,000 | 1,397,812 | 9/17/15 | 24,370 | — | ||||
| Euro | BZWS | Sell | 667,313 | 758,788 | 9/17/15 | 8,484 | — | ||||
| Euro | DBAB | Buy | 2,493,833 | 2,694,587 | 9/17/15 | 109,396 | — | ||||
| Euro | DBAB | Sell | 140,199,751 | 155,965,221 | 9/17/15 | 857,135 | (2,527,828 | ) | |||
| Euro | GSCO | Sell | 800,000 | 909,968 | 9/17/15 | 10,475 | — | ||||
| Euro | HSBC | Sell | 711,759 | 809,605 | 9/17/15 | 9,326 | — | ||||
| Euro | JPHQ | Sell | 9,285,384 | 10,561,029 | 9/17/15 | 120,853 | — | ||||
| Japanese Yen | DBAB | Sell | 15,346,163,000 | 129,210,515 | 9/17/15 | 532,442 | (121,873 | ) | |||
| Japanese Yen | HSBC | Sell | 561,900,000 | 4,740,372 | 9/17/15 | 24,360 | — | ||||
| Japanese Yen | JPHQ | Sell | 1,648,760,000 | 13,905,246 | 9/17/15 | 67,246 | — | ||||
| Singapore Dollar | DBAB | Buy | 26,357,820 | 19,403,578 | 9/17/15 | 457,472 | — | ||||
| Singapore Dollar | HSBC | Buy | 3,182,000 | 2,344,101 | 9/17/15 | 53,588 | — | ||||
| Singapore Dollar | JPHQ | Buy | 18,544,500 | 13,684,968 | 9/17/15 | 288,617 | — | ||||
| Unrealized appreciation (depreciation) | 66,873,290 | (5,873,670 | ) | ||||||||
| Net unrealized appreciation (depreciation) | $ | 60,999,620 | |||||||||
aMay be comprised of multiple contracts with the same counterparty, currency and settlement date.
| At April 30, 2015, the Fund had the following credit default swap contracts outstanding. See Note 1(d). | ||||||||||||||
| Credit Default Swap Contracts | ||||||||||||||
| Upfront | ||||||||||||||
| Periodic | Premiums | |||||||||||||
| Counterparty/ | Notional | Payment | Expiration | Paid | Unrealized | Unrealized | ||||||||
| Description | Exchange | Amounta | Rate | Date | (Received) | Appreciation | Depreciation | Value | Ratingb | |||||
| OTC Swaps | ||||||||||||||
| Contracts to Sell Protectionc | ||||||||||||||
| Traded Index | ||||||||||||||
| MCDX.NA.24 | CITI | 30,000,000 | 1.00 | % | 6/20/20 | $ | 68,828 | $ | 76,294 | $ | — | $ | 145,122 | Non |
| Investment | ||||||||||||||
| Grade | ||||||||||||||
| MCDX.NA.24 | GSCO | 75,000,000 | 1.00 | % | 6/20/20 | 172,071 | 190,736 | — | 362,807 | Non | ||||
| Investment | ||||||||||||||
| Grade | ||||||||||||||
| Unrealized appreciation (depreciation) | 267,030 | — | ||||||||||||
| Net unrealized appreciation (depreciation) | $ | 267,030 | ||||||||||||
aIn U.S. dollars unless otherwise indicated. For contracts to sell protection, the notional amount is equal to the maximum potential amount of the future payments and no
recourse provisions have been entered into in association with the contracts.
bBased on internal ratings for index swaps. Internal ratings based on mapping into equivalent ratings from external vendors.
cThe fund enters contracts to sell protection to create a long credit position. Performance triggers include failure to pay or bankruptcy of the underlying securities for traded
index swaps.
See Note 9 regarding other derivative information.
See Abbreviations on page 58.
franklintempleton.com The accompanying notes are an integral part of these financial statements. | Annual Report | 41
| FRANKLIN STRATEGIC SERIES | |||
| Financial Statements | |||
| Statement of Assets and Liabilities | |||
| April 30, 2015 | |||
| Franklin Strategic Income Fund | |||
| Assets: | |||
| Investments in securities: | |||
| Cost - Unaffiliated issuers | $ | 8,323,803,663 | |
| Cost - Sweep Money Fund (Note 3f) | 1,030,461,214 | ||
| Total cost of investments | $ | 9,354,264,877 | |
| Value - Unaffiliated issuers | $ | 8,118,289,862 | |
| Value - Sweep Money Fund (Note 3f) | 1,030,461,214 | ||
| Total value of investments | 9,148,751,076 | ||
| Cash | 1,422,923 | ||
| Restricted Cash (Note 1e) | 59,928,500 | ||
| Foreign currency, at value (cost $96,499,352) | 96,288,204 | ||
| Receivables: | |||
| Investment securities sold | 62,039,016 | ||
| Capital shares sold | 12,888,350 | ||
| Interest | 89,774,317 | ||
| OTC swaps (premiums paid $243,721) | 240,899 | ||
| Unrealized appreciation on forward exchange contracts | 66,873,290 | ||
| Unrealized appreciation on OTC swap contracts | 267,030 | ||
| Other assets | 8,116 | ||
| Total assets | 9,538,481,721 | ||
| Liabilities: | |||
| Payables: | |||
| Investment securities purchased | 518,651,142 | ||
| Capital shares redeemed | 20,694,639 | ||
| Management fees | 3,216,848 | ||
| Distribution fees | 2,275,544 | ||
| Transfer agent fees | 1,786,928 | ||
| Distributions to shareholders | 2,813,438 | ||
| Due to brokers | 59,990,500 | ||
| Unrealized depreciation on forward exchange contracts | 5,873,670 | ||
| Unrealized depreciation on unfunded loan commitments (Note 8) | 226,252 | ||
| Deferred tax | 224,914 | ||
| Accrued expenses and other liabilities | 661,920 | ||
| Total liabilities | 616,415,795 | ||
| Net assets, at value | $ | 8,922,065,926 | |
| Net assets consist of: | |||
| Paid-in capital | $ | 9,134,393,819 | |
| Distributions in excess of net investment income | (57,248,362 | ) | |
| Net unrealized appreciation (depreciation) | (144,849,721 | ) | |
| Accumulated net realized gain (loss) | (10,229,810 | ) | |
| Net assets, at value | $ | 8,922,065,926 | |
42 | Annual Report | The accompanying notes are an integral part of these financial statements. franklintempleton.com
FRANKLIN STRATEGIC SERIES
FINANCIAL STATEMENTS
| Statement of Assets and Liabilities (continued) | ||
| April 30, 2015 | ||
| Class A: | ||
| Net assets, at value | $ | 5,242,843,877 |
| Shares outstanding | 522,050,762 | |
| Net asset value per sharea | $ | 10.04 |
| Maximum offering price per share (net asset value per share ÷ 95.75%) | $ | 10.49 |
| Class C: | ||
| Net assets, at value | $ | 2,070,738,770 |
| Shares outstanding | 206,249,957 | |
| Net asset value and maximum offering price per sharea | $ | 10.04 |
| Class R: | ||
| Net assets, at value | $ | 223,758,013 |
| Shares outstanding | 22,358,262 | |
| Net asset value and maximum offering price per share | $ | 10.01 |
| Class R6: | ||
| Net assets, at value | $ | 253,929,131 |
| Shares outstanding | 25,254,798 | |
| Net asset value and maximum offering price per share | $ | 10.05 |
| Advisor Class: | ||
| Net assets, at value | $ | 1,130,796,135 |
| Shares outstanding | 112,493,238 | |
| Net asset value and maximum offering price per share | $ | 10.05 |
aRedemption price is equal to net asset value less contingent deferred sales charges, if applicable.
franklintempleton.com The accompanying notes are an integral part of these financial statements. | Annual Report | 43
| FRANKLIN STRATEGIC SERIES |
| FINANCIAL STATEMENTS |
Statement of Operations
for the year ended April 30, 2015
| Franklin Strategic Income Fund | |||
| Investment income: | |||
| Dividends | $ | 2,067,359 | |
| Interest | 437,336,754 | ||
| Total investment income | 439,404,113 | ||
| Expenses: | |||
| Management fees (Note 3a) | 40,595,637 | ||
| Distribution fees: (Note 3c) | |||
| Class A | 13,204,149 | ||
| Class C | 13,784,598 | ||
| Class R | 1,142,098 | ||
| Transfer agent fees: (Note 3e) | |||
| Class A | 6,698,606 | ||
| Class C | 2,690,686 | ||
| Class R | 289,748 | ||
| Class R6 | 1,464 | ||
| Advisor Class | 1,406,371 | ||
| Custodian fees (Note 4) | 1,115,602 | ||
| Reports to shareholders | 761,419 | ||
| Registration and filing fees | 457,700 | ||
| Professional fees | 168,019 | ||
| Trustees’ fees and expenses | 96,111 | ||
| Other | 190,861 | ||
| Total expenses | 82,603,069 | ||
| Expense reductions (Note 4) | (9,524 | ) | |
| Expenses waived/paid by affiliates (Note 3f) | (839,950 | ) | |
| Net expenses | 81,753,595 | ||
| Net investment income | 357,650,518 | ||
| Realized and unrealized gains (losses): | |||
| Net realized gain (loss) from: | |||
| Investments | 14,593,507 | ||
| Foreign currency transactions | 116,221,037 | ||
| Swap contracts | 7,700,340 | ||
| Net realized gain (loss) | 138,514,884 | ||
| Net change in unrealized appreciation (depreciation) on: | |||
| Investments | (475,191,765 | ) | |
| Translation of other assets and liabilities denominated in foreign currencies | 73,879,657 | ||
| Change in deferred taxes on unrealized appreciation | 42,042 | ||
| Net change in unrealized appreciation (depreciation) | (401,270,066 | ) | |
| Net realized and unrealized gain (loss) | (262,755,182 | ) | |
| Net increase (decrease) in net assets resulting from operations | $ | 94,895,336 | |
44 | Annual Report | The accompanying notes are an integral part of these financial statements.
franklintempleton.com
FRANKLIN STRATEGIC SERIES
FINANCIAL STATEMENTS
| Statements of Changes in Net Assets | ||||||
| Franklin Strategic Income Fund | ||||||
| Year Ended April 30, | ||||||
| 2015 | 2014 | |||||
| Increase (decrease) in net assets: | ||||||
| Operations: | ||||||
| Net investment income | $ | 357,650,518 | $ | 344,373,059 | ||
| Net realized gain (loss) from investments, foreign currency transactions and swap contracts | 138,514,884 | 60,506,551 | ||||
| Net change in unrealized appreciation (depreciation) on investments, translation of other assets | ||||||
| and liabilities denominated in foreign currencies and deferred taxes | (401,270,066 | ) | (190,166,997 | ) | ||
| Net increase (decrease) in net assets resulting from operations | 94,895,336 | 214,712,613 | ||||
| Distributions to shareholders from: | ||||||
| Net investment income and net foreign currency gains: | ||||||
| Class A | (282,280,270 | ) | (213,087,467 | ) | ||
| Class C | (104,690,062 | ) | (80,821,962 | ) | ||
| Class R | (11,662,658 | ) | (9,384,072 | ) | ||
| Class R6 | (14,834,561 | ) | (8,216,596 | ) | ||
| Advisor Class | (62,495,206 | ) | (43,278,074 | ) | ||
| Net realized gains: | ||||||
| Class A | (49,068,785 | ) | (45,182,760 | ) | ||
| Class C | (19,599,475 | ) | (18,883,836 | ) | ||
| Class R | (2,116,015 | ) | (2,123,917 | ) | ||
| Class R6 | (2,507,121 | ) | (2,119,812 | ) | ||
| Advisor Class | (10,474,079 | ) | (8,346,053 | ) | ||
| Total distributions to shareholders | (559,728,232 | ) | (431,444,549 | ) | ||
| Capital share transactions: (Note 2) | ||||||
| Class A | 331,943,973 | 347,835,138 | ||||
| Class C | 70,643,695 | 57,022,268 | ||||
| Class R | 8,142,440 | (26,386,053 | ) | |||
| Class R6 | 20,521,455 | 243,042,693 | ||||
| Advisor Class | 178,987,572 | 79,433,172 | ||||
| Total capital share transactions | 610,239,135 | 700,947,218 | ||||
| Net increase (decrease) in net assets | 145,406,239 | 484,215,282 | ||||
| Net assets: | ||||||
| Beginning of year | 8,776,659,687 | 8,292,444,405 | ||||
| End of year | $ | 8,922,065,926 | $ | 8,776,659,687 | ||
| Distributions in excess of net investment income included in net assets: | ||||||
| End of year | $ | (57,248,362 | ) | $ | (38,578,004 | ) |
franklintempleton.com The accompanying notes are an integral part of these financial statements. | Annual Report | 45
FRANKLIN STRATEGIC SERIES
Notes to Financial Statements
Franklin Strategic Income Fund
1. Organization And Significant Accounting Policies
Franklin Strategic Series (Trust) is registered under the Investment Company Act of 1940, as amended, (1940 Act) as an open-end management investment company, consisting of nine separate funds and applies the specialized accounting and reporting guidance in U.S. Generally Accepted Accounting Principles (U.S. GAAP). Franklin Strategic Income Fund (Fund) is included in this report. The financial statements of the remaining funds in the Trust are presented separately. The Fund offers five classes of shares: Class A, Class C, Class R, Class R6, and Advisor Class. Each class of shares differs by its initial sales load, contingent deferred sales charges, voting rights on matters affecting a single class, its exchange privilege and fees primarily due to differing arrangements for distribution and transfer agent fees.
The following summarizes the Fund’s significant accounting policies.
a. Financial Instrument Valuation
The Fund’s investments in financial instruments are carried at fair value daily. Fair value is the price that would be received to sell an asset or paid to transfer a liability in an orderly transaction between market participants on the measurement date. The Fund calculates the net asset value (NAV) per share at the close of the New York Stock Exchange (NYSE), generally at 4 p.m. Eastern time (NYSE close) on each day the NYSE is open for trading. Under compliance policies and procedures approved by the Trust’s Board of Trustees (the Board), the Fund’s administrator has responsibility for oversight of valuation, including leading the cross-functional Valuation and Liquidity Oversight Committee (VLOC). The VLOC provides administration and oversight of the Fund’s valuation policies and procedures, which are approved annually by the Board. Among other things, these procedures allow the Fund to utilize independent pricing services, quotations from securities and financial instrument dealers, and other market sources to determine fair value.
Equity securities listed on an exchange or on the NASDAQ National Market System are valued at the last quoted sale price or the official closing price of the day, respectively. Foreign equity securities are valued as of the close of trading on the foreign stock exchange on which the security is primarily traded or as of the NYSE close, whichever is earlier. The value is then converted into its U.S. dollar equivalent at the foreign exchange rate in effect at the NYSE close on the day that the value of the security is determined. Over-the-counter (OTC) securities are valued within the range of the most recent quoted bid and ask prices. Securities that trade in multiple markets or on multiple exchanges are valued according to the broadest and most representative market. Certain equity securities are valued based upon fundamental characteristics or relationships to similar securities. Investments in open-end mutual funds are valued at the closing NAV.
Debt securities generally trade in the OTC market rather than on a securities exchange. The Fund’s pricing services use multiple valuation techniques to determine fair value. In instances where sufficient market activity exists, the pricing services may utilize a market-based approach through which quotes from market makers are used to determine fair value. In instances where sufficient market activity may not exist or is limited, the pricing services also utilize proprietary valuation models which may consider market characteristics such as benchmark yield curves, credit spreads, estimated default rates, anticipated market interest rate volatility, coupon rates, anticipated timing of principal repayments, underlying collateral, and other unique security features in order to estimate the relevant cash flows, which are then discounted to calculate the fair value. Securities denominated in a foreign currency are converted into their U.S. dollar equivalent at the foreign exchange rate in effect at the NYSE close on the date that the values of the foreign debt securities are determined.
Certain derivative financial instruments (derivatives) trade in the OTC market. The Fund’s pricing services use various techniques including industry standard option pricing models and proprietary discounted cash flow models to determine the fair value of those instruments. The Fund’s net benefit or obligation under the derivative contract, as measured by the fair value of the contract, is included in net assets.
The Fund has procedures to determine the fair value of financial instruments for which market prices are not reliable or readily available. Under these procedures, the VLOC convenes on a regular basis to review such financial instruments and considers a number of factors, including significant unobservable valuation inputs, when arriving at fair value. The VLOC primarily employs a market-based approach which may use related or comparable assets or liabilities, recent transactions, market multiples, book values, and other relevant information for the investment to determine the fair value of the investment. An income-based valuation approach may also be used in which the
46 | Annual Report
franklintempleton.com
FRANKLIN STRATEGIC SERIES
NOTES TO FINANCIAL STATEMENTS
Franklin Strategic Income Fund (continued)
anticipated future cash flows of the investment are discounted to calculate fair value. Discounts may also be applied due to the nature or duration of any restrictions on the disposition of the investments. Due to the inherent uncertainty of valuations of such investments, the fair values may differ significantly from the values that would have been used had an active market existed. The VLOC employs various methods for calibrating these valuation approaches including a regular review of key inputs and assumptions, transactional back-testing or disposition analysis, and reviews of any related market activity.
Trading in securities on foreign securities stock exchanges and OTC markets may be completed before the daily NYSE close. In addition, trading in certain foreign markets may not take place on every NYSE business day. Occasionally, events occur between the time at which trading in a foreign security is completed and the close of the NYSE that might call into question the reliability of the value of a portfolio security held by the Fund. As a result, differences may arise between the value of the Fund’s portfolio securities as determined at the foreign market close and the latest indications of value at the close of the NYSE. In order to minimize the potential for these differences, the VLOC monitors price movements following the close of trading in foreign stock markets through a series of country specific market proxies (such as baskets of American Depositary Receipts, futures contracts and exchange traded funds). These price movements are measured against established trigger thresholds for each specific market proxy to assist in determining if an event has occurred that may call into question the reliability of the values of the foreign securities held by the Fund. If such an event occurs, the securities may be valued using fair value procedures, which may include the use of independent pricing services.
When the last day of the reporting period is a non-business day, certain foreign markets may be open on those days that the NYSE is closed, which could result in differences between the value of the Fund’s portfolio securities on the last business day and the last calendar day of the reporting period. Any significant security valuation changes due to an open foreign market are adjusted and reflected by the Fund for financial reporting purposes.
b. Foreign Currency Translation
Portfolio securities and other assets and liabilities denominated in foreign currencies are translated into U.S. dollars based on the exchange rate of such currencies against U.S. dollars on the date of valuation. The Fund may enter into foreign currency exchange contracts to facilitate transactions denominated in a foreign currency. Purchases and sales of securities, income and expense items denominated in foreign currencies are translated into U.S. dollars at the exchange rate in effect on the transaction date. Portfolio securities and assets and liabilities denominated in foreign currencies contain risks that those currencies will decline in value relative to the U.S. dollar. Occasionally, events may impact the availability or reliability of foreign exchange rates used to convert the U.S. dollar equivalent value. If such an event occurs, the foreign exchange rate will be valued at fair value using procedures established and approved by the Board.
The Fund does not separately report the effect of changes in foreign exchange rates from changes in market prices on securities held. Such changes are included in net realized and unrealized gain or loss from investments in the Statement of Operations.
Realized foreign exchange gains or losses arise from sales of foreign currencies, currency gains or losses realized between the trade and settlement dates on securities transactions and the difference between the recorded amounts of dividends, interest, and foreign withholding taxes and the U.S. dollar equivalent of the amounts actually received or paid. Net unrealized foreign exchange gains and losses arise from changes in foreign exchange rates on foreign denominated assets and liabilities other than investments in securities held at the end of the reporting period.
c. Securities Purchased on a When-Issued, Delayed Delivery and TBA Basis
The Fund purchases securities on a when-issued, delayed delivery and to-be-announced (TBA) basis, with payment and delivery scheduled for a future date. These transactions are subject to market fluctuations and are subject to the risk that the value at delivery may be more or less than the trade date purchase price. Although the Fund will generally purchase these securities with the intention of holding the securities, it may sell the securities before the settlement date. Sufficient assets have been segregated for these securities and collateral has been pledged and/or received for open TBA trades.
d. Derivative Financial Instruments
The Fund invested in derivatives in order to manage risk or gain exposure to various other investments or markets.
franklintempleton.com Annual Report | 47
FRANKLIN STRATEGIC SERIES
NOTES TO FINANCIAL STATEMENTS
Franklin Strategic Income Fund (continued)
1. Organization and Significant Accounting
Policies (continued)
d. Derivative Financial Instruments (continued)
Derivatives are financial contracts based on an underlying or notional amount, require no initial investment or an initial net investment that is smaller than would normally be required to have a similar response to changes in market factors, and require or permit net settlement. Derivatives contain various risks including the potential inability of the counterparty to fulfill their obligations under the terms of the contract, the potential for an illiquid secondary market, and/or the potential for market movements which expose the Fund to gains or losses in excess of the amounts shown in the Statement of Assets and Liabilities. Realized gain and loss and unrealized appreciation and depreciation on these contracts for the period are included in the Statement of Operations.
Derivative counterparty credit risk is managed through a formal evaluation of the creditworthiness of all potential counterparties. The Fund attempts to reduce its exposure to counterparty credit risk on OTC derivatives, whenever possible, by entering into International Swaps and Derivatives Association (ISDA) master agreements with certain counterpar-ties. These agreements contain various provisions, including but not limited to collateral requirements, events of default, or early termination. Termination events applicable to the counter-party include certain deteriorations in the credit quality of the counterparty. Termination events applicable to the Fund include failure of the Fund to maintain certain net asset levels and/or limit the decline in net assets over various periods of time. In the event of default or early termination, the ISDA master agreement gives the non-defaulting party the right to net and close-out all transactions traded, whether or not arising under the ISDA agreement, to one net amount payable by one coun-terparty to the other. However, absent an event of default or early termination, OTC derivative assets and liabilities are presented gross and not offset in the Statement of Assets and Liabilities. Early termination by the counterparty may result in an immediate payment by the Fund of any net liability owed to that counterparty under the ISDA agreement.
Collateral requirements differ by type of derivative. Collateral terms are contract specific for OTC derivatives. For OTC derivatives traded under an ISDA master agreement, posting of collateral is required by either the fund or the applicable coun-terparty if the total net exposure of all OTC derivatives with the applicable counterparty exceeds the minimum transfer amount, which typically ranges from $100,000 to $250,000, and can vary depending on the counterparty and the type of the agreement. Generally, collateral is determined at the close of fund business each day and any additional collateral required due to changes in derivative values may be delivered by the fund or the counterparty within a few business days. Collateral pledged and/or received by the fund, if any, is held in segregated accounts with the fund’s custodian/counterparty broker and can be in the form of cash and/or securities. Unrestricted cash may be invested according to the Fund’s investment objectives.
The Fund entered into OTC forward exchange contracts primarily to manage and/or gain exposure to certain foreign currencies. A forward exchange contract is an agreement between the Fund and a counterparty to buy or sell a foreign currency at a specific exchange rate on a future date.
The Fund entered into credit default swap contracts primarily to manage exposure to credit risk. A credit default swap is an agreement between the Fund and a counterparty whereby the buyer of the contract receives credit protection and the seller of the contract guarantees the credit worthiness of a referenced debt obligation. These agreements may be privately negotiated in the over-the-counter market (“OTC credit default swaps”) or may be executed in a multilateral trade facility platform, such as a registered exchange (“centrally cleared credit default swaps”). The underlying referenced debt obligation may be a single issuer of corporate or sovereign debt, a credit index, or a tranche of a credit index. In the event of a default of the underlying referenced debt obligation, the buyer is entitled to receive the notional amount of the credit default swap contract from the seller in exchange for the referenced debt obligation, a net settlement amount equal to the notional amount of the credit default swap less the recovery value of the referenced debt obligation, or other agreed upon amount. For centrally cleared credit default swaps, required initial margins are pledged by the Fund, and the daily change in fair value is accounted for as a variation margin payable or receivable in the Statement of Assets and Liabilities. Over the term of the contract, the buyer pays the seller a periodic stream of payments, provided that no event of default has occurred. Such periodic payments are accrued daily as an unrealized appreciation or depreciation until the payments are made, at which time they are realized. Payments received or paid to initiate a credit default swap contract are reflected in the Statement of Assets and Liabilities and represent compensating factors between
48 | Annual Report
franklintempleton.com
FRANKLIN STRATEGIC SERIES
NOTES TO FINANCIAL STATEMENTS
Franklin Strategic Income Fund (continued)
stated terms of the credit default swap agreement and prevailing market conditions (credit spreads and other relevant factors). These upfront payments are amortized over the term of the contract as a realized gain or loss in the Statement of Operations.
See Note 9 regarding other derivative information.
e. Restricted Cash
At April 30, 2015, the Fund held restricted cash in connection with investments in certain derivative securities. Restricted cash is held in a segregated account with the Fund’s custodian and is reflected in the Statement of Assets and Liabilities.
f. Loan Participation Notes
The Fund invests in loan participation notes (“Participations”). Participations are loans originally issued to a borrower by one or more financial institutions (the “Lender”) and subsequently sold to other investors, such as the Fund. Participations typically result in the Fund having a contractual relationship only with the Lender and not with the borrower. The Fund has the right to receive from the Lender any payments of principal, interest and fees which the Lender received from the borrower. The Fund generally has no rights to either enforce compliance by the borrower with the terms of the loan agreement or to any collateral relating to the original loan. As a result, the Fund assumes the credit risk of both the borrower and the Lender that is selling the Participation. The Participations may also involve interest rate risk and liquidity risk, including the potential default or insolvency of the borrower and/or the Lender.
g. FT Holdings Corporation II (FT Subsidiary)
The Fund invests in certain financial instruments through its investment in the FT Subsidiary. FT Subsidiary is a Delaware Corporation, is a wholly-owned subsidiary of the Fund, and is able to invest in certain financial instruments consistent with the investment objective of the Fund. At April 30, 2015, FT subsidiary’s investment, Turtle Bay Resort, as well as any other assets and liabilities of FT subsidiary are reflected in the Fund’s Statement of Investments and Statement of Assets and Liabilities. The financial statements have been consolidated and include the accounts of the Fund and FT subsidiary. All intercompany transactions and balances have been eliminated.
h. Mortgage Dollar Rolls
The Fund enters into mortgage dollar rolls, typically on a TBA basis. Mortgage dollar rolls are agreements between the Fund and a financial institution to simultaneously sell and repurchase mortgage-backed securities at a future date. Gains or losses are realized on the initial sale, and the difference between the repurchase price and the sale price is recorded as an unrealized gain or loss to the Fund upon entering into the mortgage dollar roll. In addition, the Fund may invest the cash proceeds that are received from the initial sale. During the period between the sale and repurchase, the Fund is not entitled to principal and interest paid on the mortgage backed securities. The risks of mortgage dollar roll transactions include the potential inability of the counterparty to fulfill its obligations.
i. Senior Floating Rate Interests
The Fund invests in senior secured corporate loans that pay interest at rates which are periodically reset by reference to a base lending rate plus a spread. These base lending rates are generally the prime rate offered by a designated U.S. bank or the London InterBank Offered Rate (LIBOR). Senior secured corporate loans often require prepayment of principal from excess cash flows or at the discretion of the borrower. As a result, actual maturity may be substantially less than the stated maturity. Senior secured corporate loans in which the Fund invests are generally readily marketable, but may be subject to certain restrictions on resale.
j. Income and Deferred Taxes
It is the Fund’s policy to qualify as a regulated investment company under the Internal Revenue Code. The Fund intends to distribute to shareholders substantially all of its taxable income and net realized gains to relieve it from federal income and excise taxes. As a result, no provision for U.S. federal income taxes is required.
The Fund may be subject to foreign taxation related to income received, capital gains on the sale of securities and certain foreign currency transactions in the foreign jurisdictions in which it invests. Foreign taxes, if any, are recorded based on the tax regulations and rates that exist in the foreign markets in which the Fund invests. When a capital gain tax is determined to apply, the Fund records an estimated deferred tax liability in an amount that would be payable if the securities were disposed of on the valuation date.
franklintempleton.com
Annual Report
| 49
FRANKLIN STRATEGIC SERIES
NOTES TO FINANCIAL STATEMENTS
Franklin Strategic Income Fund (continued)
1. Organization and Significant Accounting
Policies (continued)
j. Income and Deferred Taxes (continued)
The Fund recognizes the tax benefits of uncertain tax positions only when the position is “more likely than not” to be sustained upon examination by the tax authorities based on the technical merits of the tax position. As of April 30, 2015, and for all open tax years, the Fund has determined that no liability for unrecognized tax benefits is required in the Fund’s financial statements related to uncertain tax positions taken on a tax return (or expected to be taken on future tax returns). Open tax years are those that remain subject to examination and are based on each tax jurisdiction’s statute of limitation.
k. Security Transactions, Investment Income, Expenses and Distributions
Security transactions are accounted for on trade date. Realized gains and losses on security transactions are determined on a specific identification basis. Interest income and estimated expenses are accrued daily. Amortization of premium and accretion of discount on debt securities are included in interest income. Paydown gains and losses are recorded as an adjustment to interest income. Facility fees are recognized as income over the expected term of the loan. Dividend income is recorded on the ex-dividend date. Distributions to shareholders are recorded on the ex-dividend date and are determined according to income tax regulations (tax basis). Distributable earnings determined on a tax basis may differ from earnings recorded in accordance with U.S. GAAP. These differences may be permanent or temporary. Permanent differences are reclassified among capital accounts to reflect their tax character. These reclassifications have no impact on net assets or the results of operations. Temporary differences are not reclassified, as they may reverse in subsequent periods.
Common expenses incurred by the Trust are allocated among the funds based on the ratio of net assets of each fund to the combined net assets of the Trust. Fund specific expenses are charged directly to the fund that incurred the expense.
Realized and unrealized gains and losses and net investment income, not including class specific expenses, are allocated daily to each class of shares based upon the relative proportion of net assets of each class. Differences in per share distributions, by class, are generally due to differences in class specific expenses.
Inflation-indexed bonds are adjusted for inflation through periodic increases or decreases in the security’s interest accruals, face amount, or principal redemption value, by amounts corresponding to the rate of inflation as measured by an index. Any increase or decrease in the face amount or principal redemption value will be included as interest income in the Statement of Operations.
l. Accounting Estimates
The preparation of financial statements in accordance with U.S. GAAP requires management to make estimates and assumptions that affect the reported amounts of assets and liabilities at the date of the financial statements and the amounts of income and expenses during the reporting period. Actual results could differ from those estimates.
m. Guarantees and Indemnifications
Under the Trust’s organizational documents, its officers and trustees are indemnified by the Trust against certain liabilities arising out of the performance of their duties to the Trust. Additionally, in the normal course of business, the Trust, on behalf of the Fund, enters into contracts with service providers that contain general indemnification clauses. The Trust’s maximum exposure under these arrangements is unknown as this would involve future claims that may be made against the Trust that have not yet occurred. Currently, the Trust expects the risk of loss to be remote.
50 | Annual Report
franklintempleton.com
FRANKLIN STRATEGIC SERIES
NOTES TO FINANCIAL STATEMENTS
Franklin Strategic Income Fund (continued)
2. Shares of Beneficial Interest
At April 30, 2015, there were an unlimited number of shares authorized (without par value). Transactions in the Fund’s shares were as follows:
| Year Ended April 30, | ||||||||||
| 2015 | 2014 | |||||||||
| Shares | Amount | Shares | Amount | |||||||
| Class A Shares: | ||||||||||
| Shares sold | 124,483,941 | $ | 1,289,844,127 | 149,694,277 | $ | 1,580,320,735 | ||||
| Shares issued in reinvestment of distributions | 29,780,955 | 304,820,710 | 22,409,597 | 235,187,078 | ||||||
| Shares redeemed | (122,508,169 | ) | (1,262,720,864 | ) | (139,329,102 | ) | (1,467,672,675 | ) | ||
| Net increase (decrease) | 31,756,727 | $ | 331,943,973 | 32,774,772 | $ | 347,835,138 | ||||
| Class C Shares: | ||||||||||
| Shares sold | 41,144,532 | $ | 426,954,807 | 52,213,238 | $ | 551,561,530 | ||||
| Shares issued in reinvestment of distributions | 10,833,393 | 110,798,384 | 8,492,709 | 89,117,411 | ||||||
| Shares redeemed | (45,307,787 | ) | (467,109,496 | ) | (55,445,492 | ) | (583,656,673 | ) | ||
| Net increase (decrease) | 6,670,138 | $ | 70,643,695 | 5,260,455 | $ | 57,022,268 | ||||
| Class R Shares: | ||||||||||
| Shares sold | 5,069,436 | $ | 52,401,676 | 5,437,437 | $ | 57,142,615 | ||||
| Shares issued in reinvestment of distributions | 1,312,515 | 13,385,323 | 1,059,135 | 11,083,038 | ||||||
| Shares redeemed | (5,603,123 | ) | (57,644,559 | ) | (9,001,828 | ) | (94,611,706 | ) | ||
| Net increase (decrease) | 778,828 | $ | 8,142,440 | (2,505,256 | ) | $ | (26,386,053 | ) | ||
| Class R6 Sharesa: | ||||||||||
| Shares soldb | 4,582,309 | $ | 47,822,000 | 22,906,764 | $ | 238,472,675 | ||||
| Shares issued in reinvestment of distributions | 1,591,380 | 16,309,141 | 984,342 | 10,336,351 | ||||||
| Shares redeemed | (4,262,404 | ) | (43,609,686 | ) | (547,593 | ) | (5,766,333 | ) | ||
| Net increase (decrease) | 1,911,285 | $ | 20,521,455 | 23,343,513 | $ | 243,042,693 | ||||
| Advisor Class Shares: | ||||||||||
| Shares sold | 43,912,372 | $ | 455,843,462 | 43,658,699 | $ | 460,708,567 | ||||
| Shares issued in reinvestment of distributions | 6,465,928 | 66,243,350 | 4,404,969 | 46,277,451 | ||||||
| Shares redeemedb | (33,425,788 | ) | (343,099,240 | ) | (40,514,204 | ) | (427,552,846 | ) | ||
| Net increase (decrease) | 16,952,512 | $ | 178,987,572 | 7,549,464 | $ | 79,433,172 | ||||
| aFor the year May 1, 2013 (effective date) to April 30, 2014. | ||||||||||
| bEffective May 1, 2013, a portion of Advisor Class shares were exchanged into Class R6. | ||||||||||
3. Transactions with Affiliates
Franklin Resources, Inc. is the holding company for various subsidiaries that together are referred to as Franklin Templeton Investments. Certain officers and trustees of the Trust are also officers and/or directors of the following subsidiaries:
| Subsidiary | Affiliation |
| Franklin Advisers, Inc. (Advisers) | Investment manager |
| Franklin Templeton Services, LLC (FT Services) | Administrative manager |
| Franklin Templeton Distributors, Inc. (Distributors) | Principal underwriter |
| Franklin Templeton Investor Services, LLC (Investor Services) | Transfer agent |
franklintempleton.com
Annual Report
| 51
FRANKLIN STRATEGIC SERIES
NOTES TO FINANCIAL STATEMENTS
Franklin Strategic Income Fund (continued)
3. Transactions with Affiliates (continued)
a. Management Fees
The Fund pays an investment management fee to Advisers based on the average daily net assets of the Fund as follows:
| Annualized Fee Rate | Net Assets | |
| 0.625 | % | Up to and including $100 million |
| 0.500 | % | Over $100 million, up to and including $250 million |
| 0.450 | % | Over $250 million, up to and including $7.5 billion |
| 0.440 | % | Over $7.5 billion, up to and including $10 billion |
| 0.430 | % | Over $10 billion, up to and including $12.5 billion |
| 0.420 | % | Over $12.5 billion, up to and including $15 billion |
| 0.400 | % | Over $15 billion, up to and including $17.5 billion |
| 0.380 | % | Over $17.5 billion, up to and including $20 billion |
| 0.360 | % | Over $20 billion, up to and including $35 billion |
| 0.355 | % | Over $35 billion, up to and including $50 billion |
| 0.350 | % | In excess of $50 billion |
b. Administrative Fees
Under an agreement with Advisers, FT Services provides administrative services to the Fund. The fee is paid by Advisers based on the Fund’s average daily net assets, and is not an additional expense of the Fund.
c. Distribution Fees
The Board has adopted distribution plans for each share class, with the exception of Class R6 and Advisor Class shares, pursuant to Rule 12b-1 under the 1940 Act. Distribution fees are not charged on shares held by affiliates. Under the Fund’s Class A reimbursement distribution plan, the Fund reimburses Distributors for costs incurred in connection with the servicing, sale and distribution of the Fund’s shares up to the maximum annual plan rate. Under the Class A reimbursement distribution plan, costs exceeding the maximum for the current plan year cannot be reimbursed in subsequent periods. In addition, under the Fund’s Class C and R compensation distribution plans, the Fund pays Distributors for costs incurred in connection with the servicing, sale and distribution of the Fund’s shares up to the maximum annual plan rate for each class. The plan year, for purposes of monitoring compliance with the maximum annual plan rates, is February 1 through January 31.
The maximum annual plan rates, based on the average daily net assets, for each class, are as follows:
| Class A | 0.25 | % |
| Class C | 0.65 | % |
| Class R | 0.50 | % |
d. Sales Charges/Underwriting Agreements
Front-end sales charges and contingent deferred sales charges (CDSC) do not represent expenses of the Fund. These charges are deducted from the proceeds of sales of Fund shares prior to investment or from redemption proceeds prior to remittance, as applicable. Distributors has advised the Fund of the following commission transactions related to the sales and redemptions of the Fund’s shares for the year:
| Sales charges retained net of commissions paid to unaffiliated | ||
| broker/dealers | $ | 2,919,437 |
| CDSC retained | $ | 275,193 |
52 | Annual Report franklintempleton.com
FRANKLIN STRATEGIC SERIES
NOTES TO FINANCIAL STATEMENTS
Franklin Strategic Income Fund (continued)
e. Transfer Agent Fees
Each class of shares, except for Class R6, pays transfer agent fees to Investor Services for its performance of shareholder servicing obligations and reimburses Investor Services for out of pocket expenses incurred, including shareholding servicing fees paid to third parties. These fees are allocated daily based upon their relative proportion of such classes’ aggregate net assets. Class R6 pays Investor Services transfer agent fees specific to that class.
For the year ended April 30, 2015, the Fund paid transfer agent fees of $11,086,875, of which $4,578,160 was retained by Investor Services.
f. Investments in Institutional Fiduciary Trust Money Market Portfolio
The Fund invests in Institutional Fiduciary Trust Money Market Portfolio (Sweep Money Fund), an affiliated open-end management investment company. Management fees paid by the Fund are waived on assets invested in the Sweep Money Fund, as noted in the Statement of Operations, in an amount not to exceed the management and administrative fees paid directly or indirectly by the Sweep Money Fund. Prior to May 1, 2013, the waiver was accounted for as a reduction to management fees.
g. Waiver and Expense Reimbursements
Investor Services has contractually agreed in advance to waive or limit its fees so that the Class R6 transfer agent fees do not exceed 0.01% until August 31, 2015. There were no Class R6 transfer agent fees waived during the year ended April 30, 2015.
4. Expense Offset Arrangement
The Fund has entered into an arrangement with its custodian whereby credits realized as a result of uninvested cash balances are used to reduce a portion of the Fund’s custodian expenses. During the year ended April 30, 2015, the custodian fees were reduced as noted in the Statement of Operations.
5. Income Taxes
For tax purposes, the Fund may elect to defer any portion of a post-October capital loss to the first day of the following fiscal year. At April 30, 2015, the Fund deferred post-October capital losses of $18,092,766.
The tax character of distributions paid during the years ended April 30, 2015 and 2014, was as follows:
| 2015 | 2014 | |||
| Distributions paid from: | ||||
| Ordinary income | $ | 482,780,216 | $ | 359,348,855 |
| Long term capital gain | 76,948,016 | 72,095,694 | ||
| $ | 559,728,232 | $ | 431,444,549 |
At April 30, 2015, the cost of investments, net unrealized appreciation (depreciation) and undistributed ordinary income for income tax purposes were as follows:
| Cost of investments | $ | 9,384,312,400 | |
| Unrealized appreciation | $ | 202,018,796 | |
| Unrealized depreciation | (437,580,120 | ) | |
| Net unrealized appreciation (depreciation) | $ | (235,561,324 | ) |
| Distributable earnings - undistributed ordinary income | $ | 45,453,181 |
Differences between income and/or capital gains as determined on a book basis and a tax basis are primarily due to differing treatments of foreign currency transactions and bond discounts and premiums.
franklintempleton.com Annual Report | 53
FRANKLIN STRATEGIC SERIES
NOTES TO FINANCIAL STATEMENTS
Franklin Strategic Income Fund (continued)
6. Investment Transactions
Purchases and sales of investments (excluding short term securities) for the year ended April 30, 2015, aggregated $6,529,183,779 and $5,837,948,104, respectively.
7. Credit Risk and Defaulted Securities
At April 30, 2015, the Fund had 56.85% of its portfolio invested in high yield, senior secured floating rate notes, or other securities rated below investment grade. These securities may be more sensitive to economic conditions causing greater price volatility and are potentially subject to a greater risk of loss due to default than higher rated securities.
The Fund held defaulted securities and/or other securities for which the income has been deemed uncollectible. At April 30, 2015, the aggregate value of these securities was $46,340,000, representing 0.52% of the Fund’s net assets. The Fund discontinues accruing income on securities for which income has been deemed uncollectible and provides an estimate for losses on interest receivable. The securities have been identified in the accompanying Statement of Investments.
8. Unfunded Loan Commitments
The Fund enters into certain credit agreements, all or a portion of which may be unfunded. The Fund is obligated to fund these loan commitments at the borrowers’ discretion. Funded portions of credit agreements are presented in the Statement of Investments.
| At April 30, 2015, unfunded commitments were as follows: | ||
| Unfunded | ||
| Borrower | Commitment | |
| Patriot Coal Corp., L/C Facility, 9.25%, 12/18/18 | $ | 2,394,670 |
Unfunded loan commitments and funded portions of credit agreements are marked to market daily and any unrealized appreciation or depreciation is included in the Statement of Assets and Liabilities and the Statement of Operations.
9. Other Derivative Information
At April 30, 2015, the Fund’s investments in derivative contracts are reflected in the Statement of Assets and Liabilities as follows:
| Asset Derivatives | Liability Derivatives | |||||
| Derivative Contracts | ||||||
| Not Accounted for as | Statement of Assets and | Statement of Assets and | ||||
| Hedging Instruments | Liabilities Location | Fair Value | Liabilities Location | Fair Value | ||
| Foreign exchange contracts | Unrealized appreciation on | Unrealized depreciation on | ||||
| forward exchange contracts | $ | 66,873,290 | forward exchange contracts | $ | 5,873,670 | |
| Credit contracts | Unrealized appreciation on OTC | Unrealized depreciation on | ||||
| swap contracts | 267,030 | OTC swap contracts | — | |||
54 | Annual Report
franklintempleton.com
FRANKLIN STRATEGIC SERIES
NOTES TO FINANCIAL STATEMENTS
Franklin Strategic Income Fund (continued)
For the year ended April 30, 2015, the effect of derivative contracts in the Fund’s Statement of Operations was as follows:
| Change in | |||||||
| Unrealized | |||||||
| Derivative Contracts | Realized | Appreciation | |||||
| Not Accounted for as | Gain (Loss) | (Depreciation) | |||||
| Hedging Instruments | Statement of Operations Locations | for the Year | for the Year | ||||
| Foreign exchange contracts | Net realized gain (loss) from foreign currency | ||||||
| transactions / Net change in unrealized appreciation | |||||||
| (depreciation) on translation of other assets and | |||||||
| liabilities denominated in foreign currencies | $ | 120,973,074 | $ | 74,295,083 | |||
| Credit contracts | Net realized gain (loss) from swap contracts / Net | ||||||
| change in unrealized appreciation (depreciation) | |||||||
| on investments | 7,700,340 | (5,222,660 | ) | ||||
| At April 30, 2015, the Fund’s OTC derivative assets and liabilities are as follows: | |||||||
| Gross and Net Amounts of Assets and Liabilities | |||||||
| Presented in the Statement of Assets and Liabilities | |||||||
| Assetsa | Liabilitiesa | ||||||
| Derivatives | |||||||
| Forward exchange contracts | $ | 66,873,290 | $ | 5,873,670 | |||
| Swap Contracts | 507,929 | — | |||||
| Total | $ | 67,381,219 | $ | 5,873,670 | |||
aAbsent an event of default or early termination, OTC derivative assets and liabilities are presented gross and not offset in the Statement of Assets and Liabilities.
At April 30, 2015, the Fund’s OTC derivative assets which may be offset against the Fund’s OTC derivative liabilities and collateral received from the counterparty, is as follows:
| Amounts Not Offset in the | ||||||||||||||
| Statement of Assets and Liabilities | ||||||||||||||
| Gross and | ||||||||||||||
| Net Amounts of | Financial | Financial | ||||||||||||
| Assets Presented in | Instruments | Instruments | Cash | Net Amount | ||||||||||
| the Statement of | Available for | Collateral | Collateral | (Not less | ||||||||||
| Assets and Liabilities | Offset | Receiveda,b | Receivedb | than zero) | ||||||||||
| Counterparty | ||||||||||||||
| BZWS | $ | 4,989,670 | $ | — | $ | — | $ | (4,989,670 | ) | $ | — | |||
| CITI | 2,490,798 | (106,521 | ) | (2,384,277 | ) | — | — | |||||||
| DBAB | 47,508,824 | (4,349,842 | ) | — | (43,158,982 | ) | — | |||||||
| GSCO | 1,807,219 | — | — | (1,807,219 | ) | — | ||||||||
| HSBC | 1,193,695 | (628,861 | ) | (564,834 | ) | — | — | |||||||
| JPHQ | 9,141,715 | (788,446 | ) | (8,353,269 | ) | — | — | |||||||
| MSCO | 249,298 | — | — | (249,298 | ) | — | ||||||||
| Total | $ | 67,381,219 | $ | (5,873,670 | ) | $ | (11,302,380 | ) | $ | (50,205,169 | ) | $ | — | |
aAt April 30,2015, the Fund received U.S. Government Agency Securities and U.S. Treasury Bonds and Notes as collateral for derivatives.
bIn some instances, the collateral amounts disclosed in the table above were adjusted due to the requirement to limit the collateral amounts to avoid the effect of
overcollateralization. Actual collateral received and/or pledged may be more than the amounts disclosed herein.
franklintempleton.com Annual Report | 55
FRANKLIN STRATEGIC SERIES
NOTES TO FINANCIAL STATEMENTS
Franklin Strategic Income Fund (continued)
9. Other Derivative Information (continued)
At April 30, 2015, the Fund’s OTC derivative liabilities which may be offset against the Fund’s OTC derivative assets and collateral pledged to the counterparty, is as follows:
| Amounts Not Offset in the | |||||||||||
| Statement of Assets and Liabilities | |||||||||||
| Gross and | |||||||||||
| Net Amounts of | Financial | Financial | |||||||||
| Liabilities Presented in | Instruments | Instruments | Cash | Net Amount | |||||||
| the Statement of | Available for | Collateral | Collateral | (Not less | |||||||
| Assets and Liabilities | Offset | Pledged | Pledged | than zero) | |||||||
| Counterparty | |||||||||||
| BZWS | $ | — | $ | — | $ | — | $ | — | $ | — | |
| CITI | 106,521 | (106,521 | ) | — | — | — | |||||
| DBAB | 4,349,842 | (4,349,842 | ) | — | — | — | |||||
| GSCO | — | — | — | — | — | ||||||
| HSBC | 628,861 | (628,861 | ) | — | — | — | |||||
| JPHQ | 788,446 | (788,446 | ) | — | — | — | |||||
| MSCO | — | — | — | — | — | ||||||
| Total | $ | 5,873,670 | $ | (5,873,670 | ) | $ | — | $ | — | $ | — |
For the year ended April 30, 2015, the average month end fair value of derivatives represented 1.22% of average month end net assets. The average month end number of open derivative contracts for the year was 237.
See Note 1(d) regarding derivative financial instruments.
10. Credit Facility
The Fund, together with other U.S. registered and foreign investment funds (collectively, Borrowers), managed by Franklin Templeton Investments, are borrowers in a joint syndicated senior unsecured credit facility totaling $2 billion (Global Credit Facility) which matures on February 12, 2016. This Global Credit Facility provides a source of funds to the Borrowers for temporary and emergency purposes, including the ability to meet future unanticipated or unusually large redemption requests.
Under the terms of the Global Credit Facility, the Fund shall, in addition to interest charged on any borrowings made by the Fund and other costs incurred by the Fund, pay its share of fees and expenses incurred in connection with the implementation and maintenance of the Global Credit Facility, based upon its relative share of the aggregate net assets of all of the Borrowers, including an annual commitment fee of 0.07% based upon the unused portion of the Global Credit Facility. These fees are reflected in other expenses in the Statement of Operations. During the year ended April 30, 2015, the Fund did not use the Global Credit Facility.
11. Fair Value Measurements
The Fund follows a fair value hierarchy that distinguishes between market data obtained from independent sources (observable inputs) and the Fund’s own market assumptions (unobservable inputs). These inputs are used in determining the value of the Fund’s financial instruments and are summarized in the following fair value hierarchy:
- Level 1 – quoted prices in active markets for identical financial instruments
- Level 2 – other significant observable inputs (including quoted prices for similar financial instruments, interest rates, prepayment speed, credit risk, etc.)
- Level 3 – significant unobservable inputs (including the Fund’s own assumptions in determining the fair value of financial instruments)
56 | Annual Report
franklintempleton.com
FRANKLIN STRATEGIC SERIES
NOTES TO FINANCIAL STATEMENTS
Franklin Strategic Income Fund (continued)
The input levels are not necessarily an indication of the risk or liquidity associated with financial instruments at that level.
For movements between the levels within the fair value hierarchy, the Fund has adopted a policy of recognizing the transfers as of the date of the underlying event which caused the movement.
A summary of inputs used as of April 30, 2015, in valuing the Fund’s assets and liabilities carried at fair value, is as follows:
| Level 1 | Level 2 | Level 3 | Total | |||||
| Assets: | ||||||||
| Investments in Securities: | ||||||||
| Equity Investments:a | ||||||||
| Consumer Services | $ | — | $ | 11,076,180 | $ | — | $ | 11,076,180 |
| Transportation | — | 3,791,498 | — | 3,791,498 | ||||
| All Other Equity Investmentsb | 73,942 | — | — | 73,942 | ||||
| Corporate Bonds | — | 3,427,981,048 | — | 3,427,981,048 | ||||
| Senior Floating Rate Interests | — | 1,672,197,303 | 992,074 | 1,673,189,377 | ||||
| Foreign Government and Agency Securities | — | 1,544,116,015 | — | 1,544,116,015 | ||||
| U.S. Government and Agency Securities | — | 200,957,325 | — | 200,957,325 | ||||
| Asset-Backed Securities and Commercial | ||||||||
| Mortgage-Backed Securities | — | 499,914,034 | — | 499,914,034 | ||||
| Mortgage-Backed Securities | — | 397,090,217 | — | 397,090,217 | ||||
| Municipal Bonds | — | 360,100,226 | — | 360,100,226 | ||||
| Escrows and Litigation Trusts | — | — | —c | — | ||||
| Short Term Investments | 1,030,461,214 | — | — | 1,030,461,214 | ||||
| Total Investments in Securities | $ | 1,030,535,156 | $ | 8,117,223,846 | $ | 992,074 | $ | 9,148,751,076 |
| Other Financial Instruments | ||||||||
| Forward Exchange Contracts | $ | — | $ | 66,873,290 | $ | — | $ | 66,873,290 |
| Swap Contracts | — | 267,030 | — | 267,030 | ||||
| Total Other Financial Instruments | $ | — | $ | 67,140,320 | $ | — | $ | 67,140,320 |
| Liabilities: | ||||||||
| Other Financial Instruments | ||||||||
| Forward Exchange Contracts | $ | — | $ | 5,873,670 | $ | — | $ | 5,873,670 |
| Unfunded Loan Commitments | — | 226,252 | — | 226,252 | ||||
| Total Other Financial Instruments | $ | — | $ | 6,099,922 | $ | — | $ | 6,099,922 |
aIncludes common and convertible preferred stocks.
bFor detailed categories, see accompanying Statement of Investments.
cIncludes securities determined to have no value at April 30,2015.
A reconciliation of assets in which Level 3 inputs are used in determining fair value is presented when there are significant Level 3 financial instruments at the end of the year.
franklintempleton.com
Annual Report
| 57
FRANKLIN STRATEGIC SERIES
NOTES TO FINANCIAL STATEMENTS
Franklin Strategic Income Fund (continued)
12. Subsequent Events
The Fund has evaluated subsequent events through the issuance of the financial statements and determined that no events have occurred that require disclosure.
| Abbreviations | |||||
| Counterparty | Currency | Selected Portfolio | |||
| BZWS | Barclays Bank PLC | BRL | Brazilian Real | AGMC | Assured Guaranty Municipal Corp. |
| CITI | Citigroup, Inc. | EUR | Euro | CDO | Collateralized Debt Obligation |
| DBAB | Deutsche Bank AG | GBP | British Pound | CLO | Collateralized Loan Obligation |
| GSCO | The Goldman Sachs Group, Inc. | HUF | Hungarian Forint | EDA | Economic Development Authority |
| HSBC | HSBC Bank USA, N.A. | IDR | Indonesian Rupiah | FICO | Financing Corp. |
| JPHQ | JP Morgan Chase & Co. | KRW | South Korean Won | FRN | Floating Rate Note |
| MSCO | Morgan Stanley | LKR | Sri Lankan Rupee | GO | General Obligation |
| MXN | Mexican Peso | HDC | Housing Development Corp. | ||
| MYR | Malaysian Ringgit | ISD | Independent School District | ||
| PHP | Philippine Peso | NATL | National Public Financial Guarantee Corp. | ||
| PLN | Polish Zloty | PIK | Payment-In-Kind | ||
| SGD | Singapore Dollar | PSF | Permanent School Fund | ||
| UYU | Uruguayan Peso | ||||
58 | Annual Report
franklintempleton.com
FRANKLIN STRATEGIC SERIES
Report of Independent Registered Public Accounting Firm
To the Board of Trustees and Shareholders of Franklin Strategic Income Fund
In our opinion, the accompanying statement of assets and liabilities, including the statement of investments, and the related statements of operations and of changes in net assets and the financial highlights present fairly, in all material respects, the financial position of Franklin Strategic Income Fund (one of the funds constituting the Franklin Strategic Series, hereafter referred to as the “Fund”) at April 30, 2015, the results of its operations for the year then ended, the changes in its net assets for each of the two years in the period then ended and the financial highlights for each of the periods presented, in conformity with accounting principles generally accepted in the United States of America. These financial statements and financial highlights (hereafter referred to as “financial statements”) are the responsibility of the Fund’s management. Our responsibility is to express an opinion on these financial statements based on our audits. We conducted our audits of these financial statements in accordance with the standards of the Public Company Accounting Oversight Board (United States). Those standards require that we plan and perform the audit to obtain reasonable assurance about whether the financial statements are free of material misstatement. An audit includes examining, on a test basis, evidence supporting the amounts and disclosures in the financial statements, assessing the accounting principles used and significant estimates made by management, and evaluating the overall financial statement presentation. We believe that our audits, which included confirmation of securities at April 30, 2015 by correspondence with the custodian, transfer agent and brokers, provide a reasonable basis for our opinion.
PricewaterhouseCoopers LLP
San Francisco, California
June 15, 2015
franklintempleton.com
Annual Report
| 59
FRANKLIN STRATEGIC SERIES
Tax Information (unaudited)
Franklin Strategic Income Fund
Under Section 852(b)(3)(C) of the Internal Revenue Code (Code), the Fund hereby reports the maximum amount allowable but no less than $76,948,016 as a long term capital gain dividend for the fiscal year ended April 30, 2015.
Under Section 871(k)(2)(C) of the Code, the Fund hereby reports the maximum amount allowable but no less than $6,817,459 as a short term capital gain dividend for purposes of the tax imposed under Section 871(a)(1)(A) of the Code for the fiscal year ended April 30, 2015.
60 | Annual Report
franklintempleton.com
FRANKLIN STRATEGIC SERIES
Board Members and Officers
The name, year of birth and address of the officers and board members, as well as their affiliations, positions held with the Trust, principal occupations during at least the past five years and number of portfolios overseen in the Franklin Templeton Investments fund complex are shown below. Generally, each board member serves until that person’s successor is elected and qualified.
| Independent Board Members | ||||
| Number of Portfolios in | ||||
| Name, Year of Birth | Length of | Fund Complex Overseen | Other Directorships Held | |
| and Address | Position | Time Served | by Board Member* | During at Least the Past 5 Years |
| Harris J. Ashton (1932) | Trustee | Since 1991 | 145 | Bar-S Foods (meat packing company) |
| One Franklin Parkway | (1981-2010). | |||
| San Mateo, CA 94403-1906 | ||||
| Principal Occupation During at Least the Past 5 Years: | ||||
| Director of various companies; and formerly, Director, RBC Holdings, Inc. (bank holding company) (until 2002); and President, Chief Executive | ||||
| Officer and Chairman of the Board, General Host Corporation (nursery and craft centers) (until 1998). | ||||
| Mary C. Choksi (1950) | Trustee | Since | 119 | Avis Budget Group Inc. (car rental) |
| One Franklin Parkway | October 2014 | (2007-present), Omnicom Group Inc. | ||
| San Mateo, CA 94403-1906 | (advertising and marketing communi- | |||
| cations services) (2011-present) and | ||||
| H.J. Heinz Company (processed foods | ||||
| and allied products) (1998-2006). | ||||
| Principal Occupation During at Least the Past 5 Years: | ||||
| Founding Partner and Senior Managing Director, Strategic Investment Group (investment management group) (1987-present); director of | ||||
| various companies; and formerly, Founding Partner and Managing Director, Emerging Markets Management LLC (investment management | ||||
| firm) (1987-2011); and Loan Officer/Senior Loan Officer/Senior Pension Investment Officer, World Bank Group (international financial | ||||
| institution) (1977-1987). | ||||
| Edith E. Holiday (1952) | Trustee | Since 1998 | 145 | Hess Corporation (exploration and |
| One Franklin Parkway | refining of oil and gas) (1993-present), | |||
| San Mateo, CA 94403-1906 | RTI International Metals, Inc. (manu- | |||
| facture and distribution of titanium) | ||||
| (1999-present), Canadian National | ||||
| Railway (railroad) (2001-present), | ||||
| White Mountains Insurance Group, Ltd. | ||||
| (holding company) (2004-present) and | ||||
| H.J. Heinz Company (processed foods | ||||
| and allied products) (1994-2013). | ||||
| Principal Occupation During at Least the Past 5 Years: | ||||
| Director or Trustee of various companies and trusts; and formerly, Assistant to the President of the United States and Secretary of the | ||||
| Cabinet (1990-1993); General Counsel to the United States Treasury Department (1989-1990); and Counselor to the Secretary and Assistant | ||||
| Secretary for Public Affairs and Public Liaison – United States Treasury Department (1988-1989). | ||||
| J. Michael Luttig (1954) | Trustee | Since 2009 | 145 | Boeing Capital Corporation |
| One Franklin Parkway | (aircraft financing) (2006-2013). | |||
| San Mateo, CA 94403-1906 | ||||
| Principal Occupation During at Least the Past 5 Years: | ||||
| Executive Vice President, General Counsel and member of the Executive Council, The Boeing Company (aerospace company); and | ||||
| formerly, Federal Appeals Court Judge, U.S. Court of Appeals for the Fourth Circuit (1991-2006). | ||||
franklintempleton.com Annual Report | 61
| FRANKLIN STRATEGIC SERIES | ||||
| Independent Board Members (continued) | ||||
| Number of Portfolios in | ||||
| Name, Year of Birth | Length of | Fund Complex Overseen | Other Directorships Held | |
| and Address | Position | Time Served | by Board Member* | During at Least the Past 5 Years |
| Frank A. Olson (1932) | Trustee | Since 2007 | 145 | Hess Corporation (exploration and |
| One Franklin Parkway | refining of oil and gas) (1998-2013). | |||
| San Mateo, CA 94403-1906 | ||||
| Principal Occupation During at Least the Past 5 Years: | ||||
| Director of various companies; and formerly, Chairman of the Board, The Hertz Corporation (car rental) (1980-2000) and Chief Executive | ||||
| Officer (1977-1999); and Chairman of the Board, President and Chief Executive Officer, UAL Corporation (airlines) (June-December 1987). | ||||
| Larry D. Thompson (1945) | Trustee | Since 2007 | 145 | Cbeyond, Inc. (business commu- |
| One Franklin Parkway | nications provider) (2010-2012), | |||
| San Mateo, CA 94403-1906 | The Southern Company (energy | |||
| company) (December 2014; | ||||
| previously 2010-2012) and Graham | ||||
| Holdings Company (education and | ||||
| media organization) (2011-present). | ||||
| Principal Occupation During at Least the Past 5 Years: | ||||
| Director of various companies; John A. Sibley Professor of Corporate and Business Law, University of Georgia School of Law (January 2015; | ||||
| previously 2011-2012); and formerly, Executive Vice President – Government Affairs, General Counsel and Corporate Secretary, PepsiCo, | ||||
| Inc. (consumer products) (2012-2014); Senior Vice President – Government Affairs, General Counsel and Secretary, PepsiCo, Inc. | ||||
| (2004-2011); Senior Fellow of The Brookings Institution (2003-2004); Visiting Professor, University of Georgia School of Law (2004); and | ||||
| Deputy Attorney General, U.S. Department of Justice (2001-2003). | ||||
| John B. Wilson (1959) | Lead | Trustee since | 119 | None |
| One Franklin Parkway | Independent | 2006 and Lead | ||
| San Mateo, CA 94403-1906 | Trustee | Independent | ||
| Trustee since 2008 | ||||
| Principal Occupation During at Least the Past 5 Years: | ||||
| President, Staples Europe (office supplies) (2012-present); President and Founder, Hyannis Port Capital, Inc. (real estate and private equity | ||||
| investing); serves on private and non-profit boards; and formerly, Chief Operating Officer and Executive Vice President, Gap, Inc. (retail) | ||||
| (1996-2000); Chief Financial Officer and Executive Vice President – Finance and Strategy, Staples, Inc. (1992-1996); Senior Vice President – | ||||
| Corporate Planning, Northwest Airlines, Inc. (airlines) (1990-1992); and Vice President and Partner, Bain & Company (consulting firm) | ||||
| (1986-1990). | ||||
| Interested Board Members and Officers | ||||
| Number of Portfolios in | ||||
| Name, Year of Birth | Length of | Fund Complex Overseen | Other Directorships Held | |
| and Address | Position | Time Served | by Board Member* | During at Least the Past 5 Years |
| **Gregory E. Johnson (1961) | Trustee | Since June 2013 | 162 | None |
| One Franklin Parkway | ||||
| San Mateo, CA 94403-1906 | ||||
| Principal Occupation During at Least the Past 5 Years: | ||||
| Chairman of the Board, Member – Office of the Chairman, Director, President and Chief Executive Officer, Franklin Resources, Inc.; officer | ||||
| and/or director or trustee, as the case may be, of some of the other subsidiaries of Franklin Resources, Inc. and of 46 of the investment | ||||
| companies in Franklin Templeton Investments; and Vice Chairman, Investment Company Institute. | ||||
62 | Annual Report franklintempleton.com
FRANKLIN STRATEGIC SERIES
| Interested Board Members and Officers (continued) | ||||
| Number of Portfolios in | ||||
| Name, Year of Birth | Length of | Fund Complex Overseen | Other Directorships Held | |
| and Address | Position | Time Served | by Board Member* | During at Least the Past 5 Years |
| **Rupert H. Johnson, Jr. (1940) Chairman of | Chairman of | 145 | None | |
| One Franklin Parkway | the Board and | the Board since | ||
| San Mateo, CA 94403-1906 | Trustee | 2013 and Trustee | ||
| since 1991 | ||||
| Principal Occupation During at Least the Past 5 Years: | ||||
| Vice Chairman, Member – Office of the Chairman and Director, Franklin Resources, Inc.; Director, Franklin Advisers, Inc.; Senior Vice | ||||
| President, Franklin Advisory Services, LLC; and officer and/or director or trustee, as the case may be, of some of the other subsidiaries | ||||
| of Franklin Resources, Inc. and of 43 of the investment companies in Franklin Templeton Investments. | ||||
| Alison E. Baur (1964) | Vice President | Since 2012 | Not Applicable | Not Applicable |
| One Franklin Parkway | ||||
| San Mateo, CA 94403-1906 | ||||
| Principal Occupation During at Least the Past 5 Years: | ||||
| Deputy General Counsel, Franklin Templeton Investments; and officer of some of the other subsidiaries of Franklin Resources, Inc. and of | ||||
| 46 of the investment companies in Franklin Templeton Investments. | ||||
| Laura F. Fergerson (1962) | Chief Executive Since 2009 | Not Applicable | Not Applicable | |
| One Franklin Parkway | Officer – | |||
| San Mateo, CA 94403-1906 | Finance and | |||
| Administration | ||||
| Principal Occupation During at Least the Past 5 Years: | ||||
| Senior Vice President, Franklin Templeton Services, LLC; and officer of 46 of the investment companies in Franklin Templeton Investments. | ||||
| Gaston Gardey (1967) | Treasurer, | Since 2009 | Not Applicable | Not Applicable |
| One Franklin Parkway | Chief Financial | |||
| San Mateo, CA 94403-1906 | Officer and | |||
| Chief | ||||
| Accounting | ||||
| Officer | ||||
| Principal Occupation During at Least the Past 5 Years: | ||||
| Treasurer, U.S. Products and Client Services, Franklin Templeton Investments; and officer of 27 of the investment companies in Franklin | ||||
| Templeton Investments. | ||||
| Aliya S. Gordon (1973) | Vice President | Since 2009 | Not Applicable | Not Applicable |
| One Franklin Parkway | ||||
| San Mateo, CA 94403-1906 | ||||
| Principal Occupation During at Least the Past 5 Years: | ||||
| Senior Associate General Counsel, Franklin Templeton Investments; officer of 46 of the investment companies in Franklin Templeton | ||||
| Investments; and formerly, Litigation Associate, Steefel, Levitt & Weiss, LLP (2000-2004). | ||||
| Steven J. Gray (1955) | Vice President | Since 2009 | Not Applicable | Not Applicable |
| One Franklin Parkway | ||||
| San Mateo, CA 94403-1906 | ||||
| Principal Occupation During at Least the Past 5 Years: | ||||
| Senior Associate General Counsel, Franklin Templeton Investments; Vice President, Franklin Templeton Distributors, Inc. and Franklin | ||||
| Alternative Strategies Advisers, LLC; and officer of 46 of the investment companies in Franklin Templeton Investments. | ||||
franklintempleton.com Annual Report | 63
| FRANKLIN STRATEGIC SERIES | ||||
| Interested Board Members and Officers (continued) | ||||
| Number of Portfolios in | ||||
| Name, Year of Birth | Length of | Fund Complex Overseen | Other Directorships Held | |
| and Address | Position | Time Served | by Board Member* | During at Least the Past 5 Years |
| Selena L. Holmes (1965) | Vice President | Since 2012 | Not Applicable | Not Applicable |
| 100 Fountain Parkway | – AML | |||
| St. Petersburg, FL 33716-1205 | Compliance | |||
| Principal Occupation During at Least the Past 5 Years: | ||||
| Director, Global Compliance Monitoring; Chief Compliance Officer, Franklin Alternative Strategies Advisers, LLC; Vice President, Franklin | ||||
| Templeton Companies, LLC; and officer of 46 of the investment companies in Franklin Templeton Investments. | ||||
| Edward B. Jamieson (1948) | President and | Since 2010 | Not Applicable | Not Applicable |
| One Franklin Parkway | Chief Executive | |||
| San Mateo, CA 94403-1906 | Officer – | |||
| Investment | ||||
| Management | ||||
| Principal Occupation During at Least the Past 5 Years: | ||||
| President, Chief Investment Officer and Director, Franklin Advisers, Inc.; Executive Vice President, Franklin Templeton Institutional, LLC; | ||||
| and officer and/or trustee, as the case may be, of some of the other subsidiaries of Franklin Resources, Inc. and of 10 of the investment | ||||
| companies in Franklin Templeton Investments. | ||||
| Christopher J. Molumphy (1962) Vice President | Since 2000 | Not Applicable | Not Applicable | |
| One Franklin Parkway | ||||
| San Mateo, CA 94403-1906 | ||||
| Principal Occupation During at Least the Past 5 Years: | ||||
| Director and Executive Vice President, Franklin Advisers, Inc.; Executive Vice President, Franklin Templeton Institutional, LLC; and officer | ||||
| of some of the other subsidiaries of Franklin Resources, Inc. and of 22 of the investment companies in Franklin Templeton Investments. | ||||
| Kimberly H. Novotny (1972) | Vice President | Since 2013 | Not Applicable | Not Applicable |
| 300 S.E. 2nd Street | ||||
| Fort Lauderdale, FL 33301-1923 | ||||
| Principal Occupation During at Least the Past 5 Years: | ||||
| Associate General Counsel, Franklin Templeton Investments; Vice President and Secretary, Fiduciary Trust International of the South; Vice | ||||
| President, Templeton Investment Counsel, LLC; Assistant Secretary, Franklin Resources, Inc.; and officer of 46 of the investment companies | ||||
| in Franklin Templeton Investments. | ||||
| Robert C. Rosselot (1960) | Chief | Since 2013 | Not Applicable | Not Applicable |
| 300 S.E. 2nd Street | Compliance | |||
| Fort Lauderdale, FL 33301-1923 | Officer | |||
| Principal Occupation During at Least the Past 5 Years: | ||||
| Director, Global Compliance, Franklin Templeton Investments; Vice President, Franklin Templeton Companies, LLC; officer of 46 of the | ||||
| investment companies in Franklin Templeton Investments; and formerly, Senior Associate General Counsel, Franklin Templeton Investments | ||||
| (2007-2013); and Secretary and Vice President, Templeton Group of Funds (2004-2013). | ||||
| Karen L. Skidmore (1952) | Vice President | Since 2006 | Not Applicable | Not Applicable |
| One Franklin Parkway | and Secretary | |||
| San Mateo, CA 94403-1906 | ||||
| Principal Occupation During at Least the Past 5 Years: | ||||
| Senior Associate General Counsel, Franklin Templeton Investments; and officer of 46 of the investment companies in Franklin Templeton | ||||
| Investments. | ||||
64 | Annual Report franklintempleton.com
FRANKLIN STRATEGIC SERIES
| Interested Board Members and Officers (continued) | ||||
| Number of Portfolios in | ||||
| Name, Year of Birth | Length of | Fund Complex Overseen | Other Directorships Held | |
| and Address | Position | Time Served | by Board Member* | During at Least the Past 5 Years |
| Craig S. Tyle (1960) | Vice President | Since 2005 | Not Applicable | Not Applicable |
| One Franklin Parkway | ||||
| San Mateo, CA 94403-1906 | ||||
| Principal Occupation During at Least the Past 5 Years: | ||||
| General Counsel and Executive Vice President, Franklin Resources, Inc.; and officer of some of the other subsidiaries of Franklin Resources, | ||||
| Inc. and of 46 of the investment companies in Franklin Templeton Investments. | ||||
| Lori A. Weber (1964) | Vice President | Since 2011 | Not Applicable | Not Applicable |
| 300 S.E. 2nd Street | ||||
| Fort Lauderdale, FL 33301-1923 | ||||
| Principal Occupation During at Least the Past 5 Years: | ||||
| Senior Associate General Counsel, Franklin Templeton Investments; Assistant Secretary, Franklin Resources, Inc.; Vice President and | ||||
| Secretary, Templeton Investment Counsel, LLC; Vice President, Fiduciary Trust International of the South; and officer of 46 of the investment | ||||
| companies in Franklin Templeton Investments. | ||||
*We base the number of portfolios on each separate series of the U.S. registered investment companies within the Franklin Templeton Investments fund complex.
These portfolios have a common investment manager or affiliated investment managers.
**Gregory E. Johnson is considered to be an interested person of the Fund under the federal securities laws due to his position as an officer and director of Franklin
Resources, Inc. (Resources), which is the parent company of the Fund’s investment manager and distributor. Rupert H. Johnson, Jr. is considered to be an interested
person of the Fund under the federal securities laws due to his position as officer and director and major shareholder of Resources.
Note 1: Rupert H. Johnson, Jr. is the uncle of Gregory E. Johnson.
Note 2: Officer information is current as of the date of this report. It is possible that after this date, information about officers may change.
Note 3: Effective April 30, 2015, Sam Ginn ceased to be a trustee of the Fund.
The Sarbanes-Oxley Act of 2002 and Rules adopted by the Securities and Exchange Commission require the Fund to disclose whether the Fund’s Audit Committee
includes at least one member who is an audit committee financial expert within the meaning of such Act and Rules. The Fund’s Board has determined that there
is at least one such financial expert on the Audit Committee and has designated John B. Wilson as its audit committee financial expert. The Board believes that
Mr. Wilson qualifies as such an expert in view of his extensive business background and experience, including service as chief financial officer of Staples, Inc.
from 1992 to 1996. Mr. Wilson has been a Member and Chairman of the Fund’s Audit Committee since 2006. As a result of such background and experience, the
Board believes that Mr. Wilson has acquired an understanding of generally accepted accounting principles and financial statements, the general application of
such principles in connection with the accounting estimates, accruals and reserves, and analyzing and evaluating financial statements that present a breadth
and level of complexity of accounting issues generally comparable to those of the Fund, as well as an understanding of internal controls and procedures for
financial reporting and an understanding of audit committee functions. Mr. Wilson is an independent Board member as that term is defined under the relevant
Securities and Exchange Commission Rules and Releases.
The Statement of Additional Information (SAI) includes additional information about the board members and is available, without charge, upon request.
Shareholders may call (800) DIAL BEN/342-5236 to request the SAI.
franklintempleton.com Annual Report | 65
FRANKLIN STRATEGIC SERIES FRANKLIN STRATEGIC INCOME FUND
Shareholder Information
Board Review of Investment Management Agreement
At a meeting held April 14, 2015, the Board of Trustees (Board), including a majority of non-interested or independent Trustees, approved renewal of the investment management agreement for each of the separate funds within the Trust, including Franklin Strategic Income Fund (Fund(s)). In reaching this decision, the Board took into account information furnished throughout the year at regular Board meetings, as well as information prepared specifically in connection with the annual renewal review process. Information furnished and discussed throughout the year included investment performance reports and related financial information for the Funds, along with periodic reports on expenses, shareholder services, legal and compliance matters, pricing, brokerage commissions and execution and other services provided by the Investment Manager (Manager) and its affiliates, as well as marketing support payments made to financial intermediaries. Information furnished specifically in connection with the renewal process included a report for each Fund prepared by Lipper, Inc. (Lipper), an independent organization, as well as additional material, including a Fund profitability analysis prepared by management. The Lipper reports compared each Fund’s investment performance and expenses with those of other mutual funds deemed comparable to the Fund as selected by Lipper. The Fund profitability analysis discussed the profitability to Franklin Templeton Investments (FTI) from its overall U.S. fund operations, as well as on an individual fund-by-fund basis. Additional material accompanying such profitability analysis included information on a fund-by-fund basis listing portfolio managers and other accounts they manage, as well as information on management fees charged by the Manager and its affiliates to U.S. mutual funds and other accounts, including management’s explanation of differences where relevant. Such material also included a memorandum prepared by management describing project initiatives and capital investments relating to the services provided to the Funds by the FTI organization, as well as a memorandum relating to economies of scale and an analysis concerning transfer agent fees charged by an affiliate of the Manager. The Board also noted that at the February meetings each year, it receives an annual report on all marketing support payments made by FTI to financial intermediaries.
In considering such materials, the independent Trustees received assistance and advice from and met separately with independent counsel. While the investment management agreements for all Funds were considered at the same Board meeting, the Board dealt with each Fund separately. In approving continuance of the investment management agreement for each Fund, the Board, including a majority of independent Trustees, determined that the existing management fee structure was fair and reasonable and that continuance of the investment management agreement was in the best interests of each Fund and its shareholders. While attention was given to all information furnished, the following discusses some primary factors relevant to the Board’s decision.
NATURE, EXTENT AND QUALITY OF SERVICE. The Board was satisfied with the nature and quality of the overall services provided by the Manager and its affiliates to the Fund and its shareholders, as noted later in the discussion of investment performance and expenses. The Board’s opinion was based, in part, upon periodic reports furnished it showing that the investment policies and restrictions for the Fund were consistently complied with as well as other reports periodically furnished the Board covering matters such as the compliance of portfolio managers and other management personnel with the code of ethics adopted throughout the Franklin Templeton fund complex, the adherence to fair value pricing procedures established by the Board, and the accuracy of net asset value calculations. The Board also noted the extent of benefits provided Fund shareholders from being part of the Franklin Templeton family of funds, including the right to exchange investments between the same class of shares of different funds without a sales charge, the ability to reinvest Fund dividends into other funds and the right to combine holdings in other funds to obtain a reduced sales charge. Favorable consideration was given to management’s continual efforts and expenditures in establishing effective business continuity plans and developing strategies to address cybersecurity threats. Among other factors taken into account by the Board were the Manager’s best execution trading policies, including a favorable report by an independent portfolio trading analytical firm that also covered FOREX transactions. Consideration was also given to the experience of the Fund’s portfolio management team, the number of accounts managed and general method of compensation. In this latter respect, the Board noted that a primary factor in management’s determination of a portfolio manager’s bonus compensation was the relative investment performance of the funds he or she managed and that a portion of such bonus was required to be invested in a predesignated list of funds within such person’s fund management area so as to be aligned with the interests of shareholders. The Board also took into account the quality of transfer agent and shareholder services provided Fund shareholders by an affiliate of the Manager, noting the
66 | Annual Report
franklintempleton.com
FRANKLIN STRATEGIC SERIES
FRANKLIN STRATEGIC INCOME FUND
SHAREHOLDER INFORMATION
changes taking place in the nature of transfer agency services throughout the industry and regulatory initiatives in this area, and the continual enhancements to the Franklin Templeton website. Particular attention was given to management’s conservative approach and diligent risk management procedures, including continual monitoring of counterparty credit risk and attention given to derivatives and other complex instruments, including expanded collateralization requirements. The Board also took into account, among other things, management’s efforts in establishing a global credit facility for the benefit of the Fund and other accounts managed by FTI to provide a source of cash for temporary and emergency purposes or to meet unusual redemption requests as well as the strong financial position of the Manager’s parent company and its commitment to the mutual fund business as evidenced by its continued subsidization of money market funds.
INVESTMENT PERFORMANCE. The Board placed significant emphasis on the investment performance of the Fund in view of its importance to shareholders. While consideration was given to performance reports and discussions with portfolio managers at Board meetings throughout the year, particular attention in assessing performance was given to the Lipper reports furnished for the agreement renewal. The Lipper reports prepared for the Fund showed the investment performance of its Class A shares in comparison to a performance universe selected by Lipper. Comparative performance for the Fund was shown for the one-year period ended January 31, 2015, and previous periods ended that date of up to 10 years. The performance universe for the Fund consisted of the Fund and all retail and institutional multi-sector income funds as selected by Lipper. The Lipper report comparison showed the Fund’s income return for the one-year period to be in the highest quin-tile of its Lipper performance universe, and on an annualized basis to also be in the highest quintile of such universe for the previous three-year period, and in the second-highest quintile of such universe during the previous five- and 10-year periods. The Lipper report showed the Fund’s total return for the one-year period to be in the second-lowest performing quintile of its performance universe, and on an annualized basis to also be in the middle performing quintile of such universe for the previous three- and five-year periods, and the second-highest performing quintile of such universe for the previous 10-year period. The Board was satisfied with the Fund’s investment performance as set forth in the Lipper report and noted its income oriented investment objective.
COMPARATIVE EXPENSES. Consideration was given to a comparative analysis of the management fees and total expense ratio of the Fund compared with those of a group of other funds selected by Lipper as its appropriate Lipper expense group. Lipper expense data is based upon information taken from each fund’s most recent annual report, which reflects historical asset levels that may be quite different from those currently existing, particularly in a period of market volatility. While recognizing such inherent limitation and the fact that expense ratios generally increase as assets decline and decrease as assets grow, the Board believed the independent analysis conducted by Lipper to be an appropriate measure of comparative expenses. In reviewing comparative costs, Lipper provides information on the Fund’s contractual investment management fee in comparison with the investment management fee that would have been charged by other funds within its Lipper expense group assuming they were similar in size to the Fund, as well as the actual total expense ratio of the Fund in comparison with those of its Lipper expense group. The Lipper contractual investment management fee analysis includes administrative charges as being part of the investment management fee, and actual total expenses, for comparative consistency, are shown by Lipper for Fund Class A shares. The results of such expense comparisons showed the contractual investment management fee rates and actual total expense ratio for the Fund to be in the least expensive quintile of its Lipper expense group. The Board was satisfied with the contractual management fee rate and total expense ratio of the Fund in comparison to its expense group as shown in the Lipper report.
MANAGEMENT PROFITABILITY. The Board also considered the level of profits realized by the Manager and its affiliates in connection with the operation of the Fund. In this respect, the Board reviewed the Fund profitability analysis that addresses the overall profitability of Franklin Templeton’s U.S. fund business, as well as its profits in providing management and other services to each of the individual funds during the 12-month period ended September 30, 2014, being the most recent fiscal year-end for Franklin Resources, Inc., the Manager’s parent. In reviewing the analysis, the Board recognized that allocation methodologies are inherently subjective and various allocation methodologies may be reasonable while producing different results. In this respect, the Board noted that while management continually makes refinements to its methodologies in response to organizational and product related changes, the overall approach as defined by the primary drivers and activity measurements has remained consistent with
franklintempleton.com
Annual Report
| 67
FRANKLIN STRATEGIC SERIES FRANKLIN STRATEGIC INCOME FUND SHAREHOLDER INFORMATION
Board Review of Investment Management
Agreement (continued)
that used in the Fund’s profitability report presentations from prior years. Additionally, the Fund’s independent registered public accounting firm had been engaged by the Manager to periodically review the reasonableness of the allocation methodologies to be used solely by the Fund’s Board in reference to the profitability analysis. In reviewing and discussing such analysis, management discussed with the Board its belief that costs incurred in establishing the infrastructure necessary for the type of mutual fund operations conducted by the Manager and its affiliates may not be fully reflected in the expenses allocated to the Fund in determining its profitability, as well as the fact that the level of profits, to a certain extent, reflected operational cost savings and efficiencies initiated by management. The Board also took into account management’s expenditures in improving shareholder services provided the Fund, as well as the need to implement systems and meet additional regulatory and compliance requirements resulting from statutes such as the Sarbanes-Oxley and Dodd-Frank Acts and recent SEC and other regulatory requirements. In addition, the Board considered a third-party study comparing the profitability of the Manager’s parent on an overall basis to other publicly held managers broken down to show profitability from management operations exclusive of distribution expenses, as well as profitability including distribution expenses. The Board also considered the extent to which the Manager and its affiliates might derive ancillary benefits from fund operations, including revenues generated from transfer agent services, potential benefits resulting from personnel and systems enhancements necessitated by fund growth, as well as increased leverage with the service providers and counterparties. Based upon its consideration of all these factors, the Board determined that the level of profits realized by the Manager and its affiliates from providing services to the Fund was not excessive in view of the nature, quality and extent of services provided.
ECONOMIES OF SCALE. The Board also considered whether economies of scale are realized by the Manager as the Fund grows larger and the extent to which this is reflected in the level of management fees charged. While recognizing that any precise determination is inherently subjective, the Board noted that based upon the Fund profitability analysis, it appears that as some funds get larger, at some point economies of scale do result in the Manager realizing a larger profit margin on management services provided such a fund. The Board noted that economies of scale were shared with the Fund and its shareholders through management fee breakpoints so that as a fund grows in size, its effective management fee rate declines. The fee structure under the investment management agreement for the Fund contains breakpoints that continued to asset levels that exceeded its asset size at December 31, 2014. In view of such fee structure and the favorable expense comparisons of the Fund within its expense group, the Board believed that to the extent economies of scale may be realized by the Manager of the Fund and its affiliates, that there was a sharing of benefits with the Fund and its shareholders.
Proxy Voting Policies and Procedures
The Fund’s investment manager has established Proxy Voting Policies and Procedures (Policies) that the Fund uses to determine how to vote proxies relating to portfolio securities. Shareholders may view the Fund’s complete Policies online at franklintempleton.com. Alternatively, shareholders may request copies of the Policies free of charge by calling the Proxy Group collect at (954) 527-7678 or by sending a written request to: Franklin Templeton Companies, LLC, 300 S.E. 2nd Street, Fort Lauderdale, FL 33301, Attention: Proxy Group. Copies of the Fund’s proxy voting records are also made available online at franklintempleton.com and posted on the U.S. Securities and Exchange Commission’s website at sec.gov and reflect the most recent 12-month period ended June 30.
Quarterly Statement of Investments
The Fund files a complete statement of investments with the U.S. Securities and Exchange Commission for the first and third quarters for each fiscal year on Form N-Q. Shareholders may view the filed Form N-Q by visiting the Commission’s website at sec.gov. The filed form may also be viewed and copied at the Commission’s Public Reference Room in Washington, DC. Information regarding the operations of the Public Reference Room may be obtained by calling (800) SEC-0330.
Householding of Reports and Prospectuses
You will receive the Fund’s financial reports every six months as well as an annual updated summary prospectus (prospectus available upon request). To reduce Fund expenses, we try to identify related shareholders in a household and send only one copy of the financial reports and summary prospectus. This process, called “householding,” will continue indefinitely unless you instruct us otherwise. If you prefer not to have these documents householded, please call us at (800) 632-2301. At any time you may view current prospectuses/summary prospectuses and financial reports on our website. If you choose, you may receive these documents through electronic delivery.
68 | Annual Report
franklintempleton.com
Franklin Templeton Investments
Gain From Our Perspective®
At Franklin Templeton Investments, we’re dedicated to one goal: delivering exceptional asset management for our clients. By bringing together multiple, world-class investment teams in a single firm, we’re able to offer specialized expertise across styles and asset classes, all supported by the strength and resources of one of the world’s largest asset managers. This has helped us to become a trusted partner to individual and institutional investors across the globe.
Focus on Investment Excellence
At the core of our firm, you’ll find multiple independent investment teams—each with a focused area of expertise—from traditional to alternative strategies and multi-asset solutions. And because our portfolio groups operate autonomously, their strategies can be combined to deliver true style and asset class diversification.
All of our investment teams share a common commitment to excellence grounded in rigorous, fundamental research and robust, disciplined risk management. Decade after decade, our consistent, research-driven processes have helped Franklin Templeton earn an impressive record of strong, long-term results.
Global Perspective Shaped by Local Expertise
In today’s complex and interconnected world, smart investing demands a global perspective. Franklin Templeton pioneered international investing over 60 years ago, and our expertise in emerging markets spans more than a quarter of a century. Today, our investment professionals are on the ground across the globe, spotting investment ideas and potential risks firsthand. These locally based teams bring in-depth understanding of local companies, economies and cultural nuances, and share their best thinking across our global research network.
Strength and Experience
Franklin Templeton is a global leader in asset management serving clients in over 150 countries.1 We run our business with the same prudence we apply to asset management, staying focused on delivering relevant investment solutions, strong long-term results and reliable, personal service. This approach, focused on putting clients first, has helped us to become one of the most trusted names in financial services.
1. As of 12/31/14. Clients are represented by the total number of shareholder accounts.
Not FDIC Insured | May Lose Value | No Bank Guarantee
| Contents | |
| Annual Report | |
| Franklin Global | |
| Government Bond Fund | 3 |
| Performance Summary | 7 |
| Your Fund’s Expenses | 12 |
| Financial Highlights and | |
| Statement of Investments | 14 |
| Financial Statements | 21 |
| Notes to Financial Statements | 25 |
| Report of Independent Registered | |
| Public Accounting Firm | 34 |
| Tax Information | 35 |
| Board Members and Officers | 36 |
| Shareholder Information | 41 |
franklintempleton.com
1
Annual Report
Franklin Global Government Bond Fund
This annual report for Franklin Global Government Bond Fund covers the fiscal year ended April 30, 2015.
Your Fund’s Goal and Main Investments
The Fund seeks total return, consisting of interest income and capital appreciation. Under normal market conditions, the Fund invests at least 80% of its net assets in government bonds of issuers located around the world. Government bonds include floating and fixed-rate debt securities of any maturity, such as bonds, notes, bills and debentures, issued or guaranteed by governments, government agencies or instrumentalities, including government-sponsored entities, supranational entities and public-private partnerships.
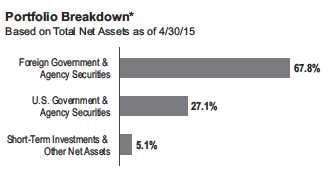
*Figures reflect certain derivatives held in the portfolio (or their underlying reference
assets) and may not total 100% or may be negative due to rounding, use of any
derivatives, unsettled trades or other factors.
Performance Overview
For the 12 months under review, the Fund’s Class A shares had a -0.64% cumulative total return. In comparison, global government bonds, as measured by the Fund’s benchmark, the Citigroup World Government Bond Index (WGBI), had a -5.50% cumulative total return for the same period.1 You can find more of the Fund’s performance data in the Performance Summary beginning on page 7.
Performance data represent past performance, which does not guarantee future results. Investment return and principal value will fluctuate, and you may have a gain or loss when you sell your shares. Current performance may differ from figures shown. Please visit franklintempleton.com or call (800) 342-5236 for most recent month-end performance.
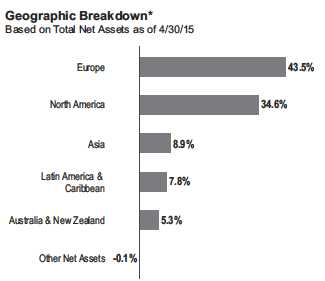
*Figures reflect certain derivatives held in the portfolio (or their underlying reference
assets) and may not total 100% or may be negative due to rounding, use of any
derivatives, unsettled trades or other factors.
Economic and Market Overview
Global bonds, as measured by the Citigroup WGBI, lost value in U.S. dollar terms for the 12-month reporting period, resulting largely from the negative effect of U.S. dollar strength on local currency-denominated bonds. U.S. dollar appreciation and oil price volatility were two of the main factors that impacted global markets starting in mid-2014. Toward period-end, the U.S. dollar reached its highest level in more than a decade against the currencies of major U.S. trading partners, aided by market expectations for U.S. interest rate increases.
1. Source: Morningstar.
The index is unmanaged and includes reinvested interest. One cannot invest directly in an index, and an index is not representative of the Fund’s portfolio.
See www.franklintempletondatasources.com for additional data provider information.
The dollar value, number of shares or principal amount, and names of all portfolio holdings are listed in the Fund’s Statement of Investments (SOI).
The SOI begins on page 19.
franklintempleton.com Annual Report | 3
FRANKLIN GLOBAL GOVERNMENT BOND FUND
Oil prices, meanwhile, ended 2014 at a multi-year low, after the Organization of the Petroleum Exporting Countries maintained production levels despite a global oversupply caused largely by growing U.S. oil production. After reaching a six-year low in March amid rising U.S. oil inventories, crude oil prices began to recover in April.
Various data in the second half of 2014, including improved labor market conditions, indicated a strengthening U.S. economy, which led the U.S. Federal Reserve Board to end its quantitative easing (QE) program in October. However, investors’ fears about slowing global economic growth —which were partly responsible for the oil price plunge —proved to be a major influence on the U.S. Treasury market. Yields on 10-year U.S. Treasury notes moved sharply lower during the 12-month period, reaching a 21-month low at the end of January 2015, before reversing some of the decline over the rest of the period.
Part of the reason for mounting concerns about global growth was economic weakness in the eurozone, where expansion remained anemic and inflation eventually turned negative at the end of 2014. The European Central Bank responded by cutting interest rates in September and announcing an extensive QE program in January 2015. Core and most peripheral eurozone bond yields fell to historically low levels near period-end, while the euro fell to multi-year lows against many major currencies.
In Asia, Japanese government bond yields fell during most of the 12-month period, ending significantly lower after the Bank of Japan (BOJ) announced another sizable round of its QE program in October 2014. The BOJ’s unexpected monetary expansion also weakened the Japanese yen against many major currencies. During the period, China’s central bank reduced its benchmark interest rate twice and implemented other stimulus measures in an effort to support growth as the Chinese economy moderated.
Among other fixed income asset classes, global investment-grade corporate credit generally performed well, as larger companies appeared to be likely beneficiaries of lower energy costs. U.S. dollar-denominated emerging market debt generally delivered positive returns, but local currency-denominated emerging market debt declined in U.S. dollar terms, as a result of the strong U.S. dollar.
| Dividend Distributions* | |||||
| 5/1/14–4/30/15 | |||||
| Dividend per Share (cents) | |||||
| Advisor | |||||
| Month | Class A | Class C | Class R | Class R6 | Class |
| May | 2.47 | 1.71 | 2.32 | 2.00 | 3.88 |
| June | 2.44 | 1.96 | 2.10 | 2.53 | 2.53 |
| July | 2.36 | 1.98 | 1.77 | 2.43 | 2.43 |
| August | 2.35 | 1.83 | 2.05 | 2.46 | 2.46 |
| September | 2.26 | 1.79 | 1.91 | 2.37 | 2.34 |
| October | 3.48 | 2.90 | 3.12 | 3.52 | 3.52 |
| November | 4.12 | 3.60 | 3.72 | 4.20 | 4.14 |
| December | 14.04 | 13.44 | 13.54 | 13.99 | 13.97 |
| January | 1.63 | 1.16 | 1.26 | 1.70 | 1.69 |
| February | 1.61 | 1.07 | 1.21 | 1.68 | 1.68 |
| March | 1.55 | 1.13 | 1.21 | 1.60 | 1.60 |
| April | 2.15 | 1.67 | 1.74 | 2.16 | 2.16 |
| Total | 40.46 | 34.24 | 35.95 | 40.64 | 42.40 |
*All Fund distributions will vary depending upon current market conditions, and past
distributions are not indicative of future trends.
Investment Strategy
We invest selectively in bonds around the world based upon our assessment of changing market, political and economic conditions. While seeking opportunities, we consider various factors including interest rates, currency exchange rates and credit risks. We use top-down macroeconomic research, bottom-up sector-specific research and quantitative analysis to identify and to seek to exploit market inefficiencies while employing a disciplined risk management process. We may use various currency-related derivative instruments, including currency forward and currency futures contracts, as well as various interest rate/bond-related derivative instruments, including interest rate/bond futures contracts and swap agreements.
What is a currency forward contract?
A currency forward contract is an agreement between the Fund and a counterparty to buy or sell a foreign currency at a specific exchange rate on a future date.
4 | Annual Report franklintempleton.com
FRANKLIN GLOBAL GOVERNMENT BOND FUND
What is a futures contract?
A futures contract is an agreement between the Fund and a counterparty made through a U.S. or foreign futures exchange to buy or sell an underlying instrument or asset at a specific price on a future date.
What are swap agreements?
Swap agreements, such as interest rate, currency and credit default swaps, are contracts between the Fund and another party (the swap counterparty). In a basic swap transaction, the Fund agrees with the swap counterparty to exchange the returns (or differentials in rates of return) earned or realized on a particular “notional amount” of underlying instruments. The notional amount is the set amount selected by the parties as the basis on which to calculate the obligations that they have agreed to exchange. The parties typically do not actually exchange the notional amount. Instead, they agree to exchange the returns that would be earned or realized if the notional amount were invested in given instruments or at given interest rates.
| Currency Breakdown* | ||
| 4/30/15 | ||
| % of Total | ||
| Net Assets | ||
| North America | 76.4 | % |
| U.S. Dollar | 74.1 | % |
| Canadian Dollar | 2.3 | % |
| Europe | 17.3 | % |
| Euro | 17.6 | % |
| British Pound | -0.1 | % |
| Polish Zloty | -0.2 | % |
| Latin America & Caribbean | 3.7 | % |
| Mexican Peso | 3.7 | % |
| Asia | 2.4 | % |
| Singapore Dollar | 2.3 | % |
| Malaysian Ringgit | 0.1 | % |
| Australia & New Zealand | 0.2 | % |
| Australian Dollar | 0.2 | % |
*Figures reflect certain derivatives held in the portfolio (or their underlying reference
assets) and may not total 100% or may be negative due to rounding, use of any
derivatives, unsettled trades or other factors.
Manager’s Discussion
For the 12 months ended April 30, 2015, the Fund performed better than its benchmark, the Citigroup WGBI. Currency allocation was a major contributor to performance relative to the index. Positions denominated in currencies other than the U.S. dollar, euro, Japanese yen and British pound also had a positive effect on relative performance. However, security selection among government bonds detracted from the Fund’s relative results.
Regarding the Fund’s currency positioning, an overweighted exposure to the stronger U.S. dollar and underweighted allocations to the weaker euro and Japanese yen supported relative performance. Among the Fund’s other currency positions that contributed to relative performance was an overweighted allocation during the period to local currency-denominated Polish sovereign bonds. Polish interest rates fell to record lows during the period, as policymakers responded to weakness in the neighboring eurozone.
The Fund’s exposures to and selection among emerging market sovereign bonds further added to relative returns, though to a lesser extent, as did the Fund’s duration and yield curve positioning.
What is duration?
Duration is a measure of a bond’s price sensitivity to interest rate changes. In general, a portfolio of securities with a lower duration can be expected to be less sensitive to interest rate changes than a portfolio with a higher duration.
What is the yield curve?
The yield curve is a line that plots the interest rates, at a set point in time, of bonds having equal credit but differing maturity dates. The most frequently reported yield curve compares three-month, two-year and 30-year U.S. Treasury debt.
In contrast, the Fund’s security selection and sector allocation weighed slightly on relative returns, resulting from positioning in government bonds.
During the period, the Fund invested in bonds without the use of interest rate-related derivatives.
franklintempleton.com
Annual Report
| 5
FRANKLIN GLOBAL GOVERNMENT BOND FUND
Thank you for your continued participation in Franklin Global Government Bond Fund. We look forward to serving your future investment needs.

The foregoing information reflects our analysis, opinions and portfolio holdings as of April 30, 2015, the end of the reporting period. The way we implement our main investment strategies and the resulting portfolio holdings may change depending on factors such as market and economic conditions. These opinions may not be relied upon as investment advice or an offer for a particular security. The information is not a complete analysis of every aspect of any market, country, industry, security or the Fund. Statements of fact are from sources considered reliable, but the investment manager makes no representation or warranty as to their completeness or accuracy. Although historical performance is no guarantee of future results, these insights may help you understand our investment management philosophy.
CFA® is a trademark owned by CFA Institute.
6 | Annual Report franklintempleton.com
FRANKLIN GLOBAL GOVERNMENT BOND FUND
Performance Summary as of April 30, 2015
Your dividend income will vary depending on dividends or interest paid by securities in the Fund’s portfolio, adjusted for operating expenses of each class. Capital gain distributions are net profits realized from the sale of portfolio securities. The performance tables and graphs do not reflect any taxes that a shareholder would pay on Fund dividends, capital gain distributions, if any, or any realized gains on the sale of Fund shares. Total return reflects reinvestment of the Fund’s dividends and capital gain distributions, if any, and any unrealized gains or losses.
| Net Asset Value | ||||||||
| Share Class (Symbol) | 4/30/15 | 4/30/14 | Change | |||||
| A (FGGAX) | $ | 9.81 | $ | 10.45 | -$ | 0.64 | ||
| C (N/A) | $ | 9.79 | $ | 10.44 | -$ | 0.65 | ||
| R (N/A) | $ | 9.80 | $ | 10.44 | -$ | 0.64 | ||
| R6 (N/A) | $ | 9.81 | $ | 10.45 | -$ | 0.64 | ||
| Advisor (N/A) | $ | 9.83 | $ | 10.49 | -$ | 0.66 | ||
| Distributions (5/1/14–4/30/15) | ||||||||
| Dividend | Short-Term | Long-Term | ||||||
| Share Class | Income | Capital Gain | Capital Gain | Total | ||||
| A | $ | 0.4046 | $ | 0.1302 | $ | 0.0443 | $ | 0.5791 |
| C | $ | 0.3424 | $ | 0.1302 | $ | 0.0443 | $ | 0.5169 |
| R | $ | 0.3595 | $ | 0.1302 | $ | 0.0443 | $ | 0.5340 |
| R6 | $ | 0.4064 | $ | 0.1302 | $ | 0.0443 | $ | 0.5809 |
| Advisor | $ | 0.4240 | $ | 0.1302 | $ | 0.0443 | $ | 0.5985 |
franklintempleton.com
Annual Report
| 7
FRANKLIN GLOBAL GOVERNMENT BOND FUND
PERFORMANCE SUMMARY
Performance as of 4/30/151
Cumulative total return excludes sales charges. Average annual total returns include maximum sales charges. Class A: 4.25% maximum initial sales charge; Class C: 1% contingent deferred sales charge in first year only; Class R/R6/Advisor Class: no sales charges.
| Total Annual Operating Expenses5 | ||||||||||
| Cumulative | Average Annual | Average Annual | ||||||||
| Share Class | Total Return2 | Total Return3 | Total Return (3/31/15)4 | (with waiver) | (without waiver) | |||||
| A | 0.86 | % | 3.42 | % | ||||||
| 1-Year | -0.64 | % | -4.83 | % | -3.52 | % | ||||
| Since Inception (9/6/13) | +5.13 | % | +0.43 | % | +0.63 | % | ||||
| C | 1.26 | % | 3.82 | % | ||||||
| 1-Year | -1.34 | % | -2.28 | % | -0.80 | % | ||||
| Since Inception (9/6/13) | +4.05 | % | +2.44 | % | +2.86 | % | ||||
| R | 1.11 | % | 3.67 | % | ||||||
| 1-Year | -1.07 | % | -1.07 | % | +0.32 | % | ||||
| Since Inception (9/6/13) | +4.38 | % | +2.64 | % | +3.00 | % | ||||
| R6 | 0.61 | % | 3.79 | % | ||||||
| 1-Year | -0.62 | % | -0.62 | % | +0.79 | % | ||||
| Since Inception (9/6/13) | +5.26 | % | +3.16 | % | +3.52 | % | ||||
| Advisor | 0.61 | % | 3.17 | % | ||||||
| 1-Year | -0.65 | % | -0.65 | % | +0.94 | % | ||||
| Since Inception (9/6/13) | +5.55 | % | +3.34 | % | +3.71 | % | ||||
| 30-Day Standardized Yield7 | ||||||
| Distribution | ||||||
| Share Class | Rate6 | (with waiver) | (without waiver) | |||
| A | 2.52 | % | 0.93 | % | -0.65 | % |
| C | 2.05 | % | 0.40 | % | -1.24 | % |
| R | 2.13 | % | 0.54 | % | -1.10 | % |
| R6 | 2.64 | % | 1.03 | % | -0.57 | % |
| Advisor | 2.64 | % | 1.04 | % | -0.61 | % |
Performance data represent past performance, which does not guarantee future results. Investment return and principal value will fluctuate, and you may have a gain or loss when you sell your shares. Current performance may differ from figures shown. For most recent month-end performance, go to franklintempleton.com or call (800) 342-5236.
8 | Annual Report
franklintempleton.com
FRANKLIN GLOBAL GOVERNMENT BOND FUND
PERFORMANCE SUMMARY
Total Return Index Comparison for a Hypothetical $10,000 Investment1
Total return represents the change in value of an investment over the periods shown. It includes any applicable maximum sales charge, Fund expenses, account fees and reinvested distributions. The unmanaged index includes reinvestment of any income or distributions. It differs from the Fund in composition and does not pay management fees or expenses. One cannot invest directly in an index.
franklintempleton.com Annual Report | 9
FRANKLIN GLOBAL GOVERNMENT BOND FUND
PERFORMANCE SUMMARY
Total Return Index Comparison for a Hypothetical $10,000 Investment1 (continued)
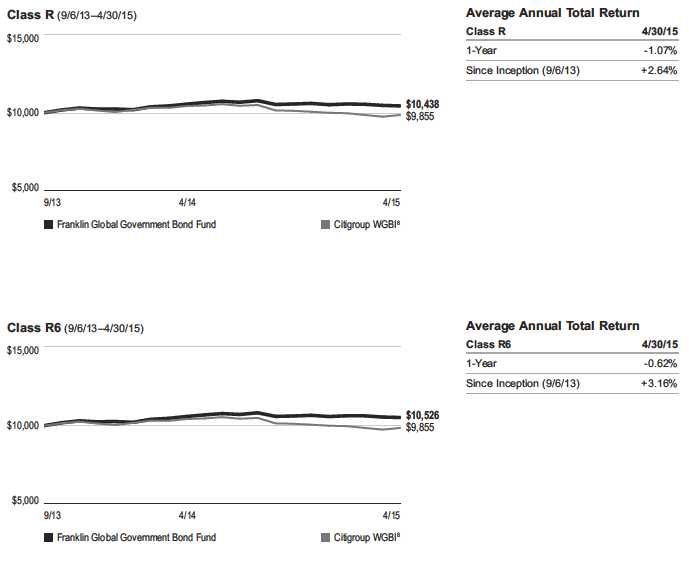
10 | Annual Report franklintempleton.com
FRANKLIN GLOBAL GOVERNMENT BOND FUND
PERFORMANCE SUMMARY
Total Return Index Comparison for a Hypothetical $10,000 Investment1 (continued)
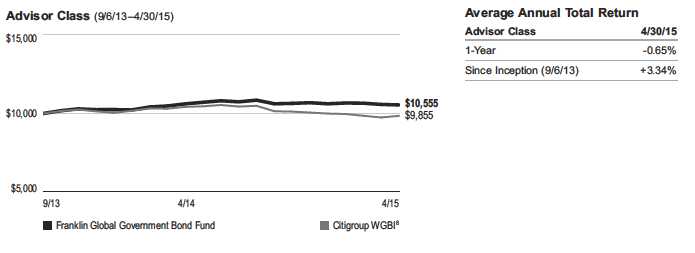
All investments involve risks, including possible loss of principal. Special risks are associated with investing in foreign securities, including risks associated with political and economic developments, trading practices, availability of information, limited markets and currency exchange rate fluctuations and policies. Sovereign debt securities are subject to various risks in addition to those relating to debt securities and foreign securities generally, including, but not limited to, the risk that a governmental entity may be unwilling or unable to pay interest and repay principal on its sovereign debt. Investments in emerging market countries are subject to all of the risks of foreign investing generally and have additional heightened risks due to a lack of established legal, political, business and social frameworks to support securities markets. Changes in interest rates will affect the value of the Fund’s portfolio and its share price and yield. Bond prices generally move in the opposite direction of interest rates. Thus, as prices of bonds in the Fund adjust to a rise in interest rates, the Fund’s share price may decline. Changes in the financial strength of a bond issuer or in a bond’s credit rating may affect its value. The market values of securities owned by the Fund will go up or down, sometimes rapidly or unpredictably. Derivatives, including currency management strategies, involve costs and can create economic leverage in the portfolio that may result in significant volatility and cause the Fund to participate in losses (as well as gains) in an amount that exceeds the Fund’s initial investment. The Fund may not achieve the anticipated benefits and may realize losses when a counterparty fails to perform as promised. The Fund is also non-diversified, which involves the risk of greater price fluctuation than a more diversified portfolio. The Fund is actively managed but there is no guarantee that the manager’s investment decisions will produce the desired results. The Fund’s prospectus also includes a description of the main investment risks.
| Class C: | These shares have higher annual fees and expenses than Class A shares. |
| Class R: | Shares are available to certain eligible investors as described in the prospectus. These shares have higher annual fees and expenses than Class A shares. |
| Class R6: | Shares are available to certain eligible investors as described in the prospectus. |
| Advisor Class: | Shares are available to certain eligible investors as described in the prospectus. |
1. The Fund has an expense reduction contractually guaranteed through at least 8/31/15 and a fee waiver associated with its investments in a Franklin Templeton money
fund, contractually guaranteed through at least its current fiscal year-end. Fund investment results reflect the expense reduction and fee waiver, to the extent applicable;
without these reductions, the results would have been lower.
2. Cumulative total return represents the change in value of an investment over the periods indicated.
3. Average annual total return represents the average annual change in value of an investment over the periods indicated.
4. In accordance with SEC rules, we provide standardized average annual total return information through the latest calendar quarter.
5. Figures are as stated in the Fund’s current prospectus. In periods of market volatility, assets may decline significantly, causing total annual Fund operating expenses to
become higher than the figures shown.
6. Distribution rate is based on an annualization of the respective class’s April dividend and the maximum offering price (NAV for Classes C, R, R6 and Advisor) per share
on 4/30/15.
7. The 30-day standardized yield for the 30 days ended 4/30/15 reflects an estimated yield to maturity (assuming all portfolio securities are held to maturity). It should be
regarded as an estimate of the Fund’s rate of investment income, and it may not equal the Fund’s actual income distribution rate (which reflects the Fund’s past dividends
paid to shareholders) or the income reported in the Fund’s financial statements.
8. Source: Morningstar. The Citigroup WGBI is a market capitalization-weighted index consisting of investment-grade world government bond markets.
See www.franklintempletondatasources.com for additional data provider information.
franklintempleton.com
Annual Report
| 11
FRANKLIN GLOBAL GOVERNMENT BOND FUND
Your Fund’s Expenses
As a Fund shareholder, you can incur two types of costs:
- Transaction costs, including sales charges (loads) on Fund purchases; and
- Ongoing Fund costs, including management fees, distribu- tion and service (12b-1) fees, and other Fund expenses. All mutual funds have ongoing costs, sometimes referred to as operating expenses.
The following table shows ongoing costs of investing in the Fund and can help you understand these costs and compare them with those of other mutual funds. The table assumes a $1,000 investment held for the six months indicated.
Actual Fund Expenses
The first line (Actual) for each share class listed in the table provides actual account values and expenses. The “Ending Account Value” is derived from the Fund’s actual return, which includes the effect of Fund expenses.
You can estimate the expenses you paid during the period by following these steps. Of course, your account value and expenses will differ from those in this illustration:
| 1. | Divide your account value by $1,000. |
| If an account had an $8,600 value, then $8,600 ÷ $1,000 = 8.6. | |
| 2. | Multiply the result by the number under the heading “Expenses Paid During Period.” |
| If Expenses Paid During Period were $7.50, then 8.6 x $7.50 = $64.50. |
In this illustration, the estimated expenses paid this period are $64.50.
Hypothetical Example for Comparison with Other Funds
Information in the second line (Hypothetical) for each class in the table can help you compare ongoing costs of investing in the Fund with those of other mutual funds. This information may not be used to estimate the actual ending account balance or expenses you paid during the period. The hypothetical “Ending Account Value” is based on the actual expense ratio for each class and an assumed 5% annual rate of return before expenses, which does not represent the Fund’s actual return. The figure under the heading “Expenses Paid During Period” shows the hypothetical expenses your account would have incurred under this scenario. You can compare this figure with the 5% hypothetical examples that appear in shareholder reports of other funds.
Please note that expenses shown in the table are meant to highlight ongoing costs and do not reflect any transaction costs, such as sales charges. Therefore, the second line for each class is useful in comparing ongoing costs only, and will not help you compare total costs of owning different funds. In addition, if transaction costs were included, your total costs would have been higher. Please refer to the Fund prospectus for additional information on operating expenses.
12 | Annual Report
franklintempleton.com
FRANKLIN GLOBAL GOVERNMENT BOND FUND
YOUR FUND’S EXPENSES
| Beginning Account | Ending Account | Expenses Paid During | ||||
| Share Class | Value 11/1/14 | Value 4/30/15 | Period* 11/1/14–4/30/15 | |||
| A | ||||||
| Actual | $ | 1,000 | $ | 990.60 | $ | 3.36 |
| Hypothetical (5% return before expenses) | $ | 1,000 | $ | 1,021.42 | $ | 3.41 |
| C | ||||||
| Actual | $ | 1,000 | $ | 987.50 | $ | 6.16 |
| Hypothetical (5% return before expenses) | $ | 1,000 | $ | 1,018.60 | $ | 6.26 |
| R | ||||||
| Actual | $ | 1,000 | $ | 988.20 | $ | 5.42 |
| Hypothetical (5% return before expenses) | $ | 1,000 | $ | 1,019.34 | $ | 5.51 |
| R6 | ||||||
| Actual | $ | 1,000 | $ | 990.80 | $ | 2.96 |
| Hypothetical (5% return before expenses) | $ | 1,000 | $ | 1,021.82 | $ | 3.01 |
| Advisor | ||||||
| Actual | $ | 1,000 | $ | 990.70 | $ | 2.96 |
| Hypothetical (5% return before expenses) | $ | 1,000 | $ | 1,021.82 | $ | 3.01 |
*Expenses are calculated using the most recent six-month expense ratio, net of expense waivers, annualized for each class (A: 0.68%;
C: 1.25%; R: 1.10%; R6: 0.60%; and Advisor: 0.60%), multiplied by the average account value over the period, multiplied by 181/365
to reflect the one-half year period.
franklintempleton.com
Annual Report
| 13
| FRANKLIN STRATEGIC SERIES | ||||||
| Financial Highlights | ||||||
| Franklin Global Government Bond Fund | ||||||
| Year Ended | ||||||
| April 30, | ||||||
| 2015 | 2014 | a | ||||
| Class A | ||||||
| Per share operating performance | ||||||
| (for a share outstanding throughout the year) | ||||||
| Net asset value, beginning of year | $ | 10.45 | $ | 10.00 | ||
| Income from investment operationsb: | ||||||
| Net investment incomec | 0.17 | 0.11 | ||||
| Net realized and unrealized gains (losses) | (0.24 | ) | 0.47 | |||
| Total from investment operations | (0.07 | ) | 0.58 | |||
| Less distributions from: | ||||||
| Net investment income and net realized foreign currency gains | (0.40 | ) | (0.13 | ) | ||
| Net realized gains | (0.17 | ) | — | |||
| Total distributions | (0.57 | ) | (0.13 | ) | ||
| Net asset value, end of year | $ | 9.81 | $ | 10.45 | ||
| Total returnd | (0.64 | )% | 5.81 | % | ||
| Ratios to average net assetse | ||||||
| Expenses before waiver and payments by affiliates | 2.37 | % | 3.22 | % | ||
| Expenses net of waiver and payments by affiliates | 0.64 | % | 0.57 | % | ||
| Net investment income | 1.63 | % | 1.62 | % | ||
| Supplemental data | ||||||
| Net assets, end of year (000’s) | $ | 11,487 | $ | 11,232 | ||
| Portfolio turnover rate | 60.28 | % | 13.24 | % | ||
aFor the period September 6, 2013 (commencement of operations) to April 30, 2014.
bThe amount shown for a share outstanding throughout the period may not correlate with the Statement of Operations for the period due to the timing of sales and
repurchases of the Fund shares in relation to income earned and/or fluctuating fair value of the investments of the Fund.
cBased on average daily shares outstanding.
dTotal return does not reflect sales commissions or contingent deferred sales charges, if applicable, and is not annualized for periods less than one year.
eRatios are annualized for periods less than one year.
14 | Annual Report | The accompanying notes are an integral part of these financial statements. franklintempleton.com
| FRANKLIN STRATEGIC SERIES |
| FINANCIAL HIGHLIGHTS |
| Franklin Global Government Bond Fund (continued) | ||||||
| Year Ended | ||||||
| April 30, | ||||||
| 2015 | 2014 | a | ||||
| Class C | ||||||
| Per share operating performance | ||||||
| (for a share outstanding throughout the year) | ||||||
| Net asset value, beginning of year | $ | 10.44 | $ | 10.00 | ||
| Income from investment operationsb: | ||||||
| Net investment incomec | 0.10 | 0.08 | ||||
| Net realized and unrealized gains (losses) | (0.24 | ) | 0.46 | |||
| Total from investment operations | (0.14 | ) | 0.54 | |||
| Less distributions from: | ||||||
| Net investment income and net realized foreign currency gains | (0.34 | ) | (0.10 | ) | ||
| Net realized gains | (0.17 | ) | — | |||
| Total distributions | (0.51 | ) | (0.10 | ) | ||
| Net asset value, end of year | $ | 9.79 | $ | 10.44 | ||
| Total returnd | (1.34 | )% | 5.46 | % | ||
| Ratios to average net assetse | ||||||
| Expenses before waiver and payments by affiliates | 2.95 | % | 3.81 | % | ||
| Expenses net of waiver and payments by affiliates | 1.22 | % | 1.16 | % | ||
| Net investment income | 1.05 | % | 1.03 | % | ||
| Supplemental data | ||||||
| Net assets, end of year (000’s) | $ | 292 | $ | 156 | ||
| Portfolio turnover rate | 60.28 | % | 13.24 | % | ||
aFor the period September 6, 2013 (commencement of operations) to April 30, 2014.
bThe amount shown for a share outstanding throughout the period may not correlate with the Statement of Operations for the period due to the timing of sales and
repurchases of the Fund shares in relation to income earned and/or fluctuating fair value of the investments of the Fund.
cBased on average daily shares outstanding.
dTotal return does not reflect sales commissions or contingent deferred sales charges, if applicable, and is not annualized for periods less than one year.
eRatios are annualized for periods less than one year.
franklintempleton.com The accompanying notes are an integral part of these financial statements. | Annual Report | 15
FRANKLIN STRATEGIC SERIES
FINANCIAL HIGHLIGHTS
| Franklin Global Government Bond Fund (continued) | ||||||
| Year Ended | ||||||
| April 30, | ||||||
| 2015 | 2014 | a | ||||
| Class R | ||||||
| Per share operating performance | ||||||
| (for a share outstanding throughout the year) | ||||||
| Net asset value, beginning of year | $ | 10.44 | $ | 10.00 | ||
| Income from investment operationsb: | ||||||
| Net investment incomec | 0.12 | 0.08 | ||||
| Net realized and unrealized gains (losses) | (0.23 | ) | 0.47 | |||
| Total from investment operations | (0.11 | ) | 0.55 | |||
| Less distributions from: | ||||||
| Net investment income and net realized foreign currency gains | (0.36 | ) | (0.11 | ) | ||
| Net realized gains | (0.17 | ) | — | |||
| Total distributions | (0.53 | ) | (0.11 | ) | ||
| Net asset value, end of year | $ | 9.80 | $ | 10.44 | ||
| Total returnd | (1.07 | )% | 5.52 | % | ||
| Ratios to average net assetse | ||||||
| Expenses before waiver and payments by affiliates | 2.82 | % | 3.66 | % | ||
| Expenses net of waiver and payments by affiliates | 1.09 | % | 1.01 | % | ||
| Net investment income | 1.18 | % | 1.18 | % | ||
| Supplemental data | ||||||
| Net assets, end of year (000’s) | $ | 10 | $ | 10 | ||
| Portfolio turnover rate | 60.28 | % | 13.24 | % | ||
aFor the period September 6, 2013 (commencement of operations) to April 30, 2014.
bThe amount shown for a share outstanding throughout the period may not correlate with the Statement of Operations for the period due to the timing of sales and
repurchases of the Fund shares in relation to income earned and/or fluctuating fair value of the investments of the Fund.
cBased on average daily shares outstanding.
dTotal return is not annualized for periods less than one year.
eRatios are annualized for periods less than one year.
16 | Annual Report | The accompanying notes are an integral part of these financial statements. franklintempleton.com
| FRANKLIN STRATEGIC SERIES |
| FINANCIAL HIGHLIGHTS |
| Franklin Global Government Bond Fund (continued) | ||||||
| Year Ended | ||||||
| April 30, | ||||||
| 2015 | 2014 | a | ||||
| Class R6 | ||||||
| Per share operating performance | ||||||
| (for a share outstanding throughout the year) | ||||||
| Net asset value, beginning of year | $ | 10.45 | $ | 10.00 | ||
| Income from investment operationsb: | ||||||
| Net investment incomec | 0.18 | 0.11 | ||||
| Net realized and unrealized gains (losses) | (0.24 | ) | 0.48 | |||
| Total from investment operations | (0.06 | ) | 0.59 | |||
| Less distributions from: | ||||||
| Net investment income and net realized foreign currency gains | (0.41 | ) | (0.14 | ) | ||
| Net realized gains | (0.17 | ) | — | |||
| Total distributions | (0.58 | ) | (0.14 | ) | ||
| Net asset value, end of year | $ | 9.81 | $ | 10.45 | ||
| Total returnd | (0.62 | )% | 5.91 | % | ||
| Ratios to average net assetse | ||||||
| Expenses before waiver and payments by affiliates | 3.04 | % | 3.78 | % | ||
| Expenses net of waiver and payments by affiliates | 0.57 | % | 0.51 | % | ||
| Net investment income | 1.70 | % | 1.68 | % | ||
| Supplemental data | ||||||
| Net assets, end of year (000’s) | $ | 10 | $ | 10 | ||
| Portfolio turnover rate | 60.28 | % | 13.24 | % | ||
aFor the period September 6, 2013 (commencement of operations) to April 30, 2014.
bThe amount shown for a share outstanding throughout the period may not correlate with the Statement of Operations for the period due to the timing of sales and
repurchases of the Fund shares in relation to income earned and/or fluctuating fair value of the investments of the Fund.
cBased on average daily shares outstanding.
dTotal return is not annualized for periods less than one year.
eRatios are annualized for periods less than one year.
franklintempleton.com The accompanying notes are an integral part of these financial statements. | Annual Report | 17
FRANKLIN STRATEGIC SERIES
FINANCIAL HIGHLIGHTS
| Franklin Global Government Bond Fund (continued) | ||||||
| Year Ended | ||||||
| April 30, | ||||||
| 2015 | 2014 | a | ||||
| Advisor Class | ||||||
| Per share operating performance | ||||||
| (for a share outstanding throughout the year) | ||||||
| Net asset value, beginning of year | $ | 10.49 | $ | 10.00 | ||
| Income from investment operationsb: | ||||||
| Net investment incomec | 0.17 | 0.10 | ||||
| Net realized and unrealized gains (losses) | (0.24 | ) | 0.52 | |||
| Total from investment operations | (0.07 | ) | 0.62 | |||
| Less distributions from: | ||||||
| Net investment income and net realized foreign currency gains | (0.42 | ) | (0.13 | ) | ||
| Net realized gains | (0.17 | ) | — | |||
| Total distributions | (0.59 | ) | (0.13 | ) | ||
| Net asset value, end of year | $ | 9.83 | $ | 10.49 | ||
| Total returnd | (0.65 | )% | 6.24 | % | ||
| Ratios to average net assetse | ||||||
| Expenses before waiver and payments by affiliates | 2.30 | % | 3.16 | % | ||
| Expenses net of waiver and payments by affiliates | 0.57 | % | 0.51 | % | ||
| Net investment income | 1.70 | % | 1.68 | % | ||
| Supplemental data | ||||||
| Net assets, end of year (000’s) | $ | 10 | $ | 10 | ||
| Portfolio turnover rate | 60.28 | % | 13.24 | % | ||
aFor the period September 6, 2013 (commencement of operations) to April 30, 2014.
bThe amount shown for a share outstanding throughout the period may not correlate with the Statement of Operations for the period due to the timing of sales and
repurchases of the Fund shares in relation to income earned and/or fluctuating fair value of the investments of the Fund.
cBased on average daily shares outstanding.
dTotal return is not annualized for periods less than one year.
eRatios are annualized for periods less than one year.
18 | Annual Report | The accompanying notes are an integral part of these financial statements. franklintempleton.com
FRANKLIN STRATEGIC SERIES
| Statement of Investments, April 30, 2015 | |||||
| Franklin Global Government Bond Fund | |||||
| Principal | |||||
| Country | Amount* | Value | |||
| Foreign Government and Agency Securities 67.8% | |||||
| Government of Canada, 2.75%, 6/01/22 | Canada | 300,000 | CAD | $ | 273,541 |
| Government of Chile, 3.875%, 8/05/20 | Chile | 100,000 | 110,158 | ||
| aGovernment of Finland, senior bond, Reg S, 2.00%, 4/15/24 | Finland | 350,000 | EUR | 447,346 | |
| Government of France, | |||||
| 2.25%, 5/25/24 | France | 150,000 | EUR | 193,771 | |
| 1.75%, 11/25/24 | France | 290,000 | EUR | 360,230 | |
| Government of Germany, 1.50%, 2/15/23 | Germany | 375,000 | EUR | 462,574 | |
| aGovernment of Indonesia, Reg S, 4.875%, 5/05/21 | Indonesia | 200,000 | 218,273 | ||
| aGovernment of Lithuania, senior note, Reg S, 6.625%, 2/01/22 | Lithuania | 200,000 | 246,661 | ||
| Government of Malaysia, | |||||
| 3.197%, 10/15/15 | Malaysia | 800,000 | MYR | 224,653 | |
| senior bond, 4.24%, 2/07/18 | Malaysia | 650,000 | MYR | 186,915 | |
| senior note, 3.654%, 10/31/19 | Malaysia | 550,000 | MYR | 155,448 | |
| Government of Mexico, | |||||
| 7.75%, 12/14/17 | Mexico | 30,000b MXN | 211,571 | ||
| 8.00%, 12/07/23 | Mexico | 30,000b MXN | 223,560 | ||
| senior bond, 5.95%, 3/19/19 | Mexico | 100,000 | 114,231 | ||
| Government of Peru, senior bond, 6.55%, 3/14/37 | Peru | 200,000 | 265,919 | ||
| Government of Poland, | |||||
| 4.00%, 10/25/23 | Poland | 650,000 | PLN | 200,515 | |
| 3.25%, 7/25/25 | Poland | 900,000 | PLN | 263,633 | |
| 5.75%, 4/25/29 | Poland | 800,000 | PLN | 297,874 | |
| Government of Singapore, 2.375%, 4/01/17 | Singapore | 350,000 | SGD | 271,040 | |
| aGovernment of Spain, senior note, Reg S, 5.15%, 10/31/28 | Spain | 200,000 | EUR | 310,555 | |
| aGovernment of the Netherlands, Reg S, 2.50%, 1/15/33 | Netherlands | 120,000 | EUR | 173,571 | |
| Italy Treasury Bond, | |||||
| aReg S, 3.50%, 3/01/30 | Italy | 400,000 | EUR | 538,135 | |
| senior bond, 5.50%, 9/01/22 | Italy | 250,000 | EUR | 365,347 | |
| asenior bond, Reg S, 5.00%, 8/01/34 | Italy | 300,000 | EUR | 481,731 | |
| aQueensland Treasury Corp., | |||||
| senior bond, Reg S, 5.75%, 7/22/24 | Australia | 350,000 | AUD | 335,146 | |
| senior note, Reg S, 6.00%, 7/21/22 | Australia | 300,000 | AUD | 285,736 | |
| aUnited Kingdom Treasury Bond, Reg S, 4.00%, 9/07/16 | United Kingdom | 300,000 | GBP | 482,774 | |
| aUnited Kingdom Treasury Note, Reg S, 2.00%, 7/22/20 | United Kingdom | 195,000 | GBP | 308,352 | |
| Total Foreign Government and Agency Securities | |||||
| (Cost $8,291,425) | 8,009,260 | ||||
| U.S. Government and Agency Securities 27.1% | |||||
| U.S. Treasury Bond, | |||||
| 4.375%, 11/15/39 | United States | 500,000 | 651,758 | ||
| cIndex Linked, 3.375%, 4/15/32 | United States | 158,662 | 233,321 | ||
| U.S. Treasury Note, | |||||
| 0.375%, 1/15/16 | United States | 200,000 | 200,281 | ||
| 1.00%, 8/31/16 | United States | 600,000 | 604,781 | ||
| 1.875%, 8/31/17 | United States | 500,000 | 513,477 | ||
| 2.625%, 11/15/20 | United States | 600,000 | 633,375 | ||
franklintempleton.com Annual Report | 19
FRANKLIN STRATEGIC SERIES
STATEMENT OF INVESTMENTS
| Franklin Global Government Bond Fund (continued) | |||||
| Principal | |||||
| Country | Amount* | Value | |||
| U.S. Government and Agency Securities (continued) | |||||
| U.S. Treasury Note, (continued) | |||||
| cIndex Linked, 2.00%, 1/15/16 | United States | 177,366 | $ | 181,842 | |
| cIndex Linked, 1.25%, 7/15/20 | United States | 161,420 | 175,796 | ||
| Total U.S. Government and Agency Securities | |||||
| (Cost $3,123,293) | 3,194,631 | ||||
| Total Investments before Short Term Investments | |||||
| (Cost $11,414,718) | 11,203,891 | ||||
| Short Term Investments 5.2% | |||||
| U.S. Government and Agency Securities (Cost $400,697) 3.4% | |||||
| U.S. Treasury Note, 2.125%, 5/31/15 | United States | 400,000 | 400,703 | ||
| Total Investments before Money Market Funds | |||||
| (Cost $11,815,415) | 11,604,594 | ||||
| Shares | |||||
| Money Market Funds (Cost $221,129) 1.8% | |||||
| d,eInstitutional Fiduciary Trust Money Market Portfolio | United States | 221,129 | 221,129 | ||
| Total Investments (Cost $12,036,544) 100.1% | 11,825,723 | ||||
| Other Assets, less Liabilities (0.1)% | (17,406 | ) | |||
| Net Assets 100.0% | $ | 11,808,317 | |||
*The principal amount is stated in U.S. dollars unless otherwise indicated.
aSecurity was purchased pursuant to Regulation S under the Securities Act of 1933, which exempts from registration securities offered and sold outside of the United States
Such a security cannot be sold in the United States without either an effective registration statement filed pursuant to the Securities Act of 1933, or pursuant to an exemption
from registration. These securities have been deemed liquid under guidelines approved by the Trust’s Board of Trustees. At April 30, 2015, the aggregate value of these
securities was $3,828,280, representing 32.42% of net assets.
bPrincipal amount is stated in 100 Mexican Peso Units.
cPrincipal amount of security is adjusted for inflation. See Note 1(e).
dNon-income producing.
eSee Note 3(f) regarding investments in Institutional Fiduciary Trust Money Market Portfolio.
| At April 30, 2015, the Fund had the following forward exchange contracts outstanding. See Note 1(c). | |||||||||||
| Forward Exchange Contracts | |||||||||||
| Contract | Settlement | Unrealized | Unrealized | ||||||||
| Currency | Counterpartya | Type | Quantity | Amount | Date | Appreciation | Depreciation | ||||
| Australian Dollar | BZWS | Sell | 760,000 | $ | 592,906 | 6/09/15 | $ | — | $ | (7,149 | ) |
| British Pound | RBCCM | Sell | 520,000 | 767,480 | 6/09/15 | — | (30,959 | ) | |||
| Euro | CITI | Sell | 1,120,000 | 1,248,520 | 6/09/15 | — | (8,847 | ) | |||
| Malaysian Ringgit | BZWS | Sell | 2,000,000 | 542,962 | 6/09/15 | — | (16,855 | ) | |||
| Polish Zloty | BZWS | Sell | 2,900,000 | 771,174 | 6/09/15 | — | (32,685 | ) | |||
| Net unrealized appreciation (depreciation) | $ | (96,495 | ) | ||||||||
| aMay be comprised of multiple contracts with the same counterparty, currency and settlement date. | |||||||||||
| See Abbreviations on page 33. | |||||||||||
20 | Annual Report | The accompanying notes are an integral part of these financial statements. franklintempleton.com
FRANKLIN STRATEGIC SERIES
Financial Statements
Statement of Assets and Liabilities
April 30, 2015
| Franklin Global Government Bond Fund | |||
| Assets: | |||
| Investments in securities: | |||
| Cost - Unaffiliated issuers | $ | 11,815,415 | |
| Cost - Sweep Money Fund (Note 3f) | 221,129 | ||
| Total cost of investments | $ | 12,036,544 | |
| Value - Unaffiliated issuers | $ | 11,604,594 | |
| Value - Sweep Money Fund (Note 3f) | 221,129 | ||
| Total value of investments | 11,825,723 | ||
| Foreign currency, at value (cost $15,354) | 15,589 | ||
| Receivables: | |||
| Capital shares sold | 18 | ||
| Interest | 99,700 | ||
| Other assets | 7 | ||
| Total assets | 11,941,037 | ||
| Liabilities: | |||
| Payables: | |||
| Distribution fees | 932 | ||
| Affiliates | 25,858 | ||
| Unrealized depreciation on forward exchange contracts | 96,495 | ||
| Accrued expenses and other liabilities | 9,435 | ||
| Total liabilities | 132,720 | ||
| Net assets, at value | $ | 11,808,317 | |
| Net assets consist of: | |||
| Paid-in capital | $ | 12,082,710 | |
| Undistributed net investment income | 37,696 | ||
| Net unrealized appreciation (depreciation) | (307,163 | ) | |
| Accumulated net realized gain (loss) | (4,926 | ) | |
| Net assets, at value | $ | 11,808,317 | |
franklintempleton.com
The accompanying notes are an integral part of these financial statements. | Annual Report | 21
FRANKLIN STRATEGIC SERIES
FINANCIAL STATEMENTS
| Statement of Assets and Liabilities (continued) | ||
| April 30, 2015 | ||
| Class A: | ||
| Net assets, at value | $ | 11,487,278 |
| Shares outstanding | 1,171,305 | |
| Net asset value per sharea | $ | 9.81 |
| Maximum offering price per share (net asset value per share ÷ 95.75%) | $ | 10.25 |
| Class C: | ||
| Net assets, at value | $ | 291,604 |
| Shares outstanding | 29,778 | |
| Net asset value and maximum offering price per sharea | $ | 9.79 |
| Class R: | ||
| Net assets, at value | $ | 9,795 |
| Shares outstanding | 1,000 | |
| Net asset value and maximum offering price per share | $ | 9.80 |
| Class R6: | ||
| Net assets, at value | $ | 9,809 |
| Shares outstanding | 1,000 | |
| Net asset value and maximum offering price per share | $ | 9.81 |
| Advisor Class: | ||
| Net assets, at value | $ | 9,831 |
| Shares outstanding | 1,000 | |
| Net asset value and maximum offering price per share | $ | 9.83 |
aRedemption price is equal to net asset value less contingent deferred sales charges, if applicable.
22 | Annual Report | The accompanying notes are an integral part of these financial statements. franklintempleton.com
| FRANKLIN STRATEGIC SERIES |
| FINANCIAL STATEMENTS |
Statement of Operations
for the year ended April 30, 2015
| Franklin Global Government Bond Fund | |||
| Investment income: | |||
| Interest | $ | 274,134 | |
| Expenses: | |||
| Management fees (Note 3a) | 78,411 | ||
| Distribution fees: (Note 3c) | |||
| Class A | 8,278 | ||
| Class C | 1,561 | ||
| Class R | 53 | ||
| Transfer agent fees: (Note 3e) | |||
| Class A | 2,901 | ||
| Class C | 59 | ||
| Class R | 3 | ||
| Class R6 | 78 | ||
| Advisor Class | 3 | ||
| Custodian fees (Note 4) | 2,696 | ||
| Reports to shareholders | 13,102 | ||
| Registration and filing fees | 65,515 | ||
| Professional fees | 55,216 | ||
| Amortization of offering costs | 58,771 | ||
| Other | 996 | ||
| Total expenses | 287,643 | ||
| Expenses waived/paid by affiliates (Note 3g) | (208,788 | ) | |
| Net expenses | 78,855 | ||
| Net investment income | 195,279 | ||
| Realized and unrealized gains (losses): | |||
| Net realized gain (loss) from: | |||
| Investments | 159,743 | ||
| Foreign currency transactions | 363,958 | ||
| Net realized gain (loss) | 523,701 | ||
| Net change in unrealized appreciation (depreciation) on: | |||
| Investments | (745,463 | ) | |
| Translation of other assets and liabilities denominated in foreign currencies | (71,279 | ) | |
| Net change in unrealized appreciation (depreciation) | (816,742 | ) | |
| Net realized and unrealized gain (loss) | (293,041 | ) | |
| Net increase (decrease) in net assets resulting from operations | $ | (97,762 | ) |
franklintempleton.com
The accompanying notes are an integral part of these financial statements. | Annual Report | 23
| FRANKLIN STRATEGIC SERIES | ||||||
| FINANCIAL STATEMENTS | ||||||
| Statements of Changes in Net Assets | ||||||
| Franklin Global Government Bond Fund | ||||||
| Year Ended April 30, | ||||||
| 2015 | 2014 | a | ||||
| Increase (decrease) in net assets: | ||||||
| Operations: | ||||||
| Net investment income | $ | 195,279 | $ | 111,150 | ||
| Net realized gain (loss) from investments and foreign currency transactions | 523,701 | (11,529 | ) | |||
| Net change in unrealized appreciation (depreciation) on investments and translation of other assets and | ||||||
| liabilities denominated in foreign currencies | (816,742 | ) | 509,579 | |||
| Net increase (decrease) in net assets resulting from operations | (97,762 | ) | 609,200 | |||
| Distributions to shareholders from: | ||||||
| Net investment income and net realized foreign currency gains: | ||||||
| Class A | (471,147 | ) | (132,443 | ) | ||
| Class C | (8,576 | ) | (625 | ) | ||
| Class R | (360 | ) | (109 | ) | ||
| Class R6 | (406 | ) | (138 | ) | ||
| Advisor Class | (433 | ) | (454 | ) | ||
| Net realized gains: | ||||||
| Class A | (208,054 | ) | — | |||
| Class C | (5,007 | ) | — | |||
| Class R | (174 | ) | — | |||
| Class R6 | (174 | ) | — | |||
| Advisor Class | (174 | ) | — | |||
| Total distributions to shareholders | (694,505 | ) | (133,769 | ) | ||
| Capital share transactions: (Note 2) | ||||||
| Class A | 1,027,141 | 10,760,752 | ||||
| Class C | 154,015 | 152,968 | ||||
| Class R | — | 10,000 | ||||
| Class R6 | — | 10,000 | ||||
| Advisor Class | 30 | 10,247 | ||||
| Total capital share transactions | 1,181,186 | 10,943,967 | ||||
| Net increase (decrease) in net assets | 388,919 | 11,419,398 | ||||
| Net assets: | ||||||
| Beginning of year | 11,419,398 | — | ||||
| End of year | $ | 11,808,317 | $ | 11,419,398 | ||
| Undistributed net investment income (distributions in excess of net investment income) included in | ||||||
| net assets: | ||||||
| End of year | $ | 37,696 | $ | (9,958 | ) | |
aFor the period September 6, 2013 (commencement of operations) to April 30, 2014.
24 | Annual Report | The accompanying notes are an integral part of these financial statements. franklintempleton.com
FRANKLIN STRATEGIC SERIES
Notes to Financial Statements
Franklin Global Government Bond Fund
1. Organization and Significant Accounting Policies
Franklin Strategic Series (Trust) is registered under the Investment Company Act of 1940, as amended, (1940 Act) as an open-end management investment company, consisting of nine separate funds and applies the specialized accounting and reporting guidance in U.S. Generally Accepted Accounting Principles (U.S. GAAP). Franklin Global Government Bond Fund (Fund) is included in this report. The financial statements of the remaining funds in the Trust are presented separately. The Fund offers five classes of shares: Class A, Class C, Class R, Class R6, and Advisor Class. Each class of shares differs by its initial sales load, contingent deferred sales charges, voting rights on matters affecting a single class, its exchange privilege and fees primarily due to differing arrangements for distribution and transfer agent fees.
The following summarizes the Fund’s significant accounting policies.
a. Financial Instrument Valuation
The Fund’s investments in financial instruments are carried at fair value daily. Fair value is the price that would be received to sell an asset or paid to transfer a liability in an orderly transaction between market participants on the measurement date. The Fund calculates the net asset value (NAV) per share at the close of the New York Stock Exchange (NYSE), generally at 4 p.m. Eastern time (NYSE close) on each day the NYSE is open for trading. Under compliance policies and procedures approved by the Trust’s Board of Trustees (the Board), the Fund’s administrator has responsibility for oversight of valuation, including leading the cross-functional Valuation and Liquidity Oversight Committee (VLOC). The VLOC provides administration and oversight of the Fund’s valuation policies and procedures, which are approved annually by the Board. Among other things, these procedures allow the Fund to utilize independent pricing services, quotations from securities and financial instrument dealers, and other market sources to determine fair value.
Debt securities generally trade in the over-the-counter (OTC) market rather than on a securities exchange. The Fund’s pricing services use multiple valuation techniques to determine fair value. In instances where sufficient market activity exists, the pricing services may utilize a market-based approach through which quotes from market makers are used to determine fair value. In instances where sufficient market activity may not exist or is limited, the pricing services also utilize proprietary valuation models which may consider market characteristics such as benchmark yield curves, credit spreads, estimated default rates, anticipated market interest rate volatility, coupon rates, anticipated timing of principal repayments, underlying collateral, and other unique security features in order to estimate the relevant cash flows, which are then discounted to calculate the fair value. Securities denominated in a foreign currency are converted into their U.S. dollar equivalent at the foreign exchange rate in effect at the NYSE close on the date that the values of the foreign debt securities are determined. Investments in open-end mutual funds are valued at the closing NAV.
Certain derivative financial instruments (derivatives) trade in the OTC market. The Fund’s pricing services use various techniques including industry standard option pricing models and proprietary discounted cash flow models to determine the fair value of those instruments. The Fund’s net benefit or obligation under the derivative contract, as measured by the fair value of the contract, is included in net assets.
The Fund has procedures to determine the fair value of financial instruments for which market prices are not reliable or readily available. Under these procedures, the VLOC convenes on a regular basis to review such financial instruments and considers a number of factors, including significant unobservable valuation inputs, when arriving at fair value. The VLOC primarily employs a market-based approach which may use related or comparable assets or liabilities, recent transactions, market multiples, book values, and other relevant information for the investment to determine the fair value of the investment. An income-based valuation approach may also be used in which the anticipated future cash flows of the investment are discounted to calculate fair value. Discounts may also be applied due to the nature or duration of any restrictions on the disposition of the investments. Due to the inherent uncertainty of valuations of such investments, the fair values may differ significantly from the values that would have been used had an active market existed. The VLOC employs various methods for calibrating these valuation approaches including a regular review of key inputs and assumptions, transactional back-testing or disposition analysis, and reviews of any related market activity.
Trading in securities on foreign securities stock exchanges and OTC markets may be completed before the daily NYSE close. In addition, trading in certain foreign markets may not take place on every NYSE business day. Occasionally, events occur
franklintempleton.com
Annual Report
| 25
FRANKLIN STRATEGIC SERIES
NOTES TO FINANCIAL STATEMENTS
Franklin Global Government Bond Fund (continued)
1. Organization and Significant Accounting
Policies (continued)
a. Financial Instrument Valuation (continued)
between the time at which trading in a foreign security is completed and the close of the NYSE that might call into question the reliability of the value of a portfolio security held by the Fund. As a result, differences may arise between the value of the Fund’s portfolio securities as determined at the foreign market close and the latest indications of value at the close of the NYSE. In order to minimize the potential for these differences, the VLOC monitors price movements following the close of trading in foreign stock markets through a series of country specific market proxies (such as baskets of American Depositary Receipts, futures contracts and exchange traded funds). These price movements are measured against established trigger thresholds for each specific market proxy to assist in determining if an event has occurred that may call into question the reliability of the values of the foreign securities held by the Fund. If such an event occurs, the securities may be valued using fair value procedures, which may include the use of independent pricing services.
When the last day of the reporting period is a non-business day, certain foreign markets may be open on those days that the NYSE is closed, which could result in differences between the value of the Fund’s portfolio securities on the last business day and the last calendar day of the reporting period. Any significant security valuation changes due to an open foreign market are adjusted and reflected by the Fund for financial reporting purposes.
b. Foreign Currency Translation
Portfolio securities and other assets and liabilities denominated in foreign currencies are translated into U.S. dollars based on the exchange rate of such currencies against U.S. dollars on the date of valuation. The Fund may enter into foreign currency exchange contracts to facilitate transactions denominated in a foreign currency. Purchases and sales of securities, income and expense items denominated in foreign currencies are translated into U.S. dollars at the exchange rate in effect on the transaction date. Portfolio securities and assets and liabilities denominated in foreign currencies contain risks that those currencies will decline in value relative to the U.S. dollar. Occasionally, events may impact the availability or reliability of foreign exchange rates used to convert the U.S. dollar equivalent value. If such an event occurs, the foreign exchange rate will be valued at fair value using procedures established and approved by the Board.
The Fund does not separately report the effect of changes in foreign exchange rates from changes in market prices on securities held. Such changes are included in net realized and unrealized gain or loss from investments in the Statement of Operations.
Realized foreign exchange gains or losses arise from sales of foreign currencies, currency gains or losses realized between the trade and settlement dates on securities transactions and the difference between the recorded amounts of dividends, interest, and foreign withholding taxes and the U.S. dollar equivalent of the amounts actually received or paid. Net unrealized foreign exchange gains and losses arise from changes in foreign exchange rates on foreign denominated assets and liabilities other than investments in securities held at the end of the reporting period.
c. Derivative Financial Instruments
The Fund invested in derivatives in order to manage risk or gain exposure to various other investments or markets. Derivatives are financial contracts based on an underlying or notional amount, require no initial investment or an initial net investment that is smaller than would normally be required to have a similar response to changes in market factors, and require or permit net settlement. Derivatives contain various risks including the potential inability of the counterparty to fulfill their obligations under the terms of the contract, the potential for an illiquid secondary market, and/or the potential for market movements which expose the fund to gains or losses in excess of the amounts shown in the Statement of Assets and Liabilities. Realized gain and loss and unrealized appreciation and depreciation on these contracts for the period are included in the Statement of Operations.
Derivative counterparty credit risk is managed through a formal evaluation of the creditworthiness of all potential counterpar-ties. The Fund attempts to reduce its exposure to counterparty credit risk on OTC derivatives, whenever possible, by entering into International Swaps and Derivatives Association (ISDA) master agreements with certain counterparties. These agreements contain various provisions, including but not limited to collateral requirements, events of default, or early termination. Termination events applicable to the counterparty include certain deteriorations in the credit quality of the counterparty. Termination events applicable to the Fund include failure of
26 | Annual Report
franklintempleton.com
FRANKLIN STRATEGIC SERIES
NOTES TO FINANCIAL STATEMENTS
Franklin Global Government Bond Fund (continued)
the Fund to maintain certain net asset levels and/or limit the decline in net assets over various periods of time. In the event of default or early termination, the ISDA master agreement gives the non-defaulting party the right to net and close-out all transactions traded, whether or not arising under the ISDA agreement, to one net amount payable by one counterparty to the other. However, absent an event of default or early termination, OTC derivative assets and liabilities are presented gross and not offset in the Statement of Assets and Liabilities. Early termination by the counterparty may result in an immediate payment by the Fund of any net liability owed to that counter-party under the ISDA agreement. At April 30, 2015, the Fund had OTC derivatives in a net liability position for such contracts of $96,495.
Collateral requirements differ by type of derivative. Collateral terms are contract specific for OTC derivatives. For OTC derivatives traded under an ISDA master agreement, posting of collateral is required by either the fund or the applicable counterparty if the total net exposure of all OTC derivatives with the applicable counterparty exceeds the minimum transfer amount, which typically ranges from $100,000 to $250,000, and can vary depending on the counterparty and the type of the agreement. Generally, collateral is determined at the close of fund business each day and any additional collateral required due to changes in derivative values may be delivered by the fund or the counterparty within a few business days. Collateral pledged and/or received by the fund, if any, is held in segregated accounts with the fund’s custodian/counterparty broker and can be in the form of cash and/or securities. Unrestricted cash may be invested according to the Fund’s investment objectives.
The Fund entered into OTC forward exchange contracts primarily to manage exposure to certain foreign currencies. A forward exchange contract is an agreement between the Fund and a counterparty to buy or sell a foreign currency at a specific exchange rate on a future date.
See Note 8 regarding other derivative information.
d. Income and Deferred Taxes
It is the Fund’s policy to qualify as a regulated investment company under the Internal Revenue Code. The Fund intends to distribute to shareholders substantially all of its taxable income and net realized gains to relieve it from federal income and excise taxes. As a result, no provision for U.S. federal income taxes is required.
The Fund may be subject to foreign taxation related to income received, capital gains on the sale of securities and certain foreign currency transactions in the foreign jurisdictions in which it invests. Foreign taxes, if any, are recorded based on the tax regulations and rates that exist in the foreign markets in which the Fund invests. When a capital gain tax is determined to apply, the Fund records an estimated deferred tax liability in an amount that would be payable if the securities were disposed of on the valuation date.
The Fund recognizes the tax benefits of uncertain tax positions only when the position is “more likely than not” to be sustained upon examination by the tax authorities based on the technical merits of the tax position. As of April 30, 2015, and for all open tax years, the Fund has determined that no liability for unrecognized tax benefits is required in the Fund’s financial statements related to uncertain tax positions taken on a tax return (or expected to be taken on future tax returns). Open tax years are those that remain subject to examination and are based on each tax jurisdiction’s statute of limitation.
e. Security Transactions, Investment Income, Expenses and Distributions
Security transactions are accounted for on trade date. Realized gains and losses on security transactions are determined on a specific identification basis. Interest income and estimated expenses are accrued daily. Amortization of premium and accretion of discount on debt securities are included in interest income. Distributions to shareholders are recorded on the ex-dividend date and are determined according to income tax regulations (tax basis). Distributable earnings determined on a tax basis may differ from earnings recorded in accordance with U.S. GAAP. These differences may be permanent or temporary. Permanent differences are reclassified among capital accounts to reflect their tax character. These reclassifications have no impact on net assets or the results of operations. Temporary differences are not reclassified, as they may reverse in subsequent periods.
Common expenses incurred by the Trust are allocated among the funds based on the ratio of net assets of each fund to the combined net assets of the Trust. Fund specific expenses are charged directly to the fund that incurred the expense.
franklintempleton.com
Annual Report
| 27
FRANKLIN STRATEGIC SERIES
NOTES TO FINANCIAL STATEMENTS
Franklin Global Government Bond Fund (continued)
1. Organization and Significant Accounting
Policies (continued)
e. Security Transactions, Investment Income, Expenses and Distributions (continued)
Realized and unrealized gains and losses and net investment income, not including class specific expenses, are allocated daily to each class of shares based upon the relative proportion of net assets of each class. Differences in per share distributions, by class, are generally due to differences in class specific expenses.
Inflation-indexed bonds are adjusted for inflation through periodic increases or decreases in the security’s interest accruals, face amount, or principal redemption value, by amounts corresponding to the rate of inflation as measured by an index. Any increase or decrease in the face amount or principal redemption value will be included as interest income in the Statement of Operations.
f. Offering Costs
Offering costs are amortized on a straight line basis over twelve months.
g. Accounting Estimates
The preparation of financial statements in accordance with U.S. GAAP requires management to make estimates and assumptions that affect the reported amounts of assets and liabilities at the date of the financial statements and the amounts of income and expenses during the reporting period. Actual results could differ from those estimates.
h. Guarantees and Indemnifications
Under the Trust’s organizational documents, its officers and trustees are indemnified by the Trust against certain liabilities arising out of the performance of their duties to the Trust. Additionally, in the normal course of business, the Trust, on behalf of the Fund, enters into contracts with service providers that contain general indemnification clauses. The Trust’s maximum exposure under these arrangements is unknown as this would involve future claims that may be made against the Trust that have not yet occurred. Currently, the Trust expects the risk of loss to be remote.
2. Shares of Beneficial Interest
At April 30, 2015, there were an unlimited number of shares authorized (without par value). Transactions in the Fund’s shares were as follows:
| Year Ended April 30, | ||||||||||||
| 2015 | 2014 | a | ||||||||||
| Shares | Amount | Shares | Amount | |||||||||
| Class A Shares: | ||||||||||||
| Shares sold | 170,918 | $ | 1,766,228 | 1,077,037 | $ | 10,788,066 | ||||||
| Shares issued in reinvestment of distributions | 10,173 | 102,381 | 520 | 5,353 | ||||||||
| Shares redeemed | (84,154 | ) | (841,468 | ) | (3,189 | ) | (32,667 | ) | ||||
| Net increase (decrease) | 96,937 | $ | 1,027,141 | 1,074,368 | $ | 10,760,752 | ||||||
| Class C Shares: | ||||||||||||
| Shares sold | 28,174 | $ | 290,140 | 14,871 | $ | 152,447 | ||||||
| Shares issued in reinvestment of distributions | 1,297 | 13,025 | 51 | 521 | ||||||||
| Shares redeemed | (14,615 | ) | (149,150 | ) | — | — | ||||||
| Net increase (decrease) | 14,856 | $ | 154,015 | 14,922 | $ | 152,968 | ||||||
| Class R Sharesb: | ||||||||||||
| Shares sold | 1,000 | $ | 10,000 | |||||||||
| Class R6 Sharesb: | ||||||||||||
| Shares sold | 1,000 | $ | 10,000 | |||||||||
28 | Annual Report franklintempleton.com
| FRANKLIN STRATEGIC SERIES | |||||||||||
| NOTES TO FINANCIAL STATEMENTS | |||||||||||
| Franklin Global Government Bond Fund (continued) | |||||||||||
| Year Ended April 30, | |||||||||||
| 2015 | 2014 | a | |||||||||
| Shares | Amount | Shares | Amount | ||||||||
| Advisor Class Shares: | |||||||||||
| Shares sold | 280 | $ | 2,800 | 5,902 | $ | 60,000 | |||||
| Shares issued in reinvestment of distributions | 1 | 9 | 32 | 323 | |||||||
| Shares redeemed | (281 | ) | (2,779 | ) | (4,934 | ) | (50,076 | ) | |||
| Net increase (decrease) | — | $ | 30 | 1,000 | $ | 10,247 | |||||
aFor the period September 6, 2013 (commencement of operations) to April 30, 2014.
bDuring the year Class R and Class R6 did not report any share transactions.
3. Transactions with Affiliates
Franklin Resources, Inc. is the holding company for various subsidiaries that together are referred to as Franklin Templeton Investments. Certain officers and trustees of the Fund are also officers and/or directors of the following subsidiaries:
| Subsidiary | Affiliation |
| Franklin Templeton Investment Management Limited (FTIML) | Investment manager |
| Franklin Templeton Services, LLC (FT Services) | Administrative manager |
| Franklin Templeton Distributors, Inc. (Distributors) | Principal underwriter |
| Franklin Templeton Investor Services, LLC (Investor Services) | Transfer agent |
a. Management Fees
The Fund pays an investment management fee to FTIML based on the average daily net assets of the Fund as follows:
| Annualized Fee Rate | Net Assets | |
| 0.650 | % | Up to and including $1 billion |
| 0.600 | % | Over $1 billion up to and including $5 billion |
| 0.550 | % | Over $5 billion up to and including $10 billion |
| 0.545 | % | Over $10 billion up to and including $15 billion |
| 0.540 | % | Over $15 billion up to and including $20 billion |
| 0.535 | % | Over $20 billion |
b. Administrative Fees
Under an agreement with FTIML, FT Services provides administrative services to the Fund. The fee is paid by FTIML based on the Fund’s average daily net assets, and is not an additional expense of the Fund.
c. Distribution Fees
The Board has adopted distribution plans for each share class, with the exception of Class R6 and Advisor Class shares, pursuant to Rule 12b-1 under the 1940 Act. Distribution fees are not charged on shares held by affiliates. Under the Fund’s Class A reimbursement distribution plan, the Fund reimburses Distributors for costs incurred in connection with the servicing, sale and distribution of the Fund’s shares up to the maximum annual plan rate. Under the Class A reimbursement distribution plan, costs exceeding the maximum for the current plan year cannot be reimbursed in subsequent periods. In addition, under the Fund’s Class C and R compensation distribution plans, the Fund pays Distributors for costs incurred in connection with the servicing, sale and distribution of the Fund’s shares up to the maximum annual plan rate for each class. The plan year, for purposes of monitoring compliance with the maximum annual plan rates, is February 1 through January 31.
franklintempleton.com
Annual Report
| 29
FRANKLIN STRATEGIC SERIES
NOTES TO FINANCIAL STATEMENTS
Franklin Global Government Bond Fund (continued)
3. Transactions with Affiliates (continued)
The maximum annual plan rates, based on the average daily net assets, for each class, are as follows:
| Class A | 0.25 | % |
| Class C | 0.65 | % |
| Class R | 0.50 | % |
d. Sales Charges/Underwriting Agreements
Front-end sales charges and contingent deferred sales charges (CDSC) do not represent expenses of the Fund. These charges are deducted from the proceeds of sales of Fund shares prior to investment or from redemption proceeds prior to remittance, as applicable. Distributors has advised the Fund of the following commission transactions related to the sales and redemptions of the Fund’s shares for the year:
| Sales charges retained net of commissions paid to unaffiliated broker/dealers | $ | 4,547 |
| CDSC retained | $ | 94 |
e. Transfer Agent Fees
Each class of shares, except for Class R6, pays transfer agent fees to Investor Services for its performance of shareholder servicing obligations and reimburses Investor Services for out of pocket expenses incurred, including shareholding servicing fees paid to third parties. These fees are allocated daily based upon their relative proportion of such classes’ aggregate net assets. Class R6 pays Investor Services transfer agent fees specific to that class.
For the year ended April 30, 2015, the Fund paid transfer agent fees of $3,044, of which $2,245 was retained by Investor Services.
f. Investments in Institutional Fiduciary Trust Money Market Portfolio
The Fund invests in Institutional Fiduciary Trust Money Market Portfolio (Sweep Money Fund), an affiliated open-end management investment company. Management fees paid by the Fund are waived on assets invested in the Sweep Money Fund, in an amount not to exceed the management and administrative fees paid directly or indirectly by the Sweep Money Fund.
g. Waiver and Expense Reimbursements
FTIML and Investor Services have contractually agreed in advance to waive or limit their respective fees and to assume as their own expense certain expenses otherwise payable by the Fund so that the expenses (excluding distribution fees, and acquired fund fees and expenses) for each class of the Fund do not exceed 0.60% based on the average net assets of each class (other than certain non-routine expenses or costs, including those relating to litigation, indemnification, reorganizations, and liquidations) until August 31, 2015.
h. Other Affiliated Transactions
At April 30, 2015, Franklin Resources, Inc., an affiliate of FTIML, owned 83.05% of the Fund’s outstanding shares. Investment activities of this shareholder could have a material impact on the Fund.
4. Expense Offset Arrangement
The Fund has entered into an arrangement with its custodian whereby credits realized as a result of uninvested cash balances are used to reduce a portion of the Fund’s custodian expenses. During the year ended April 30, 2015, there were no credits earned.
30 | Annual Report
franklintempleton.com
FRANKLIN STRATEGIC SERIES
NOTES TO FINANCIAL STATEMENTS
Franklin Global Government Bond Fund (continued)
5. Income Taxes
For tax purposes, capital losses may be carried over to offset future capital gains, if any.
During the year ended April 30, 2015, the Fund utilized $1,540 of capital loss carryforwards.
For tax purposes, the Fund may elect to defer any portion of a post-October capital loss to the first day of the following fiscal year. At April 30, 2015, the Fund deferred post-October capital losses of $13,436.
The tax character of distributions paid during the years ended April 30, 2015 and 2014, was as follows:
| 2015 | 2014 | |||
| Distributions paid from: | ||||
| Ordinary income | $ | 640,218 | $ | 133,769 |
| Long term capital gain | 54,287 | — | ||
| $ | 694,505 | $ | 133,769 |
At April 30, 2015, the cost of investments, net unrealized appreciation (depreciation), undistributed ordinary income and undistributed long term capital gains for income tax purposes were as follows:
| Cost of investments | $ | 12,132,689 | |
| Unrealized appreciation | $ | 175,488 | |
| Unrealized depreciation | (482,454 | ) | |
| Net unrealized appreciation (depreciation) | $ | (306,966 | ) |
| Undistributed ordinary income | $ | 67,367 | |
| Undistributed long term capital gains | 8,510 | ||
| Distributable earnings | $ | 75,877 | |
Differences between income and/or capital gains as determined on a book basis and a tax basis are primarily due to differing treatment of bond discounts and premiums, foreign currency transactions, and offering costs.
6. Investment Transactions
Purchases and sales of investments (excluding short term securities) for the year ended April 30, 2015, aggregated $8,283,113 and $6,832,595, respectively.
7. Concentration of Risk
Investing in foreign securities may include certain risks and considerations not typically associated with investing in U.S. securities, such as fluctuating currency values and changing local and regional economic, political and social conditions, which may result in greater market volatility. In addition, certain foreign securities may not be as liquid as U.S. securities.
8. Other Derivative Information
At April 30, 2015, the Fund’s investments in derivative contracts are reflected in the Statement of Assets and Liabilities as follows:
| Asset Derivatives | Liability Derivatives | ||||
| Derivative Contracts | |||||
| Not Accounted for as | Statement of Assets and | Statement of Assets and | |||
| Hedging Instruments | Liabilities Location | Fair Value | Liabilities Location | Fair Value | |
| Foreign exchange contracts | Unrealized appreciation on forward | Unrealized depreciation on forward | |||
| exchange contracts | $ — | exchange contracts | $ | 96,495 |
franklintempleton.com Annual Report | 31
FRANKLIN STRATEGIC SERIES
NOTES TO FINANCIAL STATEMENTS
Franklin Global Government Bond Fund (continued)
8. Other Derivative Information (continued)
For the year ended April 30, 2015, the effect of derivative contracts in the Fund’s Statement of Operations was as follows:
| Change in | ||||||
| Unrealized | ||||||
| Derivative Contracts | Realized | Appreciation | ||||
| Not Accounted for as | Gain (Loss) | (Depreciation) | ||||
| Hedging Instruments | Statement of Operations Locations | for the Year | for the Year | |||
| Foreign exchange contracts | Net realized gain (loss) from foreign currency | |||||
| transactions / Net change in unrealized appreciation | ||||||
| (depreciation) on translation of other assets and | ||||||
| liabilities denominated in foreign currencies | $ | 395,824 | $ | (71,121 | ) |
For the year ended April 30, 2015, the average month end fair value of derivatives represented 0.73% of average month end net assets. The average month end number of open derivative contracts for the year was 4.
See Note 1(c) regarding derivative financial instruments.
9. Credit Facility
The Fund, together with other U.S. registered and foreign investment funds (collectively, Borrowers), managed by Franklin Templeton Investments, are borrowers in a joint syndicated senior unsecured credit facility totaling $2 billion (Global Credit Facility) which, matures on February 12, 2016. This Global Credit Facility provides a source of funds to the Borrowers for temporary and emergency purposes, including the ability to meet future unanticipated or unusually large redemption requests.
Under the terms of the Global Credit Facility, the Fund shall, in addition to interest charged on any borrowings made by the Fund and other costs incurred by the Fund, pay its share of fees and expenses incurred in connection with the implementation and maintenance of the Global Credit Facility, based upon its relative share of the aggregate net assets of all of the Borrowers, including an annual commitment fee of 0.07% based upon the unused portion of the Global Credit Facility. These fees are reflected in other expenses in the Statement of Operations. During the year ended April 30, 2015, the Fund did not use the Global Credit Facility.
10. Fair Value Measurements
The Fund follows a fair value hierarchy that distinguishes between market data obtained from independent sources (observable inputs) and the Fund’s own market assumptions (unobservable inputs). These inputs are used in determining the value of the Fund’s financial instruments and are summarized in the following fair value hierarchy:
- Level 1 – quoted prices in active markets for identical financial instruments
- Level 2 – other significant observable inputs (including quoted prices for similar financial instruments, interest rates, prepayment speed, credit risk, etc.)
- Level 3 – significant unobservable inputs (including the Fund’s own assumptions in determining the fair value of financial instruments)
The input levels are not necessarily an indication of the risk or liquidity associated with financial instruments at that level.
For movements between the levels within the fair value hierarchy, the Fund has adopted a policy of recognizing the transfers as of the date of the underlying event which caused the movement.
32 | Annual Report
franklintempleton.com
FRANKLIN STRATEGIC SERIES
NOTES TO FINANCIAL STATEMENTS
Franklin Global Government Bond Fund (continued)
A summary of inputs used as of April 30, 2015, in valuing the Fund’s assets and liabilities carried at fair value, is as follows:
| Level 1 | Level 2 | Level 3 | Total | |||||
| Assets: | ||||||||
| Investments in Securities: | ||||||||
| Foreign Government and Agency Securities | $ | — | $ | 8,009,260 | $ | — | $ | 8,009,260 |
| U.S. Government and Agency Securities | — | 3,194,631 | — | 3,194,631 | ||||
| Short Term Investments | 221,129 | 400,703 | — | 621,832 | ||||
| Total Investments in Securities | $ | 221,129 | $ | 11,604,594 | $ | — | $ | 11,825,723 |
| Liabilities: | ||||||||
| Other Financial Instruments | ||||||||
| Forward Exchange Contracts | $ | — | $ | 96,495 | $ | — | $ | 96,495 |
11. New Accounting Pronouncements
In June 2014, the Financial Accounting Standards Board issued Accounting Standards Update (ASU) No. 2014-11, Transfers and Servicing (Topic 860), Repurchase-to-Maturity Transactions, Repurchase Financings, and Disclosures. The ASU changes the accounting for certain repurchase agreements and expands disclosure requirements related to repurchase agreements, securities lending, repurchase-to-maturity and similar transactions. The ASU is effective for interim and annual reporting periods beginning after December 15, 2014. Management has reviewed the requirements and believes the adoption of this ASU will not have a material impact on the financial statements.
12. Subsequent Events
The Fund evaluated subsequent events through the issuance of the financial statements and determined that no events have occurred that require disclosure.
| Abbreviations | |||
| Counterparty | Currency | ||
| BZWS | Barclays Bank PLC | AUD | Australian Dollar |
| CITI | Citigroup, Inc. | CAD | Canadian Dollar |
| RBCCM | Royal Bank of Canada | EUR | Euro |
| GBP | British Pound | ||
| MXN | Mexican Peso | ||
| MYR | Malaysian Ringgit | ||
| PLN | Polish Zloty | ||
| SGD | Singapore Dollar | ||
franklintempleton.com
Annual Report
| 33
FRANKLIN STRATEGIC SERIES
Report of Independent Registered Public Accounting Firm
To the Board of Trustees and Shareholders of Franklin Global Government Bond Fund
In our opinion, the accompanying statement of assets and liabilities, including the statement of investments, and the related statements of operations and of changes in net assets and the financial highlights present fairly, in all material respects, the financial position of Franklin Global Government Bond Fund (the “Fund”) at April 30, 2015, the results of its operations for the year then ended, the changes in its net assets and the financial highlights for the periods presented, in conformity with accounting principles generally accepted in the United States of America. These financial statements and financial highlights (hereafter referred to as “financial statements”) are the responsibility of the Fund’s management. Our responsibility is to express an opinion on these financial statements based on our audit. We conducted our audit of these financial statements in accordance with the standards of the Public Company Accounting Oversight Board (United States). Those standards require that we plan and perform the audit to obtain reasonable assurance about whether the financial statements are free of material misstatement. An audit includes examining, on a test basis, evidence supporting the amounts and disclosures in the financial statements, assessing the accounting principles used and significant estimates made by management, and evaluating the overall financial statement presentation. We believe that our audit, which included confirmation of securities at April 30, 2015 by correspondence with the custodian, transfer agent and brokers, provide a reasonable basis for our opinion.
PricewaterhouseCoopers LLP
San Francisco, California
June 15, 2015
34 | Annual Report
franklintempleton.com
FRANKLIN STRATEGIC SERIES
Tax Information (unaudited)
Franklin Global Government Bond Fund
Under Section 852(b)(3)(C) of the Internal Revenue Code (Code), the Fund hereby reports the maximum amount allowable but no less than $54,287 as a long term capital gain dividend for the fiscal year ended April 30, 2015.
Under Section 871(k)(2)(C) of the Code, the Fund hereby reports the maximum amount allowable but no less than $159,299 as a short term capital gain dividend for purposes of the tax imposed under Section 871(a)(1)(A) of the Code for the fiscal year ended April 30, 2015.
franklintempleton.com
Annual Report
| 35
FRANKLIN STRATEGIC SERIES
Board Members and Officers
The name, year of birth and address of the officers and board members, as well as their affiliations, positions held with the Trust, principal occupations during at least the past five years and number of portfolios overseen in the Franklin Templeton Investments fund complex are shown below. Generally, each board member serves until that person’s successor is elected and qualified.
| Independent Board Members | ||||
| Number of Portfolios in | ||||
| Name, Year of Birth | Length of | Fund Complex Overseen | Other Directorships Held | |
| and Address | Position | Time Served | by Board Member* | During at Least the Past 5 Years |
| Harris J. Ashton (1932) | Trustee | Since 1991 | 145 | Bar-S Foods (meat packing company) |
| One Franklin Parkway | (1981-2010). | |||
| San Mateo, CA 94403-1906 | ||||
| Principal Occupation During at Least the Past 5 Years: | ||||
| Director of various companies; and formerly, Director, RBC Holdings, Inc. (bank holding company) (until 2002); and President, Chief Executive | ||||
| Officer and Chairman of the Board, General Host Corporation (nursery and craft centers) (until 1998). | ||||
| Mary C. Choksi (1950) | Trustee | Since | 119 | Avis Budget Group Inc. (car rental) |
| One Franklin Parkway | October 2014 | (2007-present), Omnicom Group Inc. | ||
| San Mateo, CA 94403-1906 | (advertising and marketing communi- | |||
| cations services) (2011-present) and | ||||
| H.J. Heinz Company (processed foods | ||||
| and allied products) (1998-2006). | ||||
| Principal Occupation During at Least the Past 5 Years: | ||||
| Founding Partner and Senior Managing Director, Strategic Investment Group (investment management group) (1987-present); director of | ||||
| various companies; and formerly, Founding Partner and Managing Director, Emerging Markets Management LLC (investment management | ||||
| firm) (1987-2011); and Loan Officer/Senior Loan Officer/Senior Pension Investment Officer, World Bank Group (international financial | ||||
| institution) (1977-1987). | ||||
| Edith E. Holiday (1952) | Trustee | Since 1998 | 145 | Hess Corporation (exploration and |
| One Franklin Parkway | refining of oil and gas) (1993-present), | |||
| San Mateo, CA 94403-1906 | RTI International Metals, Inc. (manu- | |||
| facture and distribution of titanium) | ||||
| (1999-present), Canadian National | ||||
| Railway (railroad) (2001-present), | ||||
| White Mountains Insurance Group, Ltd. | ||||
| (holding company) (2004-present) and | ||||
| H.J. Heinz Company (processed foods | ||||
| and allied products) (1994-2013). | ||||
| Principal Occupation During at Least the Past 5 Years: | ||||
| Director or Trustee of various companies and trusts; and formerly, Assistant to the President of the United States and Secretary of the | ||||
| Cabinet (1990-1993); General Counsel to the United States Treasury Department (1989-1990); and Counselor to the Secretary and Assistant | ||||
| Secretary for Public Affairs and Public Liaison – United States Treasury Department (1988-1989). | ||||
| J. Michael Luttig (1954) | Trustee | Since 2009 | 145 | Boeing Capital Corporation |
| One Franklin Parkway | (aircraft financing) (2006-2013). | |||
| San Mateo, CA 94403-1906 | ||||
| Principal Occupation During at Least the Past 5 Years: | ||||
| Executive Vice President, General Counsel and member of the Executive Council, The Boeing Company (aerospace company); and | ||||
| formerly, Federal Appeals Court Judge, U.S. Court of Appeals for the Fourth Circuit (1991-2006). | ||||
36 | Annual Report franklintempleton.com
FRANKLIN STRATEGIC SERIES
| Independent Board Members (continued) | ||||
| Number of Portfolios in | ||||
| Name, Year of Birth | Length of | Fund Complex Overseen | Other Directorships Held | |
| and Address | Position | Time Served | by Board Member* | During at Least the Past 5 Years |
| Frank A. Olson (1932) | Trustee | Since 2007 | 145 | Hess Corporation (exploration and |
| One Franklin Parkway | refining of oil and gas) (1998-2013). | |||
| San Mateo, CA 94403-1906 | ||||
| Principal Occupation During at Least the Past 5 Years: | ||||
| Director of various companies; and formerly, Chairman of the Board, The Hertz Corporation (car rental) (1980-2000) and Chief Executive | ||||
| Officer (1977-1999); and Chairman of the Board, President and Chief Executive Officer, UAL Corporation (airlines) (June-December 1987). | ||||
| Larry D. Thompson (1945) | Trustee | Since 2007 | 145 | Cbeyond, Inc. (business commu- |
| One Franklin Parkway | nications provider) (2010-2012), | |||
| San Mateo, CA 94403-1906 | The Southern Company (energy | |||
| company) (December 2014; | ||||
| previously 2010-2012) and Graham | ||||
| Holdings Company (education and | ||||
| media organization) (2011-present). | ||||
| Principal Occupation During at Least the Past 5 Years: | ||||
| Director of various companies; John A. Sibley Professor of Corporate and Business Law, University of Georgia School of Law (January 2015; | ||||
| previously 2011-2012); and formerly, Executive Vice President – Government Affairs, General Counsel and Corporate Secretary, PepsiCo, | ||||
| Inc. (consumer products) (2012-2014); Senior Vice President – Government Affairs, General Counsel and Secretary, PepsiCo, Inc. | ||||
| (2004-2011); Senior Fellow of The Brookings Institution (2003-2004); Visiting Professor, University of Georgia School of Law (2004); and | ||||
| Deputy Attorney General, U.S. Department of Justice (2001-2003). | ||||
| John B. Wilson (1959) | Lead | Trustee since | 119 | None |
| One Franklin Parkway | Independent | 2006 and Lead | ||
| San Mateo, CA 94403-1906 | Trustee | Independent | ||
| Trustee since 2008 | ||||
| Principal Occupation During at Least the Past 5 Years: | ||||
| President, Staples Europe (office supplies) (2012-present); President and Founder, Hyannis Port Capital, Inc. (real estate and private equity | ||||
| investing); serves on private and non-profit boards; and formerly, Chief Operating Officer and Executive Vice President, Gap, Inc. (retail) | ||||
| (1996-2000); Chief Financial Officer and Executive Vice President – Finance and Strategy, Staples, Inc. (1992-1996); Senior Vice President – | ||||
| Corporate Planning, Northwest Airlines, Inc. (airlines) (1990-1992); and Vice President and Partner, Bain & Company (consulting firm) | ||||
| (1986-1990). | ||||
| Interested Board Members and Officers | ||||
| Number of Portfolios in | ||||
| Name, Year of Birth | Length of | Fund Complex Overseen | Other Directorships Held | |
| and Address | Position | Time Served | by Board Member* | During at Least the Past 5 Years |
| **Gregory E. Johnson (1961) | Trustee | Since June 2013 | 162 | None |
| One Franklin Parkway | ||||
| San Mateo, CA 94403-1906 | ||||
| Principal Occupation During at Least the Past 5 Years: | ||||
| Chairman of the Board, Member – Office of the Chairman, Director, President and Chief Executive Officer, Franklin Resources, Inc.; officer | ||||
| and/or director or trustee, as the case may be, of some of the other subsidiaries of Franklin Resources, Inc. and of 46 of the investment | ||||
| companies in Franklin Templeton Investments; and Vice Chairman, Investment Company Institute. | ||||
franklintempleton.com Annual Report | 37
| FRANKLIN STRATEGIC SERIES | ||||
| Interested Board Members and Officers (continued) | ||||
| Number of Portfolios in | ||||
| Name, Year of Birth | Length of | Fund Complex Overseen | Other Directorships Held | |
| and Address | Position | Time Served | by Board Member* | During at Least the Past 5 Years |
| **Rupert H. Johnson, Jr. (1940) Chairman of | Chairman of | 145 | None | |
| One Franklin Parkway | the Board and | the Board since | ||
| San Mateo, CA 94403-1906 | Trustee | 2013 and Trustee | ||
| since 1991 | ||||
| Principal Occupation During at Least the Past 5 Years: | ||||
| Vice Chairman, Member – Office of the Chairman and Director, Franklin Resources, Inc.; Director, Franklin Advisers, Inc.; Senior Vice | ||||
| President, Franklin Advisory Services, LLC; and officer and/or director or trustee, as the case may be, of some of the other subsidiaries | ||||
| of Franklin Resources, Inc. and of 43 of the investment companies in Franklin Templeton Investments. | ||||
| Alison E. Baur (1964) | Vice President | Since 2012 | Not Applicable | Not Applicable |
| One Franklin Parkway | ||||
| San Mateo, CA 94403-1906 | ||||
| Principal Occupation During at Least the Past 5 Years: | ||||
| Deputy General Counsel, Franklin Templeton Investments; and officer of some of the other subsidiaries of Franklin Resources, Inc. and of | ||||
| 46 of the investment companies in Franklin Templeton Investments. | ||||
| Laura F. Fergerson (1962) | Chief Executive Since 2009 | Not Applicable | Not Applicable | |
| One Franklin Parkway | Officer – | |||
| San Mateo, CA 94403-1906 | Finance and | |||
| Administration | ||||
| Principal Occupation During at Least the Past 5 Years: | ||||
| Senior Vice President, Franklin Templeton Services, LLC; and officer of 46 of the investment companies in Franklin Templeton Investments. | ||||
| Gaston Gardey (1967) | Treasurer, | Since 2009 | Not Applicable | Not Applicable |
| One Franklin Parkway | Chief Financial | |||
| San Mateo, CA 94403-1906 | Officer and | |||
| Chief | ||||
| Accounting | ||||
| Officer | ||||
| Principal Occupation During at Least the Past 5 Years: | ||||
| Treasurer, U.S. Products and Client Services, Franklin Templeton Investments; and officer of 27 of the investment companies in Franklin | ||||
| Templeton Investments. | ||||
| Aliya S. Gordon (1973) | Vice President | Since 2009 | Not Applicable | Not Applicable |
| One Franklin Parkway | ||||
| San Mateo, CA 94403-1906 | ||||
| Principal Occupation During at Least the Past 5 Years: | ||||
| Senior Associate General Counsel, Franklin Templeton Investments; officer of 46 of the investment companies in Franklin Templeton | ||||
| Investments; and formerly, Litigation Associate, Steefel, Levitt & Weiss, LLP (2000-2004). | ||||
| Steven J. Gray (1955) | Vice President | Since 2009 | Not Applicable | Not Applicable |
| One Franklin Parkway | ||||
| San Mateo, CA 94403-1906 | ||||
| Principal Occupation During at Least the Past 5 Years: | ||||
| Senior Associate General Counsel, Franklin Templeton Investments; Vice President, Franklin Templeton Distributors, Inc. and Franklin | ||||
| Alternative Strategies Advisers, LLC; and officer of 46 of the investment companies in Franklin Templeton Investments. | ||||
38 | Annual Report franklintempleton.com
FRANKLIN STRATEGIC SERIES
| Interested Board Members and Officers (continued) | ||||
| Number of Portfolios in | ||||
| Name, Year of Birth | Length of | Fund Complex Overseen | Other Directorships Held | |
| and Address | Position | Time Served | by Board Member* | During at Least the Past 5 Years |
| Selena L. Holmes (1965) | Vice President | Since 2012 | Not Applicable | Not Applicable |
| 100 Fountain Parkway | – AML | |||
| St. Petersburg, FL 33716-1205 | Compliance | |||
| Principal Occupation During at Least the Past 5 Years: | ||||
| Director, Global Compliance Monitoring; Chief Compliance Officer, Franklin Alternative Strategies Advisers, LLC; Vice President, Franklin | ||||
| Templeton Companies, LLC; and officer of 46 of the investment companies in Franklin Templeton Investments. | ||||
| Edward B. Jamieson (1948) | President and | Since 2010 | Not Applicable | Not Applicable |
| One Franklin Parkway | Chief Executive | |||
| San Mateo, CA 94403-1906 | Officer – | |||
| Investment | ||||
| Management | ||||
| Principal Occupation During at Least the Past 5 Years: | ||||
| President, Chief Investment Officer and Director, Franklin Advisers, Inc.; Executive Vice President, Franklin Templeton Institutional, LLC; | ||||
| and officer and/or trustee, as the case may be, of some of the other subsidiaries of Franklin Resources, Inc. and of 10 of the investment | ||||
| companies in Franklin Templeton Investments. | ||||
| Christopher J. Molumphy (1962) Vice President | Since 2000 | Not Applicable | Not Applicable | |
| One Franklin Parkway | ||||
| San Mateo, CA 94403-1906 | ||||
| Principal Occupation During at Least the Past 5 Years: | ||||
| Director and Executive Vice President, Franklin Advisers, Inc.; Executive Vice President, Franklin Templeton Institutional, LLC; and officer | ||||
| of some of the other subsidiaries of Franklin Resources, Inc. and of 22 of the investment companies in Franklin Templeton Investments. | ||||
| Kimberly H. Novotny (1972) | Vice President | Since 2013 | Not Applicable | Not Applicable |
| 300 S.E. 2nd Street | ||||
| Fort Lauderdale, FL 33301-1923 | ||||
| Principal Occupation During at Least the Past 5 Years: | ||||
| Associate General Counsel, Franklin Templeton Investments; Vice President and Secretary, Fiduciary Trust International of the South; Vice | ||||
| President, Templeton Investment Counsel, LLC; Assistant Secretary, Franklin Resources, Inc.; and officer of 46 of the investment companies | ||||
| in Franklin Templeton Investments. | ||||
| Robert C. Rosselot (1960) | Chief | Since 2013 | Not Applicable | Not Applicable |
| 300 S.E. 2nd Street | Compliance | |||
| Fort Lauderdale, FL 33301-1923 | Officer | |||
| Principal Occupation During at Least the Past 5 Years: | ||||
| Director, Global Compliance, Franklin Templeton Investments; Vice President, Franklin Templeton Companies, LLC; officer of 46 of the | ||||
| investment companies in Franklin Templeton Investments; and formerly, Senior Associate General Counsel, Franklin Templeton Investments | ||||
| (2007-2013); and Secretary and Vice President, Templeton Group of Funds (2004-2013). | ||||
| Karen L. Skidmore (1952) | Vice President | Since 2006 | Not Applicable | Not Applicable |
| One Franklin Parkway | and Secretary | |||
| San Mateo, CA 94403-1906 | ||||
| Principal Occupation During at Least the Past 5 Years: | ||||
| Senior Associate General Counsel, Franklin Templeton Investments; and officer of 46 of the investment companies in Franklin Templeton | ||||
| Investments. | ||||
franklintempleton.com Annual Report | 39
FRANKLIN STRATEGIC SERIES
| Interested Board Members and Officers (continued) | ||||
| Number of Portfolios in | ||||
| Name, Year of Birth | Length of | Fund Complex Overseen | Other Directorships Held | |
| and Address | Position | Time Served | by Board Member* | During at Least the Past 5 Years |
| Craig S. Tyle (1960) | Vice President | Since 2005 | Not Applicable | Not Applicable |
| One Franklin Parkway | ||||
| San Mateo, CA 94403-1906 | ||||
| Principal Occupation During at Least the Past 5 Years: | ||||
| General Counsel and Executive Vice President, Franklin Resources, Inc.; and officer of some of the other subsidiaries of Franklin Resources, | ||||
| Inc. and of 46 of the investment companies in Franklin Templeton Investments. | ||||
| Lori A. Weber (1964) | Vice President | Since 2011 | Not Applicable | Not Applicable |
| 300 S.E. 2nd Street | ||||
| Fort Lauderdale, FL 33301-1923 | ||||
| Principal Occupation During at Least the Past 5 Years: | ||||
| Senior Associate General Counsel, Franklin Templeton Investments; Assistant Secretary, Franklin Resources, Inc.; Vice President and | ||||
| Secretary, Templeton Investment Counsel, LLC; Vice President, Fiduciary Trust International of the South; and officer of 46 of the investment | ||||
| companies in Franklin Templeton Investments. | ||||
*We base the number of portfolios on each separate series of the U.S. registered investment companies within the Franklin Templeton Investments fund complex.
These portfolios have a common investment manager or affiliated investment managers.
**Gregory E. Johnson is considered to be an interested person of the Fund under the federal securities laws due to his position as an officer and director of Franklin
Resources, Inc. (Resources), which is the parent company of the Fund’s investment manager and distributor. Rupert H. Johnson, Jr. is considered to be an interested
person of the Fund under the federal securities laws due to his position as officer and director and major shareholder of Resources.
Note 1: Rupert H. Johnson, Jr. is the uncle of Gregory E. Johnson.
Note 2: Officer information is current as of the date of this report. It is possible that after this date, information about officers may change.
Note 3: Effective April 30, 2015, Sam Ginn ceased to be a trustee of the Fund.
The Sarbanes-Oxley Act of 2002 and Rules adopted by the Securities and Exchange Commission require the Fund to disclose whether the Fund’s Audit Committee
includes at least one member who is an audit committee financial expert within the meaning of such Act and Rules. The Fund’s Board has determined that there
is at least one such financial expert on the Audit Committee and has designated John B. Wilson as its audit committee financial expert. The Board believes that
Mr. Wilson qualifies as such an expert in view of his extensive business background and experience, including service as chief financial officer of Staples, Inc.
from 1992 to 1996. Mr. Wilson has been a Member and Chairman of the Fund’s Audit Committee since 2006. As a result of such background and experience, the
Board believes that Mr. Wilson has acquired an understanding of generally accepted accounting principles and financial statements, the general application of
such principles in connection with the accounting estimates, accruals and reserves, and analyzing and evaluating financial statements that present a breadth
and level of complexity of accounting issues generally comparable to those of the Fund, as well as an understanding of internal controls and procedures for
financial reporting and an understanding of audit committee functions. Mr. Wilson is an independent Board member as that term is defined under the relevant
Securities and Exchange Commission Rules and Releases.
The Statement of Additional Information (SAI) includes additional information about the board members and is available, without charge, upon request.
Shareholders may call (800) DIAL BEN/ 342-5236 to request the SAI.
40 | Annual Report franklintempleton.com
FRANKLIN STRATEGIC SERIES
FRANKLIN GLOBAL GOVERNMENT BOND FUND
Shareholder Information
Board Review of Investment Management Agreement
At a meeting held April 14, 2015, the Board of Trustees (Board), including a majority of non-interested or independent Trustees, approved renewal of the investment management agreement for each of the separate funds within the Trust, including Franklin Global Government Bond Fund (Fund(s)). In reaching this decision, the Board took into account information furnished throughout the year at regular Board meetings, as well as information prepared specifically in connection with the annual renewal review process. Information furnished and discussed throughout the year included investment performance reports and related financial information for the Funds, along with periodic reports on expenses, shareholder services, legal and compliance matters, pricing, brokerage commissions and execution and other services provided by the Investment Manager (Manager) and its affiliates, as well as marketing support payments made to financial intermediaries. Information furnished specifically in connection with the renewal process included a report for each Fund prepared by Lipper, Inc. (Lipper), an independent organization, as well as additional material, including a Fund profitability analysis prepared by management. The Lipper reports compared each Fund’s investment performance and expenses with those of other mutual funds deemed comparable to the Fund as selected by Lipper. The Fund profitability analysis discussed the profitability to Franklin Templeton Investments (FTI) from its overall U.S. fund operations, as well as on an individual fund-by-fund basis. Additional material accompanying such profitability analysis included information on a fund-by-fund basis listing portfolio managers and other accounts they manage, as well as information on management fees charged by the Manager and its affiliates to U.S. mutual funds and other accounts, including management’s explanation of differences where relevant. Such material also included a memorandum prepared by management describing project initiatives and capital investments relating to the services provided to the Funds by the FTI organization, as well as a memorandum relating to economies of scale and an analysis concerning transfer agent fees charged by an affiliate of the Manager. The Board also noted that at the February meetings each year, it receives an annual report on all marketing support payments made by FTI to financial intermediaries.
In considering such materials, the independent Trustees received assistance and advice from and met separately with independent counsel. While the investment management agreements for all Funds were considered at the same Board meeting, the Board dealt with each Fund separately. In approving continuance of the investment management agreement for each Fund, the Board, including a majority of independent Trustees, determined that the existing management fee structure was fair and reasonable and that continuance of the investment management agreement was in the best interests of each Fund and its shareholders. While attention was given to all information furnished, the following discusses some primary factors relevant to the Board’s decision.
NATURE, EXTENT AND QUALITY OF SERVICE. The Board was satisfied with the nature and quality of the overall services provided by the Manager and its affiliates to the Fund and its shareholders, as noted later in the discussion of investment performance and expenses. The Board’s opinion was based, in part, upon periodic reports furnished it showing that the investment policies and restrictions for the Fund were consistently complied with as well as other reports periodically furnished the Board covering matters such as the compliance of portfolio managers and other management personnel with the code of ethics adopted throughout the Franklin Templeton fund complex, the adherence to fair value pricing procedures established by the Board, and the accuracy of net asset value calculations. The Board also noted the extent of benefits provided Fund shareholders from being part of the Franklin Templeton family of funds, including the right to exchange investments between the same class of shares of different funds without a sales charge, the ability to reinvest Fund dividends into other funds and the right to combine holdings in other funds to obtain a reduced sales charge. Favorable consideration was given to management’s continual efforts and expenditures in establishing effective business continuity plans and developing strategies to address cybersecurity threats. Among other factors taken into account by the Board were the Manager’s best execution trading policies, including a favorable report by an independent portfolio trading analytical firm that also covered FOREX transactions. Consideration was also given to the experience of the Fund’s portfolio management team, the number of accounts managed and general method of compensation. In this latter respect, the Board noted that a primary factor in management’s determination of a portfolio manager’s bonus compensation was the relative investment performance of the funds he or she managed and that a portion of such bonus was required to be invested in a predesignated list of funds within such person’s fund management area so as to be aligned with the interests of shareholders. The Board also took into account the quality of transfer agent and shareholder services provided Fund shareholders by an affiliate of the Manager, noting the
franklintempleton.com
Annual Report
| 41
FRANKLIN STRATEGIC SERIES
FRANKLIN GLOBAL GOVERNMENT BOND FUND
SHAREHOLDER INFORMATION
Board Review of Investment Management
Agreement (continued) changes taking place in the nature of transfer agency services throughout the industry and regulatory initiatives in this area, and the continual enhancements to the Franklin Templeton website. Particular attention was given to management’s conservative approach and diligent risk management procedures, including continual monitoring of counterparty credit risk and attention given to derivatives and other complex instruments, including expanded collateralization requirements. The Board also took into account, among other things, management’s efforts in establishing a global credit facility for the benefit of the Fund and other accounts managed by FTI to provide a source of cash for temporary and emergency purposes or to meet unusual redemption requests as well as the strong financial position of the Manager’s parent company and its commitment to the mutual fund business as evidenced by its continued subsidization of money market funds.
INVESTMENT PERFORMANCE. The Board placed significant emphasis on the investment performance of the Fund in view of its importance to shareholders. While consideration was given to performance reports and discussions with portfolio managers at Board meetings throughout the year, particular attention in assessing performance was given to the Lipper reports furnished for the agreement renewal. The Lipper reports prepared for the Fund showed the investment performance of its Class A shares in comparison to a performance universe selected by Lipper. Comparative performance for the Fund was shown for the one-year period ended January 31, 2015, and previous periods ended that date of up to 10 years depending on when the Fund commenced operations. The performance universe for the Fund consisted of the Fund and all retail and institutional global income funds as selected by Lipper. The Lipper report showed the Fund’s total return to be in the second-highest performing quintile of its performance universe. The Board found the Fund’s performance to be satisfactory, taking into account that the Fund has been operational for less than two full years.
COMPARATIVE EXPENSES. Consideration was given to a comparative analysis of the management fees and total expense ratio of the Fund compared with those of a group of other funds selected by Lipper as its appropriate Lipper expense group. Lipper expense data is based upon information taken from each fund’s most recent annual report, which reflects historical asset levels that may be quite different from those currently existing, particularly in a period of market volatility.
While recognizing such inherent limitation and the fact that expense ratios generally increase as assets decline and decrease as assets grow, the Board believed the independent analysis conducted by Lipper to be an appropriate measure of comparative expenses. In reviewing comparative costs, Lipper provides information on the Fund’s contractual investment management fee in comparison with the investment management fee that would have been charged by other funds within its Lipper expense group assuming they were similar in size to the Fund, as well as the actual total expense ratio of the Fund in comparison with those of its Lipper expense group. The Lipper contractual investment management fee analysis includes administrative charges as being part of the investment management fee, and actual total expenses, for comparative consistency, are shown by Lipper for Fund Class A shares. The results of such expense comparisons showed the contractual investment management fee rate for the Fund was in the second most expensive quintile of its Lipper expense group, while its actual total expense ratio was in the least expensive quintile of such expense group. The Board found the contractual management fee rate and total expense ratio of the Fund to be acceptable, noting that the total expenses were subsidized by management.
MANAGEMENT PROFITABILITY. The Board also considered the level of profits realized by the Manager and its affiliates in connection with the operation of the Fund. In this respect, the Board reviewed the Fund profitability analysis that addresses the overall profitability of Franklin Templeton’s U.S. fund business, as well as its profits in providing management and other services to each of the individual funds during the 12-month period ended September 30, 2014, being the most recent fiscal year-end for Franklin Resources, Inc., the Manager’s parent. In reviewing the analysis, the Board recognized that allocation methodologies are inherently subjective and various allocation methodologies may be reasonable while producing different results. In this respect, the Board noted that while management continually makes refinements to its methodologies in response to organizational and product related changes, the overall approach as defined by the primary drivers and activity measurements has remained consistent with that used in the Fund’s profitability report presentations from prior years. Additionally, the Fund’s independent registered public accounting firm had been engaged by the Manager to periodically review the reasonableness of the allocation methodologies to be used solely by the Fund’s Board in reference to the profitability analysis. In reviewing and discussing such analysis, management discussed with the Board its belief that costs incurred in establishing the infrastructure necessary
42 | Annual Report
franklintempleton.com
FRANKLIN STRATEGIC SERIES
FRANKLIN GLOBAL GOVERNMENT BOND FUND
SHAREHOLDER INFORMATION
for the type of mutual fund operations conducted by the Manager and its affiliates may not be fully reflected in the expenses allocated to the Fund in determining its profitability, as well as the fact that the level of profits, to a certain extent, reflected operational cost savings and efficiencies initiated by management. The Board also took into account management’s expenditures in improving shareholder services provided the Fund, as well as the need to implement systems and meet additional regulatory and compliance requirements resulting from statutes such as the Sarbanes-Oxley and Dodd-Frank Acts and recent SEC and other regulatory requirements. In addition, the Board considered a third-party study comparing the profitability of the Manager’s parent on an overall basis to other publicly held managers broken down to show profitability from management operations exclusive of distribution expenses, as well as profitability including distribution expenses. The Board also considered the extent to which the Manager and its affiliates might derive ancillary benefits from fund operations, including revenues generated from transfer agent services, potential benefits resulting from personnel and systems enhancements necessitated by fund growth, as well as increased leverage with the service providers and counterparties. Based upon its consideration of all these factors, the Board determined that the level of profits realized by the Manager and its affiliates from providing services to the Fund was not excessive in view of the nature, quality and extent of services provided.
ECONOMIES OF SCALE. The Board also considered whether economies of scale are realized by the Manager as the Fund grows larger and the extent to which this is reflected in the level of management fees charged. While recognizing that any precise determination is inherently subjective, the Board noted that based upon the Fund profitability analysis, it appears that as some funds get larger, at some point economies of scale do result in the Manager realizing a larger profit margin on management services provided such a fund. The Board noted that economies of scale were shared with the Fund and its shareholders through management fee breakpoints so that as a fund grows in size, its effective management fee rate declines. The fee structure under the investment management agreement for the Fund contains breakpoints that continued to asset levels that exceeded its asset size at December 31, 2014. In view of such fee structure and the favorable expense comparisons of the Fund within its expense group, the Board believed that to the extent economies of scale may be realized by the Manager of the Fund and its affiliates, that there was a sharing of benefits with the Fund and its shareholders.
Proxy Voting Policies and Procedures
The Fund’s investment manager has established Proxy Voting Policies and Procedures (Policies) that the Fund uses to determine how to vote proxies relating to portfolio securities. Shareholders may view the Fund’s complete Policies online at franklintempleton.com. Alternatively, shareholders may request copies of the Policies free of charge by calling the Proxy Group collect at (954) 527-7678 or by sending a written request to: Franklin Templeton Companies, LLC, 300 S.E. 2nd Street, Fort Lauderdale, FL 33301, Attention: Proxy Group. Copies of the Fund’s proxy voting records are also made available online at franklintempleton.com and posted on the U.S. Securities and Exchange Commission’s website at sec.gov and reflect the most recent 12-month period ended June 30.
Quarterly Statement of Investments
The Fund files a complete statement of investments with the U.S. Securities and Exchange Commission for the first and third quarters for each fiscal year on Form N-Q. Shareholders may view the filed Form N-Q by visiting the Commission’s website at sec.gov. The filed form may also be viewed and copied at the Commission’s Public Reference Room in Washington, DC. Information regarding the operations of the Public Reference Room may be obtained by calling (800) SEC-0330.
Householding of Reports and Prospectuses
You will receive the Fund’s financial reports every six months as well as an annual updated summary prospectus (prospectus available upon request). To reduce Fund expenses, we try to identify related shareholders in a household and send only one copy of the financial reports and summary prospectus. This process, called “householding,” will continue indefinitely unless you instruct us otherwise. If you prefer not to have these documents householded, please call us at (800) 632-2301. At any time you may view current prospectuses/summary prospectuses and financial reports on our website. If you choose, you may receive these documents through electronic delivery.
franklintempleton.com
Annual Report
| 43
This page intentionally left blank.
Item 2. Code of Ethics.
(a) The Registrant has adopted a code of ethics that applies to its principal executive officers and principal financial and accounting officer.
(c) N/A
(d) N/A
(f) Pursuant to Item 12(a)(1), the Registrant is attaching as an exhibit a copy of its code of ethics that applies to its principal executive officers and principal financial and accounting officer.
Item 3. Audit Committee Financial Expert.
(a)(1) The Registrant has an audit committee financial expert serving on its audit committee.
(2) The audit committee financial expert is John B. Wilson and he is "independent" as defined under the relevant Securities and Exchange Commission Rules and Releases.
Item 4. Principal Accountant Fees and Services.
(a) Audit Fees
The aggregate fees paid to the principal accountant for professional services rendered by the principal accountant for the audit of the registrant’s annual financial statements or for services that are normally provided by the principal accountant in connection with statutory and regulatory filings or engagements were $452,420 for the fiscal year ended April 30, 2015 and $418,227 for the fiscal year ended April 30, 2014.
(b) Audit-Related Fees
There were no fees paid to the principal accountant for assurance and related services rendered by the principal accountant to the registrant that are reasonably related to the performance of the audit of the registrant's financial statements and are not reported under paragraph (a) of Item 4.
There were no fees paid to the principal accountant for assurance and related services rendered by the principal accountant to the registrant's investment adviser and any entity controlling, controlled by or under common control with the investment adviser that provides ongoing services to the registrant that are reasonably related to the performance of the audit of their financial statements.
(c) Tax Fees
There were no fees paid to the principal accountant for professional services rendered by the principal accountant to the registrant for tax compliance, tax advice and tax planning.
The aggregate fees paid to the principal accountant for professional services rendered by the principal accountant to the registrant’s investment adviser and any entity controlling, controlled by or under common control with the investment adviser that provides ongoing services to the registrant for tax compliance, tax advice and tax planning were $0 for the fiscal year ended April 30, 2015 and $6,930 for the fiscal year ended April 30, 2014. The services for which these fees were paid included technical tax consultation for capital gain tax and withholding tax reporting for foreign governments and requirements on local country’s self-certification forms.
(d) All Other Fees
The aggregate fees paid to the principal accountant for products and services rendered by the principal accountant to the registrant not reported in paragraphs (a)-(c) of Item 4 were $0 for the fiscal year ended April 30, 2015 and $6,258 for the fiscal year ended April 30, 2014. The services for which these fees were paid included review of materials provided to the fund Board in connection with the investment management contract renewal process.
The aggregate fees paid to the principal accountant for products and services rendered by the principal accountant to the registrant’s investment adviser and any entity controlling, controlled by or under common control with the investment adviser that provides ongoing services to the registrant other than services reported in paragraphs (a)-(c) of Item 4 were $3,519 for the fiscal year ended April 30, 2015 and $155,553 for the fiscal year ended April 30, 2014. The services for which these fees were paid included review of materials provided to the fund Board in connection with the investment management contract renewal process and XBRL tagging on financial statements.
(e) (1) The registrant’s audit committee is directly responsible for approving the services to be provided by the auditors, including:
(i) pre-approval of all audit and audit related services;
(ii) pre-approval of all non-audit related services to be provided to the Fund by the auditors;
(iii) pre-approval of all non-audit related services to be provided to the registrant by the auditors to the registrant’s investment adviser or to any entity that controls, is controlled by or is under common control with the registrant’s investment adviser and that provides ongoing services to the registrant where the non-audit services relate directly to the operations or financial reporting of the registrant; and
(iv) establishment by the audit committee, if deemed necessary or appropriate, as an alternative to committee pre-approval of services to be provided by the auditors, as required by paragraphs (ii) and (iii) above, of policies and procedures to permit such services to be pre-approved by other means, such as through establishment of guidelines or by action of a designated member or members of the committee; provided the policies and procedures are detailed as to the particular service and the committee is informed of each service and such policies and procedures do not include delegation of audit committee responsibilities, as contemplated under the Securities Exchange Act of 1934, to management; subject, in the case of (ii) through (iv), to any waivers, exceptions or exemptions that may be available under applicable law or rules.
(e) (2) None of the services provided to the registrant described in paragraphs (b)-(d) of Item 4 were approved by the audit committee pursuant to paragraph (c)(7)(i)(C) of Rule 2-01 of regulation S-X.
(f) No disclosures are required by this Item 4(f).
(g) The aggregate non-audit fees paid to the principal accountant for services rendered by the principal accountant to the registrant and the registrant’s investment adviser and any entity controlling, controlled by or under common control with the investment adviser that provides ongoing services to the registrant were $3,519 for the fiscal year ended April 30, 2015 and $168,741 for the fiscal year ended April 30, 2014.
(h) The registrant’s audit committee of the board has considered whether the provision of non-audit services that were rendered to the registrant’s investment adviser (not including any sub-adviser whose role is primarily portfolio management and is subcontracted with or overseen by another investment adviser), and any entity controlling, controlled by, or under common control with the investment adviser that provides ongoing services to the registrant that were not pre-approved pursuant to paragraph (c)(7)(ii) of Rule 2-01 of Regulation S-X is compatible with maintaining the principal accountant’s independence.
Item 5. Audit Committee of Listed Registrants. N/A
Item 6. Schedule of Investments. N/A
Item 7. Disclosure of Proxy Voting Policies and Procedures for Closed-End Management Investment Companies. N/A
Item 8. Portfolio Managers of Closed-End Management Investment Companies. N/A
Item 9. Purchases of Equity Securities by Closed-End Management Investment Company and Affiliated Purchasers. N/A
Item 10. Submission of Matters to a Vote of Security Holders.
There have been no changes to the procedures by which shareholders may recommend nominees to the Registrant's Board of Trustees that would require disclosure herein.
Item 11. Controls and Procedures.
(a) Evaluation of Disclosure Controls and Procedures. The Registrant maintains disclosure controls and procedures that are designed to ensure that information required to be disclosed in the Registrant’s filings under the Securities Exchange Act of 1934 and the Investment Company Act of 1940 is recorded, processed, summarized and reported within the periods specified in the rules and forms of the Securities and Exchange Commission. Such information is accumulated and communicated to the Registrant’s management, including its principal executive officer and principal financial officer, as appropriate, to allow timely decisions regarding required disclosure. The Registrant’s management, including the principal executive officer and the principal financial officer, recognizes that any set of controls and procedures, no matter how well designed and operated, can provide only reasonable assurance of achieving the desired control objectives.
Within 90 days prior to the filing date of this Shareholder Report on Form N-CSR, the Registrant had carried out an evaluation, under the supervision and with the participation of the Registrant’s management, including the Registrant’s principal executive officer and the Registrant’s principal financial officer, of the effectiveness of the design and operation of the Registrant’s disclosure controls and procedures. Based on such evaluation, the Registrant’s principal executive officer and principal financial officer concluded that the Registrant’s disclosure controls and procedures are effective.
(b) Changes in Internal Controls. There have been no changes in the Registrant’s internal controls or in other factors that could materially affect the internal controls over financial reporting subsequent to the date of their evaluation in connection with the preparation of this Shareholder Report on Form N-CSR.
Item 12. Exhibits.
(a) (1) Code of Ethics
(a) (2) Certifications pursuant to Section 302 of the Sarbanes-Oxley Act of 2002 of Laura F. Fergerson, Chief Executive Officer - Finance and Administration, and Gaston Gardey, Chief Financial Officer and Chief Accounting Officer
(b) Certifications pursuant to Section 906 of the Sarbanes-Oxley Act of 2002 of Laura F. Fergerson, Chief Executive Officer - Finance and Administration, and Gaston Gardey, Chief Financial Officer and Chief Accounting Officer
SIGNATURES
Pursuant to the requirements of the Securities Exchange Act of 1934 and the Investment Company Act of 1940, the registrant has duly caused this report to be signed on its behalf by the undersigned, thereunto duly authorized.
FRANKLIN STRATEGIC SERIES
By /s/Laura F. Fergerson
Laura F. Fergerson
Chief Executive Officer –
Finance and Administration
Date June 25, 2015
Pursuant to the requirements of the Securities Exchange Act of 1934 and the Investment Company Act of 1940, this report has been signed below by the following persons on behalf of the registrant and in the capacities and on the dates indicated.
By /s/Laura F. Fergerson
Laura F. Fergerson
Chief Executive Officer –
Finance and Administration
Date June 25, 2015
By /s/Gaston Gardey
Gaston Gardey
Chief Financial Officer and
Chief Accounting Officer
Date June 25, 2015