UNITED STATES
SECURITIES AND EXCHANGE COMMISSION
Washington, DC 20549
FORM N-CSR
CERTIFIED SHAREHOLDER REPORT OF REGISTERED MANAGEMENT INVESTMENT COMPANIES
Investment Company Act file number 811-06243
Franklin Strategic Series
(Exact name of registrant as specified in charter)
_ONE FRANKLIN PARKWAY, SAN MATEO, CA 94403-1906
(Address of principal executive offices) (Zip code)
_CRAIG S. TYLE, ONE FRANKLIN PARKWAY, SAN MATEO, CA 94403-1906
(Name and address of agent for service)
Registrant's telephone number, including area code: 650 312-2000
Date of fiscal year end: _4/30
Date of reporting period: _4/30/14
Item 1. Reports to Stockholders.
| Contents | |||||||
| Shareholder Letter | 1 | Annual Report | Franklin Small Cap | Report of Independent | |||
| Economic and Market Overview | 3 | Growth Fund | 38 | Registered Public | |||
| Franklin Small-Mid Cap | Accounting Firm | 135 | |||||
| Franklin Flex Cap | |||||||
| Growth Fund | 5 | Growth Fund | 50 | Tax Information | 136 | ||
| Franklin Focused Core | Financial Highlights and | Board Members and Officers | 137 | ||||
| Equity Fund | 16 | Statements of Investments | 62 | Shareholder Information | 142 | ||
| Franklin Growth | Financial Statements | 105 | |||||
| Opportunities Fund | 27 | Notes to Financial Statements | 114 | ||||
Annual Report
Economic and Market Overview
During the 12-month period ended April 30, 2014, and especially in the second half of 2013, the U.S. economy continued to show signs of recovery because of consumer and business spending and rising inventories. Despite the abnormally cold weather that suppressed economic activity in the first quarter of 2014, economic indicators were still broadly supportive of recovery at period-end. Manufacturing activity expanded and retail sales for the period rose year-over-year. Home sales declined because of rising mortgage rates and lower inventories as well as the impact of extreme weather in early 2014, but home prices rose in comparison with year-ago figures. The unemployment rate declined to 6.3% in April 2014 from 7.5% in April 2013,1 and inflation remained below the U.S. Federal Reserve Board’s (Fed’s) 2.0% target.
In October 2013, the federal government temporarily shut down after Congress reached a budget impasse. However, Congress passed a spending bill in January to fund the federal government through September 2014. Congress then approved suspension of the debt ceiling until March 2015. Despite speculation that it would start tapering its quantitative easing, the Fed maintained its monthly bond purchases at $85 billion through December 2013, gradually reducing them beginning in January, based on continued positive economic and employment data. Although economic data in early 2014 were soft in part because of severe winter weather, Fed Chair Janet Yellen kept the pace of asset-purchase tapering intact while adopting a more qualitative approach to rate-hike guidance. However, the Fed remained committed to keeping interest rates low for a considerable time even after the asset purchase program ends, depending on inflation and unemployment trends. Despite volatility in U.S. equity markets toward period-end heightened by geopolitical risks from the crisis in Ukraine, markets continued to advance.
Investors’ confidence grew as corporate profits rose and generally favorable economic data indicated continued recovery despite brief sell-offs when markets reacted to the Fed’s statements, U.S. budget disputes, political instability in certain emerging markets and China’s slowing economy. U.S. stocks generated strong returns for the 12 months under review as the Standard & Poor’s 500 Index and Dow Jones Industrial Average reached all-time highs.2
Annual Report | 3
The foregoing information reflects our analysis and opinions as of April 30, 2014. The information is not a complete analysis of every aspect of any market, country, industry, security or fund. Statements of fact are from sources considered reliable.
1. Source: Bureau of Labor Statistics.
2. S&P Dow Jones Indices. Copyright © 2014, S&P Dow Jones Indices LLC. All rights reserved. Reproduction of S&P Dow Jones Indices in any form is prohibited except with the prior written permission of S&P. S&P does not guarantee the accuracy, adequacy, completeness or availability of any information and is not responsible for any errors or omissions, regardless of the cause or for the results obtained from the use of such information. S&P DISCLAIMS ANY AND ALL EXPRESS OR IMPLIED WARRANTIES, INCLUDING, BUT NOT LIMITED TO, ANY WARRANTIES OF MERCHANTABILITY OR FITNESS FOR A PARTICULAR PURPOSE OR USE. In no event shall S&P be liable for any direct, indirect, special or consequential damages, costs, expenses, legal fees, or losses (including lost income or lost profit and opportunity costs) in connection with subscriber’s or others’ use of S&P Dow Jones Indices.
4 | Annual Report
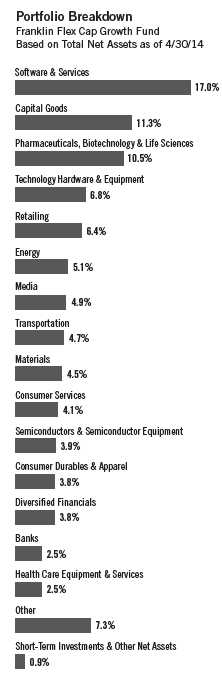
Franklin Flex Cap Growth Fund
Your Fund’s Goal and Main Investments: Franklin Flex Cap Growth Fund seeks capital appreciation. The Fund normally invests predominantly in equity securities of companies that the manager believes have the potential for capital appreciation. The Fund has flexibility to invest in companies located, headquartered or operating inside and outside the U.S., across the entire market capitalization spectrum from small, emerging growth companies to well-established, large cap companies.
We are pleased to bring you Franklin Flex Cap Growth Fund’s annual report for the fiscal year ended April 30, 2014.
Performance Overview
For the 12 months under review, Franklin Flex Cap Growth Fund – Class A delivered a +22.31% cumulative total return. For comparison, the Fund’s narrow benchmark, the Russell 3000® Growth Index, which measures performance of Russell 3000 Index companies with higher price-to-book ratios and higher forecasted growth values, generated a +20.72% total return, and the Russell 1000® Growth Index, which tracks performance of the largest companies in the Russell 3000 Index with higher price-to-book ratios and higher forecasted growth values, produced a +20.66% total return.1, 2 Additionally, the Fund’s broad benchmark, the Standard & Poor’s 500 Index (S&P 500®), which tracks the broad U.S. stock market, posted a +20.44% total return.2, 3 You can find the Fund’s long-term performance data in the Performance Summary beginning on page 8.
| Performance data represent |
| past performance, which does |
| not guarantee future results. |
| Investment return and principal |
| value will fluctuate, and you may |
| have a gain or loss when you sell |
| your shares. Current performance |
| may differ from figures shown. |
| Please visit franklintempleton.com |
| or call (800) 342-5236 for most |
| recent month-end performance. |
Investment Strategy
We use fundamental, bottom-up research to seek companies meeting our criteria of growth potential, quality and valuation. In seeking sustainable growth characteristics, we look for companies we believe can produce sustainable earnings and cash flow growth, evaluating the long-term market opportunity and competitive structure of an industry to target leaders and emerging leaders. We define quality companies as those with strong and improving competitive positions in attractive markets. We also believe important attributes of quality are experienced and talented management teams as well as financial strength reflected in the capital structure, gross and operating margins, free cash flow generation and returns on capital employed. Our valuation analysis includes a range of potential outcomes based on an assessment of multiple scenarios.
The dollar value, number of shares or principal amount, and names of all portfolio holdings are listed in the Fund’s Statement of Investments (SOI). The SOI begins on page 67.
Annual Report | 5
In assessing value, we consider whether security prices fully reflect the balance of the sustainable growth opportunities relative to business and financial risks.
Manager’s Discussion
The Fund outperformed its benchmark, the Russell 3000 Growth Index, for the fiscal year under review as all sectors represented in the Fund’s portfolio made gains. Stock selection in information technology (IT) and an underweighting and stock selection in consumer staples contributed to the Fund’s relative performance.4 The Fund also benefited from stock selection and an overweighting in health care.5 In the IT sector, an off-benchmark position in Netherlands-based integrated circuits manufacturer NXP Semiconductors was among the top contributors, as the company reported strong quarterly earnings underpinned by solid revenue growth and improved operational cost control. Although the consumer staples sector underperformed the overall index, our new position in craft brewer Boston Beer boosted relative returns. Other key contributors included generic pharmaceutical company Actavis and genetic research firm Illumina in the health care sector. Actavis’s shares gained after the company announced the acquisition of Forest Laboratories to strengthen its specialty pharmaceuticals portfolio. Actavis also reported strong full-year 2013 and first-quarter 2014 results backed by organic growth as well as revenues and operational synergies resulting from the Warner Chilcott acquisition, which was completed in October 2013. Outside of these sectors, equipment rental company United Rentals, apparel and footwear manufacturer Under Armour and commercial banking services provider Signature Bank performed strongly.
During the Fund’s fiscal year, stock selection in the energy and industrials sectors detracted from the Fund’s performance relative to its benchmark.6 Oil exploration company Cobalt International Energy weighed on relative performance as the company failed to find commercially viable oil at one of its Gulf of Mexico wells.7 Toward the end of 2013, the stock fell amid concerns that Cobalt might not be able to profit from its larger-than-expected natural gas discovery in Angola. In industrials, our new position in engineering equipment firm Chart Industries hurt performance. Some other major detractors included the Fund’s positions in specialty pharmaceuticals company Allergan, biotechnology firm ARIAD Pharmaceuticals and apparel maker Ralph Lauren.7 ARIAD Pharmaceuticals’ share price fell after the company suspended trials on its leukemia drug Iclusig amid reports of harmful side effects. After initially halting the drug’s marketing in the U.S., the Food and Drug Administration allowed sales to resume with revised labeling and limited application.
6 | Annual Report
Thank you for your continued participation in Franklin Flex Cap Growth Fund. We look forward to serving your future investment needs.

| Top 10 Holdings | |||
| Franklin Flex Cap Growth Fund | |||
| 4/30/14 | |||
| Company | % of Total | ||
| Sector/Industry | Net Assets | ||
| Google Inc., A & C | 2.8 | % | |
| Software & Services | |||
| Apple Inc. | 2.7 | % | |
| Technology Hardware & Equipment | |||
| Actavis PLC | 2.2 | % | |
| Pharmaceuticals, Biotechnology & | |||
| Life Sciences | |||
| MasterCard Inc., A | 2.1 | % | |
| Software & Services | |||
| Ecolab Inc. | 2.0 | % | |
| Materials | |||
| Gilead Sciences Inc. | 1.9 | % | |
| Pharmaceuticals, Biotechnology & | |||
| Life Sciences | |||
| Visa Inc., A | 1.6 | % | |
| Software & Services | |||
| Precision Castparts Corp. | 1.6 | % | |
| Capital Goods | |||
| QUALCOMM Inc. | 1.5 | % | |
| Technology Hardware & Equipment | |||
| NXP Semiconductors NV (Netherlands) | 1.5 | % | |
| Semiconductors & Semiconductor | |||
| Equipment | |||
The foregoing information reflects our analysis, opinions and portfolio holdings as of April 30, 2014, the end of the
reporting period. The way we implement our main investment strategies and the resulting portfolio holdings may
change depending on factors such as market and economic conditions. These opinions may not be relied upon as
investment advice or an offer for a particular security. The information is not a complete analysis of every aspect
of any market, country, industry, security or the Fund. Statements of fact are from sources considered reliable,
but the investment manager makes no representation or warranty as to their completeness or accuracy. Although
historical performance is no guarantee of future results, these insights may help you understand our investment
management philosophy.
The index is unmanaged and includes reinvested dividends. One cannot invest directly in an index, and an index is not
representative of the Fund’s portfolio.
1. Frank Russell Company is the source and owner of the Russell Index data contained or reflected in this material and
all trademarks and copyrights related thereto. This is a presentation of Licensee. The presentation may contain confi-
dential information and unauthorized use, disclosure, copying, dissemination or redistribution is strictly prohibited.
Frank Russell Company is not responsible for the formatting or configuration of this material or for any inaccuracy in
Licensee’s presentation thereof.
2. Source: © 2014 Morningstar. All Rights Reserved. The information contained herein: (1) is proprietary to Morningstar
and/or its content providers; (2) may not be copied or distributed; and (3) is not warranted to be accurate, complete or
timely. Neither Morningstar nor its content providers are responsible for any damages or losses arising from any use of
this information.
3. S&P 500: Copyright © 2014, S&P Dow Jones Indices LLC. All rights reserved. Reproduction of S&P U.S. Index data
in any form is prohibited except with the prior written permission of S&P. S&P does not guarantee the accuracy, ade-
quacy, completeness or availability of any information and is not responsible for any errors or omissions, regardless
of the cause or for the results obtained from the use of such information. S&P DISCLAIMS ANY AND ALL EXPRESS OR
IMPLIED WARRANTIES, INCLUDING, BUT NOT LIMITED TO, ANY WARRANTIES OF MERCHANTABILITY OR FITNESS FOR A
PARTICULAR PURPOSE OR USE. In no event shall S&P be liable for any direct, indirect, special or consequential dam-
ages, costs, expenses, legal fees, or losses (including lost income or lost profit and opportunity costs) in connection
with subscriber’s or others’ use of S&P U.S. Index data.
4. The IT sector comprises semiconductors and semiconductor equipment, software and services, and technology
hardware and equipment in the SOI. The consumer staples sector comprises food and staples retailing; and food,
beverage and tobacco in the SOI.
5. The health care sector comprises health care equipment and services; and pharmaceuticals, biotechnology and life
sciences in the SOI.
6. The industrials sector comprises capital goods, commercial and professional services, and transportation in the SOI.
7. No longer held at period-end.
Annual Report | 7
Performance Summary as of 4/30/14
Franklin Flex Cap Growth Fund
Your dividend income will vary depending on dividends or interest paid by securities in the Fund’s portfolio, adjusted for operating expenses of each class. Capital gain distributions are net profits realized from the sale of portfolio securities. The performance table and graphs do not reflect any taxes that a shareholder would pay on Fund dividends, capital gain distributions, if any, or any realized gains on the sale of Fund shares. Total return reflects reinvestment of the Fund’s dividends and capital gain distributions, if any, and any unrealized gains or losses.
| Net Asset Value | ||||||||
| Share Class | 4/30/14 | 4/30/13 | Change | |||||
| A (FKCGX) | $ | 53.93 | $ | 51.21 | +$ | 2.72 | ||
| C (FCIIX) | $ | 46.79 | $ | 45.70 | +$ | 1.09 | ||
| R (FRCGX) | $ | 51.99 | $ | 49.74 | +$ | 2.25 | ||
| Advisor (FKCAX) | $ | 55.40 | $ | 52.29 | +$ | 3.11 | ||
| 5/1/13 | ||||||||
| R6 (FFCRX) | $ | 55.54 | $ | 51.70 | +$ | 3.84 | ||
| Distributions | ||||||||
| Short-Term | Long-Term | |||||||
| Share Class | Capital Gain | Capital Gain | Total | |||||
| A | (5/1/13–4/30/14 | ) | $ | 0.5529 | $ | 8.0766 | $ | 8.6295 |
| C | (5/1/13–4/30/14 | ) | $ | 0.5529 | $ | 8.0766 | $ | 8.6295 |
| R | (5/1/13–4/30/14 | ) | $ | 0.5529 | $ | 8.0766 | $ | 8.6295 |
| R6 | (5/1/13–4/30/14) | $ | 0.5529 | $ | 8.0766 | $ | 8.6295 | |
| Advisor (5/1/13–4/30/14) | $ | 0.5529 | $ | 8.0766 | $ | 8.6295 | ||
8 | Annual Report
Performance Summary (continued)
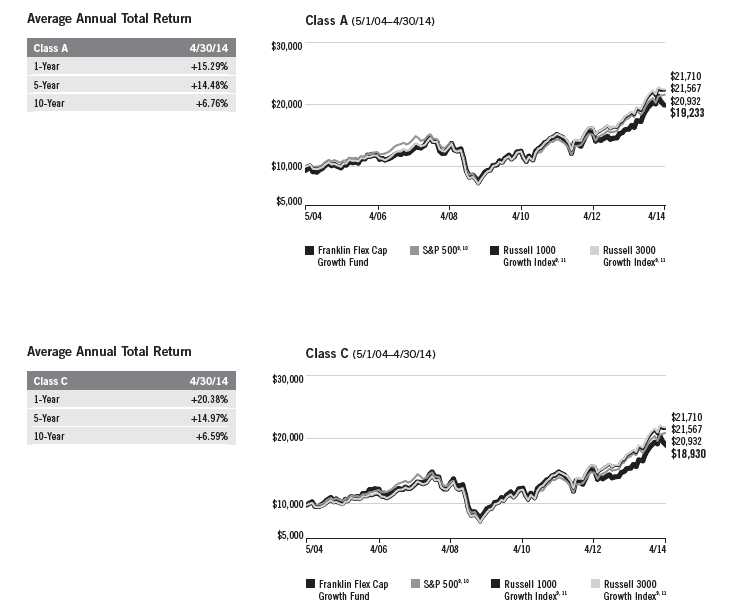
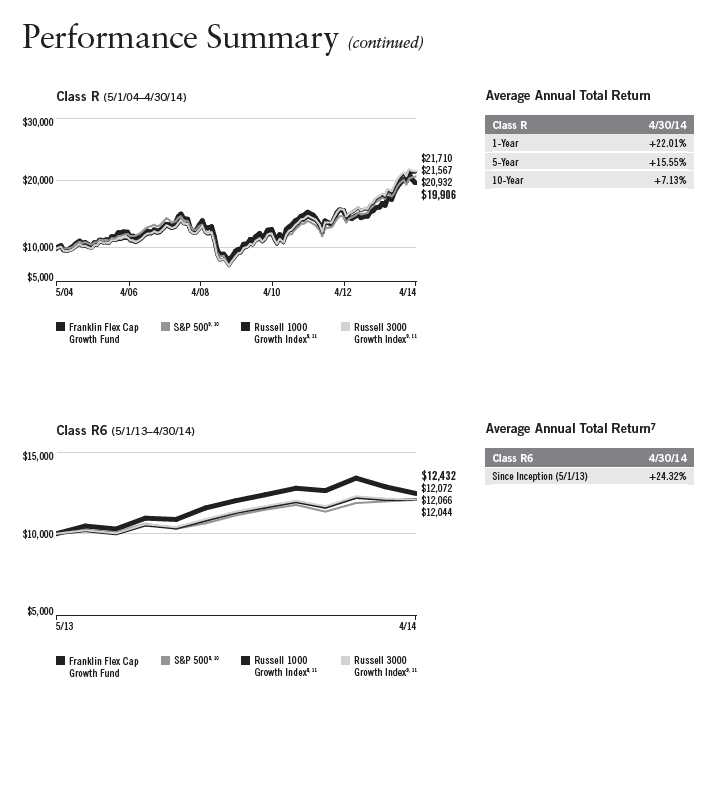
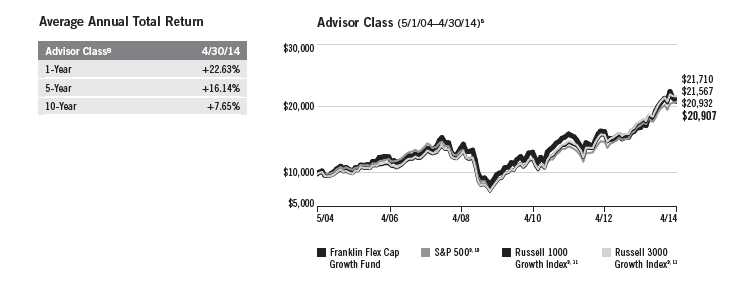
Performance as of 4/30/141
Cumulative total return excludes sales charges. Average annual total returns and value of $10,000 investment include maximum sales charges. Class A: 5.75% maximum initial sales charge; Class C: 1% contingent deferred sales charge in first year only; Class R/R6/Advisor Class: no sales charges.
| Value of | Average Annual | Total Annual | |||||||||||
| Cumulative | Average Annual | $ | 10,000 | Total Return | Operating | ||||||||
| Share Class | Total Return2 | Total Return3 | Investment4 | (3/31/14 | )5 | Expenses6 | |||||||
| A | 0.99 | % | |||||||||||
| 1-Year | + | 22.31 | % | + | 15.29 | % | $ | 11,529 | + | 19.78 | % | ||
| 5-Year | + | 108.65 | % | + | 14.48 | % | $ | 19,665 | + | 17.59 | % | ||
| 10-Year | + | 104.06 | % | + | 6.76 | % | $ | 19,233 | + | 6.89 | % | ||
| C | 1.74 | % | |||||||||||
| 1-Year | + | 21.38 | % | + | 20.38 | % | $ | 12,038 | + | 25.14 | % | ||
| 5-Year | + | 100.91 | % | + | 14.97 | % | $ | 20,091 | + | 18.10 | % | ||
| 10-Year | + | 89.30 | % | + | 6.59 | % | $ | 18,930 | + | 6.71 | % | ||
| R | 1.24 | % | |||||||||||
| 1-Year | + | 22.01 | % | + | 22.01 | % | $ | 12,201 | + | 26.76 | % | ||
| 5-Year | + | 106.02 | % | + | 15.55 | % | $ | 20,602 | + | 18.70 | % | ||
| 10-Year | + | 99.06 | % | + | 7.13 | % | $ | 19,906 | + | 7.25 | % | ||
| R67 | 0.49 | % | |||||||||||
| Since Inception (5/1/13) | + | 24.32 | % | + | 24.32 | % | $ | 12,432 | + | 28.37 | % | ||
| Advisor8 | 0.74 | % | |||||||||||
| 1-Year | + | 22.63 | % | + | 22.63 | % | $ | 12,263 | + | 27.42 | % | ||
| 5-Year | + | 111.27 | % | + | 16.14 | % | $ | 21,127 | + | 19.29 | % | ||
| 10-Year | + | 109.07 | % | + | 7.65 | % | $ | 20,907 | + | 7.78 | % |
Performance data represent past performance, which does not guarantee future results. Investment return and principal value will fluctuate, and you may have a gain or loss when you sell your shares. Current performance may differ from figures shown. For most recent month-end performance, go to franklintempleton.com or call (800) 342-5236.
Annual Report | 9
Performance Summary (continued)
Total Return Index Comparison for a Hypothetical $10,000 Investment1
Total return represents the change in value of an investment over the periods shown. It includes any applicable, maximum sales charge, Fund expenses, account fees and reinvested distributions. The unmanaged indexes include reinvestment of any income or distributions. They differ from the Fund in composition and do not pay management fees or expenses. One cannot invest directly in an index.
10 | Annual Report
Annual Report | 11
Performance Summary (continued)
All investments involve risks, including possible loss of principal. Growth stock prices reflect projections of
future earnings or revenues, and can, therefore, fall dramatically if the company fails to meet those projec-
tions. Smaller, midsized and relatively new or unseasoned companies can be particularly sensitive to changing
economic conditions, and their prospects for growth are less certain than those of larger, more established
companies. Historically, these securities have exhibited more price volatility than larger company stocks,
especially over the short term. To the extent the Fund focuses on particular countries, regions, industries,
sectors or types of investment from time to time, it may be subject to greater risks of adverse developments
in such areas of focus than a fund that invests in a wider variety of countries, regions, industries, sectors
or investments. Foreign securities involve special risks, including currency fluctuations and economic and
political uncertainties. The Fund is actively managed but there is no guarantee that the manager’s investment
decisions will produce the desired results. The Fund’s prospectus also includes a description of the main
investment risks.
Class C: These shares have higher annual fees and expenses than Class A shares.
Class R: Shares are available to certain eligible investors as described in the prospectus. These shares
have higher annual fees and expenses than Class A shares.
Class R6: Shares are available to certain eligible investors as described in the prospectus.
Advisor Class: Shares are available to certain eligible investors as described in the prospectus.
12 | Annual Report
Performance Summary (continued)
1. The Fund has a fee waiver associated with its investments in a Franklin Templeton money fund, contractually guaranteed through at least its
current fiscal year-end. Fund investment results reflect the fee waiver, to the extent applicable; without this reduction, the results would have
been lower.
2. Cumulative total return represents the change in value of an investment over the periods indicated.
3. Average annual total return represents the average annual change in value of an investment over the periods indicated.
4. These figures represent the value of a hypothetical $10,000 investment in the Fund over the periods indicated.
5. In accordance with SEC rules, we provide standardized average annual total return information through the latest calendar quarter.
6. Figures are as stated in the Fund’s current prospectus. In periods of market volatility, assets may decline significantly, causing total annual Fund
operating expenses to become higher than the figures shown.
7. Performance shown is not annualized.
8. Effective 8/2/04, the Fund began offering Advisor Class shares, which do not have sales charges or a Rule 12b-1 plan. Performance quotations for
this class reflect the following methods of calculation: (a) For periods prior to 8/2/04, a restated figure is used based upon the Fund’s Class A per-
formance, excluding the effect of Class A’s maximum initial sales charge, but reflecting the effect of the Class A Rule 12b-1 fees; and (b) for periods
after 8/2/04, actual Advisor Class performance is used reflecting all charges and fees applicable to that class. Since 8/2/04 (commencement of
sales), the cumulative and average annual total returns of Advisor Class shares were +111.64% and +8.00%.
9. Source: © 2014 Morningstar. The S&P 500 is a market capitalization-weighted index of 500 stocks designed to measure total U.S. equity market
performance. The Russell 1000 Growth Index is market capitalization weighted and measures performance of those Russell 1000 Index companies
with higher price-to-book ratios and higher forecasted growth values. The Russell 3000 Growth Index is market capitalization weighted and meas-
ures performance of those Russell 3000 Index companies with higher price-to-book ratios and higher forecasted growth values.
10. S&P 500: Copyright © 2014, S&P Dow Jones Indices LLC. All rights reserved. Reproduction of S&P U.S. Index data in any form is prohibited except
with the prior written permission of S&P. S&P does not guarantee the accuracy, adequacy, completeness or availability of any information and is not
responsible for any errors or omissions, regardless of the cause or for the results obtained from the use of such information. S&P DISCLAIMS ANY AND
ALL EXPRESS OR IMPLIED WARRANTIES, INCLUDING, BUT NOT LIMITED TO, ANY WARRANTIES OF MERCHANTABILITY OR FITNESS FOR A PARTICULAR
PURPOSE OR USE. In no event shall S&P be liable for any direct, indirect, special or consequential damages, costs, expenses, legal fees, or losses
(including lost income or lost profit and opportunity costs) in connection with subscriber’s or others’ use of S&P U.S. Index data.
11. Frank Russell Company is the source and owner of the Russell Index data contained or reflected in this material and all trademarks and copy-
rights related thereto. This is a presentation of Licensee. The presentation may contain confidential information and unauthorized use, disclosure,
copying, dissemination or redistribution is strictly prohibited. Frank Russell Company is not responsible for the formatting or configuration of this
material or for any inaccuracy in Licensee’s presentation thereof.
Annual Report | 13
Your Fund’s Expenses
Franklin Flex Cap Growth Fund
As a Fund shareholder, you can incur two types of costs:
- Transaction costs, including sales charges (loads) on Fund purchases; and
- Ongoing Fund costs, including management fees, distribution and service (12b-1) fees, and other Fund expenses. All mutual funds have ongoing costs, sometimes referred to as operating expenses.
The following table shows ongoing costs of investing in the Fund and can help you understand these costs and compare them with those of other mutual funds. The table assumes a $1,000 investment held for the six months indicated.
Actual Fund Expenses
The first line (Actual) for each share class listed in the table provides actual account values and expenses. The “Ending Account Value” is derived from the Fund’s actual return, which includes the effect of Fund expenses.
You can estimate the expenses you paid during the period by following these steps. Of course, your account value and expenses will differ from those in this illustration:
| 1. | Divide your account value by $1,000. |
| If an account had an $8,600 value, then $8,600 ÷ $1,000 = 8.6. | |
| 2. | Multiply the result by the number under the heading “Expenses Paid During Period.” |
| �� | If Expenses Paid During Period were $7.50, then 8.6 x $7.50 = $64.50. |
In this illustration, the estimated expenses paid this period are $64.50.
Hypothetical Example for Comparison with Other Funds
Information in the second line (Hypothetical) for each class in the table can help you compare ongoing costs of investing in the Fund with those of other mutual funds. This information may not be used to estimate the actual ending account balance or expenses you paid during the period. The hypothetical “Ending Account Value” is based on the actual expense ratio for each class and an assumed 5% annual rate of return before expenses, which does not represent the Fund’s actual return. The figure under the heading “Expenses Paid During Period” shows the hypothetical expenses your account would have incurred under this scenario. You can compare this figure with the 5% hypothetical examples that appear in shareholder reports of other funds.
14 | Annual Report
Your Fund’s Expenses (continued)
Please note that expenses shown in the table are meant to highlight ongoing costs and do not reflect any transaction costs, such as sales charges. Therefore, the second line for each class is useful in comparing ongoing costs only, and will not help you compare total costs of owning different funds. In addition, if transaction costs were included, your total costs would have been higher. Please refer to the Fund prospectus for additional information on operating expenses.
| Beginning Account | Ending Account | Expenses Paid During | ||||
| Share Class | Value 11/1/13 | Value 4/30/14 | Period* 11/1/13– 4/30/14 | |||
| A | ||||||
| Actual | $ | 1,000 | $ | 1,033.50 | $ | 4.84 |
| Hypothetical (5% return before expenses) | $ | 1,000 | $ | 1,020.03 | $ | 4.81 |
| C | ||||||
| Actual | $ | 1,000 | $ | 1,029.40 | $ | 8.60 |
| Hypothetical (5% return before expenses) | $ | 1,000 | $ | 1,016.31 | $ | 8.55 |
| R | ||||||
| Actual | $ | 1,000 | $ | 1,032.10 | $ | 6.10 |
| Hypothetical (5% return before expenses) | $ | 1,000 | $ | 1,018.79 | $ | 6.06 |
| R6 | ||||||
| Actual | $ | 1,000 | $ | 1,035.80 | $ | 2.42 |
| Hypothetical (5% return before expenses) | $ | 1,000 | $ | 1,022.41 | $ | 2.41 |
| Advisor | ||||||
| Actual | $ | 1,000 | $ | 1,034.60 | $ | 3.58 |
| Hypothetical (5% return before expenses) | $ | 1,000 | $ | 1,021.27 | $ | 3.56 |
*Expenses are calculated using the most recent six-month expense ratio, net of expense waivers, annualized for each class (A: 0.96%; C: 1.71%; R: 1.21%; R6: 0.48%; and Advisor: 0.71%), multiplied by the average account value over the period, multiplied by 181/365 to reflect the one-half year period.
Annual Report | 15
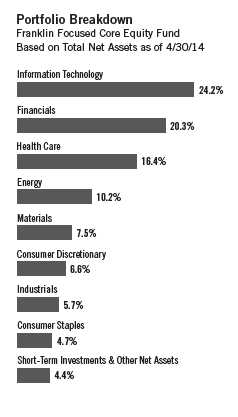
Franklin Focused Core Equity Fund
Your Fund’s Goal and Main Investments: Franklin Focused Core Equity Fund seeks capital appreciation by normally investing at least 80% of its net assets in equity securities. The Fund normally invests primarily to predominantly in equity securities of large capitalization companies, which are similar in size to those in the Standard & Poor’s 500 Index (S&P 500).
We are pleased to bring you Franklin Focused Core Equity Fund’s annual report for the fiscal year ended April 30, 2014.
Performance Overview
For the 12 months under review, Franklin Focused Core Equity Fund – Class A delivered a +28.00% cumulative total return. In comparison, the S&P 500, which tracks the broad U.S. stock market, generated a +20.44% total return.1, 2 You can find the Fund’s long-term performance data in the Performance Summary beginning on page 20.
| Performance data represent |
| past performance, which does |
| not guarantee future results. |
| Investment return and principal |
| value will fluctuate, and you may |
| have a gain or loss when you sell |
| your shares. Current performance |
| may differ from figures shown. |
| Please visit franklintempleton.com |
| or call (800) 342-5236 for most |
| recent month-end performance. |
Investment Strategy
We are research-driven, bottom-up, fundamental investors. Our investment approach is opportunistic and contrarian, and we seek to identify mispriced companies using fundamental analysis. We seek to take advantage of price dislocations that result from the market’s short-term focus. Our analysis includes the investigation of the valuation for each investment based upon the view that the price paid for the security is a critical factor determining long-term success. We rely on a team of analysts to help provide in-depth industry expertise and use both qualitative and quantitative analysis to evaluate companies. Our analysts identify each company’s market opportunity, competitive position, management and financial strength, business and financial risks, and valuation. We choose to invest in those companies that, in our opinion, offer the best trade-off between growth opportunity, business and financial risk, and valuation.
The dollar value, number of shares or principal amount, and names of all portfolio holdings are listed in the Fund’s Statement of Investments (SOI). The SOI begins on page 77.
16 | Annual Report
Manager’s Discussion
In a strong 12-month period for the stock market, all investment sectors represented in the Fund’s portfolio, particularly health care, information technology (IT), financials and consumer discretionary, contributed to absolute performance.
Pharmaceutical stocks supported returns in the health care sector as shares of Valeant Pharmaceuticals International, Actavis and Allergan rallied. Canada-based Valeant’s shares advanced after the specialty pharmaceutical company announced a definitive agreement to acquire eye health company Bausch & Lomb Holdings. Valeant reported better-than-expected earnings in recent quarters and provided a solid revenue and earnings forecast for 2014. Toward period-end, the company proposed a merger with Allergan using a combination of cash and stock, which also boosted Valeant’s share price. Generic drug maker Actavis’s share price gained after the company announced the acquisition of Forest Laboratories to strengthen its specialty pharmaceuticals portfolio. Actavis also reported strong full-year 2013 results, backed by organic growth as well as strong revenues and operational synergies resulting from the Warner Chilcott acquisition, which was completed in October 2013. The share price of specialty pharmaceutical company Allergan, a new holding, rose after the company obtained new patents for drugs treating glaucoma and dry eye, delaying the potential threat of generic entrants. Allergan’s shares also advanced after the company reported higher earnings and received a takeover bid from Valeant. However, Allergan adopted a “poison pill” defense that would allow existing shareholders to buy the company’s stock at a discount if any unapproved investor acquires more than 10% of its shares.
Internet giant Google and leading specialty glass products maker Corning aided the Fund’s return in the IT sector. Google’s share price rose after the company reported stronger-than-expected third-quarter 2013 earnings, driven largely by its advertising business. During the period, the company sold its loss-making Motorola Mobility unit to Lenovo. Toward period-end, Google potentially avoided a heavy fine as it reached a settlement with European Union antitrust regulators and agreed to provide comparable prominence in online search results to competitors’ services. Corning’s shares advanced after the company announced an agreement to take full ownership of South Korean liquid crystal display (LCD) glass manufacturer Samsung Corning Precision Materials, its joint venture with Samsung Electronics subsidiary Samsung Display. Corning also reached a 10-year LCD glass supply agreement with Samsung Display. The company’s shares were further supported by Corning’s solid first-quarter 2014 results and authorization of an additional $2 billion share repurchase program through the end of 2015.
Annual Report | 17
| Top 10 Equity Holdings | ||
| Franklin Focused Core Equity Fund | ||
| 4/30/14 | ||
| Company | % of Total | |
| Sector/Industry | Net Assets | |
| Allergan Inc. | 4.4 | % |
| Health Care | ||
| The Hartford Financial Services | ||
| Group Inc. | 4.4 | % |
| Financials | ||
| Valeant Pharmaceuticals International | ||
| Inc. (Canada) | 4.1 | % |
| Health Care | ||
| Adobe Systems Inc. | 3.7 | % |
| Information Technology | ||
| Motorola Solutions Inc. | 3.5 | % |
| Information Technology | ||
| CBRE Group Inc. | 3.4 | % |
| Financials | ||
| Microsoft Corp. | 3.3 | % |
| Information Technology | ||
| LyondellBasell Industries NV, A | 3.0 | % |
| Materials | ||
| MetLife Inc. | 3.0 | % |
| Financials | ||
| Actavis PLC | 3.0 | % |
| Health Care | ||
In the financials sector, property and casualty insurer The Hartford Financial Services Group’s share price rose after the company increased the quarterly dividend payment by 50% and reported better-than-expected first-quarter 2014 earnings. Toward period-end, Japanese leasing company Orix agreed to buy Hartford’s Japanese life insurance unit, subject to regulatory approval. Consumer discretionary sector holding BorgWarner’s share price increased as the automotive components manufacturer reported stronger-than-expected quarterly earnings and raised its full-year 2014 earnings guidance, primarily because of the acquisition of global powertrain supplier Gustav Wahler.
Elsewhere, materials sector holding LyondellBasell Industries, a chemical and polymer manufacturer, was a notable contributor to absolute Fund performance as the firm reported record earnings for 2013. LyondellBasell generated solid free cash flow and maintained a healthy balance sheet amid a challenging revenue environment resulting largely from weakness in its intermediate chemicals and refining segments. The company reported better-than-expected fourth-quarter earnings aided by a favorable North American natural gas market. LyondellBasell also announced an additional share buyback program and increased its first-quarter 2014 dividend. Global express delivery services provider FedEx reported strong earnings, driven largely by higher ground shipping revenues. FedEx announced plans to raise domestic express shipping rates and to repurchase up to 32 million shares. Oilfield services company Schlumberger reported better-than-expected quarterly earnings as revenues from the Middle East, Asia and the Gulf of Mexico rose.
Nearly all Fund positions contributed to absolute performance, but some notable detractors were global IT software and services provider International Business Machines (IBM)3 and chemicals and buildings products manufacturer Axiall. IBM reported muted quarterly results amid weakness in emerging markets and the hardware business. The company sold its low-end server unit to Lenovo to focus on higher-margin segments such as cloud computing. Pressuring Axiall shares were a net loss in the first quarter of 2013, lower third-quarter 2013 profit guidance and subsequently disappointing quarterly earnings, partially resulting from lower operating rates and higher-than-planned outage costs. Axiall also forecast that its first-quarter 2014 earnings would be affected by severe winter weather and higher maintenance costs.
18 | Annual Report
Thank you for your continued participation in Franklin Focused Core Equity Fund. We look forward to serving your future investment needs.
Portfolio Management Team
Franklin Focused Core Equity Fund
The foregoing information reflects our analysis, opinions and portfolio holdings as of April 30, 2014, the end of the reporting period. The way we implement our main investment strategies and the resulting portfolio holdings may change depending on factors such as market and economic conditions. These opinions may not be relied upon as investment advice or an offer for a particular security. The information is not a complete analysis of every aspect of any market, country, industry, security or the Fund. Statements of fact are from sources considered reliable, but the investment manager makes no representation or warranty as to their completeness or accuracy. Although historical performance is no guarantee of future results, these insights may help you understand our investment management philosophy.
The index is unmanaged and includes reinvested dividends. One cannot invest directly in an index, and an index is not representative of the Fund’s portfolio.
1. Source: © 2014 Morningstar. All Rights Reserved. The information contained herein: (1) is proprietary to Morningstar and/or its content providers; (2) may not be copied or distributed; and (3) is not warranted to be accurate, complete or timely. Neither Morningstar nor its content providers are responsible for any damages or losses arising from any use of this information.
2. S&P 500: Copyright © 2014, S&P Dow Jones Indices LLC. All rights reserved. Reproduction of S&P U.S. Index data in any form is prohibited except with the prior written permission of S&P. S&P does not guarantee the accuracy, adequacy, completeness or availability of any information and is not responsible for any errors or omissions, regardless of the cause or for the results obtained from the use of such information. S&P DISCLAIMS ANY AND ALL EXPRESS OR IMPLIED WARRANTIES, INCLUDING, BUT NOT LIMITED TO, ANY WARRANTIES OF MERCHANTABILITY OR FITNESS FOR A PARTICULAR PURPOSE OR USE. In no event shall S&P be liable for any direct, indirect, special or consequential damages, costs, expenses, legal fees, or losses (including lost income or lost profit and opportunity costs) in connection with subscriber’s or others’ use of S&P U.S. Index data.
3. Sold by period-end.
Annual Report | 19
Performance Summary as of 4/30/14
Franklin Focused Core Equity Fund
Your dividend income will vary depending on dividends or interest paid by securities in the Fund’s portfolio, adjusted for operating expenses of each class. Capital gain distributions are net profits realized from the sale of portfolio securities. The performance table and graphs do not reflect any taxes that a shareholder would pay on Fund dividends, capital gain distributions, if any, or any realized gains on the sale of Fund shares. Total return reflects reinvestment of the Fund’s dividends and capital gain distributions, if any, and any unrealized gains or losses.
| Net Asset Value | ||||||||
| Share Class | 4/30/14 | 4/30/13 | Change | |||||
| A (FCEQX) | $ | 13.38 | $ | 10.63 | +$ | 2.75 | ||
| C (n/a) | $ | 12.98 | $ | 10.36 | +$ | 2.62 | ||
| R (n/a) | $ | 13.28 | $ | 10.56 | +$ | 2.72 | ||
| Advisor (n/a) | $ | 13.48 | $ | 10.70 | +$ | 2.78 | ||
| 5/1/13 | ||||||||
| R6 (n/a) | $ | 13.49 | $ | 10.54 | +$ | 2.95 | ||
| Distributions | ||||||||
| Dividend | Long-Term | |||||||
| Share Class | Income | Capital Gain | Total | |||||
| A | (5/1/13–4/30/14 | ) | $ | 0.0738 | $ | 0.1327 | $ | 0.2065 |
| C | (5/1/13–4/30/14 | ) | $ | 0.0288 | $ | 0.1327 | $ | 0.1615 |
| R | (5/1/13–4/30/14 | ) | $ | 0.0550 | $ | 0.1327 | $ | 0.1877 |
| R6 | (5/1/13–4/30/14) | $ | 0.1025 | $ | 0.1327 | $ | 0.2352 | |
| Advisor | (5/1/13–4/30/14) | $ | 0.0916 | $ | 0.1327 | $ | 0.2243 | |
20 | Annual Report
Performance Summary (continued)
Performance as of 4/30/141
Cumulative total return excludes sales charges. Average annual total returns and value of $10,000 investment include maximum sales charges. Class A: 5.75% maximum initial sales charge; Class C: 1% contingent deferred sales charge in first year only; Class R/R6/Advisor Class: no sales charges.
| Value of | Average Annual | ||||||||||||||
| Cumulative | Average Annual | $ | 10,000 | Total Return | Total Annual Operating Expenses 6 | ||||||||||
| Share Class | Total Return2 | Total Return 3 | Investment 4 | (3/31/14 | ) 5 | (with waiver) | (without waiver) | ||||||||
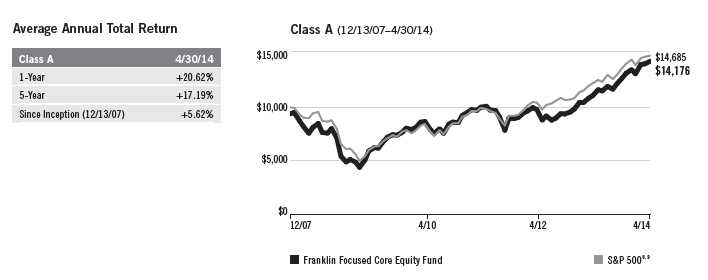
| A | 1.31 | % | 1.90 | % | |||||||||||
| 1-Year | + | 28.00 | % | + | 20.62 | % | $ | 12,062 | + | 21.11 | % | ||||
| 5-Year | + | 134.39 | % | + | 17.19 | % | $ | 22,099 | + | 20.29 | % | ||||
| Since Inception (12/13/07) | + | 50.40 | % | + | 5.62 | % | $ | 14,176 | + | 5.42 | % | ||||
| C | 2.01 | % | 2.60 | % | |||||||||||
| 1-Year | + | 26.99 | % | + | 25.99 | % | $ | 12,599 | + | 26.62 | % | ||||
| 5-Year | + | 125.74 | % | + | 17.68 | % | $ | 22,574 | + | 20.85 | % | ||||
| Since Inception (12/13/07) | + | 43.73 | % | + | 5.85 | % | $ | 14,373 | + | 5.67 | % | ||||
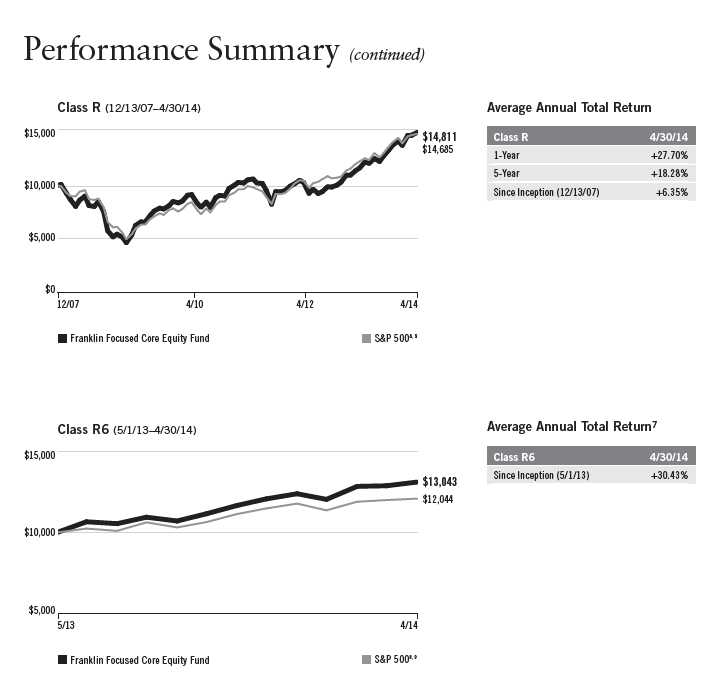
| R | 1.51 | % | 2.10 | % | |||||||||||
| 1-Year | + | 27.70 | % | + | 27.70 | % | $ | 12,770 | + | 28.26 | % | ||||
| 5-Year | + | 131.54 | % | + | 18.28 | % | $ | 23,154 | + | 21.42 | % | ||||
| Since Inception (12/13/07) | + | 48.11 | % | + | 6.35 | % | $ | 14,811 | + | 6.15 | % | ||||
| R67 | 0.81 | % | 1.40 | % | |||||||||||
| Since Inception (5/1/13) | + | 30.43 | % | + | 30.43 | % | $ | 13,043 | + | 28.21 | % | ||||
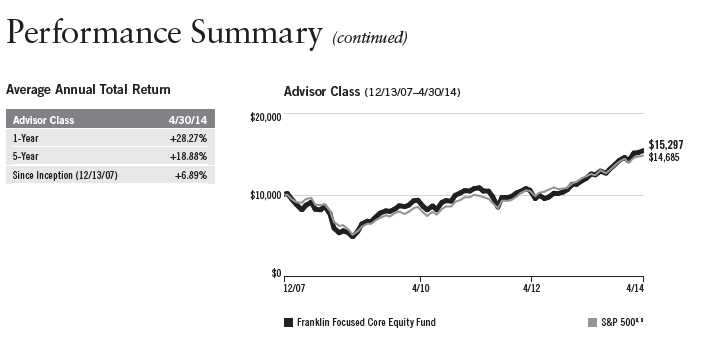
| Advisor | 1.01 | % | 1.60 | % | |||||||||||
| 1-Year | + | 28.27 | % | + | 28.27 | % | $ | 12,827 | + | 28.95 | % | ||||
| 5-Year | + | 137.40 | % | + | 18.88 | % | $ | 23,740 | + | 22.03 | % | ||||
| Since Inception (12/13/07) | + | 52.97 | % | + | 6.89 | % | $ | 15,297 | + | 6.70 | % | ||||
Performance data represent past performance, which does not guarantee future results. Investment return and principal value will fluctuate, and you may have a gain or loss when you sell your shares. Current performance may differ from figures shown. For most recent month-end performance, go to franklintempleton.com or call (800) 342-5236.
Annual Report | 21
Performance Summary (continued)
Total Return Index Comparison for a Hypothetical $10,000 Investment1
Total return represents the change in value of an investment over the periods shown. It includes any applicable, maximum sales charge, Fund expenses, account fees and reinvested distributions. The unmanaged index includes reinvestment of any income or distributions. It differs from the Fund in composition and does not pay management fees or expenses. One cannot invest directly in an index.

22 | Annual Report
Annual Report | 23
All investments involve risks, including possible loss of principal. To the extent the Fund focuses on particular countries, regions, industries,
sectors or types of investment from time to time, it may be subject to greater risks of adverse developments in such areas of focus than a fund
that invests in a wider variety of countries, regions, industries, sectors or investments. The Fund may have investments in both growth and value
stocks, or in stocks with characteristics of both. Growth stock prices reflect projections of future earnings or revenues, and can, therefore,
fall dramatically if the company fails to meet those projections. A value stock may not increase in price as anticipated by the investment man-
ager if other investors fail to recognize the company’s value and bid up the price, the markets favor faster growing companies, or the factors
that the investment manager believes will increase the price of the security do not occur. Foreign securities involve special risks, including
currency fluctuations and economic and political uncertainties. The Fund is actively managed but there is no guarantee that the manager’s
investment decisions will produce the desired results. The Fund’s prospectus also includes a description of the main investment risks.
Class C: These shares have higher annual fees and expenses than Class A shares.
Class R: Shares are available to certain eligible investors as described in the prospectus. These shares have higher annual fees and
expenses than Class A shares.
Class R6: Shares are available to certain eligible investors as described in the prospectus.
Advisor Class: Shares are available to certain eligible investors as described in the prospectus.
1. The Fund has an expense reduction contractually guaranteed through at least 8/31/14 and a fee waiver associated with its investments in a
Franklin Templeton money fund, contractually guaranteed through at least its current fiscal year-end. Fund investment results reflect the expense
reduction and fee waiver, to the extent applicable; without these reductions, the results would have been lower.
2. Cumulative total return represents the change in value of an investment over the periods indicated.
3. Average annual total return represents the average annual change in value of an investment over the periods indicated.
4. These figures represent the value of a hypothetical $10,000 investment in the Fund over the periods indicated.
5. In accordance with SEC rules, we provide standardized average annual total return information through the latest calendar quarter.
6. Figures are as stated in the Fund’s current prospectus. In periods of market volatility, assets may decline significantly, causing total annual Fund
operating expenses to become higher than the figures shown.
7. Performance shown is not annualized.
8. Source: © 2014 Morningstar. The S&P 500 is a market capitalization-weighted index of 500 stocks designed to measure total U.S. equity market
performance.
9. S&P 500: Copyright © 2014, S&P Dow Jones Indices LLC. All rights reserved. Reproduction of S&P U.S. Index data in any form is prohibited except
with the prior written permission of S&P. S&P does not guarantee the accuracy, adequacy, completeness or availability of any information and is not
responsible for any errors or omissions, regardless of the cause or for the results obtained from the use of such information. S&P DISCLAIMS ANY
AND ALL EXPRESS OR IMPLIED WARRANTIES, INCLUDING, BUT NOT LIMITED TO, ANY WARRANTIES OF MERCHANTABILITY OR FITNESS FOR A PARTICULAR
PURPOSE OR USE. In no event shall S&P be liable for any direct, indirect, special or consequential damages, costs, expenses, legal fees, or losses
(including lost income or lost profit and opportunity costs) in connection with subscriber’s or others’ use of S&P U.S. Index data.
24 | Annual Report
Your Fund’s Expenses
Franklin Focused Core Equity Fund
As a Fund shareholder, you can incur two types of costs:
- Transaction costs, including sales charges (loads) on Fund purchases; and
- Ongoing Fund costs, including management fees, distribution and service (12b-1) fees, and other Fund expenses. All mutual funds have ongoing costs, sometimes referred to as operating expenses.
The following table shows ongoing costs of investing in the Fund and can help you understand these costs and compare them with those of other mutual funds. The table assumes a $1,000 investment held for the six months indicated.
Actual Fund Expenses
The first line (Actual) for each share class listed in the table provides actual account values and expenses. The “Ending Account Value” is derived from the Fund’s actual return, which includes the effect of Fund expenses.
You can estimate the expenses you paid during the period by following these steps. Of course, your account value and expenses will differ from those in this illustration:
| 1. | Divide your account value by $1,000. |
| If an account had an $8,600 value, then $8,600 ÷ $1,000 = 8.6. | |
| 2. | Multiply the result by the number under the heading “Expenses Paid During Period.” |
| If Expenses Paid During Period were $7.50, then 8.6 x $7.50 = $64.50. |
In this illustration, the estimated expenses paid this period are $64.50.
Hypothetical Example for Comparison with Other Funds
Information in the second line (Hypothetical) for each class in the table can help you compare ongoing costs of investing in the Fund with those of other mutual funds. This information may not be used to estimate the actual ending account balance or expenses you paid during the period. The hypothetical “Ending Account Value” is based on the actual expense ratio for each class and an assumed 5% annual rate of return before expenses, which does not represent the Fund’s actual return. The figure under the heading “Expenses Paid During Period” shows the hypothetical expenses your account would have incurred under this scenario. You can compare this figure with the 5% hypothetical examples that appear in shareholder reports of other funds.
Annual Report | 25
Your Fund’s Expenses (continued)
Please note that expenses shown in the table are meant to highlight ongoing costs and do not reflect any transaction costs, such as sales charges. Therefore, the second line for each class is useful in comparing ongoing costs only, and will not help you compare total costs of owning different funds. In addition, if transaction costs were included, your total costs would have been higher. Please refer to the Fund prospectus for additional information on operating expenses.
| Beginning Account | Ending Account | Expenses Paid During | ||||
| Share Class | Value 11/1/13 | Value 4/30/14 | Period* 11/1/13– 4/30/14 | |||
| A | ||||||
| Actual | $ | 1,000 | $ | 1,119.80 | $ | 6.62 |
| Hypothetical (5% return before expenses) | $ | 1,000 | $ | 1,018.55 | $ | 6.31 |
| C | ||||||
| Actual | $ | 1,000 | $ | 1,114.90 | $ | 10.23 |
| Hypothetical (5% return before expenses) | $ | 1,000 | $ | 1,015.12 | $ | 9.74 |
| R | ||||||
| Actual | $ | 1,000 | $ | 1,118.20 | $ | 7.62 |
| Hypothetical (5% return before expenses) | $ | 1,000 | $ | 1,017.60 | $ | 7.25 |
| R6 | ||||||
| Actual | $ | 1,000 | $ | 1,121.30 | $ | 4.21 |
| Hypothetical (5% return before expenses) | $ | 1,000 | $ | 1,020.83 | $ | 4.01 |
| Advisor | ||||||
| Actual | $ | 1,000 | $ | 1,120.40 | $ | 4.99 |
| Hypothetical (5% return before expenses) | $ | 1,000 | $ | 1,020.08 | $ | 4.76 |
*Expenses are calculated using the most recent six-month expense ratio, net of expense waivers, annualized for each class (A: 1.26%; C: 1.95%; R: 1.45%; R6: 0.80%; and Advisor: 0.95%), multiplied by the average account value over the period, multiplied by 181/365 to reflect the one-half year period.
26 | Annual Report
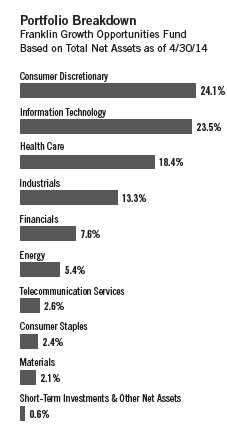
Franklin Growth Opportunities Fund
Your Fund’s Goal and Main Investments: Franklin Growth Opportunities Fund seeks capital appreciation by normally investing substantially in equity securities of companies demonstrating accelerating growth, increasing profitability, or above-average growth or growth potential, when compared with the overall economy.
This annual report for Franklin Growth Opportunities Fund covers the fiscal year ended April 30, 2014.
Performance Overview
For the 12 months under review, Franklin Growth Opportunities Fund – Class A delivered a +20.26% cumulative total return. For comparison, the Fund’s narrow benchmark, the Russell 3000 Growth Index, which measures performance of Russell 3000 Index companies with higher price-to-book ratios and higher forecasted growth values, generated a +20.72% total return.1, 2 The Fund’s broad benchmark, the Standard & Poor’s 500 Index (S&P 500), which tracks the broad U.S. stock market, produced a +20.44% total return.2, 3 You can find the Fund’s long-term performance data in the Performance Summary beginning on page 30.
| Performance data represent |
| past performance, which does |
| not guarantee future results. |
| Investment return and principal |
| value will fluctuate, and you may |
| have a gain or loss when you sell |
| your shares. Current performance |
| may differ from figures shown. |
| Please visit franklintempleton.com |
| or call (800) 342-5236 for most |
| recent month-end performance. |
Investment Strategy
We use fundamental, bottom-up research to seek companies meeting our criteria of growth potential, quality and valuation. In seeking sustainable growth characteristics, we look for companies we believe can produce sustainable earnings and cash flow growth, evaluating the long-term market opportunity and competitive structure of an industry to target leaders and emerging leaders. We define quality companies as those with strong and improving competitive positions in attractive markets. We also believe important attributes of quality are experienced and talented management teams as well as financial strength reflected in the capital structure, gross and operating margins, free cash flow generation and returns on capital employed. Our valuation analysis includes a range of potential outcomes based on an assessment of multiple scenarios. In assessing value, we consider whether security prices fully reflect the balance of the sustainable growth opportunities relative to business and financial risks.
The dollar value, number of shares or principal amount, and names of all portfolio holdings are listed in the Fund’s Statement of Investments (SOI). The SOI begins on page 84.
Annual Report | 27
Manager’s Discussion
The Fund performed comparably to its benchmark, the Russell 3000 Growth Index, for the 12 months under review as holdings across several sectors contributed to relative performance. Stock selection in the health care and financials sectors, along with stock selection and an underweighting in the consumer staples sector, benefited relative returns.
Biotechnology firm Gilead Sciences, generic pharmaceutical company Actavis and specialty biopharmaceutical firm Jazz Pharmaceuticals, a new holding this period, helped relative health care sector performance. Gilead, a health care firm specializing in developing antiviral and cardiopulmonary drugs, reported solid revenue and earnings in fiscal year 2013 following strong product sales. The U.S. Food and Drug Administration approved Gilead’s hepatitis C virus treatment Sovaldi, which boosted the firm’s performance in the first quarter of 2014. Actavis’s shares gained after the company announced the acquisition of Forest Laboratories to strengthen its specialty pharmaceuticals portfolio. Actavis also reported strong full-year 2013 and first-quarter 2014 results, backed by organic growth as well as strong revenues and operational synergies resulting from the Warner Chilcott acquisition, which was completed in October 2013. In the financials sector, Signature Bank contributed to relative returns as the full-service commercial bank continued to generate strong quarterly revenue and earnings growth, led by robust deposit and loan growth. The bank, which operates in the New York metropolitan area, benefited from its client-centric model, which includes hiring seasoned private-client banking teams. Outside of these sectors, global payments and technology company MasterCard, apparel and footwear manufacturer Under Armour and social networking site Facebook aided relative performance.
In contrast, stock selection in the materials, industrials and energy sectors detracted from the Fund’s performance relative to the benchmark. Chemical manufacturing company Axiall in the materials sector lost value as the company signaled lower third-quarter 2013 earnings because of lower operating rates and higher-than-planned outage costs.4 The company also forecast that its first-quarter 2014 earnings would be affected by severe winter weather and higher maintenance costs. Railroad company Kansas City Southern in the industrials sector hindered relative performance as the firm’s fourth-quarter 2013 revenue and earnings fell short of expectations. The stock was also weighed down by the possibility of changes to Mexican rail regulations that could result in more competition and lower profitability. In the energy sector, oil exploration and production company Cobalt International Energy failed to find commercially viable oil at one of its Gulf of Mexico wells.4 Furthermore, toward the end of 2013, the stock fell amid concerns that Cobalt might not be able to profit from its larger-than-expected natural gas discovery in Angola.
28 | Annual Report
Other key detractors were biotechnology company ARIAD Pharmaceuticals,4 Canada-based athletic apparel maker Lululemon Athletica4, 5 and a new position in specialty retailer of manufactured and natural stone tiles Tile Shop Holdings.
Thank you for your continued participation in Franklin Growth Opportunities Fund. We look forward to serving your future investment needs.
| Top 10 Holdings | ||
| Franklin Growth Opportunities Fund | ||
| 4/30/14 | ||
| Company | % of Total | |
| Sector/Industry | Net Assets | |
| Gilead Sciences Inc. | 4.3 | % |
| Health Care | ||
| Google Inc., A & C | 3.8 | % |
| Information Technology | ||
| Actavis PLC | 2.8 | % |
| Health Care | ||
| MasterCard Inc., A | 2.8 | % |
| Information Technology | ||
| SBA Communications Corp. | 2.6 | % |
| Telecommunication Services | ||
| Amazon.com Inc. | 2.6 | % |
| Consumer Discretionary | ||
| Precision Castparts Corp. | 2.3 | % |
| Industrials | ||
| Las Vegas Sands Corp. | 2.3 | % |
| Consumer Discretionary | ||
| The Priceline Group Inc. | 2.1 | % |
| Consumer Discretionary | ||
| Facebook Inc., A | 1.9 | % |
| Information Technology | ||
The foregoing information reflects our analysis, opinions and portfolio holdings as of April 30, 2014, the end of the
reporting period. The way we implement our main investment strategies and the resulting portfolio holdings may
change depending on factors such as market and economic conditions. These opinions may not be relied upon as
investment advice or an offer for a particular security. The information is not a complete analysis of every aspect
of any market, country, industry, security or the Fund. Statements of fact are from sources considered reliable,
but the investment manager makes no representation or warranty as to their completeness or accuracy. Although
historical performance is no guarantee of future results, these insights may help you understand our investment
management philosophy.
The index is unmanaged and includes reinvested dividends. One cannot invest directly in an index, and an index is not
representative of the Fund’s portfolio.
1. Frank Russell Company is the source and owner of the Russell Index data contained or reflected in this material and
all trademarks and copyrights related thereto. This is a presentation of Licensee. The presentation may contain con-
fidential information and unauthorized use, disclosure, copying, dissemination or redistribution is strictly prohibited.
Frank Russell Company is not responsible for the formatting or configuration of this material or for any inaccuracy in
Licensee’s presentation thereof.
2. Source: © 2014 Morningstar. All Rights Reserved. The information contained herein: (1) is proprietary to Morningstar
and/or its content providers; (2) may not be copied or distributed; and (3) is not warranted to be accurate, complete or
timely. Neither Morningstar nor its content providers are responsible for any damages or losses arising from any use of
this information.
3. S&P 500: Copyright © 2014, S&P Dow Jones Indices LLC. All rights reserved. Reproduction of S&P U.S. Index data
in any form is prohibited except with the prior written permission of S&P. S&P does not guarantee the accuracy, ade-
quacy, completeness or availability of any information and is not responsible for any errors or omissions, regardless
of the cause or for the results obtained from the use of such information. S&P DISCLAIMS ANY AND ALL EXPRESS OR
IMPLIED WARRANTIES, INCLUDING, BUT NOT LIMITED TO, ANY WARRANTIES OF MERCHANTABILITY OR FITNESS FOR
A PARTICULAR PURPOSE OR USE. In no event shall S&P be liable for any direct, indirect, special or consequential dam-
ages, costs, expenses, legal fees, or losses (including lost income or lost profit and opportunity costs) in connection
with subscriber’s or others’ use of S&P U.S. Index data.
4. Sold by period-end.
5. Not part of the index.
Annual Report | 29
Performance Summary as of 4/30/14
Franklin Growth Opportunities Fund
Your dividend income will vary depending on dividends or interest paid by securities in the Fund’s portfolio, adjusted for operating expenses of each class. Capital gain distributions are net profits realized from the sale of portfolio securities. The performance table and graphs do not reflect any taxes that a shareholder would pay on Fund dividends, capital gain distributions, if any, or any realized gains on the sale of Fund shares. Total return reflects reinvestment of the Fund’s dividends and capital gain distributions, if any, and any unrealized gains or losses.
| Net Asset Value | ||||||
| Share Class | 4/30/14 | 4/30/13 | Change | |||
| A (FGRAX) | $ | 28.48 | $ | 24.29 | +$ | 4.19 |
| C (FKACX) | $ | 25.41 | $ | 21.89 | +$ | 3.52 |
| R (FKARX) | $ | 27.67 | $ | 23.67 | +$ | 4.00 |
| Advisor (FRAAX) | $ | 29.93 | $ | 25.43 | +$ | 4.50 |
| 5/1/13 | ||||||
| R6 (FOPPX) | $ | 29.98 | $ | 24.99 | +$ | 4.99 |
| Distributions | |||
| Long-Term | |||
| Share Class | Capital Gain | ||
| A | (5/1/13–4/30/14) | $ | 0.7279 |
| C | (5/1/13–4/30/14) | $ | 0.7279 |
| R | (5/1/13–4/30/14) | $ | 0.7279 |
| R6 | (5/1/13–4/30/14) | $ | 0.7279 |
| Advisor | (5/1/13–4/30/14) | $ | 0.7279 |
30 | Annual Report
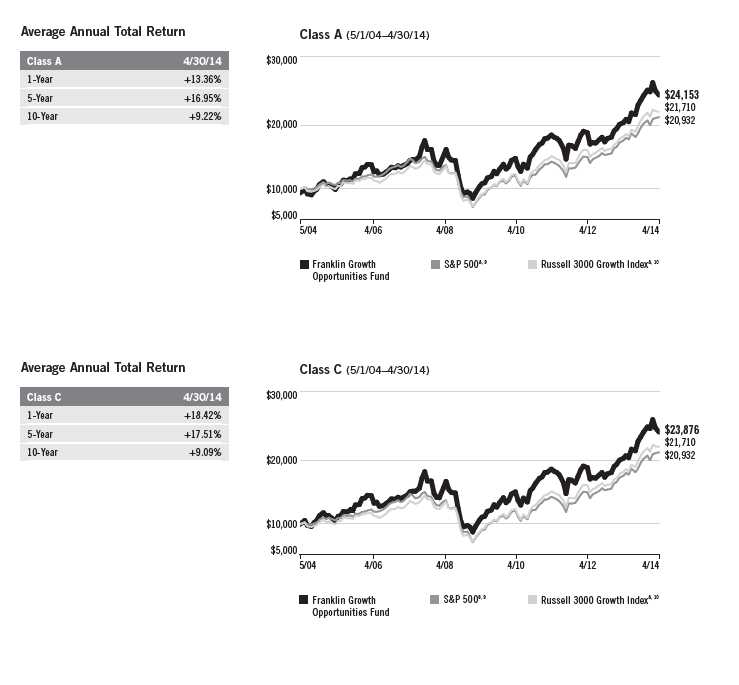
Performance Summary (continued)
Performance as of 4/30/141
Cumulative total return excludes sales charges. Average annual total return and value of $10,000 investment include maximum sales charges. Class A: 5.75% maximum initial sales charge; Class C: 1% contingent deferred sales charge in first year only; Class R/R6/Advisor Class: no sales charges.
| Value of | Average Annual | Total Annual | |||||||||||
| Cumulative | Average Annual | $ | 10,000 | Total Return | Operating | ||||||||
| Share Class | Total Return2 | Total Return3 | Investment4 | (3/31/14 | )5 | Expenses6 | |||||||
| A | 1.25 | % | |||||||||||
| 1-Year | + | 20.26 | % | + | 13.36 | % | $ | 11,336 | + | 18.39 | % | ||
| 5-Year | + | 132.14 | % | + | 16.95 | % | $ | 21,874 | + | 19.94 | % | ||
| 10-Year | + | 156.33 | % | + | 9.22 | % | $ | 24,153 | + | 9.11 | % | ||
| C | 1.97 | % | |||||||||||
| 1-Year | + | 19.42 | % | + | 18.42 | % | $ | 11,842 | + | 23.79 | % | ||
| 5-Year | + | 124.05 | % | + | 17.51 | % | $ | 22,405 | + | 20.52 | % | ||
| 10-Year | + | 138.76 | % | + | 9.09 | % | $ | 23,876 | + | 8.99 | % | ||
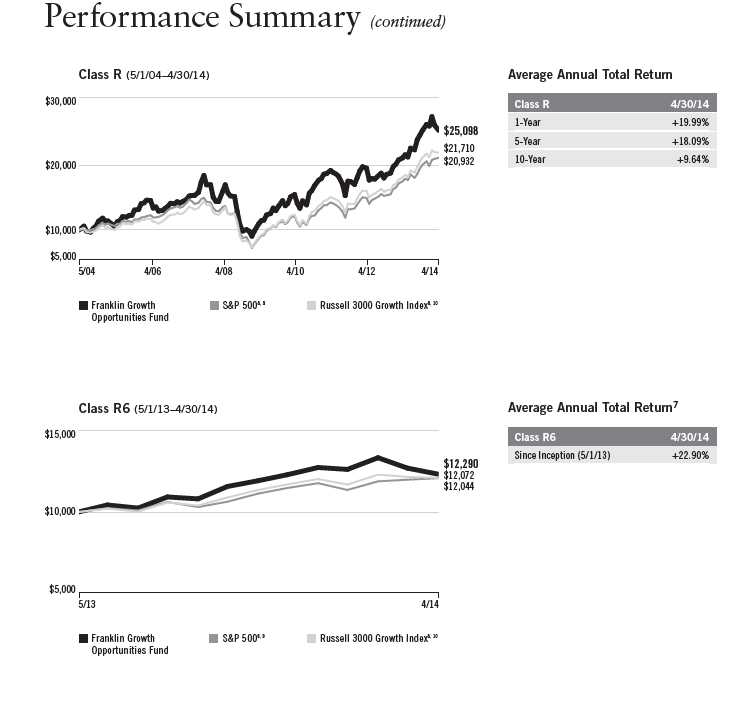
| R | 1.47 | % | |||||||||||
| 1-Year | + | 19.99 | % | + | 19.99 | % | $ | 11,999 | + | 25.43 | % | ||
| 5-Year | + | 129.68 | % | + | 18.09 | % | $ | 22,968 | + | 21.12 | % | ||
| 10-Year | + | 150.98 | % | + | 9.64 | % | $ | 25,098 | + | 9.55 | % | ||
| R67 | 0.76 | % | |||||||||||
| Since Inception (5/1/13) | + | 22.90 | % | + | 22.90 | % | $ | 12,290 | + | 26.55 | % | ||
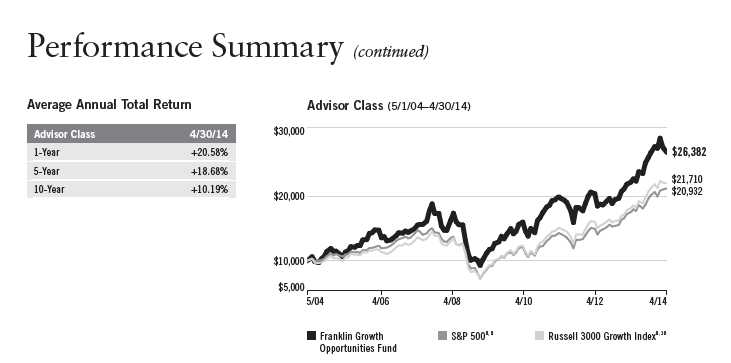
| Advisor | 0.97 | % | |||||||||||
| 1-Year | + | 20.58 | % | + | 20.58 | % | $ | 12,058 | + | 25.99 | % | ||
| 5-Year | + | 135.43 | % | + | 18.68 | % | $ | 23,543 | + | 21.73 | % | ||
| 10-Year | + | 163.82 | % | + | 10.19 | % | $ | 26,382 | + | 10.09 | % |
Performance data represent past performance, which does not guarantee future results. Investment return and principal value will fluctuate, and you may have a gain or loss when you sell your shares. Current performance may differ from figures shown. For most recent month-end performance, go to franklintempleton.com or call (800) 342-5236.
Annual Report | 31
Performance Summary (continued)
Total Return Index Comparison for a Hypothetical $10,000 Investment1
Total return represents the change in value of an investment over the periods shown. It includes any applicable, maximum sales charge, Fund expenses, account fees and reinvested distributions. The unmanaged indexes include reinvestment of any income or distributions. They differ from the Fund in composition and do not pay management fees or expenses. One cannot invest directly in an index.
Annual Report | 33
All investments involve risks, including possible loss of principal. Growth stock prices reflect projections of
future earnings or revenues, and can, therefore, fall dramatically if the company fails to meet those projections.
Smaller, midsized and relatively new or unseasoned companies can be particularly sensitive to changing
economic conditions, and their prospects for growth are less certain than those of larger, more established
companies. Historically, these securities have experienced more price volatility than larger company stocks,
especially over the short term. To the extent the Fund focuses on particular countries, regions, industries,
sectors or types of investment from time to time, it may be subject to greater risks of adverse developments
in such areas of focus than a fund that invests in a wider variety of countries, regions, industries, sectors or
investments. The Fund is actively managed but there is no guarantee that the manager’s investment decisions
will produce the desired results. The Fund’s prospectus also includes a description of the main investment risks.
Class C: These shares have higher annual fees and expenses than Class A shares.
Class R: Shares are available to certain eligible investors as described in the prospectus. These shares
have higher annual fees and expenses than Class A shares.
Class R6: Shares are available to certain eligible investors as described in the prospectus.
Advisor Class: Shares are available to certain eligible investors as described in the prospectus.
34 | Annual Report
Performance Summary (continued)
1. The Fund has a fee waiver associated with its investments in a Franklin Templeton money fund, contractually guaranteed through at least its
current fiscal year-end. Fund investment results reflect the fee waiver, to the extent applicable; without this reduction, the results would have
been lower.
2. Cumulative total return represents the change in value of an investment over the periods indicated.
3. Average annual total return represents the average annual change in value of an investment over the periods indicated.
4. These figures represent the value of a hypothetical $10,000 investment in the Fund over the periods indicated.
5. In accordance with SEC rules, we provide standardized average annual total return information through the latest calendar quarter.
6. Figures are as stated in the Fund’s current prospectus. In periods of market volatility, assets may decline significantly, causing total annual Fund
operating expenses to become higher than the figures shown.
7. Performance shown is not annualized.
8. Source: © 2014 Morningstar. The S&P 500 is a market capitalization-weighted index of 500 stocks designed to measure total U.S. equity market
performance. The Russell 3000 Growth Index is market capitalization weighted and measures performance of those Russell 3000 Index companies
with higher price-to-book ratios and higher forecasted growth values.
9. S&P 500: Copyright © 2014, S&P Dow Jones Indices LLC. All rights reserved. Reproduction of S&P U.S. Index data in any form is prohibited except
with the prior written permission of S&P. S&P does not guarantee the accuracy, adequacy, completeness or availability of any information and is not
responsible for any errors or omissions, regardless of the cause or for the results obtained from the use of such information. S&P DISCLAIMS ANY
AND ALL EXPRESS OR IMPLIED WARRANTIES, INCLUDING, BUT NOT LIMITED TO, ANY WARRANTIES OF MERCHANTABILITY OR FITNESS FOR A PARTICULAR
PURPOSE OR USE. In no event shall S&P be liable for any direct, indirect, special or consequential damages, costs, expenses, legal fees, or losses
(including lost income or lost profit and opportunity costs) in connection with subscriber’s or others’ use of S&P U.S. Index data.
10. Frank Russell Company is the source and owner of the Russell Index data contained or reflected in this material and all trademarks and copy-
rights related thereto. This is a presentation of Licensee. The presentation may contain confidential information and unauthorized use, disclosure,
copying, dissemination or redistribution is strictly prohibited. Frank Russell Company is not responsible for the formatting or configuration of this
material or for any inaccuracy in Licensee’s presentation thereof.
Annual Report | 35
Your Fund’s Expenses
Franklin Growth Opportunities Fund
As a Fund shareholder, you can incur two types of costs:
- Transaction costs, including sales charges (loads) on Fund purchases; and
- Ongoing Fund costs, including management fees, distribution and service (12b-1) fees, and other Fund expenses. All mutual funds have ongoing costs, sometimes referred to as operating expenses.
The following table shows ongoing costs of investing in the Fund and can help you understand these costs and compare them with those of other mutual funds. The table assumes a $1,000 investment held for the six months indicated.
Actual Fund Expenses
The first line (Actual) for each share class listed in the table provides actual account values and expenses. The “Ending Account Value” is derived from the Fund’s actual return, which includes the effect of Fund expenses.
You can estimate the expenses you paid during the period by following these steps. Of course, your account value and expenses will differ from those in this illustration:
| 1. | Divide your account value by $1,000. |
| If an account had an $8,600 value, then $8,600 ÷ $1,000 = 8.6. | |
| 2. | Multiply the result by the number under the heading “Expenses Paid During Period.” |
| If Expenses Paid During Period were $7.50, then 8.6 x $7.50 = $64.50. |
In this illustration, the estimated expenses paid this period are $64.50.
Hypothetical Example for Comparison with Other Funds
Information in the second line (Hypothetical) for each class in the table can help you compare ongoing costs of investing in the Fund with those of other mutual funds. This information may not be used to estimate the actual ending account balance or expenses you paid during the period. The hypothetical “Ending Account Value” is based on the actual expense ratio for each class and an assumed 5% annual rate of return before expenses, which does not represent the Fund’s actual return. The figure under the heading “Expenses Paid During Period” shows the hypothetical expenses your account would have incurred under this scenario. You can compare this figure with the 5% hypothetical examples that appear in shareholder reports of other funds.
36 | Annual Report
Your Fund’s Expenses (continued)
Please note that expenses shown in the table are meant to highlight ongoing costs and do not reflect any transaction costs, such as sales charges. Therefore, the second line for each class is useful in comparing ongoing costs only, and will not help you compare total costs of owning different funds. In addition, if transaction costs were included, your total costs would have been higher. Please refer to the Fund prospectus for additional information on operating expenses.
| Beginning Account | Ending Account | Expenses Paid During | ||||
| Share Class | Value 11/1/13 | Value 4/30/14 | Period* 11/1/13– 4/30/14 | |||
| A | ||||||
| Actual | $ | 1,000 | $ | 1,031.10 | $ | 5.74 |
| Hypothetical (5% return before expenses) | $ | 1,000 | $ | 1,019.14 | $ | 5.71 |
| C | ||||||
| Actual | $ | 1,000 | $ | 1,027.50 | $ | 9.25 |
| Hypothetical (5% return before expenses) | $ | 1,000 | $ | 1,015.67 | $ | 9.20 |
| R | ||||||
| Actual | $ | 1,000 | $ | 1,030.20 | $ | 6.75 |
| Hypothetical (5% return before expenses) | $ | 1,000 | $ | 1,018.15 | $ | 6.71 |
| R6 | ||||||
| Actual | $ | 1,000 | $ | 1,033.40 | $ | 3.48 |
| Hypothetical (5% return before expenses) | $ | 1,000 | $ | 1,021.37 | $ | 3.46 |
| Advisor | ||||||
| Actual | $ | 1,000 | $ | 1,032.80 | $ | 4.23 |
| Hypothetical (5% return before expenses) | $ | 1,000 | $ | 1,020.63 | $ | 4.21 |
*Expenses are calculated using the most recent six-month expense ratio, net of expense waivers, annualized for each class (A: 1.14%; C: 1.84%; R: 1.34%; R6: 0.69%; and Advisor: 0.84%), multiplied by the average account value over the period, multiplied by 181/365 to reflect the one-half year period.
Annual Report | 37
Franklin Small Cap Growth Fund
Your Fund’s Goal and Main Investments: Franklin Small Cap Growth Fund seeks
long-term capital growth by normally investing at least 80% of its net assets in equity securities of small-capitalization companies, which for this Fund are those with market capitalizations not exceeding that of the highest market capitalization in the Russell 2000® Index or $1.5 billion, whichever is greater, at the time of purchase.1
We are pleased to bring you Franklin Small Cap Growth Fund’s annual report for the fiscal year ended April 30, 2014.
Performance Overview
For the 12 months under review, Franklin Small Cap Growth Fund – Class A delivered a +32.40% cumulative total return. In comparison, the Russell 2000 Growth Index, which measures performance of small companies with higher price-to-book ratios and higher forecasted growth values, generated a +21.46% total return.2, 3 The Standard & Poor’s 500 Index (S&P 500), which tracks the broad U.S. stock market, produced a +20.44% total return.2, 4 You can find the Fund’s long-term performance data in the Performance Summary beginning on page 42.
| Performance data represent |
| past performance, which does |
| not guarantee future results. |
| Investment return and principal |
| value will fluctuate, and you may |
| have a gain or loss when you sell |
| your shares. Current performance |
| may differ from figures shown. |
| Please visit franklintempleton.com |
| or call (800) 342-5236 for most |
| recent month-end performance. |
Investment Strategy
We use fundamental, bottom-up research to seek companies meeting our criteria of growth potential, quality and valuation. In seeking sustainable growth characteristics, we look for companies we believe can produce sustainable earnings and cash flow growth, evaluating the long-term market opportunity and competitive structure of an industry to target leaders and emerging leaders. We define quality companies as those with strong and improving competitive positions in attractive markets. We also believe important attributes of quality are experienced and talented management teams as well as financial strength reflected in the capital structure, gross and operating margins, free cash flow generation and returns on capital employed. Our valuation analysis includes a range of potential outcomes based on an assessment of multiple scenarios. In assessing value, we consider whether security prices fully reflect the balance of the sustainable growth opportunities relative to business and financial risks.
The dollar value, number of shares or principal amount, and names of all portfolio holdings are listed in the Fund’s Statement of Investments (SOI). The SOI begins on page 92.
38 | Annual Report
Manager’s Discussion
During the fiscal year under review, all sectors in the Fund’s portfolio contributed to performance relative to the Russell 2000 Growth Index. Key contributors included stock selection in the information technology (IT) and industrials sectors as well as stock selection and an overweighting in the energy sector.
In the IT sector, Yelp drove relative results as its shares delivered triple-digit gains for the 12-month period.5 The online urban guide reported better-than-expected quarterly revenues and lower-than-expected losses throughout the year, supported by the addition of local business customers. The company also raised its full-year 2014 revenue forecast. Integrated circuit solutions provider Lattice Semiconductor, enterprise e-commerce solutions provider Demandware and power-supply chip manufacturer Volterra Semiconductor5 also aided the Fund’s relative performance. Lattice Semiconductor gained after it delivered better-than-expected quarterly earnings fueled by increased demand for its innovative low-power, low-cost programmable devices. Demandware’s revenue growth accelerated during the period, as customers increased subscriptions for its e-commerce support software. Volterra’s share price surged after Maxim Integrated Products announced a definitive agreement to acquire the company. The acquisition was completed in October 2013.
In the industrials sector, Astronics, a provider of advanced technologies for the global aerospace and defense industries, was also a notable contributor to relative performance. The company generated revenue and net income growth during 2013, resulting from strong sales growth in its aerospace segment as well as from a series of acquisitions made in the second half of 2013. The company also forecast robust revenue growth in 2014, driven by the acquisitions.
In the energy sector, land drilling services provider Pioneer Energy Services delivered strong fourth-quarter and full-year 2013 revenues, although it reported a net loss. The company reported better-than-expected first-quarter 2014 results supported by increased demand for oil and gas production services. Other key individual contributors included cancer drug developer Puma Biotechnology5 and medical device company DexCom. Puma Biotechnology shares gained after the company released positive results from a Phase II trial of its cancer drug neratinib. DexCom, a manufacturer of continuous glucose monitoring systems, generated strong product revenue and total revenue in 2013 that exceeded consensus expectations as sales were robust for its G4 PLATINUM continuous glucose monitor. The company also reported a smaller net loss for 2013 compared with the previous year.
Annual Report | 39
Although the Fund delivered strong gains, several holdings detracted from relative performance. Exposure to some holdings in health care such as an off-benchmark investment in Ireland-based biopharmaceutical company Amarin5 and a position in health care solutions provider HMS Holdings hindered relative returns. Amarin’s stock price declined after a U.S. Food and Drug Administration advisory panel would not recommend approval to expand the use of the company’s fish-oil drug Vascepa to heart-disease patients who already take a statin drug. The share price of health care claims coordinator HMS Holdings fell after the company reported a decline in 2013 revenue and income because of changes in its Medicare contract during the year.
Some technology companies, such as Ixia, a maker of comprehensive network testing products, and Semtech, a semiconductor supplier, also hurt relative results. Ixia’s share price declined after the company announced it would not meet its 2013 second-quarter revenue guidance. However, Ixia reported solid third-quarter revenue and earnings, resulting largely from healthy spending by its enterprise, federal and service-provider clients. During the period, Ixia acquired Net Optics, a leading provider of total application and network visibility solutions. In April 2014, Ixia announced it identified accounting errors and would restate financials of the first two quarters of 2013, which would likely result in lower revenue and profits. Semtech lost value after the company lowered its fiscal 2014 fourth-quarter guidance. Although Semtech reported marginal growth in revenues for fiscal year 2014 (ended January 27, 2014), earnings decreased from the previous year.
Among other detractors, a new position in Tile Shop Holdings, a specialty retailer of manufactured and natural stone tiles, suffered after a short seller raised corporate governance concerns that ultimately resulted in an executive related to the CEO being terminated. Tile Shop also reported a disappointing sales outlook for early 2014, partly because of harsh winter weather throughout much of the east coast and Midwest, where a majority of its stores operate.
| Top 10 Holdings | ||
| Franklin Small Cap Growth Fund | ||
| 4/30/14 | ||
| Company | % of Total | |
| Sector/Industry | Net Assets | |
| Lattice Semiconductor Corp. | 1.9 | % |
| Information Technology | ||
| Lithia Motors Inc. | 1.6 | % |
| Consumer Discretionary | ||
| Shutterfly Inc. | 1.5 | % |
| Consumer Discretionary | ||
| Mobile Mini Inc. | 1.5 | % |
| Industrials | ||
| The Manitowoc Co. Inc. | 1.5 | % |
| Industrials | ||
| Tenneco Inc. | 1.5 | % |
| Consumer Discretionary | ||
| Ixia | 1.4 | % |
| Information Technology | ||
| PAREXEL International Corp. | 1.4 | % |
| Health Care | ||
| Tile Shop Holdings Inc. | 1.4 | % |
| Consumer Discretionary | ||
| Virtus Investment Partners Inc. | 1.4 | % |
| Financials | ||
40 | Annual Report
Thank you for your continued participation in Franklin Small Cap Growth Fund. We look forward to serving your future investment needs.

The foregoing information reflects our analysis, opinions and portfolio holdings as of April 30, 2014, the end of the
reporting period. The way we implement our main investment strategies and the resulting portfolio holdings may
change depending on factors such as market and economic conditions. These opinions may not be relied upon as
investment advice or an offer for a particular security. The information is not a complete analysis of every aspect
of any market, country, industry, security or the Fund. Statements of fact are from sources considered reliable,
but the investment manager makes no representation or warranty as to their completeness or accuracy. Although
historical performance is no guarantee of future results, these insights may help you understand our investment
management philosophy.
The index is unmanaged and includes reinvested dividends. One cannot invest directly in an index, and an index is
not representative of the Fund’s portfolio.
1. The Russell 2000 Index is market capitalization weighted and measures performance of the 2,000 smallest
companies in the Russell 3000 Index, which represent a small amount of the total market capitalization of the
Russell 3000 Index.
2. Source: © 2014 Morningstar. All Rights Reserved. The information contained herein: (1) is proprietary to Morningstar
and/or its content providers; (2) may not be copied or distributed; and (3) is not warranted to be accurate, complete or
timely. Neither Morningstar nor its content providers are responsible for any damages or losses arising from any use of
this information.
3. Frank Russell Company is the source and owner of the Russell Index data contained or reflected in this material and
all trademarks and copyrights related thereto. This is a presentation of Licensee. The presentation may contain confi-
dential information and unauthorized use, disclosure, copying, dissemination or redistribution is strictly prohibited.
Frank Russell Company is not responsible for the formatting or configuration of this material or for any inaccuracy in
Licensee’s presentation thereof.
4. S&P 500: Copyright © 2014, S&P Dow Jones Indices LLC. All rights reserved. Reproduction of S&P U.S. Index data
in any form is prohibited except with the prior written permission of S&P. S&P does not guarantee the accuracy, ade-
quacy, completeness or availability of any information and is not responsible for any errors or omissions, regardless
of the cause or for the results obtained from the use of such information. S&P DISCLAIMS ANY AND ALL EXPRESS OR
IMPLIED WARRANTIES, INCLUDING, BUT NOT LIMITED TO, ANY WARRANTIES OF MERCHANTABILITY OR FITNESS FOR A
PARTICULAR PURPOSE OR USE. In no event shall S&P be liable for any direct, indirect, special or consequential dam-
ages, costs, expenses, legal fees, or losses (including lost income or lost profit and opportunity costs) in connection
with subscriber’s or others’ use of S&P U.S. Index data.
5. Sold by period-end.
Annual Report | 41
Performance Summary as of 4/30/14
Franklin Small Cap Growth Fund
Your dividend income will vary depending on dividends or interest paid by securities in the Fund’s portfolio, adjusted for operating expenses of each class. Capital gain distributions are net profits realized from the sale of portfolio securities. The performance table and graphs do not reflect any taxes that a shareholder would pay on Fund dividends, capital gain distributions, if any, or any realized gains on the sale of Fund shares. Total return reflects reinvestment of the Fund’s dividends and capital gain distributions, if any, and any unrealized gains or losses.
| Net Asset Value | ||||||
| Share Class | 4/30/14 | 4/30/13 | Change | |||
| A (FSGRX) | $ | 18.20 | $ | 14.26 | +$ | 3.94 |
| C (FCSGX) | $ | 16.03 | $ | 12.70 | +$ | 3.33 |
| R (FSSRX) | $ | 17.57 | $ | 13.81 | +$ | 3.76 |
| Advisor (FSSAX) | $ | 19.17 | $ | 14.94 | +$ | 4.23 |
| 5/1/13 | ||||||
| R6 (FSMLX) | $ | 19.21 | $ | 14.64 | +$ | 4.57 |
| |||||||
| Distributions | |||||||
| Short-Term | Long-Term | ||||||
| Share Class | Capital Gain | Capital Gain | Total | ||||
| A | (5/1/13–4/30/14) | $ | 0.1502 | $ | 0.5069 | $ | 0.6571 |
| C | (5/1/13–4/30/14) | $ | 0.1502 | $ | 0.5069 | $ | 0.6571 |
| R | (5/1/13–4/30/14) | $ | 0.1502 | $ | 0.5069 | $ | 0.6571 |
| R6 | (5/1/13–4/30/14) | $ | 0.1502 | $ | 0.5069 | $ | 0.6571 |
| Advisor | (5/1/13–4/30/14) | $ | 0.1502 | $ | 0.5069 | $ | 0.6571 |
42 | Annual Report
Performance Summary (continued)
Performance as of 4/30/141
Cumulative total return excludes sales charges. Average annual total returns and value of $10,000 investment include maximum sales charges. Class A: 5.75% maximum initial sales charge; Class C: 1% contingent deferred sales charge in first year only; Class R/R6/Advisor Class: no sales charges.
| Value of | Average Annual | ||||||||||||||
| Cumulative | Average Annual | $ | 10,000 | Total Return | Total Annual Operating Expenses6 | ||||||||||
| Share Class | Total Return2 | Total Return3 | Investment4 | (3/31/14 | )5 | (with waiver) | (without waiver) | ||||||||
| A | 1.35 | % | 1.36 | % | |||||||||||
| 1-Year | + | 32.40 | % | + | 24.79 | % | $ | 12,479 | + | 27.22 | % | ||||
| 5-Year | + | 203.28 | % | + | 23.38 | % | $ | 28,588 | + | 28.14 | % | ||||
| 10-Year | + | 153.30 | % | + | 9.10 | % | $ | 23,881 | + | 9.26 | % | ||||
| C | 2.05 | % | 2.06 | % | |||||||||||
| 1-Year | + | 31.57 | % | + | 30.57 | % | $ | 13,057 | + | 33.06 | % | ||||
| 5-Year | + | 193.10 | % | + | 23.99 | % | $ | 29,310 | + | 28.77 | % | ||||
| 10-Year | + | 135.73 | % | + | 8.95 | % | $ | 23,573 | + | 9.11 | % | ||||
| R | 1.55 | % | 1.56 | % | |||||||||||
| 1-Year | + | 32.15 | % | + | 32.15 | % | $ | 13,215 | + | 34.71 | % | ||||
| 5-Year | + | 200.44 | % | + | 24.61 | % | $ | 30,044 | + | 29.42 | % | ||||
| 10-Year | + | 147.78 | % | + | 9.50 | % | $ | 24,778 | + | 9.66 | % | ||||
| R67 | 0.81 | % | 0.82 | % | |||||||||||
| Since Inception (5/1/13) | + | 35.80 | % | + | 35.80 | % | $ | 13,580 | + | 43.09 | % | ||||
| Advisor | 1.05 | % | 1.06 | % | |||||||||||
| 1-Year | + | 32.87 | % | + | 32.87 | % | $ | 13,287 | + | 35.39 | % | ||||
| 5-Year | + | 207.89 | % | + | 25.22 | % | $ | 30,789 | + | 30.06 | % | ||||
| 10-Year | + | 160.45 | % | + | 10.05 | % | $ | 26,045 | + | 10.21 | % | ||||
Performance data represent past performance, which does not guarantee future results. Investment return and principal value will fluctuate, and you may have a gain or loss when you sell your shares. Current performance may differ from figures shown. For most recent month-end performance, go to franklintempleton.com or call (800) 342-5236.
Annual Report | 43
Performance Summary (continued)
Total Return Index Comparison for a Hypothetical $10,000 Investment1
Total return represents the change in value of an investment over the periods shown. It includes any applicable, maximum sales charge, Fund expenses, account fees and reinvested distributions. The unmanaged indexes include reinvestment of any income or distributions. They differ from the Fund in composition and do not pay management fees or expenses. One cannot invest directly in an index.
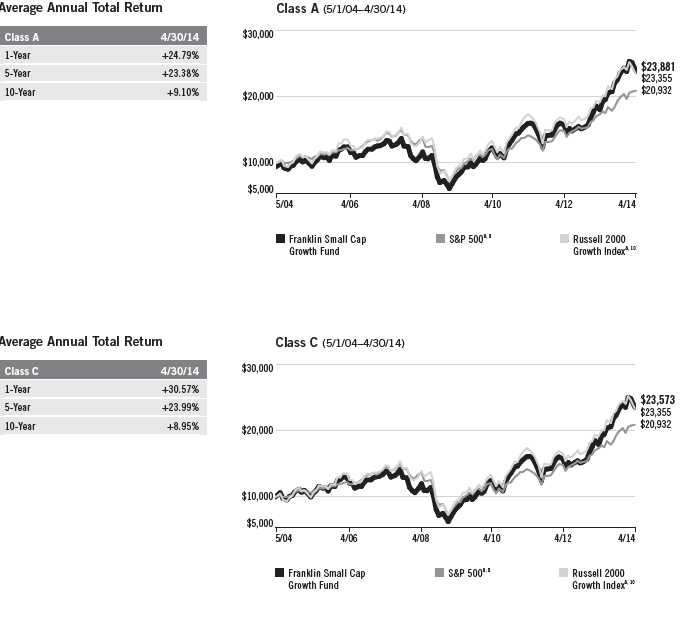
44 | Annual Report
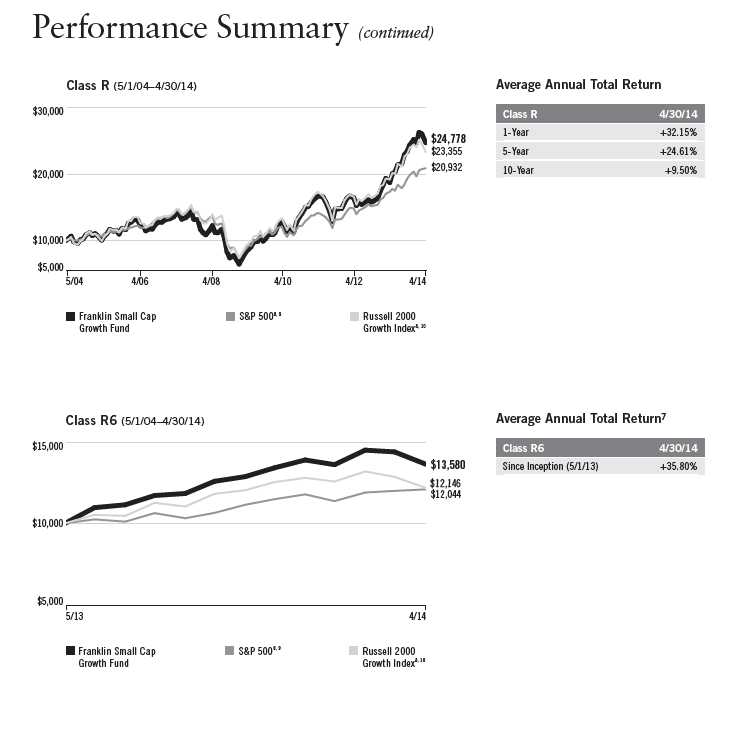

Performance Summary (continued)
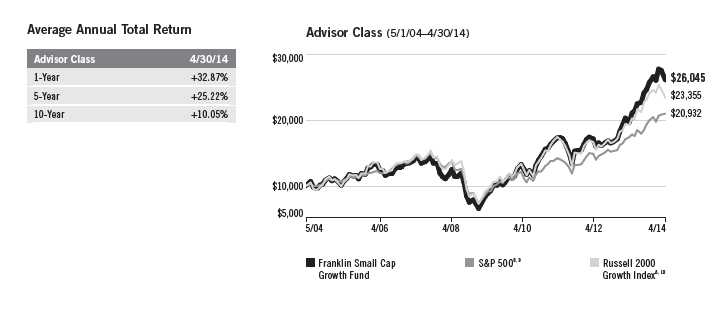
All investments involve risks, including possible loss of principal. Smaller, midsized and relatively new or
unseasoned companies can be particularly sensitive to changing economic conditions, and their prospects for
growth are less certain than those of larger, more established companies. Historically, these securities have
experienced more price volatility than larger company stocks, especially over the short term. Growth stock
prices reflect projections of future earnings or revenues, and can, therefore, fall dramatically if the company
fails to meet those projections. To the extent the Fund focuses on particular countries, regions, industries,
sectors or types of investment from time to time, it may be subject to greater risks of adverse developments
in such areas of focus than a fund that invests in a wider variety of countries, regions, industries, sectors or
investments. From time to time, the trading market for a particular security or type of security in which the
Fund invests may become less liquid or even illiquid. The Fund is actively managed but there is no guarantee
that the manager’s investment decisions will produce the desired results. The Fund’s prospectus also includes
a description of the main investment risks.
Class C: These shares have higher annual fees and expenses than Class A shares.
Class R: Shares are available to certain eligible investors as described in the prospectus. These shares
have higher annual fees and expenses than Class A shares.
Class R6: Shares are available to certain eligible investors as described in the prospectus.
Advisor Class: Shares are available to certain eligible investors as described in the prospectus.
46 | Annual Report
Performance Summary (continued)
1. The Fund has a fee waiver associated with its investments in a Franklin Templeton money fund, contractually guaranteed through at least its
current fiscal year-end. Fund investment results reflect the fee waiver, to the extent applicable; without this reduction, the results would have
been lower.
2. Cumulative total return represents the change in value of an investment over the periods indicated.
3. Average annual total return represents the average annual change in value of an investment over the periods indicated.
4. These figures represent the value of a hypothetical $10,000 investment in the Fund over the periods indicated.
5. In accordance with SEC rules, we provide standardized average annual total return information through the latest calendar quarter.
6. Figures are as stated in the Fund’s current prospectus. In periods of market volatility, assets may decline significantly, causing total annual Fund
operating expenses to become higher than the figures shown.
7. Performance shown is not annualized.
8. Source: © 2014 Morningstar. The S&P 500 is a market capitalization-weighted index of 500 stocks designed to measure total U.S. equity market
performance. The Russell 2000 Growth Index is market capitalization weighted and measures performance of those Russell 2000 Index companies
with higher price-to-book ratios and higher forecasted growth values.
9. S&P 500: Copyright © 2014, S&P Dow Jones Indices LLC. All rights reserved. Reproduction of S&P U.S. Index data in any form is prohibited except
with the prior written permission of S&P. S&P does not guarantee the accuracy, adequacy, completeness or availability of any information and is not
responsible for any errors or omissions, regardless of the cause or for the results obtained from the use of such information. S&P DISCLAIMS ANY
AND ALL EXPRESS OR IMPLIED WARRANTIES, INCLUDING, BUT NOT LIMITED TO, ANY WARRANTIES OF MERCHANTABILITY OR FITNESS FOR A PARTICULAR
PURPOSE OR USE. In no event shall S&P be liable for any direct, indirect, special or consequential damages, costs, expenses, legal fees, or losses
(including lost income or lost profit and opportunity costs) in connection with subscriber’s or others’ use of S&P U.S. Index data.
10. Frank Russell Company is the source and owner of the Russell Index data contained or reflected in this material and all trademarks and copy-
rights related thereto. This is a presentation of Licensee. The presentation may contain confidential information and unauthorized use, disclosure,
copying, dissemination or redistribution is strictly prohibited. Frank Russell Company is not responsible for the formatting or configuration of this
material or for any inaccuracy in Licensee’s presentation thereof.
Annual Report | 47
Your Fund’s Expenses
Franklin Small Cap Growth Fund
As a Fund shareholder, you can incur two types of costs:
- Transaction costs, including sales charges (loads) on Fund purchases; and
- Ongoing Fund costs, including management fees, distribution and service (12b-1) fees, and other Fund expenses.
All mutual funds have ongoing costs, sometimes referred to as operating expenses.
The following table shows ongoing costs of investing in the Fund and can help you understand these costs and compare them with those of other mutual funds. The table assumes a $1,000 investment held for the six months indicated.
Actual Fund Expenses
The first line (Actual) for each share class listed in the table provides actual account values and expenses. The “Ending Account Value” is derived from the Fund’s actual return, which includes the effect of Fund expenses.
You can estimate the expenses you paid during the period by following these steps. Of course, your account value and expenses will differ from those in this illustration:
| 1. | Divide your account value by $1,000. |
| If an account had an $8,600 value, then $8,600 ÷ $1,000 = 8.6. | |
| 2. | Multiply the result by the number under the heading “Expenses Paid During Period.” |
| If Expenses Paid During Period were $7.50, then 8.6 x $7.50 = $64.50. |
In this illustration, the estimated expenses paid this period are $64.50.
Hypothetical Example for Comparison with Other Funds
Information in the second line (Hypothetical) for each class in the table can help you compare ongoing costs of investing in the Fund with those of other mutual funds. This information may not be used to estimate the actual ending account balance or expenses you paid during the period. The hypothetical “Ending Account Value” is based on the actual expense ratio for each class and an assumed 5% annual rate of return before expenses, which does not represent the Fund’s actual return. The figure under the heading “Expenses Paid During Period” shows the hypothetical expenses your account would have incurred under this scenario. You can compare this figure with the 5% hypothetical examples that appear in shareholder reports of other funds.
48 | Annual Report
Your Fund’s Expenses (continued)
Please note that expenses shown in the table are meant to highlight ongoing costs and do not reflect any transaction costs, such as sales charges. Therefore, the second line for each class is useful in comparing ongoing costs only, and will not help you compare total costs of owning different funds. In addition, if transaction costs were included, your total costs would have been higher. Please refer to the Fund prospectus for additional information on operating expenses.
| Beginning Account | Ending Account | Expenses Paid During | ||||
| Share Class | Value 11/1/13 | Value 4/30/14 | Period* 11/1/13– 4/30/14 | |||
| A | ||||||
| Actual | $ | 1,000 | $ | 1,057.70 | $ | 6.07 |
| Hypothetical (5% return before expenses) | $ | 1,000 | $ | 1,018.89 | $ | 5.96 |
| C | ||||||
| Actual | $ | 1,000 | $ | 1,054.20 | $ | 9.63 |
| Hypothetical (5% return before expenses) | $ | 1,000 | $ | 1,015.42 | $ | 9.44 |
| R | ||||||
| Actual | $ | 1,000 | $ | 1,056.10 | $ | 7.09 |
| Hypothetical (5% return before expenses) | $ | 1,000 | $ | 1,017.90 | $ | 6.95 |
| R6 | ||||||
| Actual | $ | 1,000 | $ | 1,059.80 | $ | 3.63 |
| Hypothetical (5% return before expenses) | $ | 1,000 | $ | 1,021.27 | $ | 3.56 |
| Advisor | ||||||
| Actual | $ | 1,000 | $ | 1,059.30 | $ | 4.54 |
| Hypothetical (5% return before expenses) | $ | 1,000 | $ | 1,020.38 | $ | 4.46 |
*Expenses are calculated using the most recent six-month expense ratio, net of expense waivers, annualized for each class (A: 1.19%; C: 1.89%; R: 1.39%; R6: 0.71%; and Advisor: 0.89%), multiplied by the average account value over the period, multiplied by 181/365 to reflect the one-half year period.
Annual Report | 49
Franklin Small-Mid Cap Growth Fund
Your Fund’s Goal and Main Investments: Franklin Small-Mid Cap Growth Fund seeks long-term capital growth by normally investing at least 80% of its net assets in equity securities of small-cap and mid-cap companies. The Fund defines small-cap companies as those within the market capitalization range of companies in the Russell 2500™ Index at the time of purchase, and mid-cap companies as those within the market capitalization range of the Russell Midcap® Index at the time of purchase.1
We are pleased to bring you Franklin Small-Mid Cap Growth Fund’s annual report for the fiscal year ended April 30, 2014.
Performance Overview
For the 12 months under review, Franklin Small-Mid Cap Growth Fund –Class A delivered a +21.99% cumulative total return. In comparison, the Russell Midcap Growth Index, which measures performance of companies in the Russell Midcap Index with higher price-to-book ratios and higher forecasted growth values, generated a +20.62% total return.2, 3 Also in comparison, the Standard & Poor’s 500 Index (S&P 500), which tracks the broad U.S. stock market, produced a +20.44% total return.3, 4 You can find the Fund’s long-term performance data in the Performance Summary beginning on page 54.
| Performance data represent |
| past performance, which does |
| not guarantee future results. |
| Investment return and principal |
| value will fluctuate, and you may |
| have a gain or loss when you sell |
| your shares. Current performance |
| may differ from figures shown. |
| Please visit franklintempleton.com |
| or call (800) 342-5236 for most |
| recent month-end performance. |
Investment Strategy
We use fundamental, bottom-up research to seek companies meeting our criteria of growth potential, quality and valuation. In seeking sustainable growth characteristics, we look for companies we believe can produce sustainable earnings and cash flow growth, evaluating the long-term market opportunity and competitive structure of an industry to target leaders and emerging leaders. We define quality companies as those with strong and improving competitive positions in attractive markets. We also believe important attributes of quality are experienced and talented management teams as well as financial strength reflected in the capital structure, gross and operating margins, free cash flow generation and returns on capital employed. Our valuation analysis includes a range of potential outcomes based on an assessment of multiple scenarios. In assessing value, we consider whether security prices fully reflect the balance of the sustainable growth opportunities relative to business and financial risks.
The dollar value, number of shares or principal amount, and names of all portfolio holdings are listed in the Fund’s Statement of Investments (SOI). The SOI begins on page 101.
50 | Annual Report
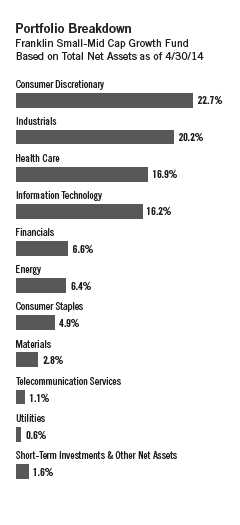
Manager’s Discussion
During the 12 months under review, nearly all sectors represented in the Fund’s portfolio contributed to absolute performance as the broad stock market rallied. Relative to the Russell Midcap Growth Index, key contributors to the Fund’s performance included stock selection in the information technology (IT), financials and consumer discretionary sectors.
In the IT sector, our off-benchmark investment in Netherlands-based integrated circuits manufacturer NXP Semiconductors and our position in Singapore-based analog semiconductor manufacturer Avago Technologies performed well. NXP Semiconductors reported strong quarterly earnings resulting from solid revenue growth and improved operational cost control. Avago Technologies’ share price rose to an all-time high during the period as investors believed the company was strongly positioned to benefit from the smartphone market’s growth. Avago Technologies entered into a definitive agreement to acquire LSI, diversifying from wired infrastructure, wireless and industrial businesses into the enterprise storage market. In the financials sector, Signature Bank contributed to relative returns as the full-service commercial bank continued to generate strong quarterly revenue and earnings growth, led by robust deposit and loan growth. The bank, which operates in the New York metropolitan area, benefited from its client-centric model, which includes hiring seasoned private-client banking teams.
In the consumer discretionary sector, our off-benchmark investment in Buffalo Wild Wings and our position in Under Armour aided relative returns. Quarterly earnings of restaurant operator and franchisor Buffalo Wild Wings exceeded expectations, supported by revenue growth and higher operating margins resulting from lower chicken wing costs and better cost control. Apparel and footwear manufacturer Under Armour’s earnings benefited from sales growth across segments. The company also provided a solid outlook for 2014. Other individual contributors included our positions in generic drug maker Actavis and equipment rental company United Rentals.
In contrast, key detractors from the Fund’s relative performance included stock selection in the health care and energy sectors. In the health care sector, our position in ARIAD Pharmaceuticals and an off-benchmark investment in Ireland-based Amarin weighed on relative returns.5 ARIAD Pharmaceuticals’ share price fell after the biotechnology company suspended trials on its leukemia drug Iclusig amid reports of harmful side effects. After initially halting the drug’s marketing in the U.S., the Food and Drug Administration (FDA) allowed sales to resume with revised labeling and limited application. Amarin’s stock price declined after an FDA advisory panel would not recommend approval to expand the use of the biopharmaceutical firm’s cholesterol drug Vascepa to heart-disease patients who already take a statin drug. In the energy sector, oil

| Top 10 Holdings | |||
| Franklin Small-Mid Cap Growth Fund | |||
| 4/30/14 | |||
| Company | % of Total | ||
| Sector/Industry | Net Assets | ||
| AMETEK Inc. | 1.5 | % | |
| Industrials | |||
| Roper Industries Inc. | 1.5 | % | |
| Industrials | |||
| Mead Johnson Nutrition Co., A | 1.4 | % | |
| Consumer Staples | |||
| Affiliated Managers Group Inc. | 1.4 | % | |
| Financials | |||
| NXP Semiconductors NV (Netherlands) | 1.3 | % | |
| Information Technology | |||
| Oasis Petroleum Inc. | 1.3 | % | |
| Energy | |||
| IntercontinentalExchange Group Inc. | 1.3 | % | |
| Financials | |||
| Whole Foods Market Inc. | 1.2 | % | |
| Consumer Staples | |||
| Perrigo Co. PLC | 1.2 | % | |
| Health Care | |||
| Wynn Resorts Ltd. | 1.2 | % | |
| Consumer Discretionary | |||
exploration and production company Cobalt International Energy detracted from relative returns as the company failed to find commercially viable oil at one of its Gulf of Mexico wells, and its stock fell toward the end of 2013 amid concerns the company might not be able to profit from its larger-than-expected natural gas discovery in Angola.5 Other individual detractors included our off-benchmark position in Canada-based athletic apparel maker Lululemon Athletica and our holding in fashion apparel manufacturer Ralph Lauren.5
Thank you for your continued participation in Franklin Small-Mid Cap Growth Fund. We look forward to serving your future investment needs.

The foregoing information reflects our analysis, opinions and portfolio holdings as of April 30, 2014, the end of the reporting period. The way we implement our main investment strategies and the resulting portfolio holdings may change depending on factors such as market and economic conditions. These opinions may not be relied upon as investment advice or an offer for a particular security. The information is not a complete analysis of every aspect of any market, country, industry, security or the Fund. Statements of fact are from sources considered reliable, but the investment manager makes no representation or warranty as to their completeness or accuracy. Although historical performance is no guarantee of future results, these insights may help you understand our investment management philosophy.
52 | Annual Report
The index is unmanaged and includes reinvested dividends. One cannot invest directly in an index, and an index is
not representative of the Fund’s portfolio.
1. The Russell 2500 Index is market capitalization weighted and measures performance of the 2,500 smallest
companies in the Russell 3000 Index, which represent a modest amount of the Russell 3000 Index’s total market
capitalization. The Russell Midcap Index is market capitalization weighted and measures performance of the
smallest companies in the Russell 1000 Index, which represent a modest amount of the Russell 1000 Index’s total
market capitalization.
2. Frank Russell Company is the source and owner of the Russell Index data contained or reflected in this material and
all trademarks and copyrights related thereto. This is a presentation of Licensee. The presentation may contain confi-
dential information and unauthorized use, disclosure, copying, dissemination or redistribution is strictly prohibited.
Frank Russell Company is not responsible for the formatting or configuration of this material or for any inaccuracy in
Licensee’s presentation thereof.
3. Source: © 2014 Morningstar. All Rights Reserved. The information contained herein: (1) is proprietary to Morningstar
and/or its content providers; (2) may not be copied or distributed; and (3) is not warranted to be accurate, complete or
timely. Neither Morningstar nor its content providers are responsible for any damages or losses arising from any use of
this information.
4. S&P 500: Copyright © 2014, S&P Dow Jones Indices LLC. All rights reserved. Reproduction of S&P U.S. Index data
in any form is prohibited except with the prior written permission of S&P. S&P does not guarantee the accuracy, ade-
quacy, completeness or availability of any information and is not responsible for any errors or omissions, regardless
of the cause or for the results obtained from the use of such information. S&P DISCLAIMS ANY AND ALL EXPRESS OR
IMPLIED WARRANTIES, INCLUDING, BUT NOT LIMITED TO, ANY WARRANTIES OF MERCHANTABILITY OR FITNESS FOR A
PARTICULAR PURPOSE OR USE. In no event shall S&P be liable for any direct, indirect, special or consequential dam-
ages, costs, expenses, legal fees, or losses (including lost income or lost profit and opportunity costs) in connection
with subscriber’s or others’ use of S&P U.S. Index data.
5. Sold by period-end.
Annual Report | 53
Performance Summary as of 4/30/14
Franklin Small-Mid Cap Growth Fund
Your dividend income will vary depending on dividends or interest paid by securities in the Fund’s portfolio, adjusted for operating expenses of each class. Capital gain distributions are net profits realized from the sale of portfolio securities. The performance table and graphs do not reflect any taxes that a shareholder would pay on Fund dividends, capital gain distributions, if any, or any realized gains on the sale of Fund shares. Total return reflects reinvestment of the Fund’s dividends and capital gain distributions, if any, and any unrealized gains or losses.
| Net Asset Value | ||||||
| Share Class | 4/30/14 | 4/30/13 | Change | |||
| A (FRSGX) | $ | 40.42 | $ | 38.01 | +$ | 2.41 |
| C (FRSIX) | $ | 33.78 | $ | 32.80 | +$ | 0.98 |
| R (FSMRX) | $ | 38.61 | $ | 36.61 | +$ | 2.00 |
| Advisor (FSGAX) | $ | 42.44 | $ | 39.56 | +$ | 2.88 |
| 5/1/13 | ||||||
| R6 (FMGGX) | $ | 42.53 | $ | 38.96 | +$ | 3.57 |
| Distributions | |||||||
| Short-Term | Long-Term | ||||||
| Share Class | Capital Gain | Capital Gain | Total | ||||
| A | (5/1/13–4/30/14) | $ | 0.5790 | $ | 5.2039 | $ | 5.7829 |
| C | (5/1/13–4/30/14) | $ | 0.5790 | $ | 5.2039 | $ | 5.7829 |
| R | (5/1/13–4/30/14) | $ | 0.5790 | $ | 5.2039 | $ | 5.7829 |
| R6 | (5/1/13–4/30/14) | $ | 0.5790 | $ | 5.2039 | $ | 5.7829 |
| Advisor | (5/1/13–4/30/14) | $ | 0.5790 | $ | 5.2039 | $ | 5.7829 |
54 | Annual Report
Performance Summary (continued)
Performance as of 4/30/141
Cumulative total return excludes sales charges. Average annual total returns and value of $10,000 investment include maximum sales charges. Class A: 5.75% maximum initial sales charge; Class C: 1% contingent deferred sales charge in first year only; Class R/R6/Advisor Class: no sales charges.
| Value of | Average Annual | Total Annual | |||||||||||
| Cumulative | Average Annual | $ | 10,000 | Total Return | Operating | ||||||||
| Share Class | Total Return2 | Total Return3 | Investment4 | (3/31/14 | )5 | Expenses6 | |||||||
| A | 0.98 | % | |||||||||||
| 1-Year | + | 21.99 | % | + | 14.97 | % | $ | 11,497 | + | 19.03 | % | ||
| 5-Year | + | 140.46 | % | + | 17.78 | % | $ | 22,666 | + | 21.30 | % | ||
| 10-Year | + | 132.42 | % | + | 8.16 | % | $ | 21,907 | + | 8.04 | % | ||
| C | 1.73 | % | |||||||||||
| 1-Year | + | 21.04 | % | + | 20.04 | % | $ | 12,004 | + | 24.30 | % | ||
| 5-Year | + | 131.41 | % | + | 18.27 | % | $ | 23,141 | + | 21.81 | % | ||
| 10-Year | + | 115.57 | % | + | 7.98 | % | $ | 21,557 | + | 7.87 | % | ||
| R | 1.23 | % | |||||||||||
| 1-Year | + | 21.66 | % | + | 21.66 | % | $ | 12,166 | + | 25.97 | % | ||
| 5-Year | + | 137.33 | % | + | 18.87 | % | $ | 23,733 | + | 22.43 | % | ||
| 10-Year | + | 126.62 | % | + | 8.53 | % | $ | 22,662 | + | 8.41 | % | ||
| R67 | 0.48 | % | |||||||||||
| Since Inception (5/1/13) | + | 24.43 | % | + | 24.43 | % | $ | 12,443 | + | 28.11 | % | ||
| Advisor | 0.73 | % | |||||||||||
| 1-Year | + | 22.30 | % | + | 22.30 | % | $ | 12,230 | + | 26.60 | % | ||
| 5-Year | + | 143.51 | % | + | 19.48 | % | $ | 24,351 | + | 23.05 | % | ||
| 10-Year | + | 138.39 | % | + | 9.08 | % | $ | 23,839 | + | 8.96 | % |
Performance data represent past performance, which does not guarantee future results. Investment return and principal value will fluctuate, and you may have a gain or loss when you sell your shares. Current performance may differ from figures shown. For most recent month-end performance, go to franklintempleton.com or call (800) 342-5236.
Annual Report | 55
Performance Summary (continued)
Total Return Index Comparison for a Hypothetical $10,000 Investment1
Total return represents the change in value of an investment over the periods shown. It includes any applicable, maximum sales charge, Fund expenses, account fees and reinvested distributions. The unmanaged indexes include reinvestment of any income or distributions. They differ from the Fund in composition and do not pay management fees or expenses. One cannot invest directly in an index.
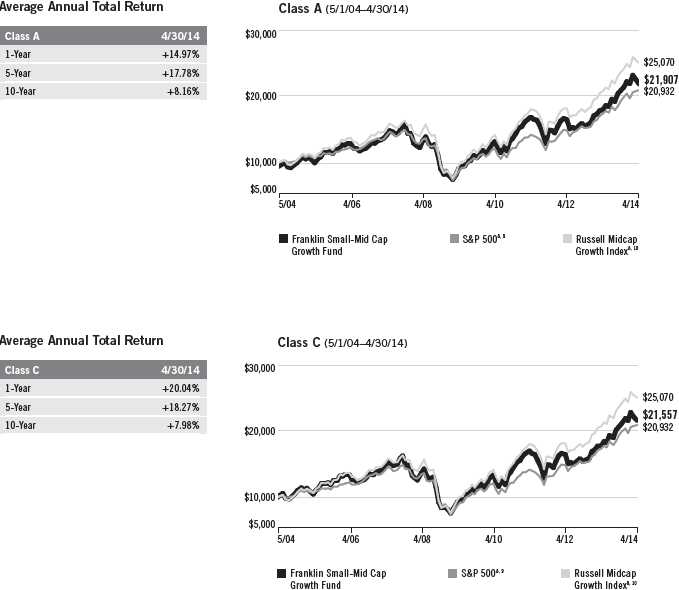
56 | Annual Report
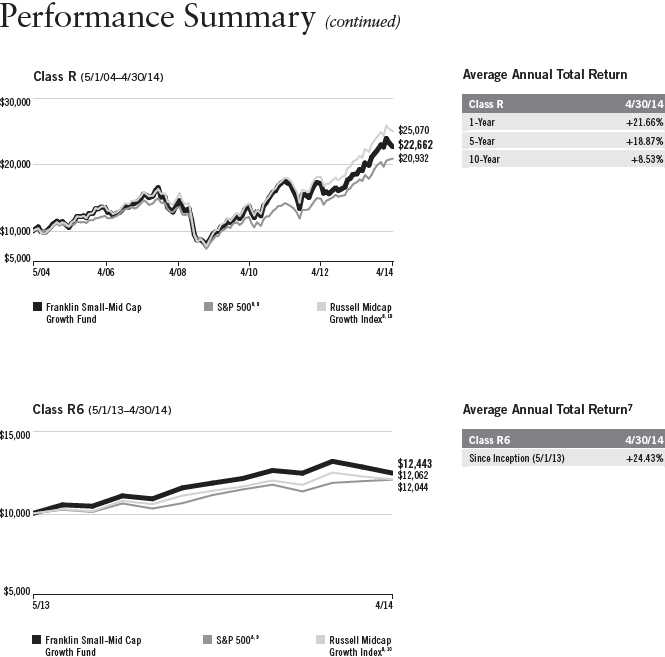
Annual Report | 57
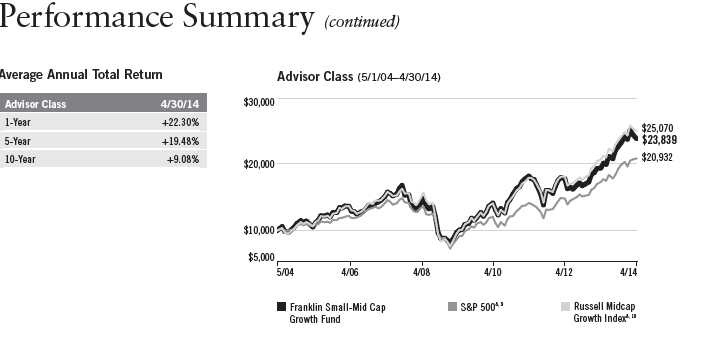
All investments involve risks, including possible loss of principal. Growth stock prices reflect projections of
future earnings or revenues, and can, therefore, fall dramatically if the company fails to meet those projections.
Smaller, midsized and relatively new or unseasoned companies can be particularly sensitive to changing eco-
nomic conditions, and their prospects for growth are less certain than those of larger, more established
companies. Historically, these securities have exhibited more price volatility than larger company stocks,
especially over the short term. To the extent the Fund focuses on particular countries, regions, industries,
sectors or types of investment from time to time, it may be subject to greater risks of adverse developments
in such areas of focus than a fund that invests in a wider variety of countries, regions, industries, sectors or
investments. From time to time, the trading market for a particular security or type of security in which the
Fund invests may become less liquid or even illiquid. The Fund is actively managed but there is no guarantee
that the manager’s investment decisions will produce the desired results. The Fund’s prospectus also includes
a description of the main investment risks.
Class C: These shares have higher annual fees and expenses than Class A shares.
Class R: Shares are available to certain eligible investors as described in the prospectus. These shares
have higher annual fees and expenses than Class A shares.
Class R6: Shares are available to certain eligible investors as described in the prospectus.
Advisor Class: Shares are available to certain eligible investors as described in the prospectus.
58 | Annual Report
Performance Summary (continued)
1. The Fund has a fee waiver associated with its investments in a Franklin Templeton money fund, contractually guaranteed through at least its
current fiscal year-end. Fund investment results reflect the fee waiver, to the extent applicable; without this reduction, the results would have
been lower.
2. Cumulative total return represents the change in value of an investment over the periods indicated.
3. Average annual total return represents the average annual change in value of an investment over the periods indicated.
4. These figures represent the value of a hypothetical $10,000 investment in the Fund over the periods indicated.
5. In accordance with SEC rules, we provide standardized average annual total return information through the latest calendar quarter.
6. Figures are as stated in the Fund’s current prospectus. In periods of market volatility, assets may decline significantly, causing total annual Fund
operating expenses to become higher than the figures shown.
7. Performance shown is not annualized.
8. Source: © 2014 Morningstar. The S&P 500 is a market capitalization-weighted index of 500 stocks designed to measure total U.S. equity market
performance. The Russell Midcap Growth Index is market capitalization weighted and measures performance of those Russell Midcap Index compa-
nies with higher price-to-book ratios and higher forecasted growth values.
9. S&P 500: Copyright © 2014, S&P Dow Jones Indices LLC. All rights reserved. Reproduction of S&P U.S. Index data in any form is prohibited except
with the prior written permission of S&P. S&P does not guarantee the accuracy, adequacy, completeness or availability of any information and is not
responsible for any errors or omissions, regardless of the cause or for the results obtained from the use of such information. S&P DISCLAIMS ANY
AND ALL EXPRESS OR IMPLIED WARRANTIES, INCLUDING, BUT NOT LIMITED TO, ANY WARRANTIES OF MERCHANTABILITY OR FITNESS FOR A PARTICULAR
PURPOSE OR USE. In no event shall S&P be liable for any direct, indirect, special or consequential damages, costs, expenses, legal fees, or losses
(including lost income or lost profit and opportunity costs) in connection with subscriber’s or others’ use of S&P U.S. Index data.
10. Frank Russell Company is the source and owner of the Russell Index data contained or reflected in this material and all trademarks and copy-
rights related thereto. This is a presentation of Licensee. The presentation may contain confidential information and unauthorized use, disclosure,
copying, dissemination or redistribution is strictly prohibited. Frank Russell Company is not responsible for the formatting or configuration of this
material or for any inaccuracy in Licensee’s presentation thereof.
Annual Report | 59
Your Fund’s Expenses
Franklin Small-Mid Cap Growth Fund
As a Fund shareholder, you can incur two types of costs:
- Transaction costs, including sales charges (loads) on Fund purchases; and
- Ongoing Fund costs, including management fees, distribution and service (12b-1) fees, and other Fund expenses. All mutual funds have ongoing costs, sometimes referred to as operating expenses.
The following table shows ongoing costs of investing in the Fund and can help you understand these costs and compare them with those of other mutual funds. The table assumes a $1,000 investment held for the six months indicated.
Actual Fund Expenses
The first line (Actual) for each share class listed in the table provides actual account values and expenses. The “Ending Account Value” is derived from the Fund’s actual return, which includes the effect of Fund expenses.
You can estimate the expenses you paid during the period by following these steps. Of course, your account value and expenses will differ from those in this illustration:
| 1. | Divide your account value by $1,000. |
| If an account had an $8,600 value, then $8,600 ÷ $1,000 = 8.6. | |
| 2. | Multiply the result by the number under the heading “Expenses Paid During Period.” |
| If Expenses Paid During Period were $7.50, then 8.6 x $7.50 = $64.50. |
In this illustration, the estimated expenses paid this period are $64.50.
Hypothetical Example for Comparison with Other Funds
Information in the second line (Hypothetical) for each class in the table can help you compare ongoing costs of investing in the Fund with those of other mutual funds. This information may not be used to estimate the actual ending account balance or expenses you paid during the period. The hypothetical “Ending Account Value” is based on the actual expense ratio for each class and an assumed 5% annual rate of return before expenses, which does not represent the Fund’s actual return. The figure under the heading “Expenses Paid During Period” shows the hypothetical expenses your account would have incurred under this scenario. You can compare this figure with the 5% hypothetical examples that appear in shareholder reports of other funds.
60 | Annual Report
Your Fund’s Expenses (continued)
Please note that expenses shown in the table are meant to highlight ongoing costs and do not reflect any transaction costs, such as sales charges. Therefore, the second line for each class is useful in comparing ongoing costs only, and will not help you compare total costs of owning different funds. In addition, if transaction costs were included, your total costs would have been higher. Please refer to the Fund prospectus for additional information on operating expenses.
| Beginning Account | Ending Account | Expenses Paid During | ||||
| Share Class | Value 11/1/13 | Value 4/30/14 | Period* 11/1/13– 4/30/14 | |||
| A | ||||||
| Actual | $ | 1,000 | $ | 1,048.60 | $ | 4.83 |
| Hypothetical (5% return before expenses) | $ | 1,000 | $ | 1,020.08 | $ | 4.76 |
| C | ||||||
| Actual | $ | 1,000 | $ | 1,044.20 | $ | 8.62 |
| Hypothetical (5% return before expenses) | $ | 1,000 | $ | 1,016.36 | $ | 8.50 |
| R | ||||||
| Actual | $ | 1,000 | $ | 1,047.00 | $ | 6.09 |
| Hypothetical (5% return before expenses) | $ | 1,000 | $ | 1,018.84 | $ | 6.01 |
| R6 | ||||||
| Actual | $ | 1,000 | $ | 1,050.90 | $ | 2.39 |
| Hypothetical (5% return before expenses) | $ | 1,000 | $ | 1,022.46 | $ | 2.36 |
| Advisor | ||||||
| Actual | $ | 1,000 | $ | 1,049.70 | $ | 3.56 |
| Hypothetical (5% return before expenses) | $ | 1,000 | $ | 1,021.32 | $ | 3.51 |
| *Expenses are calculated using the most recent six-month expense ratio, net of expense waivers, annualized for each class (A: 0.95%; C: 1.70%; | ||||||
| R: 1.20%; R6: 0.47%; and Advisor: 0.70%), multiplied by the average account value over the period, multiplied by 181/365 to reflect the one-half | ||||||
| year period. | ||||||
Annual Report | 61
| Franklin Strategic Series | |||||||||||||||
| Financial Highlights | |||||||||||||||
| Franklin Flex Cap Growth Fund | |||||||||||||||
| Year Ended April 30, | |||||||||||||||
| Class A | 2014 | 2013 | 2012 | 2011 | 2010 | ||||||||||
| Per share operating performance | |||||||||||||||
| (for a share outstanding throughout the year) | |||||||||||||||
| Net asset value, beginning of year | $ | 51.21 | $ | 51.12 | $ | 52.42 | $ | 43.55 | $ | 32.46 | |||||
| Income from investment operationsa: | |||||||||||||||
| Net investment income (loss)b | (0.16 | ) | 0.04 | c | (0.05 | ) | (0.11 | ) | (0.06 | ) | |||||
| Net realized and unrealized gains (losses) | 11.51 | 1.69 | 0.67 | 8.98 | 11.15 | ||||||||||
| Total from investment operations | 11.35 | 1.73 | 0.62 | 8.87 | 11.09 | ||||||||||
| Less distributions from: | |||||||||||||||
| Net investment income | — | (0.01 | ) | — | — | — | |||||||||
| Net realized gains | (8.63 | ) | (1.63 | ) | (1.92 | ) | — | — | |||||||
| Total distributions | (8.63 | ) | (1.64 | ) | (1.92 | ) | — | — | |||||||
| Net asset value, end of year | $ | 53.93 | $ | 51.21 | $ | 51.12 | $ | 52.42 | $ | 43.55 | |||||
| Total returnd | 22.31 | % | 3.70 | % | 1.86 | % | 20.37 | % | 34.17 | % | |||||
| Ratios to average net assets | |||||||||||||||
| Expenses before waiver and payments by affiliates | 0.97 | % | 0.99 | % | 0.98 | % | 0.98 | % | 1.01 | % | |||||
| Expenses net of waiver and payments by affiliates | 0.97 | %e,f | 0.99 | % | 0.98 | % | 0.98 | % | 0.99 | %f | |||||
| Net investment income (loss) | (0.27 | )% | 0.09 | %c | (0.10 | )% | (0.23 | )% | (0.16 | )% | |||||
| Supplemental data | |||||||||||||||
| Net assets, end of year (000’s) | $ | 2,171,053 | $ | 2,080,349 | $ | 2,094,119 | $ | 2,233,642 | $ | 1,899,703 | |||||
| Portfolio turnover rate | 41.08 | % | 63.09 | % | 49.59 | % | 51.32 | % | 47.70 | % | |||||
aThe amount shown for a share outstanding throughout the period may not correlate with the Statement of Operations for the period due to the timing of sales and repurchases of
the Fund shares in relation to income earned and/or fluctuating fair value of the investments of the Fund.
bBased on average daily shares outstanding.
cNet investment income per share includes approximately $0.07 per share received in the form of special dividends. Excluding these amounts, the ratio of net investment income
to average net assets would have been (0.06)%.
dTotal return does not reflect sales commissions or contingent deferred sales charges, if applicable.
eBenefit of waiver and payments by affiliates rounds to less than 0.01%.
fBenefit of expense reduction rounds to less than 0.01%.
62 | The accompanying notes are an integral part of these financial statements. | Annual Report
| Franklin Strategic Series | |||||||||||||||
| Financial Highlights (continued) | |||||||||||||||
| Franklin Flex Cap Growth Fund | |||||||||||||||
| Year Ended April 30, | |||||||||||||||
| Class C | 2014 | 2013 | 2012 | 2011 | 2010 | ||||||||||
| Per share operating performance | |||||||||||||||
| (for a share outstanding throughout the year) | |||||||||||||||
| Net asset value, beginning of year | $ | 45.70 | $ | 46.14 | $ | 47.88 | $ | 40.08 | $ | 30.10 | |||||
| Income from investment operationsa: | |||||||||||||||
| Net investment income (loss)b | (0.52 | ) | (0.29 | )c | (0.37 | ) | (0.41 | ) | (0.32 | ) | |||||
| Net realized and unrealized gains (losses) | 10.24 | 1.48 | 0.55 | 8.21 | 10.30 | ||||||||||
| Total from investment operations | 9.72 | 1.19 | 0.18 | 7.80 | 9.98 | ||||||||||
| Less distributions from net realized gains | (8.63 | ) | (1.63 | ) | (1.92 | ) | — | — | |||||||
| Net asset value, end of year | $ | 46.79 | $ | 45.70 | $ | 46.14 | $ | 47.88 | $ | 40.08 | |||||
| Total returnd | 21.38 | % | 2.92 | % | 1.10 | % | 19.46 | % | 33.16 | % | |||||
| Ratios to average net assets | |||||||||||||||
| Expenses before waiver and payments by affiliates | 1.72 | % | 1.74 | % | 1.73 | % | 1.73 | % | 1.76 | % | |||||
| Expenses net of waiver and payments by affiliates | 1.72 | %e,f | 1.74 | % | 1.73 | % | 1.73 | % | 1.74 | %f | |||||
| Net investment income (loss) | (1.02 | )% | (0.66 | )%c | (0.85 | )% | (0.98 | )% | (0.91 | )% | |||||
| Supplemental data | |||||||||||||||
| Net assets, end of year (000’s) | $ | 348,040 | $ | 298,253 | $ | 323,249 | $ | 352,282 | $ | 315,013 | |||||
| Portfolio turnover rate | 41.08 | % | 63.09 | % | 49.59 | % | 51.32 | % | 47.70 | % | |||||
aThe amount shown for a share outstanding throughout the period may not correlate with the Statement of Operations for the period due to the timing of sales and repurchases of
the Fund shares in relation to income earned and/or fluctuating fair value of the investments of the Fund.
bBased on average daily shares outstanding.
cNet investment income per share includes approximately $0.07 per share received in the form of special dividends. Excluding these amounts, the ratio of net investment income
to average net assets would have been (0.81)%.
dTotal return does not reflect sales commissions or contingent deferred sales charges, if applicable.
eBenefit of waiver and payments by affiliates rounds to less than 0.01%.
fBenefit of expense reduction rounds to less than 0.01%.
Annual Report | The accompanying notes are an integral part of these financial statements. | 63
| Franklin Strategic Series | |||||||||||||||
| Financial Highlights (continued) | |||||||||||||||
| Franklin Flex Cap Growth Fund | |||||||||||||||
| Year Ended April 30, | |||||||||||||||
| Class R | 2014 | 2013 | 2012 | 2011 | 2010 | ||||||||||
| Per share operating performance | |||||||||||||||
| (for a share outstanding throughout the year) | |||||||||||||||
| Net asset value, beginning of year | $ | 49.74 | $ | 49.82 | $ | 51.27 | $ | 42.70 | $ | 31.91 | |||||
| Income from investment operationsa: | |||||||||||||||
| Net investment income (loss)b | (0.28 | ) | (0.08 | )c | (0.16 | ) | (0.21 | ) | (0.16 | ) | |||||
| Net realized and unrealized gains (losses) | 11.16 | 1.63 | 0.63 | 8.78 | 10.95 | ||||||||||
| Total from investment operations | 10.88 | 1.55 | 0.47 | 8.57 | 10.79 | ||||||||||
| Less distributions from net realized gains | (8.63 | ) | (1.63 | ) | (1.92 | ) | — | — | |||||||
| Net asset value, end of year | $ | 51.99 | $ | 49.74 | $ | 49.82 | $ | 51.27 | $ | 42.70 | |||||
| Total return | 22.01 | % | 3.43 | % | 1.60 | % | 20.07 | % | 33.81 | % | |||||
| Ratios to average net assets | |||||||||||||||
| Expenses before waiver and payments by affiliates | 1.22 | % | 1.24 | % | 1.23 | % | 1.23 | % | 1.26 | % | |||||
| Expenses net of waiver and payments by affiliates | 1.22 | %d,e | 1.24 | % | 1.23 | % | 1.23 | % | 1.24 | %e | |||||
| Net investment income (loss) | (0.52 | )% | (0.16 | )%c | (0.35 | )% | (0.48 | )% | (0.41 | )% | |||||
| Supplemental data | |||||||||||||||
| Net assets, end of year (000’s) | $ | 56,274 | $ | 63,134 | $ | 76,340 | $ | 72,532 | $ | 60,904 | |||||
| Portfolio turnover rate | 41.08 | % | 63.09 | % | 49.59 | % | 51.32 | % | 47.70 | % | |||||
aThe amount shown for a share outstanding throughout the period may not correlate with the Statement of Operations for the period due to the timing of sales and repurchases of
the Fund shares in relation to income earned and/or fluctuating fair value of the investments of the Fund.
bBased on average daily shares outstanding.
cNet investment income per share includes approximately $0.07 per share received in the form of special dividends. Excluding these amounts, the ratio of net investment income
to average net assets would have been (0.31)%.
dBenefit of waiver and payments by affiliates rounds to less than 0.01%.
eBenefit of expense reduction rounds to less than 0.01%.
64 | The accompanying notes are an integral part of these financial statements. | Annual Report
| Franklin Strategic Series | |||
| Financial Highlights (continued) | |||
| Franklin Flex Cap Growth Fund | |||
| Year Ended | |||
| April 30, | |||
| Class R6 | 2014 | a | |
| Per share operating performance | |||
| (for a share outstanding throughout the year) | |||
| Net asset value, beginning of year | $ | 51.70 | |
| Income from investment operationsb: | |||
| Net investment incomec | 0.11 | ||
| Net realized and unrealized gains (losses) | 12.36 | ||
| Total from investment operations | 12.47 | ||
| Less distributions from net realized gains | (8.63 | ) | |
| Net asset value, end of year | $ | 55.54 | |
| Total return | 24.32 | % | |
| Ratios to average net assets | |||
| Expensesd | 0.48 | % | |
| Net investment income | 0.22 | % | |
| Supplemental data | |||
| Net assets, end of year (000’s) | $ | 376,607 | |
| Portfolio turnover rate | 41.08 | % | |
aFor the year May 1, 2013 (effective date) to April 30, 2014.
bThe amount shown for a share outstanding throughout the period may not correlate with the Statement of Operations for the period due to the timing of sales and repurchases of
the Fund shares in relation to income earned and/or fluctuating fair value of the investments of the Fund.
cBased on average daily shares outstanding.
dBenefit of waiver and payments by affiliates and expense reduction rounds to less than 0.01%.
Annual Report | The accompanying notes are an integral part of these financial statements. | 65
| Franklin Strategic Series | |||||||||||||||
| Financial Highlights (continued) | |||||||||||||||
| Franklin Flex Cap Growth Fund | |||||||||||||||
| Year Ended April 30, | |||||||||||||||
| Advisor Class | 2014 | 2013 | 2012 | 2011 | 2010 | ||||||||||
| Per share operating performance | |||||||||||||||
| (for a share outstanding throughout the year) | |||||||||||||||
| Net asset value, beginning of year | $ | 52.29 | $ | 52.12 | $ | 53.26 | $ | 44.14 | $ | 32.82 | |||||
| Income from investment operationsa: | |||||||||||||||
| Net investment incomeb | 0.03 | 0.18 | c | 0.07 | 0.01 | 0.04 | |||||||||
| Net realized and unrealized gains (losses) | 11.71 | 1.71 | 0.71 | 9.11 | 11.28 | ||||||||||
| Total from investment operations | 11.74 | 1.89 | 0.78 | 9.12 | 11.32 | ||||||||||
| Less distributions from: | |||||||||||||||
| Net investment income | — | (0.09 | ) | — | — | — | |||||||||
| Net realized gains | (8.63 | ) | (1.63 | ) | (1.92 | ) | — | — | |||||||
| Total distributions | (8.63 | ) | (1.72 | ) | (1.92 | ) | — | — | |||||||
| Net asset value, end of year | $ | 55.40 | $ | 52.29 | $ | 52.12 | $ | 53.26 | $ | 44.14 | |||||
| Total return | 22.63 | % | 3.94 | % | 2.13 | % | 20.66 | % | 34.49 | % | |||||
| Ratios to average net assets | |||||||||||||||
| Expenses before waiver and payments by affiliates | 0.72 | % | 0.74 | % | 0.73 | % | 0.73 | % | 0.76 | % | |||||
| Expenses net of waiver and payments by affiliates | 0.72 | %d,e | 0.74 | % | 0.73 | % | 0.73 | % | 0.74 | %e | |||||
| Net investment income (loss) | (0.02 | )%f | 0.34 | %c | 0.15 | % | 0.02 | % | 0.09 | % | |||||
| Supplemental data | |||||||||||||||
| Net assets, end of year (000’s) | $ | 329,671 | $ | 836,225 | $ | 1,162,624 | $ | 1,233,168 | $ | 856,298 | |||||
| Portfolio turnover rate | 41.08 | % | 63.09 | % | 49.59 | % | 51.32 | % | 47.70 | % | |||||
aThe amount shown for a share outstanding throughout the period may not correlate with the Statement of Operations for the period due to the timing of sales and repurchases of
the Fund shares in relation to income earned and/or fluctuating fair value of the investments of the Fund.
bBased on average daily shares outstanding.
cNet investment income per share includes approximately $0.07 per share received in the form of special dividends. Excluding these amounts, the ratio of net investment income
to average net assets would have been 0.19%.
dBenefit of waiver and payments by affiliates rounds to less than 0.01%.
eBenefit of expense reduction rounds to less than 0.01%.
fRatio is calculated based on the Fund level net investment income, as reflected in the Statement of Operations, and adjusted for class specific expenses. The amount may not
correlate with the per share amount due to the timing of income earned and/or fluctuating market value of the investments of the Fund in relation to the timing of sales and
repurchases of Fund shares.
66 | The accompanying notes are an integral part of these financial statements. | Annual Report
| Franklin Strategic Series | |||
| Statement of Investments, April 30, 2014 | |||
| Franklin Flex Cap Growth Fund | Shares | Value | |
| Common Stocks 98.7% | |||
| Automobiles & Components 1.1% | |||
| BorgWarner Inc. | 400,000 | $ | 24,856,000 |
| aTesla Motors Inc. | 50,000 | 10,394,500 | |
| 35,250,500 | |||
| Banks 2.5% | |||
| aSignature Bank/New York NY | 318,400 | 37,832,288 | |
| aSVB Financial Group | 200,000 | 21,338,000 | |
| aTalmer Bancorp Inc., A | 700,000 | 9,387,000 | |
| aTexas Capital Bancshares Inc. | 235,000 | 13,204,650 | |
| 81,761,938 | |||
| Capital Goods 11.3% | |||
| Acuity Brands Inc. | 100,000 | 12,457,000 | |
| aChart Industries Inc. | 225,000 | 15,349,500 | |
| aColfax Corp. | 308,300 | 22,191,434 | |
| Cummins Inc. | 65,000 | 9,805,250 | |
| Danaher Corp. | 350,000 | 25,683,000 | |
| aDigitalGlobe Inc. | 550,000 | 16,379,000 | |
| aHD Supply Holdings Inc. | 325,000 | 8,378,500 | |
| Honeywell International Inc. | 400,000 | 37,160,000 | |
| aJacobs Engineering Group Inc. | 276,400 | 15,948,280 | |
| a,bThe Keyw Holding Corp. | 425,000 | 5,461,250 | |
| The Manitowoc Co. Inc. | 850,000 | 27,013,000 | |
| Pall Corp. | 375,200 | 31,573,080 | |
| Precision Castparts Corp. | 202,700 | 51,301,343 | |
| aProto Labs Inc. | 225,000 | 13,621,500 | |
| Rockwell Automation Inc. | 154,400 | 18,401,392 | |
| Roper Industries Inc. | 185,000 | 25,705,750 | |
| aUnited Rentals Inc. | 370,000 | 34,717,100 | |
| 371,146,379 | |||
| Commercial & Professional Services 1.9% | |||
| aIHS Inc., A | 132,500 | 15,983,475 | |
| Nielsen Holdings NV | 375,000 | 17,606,250 | |
| aStericycle Inc. | 154,400 | 17,978,336 | |
| aVerisk Analytics Inc., A | 185,000 | 11,116,650 | |
| 62,684,711 | |||
| Consumer Durables & Apparel 3.8% | |||
| aKate Spade & Co. | 175,000 | 6,084,750 | |
| a,bLululemon Athletica Inc. | 225,000 | 10,334,250 | |
| aMichael Kors Holdings Ltd. | 360,000 | 32,832,000 | |
| NIKE Inc., B | 441,400 | 32,200,130 | |
| a,bTRI Pointe Homes Inc. | 675,000 | 10,847,250 | |
| aUnder Armour Inc., A | 650,000 | 31,778,500 | |
| 124,076,880 | |||
Annual Report | 67
| Franklin Strategic Series | |||
| Statement of Investments, April 30, 2014 (continued) | |||
| Franklin Flex Cap Growth Fund | Shares | Value | |
| Common Stocks (continued) | |||
| Consumer Services 4.1% | |||
| aBally Technologies Inc. | 250,000 | $ | 16,277,500 |
| aBuffalo Wild Wings Inc. | 100,000 | 14,612,000 | |
| aChipotle Mexican Grill Inc. | 27,500 | 13,708,750 | |
| aChuy’s Holdings Inc. | 216,100 | 7,768,795 | |
| aHilton Worldwide Holdings Inc. | 290,300 | 6,337,249 | |
| Las Vegas Sands Corp. | 335,000 | 26,508,550 | |
| a,bNoodles & Co. | 375,200 | 12,302,808 | |
| Wynn Resorts Ltd. | 175,000 | 35,680,750 | |
| 133,196,402 | |||
| Diversified Financials 3.8% | |||
| aAffiliated Managers Group Inc. | 115,000 | 22,793,000 | |
| Discover Financial Services | 475,000 | 26,552,500 | |
| Evercore Partners Inc. | 200,000 | 10,686,000 | |
| Financial Engines Inc. | 176,600 | 7,814,550 | |
| IntercontinentalExchange Group Inc. | 110,200 | 22,529,288 | |
| T. Rowe Price Group Inc. | 397,200 | 32,622,036 | |
| 122,997,374 | |||
| Energy 5.1% | |||
| Anadarko Petroleum Corp. | 200,000 | 19,804,000 | |
| aDiamondback Energy Inc. | 250,000 | 17,985,000 | |
| aFMC Technologies Inc. | 313,000 | 17,747,100 | |
| National Oilwell Varco Inc. | 150,000 | 11,779,500 | |
| Noble Energy Inc. | 325,000 | 23,328,500 | |
| aOasis Petroleum Inc. | 475,000 | 22,092,250 | |
| Oceaneering International Inc. | 75,000 | 5,496,000 | |
| aRice Energy Inc. | 725,000 | 21,532,500 | |
| Schlumberger Ltd. | 263,600 | 26,768,580 | |
| 166,533,430 | |||
| Food & Staples Retailing 1.1% | |||
| aSprouts Farmers Markets LLC | 100,000 | 3,197,000 | |
| Whole Foods Market Inc. | 690,000 | 34,293,000 | |
| 37,490,000 | |||
| Food, Beverage & Tobacco 1.5% | |||
| aBoston Beer Inc., A | 61,800 | 15,205,272 | |
| Mead Johnson Nutrition Co., A | 190,000 | 16,769,400 | |
| aMonster Beverage Corp. | 273,600 | 18,320,256 | |
| 50,294,928 | |||
| Health Care Equipment & Services 2.5% | |||
| aCerner Corp. | 441,400 | 22,643,820 | |
| aDaVita HealthCare Partners Inc. | 309,000 | 21,413,700 | |
| aEnvision Healthcare Holdings Inc. | 525,000 | 17,739,750 | |
| McKesson Corp. | 110,200 | 18,644,738 | |
| 80,442,008 | |||
68 | Annual Report
| Franklin Strategic Series | |||
| Statement of Investments, April 30, 2014 (continued) | |||
| Franklin Flex Cap Growth Fund | Shares | Value | |
| Common Stocks (continued) | |||
| Insurance 0.3% | |||
| Aflac Inc. | 175,000 | $ | 10,976,000 |
| Materials 4.5% | |||
| Cytec Industries Inc. | 475,000 | 45,277,000 | |
| Ecolab Inc. | 640,000 | 66,969,600 | |
| Praxair Inc. | 275,000 | 35,901,250 | |
| 148,147,850 | |||
| Media 4.9% | |||
| aCharter Communications Inc., A | 200,000 | 27,106,000 | |
| aDiscovery Communications Inc., C | 420,000 | 29,454,600 | |
| aImax Corp. (Canada) | 450,400 | 11,548,256 | |
| aSirius XM Holdings Inc. | 8,900,000 | 28,391,000 | |
| Twenty-First Century Fox Inc., B | 775,000 | 24,273,000 | |
| The Walt Disney Co. | 500,000 | 39,670,000 | |
| 160,442,856 | |||
| Pharmaceuticals, Biotechnology & Life Sciences 10.1% | |||
| aActavis PLC | 350,000 | 71,515,500 | |
| aAlnylam Pharmaceuticals Inc. | 310,000 | 15,354,300 | |
| aBiogen Idec Inc. | 167,500 | 48,092,600 | |
| Bristol-Myers Squibb Co. | 617,900 | 30,950,611 | |
| aCelgene Corp. | 225,000 | 33,077,250 | |
| aCelldex Therapeutics Inc. | 775,000 | 11,625,000 | |
| aGilead Sciences Inc. | 800,000 | 62,792,000 | |
| aIllumina Inc. | 210,000 | 28,528,500 | |
| a,bKaryopharm Therapeutics Inc. | 125,000 | 3,353,750 | |
| Perrigo Co. PLC | 75,000 | 10,864,500 | |
| aQuintiles Transnational Holdings Inc. | 350,000 | 16,495,500 | |
| 332,649,511 | |||
| Real Estate 0.6% | |||
| American Tower Corp. | 225,000 | 18,792,000 | |
| Retailing 6.4% | |||
| aAmazon.com Inc. | 160,000 | 48,660,800 | |
| a,bThe Container Store Group Inc. | 115,200 | 3,178,368 | |
| Dick’s Sporting Goods Inc. | 402,400 | 21,190,384 | |
| GNC Holdings Inc., A | 275,000 | 12,375,000 | |
| aHomeAway Inc. | 425,000 | 13,863,500 | |
| aLiberty Ventures, A | 200,000 | 11,608,000 | |
| Lithia Motors Inc. | 160,000 | 11,884,800 | |
| aLKQ Corp. | 375,000 | 10,920,000 | |
| aNetflix Inc. | 45,000 | 14,491,800 | |
| aThe Priceline Group Inc. | 37,500 | 43,415,625 | |
| Tractor Supply Co. | 290,200 | 19,513,048 | |
| 211,101,325 | |||
Annual Report | 69
| Franklin Strategic Series | |||
| Statement of Investments, April 30, 2014 (continued) | |||
| Franklin Flex Cap Growth Fund | Shares | Value | |
| Common Stocks (continued) | |||
| Semiconductors & Semiconductor Equipment 3.9% | |||
| aCavium Inc. | 300,000 | $ | 12,711,000 |
| Microchip Technology Inc. | 600,000 | 28,524,000 | |
| aNanometrics Inc. | 361,629 | 5,880,087 | |
| aNXP Semiconductors NV (Netherlands) | 820,000 | 48,888,400 | |
| Xilinx Inc. | 675,000 | 31,853,250 | |
| 127,856,737 | |||
| Software & Services 17.0% | |||
| aAlliance Data Systems Corp. | 90,000 | 21,771,000 | |
| aANSYS Inc. | 264,700 | 20,199,257 | |
| aBottomline Technologies Inc. | 276,400 | 8,745,296 | |
| aBroadSoft Inc. | 350,000 | 8,883,000 | |
| aCoStar Group Inc. | 70,000 | 11,262,300 | |
| aDemandware Inc. | 200,000 | 9,926,000 | |
| aElectronic Arts Inc. | 500,000 | 14,150,000 | |
| aFacebook Inc., A | 780,000 | 46,628,400 | |
| a,bFireEye Inc. | 120,000 | 4,711,200 | |
| aFleetCor Technologies Inc. | 225,000 | 25,679,250 | |
| aFortinet Inc. | 450,000 | 9,891,000 | |
| aGlobal Eagle Entertainment Inc. | 550,000 | 6,066,500 | |
| aGoogle Inc., A | 87,500 | 46,802,000 | |
| aGoogle Inc., C | 87,500 | 46,082,750 | |
| aGuidewire Software Inc. | 225,000 | 8,496,000 | |
| aLinkedIn Corp., A | 130,000 | 19,951,100 | |
| MasterCard Inc., A | 950,000 | 69,872,500 | |
| aNetSuite Inc. | 225,000 | 17,394,750 | |
| aPandora Media Inc. | 350,000 | 8,197,000 | |
| aSalesforce.com Inc. | 500,000 | 25,825,000 | |
| aServiceNow Inc. | 275,000 | 13,673,000 | |
| aSplunk Inc. | 141,300 | 7,710,741 | |
| a,bTwitter Inc. | 250,000 | 9,742,500 | |
| Visa Inc., A | 260,000 | 52,678,600 | |
| aWorkday Inc. | 120,000 | 8,768,400 | |
| aYahoo! Inc. | 675,000 | 24,266,250 | |
| aYelp Inc. | 150,000 | 8,748,000 | |
| 556,121,794 | |||
| Technology Hardware & Equipment 6.8% | |||
| Apple Inc. | 150,000 | 88,513,500 | |
| aPalo Alto Networks Inc. | 160,000 | 10,172,800 | |
| QUALCOMM Inc. | 625,000 | 49,193,750 | |
| SanDisk Corp. | 300,000 | 25,491,000 | |
| aStratasys Ltd. | 150,000 | 14,530,500 | |
| aTrimble Navigation Ltd. | 640,000 | 24,595,200 | |
| a,bUbiquiti Networks Inc. | 300,000 | 11,619,000 | |
| 224,115,750 | |||
70 | Annual Report
Franklin Strategic Series
Statement of Investments, April 30, 2014 (continued)
| Franklin Flex Cap Growth Fund | Shares | Value | ||
| Common Stocks (continued) | ||||
| Telecommunication Services 0.8% | ||||
| aSBA Communications Corp. | 295,000 | $ | 26,479,200 | |
| Transportation 4.7% | ||||
| Canadian Pacific Railway Ltd. (Canada) | 125,000 | 19,496,250 | ||
| Expeditors International of Washington Inc. | 257,400 | 10,615,176 | ||
| aGenesee & Wyoming Inc. | 255,900 | 25,336,659 | ||
| aHub Group Inc., A | 551,800 | 24,637,870 | ||
| Kansas City Southern | 175,000 | 17,654,000 | ||
| aKirby Corp. | 100,000 | 10,062,000 | ||
| aSpirit Airlines Inc. | 350,000 | 19,894,000 | ||
| Union Pacific Corp. | 145,000 | 27,612,351 | ||
| 155,308,306 | ||||
| Total Common Stocks (Cost $2,096,680,633) | 3,237,865,879 | |||
| Preferred Stocks (Cost $9,999,998) 0.4% | ||||
| Pharmaceuticals, Biotechnology & Life Sciences 0.4% | ||||
| a,cFibroGen Inc., pfd., E | 2,227,171 | 12,605,788 | ||
| Total Investments before Short Term Investments (Cost $2,106,680,631) | 3,250,471,667 | |||
| Short Term Investments 2.9% | ||||
| Money Market Funds (Cost $37,937,180) 1.1% | ||||
| a,dInstitutional Fiduciary Trust Money Market Portfolio | 37,937,180 | 37,937,180 | ||
| eInvestments from Cash Collateral Received for Loaned Securities | ||||
| (Cost $60,498,783) 1.8% | ||||
| Money Market Funds 1.8% | ||||
| fBNY Mellon Overnight Government Fund, 0.05% | 60,498,783 | 60,498,783 | ||
| Total Investments (Cost $2,205,116,594) 102.0% | 3,348,907,630 | |||
| Other Assets, less Liabilities (2.0)% | (67,262,961 | ) | ||
| Net Assets 100.0% | $ | 3,281,644,669 | ||
| aNon-income producing. | ||||
| bA portion or all of the security is on loan at April 30, 2014. See Note 1(c). | ||||
| cSee Note 7 regarding restricted securities. | ||||
| dSee Note 3(f) regarding investments in the Institutional Fiduciary Trust Money Market Portfolio. | ||||
| eSee Note 1(c) regarding securities on loan. | ||||
| fThe rate shown is the annualized seven-day yield at period end. | ||||
Annual Report | The accompanying notes are an integral part of these financial statements. | 71
| Franklin Strategic Series | |||||||||||||||
| Financial Highlights | |||||||||||||||
| Franklin Focused Core Equity Fund | |||||||||||||||
| Year Ended April 30, | |||||||||||||||
| Class A | 2014 | 2013 | 2012 | 2011 | 2010 | ||||||||||
| Per share operating performance | |||||||||||||||
| (for a share outstanding throughout the year) | |||||||||||||||
| Net asset value, beginning of year | $ | 10.63 | $ | 9.47 | $ | 10.35 | $ | 9.03 | $ | 6.27 | |||||
| Income from investment operationsa: | |||||||||||||||
| Net investment incomeb | 0.03 | 0.07 | 0.02 | 0.06 | 0.02 | ||||||||||
| Net realized and unrealized gains (losses) | 2.92 | 1.16 | (0.31 | ) | 1.29 | 2.74 | |||||||||
| Total from investment operations | 2.95 | 1.23 | (0.29 | ) | 1.35 | 2.76 | |||||||||
| Less distributions from: | |||||||||||||||
| Net investment income | (0.07 | ) | — | (0.11 | ) | (0.03 | ) | —c | |||||||
| Net realized gains | (0.13 | ) | (0.07 | ) | (0.48 | ) | — | — | |||||||
| Total distributions | (0.20 | ) | (0.07 | ) | (0.59 | ) | (0.03 | ) | —c | ||||||
| Net asset value, end of year | $ | 13.38 | $ | 10.63 | $ | 9.47 | $ | 10.35 | $ | 9.03 | |||||
| Total returnd | 28.00 | % | 13.08 | % | (2.17 | )% | 14.92 | % | 44.05 | % | |||||
| Ratios to average net assets | |||||||||||||||
| Expenses before waiver and payments by affiliates | 1.73 | % | 1.89 | % | 1.81 | % | 1.87 | % | 2.04 | % | |||||
| Expenses net of waiver and payments by affiliates | 1.22 | % | 1.19 | % | 1.21 | % | 1.10 | % | 1.09 | %e | |||||
| Net investment income | 0.23 | % | 0.76 | % | 0.25 | % | 0.61 | % | 0.21 | % | |||||
| Supplemental data | |||||||||||||||
| Net assets, end of year (000’s) | $ | 40,372 | $ | 19,029 | $ | 26,253 | $ | 14,481 | $ | 10,974 | |||||
| Portfolio turnover rate | 43.30 | % | 74.50 | % | 51.85 | % | 63.80 | % | 42.73 | % | |||||
aThe amount shown for a share outstanding throughout the period may not correlate with the Statement of Operations for the period due to the timing of sales and repurchases of
the Fund shares in relation to income earned and/or fluctuating fair value of the investments of the Fund.
bBased on average daily shares outstanding.
cAmount rounds to less than $0.01 per share.
dTotal return does not reflect sales commissions or contingent deferred sales charges, if applicable.
eBenefit of expense reduction rounds to less than 0.01%.
72 | The accompanying notes are an integral part of these financial statements. | Annual Report
| Franklin Strategic Series | |||||||||||||||
| Financial Highlights (continued) | |||||||||||||||
| Franklin Focused Core Equity Fund | |||||||||||||||
| Year Ended April 30, | |||||||||||||||
| Class C | 2014 | 2013 | 2012 | 2011 | 2010 | ||||||||||
| Per share operating performance | |||||||||||||||
| (for a share outstanding throughout the year) | |||||||||||||||
| Net asset value, beginning of year | $ | 10.36 | $ | 9.29 | $ | 10.14 | $ | 8.90 | $ | 6.24 | |||||
| Income from investment operationsa: | |||||||||||||||
| Net investment income (loss)b | (0.06 | ) | 0.01 | (0.04 | ) | (0.01 | ) | (0.05 | ) | ||||||
| Net realized and unrealized gains (losses) | 2.84 | 1.13 | (0.29 | ) | 1.25 | 2.71 | |||||||||
| Total from investment operations | 2.78 | 1.14 | (0.33 | ) | 1.24 | 2.66 | |||||||||
| Less distributions from: | |||||||||||||||
| Net investment income | (0.03 | ) | — | (0.04 | ) | — | —c | ||||||||
| Net realized gains | (0.13 | ) | (0.07 | ) | (0.48 | ) | — | — | |||||||
| Total distributions | (0.16 | ) | (0.07 | ) | (0.52 | ) | — | —c | |||||||
| Net asset value, end of year | $ | 12.98 | $ | 10.36 | $ | 9.29 | $ | 10.14 | $ | 8.90 | |||||
| Total returnd | 26.99 | % | 12.36 | % | (2.66 | )% | 13.93 | % | 42.65 | % | |||||
| Ratios to average net assets | |||||||||||||||
| Expenses before waiver and payments by affiliates | 2.43 | % | 2.59 | % | 2.50 | % | 2.66 | % | 2.84 | % | |||||
| Expenses net of waiver and payments by affiliates | 1.92 | % | 1.89 | % | 1.90 | % | 1.89 | % | 1.89 | %e | |||||
| Net investment income (loss) | (0.47 | )% | 0.06 | % | (0.44 | )% | (0.18 | )% | (0.59 | )% | |||||
| Supplemental data | |||||||||||||||
| Net assets, end of year (000’s) | $ | 6,666 | $ | 2,502 | $ | 3,265 | $ | 2,095 | $ | 1,853 | |||||
| Portfolio turnover rate | 43.30 | % | 74.50 | % | 51.85 | % | 63.80 | % | 42.73 | % | |||||
aThe amount shown for a share outstanding throughout the period may not correlate with the Statement of Operations for the period due to the timing of sales and repurchases of
the Fund shares in relation to income earned and/or fluctuating fair value of the investments of the Fund.
bBased on average daily shares outstanding.
cAmount rounds to less than $0.01 per share.
dTotal return does not reflect sales commissions or contingent deferred sales charges, if applicable.
eBenefit of expense reduction rounds to less than 0.01%.
Annual Report | The accompanying notes are an integral part of these financial statements. | 73
| Franklin Strategic Series | |||||||||||||||
| Financial Highlights (continued) | |||||||||||||||
| Franklin Focused Core Equity Fund | |||||||||||||||
| Year Ended April 30, | |||||||||||||||
| Class R | 2014 | 2013 | 2012 | 2011 | 2010 | ||||||||||
| Per share operating performance | |||||||||||||||
| (for a share outstanding throughout the year) | |||||||||||||||
| Net asset value, beginning of year | $ | 10.56 | $ | 9.43 | $ | 10.30 | $ | 9.00 | $ | 6.27 | |||||
| Income from investment operationsa: | |||||||||||||||
| Net investment income (loss)b | 0.01 | 0.05 | 0.02 | 0.03 | (0.01 | ) | |||||||||
| Net realized and unrealized gains (losses) | 2.90 | 1.15 | (0.32 | ) | 1.28 | 2.74 | |||||||||
| Total from investment operations | 2.91 | 1.20 | (0.30 | ) | 1.31 | 2.73 | |||||||||
| Less distributions from: | |||||||||||||||
| Net investment income | (0.06 | ) | — | (0.09 | ) | (0.01 | ) | — | |||||||
| Net realized gains | (0.13 | ) | (0.07 | ) | (0.48 | ) | — | — | |||||||
| Total distributions | (0.19 | ) | (0.07 | ) | (0.57 | ) | (0.01 | ) | — | ||||||
| Net asset value, end of year | $ | 13.28 | $ | 10.56 | $ | 9.43 | $ | 10.30 | $ | 9.00 | |||||
| Total return | 27.70 | % | 12.81 | % | (2.22 | )% | 14.51 | % | 43.54 | % | |||||
| Ratios to average net assets | |||||||||||||||
| Expenses before waiver and payments by affiliates | 1.93 | % | 2.09 | % | 1.99 | % | 2.16 | % | 2.34 | % | |||||
| Expenses net of waiver and payments by affiliates | 1.42 | % | 1.39 | % | 1.39 | % | 1.39 | % | 1.39 | %c | |||||
| Net investment income (loss) | 0.03 | % | 0.56 | % | 0.07 | % | 0.32 | % | (0.09 | )% | |||||
| Supplemental data | |||||||||||||||
| Net assets, end of year (000’s) | $ | 124 | $ | 76 | $ | 41 | $ | 27 | $ | 21 | |||||
| Portfolio turnover rate | 43.30 | % | 74.50 | % | 51.85 | % | 63.80 | % | 42.73 | % | |||||
aThe amount shown for a share outstanding throughout the period may not correlate with the Statement of Operations for the period due to the timing of sales and repurchases of
the Fund shares in relation to income earned and/or fluctuating fair value of the investments of the Fund.
bBased on average daily shares outstanding.
cBenefit of expense reduction rounds to less than 0.01%.
74 | The accompanying notes are an integral part of these financial statements. | Annual Report
| Franklin Strategic Series | |||
| Financial Highlights (continued) | |||
| Franklin Focused Core Equity Fund | |||
| Year Ended | |||
| April 30, | |||
| Class R6 | 2014 | a | |
| Per share operating performance | |||
| (for a share outstanding throughout the year) | |||
| Net asset value, beginning of year | $ | 10.54 | |
| Income from investment operationsb: | |||
| Net investment incomec | 0.07 | ||
| Net realized and unrealized gains (losses) | 3.11 | ||
| Total from investment operations | 3.18 | ||
| Less distributions from: | |||
| Net investment income | (0.10 | ) | |
| Net realized gains | (0.13 | ) | |
| Total distributions | (0.23 | ) | |
| Net asset value, end of year | $ | 13.49 | |
| Total return | 30.43 | % | |
| Ratios to average net assets | |||
| Expenses before waiver and payments by affiliates | 2.28 | % | |
| Expenses net of waiver and payments by affiliates | 0.77 | % | |
| Net investment income | 0.68 | % | |
| Supplemental data | |||
| Net assets, end of year (000’s) | $ | 14 | |
| Portfolio turnover rate | 43.30 | % | |
aFor the year May 1, 2013 (effective date) to April 30, 2014.
bThe amount shown for a share outstanding throughout the period may not correlate with the Statement of Operations for the period due to the timing of sales and repurchases of
the Fund shares in relation to income earned and/or fluctuating fair value of the investments of the Fund.
cBased on average daily shares outstanding.
Annual Report | The accompanying notes are an integral part of these financial statements. | 75
| Franklin Strategic Series | |||||||||||||||
| Financial Highlights (continued) | |||||||||||||||
| Franklin Focused Core Equity Fund | |||||||||||||||
| Year Ended April 30, | |||||||||||||||
| Advisor Class | 2014 | 2013 | 2012 | 2011 | 2010 | ||||||||||
| Per share operating performance | |||||||||||||||
| (for a share outstanding throughout the year) | |||||||||||||||
| Net asset value, beginning of year | $ | 10.70 | $ | 9.50 | $ | 10.37 | $ | 9.06 | $ | 6.28 | |||||
| Income from investment operationsa: | |||||||||||||||
| Net investment incomeb | 0.07 | 0.10 | 0.06 | 0.08 | 0.04 | ||||||||||
| Net realized and unrealized gains (losses) | 2.93 | 1.17 | (0.32 | ) | 1.28 | 2.74 | |||||||||
| Total from investment operations | 3.00 | 1.27 | (0.26 | ) | 1.36 | 2.78 | |||||||||
| Less distributions from: | |||||||||||||||
| Net investment income | (0.09 | ) | — | (0.13 | ) | (0.05 | ) | —c | |||||||
| Net realized gains | (0.13 | ) | (0.07 | ) | (0.48 | ) | — | — | |||||||
| Total distributions | (0.22 | ) | (0.07 | ) | (0.61 | ) | (0.05 | ) | —c | ||||||
| Net asset value, end of year | $ | 13.48 | $ | 10.70 | $ | 9.50 | $ | 10.37 | $ | 9.06 | |||||
| Total return | 28.27 | % | 13.46 | % | (1.80 | )% | 15.08 | % | 44.34 | % | |||||
| Ratios to average net assets | |||||||||||||||
| Expenses before waiver and payments by affiliates | 1.43 | % | 1.59 | % | 1.49 | % | 1.66 | % | 1.84 | % | |||||
| Expenses net of waiver and payments by affiliates | 0.92 | % | 0.89 | % | 0.89 | % | 0.89 | % | 0.89 | %d | |||||
| Net investment income | 0.53 | % | 1.06 | % | 0.57 | % | 0.82 | % | 0.41 | % | |||||
| Supplemental data | |||||||||||||||
| Net assets, end of year (000’s) | $ | 6,990 | $ | 4,347 | $ | 3,188 | $ | 1,966 | $ | 1,182 | |||||
| Portfolio turnover rate | 43.30 | % | 74.50 | % | 51.85 | % | 63.80 | % | 42.73 | % | |||||
aThe amount shown for a share outstanding throughout the period may not correlate with the Statement of Operations for the period due to the timing of sales and repurchases of
the Fund shares in relation to income earned and/or fluctuating fair value of the investments of the Fund.
bBased on average daily shares outstanding.
cAmount rounds to less than $0.01 per share.
dBenefit of expense reduction rounds to less than 0.01%.
76 | The accompanying notes are an integral part of these financial statements. | Annual Report
| Franklin Strategic Series | ||||
| Statement of Investments, April 30, 2014 | ||||
| Franklin Focused Core Equity Fund | Country | Shares | Value | |
| Common Stocks 95.6% | ||||
| Consumer Discretionary 6.6% | ||||
| BorgWarner Inc. | United States | 14,170 | $ | 880,524 |
| NIKE Inc., B | United States | 19,568 | 1,427,485 | |
| The Walt Disney Co. | United States | 15,670 | 1,243,258 | |
| 3,551,267 | ||||
| Consumer Staples 4.7% | ||||
| CVS Caremark Corp. | United States | 17,470 | 1,270,418 | |
| Mead Johnson Nutrition Co., A | United States | 14,280 | 1,260,353 | |
| 2,530,771 | ||||
| Energy 10.2% | ||||
| Anadarko Petroleum Corp. | United States | 14,540 | 1,439,751 | |
| aDresser-Rand Group Inc. | United States | 17,890 | 1,081,272 | |
| Marathon Oil Corp. | United States | 39,590 | 1,431,178 | |
| Schlumberger Ltd. | United States | 15,280 | 1,551,684 | |
| 5,503,885 | ||||
| Financials 20.3% | ||||
| BlackRock Inc. | United States | 3,667 | 1,103,767 | |
| aCBRE Group Inc. | United States | 69,980 | 1,864,267 | |
| Citigroup Inc. | United States | 28,660 | 1,373,101 | |
| Discover Financial Services | United States | 22,460 | 1,255,514 | |
| The Hartford Financial Services Group Inc. | United States | 66,140 | 2,372,442 | |
| JPMorgan Chase & Co. | United States | 25,423 | 1,423,180 | |
| MetLife Inc. | United States | 31,090 | 1,627,561 | |
| 11,019,832 | ||||
| Health Care 16.4% | ||||
| aActavis PLC | United States | 7,920 | 1,618,294 | |
| Aetna Inc. | United States | 16,310 | 1,165,349 | |
| Allergan Inc. | United States | 14,530 | 2,409,655 | |
| Roche Holding AG | Switzerland | 5,050 | 1,480,316 | |
| aValeant Pharmaceuticals International Inc. | Canada | 16,710 | 2,234,294 | |
| 8,907,908 | ||||
| Industrials 5.7% | ||||
| The ADT Corp. | United States | 18,950 | 573,048 | |
| FedEx Corp. | United States | 7,160 | 975,550 | |
| aGenesee & Wyoming Inc. | United States | 15,400 | 1,524,754 | |
| 3,073,352 | ||||
| Information Technology 24.2% | ||||
| aAdobe Systems Inc. | United States | 32,370 | 1,996,905 | |
| Corning Inc. | United States | 44,630 | 933,213 | |
| aEquinix Inc. | United States | 2,910 | 546,527 | |
| aGoogle Inc., A | United States | 1,460 | 780,925 | |
| aGoogle Inc., C | United States | 1,470 | 774,190 | |
| MasterCard Inc., A | United States | 21,780 | 1,601,919 | |
| Maxim Integrated Products Inc. | United States | 39,610 | 1,284,949 | |
Annual Report | 77
| Franklin Strategic Series | |||||
| Statement of Investments, April 30, 2014 (continued) | |||||
| Franklin Focused Core Equity Fund | Country | Shares | Value | ||
| Common Stocks (continued) | |||||
| Information Technology (continued) | |||||
| Microsoft Corp. | United States | 44,050 | $ | 1,779,620 | |
| Motorola Solutions Inc. | United States | 29,780 | 1,893,413 | ||
| QUALCOMM Inc. | United States | 19,500 | 1,534,845 | ||
| 13,126,506 | |||||
| Materials 7.5% | |||||
| Axiall Corp. | United States | 19,998 | 931,907 | ||
| LyondellBasell Industries NV, A | United States | 17,650 | 1,632,625 | ||
| The Mosaic Co. | United States | 30,350 | 1,518,714 | ||
| 4,083,246 | |||||
| Total Common Stocks (Cost $39,729,558) | 51,796,767 | ||||
| Short Term Investments (Cost $2,870,498) 5.3% | |||||
| Money Market Funds 5.3% | |||||
| a,bInstitutional Fiduciary Trust Money Market Portfolio | United States | 2,870,498 | 2,870,498 | ||
| Total Investments (Cost $42,600,056) 100.9% | 54,667,265 | ||||
| Other Assets, less Liabilities (0.9)% | (502,044 | ) | |||
| Net Assets 100.0% | $ | 54,165,221 | |||
| aNon-income producing. | |||||
| bSee Note 3(f) regarding investments in the Institutional Fiduciary Trust Money Market Portfolio. | |||||
78 | The accompanying notes are an integral part of these financial statements. | Annual Report
| Franklin Strategic Series | |||||||||||||||
| Financial Highlights | |||||||||||||||
| Franklin Growth Opportunities Fund | |||||||||||||||
| Year Ended April 30, | |||||||||||||||
| Class A | 2014 | 2013 | 2012 | 2011 | 2010 | ||||||||||
| Per share operating performance | |||||||||||||||
| (for a share outstanding throughout the year) | |||||||||||||||
| Net asset value, beginning of year | $ | 24.29 | $ | 23.02 | $ | 24.28 | $ | 19.59 | $ | 13.88 | |||||
| Income from investment operationsa: | |||||||||||||||
| Net investment income (loss)b | (0.19 | ) | (0.12 | ) | (0.16 | ) | (0.15 | ) | (0.14 | ) | |||||
| Net realized and unrealized gains (losses) | 5.11 | 1.95 | 0.40 | 4.84 | 5.85 | ||||||||||
| Total from investment operations | 4.92 | 1.83 | 0.24 | 4.69 | 5.71 | ||||||||||
| Less distributions from net realized gains | (0.73 | ) | (0.56 | ) | (1.50 | ) | — | — | |||||||
| Net asset value, end of year | $ | 28.48 | $ | 24.29 | $ | 23.02 | $ | 24.28 | $ | 19.59 | |||||
| Total returnc | 20.26 | % | 8.29 | % | 1.90 | % | 23.94 | % | 41.14 | % | |||||
| Ratios to average net assets | |||||||||||||||
| Expenses before waiver and payments by affiliates | 1.17 | % | 1.25 | % | 1.28 | % | 1.28 | % | 1.31 | % | |||||
| Expenses net of waiver and payments by affiliates | 1.17 | %d,e | 1.25 | % | 1.28 | % | 1.28 | % | 1.24 | %e | |||||
| Net investment income (loss) | (0.70 | )% | (0.56 | )% | (0.71 | )% | (0.73 | )% | (0.81 | )% | |||||
| Supplemental data | |||||||||||||||
| Net assets, end of year (000’s) | $ | 349,343 | $ | 213,639 | $ | 209,382 | $ | 211,435 | $ | 168,205 | |||||
| Portfolio turnover rate | 36.64 | % | 58.76 | % | 63.57 | % | 69.74 | % | 67.27 | % | |||||
aThe amount shown for a share outstanding throughout the period may not correlate with the Statement of Operations for the period due to the timing of sales and repurchases of
the Fund shares in relation to income earned and/or fluctuating fair value of the investments of the Fund.
bBased on average daily shares outstanding.
cTotal return does not reflect sales commissions or contingent deferred sales charges, if applicable.
dBenefit of waiver and payments by affiliates rounds to less than 0.01%.
eBenefit of expense reduction rounds to less than 0.01%.
Annual Report | The accompanying notes are an integral part of these financial statements. | 79
| Franklin Strategic Series | |||||||||||||||
| Financial Highlights (continued) | |||||||||||||||
| Franklin Growth Opportunities Fund | |||||||||||||||
| Year Ended April 30, | |||||||||||||||
| Class C | 2014 | 2013 | 2012 | 2011 | 2010 | ||||||||||
| Per share operating performance | |||||||||||||||
| (for a share outstanding throughout the year) | |||||||||||||||
| Net asset value, beginning of year | $ | 21.89 | $ | 20.95 | $ | 22.40 | $ | 18.20 | $ | 12.99 | |||||
| Income from investment operationsa: | |||||||||||||||
| Net investment income (loss)b | (0.35 | ) | (0.26 | ) | (0.29 | ) | (0.27 | ) | (0.24 | ) | |||||
| Net realized and unrealized gains (losses) | 4.60 | 1.76 | 0.34 | 4.47 | 5.45 | ||||||||||
| Total from investment operations | 4.25 | 1.50 | 0.05 | 4.20 | 5.21 | ||||||||||
| Less distributions from net realized gains | (0.73 | ) | (0.56 | ) | (1.50 | ) | — | — | |||||||
| Net asset value, end of year | $ | 25.41 | $ | 21.89 | $ | 20.95 | $ | 22.40 | $ | 18.20 | |||||
| Total returnc | 19.42 | % | 7.47 | % | 1.24 | % | 23.08 | % | 40.11 | % | |||||
| Ratios to average net assets | |||||||||||||||
| Expenses before waiver and payments by affiliates | 1.87 | % | 1.97 | % | 1.99 | % | 1.98 | % | 2.02 | % | |||||
| Expenses net of waiver and payments by affiliates | 1.87 | %d,e | 1.97 | % | 1.99 | % | 1.98 | % | 1.95 | %e | |||||
| Net investment income (loss) | (1.40 | )% | (1.28 | )% | (1.42 | )% | (1.43 | )% | (1.52 | )% | |||||
| Supplemental data | |||||||||||||||
| Net assets, end of year (000’s) | $ | 85,883 | $ | 51,719 | $ | 50,453 | $ | 56,658 | $ | 46,227 | |||||
| Portfolio turnover rate | 36.64 | % | 58.76 | % | 63.57 | % | 69.74 | % | 67.27 | % | |||||
aThe amount shown for a share outstanding throughout the period may not correlate with the Statement of Operations for the period due to the timing of sales and repurchases of
the Fund shares in relation to income earned and/or fluctuating fair value of the investments of the Fund.
bBased on average daily shares outstanding.
cTotal return does not reflect sales commissions or contingent deferred sales charges, if applicable.
dBenefit of waiver and payments by affiliates rounds to less than 0.01%.
eBenefit of expense reduction rounds to less than 0.01%.
80 | The accompanying notes are an integral part of these financial statements. | Annual Report
| Franklin Strategic Series | |||||||||||||||
| Financial Highlights (continued) | |||||||||||||||
| Franklin Growth Opportunities Fund | |||||||||||||||
| Year Ended April 30, | |||||||||||||||
| Class R | 2014 | 2013 | 2012 | 2011 | 2010 | ||||||||||
| Per share operating performance | |||||||||||||||
| (for a share outstanding throughout the year) | |||||||||||||||
| Net asset value, beginning of year | $ | 23.67 | $ | 22.49 | $ | 23.81 | $ | 19.25 | $ | 13.67 | |||||
| Income from investment operationsa: | |||||||||||||||
| Net investment income (loss)b | (0.24 | ) | (0.17 | ) | (0.20 | ) | (0.19 | ) | (0.17 | ) | |||||
| Net realized and unrealized gains (losses) | 4.97 | 1.91 | 0.38 | 4.75 | 5.75 | ||||||||||
| Total from investment operations | 4.73 | 1.74 | 0.18 | 4.56 | 5.58 | ||||||||||
| Less distributions from net realized gains | (0.73 | ) | (0.56 | ) | (1.50 | ) | — | — | |||||||
| Net asset value, end of year | $ | 27.67 | $ | 23.67 | $ | 22.49 | $ | 23.81 | $ | 19.25 | |||||
| Total return | 19.99 | % | 8.03 | % | 1.73 | % | 23.69 | % | 40.82 | % | |||||
| Ratios to average net assets | |||||||||||||||
| Expenses before waiver and payments by affiliates | 1.37 | % | 1.47 | % | 1.49 | % | 1.48 | % | 1.52 | % | |||||
| Expenses net of waiver and payments by affiliates | 1.37 | %c,d | 1.47 | % | 1.49 | % | 1.48 | % | 1.45 | %d | |||||
| Net investment income (loss) | (0.90 | )% | (0.78 | )% | (0.92 | )% | (0.93 | )% | (1.02 | )% | |||||
| Supplemental data | |||||||||||||||
| Net assets, end of year (000’s) | $ | 42,953 | $ | 34,399 | $ | 33,783 | $ | 29,053 | $ | 17,010 | |||||
| Portfolio turnover rate | 36.64 | % | 58.76 | % | 63.57 | % | 69.74 | % | 67.27 | % | |||||
aThe amount shown for a share outstanding throughout the period may not correlate with the Statement of Operations for the period due to the timing of sales and repurchases of
the Fund shares in relation to income earned and/or fluctuating fair value of the investments of the Fund.
bBased on average daily shares outstanding.
cBenefit of waiver and payments by affiliates rounds to less than 0.01%.
dBenefit of expense reduction rounds to less than 0.01%.
Annual Report | The accompanying notes are an integral part of these financial statements. | 81
| Franklin Strategic Series | |||
| Financial Highlights (continued) | |||
| Franklin Growth Opportunities Fund | |||
| Year Ended | |||
| April 30, | |||
| Class R6 | 2014 | a | |
| Per share operating performance | |||
| (for a share outstanding throughout the year) | |||
| Net asset value, beginning of year | $ | 24.99 | |
| Income from investment operationsb: | |||
| Net investment income (loss)c | (0.07 | ) | |
| Net realized and unrealized gains (losses) | 5.79 | ||
| Total from investment operations | 5.72 | ||
| Less distributions from net realized gains | (0.73 | ) | |
| Net asset value, end of year | $ | 29.98 | |
| Total return | 22.90 | % | |
| Ratios to average net assets | |||
| Expensesd | 0.71 | % | |
| Net investment income (loss) | (0.24 | )% | |
| Supplemental data | |||
| Net assets, end of year (000’s) | $ | 180,843 | |
| Portfolio turnover rate | 36.64 | % | |
aFor the year May 1, 2013 (effective date) to April 30, 2014.
bThe amount shown for a share outstanding throughout the period may not correlate with the Statement of Operations for the period due to the timing of sales and repurchases of
the Fund shares in relation to income earned and/or fluctuating fair value of the investments of the Fund.
cBased on average daily shares outstanding.
dBenefit of waiver and payments by affiliates and expense reduction rounds to less than 0.01%.
82 | The accompanying notes are an integral part of these financial statements. | Annual Report
| Franklin Strategic Series | |||||||||||||||
| Financial Highlights (continued) | |||||||||||||||
| Franklin Growth Opportunities Fund | |||||||||||||||
| Year Ended April 30, | |||||||||||||||
| Advisor Class | 2014 | 2013 | 2012 | 2011 | 2010 | ||||||||||
| Per share operating performance | |||||||||||||||
| (for a share outstanding throughout the year) | |||||||||||||||
| Net asset value, beginning of year | $ | 25.43 | $ | 23.99 | $ | 25.16 | $ | 20.24 | $ | 14.30 | |||||
| Income from investment operationsa: | |||||||||||||||
| Net investment income (loss)b | (0.13 | ) | (0.06 | ) | (0.10 | ) | (0.09 | ) | (0.09 | ) | |||||
| Net realized and unrealized gains (losses) | 5.36 | 2.06 | 0.43 | 5.01 | 6.03 | ||||||||||
| Total from investment operations | 5.23 | 2.00 | 0.33 | 4.92 | 5.94 | ||||||||||
| Less distributions from net realized gains | (0.73 | ) | (0.56 | ) | (1.50 | ) | — | — | |||||||
| Net asset value, end of year | $ | 29.93 | $ | 25.43 | $ | 23.99 | $ | 25.16 | $ | 20.24 | |||||
| Total return | 20.58 | % | 8.62 | % | 2.20 | % | 24.31 | % | 41.54 | % | |||||
| Ratios to average net assets | |||||||||||||||
| Expenses before waiver and payments by affiliates | 0.87 | % | 0.97 | % | 0.99 | % | 0.98 | % | 1.02 | % | |||||
| Expenses net of waiver and payments by affiliates | 0.87 | %c,d | 0.97 | % | 0.99 | % | 0.98 | % | 0.95 | %d | |||||
| Net investment income (loss) | (0.40 | )% | (0.28 | )% | (0.42 | )% | (0.43 | )% | (0.52 | )% | |||||
| Supplemental data | |||||||||||||||
| Net assets, end of year (000’s) | $ | 224,469 | $ | 182,954 | $ | 154,708 | $ | 172,528 | $ | 245,727 | |||||
| Portfolio turnover rate | 36.64 | % | 58.76 | % | 63.57 | % | 69.74 | % | 67.27 | % | |||||
aThe amount shown for a share outstanding throughout the period may not correlate with the Statement of Operations for the period due to the timing of sales and repurchases of
the Fund shares in relation to income earned and/or fluctuating fair value of the investments of the Fund.
bBased on average daily shares outstanding.
cBenefit of waiver and payments by affiliates rounds to less than 0.01%.
dBenefit of expense reduction rounds to less than 0.01%.
Annual Report | The accompanying notes are an integral part of these financial statements. | 83
| Franklin Strategic Series | |||
| Statement of Investments, April 30, 2014 | |||
| Franklin Growth Opportunities Fund | Shares | Value | |
| Common Stocks 99.4% | |||
| Consumer Discretionary 24.1% | |||
| aAmazon.com Inc. | 75,692 | $ | 23,020,208 |
| aAMC Networks Inc., A | 80,300 | 5,273,301 | |
| aBuffalo Wild Wings Inc. | 45,700 | 6,677,684 | |
| CBS Corp., B | 108,430 | 6,262,917 | |
| aChipotle Mexican Grill Inc. | 18,003 | 8,974,495 | |
| aDISH Network Corp., A | 121,665 | 6,917,872 | |
| aDollar General Corp. | 105,344 | 5,945,615 | |
| Harman International Industries Inc. | 96,541 | 10,581,859 | |
| aKate Spade & Co. | 185,524 | 6,450,669 | |
| Las Vegas Sands Corp. | 253,376 | 20,049,643 | |
| aLiberty Media Corp., A | 73,197 | 9,494,383 | |
| Lowe’s Cos. Inc. | 118,302 | 5,431,245 | |
| aMichael Kors Holdings Ltd. | 102,179 | 9,318,725 | |
| aNetflix Inc. | 20,574 | 6,625,651 | |
| NIKE Inc., B | 162,418 | 11,848,393 | |
| aThe Priceline Group Inc. | 16,197 | 18,752,077 | |
| Starbucks Corp. | 157,377 | 11,113,964 | |
| a,bTile Shop Holdings Inc. | 273,449 | 3,854,264 | |
| Twenty-First Century Fox Inc., B | 211,225 | 6,615,567 | |
| aUnder Armour Inc., A | 188,400 | 9,210,876 | |
| The Walt Disney Co. | 144,713 | 11,481,529 | |
| Wynn Resorts Ltd. | 43,475 | 8,864,118 | |
| 212,765,055 | |||
| Consumer Staples 2.4% | |||
| aBoston Beer Inc., A | 19,783 | 4,867,409 | |
| Mead Johnson Nutrition Co., A | 85,166 | 7,516,751 | |
| aMonster Beverage Corp. | 132,051 | 8,842,135 | |
| 21,226,295 | |||
| Energy 5.4% | |||
| Anadarko Petroleum Corp. | 93,075 | 9,216,287 | |
| aCameron International Corp. | 96,640 | 6,277,734 | |
| aDiamondback Energy Inc. | 115,928 | 8,339,860 | |
| Halliburton Co. | 111,972 | 7,062,074 | |
| aKey Energy Services Inc. | 483,300 | 4,852,332 | |
| aRice Energy Inc. | 101,244 | 3,006,947 | |
| Schlumberger Ltd. | 87,718 | 8,907,763 | |
| 47,662,997 | |||
| Financials 7.6% | |||
| aAffiliated Managers Group Inc. | 57,025 | 11,302,355 | |
| Aon PLC | 85,893 | 7,290,598 | |
| Bank of America Corp. | 511,687 | 7,746,941 | |
| BlackRock Inc. | 37,469 | 11,278,169 | |
| aCBRE Group Inc. | 155,800 | 4,150,512 | |
| IntercontinentalExchange Group Inc. | 44,832 | 9,165,454 | |
84 | Annual Report
| Franklin Strategic Series | |||
| Statement of Investments, April 30, 2014 (continued) | |||
| Franklin Growth Opportunities Fund | Shares | Value | |
| Common Stocks (continued) | |||
| Financials (continued) | |||
| JPMorgan Chase & Co. | 123,200 | $ | 6,896,736 |
| aSignature Bank/New York NY | 79,824 | 9,484,688 | |
| 67,315,453 | |||
| Health Care 18.4% | |||
| aActavis PLC | 121,897 | 24,907,214 | |
| Allergan Inc. | 55,195 | 9,153,539 | |
| aAlnylam Pharmaceuticals Inc. | 85,166 | 4,218,272 | |
| aBiogen Idec Inc. | 41,445 | 11,899,688 | |
| aCelgene Corp. | 31,106 | 4,572,893 | |
| aCelldex Therapeutics Inc. | 291,799 | 4,376,985 | |
| The Cooper Cos. Inc. | 48,765 | 6,432,591 | |
| aGilead Sciences Inc. | 486,576 | 38,191,350 | |
| aHMS Holdings Corp. | 220,860 | 3,571,306 | |
| aIllumina Inc. | 48,666 | 6,611,276 | |
| aJazz Pharmaceuticals PLC | 88,529 | 11,942,562 | |
| a,bKaryopharm Therapeutics Inc. | 65,824 | 1,766,058 | |
| aMedivation Inc. | 71,027 | 4,276,536 | |
| Perrigo Co. PLC | 69,504 | 10,068,350 | |
| aRegeneron Pharmaceuticals Inc. | 22,054 | 6,547,612 | |
| aSagent Pharmaceuticals Inc. | 207,795 | 4,299,279 | |
| aValeant Pharmaceuticals International Inc. (Canada) | 74,978 | 10,025,308 | |
| 162,860,819 | |||
| Industrials 13.3% | |||
| Allegiant Travel Co. | 47,945 | 5,631,140 | |
| aAmerican Airlines Group Inc. | 155,513 | 5,453,841 | |
| aColfax Corp. | 128,340 | 9,237,913 | |
| Cummins Inc. | 33,236 | 5,013,651 | |
| aDigitalGlobe Inc. | 216,700 | 6,453,326 | |
| Flowserve Corp. | 177,943 | 12,998,736 | |
| aHexcel Corp. | 132,051 | 5,505,206 | |
| aIHS Inc., A | 50,447 | 6,085,422 | |
| Kansas City Southern | 89,061 | 8,984,474 | |
| Precision Castparts Corp. | 80,645 | 20,410,443 | |
| Rockwell Automation Inc. | 81,705 | 9,737,602 | |
| Towers Watson & Co. | 54,857 | 6,156,053 | |
| aUnited Rentals Inc. | 104,058 | 9,763,762 | |
| aVerisk Analytics Inc., A | 99,083 | 5,953,897 | |
| 117,385,466 | |||
| Information Technology 23.5% | |||
| aAdobe Systems Inc. | 160,539 | 9,903,651 | |
| Apple Inc. | 13,156 | 7,763,224 | |
| ARM Holdings PLC (United Kingdom) | 508,900 | 7,656,497 | |
| aBroadSoft Inc. | 88,300 | 2,241,054 | |
| aFacebook Inc., A | 285,428 | 17,062,886 | |
Annual Report | 85
Franklin Strategic Series
Statement of Investments, April 30, 2014 (continued)
| Franklin Growth Opportunities Fund | Shares | Value | ||
| Common Stock (continued) | ||||
| Information Technology (continued) | ||||
| aGoogle Inc., A | 31,445 | $ | 16,819,302 | |
| aGoogle Inc., C | 31,445 | 16,560,824 | ||
| aLinkedIn Corp., A | 43,424 | 6,664,281 | ||
| MasterCard Inc., A | 336,607 | 24,757,445 | ||
| aNetSuite Inc. | 62,217 | 4,809,996 | ||
| aNXP Semiconductors NV (Netherlands) | 107,916 | 6,433,952 | ||
| QUALCOMM Inc. | 125,712 | 9,894,792 | ||
| aSalesforce.com Inc. | 212,297 | 10,965,140 | ||
| aServiceNow Inc. | 141,053 | 7,013,155 | ||
| a,bStratasys Ltd. | 47,479 | 4,599,291 | ||
| aTrimble Navigation Ltd. | 302,957 | 11,642,637 | ||
| a,bTwitter Inc. | 42,500 | 1,656,225 | ||
| a,bUbiquiti Networks Inc. | 130,294 | 5,046,287 | ||
| aViaSat Inc. | 80,121 | 5,144,569 | ||
| Visa Inc., A | 81,829 | 16,579,374 | ||
| aWorkday Inc. | 47,677 | 3,483,758 | ||
| aYahoo! Inc. | 295,063 | 10,607,515 | ||
| 207,305,855 | ||||
| Materials 2.1% | ||||
| Airgas Inc. | 59,942 | 6,369,437 | ||
| LyondellBasell Industries NV, A | 78,934 | 7,301,395 | ||
| Martin Marietta Materials Inc. | 35,477 | 4,410,855 | ||
| 18,081,687 | ||||
| Telecommunication Services 2.6% | ||||
| aSBA Communications Corp. | 259,019 | 23,249,545 | ||
| Total Common Stocks (Cost $663,090,612) | 877,853,172 | |||
| Short Term Investments 2.5% | ||||
| Money Market Funds (Cost $10,764,599) 1.2% | ||||
| a,cInstitutional Fiduciary Trust Money Market Portfolio | 10,764,599 | 10,764,599 | ||
| dInvestments from Cash Collateral Received for Loaned Securities (Cost $12,024,475) 1.3% | ||||
| Money Market Funds 1.3% | ||||
| eBNY Mellon Overnight Government Fund, 0.05% | 12,024,475 | 12,024,475 | ||
| Total Investments (Cost $685,879,686) 101.9% | 900,642,246 | |||
| Other Assets, less Liabilities (1.9)% | (17,151,001 | ) | ||
| Net Assets 100.0% | $ | 883,491,245 |
aNon-income producing.
bA portion or all of the security is on loan at April 30, 2014. See Note 1(c).
cSee Note 3(f) regarding investments in the Institutional Fiduciary Trust Money Market Portfolio.
dSee Note 1(c) regarding securities on loan.
eThe rate shown is the annualized seven-day yield at period end.
86 | The accompanying notes are an integral part of these financial statements. | Annual Report
| Franklin Strategic Series | |||||||||||||||
| Financial Highlights | |||||||||||||||
| Franklin Small Cap Growth Fund | |||||||||||||||
| Year Ended April 30, | |||||||||||||||
| Class A | 2014 | 2013 | 2012 | 2011 | 2010 | ||||||||||
| Per share operating performance | |||||||||||||||
| (for a share outstanding throughout the year) | |||||||||||||||
| Net asset value, beginning of year | $ | 14.26 | $ | 12.84 | $ | 13.02 | $ | 10.02 | $ | 6.41 | |||||
| Income from investment operationsa: | |||||||||||||||
| Net investment income (loss)b | (0.15 | ) | (0.09 | ) | (0.07 | ) | (0.10 | ) | (0.09 | ) | |||||
| Net realized and unrealized gains (losses) | 4.75 | 1.87 | (0.11 | ) | 3.10 | 3.70 | |||||||||
| Total from investment operations | 4.60 | 1.78 | (0.18 | ) | 3.00 | 3.61 | |||||||||
| Less distributions from net realized gains | (0.66 | ) | (0.36 | ) | — | — | — | ||||||||
| Net asset value, end of year | $ | 18.20 | $ | 14.26 | $ | 12.84 | $ | 13.02 | $ | 10.02 | |||||
| Total returnc | 32.40 | % | 14.35 | % | (1.38 | )% | 29.94 | % | 56.32 | % | |||||
| Ratios to average net assets | |||||||||||||||
| Expenses before waiver and payments by affiliates | 1.20 | % | 1.33 | % | 1.37 | % | 1.37 | % | 1.37 | % | |||||
| Expenses net of waiver and payments by affiliates | 1.20 | %d | 1.33 | % | 1.37 | % | 1.37 | % | 1.35 | % | |||||
| Net investment income (loss) | (0.85 | )% | (0.68 | )% | (0.60 | )% | (0.94 | )% | (1.06 | )% | |||||
| Supplemental data | |||||||||||||||
| Net assets, end of year (000’s) | $ | 851,317 | $ | 327,882 | $ | 244,570 | $ | 270,271 | $ | 197,461 | |||||
| Portfolio turnover rate | 40.35 | % | 41.02 | % | 50.08 | % | 63.07 | % | 61.32 | % | |||||
aThe amount shown for a share outstanding throughout the period may not correlate with the Statement of Operations for the period due to the timing of sales and repurchases of
the Fund shares in relation to income earned and/or fluctuating fair value of the investments of the Fund.
bBased on average daily shares outstanding.
cTotal return does not reflect sales commissions or contingent deferred sales charges, if applicable.
dBenefit of waiver and payments by affiliates and expense reduction rounds to less than 0.01%.
Annual Report | The accompanying notes are an integral part of these financial statements. | 87
| Franklin Strategic Series | |||||||||||||||
| Financial Highlights (continued) | |||||||||||||||
| Franklin Small Cap Growth Fund | |||||||||||||||
| Year Ended April 30, | |||||||||||||||
| Class C | 2014 | 2013 | 2012 | 2011 | 2010 | ||||||||||
| Per share operating performance | |||||||||||||||
| (for a share outstanding throughout the year) | |||||||||||||||
| Net asset value, beginning of year | $ | 12.70 | $ | 11.57 | $ | 11.80 | $ | 9.15 | $ | 5.89 | |||||
| Income from investment operationsa: | |||||||||||||||
| Net investment income (loss)b | (0.24 | ) | (0.16 | ) | (0.14 | ) | (0.16 | ) | (0.13 | ) | |||||
| Net realized and unrealized gains (losses) | 4.23 | 1.65 | (0.09 | ) | 2.81 | 3.39 | |||||||||
| Total from investment operations | 3.99 | 1.49 | (0.23 | ) | 2.65 | 3.26 | |||||||||
| Less distributions from net realized gains | (0.66 | ) | (0.36 | ) | — | — | — | ||||||||
| Net asset value, end of year | $ | 16.03 | $ | 12.70 | $ | 11.57 | $ | 11.80 | $ | 9.15 | |||||
| Total returnc | 31.57 | % | 13.41 | % | (1.95 | )% | 28.96 | % | 55.35 | % | |||||
| Ratios to average net assets | |||||||||||||||
| Expenses before waiver and payments by affiliates | 1.90 | % | 2.03 | % | 2.07 | % | 2.07 | % | 2.10 | % | |||||
| Expenses net of waiver and payments by affiliates | 1.90 | %d | 2.03 | % | 2.07 | % | 2.07 | % | 2.08 | % | |||||
| Net investment income (loss) | (1.55 | )% | (1.38 | )% | (1.30 | )% | (1.64 | )% | (1.79 | )% | |||||
| Supplemental data | |||||||||||||||
| Net assets, end of year (000’s) | $ | 187,271 | $ | 77,644 | $ | 67,212 | $ | 72,394 | $ | 57,298 | |||||
| Portfolio turnover rate | 40.35 | % | 41.02 | % | 50.08 | % | 63.07 | % | 61.32 | % | |||||
aThe amount shown for a share outstanding throughout the period may not correlate with the Statement of Operations for the period due to the timing of sales and repurchases of
the Fund shares in relation to income earned and/or fluctuating fair value of the investments of the Fund.
bBased on average daily shares outstanding.
cTotal return does not reflect sales commissions or contingent deferred sales charges, if applicable.
dBenefit of waiver and payments by affiliates and expense reduction rounds to less than 0.01%.
88 | The accompanying notes are an integral part of these financial statements. | Annual Report
| Franklin Strategic Series | |||||||||||||||
| Financial Highlights (continued) | |||||||||||||||
| Franklin Small Cap Growth Fund | |||||||||||||||
| Year Ended April 30, | |||||||||||||||
| Class R | 2014 | 2013 | 2012 | 2011 | 2010 | ||||||||||
| Per share operating performance | |||||||||||||||
| (for a share outstanding throughout the year) | |||||||||||||||
| Net asset value, beginning of year | $ | 13.81 | $ | 12.48 | $ | 12.67 | $ | 9.77 | $ | 6.26 | |||||
| Income from investment operationsa: | |||||||||||||||
| Net investment income (loss)b | (0.18 | ) | (0.11 | ) | (0.09 | ) | (0.12 | ) | (0.10 | ) | |||||
| Net realized and unrealized gains (losses) | 4.60 | 1.80 | (0.10 | ) | 3.02 | 3.61 | |||||||||
| Total from investment operations | 4.42 | 1.69 | (0.19 | ) | 2.90 | 3.51 | |||||||||
| Less distributions from net realized gains | (0.66 | ) | (0.36 | ) | — | — | — | ||||||||
| Net asset value, end of year | $ | 17.57 | $ | 13.81 | $ | 12.48 | $ | 12.67 | $ | 9.77 | |||||
| Total return | 32.15 | % | 14.04 | % | (1.50 | )% | 29.68 | % | 56.07 | % | |||||
| Ratios to average net assets | |||||||||||||||
| Expenses before waiver and payments by affiliates | 1.40 | % | 1.53 | % | 1.57 | % | 1.57 | % | 1.60 | % | |||||
| Expenses net of waiver and payments by affiliates | 1.40 | %c | 1.53 | % | 1.57 | % | 1.57 | % | 1.58 | % | |||||
| Net investment income (loss) | (1.05 | )% | (0.88 | )% | (0.80 | )% | (1.14 | )% | (1.29 | )% | |||||
| Supplemental data | |||||||||||||||
| Net assets, end of year (000’s) | $ | 51,190 | $ | 15,783 | $ | 8,489 | $ | 8,993 | $ | 4,290 | |||||
| Portfolio turnover rate | 40.35 | % | 41.02 | % | 50.08 | % | 63.07 | % | 61.32 | % | |||||
aThe amount shown for a share outstanding throughout the period may not correlate with the Statement of Operations for the period due to the timing of sales and repurchases of
the Fund shares in relation to income earned and/or fluctuating fair value of the investments of the Fund.
bBased on average daily shares outstanding.
cBenefit of waiver and payments by affiliates and expense reduction rounds to less than 0.01%.
Annual Report | The accompanying notes are an integral part of these financial statements. | 89
| Franklin Strategic Series | |||
| Financial Highlights (continued) | |||
| Franklin Small Cap Growth Fund | |||
| Year Ended | |||
| April 30, | |||
| Class R6 | 2014 | a | |
| Per share operating performance | |||
| (for a share outstanding throughout the year) | |||
| Net asset value, beginning of year | $ | 14.64 | |
| Income from investment operationsb: | |||
| Net investment income (loss)c | (0.06 | ) | |
| Net realized and unrealized gains (losses) | 5.29 | ||
| Total from investment operations | 5.23 | ||
| Less distributions from net realized gains | (0.66 | ) | |
| Net asset value, end of year | $ | 19.21 | |
| Total return | 35.80 | % | |
| Ratios to average net assets | |||
| Expensesd | 0.72 | % | |
| Net investment income (loss) | (0.37 | )% | |
| Supplemental data | |||
| Net assets, end of year (000’s) | $ | 87,777 | |
| Portfolio turnover rate | 40.35 | % | |
aFor the year May 1, 2013 (effective date) to April 30, 2014.
bThe amount shown for a share outstanding throughout the period may not correlate with the Statement of Operations for the period due to the timing of sales and repurchases of
the Fund shares in relation to income earned and/or fluctuating fair value of the investments of the Fund.
cBased on average daily shares outstanding.
dBenefit of waiver and payments by affiliates and expense reduction rounds to less than 0.01%.
90 | The accompanying notes are an integral part of these financial statements. | Annual Report
| Franklin Strategic Series | |||||||||||||||
| Financial Highlights (continued) | |||||||||||||||
| Franklin Small Cap Growth Fund | |||||||||||||||
| Year Ended April 30, | |||||||||||||||
| Advisor Class | 2014 | 2013 | 2012 | 2011 | 2010 | ||||||||||
| Per share operating performance | |||||||||||||||
| (for a share outstanding throughout the year) | |||||||||||||||
| Net asset value, beginning of year | $ | 14.94 | $ | 13.41 | $ | 13.55 | $ | 10.39 | $ | 6.63 | |||||
| Income from investment operationsa: | |||||||||||||||
| Net investment income (loss)b | (0.11 | ) | (0.05 | ) | (0.04 | ) | (0.07 | ) | (0.07 | ) | |||||
| Net realized and unrealized gains (losses) | 5.00 | 1.94 | (0.10 | ) | 3.23 | 3.83 | |||||||||
| Total from investment operations | 4.89 | 1.89 | (0.14 | ) | 3.16 | 3.76 | |||||||||
| Less distributions from net realized gains | (0.66 | ) | (0.36 | ) | — | — | — | ||||||||
| Net asset value, end of year | $ | 19.17 | $ | 14.94 | $ | 13.41 | $ | 13.55 | $ | 10.39 | |||||
| Total return | 32.87 | % | 14.56 | % | (1.03 | )% | 30.41 | % | 56.71 | % | |||||
| Ratios to average net assets | |||||||||||||||
| Expenses before waiver and payments by affiliates | 0.90 | % | 1.03 | % | 1.07 | % | 1.07 | % | 1.10 | % | |||||
| Expenses net of waiver and payments by affiliates | 0.90 | %c | 1.03 | % | 1.07 | % | 1.07 | % | 1.08 | % | |||||
| Net investment income (loss) | (0.55 | )% | (0.38 | )% | (0.30 | )% | (0.64 | )% | (0.79 | )% | |||||
| Supplemental data | |||||||||||||||
| Net assets, end of year (000’s) | $ | 427,406 | $ | 91,687 | $ | 49,159 | $ | 49,489 | $ | 114,212 | |||||
| Portfolio turnover rate | 40.35 | % | 41.02 | % | 50.08 | % | 63.07 | % | 61.32 | % | |||||
aThe amount shown for a share outstanding throughout the period may not correlate with the Statement of Operations for the period due to the timing of sales and repurchases of
the Fund shares in relation to income earned and/or fluctuating fair value of the investments of the Fund.
bBased on average daily shares outstanding.
cBenefit of waiver and payments by affiliates and expense reduction rounds to less than 0.01%.
Annual Report | The accompanying notes are an integral part of these financial statements. | 91
Franklin Strategic Series
Statement of Investments, April 30, 2014
| Franklin Small Cap Growth Fund | Shares | Value | |
| Common Stocks 94.8% | |||
| Consumer Discretionary 19.4% | |||
| a2U Inc. | 296,000 | $ | 4,416,320 |
| aAmerican Axle & Manufacturing Holdings Inc. | 967,600 | 17,078,140 | |
| aAmerican Public Education Inc. | 351,800 | 12,172,280 | |
| aBuffalo Wild Wings Inc. | 80,700 | 11,791,884 | |
| aCiti Trends Inc. | 559,000 | 9,497,410 | |
| aGrand Canyon Education Inc. | 407,400 | 17,567,088 | |
| aHomeAway Inc. | 439,500 | 14,336,490 | |
| aIconix Brand Group Inc. | 138,700 | 5,894,750 | |
| aImax Corp. (Canada) | 793,300 | 20,340,212 | |
| Lithia Motors Inc. | 351,495 | 26,109,049 | |
| aM/I Homes Inc. | 703,300 | 15,662,491 | |
| a,bMattress Firm Holding Corp. | 208,600 | 9,426,634 | |
| a,bNoodles & Co. | 436,100 | 14,299,719 | |
| aNord Anglia Education Inc. (Hong Kong) | 560,600 | 11,127,910 | |
| a,bPotbelly Corp. | 816,500 | 13,880,500 | |
| aShutterfly Inc. | 601,600 | 24,623,488 | |
| aSportsman’s Warehouse Holdings Inc. | 808,400 | 8,512,452 | |
| aTenneco Inc. | 389,200 | 23,301,404 | |
| aTile Shop Holdings Inc. | 1,586,800 | 22,365,946 | |
| aVitamin Shoppe Inc. | 214,600 | 10,275,048 | |
| Wolverine World Wide Inc. | 649,300 | 18,245,330 | |
| 310,924,545 | |||
| Consumer Staples 3.0% | |||
| aBoston Beer Inc., A | 29,800 | 7,331,992 | |
| aSonOpta Inc. (Canada) | 1,882,600 | 21,969,942 | |
| aTreeHouse Foods Inc. | 260,200 | 19,473,368 | |
| 48,775,302 | |||
| Energy 6.7% | |||
| aC&J Energy Services Inc. | 484,300 | 14,558,058 | |
| aKey Energy Services Inc. | 1,472,700 | 14,785,908 | |
| aMatador Resources Co. | 287,600 | 8,259,872 | |
| aPioneer Energy Services Corp. | 1,072,400 | 16,053,828 | |
| aRex Energy Corp. | 855,700 | 18,021,042 | |
| aSanchez Energy Corp. | 672,600 | 19,021,128 | |
| aSynergy Resources Corp. | 1,493,900 | 17,388,996 | |
| 108,088,832 | |||
| Financials 6.8% | |||
| BBCN Bancorp Inc. | 697,500 | 10,748,475 | |
| aEssent Group Ltd. | 133,268 | 2,512,102 | |
| Evercore Partners Inc. | 236,500 | 12,636,195 | |
| Independent Bank Group Inc. | 209,767 | 10,322,634 | |
| Manning & Napier Inc. | 446,300 | 7,417,506 | |
| aSquare 1 Financial Inc., A | 244,800 | 4,614,480 | |
| aTalmer Bancorp Inc., A | 1,004,500 | 13,470,345 | |
| aTexas Capital Bancshares Inc. | 94,219 | 5,294,165 |
92 | Annual Report
| Franklin Strategic Series | |||
| Statement of Investments, April 30, 2014 (continued) | |||
| Franklin Small Cap Growth Fund | Shares | Value | |
| Common Stocks (continued) | |||
| Financials (continued) | |||
| aVirtus Investment Partners Inc. | 120,200 | $ | 22,235,798 |
| aWestern Alliance Bancorp | 851,600 | 19,646,412 | |
| 108,898,112 | |||
| Health Care 14.9% | |||
| aAratana Therapeutics Inc. | 1,003,436 | 13,827,348 | |
| aCelldex Therapeutics Inc. | 914,600 | 13,719,000 | |
| a,bCorium International Inc. | 402,350 | 3,037,743 | |
| aDexCom Inc. | 535,200 | 17,361,888 | |
| a,bEXACT Sciences Corp. | 726,813 | 8,721,756 | |
| aFluidigm Corp. | 293,800 | 11,035,128 | |
| aGreatbatch Inc. | 395,000 | 18,181,850 | |
| aHealthStream Inc. | 44,800 | 1,014,720 | |
| aHeartWare International Inc. | 151,300 | 12,854,448 | |
| aHeron Therapeutics Inc. | 233,870 | 2,818,134 | |
| aHMS Holdings Corp. | 877,200 | 14,184,324 | |
| aImpax Laboratories Inc. | 363,700 | 9,510,755 | |
| a,bKaryopharm Therapeutics Inc. | 251,168 | 6,738,837 | |
| aMWI Veterinary Supply Inc. | 81,800 | 12,813,152 | |
| aNeogen Corp. | 280,700 | 11,726,242 | |
| aPAREXEL International Corp. | 495,200 | 22,457,320 | |
| aPhibro Animal Health Corp. | 322,300 | 5,691,818 | |
| aSagent Pharmaceuticals Inc. | 877,600 | 18,157,544 | |
| aThe Spectranetics Corp. | 585,600 | 12,449,856 | |
| aTandem Diabetes Care Inc. | 477,700 | 8,393,189 | |
| aThoratec Corp. | 237,600 | 7,788,528 | |
| aVolcano Corp. | 412,100 | 7,236,476 | |
| 239,720,056 | |||
| Industrials 16.7% | |||
| aThe Advisory Board Co. | 329,000 | 18,838,540 | |
| Allegiant Travel Co. | 142,000 | 16,677,900 | |
| Altra Industrial Motion Corp. | 635,800 | 21,718,928 | |
| aAstronics Corp. | 301,000 | 17,193,120 | |
| aDigitalGlobe Inc. | 673,600 | 20,059,808 | |
| aEcho Global Logistics Inc. | 409,900 | 8,017,644 | |
| Exponent Inc. | 133,208 | 9,380,507 | |
| aHexcel Corp. | 80,800 | 3,368,552 | |
| aHub Group Inc., A | 400,600 | 17,886,790 | |
| aHuron Consulting Group Inc. | 151,100 | 10,758,320 | |
| Interface Inc. | 1,086,400 | 19,544,336 | |
| aThe Keyw Holding Corp. | 963,013 | 12,374,717 | |
| The Manitowoc Co. Inc. | 750,700 | 23,857,246 | |
| Mobile Mini Inc. | 540,200 | 23,866,036 | |
| aPaylocity Holding Corp. | 93,892 | 1,775,498 | |
| aProto Labs Inc. | 200,800 | 12,156,432 | |
| aSpirit Airlines Inc. | 191,800 | 10,901,912 | |
| US Ecology Inc. | 433,490 | 19,355,329 | |
| 267,731,615 | |||
| Annual Report | 93 | |||
Franklin Strategic Series
Statement of Investments, April 30, 2014 (continued)
| Franklin Small Cap Growth Fund | Shares | Value | |
| Common Stocks (continued) | |||
| Information Technology 25.1% | |||
| aA10 Networks Inc. | 240,900 | $ | 3,153,381 |
| aBazaarvoice Inc. | 2,774,300 | 18,643,296 | |
| a,bBenefitfocus Inc. | 85,930 | 2,784,132 | |
| a,bBorderfree Inc. | 323,000 | 4,841,770 | |
| aBottomline Technologies Inc. | 654,404 | 20,705,343 | |
| aBroadSoft Inc. | 813,700 | 20,651,706 | |
| aCallidus Software Inc. | 849,800 | 8,111,341 | |
| aCavium Inc. | 404,300 | 17,130,191 | |
| aCIBER Inc. | 1,363,400 | 5,889,888 | |
| aCognex Corp. | 605,500 | 20,847,365 | |
| aCoherent Inc. | 269,200 | 16,073,932 | |
| aCvent Inc. | 120,528 | 3,318,136 | |
| aDemandware Inc. | 431,100 | 21,395,493 | |
| EVERTEC Inc. (Puerto Rico) | 247,800 | 5,833,212 | |
| aFARO Technologies Inc. | 378,500 | 15,102,150 | |
| aGlobal Eagle Entertainment Inc. | 659,656 | 7,276,006 | |
| aGuidewire Software Inc. | 223,900 | 8,454,464 | |
| Intersil Corp., A | 1,676,800 | 20,691,712 | |
| aIxia | 1,842,100 | 22,878,882 | |
| aLattice Semiconductor Corp. | 3,554,700 | 29,930,574 | |
| Methode Electronics Inc. | 541,500 | 15,021,210 | |
| aNanometrics Inc. | 955,471 | 15,535,958 | |
| National Instruments Corp. | 415,300 | 11,341,843 | |
| Power Integrations Inc. | 48,200 | 2,276,486 | |
| aQ2 Holdings Inc. | 340,000 | 4,175,200 | |
| aThe Rubicon Project Inc. | 118,524 | 1,703,190 | |
| aSapient Corp. | 1,129,520 | 18,377,290 | |
| aSemtech Corp. | 844,300 | 20,246,314 | |
| aShoretel Inc. | 867,000 | 6,545,850 | |
| aSilicon Laboratories Inc. | 368,700 | 16,573,065 | |
| aViaSat Inc. | 257,700 | 16,546,917 | |
| 402,056,297 | |||
| Materials 2.2% | |||
| H.B. Fuller Co. | 447,732 | 20,743,423 | |
| Quaker Chemical Corp. | 190,800 | 14,201,244 | |
| 34,944,667 | |||
| Total Common Stocks (Cost $1,314,770,226) | 1,521,139,426 |
94 | Annual Report
Franklin Strategic Series
Statement of Investments, April 30, 2014 (continued)
| Franklin Small Cap Growth Fund | Shares | Value | ||
| Short Term Investments 8.2% | ||||
| Money Market Funds (Cost $91,895,995) 5.7% | ||||
| a,cInstitutional Fiduciary Trust Money Market Portfolio | 91,895,995 | $ | 91,895,995 | |
| dInvestments from Cash Collateral Received for Loaned Securities | ||||
| (Cost $40,714,400) 2.5% | ||||
| Money Market Funds 2.5% | ||||
| eBNY Mellon Overnight Government Fund, 0.05% | 40,714,400 | 40,714,400 | ||
| Total Investments (Cost $1,447,380,621) 103.0% | 1,653,749,821 | |||
| Other Assets, less Liabilities (3.0)% | (48,789,514 | ) | ||
| Net Assets 100.0% | $ | 1,604,960,307 |
aNon-income producing.
bA portion or all of the security is on loan at April 30, 2014. See Note 1(c).
cSee Note 3(f) regarding investments in the Institutional Fiduciary Trust Money Market Portfolio.
dSee Note 1(c) regarding securities on loan.
eThe rate shown is the annualized seven-day yield at period end.
Annual Report | The accompanying notes are an integral part of these financial statements. | 95
| Franklin Strategic Series | |||||||||||||||
| Financial Highlights | |||||||||||||||
| Franklin Small-Mid Cap Growth Fund | |||||||||||||||
| Year Ended April 30, | |||||||||||||||
| Class A | 2014 | 2013 | 2012 | 2011 | 2010 | ||||||||||
| Per share operating performance | |||||||||||||||
| (for a share outstanding throughout the year) | |||||||||||||||
| Net asset value, beginning of year | $ | 38.01 | $ | 38.51 | $ | 41.47 | $ | 32.29 | $ | 22.34 | |||||
| Income from investment operationsa: | |||||||||||||||
| Net investment income (loss)b | (0.20 | ) | (0.10 | ) | (0.14 | ) | (0.11 | ) | (0.13 | ) | |||||
| Net realized and unrealized gains (losses) | 8.39 | 3.08 | (1.18 | ) | 9.29 | 10.08 | |||||||||
| Total from investment operations | 8.19 | 2.98 | (1.32 | ) | 9.18 | 9.95 | |||||||||
| Less distributions from net realized gains | (5.78 | ) | (3.48 | ) | (1.64 | ) | — | — | |||||||
| Net asset value, end of year | $ | 40.42 | $ | 38.01 | $ | 38.51 | $ | 41.47 | $ | 32.29 | |||||
| Total returnc | 21.99 | % | 8.95 | % | (2.54 | )% | 28.43 | % | 44.54 | % | |||||
| Ratios to average net assets | |||||||||||||||
| Expenses | 0.96 | %d,e | 0.98 | % | 0.99 | % | 0.99 | % | 1.04 | %e | |||||
| Net investment income (loss) | (0.48 | )% | (0.27 | )% | (0.38 | )% | (0.31 | )% | (0.48 | )% | |||||
| Supplemental data | |||||||||||||||
| Net assets, end of year (000’s) | $ | 2,371,448 | $ | 2,355,507 | $ | 2,492,205 | $ | 2,939,925 | $ | 2,585,515 | |||||
| Portfolio turnover rate | 40.82 | % | 43.72 | % | 47.37 | % | 44.42 | % | 55.44 | % | |||||
aThe amount shown for a share outstanding throughout the period may not correlate with the Statement of Operations for the period due to the timing of sales and repurchases of
the Fund shares in relation to income earned and/or fluctuating fair value of the investments of the Fund.
bBased on average daily shares outstanding.
cTotal return does not reflect sales commissions or contingent deferred sales charges, if applicable.
dBenefit of waiver and payments by affiliates rounds to less than 0.01%.
eBenefit of expense reduction rounds to less than 0.01%.
96 | The accompanying notes are an integral part of these financial statements. | Annual Report
| Franklin Strategic Series | |||||||||||||||
| Financial Highlights (continued) | |||||||||||||||
| Franklin Small-Mid Cap Growth Fund | |||||||||||||||
| Year Ended April 30, | |||||||||||||||
| Class C | 2014 | 2013 | 2012 | 2011 | 2010 | ||||||||||
| Per share operating performance | |||||||||||||||
| (for a share outstanding throughout the year) | |||||||||||||||
| Net asset value, beginning of year | $ | 32.80 | $ | 33.97 | $ | 37.10 | $ | 29.10 | $ | 20.29 | |||||
| Income from investment operationsa: | |||||||||||||||
| Net investment income (loss)b | (0.43 | ) | (0.32 | ) | (0.37 | ) | (0.33 | ) | (0.30 | ) | |||||
| Net realized and unrealized gains (losses) | 7.19 | 2.63 | (1.12 | ) | 8.33 | 9.11 | |||||||||
| Total from investment operations | 6.76 | 2.31 | (1.49 | ) | 8.00 | 8.81 | |||||||||
| Less distributions from net realized gains | (5.78 | ) | (3.48 | ) | (1.64 | ) | — | — | |||||||
| Net asset value, end of year | $ | 33.78 | $ | 32.80 | $ | 33.97 | $ | 37.10 | $ | 29.10 | |||||
| Total returnc | 21.04 | % | 8.11 | % | (3.28 | )% | 27.49 | % | 43.42 | % | |||||
| Ratios to average net assets | |||||||||||||||
| Expenses | 1.71 | %d,e | 1.73 | % | 1.74 | % | 1.74 | % | 1.79 | %e | |||||
| Net investment income (loss) | (1.23 | )% | (1.02 | )% | (1.13 | )% | (1.06 | )% | (1.23 | )% | |||||
| Supplemental data | |||||||||||||||
| Net assets, end of year (000’s) | $ | 404,923 | $ | 348,144 | $ | 367,272 | $ | 426,526 | $ | 366,292 | |||||
| Portfolio turnover rate | 40.82 | % | 43.72 | % | 47.37 | % | 44.42 | % | 55.44 | % | |||||
aThe amount shown for a share outstanding throughout the period may not correlate with the Statement of Operations for the period due to the timing of sales and repurchases of
the Fund shares in relation to income earned and/or fluctuating fair value of the investments of the Fund.
bBased on average daily shares outstanding.
cTotal return does not reflect sales commissions or contingent deferred sales charges, if applicable.
dBenefit of waiver and payments by affiliates rounds to less than 0.01%.
eBenefit of expense reduction rounds to less than 0.01%.
Annual Report | The accompanying notes are an integral part of these financial statements. | 97
| Franklin Strategic Series | |||||||||||||||
| Financial Highlights (continued) | |||||||||||||||
| Franklin Small-Mid Cap Growth Fund | |||||||||||||||
| Year Ended April 30, | |||||||||||||||
| Class R | 2014 | 2013 | 2012 | 2011 | 2010 | ||||||||||
| Per share operating performance | |||||||||||||||
| (for a share outstanding throughout the year) | |||||||||||||||
| Net asset value, beginning of year | $ | 36.61 | $ | 37.32 | $ | 40.35 | $ | 31.50 | $ | 21.85 | |||||
| Income from investment operationsa: | |||||||||||||||
| Net investment income (loss)b | (0.29 | ) | (0.18 | ) | (0.23 | ) | (0.19 | ) | (0.19 | ) | |||||
| Net realized and unrealized gains (losses) | 8.07 | 2.95 | (1.16 | ) | 9.04 | 9.84 | |||||||||
| Total from investment operations | 7.78 | 2.77 | (1.39 | ) | 8.85 | 9.65 | |||||||||
| Less distributions from net realized gains | (5.78 | ) | (3.48 | ) | (1.64 | ) | — | — | |||||||
| Net asset value, end of year | $ | 38.61 | $ | 36.61 | $ | 37.32 | $ | 40.35 | $ | 31.50 | |||||
| Total return | 21.66 | % | 8.66 | % | (2.79 | )% | 28.10 | % | 44.16 | % | |||||
| Ratios to average net assets | |||||||||||||||
| Expenses | 1.21% | c,d | 1.23 | % | 1.24 | % | 1.24 | % | 1.29 | %d | |||||
| Net investment income (loss) | (0.73 | )% | (0.52 | )% | (0.63 | )% | (0.56 | )% | (0.73 | )% | |||||
| Supplemental data | |||||||||||||||
| Net assets, end of year (000’s) | $ | 85,921 | $ | 65,397 | $ | 64,743 | $ | 86,814 | $ | 69,415 | |||||
| Portfolio turnover rate | 40.82 | % | 43.72 | % | 47.37 | % | 44.42 | % | 55.44 | % | |||||
aThe amount shown for a share outstanding throughout the period may not correlate with the Statement of Operations for the period due to the timing of sales and repurchases of
the Fund shares in relation to income earned and/or fluctuating fair value of the investments of the Fund.
bBased on average daily shares outstanding.
cBenefit of waiver and payments by affiliates rounds to less than 0.01%.
dBenefit of expense reduction rounds to less than 0.01%.
98 | The accompanying notes are an integral part of these financial statements. | Annual Report
| Franklin Strategic Series | |||
| Financial Highlights (continued) | |||
| Franklin Small-Mid Cap Growth Fund | |||
| Year Ended | |||
| April 30, | |||
| Class R6 | 2014 | a | |
| Per share operating performance | |||
| (for a share outstanding throughout the year) | |||
| Net asset value, beginning of year | $ | 38.96 | |
| Income from investment operationsb: | |||
| Net investment incomec | 0.01 | ||
| Net realized and unrealized gains (losses) | 9.34 | ||
| Total from investment operations | 9.35 | ||
| Less distributions from net realized gains | (5.78 | ) | |
| Net asset value, end of year | $ | 42.53 | |
| Total return | 24.43 | % | |
| Ratios to average net assets | |||
| Expensesd | 0.47 | % | |
| Net investment income | 0.01 | % | |
| Supplemental data | |||
| Net assets, end of year (000’s) | $ | 157,153 | |
| Portfolio turnover rate | 40.82 | % | |
aFor the year May 1, 2013 (effective date) to April 30, 2014.
bThe amount shown for a share outstanding throughout the period may not correlate with the Statement of Operations for the period due to the timing of sales and repurchases of
the Fund shares in relation to income earned and/or fluctuating fair value of the investments of the Fund.
cBased on average daily shares outstanding.
dBenefit of waiver and payments by affiliates and expense reduction rounds to less than 0.01%.
Annual Report | The accompanying notes are an integral part of these financial statements. | 99
| Franklin Strategic Series | |||||||||||||||
| Financial Highlights (continued) | |||||||||||||||
| Franklin Small-Mid Cap Growth Fund | |||||||||||||||
| Year Ended April 30, | |||||||||||||||
| Advisor Class | 2014 | 2013 | 2012 | 2011 | 2010 | ||||||||||
| Per share operating performance | |||||||||||||||
| (for a share outstanding throughout the year) | |||||||||||||||
| Net asset value, beginning of year | $ | 39.56 | $ | 39.83 | $ | 42.73 | $ | 33.19 | $ | 22.90 | |||||
| Income from investment operationsa: | |||||||||||||||
| Net investment income (loss)b | (0.10 | ) | (0.01 | ) | (0.05 | ) | (0.02 | ) | (0.07 | ) | |||||
| Net realized and unrealized gains (losses) | 8.76 | 3.22 | (1.21 | ) | 9.56 | 10.36 | |||||||||
| Total from investment operations | 8.66 | 3.21 | (1.26 | ) | 9.54 | 10.29 | |||||||||
| Less distributions from net realized gains | (5.78 | ) | (3.48 | ) | (1.64 | ) | — | — | |||||||
| Net asset value, end of year | $ | 42.44 | $ | 39.56 | $ | 39.83 | $ | 42.73 | $ | 33.19 | |||||
| Total return | 22.30 | % | 9.21 | % | (2.29 | )% | 28.74 | % | 44.93 | % | |||||
| Ratios to average net assets | |||||||||||||||
| Expenses | 0.71 | %c,d | 0.73 | % | 0.74 | % | 0.74 | % | 0.79 | %d | |||||
| Net investment income (loss) | (0.23 | )% | (0.02 | )% | (0.13 | )% | (0.06 | )% | (0.23 | )% | |||||
| Supplemental data | |||||||||||||||
| Net assets, end of year (000’s) | $ | 650,426 | $ | 909,895 | $ | 822,827 | $ | 878,248 | $ | 783,021 | |||||
| Portfolio turnover rate | 40.82 | % | 43.72 | % | 47.37 | % | 44.42 | % | 55.44 | % | |||||
aThe amount shown for a share outstanding throughout the period may not correlate with the Statement of Operations for the period due to the timing of sales and repurchases of
the Fund shares in relation to income earned and/or fluctuating fair value of the investments of the Fund.
bBased on average daily shares outstanding.
cBenefit of waiver and payments by affiliates rounds to less than 0.01%.
dBenefit of expense reduction rounds to less than 0.01%.
100 | The accompanying notes are an integral part of these financial statements. | Annual Report
Franklin Strategic Series
Statement of Investments, April 30, 2014
| Franklin Small-Mid Cap Growth Fund | Shares | Value | |
| Common Stocks 98.4% | |||
| Consumer Discretionary 22.7% | |||
| aAMC Networks Inc., A | 229,100 | $ | 15,044,997 |
| aBally Technologies Inc. | 154,200 | 10,039,962 | |
| BorgWarner Inc. | 615,600 | 38,253,384 | |
| aBRP Inc. (Canada) | 1,164,100 | 31,331,555 | |
| aBuffalo Wild Wings Inc. | 156,900 | 22,926,228 | |
| aCharter Communications Inc., A | 117,100 | 15,870,563 | |
| aChipotle Mexican Grill Inc. | 60,900 | 30,358,650 | |
| Dick’s Sporting Goods Inc. | 620,400 | 32,670,264 | |
| aDollar General Corp. | 742,200 | 41,889,768 | |
| GNC Holdings Inc., A | 831,500 | 37,417,500 | |
| aGrand Canyon Education Inc. | 402,400 | 17,351,488 | |
| Harman International Industries Inc. | 321,700 | 35,261,537 | |
| aHomeAway Inc. | 615,400 | 20,074,348 | |
| a,bImax Corp. (Canada) | 428,500 | 10,986,740 | |
| aJarden Corp. | 665,528 | 38,034,925 | |
| aLiberty Media Corp., A | 240,300 | 31,169,313 | |
| aLiberty Ventures, A | 462,000 | 26,814,480 | |
| aMichael Kors Holdings Ltd. | 359,000 | 32,740,800 | |
| aNetflix Inc. | 104,230 | 33,566,229 | |
| aNorwegian Cruise Line Holdings Ltd. | 297,900 | 9,762,183 | |
| PetSmart Inc. | 365,200 | 24,716,736 | |
| The Ryland Group Inc. | 524,400 | 20,131,716 | |
| aShutterfly Inc. | 474,700 | 19,429,471 | |
| Starwood Hotels & Resorts Worldwide Inc. | 419,300 | 32,139,345 | |
| aStarz, A | 754,800 | 24,357,396 | |
| aTenneco Inc. | 556,900 | 33,341,603 | |
| Tractor Supply Co. | 453,600 | 30,500,064 | |
| aUnder Armour Inc., A | 637,400 | 31,162,486 | |
| Wolverine World Wide Inc. | 1,457,500 | 40,955,750 | |
| Wynn Resorts Ltd. | 215,500 | 43,938,295 | |
| 832,237,776 | |||
| Consumer Staples 4.9% | |||
| aBoston Beer Inc., A | 121,800 | 29,967,672 | |
| Mead Johnson Nutrition Co., A | 571,200 | 50,414,112 | |
| aMonster Beverage Corp. | 387,500 | 25,947,000 | |
| aTreeHouse Foods Inc. | 376,500 | 28,177,260 | |
| Whole Foods Market Inc. | 920,100 | 45,728,970 | |
| 180,235,014 | |||
| Energy 6.4% | |||
| Cabot Oil & Gas Corp., A | 998,910 | 39,237,185 | |
| aCameron International Corp. | 232,000 | 15,070,720 | |
| aConcho Resources Inc. | 276,200 | 36,030,290 | |
| aDiamondback Energy Inc. | 525,400 | 37,797,276 | |
| aOasis Petroleum Inc. | 999,200 | 46,472,792 | |
| Oceaneering International Inc. | 227,300 | 16,656,544 |
Annual Report | 101
| Franklin Strategic Series | |||
| Statement of Investments, April 30, 2014 (continued) | |||
| Franklin Small-Mid Cap Growth Fund | Shares | Value | |
| Common Stocks (continued) | |||
| Energy (continued) | |||
| aSanchez Energy Corp. | 686,814 | $ | 19,423,100 |
| Superior Energy Services Inc. | 739,400 | 24,341,048 | |
| 235,028,955 | |||
| Financials 6.6% | |||
| aAffiliated Managers Group Inc. | 251,800 | 49,906,760 | |
| Brown & Brown Inc. | 351,700 | 10,473,626 | |
| bDigital Realty Trust Inc. | 199,400 | 10,647,960 | |
| IntercontinentalExchange Group Inc. | 227,048 | 46,417,693 | |
| Jones Lang LaSalle Inc. | 144,900 | 16,792,461 | |
| Lazard Ltd., A | 801,500 | 37,710,575 | |
| aSignature Bank/New York NY | 349,200 | 41,491,944 | |
| T. Rowe Price Group Inc. | 342,800 | 28,154,164 | |
| 241,595,183 | |||
| Health Care 16.9% | |||
| aActavis PLC | 211,900 | 43,297,527 | |
| Agilent Technologies Inc. | 373,100 | 20,162,324 | |
| aAlexion Pharmaceuticals Inc. | 188,000 | 29,741,600 | |
| aAlnylam Pharmaceuticals Inc. | 282,900 | 14,012,037 | |
| aBioMarin Pharmaceutical Inc. | 151,500 | 8,821,845 | |
| aCareFusion Corp. | 549,400 | 21,459,564 | |
| aCatamaran Corp. | 669,300 | 25,266,075 | |
| aCelldex Therapeutics Inc. | 1,096,400 | 16,446,000 | |
| aCerner Corp. | 588,000 | 30,164,400 | |
| The Cooper Cos. Inc. | 197,300 | 26,025,843 | |
| aDaVita HealthCare Partners Inc. | 584,600 | 40,512,780 | |
| aEdwards Lifesciences Corp. | 184,700 | 15,047,509 | |
| aEnvision Healthcare Holdings Inc. | 800,600 | 27,052,274 | |
| aHCA Holdings Inc. | 620,200 | 32,250,400 | |
| aHeartWare International Inc. | 163,600 | 13,899,456 | |
| aHMS Holdings Corp. | 661,800 | 10,701,306 | |
| aIllumina Inc. | 154,900 | 21,043,165 | |
| aIncyte Corp. | 148,700 | 7,220,872 | |
| a,bKaryopharm Therapeutics Inc. | 341,700 | 9,167,811 | |
| aMedivation Inc. | 303,892 | 18,297,337 | |
| aMettler-Toledo International Inc. | 146,200 | 34,082,144 | |
| Perrigo Co. PLC | 310,817 | 45,024,951 | |
| aPuma Biotechnology Inc. | 73,200 | 5,529,528 | |
| aQuintiles Transnational Holdings Inc. | 451,100 | 21,260,343 | |
| aSagent Pharmaceuticals Inc. | 866,300 | 17,923,747 | |
| St. Jude Medical Inc. | 395,500 | 25,102,385 | |
| aVertex Pharmaceuticals Inc. | 198,900 | 13,465,530 | |
| Zoetis Inc. | 941,300 | 28,483,738 | |
| 621,462,491 | |||
| Industrials 20.2% | |||
| Acuity Brands Inc. | 174,900 | 21,787,293 | |
| aThe Advisory Board Co. | 424,200 | 24,289,692 | |
| Allegiant Travel Co. | 271,870 | 31,931,132 | |
| 102 | Annual Report | |||
| Franklin Strategic Series | |||
| Statement of Investments, April 30, 2014 (continued) | |||
| Franklin Small-Mid Cap Growth Fund | Shares | Value | |
| Common Stocks (continued) | |||
| Industrials (continued) | |||
| AMETEK Inc. | 1,019,950 | $ | 53,771,764 |
| aB/E Aerospace Inc. | 377,800 | 33,159,506 | |
| aColfax Corp. | 547,800 | 39,430,644 | |
| aDigitalGlobe Inc. | 956,900 | 28,496,482 | |
| Flowserve Corp. | 597,100 | 43,618,155 | |
| aGenesee & Wyoming Inc. | 300,200 | 29,722,802 | |
| aHexcel Corp. | 700,100 | 29,187,169 | |
| aIHS Inc., A | 362,900 | 43,776,627 | |
| Interface Inc. | 709,400 | 12,762,106 | |
| J.B. Hunt Transport Services Inc. | 307,800 | 23,423,580 | |
| aJacobs Engineering Group Inc. | 387,400 | 22,352,980 | |
| Kansas City Southern | 196,100 | 19,782,568 | |
| The Manitowoc Co. Inc. | 1,098,400 | 34,907,152 | |
| aProto Labs Inc. | 186,700 | 11,302,818 | |
| Robert Half International Inc. | 834,900 | 37,403,520 | |
| Rockwell Automation Inc. | 170,300 | 20,296,354 | |
| Roper Industries Inc. | 386,330 | 53,680,553 | |
| aSpirit Airlines Inc. | 433,900 | 24,662,876 | |
| Towers Watson & Co. | 120,100 | 13,477,622 | |
| aUnited Rentals Inc. | 398,000 | 37,344,340 | |
| aVerisk Analytics Inc., A | 249,800 | 15,010,482 | |
| W.W. Grainger Inc. | 69,200 | 17,604,480 | |
| aWABCO Holdings Inc. | 173,100 | 18,523,431 | |
| 741,706,128 | |||
| Information Technology 16.2% | |||
| aAlliance Data Systems Corp. | 117,100 | 28,326,490 | |
| aANSYS Inc. | 384,400 | 29,333,564 | |
| Avago Technologies Ltd. (Singapore) | 580,000 | 36,830,000 | |
| aBottomline Technologies Inc. | 565,600 | 17,895,584 | |
| aCognex Corp. | 664,300 | 22,871,849 | |
| aDemandware Inc. | 347,100 | 17,226,573 | |
| aElectronic Arts Inc. | 665,000 | 18,819,500 | |
| aFleetCor Technologies Inc. | 228,400 | 26,067,292 | |
| aGlobal Eagle Entertainment Inc. | 766,700 | 8,456,701 | |
| a,bGrubHub Inc. | 26,800 | 829,460 | |
| Intersil Corp., A | 1,894,200 | 23,374,428 | |
| aJDS Uniphase Corp. | 1,774,600 | 22,484,182 | |
| aLam Research Corp. | 554,200 | 31,927,462 | |
| aLinkedIn Corp., A | 175,700 | 26,964,679 | |
| Maxim Integrated Products Inc. | 764,500 | 24,800,380 | |
| National Instruments Corp. | 392,716 | 10,725,074 | |
| aNetSuite Inc. | 169,800 | 13,127,238 | |
| aNXP Semiconductors NV (Netherlands) | 801,300 | 47,773,506 | |
| aPandora Media Inc. | 446,500 | 10,457,030 | |
| aRed Hat Inc. | 301,000 | 14,643,650 | |
| aSemtech Corp. | 518,300 | 12,428,834 | |
| aServiceNow Inc. | 457,000 | 22,722,040 | |
| aSilicon Laboratories Inc. | 172,826 | 7,768,529 | |
| Annual Report | 103 | |||
Franklin Strategic Series
Statement of Investments, April 30, 2014 (continued)
| Franklin Small-Mid Cap Growth Fund | Shares | Value | ||
| Common Stocks (continued) | ||||
| Information Technology (continued) | ||||
| aStratasys Ltd. | 113,600 | $ | 11,004,432 | |
| aTrimble Navigation Ltd. | 1,084,300 | 41,669,649 | ||
| aViaSat Inc. | 374,796 | 24,065,651 | ||
| aWorkday Inc. | 108,300 | 7,913,481 | ||
| Xilinx Inc. | 410,900 | 19,390,371 | ||
| aYelp Inc. | 226,600 | 13,215,312 | ||
| 593,112,941 | ||||
| Materials 2.8% | ||||
| Airgas Inc. | 286,500 | 30,443,490 | ||
| Cytec Industries Inc. | 279,600 | 26,651,472 | ||
| H.B. Fuller Co. | 466,933 | 21,633,006 | ||
| Martin Marietta Materials Inc. | 187,300 | 23,287,009 | ||
| 102,014,977 | ||||
| Telecommunication Services 1.1% | ||||
| aSBA Communications Corp. | 469,400 | 42,133,344 | ||
| Utilities 0.6% | ||||
| aCalpine Corp. | 997,600 | 22,874,968 | ||
| Total Common Stocks (Cost $2,362,812,837) | 3,612,401,777 | |||
| Short Term Investments 2.5% | ||||
| Money Market Funds (Cost $61,645,499) 1.7% | ||||
| a,cInstitutional Fiduciary Trust Money Market Portfolio | 61,645,499 | 61,645,499 | ||
| dInvestments from Cash Collateral Received for Loaned Securities | ||||
| (Cost $27,609,025) 0.8% | ||||
| Money Market Funds 0.8% | ||||
| eBNY Mellon Overnight Government Fund, 0.05% | 27,609,025 | 27,609,025 | ||
| Total Investments (Cost $2,452,067,361) 100.9% | 3,701,656,301 | |||
| Other Assets, less Liabilities (0.9)% | (31,785,171 | ) | ||
| Net Assets 100.0% | $ | 3,669,871,130 |
104 | The accompanying notes are an integral part of these financial statements. | Annual Report
aNon-income producing.
bA portion or all of the security is on loan at April 30, 2014. See Note 1(c).
cSee Note 3(f) regarding investments in the Institutional Fiduciary Trust Money Market Portfolio.
dSee Note 1(c) regarding securities on loan.
eThe rate shown is the annualized seven-day yield at period end.
| Franklin Strategic Series | |||||||
| Financial Statements | |||||||
| Statements of Assets and Liabilities | |||||||
| April 30, 2014 | |||||||
| Franklin | |||||||
| Franklin | Franklin | Growth | |||||
| Flex Cap | Focused Core | Opportunities | |||||
| Growth Fund | Equity Fund | Fund | |||||
| Assets: | |||||||
| Investments in securities: | |||||||
| Cost - Unaffiliated issuers | $ | 2,167,179,414 | $ | 39,729,558 | $ | 675,115,087 | |
| Cost - Sweep Money Fund (Note 3f) | 37,937,180 | 2,870,498 | 10,764,599 | ||||
| Total cost of investments | $ | 2,205,116,594 | $ | 42,600,056 | $ | 685,879,686 | |
| Value - Unaffiliated issuers | $ | 3,310,970,450 | $ | 51,796,767 | $ | 889,877,647 | |
| Value - Sweep Money Fund (Note 3f) | 37,937,180 | 2,870,498 | 10,764,599 | ||||
| Total value of investmentsa | 3,348,907,630 | 54,667,265 | 900,642,246 | ||||
| Receivables: | |||||||
| Investment securities sold | 16,008,219 | 316,315 | 3,116,980 | ||||
| Capital shares sold | 3,567,817 | 85,813 | 891,831 | ||||
| Dividends and interest | 530,179 | 57,135 | 170,018 | ||||
| Other assets | 1,975 | 28 | 508 | ||||
| Total assets | 3,369,015,820 | 55,126,556 | 904,821,583 | ||||
| Liabilities: | |||||||
| Payables: | |||||||
| Investment securities purchased | 19,494,268 | 795,490 | 6,947,779 | ||||
| Capital shares redeemed | 4,277,038 | 130,434 | 1,569,764 | ||||
| Management fees | 1,240,506 | 6,909 | 474,550 | ||||
| Distribution fees | 761,080 | 14,687 | 173,997 | ||||
| Transfer agent fees | 911,705 | 9,285 | 106,510 | ||||
| Payable upon return of securities loaned | 60,498,783 | — | 12,024,475 | ||||
| Accrued expenses and other liabilities | 187,771 | 4,530 | 33,263 | ||||
| Total liabilities | 87,371,151 | 961,335 | 21,330,338 | ||||
| Net assets, at value | $ | 3,281,644,669 | $ | 54,165,221 | $ | 883,491,245 | |
| Net assets consist of: | |||||||
| Paid-in capital | $ | 1,816,837,067 | $ | 41,326,219 | $ | 658,252,096 | |
| Undistributed net investment income (loss) | — | 13,720 | (1,886,845 | ) | |||
| Net unrealized appreciation (depreciation) | 1,143,791,036 | 12,068,535 | 214,762,846 | ||||
| Accumulated net realized gain (loss) | 321,016,566 | 756,747 | 12,363,148 | ||||
| Net assets, at value | $ | 3,281,644,669 | $ | 54,165,221 | $ | 883,491,245 | |
| aIncludes securities loaned | $ | 55,816,292 | $ | — | $ | 11,872,652 | |
Annual Report | The accompanying notes are an integral part of these financial statements. | 105
Franklin Strategic Series
Financial Statements (continued)
Statements of Assets and Liabilities (continued)
April 30, 2014
| Franklin | |||||||||
| Franklin | Franklin | Growth | |||||||
| Flex Cap | Focused Core | Opportunities | |||||||
| Growth Fund | Equity Fund | Fund | |||||||
| Class A: | |||||||||
| Net assets, at value | $ | 2,171,052,671 | $ | 40,371,799 | $ | 349,343,492 | |||
| Shares outstanding | 40,259,539 | 3,018,118 | 12,267,820 | ||||||
| Net asset value per sharea | $ | 53.93 | $ | 13.38 | $ | 28.48 | |||
| Maximum offering price per share (net asset value per share ÷ 94.25%) | $ | 57.22 | $ | 14.20 | $ | 30.22 | |||
| Class C: | |||||||||
| Net assets, at value | $ | 348,040,114 | $ | 6,665,805 | $ | 85,883,469 | |||
| Shares outstanding | 7,438,079 | 513,414 | 3,380,258 | ||||||
| Net asset value and maximum offering price per sharea | $ | 46.79 | $ | 12.98 | $ | 25.41 | |||
| Class R: | |||||||||
| Net assets, at value | $ | 56,274,179 | $ | 123,919 | $ | 42,952,792 | |||
| Shares outstanding | 1,082,449 | 9,332 | 1,552,406 | ||||||
| Net asset value and maximum offering price per share | $ | 51.99 | $ | 13.28 | $ | 27.67 | |||
| Class R6: | |||||||||
| Net assets, at value | $ | 376,607,136 | $ | 14,151 | $ | 180,842,845 | |||
| Shares outstanding | 6,780,316 | 1,049 | 6,032,188 | ||||||
| Net asset value and maximum offering price per share | $ | 55.54 | $ | 13.49 | $ | 29.98 | |||
| Advisor Class: | |||||||||
| Net assets, at value | $ | 329,670,569 | $ | 6,989,547 | $ | 224,468,647 | |||
| Shares outstanding | 5,950,319 | 518,375 | 7,499,971 | ||||||
| Net asset value and maximum offering price per share | $ | 55.40 | $ | 13.48 | $ | 29.93 | |||
| aRedemption price is equal to net asset value less contingent deferred sales charges, if applicable. | |||||||||
106 | The accompanying notes are an integral part of these financial statements. | Annual Report
| Franklin Strategic Series | ||||
| Financial Statements (continued) | ||||
| Statements of Assets and Liabilities (continued) | ||||
| April 30, 2014 | ||||
| Franklin | Franklin | |||
| Small Cap | Small-Mid Cap | |||
| Growth Fund | Growth Fund | |||
| Assets: | ||||
| Investments in securities: | ||||
| Cost - Unaffiliated issuers | $ | 1,355,484,626 | $ | 2,390,421,862 |
| Cost - Sweep Money Fund (Note 3f) | 91,895,995 | 61,645,499 | ||
| Total cost of investments | $ | 1,447,380,621 | $ | 2,452,067,361 |
| Value - Unaffiliated issuers | $ | 1,561,853,826 | $ | 3,640,010,802 |
| Value - Sweep Money Fund (Note 3f) | 91,895,995 | 61,645,499 | ||
| Total value of investmentsa | 1,653,749,821 | 3,701,656,301 | ||
| Cash | 77,133 | — | ||
| Receivables: | ||||
| Investment securities sold | 27,794,136 | 19,775,616 | ||
| Capital shares sold | 16,251,283 | 2,362,101 | ||
| Dividends and interest | 372,336 | 451,286 | ||
| Other assets | 799 | 2,178 | ||
| Total assets | 1,698,245,508 | 3,724,247,482 | ||
| Liabilities: | ||||
| Payables: | ||||
| Investment securities purchased | 25,634,700 | 10,271,451 | ||
| Capital shares redeemed | 25,280,389 | 12,825,250 | ||
| Management fees | 864,762 | 1,382,468 | ||
| Distribution fees | 390,088 | 860,548 | ||
| Transfer agent fees | 337,903 | 1,266,470 | ||
| Payable upon return of securities loaned | 40,714,400 | 27,609,025 | ||
| Accrued expenses and other liabilities | 62,959 | 161,140 | ||
| Total liabilities | 93,285,201 | 54,376,352 | ||
| Net assets, at value | $ | 1,604,960,307 | $ | 3,669,871,130 |
| Net assets consist of: | ||||
| Paid-in capital | $ | 1,323,730,008 | $ | 2,081,442,638 |
| Undistributed net investment income (loss) | — | 260,343 | ||
| Net unrealized appreciation (depreciation) | 206,369,200 | 1,249,588,940 | ||
| Accumulated net realized gain (loss) | 74,861,099 | 338,579,209 | ||
| Net assets, at value | $ | 1,604,960,307 | $ | 3,669,871,130 |
| aIncludes securities loaned | $ | 37,362,572 | $ | 27,259,363 |
Annual Report | The accompanying notes are an integral part of these financial statements. | 107
| Franklin Strategic Series | ||||||
| Financial Statements (continued) | ||||||
| Statements of Assets and Liabilities (continued) | ||||||
| April 30, 2014 | ||||||
| Franklin | Franklin | |||||
| Small Cap | Small-Mid Cap | |||||
| Growth Fund | Growth Fund | |||||
| Class A: | ||||||
| Net assets, at value | $ | 851,316,920 | $ | 2,371,447,800 | ||
| Shares outstanding | 46,766,389 | 58,665,401 | ||||
| Net asset value per sharea | $ | 18.20 | $ | 40.42 | ||
| Maximum offering price per share (net asset value per share ÷ 94.25%) | $ | 19.31 | $ | 42.89 | ||
| Class C: | ||||||
| Net assets, at value | $ | 187,270,701 | $ | 404,923,180 | ||
| Shares outstanding | 11,682,080 | 11,986,725 | ||||
| Net asset value and maximum offering price per sharea | $ | 16.03 | $ | 33.78 | ||
| Class R: | ||||||
| Net assets, at value | $ | 51,189,760 | $ | 85,921,147 | ||
| Shares outstanding | 2,912,647 | 2,225,379 | ||||
| Net asset value and maximum offering price per share | $ | 17.57 | $ | 38.61 | ||
| Class R6: | ||||||
| Net assets, at value | $ | 87,776,563 | $ | 157,153,119 | ||
| Shares outstanding | 4,569,882 | 3,695,130 | ||||
| Net asset value and maximum offering price per share | $ | 19.21 | $ | 42.53 | ||
| Advisor Class: | ||||||
| Net assets, at value | $ | 427,406,363 | $ | 650,425,884 | ||
| Shares outstanding | 22,289,997 | 15,326,802 | ||||
| Net asset value and maximum offering price per share | $ | 19.17 | $ | 42.44 | ||
| aRedemption price is equal to net asset value less contingent deferred sales charges, if applicable. | ||||||
108 | The accompanying notes are an integral part of these financial statements. | Annual Report
| Franklin Strategic Series | |||||||||
| Financial Statements (continued) | |||||||||
| Statements of Operations | |||||||||
| for the year ended April 30, 2014 | |||||||||
| Franklin | |||||||||
| Franklin | Franklin | Growth | |||||||
| Flex Cap | Focused Core | Opportunities | |||||||
| Growth Fund | Equity Fund | Fund | |||||||
| Investment income: | |||||||||
| Dividends | $ | 22,618,021 | $ | 579,581 | $ | 3,107,584 | |||
| Income from securities loaned | 997,155 | — | 65,366 | ||||||
| Total investment income | 23,615,176 | 579,581 | 3,172,950 | ||||||
| Expenses: | |||||||||
| Management fees (Note 3a) | 15,572,687 | 378,362 | 4,607,345 | ||||||
| Distribution fees: (Note 3c) | |||||||||
| Class A | 5,466,660 | 89,732 | 870,287 | ||||||
| Class C | 3,369,351 | 43,526 | 701,502 | ||||||
| Class R | 308,135 | 480 | 203,541 | ||||||
| Transfer agent fees: (Note 3e) | |||||||||
| Class A | 5,227,771 | 47,101 | 466,125 | ||||||
| Class C | 805,546 | 6,839 | 113,700 | ||||||
| Class R | 147,343 | 151 | 65,990 | ||||||
| Class R6 | 128 | 68 | 1,062 | ||||||
| Advisor Class | 1,096,991 | 8,597 | 238,397 | ||||||
| Custodian fees (Note 4) | 23,627 | 467 | 5,917 | ||||||
| Reports to shareholders | 419,687 | 9,652 | 61,094 | ||||||
| Registration and filing fees | 169,511 | 76,489 | 118,784 | ||||||
| Professional fees | 61,594 | 34,496 | 40,270 | ||||||
| Trustees’ fees and expenses | 38,080 | — | 6,290 | ||||||
| Other | 45,918 | 7,427 | 11,311 | ||||||
| Total expenses | 32,753,029 | 703,387 | 7,511,615 | ||||||
| Expense reductions (Note 4) | (30 | ) | — | (13 | ) | ||||
| Expenses waived/paid by affiliates (Note 3f and 3g) | (50,542 | ) | (204,103 | ) | (9,730 | ) | |||
| Net expenses | 32,702,457 | 499,284 | 7,501,872 | ||||||
| Net investment income (loss) | (9,087,281 | ) | 80,297 | (4,328,922 | ) | ||||
| Realized and unrealized gains (losses): | |||||||||
| Net realized gain (loss) from: | |||||||||
| Investments | 547,040,961 | 2,999,777 | 34,740,569 | ||||||
| Foreign currency transactions | — | 1,382 | (5,720 | ) | |||||
| Net realized gain (loss) | 547,040,961 | 3,001,159 | 34,734,849 | ||||||
| Net change in unrealized appreciation (depreciation) on: | |||||||||
| Investments | 149,336,366 | 6,358,456 | 72,756,026 | ||||||
| Translation of other assets and liabilities denominated in foreign currencies | — | 1,405 | (154 | ) | |||||
| Net change in unrealized appreciation (depreciation) | 149,336,366 | 6,359,861 | 72,755,872 | ||||||
| Net realized and unrealized gain (loss) | 696,377,327 | 9,361,020 | 107,490,721 | ||||||
| Net increase (decrease) in net assets resulting from operations | $ | 687,290,046 | $ | 9,441,317 | $ | 103,161,799 | |||
Annual Report | The accompanying notes are an integral part of these financial statements. | 109
| Franklin Strategic Series | ||||||
| Financial Statements (continued) | ||||||
| Statements of Operations (continued) | ||||||
| for the year ended April 30, 2014 | ||||||
| Franklin | Franklin | |||||
| Small Cap | Small-Mid Cap | |||||
| Growth Fund | Growth Fund | |||||
| Investment income: | ||||||
| Dividends | $ | 2,593,793 | $ | 18,066,541 | ||
| Income from securities loaned | 1,137,271 | 247,221 | ||||
| Total investment income | 3,731,064 | 18,313,762 | ||||
| Expenses: | ||||||
| Management fees (Note 3a) | 7,289,393 | 17,329,484 | ||||
| Distribution fees: (Note 3c) | ||||||
| Class A | 1,840,322 | 6,097,710 | ||||
| Class C | 1,353,493 | 3,902,802 | ||||
| Class R | 159,809 | 379,276 | ||||
| Transfer agent fees: (Note 3e) | ||||||
| Class A | 1,082,857 | 5,764,906 | ||||
| Class C | 238,974 | 922,610 | ||||
| Class R | 56,425 | 179,275 | ||||
| Class R6 | 862 | 200 | ||||
| Advisor Class | 394,566 | 1,886,486 | ||||
| Custodian fees (Note 4) | 8,671 | 31,272 | ||||
| Reports to shareholders | 135,501 | 328,429 | ||||
| Registration and filing fees | 212,716 | 185,651 | ||||
| Professional fees | 41,281 | 61,616 | ||||
| Trustees’ fees and expenses | 8,287 | 42,552 | ||||
| Other | 8,036 | 52,609 | ||||
| Total expenses | 12,831,193 | 37,164,878 | ||||
| Expense reductions (Note 4) | (23 | ) | (17 | ) | ||
| Expenses waived/paid by affiliates (Note 3f) | (55,735 | ) | (60,690 | ) | ||
| Net expenses | 12,775,435 | 37,104,171 | ||||
| Net investment income (loss) | (9,044,371 | ) | (18,790,409 | ) | ||
| Realized and unrealized gains (losses): | ||||||
| Net realized gain (loss) from: | ||||||
| Investments: | ||||||
| Unaffiliated issuers | 118,376,734 | 748,768,800 | ||||
| Non-controlled affiliated issuers (Note 8) | — | (17,058,181 | ) | |||
| Foreign currency transactions | — | (34,373 | ) | |||
| Net realized gain (loss) | 118,376,734 | 731,676,246 | ||||
| Net change in unrealized appreciation (depreciation) on investments | 102,087,491 | 39,368,824 | ||||
| Net realized and unrealized gain (loss) | 220,464,225 | 771,045,070 | ||||
| Net increase (decrease) in net assets resulting from operations | $ | 211,419,854 | $ | 752,254,661 | ||
110 | The accompanying notes are an integral part of these financial statements. | Annual Report
| Franklin Strategic Series | ||||||||||||||
| Financial Statements (continued) | ||||||||||||||
| Statements of Changes in Net Assets | ||||||||||||||
| Franklin Flex Cap | Franklin Focused Core | |||||||||||||
| Growth Fund | Equity Fund | |||||||||||||
| Year Ended April 30, | Year Ended April 30, | |||||||||||||
| 2014 | 2013 | 2014 | 2013 | |||||||||||
| Increase (decrease) in net assets: | ||||||||||||||
| Operations: | ||||||||||||||
| Net investment income (loss) | $ | (9,087,281 | ) | $ | 2,998,279 | $ | 80,297 | $ | 174,940 | |||||
| Net realized gain (loss) from investments and foreign | ||||||||||||||
| currency transactions | 547,040,961 | 269,956,346 | 3,001,159 | (1,098,858 | ) | |||||||||
| Net change in unrealized appreciation (depreciation) | ||||||||||||||
| on investments and translation of other assets and | ||||||||||||||
| liabilities denominated in foreign currencies | 149,336,366 | (181,303,288 | ) | 6,359,861 | 3,219,978 | |||||||||
| Net increase (decrease) in net assets resulting | ||||||||||||||
| from operations | 687,290,046 | 91,651,337 | 9,441,317 | 2,296,060 | ||||||||||
| Distributions to shareholders from: | ||||||||||||||
| Net investment income: | ||||||||||||||
| Class A | — | (352,224 | ) | (192,481 | ) | — | ||||||||
| Class C | — | — | (11,368 | ) | — | |||||||||
| Class R | — | — | (445 | ) | — | |||||||||
| Class R6 | — | — | (49 | ) | — | |||||||||
| Advisor Class | — | (1,555,933 | ) | (39,406 | ) | — | ||||||||
| Net realized gains: | ||||||||||||||
| Class A | (301,818,476 | ) | (65,229,228 | ) | (346,062 | ) | (127,814 | ) | ||||||
| Class B | — | (73,931 | ) | — | — | |||||||||
| Class C | (54,830,001 | ) | (10,758,605 | ) | (51,272 | ) | (17,525 | ) | ||||||
| Class R | (9,202,542 | ) | (2,192,464 | ) | (1,074 | ) | (372 | ) | ||||||
| Class R6 | (49,991,855 | ) | — | (63 | ) | — | ||||||||
| Advisor Class | (52,429,221 | ) | (27,903,654 | ) | (57,087 | ) | (20,718 | ) | ||||||
| Total distributions to shareholders | (468,272,095 | ) | (108,066,039 | ) | (699,307 | ) | (166,429 | ) | ||||||
| Capital share transactions: (Note 2) | ||||||||||||||
| Class A | (40,787,141 | ) | (19,154,003 | ) | 14,846,786 | (8,777,929 | ) | |||||||
| Class B | — | (7,931,824 | ) | — | — | |||||||||
| Class C | 41,930,551 | (21,357,248 | ) | 3,202,995 | (1,000,057 | ) | ||||||||
| Class R | (10,211,593 | ) | (12,574,711 | ) | 25,544 | 28,198 | ||||||||
| Class R6 | 351,377,703 | — | 12,502 | — | ||||||||||
| Advisor Class | (557,643,800 | ) | (309,419,923 | ) | 1,381,150 | 827,085 | ||||||||
| Total capital share transactions | (215,334,280 | ) | (370,437,709 | ) | 19,468,977 | (8,922,703 | ) | |||||||
| Net increase (decrease) in net assets | 3,683,671 | (386,852,411 | ) | 28,210,987 | (6,793,072 | ) | ||||||||
| Net assets: | ||||||||||||||
| Beginning of year | 3,277,960,998 | 3,664,813,409 | 25,954,234 | 32,747,306 | ||||||||||
| End of year | $ | 3,281,644,669 | $ | 3,277,960,998 | $ | 54,165,221 | $ | 25,954,234 | ||||||
| Undistributed net investment income (loss) included in | ||||||||||||||
| net assets: | ||||||||||||||
| End of year | $ | — | $ | (2,150,228 | ) | $ | 13,720 | $ | 175,790 | |||||
Annual Report | The accompanying notes are an integral part of these financial statements. | 111
| Franklin Strategic Series | ||||||||||||
| Financial Statements (continued) | ||||||||||||
| Statements of Changes in Net Assets (continued) | ||||||||||||
| Franklin Growth | Franklin Small Cap | |||||||||||
| Opportunities Fund | Growth Fund | |||||||||||
| Year Ended April 30, | Year Ended April 30, | |||||||||||
| 2014 | 2013 | 2014 | 2013 | |||||||||
| Increase (decrease) in net assets: | ||||||||||||
| Operations: | ||||||||||||
| Net investment income (loss) | $ | (4,328,922 | ) | $ | (2,368,918 | ) | $ | (9,044,371 | ) | $ | (2,933,796 | ) |
| Net realized gain (loss) from investments and foreign | ||||||||||||
| currency transactions | 34,734,849 | 549,092 | 118,376,734 | 28,952,819 | ||||||||
| Net change in unrealized appreciation (depreciation) | ||||||||||||
| on investments and translation of other assets and | ||||||||||||
| liabilities denominated in foreign currencies | 72,755,872 | 36,581,747 | 102,087,491 | 24,437,254 | ||||||||
| Net increase (decrease) in net assets resulting | ||||||||||||
| from operations | 103,161,799 | 34,761,921 | 211,419,854 | 50,456,277 | ||||||||
| Distributions to shareholders from: | ||||||||||||
| Net realized gains: | ||||||||||||
| Class A | (7,721,877 | ) | (4,652,871 | ) | (24,165,547 | ) | (6,851,163 | ) | ||||
| Class B | — | (11,394 | ) | — | (10,436 | ) | ||||||
| Class C | (2,096,347 | ) | (1,259,124 | ) | (6,035,996 | ) | (2,077,955 | ) | ||||
| Class R | (1,119,208 | ) | (791,447 | ) | (1,265,928 | ) | (348,859 | ) | ||||
| Class R6 | (3,094,887 | ) | — | (1,954,443 | ) | — | ||||||
| Advisor Class | (5,609,140 | ) | (3,639,948 | ) | (8,618,047 | ) | (1,291,841 | ) | ||||
| Total distributions to shareholders | (19,641,459 | ) | (10,354,784 | ) | (42,039,961 | ) | (10,580,254 | ) | ||||
| Capital share transactions: (Note 2) | ||||||||||||
| Class A | 97,823,516 | (6,288,827 | ) | 418,746,753 | 57,075,476 | |||||||
| Class B | — | (1,203,871 | ) | — | (1,182,188 | ) | ||||||
| Class C | 25,708,687 | (793,226 | ) | 87,582,326 | 3,840,639 | |||||||
| Class R | 2,812,217 | (1,056,593 | ) | 30,683,689 | 5,734,645 | |||||||
| Class R6 | 160,891,720 | — | 77,135,611 | — | ||||||||
| Advisor Class | 30,022,943 | 18,046,112 | 308,435,474 | 37,021,301 | ||||||||
| Total capital share transactions | 317,259,083 | 8,703,595 | 922,583,853 | 102,489,873 | ||||||||
| Net increase (decrease) in net assets | 400,779,423 | 33,110,732 | 1,091,963,746 | 142,365,896 | ||||||||
| Net assets: | ||||||||||||
| Beginning of year | 482,711,822 | 449,601,090 | 512,996,561 | 370,630,665 | ||||||||
| End of year | $ | 883,491,245 | $ | 482,711,822 | $ | 1,604,960,307 | $ | 512,996,561 | ||||
| Undistributed net investment income (loss) included in | ||||||||||||
| net assets: | ||||||||||||
| End of year | $ | (1,886,845 | ) | $ | (1,139,112 | ) | $ | — | $ | 131,316 | ||
112 | The accompanying notes are an integral part of these financial statements. | Annual Report
| Franklin Strategic Series | ||||||
| Financial Statements (continued) | ||||||
| Statements of Changes in Net Assets (continued) | ||||||
| Franklin Small-Mid Cap | ||||||
| Growth Fund | ||||||
| Year Ended April 30, | ||||||
| 2014 | 2013 | |||||
| Increase (decrease) in net assets: | ||||||
| Operations: | ||||||
| Net investment income (loss) | $ | (18,790,409 | ) | $ | (10,034,089 | ) |
| Net realized gain (loss) from investments and foreign currency transactions | 731,676,246 | 245,057,502 | ||||
| Net change in unrealized appreciation (depreciation) on investments | 39,368,824 | 53,332,558 | ||||
| Net increase (decrease) in net assets resulting from operations | 752,254,661 | 288,355,971 | ||||
| Distributions to shareholders from: | ||||||
| Net realized gains: | ||||||
| Class A | (308,312,450 | ) | (206,899,409 | ) | ||
| Class B | — | (83,282 | ) | |||
| Class C | (59,893,715 | ) | (34,536,552 | ) | ||
| Class R | (10,409,543 | ) | (5,972,039 | ) | ||
| Class R6 | (13,191,566 | ) | — | |||
| Advisor Class | (87,681,400 | ) | (71,239,570 | ) | ||
| Total distributions to shareholders | (479,488,674 | ) | (318,730,852 | ) | ||
| Capital share transactions: (Note 2) | ||||||
| Class A | (158,638,312 | ) | (114,236,660 | ) | ||
| Class B | — | (3,746,511 | ) | |||
| Class C | 44,837,913 | (9,202,794 | ) | |||
| Class R | 17,358,312 | 1,364,360 | ||||
| Class R6 | 157,466,945 | — | ||||
| Advisor Class | (342,862,855 | ) | 84,042,939 | |||
| Total capital share transactions | (281,837,997 | ) | (41,778,666 | ) | ||
| Net increase (decrease) in net assets | (9,072,010 | ) | (72,153,547 | ) | ||
| Net assets: | ||||||
| Beginning of year | 3,678,943,140 | 3,751,096,687 | ||||
| End of year | $ | 3,669,871,130 | $ | 3,678,943,140 | ||
| Undistributed net investment income (loss) included in net assets: | ||||||
| End of year | $ | 260,343 | $ | (5,714,337 | ) | |
Annual Report | The accompanying notes are an integral part of these financial statements. | 113
Franklin Strategic Series
Notes to Financial Statements
1. ORGANIZATION AND SIGNIFICANT ACCOUNTING POLICIES
Franklin Strategic Series (Trust) is registered under the Investment Company Act of 1940, as amended, (1940 Act) as an open-end management investment company, consisting of nine separate funds, five of which are included in this report (Funds). The financial statements of the remaining funds in the Trust are presented separately. The Funds offer five classes of shares: Class A, Class C, Class R, Class R6, and Advisor Class. Effective May 1, 2013, the Funds began offering a new class of shares, Class R6. Each class of shares differs by its initial sales load, contingent deferred sales charges, voting rights on matters affecting a single class, its exchange privilege and fees primarily due to differing arrangements for distribution and transfer agent fees.
The following summarizes the Funds’ significant accounting policies.
a. Financial Instrument Valuation
The Funds’ investments in financial instruments are carried at fair value daily. Fair value is the price that would be received to sell an asset or paid to transfer a liability in an orderly transaction between market participants on the measurement date. The Funds’ calculate the net asset value per share at the close of the New York Stock Exchange (NYSE), generally at 4 p.m. Eastern time (NYSE close) on each day the NYSE is open for trading. Under procedures approved by the Trust’s Board of Trustees (the Board), the Funds’ administrator, investment manager and other affiliates have formed the Valuation and Liquidity Oversight Committee (VLOC). The VLOC provides administration and oversight of the Funds’ valuation policies and procedures, which are approved annually by the Board. Among other things, these procedures allow the Funds to utilize independent pricing services, quotations from securities and financial instrument dealers, and other market sources to determine fair value.
Equity securities listed on an exchange or on the NASDAQ National Market System are valued at the last quoted sale price or the official closing price of the day, respectively. Foreign equity securities are valued as of the close of trading on the foreign stock exchange on which the security is primarily traded or as of the NYSE close, whichever is earlier. The value is then converted into its U.S. dollar equivalent at the foreign exchange rate in effect at the NYSE close on the day that the value of the security is determined. Over-the-counter (OTC) securities are valued within the range of the most recent quoted bid and ask prices. Securities that trade in multiple markets or on multiple exchanges are valued according to the broadest and most representative market. Certain equity securities are valued based upon fundamental characteristics or relationships to similar securities. Investments in open-end mutual funds and non-registered money market funds are valued at the closing net asset value.
The Funds have procedures to determine the fair value of financial instruments for which market prices are not reliable or readily available. Under these procedures, the VLOC convenes on a regular basis to review such financial instruments and considers a number of factors, including
114 | Annual Report
Franklin Strategic Series
Notes to Financial Statements (continued)
| 1. | ORGANIZATION AND SIGNIFICANT ACCOUNTING POLICIES (continued) |
| a. | Financial Instrument Valuation (continued) |
significant unobservable valuation inputs, when arriving at fair value. The VLOC primarily employs a market-based approach which may use related or comparable assets or liabilities, recent transactions, market multiples, book values, and other relevant information for the investment to determine the fair value of the investment. An income-based valuation approach may also be used in which the anticipated future cash flows of the investment are discounted to calculate fair value. Discounts may also be applied due to the nature or duration of any restrictions on the disposition of the investments. Due to the inherent uncertainty of valuations of such investments, the fair values may differ significantly from the values that would have been used had an active market existed. The VLOC employs various methods for calibrating these valuation approaches including a regular review of key inputs and assumptions, transactional back-testing or disposition analysis, and reviews of any related market activity.
Trading in securities on foreign securities stock exchanges and OTC markets may be completed before the daily NYSE close. In addition, trading in certain foreign markets may not take place on every NYSE business day. Occasionally, events occur between the time at which trading in a foreign security is completed and the close of the NYSE that might call into question the reliability of the value of a portfolio security held by the fund. As a result, differences may arise between the value of the Funds’ portfolio securities as determined at the foreign market close and the latest indications of value at the close of the NYSE. In order to minimize the potential for these differences, the VLOC monitors price movements following the close of trading in foreign stock markets through a series of country specific market proxies (such as baskets of American Depositary Receipts, futures contracts and exchange traded funds). These price movements are measured against established trigger thresholds for each specific market proxy to assist in determining if an event has occurred that may call into question the reliability of the values of the foreign securities held by the Funds. If such an event occurs, the securities may be valued using fair value procedures, which may include the use of independent pricing services.
Also, when the last day of the reporting period is a non-business day, certain foreign markets may be open on those days that the NYSE is closed, which could result in differences between the value of the Funds’ portfolio securities on the last business day and the last calendar day of the reporting period. Any significant security valuation changes due to an open foreign market are adjusted and reflected by the Funds for financial reporting purposes.
b. Foreign Currency Translation
Portfolio securities and other assets and liabilities denominated in foreign currencies are translated into U.S. dollars based on the exchange rate of such currencies against U.S. dollars on the date of valuation. The Funds may enter into foreign currency exchange contracts to facilitate transactions denominated in a foreign currency. Purchases and sales of securities, income and expense items denominated in foreign currencies are translated into U.S. dollars at the exchange
Annual Report | 115
Franklin Strategic Series
Notes to Financial Statements (continued)
| 1. | ORGANIZATION AND SIGNIFICANT ACCOUNTING POLICIES (continued) |
| b. | Foreign Currency Translation (continued) |
rate in effect on the transaction date. Portfolio securities and assets and liabilities denominated in foreign currencies contain risks that those currencies will decline in value relative to the U.S. dollar. Occasionally, events may impact the availability or reliability of foreign exchange rates used to convert the U.S. dollar equivalent value. If such an event occurs, the foreign exchange rate will be valued at fair value using procedures established and approved by the Board.
The Funds do not separately report the effect of changes in foreign exchange rates from changes in market prices on securities held. Such changes are included in net realized and unrealized gain or loss from investments on the Statements of Operations.
Realized foreign exchange gains or losses arise from sales of foreign currencies, currency gains or losses realized between the trade and settlement dates on securities transactions and the difference between the recorded amounts of dividends, interest, and foreign withholding taxes and the U.S. dollar equivalent of the amounts actually received or paid. Net unrealized foreign exchange gains and losses arise from changes in foreign exchange rates on foreign denominated assets and liabilities other than investments in securities held at the end of the reporting period.
c. Securities Lending
Certain funds participate in an agency based securities lending program. The fund receives cash collateral against the loaned securities in an amount equal to at least 102% of the fair value of the loaned securities. Collateral is maintained over the life of the loan in an amount not less than 100% of the fair value of loaned securities, as determined at the close of fund business each day; any additional collateral required due to changes in security values is delivered to the fund on the next business day. The collateral is invested in a non-registered money fund as indicated on the Statements of Investments. The fund receives income from the investment of cash collateral, in addition to lending fees and rebates paid by the borrower. The fund bears the market risk with respect to the collateral investment, securities loaned, and the risk that the agent may default on its obligations to the fund. The securities lending agent has agreed to indemnify the fund in the event of default by a third party borrower.
d. Income and Deferred Taxes
It is each fund’s policy to qualify as a regulated investment company under the Internal Revenue Code. Each fund intends to distribute to shareholders substantially all of its taxable income and net realized gains to relieve it from federal income and excise taxes. As a result, no provision for U.S. federal income taxes is required.
The Funds may be subject to foreign taxation related to income received, capital gains on the sale of securities and certain foreign currency transactions in the foreign jurisdictions in which it invests. Foreign taxes, if any, are recorded based on the tax regulations and rates that exist in
116 | Annual Report
Franklin Strategic Series
Notes to Financial Statements (continued)
| 1. | ORGANIZATION AND SIGNIFICANT ACCOUNTING POLICIES (continued) |
| d. | Income and Deferred Taxes (continued) |
the foreign markets in which the Funds invest. When a capital gain tax is determined to apply the Funds record an estimated deferred tax liability in an amount that would be payable if the securities were disposed of on the valuation date.
Each fund recognizes the tax benefits of uncertain tax positions only when the position is “more likely than not” to be sustained upon examination by the tax authorities based on the technical merits of the tax position. As of April 30, 2014, and for all open tax years, each fund has determined that no liability for unrecognized tax benefits is required in each fund’s financial statements related to uncertain tax positions taken on a tax return (or expected to be taken on future tax returns). Open tax years are those that remain subject to examination and are based on each tax jurisdiction statute of limitation.
e. Security Transactions, Investment Income, Expenses and Distributions
Security transactions are accounted for on trade date. Realized gains and losses on security transactions are determined on a specific identification basis. Estimated expenses are accrued daily. Dividend income is recorded on the ex-dividend date except that certain dividends from foreign securities are recognized as soon as the Funds are notified of the ex-dividend date. Distributions to shareholders are recorded on the ex-dividend date and are determined according to income tax regulations (tax basis). Distributable earnings determined on a tax basis may differ from earnings recorded in accordance with accounting principles generally accepted in the United States of America. These differences may be permanent or temporary. Permanent differences are reclassified among capital accounts to reflect their tax character. These reclassifications have no impact on net assets or the results of operations. Temporary differences are not reclassified, as they may reverse in subsequent periods.
Common expenses incurred by the Trust are allocated among the Funds based on the ratio of net assets of each fund to the combined net assets of the Trust. Fund specific expenses are charged directly to the fund that incurred the expense.
Realized and unrealized gains and losses and net investment income, not including class specific expenses, are allocated daily to each class of shares based upon the relative proportion of net assets of each class. Differences in per share distributions, by class, are generally due to differences in class specific expenses.
f. Accounting Estimates
The preparation of financial statements in accordance with accounting principles generally accepted in the United States of America requires management to make estimates and assumptions that affect the reported amounts of assets and liabilities at the date of the financial statements and the amounts of income and expenses during the reporting period. Actual results could differ from those estimates.
Annual Report | 117
Franklin Strategic Series
Notes to Financial Statements (continued)
| 1. | ORGANIZATION AND SIGNIFICANT ACCOUNTING POLICIES (continued) |
| g. | Guarantees and Indemnifications |
Under the Trust’s organizational documents, its officers and trustees are indemnified by the Trust against certain liabilities arising out of the performance of their duties to the Trust. Additionally, in the normal course of business, the Trust, on behalf of the Funds, enters into contracts with service providers that contain general indemnification clauses. The Trust’s maximum exposure under these arrangements is unknown as this would involve future claims that may be made against the Trust that have not yet occurred. Currently, the Trust expects the risk of loss to be remote.
2. SHARES OF BENEFICIAL INTEREST
At April 30, 2014, there were an unlimited number of shares authorized (without par value).
Transactions in the Funds’ shares were as follows:
| Franklin | Franklin Focused | |||||||||||
| Flex Cap Growth Fund | Core Equity Fund | |||||||||||
| Shares | Amount | Shares | Amount | |||||||||
| Class A Shares: | ||||||||||||
| Year ended April 30, 2014 | ||||||||||||
| Shares sold | 6,700,704 | $ | 375,096,611 | 2,207,069 | $ | 26,644,238 | ||||||
| Shares issued in reinvestment of | ||||||||||||
| distributions | 5,171,210 | 276,039,156 | 43,741 | 534,953 | ||||||||
| Shares redeemed | (12,236,062 | ) | (691,922,908 | ) | (1,023,326 | ) | (12,332,405 | ) | ||||
| Net increase (decrease) | (364,148 | ) | $ | (40,787,141 | ) | 1,227,484 | $ | 14,846,786 | ||||
| Year ended April 30, 2013 | ||||||||||||
| Shares sold | 6,397,482 | $ | 309,888,631 | 514,515 | $ | 4,792,474 | ||||||
| Shares issued in reinvestment of | ||||||||||||
| distributions | 1,178,334 | 55,146,043 | 12,299 | 115,857 | ||||||||
| Shares redeemed | (7,916,454 | ) | (384,188,677 | ) | (1,507,893 | ) | (13,686,260 | ) | ||||
| Net increase (decrease) | (340,638 | ) | $ | (19,154,003 | ) | (981,079 | ) | $ | (8,777,929 | ) | ||
| Class B Shares: | ||||||||||||
| Year ended April 30, 2013a | ||||||||||||
| Shares sold | 1,058 | $ | 45,598 | |||||||||
| Shares issued in reinvestment of | ||||||||||||
| distributions | 1,671 | 69,863 | ||||||||||
| Shares redeemed | (186,921 | ) | (8,047,285 | ) | ||||||||
| Net increase (decrease) | (184,192 | ) | $ | (7,931,824 | ) | |||||||
118 | Annual Report
| Franklin Strategic Series | |||||||||||
| Notes to Financial Statements (continued) | |||||||||||
| 2. SHARES OF BENEFICIAL INTEREST (continued) | |||||||||||
| Franklin | Franklin Focused | ||||||||||
| Flex Cap Growth Fund | Core Equity Fund | ||||||||||
| Shares | Amount | Shares | Amount | ||||||||
| Class C Shares: | |||||||||||
| Year ended April 30, 2014 | |||||||||||
| Shares sold | 893,299 | $ | 44,126,041 | 351,843 | $ | 4,174,110 | |||||
| Shares issued in reinvestment of | |||||||||||
| distributions | 1,140,917 | 52,995,741 | 5,240 | 62,354 | |||||||
| Shares redeemed | (1,121,933 | ) | (55,191,231 | ) | (85,283 | ) | (1,033,469 | ) | |||
| Net increase (decrease) | 912,283 | $ | 41,930,551 | 271,800 | $ | 3,202,995 | |||||
| Year ended April 30, 2013 | |||||||||||
| Shares sold | 754,297 | $ | 32,844,637 | 63,732 | $ | 579,665 | |||||
| Shares issued in reinvestment of | |||||||||||
| distributions | 245,647 | 10,290,135 | 1,895 | 17,413 | |||||||
| Shares redeemed | (1,479,890 | ) | (64,492,020 | ) | (175,614 | ) | (1,597,135 | ) | |||
| Net increase (decrease) | (479,946 | ) | $ | (21,357,248 | ) | (109,987 | ) | $ | (1,000,057 | ) | |
| Class R Shares: | |||||||||||
| Year ended April 30, 2014 | |||||||||||
| Shares sold | 165,427 | $ | 9,014,678 | 1,978 | $ | 24,090 | |||||
| Shares issued in reinvestment of | |||||||||||
| distributions | 178,238 | 9,181,050 | 125 | 1,519 | |||||||
| Shares redeemed | (530,379 | ) | (28,407,321 | ) | (5 | ) | (65 | ) | |||
| Net increase (decrease) | (186,714 | ) | $ | (10,211,593 | ) | 2,098 | $ | 25,544 | |||
| Year ended April 30, 2013 | |||||||||||
| Shares sold | 227,103 | $ | 10,756,576 | 2,918 | $ | 28,010 | |||||
| Shares issued in reinvestment of | |||||||||||
| distributions | 48,092 | 2,188,657 | 40 | 372 | |||||||
| Shares redeemed | (538,294 | ) | (25,519,944 | ) | (21 | ) | (184 | ) | |||
| Net increase (decrease) | (263,099 | ) | $ | (12,574,711 | ) | 2,937 | $ | 28,198 | |||
| Class R6 Shares: | |||||||||||
| Year ended April 30, 2014b | |||||||||||
| Shares soldc | 6,538,546 | $ | 339,702,428 | 1,049 | $ | 12,502 | |||||
| Shares issued on reinvestment of | |||||||||||
| distributions | 910,764 | 49,991,855 | — | — | |||||||
| Shares redeemed | (668,994 | ) | (38,316,580 | ) | — | — | |||||
| Net increase (decrease) | 6,780,316 | $ | 351,377,703 | 1,049 | $ | 12,502 | |||||
Annual Report | 119
| Franklin Strategic Series | |||||||||||||
| Notes to Financial Statements (continued) | |||||||||||||
| 2. SHARES OF BENEFICIAL INTEREST (continued) | |||||||||||||
| Franklin | Franklin Focused | ||||||||||||
| Flex Cap Growth Fund | Core Equity Fund | ||||||||||||
| Shares | Amount | Shares | Amount | ||||||||||
| Advisor Class Shares: | |||||||||||||
| Year ended April 30, 2014 | |||||||||||||
| Shares sold | 1,105,318 | $ | 63,767,861 | 151,580 | $ | 1,862,457 | |||||||
| Shares issued in reinvestment of | |||||||||||||
| distributions | 941,204 | 51,568,568 | 7,778 | 95,825 | |||||||||
| Shares redeemedb | (12,088,944 | ) | (672,980,229 | ) | (47,289 | ) | (577,132 | ) | |||||
| Net increase (decrease) | (10,042,422 | ) | $ | (557,643,800 | ) | 112,069 | $ | 1,381,150 | |||||
| Year ended April 30, 2013 | |||||||||||||
| Shares sold | 1,683,784 | $ | 83,003,307 | 285,268 | $ | 2,709,150 | |||||||
| Shares issued in reinvestment of | |||||||||||||
| distributions | 613,738 | 29,299,870 | 2,188 | 20,718 | |||||||||
| Shares redeemed | (8,612,189 | ) | (421,723,100 | ) | (216,573 | ) | (1,902,783 | ) | |||||
| Net increase (decrease) | (6,314,667 | ) | $ | (309,419,923 | ) | 70,883 | $ | 827,085 | |||||
| Franklin Growth | Franklin | ||||||||||||
| Opportunities Fund | Small Cap Growth Fund | ||||||||||||
| Shares | Amount | Shares | Amount | ||||||||||
| Class A Shares: | |||||||||||||
| Year ended April 30, 2014 | |||||||||||||
| Shares sold | 5,335,483 | $ | 149,644,541 | 32,871,636 | $ | 580,436,703 | |||||||
| Shares issued in reinvestment of | |||||||||||||
| distributions | 259,497 | 7,351,542 | 1,287,541 | 22,969,714 | |||||||||
| Shares redeemed | (2,121,489 | ) | (59,172,567 | ) | (10,393,514 | ) | (184,659,664 | ) | |||||
| Net increase (decrease) | 3,473,491 | $ | 97,823,516 | 23,765,663 | $ | 418,746,753 | |||||||
| Year ended April 30, 2013 | |||||||||||||
| Shares sold | 2,034,008 | $ | 45,284,699 | 8,580,844 | $ | 116,114,487 | |||||||
| Shares issued in reinvestment of | |||||||||||||
| distributions | 204,804 | 4,405,319 | 527,904 | 6,498,498 | |||||||||
| Shares redeemed | (2,541,886 | ) | (55,978,845 | ) | (5,148,606 | ) | (65,537,509 | ) | |||||
| Net increase (decrease) | (303,074 | ) | $ | (6,288,827 | ) | 3,960,142 | $ | 57,075,476 | |||||
| Class B Shares: | |||||||||||||
| Year ended April 30, 2013a | |||||||||||||
| Shares sold | 305 | $ | 6,881 | 8,145 | $ | 93,755 | |||||||
| Shares issued in reinvestment of | |||||||||||||
| distributions | 541 | 10,556 | 915 | 10,047 | |||||||||
| Shares redeemed | (61,518 | ) | (1,221,308 | ) | (113,083 | ) | (1,285,990 | ) | |||||
| Net increase (decrease) | (60,672 | ) | $ | (1,203,871 | ) | (104,023 | ) | $ | (1,182,188 | ) | |||
120 | Annual Report
| Franklin Strategic Series | ||||||||||||
| Notes to Financial Statements (continued) | ||||||||||||
| 2. SHARES OF BENEFICIAL INTEREST (continued) | ||||||||||||
| Franklin Growth | Franklin | |||||||||||
| Opportunities Fund | Small Cap Growth Fund | |||||||||||
| Shares | Amount | Shares | Amount | |||||||||
| Class C Shares: | ||||||||||||
| Year ended April 30, 2014 | ||||||||||||
| Shares sold | 1,424,840 | $ | 35,757,550 | 6,739,782 | $ | 105,854,080 | ||||||
| Shares issued in reinvestment of | ||||||||||||
| distributions | 78,027 | 1,977,203 | 347,196 | 5,468,331 | ||||||||
| Shares redeemed | (485,128 | ) | (12,026,066 | ) | (1,517,438 | ) | (23,740,085 | ) | ||||
| Net increase (decrease) | 1,017,739 | $ | 25,708,687 | 5,569,540 | $ | 87,582,326 | ||||||
| Year ended April 30, 2013 | ||||||||||||
| Shares sold | 539,955 | $ | 10,975,431 | 1,443,135 | $ | 17,053,139 | ||||||
| Shares issued in reinvestment of | ||||||||||||
| distributions | 60,833 | 1,181,984 | 173,172 | 1,903,160 | ||||||||
| Shares redeemed | (646,892 | ) | (12,950,641 | ) | (1,314,987 | ) | (15,115,660 | ) | ||||
| Net increase (decrease) | (46,104 | ) | $ | (793,226 | ) | 301,320 | $ | 3,840,639 | ||||
| Class R Shares: | ||||||||||||
| Year ended April 30, 2014 | ||||||||||||
| Shares sold | 545,166 | $ | 14,740,941 | 2,300,867 | $ | 39,848,549 | ||||||
| Shares issued in reinvestment of | ||||||||||||
| distributions | 40,261 | 1,108,798 | 73,430 | 1,265,928 | ||||||||
| Shares redeemed | (486,471 | ) | (13,037,522 | ) | (604,595 | ) | (10,430,788 | ) | ||||
| Net increase (decrease) | 98,956 | $ | 2,812,217 | 1,769,702 | $ | 30,683,689 | ||||||
| Year ended April 30, 2013 | ||||||||||||
| Shares sold | 421,524 | $ | 9,105,885 | 676,380 | $ | 8,470,505 | ||||||
| Shares issued in reinvestment of | ||||||||||||
| distributions | 37,480 | 785,961 | 29,213 | 348,509 | ||||||||
| Shares redeemed | (507,973 | ) | (10,948,439 | ) | (242,918 | ) | (3,084,369 | ) | ||||
| Net increase (decrease) | (48,969 | ) | $ | (1,056,593 | ) | 462,675 | $ | 5,734,645 | ||||
| Class R6 Shares: | ||||||||||||
| Year ended April 30, 2014b | ||||||||||||
| Shares soldc | 6,199,116 | $ | 165,959,115 | 4,726,169 | $ | 80,264,676 | ||||||
| Shares issued on reinvestment of | ||||||||||||
| distributions | 103,960 | 3,094,887 | 104,015 | 1,954,443 | ||||||||
| Shares redeemed | (270,888 | ) | (8,162,282 | ) | (260,302 | ) | (5,083,508 | ) | ||||
| Net increase (decrease) | 6,032,188 | $ | 160,891,720 | 4,569,882 | $ | 77,135,611 | ||||||
Annual Report | 121
| Franklin Strategic Series | ||||||||||||
| Notes to Financial Statements (continued) | ||||||||||||
| 2. SHARES OF BENEFICIAL INTEREST (continued) | ||||||||||||
| Franklin Growth | Franklin | |||||||||||
| Opportunities Fund | Small Cap Growth Fund | |||||||||||
| Shares | Amount | Shares | Amount | |||||||||
| Advisor Class Shares: | ||||||||||||
| Year ended April 30, 2014 | ||||||||||||
| Shares sold | 6,718,925 | $ | 202,105,098 | 21,984,752 | $ | 414,137,550 | ||||||
| Shares issued in reinvestment of | ||||||||||||
| distributions | 187,091 | 5,564,089 | 373,668 | 7,013,753 | ||||||||
| Shares redeemedb | (6,601,759 | ) | (177,646,244 | ) | (6,203,491 | ) | (112,715,829 | ) | ||||
| Net increase (decrease) | 304,257 | $ | 30,022,943 | 16,154,929 | $ | 308,435,474 | ||||||
| Year ended April 30, 2013 | ||||||||||||
| Shares sold | 1,061,965 | $ | 25,394,126 | 3,532,296 | $ | 51,189,023 | ||||||
| Shares issued in reinvestment of | ||||||||||||
| distributions | 160,621 | 3,612,362 | 84,707 | 1,091,876 | ||||||||
| Shares redeemed | (474,835 | ) | (10,960,376 | ) | (1,148,352 | ) | (15,259,598 | ) | ||||
| Net increase (decrease) | 747,751 | $ | 18,046,112 | 2,468,651 | $ | 37,021,301 | ||||||
| Franklin Small-Mid Cap | ||||||||||||
| Growth Fund | ||||||||||||
| Shares | Amount | |||||||||||
| Class A Shares: | ||||||||||||
| Year ended April 30, 2014 | ||||||||||||
| Shares sold | 8,518,651 | $ | 352,913,687 | |||||||||
| Shares issued in reinvestment of distributions | 7,034,330 | 277,011,793 | ||||||||||
| Shares redeemed | (18,857,338 | ) | (788,563,792 | ) | ||||||||
| Net increase (decrease) | (3,304,357 | ) | $ | (158,638,312 | ) | |||||||
| Year ended April 30, 2013 | ||||||||||||
| Shares sold | 7,696,472 | $ | 276,191,716 | |||||||||
| Shares issued in reinvestment of distributions | 5,177,054 | 173,793,699 | ||||||||||
| Shares redeemed | (15,626,931 | ) | (564,222,075 | ) | ||||||||
| Net increase (decrease) | (2,753,405 | ) | $ | (114,236,660 | ) | |||||||
| Class B Shares: | ||||||||||||
| Year ended April 30, 2013a | ||||||||||||
| Shares sold | 2,137 | $ | 70,578 | |||||||||
| Shares issued in reinvestment of distributions | 2,393 | 72,482 | ||||||||||
| Shares redeemed | (119,379 | ) | (3,889,571 | ) | ||||||||
| Net increase (decrease) | (114,849 | ) | $ | (3,746,511 | ) | |||||||
122 | Annual Report
| Franklin Strategic Series | ||||||
| Notes to Financial Statements (continued) | ||||||
| 2. SHARES OF BENEFICIAL INTEREST (continued) | ||||||
| Franklin Small-Mid Cap | ||||||
| Growth Fund | ||||||
| Shares | Amount | |||||
| Class C Shares: | ||||||
| Year ended April 30, 2014 | ||||||
| Shares sold | 1,311,930 | $ | 46,282,012 | |||
| Shares issued in reinvestment of distributions | 1,665,263 | 54,953,680 | ||||
| Shares redeemed | (1,603,672 | ) | (56,397,779 | ) | ||
| Net increase (decrease) | 1,373,521 | $ | 44,837,913 | |||
| Year ended April 30, 2013 | ||||||
| Shares sold | 916,926 | $ | 28,779,646 | |||
| Shares issued in reinvestment of distributions | 1,081,181 | 31,408,307 | ||||
| Shares redeemed | (2,195,464 | ) | (69,390,747 | ) | ||
| Net increase (decrease) | (197,357 | ) | $ | (9,202,794 | ) | |
| Class R Shares: | ||||||
| Year ended April 30, 2014 | ||||||
| Shares sold | 827,089 | $ | 33,172,661 | |||
| Shares issued in reinvestment of distributions | 273,999 | 10,316,051 | ||||
| Shares redeemed | (661,910 | ) | (26,130,400 | ) | ||
| Net increase (decrease) | 439,178 | $ | 17,358,312 | |||
| Year ended April 30, 2013 | ||||||
| Shares sold | 723,580 | $ | 25,355,379 | |||
| Shares issued in reinvestment of distributions | 182,327 | 5,901,923 | ||||
| Shares redeemed | (854,742 | ) | (29,892,942 | ) | ||
| Net increase (decrease) | 51,165 | $ | 1,364,360 | |||
| Class R6 Shares: | ||||||
| Year ended April 30, 2014b | ||||||
| Shares sold | 3,770,614 | $ | 161,755,908 | |||
| Shares issued on reinvestment of distributions | 318,927 | 13,190,824 | ||||
| Shares redeemed | (394,411 | ) | (17,479,787 | ) | ||
| Net increase (decrease) | 3,695,130 | $ | 157,466,945 | |||
| Advisor Class Shares: | ||||||
| Year ended April 30, 2014 | ||||||
| Shares sold | 3,625,676 | $ | 157,249,867 | |||
| Shares issued in reinvestment of distributions | 1,961,538 | 81,031,144 | ||||
| Shares redeemed | (13,258,411 | ) | (581,143,866 | ) | ||
| Net increase (decrease) | (7,671,197 | ) | $ | (342,862,855 | ) | |
| Year ended April 30, 2013 | ||||||
| Shares sold | 4,478,999 | $ | 168,792,553 | |||
| Shares issued in reinvestment of distributions | 1,908,966 | 66,642,021 | ||||
| Shares redeemed | (4,046,317 | ) | (151,391,635 | ) | ||
| Net increase (decrease) | 2,341,648 | $ | 84,042,939 | |||
aEffective March 22, 2013, all Class B shares were converted to Class A.
bFor the year May 1, 2013 (effective date) to April 30, 2014.
cEffective May 1, 2013, a portion of Advisor Class shares were exchanged into R6 for the Franklin Flex Cap Growth Fund, Franklin Growth Opportunities Fund, and Franklin Small Cap Growth Fund.
Annual Report | 123
Franklin Strategic Series
Notes to Financial Statements (continued)
3. TRANSACTIONS WITH AFFILIATES
Franklin Resources, Inc. is the holding company for various subsidiaries that together are referred to as Franklin Templeton Investments. Certain officers and trustees of the Trust are also officers and/or directors of the following subsidiaries:
| Subsidiary | Affiliation |
| Franklin Advisers, Inc. (Advisers) | Investment manager |
| Franklin Templeton Services, LLC (FT Services) | Administrative manager |
| Franklin Templeton Distributors, Inc. (Distributors) | Principal underwriter |
| Franklin Templeton Investor Services, LLC (Investor Services) | Transfer agent |
a. Management Fees
The Franklin Flex Cap Growth Fund and the Franklin Small-Mid Cap Growth Fund pay an investment management fee to Advisers based on the average daily net assets of each of the funds as follows:
| Annualized Fee Rate | Net Assets | |
| 0.625 | % | Up to and including $100 million |
| 0.500 | % | Over $100 million, up to and including $250 million |
| 0.450 | % | Over $250 million, up to and including $7.5 billion |
| 0.440 | % | Over $7.5 billion, up to and including $10 billion |
| 0.430 | % | Over $10 billion, up to and including $12.5 billion |
| 0.420 | % | Over $12.5 billion, up to and including $15 billion |
| 0.400 | % | In excess of $15 billion |
The Franklin Focused Core Equity Fund pays an investment management fee to Advisers based on the average daily net assets of the fund as follows:
| Annualized Fee Rate | Net Assets | |
| 0.950 | % | Up to and including $500 million |
| 0.850 | % | Over $500 million, up to and including $1 billion |
| 0.800 | % | Over $1 billion, up to and including $1.5 billion |
| 0.750 | % | Over $1.5 billion, up to and including $6.5 billion |
| 0.725 | % | Over $6.5 billion, up to and including $11.5 billion |
| 0.700 | % | Over $11.5 billion, up to and including $16.5 billion |
| 0.690 | % | Over $16.5 billion, up to and including $19 billion |
| 0.680 | % | Over $19 billion, up to and including $21.5 billion |
| 0.670 | % | In excess of $21.5 billion |
Effective May 1, 2013, the Franklin Focused Core Equity Fund combined its investment management and administration agreements as approved by the Board. The fees paid under the combined agreement do not exceed the aggregate fees that were paid under the separate agreements.
124 | Annual Report
Franklin Strategic Series
Notes to Financial Statements (continued)
| 3. | TRANSACTIONS WITH AFFILIATES (continued) |
| a. | Management Fees (continued) |
Prior to May 1, 2013, the Franklin Focused Core Equity Fund paid fees to Advisers based on the average daily net assets of the fund as follows:
| Annualized Fee Rate | Net Assets | |
| 0.750 | % | Up to and including $500 million |
| 0.650 | % | Over $500 million, up to and including $1 billion |
| 0.600 | % | Over $1 billion, up to and including $1.5 billion |
| 0.550 | % | Over $1.5 billion, up to and including $6.5 billion |
| 0.525 | % | Over $6.5 billion, up to and including $11.5 billion |
| 0.500 | % | Over $11.5 billion, up to and including $16.5 billion |
| 0.490 | % | Over $16.5 billion, up to and including $19 billion |
| 0.480 | % | Over $19 billion, up to and including $21.5 billion |
| 0.470 | % | In excess of $21.5 billion |
The Franklin Growth Opportunities Fund pays an investment management fee to Advisers based on the average daily net assets of the fund as follows:
| Annualized Fee Rate | Net Assets | |
| 0.700 | % | Up to and including $500 million |
| 0.600 | % | Over $500 million, up to and including $1 billion |
| 0.550 | % | Over $1 billion, up to and including $1.5 billion |
| 0.500 | % | Over $1.5 billion, up to and including $6.5 billion |
| 0.475 | % | Over $6.5 billion, up to and including $11.5 billion |
| 0.450 | % | Over $11.5 billion, up to and including $16.5 billion |
| 0.440 | % | Over $16.5 billion, up to and including $19 billion |
| 0.430 | % | Over $19 billion, up to and including $21.5 billion |
| 0.420 | % | In excess of $21.5 billion |
Effective May 1, 2013, the Franklin Growth Opportunities Fund combined its investment management and administration agreements as approved by the Board. The fees paid under the combined agreement do not exceed the aggregate fees that were paid under the separate agreements.
Prior to May 1, 2013, the Franklin Growth Opportunities Fund paid fees to Advisers based on the average daily net assets of the fund as follows:
| Annualized Fee Rate | Net Assets | |
| 0.500 | % | Up to and including $500 million |
| 0.400 | % | Over $500 million, up to and including $1 billion |
| 0.350 | % | Over $1 billion, up to and including $1.5 billion |
| 0.300 | % | Over $1.5 billion, up to and including $6.5 billion |
| 0.275 | % | Over $6.5 billion, up to and including $11.5 billion |
| 0.250 | % | Over $11.5 billion, up to and including $16.5 billion |
| 0.240 | % | Over $16.5 billion, up to and including $19 billion |
| 0.230 | % | Over $19 billion, up to and including $21.5 billion |
| 0.220 | % | In excess of $21.5 billion |
Annual Report | 125
Franklin Strategic Series
Notes to Financial Statements (continued)
| 3. | TRANSACTIONS WITH AFFILIATES (continued) |
| a. | Management Fees (continued) |
The Franklin Small Cap Growth Fund pays an investment management fee to Advisers based on the average daily net assets of the fund as follows:
| Annualized Fee Rate | Net Assets | |
| 0.750 | % | Up to and including $500 million |
| 0.650 | % | Over $500 million, up to and including $1 billion |
| 0.600 | % | Over $1 billion, up to and including $1.5 billion |
| 0.550 | % | Over $1.5 billion, up to and including $6.5 billion |
| 0.525 | % | Over $6.5 billion, up to and including $11.5 billion |
| 0.500 | % | Over $11.5 billion, up to and including $16.5 billion |
| 0.490 | % | Over $16.5 billion, up to and including $19 billion |
| 0.480 | % | Over $19 billion, up to and including $21.5 billion |
| 0.470 | % | In excess of $21.5 billion |
Effective May 1, 2013, the Franklin Small Cap Growth Fund combined its investment management and administration agreements as approved by the Board. The fees paid under the combined agreement do not exceed the aggregate fees that were paid under the separate agreements.
Prior to May 1, 2013, the Franklin Small Cap Growth Fund paid fees to Advisers based on the average daily net assets of the fund as follows:
| Annualized Fee Rate | Net Assets | |
| 0.550 | % | Up to and including $500 million |
| 0.450 | % | Over $500 million, up to and including $1 billion |
| 0.400 | % | Over $1 billion, up to and including $1.5 billion |
| 0.350 | % | Over $1.5 billion, up to and including $6.5 billion |
| 0.325 | % | Over $6.5 billion, up to and including $11.5 billion |
| 0.300 | % | Over $11.5 billion, up to and including $16.5 billion |
| 0.290 | % | Over $16.5 billion, up to and including $19 billion |
| 0.280 | % | Over $19 billion, up to and including $21.5 billion |
| 0.270 | % | In excess of $21.5 billion |
b. Administrative Fees
Under an agreement with Advisers, FT Services provides administrative services to the Funds. The fee is paid by Advisers based on the Funds’ average daily net assets, and is not an additional expense of the Funds.
Prior to May 1, 2013, before the combining of the investment management and administrative agreements as approved by the Board, the Franklin Focused Core Equity Fund, the Franklin Growth Opportunities Fund and the Franklin Small Cap Growth Fund paid administrative fees to FT Services of 0.20% per year of their average daily net assets.
126 | Annual Report
Franklin Strategic Series
Notes to Financial Statements (continued)
| 3. | TRANSACTIONS WITH AFFILIATES (continued) |
| c. | Distribution Fees |
The Board has adopted distribution plans for each share class, with the exception of Class R6 and Advisor Class shares, pursuant to Rule 12b-1 under the 1940 Act. Distribution fees are not charged on shares held by affiliates. Under the Funds’ Class A reimbursement distribution plans, the Funds reimburse Distributors for costs incurred in connection with the servicing, sale and distribution of each fund’s shares up to the maximum annual plan rate. Under the Class A reimbursement distribution plans, costs exceeding the maximum for the current plan year cannot be reimbursed in subsequent periods. In addition, under the Funds’ Class C and R compensation distribution plans, the Funds pay Distributors for costs incurred in connection with the servicing, sale and distribution of each fund’s shares up to the maximum annual plan rate for each class. The plan year, for purposes of monitoring compliance with the maximum annual plan rates, is February 1 through January 31 for each fund.
The maximum annual plan rates, based on the average daily net assets, for each class, are as follows:
| Franklin | ||||||||||
| Franklin | Franklin | Growth | Franklin | Franklin | ||||||
| Flex Cap | Focused Core | Opportunities | Small Cap | Small-Mid Cap | ||||||
| Growth Fund | Equity Fund | Fund | Growth Fund | Growth Fund | ||||||
| Reimbursement Plans: | ||||||||||
| Class A | 0.25 | % | 0.35 | % | 0.35 | % | 0.35 | % | 0.25 | % |
| Compensation Plans: | ||||||||||
| Class C | 1.00 | % | 1.00 | % | 1.00 | % | 1.00 | % | 1.00 | % |
| Class R | 0.50 | % | 0.50 | % | 0.50 | % | 0.50 | % | 0.50 | % |
The Board has set the current rate at 0.30% per year for Class A shares for the Franklin Focused Core Equity Fund, the Franklin Growth Opportunities Fund and the Franklin Small Cap Growth Fund until further notice and approval by the Board.
d. Sales Charges/Underwriting Agreements
Front-end sales charges and contingent deferred sales charges (CDSC) do not represent expenses of the Funds. These charges are deducted from the proceeds of sales of fund shares prior to investment or from redemption proceeds prior to remittance, as applicable. Distributors has advised the Funds of the following commission transactions related to the sales and redemptions of the Funds’ shares for the year:
| Franklin | ||||||
| Franklin | Franklin | Growth | ||||
| Flex Cap | Focused Core | Opportunities | ||||
| Growth Fund | Equity Fund | Fund | ||||
| Sales charges retained net of commissions paid to unaffiliated | ||||||
| broker/dealers | $ | 1,009,441 | $ | 38,177 | $ | 344,939 |
| CDSC retained | $ | 19,079 | $ | 2,796 | $ | 13,100 |
Annual Report | 127
Franklin Strategic Series
Notes to Financial Statements (continued)
| 3. | TRANSACTIONS WITH AFFILIATES (continued) |
| d. | Sales Charges/Underwriting Agreements (continued) |
| Franklin | Franklin | |||
| Small Cap | Small-Mid Cap | |||
| Growth Fund | Growth Fund | |||
| Sales charges retained net of commissions paid to unaffiliated | ||||
| broker/dealers | $ | 612,378 | $ | 455,624 |
| CDSC retained | $ | 34,512 | $ | 17,441 |
e. Transfer Agent Fees
Each class of shares, except for Class R6, pays transfer agent fees to Investor Services for its performance of shareholder servicing obligations and reimburses Investor Services for out of pocket expenses incurred, including shareholding servicing fees paid to third parties. These fees are allocated daily based upon their relative proportion of such classes’ aggregate net assets. Class R6 pays Investor Services transfer agent fees specific to that class.
For the year ended April 30, 2014, the Funds paid transfer agent fees as noted in the Statements of Operations of which the following amounts were retained by Investor Services:
| Franklin | |||||||||
| Franklin | Franklin | Growth | Franklin | Franklin | |||||
| Flex Cap | Focused Core | Opportunities | Small Cap | Small-Mid Cap | |||||
| Growth Fund | Equity Fund | Fund | Growth Fund | Growth Fund | |||||
| Transfer agent fees | $ | 3,898,310 | $ | 32,231 | $525,505 | $ | 727,333 | $ | 4,366,608 |
| f. Investment in Institutional Fiduciary Trust Money Market Portfolio | |||||||||
The Funds invest in the Institutional Fiduciary Trust Money Market Portfolio (Sweep Money Fund), an affiliated open-end management investment company. Management fees paid by the Funds are waived on assets invested in the Sweep Money Fund, in an amount not to exceed the management and administrative fees paid directly or indirectly by the Sweep Money Fund, as noted on the Statements of Operations. Prior to May 1, 2013, the waiver was accounted for as a reduction to management fees.
g. Waiver and Expense Reimbursements
Advisers and Investor Services have contractually agreed in advance to waive or limit their respective fees and to assume as their own expense certain expenses otherwise payable by the Franklin Focused Core Equity Fund so that the expenses (excluding distribution fees, and acquired fund fees and expenses) for Class A, Class C, Class R and Advisor Class of the fund do not exceed 1.00%, and Class R6 does not exceed 0.80% based on the average net assets of each class (other than certain non-routine expenses or costs, including those relating to litigation, indemnification, reorganizations, and liquidations) until August 31, 2014. Prior to August 31, 2013, expenses
128 | Annual Report
Franklin Strategic Series
Notes to Financial Statements (continued)
| 3. | TRANSACTIONS WITH AFFILIATES (continued) |
| g. | Waiver and Expense Reimbursements (continued) |
were limited to 0.89% for Class A, Class C, Class R and Advisor Class and 0.68% for Class R6. Prior to the combining of the investment management and administrative agreements, the fund had a contractual fee agreement with FT Services, which was eliminated effective May 1, 2013.
Additionally, Investor Services has contractually agreed in advance to waive or limit its fees so that the Class R6 transfer agent fees for the Funds, except for the Franklin Focused Core Equity Fund, do not exceed 0.01% until August 31, 2014. There were no Class R6 transfer agent fees waived during the year ended April 30, 2014.
h. Other Affiliated Transactions
At April 30, 2014, one or more of the funds in the Franklin Allocator Series owned a percentage of the following funds’ outstanding shares:
| Franklin | Franklin Growth | Franklin | |||
| Flex Cap | Opportunities | Small Cap | |||
| Growth Fund | Fund | Growth Fund | |||
| 10.61 | % | 13.85 | % | 2.12 | % |
4. EXPENSE OFFSET ARRANGEMENT
The Funds have entered into an arrangement with their custodian whereby credits realized as a result of uninvested cash balances are used to reduce a portion of the Funds’ custodian expenses. During the year ended April 30, 2014, the custodian fees were reduced as noted in the Statements of Operations.
5. INCOME TAXES
For tax purposes, capital losses may be carried over to offset future capital gains. Capital loss carryforwards with no expiration, if any, must be fully utilized before those losses with expiration dates.
During the year ended April 30, 2014, the Franklin Focused Core Equity Fund utilized $1,592,509 of capital loss carryforwards.
For tax purposes, the Funds may elect to defer any portion of a late-year ordinary loss to the first day of the following fiscal year. At April 30, 2014, the Franklin Growth Opportunities Fund deferred late-year ordinary losses of $1,886,845.
Annual Report | 129
Franklin Strategic Series
Notes to Financial Statements (continued)
5. INCOME TAXES (continued)
The tax character of distributions paid during the years ended April 30, 2014 and 2013, was as follows:
| Franklin | Franklin | |||||||||
| Flex Cap | Focused Core | |||||||||
| Growth Fund | Equity Fund | |||||||||
| 2014 | 2013 | 2014 | 2013 | |||||||
| Distributions paid from: | ||||||||||
| Ordinary income | $ | 30,002,450 | $ | 1,908,157 | $ | 243,749 | $ | 166,429 | ||
| Long term capital gain | 438,269,645 | 106,157,882 | 455,558 | — | ||||||
| $ | 468,272,095 | $ | 108,066,039 | $ | 699,307 | $ | 166,429 | |||
| Franklin Growth | Franklin | |||||||||
| Opportunities | Small Cap | |||||||||
| Fund | Growth Fund | |||||||||
| 2014 | 2013 | 2014 | 2013 | |||||||
| Distributions paid from: | ||||||||||
| Ordinary income | $ | — | $ | — | $ | 9,609,487 | $ | — | ||
| Long term capital gain | 19,641,459 | 10,354,784 | 32,430,474 | 10,580,254 | ||||||
| $ | 19,641,459 | $ | 10,354,784 | $ | 42,039,961 | $ | 10,580,254 | |||
| Franklin | ||||||||||
| Small-Mid Cap | ||||||||||
| Growth Fund | ||||||||||
| 2014 | 2013 | |||||||||
| Distributions paid from: | ||||||||||
| Ordinary income | $ | 48,006,745 | $ | — | ||||||
| Long term capital gain | 431,481,929 | 318,730,852 | ||||||||
| $ | 479,488,674 | $ | 318,730,852 | |||||||
At April 30, 2014, the cost of investments, net unrealized appreciation (depreciation), undistributed ordinary income and undistributed long term capital gains for income tax purposes were as follows:
| Franklin | |||||||||
| Franklin | Franklin | Growth | |||||||
| Flex Cap | Focused Core | Opportunities | |||||||
| Growth Fund | Equity Fund | Fund | |||||||
| Cost of investments | $ | 2,212,312,898 | $ | 42,834,275 | $ | 687,061,519 | |||
| Unrealized appreciation | $ | 1,185,388,257 | $ | 11,890,357 | $ | 225,450,449 | |||
| Unrealized depreciation | (48,793,525 | ) | (57,367 | ) | (11,869,722 | ) | |||
| Net unrealized appreciation (depreciation) | $ | 1,136,594,732 | $ | 11,832,990 | $ | 213,580,727 | |||
| Undistributed ordinary income | $ | 47,149,148 | $ | 13,720 | $ | — | |||
| Undistributed long term capital gains | 281,063,721 | 990,964 | 13,544,981 | ||||||
| Distributable earnings | $ | 328,212,869 | $ | 1,004,684 | $ | 13,544,981 | |||
130 | Annual Report
| Franklin Strategic Series | |||||||
| Notes to Financial Statements (continued) | |||||||
| 5. INCOME TAXES (continued) | |||||||
| Franklin | Franklin | ||||||
| Small Cap | Small-Mid Cap | ||||||
| Growth Fund | Growth Fund | ||||||
| Cost of investments | $ | 1,449,560,901 | $ | 2,453,368,462 | |||
| Unrealized appreciation | $ | 262,416,959 | $ | 1,310,199,551 | |||
| Unrealized depreciation | (58,228,039 | ) | (61,911,712 | ) | |||
| Net unrealized appreciation (depreciation) | $ | 204,188,920 | $ | 1,248,287,839 | |||
| Undistributed ordinary income | $ | 35,099,529 | $ | 47,465,812 | |||
| Undistributed long term capital gains | 41,941,846 | 292,674,846 | |||||
| Distributable earnings | $ | 77,041,375 | $ | 340,140,658 | |||
Differences between income and/or capital gains as determined on a book basis and a tax basis are primarily due to differing treatments of current year late-year ordinary loss deferral and wash sales.
6. INVESTMENT TRANSACTIONS
Purchases and sales of investments (excluding short term securities) for the year ended April 30, 2014, were as follows:
| Franklin | ||||||||||
| Franklin | Franklin | Growth | Franklin | Franklin | ||||||
| Flex Cap | Focused Core | Opportunities | Small Cap | Small-Mid Cap | ||||||
| Growth Fund | Equity Fund | Fund | Growth Fund | Growth Fund | ||||||
| Purchases | $ | 1,366,857,157 | $ | 34,131,707 | $ | 539,925,864 | $ | 1,207,476,469 | $ | 1,517,344,422 |
| Sales | $ | 1,999,036,640 | $ | 16,576,635 | $ | 247,841,168 | $ | 403,568,746 | $ | 2,207,759,329 |
7. RESTRICTED SECURITIES
Certain funds invest in securities that are restricted under the Securities Act of 1933 (1933 Act) or which are subject to legal, contractual, or other agreed upon restrictions on resale. Restricted securities are often purchased in private placement transactions, and cannot be sold without prior registration unless the sale is pursuant to an exemption under the 1933 Act. Disposal of these securities may require greater effort and expense, and prompt sale at an acceptable price may be difficult. The funds may have registration rights for restricted securities. The issuer generally incurs all registration costs.
Annual Report | 131
Franklin Strategic Series
Notes to Financial Statements (continued)
7. RESTRICTED SECURITIES (continued)
At April 30, 2014, the Franklin Flex Cap Growth Fund held investments in restricted securities, excluding certain securities exempt from registration under the 1933 Act deemed to be liquid, as follows:
| Acquisition | ||||||
| Shares | Issuer | Date | Cost | Value | ||
| Franklin Flex Cap Growth Fund | ||||||
| 2,227,171 FibroGen Inc., pfd., E | ||||||
| (Value is 0.38% of Net Assets) | 5/19/00 | $ | 9,999,998 | $ | 12,605,788 | |
8. HOLDINGS OF 5% VOTING SECURITIES OF PORTFOLIO COMPANIES
The 1940 Act defines “affiliated companies” to include investments in portfolio companies in which a fund owns 5% or more of the outstanding voting securities. Investments in “affiliated companies” for the Franklin Small-Mid Cap Growth Fund for the year ended April 30, 2014, were as shown below.
| Number of | Number of | ||||||||||
| Shares/ | Shares/ | Value | Realized | ||||||||
| Warrants Held | Warrants Held | at End | Capital | ||||||||
| at Beginning | Gross | Gross | at End | of | Investment | Gain | |||||
| Name of Issuer | of Year | Additions | Reductions | of Year | Year | Income | (Loss) | ||||
| Franklin Small-Mid Cap | |||||||||||
| Growth Fund | |||||||||||
| Non-Controlled Affiliates | |||||||||||
| Stereotaxis Inc | 265,000 | 1,031,152 | 1,296,152 | — | $ | — | $ | — | $ | (15,325,330 | ) |
| Stereotaxis Inc., 144A | 515,576 | — | 515,576 | — | — | — | (1,732,851 | ) | |||
| Stereotaxis Inc., wts., 144A, | |||||||||||
| 5/07/18 | 515,576 | — | 515,576 | — | — | — | — | ||||
| Total Affiliated Securities (Value is 0.00% of Net Assets) | $ | — | $ | — | $ | (17,058,181 | ) | ||||
9. CREDIT FACILITY
The Funds, together with other U.S. registered and foreign investment funds (collectively, Borrowers), managed by Franklin Templeton Investments, are borrowers in a joint syndicated senior unsecured credit facility totaling $1.5 billion (Global Credit Facility) which matures on February 13, 2015. This Global Credit Facility provides a source of funds to the Borrowers for temporary and emergency purposes, including the ability to meet future unanticipated or unusually large redemption requests.
Under the terms of the Global Credit Facility, the Funds shall, in addition to interest charged on any borrowings made by the Funds and other costs incurred by the Funds, pay their share of fees and expenses incurred in connection with the implementation and maintenance of the Global
132 | Annual Report
Franklin Strategic Series
Notes to Financial Statements (continued)
9. CREDIT FACILITY (continued)
Credit Facility, based upon their relative share of the aggregate net assets of all of the Borrowers, including an annual commitment fee of 0.07% based upon the unused portion of the Global Credit Facility. These fees are reflected in other expenses on the Statements of Operations. During the year ended April 30, 2014, the Funds did not use the Global Credit Facility.
10. FAIR VALUE MEASUREMENTS
The Trust follows a fair value hierarchy that distinguishes between market data obtained from independent sources (observable inputs) and the Trust’s own market assumptions (unobservable inputs). These inputs are used in determining the value of the Funds’ financial instruments and are summarized in the following fair value hierarchy:
- Level 1 – quoted prices in active markets for identical financial instruments
- Level 2 – other significant observable inputs (including quoted prices for similar financial instruments, interest rates, prepayment speed, credit risk, etc.)
- Level 3 – significant unobservable inputs (including the Funds’ own assumptions in determining the fair value of financial instruments)
The input levels are not necessarily an indication of the risk or liquidity associated with financial instruments at that level.
For movements between the levels within the fair value hierarchy, the Funds have adopted a policy of recognizing the transfers as of the date of the underlying event which caused the movement.
A summary of inputs used as of April 30, 2014, in valuing the Funds’ assets carried at fair value, is as follows:
| Level 1 | Level 2 | Level 3 | Total | |||||
| Franklin Flex Cap Growth Fund | ||||||||
| Assets: | ||||||||
| Investments in Securities: | ||||||||
| Equity Investments:a | ||||||||
| Pharmaceuticals, Biotechnology | ||||||||
| & Life Sciences. | $ | 332,649,511 | $ | — | $ | 12,605,788 | $ | 345,255,299 |
| Other Equity Investmentsb | 2,905,216,368 | — | — | 2,905,216,368 | ||||
| Short Term Investments | 37,937,180 | 60,498,783 | — | 98,435,963 | ||||
| Total Investments in Securities. | $ | 3,275,803,059 | $ | 60,498,783 | $ | 12,605,788 | $ | 3,348,907,630 |
| Franklin Focused Core Equity Fund | ||||||||
| Assets: | ||||||||
| Investments in Securities: | ||||||||
| Equity Investmentsb | $ | 51,796,767 | $ | — | $ | — | $ | 51,796,767 |
| Short Term Investments | 2,870,498 | — | — | 2,870,498 | ||||
| Total Investments in Securities. | $ | 54,667,265 | $ | — | $ | — | $ | 54,667,265 |
Annual Report | 133
Franklin Strategic Series
Notes to Financial Statements (continued)
| 10. FAIR VALUE MEASUREMENTS (continued) | |||||||||
| Level 1 | Level 2 | Level 3 | Total | ||||||
| Franklin Growth Opportunities Fund | |||||||||
| Assets: | |||||||||
| Investments in Securities: | |||||||||
| Equity Investmentsb | $ | 877,853,172 | $ | — | $ | — | $ | 877,853,172 | |
| Short Term Investments | 10,764,599 | 12,024,475 | — | 22,789,074 | |||||
| Total Investments in Securities. | $ | 888,617,771 | $ | 12,024,475 | $ | — | $ | 900,642,246 | |
| Franklin Small Cap Growth Fund | |||||||||
| Assets: | |||||||||
| Investments in Securities: | |||||||||
| Equity Investmentsb | $ | 1,521,139,426 | $ | — | $ | — | $ | 1,521,139,426 | |
| Short Term Investments | 91,895,995 | 40,714,400 | — | 132,610,395 | |||||
| Total Investments in Securities. | $ | 1,613,035,421 | $ | 40,714,400 | $ | — | $ | 1,653,749,821 | |
| Franklin Small-Mid Cap Growth Fund | |||||||||
| Assets: | |||||||||
| Investments in Securities: | |||||||||
| Equity Investmentsb | $ | 3,612,401,777 | $ | — | $ | — | $ | 3,612,401,777 | |
| Short Term Investments | 61,645,499 | 27,609,025 | — | 89,254,524 | |||||
| Total Investments in Securities. | $ | 3,674,047,276 | $ | 27,609,025 | $ | — | $ | 3,701,656,301 | |
aIncludes common and preferred stocks as well as other equity investments.
bFor detailed categories, see the accompanying Statements of Investments.
A reconciliation of assets in which Level 3 inputs are used in determining fair value is presented when there are significant Level 3 financial instruments at the end of the period.
11. NEW ACCOUNTING PRONOUNCEMENTS
In June 2013, the Financial Accounting Standards Board issued Accounting Standards Update (ASU) No. 2013-08, Investment Companies (Topic 946): Amendments to the Scope, Measurement, and Disclosure Requirements. The ASU modifies the criteria used in defining an investment company under U.S. Generally Accepted Accounting Principles and also sets forth certain measurement and disclosure requirements. Under the ASU, an entity that is registered under the 1940 Act automatically qualifies as an investment company. The ASU is effective for interim and annual reporting periods beginning after December 15, 2013. Management has reviewed the requirements and believes the adoption of this ASU will not have a material impact on the financial statements.
12. SUBSEQUENT EVENTS
The Funds have evaluated subsequent events through the issuance of the financial statements and determined that no events have occurred that require disclosure.
134 | Annual Report
Franklin Strategic Series
Report of Independent Registered Public Accounting Firm
To the Board of Trustees and Shareholders of Franklin Strategic Series
In our opinion, the accompanying statements of assets and liabilities, including the statements of investments, and the related statements of operations and of changes in net assets and the financial highlights present fairly, in all material respects, the financial position of Franklin Flex Cap Growth Fund, Franklin Focused Core Equity Fund, Franklin Growth Opportunities Fund, Franklin Small Cap Growth Fund, and Franklin Small-Mid Cap Growth Fund (separate portfolios of Franklin Strategic Series, hereafter referred to as the “Funds”) at April 30, 2014, the results of each of their operations for the year then ended, the changes in each of their net assets for each of the two years in the period then ended and the financial highlights for each of the periods presented, in conformity with accounting principles generally accepted in the United States of America. These financial statements and financial highlights (hereafter referred to as “financial statements”) are the responsibility of the Funds’ management. Our responsibility is to express an opinion on these financial statements based on our audits. We conducted our audits of these financial statements in accordance with the standards of the Public Company Accounting Oversight Board (United States). Those standards require that we plan and perform the audit to obtain reasonable assurance about whether the financial statements are free of material misstatement. An audit includes examining, on a test basis, evidence supporting the amounts and disclosures in the financial statements, assessing the accounting principles used and significant estimates made by management, and evaluating the overall financial statement presentation.
We believe that our audits, which included confirmation of securities at April 30, 2014 by correspondence with the custodian, transfer agent and brokers, provide a reasonable basis for our opinion.
PricewaterhouseCoopers LLP
San Francisco, California
June 13, 2014
Annual Report | 135
Franklin Strategic Series
Tax Information (unaudited)
Under Section 852(b)(3)(C) of the Internal Revenue Code (Code), the Funds hereby report the maximum amount allowable but no less than the following amounts as long term capital gain dividends for the fiscal year ended April 30, 2014:
| Franklin | Franklin | Franklin Growth | Franklin | Franklin | |||||
| Flex Cap | Focused Core | Opportunities | Small Cap | Small-Mid Cap | |||||
| Growth Fund | Equity Fund | Fund | Growth Fund | Growth Fund | |||||
| $ | 438,269,645 | $ | 455,558 | $ | 19,641,459 | $ | 32,430,474 | $ | 431,481,929 |
Under Section 871(k)(2)(C) of the Code, the Fund hereby reports the maximum amount allowable but no less than the following amounts as a short term capital gain dividend for purposes of the tax imposed under Section 871(a)(1)(A) of the Code for the fiscal year ended April 30, 2014:
| Franklin | Franklin | Franklin | |||
| Flex Cap | Small Cap | Small-Mid Cap | |||
| Growth Fund | Growth Fund | Growth Fund | |||
| $ | 30,002,450 | $ | 9,609,487 | $ | 48,006,745 |
Under Section 854(b)(1)(A) of the Code, the Funds hereby report the following percentage amounts of the ordinary income dividends as income qualifying for the dividends received deduction for the fiscal year ended April 30, 2014:
| Franklin | Franklin | Franklin | Franklin | ||||
| Flex Cap | Focused Core | Small Cap | Small-Mid Cap | ||||
| Growth Fund | Equity Fund | Growth Fund | Growth Fund | ||||
| 69.08 | % | 100.00 | % | 26.18 | % | 31.04 | % |
Under Section 854(b)(1)(B) of the Code, the Funds hereby report the maximum amount allowable but no less than the following amounts as qualified dividends for purposes of the maximum rate under Section 1(h)(11) of the Code for the fiscal year ended April 30, 2014:
| Franklin | Franklin | Franklin Growth | Franklin | Franklin | |||||
| Flex Cap | Focused Core | Opportunities | Small Cap | Small-Mid Cap | |||||
| Growth Fund | Equity Fund | Fund | Growth Fund | Growth Fund | |||||
| $ | 21,688,244 | $ | 589,067 | $ | 3,037,263 | $ | 2,581,808 | $ | 16,542,098 |
Distributions, including qualified dividend income, paid during calendar year 2014 will be reported to shareholders on Form 1099-DIV by mid-February 2015. Shareholders are advised to check with their tax advisors for information on the treatment of these amounts on their individual income tax returns.
136 | Annual Report
Franklin Strategic Series
Board Members and Officers
The name, year of birth and address of the officers and board members, as well as their affiliations, positions held with the Trust, principal occupations during at least the past five years and number of portfolios overseen in the Franklin Templeton Investments fund complex are shown below. Generally, each board member serves until that person’s successor is elected and qualified.
| Independent Board Members | ||||
| Number of Portfolios in | ||||
| Name, Year of Birth | Length of | Fund Complex Overseen | Other Directorships Held | |
| and Address | Position | Time Served | by Board Member* | During at Least the Past 5 Years |
| Harris J. Ashton (1932) | Trustee | Since 1991 | 139 | Bar-S Foods (meat packing company) |
| One Franklin Parkway | (1981-2010). | |||
| San Mateo, CA 94403-1906 | ||||
| Principal Occupation During at Least the Past 5 Years: | ||||
| Director of various companies; and formerly, Director, RBC Holdings, Inc. (bank holding company) (until 2002); and President, Chief Executive | ||||
| Officer and Chairman of the Board, General Host Corporation (nursery and craft centers) (until 1998). | ||||
| Sam Ginn (1937) | Trustee | Since 2007 | 113 | ICO Global Communications |
| One Franklin Parkway | (Holdings) Limited (satellite company) | |||
| San Mateo, CA 94403-1906 | (2006-2010), Chevron Corporation | |||
| (global energy company) (1989-2009), | ||||
| Hewlett-Packard Company (technology | ||||
| company) (1996-2002), Safeway, Inc. | ||||
| (grocery retailer) (1991-1998) and | ||||
| TransAmerica Corporation (insurance | ||||
| company) (1989-1999). | ||||
| Principal Occupation During at Least the Past 5 Years: | ||||
| Private investor; Chairman, First Responder Network Authority (FirstNet) (interoperable wireless broadband network) (2012); and formerly, | ||||
| Chairman of the Board, Vodafone AirTouch, PLC (wireless company) (1999-2000); Chairman of the Board and Chief Executive Officer, | ||||
| AirTouch Communications (cellular communications) (1993-1998) and Pacific Telesis Group (telephone holding company) (1988-1994). | ||||
| Edith E. Holiday (1952) | Trustee | Since 1998 | 139 | Hess Corporation (exploration and |
| One Franklin Parkway | refining of oil and gas), H.J. Heinz | |||
| San Mateo, CA 94403-1906 | Company (processed foods and | |||
| allied products) (1994-2013), RTI | ||||
| International Metals, Inc. (manu- | ||||
| facture and distribution of titanium), | ||||
| Canadian National Railway (railroad) | ||||
| and White Mountains Insurance | ||||
| Group, Ltd. (holding company). | ||||
| Principal Occupation During at Least the Past 5 Years: | ||||
| Director or Trustee of various companies and trusts; and formerly, Assistant to the President of the United States and Secretary of the | ||||
| Cabinet (1990-1993); General Counsel to the United States Treasury Department (1989-1990); and Counselor to the Secretary and Assistant | ||||
| Secretary for Public Affairs and Public Liaison – United States Treasury Department (1988-1989). | ||||
| J. Michael Luttig (1954) | Trustee | Since 2009 | 139 | Boeing Capital Corporation (aircraft |
| One Franklin Parkway | financing) (2006-2013). | |||
| San Mateo, CA 94403-1906 | ||||
| Principal Occupation During at Least the Past 5 Years: | ||||
| Executive Vice President, General Counsel and member of the Executive Council, The Boeing Company (aerospace company); and formerly, | ||||
| Federal Appeals Court Judge, U.S. Court of Appeals for the Fourth Circuit (1991-2006). | ||||
| Annual Report | 137 | ||||
| Number of Portfolios in | ||||
| Name, Year of Birth | Length of | Fund Complex Overseen | Other Directorships Held | |
| and Address | Position | Time Served | by Board Member* | During at Least the Past 5 Years |
| Frank A. Olson (1932) | Trustee | Since 2007 | 139 | Hess Corporation (exploration and |
| One Franklin Parkway | refining of oil and gas) (1998-2013). | |||
| San Mateo, CA 94403-1906 | ||||
| Principal Occupation During at Least the Past 5 Years: | ||||
| Chairman Emeritus, The Hertz Corporation (car rental) (since 2000) (Chairman of the Board (1980-2000) and Chief Executive Officer | ||||
| (1977-1999)); and formerly, Chairman of the Board, President and Chief Executive Officer, UAL Corporation (airlines) (until 1987). | ||||
| Larry D. Thompson (1945) | Trustee | Since 2007 | 139 | Cbeyond, Inc. (business commu- |
| One Franklin Parkway | nications provider) (2010-2012), | |||
| San Mateo, CA 94403-1906 | The Southern Company (energy | |||
| company) (2010-2012) and Graham | ||||
| Holdings Company (formerly, | ||||
| The Washington Post Company) | ||||
| (education and media organization). | ||||
| Principal Occupation During at Least the Past 5 Years: | ||||
| Executive Vice President – Government Affairs, General Counsel and Corporate Secretary, PepsiCo, Inc. (consumer products) (2012-present); | ||||
| and formerly, John A. Sibley Professor of Corporate and Business Law, University of Georgia School of Law (2011-2012); Senior Vice | ||||
| President – Government Affairs, General Counsel and Secretary, PepsiCo, Inc. (2004-2011); Senior Fellow of The Brookings Institution | ||||
| (2003-2004); Visiting Professor, University of Georgia School of Law (2004); and Deputy Attorney General, U.S. Department of Justice | ||||
| (2001-2003). | ||||
| John B. Wilson (1959) | Lead | Trustee since | 113 | None |
| One Franklin Parkway | Independent | 2006 and Lead | ||
| San Mateo, CA 94403-1906 | Trustee | Independent | ||
| Trustee since | ||||
| 2008 | ||||
| Principal Occupation During at Least the Past 5 Years: | ||||
| President, Staples Europe (office supplies) (2012-present); President and Founder, Hyannis Port Capital, Inc. (real estate and private equity | ||||
| investing); serves on private and non-profit boards; and formerly, Chief Operating Officer and Executive Vice President, Gap, Inc. (retail) | ||||
| (1996-2000); Chief Financial Officer and Executive Vice President – Finance and Strategy, Staples, Inc. (1992-1996); Senior Vice President – | ||||
| Corporate Planning, Northwest Airlines, Inc. (airlines) (1990-1992); and Vice President and Partner, Bain & Company (consulting firm) | ||||
| (1986-1990). | ||||
| Interested Board Members and Officers | ||||
| Number of Portfolios in | ||||
| Name, Year of Birth | Length of | Fund Complex Overseen | Other Directorships Held | |
| and Address | Position | Time Served | by Board Member* | During at Least the Past 5 Years |
| **Gregory E. Johnson (1961) | Trustee | Since June 2013 | 149 | None |
| One Franklin Parkway | ||||
| San Mateo, CA 94403-1906 | ||||
| Principal Occupation During at Least the Past 5 Years: | ||||
| Chairman of the Board, Member – Office of the Chairman, Director, President and Chief Executive Officer, Franklin Resources, Inc.; officer | ||||
| and/or director or trustee, as the case may be, of some of the other subsidiaries of Franklin Resources, Inc. and of 44 of the investment | ||||
| companies in Franklin Templeton Investments; and Chairman, Investment Company Institute. | ||||
138 | Annual Report
| Number of Portfolios in | ||||
| Name, Year of Birth | Length of | Fund Complex Overseen | Other Directorships Held | |
| and Address | Position | Time Served | by Board Member* | During at Least the Past 5 Years |
| **Rupert H. Johnson, Jr. (1940) | Chairman of | Chairman of the | 139 | None |
| One Franklin Parkway | the Board and | Board since June | ||
| San Mateo, CA 94403-1906 | Trustee | 2013 and Trustee | ||
| since 1991 | ||||
| Principal Occupation During at Least the Past 5 Years: | ||||
| Vice Chairman, Member – Office of the Chairman and Director, Franklin Resources, Inc.; Director, Franklin Advisers, Inc.; Senior Vice | ||||
| President, Franklin Advisory Services, LLC; and officer and/or director or trustee, as the case may be, of some of the other subsidiaries of | ||||
| Franklin Resources, Inc. and of 41 of the investment companies in Franklin Templeton Investments. | ||||
| Alison E. Baur (1964) | Vice President | Since 2012 | Not Applicable | Not Applicable |
| One Franklin Parkway | ||||
| San Mateo, CA 94403-1906 | ||||
| Principal Occupation During at Least the Past 5 Years: | ||||
| Deputy General Counsel, Franklin Templeton Investments; and officer of some of the other subsidiaries of Franklin Resources, Inc. and of 46 | ||||
| of the investment companies in Franklin Templeton Investments. | ||||
| Laura F. Fergerson (1962) | Chief | Since 2009 | Not Applicable | Not Applicable |
| One Franklin Parkway | Executive | |||
| San Mateo, CA 94403-1906 | Officer – | |||
| Finance and | ||||
| Administration | ||||
| Principal Occupation During at Least the Past 5 Years: | ||||
| Senior Vice President, Franklin Templeton Services, LLC; and officer of 46 of the investment companies in Franklin Templeton Investments. | ||||
| Gaston Gardey (1967) | Treasurer, | Since 2009 | Not Applicable | Not Applicable |
| One Franklin Parkway | Chief Financial | |||
| San Mateo, CA 94403-1906 | Officer and | |||
| Chief | ||||
| Accounting | ||||
| Officer | ||||
| Principal Occupation During at Least the Past 5 Years: | ||||
| Director, Fund Accounting, Franklin Templeton Investments; and officer of 27 of the investment companies in Franklin Templeton Investments. | ||||
| Aliya S. Gordon (1973) | Vice President | Since 2009 | Not Applicable | Not Applicable |
| One Franklin Parkway | ||||
| San Mateo, CA 94403-1906 | ||||
| Principal Occupation During at Least the Past 5 Years: | ||||
| Senior Associate General Counsel, Franklin Templeton Investments; officer of 46 of the investment companies in Franklin Templeton | ||||
| Investments; and formerly, Litigation Associate, Steefel, Levitt & Weiss, LLP (2000-2004). | ||||
| Steven J. Gray (1955) | Vice President | Since 2009 | Not Applicable | Not Applicable |
| One Franklin Parkway | ||||
| San Mateo, CA 94403-1906 | ||||
| Principal Occupation During at Least the Past 5 Years: | ||||
| Senior Associate General Counsel, Franklin Templeton Investments; Vice President, Franklin Templeton Distributors, Inc. and Franklin | ||||
| Alternative Strategies Advisers, LLC; and officer of 46 of the investment companies in Franklin Templeton Investments. | ||||
Annual Report | 139
| Number of Portfolios in | ||||
| Name, Year of Birth | Length of | Fund Complex Overseen | Other Directorships Held | |
| and Address | Position | Time Served | by Board Member* | During at Least the Past 5 Years |
| Selena L. Holmes (1965) | Vice President | Since 2012 | Not Applicable | Not Applicable |
| 100 Fountain Parkway | – AML | |||
| St. Petersburg, FL 33716-1205 | Compliance | |||
| Principal Occupation During at Least the Past 5 Years: | ||||
| Director, Global Compliance Monitoring; Deputy Chief Compliance Officer, Franklin Alternative Strategies Advisers, LLC; and officer of 46 of | ||||
| the investment companies in Franklin Templeton Investments. | ||||
| Edward B. Jamieson (1948) | President and | Since 2010 | Not Applicable | Not Applicable |
| One Franklin Parkway | Chief | |||
| San Mateo, CA 94403-1906 | Executive | |||
| Officer – | ||||
| Investment | ||||
| Management | ||||
| Principal Occupation During at Least the Past 5 Years: | ||||
| President, Chief Investment Officer and Director, Franklin Advisers, Inc.; Executive Vice President, Franklin Templeton Institutional, LLC; | ||||
| and officer and/or trustee, as the case may be, of some of the other subsidiaries of Franklin Resources, Inc. and of 10 of the investment | ||||
| companies in Franklin Templeton Investments. | ||||
| Christopher J. Molumphy (1962) | Vice President | Since 2000 | Not Applicable | Not Applicable |
| One Franklin Parkway | ||||
| San Mateo, CA 94403-1906 | ||||
| Principal Occupation During at Least the Past 5 Years: | ||||
| Director and Executive Vice President, Franklin Advisers, Inc.; Executive Vice President, Franklin Templeton Institutional, LLC; and officer of | ||||
| some of the other subsidiaries of Franklin Resources, Inc. and of 22 of the investment companies in Franklin Templeton Investments. | ||||
| Kimberly H. Novotny (1972) | Vice President | Since 2013 | Not Applicable | Not Applicable |
| 300 S.E. 2nd Street | ||||
| Fort Lauderdale, FL 33301-1923 | ||||
| Principal Occupation During at Least the Past 5 Years: | ||||
| Associate General Counsel, Franklin Templeton Investments; Vice President and Secretary, Fiduciary Trust International of the South; Vice | ||||
| President, Templeton Investment Counsel, LLC; Assistant Secretary, Franklin Resources, Inc.; and officer of 46 of the investment companies | ||||
| in Franklin Templeton Investments. | ||||
| Robert C. Rosselot (1960) | Chief | Since 2013 | Not Applicable | Not Applicable |
| 300 S.E. 2nd Street | Compliance | |||
| Fort Lauderdale, FL 33301-1923 | Officer | |||
| Principal Occupation During at Least the Past 5 Years: | ||||
| Director, Global Compliance, Franklin Templeton Investments; Vice President, Franklin Templeton Companies, LLC; officer of 46 of the | ||||
| investment companies in Franklin Templeton Investments; and formerly, Senior Associate General Counsel, Franklin Templeton Investments | ||||
| (2007-2013); and Secretary and Vice President, Templeton Group of Funds (2004-2013). | ||||
| Karen L. Skidmore (1952) | Vice President | Since 2006 | Not Applicable | Not Applicable |
| One Franklin Parkway | and Secretary | |||
| San Mateo, CA 94403-1906 | ||||
| Principal Occupation During at Least the Past 5 Years: | ||||
| Senior Associate General Counsel, Franklin Templeton Investments; and officer of 46 of the investment companies in Franklin | ||||
| Templeton Investments. | ||||
140 | Annual Report
| Number of Portfolios in | ||||
| Name, Year of Birth | Length of | Fund Complex Overseen | Other Directorships Held | |
| and Address | Position | Time Served | by Board Member* | During at Least the Past 5 Years |
| Craig S. Tyle (1960) | Vice President | Since 2005 | Not Applicable | Not Applicable |
| One Franklin Parkway | ||||
| San Mateo, CA 94403-1906 | ||||
| Principal Occupation During at Least the Past 5 Years: | ||||
| General Counsel and Executive Vice President, Franklin Resources, Inc.; and officer of some of the other subsidiaries of Franklin Resources, | ||||
| Inc. and of 46 of the investment companies in Franklin Templeton Investments. | ||||
| Lori A. Weber (1964) | Vice President | Since 2011 | Not Applicable | Not Applicable |
| 300 S.E. 2nd Street | ||||
| Fort Lauderdale, FL 33301-1923 | ||||
| Principal Occupation During at Least the Past 5 Years: | ||||
| Senior Associate General Counsel, Franklin Templeton Investments; Assistant Secretary, Franklin Resources, Inc.; Vice President and | ||||
| Secretary, Templeton Investment Counsel, LLC; Vice President, Fiduciary Trust International of the South; and officer of 46 of the investment | ||||
| companies in Franklin Templeton Investments. | ||||
*We base the number of portfolios on each separate series of the U.S. registered investment companies within the Franklin Templeton Investments fund complex. These portfolios
have a common investment manager or affiliated investment managers.
**Gregory E. Johnson is considered to be an interested person of the Fund under the federal securities laws due to his position as an officer and director of Franklin Resources, Inc.
(Resources), which is the parent company of the Fund’s investment manager and distributor. Rupert H. Johnson, Jr. is considered to be an interested person of the Fund under the
federal securities laws due to his position as officer and director and major shareholder of Resources.
Note 1: Rupert H. Johnson, Jr. is the uncle of Gregory E. Johnson.
Note 2: Officer information is current as of the date of this report. It is possible that after this date, information about officers may change.
Note 3: Effective June 13, 2013, Charles B. Johnson ceased to be a trustee of the Fund.
The Sarbanes-Oxley Act of 2002 and Rules adopted by the Securities and Exchange Commission require the Fund to disclose whether the Fund’s Audit Committee includes
at least one member who is an audit committee financial expert within the meaning of such Act and Rules. The Fund’s Board has determined that there is at least one such
financial expert on the Audit Committee and has designated John B. Wilson as its audit committee financial expert. The Board believes that Mr. Wilson qualifies as such an
expert in view of his extensive business background and experience, including service as chief financial officer of Staples, Inc. from 1992 to 1996. Mr. Wilson has been a
Member and Chairman of the Fund’s Audit Committee since 2006. As a result of such background and experience, the Board believes that Mr. Wilson has acquired an under-
standing of generally accepted accounting principles and financial statements, the general application of such principles in connection with the accounting estimates,
accruals and reserves, and analyzing and evaluating financial statements that present a breadth and level of complexity of accounting issues generally comparable to those
of the Fund, as well as an understanding of internal controls and procedures for financial reporting and an understanding of audit committee functions. Mr. Wilson is an
independent Board member as that term is defined under the relevant Securities and Exchange Commission Rules and Releases.
The Statement of Additional Information (SAI) includes additional information about the board members and is available, without charge, upon request. Shareholders may
call (800) DIAL BEN/342-5236 to request the SAI.
Annual Report | 141
Franklin Strategic Series
Shareholder Information
Board Review of Investment Management Agreement
At a meeting held April 15, 2014, the Board of Trustees (Board), including a majority of non-interested or independent Trustees, approved renewal of the investment management agreement for each of the separate funds within the Trust (Fund(s)). In reaching this decision, the Board took into account information furnished throughout the year at regular Board meetings, as well as information prepared specifically in connection with the annual renewal review process. Information furnished and discussed throughout the year included investment performance reports and related financial information for each Fund, along with periodic reports on expenses, shareholder services, legal and compliance matters, pricing, brokerage commissions and execution and other services provided by the Investment Manager (Manager) and its affiliates. Information furnished specifically in connection with the renewal process included a report for each Fund prepared by Lipper, Inc. (Lipper), an independent organization, as well as additional material, including a Fund profitability analysis prepared by management. The Lipper reports compared each Fund’s investment performance and expenses with those of other mutual funds deemed comparable to the Fund as selected by Lipper. The Fund profitability analysis discussed the profitability to Franklin Templeton Investments from its overall U.S. fund operations, as well as on an individual fund-by-fund basis. Additional material accompanying such profitability analysis included information on a fund-by-fund basis listing portfolio managers and other accounts they manage, as well as information on management fees charged by the Manager and its affiliates to U.S. mutual funds and other accounts, including management’s explanation of differences where relevant. Such material also included a memorandum prepared by management describing project initiatives and capital investments relating to the services provided to the Funds by the Franklin Templeton Investments organization, as well as a memorandum relating to economies of scale and an analysis concerning transfer agent fees charged by an affiliate of the Manager.
In considering such materials, the independent Trustees received assistance and advice from and met separately with independent counsel. While the investment management agreements for all Funds were considered at the same Board meeting, the Board dealt with each Fund separately. In approving continuance of the investment management agreement for each Fund, the Board, including a majority of independent Trustees, determined that the existing management fee structure was fair and reasonable and that continuance of the investment management agreement was in the best interests of each Fund and its shareholders. While attention was given to all information furnished, the following discusses some primary factors relevant to the Board’s decision.
NATURE, EXTENT AND QUALITY OF SERVICE. The Board was satisfied with the nature and quality of the overall services provided by the Manager and its affiliates to the Funds and their shareholders. In addition to investment performance and expenses discussed later, the Board’s opinion was based, in part, upon periodic reports furnished it showing that the investment policies and restrictions for each Fund were consistently complied with as well as other reports periodically furnished the Board covering matters such as the compliance of portfolio managers and other management personnel with the code of ethics adopted throughout the Franklin Templeton fund complex, the adherence to fair value pricing procedures established by the Board, and the accuracy
142 | Annual Report
Franklin Strategic Series
Shareholder Information (continued)
Board Review of Investment Management Agreement (continued)
of net asset value calculations. The Board also noted the extent of benefits provided Fund shareholders from being part of the Franklin Templeton family of funds, including the right to exchange investments between the same class of funds without a sales charge, the ability to reinvest Fund dividends into other funds and the right to combine holdings in other funds to obtain a reduced sales charge. Favorable consideration was given to management’s continual efforts and expenditures in establishing back-up systems and recovery procedures to function in the event of a natural disaster, it being noted that such systems and procedures had functioned well during the Florida hurricanes and blackouts experienced in previous years, and that those operations in the New York/New Jersey area ran smoothly during the period of the 2012 Hurricane Sandy. Among other factors taken into account by the Board were the Manager’s best execution trading policies, including a favorable report by an independent portfolio trading analytical firm, which also covered FOREX transactions. Consideration was also given to the experience of each Fund’s portfolio management team, the number of accounts managed and general method of compensation. In this latter respect, the Board noted that a primary factor in management’s determination of a portfolio manager’s bonus compensation was the relative investment performance of the funds he or she managed and that a portion of such bonus was required to be invested in a predesignated list of funds within such person’s fund management area so as to be aligned with the interests of shareholders. The Board also took into account the quality of transfer agent and shareholder services provided Fund shareholders by an affiliate of the Manager, and the continual enhancements to the Franklin Templeton website. Particular attention was given to management’s conservative approach and diligent risk management procedures, including continual monitoring of counterparty credit risk and attention given to derivatives and other complex instruments, including expanded collateralization requirements. The Board also took into account, among other things, management’s efforts in establishing a global credit facility for the benefit of the Funds and other accounts managed by Franklin Templeton Investments to provide a source of cash for temporary and emergency purposes or to meet unusual redemption requests as well as the strong financial position of the Manager’s parent company and its commitment to the mutual fund business as evidenced by its subsidization of money market funds.
INVESTMENT PERFORMANCE. The Board placed significant emphasis on the investment performance of the Funds in view of its importance to shareholders. While consideration was given to performance reports and discussions with portfolio managers at Board meetings throughout the year, particular attention in assessing performance was given to the Lipper reports furnished for the agreement renewals. The Lipper reports prepared for each such individual Fund showed the investment performance of its Class A shares in comparison to a performance universe selected by Lipper. Comparative performance for each Fund was shown for the one-year period ended January 31, 2014, and previous periods ended that date of up to 10 years depending on when a particular Fund commenced operations. The following summarizes the performance results for each of these Funds and the Board’s view of such performance.
Annual Report | 143
Franklin Strategic Series
Shareholder Information (continued)
Board Review of Investment Management Agreement (continued)
Franklin Flex Cap Growth Fund – The performance universe for this Fund consisted of the Fund and all retail and institutional multi-cap growth funds as selected by Lipper. The Lipper report showed the Fund’s total return to be in the second-highest performing quintile of such performance universe for the one-year period, and on an annualized basis to be in the second-lowest performing quintile of the performance universe during each of the previous three- and five-year periods, and in the middle performing quintile of such universe during the previous 10-year period. The Board acknowledged the positive impact of steps taken by management in 2012 to commit additional resources to the Fund. The Board found the Fund’s comparative performance as shown in the Lipper report to be acceptable, noting its one-year total return exceeded 29%, and its annualized three- and five-year total returns were within 2% of the median of the Lipper performance universe for such periods.
Franklin Focused Core Equity Fund – The performance universe for this Fund consisted of all retail and institutional multi-cap core funds as selected by Lipper. The Lipper report showed the Fund’s total return for the one-year period to be in the second-highest performing quintile of such performance universe, and on an annualized basis to be in the second-lowest performing quintile of such performance universe for the previous three-year period and the highest performing quintile of such universe for the previous five-year period. The Board believed that steps that management had taken to improve performance, including a change in the lead portfolio manager, were producing results and that no additional changes to portfolio management were necessary at the present time. The Board found the comparative performance of the Fund as set forth in the Lipper report to be satisfactory.
Franklin Growth Opportunities Fund – The performance universe for this Fund consisted of the Fund and all retail and institutional multi-cap growth funds as selected by Lipper. The Lipper report showed the Fund’s total return for the one-year period to be in the highest or best performing quintile of its performance universe, and on an annualized basis to be in the middle performing quintile of such universe during each of the previous three- and five-year periods, and the highest performing quintile of such universe for the previous 10-year period. The Board found the comparative performance of the Fund as set forth in the Lipper report to be satisfactory.
Franklin Small Cap Growth Fund – The performance universe for this Fund consisted of the Fund and all retail and institutional small cap growth funds as selected by Lipper. The Lipper report showed the Fund’s total return to be in the highest or best performing quintile of such performance universe during the one-year period, and on an annualized basis to also be in the highest performing quintile of such universe for the previous three- and five-year periods, and the second-highest performing quintile of such universe for the previous 10-year period. The Board was satisfied with the Fund’s investment performance as set forth in the Lipper report.
144 | Annual Report
Franklin Strategic Series
Shareholder Information (continued)
Board Review of Investment Management Agreement (continued)
Franklin Small-Mid Cap Growth Fund – The performance universe for this Fund consisted of all retail and institutional mid-cap growth funds as selected by Lipper. The Lipper report comparison for the Fund showed its total return during the one-year period to be in the second-highest performing quintile of such performance universe, and on an annualized basis to be in the middle performing quintile of such universe during each of the previous three-, five- and 10-year periods. The Board found the comparative performance of the Fund as set forth in the Lipper report to be satisfactory.
COMPARATIVE EXPENSES. Consideration was given to a comparative analysis of the management fees and total expense ratio of each Fund compared with those of a group of other funds selected by Lipper as its appropriate Lipper expense group. Lipper expense data is based upon information taken from each fund’s most recent annual report, which reflects historical asset levels that may be quite different from those currently existing, particularly in a period of market volatility. While recognizing such inherent limitation and the fact that expense ratios generally increase as assets decline and decrease as assets grow, the Board believed the independent analysis conducted by Lipper to be an appropriate measure of comparative expenses. In reviewing comparative costs, Lipper provides information on each Fund’s contractual investment management fee in comparison with the investment management fee that would have been charged by other funds within its Lipper expense group assuming they were similar in size to the Fund, as well as the actual total expense ratio of the Fund in comparison with those of its Lipper expense group. The Lipper contractual investment management fee analysis includes administrative charges as being part of the investment management fee, and actual total expenses, for comparative consistency, are shown by Lipper for Fund Class A shares. The results of such expense comparisons showed the contractual investment management fee rates and actual total expense ratio for each of Franklin Flex Cap Growth Fund, Franklin Small Cap Growth Fund and Franklin Small-Mid Cap Growth Fund to be in the least expensive quintiles of their respective Lipper expense groups. The contractual investment management fee rate for Franklin Growth Opportunities Fund was in the least expensive quintile of its Lipper expense group and its actual total expense ratio was below the median of such expense group. The Board was satisfied with the contractual management fee rate and total expense ratio of each of these Funds in comparison to their respective expense groups as shown in the Lipper reports. The contractual investment management fee rate for Franklin Focused Core Equity Fund was in the second-highest expense quintile of its Lipper expense group, while its actual total expense ratio was in the least expensive quintile of such expense group. The Board was satisfied with the expenses of this Fund as shown in its Lipper report, noting they were subsidized by management.
MANAGEMENT PROFITABILITY. The Board also considered the level of profits realized by the Manager and its affiliates in connection with the operation of each Fund. In this respect, the Board reviewed the Fund profitability analysis that addresses the overall profitability of Franklin Templeton’s U.S. fund business, as well as its profits in providing management and other services to each of the individual funds during the 12-month period ended September 30, 2013, being the most recent fiscal year-end for Franklin Resources, Inc., the Manager’s parent. In reviewing the analysis, the Board recognized that allocation methodologies are inherently subjective and various
Annual Report | 145
Franklin Strategic Series
Shareholder Information (continued)
Board Review of Investment Management Agreement (continued)
allocation methodologies may be reasonable while producing different results. In this respect, the Board noted that while management continually makes refinements to its methodologies in response to organizational and product related changes, the overall approach as defined by the primary drivers and activity measurements has remained consistent with that used in the Funds’ profitability report presentations from prior years. Additionally, the Funds’ independent registered public accounting firm had been engaged by the Manager to periodically review the reasonableness of the allocation methodologies to be used solely by the Funds’ Board in reference to the profitability analysis. In reviewing and discussing such analysis, management discussed with the Board its belief that costs incurred in establishing the infrastructure necessary for the type of mutual fund operations conducted by the Manager and its affiliates may not be fully reflected in the expenses allocated to each Fund in determining its profitability, as well as the fact that the level of profits, to a certain extent, reflected operational cost savings and efficiencies initiated by management. The Board also took into account management’s expenditures in improving shareholder services provided the Funds, as well as the need to implement systems and meet additional regulatory and compliance requirements resulting from statutes such as the Sarbanes-Oxley and Dodd-Frank Acts and recent SEC and other regulatory requirements. In addition, the Board considered a third-party study comparing the profitability of the Manager’s parent on an overall basis to other publicly held managers broken down to show profitability from management operations exclusive of distribution expenses, as well as profitability including distribution expenses. The Board also considered the extent to which the Manager and its affiliates might derive ancillary benefits from fund operations, including revenues generated from transfer agent services and potential benefits resulting from allocation of fund brokerage and the use of commission dollars to pay for research. Based upon its consideration of all these factors, the Board determined that the level of profits realized by the Manager and its affiliates from providing services to each Fund was not excessive in view of the nature, quality and extent of services provided.
ECONOMIES OF SCALE. The Board also considered whether economies of scale are realized by the Manager as the Funds grow larger and the extent to which this is reflected in the level of management fees charged. While recognizing that any precise determination is inherently subjective, the Board noted that based upon the Fund profitability analysis, it appears that as some funds get larger, at some point economies of scale do result in the Manager realizing a larger profit margin on management services provided such a fund. The Board noted that economies of scale were shared with each Fund and its shareholders through management fee breakpoints so that as a Fund grows in size, its effective management fee rate declines. The fee structure under the investment management agreements for all of the Funds contains breakpoints that continued to asset levels that exceeded their asset sizes at December 31, 2013. The assets of Franklin Focused Core Equity Fund amounted to approximately $46 million at December 31, 2013, and the Board did not believe such size afforded any economies of scale, noting expenses were subsidized by management. In view of such fee structure and the favorable expense comparisons of each of the Funds within their respective expense groups, the Board believed that to the extent economies of scale may be realized by the manager of these Funds and its affiliates, that there was a sharing of benefits with each Fund and its shareholders.
146 | Annual Report
Franklin Strategic Series
Shareholder Information (continued)
Proxy Voting Policies and Procedures
The Trust’s investment manager has established Proxy Voting Policies and Procedures (Policies) that the Trust uses to determine how to vote proxies relating to portfolio securities. Shareholders may view the Trust’s complete Policies online at franklintempleton.com. Alternatively, shareholders may request copies of the Policies free of charge by calling the Proxy Group collect at (954) 527-7678 or by sending a written request to: Franklin Templeton Companies, LLC, 300 S.E. 2nd Street, Fort Lauderdale, FL 33301, Attention: Proxy Group. Copies of the Trust’s proxy voting records are also made available online at franklintempleton.com and posted on the U.S. Securities and Exchange Commission’s website at sec.gov and reflect the most recent 12-month period ended June 30.
Quarterly Statement of Investments
The Trust files a complete statement of investments with the U.S. Securities and Exchange Commission for the first and third quarters for each fiscal year on Form N-Q. Shareholders may view the filed Form N-Q by visiting the Commission’s website at sec.gov. The filed form may also be viewed and copied at the Commission’s Public Reference Room in Washington, DC. Information regarding the operations of the Public Reference Room may be obtained by calling (800) SEC-0330.
Householding of Reports and Prospectuses
You will receive each Fund’s financial reports every six months as well as an annual updated summary prospectus (prospectus available upon request). To reduce Fund expenses, we try to identify related shareholders in a household and send only one copy of the financial reports and summary prospectus. This process, called “householding,” will continue indefinitely unless you instruct us otherwise. If you prefer not to have these documents householded, please call us at (800) 632-2301. At any time you may view current prospectuses/summary prospectuses and financial reports on our website. If you choose, you may receive these documents through electronic delivery.
Annual Report | 147
This page intentionally left blank.

Annual Report and Shareholder Letter
Franklin Strategic Series
Investment Manager
Franklin Advisers, Inc.
Distributor
Franklin Templeton Distributors, Inc.
(800) DIAL BEN®/342-5236
franklintempleton.com
Shareholder Services
(800) 632-2301
Authorized for distribution only when accompanied or preceded by a summary prospectus and/or prospectus.
Investors should carefully consider a fund’s investment goals, risks, charges and expenses before investing.
A prospectus contains this and other information; please read it carefully before investing.
To help ensure we provide you with quality service, all calls to and from our service areas are monitored and/or recorded.
© 2014 Franklin Templeton Investments. All rights reserved. FSS1 A 06/14
| Contents | |||||||
| Shareholder Letter | 1 | Annual Report | Financial Highlights and | Report of Independent | |||
| Economic and Market Overview | 3 | Statements of Investments | 28 | Registered Public | |||
| Accounting Firm | 62 | ||||||
| Franklin Biotechnology | Financial Statements | 44 | |||||
| Tax Information | 63 | ||||||
| Discovery Fund | 5 | Notes to | |||||
| Franklin Natural Resources | Financial Statements | 48 | Board Members and Officers | 64 | |||
| Fund | 15 | Shareholder Information | 69 | ||||
Annual Report
Economic and Market Overview
During the 12-month period ended April 30, 2014, and especially in the second half of 2013, the U.S. economy continued to show signs of recovery driven by consumer and business spending and rising inventories. Despite the abnormally cold weather that suppressed economic activity in the first quarter of 2014, economic indicators were still broadly supportive of recovery at period-end. Manufacturing activity expanded and retail sales for the period rose year-over-year. Home sales declined largely as a result of rising mortgage rates and lower inventories as well as the impact of extreme weather in early 2014, but home prices rose in comparison with year-ago figures. The unemployment rate declined to 6.3% in April 2014 from 7.5% in April 2013,1 and inflation remained below the U.S. Federal Reserve Board’s (Fed’s) 2.0% target.
In October 2013, the federal government temporarily shut down after Congress reached a budget impasse. However, Congress passed a spending bill in January to fund the federal government through September 2014. Congress then approved suspension of the debt ceiling until March 2015. Despite speculation that it would start tapering its quantitative easing, the Fed maintained its monthly bond purchases at $85 billion through December 2013, gradually reducing them beginning in January, based on continued positive economic and employment data. Although economic data in early 2014 were soft in part because of severe winter weather, Fed Chair Janet Yellen kept the pace of asset-purchase tapering intact while adopting a more qualitative approach to rate-hike guidance. However, the Fed remained committed to keeping interest rates low for a considerable time even after the asset purchase program ends, depending on inflation and unemployment trends. Despite volatility in U.S. equity markets toward period-end heightened by geopolitical risks from the crisis in Ukraine, markets continued to advance.
Investors’ confidence grew as corporate profits rose and generally favorable economic data indicated continued recovery despite brief sell-offs when markets reacted to the Fed’s statements, U.S. budget disputes, political instability in certain emerging markets and China’s slowing economy. U.S. stocks generated strong returns for the 12-months under review as the Standard & Poor’s 500 Index and Dow Jones Industrial Average reached all-time highs.2
Annual Report | 3
The foregoing information reflects our analysis and opinions as of April 30, 2014. The information is not a
complete analysis of every aspect of any market, country, industry, security or fund. Statements of fact are
from sources considered reliable.
1. Source: Bureau of Labor Statistics.
2. S&P Dow Jones Indices. Copyright © 2014, S&P Dow Jones Indices LLC. All rights reserved. Reproduction of S&P
Dow Jones Indices in any form is prohibited except with the prior written permission of S&P. S&P does not guarantee
the accuracy, adequacy, completeness or availability of any information and is not responsible for any errors or omis-
sions, regardless of the cause or for the results obtained from the use of such information. S&P DISCLAIMS ANY AND
ALL EXPRESS OR IMPLIED WARRANTIES, INCLUDING, BUT NOT LIMITED TO, ANY WARRANTIES OF MERCHANTABILITY OR
FITNESS FOR A PARTICULAR PURPOSE OR USE. In no event shall S&P be liable for any direct, indirect, special or con-
sequential damages, costs, expenses, legal fees, or losses (including lost income or lost profit and opportunity costs)
in connection with subscriber’s or others’ use of S&P Dow Jones Indices.
4 | Annual Report
Franklin Biotechnology Discovery Fund
Your Fund’s Goal and Main Investments: Franklin Biotechnology Discovery Fund seeks capital appreciation by investing at least 80% of its net assets in securities of biotechnology companies and discovery research firms located in the U.S. and other countries.
This annual report for Franklin Biotechnology Discovery Fund covers the fiscal year ended April 30, 2014.
Performance Overview
Franklin Biotechnology Discovery Fund – Class A delivered a +30.60% cumulative total return for the 12 months under review. In comparison, the NASDAQ Biotechnology Index®, which tracks U.S. and international-based biotechnology stocks, generated a +33.59% total return.1 Also for comparison, the Standard & Poor’s 500 Index (S&P 500®), which is a broad measure of the U.S. stock market, generated a +20.44% total return.1, 2 Finally, domestic and international-based stocks, as measured by the NASDAQ Composite Index®, produced a +25.20% total return.1 You can find the Fund’s long-term performance data in the Performance Summary beginning on page 9.
| Performance data represent |
| past performance, which does |
| not guarantee future results. |
| Investment return and principal |
| value will fluctuate, and you may |
| have a gain or loss when you sell |
| your shares. Current performance |
| may differ from figures shown. |
| Please visit franklintempleton.com |
| or call (800) 342-5236 for most |
| recent month-end performance. |
Investment Strategy
The Fund is managed using a bottom-up approach to individual stock selection, with a focus on fundamental analysis and primary research. We look for bio-technology, biopharmaceutical and platform technology companies that possess products with favorable competitive profiles, large market opportunities and strong intellectual property, supported by thoughtful clinical and market development strategies. Our assessment of these products is based on extensive primary research and due diligence and includes, but is not limited to, a thorough review of medical literature, consultation of community and academic physicians, and attendance at scientific meetings and symposia. Additionally, we favor companies with excellent management, strong financial characteristics and attractive valuations.
The dollar value, number of shares or principal amount, and names of all portfolio holdings are listed in the Fund’s Statement of Investments (SOI). The SOI begins on page 32.
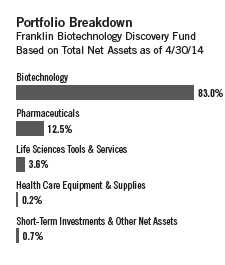
Annual Report | 5
| Top 10 Holdings | ||
| Franklin Biotechnology Discovery Fund | ||
| 4/30/14 | ||
| Company | % of Total | |
| Sector/Industry | Net Assets | |
| Gilead Sciences Inc. | 11.0 | % |
| Biotechnology | ||
| Biogen Idec Inc. | 7.7 | % |
| Biotechnology | ||
| Amgen Inc. | 5.3 | % |
| Biotechnology | ||
| Regeneron Pharmaceuticals Inc. | 5.1 | % |
| Biotechnology | ||
| Celgene Corp. | 5.1 | % |
| Biotechnology | ||
| Medivation Inc. | 4.4 | % |
| Biotechnology | ||
| Alexion Pharmaceuticals Inc. | 3.1 | % |
| Biotechnology | ||
| Incyte Corp. | 2.9 | % |
| Biotechnology | ||
| Illumina Inc. | 2.8 | % |
| Life Sciences Tools & Services | ||
| Vertex Pharmaceuticals Inc. | 2.5 | % |
| Biotechnology | ||
Manager’s Discussion
During the 12 months under review, many biotechnology stocks rallied amid clinical and regulatory successes. Within the Fund’s portfolio, the performance of individual stocks varied greatly, with several holdings reaching all-time highs and even delivering triple-digit gains. However, the biotechnology industry remains subject to volatility surrounding trial drug results, and a few positions declined notably following adverse outcomes. Please keep in mind that volatility is not uncommon in the biotechnology sector, and the Fund seeks to take advantage of short-term volatility by initiating or adding to securities we believe to be undervalued.
Leading contributors to the Fund’s absolute performance included Gilead Sciences, Celgene, Incyte and Alexion Pharmaceuticals. Gilead develops therapeutics to treat life-threatening diseases, including HIV, liver disease and respiratory illnesses. During the period, Gilead’s shares rallied after the company announced an early end to clinical trials for its blood cancer drug idelalisib following positive clinical results. The U.S. Food and Drug Administration (FDA) and the European Commission approved the company’s potential blockbuster drug Sovaldi, used to treat hepatitis C. Gilead reported strong 2013 earnings driven by increased sales of antiviral drugs. First-quarter 2014 earnings exceeded expectations because of Sovaldi’s strong prescription growth soon after its launch.
Celgene discovers, develops and sells therapies for treating cancer and immunological diseases. Shares of Celgene rose as the company announced positive late-stage clinical trials of some of its pipeline drugs targeting cancer. Impressive sales for the company’s flagship blood-cancer treatment, Revlimid, helped revenue growth during the period. Celgene’s drug sales increased in part because of the company’s expansion of availability to new regions. Sales also increased for a number of medicines, including Abraxane, whose application expanded from lung and breast cancer to pancreatic cancer.
Incyte focuses on the discovery, development and commercialization of drugs, primarily for oncology and inflammation. The company’s revenues were driven by sales of Jakafi, the company’s only marketed drug, which is used to treat patients of intermediate- or high-risk myelofibrosis. During the period, the company announced positive Phase III trials of Jakafi for patients with polycythemia vera, a type of blood cancer.
6 | Annual Report
Alexion Pharmaceuticals’ shares rallied because of a potential takeover by Roche Holding early in the period. The FDA granted an orphan drug designation to the company’s sole marketed drug, Soliris, for the treatment of neuromyelitis optica, a rare neurological disorder. An orphan drug designation was also granted to Soliris for preventing delayed graft function in renal transplant patients. The company reported better-than-expected earnings results in recent quarters, driven by Soliris’s strong sales. The company also provided solid 2014 revenue and earnings growth forecasts following a reimbursement deal with France on Soliris. The company has started a rolling FDA submission process for asfotase alfa for the treatment of a rare disease, hypophosphatasia, which, if approved, would be the company’s second commercial product.
In contrast, certain Fund holdings weighed on performance. ARIAD Pharmaceuticals’ share price fell after the biotechnology company suspended trials on its leukemia drug Iclusig amid reports of harmful side effects. After initially halting the drug’s marketing in the U.S., the FDA allowed sales to resume with revised labeling and limited application.
Shares of Sarepta Therapeutics, a biopharmaceutical company focused on developing innovative RNA-based therapeutics, fell as the FDA raised concerns over granting marketing approval for Sarepta’s flagship drug eteplirsen based on the existing trial design.3 The FDA advised the company that a new, larger trial with a placebo might be warranted because of new data and the failure of a competing drug’s trial. However, toward the end of the period, the FDA indicated that safety and efficacy data from studies without placebo groups could support marketing approval.
Ireland-based clinical biopharmaceutical company Amarin met with regulatory delay in its effort to expand the application of its cholesterol drug Vascepa to include patients with high triglycerides who already take a statin drug. Although the company’s fish-oil pill treatment is approved for patients with severely high triglycerides, an FDA panel requested that Amarin complete a study on heart benefits to decide on the wider use of Vascepa. In early 2014, the FDA turned down Amarin’s request to reinstate a testing process that Amarin hoped would allow approval of the drug’s expanded use.
Annual Report | 7
Thank you for your continued participation in Franklin Biotechnology Discovery Fund. We look forward to serving your future investment needs.

CFA® is a trademark owned by CFA Institute.
The foregoing information reflects our analysis, opinions and portfolio holdings as of April 30, 2014, the end of the
reporting period. The way we implement our main investment strategies and the resulting portfolio holdings may
change depending on factors such as market and economic conditions. These opinions may not be relied upon as
investment advice or an offer for a particular security. The information is not a complete analysis of every aspect
of any market, country, industry, security or the Fund. Statements of fact are from sources considered reliable,
but the investment manager makes no representation or warranty as to their completeness or accuracy. Although
historical performance is no guarantee of future results, these insights may help you understand our investment
management philosophy.
The index is unmanaged and includes reinvested dividends. One cannot invest directly in an index, and an index is not
representative of the Fund’s portfolio.
1. Source: © 2014 Morningstar. All Rights Reserved. The information contained herein: (1) is proprietary to Morningstar
and/or its content providers; (2) may not be copied or distributed; and (3) is not warranted to be accurate, complete or
timely. Neither Morningstar nor its content providers are responsible for any damages or losses arising from any use of
this information.
2. S&P 500: Copyright © 2014, S&P Dow Jones Indices LLC. All rights reserved. Reproduction of S&P U.S. Index data in
any form is prohibited except with the prior written permission of S&P. S&P does not guarantee the accuracy, adequacy,
completeness or availability of any information and is not responsible for any errors or omissions, regardless of the
cause or for the results obtained from the use of such information. S&P DISCLAIMS ANY AND ALL EXPRESS OR IMPLIED
WARRANTIES, INCLUDING, BUT NOT LIMITED TO, ANY WARRANTIES OF MERCHANTABILITY OR FITNESS FOR A PARTICULAR
PURPOSE OR USE. In no event shall S&P be liable for any direct, indirect, special or consequential damages, costs,
expenses, legal fees, or losses (including lost income or lost profit and opportunity costs) in connection with sub-
scriber’s or others’ use of S&P U.S. Index data.
3. Sold by period-end.
8 | Annual Report
Performance Summary as of 4/30/14
Franklin Biotechnology Discovery Fund
Your dividend income will vary depending on dividends or interest paid by securities in the Fund’s portfolio, adjusted for operating expenses of each class. Capital gain distributions are net profits realized from the sale of portfolio securities. The performance table and graphs do not reflect any taxes that a shareholder would pay on Fund dividends, capital gain distributions, if any, or any realized gains on the sale of Fund shares. Total return reflects reinvestment of the Fund’s dividends and capital gain distributions, if any, and any unrealized gains or losses.
| Net Asset Value | ||||||
| Share Class | 4/30/14 | 4/30/13 | Change | |||
| A (FBDIX) | $ | 129.27 | $ | 105.95 | +$ | 23.32 |
| Advisor (FTDZX) | $ | 130.86 | $ | 106.86 | +$ | 24.00 |
| 5/1/13 | ||||||
| R6 (FRBRX) | $ | 131.09 | $ | 104.56 | +$ | 26.53 |
| 3/4/14 | ||||||
| C (n/a) | $ | 129.061 | $ | 159.15 | -$ | 30.09 |
| Distributions | ||||||
| Short-Term | Long-Term | |||||
| Share Class | Capital Gain | Capital Gain | Total | |||
| A (5/1/13–4/30/14) | $ | 1.5839 | $ | 7.2093 | $ | 8.7932 |
| R6 (5/1/13–4/30/14) | $ | 1.5839 | $ | 7.2093 | $ | 8.7932 |
| Advisor (5/1/13–4/30/14) | $ | 1.5839 | $ | 7.2093 | $ | 8.7932 |
Annual Report | 9
Performance Summary (continued)
Performance as of 4/30/142
Cumulative total return excludes sales charges. Average annual total returns and value of $10,000 investment include maximum sales charges. Class A: 5.75% maximum initial sales charge; Class C: 1% contingent deferred sales charge in first year only; Class R6/Advisor Class: no sales charges.
| Value of | Average Annual | ||||||||||||||
| Cumulative | Average Annual | $ | 10,000 | Total Return | Total Annual Operating Expenses 7 | ||||||||||
| Share Class | Total Return3 | Total Return 4 | Investment 5 | (3/31/14 | ) 6 | (with waiver) | (without waiver) | ||||||||
| A | 1.21 | % | 1.22 | % | |||||||||||
| 1-Year | + | 30.60 | % | + | 23.09 | % | $ | 12,309 | + | 42.10 | % | ||||
| 5-Year | + | 221.66 | % | + | 24.84 | % | $ | 30,319 | + | 25.77 | % | ||||
| 10-Year | + | 200.34 | % | + | 10.97 | % | $ | 28,307 | + | 12.19 | % | ||||
| C8 | 1.92 | % | 1.93 | % | |||||||||||
| Since Inception (3/4/14) | -18.91 | %1 | -19.72 | % | $ | 8,028 | -13.06 | % | |||||||
| R68 | 0.71 | % | 0.72 | % | |||||||||||
| Since Inception (5/1/13) | + | 34.10 | % | + | 34.10 | % | $ | 13,410 | + | 45.02 | % | ||||
| Advisor9 | 0.92 | % | 0.93 | % | |||||||||||
| 1-Year | + | 31.02 | % | + | 31.02 | % | $ | 13,102 | + | 51.23 | % | ||||
| 5-Year | + | 226.09 | % | + | 26.67 | % | $ | 32,609 | + | 27.61 | % | ||||
| 10-Year | + | 204.47 | % | + | 11.78 | % | $ | 30,447 | + | 13.00 | % | ||||
Performance data represent past performance, which does not guarantee future results. Investment return and principal value will fluctuate, and you may have a gain or loss when you sell your shares. Current performance may differ from figures shown. For most recent month-end performance, go to franklintempleton.com or call (800) 342-5236.
10 | Annual Report
Performance Summary (continued)
Total Return Index Comparison for a Hypothetical $10,000 Investment2
Total return represents the change in value of an investment over the periods shown. It includes any applicable, maximum sales charge, Fund expenses, account fees and reinvested distributions. The unmanaged indexes include reinvestment of any income or distributions. They differ from the Fund in composition and do not pay management fees or expenses. One cannot invest directly in an index.
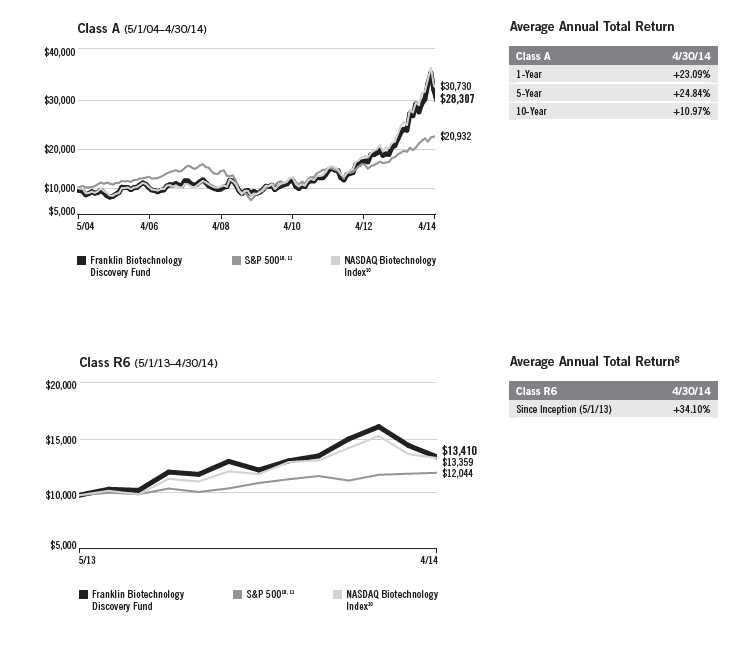
Annual Report | 11
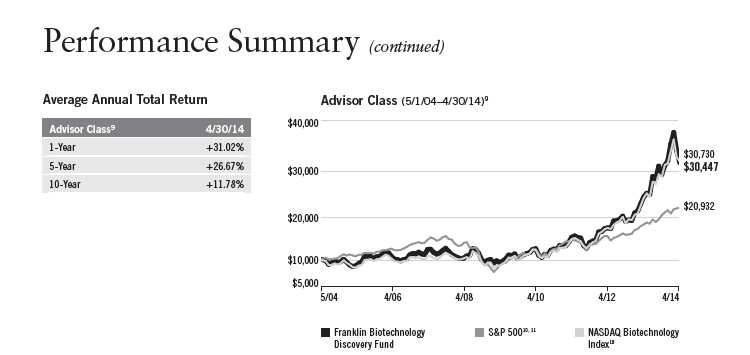
All investments involve risks, including possible loss of principal. The Fund is a nondiversified fund that concentrates in a single sector, which
involves risks such as patent considerations, product liability, government regulatory requirements, and regulatory approval for new drugs and
medical products. Biotechnology companies often are small and/or relatively new. Smaller companies can be particularly sensitive to changes
in economic conditions and have less certain growth prospects than larger, more established companies and can be volatile, especially over
the short term. The Fund may also invest in foreign companies, which involve special risks, including currency fluctuations and political uncer-
tainty. The Fund is actively managed but there is no guarantee that the manager’s investment decisions will produce the desired results. The
Fund’s prospectus also includes a description of the main investment risks.
Class C: These shares have higher annual fees and expenses than Class A shares.
Class R6: Shares are available to certain eligible investors as described in the prospectus.
Advisor Class: Shares are available to certain eligible investors as described in the prospectus.
1. Price and total return information is based on net asset values calculated for shareholder transactions. Certain adjustments were made to
Class C shares’ net assets at 4/30/14 for financial reporting purposes, and as a result, Class C shares’ net asset values for shareholder transactions
and the total returns based on those net asset values differ from the adjusted net asset values and total returns reported in the Financial Highlights.
2. The Fund has a fee waiver associated with its investments in a Franklin Templeton money fund, contractually guaranteed through at least its
current fiscal year-end. Fund investment results reflect the fee waiver, to the extent applicable; without this reduction, the results would have
been lower.
3. Cumulative total return represents the change in value of an investment over the periods indicated.
4. Average annual total return represents the average annual change in value of an investment over the periods indicated.
5. These figures represent the value of a hypothetical $10,000 investment in the Fund over the periods indicated.
6. In accordance with SEC rules, we provide standardized average annual total return information through the latest calendar quarter.
7. Figures are as stated in the Fund’s current prospectus. In periods of market volatility, assets may decline significantly, causing total annual Fund
operating expenses to become higher than the figures shown.
8. Performance is not annualized.
9. Effective 9/1/09, the Fund began offering Advisor Class shares, which do not have sales charges or a Rule 12b-1 plan. Performance quotations for
this class reflect the following methods of calculation: (a) For periods prior to 9/1/09, a restated figure is used based upon the Fund’s Class A per-
formance, excluding the effect of Class A’s maximum initial sales charge, but reflecting the effect of the Class A Rule 12b-1 fees; and (b) for periods
after 9/1/09, actual Advisor Class performance is used reflecting all charges and fees applicable to that class. Since 9/1/09 (commencement of
sales), the cumulative and average annual total returns of Advisor Class shares were +184.44% and +25.15%.
10. Source: © 2014 Morningstar. The S&P 500 is a market capitalization-weighted index of 500 stocks designed to measure total U.S. equity market
performance. The NASDAQ Biotechnology Index is a modified capitalization-weighted index designed to measure performance of all NASDAQ stocks in
the biotechnology sector.
11. S&P 500: Copyright © 2014, S&P Dow Jones Indices LLC. All rights reserved. Reproduction of S&P U.S. Index data in any form is prohibited except
with the prior written permission of S&P. S&P does not guarantee the accuracy, adequacy, completeness or availability of any information and is not
responsible for any errors or omissions, regardless of the cause or for the results obtained from the use of such information. S&P DISCLAIMS ANY
AND ALL EXPRESS OR IMPLIED WARRANTIES, INCLUDING, BUT NOT LIMITED TO, ANY WARRANTIES OF MERCHANTABILITY OR FITNESS FOR A PARTICULAR
PURPOSE OR USE. In no event shall S&P be liable for any direct, indirect, special or consequential damages, costs, expenses, legal fees, or losses
(including lost income or lost profit and opportunity costs) in connection with subscriber’s or others’ use of S&P U.S. Index data.
12 | Annual Report
Your Fund’s Expenses
Franklin Biotechnology Discovery Fund
As a Fund shareholder, you can incur two types of costs:
- Transaction costs, including sales charges (loads) on Fund purchases; and
- Ongoing Fund costs, including management fees, distribution and service (12b-1) fees, and other Fund expenses. All mutual funds have ongoing costs, sometimes referred to as operating expenses.
The following table shows ongoing costs of investing in the Fund and can help you understand these costs and compare them with those of other mutual funds. The table assumes a $1,000 investment held for the six months indicated.
Actual Fund Expenses
The first line (Actual) for each share class listed in the table provides actual account values and expenses. The “Ending Account Value” is derived from the Fund’s actual return, which includes the effect of Fund expenses.
You can estimate the expenses you paid during the period by following these steps. Of course, your account value and expenses will differ from those in this illustration:
| 1. | Divide your account value by $1,000. |
| If an account had an $8,600 value, then $8,600 ÷ $1,000 = 8.6. | |
| 2. | Multiply the result by the number under the heading “Expenses Paid During Period.” |
| If Expenses Paid During Period were $7.50, then 8.6 x $7.50 = $64.50. |
In this illustration, the estimated expenses paid this period are $64.50.
Hypothetical Example for Comparison with Other Funds
Information in the second line (Hypothetical) for each class in the table can help you compare ongoing costs of investing in the Fund with those of other mutual funds. This information may not be used to estimate the actual ending account balance or expenses you paid during the period. The hypothetical “Ending Account Value” is based on the actual expense ratio for each class and an assumed 5% annual rate of return before expenses, which does not represent the Fund’s actual return. The figure under the heading “Expenses Paid During Period” shows the hypothetical expenses your account would have incurred under this scenario. You can compare this figure with the 5% hypothetical examples that appear in shareholder reports of other funds.
Annual Report | 13
Your Fund’s Expenses (continued)
Please note that expenses shown in the table are meant to highlight ongoing costs and do not reflect any transaction costs, such as sales charges. Therefore, the second line for each class is useful in comparing ongoing costs only, and will not help you compare total costs of owning different funds. In addition, if transaction costs were included, your total costs would have been higher. Please refer to the Fund prospectus for additional information on operating expenses.
| Beginning Account | Ending Account | Expenses Paid During | ||||
| Share Class | Value 11/1/13 | Value 4/30/14 | Period* 11/1/13– 4/30/14 | |||
| A | ||||||
| Actual | $ | 1,000 | $ | 1,088.30 | $ | 5.70 |
| Hypothetical (5% return before expenses) | $ | 1,000 | $ | 1,019.39 | $ | 5.51 |
| C | ||||||
| Actual (3/4/14-4/30/14) | $ | 1,000 | $ | 810.90 | $ | 2.59 |
| Hypothetical (5% return before expenses) | $ | 1,000 | $ | 1,019.29 | $ | 9.00 |
| R6 | ||||||
| Actual | $ | 1,000 | $ | 1,090.90 | $ | 3.27 |
| Hypothetical (5% return before expenses) | $ | 1,000 | $ | 1,021.72 | $ | 3.16 |
| Advisor | ||||||
| Actual | $ | 1,000 | $ | 1,090.10 | $ | 4.15 |
| Hypothetical (5% return before expenses) | $ | 1,000 | $ | 1,020.88 | $ | 4.01 |
*Expenses are calculated using the most recent six-month expense ratio, net of expense waivers, annualized for each class (A: 1.10%; C: 1.80%; R6: 0.63%; and Advisor: 0.80%), multiplied by the average account value over the period, multiplied by 181/365 to reflect the one-half year period for Class C hypothetical expenses and actual and hypothetical expenses for Classes A, R6 and Advisor. The multiplier is 58/365 for Class C actual expenses to reflect the number of days since inception.
14 | Annual Report
Franklin Natural Resources Fund
Your Fund’s Goal and Main Investments: Franklin Natural Resources Fund seeks high total return (total return consists of capital appreciation and current dividend and interest income) by investing at least 80% of its net assets in equity and debt securities of companies that own, produce, refine, process, transport or market natural resources, as well as those that provide related services for natural resources companies.
We are pleased to bring you Franklin Natural Resources Fund’s annual report for the fiscal year ended April 30, 2014.
Performance Overview
Franklin Natural Resources Fund – Class A delivered a +20.74% cumulative total return for the 12 months under review. In comparison, the Standard & Poor’s (S&P®) North American Natural Resources Index, which tracks companies involved in industries such as mining, energy, timber and forestry services, and the production of pulp and paper, produced a +20.76% total return.1, 2 Also in comparison, the S&P 500 Index, which is a broad measure of the U.S. stock market, generated a +20.44% total return.1, 2 Please note index performance information is provided for reference and we do not attempt to track any index but rather undertake investments on the basis of fundamental research. The Fund’s strategy, which focuses on companies with higher long-term growth potential, differs from the natural resources index’s large weighting in income-oriented companies with more limited growth opportunities. This difference may occasionally lead to wide performance discrepancies, especially in periods when investors focus on short-term safety and yield. You can find the Fund’s long-term performance data in the Performance Summary beginning on page 21.
| Performance data represent |
| past performance, which does |
| not guarantee future results. |
| Investment return and principal |
| value will fluctuate, and you may |
| have a gain or loss when you sell |
| your shares. Current performance |
| may differ from figures shown. |
| Please visit franklintempleton.com |
| or call (800) 342-5236 for most |
| recent month-end performance. |
Investment Strategy
We use a fundamental, research-driven approach to identify industries in the natural resources sector that we believe offer the strongest underlying attributes including, but not limited to, favorable supply and demand characteristics, barriers to entry, and pricing power. Within those industries, we seek to identify individual companies that have identifiable growth drivers and that present, in our opinion, the best trade-off between growth potential, business and financial risk, and valuation. The Fund’s holdings are typically concentrated in the energy sector but also can include investments in metals and mining, chemicals, paper and forest products, and other related sectors.
The dollar value, number of shares or principal amount, and names of all portfolio holdings are listed in the Fund’s Statement of Investments (SOI). The SOI begins on page 40.
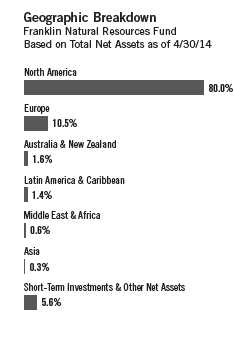
Annual Report | 15
Sector Overview
Global economic conditions generally improved during the 12-month review period, but weakness in some emerging market country economies, a partial U.S. federal government shutdown in October and geopolitical tensions in the Middle East and Eastern Europe weighed on investor sentiment and some commodities. Despite adverse weather in the U.S., the U.K. and Japan in early 2014, commodities were still primarily driven by an improved outlook for developed market economies as moderating growth in emerging markets provided limited support. Globally, inflation remained tame, as inflation rates in the eurozone and Japan remained well below their respective central banks’ targets. Overall, global commodity price performance strengthened, and near period-end the Thomson Reuters/CoreCommodity CRB Index of key materials reached a 12-month high as price declines for many precious and industrial metals were countered by price gains for agricultural and energy commodities.3 Although gold stocks generally weakened, many diversified metals and mining stocks strengthened. Energy stocks displayed broad strength as oil and natural gas prices recovered to healthy levels. In this environment, oil and gas equipment and services companies and oil and gas exploration and production companies were particularly strong.
World oil use reached a record level in March amid steady consumption growth in developing market countries and a modest recovery in U.S. demand. In addition, oil prices were bolstered by unrest in the Middle East and geopolitical tensions created by the conflict in Ukraine, which raised concerns about the stability of global oil supplies. Although crude oil prices rose for the 12-month review period and reached a multi-year high in early September, concerns remained over China’s slowing economic growth, moderating appetite for oil, and growing U.S. crude oil production and inventories. However, these concerns were partially offset by general optimism about U.S. economic growth and a continued recovery in eurozone economies. After declining during the first half of the period largely as a result of robust production, natural gas prices ended the period higher as severe winter weather in many parts of the U.S. increased heating demand and drew down stockpiles. U.S. energy production has grown notably during the past few years, driven by the application of new extraction methods and technology that resulted in gains in drilling efficiency, or the ability to produce more oil and gas with fewer rigs. The U.S. crude oil import level declined to an 18-year low in February, and in early 2014 U.S. oil production reached its highest level in more than 25 years.
16 | Annual Report
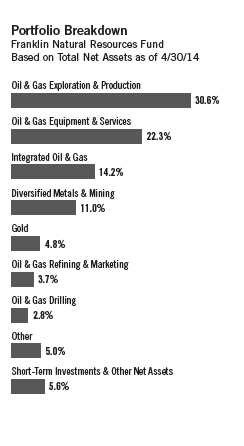
Prices for metals tended to decline as mining projects initiated in recent years commenced production and increased supply amid lackluster demand growth. The spot gold price fell more than 12% for the 12-month period as a combination of low inflation, stable economic growth and improved investor sentiment weighed on precious metals, although prices rebounded near period-end as a result of geopolitical tensions.4 Industrial metals generally trailed the performance of other commodities amid renewed concerns about economic growth in emerging market countries, particularly in China, and the potential impact on demand for base metals. In addition, several large mining projects were in the commissioning phase and could loosen the supply and demand balance over the next year or more. As a result, prices for several base metals remained near multi-year lows in April. However, continuing improvement across global economies should increase demand and, along with better capital discipline from producers, may help support prices for many commodities, including precious and industrial metals, over the long term.
Manager’s Discussion
The Fund’s overall performance was largely driven by investor recognition of positive fundamental trends in energy-related industries with higher operating leverage and growth potential, such as oil and gas equipment and services, oil and gas drilling, and oil and gas exploration and production (E&P). In contrast, diversified metals and mining, as well as coal and consumable fuels, under-performed as these industries reflected negative fundamental trends such as lackluster demand growth and increasing supply.
Relative to the benchmark S&P North American Natural Resources Index, the Fund benefited from certain sector weightings and stock selection. In particular, the Fund’s overweighted positions in two of the index’s best-performing industries, E&P and oil and gas equipment and services, contributed to relative performance, as these industries benefited from the U.S. onshore market’s growing resource development activity.
E&P was the Fund’s largest contributor to absolute performance as the industry featured several standout performers that appreciated strongly for the period, such as Triangle Petroleum,5 Matador Resources and Sanchez Energy, which are not included in the index, as well as Whiting Petroleum and Cimarex Energy. Our smaller, off-benchmark investment in Synergy Resources also rose significantly for the period. The only major E&P detractor was Cobalt
Annual Report | 17
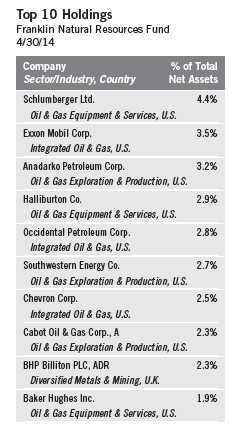
International Energy, which suffered after reporting disappointing exploration results. Although a lack of ownership in several strongly performing stocks negatively impacted relative performance, this effect was more than offset by the positive contributions of our investments in outperforming companies that possessed what we considered to be more attractive valuations and stronger growth profiles.
Oil and gas equipment and services was the second largest industry contributor to absolute performance, as nearly all holdings produced positive returns. Several had strong returns, including our positions in Key Energy Services and Weatherford International, as well as our off-benchmark investments in Rignet and PHI. Another strong, off-benchmark performer was Pioneer Energy Services, an oil and gas drilling company tied to the oil and gas equipment and services industry. The primary driver of industry performance was investor recognition of improving fundamental conditions in the onshore U.S. market, where many E&P companies planned to increase spending in 2014. This trend, in addition to service providers’ capital spending restraint, led to expectations for growing capacity utilization and the potential for stronger pricing and an acceleration in earnings growth. Conversely, shares of offshore-focused companies fared poorly as signs of a deceleration in spending growth began to emerge. Although the Fund owned some positions tied to the offshore markets, we reduced exposure over the second half of the period as we shifted our focus to companies with greater onshore development exposure.
The Fund’s underweighting in integrated oil and gas boosted relative results. Additionally, the Fund’s industry holdings outperformed those of the index, as off-benchmark positions in European companies, including France-based Total, outpaced their U.S. peers, which the Fund underweighted. In particular, the Fund’s underweighting in Chevron, which underperformed, was a leading contributor to relative performance. European integrated oil and gas companies generally outperformed as investors embraced their restructuring efforts and greater focus on investment returns and cash generation. Discounted valuations and signs of improvement in many European economies also likely contributed to European stocks’ healthy performance. The benefit of our off-benchmark investments in European integrated oil and gas companies was somewhat offset by weak performance of our off-benchmark position in Brazil’s national oil company Petroleo Brasileiro, which continued to suffer from production delays and government policies on fuel price regulation.
18 | Annual Report
Our slight underweighting and stock selection in the gold industry helped relative performance, although our overall gold holdings hurt absolute performance as the gold industry continued to struggle against a weak gold price and high production costs. Many gold companies have been making progress on cost rationalization and cash flow generation. Consequently, the stock performance of several companies improved beginning in the middle of December. Some of the Fund’s smaller positions recovered more strongly, however, particularly Osisko Mining, which rejected an acquisition bid in January from Goldcorp, another Fund holding, and subsequently accepted a joint acquisition bid from Agnico Eagle Mines and Yamana Gold in April. The Fund also benefited from a lack of ownership in certain large gold mining companies that performed poorly.
The Fund’s overall holdings in oil and gas refining and marketing companies outperformed those of the index and contributed to absolute performance. However, an underweighting detracted slightly from relative performance as the industry benefited from a widening price differential between the global benchmark Brent crude oil and the U.S. benchmark West Texas Intermediate (WTI) crude oil. This dynamic was primarily felt in the fourth quarter of 2013 when WTI crude oil prices fell to $92 per barrel amid views that rising inventories on the Gulf Coast would further pressure domestic oil prices, lower feedstock costs and increase refining margins, a situation that did not come to pass.4
Our overweighting in diversified metals and mining companies was the largest detractor from relative performance as investors continued to display aversion toward the sector. Initiatives such as cost cutting and capital spending reductions led to an improvement in corporate fundamentals that was reflected in the share prices of some companies such as Freeport McMoRan Copper & Gold and off-benchmark positions in global miners BHP Billiton and Rio Tinto. However, many companies remained out of favor with investors owing to concerns that base metal demand would wane amid signs of moderating growth in China and other emerging market countries. Investors were similarly cautious about metallurgical coal producers such as Peabody Energy, Alpha Natural Resources5 and Canada-based Teck Resources. Smaller capitalization, foreign-based companies were some of the worst performers as they suffered from negative sentiment toward companies with emerging market exposure, in addition to the general underperformance of emerging market equities. We maintained an overweighted allocation to diversified metals and mining companies compared to the index’s small weighting, given what we considered to be these companies’ relatively attractive valuations and longer term cash flow growth potential.
Annual Report | 19
Thank you for your continued participation in Franklin Natural Resources Fund. We look forward to serving your future investment needs.

The foregoing information reflects our analysis, opinions and portfolio holdings as of April 30, 2014, the end of the
reporting period. The way we implement our main investment strategies and the resulting portfolio holdings may
change depending on factors such as market and economic conditions. These opinions may not be relied upon as
investment advice or an offer for a particular security. The information is not a complete analysis of every aspect
of any market, country, industry, security or the Fund. Statements of fact are from sources considered reliable,
but the investment manager makes no representation or warranty as to their completeness or accuracy. Although
historical performance is no guarantee of future results, these insights may help you understand our investment
management philosophy.
The index is unmanaged and includes reinvested dividends. One cannot invest directly in an index, and an index is
not representative of the Fund’s portfolio.
1. Source: © 2014 Morningstar. All Rights Reserved. The information contained herein: (1) is proprietary to Morningstar
and/or its content providers; (2) may not be copied or distributed; and (3) is not warranted to be accurate, complete or
timely. Neither Morningstar nor its content providers are responsible for any damages or losses arising from any use of
this information.
2. S&P North American Natural Resources Index, S&P 500: Copyright © 2014, S&P Dow Jones Indices LLC. All rights
reserved. Reproduction of S&P Dow Jones Indices in any form is prohibited except with the prior written permission of
S&P. S&P does not guarantee the accuracy, adequacy, completeness or availability of any information and is not
responsible for any errors or omissions, regardless of the cause or for the results obtained from the use of such infor-
mation. S&P DISCLAIMS ANY AND ALL EXPRESS OR IMPLIED WARRANTIES, INCLUDING, BUT NOT LIMITED TO, ANY
WARRANTIES OF MERCHANTABILITY OR FITNESS FOR A PARTICULAR PURPOSE OR USE. In no event shall S&P be liable
for any direct, indirect, special or consequential damages, costs, expenses, legal fees, or losses (including lost income
or lost profit and opportunity costs) in connection with subscriber’s or others’ use of S&P Dow Jones Indices.
3. © Thomson Reuters 2014. All rights reserved.
4. Source: Bloomberg, L.P.
5. No longer held by period-end.
20 | Annual Report
Performance Summary as of 4/30/14
Franklin Natural Resources Fund
Your dividend income will vary depending on dividends or interest paid by securities in the Fund’s portfolio, adjusted for operating expenses of each class. Capital gain distributions are net profits realized from the sale of portfolio securities. The performance table and graphs do not reflect any taxes that a shareholder would pay on Fund dividends, capital gain distributions, if any, or any realized gains on the sale of Fund shares. Total return reflects reinvestment of the Fund’s dividends and capital gain distributions, if any, and any unrealized gains or losses.
| Net Asset Value | ||||||
| Share Class | 4/30/14 | 4/30/13 | Change | |||
| A (FRNRX) | $ | 39.79 | $ | 33.03 | +$ | 6.76 |
| C (FNCRX) | $ | 38.39 | $ | 32.02 | +$ | 6.37 |
| Advisor (FNRAX) | $ | 42.52 | $ | 35.31 | +$ | 7.21 |
| 9/20/13 | ||||||
| R6 (n/a) | $ | 42.58 | $ | 38.28 | +$ | 4.30 |
| Distributions | ||||||
| Share Class | Dividend Income | |||||
| A (5/1/13–4/30/14) | $ | 0.0781 | ||||
| R6 (9/20/13–4/30/14) | $ | 0.2017 | ||||
| Advisor (5/1/13–4/30/14) | $ | 0.2017 | ||||
Annual Report | 21
Performance Summary (continued)
Performance as of 4/30/141
Cumulative total return excludes sales charges. Average annual total returns and value of $10,000 investment include maximum sales charges. Class A: 5.75% maximum initial sales charge; Class C: 1% contingent deferred sales charge in first year only; Class R6/Advisor Class: no sales charges.
| Value of | Average Annual | Total Annual | |||||||||||
| Cumulative | Average Annual | $ | 10,000 | Total Return | Operating | ||||||||
| Share Class | Total Return2 | Total Return3 | Investment4 | (3/31/14 | )5 | Expenses6 | |||||||
| A | 1.08 | % | |||||||||||
| 1-Year | + | 20.74 | % | + | 13.78 | % | $ | 11,378 | + | 3.62 | % | ||
| 5-Year | + | 83.78 | % | + | 11.61 | % | $ | 17,318 | + | 13.23 | % | ||
| 10-Year | + | 184.85 | % | + | 10.38 | % | $ | 26,843 | + | 9.77 | % | ||
| C | 1.77 | % | |||||||||||
| 1-Year | + | 19.89 | % | + | 18.89 | % | $ | 11,889 | + | 8.18 | % | ||
| 5-Year | + | 77.41 | % | + | 12.15 | % | $ | 17,741 | + | 13.80 | % | ||
| Since Inception (9/1/05) | + | 59.62 | % | + | 5.55 | % | $ | 15,962 | + | 4.99 | % | ||
| R67 | 0.48 | % | |||||||||||
| Since Inception (9/20/13) | + | 11.83 | % | + | 11.83 | % | $ | 11,183 | + | 6.27 | % | ||
| Advisor | 0.78 | % | |||||||||||
| 1-Year | + | 21.07 | % | + | 21.07 | % | $ | 12,107 | + | 10.28 | % | ||
| 5-Year | + | 86.51 | % | + | 13.28 | % | $ | 18,651 | + | 14.93 | % | ||
| 10-Year | + | 193.46 | % | + | 11.37 | % | $ | 29,346 | + | 10.75 | % |
Performance data represent past performance, which does not guarantee future results. Investment return and principal value will fluctuate, and you may have a gain or loss when you sell your shares. Current performance may differ from figures shown. For most recent month-end performance, go to franklintempleton.com or call (800) 342-5236.
22 | Annual Report
Performance Summary (continued)
Total Return Index Comparison for a Hypothetical $10,000 Investment1
Total return represents the change in value of an investment over the periods shown. It includes any applicable, maximum sales charge, Fund expenses, account fees and reinvested distributions. The unmanaged indexes include reinvestment of any income or distributions. They differ from the Fund in composition and do not pay management fees or expenses. One cannot invest directly in an index.

Annual Report | 23
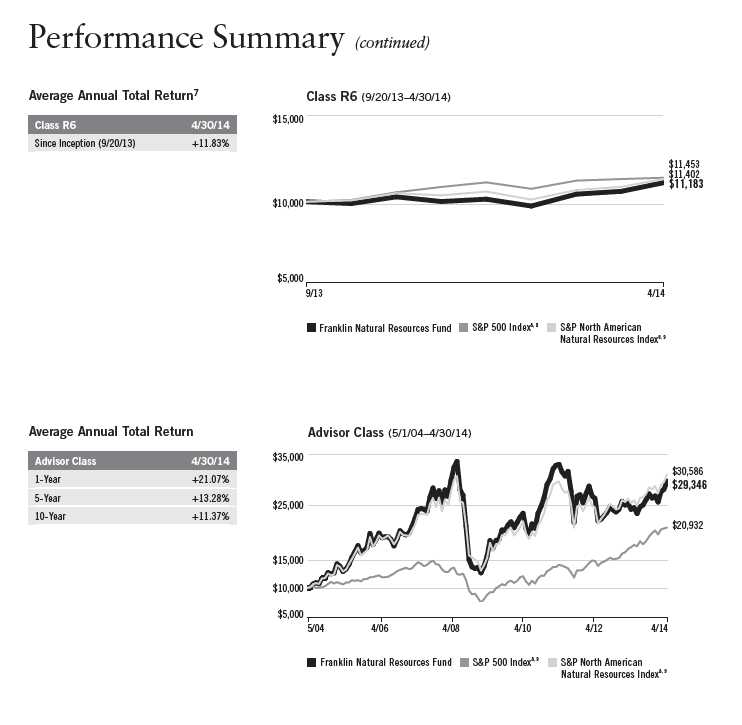
24 | Annual Report
Performance Summary (continued)
All investments involve risks, including possible loss of principal. Investing in a fund concentrating in the natural resources sector involves special risks, including increased susceptibility to adverse economic and regulatory developments affecting the sector. Smaller companies can be particularly sensitive to changes in economic conditions and have less certain growth prospects than larger, more established companies and can be volatile, especially over the short term. The Fund may also invest in foreign companies, which involve special risks, including currency fluctuations and political uncertainty. The Fund is actively managed but there is no guarantee that the manager’s investment decisions will produce the desired results. The Fund’s prospectus also includes a description of the main investment risks.
Class C: These shares have higher annual fees and expenses than Class A shares.
Class R6: Shares are available to certain eligible investors as described in the prospectus.
Advisor Class: Shares are available to certain eligible investors as described in the prospectus.
1. The Fund has a fee waiver associated with its investments in a Franklin Templeton money fund, contractually guaranteed through at least its
current fiscal year-end. Fund investment results reflect the fee waiver, to the extent applicable; without this reduction, the results would have
been lower.
2. Cumulative total return represents the change in value of an investment over the periods indicated.
3. Average annual total return represents the average annual change in value of an investment over the periods indicated.
4. These figures represent the value of a hypothetical $10,000 investment in the Fund over the periods indicated.
5. In accordance with SEC rules, we provide standardized average annual total return information through the latest calendar quarter.
6. Figures are as stated in the Fund’s current prospectus. In periods of market volatility, assets may decline significantly, causing total annual Fund
operating expenses to become higher than the figures shown.
7. Performance is not annualized.
8. Source: © 2014 Morningstar. The S&P 500 Index is a market capitalization-weighted index of 500 stocks designed to measure total U.S. equity
market performance. The S&P North American Natural Resources Index is a modified capitalization-weighted index that includes companies involved
in extractive industries (mining), energy and forestry services, producers of pulp and paper, and owners and operators of timber tracts or plantations.
9. Copyright © 2014, S&P Dow Jones Indices LLC. All rights reserved. Reproduction of S&P Dow Jones Indices in any form is prohibited except with
the prior written permission of S&P. S&P does not guarantee the accuracy, adequacy, completeness or availability of any information and is not
responsible for any errors or omissions, regardless of the cause or for the results obtained from the use of such information. S&P DISCLAIMS ANY
AND ALL EXPRESS OR IMPLIED WARRANTIES, INCLUDING, BUT NOT LIMITED TO, ANY WARRANTIES OF MERCHANTABILITY OR FITNESS FOR A PARTICULAR
PURPOSE OR USE. In no event shall S&P be liable for any direct, indirect, special or consequential damages, costs, expenses, legal fees, or losses
(including lost income or lost profit and opportunity costs) in connection with subscriber’s or others’ use of S&P Dow Jones Indices.
Annual Report | 25
Your Fund’s Expenses
Franklin Natural Resources Fund
As a Fund shareholder, you can incur two types of costs:
- Transaction costs, including sales charges (loads) on Fund purchases; and
- Ongoing Fund costs, including management fees, distribution and service (12b-1) fees, and other Fund expenses. All mutual funds have ongoing costs, sometimes referred to as operating expenses.
The following table shows ongoing costs of investing in the Fund and can help you understand these costs and compare them with those of other mutual funds. The table assumes a $1,000 investment held for the six months indicated.
Actual Fund Expenses
The first line (Actual) for each share class listed in the table provides actual account values and expenses. The “Ending Account Value” is derived from the Fund’s actual return, which includes the effect of Fund expenses.
You can estimate the expenses you paid during the period by following these steps. Of course, your account value and expenses will differ from those in this illustration:
| 1. | Divide your account value by $1,000. |
| If an account had an $8,600 value, then $8,600 ÷ $1,000 = 8.6. | |
| 2. | Multiply the result by the number under the heading “Expenses Paid During Period.” |
| If Expenses Paid During Period were $7.50, then 8.6 x $7.50 = $64.50. |
In this illustration, the estimated expenses paid this period are $64.50.
Hypothetical Example for Comparison with Other Funds
Information in the second line (Hypothetical) for each class in the table can help you compare ongoing costs of investing in the Fund with those of other mutual funds. This information may not be used to estimate the actual ending account balance or expenses you paid during the period. The hypothetical “Ending Account Value” is based on the actual expense ratio for each class and an assumed 5% annual rate of return before expenses, which does not represent the Fund’s actual return. The figure under the heading “Expenses Paid During Period” shows the hypothetical expenses your account would have incurred under this scenario. You can compare this figure with the 5% hypothetical examples that appear in shareholder reports of other funds.
26 | Annual Report
Your Fund’s Expenses (continued)
Please note that expenses shown in the table are meant to highlight ongoing costs and do not reflect any transaction costs, such as sales charges. Therefore, the second line for each class is useful in comparing ongoing costs only, and will not help you compare total costs of owning different funds. In addition, if transaction costs were included, your total costs would have been higher. Please refer to the Fund prospectus for additional information on operating expenses.
| Beginning Account | Ending Account | Expenses Paid During | ||||
| Share Class | Value 11/1/13 | Value 4/30/14 | Period* 11/1/13– 4/30/14 | |||
| A | ||||||
| Actual | $ | 1,000 | $ | 1,083.70 | $ | 5.48 |
| Hypothetical (5% return before expenses) | $ | 1,000 | $ | 1,019.54 | $ | 5.31 |
| C | ||||||
| Actual | $ | 1,000 | $ | 1,079.90 | $ | 8.87 |
| Hypothetical (5% return before expenses) | $ | 1,000 | $ | 1,016.27 | $ | 8.60 |
| R6 | ||||||
| Actual | $ | 1,000 | $ | 1,086.60 | $ | 2.74 |
| Hypothetical (5% return before expenses) | $ | 1,000 | $ | 1,022.07 | $ | 2.66 |
| Advisor | ||||||
| Actual | $ | 1,000 | $ | 1,085.30 | $ | 3.77 |
| Hypothetical (5% return before expenses) | $ | 1,000 | $ | 1,021.17 | $ | 3.66 |
*Expenses are calculated using the most recent six-month expense ratio, net of expense waivers, annualized for each class (A: 1.06%; C: 1.72%; R6: 0.53% and Advisor: 0.73%), multiplied by the average account value over the period, multiplied by 181/365 to reflect the one-half year period.
Annual Report | 27
| Franklin Strategic Series | |||||||||||||||
| Financial Highlights | |||||||||||||||
| Franklin Biotechnology Discovery Fund | |||||||||||||||
| Year Ended April 30, | |||||||||||||||
| Class A | 2014 | 2013 | 2012 | 2011 | 2010 | ||||||||||
| Per share operating performance | |||||||||||||||
| (for a share outstanding throughout the year) | |||||||||||||||
| Net asset value, beginning of year | $ | 105.95 | $ | 76.22 | $ | 77.78 | $ | 65.08 | $ | 49.73 | |||||
| Income from investment operationsa: | |||||||||||||||
| Net investment income (loss)b | (1.07 | ) | (0.76 | ) | (0.75 | ) | (0.80 | ) | (0.51 | ) | |||||
| Net realized and unrealized gains (losses) | 33.18 | 30.56 | 9.02 | 13.50 | 15.86 | ||||||||||
| Total from investment operations | 32.11 | 29.80 | 8.27 | 12.70 | 15.35 | ||||||||||
| Less distributions from: | |||||||||||||||
| Net investment income | — | (0.07 | ) | (0.52 | ) | — | — | ||||||||
| Net realized gains | (8.79 | ) | — | (9.31 | ) | — | — | ||||||||
| Total distributions | (8.79 | ) | (0.07 | ) | (9.83 | ) | — | — | |||||||
| Net asset value, end of year | $ | 129.27 | $ | 105.95 | $ | 76.22 | $ | 77.78 | $ | 65.08 | |||||
| Total returnc | 30.60 | % | 39.12 | % | 13.18 | % | 19.51 | % | 30.87 | % | |||||
| Ratios to average net assets | |||||||||||||||
| Expenses | 1.10 | %d,e | 1.20 | % | 1.26 | % | 1.31 | %e | 1.32 | %e | |||||
| Net investment income (loss) | (0.82 | )% | (0.88 | )% | (1.03 | )% | (1.24 | )% | (0.87 | )% | |||||
| Supplemental data | |||||||||||||||
| Net assets, end of year (000’s) | $ | 1,141,890 | $ | 653,718 | $ | 434,678 | $ | 402,112 | $ | 346,127 | |||||
| Portfolio turnover rate | 48.70 | % | 33.64 | % | 46.54 | % | 235.14 | % | 41.58 | % | |||||
aThe amount shown for a share outstanding throughout the period may not correlate with the Statement of Operations for the period due to the timing of sales and repurchases of
the Fund shares in relation to income earned and/or fluctuating fair value of the investments of the Fund.
bBased on average daily shares outstanding.
cTotal return does not reflect sales commissions or contingent deferred sales charges, if applicable.
dBenefit of waiver and payments by affiliates rounds to less than 0.01%.
eBenefit of expense reduction rounds to less than 0.01%.
28 | The accompanying notes are an integral part of these financial statements. | Annual Report
| Franklin Strategic Series | |||
| Financial Highlights (continued) | |||
| Franklin Biotechnology Discovery Fund | |||
| Period Ended | |||
| April 30, | |||
| Class C | 2014 | a | |
| Per share operating performance | |||
| (for a share outstanding throughout the period) | |||
| Net asset value, beginning of period | $ | 159.15 | |
| Income from investment operationsb: | |||
| Net investment income (loss)c | (0.34 | ) | |
| Net realized and unrealized gains (losses) | (29.70 | ) | |
| Total from investment operations | (30.04 | ) | |
| Net asset value, end of period | $ | 129.11 | |
| Total returnd | (18.88 | )% | |
| Ratios to average net assetse | |||
| Expensesf | 1.80 | % | |
| Net investment income (loss) | (1.52 | )% | |
| Supplemental data | |||
| Net assets, end of period (000’s) | $ | 5,486 | |
| Portfolio turnover rate | 48.70 | % | |
aFor the period March 4, 2014 (effective date) to April 30, 2014.
bThe amount shown for a share outstanding throughout the period may not correlate with the Statement of Operations for the period due to the timing of sales and repurchases of
the Fund shares in relation to income earned and/or fluctuating fair value of the investments of the Fund.
cBased on average daily shares outstanding.
dTotal return does not reflect sales commissions or contingent deferred sales charges, if applicable, and is not annualized for periods less than one year.
eRatios are annualized for periods less than one year.
fBenefit of waiver and payments by affiliates and expense reduction rounds to less than 0.01%.
Annual Report | The accompanying notes are an integral part of these financial statements. | 29
| Franklin Strategic Series | |||
| Financial Highlights (continued) | |||
| Franklin Biotechnology Discovery Fund | |||
| Year Ended | |||
| April 30, | |||
| Class R6 | 2014 | a | |
| Per share operating performance | |||
| (for a share outstanding throughout the year) | |||
| Net asset value, beginning of year | $ | 104.56 | |
| Income from investment operationsb: | |||
| Net investment income (loss)c | (0.49 | ) | |
| Net realized and unrealized gains (losses) | 35.81 | ||
| Total from investment operations | 35.32 | ||
| Less distributions from net realized gains | (8.79 | ) | |
| Net asset value, end of year | $ | 131.09 | |
| Total return | 34.10 | % | |
| Ratios to average net assets | |||
| Expensesd | 0.63 | % | |
| Net investment income (loss) | (0.35 | )% | |
| Supplemental data | |||
| Net assets, end of year (000’s) | $ | 50,846 | |
| Portfolio turnover rate | 48.70 | % | |
aFor the year May 1, 2013 (effective date) to April 30, 2014.
bThe amount shown for a share outstanding throughout the period may not correlate with the Statement of Operations for the period due to the timing of sales and repurchases of
the Fund shares in relation to income earned and/or fluctuating fair value of the investments of the Fund.
cBased on average daily shares outstanding.
dBenefit of waiver and payments by affiliates and expense reduction rounds to less than 0.01%.
30 | The accompanying notes are an integral part of these financial statements. | Annual Report
| Franklin Strategic Series | |||||||||||||||
| Financial Highlights (continued) | |||||||||||||||
| Franklin Biotechnology Discovery Fund | |||||||||||||||
| Year Ended April 30, | |||||||||||||||
| Advisor Class | 2014 | 2013 | 2012 | 2011 | 2010 | a | |||||||||
| Per share operating performance | |||||||||||||||
| (for a share outstanding throughout the year) | |||||||||||||||
| Net asset value, beginning of year | $ | 106.86 | $ | 76.65 | $ | 78.15 | $ | 65.20 | $ | 57.01 | |||||
| Income from investment operationsb: | |||||||||||||||
| Net investment income (loss)c | (0.69 | ) | (0.52 | ) | (0.53 | ) | (0.62 | ) | (0.40 | ) | |||||
| Net realized and unrealized gains (losses) | 33.48 | 30.80 | 9.05 | 13.57 | 8.59 | ||||||||||
| Total from investment operations | 32.79 | 30.28 | 8.52 | 12.95 | 8.19 | ||||||||||
| Less distributions from: | |||||||||||||||
| Net investment income | — | (0.07 | ) | (0.71 | ) | — | — | ||||||||
| Net realized gains | (8.79 | ) | — | (9.31 | ) | — | — | ||||||||
| Total distributions | (8.79 | ) | (0.07 | ) | (10.02 | ) | — | — | |||||||
| Net asset value, end of year | $ | 130.86 | $ | 106.86 | $ | 76.65 | $ | 78.15 | $ | 65.20 | |||||
| Total returnd | 31.02 | % | 39.51 | % | 13.51 | % | 19.86 | % | 14.37 | % | |||||
| Ratios to average net assetse | |||||||||||||||
| Expenses | 0.80 | %f,g | 0.91 | % | 0.97 | % | 1.02 | %g | 1.05 | %g | |||||
| Net investment income (loss) | (0.52 | )% | (0.59 | )% | (0.74 | )% | (0.95 | )% | (0.60 | )% | |||||
| Supplemental data | |||||||||||||||
| Net assets, end of year (000’s) | $ | 91,012 | $ | 25,744 | $ | 9,330 | $ | 5,009 | $ | 1,596 | |||||
| Portfolio turnover rate | 48.70 | % | 33.64 | % | 46.54 | % | 235.14 | % | 41.58 | % | |||||
aFor the period September 1, 2009 (effective date) to April 30, 2010.
bThe amount shown for a share outstanding throughout the period may not correlate with the Statement of Operations for the period due to the timing of sales and repurchases of
the Fund shares in relation to income earned and/or fluctuating fair value of the investments of the Fund.
cBased on average daily shares outstanding.
dTotal return is not annualized for periods less than one year.
eRatios are annualized for periods less than one year.
fBenefit of waiver and payments by affiliates rounds to less than 0.01%.
gBenefit of expense reduction rounds to less than 0.01%.
Annual Report | The accompanying notes are an integral part of these financial statements. | 31
Franklin Strategic Series
Statement of Investments, April 30, 2014
| Franklin Biotechnology Discovery Fund | Country | Shares/Warrants | Value | |
| Common Stocks and Other Equity Interests 98.8% | ||||
| Biotechnology 82.5% | ||||
| a,bAcadia Pharmaceuticals Inc. | United States | 645,400 | $ | 12,991,902 |
| a,bAcceleron Pharma Inc. | United States | 229,000 | 7,866,150 | |
| aAcorda Therapeutics Inc. | United States | 184,462 | 6,539,178 | |
| a,bADMA Biologics Inc. | United States | 133,400 | 1,033,850 | |
| a,bAgios Pharmaceuticals Inc. | United States | 140,400 | 5,905,224 | |
| a,bAkebia Therapeutics Inc. | United States | 164,800 | 4,016,176 | |
| aAlexion Pharmaceuticals Inc. | United States | 253,700 | 40,135,340 | |
| aAlkermes PLC | United States | 160,200 | 7,410,852 | |
| aAlnylam Pharmaceuticals Inc. | United States | 349,400 | 17,305,782 | |
| a,bAmarin Corp. PLC, ADR | Ireland | 1,457,900 | 2,361,798 | |
| Amgen Inc. | United States | 607,000 | 67,832,250 | |
| aAnthera Pharmaceuticals Inc. | United States | 292,062 | 826,536 | |
| aAquinox Pharmaceuticals Inc. | Canada | 205,700 | 1,878,041 | |
| a,bARIAD Pharmaceuticals Inc. | United States | 1,651,327 | 12,005,147 | |
| aArrowhead Research Corp. | United States | 530,000 | 5,777,000 | |
| aAuspex Pharmaceuticals Inc. | United States | 184,300 | 3,951,392 | |
| a,bBIND Therapeutics Inc. | United States | 146,800 | 1,384,324 | |
| aBiogen Idec Inc. | United States | 344,461 | 98,901,642 | |
| aBioMarin Pharmaceutical Inc. | United States | 471,656 | 27,464,530 | |
| aBiospecifics Technologies Corp. | United States | 103,450 | 2,454,869 | |
| a,bBluebird Bio Inc. | United States | 133,128 | 2,635,934 | |
| a,bCara Therapeutics Inc. | United States | 202,400 | 2,912,536 | |
| a,bCatalyst Pharmaceutical Partners Inc. | United States | 782,400 | 1,627,392 | |
| aCelgene Corp. | United States | 448,100 | 65,875,181 | |
| aCelldex Therapeutics Inc. | United States | 1,320,029 | 19,800,435 | |
| a,bChemoCentryx Inc. | United States | 595,308 | 3,262,288 | |
| aClovis Oncology Inc. | United States | 215,400 | 11,646,678 | |
| aConcert Pharmaceuticals Inc. | United States | 263,800 | 2,358,372 | |
| aCuris Inc. | United States | 525,100 | 1,186,726 | |
| aCytokinetics Inc. | United States | 329,700 | 1,500,135 | |
| a,bCytRx Corp. | United States | 589,000 | 1,808,230 | |
| a,bDicerna Pharmaceuticals Inc. | United States | 237,523 | 4,458,307 | |
| aDyax Corp. | United States | 378,900 | 2,504,529 | |
| aDynavax Technologies Corp. | United States | 2,460,700 | 4,010,941 | |
| a,bEleven Biotherapeutics Inc. | United States | 313,900 | 4,234,511 | |
| aFiveprime Therapeutics Inc. | United States | 159,000 | 2,221,230 | |
| aGilead Sciences Inc. | United States | 1,806,500 | 141,792,185 | |
| aGlycoMimetics Inc. | United States | 337,000 | 4,471,990 | |
| aHalozyme Therapeutics Inc. | United States | 809,979 | 6,034,344 | |
| a,bHeat Biologics Inc. | United States | 279,200 | 1,521,640 | |
| aHeron Therapeutics Inc. | United States | 965,010 | 11,628,371 | |
| a,cHeron Therapeutics Inc., wts., 144A, 7/01/16 | United States | 278,594 | 2,354,119 | |
| aHyperion Therapeutics Inc. | United States | 85,300 | 2,101,792 | |
| aIncyte Corp. | United States | 779,100 | 37,833,096 | |
| aInfinity Pharmaceuticals Inc. | United States | 174,000 | 1,699,980 | |
| aInsmed Inc. | United States | 417,926 | 5,825,888 | |
| a,dIntarcia Therapeutics Inc., DD | United States | 80,195 | 2,582,279 | |
| aIntercept Pharmaceuticals Inc. | United States | 44,400 | 11,726,928 |
32 | Annual Report
Franklin Strategic Series
Statement of Investments, April 30, 2014 (continued)
| Franklin Biotechnology Discovery Fund | Country | Shares/Warrants | Value | |
| Common Stocks and Other Equity Interests (continued) | ||||
| Biotechnology (continued) | ||||
| a,bIntrexon Corp. | United States | 66,049 | $ | 1,247,005 |
| aIsis Pharmaceuticals Inc. | United States | 444,500 | 11,828,145 | |
| a,bKaryopharm Therapeutics Inc. | United States | 445,900 | 11,963,497 | |
| a,bKeryx Biopharmaceuticals Inc. | United States | 902,900 | 13,335,833 | |
| a,bLa Jolla Pharmaceutical Co. | United States | 320,400 | 2,928,456 | |
| a,cLorus Therapeutics Inc., 144A | Canada | 5,866,600 | 3,050,921 | |
| aLpath Inc., A | United States | 437,485 | 1,854,936 | |
| aMacroGenics Inc. | United States | 165,900 | 3,308,046 | |
| a,bMast Therapeutics Inc. | United States | 5,353,500 | 3,073,444 | |
| aMast Therapeutics Inc., wts., 6/14/18 | United States | 4,544,600 | 908,920 | |
| aMedivation Inc. | United States | 945,454 | 56,925,785 | |
| a,bMEI Pharma Inc. | United States | 412,365 | 3,224,694 | |
| a,bMirati Therapeutics Inc. | Canada | 322,200 | 6,070,248 | |
| aMomenta Pharmaceutical Inc. | United States | 143,700 | 1,641,054 | |
| aNeurocrine Biosciences Inc. | United States | 690,900 | 9,686,418 | |
| a,bNewLink Genetics Corp. | United States | 274,800 | 6,045,600 | |
| a,bNorthwest Biotherapeutics Inc. | United States | 684,260 | 4,064,504 | |
| aNorthwest Biotherapeutics Inc., wts., 8/08/14 | United States | 223,880 | 579,849 | |
| a,eNorthwest Biotherapeutics Inc., wts., 2/20/19 | United States | 223,880 | 1,114,434 | |
| aNovavax Inc. | United States | 1,332,300 | 5,835,474 | |
| aNPS Pharmaceuticals Inc. | United States | 223,900 | 5,960,218 | |
| a,bOncoMed Pharmaceuticals Inc. | United States | 91,700 | 2,415,378 | |
| a,bOncothyreon Inc. | United States | 1,413,000 | 4,041,180 | |
| a,bOrexigen Therapeutics Inc. | United States | 1,145,200 | 6,436,024 | |
| a,cOvaScience Inc., 144A | United States | 166,654 | 1,353,231 | |
| aPharmacyclics Inc. | United States | 144,100 | 13,628,978 | |
| aPortola Pharmaceuticals Inc. | United States | 447,100 | 10,488,966 | |
| aProgenics Pharmaceuticals Inc. | United States | 267,701 | 944,985 | |
| a,bProsensa Holding NV | Netherlands | 100,300 | 701,097 | |
| aPTC Therapeutics Inc. | United States | 160,000 | 3,126,400 | |
| aPuma Biotechnology Inc. | United States | 206,344 | 15,587,226 | |
| aReceptos Inc. | United States | 394,541 | 13,331,540 | |
| aRegeneron Pharmaceuticals Inc. | United States | 222,509 | 66,060,697 | |
| aSangamo BioSciences Inc. | United States | 342,700 | 4,742,968 | |
| aSophiris Bio Inc. | Canada | 212,600 | 701,580 | |
| aStemline Therapeutics Inc. | United States | 354,400 | 5,425,864 | |
| a,bSunesis Pharmaceuticals Inc. | United States | 577,400 | 2,962,062 | |
| aTargacept Inc. | United States | 849,686 | 3,772,606 | |
| aTekmira Pharmaceuticals Corp. | Canada | 726,200 | 9,651,198 | |
| aTesaro Inc. | United States | 254,100 | 6,342,336 | |
| aThreshold Pharmaceuticals Inc. | United States | 616,100 | 2,526,010 | |
| aThreshold Pharmaceuticals Inc., wts., 3/16/16 | United States | 190,476 | 124,952 | |
| aTonix Pharmaceuticals Holding Corp. | United States | 164,181 | 1,597,481 | |
| aUltragenyx Pharmaceutical Inc. | United States | 82,400 | 3,195,472 | |
| aUnited Therapeutics Corp. | United States | 77,600 | 7,760,776 | |
| aVerastem Inc. | United States | 97,200 | 811,620 | |
| aVertex Pharmaceuticals Inc. | United States | 469,600 | 31,791,920 | |
| 1,063,828,048 |
Annual Report | 33
Franklin Strategic Series
Statement of Investments, April 30, 2014 (continued)
| Franklin Biotechnology Discovery Fund | Country | Shares/Warrants | Value | ||
| Common Stocks and Other Equity Interests (continued) | |||||
| Health Care Equipment & Supplies 0.2% | |||||
| a,bCerus Corp. | United States | 512,400 | $ | 2,218,692 | |
| Life Sciences Tools & Services 3.6% | |||||
| aFluidigm Corp. | United States | 269,500 | 10,122,420 | ||
| aIllumina Inc. | United States | 267,900 | 36,394,215 | ||
| 46,516,635 | |||||
| Pharmaceuticals 12.5% | |||||
| a,bAcelRx Pharmaceuticals Inc. | United States | 284,900 | 3,082,618 | ||
| Allergan Inc. | United States | 157,900 | 26,186,136 | ||
| aAratana Therapeutics Inc. | United States | 367,400 | 5,062,772 | ||
| aAuxilium Pharmaceuticals Inc. | United States | 320,000 | 7,203,200 | ||
| a,fCelsus Therapeutics PLC, ADR | United Kingdom | 289,817 | 1,773,680 | ||
| a,bGW Pharmaceuticals PLC, ADR | United Kingdom | 142,497 | 10,416,531 | ||
| a,bHorizon Pharma Inc. | United States | 288,000 | 4,083,840 | ||
| aIntra-Cellular Therapies Inc. | United States | 305,600 | 5,103,520 | ||
| aJazz Pharmaceuticals PLC | United States | 93,700 | 12,640,130 | ||
| aNektar Therapeutics | United States | 930,600 | 10,953,162 | ||
| aNuvo Research Inc. | Canada | 112,036 | 341,408 | ||
| a,cNuvo Research Inc., 144A | Canada | 52,941 | 161,327 | ||
| aPacira Pharmaceuticals Inc. | United States | 56,800 | 3,890,232 | ||
| a,bRepros Therapeutics Inc. | United States | 742,125 | 12,519,649 | ||
| aSagent Pharmaceuticals Inc. | United States | 776,600 | 16,067,854 | ||
| aSalix Pharmaceuticals Ltd. | United States | 36,400 | 4,004,000 | ||
| aSciClone Pharmaceuticals Inc. | United States | 1,576,460 | 7,535,479 | ||
| Shire PLC, ADR | Ireland | 143,000 | 24,560,250 | ||
| a,bTherapeuticsMD Inc. | United States | 1,285,600 | 5,399,520 | ||
| aTranscept Pharmaceuticals Inc. | United States | 163,581 | 482,564 | ||
| 161,467,872 | |||||
| Total Common Stocks and Other Equity Interests | |||||
| (Cost $939,326,036) | 1,274,031,247 | ||||
| Preferred Stocks (Cost $5,065,937) 0.5% | |||||
| Biotechnology 0.5% | |||||
| a,dFibroGen Inc., pfd., E | United States | 1,128,271 | 6,386,014 | ||
| Total Investments before Short Term Investments | |||||
| (Cost $944,391,973) | 1,280,417,261 | ||||
| Short Term Investments 8.8% | |||||
| Money Market Funds (Cost $9,738,828) 0.8% | |||||
| a,gInstitutional Fiduciary Trust Money Market Portfolio | United States | 9,738,828 | 9,738,828 | ||
| hInvestments from Cash Collateral Received for Loaned Securities | |||||
| (Cost $103,270,161) 8.0% | |||||
| Money Market Funds 8.0% | |||||
| iBNY Mellon Overnight Government Fund, 0.05% | United States | 103,270,161 | 103,270,161 | ||
| Total Investments (Cost $1,057,400,962) 108.1% | 1,393,426,250 | ||||
| Other Assets, less Liabilities (8.1)% | (104,192,333 | ) | |||
| Net Assets 100.0% | $ | 1,289,233,917 | |||
| 34 | Annual Report | |||||
Franklin Strategic Series
Statement of Investments, April 30, 2014 (continued)
Franklin Biotechnology Discovery Fund
See Abbreviations on page 61.
aNon-income producing.
bA portion or all of the security is on loan at April 30, 2014. See Note 1(c).
cSecurity was purchased pursuant to Rule 144A under the Securities Act of 1933 and may be sold in transactions exempt from registration only to qualified institutional buyers or
in a public offering registered under the Securities Act of 1933. These securities have been deemed liquid under guidelines approved by the Trust’s Board of Trustees. At April 30,
2014, the aggregate value of these securities was $6,919,598, representing 0.54% of net assets.
dSee Note 7 regarding restricted securities.
eSecurity has been deemed illiquid because it may not be able to be sold within seven days. At April 30, 2014, the value of this security was $1,114,434, representing 0.09% of
net assets.
fSee Note 8 regarding holdings of 5% voting securities.
gSee Note 3(f) regarding investments in the Institutional Fiduciary Trust Money Market Portfolio.
hSee Note 1(c) regarding securities on loan.
iThe rate shown is the annualized seven-day yield at period end.
Annual Report | The accompanying notes are an integral part of these financial statements. | 35
| Franklin Strategic Series | |||||||||||||||
| Financial Highlights | |||||||||||||||
| Franklin Natural Resources Fund | |||||||||||||||
| Year Ended April 30, | |||||||||||||||
| Class A | 2014 | 2013 | 2012 | 2011 | 2010 | ||||||||||
| Per share operating performance | |||||||||||||||
| (for a share outstanding throughout the year) | |||||||||||||||
| Net asset value, beginning of year | $ | 33.03 | $ | 35.81 | $ | 44.75 | $ | 33.15 | $ | 22.55 | |||||
| Income from investment operationsa: | |||||||||||||||
| Net investment incomeb | 0.19 | 0.08 | 0.04 | 0.03 | 0.01 | ||||||||||
| Net realized and unrealized gains (losses) | 6.65 | (2.86 | ) | (8.72 | ) | 12.21 | 11.02 | ||||||||
| Total from investment operations | 6.84 | (2.78 | ) | (8.68 | ) | 12.24 | 11.03 | ||||||||
| Less distributions from net investment income | (0.08 | ) | — | (0.26 | ) | (0.64 | ) | (0.43 | ) | ||||||
| Net asset value, end of year | $ | 39.79 | $ | 33.03 | $ | 35.81 | $ | 44.75 | $ | 33.15 | |||||
| Total returnc | 20.74 | % | (7.76 | )% | (19.36 | )% | 37.31 | % | 49.04 | % | |||||
| Ratios to average net assets | |||||||||||||||
| Expenses | 1.07 | %d,e | 1.08 | % | 1.03 | % | 1.00 | % | 1.04 | %e | |||||
| Net investment income | 0.53 | % | 0.26 | % | 0.11 | % | 0.07 | % | 0.02 | % | |||||
| Supplemental data | |||||||||||||||
| Net assets, end of year (000’s) | $ | 624,250 | $ | 628,722 | $ | 827,693 | $1,153,098 | $ | 673,662 | ||||||
| Portfolio turnover rate | 21.03 | % | 20.40 | % | 26.75 | % | 23.60 | % | 31.18 | % | |||||
aThe amount shown for a share outstanding throughout the period may not correlate with the Statement of Operations for the period due to the timing of sales and repurchases of
the Fund shares in relation to income earned and/or fluctuating fair value of the investments of the Fund.
bBased on average daily shares outstanding.
cTotal return does not reflect sales commissions or contingent deferred sales charges, if applicable.
dBenefit of waiver and payments by affiliates rounds to less than 0.01%.
eBenefit of expense reduction rounds to less than 0.01%.
36 | The accompanying notes are an integral part of these financial statements. | Annual Report
| Franklin Strategic Series | |||||||||||||||
| Financial Highlights (continued) | |||||||||||||||
| Franklin Natural Resources Fund | |||||||||||||||
| Year Ended April 30, | |||||||||||||||
| Class C | 2014 | 2013 | 2012 | 2011 | 2010 | ||||||||||
| Per share operating performance | |||||||||||||||
| (for a share outstanding throughout the year) | |||||||||||||||
| Net asset value, beginning of year | $ | 32.02 | $ | 34.96 | $ | 43.87 | $ | 32.57 | $ | 22.15 | |||||
| Income from investment operationsa: | |||||||||||||||
| Net investment income (loss)b | (0.06 | ) | (0.14 | ) | (0.22 | ) | (0.23 | ) | (0.20 | ) | |||||
| Net realized and unrealized gains (losses) | 6.43 | (2.80 | ) | (8.53 | ) | 11.98 | 10.81 | ||||||||
| Total from investment operations | 6.37 | (2.94 | ) | (8.75 | ) | 11.75 | 10.61 | ||||||||
| Less distributions from net investment income | — | — | (0.16 | ) | (0.45 | ) | (0.19 | ) | |||||||
| Net asset value, end of year | $ | 38.39 | $ | 32.02 | $ | 34.96 | $ | 43.87 | $ | 32.57 | |||||
| Total returnc | 19.89 | % | (8.41 | )% | (19.91 | )% | 36.30 | % | 48.00 | % | |||||
| Ratios to average net assets | |||||||||||||||
| Expenses | 1.76 | %d,e | 1.77 | % | 1.73 | % | 1.70 | % | 1.74 | %e | |||||
| Net investment income (loss) | (0.16 | )% | (0.43 | )% | (0.59 | )% | (0.63 | )% | (0.68 | )% | |||||
| Supplemental data | |||||||||||||||
| Net assets, end of year (000’s) | $ | 126,651 | $ | 130,424 | $ | 176,036 | $ | 241,746 | $ | 123,939 | |||||
| Portfolio turnover rate | 21.03 | % | 20.40 | % | 26.75 | % | 23.60 | % | 31.18 | % | |||||
aThe amount shown for a share outstanding throughout the period may not correlate with the Statement of Operations for the period due to the timing of sales and repurchases of
the Fund shares in relation to income earned and/or fluctuating fair value of the investments of the Fund.
bBased on average daily shares outstanding.
cTotal return does not reflect sales commissions or contingent deferred sales charges, if applicable.
dBenefit of waiver and payments by affiliates rounds to less than 0.01%.
eBenefit of expense reduction rounds to less than 0.01%.
Annual Report | The accompanying notes are an integral part of these financial statements. | 37
| Franklin Strategic Series | |||
| Financial Highlights (continued) | |||
| Franklin Natural Resources Fund | |||
| Period Ended | |||
| April 30, | |||
| Class R6 | 2014 | a | |
| Per share operating performance | |||
| (for a share outstanding throughout the period) | |||
| Net asset value, beginning of period | $ | 38.28 | |
| Income from investment operationsb: | |||
| Net investment incomec | 0.19 | ||
| Net realized and unrealized gains (losses) | 4.31 | ||
| Total from investment operations | 4.50 | ||
| Less distributions from net investment income | (0.20 | ) | |
| Net asset value, end of period | $ | 42.58 | |
| Total returnd | 11.83 | % | |
| Ratios to average net assetse | |||
| Expenses before waiver and payments by affiliates | 0.55 | % | |
| Expenses net of waiver and payments by affiliatesf | 0.53 | % | |
| Net investment income | 1.07 | % | |
| Supplemental data | |||
| Net assets, end of period (000's) | $ | 939 | |
| Portfolio turnover rate | 21.03 | % | |
aFor the period September 20, 2013 (effective date) to April 30, 2014.
bThe amount shown for a share outstanding throughout the period may not correlate with the Statement of Operations for the period due to the timing of sales and repurchases of
the Fund shares in relation to income earned and/or fluctuating fair value of the investments of the Fund.
cBased on average daily shares outstanding.
dTotal return is not annualized for periods less than one year.
eRatios are annualized for periods less than one year.
fBenefit of expense reduction rounds to less than 0.01%.
38 | The accompanying notes are an integral part of these financial statements. | Annual Report
| Franklin Strategic Series | |||||||||||||||
| Financial Highlights (continued) | |||||||||||||||
| Franklin Natural Resources Fund | |||||||||||||||
| Year Ended April 30, | |||||||||||||||
| Advisor Class | 2014 | 2013 | 2012 | 2011 | 2010 | ||||||||||
| Per share operating performance | |||||||||||||||
| (for a share outstanding throughout the year) | |||||||||||||||
| Net asset value, beginning of year | $ | 35.31 | $ | 38.17 | $ | 47.58 | $ | 35.19 | $ | 23.94 | |||||
| Income from investment operationsa: | |||||||||||||||
| Net investment incomeb | 0.31 | 0.21 | 0.16 | 0.14 | 0.10 | ||||||||||
| Net realized and unrealized gains (losses) | 7.10 | (3.07 | ) | (9.27 | ) | 12.98 | 11.71 | ||||||||
| Total from investment operations | 7.41 | (2.86 | ) | (9.11 | ) | 13.12 | 11.81 | ||||||||
| Less distributions from net investment income | (0.20 | ) | — | (0.30 | ) | (0.73 | ) | (0.56 | ) | ||||||
| Net asset value, end of year | $ | 42.52 | $ | 35.31 | $ | 38.17 | $ | 47.58 | $ | 35.19 | |||||
| Total return | 21.07 | % | (7.49 | )% | (19.10 | )% | 37.70 | % | 49.48 | % | |||||
| Ratios to average net assets | |||||||||||||||
| Expenses | 0.77 | %c,d | 0.78 | % | 0.73 | % | 0.70 | % | 0.74 | %d | |||||
| Net investment income | 0.83 | % | 0.56 | % | 0.41 | % | 0.37 | % | 0.32 | % | |||||
| Supplemental data | |||||||||||||||
| Net assets, end of year (000’s) | $ | 94,651 | $ | 117,087 | $ | 235,810 | $ | 243,180 | $ | 106,773 | |||||
| Portfolio turnover rate | 21.03 | % | 20.40 | % | 26.75 | % | 23.60 | % | 31.18 | % | |||||
aThe amount shown for a share outstanding throughout the period may not correlate with the Statement of Operations for the period due to the timing of sales and repurchases of
the Fund shares in relation to income earned and/or fluctuating fair value of the investments of the Fund.
bBased on average daily shares outstanding.
cBenefit of waiver and payments by affiliates rounds to less than 0.01%.
dBenefit of expense reduction rounds to less than 0.01%.
Annual Report | The accompanying notes are an integral part of these financial statements. | 39
Franklin Strategic Series
Statement of Investments, April 30, 2014
| Franklin Natural Resources Fund | Country | Shares | Value | |
| Common Stocks 92.5% | ||||
| Coal & Consumable Fuels 1.3% | ||||
| a,bEnergy Coal Resources, 144A | United States | 199,375 | $ | — |
| Peabody Energy Corp. | United States | 556,250 | 10,574,312 | |
| 10,574,312 | ||||
| Commodity Chemicals 0.7% | ||||
| LyondellBasell Industries NV, A | United States | 67,500 | 6,243,750 | |
| Construction Materials 0.3% | ||||
| Martin Marietta Materials Inc. | United States | 19,000 | 2,362,270 | |
| Diversified Metals & Mining 10.6% | ||||
| BHP Billiton PLC, ADR | United Kingdom | 295,000 | 19,086,500 | |
| Freeport-McMoRan Copper & Gold Inc., B | United States | 458,000 | 15,741,460 | |
| Glencore Xstrata PLC | Switzerland | 2,092,700 | 11,255,140 | |
| aImperial Metals Corp. | Canada | 306,000 | 3,894,622 | |
| aMMG Ltd. | Australia | 12,788,000 | 2,969,024 | |
| a,cMolycorp Inc. | United States | 723,850 | 3,438,287 | |
| aNautilus Minerals Inc. | Canada | 746,000 | 401,569 | |
| PanAust Ltd. | Australia | 2,777,687 | 4,141,433 | |
| Rio Tinto PLC, ADR | United Kingdom | 211,000 | 11,455,190 | |
| aSandfire Resources NL | Australia | 732,667 | 3,865,871 | |
| Teck Resources Ltd., B | Canada | 499,000 | 11,362,230 | |
| aTurquoise Hill Resources Ltd. | Canada | 451,100 | 1,759,290 | |
| 89,370,616 | ||||
| Fertilizers & Agricultural Chemicals 1.2% | ||||
| The Mosaic Co. | United States | 121,000 | 6,054,840 | |
| Potash Corp. of Saskatchewan Inc. | Canada | 115,000 | 4,158,400 | |
| 10,213,240 | ||||
| Gold 4.8% | ||||
| Agnico Eagle Mines Ltd. | Canada | 119,000 | 3,514,466 | |
| AngloGold Ashanti Ltd., ADR | South Africa | 270,000 | 4,887,000 | |
| aB2Gold Corp. | Canada | 1,212,600 | 3,484,960 | |
| Barrick Gold Corp. | Canada | 338,000 | 5,904,860 | |
| aG-Resources Group Ltd. | Hong Kong | 86,108,260 | 2,365,718 | |
| Goldcorp Inc. | Canada | 294,000 | 7,267,680 | |
| aNewcrest Mining Ltd. | Australia | 300,000 | 2,915,045 | |
| Randgold Resources Ltd., ADR | Jersey Islands | 81,500 | 6,525,705 | |
| aRomarco Minerals Inc. | Canada | 4,177,000 | 3,353,643 | |
| aSt. Barbara Ltd. | Australia | 388,873 | 77,667 | |
| 40,296,744 | ||||
| Integrated Oil & Gas 14.2% | ||||
| BP PLC, ADR | United Kingdom | 159,000 | 8,048,580 | |
| Chevron Corp. | United States | 169,000 | 21,212,880 | |
| Exxon Mobil Corp. | United States | 292,200 | 29,924,202 | |
| Hess Corp. | United States | 89,900 | 8,015,484 | |
| Occidental Petroleum Corp. | United States | 250,000 | 23,937,500 | |
| Petroleo Brasileiro SA, ADR | Brazil | 424,000 | 5,885,120 |
40 | Annual Report
| Franklin Strategic Series | ||||
| Statement of Investments, April 30, 2014 (continued) | ||||
| Franklin Natural Resources Fund | Country | Shares | Value | |
| Common Stocks (continued) | ||||
| Integrated Oil & Gas (continued) | ||||
| Royal Dutch Shell PLC, A, ADR | United Kingdom | 105,100 | $ | 8,275,574 |
| Total SA, B, ADR | France | 214,600 | 15,288,104 | |
| 120,587,444 | ||||
| Oil & Gas Drilling 2.8% | ||||
| Ensco PLC, A | United States | 77,119 | 3,890,653 | |
| Noble Corp. PLC | United States | 125,000 | 3,851,250 | |
| aPioneer Energy Services Corp. | United States | 705,937 | 10,567,877 | |
| aRowan Cos. PLC | United States | 182,000 | 5,627,440 | |
| 23,937,220 | ||||
| Oil & Gas Equipment & Services 22.3% | ||||
| Baker Hughes Inc. | United States | 234,100 | 16,363,590 | |
| aC&J Energy Services Inc. | United States | 199,000 | 5,981,940 | |
| aCameron International Corp. | United States | 200,000 | 12,992,000 | |
| aDresser-Rand Group Inc. | United States | 103,000 | 6,225,320 | |
| aDril-Quip Inc. | United States | 39,900 | 4,513,488 | |
| aFMC Technologies Inc. | United States | 139,000 | 7,881,300 | |
| aForum Energy Technologies Inc. | United States | 143,700 | 4,290,882 | |
| Halliburton Co. | United States | 389,335 | 24,555,359 | |
| aHornbeck Offshore Services Inc. | United States | 122,000 | 5,054,460 | |
| aKey Energy Services Inc. | United States | 1,007,800 | 10,118,312 | |
| National Oilwell Varco Inc. | United States | 102,000 | 8,010,060 | |
| Oceaneering International Inc. | United States | 112,000 | 8,207,360 | |
| aOil States International Inc. | United States | 42,000 | 4,079,880 | |
| aPHI Inc., non-voting | United States | 84,000 | 3,763,200 | |
| aRigNet Inc. | United States | 123,800 | 5,788,888 | |
| Schlumberger Ltd. | United States | 365,804 | 37,147,396 | |
| Superior Energy Services Inc. | United States | 454,000 | 14,945,680 | |
| aWeatherford International Ltd. | United States | 407,000 | 8,547,000 | |
| 188,466,115 | ||||
| Oil & Gas Exploration & Production 29.1% | ||||
| Anadarko Petroleum Corp. | United States | 276,900 | 27,418,638 | |
| aAntero Resources Corp. | United States | 31,000 | 2,035,770 | |
| Cabot Oil & Gas Corp., A | United States | 496,000 | 19,482,880 | |
| Canadian Natural Resources Ltd. | Canada | 290,300 | 11,828,656 | |
| Cimarex Energy Co. | United States | 51,000 | 6,075,120 | |
| aCobalt International Energy Inc. | United States | 381,000 | 6,858,000 | |
| aConcho Resources Inc. | United States | 70,600 | 9,209,770 | |
| Devon Energy Corp. | United States | 181,000 | 12,670,000 | |
| aDiamondback Energy Inc. | United States | 90,000 | 6,474,600 | |
| EnCana Corp. | Canada | 689,000 | 15,991,690 | |
| EQT Corp. | United States | 67,000 | 7,302,330 | |
| aGran Tierra Energy Inc. | Colombia | 829,000 | 5,927,350 | |
| aKosmos Energy Ltd. | United States | 412,370 | 4,503,080 | |
| Marathon Oil Corp. | United States | 414,000 | 14,966,100 | |
| aMatador Resources Co. | United States | 208,246 | 5,980,825 | |
Annual Report | 41
Franklin Strategic Series
Statement of Investments, April 30, 2014 (continued)
| Franklin Natural Resources Fund | Country | Shares | Value | ||
| Common Stocks (continued) | |||||
| Oil & Gas Exploration & Production (continued) | |||||
| aMEG Energy Corp. | Canada | 206,600 | $ | 7,438,015 | |
| Noble Energy Inc. | United States | 192,200 | 13,796,116 | ||
| aOasis Petroleum Inc. | United States | 194,000 | 9,022,940 | ||
| aRex Energy Corp. | United States | 436,000 | 9,182,160 | ||
| SM Energy Co. | United States | 113,000 | 8,376,690 | ||
| aSouthwestern Energy Co. | United States | 470,000 | 22,503,600 | ||
| aSynergy Resources Corp. | United States | 392,500 | 4,568,700 | ||
| Tullow Oil PLC | United Kingdom | 581,100 | 8,634,855 | ||
| aWhiting Petroleum Corp. | United States | 86,289 | 6,361,225 | ||
| 246,609,110 | |||||
| Oil & Gas Refining & Marketing 3.7% | |||||
| HollyFrontier Corp. | United States | 166,000 | 8,729,940 | ||
| Marathon Petroleum Corp. | United States | 31,000 | 2,881,450 | ||
| Phillips 66 | United States | 148,500 | 12,358,170 | ||
| Valero Energy Corp. | United States | 135,000 | 7,717,950 | ||
| 31,687,510 | |||||
| Precious Metals & Minerals 0.5% | |||||
| aTahoe Resources Inc. | United States | 47,000 | 1,045,874 | ||
| a,dTahoe Resources Inc., 144A | United States | 143,000 | 3,182,127 | ||
| 4,228,001 | |||||
| Renewable Electricity 0.1% | |||||
| aAlterra Power Corp. | Canada | 2,609,800 | 761,951 | ||
| Specialty Chemicals 0.5% | |||||
| Celanese Corp., A | United States | 70,500 | 4,330,815 | ||
| Steel 0.4% | |||||
| Cliffs Natural Resources Inc. | United States | 196,000 | 3,473,120 | ||
| Total Common Stocks (Cost $536,984,953) | 783,142,218 | ||||
| Convertible Preferred Stocks 1.5% | |||||
| Oil & Gas Exploration & Production 1.5% | |||||
| dSanchez Energy Corp., 4.875%, cvt. pfd., 144A | United States | 110,000 | 7,909,682 | ||
| Sanchez Energy Corp., 6.50%, cvt. pfd., B | United States | 60,000 | 4,499,665 | ||
| Total Convertible Preferred Stocks (Cost $8,500,000) | 12,409,347 | ||||
| Preferred Stocks (Cost $2,376,164) 0.0% | |||||
| Coal & Consumable Fuels 0.0% | |||||
| a,bEnergy Coal Resources, 144A, pfd. | United States | 29,847 | — | ||
| Principal Amount | |||||
| Convertible Bonds (Cost $4,453,000) 0.4% | |||||
| Diversified Metals & Mining 0.4% | |||||
| Molycorp Inc., senior note, cvt., 6.00%, 9/01/17 | United States | $ | 4,453,000 | 3,590,231 | |
| Total Investments before Short Term Investments | |||||
| (Cost $552,314,117) | 799,141,796 | ||||
42 | Annual Report
| Franklin Strategic Series | |||||
| Statement of Investments, April 30, 2014 (continued) | |||||
| Franklin Natural Resources Fund | Country | Shares | Value | ||
| Short Term Investments 6.0% | |||||
| Money Market Funds (Cost $48,057,981) 5.7% | |||||
| a,eInstitutional Fiduciary Trust Money Market Portfolio | United States | 48,057,981 | $ | 48,057,981 | |
| fInvestments from Cash Collateral Received for Loaned Securities | |||||
| (Cost $2,500,000) 0.3% | |||||
| Money Market Funds 0.3% | |||||
| gBNY Mellon Overnight Government Fund, 0.05% | United States | 2,500,000 | 2,500,000 | ||
| Total Investments (Cost $602,872,098) 100.4% | 849,699,777 | ||||
| Other Assets, less Liabilities (0.4)% | (3,209,129 | ) | |||
| Net Assets 100.0% | $ | 846,490,648 | |||
See Abbreviations on page 61.
aNon-income producing.
bSee Note 7 regarding restricted securities.
cA portion or all of the security is on loan at April 30, 2014. See Note 1(c).
dSecurity was purchased pursuant to Rule 144A under the Securities Act of 1933 and may be sold in transactions exempt from registration only to qualified institutional buyers or
in a public offering registered under the Securities Act of 1933. These securities have been deemed liquid under guidelines approved by the Trust’s Board of Trustees. At April 30,
2014, the aggregate value of these securities was $11,091,809, representing 1.31% of net assets.
eSee Note 3(f) regarding investments in the Institutional Fiduciary Trust Money Market Portfolio.
fSee Note 1(c) regarding securities on loan.
gThe rate shown is the annualized seven-day yield at period end.
Annual Report | The accompanying notes are an integral part of these financial statements. | 43
| Franklin Strategic Series | |||||
| Financial Statements | |||||
| Statements of Assets and Liabilities | |||||
| April 30, 2014 | |||||
| Franklin | |||||
| Biotechnology | Franklin Natural | ||||
| Discovery Fund | Resources Fund | ||||
| Assets: | |||||
| Investments in securities: | |||||
| Cost - Unaffiliated issuers | $ | 1,046,010,175 | $ | 554,814,117 | |
| Cost - Non-controlled affiliated issuers (Note 8) | 1,651,959 | — | |||
| Cost - Sweep Money Fund (Note 3f) | 9,738,828 | 48,057,981 | |||
| Total cost of investments | $ | 1,057,400,962 | $ | 602,872,098 | |
| Value - Unaffiliated issuers | $ | 1,381,913,742 | $ | 801,641,796 | |
| Value - Non-controlled affiliated issuers (Note 8) | 1,773,680 | — | |||
| Value - Sweep Money Fund (Note 3f) | 9,738,828 | 48,057,981 | |||
| Total value of investments* | 1,393,426,250 | 849,699,777 | |||
| Cash | — | 2,050 | |||
| Receivables: | |||||
| Investment securities sold | 1,715,240 | 1,860,055 | |||
| Capital shares sold | 2,542,103 | 1,351,378 | |||
| Dividends and interest | 266,128 | 659,691 | |||
| Other assets | 1,110 | 448 | |||
| Total assets | 1,397,950,831 | 853,573,399 | |||
| Liabilities: | |||||
| Payables: | |||||
| Investment securities purchased | 83,240 | 2,124,488 | |||
| Capital shares redeemed | 4,067,739 | 1,549,091 | |||
| Management fees | 506,738 | 324,441 | |||
| Administrative fees | 128,413 | — | |||
| Distribution fees | 290,566 | 251,126 | |||
| Transfer agent fees | 308,597 | 264,492 | |||
| Payable upon return of securities loaned | 103,270,161 | 2,500,000 | |||
| Accrued expenses and other liabilities | 61,460 | 69,113 | |||
| Total liabilities | 108,716,914 | 7,082,751 | |||
| Net assets, at value | $ | 1,289,233,917 | $ | 846,490,648 | |
| Net assets consist of: | |||||
| Paid-in capital | $ | 936,855,086 | $ | 643,072,510 | |
| Distributions in excess of net investment income | — | (597,485 | ) | ||
| Net unrealized appreciation (depreciation) | 336,025,288 | 246,825,620 | |||
| Accumulated net realized gain (loss) | 16,353,543 | (42,809,997 | ) | ||
| Net assets, at value | $ | 1,289,233,917 | $ | 846,490,648 | |
| *Includes securities loaned | $ | 99,941,763 | $ | 2,375,000 | |
44 | The accompanying notes are an integral part of these financial statements. | Annual Report
| Franklin Strategic Series | ||||||
| Financial Statements (continued) | ||||||
| Statements of Assets and Liabilities (continued) | ||||||
| April 30, 2014 | ||||||
| Franklin | ||||||
| Biotechnology | Franklin Natural | |||||
| Discovery Fund | Resources Fund | |||||
| Class A: | ||||||
| Net assets, at value | $ | 1,141,890,471 | $ | 624,249,954 | ||
| Shares outstanding | 8,833,639 | 15,690,217 | ||||
| Net asset value per sharea | $ | 129.27 | $ | 39.79 | ||
| Maximum offering price per share (net asset value per share ÷ 94.25%) | $ | 137.16 | $ | 42.22 | ||
| Class C: | ||||||
| Net assets, at value | $ | 5,485,903 | $ | 126,651,057 | ||
| Shares outstanding | 42,491 | 3,298,904 | ||||
| Net asset value and maximum offering price per sharea | $ | 129.11 | $ | 38.39 | ||
| Class R6: | ||||||
| Net assets, at value | $ | 50,845,615 | $ | 938,541 | ||
| Shares outstanding | 387,857 | 22,044 | ||||
| Net asset value and maximum offering price per share | $ | 131.09 | $ | 42.58 | ||
| Advisor Class: | ||||||
| Net assets, at value | $ | 91,011,928 | $ | 94,651,096 | ||
| Shares outstanding | 695,479 | 2,226,084 | ||||
| Net asset value and maximum offering price per share | $ | 130.86 | $ | 42.52 | ||
| aRedemption price is equal to net asset value less contingent deferred sales charges, if applicable. | ||||||
Annual Report | The accompanying notes are an integral part of these financial statements. | 45
| Franklin Strategic Series | ||||||
| Financial Statements (continued) | ||||||
| Statements of Operations | ||||||
| for the year ended April 30, 2014 | ||||||
| Franklin | ||||||
| Biotechnology | Franklin Natural | |||||
| Discovery Fund | Resources Fund | |||||
| Investment income: | ||||||
| Dividends | $ | 1,580,245 | $ | 12,787,686 | ||
| Interest | — | 267,189 | ||||
| Income from securities loaned | 1,456,143 | 266,723 | ||||
| Total investment income | 3,036,388 | 13,321,598 | ||||
| Expenses: | ||||||
| Management fees (Note 3a) | 5,270,196 | 3,990,779 | ||||
| Administrative fees (Note 3b) | 1,371,707 | — | ||||
| Distribution fees: (Note 3c) | ||||||
| Class A | 3,059,052 | 1,790,960 | ||||
| Class C | 5,228 | 1,226,888 | ||||
| Transfer agent fees: (Note 3e) | ||||||
| Class A | 1,674,361 | 1,529,273 | ||||
| Class C | 848 | 313,518 | ||||
| Class R6 | 182 | 54 | ||||
| Advisor Class | 100,063 | 267,411 | ||||
| Custodian fees (Note 4) | 8,918 | 13,025 | ||||
| Reports to shareholders | 136,750 | 151,144 | ||||
| Registration and filing fees | 161,975 | 99,308 | ||||
| Professional fees | 58,346 | 48,896 | ||||
| Trustees’ fees and expenses | 9,609 | 9,921 | ||||
| Other | 11,305 | 15,861 | ||||
| Total expenses | 11,868,540 | 9,457,038 | ||||
| Expense reductions (Note 4) | (36 | ) | (30 | ) | ||
| Expenses waived/paid by affiliates (Note 3f and 3g) | (42,779 | ) | (23,930 | ) | ||
| Net expenses | 11,825,725 | 9,433,078 | ||||
| Net investment income (loss) | (8,789,337 | ) | 3,888,520 | |||
| Realized and unrealized gains (losses): | ||||||
| Net realized gain (loss) from: | ||||||
| Investments | 107,450,657 | 19,694,467 | ||||
| Foreign currency transactions | 7,498 | (68 | ) | |||
| Net realized gain (loss) | 107,458,155 | 19,694,399 | ||||
| Net change in unrealized appreciation (depreciation) on: | ||||||
| Investments | 121,720,853 | 131,397,466 | ||||
| Translation of other assets and liabilities denominated in foreign currencies | — | (2,727 | ) | |||
| Net change in unrealized appreciation (depreciation) | 121,720,853 | 131,394,739 | ||||
| Net realized and unrealized gain (loss) | 229,179,008 | 151,089,138 | ||||
| Net increase (decrease) in net assets resulting from operations | $ | 220,389,671 | $ | 154,977,658 | ||
46 | The accompanying notes are an integral part of these financial statements. | Annual Report
| Franklin Strategic Series | |||||||||||||
| Financial Statements (continued) | |||||||||||||
| Statements of Changes in Net Assets | |||||||||||||
| Franklin | Franklin | ||||||||||||
| Biotechnology Discovery Fund | Natural Resources Fund | ||||||||||||
| Year Ended April 30, | Year Ended April 30, | ||||||||||||
| 2014 | 2013 | 2014 | 2013 | ||||||||||
| Increase (decrease) in net assets: | |||||||||||||
| Operations: | |||||||||||||
| Net investment income (loss) | $ | (8,789,337 | ) | $ | (4,433,817 | ) | $ | 3,888,520 | $ | 2,011,892 | |||
| Net realized gain (loss) from investments and | |||||||||||||
| foreign currency transactions | 107,458,155 | 3,465,460 | 19,694,399 | (16,017,210 | ) | ||||||||
| Net change in unrealized appreciation | |||||||||||||
| (depreciation) on investments and translation | |||||||||||||
| of other assets and liabilities denominated in | |||||||||||||
| foreign currencies | 121,720,853 | 177,139,592 | 131,394,739 | (76,683,143 | ) | ||||||||
| Net increase (decrease) in net assets | |||||||||||||
| resulting from operations | 220,389,671 | 176,171,235 | 154,977,658 | (90,688,461 | ) | ||||||||
| Distributions to shareholders from: | |||||||||||||
| Net investment income: | |||||||||||||
| Class A | — | (387,235 | ) | (1,295,936 | ) | — | |||||||
| Class R6 | — | — | (1,339 | ) | — | ||||||||
| Advisor Class | — | (12,343 | ) | (479,364 | ) | — | |||||||
| Net realized gains: | |||||||||||||
| Class A | (68,524,706 | ) | — | — | — | ||||||||
| Class R6 | (3,579,787 | ) | — | — | — | ||||||||
| Advisor Class | (3,829,703 | ) | — | — | — | ||||||||
| Total distributions to shareholders | (75,934,196 | ) | (399,578 | ) | (1,776,639 | ) | — | ||||||
| Capital share transactions: (Note 2) | |||||||||||||
| Class A | 350,198,470 | 48,927,671 | (116,275,300 | ) | (133,616,540 | ) | |||||||
| Class C | 6,094,568 | — | (25,999,370 | ) | (30,691,809 | ) | |||||||
| Class R6 | 44,555,564 | — | 886,459 | — | |||||||||
| Advisor Class | 64,466,934 | 10,756,033 | (41,555,321 | ) | (108,309,557 | ) | |||||||
| Total capital share transactions | 465,315,536 | 59,683,704 | (182,943,532 | ) | (272,617,906 | ) | |||||||
| Net increase (decrease) in net assets | 609,771,011 | 235,455,361 | (29,742,513 | ) | (363,306,367 | ) | |||||||
| Net assets: | |||||||||||||
| Beginning of year | 679,462,906 | 444,007,545 | 876,233,161 | 1,239,539,528 | |||||||||
| End of year | $ | 1,289,233,917 | $ | 679,462,906 | $ | 846,490,648 | $ | 876,233,161 | |||||
| Distributions in excess of net investment income | |||||||||||||
| included in net assets, end of year | $ | — | $ | (2,017,147 | ) | $ | (597,485 | ) | $ | (9,242,141 | ) | ||
Annual Report | The accompanying notes are an integral part of these financial statements. | 47
Franklin Strategic Series
Notes to Financial Statements
1. ORGANIZATION AND SIGNIFICANT ACCOUNTING POLICIES
Franklin Strategic Series (Trust) is registered under the Investment Company Act of 1940, as amended, (1940 Act) as an open-end management investment company, consisting of nine separate funds, two of which are included in this report (Funds). The financial statements of the remaining funds in the Trust are presented separately. The Funds offer four classes of shares: Class A, Class C, Class R6, and Advisor Class. Effective May 1, 2013 and September 20, 2013, the Franklin Biotechnology Discovery Fund and Franklin Natural Resources Fund, respectively, began offering a new class of shares, Class R6. Effective March 4, 2014, the Franklin Biotechnology Discovery Fund began offering a new class of shares, Class C. Each class of shares differs by its initial sales load, contingent deferred sales charges, voting rights on matters affecting a single class, its exchange privilege and fees primarily due to differing arrangements for distribution and transfer agent fees. On May 15, 2014, the Trust’s Board of Trustees (the Board) approved a proposal to close the Franklin Biotechnology Discovery Fund to new investors with limited exceptions effective on or about July 8, 2014.
The following summarizes the Funds’ significant accounting policies.
a. Financial Instrument Valuation
The Funds’ investments in financial instruments are carried at fair value daily. Fair value is the price that would be received to sell an asset or paid to transfer a liability in an orderly transaction between market participants on the measurement date. The Funds’ calculate the net asset value per share at the close of the New York Stock Exchange (NYSE), generally at 4 p.m. Eastern time (NYSE close) on each day the NYSE is open for trading. Under procedures approved by the Board, the Funds’ administrator, investment manager and other affiliates have formed the Valuation and Liquidity Oversight Committee (VLOC). The VLOC provides administration and oversight of the Funds’ valuation policies and procedures, which are approved annually by the Board. Among other things, these procedures allow the Funds to utilize independent pricing services, quotations from securities and financial instrument dealers, and other market sources to determine fair value.
Equity securities listed on an exchange or on the NASDAQ National Market System are valued at the last quoted sale price or the official closing price of the day, respectively. Foreign equity securities are valued as of the close of trading on the foreign stock exchange on which the security is primarily traded or as of the NYSE close, whichever is earlier. The value is then converted into its U.S. dollar equivalent at the foreign exchange rate in effect at the NYSE close on the day that the value of the security is determined. Over-the-counter (OTC) securities are valued within the range of the most recent quoted bid and ask prices. Securities that trade in multiple markets or on multiple exchanges are valued according to the broadest and most representative market. Certain equity securities are valued based upon fundamental characteristics or relationships to similar securities. Investments in open-end mutual funds and non-registered money market funds are valued at the closing net asset value.
48 | Annual Report
Franklin Strategic Series
Notes to Financial Statements (continued)
| 1. | ORGANIZATION AND SIGNIFICANT ACCOUNTING POLICIES (continued) |
| a. | Financial Instrument Valuation (continued) |
Debt securities generally trade in the OTC market rather than on a securities exchange. The Funds’ pricing services use multiple valuation techniques to determine fair value. In instances where sufficient market activity exists, the pricing services may utilize a market-based approach through which quotes from market makers are used to determine fair value. In instances where sufficient market activity may not exist or is limited, the pricing services also utilize proprietary valuation models which may consider market characteristics such as benchmark yield curves, credit spreads, estimated default rates, anticipated market interest rate volatility, coupon rates, anticipated timing of principal repayments, underlying collateral, and other unique security features in order to estimate the relevant cash flows, which are then discounted to calculate the fair value.
The Funds have procedures to determine the fair value of financial instruments for which market prices are not reliable or readily available. Under these procedures, the VLOC convenes on a regular basis to review such financial instruments and considers a number of factors, including significant unobservable valuation inputs, when arriving at fair value. The VLOC primarily employs a market-based approach which may use related or comparable assets or liabilities, recent transactions, market multiples, book values, and other relevant information for the investment to determine the fair value of the investment. An income-based valuation approach may also be used in which the anticipated future cash flows of the investment are discounted to calculate fair value. Discounts may also be applied due to the nature or duration of any restrictions on the disposition of the investments. Due to the inherent uncertainty of valuations of such investments, the fair values may differ significantly from the values that would have been used had an active market existed. The VLOC employs various methods for calibrating these valuation approaches including a regular review of key inputs and assumptions, transactional back-testing or disposition analysis, and reviews of any related market activity.
Trading in securities on foreign securities stock exchanges and OTC markets may be completed before the daily NYSE close. In addition, trading in certain foreign markets may not take place on every NYSE business day. Occasionally, events occur between the time at which trading in a foreign security is completed and the close of the NYSE that might call into question the reliability of the value of a portfolio security held by the fund. As a result, differences may arise between the value of the Funds’ portfolio securities as determined at the foreign market close and the latest indications of value at the close of the NYSE. In order to minimize the potential for these differences, the VLOC monitors price movements following the close of trading in foreign stock markets through a series of country specific market proxies (such as baskets of American Depositary Receipts, futures contracts and exchange traded funds). These price movements are measured against established trigger thresholds for each specific market proxy to assist in determining if an event has occurred that may call into question the reliability of the values of the foreign securities held by the Funds. If such an event occurs, the securities may be valued using fair value procedures, which may include the use of independent pricing services.
Annual Report | 49
Franklin Strategic Series
Notes to Financial Statements (continued)
| 1. | ORGANIZATION AND SIGNIFICANT ACCOUNTING POLICIES (continued) |
| a. | Financial Instrument Valuation (continued) |
Also, when the last day of the reporting period is a non-business day, certain foreign markets may be open on those days that the NYSE is closed, which could result in differences between the value of the Funds’ portfolio securities on the last business day and the last calendar day of the reporting period. Any significant security valuation changes due to an open foreign market are adjusted and reflected by the Funds for financial reporting purposes.
b. Foreign Currency Translation
Portfolio securities and other assets and liabilities denominated in foreign currencies are translated into U.S. dollars based on the exchange rate of such currencies against U.S. dollars on the date of valuation. The Funds may enter into foreign currency exchange contracts to facilitate transactions denominated in a foreign currency. Purchases and sales of securities, income and expense items denominated in foreign currencies are translated into U.S. dollars at the exchange rate in effect on the transaction date. Portfolio securities and assets and liabilities denominated in foreign currencies contain risks that those currencies will decline in value relative to the U.S. dollar. Occasionally, events may impact the availability or reliability of foreign exchange rates used to convert the U.S. dollar equivalent value. If such an event occurs, the foreign exchange rate will be valued at fair value using procedures established and approved by the Board.
The Funds do not separately report the effect of changes in foreign exchange rates from changes in market prices on securities held. Such changes are included in net realized and unrealized gain or loss from investments on the Statements of Operations.
Realized foreign exchange gains or losses arise from sales of foreign currencies, currency gains or losses realized between the trade and settlement dates on securities transactions and the difference between the recorded amounts of dividends, interest, and foreign withholding taxes and the U.S. dollar equivalent of the amounts actually received or paid. Net unrealized foreign exchange gains and losses arise from changes in foreign exchange rates on foreign denominated assets and liabilities other than investments in securities held at the end of the reporting period.
c. Securities Lending
The Funds participate in an agency based securities lending program. The fund receives cash collateral against the loaned securities in an amount equal to at least 102% of the fair value of the loaned securities. Collateral is maintained over the life of the loan in an amount not less than 100% of the fair value of loaned securities, as determined at the close of fund business each day; any additional collateral required due to changes in security values is delivered to the fund on the next business day. The collateral is invested in a non-registered money fund as indicated on the Statements of Investments. The fund receives income from the investment of cash collateral, in addition to lending fees and rebates paid by the borrower. The fund bears the market risk with respect to the collateral investment, securities loaned, and the risk that the agent may default on its obligations to the fund. The securities lending agent has agreed to indemnify the fund in the event of default by a third party borrower.
50 | Annual Report
Franklin Strategic Series
Notes to Financial Statements (continued)
| 1. | ORGANIZATION AND SIGNIFICANT ACCOUNTING POLICIES (continued) |
| d. | Income and Deferred Taxes |
It is each fund’s policy to qualify as a regulated investment company under the Internal Revenue Code. Each fund intends to distribute to shareholders substantially all of its taxable income and net realized gains to relieve it from federal income and excise taxes. As a result, no provision for U.S. federal income taxes is required.
The Funds may be subject to foreign taxation related to income received, capital gains on the sale of securities and certain foreign currency transactions in the foreign jurisdictions in which it invests. Foreign taxes, if any, are recorded based on the tax regulations and rates that exist in the foreign markets in which the Funds invest. When a capital gain tax is determined to apply the Funds record an estimated deferred tax liability in an amount that would be payable if the securities were disposed of on the valuation date.
Each fund recognizes the tax benefits of uncertain tax positions only when the position is “more likely than not” to be sustained upon examination by the tax authorities based on the technical merits of the tax position. As of April 30, 2014, and for all open tax years, each fund has determined that no liability for unrecognized tax benefits is required in each fund’s financial statements related to uncertain tax positions taken on a tax return (or expected to be taken on future tax returns). Open tax years are those that remain subject to examination and are based on each tax jurisdiction statute of limitation.
e. Security Transactions, Investment Income, Expenses and Distributions
Security transactions are accounted for on trade date. Realized gains and losses on security transactions are determined on a specific identification basis. Interest income and estimated expenses are accrued daily. Dividend income is recorded on the ex-dividend date except that certain dividends from foreign securities are recognized as soon as the Funds are notified of the ex-dividend date. Distributions to shareholders are recorded on the ex-dividend date and are determined according to income tax regulations (tax basis). Distributable earnings determined on a tax basis may differ from earnings recorded in accordance with accounting principles generally accepted in the United States of America. These differences may be permanent or temporary. Permanent differences are reclassified among capital accounts to reflect their tax character. These reclassifications have no impact on net assets or the results of operations. Temporary differences are not reclassified, as they may reverse in subsequent periods.
Common expenses incurred by the Trust are allocated among the funds based on the ratio of net assets of each fund to the combined net assets of the Trust. Fund specific expenses are charged directly to the fund that incurred the expense.
Realized and unrealized gains and losses and net investment income, not including class specific expenses, are allocated daily to each class of shares based upon the relative proportion of net assets of each class. Differences in per share distributions, by class, are generally due to differences in class specific expenses.
Annual Report | 51
Franklin Strategic Series
Notes to Financial Statements (continued)
| 1. | ORGANIZATION AND SIGNIFICANT ACCOUNTING POLICIES (continued) |
| f. | Accounting Estimates |
The preparation of financial statements in accordance with accounting principles generally accepted in the United States of America requires management to make estimates and assumptions that affect the reported amounts of assets and liabilities at the date of the financial statements and the amounts of income and expenses during the reporting period. Actual results could differ from those estimates.
g. Guarantees and Indemnifications
Under the Trust’s organizational documents, its officers and trustees are indemnified by the Trust against certain liabilities arising out of the performance of their duties to the Trust. Additionally, in the normal course of business, the Trust, on behalf of the Funds, enters into contracts with service providers that contain general indemnification clauses. The Trust’s maximum exposure under these arrangements is unknown as this would involve future claims that may be made against the Trust that have not yet occurred. Currently, the Trust expects the risk of loss to be remote.
2. SHARES OF BENEFICIAL INTEREST
At April 30, 2014, there were an unlimited number of shares authorized (without par value).
Transactions in the Funds’ shares were as follows:
| Franklin Biotechnology | Franklin Natural | |||||||||||
| Discovery Fund | Resources Fund | |||||||||||
| Class A Shares: | Shares | Amount | Shares | Amount | ||||||||
| Year ended April 30, 2014 | ||||||||||||
| Shares sold | 5,217,381 | $ | 685,233,368 | 2,604,685 | $ | 92,042,342 | ||||||
| Shares issued in reinvestment of | ||||||||||||
| distributions | 515,565 | 64,316,784 | 35,605 | 1,243,317 | ||||||||
| Shares redeemed | (3,069,325 | ) | (399,351,682 | ) | (5,984,517 | ) | (209,560,959 | ) | ||||
| Net increase (decrease) | 2,663,621 | $ | 350,198,470 | (3,344,227 | ) | $ | (116,275,300 | ) | ||||
| Year ended April 30, 2013 | ||||||||||||
| Shares sold | 2,920,895 | $ | 258,879,692 | 3,751,622 | $ | 122,605,579 | ||||||
| Shares issued in reinvestment of | ||||||||||||
| distributions | 4,248 | 360,364 | — | — | ||||||||
| Shares redeemed | (2,457,896 | ) | (210,312,385 | ) | (7,827,491 | ) | (256,222,119 | ) | ||||
| Net increase (decrease) | 467,247 | $ | 48,927,671 | (4,075,869 | ) | $ | (133,616,540 | ) | ||||
| Class C Shares: | ||||||||||||
| Year ended April 30, 2014a | ||||||||||||
| Shares sold | 44,841 | $ | 6,399,029 | 445,572 | $ | 15,263,971 | ||||||
| Shares redeemed | (2,350 | ) | (304,461 | ) | (1,219,381 | ) | (41,263,341 | ) | ||||
| Net increase (decrease) | 42,491 | $ | 6,094,568 | (773,809 | ) | $ | (25,999,370 | ) | ||||
| Year ended April 30, 2013 | ||||||||||||
| Shares sold | 619,977 | $ | 19,772,196 | |||||||||
| Shares redeemed | (1,582,017 | ) | (50,464,005 | ) | ||||||||
| Net increase (decrease) | (962,040 | ) | $ | (30,691,809 | ) | |||||||
| 52 | Annual Report | ||||||||||||
Franklin Strategic Series
Notes to Financial Statements (continued)
| 2. SHARES OF BENEFICIAL INTEREST (continued) | ||||||||||||
| Franklin Biotechnology | Franklin Natural | |||||||||||
| Discovery Fund | Resources Fund | |||||||||||
| Shares | Amount | Shares | Amount | |||||||||
| Class R6 Shares: | ||||||||||||
| Year ended April 30, 2014b,c | ||||||||||||
| Shares soldd,e | 431,359 | $ | 50,546,318 | 22,009 | $ | 885,146 | ||||||
| Shares issued on reinvestment of | ||||||||||||
| distributions | 28,341 | 3,579,477 | 35 | 1,313 | ||||||||
| Shares redeemed | (71,843 | ) | (9,570,231 | ) | — | — | ||||||
| Net increase (decrease) | 387,857 | $ | 44,555,564 | 22,044 | $ | 886,459 | ||||||
| Advisor Class Shares: | ||||||||||||
| Year ended April 30, 2014 | ||||||||||||
| Shares sold | 755,324 | $ | 105,199,247 | 824,952 | $ | 31,227,566 | ||||||
| Shares issued in reinvestment of | ||||||||||||
| distributions | 24,447 | 3,083,964 | 11,764 | 438,464 | ||||||||
| Shares redeemedc,d | (325,219 | ) | (43,816,277 | ) | (1,926,993 | ) | (73,221,351 | ) | ||||
| Net increase (decrease) | 454,552 | $ | 64,466,934 | (1,090,277 | ) | $ | (41,555,321 | ) | ||||
| Year ended April 30, 2013 | ||||||||||||
| Shares sold | 149,576 | $ | 13,375,042 | 1,454,171 | $ | 50,960,731 | ||||||
| Shares issued in reinvestment of | ||||||||||||
| distributions | 111 | 9,479 | — | — | ||||||||
| Shares redeemed | (30,479 | ) | (2,628,488 | ) | (4,315,230 | ) | (159,270,288 | ) | ||||
| Net increase (decrease) | 119,208 | $ | 10,756,033 | (2,861,059 | ) | $ | (108,309,557 | ) | ||||
aFor the period March 4, 2014 (effective date) to April 30, 2014 for the Franklin Biotechnology Discovery Fund.
bFor the year May 1, 2013 (effective date) to April 30, 2014.
cFor the period September 20, 2013 (effective date) to April 30, 2014 for the Franklin Natural Resources Fund.
dEffective May 1, 2013, a portion of Advisor Class shares were exchanged into Class R6 for the Franklin Biotechnology Discovery Fund.
eEffective September 20, 2013, a portion of Advisor Class shares were exchanged into Class R6 for the Franklin Natural Resources Fund.
3. TRANSACTIONS WITH AFFILIATES
Franklin Resources, Inc. is the holding company for various subsidiaries that together are referred to as Franklin Templeton Investments. Certain officers and trustees of the Trust are also officers and/or directors of the following subsidiaries:
| Subsidiary | Affiliation |
| Franklin Advisers, Inc. (Advisers) | Investment manager |
| Franklin Templeton Services, LLC (FT Services) | Administrative manager |
| Franklin Templeton Distributors, Inc. (Distributors) | Principal underwriter |
| Franklin Templeton Investor Services, LLC (Investor Services) | Transfer agent |
Annual Report | 53
Franklin Strategic Series
Notes to Financial Statements (continued)
| 3. | TRANSACTIONS WITH AFFILIATES (continued) |
| a. | Management Fees |
The Funds pay an investment management fee to Advisers based on the average daily net assets of each of the Funds as follows:
| Annualized Fee Rate | Net Assets | |
| 0.625 | % | Up to and including $100 million |
| 0.500 | % | Over $100 million, up to and including $250 million |
| 0.450 | % | Over $250 million, up to and including $7.5 billion |
| 0.440 | % | Over $7.5 billion, up to and including $10 billion |
| 0.430 | % | Over $10 billion, up to and including $12.5 billion |
| 0.420 | % | Over $12.5 billion, up to and including $15 billion |
| 0.400 | % | In excess of $15 billion |
b. Administrative Fees
The Franklin Biotechnology Discovery Fund pays an administrative fee to FT Services based on the fund’s average daily net assets as follows:
| Annualized Fee Rate | Net Assets | |
| 0.150 | % | Up to and including $200 million |
| 0.135 | % | Over $200 million, up to and including $700 million |
| 0.100 | % | Over $700 million, up to and including $1.2 billion |
| 0.075 | % | In excess of $1.2 billion |
Under an agreement with Advisers, FT Services provides administrative services to the Franklin Natural Resources Fund. The fee is paid by Advisers based on the fund’s average daily net assets, and is not an additional expense of the fund.
On April 15, 2014, the Board approved the proposal to combine the investment management and administration agreements for the Franklin Biotechnology Discovery Fund. The fees to be paid under the new combined agreement will not exceed the aggregate fees that would have been paid under the separate agreements. The new agreement went into effect on May 1, 2014.
c. Distribution Fees
The Board has adopted distribution plans for each share class, with the exception of Class R6 and Advisor Class shares, pursuant to Rule 12b-1 under the 1940 Act. Distribution fees are not charged on shares held by affiliates. Under the Funds’ Class A reimbursement distribution plans, the Funds reimburse Distributors for costs incurred in connection with the servicing, sale and distribution of each fund’s shares up to the maximum annual plan rate for each class. Under the Class A reimbursement distribution plans, costs exceeding the maximum for the current plan year cannot be reimbursed in subsequent periods. In addition, under the Funds’ Class C compensation distribution plans, the Funds pay Distributors for costs incurred in connection with the servicing, sale and distribution of each fund’s shares up to the maximum annual plan rate for each class. The plan year, for purposes of monitoring compliance with the maximum annual plan rates, is February 1 through January 31 for each fund.
54 | Annual Report
Franklin Strategic Series
Notes to Financial Statements (continued)
| 3. | TRANSACTIONS WITH AFFILIATES (continued) |
| c. | Distribution Fees (continued) |
The maximum annual plan rates, based on the average daily net assets, for each class, are as follows:
| Class A | 0.35 | % |
| Class C | 1.00 | % |
The Board has set the current rate at 0.30% per year for Class A shares until further notice and approval by the Board.
d. Sales Charges/Underwriting Agreements
Front-end sales charges and contingent deferred sales charges (CDSC) do not represent expenses of the Funds. These charges are deducted from the proceeds of sales of fund shares prior to investment or from redemption proceeds prior to remittance, as applicable. Distributors has advised the Funds of the following commission transactions related to the sales and redemptions of the Funds’ shares for the year:
| Franklin | ||||
| Biotechnology | Biotechnology | Franklin Natural | ||
| Discovery Fund | Resources Fund | |||
| Sales charges retained net of commissions paid to unaffiliated | ||||
| broker/dealers | $ | 1,606,525 | $ | 183,952 |
| CDSC retained | $ | 11,958 | $ | 15,105 |
e. Transfer Agent Fees
Each class of shares, except for Class R6, pays transfer agent fees to Investor Services for its performance of shareholder servicing obligations and reimburses Investor Services for out of pocket expenses incurred, including shareholding servicing fees paid to third parties. These fees are allocated daily based upon their relative proportion of such classes’ aggregate net assets. Class R6 pays Investor Services transfer agent fees specific to that class.
For the year ended April 30, 2014, the Funds paid transfer agent fees as noted in the Statements of Operations of which the following amounts were retained by Investor Services:
| Franklin | ||||
| Biotechnology | Franklin Natural | |||
| Discovery Fund | Resources Fund | |||
| Transfer agent fees | $ | 817,029 | $ | 1,032,104 |
Annual Report | 55
Franklin Strategic Series
Notes to Financial Statements (continued)
| 3. | TRANSACTIONS WITH AFFILIATES (continued) |
| f. | Investment in Institutional Fiduciary Trust Money Market Portfolio |
The Funds invest in the Institutional Fiduciary Trust Money Market Portfolio (Sweep Money Fund), an affiliated open-end investment company. Management fees paid by the Funds are waived on assets invested in the Sweep Money Fund, in an amount not to exceed the management and administrative fees paid directly or indirectly by the Sweep Money Fund, as noted on the Statements of Operations. Prior to May 1, 2013, the waiver was accounted for as a reduction to management fees.
g. Waiver and Expense Reimbursements
Investor Services has contractually agreed in advance to waive or limit its fees so that the Class R6 transfer agent fees for the Funds do not exceed 0.01% until August 31, 2014. For the Franklin Biotechnology Discovery Fund, there were no class R6 transfer agent fees waived during the year ended April 30, 2014.
4. EXPENSE OFFSET ARRANGEMENT
The Funds have entered into an arrangement with their custodian whereby credits realized as a result of uninvested cash balances are used to reduce a portion of the Funds’ custodian expenses. During the year ended April 30, 2014, the custodian fees were reduced as noted in the Statements of Operations.
5. INCOME TAXES
For tax purposes, capital losses may be carried over to offset future capital gains. Capital loss carryforwards with no expiration, if any, must be fully utilized before those losses with expiration dates.
At April 30, 2014, capital loss carryforwards were as follows:
| Franklin Natural | ||
| Resources Fund | ||
| Capital loss carryforwards subject to expiration: | ||
| 2018 | $ | 20,161,920 |
| Capital loss carryforwards not subject to expiration: | ||
| Short term | 1,234,663 | |
| Long term | 11,789,424 | |
| Total capital loss carryforwards | $ | 33,186,007 |
During the year ended April 30, 2014, the Franklin Natural Resources Fund utilized $3,535,416 of capital loss carryforwards.
56 | Annual Report
Franklin Strategic Series
Notes to Financial Statements (continued)
5. INCOME TAXES (continued)
The tax character of distributions paid during the years ended April 30, 2014 and 2013, was as follows:
| Franklin | Franklin | |||||||
| Biotechnology | Natural | |||||||
| Discovery Fund | Resources Fund | |||||||
| 2014 | 2013 | 2014 | 2013 | |||||
| Distributions paid from: | ||||||||
| Ordinary income | $ | 13,679,735 | $ | 399,578 | $ | 1,776,639 | $ | — |
| Long term capital gain | 62,254,461 | — | — | — | ||||
| $ | 75,934,196 | $ | 399,578 | $ | 1,776,639 | $ | — | |
At April 30, 2014, the cost of investments, net unrealized appreciation (depreciation), undistributed ordinary income and undistributed long term capital gains for income tax purposes were as follows:
| Franklin | Franklin | |||||
| Biotechnology | Natural | |||||
| Discovery Fund | Resources Fund | |||||
| Cost of investments | $ | 1,061,305,982 | $ | 618,227,421 | ||
| Unrealized appreciation | $ | 405,747,689 | $ | 282,604,034 | ||
| Unrealized depreciation | (73,627,421 | ) | (51,131,678 | ) | ||
| Net unrealized appreciation (depreciation) | $ | 332,120,268 | $ | 231,472,356 | ||
| Undistributed ordinary income | $ | 1,634,971 | $ | 5,133,898 | ||
| Undistributed long term capital gains | 18,623,592 | — | ||||
| Distributable earnings | $ | 20,258,563 | $ | 5,133,898 | ||
Differences between income and/or capital gains as determined on a book basis and a tax basis are primarily due to differing treatments of passive foreign investment company shares and wash sales.
6. INVESTMENT TRANSACTIONS
Purchases and sales of investments (excluding short term securities) for the year ended April 30, 2014, were as follows:
| Franklin | ||||
| Biotechnology | Franklin Natural | |||
| Discovery Fund | Resources Fund | |||
| Purchases | $ | 929,073,870 | $ | 168,098,968 |
| Sales | $ | 518,410,670 | $ | 350,459,406 |
Annual Report | 57
Franklin Strategic Series
Notes to Financial Statements (continued)
7. RESTRICTED SECURITIES
The Funds invest in securities that are restricted under the Securities Act of 1933 (1933 Act) or which are subject to legal, contractual, or other agreed upon restrictions on resale. Restricted securities are often purchased in private placement transactions, and cannot be sold without prior registration unless the sale is pursuant to an exemption under the 1933 Act. Disposal of these securities may require greater effort and expense, and prompt sale at an acceptable price may be difficult. The Funds may have registration rights for restricted securities. The issuer generally incurs all registration costs.
At April 30, 2014, the Funds held investments in restricted securities, excluding certain securities exempt from registration under the 1933 Act deemed to be liquid, as follows:
| Acquisition | ||||||
| Shares | Issuer | Dates | Cost | Value | ||
| Franklin Biotechnology Discovery Fund | ||||||
| 1,128,271 | FibroGen Inc., pfd., E | 5/19/00 | $ | 5,065,937 | $ | 6,386,014 |
| 80,195 | Intarcia Therapeutics Inc., DD | 3/26/14 | 2,597,516 | 2,582,279 | ||
| Total Restricted Securities (Value is 0.70% of Net Assets) | $ | 7,663,453 | $ | 8,968,293 | ||
| Franklin Natural Resources Fund | ||||||
| 199,375 | Energy Coal Resources, 144A | 11/16/05 - 5/05/06 | $ | 741,939 | $ | — |
| 29,847 | Energy Coal Resources, 144A, pfd. | 3/17/09 | 2,376,164 | — | ||
| Total Restricted Securities (Value is 0.00% of Net Assets) | $ | 3,118,103 | $ | — | ||
8. HOLDINGS OF 5% VOTING SECURITIES OF PORTFOLIO COMPANIES
The 1940 Act defines “affiliated companies” to include investments in portfolio companies in which a fund owns 5% or more of the outstanding voting securities. Investments in “affiliated companies” for the Franklin Biotechnology Discovery Fund for the year ended April 30, 2014, were as shown below.
| Number of | Number of | ||||||||||||
| Shares/ | Shares/ | ||||||||||||
| Warrants | Warrants | ||||||||||||
| Held at | Held at | Value | Realized | ||||||||||
| Beginning | Gross | Gross | End | at End | Investment | Capital | |||||||
| Name of Issuer | of Year | Additions | Reductions | of Year | of Year | Income | Gain (Loss) | ||||||
| Franklin Biotechnology Discovery Fund | |||||||||||||
| Non-Controlled Affiliates | |||||||||||||
| Heron Therapeutics Inc.a | 16,588,800 | 2,711,400 | 18,335,190 | b | 965,010 | $ | —c | $ | — | $ | — | ||
| Heron Therapeutics Inc., wts., 144A, | |||||||||||||
| 7/01/16 | a | 11,143,769 | — | 10,865,175 | b | 278,594 | $ | —c | $ | — | $ | — | |
| Celsus Therapeutics PLC, ADR | — | 2,898,174 | 2,608,357 | b | 289,817 | $ | 1,773,680 | $ | — | $ | — | ||
| Total Affiliated Securities (Value is 0.14% of Net Assets) | $ | 1,773,680 | $ | — | $ | — | |||||||
aAP Pharma Inc. changed its name to Heron Therapeutics Inc.
bGross reduction was the result of various corporate actions.
cAs of April 30, 2014, no longer an affiliate.
58 | Annual Report
Franklin Strategic Series
Notes to Financial Statements (continued)
9. CREDIT FACILITY
The Funds, together with other U.S. registered and foreign investment funds (collectively, Borrowers), managed by Franklin Templeton Investments, are borrowers in a joint syndicated senior unsecured credit facility totaling $1.5 billion (Global Credit Facility) which matures on February 13, 2015. This Global Credit Facility provides a source of funds to the Borrowers for temporary and emergency purposes, including the ability to meet future unanticipated or unusually large redemption requests.
Under the terms of the Global Credit Facility, the Funds shall, in addition to interest charged on any borrowings made by the Funds and other costs incurred by the Funds, pay their share of fees and expenses incurred in connection with the implementation and maintenance of the Global Credit Facility, based upon their relative share of the aggregate net assets of all of the Borrowers, including an annual commitment fee of 0.07% based upon the unused portion of the Global Credit Facility. These fees are reflected in other expenses on the Statements of Operations. During the year ended April 30, 2014, the Funds did not use the Global Credit Facility.
10. FAIR VALUE MEASUREMENTS
The Funds follow a fair value hierarchy that distinguishes between market data obtained from independent sources (observable inputs) and the Funds’ own market assumptions (unobservable inputs). These inputs are used in determining the value of the Funds’ financial instruments and are summarized in the following fair value hierarchy:
- Level 1 – quoted prices in active markets for identical financial instruments
- Level 2 – other significant observable inputs (including quoted prices for similar financial instruments, interest rates, prepayment speed, credit risk, etc.)
- Level 3 – significant unobservable inputs (including the Funds’ own assumptions in determining the fair value of financial instruments)
The input levels are not necessarily an indication of the risk or liquidity associated with financial instruments at that level.
For movements between the levels within the fair value hierarchy, the Funds have adopted a policy of recognizing the transfers as of the date of the underlying event which caused the movement.
Annual Report | 59
Franklin Strategic Series
Notes to Financial Statements (continued)
10. FAIR VALUE MEASUREMENTS (continued)
A summary of inputs used as of April 30, 2014, in valuing the Funds’ assets carried at fair value, is as follows:
| Level 1 | Level 2 | Level 3 | Total | |||||
| Franklin Biotechnology Discovery Fund | ||||||||
| Assets: | ||||||||
| Investments in Securities: | ||||||||
| Equity Investments:a | ||||||||
| Biotechnology | $ | 1,056,163,495 | $ | 3,967,840 | $ | 10,082,727 | $ | 1,070,214,062 |
| Other Equity Investmentsb | 210,203,199 | — | — | 210,203,199 | ||||
| Short Term Investments | 9,738,828 | 103,270,161 | — | 113,008,989 | ||||
| Total Investments in | ||||||||
| Securities | $ | 1,276,105,522 | $ | 107,238,001 | $ | 10,082,727 | $ | 1,393,426,250 |
| Franklin Natural Resources Fund | ||||||||
| Assets: | ||||||||
| Investments in Securities: | ||||||||
| Equity Investments:a | ||||||||
| Oil & Gas Exploration | ||||||||
| & Production | $ | 246,609,110 | $ | 12,409,347 | $ | — | $ | 259,018,457 |
| Other Equity Investmentsb | 536,533,108 | — | —c | 536,533,108 | ||||
| Convertible Bonds | — | 3,590,231 | — | 3,590,231 | ||||
| Short Term Investments | 48,057,981 | 2,500,000 | — | 50,557,981 | ||||
| Total Investments in | ||||||||
| Securities | $ | 831,200,199 | $ | 18,499,578 | $ | —c | $ | 849,699,777 |
aIncludes common, preferred and convertible preferred stocks as well as other equity investments.
bFor detailed categories, see the accompanying Statement of Investments.
cIncludes securities determined to have no value at April 30, 2014.
A reconciliation of assets in which Level 3 inputs are used in determining fair value is presented when there are significant Level 3 financial instruments at the end of the year.
11. NEW ACCOUNTING PRONOUNCEMENTS
In June 2013, the Financial Accounting Standards Board issued Accounting Standards Update (ASU) No. 2013-08, Investment Companies (Topic 946): Amendments to the Scope, Measurement, and Disclosure Requirements. The ASU modifies the criteria used in defining an investment company under U.S. Generally Accepted Accounting Principles and also sets forth certain measurement and disclosure requirements. Under the ASU, an entity that is registered under the 1940 Act automatically qualifies as an investment company. The ASU is effective for interim and annual reporting periods beginning after December 15, 2013. Management has reviewed the requirements and believes the adoption of this ASU will not have a material impact on the financial statements.
60 | Annual Report
Franklin Strategic Series
Notes to Financial Statements (continued)
12. SUBSEQUENT EVENTS
The Funds have evaluated subsequent events through the issuance of the financial statements and determined that no events have occurred that require disclosure other than those already disclosed in the financial statements.
ABBREVIATIONS
Selected Portfolio
ADR - American Depositary Receipt
Annual Report | 61
Franklin Strategic Series
Report of Independent Registered Public Accounting Firm
To the Board of Trustees and Shareholders of Franklin Strategic Series
In our opinion, the accompanying statements of assets and liabilities, including the statements of investments, and the related statements of operations and of changes in net assets and the financial highlights present fairly, in all material respects, the financial position of Franklin Biotechnology Discovery Fund and Franklin Natural Resources Fund (separate portfolios of Franklin Strategic Series, hereafter referred to as the “Funds”) at April 30, 2014, the results of each of their operations for the year then ended, the changes in each of their net assets for each of the two years in the period then ended and the financial highlights for each of the periods presented, in conformity with accounting principles generally accepted in the United States of America. These financial statements and financial highlights (hereafter referred to as “financial statements”) are the responsibility of the Funds’ management. Our responsibility is to express an opinion on these financial statements based on our audits. We conducted our audits of these financial statements in accordance with the standards of the Public Company Accounting Oversight Board (United States). Those standards require that we plan and perform the audit to obtain reasonable assurance about whether the financial statements are free of material misstatement. An audit includes examining, on a test basis, evidence supporting the amounts and disclosures in the financial statements, assessing the accounting principles used and significant estimates made by management, and evaluating the overall financial statement presentation. We believe that our audits, which included confirmation of securities at April 30, 2014 by correspondence with the custodian, transfer agent and brokers, provide a reasonable basis for our opinion.
PricewaterhouseCoopers LLP
San Francisco, California
June 13, 2014
62 | Annual Report
Franklin Strategic Series
Tax Information (unaudited)
Under Section 852(b)(3)(C) of the Internal Revenue Code (Code), the Franklin Biotechnology Discovery Fund hereby reports the maximum amount allowable but no less than $62,254,461 as long term capital gain dividends for the fiscal year ended April 30, 2014.
Under Section 871(k)(2)(C) of the Code, the Franklin Biotechnology Discovery Fund hereby reports the maximum amount allowable but no less than $13,679,735 as short term capital gain dividends for purposes of the tax imposed under Section 871(a)(1)(A) of the Code for the fiscal year ended April 30, 2014.
Under Section 854(b)(1)(A) of the Code, the Funds hereby report the following percentage amounts of the ordinary income dividends as income qualifying for the dividends received deduction for the fiscal year ended April 30, 2014:
| Franklin | Franklin | ||
| Biotechnology | Natural | ||
| Discovery Fund | Resources Fund | ||
| 9.62 | % | 100.00 | % |
Under Section 854(b)(1)(B) of the Code, the Funds hereby report the maximum amount allowable but no less than the following amounts as qualified dividends for purposes of the maximum rate under Section 1(h)(11) of the Code for the fiscal year ended April 30, 2014:
| Franklin | Franklin | ||
| Biotechnology | Natural | ||
| Discovery Fund | Resources Fund | ||
| $ | 1,535,253 | $ | 12,276,368 |
Distributions, including qualified dividend income, paid during calendar year 2014 will be reported to shareholders on Form 1099-DIV by mid-February 2015. Shareholders are advised to check with their tax advisors for information on the treatment of these amounts on their individual income tax returns.
Annual Report | 63
Franklin Strategic Series
Board Members and Officers
The name, year of birth and address of the officers and board members, as well as their affiliations, positions held with the Trust, principal occupations during at least the past five years and number of portfolios overseen in the Franklin Templeton Investments fund complex are shown below. Generally, each board member serves until that person’s successor is elected and qualified.
| Independent Board Members | ||||
| Number of Portfolios in | ||||
| Name, Year of Birth | Length of | Fund Complex Overseen | Other Directorships Held | |
| and Address | Position | Time Served | by Board Member* | During at Least the Past 5 Years |
| Harris J. Ashton (1932) | Trustee | Since 1991 | 139 | Bar-S Foods (meat packing company) |
| One Franklin Parkway | (1981-2010). | |||
| San Mateo, CA 94403-1906 | ||||
| Principal Occupation During at Least the Past 5 Years: | ||||
| Director of various companies; and formerly, Director, RBC Holdings, Inc. (bank holding company) (until 2002); and President, Chief Executive | ||||
| Officer and Chairman of the Board, General Host Corporation (nursery and craft centers) (until 1998). | ||||
| Sam Ginn (1937) | Trustee | Since 2007 | 113 | ICO Global Communications |
| One Franklin Parkway | (Holdings) Limited (satellite company) | |||
| San Mateo, CA 94403-1906 | (2006-2010), Chevron Corporation | |||
| (global energy company) (1989-2009), | ||||
| Hewlett-Packard Company (technology | ||||
| company) (1996-2002), Safeway, Inc. | ||||
| (grocery retailer) (1991-1998) and | ||||
| TransAmerica Corporation (insurance | ||||
| company) (1989-1999). | ||||
| Principal Occupation During at Least the Past 5 Years: | ||||
| Private investor; Chairman, First Responder Network Authority (FirstNet) (interoperable wireless broadband network) (2012); and formerly, | ||||
| Chairman of the Board, Vodafone AirTouch, PLC (wireless company) (1999-2000); Chairman of the Board and Chief Executive Officer, | ||||
| AirTouch Communications (cellular communications) (1993-1998) and Pacific Telesis Group (telephone holding company) (1988-1994). | ||||
| Edith E. Holiday (1952) | Trustee | Since 1998 | 139 | Hess Corporation (exploration and |
| One Franklin Parkway | refining of oil and gas), H.J. Heinz | |||
| San Mateo, CA 94403-1906 | Company (processed foods and | |||
| allied products) (1994-2013), RTI | ||||
| International Metals, Inc. (manu- | ||||
| facture and distribution of titanium), | ||||
| Canadian National Railway (railroad) | ||||
| and White Mountains Insurance | ||||
| Group, Ltd. (holding company). | ||||
| Principal Occupation During at Least the Past 5 Years: | ||||
| Director or Trustee of various companies and trusts; and formerly, Assistant to the President of the United States and Secretary of the | ||||
| Cabinet (1990-1993); General Counsel to the United States Treasury Department (1989-1990); and Counselor to the Secretary and Assistant | ||||
| Secretary for Public Affairs and Public Liaison – United States Treasury Department (1988-1989). | ||||
| J. Michael Luttig (1954) | Trustee | Since 2009 | 139 | Boeing Capital Corporation (aircraft |
| One Franklin Parkway | financing) (2006-2013). | |||
| San Mateo, CA 94403-1906 | ||||
| Principal Occupation During at Least the Past 5 Years: | ||||
| Executive Vice President, General Counsel and member of the Executive Council, The Boeing Company (aerospace company); and formerly, | ||||
| Federal Appeals Court Judge, U.S. Court of Appeals for the Fourth Circuit (1991-2006). | ||||
| 64 | Annual Report | ||||
| Number of Portfolios in | ||||
| Name, Year of Birth | Length of | Fund Complex Overseen | Other Directorships Held | |
| and Address | Position | Time Served | by Board Member* | During at Least the Past 5 Years |
| Frank A. Olson (1932) | Trustee | Since 2007 | 139 | Hess Corporation (exploration and |
| One Franklin Parkway | refining of oil and gas) (1998-2013). | |||
| San Mateo, CA 94403-1906 | ||||
| Principal Occupation During at Least the Past 5 Years: | ||||
| Chairman Emeritus, The Hertz Corporation (car rental) (since 2000) (Chairman of the Board (1980-2000) and Chief Executive Officer | ||||
| (1977-1999)); and formerly, Chairman of the Board, President and Chief Executive Officer, UAL Corporation (airlines) (until 1987). | ||||
| Larry D. Thompson (1945) | Trustee | Since 2007 | 139 | Cbeyond, Inc. (business commu- |
| One Franklin Parkway | nications provider) (2010-2012), | |||
| San Mateo, CA 94403-1906 | The Southern Company (energy | |||
| company) (2010-2012) and Graham | ||||
| Holdings Company (formerly, | ||||
| The Washington Post Company) | ||||
| (education and media organization). | ||||
| Principal Occupation During at Least the Past 5 Years: | ||||
| Executive Vice President – Government Affairs, General Counsel and Corporate Secretary, PepsiCo, Inc. (consumer products) (2012-present); | ||||
| and formerly, John A. Sibley Professor of Corporate and Business Law, University of Georgia School of Law (2011-2012); Senior Vice | ||||
| President – Government Affairs, General Counsel and Secretary, PepsiCo, Inc. (2004-2011); Senior Fellow of The Brookings Institution | ||||
| (2003-2004); Visiting Professor, University of Georgia School of Law (2004); and Deputy Attorney General, U.S. Department of Justice | ||||
| (2001-2003). | �� | |||
| John B. Wilson (1959) | Lead | Trustee since | 113 | None |
| One Franklin Parkway | Independent | 2006 and Lead | ||
| San Mateo, CA 94403-1906 | Trustee | Independent | ||
| Trustee since | ||||
| 2008 | ||||
| Principal Occupation During at Least the Past 5 Years: | ||||
| President, Staples Europe (office supplies) (2012-present); President and Founder, Hyannis Port Capital, Inc. (real estate and private equity | ||||
| investing); serves on private and non-profit boards; and formerly, Chief Operating Officer and Executive Vice President, Gap, Inc. (retail) | ||||
| (1996-2000); Chief Financial Officer and Executive Vice President – Finance and Strategy, Staples, Inc. (1992-1996); Senior Vice President – | ||||
| Corporate Planning, Northwest Airlines, Inc. (airlines) (1990-1992); and Vice President and Partner, Bain & Company (consulting firm) | ||||
| (1986-1990). | ||||
| Interested Board Members and Officers | ||||
| Number of Portfolios in | ||||
| Name, Year of Birth | Length of | Fund Complex Overseen | Other Directorships Held | |
| and Address | Position | Time Served | by Board Member* | During at Least the Past 5 Years |
| **Gregory E. Johnson (1961) | Trustee | Since June 2013 | 149 | None |
| One Franklin Parkway | ||||
| San Mateo, CA 94403-1906 | ||||
| Principal Occupation During at Least the Past 5 Years: | ||||
| Chairman of the Board, Member – Office of the Chairman, Director, President and Chief Executive Officer, Franklin Resources, Inc.; officer | ||||
| and/or director or trustee, as the case may be, of some of the other subsidiaries of Franklin Resources, Inc. and of 44 of the investment | ||||
| companies in Franklin Templeton Investments; and Chairman, Investment Company Institute. | ||||
Annual Report | 65
| Number of Portfolios in | ||||
| Name, Year of Birth | Length of | Fund Complex Overseen | Other Directorships Held | |
| and Address | Position | Time Served | by Board Member* | During at Least the Past 5 Years |
| **Rupert H. Johnson, Jr. (1940) | Chairman of | Chairman of the | 139 | None |
| One Franklin Parkway | the Board and | Board since June | ||
| San Mateo, CA 94403-1906 | Trustee | 2013 and Trustee | ||
| since 1991 | ||||
| Principal Occupation During at Least the Past 5 Years: | ||||
| Vice Chairman, Member – Office of the Chairman and Director, Franklin Resources, Inc.; Director, Franklin Advisers, Inc.; Senior Vice | ||||
| President, Franklin Advisory Services, LLC; and officer and/or director or trustee, as the case may be, of some of the other subsidiaries of | ||||
| Franklin Resources, Inc. and of 41 of the investment companies in Franklin Templeton Investments. | ||||
| Alison E. Baur (1964) | Vice President | Since 2012 | Not Applicable | Not Applicable |
| One Franklin Parkway | ||||
| San Mateo, CA 94403-1906 | ||||
| Principal Occupation During at Least the Past 5 Years: | ||||
| Deputy General Counsel, Franklin Templeton Investments; and officer of some of the other subsidiaries of Franklin Resources, Inc. and of 46 | ||||
| of the investment companies in Franklin Templeton Investments. | ||||
| Laura F. Fergerson (1962) | Chief | Since 2009 | Not Applicable | Not Applicable |
| One Franklin Parkway | Executive | |||
| San Mateo, CA 94403-1906 | Officer – | |||
| Finance and | ||||
| Administration | ||||
| Principal Occupation During at Least the Past 5 Years: | ||||
| Senior Vice President, Franklin Templeton Services, LLC; and officer of 46 of the investment companies in Franklin Templeton Investments. | ||||
| Gaston Gardey (1967) | Treasurer, | Since 2009 | Not Applicable | Not Applicable |
| One Franklin Parkway | Chief Financial | |||
| San Mateo, CA 94403-1906 | Officer and | |||
| Chief | ||||
| Accounting | ||||
| Officer | ||||
| Principal Occupation During at Least the Past 5 Years: | ||||
| Director, Fund Accounting, Franklin Templeton Investments; and officer of 27 of the investment companies in Franklin Templeton Investments. | ||||
| Aliya S. Gordon (1973) | Vice President | Since 2009 | Not Applicable | Not Applicable |
| One Franklin Parkway | ||||
| San Mateo, CA 94403-1906 | ||||
| Principal Occupation During at Least the Past 5 Years: | ||||
| Senior Associate General Counsel, Franklin Templeton Investments; officer of 46 of the investment companies in Franklin Templeton | ||||
| Investments; and formerly, Litigation Associate, Steefel, Levitt & Weiss, LLP (2000-2004). | ||||
| Steven J. Gray (1955) | Vice President | Since 2009 | Not Applicable | Not Applicable |
| One Franklin Parkway | ||||
| San Mateo, CA 94403-1906 | ||||
| Principal Occupation During at Least the Past 5 Years: | ||||
| Senior Associate General Counsel, Franklin Templeton Investments; Vice President, Franklin Templeton Distributors, Inc. and Franklin | ||||
| Alternative Strategies Advisers, LLC; and officer of 46 of the investment companies in Franklin Templeton Investments. | ||||
66 | Annual Report
| Number of Portfolios in | ||||
| Name, Year of Birth | Length of | Fund Complex Overseen | Other Directorships Held | |
| and Address | Position | Time Served | by Board Member* | During at Least the Past 5 Years |
| Selena L. Holmes (1965) | Vice President | Since 2012 | Not Applicable | Not Applicable |
| 100 Fountain Parkway | – AML | |||
| St. Petersburg, FL 33716-1205 | Compliance | |||
| Principal Occupation During at Least the Past 5 Years: | ||||
| Director, Global Compliance Monitoring; Deputy Chief Compliance Officer, Franklin Alternative Strategies Advisers, LLC; and officer of 46 of | ||||
| the investment companies in Franklin Templeton Investments. | ||||
| Edward B. Jamieson (1948) | President and | Since 2010 | Not Applicable | Not Applicable |
| One Franklin Parkway | Chief | |||
| San Mateo, CA 94403-1906 | Executive | |||
| Officer – | ||||
| Investment | ||||
| Management | ||||
| Principal Occupation During at Least the Past 5 Years: | ||||
| President, Chief Investment Officer and Director, Franklin Advisers, Inc.; Executive Vice President, Franklin Templeton Institutional, LLC; | ||||
| and officer and/or trustee, as the case may be, of some of the other subsidiaries of Franklin Resources, Inc. and of 10 of the investment | ||||
| companies in Franklin Templeton Investments. | ||||
| Christopher J. Molumphy (1962) | Vice President | Since 2000 | Not Applicable | Not Applicable |
| One Franklin Parkway | ||||
| San Mateo, CA 94403-1906 | ||||
| Principal Occupation During at Least the Past 5 Years: | ||||
| Director and Executive Vice President, Franklin Advisers, Inc.; Executive Vice President, Franklin Templeton Institutional, LLC; and officer of | ||||
| some of the other subsidiaries of Franklin Resources, Inc. and of 22 of the investment companies in Franklin Templeton Investments. | ||||
| Kimberly H. Novotny (1972) | Vice President | Since 2013 | Not Applicable | Not Applicable |
| 300 S.E. 2nd Street | ||||
| Fort Lauderdale, FL 33301-1923 | ||||
| Principal Occupation During at Least the Past 5 Years: | ||||
| Associate General Counsel, Franklin Templeton Investments; Vice President and Secretary, Fiduciary Trust International of the South; Vice | ||||
| President, Templeton Investment Counsel, LLC; Assistant Secretary, Franklin Resources, Inc.; and officer of 46 of the investment companies | ||||
| in Franklin Templeton Investments. | ||||
| Robert C. Rosselot (1960) | Chief | Since 2013 | Not Applicable | Not Applicable |
| 300 S.E. 2nd Street | Compliance | |||
| Fort Lauderdale, FL 33301-1923 | Officer | |||
| Principal Occupation During at Least the Past 5 Years: | ||||
| Director, Global Compliance, Franklin Templeton Investments; Vice President, Franklin Templeton Companies, LLC; officer of 46 of the | ||||
| investment companies in Franklin Templeton Investments; and formerly, Senior Associate General Counsel, Franklin Templeton Investments | ||||
| (2007-2013); and Secretary and Vice President, Templeton Group of Funds (2004-2013). | ||||
| Karen L. Skidmore (1952) | Vice President | Since 2006 | Not Applicable | Not Applicable |
| One Franklin Parkway | and Secretary | |||
| San Mateo, CA 94403-1906 | ||||
| Principal Occupation During at Least the Past 5 Years: | ||||
| Senior Associate General Counsel, Franklin Templeton Investments; and officer of 46 of the investment companies in Franklin | ||||
| Templeton Investments. | ||||
Annual Report | 67
| Number of Portfolios in | ||||
| Name, Year of Birth | Length of | Fund Complex Overseen | Other Directorships Held | |
| and Address | Position | Time Served | by Board Member* | During at Least the Past 5 Years |
| Craig S. Tyle (1960) | Vice President | Since 2005 | Not Applicable | Not Applicable |
| One Franklin Parkway | ||||
| San Mateo, CA 94403-1906 | ||||
| Principal Occupation During at Least the Past 5 Years: | ||||
| General Counsel and Executive Vice President, Franklin Resources, Inc.; and officer of some of the other subsidiaries of Franklin Resources, | ||||
| Inc. and of 46 of the investment companies in Franklin Templeton Investments. | ||||
| Lori A. Weber (1964) | Vice President | Since 2011 | Not Applicable | Not Applicable |
| 300 S.E. 2nd Street | ||||
| Fort Lauderdale, FL 33301-1923 | ||||
| Principal Occupation During at Least the Past 5 Years: | ||||
| Senior Associate General Counsel, Franklin Templeton Investments; Assistant Secretary, Franklin Resources, Inc.; Vice President and | ||||
| Secretary, Templeton Investment Counsel, LLC; Vice President, Fiduciary Trust International of the South; and officer of 46 of the investment | ||||
| companies in Franklin Templeton Investments. | ||||
*We base the number of portfolios on each separate series of the U.S. registered investment companies within the Franklin Templeton Investments fund complex. These portfolios have a common investment manager or affiliated investment managers.
**Gregory E. Johnson is considered to be an interested person of the Fund under the federal securities laws due to his position as an officer and director of Franklin Resources, Inc. (Resources), which is the parent company of the Fund’s investment manager and distributor. Rupert H. Johnson, Jr. is considered to be an interested person of the Fund under the federal securities laws due to his position as officer and director and major shareholder of Resources.
Note 1: Rupert H. Johnson, Jr. is the uncle of Gregory E. Johnson.
Note 2: Officer information is current as of the date of this report. It is possible that after this date, information about officers may change. Note 3: Effective June 13, 2013, Charles B. Johnson ceased to be a trustee of the Fund.
The Sarbanes-Oxley Act of 2002 and Rules adopted by the Securities and Exchange Commission require the Fund to disclose whether the Fund’s Audit Committee includes at least one member who is an audit committee financial expert within the meaning of such Act and Rules. The Fund’s Board has determined that there is at least one such financial expert on the Audit Committee and has designated John B. Wilson as its audit committee financial expert. The Board believes that Mr. Wilson qualifies as such an expert in view of his extensive business background and experience, including service as chief financial officer of Staples, Inc. from 1992 to 1996. Mr. Wilson has been a Member and Chairman of the Fund’s Audit Committee since 2006. As a result of such background and experience, the Board believes that Mr. Wilson has acquired an understanding of generally accepted accounting principles and financial statements, the general application of such principles in connection with the accounting estimates, accruals and reserves, and analyzing and evaluating financial statements that present a breadth and level of complexity of accounting issues generally comparable to those of the Fund, as well as an understanding of internal controls and procedures for financial reporting and an understanding of audit committee functions. Mr. Wilson is an independent Board member as that term is defined under the relevant Securities and Exchange Commission Rules and Releases.
The Statement of Additional Information (SAI) includes additional information about the board members and is available, without charge, upon request. Shareholders may call (800) DIAL BEN/342-5236 to request the SAI.
68 | Annual Report
Franklin Strategic Series
Shareholder Information
Board Review of Investment Management Agreement
At a meeting held April 15, 2014, the Board of Trustees (Board), including a majority of non-interested or independent Trustees, approved renewal of the investment management agreement for each of the separate funds within the Trust (Fund(s)). In reaching this decision, the Board took into account information furnished throughout the year at regular Board meetings, as well as information prepared specifically in connection with the annual renewal review process. Information furnished and discussed throughout the year included investment performance reports and related financial information for each Fund, along with periodic reports on expenses, shareholder services, legal and compliance matters, pricing, brokerage commissions and execution and other services provided by the Investment Manager (Manager) and its affiliates. Information furnished specifically in connection with the renewal process included a report for each Fund prepared by Lipper, Inc. (Lipper), an independent organization, as well as additional material, including a Fund profitability analysis prepared by management. The Lipper reports compared each Fund’s investment performance and expenses with those of other mutual funds deemed comparable to the Fund as selected by Lipper. The Fund profitability analysis discussed the profitability to Franklin Templeton Investments from its overall U.S. fund operations, as well as on an individual fund-by-fund basis. Additional material accompanying such profitability analysis included information on a fund-by-fund basis listing portfolio managers and other accounts they manage, as well as information on management fees charged by the Manager and its affiliates to U.S. mutual funds and other accounts, including management’s explanation of differences where relevant. Such material also included a memorandum prepared by management describing project initiatives and capital investments relating to the services provided to the Funds by the Franklin Templeton Investments organization, as well as a memorandum relating to economies of scale and an analysis concerning transfer agent fees charged by an affiliate of the Manager.
In considering such materials, the independent Trustees received assistance and advice from and met separately with independent counsel. While the investment management agreements for all Funds were considered at the same Board meeting, the Board dealt with each Fund separately. In approving continuance of the investment management agreement for each Fund, the Board, including a majority of independent Trustees, determined that the existing management fee structure was fair and reasonable and that continuance of the investment management agreement was in the best interests of each Fund and its shareholders. While attention was given to all information furnished, the following discusses some primary factors relevant to the Board’s decision.
NATURE, EXTENT AND QUALITY OF SERVICE. The Board was satisfied with the nature and quality of the overall services provided by the Manager and its affiliates to the Funds and their shareholders. In addition to investment performance and expenses discussed later, the Board’s opinion was based, in part, upon periodic reports furnished it showing that the investment policies and restrictions for each Fund were consistently complied with as well as other reports periodically furnished the Board covering matters such as the compliance of portfolio managers and other management personnel with the code of ethics adopted throughout the Franklin Templeton fund complex, the adherence to fair value pricing procedures established by the Board, and the accuracy of net asset value calculations. The Board also noted the extent of benefits provided Fund shareholders from being part of the Franklin Templeton family of funds, including the right to exchange
Annual Report | 69
Franklin Strategic Series
Shareholder Information (continued)
Board Review of Investment Management Agreement (continued)
investments between the same class of funds without a sales charge, the ability to reinvest Fund dividends into other funds and the right to combine holdings in other funds to obtain a reduced sales charge. Favorable consideration was given to management’s continual efforts and expenditures in establishing back-up systems and recovery procedures to function in the event of a natural disaster, it being noted that such systems and procedures had functioned well during the Florida hurricanes and blackouts experienced in previous years, and that those operations in the New York/New Jersey area ran smoothly during the period of the 2012 Hurricane Sandy. Among other factors taken into account by the Board were the Manager’s best execution trading policies, including a favorable report by an independent portfolio trading analytical firm, which also covered FOREX transactions. Consideration was also given to the experience of each Fund’s portfolio management team, the number of accounts managed and general method of compensation. In this latter respect, the Board noted that a primary factor in management’s determination of a portfolio manager’s bonus compensation was the relative investment performance of the funds he or she managed and that a portion of such bonus was required to be invested in a predesignated list of funds within such person’s fund management area so as to be aligned with the interests of shareholders. The Board also took into account the quality of transfer agent and shareholder services provided Fund shareholders by an affiliate of the Manager, and the continual enhancements to the Franklin Templeton website. Particular attention was given to management’s conservative approach and diligent risk management procedures, including continual monitoring of counterparty credit risk and attention given to derivatives and other complex instruments, including expanded collateralization requirements. The Board also took into account, among other things, management’s efforts in establishing a global credit facility for the benefit of the Funds and other accounts managed by Franklin Templeton Investments to provide a source of cash for temporary and emergency purposes or to meet unusual redemption requests as well as the strong financial position of the Manager’s parent company and its commitment to the mutual fund business as evidenced by its subsidization of money market funds.
INVESTMENT PERFORMANCE. The Board placed significant emphasis on the investment performance of the Funds in view of its importance to shareholders. While consideration was given to performance reports and discussions with portfolio managers at Board meetings throughout the year, particular attention in assessing performance was given to the Lipper reports furnished for the agreement renewals. The Lipper reports prepared for each such individual Fund showed the investment performance of its Class A shares in comparison to a performance universe selected by Lipper. Comparative performance for each Fund was shown for the one-year period ended January 31, 2014, and previous periods ended that date of up to 10 years. The following summarizes the performance results for each of these Funds and the Board’s view of such performance.
Franklin Biotechnology Discovery Fund – The performance universe for this Fund consisted of the Fund and all retail and institutional health/biotechnology funds as selected by Lipper. The Lipper report showed the Fund’s total return for the one-year period to be in the highest or best performing quintile of its performance universe, and on an annualized basis, to also be in the highest performing quintile of such universe for the previous three-year period, and the second-highest
70 | Annual Report
Franklin Strategic Series
Shareholder Information (continued)
Board Review of Investment Management Agreement (continued)
performing quintile of such universe for each of the previous five- and 10-year periods. The Board was satisfied with the Fund’s investment performance as set forth in the Lipper report.
Franklin Natural Resources Fund – The performance universe for this Fund consisted of the Fund and all retail and institutional global natural resources funds as selected by Lipper. The Lipper report comparison for the Fund showed its total return for the one-year period to be in the middle performing quintile of its performance universe, and on an annualized basis to be in the second-lowest performing quintile of such universe for the previous three-year period, the second-highest performing quintile of such universe for the previous five-year period, and the middle performing quintile of such universe for the previous 10-year period. The Board discussed with management the investment focus of the Fund and found the Fund’s overall performance as set forth in the Lipper report to be acceptable.
COMPARATIVE EXPENSES. Consideration was given to a comparative analysis of the management fees and total expense ratio of each Fund compared with those of a group of other funds selected by Lipper as its appropriate Lipper expense group. Lipper expense data is based upon information taken from each fund’s most recent annual report, which reflects historical asset levels that may be quite different from those currently existing, particularly in a period of market volatility. While recognizing such inherent limitation and the fact that expense ratios generally increase as assets decline and decrease as assets grow, the Board believed the independent analysis conducted by Lipper to be an appropriate measure of comparative expenses. In reviewing comparative costs, Lipper provides information on each Fund’s contractual investment management fee in comparison with the investment management fee that would have been charged by other funds within its Lipper expense group assuming they were similar in size to the Fund, as well as the actual total expense ratio of the Fund in comparison with those of its Lipper expense group. The Lipper contractual investment management fee analysis includes administrative charges as being part of the investment management fee, and actual total expenses, for comparative consistency, are shown by Lipper for Fund Class A shares. The results of such expense comparisons showed the contractual investment management fee rates and actual total expense ratio for each of Franklin Natural Resources Fund and Franklin Biotechnology Discovery Fund to be in the least expensive quintile of their respective Lipper expense groups. The Board was satisfied with the contractual management fee rate and total expense ratio of each of these Funds in comparison to their respective expense groups as shown in the Lipper reports.
MANAGEMENT PROFITABILITY. The Board also considered the level of profits realized by the Manager and its affiliates in connection with the operation of each Fund. In this respect, the Board reviewed the Fund profitability analysis that addresses the overall profitability of Franklin Templeton’s U.S. fund business, as well as its profits in providing management and other services to each of the individual funds during the 12-month period ended September 30, 2013, being the most recent fiscal year-end for Franklin Resources, Inc., the Manager’s parent. In reviewing the analysis, the Board recognized that allocation methodologies are inherently subjective and various
Annual Report | 71
Franklin Strategic Series
Shareholder Information (continued)
Board Review of Investment Management Agreement (continued)
allocation methodologies may be reasonable while producing different results. In this respect, the Board noted that while management continually makes refinements to its methodologies in response to organizational and product related changes, the overall approach as defined by the primary drivers and activity measurements has remained consistent with that used in the Funds’ profitability report presentations from prior years. Additionally, the Funds’ independent registered public accounting firm had been engaged by the Manager to periodically review the reasonableness of the allocation methodologies to be used solely by the Funds’ Board in reference to the profitability analysis. In reviewing and discussing such analysis, management discussed with the Board its belief that costs incurred in establishing the infrastructure necessary for the type of mutual fund operations conducted by the Manager and its affiliates may not be fully reflected in the expenses allocated to each Fund in determining its profitability, as well as the fact that the level of profits, to a certain extent, reflected operational cost savings and efficiencies initiated by management. The Board also took into account management’s expenditures in improving shareholder services provided the Funds, as well as the need to implement systems and meet additional regulatory and compliance requirements resulting from statutes such as the Sarbanes-Oxley and Dodd-Frank Acts and recent SEC and other regulatory requirements. In addition, the Board considered a third-party study comparing the profitability of the Manager’s parent on an overall basis to other publicly held managers broken down to show profitability from management operations exclusive of distribution expenses, as well as profitability including distribution expenses. The Board also considered the extent to which the Manager and its affiliates might derive ancillary benefits from fund operations, including revenues generated from transfer agent services and potential benefits resulting from allocation of fund brokerage and the use of commission dollars to pay for research. Based upon its consideration of all these factors, the Board determined that the level of profits realized by the Manager and its affiliates from providing services to each Fund was not excessive in view of the nature, quality and extent of services provided.
ECONOMIES OF SCALE. The Board also considered whether economies of scale are realized by the Manager as the Funds grow larger and the extent to which this is reflected in the level of management fees charged. While recognizing that any precise determination is inherently subjective, the Board noted that based upon the Fund profitability analysis, it appears that as some funds get larger, at some point economies of scale do result in the Manager realizing a larger profit margin on management services provided such a fund. The Board noted that economies of scale were shared with each Fund and its shareholders through management fee breakpoints so that as a Fund grows in size, its effective management fee rate declines. The fee structure under the investment management agreements for all of the Funds contains breakpoints that continued to asset levels that exceeded their asset sizes at December 31, 2013. In view of such fee structure and the favorable expense comparisons of each of the Funds within their respective expense groups, the Board believed that to the extent economies of scale may be realized by the manager of these Funds and its affiliates, that there was a sharing of benefits with each Fund and its shareholders. In addition to the investment advisory services provided Franklin Biotechnology Discovery Fund, administrative services are provided for such Fund under a separate agreement at a charge of 0.15% on the first $200 million of Fund net
72 | Annual Report
Franklin Strategic Series
Shareholder Information (continued)
Board Review of Investment Management Agreement (continued)
assets, 0.135% on the next $500 million of Fund net assets, 0.100% on the next $500 million of Fund net assets, and 0.075% on assets above the $1.2 billion level. At the April 15, 2014, Board meeting, the Board eliminated the separate investment management and administrative agreements and approved a new form of investment management agreement for Franklin Biotechnology Discovery Fund combining such services. In approving the new form of investment management agreement, the Board took into account that the types of services would be the same as provided under the previous separate agreements and that the aggregate fee, including breakpoints, would be the same as that charged under the previous separate agreements. The Board also noted that combining such services was consistent with Lipper’s methodology of considering contractual investment management fees to include any separately charged administrative fee.
Proxy Voting Policies and Procedures
The Trust’s investment manager has established Proxy Voting Policies and Procedures (Policies) that the Trust uses to determine how to vote proxies relating to portfolio securities. Shareholders may view the Trust’s complete Policies online at franklintempleton.com. Alternatively, shareholders may request copies of the Policies free of charge by calling the Proxy Group collect at (954) 527-7678 or by sending a written request to: Franklin Templeton Companies, LLC, 300 S.E. 2nd Street, Fort Lauderdale, FL 33301, Attention: Proxy Group. Copies of the Trust’s proxy voting records are also made available online at franklintempleton.com and posted on the U.S. Securities and Exchange Commission’s website at sec.gov and reflect the most recent 12-month period ended June 30.
Quarterly Statement of Investments
The Trust files a complete statement of investments with the U.S. Securities and Exchange Commission for the first and third quarters for each fiscal year on Form N-Q. Shareholders may view the filed Form N-Q by visiting the Commission’s website at sec.gov. The filed form may also be viewed and copied at the Commission’s Public Reference Room in Washington, DC. Information regarding the operations of the Public Reference Room may be obtained by calling (800) SEC-0330.
Householding of Reports and Prospectuses
You will receive each Fund’s financial reports every six months as well as an annual updated summary prospectus (prospectus available upon request). To reduce Fund expenses, we try to identify related shareholders in a household and send only one copy of the financial reports and summary prospectus. This process, called “householding,” will continue indefinitely unless you instruct us otherwise. If you prefer not to have these documents householded, please call us at (800) 632-2301. At any time you may view current prospectuses/summary prospectuses and financial reports on our website. If you choose, you may receive these documents through electronic delivery.
Annual Report | 73
This page intentionally left blank.
This page intentionally left blank.
This page intentionally left blank.

Annual Report and Shareholder Letter
Franklin Strategic Series
Investment Manager
Franklin Advisers, Inc.
Distributor
Franklin Templeton Distributors, Inc.
(800) DIAL BEN®/342-5236
franklintempleton.com
Shareholder Services
(800) 632-2301
Authorized for distribution only when accompanied or preceded by a summary prospectus and/or prospectus.
Investors should carefully consider a fund’s investment goals, risks, charges and expenses before investing.
A prospectus contains this and other information; please read it carefully before investing.
To help ensure we provide you with quality service, all calls to and from our service areas are monitored and/or recorded.
© 2014 Franklin Templeton Investments. All rights reserved. FSS2 A 06/14
| Contents | |||||||
| Shareholder Letter | 1 | Annual Report | Financial Statements | 52 | Tax Information | 78 | |
| Franklin Strategic Income Fund | 3 | Notes to | Board Members and Officers | 79 | |||
| Financial Statements | 56 | ||||||
| Performance Summary | 9 | Shareholder Information | 84 | ||||
| Report of Independent | |||||||
| Your Fund’s Expenses | 15 | ||||||
| Registered Public | |||||||
| Financial Highlights and | Accounting Firm | 77 | |||||
| Statement of Investments | 17 | ||||||
Annual Report
Franklin Strategic Income Fund
Your Fund’s Goals and Main Investments: Franklin Strategic Income Fund seeks a
high level of current income, with capital appreciation over the long term as a secondary objective. The Fund uses an active asset allocation process and under normal market conditions invests at least 65% of its assets in U.S. and foreign debt securities, including those in emerging markets. The Fund may invest in all varieties of fixed and floating rate income securities, including bonds, corporate loans (and loan participations), mortgage-backed securities and other asset-backed securities, convertible securities and municipal securities.
We are pleased to bring you Franklin Strategic Income Fund’s annual report for the fiscal year ended April 30, 2014.
Performance Overview
Franklin Strategic Income Fund – Class A posted a +2.52% cumulative total return for the fiscal year under review. In comparison, the Barclays U.S. Aggregate Index, which represents the U.S. investment-grade fixed rate taxable bond market, had a -0.26% total return.1, 2 The Lipper Multi-Sector Income Funds Classification Average, which consists of funds chosen by Lipper that seek current income by allocating assets among different fixed income securities sectors, with a significant portion rated below investment grade, produced a +1.86% total return.3 You can find the Fund’s long-term performance data in the Performance Summary beginning on page 9.
| Performance data represent |
| past performance, which does |
| not guarantee future results. |
| Investment return and principal |
| value will fluctuate, and you may |
| have a gain or loss when you sell |
| your shares. Current performance |
| may differ from figures shown. |
| Please visit franklintempleton.com |
| or call (800) 342-5236 for most |
| recent month-end performance. |
Economic and Market Overview
The U.S. economy continued to show signs of recovery during the 12-month period ended April 30, 2014, and especially in the second half of 2013, underpinned by consumer and business spending and rising inventories. Despite abnormally cold weather that suppressed economic activity in the first quarter of 2014, economic indicators were still broadly supportive of recovery at period-end. Manufacturing activity expanded during the period under review, although adverse weather led to a slowdown in early 2014. Retail sales for
The dollar value, number of shares or principal amount, and names of all portfolio holdings are listed in the Fund’s Statement of Investments (SOI). The SOI begins on page 22.
Annual Report | 3
the period followed no clear trend, but they experienced a sharp rebound in March 2014, aided by improved weather. The housing market had some weather-related weakness early in 2014 as sales abated, but home prices were higher than a year ago. The unemployment rate declined to 6.3% in April 2014 from 7.5% in April 2013.4 Inflation remained below the U.S. Federal Reserve Board’s (Fed’s) 2.0% target.
In October 2013, the federal government temporarily shut down after Congress reached a budget impasse. However, Congress passed a spending bill in January to fund the federal government though September 2014. Congress then approved suspension of the debt ceiling until March 2015.
In May 2013, the Fed indicated it might reduce its monthly asset purchases based on improved economic data, triggering a bond market sell-off that raised long-term U.S. Treasury yields to a two-year high. Long-term Treasury yields rose again late in 2013 as the Fed announced it would reduce its bond purchases $10 billion a month beginning in January 2014 while keeping interest rates low. However, yields declined through period-end as investors shifted from emerging market assets to less risky assets because of concerns over emerging market growth prospects and the potential impact of the Fed’s reductions to its asset-purchase program. Although economic data in early 2014 were soft in part because of severe winter weather, Fed Chair Janet Yellen kept the pace of asset-purchase tapering intact in the March meeting, while adopting a more qualitative approach to rate-hike guidance. However, the Fed remained committed to keeping interest rates low for a considerable time even after the asset-purchase program ends, depending on inflation and employment trends.
The 10-year Treasury yield rose from 1.70% at the beginning of the period to a high of 3.04% on December 31, 2013, mainly because of an improved economic environment and market certainty about the Fed’s plans. However, some weakening economic data and increasing political tension in Ukraine contributed to the 10-year Treasury yield’s decline to 2.67% at period-end.
The global economic recovery was mixed during the period under review. The recovery in emerging markets moderated after many economies had previously returned to and exceeded pre-crisis activity levels. Although some developed economies, such as those of Australia and some Scandinavian countries, also have enjoyed relatively strong recoveries in the aftermath of the global financial crisis, the G-3 (U.S., eurozone and Japan) continued to experience growth that was slow by the standards of previous recoveries. Policymakers in the largest developed economies continued to increase their already unprecedented efforts to supply liquidity. Actions elsewhere in the world were mixed, with some policymakers less willing to reverse previous tightening efforts in response to the external environment.
4 | Annual Report
| Dividend Distributions* | |||||
| 5/1/13–4/30/14 | |||||
| Dividend per Share (cents) | |||||
| Month | Class A | Class C | Class R | Class R6 | Advisor Class |
| May | 3.70 | 3.34 | 3.46 | 4.04 | 3.93 |
| June | 3.65 | 3.30 | 3.43 | 3.97 | 3.87 |
| July | 3.85 | 3.49 | 3.61 | 4.17 | 4.07 |
| August | 3.80 | 3.44 | 3.58 | 4.14 | 4.02 |
| September | 3.90 | 3.56 | 3.69 | 4.22 | 4.11 |
| October | 3.93 | 3.57 | 3.71 | 4.26 | 4.16 |
| November | 4.19 | 3.84 | 3.97 | 4.53 | 4.41 |
| December | 3.80 | 3.44 | 3.58 | 4.15 | 4.02 |
| January | 3.61 | 3.25 | 3.39 | 3.95 | 3.83 |
| February | 3.86 | 3.54 | 3.66 | 4.17 | 4.06 |
| March | 3.78 | 3.42 | 3.56 | 4.13 | 4.00 |
| April | 3.00 | 2.65 | 2.78 | 3.34 | 3.22 |
| Total | 45.07 | 40.84 | 42.42 | 49.07 | 47.70 |
*All Fund distributions will vary depending upon current market conditions, and past distributions are not indicative of future trends.
Investment Strategy
The Fund uses an active asset allocation strategy, investing across the fixed income markets in sectors that may include high yield and investment-grade corporate bonds, international developed and emerging market bonds, U.S. government and agency securities, mortgage- and other asset-backed securities, corporate bank loans, convertible securities and preferred stocks, and municipal securities. In addition to our bottom-up fundamental analysis of market sectors, industries and issuers, we evaluate country risk, business cycles, yield curves, and values between and within markets as part of our portfolio construction process. We may also enter into various transactions involving certain currency-, interest rate- or credit-related derivative instruments for hedging purposes, to enhance returns or to obtain exposure to various market sectors.
Manager’s Discussion
During the 12-month period, the global economic outlook as well as U.S. and foreign central banks’ policies influenced the direction of fixed income markets. During the second quarter of 2013, comments from then-Fed chairman Ben Bernanke regarding the potential tapering of the Fed’s quantitative easing program moved longer term rates higher, with the 10-year benchmark Treasury yield climbing from 1.70% at the end of April 2013 to a peak of 3.04% by the end of 2013. Although concerns regarding the U.S. budget and debt ceiling arose during the second half of the year, those issues appeared to
Annual Report | 5
be largely contained by early 2014. Longer maturity U.S. interest rates declined from their peaks by period-end as a result of a weather-induced, weak first-quarter economic growth rate and a focus on tensions surrounding Russia and Ukraine. However, even with higher interest rates, the stock market rose over the course of the Fund’s fiscal year, with the Standard & Poor’s® 500 Index gaining 20.44%, supported by corporate earnings and an improving outlook for U.S. and European economic growth.1, 5
The Fund posted a positive total return for the review period, outperforming the Barclays U.S. Aggregate Index and the Lipper Multi-Sector Income Funds peer average. The Fund’s larger exposure to non-investment grade corporate credit sectors positively impacted performance compared to the longer duration and more rate-sensitive Barclays index. Compared to the Lipper peer average, the Fund’s lower interest rate sensitivity was also beneficial for relative performance.
Fundamentals in the corporate credit sector remained broadly supportive, with a below-average default rate and percentage of bonds considered in distress, ample access to low-cost debt refinancing, rising equity markets and generally increasing corporate earnings. However, as is often typical several years into an economic recovery, many corporations began to focus on more shareholder-friendly actions, including stock buybacks, dividends, and mergers and acquisitions. In addition, the quality, structure and covenant protection of certain new corporate bond and leveraged loan issues also declined. Although spread valuations for the corporate credit markets have narrowed since the financial crisis, given what we viewed as a favorable fundamental backdrop, we still found value in the corporate credit sectors. In addition, high yield corporate and leveraged loan bonds have tended to be less sensitive to rate changes than traditional fixed income sectors, which may allow those sectors to offer more defensive benefits if U.S. interest rates increase. Following the short-term sell-off in high yield corporate bonds in the second quarter of 2013, we increased exposure to high yield corporate bonds and, conversely, reduced loan exposure considering loans’ recent outperformance. However, as high yield bonds rebounded strongly going into 2014, we began to pare high yield bonds in favor of leveraged loans. The Fund held a lesser weighting in investment-grade corporate bonds at period-end, given their valuations and greater sensitivity to interest rates.
The international fixed income markets, particularly developing markets, were negatively affected by lower expectations for emerging market growth as well as improved U.S. growth forecasts. As a result, the U.S. dollar strengthened relative to certain foreign currencies, which pressured performance for certain non-U.S. dollar sovereign bond holdings. Exposure to the Uruguayan peso, Malaysian ringgit, Chilean peso and Brazilian real constrained returns. In contrast, the Fund’s holdings in South Korean won-denominated bonds benefited
6 | Annual Report
| Portfolio Breakdown | ||||
| Based on Total Net Assets | ||||
| 4/30/14 | 4/30/13 | |||
| High Yield Corporate Bonds & Preferred Securities | 28.3 | % | 26.7 | % |
| International Government & Agency Bonds (Non-$US) | 20.0 | % | 23.4 | % |
| Floating Rate Loans | 14.5 | % | 17.0 | % |
| Investment-Grade Corporate Bonds | 8.2 | % | 8.3 | % |
| Municipal Bonds | 5.8 | % | 1.8 | % |
| Mortgage-Backed Securities | 4.5 | % | 6.1 | % |
| Commercial Mortgage-Backed Securities | 3.5 | % | 2.8 | % |
| International Government & Agency Bonds ($US) | 2.4 | % | 1.6 | % |
| U.S. Treasury Securities | 1.7 | % | 2.0 | % |
| Asset-Backed Securities | 1.5 | % | 0.8 | % |
| Equities | 1.2 | % | 0.4 | % |
| Convertible Securities | 0.1 | % | — | |
| Short-Term Investments & Other Net Assets* | 8.3 | % | 9.1 | % |
*Includes unrealized gains/losses on currency forward contracts and credit derivatives. Does not include short-term
foreign government securities.
| What is a currency forward |
| contract? |
| A currency forward contract is an |
| agreement between the Fund and a |
| counterparty to buy or sell a foreign |
| currency for a specific exchange rate |
| on a future date. |
returns, as the won appreciated compared to the U.S. dollar. The Fund’s short position in the Japanese yen, using currency forwards, was additive to performance, given weakness in the yen relative to the dollar over the past year. Overall, the Fund reduced its exposure to non-U.S. dollar government bonds during the period. In the U.S.-dollar denominated emerging market sector, the rise in interest rates during 2013 combined with outflows from dedicated emerging market bond funds negatively impacted sector performance, although the sector began to recover in 2014 as interest rates declined. The Fund maintained modest exposure to hard currency-denominated emerging market bonds, although we added some exposure to the sector given its underperformance.
Amid higher U.S. intermediate-term and longer term interest rates, the more rate-sensitive fixed income sectors, including Treasuries, agencies and mortgage-backed securities, generally delivered flat to slightly negative total returns. The Fund maintained lower exposure to these sectors, favoring instead higher income opportunities in corporate and global bond markets. However, with subdued inflation expectations and the already meaningful rise in rates during the period, inflation-adjusted yields became positive for longer term high-quality fixed income securities.
The rise in U.S. interest rates and negative headlines regarding Detroit and Puerto Rico contributed to investor outflows from dedicated municipal bond funds in 2013, pressuring bond prices. The Fund added to its municipal bond exposure during the period as valuations cheapened, although the sector began to recover during early 2014 as rates declined and investor pessimism toward the municipal market waned.
Annual Report | 7
Thank you for your continued participation in Franklin Strategic Income Fund. We look forward to serving your future investment needs.

CFA® is a trademark owned by CFA Institute.
The foregoing information reflects our analysis, opinions and portfolio holdings as of April 30, 2014, the end of the
reporting period. The way we implement our main investment strategies and the resulting portfolio holdings may
change depending on factors such as market and economic conditions. These opinions may not be relied upon as
investment advice or an offer for a particular security. The information is not a complete analysis of every aspect
of any market, country, industry, security or the Fund. Statements of fact are from sources considered reliable,
but the investment manager makes no representation or warranty as to their completeness or accuracy. Although
historical performance is no guarantee of future results, these insights may help you understand our investment
management philosophy.
The index is unmanaged and includes reinvestment of any income or distributions. One cannot invest directly in an
index, and an index is not representative of the Fund’s portfolio.
1. Source: © 2014 Morningstar. All Rights Reserved. The information contained herein: (1) is proprietary to Morningstar
and/or its content providers; (2) may not be copied or distributed; and (3) is not warranted to be accurate, complete or
timely. Neither Morningstar nor its content providers are responsible for any damages or losses arising from any use of
this information.
2. Source: Barclays Global Family of Indices. © 2014 Barclays Capital Inc. Used with permission.
3. Source: Lipper, a Thomson Reuters Company. For the 12-month period ended 4/30/14, this category consisted of 229
funds. Lipper calculations do not include sales charges or expense subsidization by a fund’s manager. Fund performance
relative to the average may have differed if these or other factors had been considered.
4. Source: Bureau of Labor Statistics.
5. Standard & Poor’s (S&P®) 500 Index: Copyright © 2014, S&P Dow Jones Indices LLC. All rights reserved. Reproduction
of S&P U.S. Index data in any form is prohibited except with the prior written permission of S&P. S&P does not guarantee
the accuracy, adequacy, completeness or availability of any information and is not responsible for any errors or omissions,
regardless of the cause or for the results obtained from the use of such information. S&P DISCLAIMS ANY AND ALL
EXPRESS OR IMPLIED WARRANTIES, INCLUDING, BUT NOT LIMITED TO, ANY WARRANTIES OF MERCHANTABILITY OR
FITNESS FOR A PARTICULAR PURPOSE OR USE. In no event shall S&P be liable for any direct, indirect, special or con-
sequential damages, costs, expenses, legal fees, or losses (including lost income or lost profit and opportunity costs)
in connection with subscriber’s or others’ use of S&P U.S. Index data.
8 | Annual Report
Performance Summary as of 4/30/14
Your dividend income will vary depending on dividends or interest paid by securities in the Fund’s portfolio, adjusted for operating expenses of each class. Capital gain distributions are net profits realized from the sale of portfolio securities. The performance table and graphs do not reflect any taxes that a shareholder would pay on Fund dividends, capital gain distributions, if any, or any realized gains on the sale of Fund shares. Total return reflects reinvestment of the Fund’s dividends and capital gain distributions, if any, and any unrealized gains or losses.
| Net Asset Value | |||||||||
| Share Class | 4/30/14 | 4/30/13 | Change | ||||||
| A (FRSTX) | $ | 10.57 | $ | 10.86 | -$ | 0.29 | |||
| C (FSGCX) | $ | 10.57 | $ | 10.85 | -$ | 0.28 | |||
| R (FKSRX) | $ | 10.54 | $ | 10.82 | -$ | 0.28 | |||
| Advisor (FKSAX) | $ | 10.58 | $ | 10.86 | -$ | 0.28 | |||
| 5/1/13 | |||||||||
| R6 | $ | 10.58 | $ | 10.87 | -$ | 0.29 | |||
| Distributions | |||||||||
| Dividend | Short-Term | Long-Term | |||||||
| Share Class | Income | Capital Gain | Capital Gain | Total | |||||
| A | (5/1/13–4/30/14) | $ | 0.4507 | $ | 0.0088 | $ | 0.0873 | $ | 0.5468 |
| C | (5/1/13–4/30/14) | $ | 0.4084 | $ | 0.0088 | $ | 0.0873 | $ | 0.5045 |
| R | (5/1/13–4/30/14) | $ | 0.4242 | $ | 0.0088 | $ | 0.0873 | $ | 0.5203 |
| R6 | (5/1/13–4/30/14) | $ | 0.4907 | $ | 0.0088 | $ | 0.0873 | $ | 0.5868 |
| Advisor | (5/1/13–4/30/14) | $ | 0.4770 | $ | 0.0088 | $ | 0.0873 | $ | 0.5731 |
Annual Report | 9
Performance Summary (continued)
Performance as of 4/30/141
Cumulative total return excludes sales charges. Average annual total returns include maximum sales charges. Class A: 4.25% maximum initial sales charge; Class C: 1% contingent deferred sales charge in first year only; Class R/R6/Advisor Class: no sales charges.
| Cumulative | Average Annual | Average Annual | Total Annual Operating Expenses5 | ||||||||||
| Share Class | Total Return2 | Total Return3 | Total Return (3/31/14)4 | (with waiver) | (without waiver) | ||||||||
| A | 0.88 | % | 0.89 | % | |||||||||
| 1-Year | + | 2.52 | % | -1.82 | % | -0.91 | % | ||||||
| 5-Year | + | 57.54 | % | + | 8.57 | % | + | 9.51 | % | ||||
| 10-Year | + | 92.78 | % | + | 6.32 | % | + | 6.02 | % | ||||
| C | 1.28 | % | 1.29 | % | |||||||||
| 1-Year | + | 2.20 | % | + | 1.23 | % | + | 2.12 | % | ||||
| 5-Year | + | 54.43 | % | + | 9.08 | % | + | 10.04 | % | ||||
| 10-Year | + | 85.27 | % | + | 6.36 | % | + | 6.05 | % | ||||
| R | 1.13 | % | 1.14 | % | |||||||||
| 1-Year | + | 2.36 | % | + | 2.36 | % | + | 3.37 | % | ||||
| 5-Year | + | 55.61 | % | + | 9.25 | % | + | 10.21 | % | ||||
| 10-Year | + | 88.17 | % | + | 6.53 | % | + | 6.22 | % | ||||
| R6 | 0.50 | % | 0.51 | % | |||||||||
| Since Inception (5/1/13)6 | + | 2.90 | % | + | 2.90 | % | + | 2.39 | % | ||||
| Advisor Class | 0.63 | % | 0.64 | % | |||||||||
| 1-Year | + | 2.87 | % | + | 2.87 | % | + | 3.77 | % | ||||
| 5-Year | + | 59.47 | % | + | 9.78 | % | + | 10.75 | % | ||||
| 10-Year | + | 97.74 | % | + | 7.06 | % | + | 6.75 | % | ||||
| Distribution | 30-Day Standardized Yield8 | ||||||||||||
| Share Class | Rate7 | (with waiver) | (without waiver) | ||||||||||
| A | 4.08 | % | 3.10 | % | 3.09 | % | |||||||
| C | 3.86 | % | 2.83 | % | 2.83 | % | |||||||
| R | 4.02 | % | 2.99 | % | 2.98 | % | |||||||
| R6 | 4.64 | % | 3.62 | % | 3.62 | % | |||||||
| Advisor | 4.51 | % | 3.49 | % | 3.48 | % | |||||||
Performance data represent past performance, which does not guarantee future results. Investment return and principal value will fluctuate, and you may have a gain or loss when you sell your shares. Current performance may differ from figures shown. For most recent month-end performance, go to franklintempleton.com or call (800) 342-5236.
10 | Annual Report
Performance Summary (continued)
Total Return Index Comparison for a Hypothetical $10,000 Investment1
Total return represents the change in value of an investment over the periods shown. It includes any applicable, maximum sales charge, Fund expenses, account fees and reinvested distributions. The unmanaged indexes include reinvestment of any income or distributions. They differ from the Fund in composition and do not pay management fees or expenses. One cannot invest directly in an index.
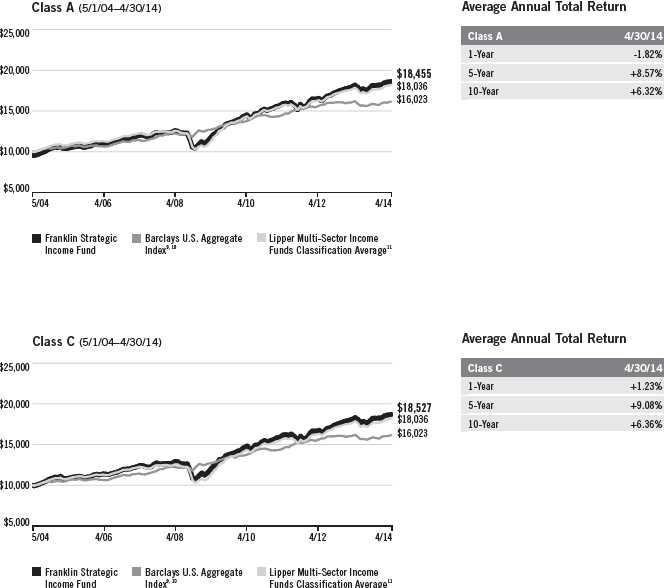
Annual Report | 11
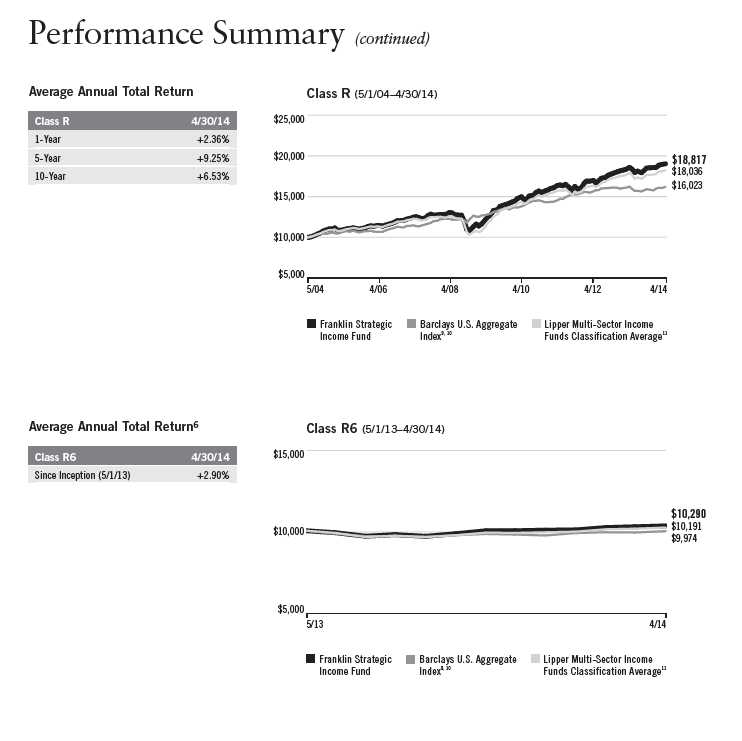
12 | Annual Report
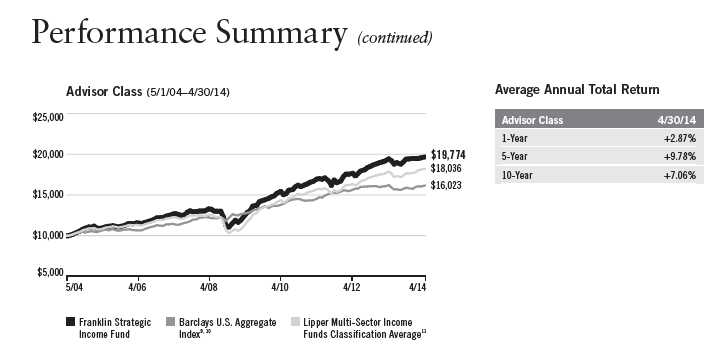
All investments involve risks, including possible loss of principal. Bond prices generally move in the opposite direction of interest rates. Thus,
as prices of bonds in the Fund adjust to a rise in interest rates, the Fund’s share price may decline. Changes in the financial strength of a bond
issuer or in a bond’s credit rating may affect its value. High yields reflect the higher credit risks associated with certain lower-rated securities
held in the portfolio. Floating rate loans and high yield corporate bonds are rated below investment grade and are subject to greater risk of
default, which could result in loss of principal — a risk that may be heightened in a slowing economy. The risks of foreign securities include
currency fluctuations and political uncertainty. Investments in developing markets involve heightened risks related to the same factors, in
addition to those associated with their relatively small size and lesser liquidity. Investing in derivative securities and the use of foreign cur-
rency techniques involve special risks as such may not achieve the anticipated benefits and/or may result in losses to the Fund. The Fund is
actively managed but there is no guarantee that the manager’s investment decisions will produce the desired results. The Fund’s prospectus
also includes a description of the main investment risks.
Class C: These shares have higher annual fees and expenses than Class A shares.
Class R: Shares are available to certain eligible investors as described in the prospectus. These shares have higher annual fees and
expenses than Class A shares.
Class R6: Shares are available to certain eligible investors as described in the prospectus.
Advisor Class: Shares are available to certain eligible investors as described in the prospectus.
Annual Report | 13
Performance Summary (continued)
1. The Fund has a fee waiver associated with its investments in a Franklin Templeton money fund, contractually guaranteed through at least its cur-
rent fiscal year-end. Fund investment results reflect the fee waiver, to the extent applicable; without this reduction, the results would have been lower.
2. Cumulative total return represents the change in value of an investment over the periods indicated.
3. Average annual total return represents the average annual change in value of an investment over the periods indicated.
4. In accordance with SEC rules, we provide standardized average annual total return information through the latest calendar quarter.
5. Figures are as stated in the Fund’s current prospectus. In periods of market volatility, assets may decline significantly, causing total annual Fund
operating expenses to become higher than the figures shown.
6. Performance shown is not annualized.
7. Distribution rate is based on the sum of the respective class’s dividend distributions over the past 12 months’ and the maximum offering price
(NAV for Classes C, R, R6 and Advisor) per share on 4/30/14.
8. The 30-day standardized yield for the 30 days ended 4/30/14 reflects an estimated yield to maturity (assuming all portfolio securities are held to
maturity). It should be regarded as an estimate of the Fund’s rate of investment income, and it may not equal the Fund’s actual income distribution
rate (which reflects the Fund’s past dividends paid to shareholders) or the income reported in the Fund’s financial statements.
9. Source: © 2014 Morningstar. The Barclays U.S. Aggregate Index is a market capitalization-weighted index representing the U.S. investment-grade,
fixed-rate, taxable bond market with index components for government and corporate, mortgage pass-through and asset-backed securities. All issues
included are SEC-registered, taxable, dollar denominated, and nonconvertible, must have at least one year to final maturity, and must be rated invest-
ment grade (Baa3/BBB-/BBB- or above) using the middle rating of Moody’s, Standard & Poor’s and Fitch, respectively.
10. Source: Barclays Global Family of Indices. © 2014 Barclays Capital Inc. Used with permission.
11. Source: Lipper, a Thomson Reuters Company. The Lipper Multi-Sector Income Funds Classification Average is calculated by averaging the total
returns of all funds within the Lipper Multi-Sector Income Funds classification in the Lipper Open-End underlying funds universe. Lipper Multi-Sector
Income Funds are defined as funds that seek current income by allocating assets among different fixed income securities sectors (not primarily in
one sector except for defensive purposes), including U.S. and foreign governments, with a significant portion rated below investment grade. For the
12-month period ended 4/30/14, there were 229 funds in this category. Lipper calculations do not include sales charges, but include reinvestment of
any income or distributions. Fund performance relative to the average may have differed if these and other factors had been considered.
14 | Annual Report
Your Fund’s Expenses
As a Fund shareholder, you can incur two types of costs:
- Transaction costs, including sales charges (loads) on Fund purchases; and
- Ongoing Fund costs, including management fees, distribution and service (12b-1) fees, and other Fund expenses. All mutual funds have ongoing costs, sometimes referred to as operating expenses.
The following table shows ongoing costs of investing in the Fund and can help you understand these costs and compare them with those of other mutual funds. The table assumes a $1,000 investment held for the six months indicated.
Actual Fund Expenses
The first line (Actual) for each share class listed in the table provides actual account values and expenses. The “Ending Account Value” is derived from the Fund’s actual return, which includes the effect of Fund expenses.
You can estimate the expenses you paid during the period by following these steps. Of course, your account value and expenses will differ from those in this illustration:
| 1. | Divide your account value by $1,000. |
| If an account had an $8,600 value, then $8,600 ÷ $1,000 = 8.6. | |
| 2. | Multiply the result by the number under the heading “Expenses Paid During Period.” |
| If Expenses Paid During Period were $7.50, then 8.6 x $7.50 = $64.50. |
In this illustration, the estimated expenses paid this period are $64.50.
Hypothetical Example for Comparison with Other Funds
Information in the second line (Hypothetical) for each class in the table can help you compare ongoing costs of investing in the Fund with those of other mutual funds. This information may not be used to estimate the actual ending account balance or expenses you paid during the period. The hypothetical “Ending Account Value” is based on the actual expense ratio for each class and an assumed 5% annual rate of return before expenses, which does not represent the Fund’s actual return. The figure under the heading “Expenses Paid During Period” shows the hypothetical expenses your account would have incurred under this scenario. You can compare this figure with the 5% hypothetical examples that appear in shareholder reports of other funds.
Annual Report | 15
Your Fund’s Expenses (continued)
Please note that expenses shown in the table are meant to highlight ongoing costs and do not reflect any transaction costs, such as sales charges. Therefore, the second line for each class is useful in comparing ongoing costs only, and will not help you compare total costs of owning different funds. In addition, if transaction costs were included, your total costs would have been higher. Please refer to the Fund prospectus for additional information on operating expenses.
| Beginning Account | Ending Account | Expenses Paid During | ||||
| Share Class | Value 11/1/13 | Value 4/30/14 | Period* 11/1/13–4/30/14 | |||
| A | ||||||
| Actual | $ | 1,000 | $ | 1,027.80 | $ | 4.32 |
| Hypothetical (5% return before expenses) | $ | 1,000 | $ | 1,020.53 | $ | 4.31 |
| C | ||||||
| Actual | $ | 1,000 | $ | 1,025.70 | $ | 6.33 |
| Hypothetical (5% return before expenses) | $ | 1,000 | $ | 1,018.55 | $ | 6.31 |
| R | ||||||
| Actual | $ | 1,000 | $ | 1,026.60 | $ | 5.58 |
| Hypothetical (5% return before expenses) | $ | 1,000 | $ | 1,019.29 | $ | 5.56 |
| R6 | ||||||
| Actual | $ | 1,000 | $ | 1,029.70 | $ | 2.42 |
| Hypothetical (5% return before expenses) | $ | 1,000 | $ | 1,022.41 | $ | 2.41 |
| Advisor | ||||||
| Actual | $ | 1,000 | $ | 1,029.00 | $ | 3.07 |
| Hypothetical (5% return before expenses) | $ | 1,000 | $ | 1,021.77 | $ | 3.06 |
*Expenses are calculated using the most recent six-month expense ratio, net of expense waivers, annualized for each class (A: 0.86%; C: 1.26%; R: 1.11%; R6: 0.48%; and Advisor: 0.61%), multiplied by the average account value over the period, multiplied by 181/365 to reflect the one-half year period.
16 | Annual Report
| Franklin Strategic Series | |||||||||||||||
| Financial Highlights | |||||||||||||||
| Franklin Strategic Income Fund | |||||||||||||||
| Year Ended April 30, | |||||||||||||||
| Class A | 2014 | 2013 | 2012 | 2011 | 2010 | ||||||||||
| Per share operating performance | |||||||||||||||
| (for a share outstanding throughout the year) | |||||||||||||||
| Net asset value, beginning of year | $ | 10.86 | $ | 10.48 | $ | 10.68 | $ | 10.30 | $ | 8.83 | |||||
| Income from investment operationsa: | |||||||||||||||
| Net investment incomeb | 0.44 | 0.45 | 0.50 | 0.55 | 0.55 | ||||||||||
| Net realized and unrealized gains (losses) | (0.18 | ) | 0.54 | (0.10 | ) | 0.39 | 1.45 | ||||||||
| Total from investment operations | 0.26 | 0.99 | 0.40 | 0.94 | 2.00 | ||||||||||
| Less distributions from: | |||||||||||||||
| Net investment income and net foreign currency gains | (0.45 | ) | (0.57 | ) | (0.60 | ) | (0.56 | ) | (0.53 | ) | |||||
| Net realized gains | (0.10 | ) | (0.04 | ) | — | — | — | ||||||||
| Total distributions | (0.55 | ) | (0.61 | ) | (0.60 | ) | (0.56 | ) | (0.53 | ) | |||||
| Net asset value, end of year | $ | 10.57 | $ | 10.86 | $ | 10.48 | $ | 10.68 | $ | 10.30 | |||||
| Total returnc | 2.52 | % | 9.70 | % | 3.97 | % | 9.41 | % | 23.15 | % | |||||
| Ratios to average net assets | |||||||||||||||
| Expensesd | 0.86 | %e | 0.87 | % | 0.89 | % | 0.88 | % | 0.88 | % | |||||
| Net investment income | 4.16 | % | 4.21 | % | 4.81 | % | 5.26 | % | 5.70 | % | |||||
| Supplemental data | |||||||||||||||
| Net assets, end of year (000’s) | $ | 5,182,490 | $ | 4,966,834 | $ | 3,757,100 | $ | 3,288,814 | $ | 2,809,864 | |||||
| Portfolio turnover rate | 54.11 | % | 47.27 | % | 36.11 | % | 66.78 | % | 55.79 | % | |||||
| Portfolio turnover rate excluding mortgage dollar rollsf | 54.11 | % | 44.33 | % | 36.11 | % | 66.78 | % | 55.79 | % | |||||
aThe amount shown for a share outstanding throughout the period may not correlate with the Statement of Operations for the period due to the timing of sales and repurchases of
the Fund shares in relation to income earned and/or fluctuating fair value of the investments of the Fund.
bBased on average daily shares outstanding.
cTotal return does not reflect sales commissions or contingent deferred sales charges, if applicable.
dBenefit of expense reduction rounds to less than 0.01%.
eBenefit of waiver and payments by affiliate rounds to less than 0.01%.
fSee Note 1(g) regarding mortgage dollar rolls.
Annual Report | The accompanying notes are an integral part of these financial statements. | 17
| Franklin Strategic Series | |||||||||||||||
| Financial Highlights (continued) | |||||||||||||||
| Franklin Strategic Income Fund | |||||||||||||||
| Year Ended April 30, | |||||||||||||||
| Class C | 2014 | 2013 | 2012 | 2011 | 2010 | ||||||||||
| Per share operating performance | |||||||||||||||
| (for a share outstanding throughout the year) | |||||||||||||||
| Net asset value, beginning of year | $ | 10.85 | $ | 10.48 | $ | 10.68 | $ | 10.30 | $ | 8.83 | |||||
| Income from investment operationsa: | |||||||||||||||
| Net investment incomeb | 0.40 | 0.41 | 0.46 | 0.50 | 0.52 | ||||||||||
| Net realized and unrealized gains (losses) | (0.17 | ) | 0.53 | (0.10 | ) | 0.40 | 1.44 | ||||||||
| Total from investment operations | 0.23 | 0.94 | 0.36 | 0.90 | 1.96 | ||||||||||
| Less distributions from: | |||||||||||||||
| Net investment income and net foreign currency gains | (0.41 | ) | (0.53 | ) | (0.56 | ) | (0.52 | ) | (0.49 | ) | |||||
| Net realized gains | (0.10 | ) | (0.04 | ) | — | — | — | ||||||||
| Total distributions | (0.51 | ) | (0.57 | ) | (0.56 | ) | (0.52 | ) | (0.49 | ) | |||||
| Net asset value, end of year | $ | 10.57 | $ | 10.85 | $ | 10.48 | $ | 10.68 | $ | 10.30 | |||||
| Total returnc | 2.20 | % | 9.17 | % | 3.56 | % | 8.98 | % | 22.64 | % | |||||
| Ratios to average net assets | |||||||||||||||
| Expensesd | 1.26 | %e | 1.27 | % | 1.29 | % | 1.28 | % | 1.28 | % | |||||
| Net investment income | 3.76 | % | 3.81 | % | 4.41 | % | 4.86 | % | 5.30 | % | |||||
| Supplemental data | |||||||||||||||
| Net assets, end of year (000’s) | $ | 2,109,049 | $ | 2,108,962 | $ | 1,569,746 | $ | 1,358,857 | $ | 1,107,436 | |||||
| Portfolio turnover rate | 54.11 | % | 47.27 | % | 36.11 | % | 66.78 | % | 55.79 | % | |||||
| Portfolio turnover rate excluding mortgage dollar rollsf | 54.11 | % | 44.33 | % | 36.11 | % | 66.78 | % | 55.79 | % | |||||
aThe amount shown for a share outstanding throughout the period may not correlate with the Statement of Operations for the period due to the timing of sales and repurchases of
the Fund shares in relation to income earned and/or fluctuating fair value of the investments of the Fund.
bBased on average daily shares outstanding.
cTotal return does not reflect sales commissions or contingent deferred sales charges, if applicable.
dBenefit of expense reduction rounds to less than 0.01%.
eBenefit of waiver and payments by affiliate rounds to less than 0.01%.
fSee Note 1(g) regarding mortgage dollar rolls.
18 | The accompanying notes are an integral part of these financial statements. | Annual Report
| Franklin Strategic Series | |||||||||||||||
| Financial Highlights (continued) | |||||||||||||||
| Franklin Strategic Income Fund | |||||||||||||||
| Year Ended April 30, | |||||||||||||||
| Class R | 2014 | 2013 | 2012 | 2011 | 2010 | ||||||||||
| Per share operating performance | |||||||||||||||
| (for a share outstanding throughout the year) | |||||||||||||||
| Net asset value, beginning of year | $ | 10.82 | $ | 10.45 | $ | 10.65 | $ | 10.27 | $ | 8.81 | |||||
| Income from investment operationsa: | |||||||||||||||
| Net investment incomeb | 0.41 | 0.42 | 0.47 | 0.52 | 0.53 | ||||||||||
| Net realized and unrealized gains (losses) | (0.17 | ) | 0.53 | (0.10 | ) | 0.39 | 1.43 | ||||||||
| Total from investment operations | 0.24 | 0.95 | 0.37 | 0.91 | 1.96 | ||||||||||
| Less distributions from: | |||||||||||||||
| Net investment income and net foreign currency gains | (0.42 | ) | (0.54 | ) | (0.57 | ) | (0.53 | ) | (0.50 | ) | |||||
| Net realized gains | (0.10 | ) | (0.04 | ) | — | — | — | ||||||||
| Total distributions | (0.52 | ) | (0.58 | ) | (0.57 | ) | (0.53 | ) | (0.50 | ) | |||||
| Net asset value, end of year | $ | 10.54 | $ | 10.82 | $ | 10.45 | $ | 10.65 | $ | 10.27 | |||||
| Total return | 2.36 | % | 9.36 | % | 3.72 | % | 9.17 | % | 22.77 | % | |||||
| Ratios to average net assets | |||||||||||||||
| Expensesc | 1.11 | %d | 1.12 | % | 1.14 | % | 1.13 | % | 1.13 | % | |||||
| Net investment income | 3.91 | % | 3.96 | % | 4.56 | % | 5.01 | % | 5.45 | % | |||||
| Supplemental data | |||||||||||||||
| Net assets, end of year (000’s) | $ | 227,359 | $ | 260,647 | $ | 249,662 | $ | 234,775 | $ | 194,901 | |||||
| Portfolio turnover rate | 54.11 | % | 47.27 | % | 36.11 | % | 66.78 | % | 55.79 | % | |||||
| Portfolio turnover rate excluding mortgage dollar rollse | 54.11 | % | 44.33 | % | 36.11 | % | 66.78 | % | 55.79 | % | |||||
aThe amount shown for a share outstanding throughout the period may not correlate with the Statement of Operations for the period due to the timing of sales and repurchases of
the Fund shares in relation to income earned and/or fluctuating fair value of the investments of the Fund.
bBased on average daily shares outstanding.
cBenefit of expense reduction rounds to less than 0.01%.
dBenefit of waiver and payments by affiliate rounds to less than 0.01%.
eSee Note 1(g) regarding mortgage dollar rolls.
Annual Report | The accompanying notes are an integral part of these financial statements. | 19
| Franklin Strategic Series | |||
| Financial Highlights (continued) | |||
| Franklin Strategic Income Fund | |||
| Year Ended | |||
| April 30, | |||
| Class R6 | 2014 | a | |
| Per share operating performance | |||
| (for a share outstanding throughout the year) | |||
| Net asset value, beginning of year | $ | 10.87 | |
| Income from investment operationsb: | |||
| Net investment incomec | 0.49 | ||
| Net realized and unrealized gains (losses) | (0.19 | ) | |
| Total from investment operations | 0.30 | ||
| Less distributions from: | |||
| Net investment income | (0.49 | ) | |
| Net realized gains | (0.10 | ) | |
| Total distributions | (0.59 | ) | |
| Net asset value, end of year | $ | 10.58 | |
| Total return | 2.90 | % | |
| Ratios to average net assets | |||
| Expensesd | 0.48 | % | |
| Net investment income | 4.54 | % | |
| Supplemental data | |||
| Net assets, end of year (000’s) | $ | 247,007 | |
| Portfolio turnover rate | 54.11 | % | |
aFor the year May 1, 2013 (effective date) to April 30, 2014.
bThe amount shown for a share outstanding throughout the period may not correlate with the Statement of Operations for the period due to the timing of sales and repurchases of
the Fund shares in relation to income earned and/or fluctuating market value of the investments of the Fund.
cBased on average daily shares outstanding.
dBenefit of waiver and payments by affiliate and expense reduction rounds to less than 0.01%.
20 | The accompanying notes are an integral part of these financial statements. | Annual Report
| Franklin Strategic Series | |||||||||||||||
| Financial Highlights (continued) | |||||||||||||||
| Franklin Strategic Income Fund | |||||||||||||||
| Year Ended April 30, | |||||||||||||||
| Advisor Class | 2014 | 2013 | 2012 | 2011 | 2010 | ||||||||||
| Per share operating performance | |||||||||||||||
| (for a share outstanding throughout the year) | |||||||||||||||
| Net asset value, beginning of year | $ | 10.86 | $ | 10.49 | $ | 10.69 | $ | 10.31 | $ | 8.84 | |||||
| Income from investment operationsa: | |||||||||||||||
| Net investment incomeb | 0.47 | 0.48 | 0.53 | 0.57 | 0.58 | ||||||||||
| Net realized and unrealized gains (losses) | (0.17 | ) | 0.53 | (0.10 | ) | 0.39 | 1.44 | ||||||||
| Total from investment operations | 0.30 | 1.01 | 0.43 | 0.96 | 2.02 | ||||||||||
| Less distributions from: | |||||||||||||||
| Net investment income and net foreign currency gains | (0.48 | ) | (0.60 | ) | (0.63 | ) | (0.58 | ) | (0.55 | ) | |||||
| Net realized gains | (0.10 | ) | (0.04 | ) | — | — | — | ||||||||
| Total distributions | (0.58 | ) | (0.64 | ) | (0.63 | ) | (0.58 | ) | (0.55 | ) | |||||
| Net asset value, end of year | $ | 10.58 | $ | 10.86 | $ | 10.49 | $ | 10.69 | $ | 10.31 | |||||
| Total return | 2.87 | % | 9.87 | % | 4.22 | % | 9.67 | % | 23.45 | % | |||||
| Ratios to average net assets | |||||||||||||||
| Expensesc | 0.61 | %d | 0.62 | % | 0.64 | % | 0.63 | % | 0.63 | % | |||||
| Net investment income | 4.41 | % | 4.46 | % | 5.06 | % | 5.51 | % | 5.95 | % | |||||
| Supplemental data | |||||||||||||||
| Net assets, end of year (000’s) | $ | 1,010,755 | $ | 956,001 | $ | 713,659 | $ | 589,220 | $ | 346,585 | |||||
| Portfolio turnover rate | 54.11 | % | 47.27 | % | 36.11 | % | 66.78 | % | 55.79 | % | |||||
| Portfolio turnover rate excluding mortgage dollar rollse | 54.11 | % | 44.33 | % | 36.11 | % | 66.78 | % | 55.79 | % | |||||
aThe amount shown for a share outstanding throughout the period may not correlate with the Statement of Operations for the period due to the timing of sales and repurchases of
the Fund shares in relation to income earned and/or fluctuating fair value of the investments of the Fund.
bBased on average daily shares outstanding.
cBenefit of expense reduction rounds to less than 0.01%.
dBenefit of waiver and payments by affiliate rounds to less than 0.01%.
eSee Note 1(g) regarding mortgage dollar rolls.
Annual Report | The accompanying notes are an integral part of these financial statements. | 21
Franklin Strategic Series
Statement of Investments, April 30, 2014
| Franklin Strategic Income Fund | Country | Shares/Units | Value | ||
| Common Stocks and Other Equity Interests 1.2% | |||||
| Consumer Services 0.1% | |||||
| a,b,c Turtle Bay Resort | United States | 5,579,939 | $ | 7,198,122 | |
| Diversified Financials 1.1% | |||||
| iShares iBoxx High Yield Corporate Bond ETF | United States | 1,000,000 | 94,340,000 | ||
| Materials 0.0%† | |||||
| NewPage Holdings Inc. | United States | 28,000 | 2,520,000 | ||
| Transportation 0.0%† | |||||
| a CEVA Holdings LLC | United Kingdom | 1,570 | 1,986,012 | ||
| Total Common Stocks and Other Equity Interests | |||||
| (Cost $105,991,088) | 106,044,134 | ||||
| Convertible Preferred Stocks 0.1% | |||||
| Transportation 0.1% | |||||
| a CEVA Holdings LLC, cvt. pfd., A-1 | United Kingdom | 62 | 104,470 | ||
| a CEVA Holdings LLC, cvt. pfd., A-2 | United Kingdom | 3,399 | 4,299,178 | ||
| Total Convertible Preferred Stocks | |||||
| (Cost $5,149,789) | 4,403,648 | ||||
| Preferred Stocks (Cost $3,845,000) 0.0%† | |||||
| Diversified Financials 0.0%† | |||||
| GMAC Capital Trust I, 8.125%, pfd. | United States | 153,800 | 4,227,962 | ||
| Principal Amount* | |||||
| Corporate Bonds 36.5% | |||||
| Automobiles & Components 0.6% | |||||
| d Avis Budget Finance PLC, senior note, 144A, 6.00%, | |||||
| 3/01/21 | United States | 9,000,000 | EUR | 13,241,691 | |
| d General Motors Co., senior bond, 144A, 4.875%, 10/02/23 | United States | 20,000,000 | 20,775,000 | ||
| The Goodyear Tire & Rubber Co., senior note, 6.50%, | |||||
| 3/01/21 | United States | 15,000,000 | 16,312,500 | ||
| 50,329,191 | |||||
| Banks 2.8% | |||||
| Bank of America Corp., | |||||
| e junior sub. bond, M, 8.125% to 5/15/18, FRN thereafter, | |||||
| Perpetual | United States | 22,000,000 | 25,100,614 | ||
| senior note, 5.65%, 5/01/18 | United States | 10,000,000 | 11,351,990 | ||
| CIT Group Inc., senior note, | |||||
| 5.375%, 5/15/20 | United States | 6,900,000 | 7,391,625 | ||
| 5.00%, 8/15/22 | United States | 18,000,000 | 18,472,500 | ||
| d 144A, 6.625%, 4/01/18 | United States | 7,000,000 | 7,848,750 | ||
| Citigroup Inc., | |||||
| e junior sub. bond, M, 6.30% to 5/15/24, FRN thereafter, | |||||
| Perpetual | United States | 6,900,000 | 6,902,932 | ||
| senior note, 3.875%, 10/25/23 | United States | 20,000,000 | 20,026,320 | ||
| sub. bond, 5.50%, 9/13/25 | United States | 15,000,000 | 16,296,105 | ||
| sub. note, 4.05%, 7/30/22 | United States | 5,000,000 | 5,059,840 | ||
22 | Annual Report
Franklin Strategic Series
Statement of Investments, April 30, 2014 (continued)
| Franklin Strategic Income Fund | Country | Principal Amount* | Value | ||
| Corporate Bonds (continued) | |||||
| Banks (continued) | |||||
| JPMorgan Chase & Co., | |||||
| e junior sub. bond, 6.00% to 8/01/23, FRN thereafter, | |||||
| Perpetual | United States | 10,000,000 | $ | 10,000,000 | |
| senior note, 4.25%, 10/15/20 | United States | 15,000,000 | 16,146,735 | ||
| senior note, 3.25%, 9/23/22 | United States | 5,000,000 | 4,947,365 | ||
| sub. note, 3.375%, 5/01/23 | United States | 10,000,000 | 9,584,430 | ||
| Merrill Lynch & Co. Inc., senior note, 6.40%, 8/28/17 | United States | 10,000,000 | 11,463,130 | ||
| Regions Bank, sub. note, 7.50%, 5/15/18 | United States | 8,000,000 | 9,460,984 | ||
| Regions Financial Corp., senior note, 5.75%, 6/15/15 | United States | 1,200,000 | 1,263,149 | ||
| Royal Bank of Scotland Group PLC, sub. note, 6.125%, | |||||
| 12/15/22 | United Kingdom | 10,000,000 | 10,650,000 | ||
| The Royal Bank of Scotland PLC, sub. note, 6.934%, | |||||
| 4/09/18 | United Kingdom | 13,000,000 | EUR | 20,704,827 | |
| e Wells Fargo & Co., S, junior sub. bond, 5.90% to 6/15/14, | |||||
| FRN thereafter, Perpetual | United States | 31,400,000 | 32,251,003 | ||
| 244,922,299 | |||||
| Capital Goods 1.0% | |||||
| d Abengoa Finance SAU, senior note, 144A, | |||||
| 8.875%, 11/01/17 | Spain | 18,000,000 | 20,430,000 | ||
| 7.75%, 2/01/20 | Spain | 2,600,000 | 2,866,500 | ||
| Case New Holland Inc., senior note, 7.875%, 12/01/17 | United States | 6,000,000 | 7,080,000 | ||
| d KM Germany Holdings GmbH, secured note, 144A, 8.75%, | |||||
| 12/15/20 | Germany | 10,000,000 | EUR | 15,727,380 | |
| d Loxam SAS, senior sub. note, 144A, 7.375%, 1/24/20 | France | 8,000,000 | EUR | 12,243,371 | |
| Meritor Inc., senior note, 6.75%, 6/15/21 | United States | 4,000,000 | 4,250,000 | ||
| Navistar International Corp., senior note, 8.25%, 11/01/21 | United States | 12,200,000 | 12,459,250 | ||
| Terex Corp., senior note, 6.00%, 5/15/21 | United States | 15,000,000 | 16,125,000 | ||
| 91,181,501 | |||||
| Commercial & Professional Services 0.2% | |||||
| d Algeco Scotsman Global Finance PLC, first lien, 144A, 9.00%, | |||||
| 10/15/18 | United Kingdom | 2,000,000 | EUR | 3,022,362 | |
| d Nielsen Finance LLC/Co., senior sub. note, 144A, 5.00%, | |||||
| 4/15/22 | United States | 11,000,000 | 11,068,750 | ||
| 14,091,112 | |||||
| Consumer Durables & Apparel 0.9% | |||||
| d Financiere Gaillon 8 SAS, senior note, 144A, 7.00%, | |||||
| 9/30/19 | France | 11,000,000 | EUR | 15,449,940 | |
| KB Home, senior note, | |||||
| 4.75%, 5/15/19 | United States | 9,400,000 | 9,400,000 | ||
| 7.00%, 12/15/21 | United States | 13,300,000 | 14,297,500 | ||
| M/I Homes Inc., senior note, 8.625%, 11/15/18 | United States | 8,600,000 | 9,266,500 | ||
| Toll Brothers Finance Corp., senior bond, 5.625%, 1/15/24 | United States | 10,300,000 | 10,737,750 | ||
| Visant Corp., senior note, 10.00%, 10/01/17 | United States | 14,700,000 | 13,891,500 | ||
| 73,043,190 | |||||
Annual Report | 23
| Franklin Strategic Series | |||||
| Statement of Investments, April 30, 2014 (continued) | |||||
| Franklin Strategic Income Fund | Country | Principal Amount* | Value | ||
| Corporate Bonds (continued) | |||||
| Consumer Services 1.0% | |||||
| Caesars Entertainment Operating Co. Inc., senior secured note, | |||||
| 11.25%, 6/01/17 | United States | 22,000,000 | $ | 21,120,000 | |
| first lien, 9.00%, 2/15/20 | United States | 1,900,000 | 1,667,250 | ||
| first lien, 9.00%, 2/15/20 | United States | 2,000,000 | 1,752,500 | ||
| d,f Financiere Quick SAS, | |||||
| 144A, FRN, 7.825%, 10/15/19 | France | 6,600,000 | EUR | 9,175,753 | |
| secured note, 144A, FRN, 5.075%, 4/15/19 | France | 6,900,000 | EUR | 9,557,849 | |
| MGM Resorts International, senior note, | |||||
| 6.625%, 7/15/15 | United States | 15,000,000 | 15,937,500 | ||
| 7.50%, 6/01/16 | United States | 1,000,000 | 1,115,000 | ||
| 10.00%, 11/01/16 | United States | 1,000,000 | 1,192,500 | ||
| 8.625%, 2/01/19 | United States | 700,000 | 839,125 | ||
| 6.75%, 10/01/20 | United States | 1,800,000 | 1,993,680 | ||
| 6.625%, 12/15/21 | United States | 10,000,000 | 11,015,500 | ||
| 7.75%, 3/15/22 | United States | 2,000,000 | 2,331,000 | ||
| Pinnacle Entertainment Inc., senior sub. note, 7.75%, | |||||
| 4/01/22 | United States | 2,200,000 | 2,398,000 | ||
| d PNK Finance Corp., senior note, 144A, 6.375%, 8/01/21 | United States | 4,900,000 | 5,169,500 | ||
| 85,265,157 | |||||
| Diversified Financials 2.4% | |||||
| Ally Financial Inc., senior note, 7.50%, 9/15/20 | United States | 28,000,000 | 33,285,000 | ||
| Deutsche Bank AG, sub. bond, 4.296% to 5/24/23, | |||||
| FRN thereafter, 5/24/28 | Germany | 33,000,000 | 31,622,250 | ||
| E*TRADE Financial Corp., senior note, 6.375%, 11/15/19 | United States | 10,000,000 | 10,912,500 | ||
| General Electric Capital Corp., | |||||
| senior note, A, 8.50%, 4/06/18 | United States | 94,000,000 | MXN | 7,947,314 | |
| sub. note, 5.30%, 2/11/21 | United States | 15,000,000 | 16,991,700 | ||
| General Motors Financial Co. Inc., | |||||
| senior bond, 4.25%, 5/15/23 | United States | 3,700,000 | 3,639,875 | ||
| senior note, 3.25%, 5/15/18 | United States | 2,100,000 | 2,128,875 | ||
| GMAC Inc., sub. note, 8.00%, 12/31/18 | United States | 4,000,000 | 4,792,000 | ||
| d KKR Group Finance Co., senior note, 144A, 6.375%, | |||||
| 9/29/20 | United States | 20,000,000 | 23,228,440 | ||
| Morgan Stanley, senior note, | |||||
| 6.00%, 4/28/15 | United States | 8,000,000 | 8,419,312 | ||
| 5.50%, 7/24/20 | United States | 10,000,000 | 11,360,390 | ||
| 5.50%, 7/28/21 | United States | 5,000,000 | 5,665,010 | ||
| d Neuberger Berman Group LLC/Finance Corp., senior note, 144A, | |||||
| 5.625%, 3/15/20 | United States | 4,000,000 | 4,230,000 | ||
| 5.875%, 3/15/22 | United States | 10,000,000 | 10,700,000 | ||
| SLM Corp., senior note, | |||||
| 8.45%, 6/15/18 | United States | 14,100,000 | 16,673,250 | ||
| 5.50%, 1/15/19 | United States | 16,000,000 | 16,996,848 | ||
| 208,592,764 | |||||
24 | Annual Report
| Franklin Strategic Series | ||||||
| Statement of Investments, April 30, 2014 (continued) | ||||||
| Franklin Strategic Income Fund | Country | Principal Amount* | Value | |||
| Corporate Bonds (continued) | ||||||
| Energy 8.5% | ||||||
| Access Midstream Partner LP/ACMP Finance Corp., senior note, | ||||||
| 5.875%, 4/15/21 | United States | 8,900,000 | $ | 9,523,000 | ||
| 6.125%, 7/15/22 | United States | 7,300,000 | 7,929,625 | |||
| d Antero Resources Corp., senior note, 144A, 5.375%, | ||||||
| 11/01/21 | United States | 5,300,000 | 5,422,562 | |||
| Antero Resources Finance Corp., senior note, 7.25%, | ||||||
| 8/01/19 | United States | 640,000 | 684,320 | |||
| BreitBurn Energy Partners LP/Finance Corp., senior bond, | ||||||
| 7.875%, 4/15/22 | United States | 7,200,000 | 7,830,000 | |||
| CGG SA, senior note, | ||||||
| 9.50%, 5/15/16 | France | 500,000 | 514,400 | |||
| 7.75%, 5/15/17 | France | 10,000,000 | 10,187,500 | |||
| d 144A, 5.875%, 5/15/20 | France | 3,500,000 | EUR | 5,022,097 | ||
| 6.50%, 6/01/21 | France | 10,000,000 | 10,125,000 | |||
| d 144A, 6.875%, 1/15/22 | France | 10,000,000 | 10,075,000 | |||
| Chaparral Energy Inc., senior note, | ||||||
| 9.875%, 10/01/20 | United States | 8,000,000 | 9,100,000 | |||
| 8.25%, 9/01/21 | United States | 8,000,000 | 8,780,000 | |||
| 7.625%, 11/15/22 | United States | 1,400,000 | 1,498,000 | |||
| CHC Helicopter SA, | ||||||
| senior note, 9.375%, 6/01/21 | Canada | 4,000,000 | 4,160,000 | |||
| senior secured note, first lien, 9.25%, 10/15/20 | Canada | 16,200,000 | 17,435,250 | |||
| Chesapeake Energy Corp., senior note, | ||||||
| 7.25%, 12/15/18 | United States | 1,000,000 | 1,167,500 | |||
| 6.625%, 8/15/20 | United States | 16,000,000 | 18,060,000 | |||
| 6.125%, 2/15/21 | United States | 6,000,000 | 6,600,000 | |||
| 5.75%, 3/15/23 | United States | 14,000,000 | 14,945,000 | |||
| Clayton Williams Energy Inc., senior note, 7.75%, 4/01/19 | United States | 18,000,000 | 19,260,000 | |||
| CONSOL Energy Inc., senior note, | ||||||
| 8.00%, 4/01/17 | United States | 7,700,000 | 8,025,710 | |||
| 8.25%, 4/01/20 | United States | 8,000,000 | 8,750,000 | |||
| 6.375%, 3/01/21 | United States | 1,600,000 | 1,694,000 | |||
| d 144A, 5.875%, 4/15/22 | United States | 10,700,000 | 11,047,750 | |||
| El Paso Corp., | ||||||
| senior bond, 6.50%, 9/15/20 | United States | 9,000,000 | 9,986,580 | |||
| senior note, 7.00%, 6/15/17 | United States | 3,500,000 | 3,963,180 | |||
| Energy Transfer Equity LP, senior note, 7.50%, 10/15/20 | United States | 30,000,000 | 34,725,000 | |||
| Energy Transfer Partners LP, senior note, 5.20%, 2/01/22 | United States | 10,000,000 | 10,947,080 | |||
| Energy XXI Gulf Coast Inc., senior note, | ||||||
| 9.25%, 12/15/17 | United States | 15,000,000 | 16,368,750 | |||
| d 144A, 7.50%, 12/15/21 | United States | 2,100,000 | 2,231,250 | |||
| d Enquest PLC, senior note, 144A, 7.00%, 4/15/22 | United Kingdom | 7,800,000 | 7,965,750 | |||
| Enterprise Products Operating LLC, junior sub. note, 7.034% | ||||||
| to 1/15/18, FRN thereafter , 1/15/68 | United States | 10,000,000 | 11,334,330 | |||
| d Expro Finance Luxembourg, senior secured note, 144A, 8.50%, | ||||||
| 12/15/16 | United Kingdom | 20,000,000 | 20,912,500 | |||
Annual Report | 25
Franklin Strategic Series
Statement of Investments, April 30, 2014 (continued)
| Franklin Strategic Income Fund | Country | Principal Amount* | Value | |
| Corporate Bonds (continued) | ||||
| Energy (continued) | ||||
| d,g Gaz Capital SA (OJSC Gazprom), loan participation, | ||||
| senior bond, 144A, 6.51%, 3/07/22 | Russia | 8,000,000 | $ | 7,960,000 |
| senior note, 144A, 5.092%, 11/29/15 | Russia | 12,000,000 | 12,258,120 | |
| senior note, 144A, 3.85%, 2/06/20 | Russia | 15,000,000 | 13,630,650 | |
| Halcon Resources Corp., senior note, | ||||
| 9.75%, 7/15/20 | United States | 4,000,000 | 4,300,000 | |
| 8.875%, 5/15/21 | United States | 15,000,000 | 15,618,750 | |
| d 144A, 9.25%, 2/15/22 | United States | 5,300,000 | 5,591,500 | |
| d Kinder Morgan Finance Co. LLC, senior secured note, 144A, | ||||
| 6.00%, 1/15/18 | United States | 17,000,000 | 18,678,172 | |
| Linn Energy LLC/Finance Corp., senior note, | ||||
| 6.50%, 5/15/19 | United States | 2,000,000 | 2,085,000 | |
| 8.625%, 4/15/20 | United States | 10,000,000 | 10,837,500 | |
| 7.75%, 2/01/21 | United States | 10,000,000 | 10,750,000 | |
| d 144A, 6.25%, 11/01/19 | United States | 8,000,000 | 8,310,000 | |
| d LUKOIL International Finance BV, senior note, 144A, 4.563%, | ||||
| 4/24/23 | Russia | 30,000,000 | 26,724,900 | |
| Martin Midstream Partners LP/Martin Midstream Finance Corp., | ||||
| senior note, | ||||
| 7.25%, 2/15/21 | United States | 8,000,000 | 8,380,000 | |
| d 144A, 7.25%, 2/15/21 | United States | 10,200,000 | 10,684,500 | |
| Midstates Petroleum Co. Inc./LLC, senior note, 9.25%, | ||||
| 6/01/21 | United States | 12,500,000 | 12,843,750 | |
| d Oasis Petroleum Inc., senior note, 144A, 6.875%, 3/15/22 | United States | 10,400,000 | 11,336,000 | |
| Offshore Group Investment Ltd., | ||||
| senior bond, first lien, 7.125%, 4/01/23 | United States | 10,000,000 | 9,900,000 | |
| senior secured note, first lien, 7.50%, 11/01/19 | United States | 15,000,000 | 15,703,125 | |
| PBF Holding Co. LLC, first lien, 8.25%, 2/15/20 | United States | 18,000,000 | 19,755,000 | |
| Peabody Energy Corp., senior note, | ||||
| 7.375%, 11/01/16 | United States | 2,000,000 | 2,255,000 | |
| 6.00%, 11/15/18 | United States | 5,000,000 | 5,337,500 | |
| 6.50%, 9/15/20 | United States | 8,300,000 | 8,694,250 | |
| 6.25%, 11/15/21 | United States | 20,000,000 | 20,400,000 | |
| Penn Virginia Corp., senior note, 8.50%, 5/01/20 | United States | 10,000,000 | 11,150,000 | |
| Penn Virginia Resource Partners LP/Finance Corp. II, | ||||
| senior note, | ||||
| 8.375%, 6/01/20 | United States | 7,890,000 | 8,955,150 | |
| 6.50%, 5/15/21 | United States | 5,000,000 | 5,400,000 | |
| Plains Exploration & Production Co., senior note, | ||||
| 6.125%, 6/15/19 | United States | 1,700,000 | 1,882,750 | |
| 8.625%, 10/15/19 | United States | 1,000,000 | 1,083,750 | |
| 6.625%, 5/01/21 | United States | 2,562,000 | 2,847,023 | |
| 6.75%, 2/01/22 | United States | 2,000,000 | 2,242,500 | |
| 6.875%, 2/15/23 | United States | 6,000,000 | 6,750,000 | |
| QR Energy LP/QRE Finance, senior note, 9.25%, 8/01/20 | United States | 16,950,000 | 18,221,250 | |
| Quicksilver Resources Inc., | ||||
| d,f secured note, second lien, 144A, FRN, 7.00%, 6/21/19 | United States | 12,000,000 | 11,857,500 | |
| senior note, 9.125%, 8/15/19 | United States | 5,000,000 | 4,925,000 |
26 | Annual Report
| Franklin Strategic Series | |||||
| Statement of Investments, April 30, 2014 (continued) | |||||
| Franklin Strategic Income Fund | Country | Principal Amount* | Value | ||
| Corporate Bonds (continued) | |||||
| Energy (continued) | |||||
| Regency Energy Partners LP/Regency Energy Finance Corp., | |||||
| senior bond, 5.50%, 4/15/23 | United States | 5,000,000 | $ | 5,087,500 | |
| senior note, 5.875%, 3/01/22 | United States | 1,300,000 | 1,365,000 | ||
| Sabine Pass Liquefaction LLC, first lien, 5.625%, | |||||
| 2/01/21 | United States | 24,000,000 | 24,900,000 | ||
| 4/15/23 | United States | 6,200,000 | 6,285,250 | ||
| d Samson Investment Co., senior note, 144A, 9.75%, 2/15/20 | United States | 20,000,000 | 21,200,000 | ||
| d Sanchez Energy Corp., senior note, 144A, 7.75%, 6/15/21 | United States | 12,600,000 | 13,545,000 | ||
| W&T Offshore Inc., senior note, 8.50%, 6/15/19 | United States | 20,000,000 | 21,700,000 | ||
| 747,702,524 | |||||
| Food & Staples Retailing 0.2% | |||||
| d Cencosud SA, senior note, 144A, 4.875%, 1/20/23 | Chile | 20,000,000 | 19,520,900 | ||
| Food, Beverage & Tobacco 1.2% | |||||
| d Barry Callebaut Services SA, senior note, 144A, 5.50%, | |||||
| 6/15/23 | Belgium | 5,300,000 | 5,574,937 | ||
| d Boparan Finance PLC, senior note, 144A, 9.75%, 4/30/18 | United Kingdom | 11,300,000 | EUR | 16,890,200 | |
| Constellation Brands Inc., senior note, 4.25%, 5/01/23 | United States | 10,600,000 | 10,441,000 | ||
| Del Monte Corp., senior note, 7.625%, 2/15/19 | United States | 15,288,000 | 15,956,850 | ||
| d JBS USA LLC/Finance Inc., senior note, 144A, | |||||
| 8.25%, 2/01/20 | United States | 15,600,000 | 17,152,200 | ||
| 7.25%, 6/01/21 | United States | 4,500,000 | 4,876,875 | ||
| Kraft Foods Group Inc., senior bond, 3.50%, 6/06/22 | United States | 20,000,000 | 20,355,260 | ||
| d Post Holdings Inc., senior note, 144A, 6.75%, 12/01/21 | United States | 8,600,000 | 9,030,000 | ||
| d Sun Merger Sub Inc., senior note, 144A, | |||||
| 5.25%, 8/01/18 | United States | 2,500,000 | 2,620,313 | ||
| 5.875%, 8/01/21 | United States | 2,000,000 | 2,111,250 | ||
| 105,008,885 | |||||
| Health Care Equipment & Services 1.3% | |||||
| Alere Inc., senior sub. note, 6.50%, 6/15/20 | United States | 4,900,000 | 5,169,500 | ||
| d Cegedim SA, senior note, 144A, 6.75%, 4/01/20 | France | 5,800,000 | EUR | 8,473,191 | |
| CHS/Community Health Systems Inc., | |||||
| senior note, 8.00%, 11/15/19 | United States | 10,200,000 | 11,207,250 | ||
| senior note, 7.125%, 7/15/20 | United States | 6,000,000 | 6,442,500 | ||
| d senior note, 144A, 6.875%, 2/01/22 | United States | 3,300,000 | 3,436,125 | ||
| senior secured note, 5.125%, 8/15/18 | United States | 6,000,000 | 6,322,500 | ||
| DaVita HealthCare Partners Inc., senior note, 5.75%, | |||||
| 8/15/22 | United States | 10,000,000 | 10,625,000 | ||
| HCA Inc., | |||||
| senior note, 6.50%, 2/15/16 | United States | 3,000,000 | 3,262,500 | ||
| senior note, 7.50%, 2/15/22 | United States | 8,100,000 | 9,258,300 | ||
| senior note, 5.875%, 5/01/23 | United States | 15,000,000 | 15,300,000 | ||
| senior secured bond, 7.25%, 9/15/20 | United States | 1,700,000 | 1,838,125 | ||
| senior secured note, 5.875%, 3/15/22 | United States | 10,000,000 | 10,750,000 | ||
| Hologic Inc., senior note, 6.25%, 8/01/20 | United States | 4,700,000 | 4,993,750 | ||
Annual Report | 27
| Franklin Strategic Series | ||||||
| Statement of Investments, April 30, 2014 (continued) | ||||||
| Franklin Strategic Income Fund | Country | Principal Amount* | Value | |||
| Corporate Bonds (continued) | ||||||
| Health Care Equipment & Services (continued) | ||||||
| Tenet Healthcare Corp., senior note, | ||||||
| 8.125%, 4/01/22 | United States | 8,400,000 | $ | 9,345,000 | ||
| d 144A, 5.00%, 3/01/19 | United States | 2,600,000 | 2,613,000 | |||
| d 144A, 6.00%, 10/01/20 | United States | 2,700,000 | 2,840,062 | |||
| 111,876,803 | ||||||
| Insurance 0.5% | ||||||
| d MetLife Capital Trust X, secured bond, 144A, 9.25% to | ||||||
| 4/08/38, FRN thereafter, 4/08/68 | United States | 1,900,000 | 2,565,000 | |||
| MetLife Inc., junior sub. note, 6.40% to 12/15/36, | ||||||
| FRN thereafter, 12/15/66 | United States | 20,000,000 | 21,800,000 | |||
| d Mitsui Sumitomo Insurance Co. Ltd., junior sub. note, 144A, | ||||||
| 7.00% to 3/15/22, FRN thereafter, 3/15/72 | Japan | 20,000,000 | 23,635,900 | |||
| 48,000,900 | ||||||
| Materials 4.1% | ||||||
| ArcelorMittal, senior note, | ||||||
| 6.00%, 3/01/21 | Luxembourg | 20,000,000 | 21,400,400 | |||
| 6.75%, 2/25/22 | Luxembourg | 15,000,000 | 16,614,225 | |||
| d Ardagh Packaging Finance PLC, senior note, 144A, 9.125%, | ||||||
| 10/15/20 | Luxembourg | 5,000,000 | 5,587,500 | |||
| d Ardagh Packaging Finance PLC/Ardagh MP Holdings USA Inc., | ||||||
| senior note, 144A, 6.25%, 1/31/19 | Luxembourg | 2,000,000 | 2,090,000 | |||
| senior note, 144A, 7.00%, 11/15/20 | Luxembourg | 1,764,706 | 1,850,735 | |||
| senior note, 144A, 6.75%, 1/31/21 | Luxembourg | 2,400,000 | 2,517,000 | |||
| senior secured note, first lien, 144A, 7.375%, 10/15/17 | Luxembourg | 3,100,000 | 3,287,937 | |||
| d Barminco Finance Pty. Ltd., senior note, 144A, 9.00%, | ||||||
| 6/01/18 | Australia | 15,000,000 | 13,884,375 | |||
| d Cemex Finance LLC, senior secured note, 144A, | ||||||
| 9.375%, 10/12/22 | Mexico | 1,400,000 | 1,620,500 | |||
| 6.00%, 4/01/24 | Mexico | 5,800,000 | 5,829,000 | |||
| d Cemex SAB de CV, | ||||||
| secured note, 144A, 5.875%, 3/25/19 | Mexico | 10,000,000 | 10,268,750 | |||
| senior secured note, 144A, 9.00%, 1/11/18 | Mexico | 20,000,000 | 21,675,000 | |||
| d Faenza GmbH, senior note, 144A, 8.25%, 8/15/21 | Germany | 6,700,000 | EUR | 10,229,473 | ||
| d First Quantum Minerals Ltd., senior note, 144A, | ||||||
| 6.75%, 2/15/20 | Canada | 15,000,000 | 15,225,000 | |||
| 7.00%, 2/15/21 | Canada | 14,125,000 | 14,389,844 | |||
| d FMG Resources (August 2006) Pty. Ltd., senior note, 144A, | ||||||
| 6.00%, 4/01/17 | Australia | 2,000,000 | 2,110,000 | |||
| 6.875%, 2/01/18 | Australia | 12,000,000 | 12,690,000 | |||
| 8.25%, 11/01/19 | Australia | 15,000,000 | 16,631,250 | |||
| d Glencore Funding LLC, | ||||||
| 144A, 4.625%, 4/29/24 | Switzerland | 5,000,000 | 5,024,000 | |||
| senior note, 144A, 4.125%, 5/30/23 | Switzerland | 7,500,000 | 7,287,795 | |||
| d Ineos Finance PLC, senior secured note, 144A, | ||||||
| 8.375%, 2/15/19 | Switzerland | 700,000 | 773,500 | |||
| 7.50%, 5/01/20 | Switzerland | 2,000,000 | 2,193,750 | |||
28 | Annual Report
Franklin Strategic Series
Statement of Investments, April 30, 2014 (continued)
| Franklin Strategic Income Fund | Country | Principal Amount* | Value | ||
| Corporate Bonds (continued) | |||||
| Materials (continued) | |||||
| d Ineos Group Holdings SA, senior note, 144A, | |||||
| 6.125%, 8/15/18 | Switzerland | 6,800,000 | $ | 7,072,000 | |
| 6.50%, 8/15/18 | Switzerland | 6,100,000 | EUR | 8,943,742 | |
| 5.75%, 2/15/19 | Switzerland | 2,800,000 | EUR | 3,993,402 | |
| d Kerling PLC, senior secured note, 144A, 10.625%, 2/01/17 | United Kingdom | 12,000,000 | EUR | 17,681,972 | |
| Novelis Inc., senior note, | |||||
| 8.375%, 12/15/17 | Canada | 9,000,000 | 9,618,750 | ||
| 8.75%, 12/15/20 | Canada | 8,000,000 | 8,960,000 | ||
| d Orion Engineered Carbons Bondco GmbH, senior secured bond, | |||||
| 144A, 10.00%, 6/15/18 | Germany | 11,700,000 | EUR | 17,599,666 | |
| d,h Orion Engineered Carbons Finance & Co. SCA, senior note, | |||||
| 144A, PIK, 9.25%, 8/01/19 | Germany | 3,000,000 | 3,138,750 | ||
| Reynolds Group Issuer Inc./LLC/SA, | |||||
| first lien, 5.75%, 10/15/20 | United States | 6,600,000 | 6,897,000 | ||
| senior note, 8.50%, 5/15/18 | United States | 14,000,000 | 14,647,500 | ||
| senior note, 9.00%, 4/15/19 | United States | 1,000,000 | 1,072,500 | ||
| senior note, 9.875%, 8/15/19 | United States | 400,000 | 446,000 | ||
| senior note, 8.25%, 2/15/21 | United States | 10,000,000 | 10,862,500 | ||
| senior secured note, 7.125%, 4/15/19 | United States | 5,000,000 | 5,300,000 | ||
| d Sealed Air Corp., senior note, 144A, | |||||
| 8.125%, 9/15/19 | United States | 4,000,000 | 4,470,000 | ||
| 6.50%, 12/01/20 | United States | 4,000,000 | 4,440,000 | ||
| 8.375%, 9/15/21 | United States | 4,000,000 | 4,630,000 | ||
| d U.S. Coatings Acquisition Inc./Flash Dutch 2 BV, 144A, | |||||
| 5.75%, 2/01/21 | United States | 8,000,000 | EUR | 11,936,856 | |
| d Xstrata Finance Canada Ltd., senior note, 144A, 4.95%, | |||||
| 11/15/21 | Canada | 25,000,000 | 26,268,000 | ||
| 361,158,672 | |||||
| Media 3.0% | |||||
| Cablevision Systems Corp., senior note, 8.625%, 9/15/17 | United States | 3,000,000 | 3,540,000 | ||
| CCO Holdings LLC/CCO Holdings Capital Corp., | |||||
| senior bond, 5.25%, 9/30/22 | United States | 5,600,000 | 5,621,000 | ||
| senior note, 8.125%, 4/30/20 | United States | 5,000,000 | 5,493,750 | ||
| senior note, 6.50%, 4/30/21 | United States | 8,000,000 | 8,570,000 | ||
| Clear Channel Communications Inc., senior secured bond, | |||||
| first lien, 9.00%, 3/01/21 | United States | 25,000,000 | 26,687,500 | ||
| Clear Channel Worldwide Holdings Inc., | |||||
| senior note, 6.50%, 11/15/22 | United States | 3,000,000 | 3,210,000 | ||
| senior note, 6.50%, 11/15/22 | United States | 5,000,000 | 5,375,000 | ||
| senior sub. note, 7.625%, 3/15/20 | United States | 900,000 | 967,500 | ||
| senior sub. note, 7.625%, 3/15/20 | United States | 5,100,000 | 5,520,750 | ||
| CSC Holdings Inc., senior deb., 7.625%, 7/15/18 | United States | 6,000,000 | 6,960,000 | ||
| CSC Holdings LLC, senior note, 6.75%, 11/15/21 | United States | 22,000,000 | 24,612,500 | ||
| DISH DBS Corp., | |||||
| senior bond, 5.00%, 3/15/23 | United States | 10,000,000 | 10,225,000 | ||
| senior note, 7.125%, 2/01/16 | United States | 13,000,000 | 14,235,000 | ||
| senior note, 6.75%, 6/01/21 | United States | 4,000,000 | 4,530,000 | ||
| senior note, 5.875%, 7/15/22 | United States | 3,000,000 | 3,243,750 | ||
| Annual Report | 29 | |||||
Franklin Strategic Series
Statement of Investments, April 30, 2014 (continued)
| Franklin Strategic Income Fund | Country | Principal Amount* | Value | ||
| Corporate Bonds (continued) | |||||
| Media (continued) | |||||
| d Gannett Co. Inc., | |||||
| senior bond, 144A, 6.375%, 10/15/23 | United States | 19,200,000 | $ | 20,400,000 | |
| senior note, 144A, 5.125%, 7/15/20 | United States | 5,200,000 | 5,408,000 | ||
| Time Warner Inc., | |||||
| 7.625%, 4/15/31 | United States | 9,000,000 | 12,277,053 | ||
| 6.10%, 7/15/40 | United States | 3,000,000 | 3,535,299 | ||
| senior bond, 3.40%, 6/15/22 | United States | 3,000,000 | 3,025,776 | ||
| d Unitymedia Hessen GmbH & Co.KG/Unitymedia NRW GmbH, | |||||
| secured bond, 144A, 5.75%, 1/15/23 | Germany | 3,700,000 | EUR | 5,565,706 | |
| senior secured note, 144A, 9.50%, 3/15/21 | Germany | 7,000,000 | EUR | 11,221,581 | |
| senior secured note, 144A, 5.625%, 4/15/23 | Germany | 1,900,000 | EUR | 2,859,515 | |
| d Univision Communications Inc., | |||||
| senior secured bond, 144A, 6.75%, 9/15/22 | United States | 3,622,000 | 4,002,310 | ||
| senior secured note, 144A, 6.875%, 5/15/19 | United States | 5,000,000 | 5,356,250 | ||
| senior secured note, 144A, 7.875%, 11/01/20 | United States | 11,000,000 | 12,141,250 | ||
| senior secured note, 144A, 5.125%, 5/15/23 | United States | 2,000,000 | 2,050,000 | ||
| d UPC Holding BV, senior note, 144A, 6.375%, 9/15/22 | Netherlands | 3,000,000 | EUR | 4,476,321 | |
| d UPCB Finance II Ltd., senior secured note, 144A, 6.375%, | |||||
| 7/01/20 | Netherlands | 8,000,000 | EUR | 11,884,364 | |
| d UPCB Finance VI Ltd., senior secured note, 144A, 6.875%, | |||||
| 1/15/22 | Netherlands | 5,000,000 | 5,459,375 | ||
| d Videotron Ltd., senior bond, 144A, 5.375%, 6/15/24 | Canada | 6,400,000 | 6,464,000 | ||
| d Virgin Media Secured Finance PLC, senior secured bond, | |||||
| 144A, 5.50%, 1/15/25 | United Kingdom | 14,000,000 | 14,113,750 | ||
| d VTR Finance BV, senior secured note, 144A, 6.875%, | |||||
| 1/15/24 | Chile | 7,600,000 | 7,936,323 | ||
| 266,968,623 | |||||
| Pharmaceuticals, Biotechnology & Life Sciences 1.0% | |||||
| d Capsugel FinanceCo SCA, senior note, 144A, 9.875%, | |||||
| 8/01/19 | United States | 11,000,000 | EUR | 16,737,435 | |
| d Grifols Worldwide Operations Ltd., senior note, 144A, 5.25%, | |||||
| 4/01/22 | United States | 3,500,000 | 3,561,250 | ||
| d inVentiv Health Inc., senior secured note, 144A, 9.00%, | |||||
| 1/15/18 | United States | 6,200,000 | 6,603,000 | ||
| d,h Jaguar Holding Co. I, senior note, 144A, PIK, 9.375%, | |||||
| 10/15/17 | United States | 12,000,000 | 12,600,000 | ||
| d Valeant Pharmaceuticals International Inc., senior note, 144A, | |||||
| 7.50%, 7/15/21 | United States | 10,800,000 | 12,096,000 | ||
| 5.625%, 12/01/21 | United States | 5,000,000 | 5,212,500 | ||
| d VPI Escrow Corp., senior note, 144A, 6.375%, 10/15/20 | United States | 16,600,000 | 17,928,000 | ||
| Zoetis Inc., senior bond, 3.25%, 2/01/23 | United States | 15,000,000 | 14,643,870 | ||
| 89,382,055 | |||||
| Real Estate 0.1% | |||||
| Crown Castle International Corp., senior bond, | |||||
| 7.125%, 11/01/19 | United States | 400,000 | 427,360 | ||
| 5.25%, 1/15/23 | United States | 5,000,000 | 5,162,500 | ||
| 5,589,860 | |||||
| 30 | Annual Report | |||||
Franklin Strategic Series
Statement of Investments, April 30, 2014 (continued)
| Franklin Strategic Income Fund | Country | Principal Amount* | Value | ||
| Corporate Bonds (continued) | |||||
| Retailing 0.5% | |||||
| d Edcon Holdings Pty. Ltd., senior note, 144A, 13.375%, | |||||
| 6/30/19 | South Africa | 1,800,000 | EUR | $ | 2,273,794 |
| d Edcon Pty. Ltd., secured note, 144A, 9.50%, 3/01/18 | South Africa | 15,325,000 | EUR | 21,228,333 | |
| d Matalan Finance Ltd., senior secured note, 144A, 8.875%, | |||||
| 4/29/16 | United Kingdom | 4,200,000 | GBP | 7,285,775 | |
| d New Look Bondco I PLC, 144A, 8.75%, 5/14/18 | United Kingdom | 9,100,000 | GBP | 16,582,812 | |
| 47,370,714 | |||||
| Software & Services 1.0% | |||||
| d BMC Software Finance Inc., senior note, 144A, 8.125%, | |||||
| 7/15/21 | United States | 15,000,000 | 15,787,500 | ||
| Equinix Inc., senior bond, 5.375%, 4/01/23 | United States | 20,000,000 | 20,450,000 | ||
| First Data Corp., | |||||
| senior bond, 12.625%, 1/15/21 | United States | 2,000,000 | 2,410,000 | ||
| senior note, 11.25%, 1/15/21 | United States | 5,000,000 | 5,737,500 | ||
| d senior secured bond, 144A, 8.25%, 1/15/21 | United States | 28,000,000 | 30,310,000 | ||
| Sterling International Inc., senior note, 11.00%, 10/01/19 | United States | 9,300,000 | 9,858,000 | ||
| 84,553,000 | |||||
| Technology Hardware & Equipment 0.6% | |||||
| d Alcatel-Lucent USA Inc., senior note, 144A, 6.75%, | |||||
| 11/15/20 | France | 16,900,000 | 17,829,500 | ||
| CDW LLC/Finance Corp., senior note, 8.50%, 4/01/19 | United States | 15,000,000 | �� | 16,481,250 | |
| d,h CommScope Holdings Co. Inc., senior note, 144A, PIK, | |||||
| 6.625%, 6/01/20 | United States | 1,800,000 | 1,939,500 | ||
| d CommScope Inc., senior note, 144A, 8.25%, 1/15/19 | United States | 13,110,000 | 14,257,125 | ||
| 50,507,375 | |||||
| Telecommunication Services 3.9% | |||||
| d Altice Financing SA, senior secured note, 144A, 6.50%, | |||||
| 1/15/22 | Luxembourg | 3,900,000 | EUR | 5,775,260 | |
| CenturyLink Inc., | |||||
| senior bond, 6.75%, 12/01/23 | United States | 2,000,000 | 2,155,000 | ||
| senior note, 6.00%, 4/01/17 | United States | 12,000,000 | 13,320,000 | ||
| senior note, 6.45%, 6/15/21 | United States | 4,100,000 | 4,438,250 | ||
| senior note, 5.80%, 3/15/22 | United States | 2,000,000 | 2,060,000 | ||
| d Digicel Group Ltd., senior note, 144A, | |||||
| 8.25%, 9/30/20 | Bermuda | 12,000,000 | 12,840,000 | ||
| 7.125%, 4/01/22 | Bermuda | 3,000,000 | 3,024,375 | ||
| d Digicel Ltd., senior note, 144A, | |||||
| 8.25%, 9/01/17 | Bermuda | 1,000,000 | 1,042,550 | ||
| 6.00%, 4/15/21 | Bermuda | 5,700,000 | 5,796,187 | ||
| d eAccess Ltd., senior note, 144A, | |||||
| 8.25%, 4/01/18 | Japan | 5,800,000 | 6,343,750 | ||
| 8.375%, 4/01/18 | Japan | 2,200,000 | EUR | 3,345,580 | |
| Frontier Communications Corp., | |||||
| senior bond, 7.625%, 4/15/24 | United States | 6,025,000 | 6,281,062 | ||
| senior note, 8.50%, 4/15/20 | United States | 14,000,000 | 16,371,250 | ||
| senior note, 8.75%, 4/15/22 | United States | 6,000,000 | 6,870,000 | ||
Annual Report | 31
| Franklin Strategic Series | |||||
| Statement of Investments, April 30, 2014 (continued) | |||||
| Franklin Strategic Income Fund | Country | Principal Amount* | Value | ||
| Corporate Bonds (continued) | |||||
| Telecommunication Services (continued) | |||||
| Frontier Communications Corp., (continued) | |||||
| senior note, 7.125%, 1/15/23 | United States | 2,000,000 | $ | 2,075,000 | |
| senior note, 7.875%, 1/15/27 | United States | 3,975,000 | 4,019,719 | ||
| Intelsat Jackson Holdings SA, | |||||
| senior bond, 6.625%, 12/15/22 | Luxembourg | 10,000,000 | 10,293,750 | ||
| d senior bond, 144A, 5.50%, 8/01/23 | Luxembourg | 3,000,000 | 2,951,250 | ||
| senior note, 7.25%, 10/15/20 | Luxembourg | 15,000,000 | 16,237,500 | ||
| senior note, 7.50%, 4/01/21 | Luxembourg | 9,000,000 | 9,900,000 | ||
| d Lynx I Corp., first lien, 144A, 5.375%, 4/15/21 | United Kingdom | 4,300,000 | 4,429,000 | ||
| d Lynx II Corp., senior bond, 144A, 6.375%, 4/15/23 | United Kingdom | 500,000 | 527,500 | ||
| d Millicom International Cellular SA, senior note, 144A, 6.625%, | |||||
| 10/15/21 | Luxembourg | 12,000,000 | 12,667,500 | ||
| d,h Mobile Challenger Intermediate Group SA, secured note, 144A, | |||||
| PIK, 8.75%, 3/15/19 | Switzerland | 3,650,000 | EUR | 5,240,495 | |
| d Nokia Siemens Networks Finance BV, senior note, 144A, | |||||
| 7.125%, 4/15/20 | Netherlands | 12,000,000 | EUR | 19,132,956 | |
| d Play Finance 1 SA, senior note, 144A, 6.50%, 8/01/19 | Poland | 3,900,000 | EUR | 5,768,498 | |
| d Play Finance 2 SA, senior secured note, 144A, 5.25%, | |||||
| 2/01/19 | Poland | 6,700,000 | EUR | 9,630,691 | |
| d Sprint Corp., | |||||
| senior bond, 144A, 7.125%, 6/15/24 | United States | 2,700,000 | 2,841,750 | ||
| senior note, 144A, 7.875%, 9/15/23 | United States | 4,700,000 | 5,193,500 | ||
| Sprint Nextel Corp., senior note, | |||||
| 8.375%, 8/15/17 | United States | 17,000,000 | 20,060,000 | ||
| 6.00%, 11/15/22 | United States | 10,000,000 | 10,112,500 | ||
| d 144A, 9.00%, 11/15/18 | United States | 8,000,000 | 9,770,000 | ||
| d 144A, 7.00%, 3/01/20 | United States | 5,000,000 | 5,793,750 | ||
| T-Mobile USA Inc., | |||||
| senior bond, 6.50%, 1/15/24 | United States | 3,500,000 | 3,679,375 | ||
| senior note, 6.542%, 4/28/20 | United States | 5,000,000 | 5,393,750 | ||
| senior note, 6.633%, 4/28/21 | United States | 3,500,000 | 3,793,125 | ||
| senior note, 6.125%, 1/15/22 | United States | 2,000,000 | 2,110,000 | ||
| senior note, 6.731%, 4/28/22 | United States | 3,500,000 | 3,788,750 | ||
| Telefonica Emisiones SAU, senior note, | |||||
| 5.462%, 2/16/21 | Spain | 12,000,000 | 13,511,220 | ||
| 4.57%, 4/27/23 | Spain | 11,000,000 | 11,541,530 | ||
| Verizon Communications Inc., senior note, 5.15%, 9/15/23 | United States | 26,000,000 | 28,702,830 | ||
| d Wind Acquisition Finance SA, senior secured note, 144A, | |||||
| 7.00%, 4/23/21 | Italy | 17,300,000 | EUR | 24,854,708 | |
| 343,683,911 | |||||
| Transportation 0.6% | |||||
| d Florida East Coast Holdings Corp., | |||||
| secured note, 144A, 6.75%, 5/01/19 | United States | 7,600,000 | 7,828,000 | ||
| senior note, 144A, 9.75%, 5/01/20 | United States | 4,000,000 | 4,140,000 | ||
| HDTFS Inc., senior note, | |||||
| 5.875%, 10/15/20 | United States | 1,800,000 | 1,917,000 | ||
| 6.25%, 10/15/22 | United States | 10,000,000 | 10,750,000 | ||
32 | Annual Report
| Franklin Strategic Series | ||||
| Statement of Investments, April 30, 2014 (continued) | ||||
| Franklin Strategic Income Fund | Country | Principal Amount* | Value | |
| Corporate Bonds (continued) | ||||
| Transportation (continued) | ||||
| Hertz Corp., senior note, 6.75%, 4/15/19 | United States | 11,900,000 | $ | 12,822,250 |
| d Stena AB, senior bond, 144A, 7.00%, 2/01/24 | Sweden | 7,500,000 | 7,612,500 | |
| d Stena International SA, secured bond, 144A, 5.75%, | ||||
| 3/01/24 | Sweden | 10,000,000 | 9,931,250 | |
| 55,001,000 | ||||
| Utilities 1.1% | ||||
| d Calpine Corp., | ||||
| senior secured bond, first lien, 144A, 5.875%, 1/15/24 | United States | 4,700,000 | 4,846,875 | |
| senior secured note, 144A, 7.875%, 7/31/20 | United States | 4,378,000 | 4,821,272 | |
| senior secured note, 144A, 7.50%, 2/15/21 | United States | 6,352,000 | 6,955,440 | |
| senior secured note, 144A, 7.875%, 1/15/23 | United States | 4,832,000 | 5,436,000 | |
| senior secured note, first lien, 144A, 6.00%, 1/15/22 | United States | 1,300,000 | 1,387,750 | |
| d,e EDF SA, | ||||
| junior sub. bond, 144A, 5.625% to 1/22/24, FRN | ||||
| thereafter, Perpetual | France | 5,000,000 | 5,169,425 | |
| sub. note, 144A, 5.25% to 1/29/23, FRN thereafter, | ||||
| Perpetual | France | 25,000,000 | 25,593,750 | |
| d InterGen NV, secured bond, 144A, 7.00%, 6/30/23 | Netherlands | 17,000,000 | 17,998,750 | |
| d,i Texas Competitive Electric Holdings Co. LLC/Texas Competitive | ||||
| Electric Holdings Finance Inc., senior secured note, 144A, | ||||
| 11.50%, 10/01/20 | United States | 30,000,000 | 24,150,000 | |
| 96,359,262 | ||||
| Total Corporate Bonds (Cost $2,999,270,690) | 3,200,109,698 | |||
| f,jSenior Floating Rate Interests 14.5% | ||||
| Automobiles & Components 0.5% | ||||
| k August LuxUK Holding Co., Lux Second Lien, 10.50%, | ||||
| 4/27/19 | Luxembourg | 10,536,643 | 10,773,717 | |
| k August U.S. Holding Co. Inc., U.S. Second Lien, 10.50%, | ||||
| 4/27/19 | United States | 3,450,051 | 3,527,678 | |
| FRAM Group Holdings Inc. (Autoparts Holdings), | ||||
| Second Lien Term Loan, 10.50%, 1/29/18 | United States | 21,928,750 | 20,941,956 | |
| Term Loan, 6.50%, 7/29/17 | United States | 8,846,403 | 8,853,772 | |
| 44,097,123 | ||||
| Capital Goods 0.8% | ||||
| Air Distribution Technologies (Tomkins Air Distribution), | ||||
| Second Lien Initial Loan, 9.25%, 5/09/20 | United States | 10,841,980 | 10,991,057 | |
| k Doncasters U.S. Finance LLC, Term B Loans, 5.75%, | ||||
| 4/09/20 | United States | 2,488,100 | 2,498,468 | |
| l Erickson Inc., Purchase Price Notes, 6.00%, 11/02/20 | United States | 1,202,322 | 1,160,988 | |
| Quikrete Holdings Inc., First Lien Initial Loan, 4.00%, | ||||
| 9/26/20 | United States | 13,685,873 | 13,696,137 | |
| Sensus USA Inc., Second Lien Term Loan, 8.50%, 5/09/18 | United States | 13,947,904 | 14,026,361 | |
| k Signode Industrial Group U.S. Inc., Term Loan B, 5.25%, | ||||
| 5/01/21 | United States | 10,884,112 | 10,858,599 | |
| TransDigm Inc., Tranche C Term Loan, 3.75%, 2/28/20 | United States | 5,199,445 | 5,181,164 | |
Annual Report | 33
| Franklin Strategic Series | ||||
| Statement of Investments, April 30, 2014 (continued) | ||||
| Franklin Strategic Income Fund | Country | Principal Amount* | Value | |
| f,jSenior Floating Rate Interests (continued) | ||||
| Capital Goods (continued) | ||||
| Wesco Distribution Inc., Tranche B-1 Loan, 3.75%, | ||||
| 12/12/19 | United States | 12,784,460 | $ | 12,784,384 |
| 71,197,158 | ||||
| Commercial & Professional Services 0.8% | ||||
| AlixPartners LLP, Second Lien 2013 Recapitalization Term | ||||
| Loan, 9.00%, 7/10/21 | United States | 2,134,146 | 2,184,166 | |
| Altegrity Inc., Tranche D Term Loan, 7.75%, 2/21/15 | United States | 39,019,727 | 38,401,928 | |
| Interactive Data Corp., | ||||
| Term B Loan, 3.75%, 2/11/18 | United States | 21,713,079 | 21,708,563 | |
| Term Loan, 6.00%, 5/05/21 | United States | 5,146,921 | 5,150,940 | |
| Pacific Industrial Services US Finco LLC (Spotless), Second | ||||
| Lien Initial Term Loan, 8.75%, 4/02/19 | United States | 253,000 | 259,483 | |
| 67,705,080 | ||||
| Consumer Services 0.6% | ||||
| Caesars Entertainment Resort Properties LLC, Term B Loans, | ||||
| 7.00%, 10/11/20 | United States | 6,857,143 | 6,879,524 | |
| k ClubCorp Club Operations Inc., Term B Loans, 5.25%, | ||||
| 7/24/20 | United States | 5,098,400 | 5,092,027 | |
| Diamond Resorts Corp., First Lien Term Loan, 6.75%, | ||||
| 5/09/21 | United States | 3,157,400 | 3,163,320 | |
| Hilton Worldwide Finance LLC, Initial Term Loan, 3.50%, | ||||
| 10/25/20 | United States | 39,590 | 39,510 | |
| La Quinta Intermediate Holdings LLC, Initial Term Loans, | ||||
| 4.00%, 4/14/21 | United States | 10,525,271 | 10,498,958 | |
| b,h Turtle Bay Holdings LLC, Term Loan B, PIK, 3.00%, 3/01/15 | United States | 25,949,828 | 24,587,462 | |
| 50,260,801 | ||||
| Diversified Financials 0.4% | ||||
| Asurion LLC, | ||||
| Incremental Tranche B-1 Term Loan, 5.00%, 5/24/19 | United States | 9,605,902 | 9,621,914 | |
| Second Lien Term Loan, 8.50%, 3/03/21 | United States | 8,900 | 9,126 | |
| Guggenheim Partners Investment Management Holdings LLC, | ||||
| Initial Term Loan, 4.25%, 7/22/20 | United States | 4,773,001 | 4,793,286 | |
| Trans Union LLC, 2014 Replacement Term Loan, 4.00%, | ||||
| 4/09/21 | United States | 22,675,900 | 22,615,673 | |
| 37,039,999 | ||||
| Energy 0.3% | ||||
| Bowie Resource Holdings LLC, 2nd Lien Initial Term Loan, | ||||
| 11.75%, 2/16/21 | United States | 6,530,612 | 6,628,571 | |
| McJunkin Red Man Corp., 2013 Term Loan, 4.75%, | ||||
| 11/11/19 | United States | 6,381,283 | 6,435,129 | |
| k Pacific Drilling SA, Term Loan, 4.50%, 6/03/18 | Luxembourg | 10,339,910 | 10,356,071 | |
| 23,419,771 | ||||
| Food & Staples Retailing 0.1% | ||||
| AdvancePierre Foods Inc., Second Lien Term Loan, 9.50%, | ||||
| 10/10/17 | United States | 8,931,383 | 8,685,770 | |
34 | Annual Report
| Franklin Strategic Series | ||||
| Statement of Investments, April 30, 2014 (continued) | ||||
| Franklin Strategic Income Fund | Country | Principal Amount* | Value | |
| f,jSenior Floating Rate Interests (continued) | ||||
| Food, Beverage & Tobacco 0.3% | ||||
| Allflex Holdings III Inc., Second Lien Initial Term Loan, | ||||
| 8.00%, 7/17/21 | United States | 5,270,000 | $ | 5,331,485 |
| Big Heart Pet Brands (Del Monte Pet), Initial Term Loans, | ||||
| 3.50%, 2/24/20 | United States | 19,189,952 | 19,060,420 | |
| k CSM Bakery Supplies LLC (U.S. Acquisition), Second Lien | ||||
| Term Loan, 9.75%, 7/03/21 | United States | 1,141,805 | 1,161,786 | |
| 25,553,691 | ||||
| Health Care Equipment & Services 2.1% | ||||
| Carestream Health Inc., Second Lien Loan, 9.50%, | ||||
| 12/07/19 | United States | 14,978,703 | 15,315,724 | |
| Community Health Systems Inc., | ||||
| 2017 Term E Loan, 3.447% - 3.483%, 1/25/17 | United States | 12,686,421 | 12,712,479 | |
| 2021 Term D Loan, 4.25%, 1/27/21 | United States | 36,542,000 | 36,701,725 | |
| DaVita HealthCare Partners Inc., | ||||
| Tranche B Term Loan, 4.50%, 10/20/16 | United States | 13,470,879 | 13,517,960 | |
| Tranche B-2 Term Loan, 4.00%, 8/24/19 | United States | 24,751,509 | 24,850,787 | |
| k Dialysis Newco Inc., | ||||
| First Lien Term Loan, 6.00%, 4/21/21 | United States | 4,273,800 | 4,279,142 | |
| Second Lien Term Loan, 9.00%, 10/21/21 | United States | 2,417,433 | 2,423,477 | |
| k Millennium Laboratories LLC, Tranche B Term Loan, 6.50%, | ||||
| 4/16/21 | United States | 35,490,400 | 35,345,990 | |
| k Prescrix Inc., Second Lien Facility, 9.25%, 4/30/22 | United States | 5,969,191 | 5,978,521 | |
| Surgery Centers Holdings Inc., Incremental Second Lien Term | ||||
| Loan, 9.75%, 4/10/20 | United States | 69,500 | 69,391 | |
| k Truven Health Analytics Inc., New Tranche B Term Loan, | ||||
| 5.50%, 6/06/19 | United States | 10,195,065 | 10,137,718 | |
| k U.S. Renal Care Inc., Tranche B-2 Term Loan, 4.25%, | ||||
| 7/03/19 | United States | 22,428,989 | 22,457,025 | |
| 183,789,939 | ||||
| Household & Personal Products 0.7% | ||||
| k FGI Operating Co. LLC (Freedom Group), Term B Loans, | ||||
| 5.50%, 4/19/19 | United States | 31,754,701 | 32,191,328 | |
| Otter Products LLC, Loans, 5.25%, 4/29/19 | United States | 28,086,996 | 28,098,708 | |
| Sun Products Corp., Tranche B Term Loan, 3.25%, 3/23/20 | United States | 1,331,171 | 1,286,244 | |
| 61,576,280 | ||||
| Insurance 0.0%† | ||||
| k HUB International Ltd., Initial Term Loan, 5.50%, 10/02/20 | United States | 4,146,500 | 4,144,945 | |
| Materials 2.6% | ||||
| k American Rock Salt Co. LLC, Initial Loan, 6.00%, 4/25/17 | United States | 24,101,741 | 24,154,475 | |
| Arysta Lifescience SPC LLC, | ||||
| Initial Term Loan, 4.50%, 5/29/20 | United States | 32,088,171 | 32,087,914 | |
| Second Lien Initial Term Loan, 8.25%, 11/30/20 | United States | 30,729,712 | 31,401,925 | |
| k Atkore International Inc., Second Lien Initial Term Loan, | ||||
| 9.00%, 10/09/21 | United States | 1,941,300 | 1,949,793 | |
| Axalta Coating Systems U.S. Holdings Inc., 2014 Specified | ||||
| Refinancing Term, 4.00%, 2/01/20 | United States | 14,923,713 | 14,904,028 | |
Annual Report | 35
| Franklin Strategic Series | |||||
| Statement of Investments, April 30, 2014 (continued) | |||||
| Franklin Strategic Income Fund | Country | Principal Amount* | Value | ||
| f,jSenior Floating Rate Interests (continued) | |||||
| Materials (continued) | |||||
| Caraustar Industries Inc., Initial Term Loan, 7.50%, 5/01/19 | United States | 3,048,069 | $ | 3,096,649 | |
| Exopack Holdings SA, USD Term Loan, 5.25%, 5/08/19 | Luxembourg | 5,100,137 | 5,157,514 | ||
| FMG America Finance Inc. (Fortescue Metals Group), Loans, | |||||
| 4.25%, 6/30/19 | United States | 15,545,286 | 15,556,214 | ||
| MacDermid Holdings LLC, First Lien Tranche B Term Loan, | |||||
| 4.00%, 6/07/20 | United States | 18,346,405 | 18,309,712 | ||
| k OCI Beaumont LLC, Term B-3 Loan, 5.00%, 8/20/19 | United States | 5,144,459 | 5,202,334 | ||
| Oxbow Carbon LLC, First Lien Tranche B Term Loan, 4.25%, | |||||
| 7/19/19 | United States | 6,870,731 | 6,892,202 | ||
| OXEA GmbH, Second Lien Term Loan, 8.25%, 7/15/20 | Luxembourg | 11,139,546 | 11,348,413 | ||
| Reynolds Group Holdings Inc., U.S. Term Loan, 4.00%, | |||||
| 12/01/18 | United States | 42,189,449 | 42,271,845 | ||
| Tronox Pigments (Netherlands) BV, Term Loan, 4.00%, | |||||
| 3/19/20 | Netherlands | 18,114,630 | 18,134,447 | ||
| 230,467,465 | |||||
| Media 1.4% | |||||
| k Cengage Learning Acquisitions Inc., Original Term Loans, | |||||
| 7.00%, 3/31/20 | United States | 32,693,536 | 33,196,199 | ||
| Cumulus Media Holdings Inc., Term Loans, 4.25%, | |||||
| 12/23/20 | United States | 15,404,327 | 15,404,327 | ||
| k NEP/NCP Holdco Inc., Second Lien Term Loan, 9.50%, | |||||
| 7/22/20 | United States | 5,918,932 | 6,085,402 | ||
| k Radio One Inc., Term Loan, 7.50%, 3/31/16 | United States | 4,560,163 | 4,634,266 | ||
| k William Morris Endeavor Entertainment LLC, | |||||
| Term Loans First Lien, 6.50%, 3/21/21 | United States | 46,451,489 | 46,428,264 | ||
| Term Loans Second Lien, 9.50%, 3/21/22 | United States | 15,931,764 | 16,086,111 | ||
| Zuffa LLC, Initial Term Loan, 3.75%, 2/25/20 | United States | 3,649,204 | 3,637,800 | ||
| 125,472,369 | |||||
| Pharmaceuticals, Biotechnology & Life Sciences 0.2% | |||||
| Valeant Pharmaceuticals International Inc., Series E-1 Tranche | |||||
| B Term Loan, 3.75%, 8/05/20 | Canada | 16,229,129 | 16,243,784 | ||
| Retailing 2.3% | |||||
| BJ’s Wholesale Club Inc., | |||||
| 2013 (Nov) Replacement Loans, 4.50%, 9/26/19 | United States | 36,234,546 | 36,244,619 | ||
| k Second Lien 2013 (Nov) Replacement Loans, 8.50%, | |||||
| 3/26/20 | United States | 25,278,297 | 25,844,810 | ||
| Evergreen AcqCo. 1 LP (Savers), Term Loan, 5.00%, | |||||
| 7/09/19 | United States | 20,179,087 | 20,246,344 | ||
| Harbor Freight Tools USA Inc., Loans, 4.75%, 7/26/19 | United States | 9,544,912 | 9,590,203 | ||
| k The Men’s Wearhouse Inc., Term Loan B, 5.75%, 4/15/21 | United States | 14,278,400 | 14,258,767 | ||
| The Neiman Marcus Group Ltd. Inc., Other Term Loan, 4.25%, | |||||
| 10/25/20 | United States | 8,046,400 | 8,039,697 | ||
| Party City Holdings Inc., 2014 Replacement Term Loan, | |||||
| 4.00%, 7/27/19 | United States | 24,314,125 | 24,260,950 | ||
| k Sears Roebuck Acceptance Corp., Term Loan, 5.50%, | |||||
| 6/30/18 | United States | 42,129,041 | 42,516,333 | ||
36 | Annual Report
| Franklin Strategic Series | |||||
| Statement of Investments, April 30, 2014 (continued) | |||||
| Franklin Strategic Income Fund | Country | Principal Amount* | Value | ||
| f,jSenior Floating Rate Interests (continued) | |||||
| Retailing (continued) | |||||
| Sungard Availability Services Capital Inc., Tranche B Term Loan, | |||||
| 6.00%, 3/31/19 | United States | 19,681,085 | $ | 19,582,680 | |
| 200,584,403 | |||||
| Software & Services 0.7% | |||||
| BMC Software Finance Inc., Initial U.S. Term Loans, 5.00%, | |||||
| 9/10/20 | United States | 28,313,659 | 28,304,826 | ||
| MoneyGram International Inc., Term Loan, 4.25%, 3/28/20 | United States | 28,365,788 | 27,763,015 | ||
| Vertafore Inc., Second Lien Term Loan, 9.75%, 10/27/17 | United States | 8,638,639 | 8,792,519 | ||
| 64,860,360 | |||||
| Technology Hardware & Equipment 0.4% | |||||
| Alcatel-Lucent USA Inc., U.S. Term Loan C (TLC), 4.50%, | |||||
| 1/30/19 | France | 13,143,873 | 13,167,151 | ||
| Dell International LLC, Term B Loan, 4.50%, 4/29/20 | United States | 11,252,807 | 11,226,239 | ||
| k Presidio Inc., Term Loan, 6.25%, 3/31/17 | United States | 7,566,521 | 7,613,812 | ||
| 32,007,202 | |||||
| Telecommunication Services 0.1% | |||||
| Intelsat Jackson Holdings SA, Tranche B-2 Term Loan, 3.75%, | |||||
| 6/30/19 | Luxembourg | 13,437,434 | 13,451,436 | ||
| Transportation 0.2% | |||||
| k Global Tip Finance BV/Finance America LLC, Facility C | |||||
| Commitment, 6.50%, 10/16/20 | United States | 16,672,657 | 16,464,249 | ||
| Total Senior Floating Rate Interests | |||||
| (Cost $1,273,083,951) | 1,277,021,825 | ||||
| Foreign Government and Agency Securities 20.3% | |||||
| Government of Canada, | |||||
| 2.25%, 8/01/14 | Canada | 4,385,000 | CAD | 4,014,132 | |
| 1.00%, 11/01/14 | Canada | 3,697,000 | CAD | 3,373,257 | |
| 2.00%, 12/01/14 | Canada | 8,878,000 | CAD | 8,149,567 | |
| 1.00%, 5/01/15 | Canada | 34,283,000 | CAD | 31,280,872 | |
| Government of Hungary, | |||||
| 7.75%, 8/24/15 | Hungary | 57,900,000 | HUF | 279,116 | |
| 5.50%, 2/12/16 | Hungary | 7,719,020,000 | HUF | 36,509,368 | |
| 5.50%, 12/22/16 | Hungary | 584,040,000 | HUF | 2,787,476 | |
| 4.125%, 2/19/18 | Hungary | 4,390,000 | 4,521,700 | ||
| 6.50%, 6/24/19 | Hungary | 721,600,000 | HUF | 3,573,278 | |
| 7.50%, 11/12/20 | Hungary | 8,507,000,000 | HUF | 44,203,130 | |
| 5.375%, 2/21/23 | Hungary | 16,250,000 | 16,997,094 | ||
| A, 8.00%, 2/12/15 | Hungary | 183,720,000 | HUF | 865,903 | |
| A, 6.75%, 11/24/17 | Hungary | 1,955,920,000 | HUF | 9,711,551 | |
| A, 5.50%, 12/20/18 | Hungary | 426,500,000 | HUF | 2,034,078 | |
| A, 7.00%, 6/24/22 | Hungary | 11,570,000 | HUF | 58,780 | |
| A, 6.00%, 11/24/23 | Hungary | 1,015,870,000 | HUF | 4,876,245 | |
| D, 6.75%, 8/22/14 | Hungary | 890,000,000 | HUF | 4,074,685 | |
| senior note, 6.25%, 1/29/20 | Hungary | 21,690,000 | 24,062,344 | ||
| senior note, 6.375%, 3/29/21 | Hungary | 14,820,000 | 16,533,563 | ||
| senior note, 5.75%, 11/22/23 | Hungary | 5,000,000 | 5,337,500 | ||
| Annual Report | 37 | |||||
| Franklin Strategic Series | |||||
| Statement of Investments, April 30, 2014 (continued) | |||||
| Franklin Strategic Income Fund | Country | Principal Amount* | Value | ||
| Foreign Government and Agency Securities (continued) | |||||
| Government of Indonesia, | |||||
| FR26, 11.00%, 10/15/14 | Indonesia | 4,500,000,000 | IDR | $ | 398,202 |
| FR28, 10.00%, 7/15/17 | Indonesia | 10,200,000,000 | IDR | 948,530 | |
| FR34, 12.80%, 6/15/21 | Indonesia | 169,210,000,000 | IDR | 18,532,387 | |
| FR36, 11.50%, 9/15/19 | Indonesia | 35,400,000,000 | IDR | 3,574,692 | |
| FR39, 11.75%, 8/15/23 | Indonesia | 29,150,000,000 | IDR | 3,107,501 | |
| FR44, 10.00%, 9/15/24 | Indonesia | 8,340,000,000 | IDR | 810,628 | |
| Government of Ireland, | |||||
| 5.90%, 10/18/19 | Ireland | 9,393,000 | EUR | 16,074,422 | |
| 4.50%, 4/18/20 | Ireland | 1,390,000 | EUR | 2,231,612 | |
| 5.00%, 10/18/20 | Ireland | 26,083,000 | EUR | 43,107,636 | |
| senior bond, 5.40%, 3/13/25 | Ireland | 15,868,580 | EUR | 26,868,718 | |
| Government of Malaysia, | |||||
| 3.434%, 8/15/14 | Malaysia | 77,675,000 | MYR | 23,841,761 | |
| 3.741%, 2/27/15 | Malaysia | 115,230,000 | MYR | 35,531,457 | |
| 3.835%, 8/12/15 | Malaysia | 32,480,000 | MYR | 10,045,156 | |
| 4.72%, 9/30/15 | Malaysia | 72,594,000 | MYR | 22,733,882 | |
| 3.197%, 10/15/15 | Malaysia | 27,690,000 | MYR | 8,493,297 | |
| senior bond, 4.24%, 2/07/18 | Malaysia | 64,800,000 | MYR | 20,400,331 | |
| senior note, 3.172%, 7/15/16 | Malaysia | 120,000,000 | MYR | 36,711,724 | |
| Government of Mexico, | |||||
| 7.00%, 6/19/14 | Mexico | 2,187,000mMXN | 16,794,431 | ||
| 9.50%, 12/18/14 | Mexico | 3,566,870mMXN | 28,280,105 | ||
| 6.00%, 6/18/15 | Mexico | 94,510mMXN | 740,595 | ||
| 8.00%, 12/17/15 | Mexico | 5,837,850mMXN | 47,492,777 | ||
| 6.25%, 6/16/16 | Mexico | 1,778,270mMXN | 14,201,371 | ||
| 7.25%, 12/15/16 | Mexico | 8,765,870mMXN | 71,961,659 | ||
| Government of Poland, | |||||
| 5.50%, 4/25/15 | Poland | 31,255,000 | PLN | 10,594,489 | |
| 6.25%, 10/24/15 | Poland | 70,991,000 | PLN | 24,606,643 | |
| 5.00%, 4/25/16 | Poland | 11,250,000 | PLN | 3,862,464 | |
| 4.75%, 10/25/16 | Poland | 265,000,000 | PLN | 91,136,451 | |
| 5.75%, 9/23/22 | Poland | 23,880,000 | PLN | 8,872,012 | |
| f FRN, 2.72%, 1/25/17 | Poland | 7,098,000 | PLN | 2,339,542 | |
| f FRN, 2.72%, 1/25/21 | Poland | 7,201,000 | PLN | 2,336,706 | |
| Strip, 7/25/14 | Poland | 3,190,000 | PLN | 1,048,099 | |
| Strip, 7/25/15 | Poland | 38,982,000 | PLN | 12,459,429 | |
| Strip, 1/25/16 | Poland | 67,525,000 | PLN | 21,235,836 | |
| d Government of Russia, senior bond, 144A, 7.50%, 3/31/30 | Russia | 12,020,380 | 13,415,345 | ||
| d Government of Serbia, senior note, 144A, | |||||
| 4.875%, 2/25/20 | Serbia | 29,400,000 | 29,289,750 | ||
| 7.25%, 9/28/21 | Serbia | 16,990,000 | 18,971,968 | ||
| Government of Singapore, senior note, | |||||
| 3.625%, 7/01/14 | Singapore | 21,250,000 | SGD | 17,045,073 | |
| 1.125%, 4/01/16 | Singapore | 39,000,000 | SGD | 31,505,286 | |
| Government of Sri Lanka, | |||||
| A, 11.25%, 7/15/14 | Sri Lanka | 528,200,000 | LKR | 4,076,569 | |
| A, 11.75%, 3/15/15 | Sri Lanka | 3,490,000 | LKR | 27,748 | |
| A, 6.50%, 7/15/15 | Sri Lanka | 86,940,000 | LKR | 660,439 | |
| A, 11.00%, 8/01/15 | Sri Lanka | 601,300,000 | LKR | 4,807,155 | |
| 38 | Annual Report | |||||
| Franklin Strategic Series | ||||||
| Statement of Investments, April 30, 2014 (continued) | ||||||
| Franklin Strategic Income Fund | Country | Principal Amount* | Value | |||
| Foreign Government and Agency Securities (continued) | ||||||
| Government of Sri Lanka, (continued) | ||||||
| A, 6.40%, 8/01/16 | Sri Lanka | 48,100,000 | LKR | $ | 359,172 | |
| A, 8.00%, 11/15/18 | Sri Lanka | 198,900,000 | LKR | 1,473,320 | ||
| A, 9.00%, 5/01/21 | Sri Lanka | 220,720,000 | LKR | 1,616,608 | ||
| B, 6.60%, 6/01/14 | Sri Lanka | 24,400,000 | LKR | 186,741 | ||
| B, 6.40%, 10/01/16 | Sri Lanka | 45,400,000 | LKR | 336,411 | ||
| B, 8.50%, 7/15/18 | Sri Lanka | 54,290,000 | LKR | 410,684 | ||
| C, 8.50%, 4/01/18 | Sri Lanka | 24,240,000 | LKR | 184,049 | ||
| D, 8.50%, 6/01/18 | Sri Lanka | 162,140,000 | LKR | 1,230,006 | ||
| Government of Sweden, 6.75%, 5/05/14 | Sweden | 1,020,860,000 | SEK | 156,995,002 | ||
| Government of the Philippines, | ||||||
| senior bond, 7.00%, 1/27/16 | Philippines | 154,290,000 | PHP | 3,674,764 | ||
| senior bond, 9.125%, 9/04/16 | Philippines | 41,860,000 | PHP | 1,048,974 | ||
| senior note, 1.625%, 4/25/16 | Philippines | 867,450,000 | PHP | 19,170,984 | ||
| d Government of Ukraine, | ||||||
| 144A, 9.25%, 7/24/17 | Ukraine | 10,720,000 | 9,694,900 | |||
| 144A, 7.75%, 9/23/20 | Ukraine | 25,000,000 | 21,242,000 | |||
| senior bond, 144A, 7.80%, 11/28/22 | Ukraine | 26,860,000 | 22,595,975 | |||
| senior note, 144A, 6.75%, 11/14/17 | Ukraine | 900,000 | 767,250 | |||
| senior note, 144A, 7.95%, 2/23/21 | Ukraine | 13,970,000 | 11,970,544 | |||
| senior note, 144A, 7.50%, 4/17/23 | Ukraine | 24,915,000 | 20,956,629 | |||
| n Government of Uruguay, senior bond, Index Linked, 4.375%, | ||||||
| 12/15/28 | Uruguay | 1,679,845,207 | UYU | 78,317,403 | ||
| Korea Monetary Stabilization Bond, | ||||||
| senior bond, 2.47%, 4/02/15 | South Korea | 58,588,400,000 | KRW | 56,615,418 | ||
| senior bond, 2.80%, 8/02/15 | South Korea | 29,565,730,000 | KRW | 28,651,685 | ||
| senior bond, 2.81%, 10/02/15 | South Korea | 1,911,000,000 | KRW | 1,851,722 | ||
| senior note, 3.28%, 6/02/14 | South Korea | 15,790,650,000 | KRW | 15,293,025 | ||
| senior note, 2.82%, 8/02/14 | South Korea | 4,726,000,000 | KRW | 4,577,212 | ||
| senior note, 2.78%, 10/02/14 | South Korea | 18,849,700,000 | KRW | 18,258,264 | ||
| senior note, 2.84%, 12/02/14 | South Korea | 9,106,970,000 | KRW | 8,826,136 | ||
| senior note, 2.74%, 2/02/15 | South Korea | 6,249,720,000 | KRW | 6,053,874 | ||
| senior note, 2.76%, 6/02/15 | South Korea | 31,746,600,000 | KRW | 30,756,589 | ||
| Korea Treasury Bond, | ||||||
| senior bond, 3.50%, 6/10/14 | South Korea | 23,735,250,000 | KRW | 22,995,277 | ||
| senior note, 3.25%, 12/10/14 | South Korea | 7,058,110,000 | KRW | 6,857,414 | ||
| senior note, 3.25%, 6/10/15 | South Korea | 7,137,850,000 | KRW | 6,951,517 | ||
| senior note, 2.75%, 12/10/15 | South Korea | 19,650,740,000 | KRW | 19,022,586 | ||
| senior note, 3.00%, 12/10/16 | South Korea | 60,500,000,000 | KRW | 58,776,416 | ||
| Nota Do Tesouro Nacional, | ||||||
| 10.00%, 1/01/17 | Brazil | 125,850o BRL | 53,716,461 | |||
| p Index Linked, 6.00%, 5/15/15 | Brazil | 16,430o BRL | 18,096,975 | |||
| p Index Linked, 6.00%, 8/15/16 | Brazil | 4,799o BRL | 5,259,285 | |||
| p Index Linked, 6.00%, 8/15/18 | Brazil | 34,550o BRL | 37,503,029 | |||
| Uruguay Notas del Tesoro, | ||||||
| 10.50%, 3/21/15 | Uruguay | 80,790,000 | UYU | 3,353,557 | ||
| 10.25%, 8/22/15 | Uruguay | 395,600,000 | UYU | 16,113,357 | ||
| 9.50%, 1/27/16 | Uruguay | 50,700,000 | UYU | 2,003,772 | ||
| n 18, Index Linked, 2.25%, 8/23/17 | Uruguay | 113,190,084 | UYU | 4,602,646 | ||
| n Index Linked, 4.00%, 6/14/15 | Uruguay | 136,891,039 | UYU | 5,829,258 | ||
| Annual Report | 39 | ||||||
| Franklin Strategic Series | |||||
| Statement of Investments, April 30, 2014 (continued) | |||||
| Franklin Strategic Income Fund | Country | Principal Amount* | Value | ||
| Foreign Government and Agency Securities (continued) | |||||
| Uruguay Treasury Bill, | |||||
| q 8/29/14 | Uruguay | 91,376,000 | UYU | $ | 3,768,980 |
| Strip, 7/02/15 | Uruguay | 3,560,000 | UYU | 130,232 | |
| Strip, 8/20/15 | Uruguay | 445,261,000 | UYU | 16,013,552 | |
| Total Foreign Government and Agency Securities | |||||
| (Cost $1,763,443,357) | 1,778,527,172 | ||||
| U.S. Government and Agency Securities 1.7% | |||||
| U.S. Treasury Bond, | |||||
| 4.50%, 2/15/16 | United States | 10,000,000 | 10,749,800 | ||
| 4.50%, 5/15/17 | United States | 8,000,000 | 8,867,184 | ||
| 7.125%, 2/15/23 | United States | 3,000,000 | 4,107,657 | ||
| 6.25%, 8/15/23 | United States | 4,000,000 | 5,240,780 | ||
| 6.875%, 8/15/25 | United States | 1,000,000 | 1,403,906 | ||
| 5.25%, 2/15/29 | United States | 1,750,000 | 2,209,921 | ||
| U.S. Treasury Note, | |||||
| 4.25%, 11/15/14 | United States | 700,000 | 715,818 | ||
| 2.375%, 3/31/16 | United States | 24,000,000 | 24,922,968 | ||
| 4.75%, 8/15/17 | United States | 7,000,000 | 7,848,750 | ||
| 3.875%, 5/15/18 | United States | 22,000,000 | 24,216,324 | ||
| 3.75%, 11/15/18 | United States | 39,000,000 | 42,855,813 | ||
| n Index Linked, 0.125%, 4/15/16 | United States | 9,571,746 | 9,850,676 | ||
| n Index Linked, 0.625%, 7/15/21 | United States | 10,415,662 | 10,815,197 | ||
| Total U.S. Government and Agency Securities | |||||
| (Cost $149,213,653) | 153,804,794 | ||||
| Asset-Backed Securities and Commercial | |||||
| Mortgage-Backed Securities 5.0% | |||||
| Banks 3.5% | |||||
| Banc of America Commercial Mortgage Trust, 2006-4, AJ, | |||||
| 5.695%, 7/10/46 | United States | 24,537,000 | 25,849,693 | ||
| Bear Stearns Commercial Mortgage Securities Inc., | |||||
| f 2006-PW11, AJ, FRN, 5.441%, 3/11/39 | United States | 19,604,000 | 20,646,541 | ||
| f 2006-PW12, AJ, FRN, 5.75%, 9/11/38 | United States | 20,666,000 | 21,424,236 | ||
| 2006-PW13, AJ, 5.611%, 9/11/41 | United States | 30,225,000 | 31,456,926 | ||
| f 2007-PW16, AM, FRN, 5.707%, 6/11/40 | United States | 4,680,000 | 5,226,418 | ||
| Bear Stearns Commercial Mortgage Securities Trust, | |||||
| 2007-PW15, A4, 5.331%, 2/11/44 | United States | 1,488,403 | 1,614,737 | ||
| Citigroup Commercial Mortgage Trust, | |||||
| 2006-C5, AJ, 5.482%, 10/15/49 | United States | 23,850,000 | 23,974,115 | ||
| f 2007-C6, AM, FRN, 5.71%, 6/10/17 | United States | 25,650,000 | 28,336,812 | ||
| f Citigroup/Deutsche Bank Commercial Mortgage Trust, | |||||
| 2006-CD3, AJ, FRN, 5.688%, 10/15/48 | United States | 21,795,000 | 20,999,822 | ||
| Countrywide Asset-Backed Certificates, 2005-11, AF4, | |||||
| 5.192%, 3/25/34 | United States | 2,800,000 | 2,239,216 | ||
| Greenwich Capital Commercial Funding Corp., | |||||
| f 2006-GG7, AJ, FRN, 5.82%, 7/10/38 | United States | 24,320,000 | 25,322,434 | ||
| 2007-GG9, A4, 5.444%, 3/10/39 | United States | 12,365,000 | 13,543,496 | ||
| 2007-GG9, AM, 5.475%, 3/10/39 | United States | 6,165,000 | 6,653,527 | ||
| 40 | Annual Report | |||||
| Franklin Strategic Series | ||||||
| Statement of Investments, April 30, 2014 (continued) | ||||||
| Franklin Strategic Income Fund | Country | Principal Amount* | Value | |||
| Asset-Backed Securities and Commercial | ||||||
| Mortgage-Backed Securities (continued) | ||||||
| Banks (continued) | ||||||
| JPMorgan Chase Commercial Mortgage Securities Corp., | ||||||
| 2006-CB17, AM, 5.464%, 12/12/43 | United States | 6,840,000 | $ | 7,227,151 | ||
| f 2006-LDP7, AJ, FRN, 5.873%, 4/15/45 | United States | 15,080,000 | 15,579,736 | |||
| f LB-UBS Commercial Mortgage Trust, 2006-C4, AM, FRN, | ||||||
| 5.855%, 6/15/38 | United States | 9,280,000 | 10,123,413 | |||
| f Merrill Lynch Mortgage Trust, 2005-CKI1, AJ, FRN, 5.281%, | ||||||
| 11/12/37 | United States | 2,875,000 | 3,026,865 | |||
| f Morgan Stanley Capital I Trust, | ||||||
| 2006-HQ8, AJ, FRN, 5.497%, 3/12/44 | United States | 7,045,000 | 7,228,720 | |||
| 2007-IQ16, AM, FRN, 6.099%, 12/12/49 | United States | 11,777,000 | 13,286,970 | |||
| 2007-IQ16, AMA, FRN, 6.094%, 12/12/49 | United States | 12,415,000 | 13,973,989 | |||
| Wells Fargo Mortgage Backed Securities Trust, | ||||||
| f 04-W, A9, FRN, 2.762%, 11/25/34 | United States | 4,111,189 | 4,260,760 | |||
| 2007-3, 3A1, 5.50%, 4/25/37 | United States | 1,448,382 | 1,502,500 | |||
| 303,498,077 | ||||||
| Diversified Financials 1.5% | ||||||
| d,f ARES CLO Funds, 2007-12A, B, 144A, FRN, 1.235%, | ||||||
| 11/25/20 | United States | 3,840,000 | 3,728,256 | |||
| d,f Atrium CDO Corp., 10A, C, 144A, FRN, 2.829%, 7/16/25 | United States | 13,950,000 | 13,694,715 | |||
| d,f Catamaran CLO Ltd., 2013-1A, C, 144A, FRN, 2.828%, | ||||||
| 1/27/25 | Cayman Islands | 11,250,000 | 10,918,226 | |||
| d,f Cent CDO Ltd., 2007-15A, A2B, 144A, FRN, 0.576%, | ||||||
| 3/11/21 | United States | 3,881,000 | 3,642,031 | |||
| d,f Cent CLO LP, 2013-17A, D, 144A, FRN, 3.236%, 1/30/25 | Cayman Islands | 7,450,980 | 7,458,237 | |||
| d,f CIFC Funding Ltd., 2007-3A, A1J, 144A, FRN, 0.628%, | ||||||
| 7/26/21 | United States | 5,130,000 | 4,892,994 | |||
| d,f Columbus Nova CLO Ltd., 2007-2A, A2, 144A, FRN, | ||||||
| 1.227%, 10/15/21 | United States | 2,680,000 | 2,607,495 | |||
| d,f CT CDO IV Ltd., 2006-4A, A1, 144A, FRN, 0.462%, | ||||||
| 10/20/43 | United States | 11,080,511 | 10,775,797 | |||
| d G | -Force LLC, 2005-RRA, C, 144A, 5.20%, 8/22/36 | United States | 11,144,000 | 10,359,463 | ||
| d,f Gleneagles CLO Ltd., 2005-1A, A2, 144A, FRN, 0.638%, | ||||||
| 11/01/17 | United States | 8,002,000 | 7,833,910 | |||
| d,f ING Investment Management CLO Ltd., | ||||||
| 2013-1A, B, 144A, FRN, 3.127%, 4/15/24 | Cayman Islands | 2,740,000 | 2,736,712 | |||
| 2013-1A, C, 144A, FRN, 3.727%, 4/15/24 | Cayman Islands | 4,440,000 | 4,301,472 | |||
| 2013-2A, B, 144A, FRN, 2.909%, 4/25/25 | United States | 10,770,000 | 10,655,569 | |||
| d,f Newcastle CDO Ltd., 2004-5A, 1, 144A, FRN, 0.574%, | ||||||
| 12/24/39 | United States | 6,589,897 | 6,382,341 | |||
| Residential Asset Securities Corp., 2004-KS1, AI4, 4.213%, | ||||||
| 4/25/32 | United States | 78,183 | 78,168 | |||
| f,r Talisman 6 Finance, Reg S, FRN, 0.507%, 10/22/16 | Ireland | 13,739,515 | EUR | 18,368,550 | ||
| d,f Westchester CLO Ltd., 2007-1A, A1A, 144A, FRN, 0.463%, | ||||||
| 8/01/22 | United States | 13,563,100 | 13,332,174 | |||
| Total Asset-Backed Securities and Commercial | 131,766,110 | |||||
| Mortgage-Backed Securities | ||||||
| (Cost $416,646,821) | 435,264,187 | |||||
| Annual Report | 41 | ||||||
| Franklin Strategic Series | ||||
| Statement of Investments, April 30, 2014 (continued) | ||||
| Franklin Strategic Income Fund | Country | Principal Amount* | Value | |
| Mortgage-Backed Securities 4.5% | ||||
| f Federal Home Loan Mortgage Corp. (FHLMC) | ||||
| Adjustable Rate 0.0%† | ||||
| FHLMC, 2.348%, 1/01/33 | United States | 123,202 | $ | 130,827 |
| Federal Home Loan Mortgage Corp. (FHLMC) Fixed Rate 0.7% | ||||
| FHLMC Gold 15 Year, 4.50%, 10/01/18 - 9/01/19 | United States | 938,662 | 996,496 | |
| FHLMC Gold 15 Year, 5.00%, 12/01/17 - 7/01/22 | United States | 1,209,029 | 1,291,818 | |
| FHLMC Gold 15 Year, 5.50%, 7/01/17 - 2/01/19 | United States | 142,082 | 151,089 | |
| FHLMC Gold 30 Year, 3.00%, 11/01/42 - 4/01/43 | United States | 30,755,887 | 30,037,760 | |
| FHLMC Gold 30 Year, 3.50%, 4/01/42 - 5/01/43 | United States | 4,094,985 | 4,162,723 | |
| FHLMC Gold 30 Year, 4.00%, 9/01/40 - 1/01/41 | United States | 14,134,525 | 14,821,589 | |
| FHLMC Gold 30 Year, 4.50%, 10/01/40 | United States | 493,967 | 531,543 | |
| FHLMC Gold 30 Year, 5.00%, 5/01/27 - 2/01/38 | United States | 4,196,672 | 4,609,651 | |
| FHLMC Gold 30 Year, 5.50%, 6/01/33 - 6/01/36 | United States | 2,716,297 | 3,023,715 | |
| FHLMC Gold 30 Year, 6.00%, 6/01/33 - 6/01/37 | United States | 1,128,644 | 1,268,542 | |
| FHLMC Gold 30 Year, 6.50%, 10/01/21 - 6/01/36 | United States | 590,932 | 665,579 | |
| FHLMC Gold 30 Year, 7.00%, 9/01/21 - 8/01/32 | United States | 61,778 | 67,292 | |
| FHLMC Gold 30 Year, 7.50%, 1/01/26 - 1/01/31 | United States | 12,808 | 14,755 | |
| FHLMC Gold 30 Year, 8.00%, 11/01/25 - 1/01/26 | United States | 288 | 303 | |
| FHLMC Gold 30 Year, 9.00%, 12/01/24 | United States | 169 | 196 | |
| 61,643,051 | ||||
| f Federal National Mortgage Association (FNMA) | ||||
| Adjustable Rate 0.0%† | ||||
| FNMA, 2.31%, 12/01/34 | United States | 342,990 | 365,351 | |
| FNMA, 2.33%, 4/01/20 | United States | 89,835 | 93,052 | |
| 458,403 | ||||
| Federal National Mortgage Association (FNMA) Fixed Rate 3.5% | ||||
| FNMA 15 Year, 2.50%, 7/01/27 | United States | 704,098 | 712,102 | |
| FNMA 15 Year, 3.00%, 11/01/26 - 8/01/28 | United States | 80,547,816 | 83,362,842 | |
| FNMA 15 Year, 3.00%, 8/01/28 - 9/01/28 | United States | 17,790,481 | 18,403,337 | |
| FNMA 15 Year, 3.50%, 1/01/26 | United States | 471,268 | 497,391 | |
| FNMA 15 Year, 4.50%, 3/01/20 | United States | 177,079 | 188,398 | |
| FNMA 15 Year, 5.00%, 1/01/18 - 6/01/18 | United States | 234,861 | 249,745 | |
| FNMA 15 Year, 5.50%, 6/01/14 - 4/01/22 | United States | 2,393,572 | 2,549,715 | |
| FNMA 15 Year, 6.00%, 7/01/16 - 10/01/16 | United States | 10,703 | 11,026 | |
| FNMA 15 Year, 7.50%, 10/01/14 | United States | 115 | 116 | |
| FNMA 30 Year, 3.00%, 1/01/28 - 5/01/43 | United States | 51,419,882 | 50,331,780 | |
| FNMA 30 Year, 3.50%, 5/01/43 | United States | 19,136,658 | 19,476,947 | |
| FNMA 30 Year, 4.00%, 11/01/40 - 8/01/43 | United States | 83,365,701 | 87,454,037 | |
| FNMA 30 Year, 4.00%, 8/01/43 | United States | 14,523,928 | 15,246,949 | |
| FNMA 30 Year, 4.50%, 3/01/28 - 2/01/41 | United States | 1,311,473 | 1,411,243 | |
| FNMA 30 Year, 5.00%, 9/01/23 - 1/01/42 | United States | 14,422,534 | 15,898,165 | |
| FNMA 30 Year, 5.50%, 9/01/33 - 7/01/38 | United States | 5,605,010 | 6,228,389 | |
| FNMA 30 Year, 6.00%, 6/01/34 - 5/01/38 | United States | 6,454,142 | 7,236,445 | |
| FNMA 30 Year, 6.50%, 3/01/28 - 10/01/37 | United States | 1,334,385 | 1,503,280 | |
| FNMA 30 Year, 7.50%, 10/01/29 | United States | 12,904 | 15,380 | |
42 | Annual Report
| Franklin Strategic Series | ||||
| Statement of Investments, April 30, 2014 (continued) | ||||
| Franklin Strategic Income Fund | Country | Principal Amount* | Value | |
| Mortgage-Backed Securities (continued) | ||||
| Federal National Mortgage Association (FNMA) | ||||
| Fixed Rate (continued) | ||||
| FNMA 30 Year, 8.00%, 1/01/25 - 5/01/26 | United States | 6,585 | $ | 7,717 |
| FNMA 30 Year, 8.50%, 7/01/25 | United States | 591 | 616 | |
| 310,785,620 | ||||
| Government National Mortgage Association (GNMA) | ||||
| Fixed Rate 0.3% | ||||
| GNMA I SF 30 Year, 5.00%, 6/15/34 - 7/15/34 | United States | 373,956 | 414,835 | |
| GNMA I SF 30 Year, 5.50%, 2/15/33 - 6/15/36 | United States | 1,018,774 | 1,141,417 | |
| GNMA I SF 30 Year, 6.00%, 8/15/36 | United States | 104,886 | 120,478 | |
| GNMA I SF 30 Year, 6.50%, 12/15/28 - 3/15/32 | United States | 73,092 | 82,710 | |
| GNMA I SF 30 Year, 7.00%, 11/15/27 - 5/15/28 | United States | 32,764 | 36,398 | |
| GNMA I SF 30 Year, 7.50%, 9/15/23 - 5/15/27 | United States | 4,529 | 5,115 | |
| GNMA I SF 30 Year, 8.00%, 2/15/25 - 9/15/27 | United States | 6,837 | 7,780 | |
| GNMA I SF 30 Year, 8.50%, 8/15/24 | United States | 93 | 106 | |
| GNMA I SF 30 Year, 9.00%, 1/15/25 | United States | 362 | 364 | |
| GNMA I SF 30 Year, 9.50%, 6/15/25 | United States | 593 | 597 | |
| GNMA II SF 30 Year, 3.50%, 4/20/42 | United States | 19,774,256 | 20,383,828 | |
| GNMA II SF 30 Year, 5.00%, 9/20/33 - 11/20/33 | United States | 568,815 | 631,785 | |
| GNMA II SF 30 Year, 5.50%, 6/20/34 | United States | 282,652 | 322,002 | |
| GNMA II SF 30 Year, 6.00%, 11/20/34 | United States | 247,400 | 285,007 | |
| GNMA II SF 30 Year, 6.50%, 7/20/28 - 12/20/31 | United States | 132,310 | 151,840 | |
| GNMA II SF 30 Year, 7.50%, 8/20/16 - 4/20/32 | United States | 32,853 | 36,847 | |
| 23,621,109 | ||||
| Total Mortgage-Backed Securities | ||||
| (Cost $398,385,135) | 396,639,010 | |||
| Municipal Bonds 5.8% | ||||
| Arkansas State GO, Four-Lane Highway Construction and | ||||
| Improvement Bonds, 3.25%, 6/15/22 | United States | 16,000,000 | 16,841,120 | |
| California State GO, | ||||
| Build America Bonds, Various Purpose, 7.625%, 3/01/40 | United States | 6,200,000 | 8,814,788 | |
| Various Purpose, 6.00%, 4/01/38 | United States | 10,000,000 | 11,742,400 | |
| Various Purpose, 6.00%, 11/01/39 | United States | 1,000,000 | 1,190,900 | |
| Various Purpose, 5.25%, 11/01/40 | United States | 3,375,000 | 3,750,334 | |
| Various Purpose, 7.60%, 11/01/40 | United States | 15,000,000 | 21,581,100 | |
| Various Purpose, Refunding, 5.25%, 3/01/38 | United States | 7,220,000 | 7,815,794 | |
| Various Purpose, Refunding, 5.00%, 4/01/38 | United States | 20,000,000 | 21,578,200 | |
| Various Purpose, Refunding, NATL Insured, 4.50%, | ||||
| 12/01/32 | United States | 1,815,000 | 1,878,688 | |
| Various Purpose, Refunding, Series 1, AGMC Insured, | ||||
| 4.75%, 9/01/31 | United States | 1,755,000 | 1,824,217 | |
| Colorado State ISD, GO, Mitchell and Scurry Counties, School | ||||
| Building, PSF Guarantee, 5.00%, 8/15/43 | United States | 3,105,000 | 3,401,496 | |
| Evansville Local Public Improvement Bond Bank Revenue, | ||||
| Sewage Works Project, Series A, 5.00%, 7/01/36 | United States | 6,320,000 | 6,858,654 | |
| Florida Hurricane Catastrophe Fund Finance Corp. Revenue, | ||||
| Series A, 2.995%, 7/01/20 | United States | 30,000,000 | 30,076,500 | |
| Hawaii State GO, Series EH, 5.00%, 8/01/30 | United States | 6,500,000 | 7,468,370 | |
| Annual Report | 43 | ||||
| Franklin Strategic Series | |||||
| Statement of Investments, April 30, 2014 (continued) | |||||
| Franklin Strategic Income Fund | Country | Principal Amount* | Value | ||
| Municipal Bonds (continued) | |||||
| Illinois State GO, | |||||
| 5.877%, 3/01/19 | United States | 20,000,000 | $ | 22,512,800 | |
| Build America Bonds, 7.35%, 7/01/35 | United States | 8,000,000 | 9,564,960 | ||
| Kansas State Development Finance Authority Revenue, Wichita | |||||
| State University Union Corp. Student Housing Project, | |||||
| Refunding, Series F-1, | |||||
| 5.25%, 6/01/38 | United States | 5,725,000 | 6,161,875 | ||
| 5.25%, 6/01/42 | United States | 5,800,000 | 6,220,442 | ||
| 5.00%, 6/01/46 | United States | 6,800,000 | 7,087,436 | ||
| Marco Island Utility System Revenue, Refunding, 4.625%, | |||||
| 10/01/30 | United States | 2,800,000 | 3,015,600 | ||
| 10/01/31 | United States | 2,500,000 | 2,676,050 | ||
| Massachusetts State GO, Consolidated Loan of 2014, Series A, | |||||
| 4.50%, 12/01/43 | United States | 18,300,000 | 19,074,456 | ||
| Metropolitan Boston Transit Parking Corp. Systemwide Parking | |||||
| Revenue, senior lien, 5.00%, 7/01/41 | United States | 4,250,000 | 4,531,053 | ||
| Minnesota State GO, Various Purpose, Refunding, Series F, | |||||
| 4.00%, 10/01/24 | United States | 21,400,000 | 24,037,122 | ||
| Mississippi State GO, Series B, 5.00%, 12/01/31 | United States | 7,300,000 | 8,375,874 | ||
| Nassau County GO, General Improvement Bonds, Series B, | |||||
| 5.00%, | |||||
| 4/01/39 | United States | 12,500,000 | 13,236,125 | ||
| 4/01/43 | United States | 13,000,000 | 13,647,270 | ||
| New Jersey EDA Revenue, School Facilities Construction, | |||||
| Refunding, Series NN, 5.00%, 3/01/30 | United States | 5,200,000 | 5,692,336 | ||
| New York City HDC Revenue, Series B1, 5.00%, 7/01/33 | United States | 3,500,000 | 3,791,060 | ||
| New York City Municipal Water Finance Authority Water and | |||||
| Sewer System Revenue, Second General Resolution, Fiscal | |||||
| 2014, Refunding, Series BB, 5.00%, 6/15/46 | United States | 22,685,000 | 24,384,107 | ||
| New York GO, Sub. Series G-1, 5.00%, 4/01/27 | United States | 14,000,000 | 15,851,920 | ||
| New York State Urban Development Corp. Revenue, State | |||||
| Personal Income Tax, General Purpose, Series C, 5.00%, | |||||
| 3/15/29 | United States | 19,500,000 | 22,124,505 | ||
| Puerto Rico Electric Power Authority Power Revenue, | |||||
| Series A, 6.75%, 7/01/36 | United States | 30,900,000 | 20,249,697 | ||
| Series XX, 5.25%, 7/01/40 | United States | 1,300,000 | 763,750 | ||
| Puerto Rico Sales Tax FICO Sales Tax Revenue, | |||||
| Capital Appreciation, Refunding, Series A, NATL Insured, | |||||
| zero cpn., 8/01/46 | United States | 6,000,000 | 712,440 | ||
| Capital Appreciation, Series A, zero cpn., 8/01/25 | United States | 6,480,000 | 2,697,430 | ||
| first subordinate, Series A, 5.75%, 8/01/37 | United States | 7,000,000 | 5,501,230 | ||
| first subordinate, Series A, 6.50%, 8/01/44 | United States | 18,300,000 | 15,365,595 | ||
| Refunding, Series A, NATL RE, FGIC Insured, zero cpn., | |||||
| 8/01/45 | United States | 25,700,000 | 3,289,600 | ||
| Refunding, Series B, 6.05%, 8/01/37 | United States | 9,150,000 | 7,623,231 | ||
| Refunding, Series B, 6.05%, 8/01/38 | United States | 11,230,000 | 9,279,574 | ||
| Red River Education Financing Corp. Education Revenue, | |||||
| Higher Education, Texas Christian University, 5.00%, 3/15/43 | United States | 4,900,000 | 5,247,214 | ||
| South Carolina State Public Service Authority Revenue, | |||||
| Refunding, Series B, 5.00%, 12/01/38 | United States | 7,200,000 | 7,744,032 | ||
| 44 | Annual Report | |||||
| Franklin Strategic Series | |||||
| Statement of Investments, April 30, 2014 (continued) | |||||
| Franklin Strategic Income Fund | Country | Principal Amount* | Value | ||
| Municipal Bonds (continued) | |||||
| University of California Revenues, General, Series AK, 5.00%, | |||||
| 5/15/48 | United States | 44,325,000 | $ | 53,628,817 | |
| Washington State GO, Various Purpose, | |||||
| Refunding, Series R-C, 5.00%, 7/01/24 | United States | 8,385,000 | 10,083,046 | ||
| Series D, 5.00%, 2/01/23 | United States | 7,400,000 | 8,797,268 | ||
| Total Municipal Bonds (Cost $482,165,145) | 507,790,476 | ||||
| Shares | |||||
| Escrows and Litigation Trusts 0.0% | |||||
| a,l Comfort Co. Inc., Escrow Account | United States | 63,156 | — | ||
| a,l NewPage Corp., Litigation Trust | United States | 14,000,000 | — | ||
| Total Escrows and Litigation Trusts (Cost $—) | — | ||||
| Total Investments before Short Term Investments | |||||
| (Cost $7,597,194,629) | 7,863,832,906 | ||||
| Principal Amount* | |||||
| Short Term Investments 10.4% | |||||
| f,j Senior Floating Rate Interests (Cost $1,538,600) 0.0%† | |||||
| k Altegrity Inc., Tranche B Term Loan, 5.00%, 2/21/15 | United States | 1,570,000 | 1,538,111 | ||
| Foreign Government and Agency Securities 2.1% | |||||
| q Bank of Negara Monetary Notes, 5/15/14 - 11/06/14 | Malaysia | 175,410,000 | MYR | 53,445,793 | |
| Government of Canada, | |||||
| 0.75%, 5/01/14 | Canada | 9,930,000 | CAD | 9,060,168 | |
| 1.00%, 2/01/15 | Canada | 4,500,000 | CAD | 4,106,555 | |
| q Hungary Treasury Bill, 6/25/14 | Hungary | 148,600,000 | HUF | 669,629 | |
| Korea Monetary Stabilization Bond, | |||||
| senior bond, 2.55%, 5/09/14 | South Korea | 6,495,900,000 | KRW | 6,287,762 | |
| senior bond, 2.72%, 9/09/14 | South Korea | 2,944,000,000 | KRW | 2,850,833 | |
| senior note, 2.57%, 6/09/14 | South Korea | 2,979,000,000 | KRW | 2,883,554 | |
| q Malaysia Treasury Bill, 5/30/14 | Malaysia | 2,600,000 | MYR | 795,102 | |
| q Philippine Treasury Bills, 7/02/14 - 11/05/14 | Philippines | 1,850,405,000 | PHP | 41,397,684 | |
| q Singapore Treasury Bills, 5/02/14 - 5/30/14 | Singapore | 76,883,000 | SGD | 61,325,239 | |
| q Uruguay Treasury Bill, 5/16/14 | Uruguay | 21,500,000 | UYU | 926,994 | |
| Total Foreign Government and Agency Securities | |||||
| (Cost $186,230,173) | 183,749,313 | ||||
| Total Investments before Money Market Funds | |||||
| (Cost $7,784,963,402) | 8,049,120,330 | ||||
| Shares | |||||
| Money Market Funds (Cost $725,462,930) 8.3% | |||||
| a,s Institutional Fiduciary Trust Money Market Portfolio | United States | 725,462,930 | 725,462,930 | ||
| Total Investments (Cost $8,510,426,332) 100.0% | 8,774,583,260 | ||||
| Other Assets, less Liabilities 0.0%† | 2,076,427 | ||||
| Net Assets 100.0% | $ | 8,776,659,687 | |||
Annual Report | 45
Franklin Strategic Series
Statement of Investments, April 30, 2014 (continued)
Franklin Strategic Income Fund
†Rounds to less than 0.1% of net assets.
*The principal amount is stated in U.S. dollars unless otherwise indicated.
aNon-income producing.
bAt April 30, 2014, pursuant to the Fund’s policies and the requirements of applicable securities law, the Fund may be restricted from trading these securities for a limited or
extended period of time due to ownership limits and/or potential possession of material non-public information.
cSee Note 1(f) regarding investment in FT Holdings Corporation II.
dSecurity was purchased pursuant to Rule 144A under the Securities Act of 1933 and may be sold in transactions exempt from registration only to qualified institutional buyers or in
a public offering registered under the Securities Act of 1933. These securities have been deemed liquid under guidelines approved by the Trust’s Board of Trustees. At April 30,
2014, the aggregate value of these securities was $1,652,503,621, representing 18.83% of net assets.
ePerpetual security with no stated maturity date.
fThe coupon rate shown represents the rate at period end.
gSee Note 1(e) regarding loan participation notes.
hIncome may be received in additional securities and/or cash.
iSee Note 7 regarding defaulted securities.
jSee Note 1(h) regarding senior floating rate interests.
kA portion or all of the security purchased on a delayed delivery basis. See Note 1(c).
lSecurity has been deemed illiquid because it may not be able to be sold within seven days. At April 30, 2014, the aggregate value of these securities was $1,160,988, representing
0.01% of net assets.
mPrincipal amount is stated in 100 Mexican Peso Units.
nPrincipal amount of security is adjusted for inflation. See Note 1(j).
oPrincipal amount is stated in 1,000 Brazilian Real Units.
pRedemption price at maturity is adjusted for inflation. See Note 1(j).
qThe security is traded on a discount basis with no stated coupon rate.
rSecurity was purchased pursuant to Regulation S under the Securities Act of 1933, which exempts from registration securities offered and sold outside of the United States. Such a
security cannot be sold in the United States without either an effective registration statement filed pursuant to the Securities Act of 1933, or pursuant to an exemption from regis-
tration. This security has been deemed liquid under guidelines approved by the Trust’s Board of Trustees. At April 30, 2014, the value of this security was $18,368,550, representing
0.21% of net assets.
sSee Note 3(f) regarding investments in the Institutional Fiduciary Trust Money Market Portfolio.
At April 30, 2014, the Fund had the following forward exchange contracts outstanding. See Note 1(d).
Forward Exchange Contracts
| Counter- | Contract | Settlement | Unrealized | Unrealized | |||||||
| Currency | partya | Type | Quantity | Amount | Date | Appreciation | Depreciation | ||||
| Euro | DBAB | Buy | 968,556 | $ | 1,339,222 | 5/05/14 | $ | 4,342 | $ | — | |
| Euro | DBAB | Sell | 968,556 | 1,281,883 | 5/05/14 | — | (61,681 | ) | |||
| Euro | DBAB | Buy | 3,815,920 | 5,276,273 | 5/06/14 | 17,094 | — | ||||
| Euro | DBAB | Sell | 3,815,920 | 5,000,000 | 5/06/14 | — | (293,367 | ) | |||
| Euro | DBAB | Buy | 2,526,241 | 3,493,034 | 5/07/14 | 11,308 | — | ||||
| Euro | DBAB | Sell | 2,526,241 | 3,322,490 | 5/07/14 | — | (181,852 | ) | |||
| Japanese Yen | DBAB | Buy | 2,136,365,000 | 20,873,131 | 5/07/14 | 29,509 | — | ||||
| Japanese Yen | DBAB | Sell | 2,136,365,000 | 22,000,000 | 5/07/14 | 1,097,359 | — | ||||
| British Pound | DBAB | Buy | 9,100,000 | 15,054,082 | 5/09/14 | 306,530 | — | ||||
| British Pound | DBAB | Sell | 9,100,000 | 14,071,330 | 5/09/14 | — | (1,289,282 | ) | |||
| Chilean Peso | DBAB | Buy | 6,734,000,000 | 13,702,309 | 5/09/14 | — | (1,778,703 | ) | |||
| Chilean Peso | DBAB | Sell | 6,734,000,000 | 11,975,814 | 5/09/14 | 52,207 | — |
46 | Annual Report
| Franklin Strategic Series | |||||||||||
| Statement of Investments, April 30, 2014 (continued) | |||||||||||
| Franklin Strategic Income Fund | |||||||||||
| Forward Exchange Contracts (continued) | |||||||||||
| Counter- | Contract | Settlement | Unrealized | Unrealized | |||||||
| Currency | partya | Type | Quantity | Amount | Date | Appreciation | Depreciation | ||||
| Euro | DBAB | Buy | 6,100,000 | $ | 8,432,893 | 5/09/14 | $ | 28,842 | $ | — | |
| Euro | DBAB | Sell | 6,100,000 | 8,007,775 | 5/09/14 | — | (453,960 | ) | |||
| Euro | DBAB | Sell | 3,090,000 | 4,086,834 | 5/12/14 | — | (199,489 | ) | |||
| Singapore Dollar | DBAB | Buy | 17,302,320 | 14,062,582 | 5/12/14 | — | (260,498 | ) | |||
| British Pound | DBAB | Buy | 2,062,985 | 3,180,505 | 5/15/14 | 301,606 | — | ||||
| British Pound | DBAB | Sell | 2,184,041 | 3,333,938 | 5/15/14 | — | (352,502 | ) | |||
| Euro | DBAB | Sell | 2,050,692 | 2,647,854 | 5/19/14 | — | (196,735 | ) | |||
| Euro | JPHQ | Sell | 855,033 | 1,105,481 | 5/23/14 | — | (80,555 | ) | |||
| Japanese Yen | DBAB | Sell | 1,008,700,000 | 10,000,000 | 5/28/14 | 129,368 | — | ||||
| Euro | GSCO | Sell | 800,000 | 1,031,480 | 5/30/14 | — | (78,199 | ) | |||
| Euro | DBAB | Sell | 3,488,331 | 4,539,365 | 6/05/14 | — | (299,217 | ) | |||
| Singapore Dollar | JPHQ | Buy | 18,544,500 | 14,751,810 | 6/05/14 | 41,168 | — | ||||
| Japanese Yen | BZWS | Sell | 527,610,000 | 5,421,605 | 6/10/14 | 258,285 | — | ||||
| Japanese Yen | HSBC | Sell | 561,900,000 | 5,808,833 | 6/10/14 | 309,943 | — | ||||
| Japanese Yen | JPHQ | Sell | 381,050,000 | 3,872,599 | 6/10/14 | 143,552 | — | ||||
| Japanese Yen | DBAB | Sell | 186,100,000 | 1,936,605 | 6/11/14 | 115,375 | — | ||||
| Japanese Yen | JPHQ | Sell | 520,600,000 | 5,421,584 | 6/11/14 | 326,836 | — | ||||
| Japanese Yen | JPHQ | Sell | 219,500,000 | 2,323,120 | 6/17/14 | 174,953 | — | ||||
| Singapore Dollar | DBAB | Buy | 3,982,600 | 3,173,386 | 6/18/14 | 3,559 | — | ||||
| Chilean Peso | DBAB | Buy | 2,426,750,000 | 4,721,304 | 6/19/14 | — | (444,188 | ) | |||
| Singapore Dollar | HSBC | Buy | 3,182,000 | 2,527,403 | 6/20/14 | 10,901 | — | ||||
| Euro | DBAB | Sell | 1,175,900 | 1,541,664 | 6/27/14 | — | (89,304 | ) | |||
| Euro | UBSW | Sell | 9,972,000 | 13,021,737 | 6/30/14 | — | (809,289 | ) | |||
| Japanese Yen | BZWS | Sell | 1,772,250,000 | 18,214,286 | 6/30/14 | 868,604 | — | ||||
| Japanese Yen | DBAB | Sell | 1,175,148,000 | 12,000,000 | 7/01/14 | 498,309 | — | ||||
| British Pound | DBAB | Sell | 825,578 | 1,230,359 | 7/07/14 | — | (162,547 | ) | |||
| British Pound | DBAB | Sell | 992,188 | 1,480,741 | 7/09/14 | — | (193,238 | ) | |||
| Euro | DBAB | Sell | 4,572,237 | 5,899,557 | 7/09/14 | — | (442,012 | ) | |||
| Chilean Peso | DBAB | Buy | 432,000,000 | 816,249 | 7/10/14 | — | (56,508 | ) | |||
| Euro | DBAB | Sell | 1,877,906 | 2,424,565 | 7/10/14 | — | (180,038 | ) | |||
| Euro | DBAB | Sell | 4,880,504 | 6,294,386 | 7/11/14 | — | (474,727 | ) | |||
| Euro | DBAB | Sell | 2,202,128 | 2,893,641 | 7/23/14 | — | (160,607 | ) | |||
| Euro | DBAB | Sell | 4,253,562 | 5,632,142 | 7/25/14 | — | (267,335 | ) | |||
| Euro | BZWS | Sell | 5,986,000 | 7,927,858 | 7/28/14 | — | (374,396 | ) | |||
| Euro | CITI | Sell | 2,785,851 | 3,689,372 | 7/28/14 | — | (174,451 | ) | |||
| Euro | DBAB | Sell | 11,104,766 | 14,717,702 | 7/29/14 | — | (683,986 | ) | |||
| British Pound | DBAB | Sell | 846,924 | 1,289,526 | 7/30/14 | — | (139,113 | ) | |||
| Euro | DBAB | Sell | 16,505,750 | 21,903,608 | 8/01/14 | — | (988,884 | ) | |||
| Euro | JPHQ | Sell | 3,379,556 | 4,470,148 | 8/06/14 | — | (217,074 | ) | |||
| Euro | CITI | Sell | 1,324,074 | 1,762,740 | 8/08/14 | — | (73,661 | ) | |||
| Chilean Peso | BZWS | Buy | 2,082,200,000 | 3,869,901 | 8/11/14 | — | (219,861 | ) | |||
| Chilean Peso | JPHQ | Buy | 1,352,200,000 | 2,536,723 | 8/11/14 | — | (166,353 | ) | |||
Annual Report | 47
| Franklin Strategic Series | |||||||||||
| Statement of Investments, April 30, 2014 (continued) | |||||||||||
| Franklin Strategic Income Fund | |||||||||||
| Forward Exchange Contracts (continued) | |||||||||||
| Counter- | Contract | Settlement | Unrealized | Unrealized | |||||||
| Currency | partya | Type | Quantity | Amount | Date | Appreciation | Depreciation | ||||
| Euro | CITI | Sell | 384,312 | $ | 512,090 | 8/11/14 | $ | — | $ | (20,923 | ) |
| Japanese Yen | DBAB | Sell | 112,187,000 | 1,142,934 | 8/19/14 | 44,563 | — | ||||
| Chilean Peso | JPHQ | Buy | 5,646,370,800 | 10,627,462 | 8/20/14 | — | (738,405 | ) | |||
| Japanese Yen | HSBC | Sell | 208,867,000 | 2,153,268 | 8/20/14 | 108,334 | — | ||||
| Japanese Yen | JPHQ | Sell | 151,946,000 | 1,563,029 | 8/20/14 | 75,386 | — | ||||
| Euro | JPHQ | Sell | 9,800,000 | 13,100,591 | 8/21/14 | — | (491,199 | ) | |||
| Japanese Yen | BZWS | Sell | 50,333,000 | 519,111 | 8/22/14 | 26,314 | — | ||||
| Euro | BZWS | Sell | 2,935,231 | 3,934,941 | 8/25/14 | — | (135,968 | ) | |||
| Japanese Yen | CITI | Sell | 100,563,000 | 1,035,222 | 8/25/14 | 50,617 | — | ||||
| Japanese Yen | DBAB | Sell | 49,740,000 | 511,802 | 8/25/14 | 24,801 | — | ||||
| Japanese Yen | HSBC | Sell | 99,826,000 | 1,025,002 | 8/25/14 | 47,613 | — | ||||
| Euro | DBAB | Sell | 2,214,428 | 2,958,476 | 8/26/14 | — | (112,740 | ) | |||
| Japanese Yen | BZWS | Sell | 139,815,000 | 1,422,330 | 8/26/14 | 53,402 | — | ||||
| Japanese Yen | JPHQ | Sell | 100,349,000 | 1,020,829 | 8/26/14 | 38,313 | — | ||||
| Euro | DBAB | Sell | 3,473,733 | 4,655,845 | 8/27/14 | — | (161,912 | ) | |||
| Euro | JPHQ | Sell | 1,161,245 | 1,549,693 | 8/27/14 | — | (60,850 | ) | |||
| Japanese Yen | DBAB | Sell | 1,803,257,000 | 18,270,081 | 8/27/14 | 614,290 | — | ||||
| Japanese Yen | HSBC | Sell | 158,794,000 | 1,609,067 | 8/27/14 | 54,306 | — | ||||
| Japanese Yen | JPHQ | Sell | 50,640,000 | 513,786 | 8/27/14 | 17,967 | — | ||||
| Singapore Dollar | DBAB | Buy | 3,355,500 | 2,624,971 | 8/27/14 | 51,881 | — | ||||
| Euro | DBAB | Sell | 14,050,998 | 18,789,304 | 8/28/14 | — | (698,156 | ) | |||
| Euro | DBAB | Sell | 10,420,622 | 13,915,698 | 8/29/14 | — | (536,747 | ) | |||
| Japanese Yen | JPHQ | Sell | 49,853,000 | 513,078 | 8/29/14 | 24,958 | — | ||||
| Euro | BZWS | Sell | 742,104 | 991,451 | 9/19/14 | — | (37,761 | ) | |||
| Euro | UBSW | Sell | 10,201,937 | 13,635,909 | 9/22/14 | — | (512,958 | ) | |||
| Japanese Yen | DBAB | Sell | 2,094,875,000 | 21,220,371 | 9/22/14 | 705,798 | — | ||||
| Euro | DBAB | Sell | 8,820,523 | 11,967,862 | 9/23/14 | — | (265,138 | ) | |||
| Euro | BZWS | Sell | 1,894,260 | 2,564,373 | 9/24/14 | — | (62,734 | ) | |||
| Euro | DBAB | Sell | 9,302,000 | 12,561,142 | 9/30/14 | — | (339,534 | ) | |||
| Japanese Yen | JPHQ | Sell | 387,212,500 | 3,927,005 | 9/30/14 | 134,931 | — | ||||
| Euro | JPHQ | Sell | 8,180,000 | 11,155,598 | 10/07/14 | — | (188,943 | ) | |||
| Euro | DBAB | Sell | 835,443 | 1,133,613 | 10/08/14 | — | (25,032 | ) | |||
| Euro | BZWS | Sell | 8,197,000 | 11,088,246 | 10/14/14 | — | (279,805 | ) | |||
| Euro | DBAB | Sell | 7,975,252 | 10,783,977 | 10/15/14 | — | (276,533 | ) | |||
| Euro | DBAB | Sell | 3,327,609 | 4,504,418 | 10/17/14 | — | (110,482 | ) | |||
| Malaysian Ringgit | JPHQ | Buy | 2,290,000 | 707,861 | 10/20/14 | — | (13,319 | ) | |||
| Euro | DBAB | Sell | 444,306 | 608,668 | 10/22/14 | — | (7,516 | ) | |||
| Japanese Yen | DBAB | Sell | 767,340,000 | 7,872,843 | 10/22/14 | 356,985 | — | ||||
| Chilean Peso | CITI | Buy | 1,510,671,000 | 2,899,560 | 10/24/14 | — | (270,795 | ) | |||
| Japanese Yen | JPHQ | Sell | 993,630,000 | 10,133,033 | 10/24/14 | 400,606 | — | ||||
| Malaysian Ringgit | DBAB | Buy | 30,637,000 | 9,513,119 | 10/24/14 | — | (223,315 | ) | |||
| Malaysian Ringgit | HSBC | Buy | 20,429,388 | 6,309,261 | 10/24/14 | — | (114,627 | ) | |||
48 | Annual Report
| Franklin Strategic Series | |||||||||||
| Statement of Investments, April 30, 2014 (continued) | |||||||||||
| Franklin Strategic Income Fund | |||||||||||
| Forward Exchange Contracts (continued) | |||||||||||
| Currency | Counter- partya | Type | Quantity | Contract Amount | Settlement Date | Unrealized Appreciation | Unrealized Depreciation | ||||
| Euro | BZWS | Sell | 935,270 | $ | 1,287,698 | 10/27/14 | $ | — | $ | (9,371 | ) |
| Euro | GSCO | Sell | 9,398,000 | 12,967,360 | 10/29/14 | — | (66,164 | ) | |||
| Euro | DBAB | Sell | 1,081,381 | 1,460,027 | 10/30/14 | — | (39,676 | ) | |||
| Euro | DBAB | Sell | 5,905,773 | 8,155,932 | 10/31/14 | — | (34,433 | ) | |||
| Euro | BZWS | Sell | 2,275,342 | 3,077,173 | 11/05/14 | — | (78,365 | ) | |||
| Japanese Yen | BZWS | Sell | 386,912,500 | 3,945,671 | 11/05/14 | 155,562 | — | ||||
| Japanese Yen | JPHQ | Sell | 1,081,080,000 | 11,036,085 | 11/05/14 | 446,064 | — | ||||
| Japanese Yen | DBAB | Sell | 1,474,215,000 | 15,000,000 | 11/07/14 | 558,665 | — | ||||
| Euro | DBAB | Sell | 5,072,000 | 6,866,727 | 11/10/14 | — | (167,333 | ) | |||
| Euro | JPHQ | Sell | 1,674,559 | 2,232,924 | 11/12/14 | — | (89,424 | ) | |||
| Euro | DBAB | Sell | 5,500,000 | 7,402,560 | 11/14/14 | — | (225,071 | ) | |||
| Japanese Yen | MSCO | Sell | 39,600,000 | 398,535 | 11/14/14 | 10,592 | — | ||||
| Euro | DBAB | Sell | 980,583 | 1,318,119 | 11/17/14 | — | (41,795 | ) | |||
| Malaysian Ringgit | DBAB | Buy | 1,869,600 | 573,726 | 11/19/14 | — | (7,602 | ) | |||
| Euro | JPHQ | Sell | 4,953,561 | 6,705,176 | 11/20/14 | — | (164,634 | ) | |||
| Malaysian Ringgit | HSBC | Buy | 1,130,000 | 347,052 | 11/20/14 | — | (4,900 | ) | |||
| Chilean Peso | DBAB | Buy | 2,000,000,000 | 3,694,809 | 11/28/14 | — | (224,830 | ) | |||
| Euro | DBAB | Sell | 5,317,857 | 7,205,696 | 11/28/14 | — | (169,340 | ) | |||
| Euro | DBAB | Sell | 5,240,000 | 7,098,418 | 12/04/14 | — | (168,645 | ) | |||
| Euro | DBAB | Sell | 12,746,000 | 17,413,713 | 12/09/14 | — | (263,011 | ) | |||
| Euro | DBAB | Sell | 7,400,000 | 10,154,650 | 12/11/14 | — | (108,003 | ) | |||
| Euro | JPHQ | Sell | 774,000 | 1,066,205 | 12/12/14 | — | (7,213 | ) | |||
| Japanese Yen | JPHQ | Sell | 1,055,280,000 | 10,306,425 | 12/12/14 | — | (34,182 | ) | |||
| Euro | CITI | Sell | 10,316,000 | 14,161,495 | 12/17/14 | — | (145,205 | ) | |||
| Euro | DBAB | Sell | 1,947,500 | 2,671,970 | 12/17/14 | — | (28,912 | ) | |||
| Euro | DBAB | Sell | 2,275,872 | 3,129,526 | 12/18/14 | — | (26,758 | ) | |||
| Japanese Yen | DBAB | Sell | 825,400,000 | 8,018,653 | 12/22/14 | — | (70,079 | ) | |||
| Malaysian Ringgit | DBAB | Buy | 2,856,400 | 852,657 | 1/07/15 | 10,069 | — | ||||
| British Pound | DBAB | Sell | 1,072,503 | 1,752,256 | 1/09/15 | — | (53,987 | ) | |||
| Chilean Peso | BZWS | Buy | 2,082,200,000 | 3,590,000 | 1/09/15 | 10,032 | — | ||||
| Chilean Peso | DBAB | Buy | 5,456,000,000 | 9,505,862 | 1/09/15 | 9,177 | (81,856 | ) | |||
| Euro | BZWS | Sell | 23,056,204 | 31,626,148 | 1/09/15 | — | (349,308 | ) | |||
| Euro | DBAB | Sell | 100,002,003 | 136,334,059 | 1/09/15 | — | (2,353,543 | ) | |||
| Euro | JPHQ | Sell | 20,335,222 | 27,707,837 | 1/09/15 | — | (494,030 | ) | |||
| Euro | MSCO | Sell | 2,920,000 | 3,989,508 | 1/09/15 | — | (60,088 | ) | |||
| Indian Rupee | DBAB | Buy | 2,529,734,000 | 37,757,723 | 1/09/15 | 2,098,356 | — | ||||
| Indian Rupee | HSBC | Buy | 1,380,831,000 | 20,481,408 | 1/09/15 | 1,273,650 | — | ||||
| Indian Rupee | JPHQ | Buy | 273,412,000 | 4,114,641 | 1/09/15 | 192,978 | — | ||||
| Japanese Yen | BZWS | Sell | 1,046,497,000 | 10,246,763 | 1/09/15 | — | (10,270 | ) | |||
| Japanese Yen | CITI | Sell | 1,022,550,000 | 10,002,819 | 1/09/15 | — | (19,503 | ) | |||
| Japanese Yen | DBAB | Sell | 8,402,595,000 | 81,674,200 | 1/09/15 | 156,060 | (838,232 | ) | |||
| Japanese Yen | GSCO | Sell | 755,750,000 | 7,381,452 | 1/09/15 | — | (25,882 | ) | |||
Annual Report | 49
| Franklin Strategic Series | |||||||||||
| Statement of Investments, April 30, 2014 (continued) | |||||||||||
| Franklin Strategic Income Fund | |||||||||||
| Forward Exchange Contracts (continued) | |||||||||||
| Counter- | Contract | Settlement | Unrealized | Unrealized | |||||||
| Currency | partya | Type | Quantity | Amount | Date | Appreciation | Depreciation | ||||
| Japanese Yen | HSBC | Sell | 1,157,280,000 | $ | 11,257,997 | 1/09/15 | $ | 51,473 | $ | (136,327 | ) |
| Japanese Yen | JPHQ | Sell | 1,197,711,000 | 11,780,155 | 1/09/15 | 53,061 | (12,033 | ) | |||
| Singapore Dollar | DBAB | Buy | 5,936,500 | 4,711,264 | 1/09/15 | 25,689 | — | ||||
| Euro | DBAB | Sell | 124,438,243 | 171,641,657 | 2/09/15 | 18,863 | (958,843 | ) | |||
| Euro | JPHQ | Sell | 20,514,800 | 28,412,734 | 2/09/15 | 46,787 | (85,739 | ) | |||
| Indian Rupee | CITI | Buy | 116,369,000 | 1,747,282 | 2/09/15 | 75,621 | — | ||||
| Japanese Yen | DBAB | Sell | 2,240,500,000 | 21,947,561 | 2/09/15 | 35,903 | (54,764 | ) | |||
| Japanese Yen | HSBC | Sell | 286,000,000 | 2,790,162 | 2/09/15 | — | (13,853 | ) | |||
| Japanese Yen | JPHQ | Sell | 605,200,000 | 5,907,594 | 2/09/15 | — | (25,938 | ) | |||
| Singapore Dollar | DBAB | Buy | 3,699,000 | 2,920,647 | 2/09/15 | 31,114 | — | ||||
| Singapore Dollar | HSBC | Buy | 4,228,000 | 3,338,690 | 2/09/15 | 35,208 | — | ||||
| Singapore Dollar | JPHQ | Buy | 2,638,000 | 2,083,366 | 2/09/15 | 21,729 | — | ||||
| British Pound | DBAB | Sell | 7,211,069 | 12,094,405 | 3/09/15 | — | (40,123 | ) | |||
| Chilean Peso | DBAB | Buy | 6,734,000,000 | 11,658,587 | 3/09/15 | — | (71,827 | ) | |||
| Chilean Peso | JPHQ | Buy | 937,202,000 | 1,634,180 | 3/09/15 | — | (21,596 | ) | |||
| Chilean Peso | MSCO | Buy | 881,530,000 | 1,559,459 | 3/09/15 | — | (42,668 | ) | |||
| Euro | BZWS | Sell | 667,313 | 921,079 | 3/09/15 | — | (4,453 | ) | |||
| Euro | DBAB | Sell | 94,273,966 | 130,095,738 | 3/09/15 | 38,014 | (695,806 | ) | |||
| Euro | HSBC | Sell | 711,759 | 979,736 | 3/09/15 | — | (7,440 | ) | |||
| Euro | JPHQ | Sell | 8,430,351 | 11,652,334 | 3/09/15 | — | (40,163 | ) | |||
| Japanese Yen | DBAB | Sell | 2,951,165,000 | 28,899,103 | 3/09/15 | — | (43,606 | ) | |||
| Singapore Dollar | DBAB | Buy | 20,972,900 | 16,702,158 | 3/09/15 | 34,983 | — | ||||
| Unrealized appreciation (depreciation) | 12,950,365 | (26,245,828 | ) | ||||||||
| Net unrealized appreciation (depreciation) | $ | (13,295,463 | ) | ||||||||
| aMay be comprised of multiple contracts using the same currency and settlement date. | |||||||||||
50 | Annual Report
Franklin Strategic Series
Statement of Investments, April 30, 2014 (continued)
Franklin Strategic Income Fund
At April 30, 2014, the Fund had the following credit default swap contracts outstanding. See Note 1(d).
| Credit Default Swap Contracts | ||||||||||||||||
| Upfront | ||||||||||||||||
| Periodic | Premiums | |||||||||||||||
| Counterparty/ Notional | Payment | Expiration | Paid | Unrealized | Unrealized | Market | ||||||||||
| Description | Exchange | Amounta | Rate | Date | (Received) | Appreciation | Depreciation | Value | Ratingb | |||||||
| OTC Swaps | ||||||||||||||||
| Contracts to Sell Protectionc | ||||||||||||||||
| Single Name | ||||||||||||||||
| People’s Republic of China | BZWS | 12,750,000 | 1.00 | % | 3/20/19 | $ | 23,604 | $ | 80,337 | $ | — | $ | 103,941 | AA- | ||
| People’s Republic of China | JPHQ | 72,250,000 | 1.00 | % | 3/20/19 | 197,625 | 391,374 | — | 588,999 | AA- | ||||||
| Republic of Brazil | FBCO | 30,000,000 | 1.00 | % | 3/20/19 | (1,427,708 | ) | 914,307 | — | (513,401 | ) | BBB- | ||||
| Traded Index | ||||||||||||||||
| CMBX.NA.AJ.2 | FBCO | 25,510,000 | 1.09 | % | 3/15/49 | (3,595,500 | ) | 1,590,450 | — | (2,005,050 | ) | Non | ||||
| Investment | ||||||||||||||||
| Grade | ||||||||||||||||
| MCDX.NA.21 | CITI | 150,000,000 | 1.00 | % | 12/20/18 | (2,525,554 | ) | 2,513,222 | — | (12,332 | ) | Non | ||||
| Investment | ||||||||||||||||
| Grade | ||||||||||||||||
| Net unrealized appreciation (depreciation) | $ | 5,489,690 | ||||||||||||||
aIn U.S. dollars unless otherwise indicated. For contracts to sell protection, the notional amount is equal to the maximum potential amount of the future payments and no recourse
provisions have been entered into in association with the contracts.
bBased on Standard and Poor’s (S&P) Rating for single name swaps and internal ratings for index swaps. Internal ratings based on mapping into equivalent ratings from external
vendors.
cThe fund enters contracts to sell protection to create a long credit position. Performance triggers include default, bankruptcy or restructuring for single name swaps and failure to
pay or bankruptcy of the underlying securities for traded index swaps.
See Note 9 regarding other derivative information.
See Abbreviations on page 76.
Annual Report | The accompanying notes are an integral part of these financial statements. | 51
| Franklin Strategic Series | |||
| Financial Statements | |||
| Statement of Assets and Liabilities | |||
| April 30, 2014 | |||
| Franklin | |||
| Strategic | |||
| Income Fund | |||
| Assets: | |||
| Investments in securities: | |||
| Cost - Unaffiliated issuers | $ | 7,784,963,402 | |
| Cost - Sweep Money Fund (Note 3f) | 725,462,930 | ||
| Total cost of investments | $ | 8,510,426,332 | |
| Value - Unaffiliated issuers | $ | 8,049,120,330 | |
| Value - Sweep Money Fund (Note 3f) | 725,462,930 | ||
| Total value of investments | 8,774,583,260 | ||
| Cash | 1,116,286 | ||
| Foreign currency, at value (cost $136,781,399) | 137,054,538 | ||
| Receivables: | |||
| Investment securities sold | 147,182,239 | ||
| Capital shares sold | 19,659,829 | ||
| Dividends and interest | 100,625,520 | ||
| Due from brokers | 16,230,000 | ||
| OTC swaps (premiums paid $232,260) | 221,229 | ||
| Unrealized appreciation on forward exchange contracts | 12,950,365 | ||
| Unrealized appreciation on OTC swap contracts | 5,489,690 | ||
| Other assets | 9,023 | ||
| Total assets | 9,215,121,979 | ||
| Liabilities: | |||
| Payables: | |||
| Investment securities purchased | 375,531,194 | ||
| Capital shares redeemed | 18,567,083 | ||
| Management fees | 3,189,056 | ||
| Distribution fees | 2,276,333 | ||
| Transfer agent fees | 1,569,751 | ||
| Distributions to shareholders | 2,246,692 | ||
| OTC Swaps (premiums received $7,973,395) | 7,548,762 | ||
| Unrealized depreciation on forward exchange contracts | 26,245,828 | ||
| Unrealized depreciation on unfunded loan commitments (Note 8) | 233,543 | ||
| Deferred tax | 266,956 | ||
| Accrued expenses and other liabilities | 787,094 | ||
| Total liabilities | 438,462,292 | ||
| Net assets, at value | $ | 8,776,659,687 | |
| Net assets consist of: | |||
| Paid-in capital | $ | 8,524,146,672 | |
| Distributions in excess of net investment income | (38,578,004 | ) | |
| Net unrealized appreciation (depreciation) | 256,420,345 | ||
| Accumulated net realized gain (loss) | 34,670,674 | ||
| Net assets, at value | $ | 8,776,659,687 | |
52 | The accompanying notes are an integral part of these financial statements. | Annual Report
| Franklin Strategic Series | |||
| Financial Statements (continued) | |||
| Statement of Assets and Liabilities (continued) | |||
| April 30, 2014 | |||
| Franklin | |||
| Strategic | |||
| Income Fund | |||
| Class A: | |||
| Net assets, at value | $ | 5,182,489,605 | |
| Shares outstanding | 490,294,035 | ||
| Net asset value per sharea | $ | 10.57 | |
| Maximum offering price per share (net asset value per share ÷ 95.75%) | $ | 11.04 | |
| Class C: | |||
| Net assets, at value | $ | 2,109,049,017 | |
| Shares outstanding | 199,579,819 | ||
| Net asset value and maximum offering price per sharea | $ | 10.57 | |
| Class R: | |||
| Net assets, at value | $ | 227,359,006 | |
| Shares outstanding | 21,579,434 | ||
| Net asset value and maximum offering price per share | $ | 10.54 | |
| Class R6: | |||
| Net assets, at value | $ | 247,007,389 | |
| Shares outstanding | 23,343,513 | ||
| Net asset value and maximum offering price per share | $ | 10.58 | |
| Advisor Class: | |||
| Net assets, at value | $ | 1,010,754,670 | |
| Shares outstanding | 95,540,726 | ||
| Net asset value and maximum offering price per share | $ | 10.58 | |
| aRedemption price is equal to net asset value less contingent deferred sales charges, if applicable. | |||
Annual Report | The accompanying notes are an integral part of these financial statements. | 53
| Franklin Strategic Series | |||
| Financial Statements (continued) | |||
| Statement of Operations | |||
| for the year ended April 30, 2014 | |||
| Franklin | |||
| Strategic | |||
| Income Fund | |||
| Investment income: | |||
| Dividends | $ | 6,210,637 | |
| Interest | 416,365,901 | ||
| Total investment income | 422,576,538 | ||
| Expenses: | |||
| Management fees (Note 3a) | 38,040,543 | ||
| Distribution fees: (Note 3c) | |||
| Class A | 12,455,288 | ||
| Class C | 13,569,447 | ||
| Class R | 1,167,594 | ||
| Transfer agent fees: (Note 3e) | |||
| Class A | 6,543,380 | ||
| Class C | 2,741,854 | ||
| Class R | 306,691 | ||
| Class R6 | 210 | ||
| Advisor Class | 1,256,398 | ||
| Custodian fees (Note 4) | 968,491 | ||
| Reports to shareholders | 766,794 | ||
| Registration and filing fees | 397,843 | ||
| Professional fees | 156,775 | ||
| Trustees’ fees and expenses | 93,594 | ||
| Other | 245,168 | ||
| Total expenses | 78,710,070 | ||
| Expense reductions (Note 4) | (6,585 | ) | |
| Expenses waived/paid by affiliates (Note 3f) | (500,006 | ) | |
| Net expenses | 78,203,479 | ||
| Net investment income | 344,373,059 | ||
| Realized and unrealized gains (losses): | |||
| Net realized gain (loss) from: | |||
| Investments | 60,444,926 | ||
| Foreign currency transactions | (10,866,459 | ) | |
| Swap contracts | 10,928,084 | ||
| Net realized gain (loss) | 60,506,551 | ||
| Net change in unrealized appreciation (depreciation) on: | |||
| Investments | (155,335,168 | ) | |
| Translation of other assets and liabilities denominated in foreign currencies | (35,819,711 | ) | |
| Change in deferred taxes on unrealized appreciation | 987,882 | ||
| Net change in unrealized appreciation (depreciation) | (190,166,997 | ) | |
| Net realized and unrealized gain (loss) | (129,660,446 | ) | |
| Net increase (decrease) in net assets resulting from operations | $ | 214,712,613 | |
54 | The accompanying notes are an integral part of these financial statements. | Annual Report
| Franklin Strategic Series | ||||||
| Financial Statements (continued) | ||||||
| Statements of Changes in Net Assets | ||||||
| Franklin Strategic Income Fund | ||||||
| Year Ended April 30, | ||||||
| 2014 | 2013 | |||||
| Increase (decrease) in net assets: | ||||||
| Operations: | ||||||
| Net investment income | $ | 344,373,059 | $ | 296,054,912 | ||
| Net realized gain (loss) from investments, foreign currency transactions and swap | ||||||
| contracts | 60,506,551 | 141,916,424 | ||||
| Net change in unrealized appreciation (depreciation) on investments, translation of other | ||||||
| assets and liabilities denominated in foreign currencies and deferred taxes | (190,166,997 | ) | 224,490,205 | |||
| Net increase (decrease) in net assets resulting from operations | 214,712,613 | 662,461,541 | ||||
| Distributions to shareholders from: | ||||||
| Net investment income: | ||||||
| Class A | (213,087,467 | ) | (230,894,978 | ) | ||
| Class B | — | (357,139 | ) | |||
| Class C | (80,821,962 | ) | (89,867,899 | ) | ||
| Class R | (9,384,072 | ) | (12,937,849 | ) | ||
| Class R6 | (8,216,596 | ) | — | |||
| Advisor Class | (43,278,074 | ) | (46,009,914 | ) | ||
| Net realized gains: | ||||||
| Class A | (45,182,760 | ) | (15,257,744 | ) | ||
| Class B | — | (13,391 | ) | |||
| Class C | (18,883,836 | ) | (6,432,291 | ) | ||
| Class R | (2,123,917 | ) | (875,855 | ) | ||
| Class R6 | (2,119,812 | ) | — | |||
| Advisor Class | (8,346,053 | ) | (2,883,125 | ) | ||
| Total distributions to shareholders | (431,444,549 | ) | (405,530,185 | ) | ||
| Capital share transactions: (Note 2) | ||||||
| Class A | 347,835,138 | 1,055,895,095 | ||||
| Class B | — | (18,389,250 | ) | |||
| Class C | 57,022,268 | 474,619,339 | ||||
| Class R | (26,386,053 | ) | 2,168,874 | |||
| Class R6 | 243,042,693 | — | ||||
| Advisor Class | 79,433,172 | 212,884,187 | ||||
| Total capital share transactions | 700,947,218 | 1,727,178,245 | ||||
| Net increase (decrease) in net assets | 484,215,282 | 1,984,109,601 | ||||
| Net assets: | ||||||
| Beginning of year | 8,292,444,405 | 6,308,334,804 | ||||
| End of year | $ | 8,776,659,687 | $ | 8,292,444,405 | ||
| Distributions in excess of net investment income included in net assets: | ||||||
| End of year | $ | (38,578,004 | ) | $ | (28,829,927 | ) |
Annual Report | The accompanying notes are an integral part of these financial statements. | 55
Franklin Strategic Series
Notes to Financial Statements
Franklin Strategic Income Fund
1. ORGANIZATION AND SIGNIFICANT ACCOUNTING POLICIES
Franklin Strategic Series (Trust) is registered under the Investment Company Act of 1940, as amended, (1940 Act) as an open-end management investment company, consisting of nine separate funds. The Franklin Strategic Income Fund (Fund) is included in this report. The financial statements of the remaining funds in the Trust are presented separately. The Fund offers five classes of shares: Class A, Class C, Class R, Class R6, and Advisor class. Effective May 1, 2013, the Fund began offering a new class of shares, Class R6. Each class of shares differs by its initial sales load, contingent deferred sales charges, voting rights on matters affecting a single class, its exchange privilege and fees primarily due to differing arrangements for distribution and transfer agent fees.
The following summarizes the Fund’s significant accounting policies.
a. Financial Instrument Valuation
The Fund’s investments in financial instruments are carried at fair value daily. Fair value is the price that would be received to sell an asset or paid to transfer a liability in an orderly transaction between market participants on the measurement date. The Fund calculates the net asset value per share at the close of the New York Stock Exchange (NYSE), generally at 4 p.m. Eastern time (NYSE close) on each day the NYSE is open for trading. Under procedures approved by the Trust’s Board of Trustees (the Board), the Fund’s administrator, investment manager and other affiliates have formed the Valuation and Liquidity Oversight Committee (VLOC). The VLOC provides administration and oversight of the Fund’s valuation policies and procedures, which are approved annually by the Board. Among other things, these procedures allow the Fund to utilize independent pricing services, quotations from securities and financial instrument dealers, and other market sources to determine fair value.
Equity securities and exchange traded funds listed on an exchange or on the NASDAQ National Market System are valued at the last quoted sale price or the official closing price of the day, respectively. Foreign equity securities are valued as of the close of trading on the foreign stock exchange on which the security is primarily traded or as of the NYSE close, whichever is earlier. The value is then converted into its U.S. dollar equivalent at the foreign exchange rate in effect at the NYSE close on the day that the value of the security is determined. Over-the-counter (OTC) securities are valued within the range of the most recent quoted bid and ask prices. Securities that trade in multiple markets or on multiple exchanges are valued according to the broadest and most representative market. Certain equity securities are valued based upon fundamental characteristics or relationships to similar securities. Investments in open-end mutual funds are valued at the closing net asset value.
56 | Annual Report
Franklin Strategic Series
Notes to Financial Statements (continued)
Franklin Strategic Income Fund
| 1. | ORGANIZATION AND SIGNIFICANT ACCOUNTING POLICIES (continued) |
| a. | Financial Instrument Valuation (continued) |
Debt securities generally trade in the OTC market rather than on a securities exchange. The Fund’s pricing services use multiple valuation techniques to determine fair value. In instances where sufficient market activity exists, the pricing services may utilize a market-based approach through which quotes from market makers are used to determine fair value. In instances where sufficient market activity may not exist or is limited, the pricing services also utilize proprietary valuation models which may consider market characteristics such as benchmark yield curves, credit spreads, estimated default rates, anticipated market interest rate volatility, coupon rates, anticipated timing of principal repayments, underlying collateral, and other unique security features in order to estimate the relevant cash flows, which are then discounted to calculate the fair value. Securities denominated in a foreign currency are converted into their U.S. dollar equivalent at the foreign exchange rate in effect at the NYSE close on the date that the values of the foreign debt securities are determined.
Certain derivative financial instruments (derivatives) trade in the OTC market. The Fund’s pricing services use various techniques including industry standard option pricing models and proprietary discounted cash flow models to determine the fair value of those instruments. The Fund’s net benefit or obligation under the derivative contract, as measured by the fair value of the contract, is included in net assets.
The Fund has procedures to determine the fair value of financial instruments for which market prices are not reliable or readily available. Under these procedures, the VLOC convenes on a regular basis to review such financial instruments and considers a number of factors, including significant unobservable valuation inputs, when arriving at fair value. The VLOC primarily employs a market-based approach which may use related or comparable assets or liabilities, recent transactions, market multiples, book values, and other relevant information for the investment to determine the fair value of the investment. An income-based valuation approach may also be used in which the anticipated future cash flows of the investment are discounted to calculate fair value. Discounts may also be applied due to the nature or duration of any restrictions on the disposition of the investments. Due to the inherent uncertainty of valuations of such investments, the fair values may differ significantly from the values that would have been used had an active market existed. The VLOC employs various methods for calibrating these valuation approaches including a regular review of key inputs and assumptions, transactional back-testing or disposition analysis, and reviews of any related market activity.
Trading in securities on foreign securities stock exchanges and OTC markets may be completed before the daily NYSE close. In addition, trading in certain foreign markets may not take place on every NYSE business day. Occasionally, events occur between the time at which trading in a
Annual Report | 57
Franklin Strategic Series
Notes to Financial Statements (continued)
Franklin Strategic Income Fund
| 1. | ORGANIZATION AND SIGNIFICANT ACCOUNTING POLICIES (continued) |
| a. | Financial Instrument Valuation (continued) |
foreign security is completed and the close of the NYSE that might call into question the reliability of the value of a portfolio security held by the Fund. As a result, differences may arise between the value of the Fund’s portfolio securities as determined at the foreign market close and the latest indications of value at the close of the NYSE. In order to minimize the potential for these differences, the VLOC monitors price movements following the close of trading in foreign stock markets through a series of country specific market proxies (such as baskets of American Depositary Receipts, futures contracts and exchange traded funds). These price movements are measured against established trigger thresholds for each specific market proxy to assist in determining if an event has occurred that may call into question the reliability of the values of the foreign securities held by the Fund. If such an event occurs, the securities may be valued using fair value procedures, which may include the use of independent pricing services.
Also, when the last day of the reporting period is a non-business day, certain foreign markets may be open on those days that the NYSE is closed, which could result in differences between the value of the Fund’s portfolio securities on the last business day and the last calendar day of the reporting period. Any significant security valuation changes due to an open foreign market are adjusted and reflected by the Fund for financial reporting purposes.
b. Foreign Currency Translation
Portfolio securities and other assets and liabilities denominated in foreign currencies are translated into U.S. dollars based on the exchange rate of such currencies against U.S. dollars on the date of valuation. The Fund may enter into foreign currency exchange contracts to facilitate transactions denominated in a foreign currency. Purchases and sales of securities, income and expense items denominated in foreign currencies are translated into U.S. dollars at the exchange rate in effect on the transaction date. Portfolio securities and assets and liabilities denominated in foreign currencies contain risks that those currencies will decline in value relative to the U.S. dollar. Occasionally, events may impact the availability or reliability of foreign exchange rates used to convert the U.S. dollar equivalent value. If such an event occurs, the foreign exchange rate will be valued at fair value using procedures established and approved by the Board.
The Fund does not separately report the effect of changes in foreign exchange rates from changes in market prices on securities held. Such changes are included in net realized and unrealized gain or loss from investments on the Statement of Operations.
58 | Annual Report
Franklin Strategic Series
Notes to Financial Statements (continued)
Franklin Strategic Income Fund
| 1. | ORGANIZATION AND SIGNIFICANT ACCOUNTING POLICIES (continued) |
| b. | Foreign Currency Translation (continued) |
Realized foreign exchange gains or losses arise from sales of foreign currencies, currency gains or losses realized between the trade and settlement dates on securities transactions and the difference between the recorded amounts of dividends, interest, and foreign withholding taxes and the U.S. dollar equivalent of the amounts actually received or paid. Net unrealized foreign exchange gains and losses arise from changes in foreign exchange rates on foreign denominated assets and liabilities other than investments in securities held at the end of the reporting period.
c. Securities Purchased on a Delayed Delivery Basis
The Fund purchases securities on a delayed delivery basis, with payment and delivery scheduled for a future date. These transactions are subject to market fluctuations and are subject to the risk that the value at delivery may be more or less than the trade date purchase price. Although the Fund will generally purchase these securities with the intention of holding the securities, it may sell the securities before the settlement date. Sufficient assets have been segregated for these securities.
d. Derivative Financial Instruments
The Fund invested in derivatives in order to manage risk or gain exposure to various other investments or markets. Derivatives are financial contracts based on an underlying or notional amount, require no initial investment or an initial net investment that is smaller than would normally be required to have a similar response to changes in market factors, and require or permit net settlement. Derivatives contain various risks including the potential inability of the counter-party to fulfill their obligations under the terms of the contract, the potential for an illiquid secondary market, and/or the potential for market movements which expose the Fund to gains or losses in excess of the amounts shown on the Statement of Assets and Liabilities. Realized gain and loss and unrealized appreciation and depreciation on these contracts for the period are included in the Statement of Operations.
Derivative counterparty credit risk is managed through a formal evaluation of the creditworthi-ness of all potential counterparties. The Fund attempts to reduce its exposure to counterparty credit risk on OTC derivatives, whenever possible, by entering into International Swaps and Derivatives Association (ISDA) master agreements with certain counterparties. These agreements contain various provisions, including but not limited to collateral requirements, events of default, or early termination. Termination events applicable to the counterparty include certain deteriorations in the credit quality of the counterparty. Termination events applicable to the Fund include failure of the Fund to maintain certain net asset levels and/or limit the decline in net assets over various periods of time. In the event of default or early termination, the ISDA master agreement gives the non-defaulting party the right to net and close-out all transactions
Annual Report | 59
Franklin Strategic Series
Notes to Financial Statements (continued)
Franklin Strategic Income Fund
| 1. | ORGANIZATION AND SIGNIFICANT ACCOUNTING POLICIES (continued) |
| d. | Derivative Financial Instruments (continued) |
traded, whether or not arising under the ISDA agreement, to one net amount payable by one counterparty to the other. However, absent an event of default or early termination, OTC derivative assets and liabilities are presented gross and not offset in the Statement of Assets and Liabilities. Early termination by the counterparty may result in an immediate payment by the Fund of any net liability owed to that counterparty under the ISDA agreement.
Collateral requirements differ by type of derivative. Collateral terms are contract specific for OTC derivatives. For OTC derivatives traded under an ISDA master agreement, posting of collateral is required by either the fund or the applicable counterparty if the total net exposure of all OTC derivatives with the applicable counterparty exceeds the minimum transfer amount, which typically ranges from $100,000 to $250,000, and can vary depending on the counterparty and the type of the agreement. Generally, collateral is determined at the close of fund business each day and any additional collateral required due to changes in derivative values may be delivered by the fund or the counterparty within a few business days. Collateral pledged and/or received by the fund, if any, is held in segregated accounts with the fund’s custodian/ counter-party broker and can be in the form of cash and/or securities. Unrestricted cash may be invested according to the Fund’s investment objectives.
The Fund entered into OTC forward exchange contracts primarily to manage and/or gain exposure to certain foreign currencies. A forward exchange contract is an agreement between the Fund and a counterparty to buy or sell a foreign currency at a specific exchange rate on a future date.
The Fund entered into credit default swap contracts primarily to manage exposure to credit risk. A credit default swap is an agreement between the Fund and a counterparty whereby the buyer of the contract receives credit protection and the seller of the contract guarantees the credit worthiness of a referenced debt obligation. These agreements may be privately negotiated in the over-the-counter market (“OTC credit default swaps”) or may be executed in a multilateral trade facility platform, such as a registered exchange (“centrally cleared credit default swaps”). The underlying referenced debt obligation may be a single issuer of corporate or sovereign debt, a credit index, or a tranche of a credit index. In the event of a default of the underlying referenced debt obligation, the buyer is entitled to receive the notional amount of the credit default swap contract from the seller in exchange for the referenced debt obligation, a net settlement amount equal to the notional amount of the credit default swap less the recovery value of the referenced debt obligation, or other agreed upon amount. For centrally cleared credit default swaps, required initial margins are pledged by the Fund, and the daily change in fair value is accounted for as a variation margin payable or receivable on the Statement of Assets and Liabilities. Over the term of the contract, the buyer pays the seller a periodic stream of payments, provided that no event of default has occurred. Such periodic payments are accrued daily
60 | Annual Report
Franklin Strategic Series
Notes to Financial Statements (continued)
Franklin Strategic Income Fund
| 1. | ORGANIZATION AND SIGNIFICANT ACCOUNTING POLICIES (continued) |
| d. | Derivative Financial Instruments (continued) |
as an unrealized appreciation or depreciation until the payments are made, at which time they are realized. Payments received or paid to initiate a credit default swap contract are reflected on the Statement of Assets and Liabilities and represent compensating factors between stated terms of the credit default swap agreement and prevailing market conditions (credit spreads and other relevant factors). These upfront payments are amortized over the term of the contract as a realized gain or loss on the Statement of Operations.
See Note 9 regarding other derivative information.
e. Loan Participation Notes
The Fund invests in loan participation notes (“Participations”). Participations are loans originally issued to a borrower by one or more financial institutions (the “Lender”) and subsequently sold to other investors, such as the Fund. Participations typically result in the Fund having a contractual relationship only with the Lender and not with the borrower. The Fund has the right to receive from the Lender any payments of principal, interest and fees which the Lender received from the borrower. The Fund generally has no rights to either enforce compliance by the borrower with the terms of the loan agreement or to any collateral relating to the original loan. As a result, the Fund assumes the credit risk of both the borrower and the Lender that is selling the Participation. The Participations may also involve interest rate risk and liquidity risk, including the potential default or insolvency of the borrower and/or the Lender.
f. FT Holdings Corporation II (FT Subsidiary)
The Fund invests in certain financial instruments through its investment in the FT Subsidiary. The FT Subsidiary is a Delaware Corporation, is a wholly-owned subsidiary of the Fund, and is able to invest in certain financial instruments consistent with the investment objective of the Fund. At April 30, 2014, the FT Subsidiary’s investment, Turtle Bay Resort, as well as any other assets and liabilities of the FT Subsidiary are reflected in the Fund’s Statement of Investments and Statement of Assets and Liabilities. The financial statements have been consolidated and include the accounts of the Fund and the FT Subsidiary. All intercompany transactions and balances have been eliminated.
g. Mortgage Dollar Rolls
The Fund enters into mortgage dollar rolls, typically on a to-be-announced basis. Mortgage dollar rolls are agreements between the Fund and a financial institution to simultaneously sell and repurchase mortgage-backed securities at a future date. Gains or losses are realized on the initial sale, and the difference between the repurchase price and the sale price is recorded as an unrealized gain or loss to the Fund upon entering into the mortgage dollar roll. In addition, the Fund
Annual Report | 61
Franklin Strategic Series
Notes to Financial Statements (continued)
Franklin Strategic Income Fund
| 1. | ORGANIZATION AND SIGNIFICANT ACCOUNTING POLICIES (continued) |
| g. | Mortgage Dollar Rolls (continued) |
may invest the cash proceeds that are received from the initial sale. During the period between the sale and repurchase, the Fund is not entitled to principal and interest paid on the mortgage backed securities. The risks of mortgage dollar roll transactions include the potential inability of the counterparty to fulfill its obligations.
h. Senior Floating Rate Interests
The Fund invests in senior secured corporate loans that pay interest at rates which are periodically reset by reference to a base lending rate plus a spread. These base lending rates are generally the prime rate offered by a designated U.S. bank or the London InterBank Offered Rate (LIBOR). Senior secured corporate loans often require prepayment of principal from excess cash flows or at the discretion of the borrower. As a result, actual maturity may be substantially less than the stated maturity.
Senior secured corporate loans in which the Fund invests are generally readily marketable, but may be subject to certain restrictions on resale.
i. Income and Deferred Taxes
It is the Fund’s policy to qualify as a regulated investment company under the Internal Revenue Code. The Fund intends to distribute to shareholders substantially all of its taxable income and net realized gains to relieve it from federal income and excise taxes. As a result, no provision for U.S. federal income taxes is required.
The Fund may be subject to foreign taxation related to income received, capital gains on the sale of securities and certain foreign currency transactions in the foreign jurisdictions in which it invests. Foreign taxes, if any, are recorded based on the tax regulations and rates that exist in the foreign markets in which the Fund invests. When a capital gain tax is determined to apply the Fund records an estimated deferred tax liability in an amount that would be payable if the securities were disposed of on the valuation date.
The Fund recognizes the tax benefits of uncertain tax positions only when the position is “more likely than not” to be sustained upon examination by the tax authorities based on the technical merits of the tax position. As of April 30, 2014, and for all open tax years, the Fund has determined that no liability for unrecognized tax benefits is required in the Fund’s financial statements related to uncertain tax positions taken on a tax return (or expected to be taken on future tax returns). Open tax years are those that remain subject to examination and are based on each tax jurisdiction statute of limitation.
62 | Annual Report
Franklin Strategic Series
Notes to Financial Statements (continued)
Franklin Strategic Income Fund
| 1. | ORGANIZATION AND SIGNIFICANT ACCOUNTING POLICIES (continued) |
| j. | Security Transactions, Investment Income, Expenses and Distributions |
Security transactions are accounted for on trade date. Realized gains and losses on security transactions are determined on a specific identification basis. Interest income and estimated expenses are accrued daily. Amortization of premium and accretion of discount on debt securities are included in interest income. Paydown gains and losses are recorded as an adjustment to interest income. Facility fees are recognized as income over the expected term of the loan. Dividend income is recorded on the ex-dividend date. Distributions to shareholders are recorded on the ex-dividend date and are determined according to income tax regulations (tax basis). Distributable earnings determined on a tax basis may differ from earnings recorded in accordance with accounting principles generally accepted in the United States of America. These differences may be permanent or temporary. Permanent differences are reclassified among capital accounts to reflect their tax character. These reclassifications have no impact on net assets or the results of operations. Temporary differences are not reclassified, as they may reverse in subsequent periods.
Common expenses incurred by the Trust are allocated among the funds based on the ratio of net assets of each fund to the combined net assets of the Trust. Fund specific expenses are charged directly to the fund that incurred the expense.
Realized and unrealized gains and losses and net investment income, not including class specific expenses, are allocated daily to each class of shares based upon the relative proportion of net assets of each class. Differences in per share distributions, by class, are generally due to differences in class specific expenses.
Inflation-indexed bonds are adjusted for inflation through periodic increases or decreases in the security’s interest accruals, face amount, or principal redemption value, by amounts corresponding to the rate of inflation as measured by an index. Any increase or decrease in the face amount or principal redemption value will be included as interest income on the Statement of Operations.
k. Accounting Estimates
The preparation of financial statements in accordance with accounting principles generally accepted in the United States of America requires management to make estimates and assumptions that affect the reported amounts of assets and liabilities at the date of the financial statements and the amounts of income and expenses during the reporting period. Actual results could differ from those estimates.
Annual Report | 63
Franklin Strategic Series
Notes to Financial Statements (continued)
Franklin Strategic Income Fund
| 1. | ORGANIZATION AND SIGNIFICANT ACCOUNTING POLICIES (continued) |
| l. | Guarantees and Indemnifications |
Under the Trust’s organizational documents, its officers and trustees are indemnified by the Trust against certain liabilities arising out of the performance of their duties to the Trust. Additionally, in the normal course of business, the Trust, on behalf of the Fund, enters into contracts with service providers that contain general indemnification clauses. The Trust’s maximum exposure under these arrangements is unknown as this would involve future claims that may be made against the Trust that have not yet occurred. Currently, the Trust expects the risk of loss to be remote.
2. SHARES OF BENEFICIAL INTEREST
At April 30, 2014, there were an unlimited number of shares authorized (without par value).
Transactions in the Fund’s shares were as follows:
| Year Ended April 30, | |||||||||||
| 2014 | 2013a | ||||||||||
| Shares | Amount | Shares | Amount | ||||||||
| Class A Shares: | |||||||||||
| Shares sold | 149,694,277 | $ | 1,580,320,735 | 156,328,438 | $ | 1,664,710,609 | |||||
| Shares issued in reinvestment of | |||||||||||
| distributions | 22,409,597 | 235,187,078 | 20,262,991 | 215,348,775 | |||||||
| Shares redeemed | (139,329,102 | ) | (1,467,672,675 | ) | (77,471,999 | ) | (824,164,289 | ) | |||
| Net increase (decrease) | 32,774,772 | $ | 347,835,138 | 99,119,430 | $ | 1,055,895,095 | |||||
| Class B Shares: | |||||||||||
| Shares sold | 54,707 | $ | 584,097 | ||||||||
| Shares issued in reinvestment of | |||||||||||
| distributions | 29,976 | 317,252 | |||||||||
| Shares redeemed | (1,806,955 | ) | (19,290,599 | ) | |||||||
| Net increase (decrease) | (1,722,272 | ) | $ | (18,389,250 | ) | ||||||
| Class C Shares: | |||||||||||
| Shares sold | 52,213,238 | $ | 551,561,530 | 66,115,522 | $ | 704,117,353 | |||||
| Shares issued in reinvestment of | |||||||||||
| distributions | 8,492,709 | 89,117,411 | 7,858,286 | 83,483,367 | |||||||
| Shares redeemed | (55,445,492 | ) | (583,656,673 | ) | (29,427,899 | ) | (312,981,381 | ) | |||
| Net increase (decrease) | 5,260,455 | $ | 57,022,268 | 44,545,909 | $ | 474,619,339 | |||||
| Class R Shares: | |||||||||||
| Shares sold | 5,437,437 | $ | 57,142,615 | 6,457,399 | $ | 68,442,116 | |||||
| Shares issued in reinvestment of | |||||||||||
| distributions | 1,059,135 | 11,083,038 | 1,258,648 | 13,320,129 | |||||||
| Shares redeemed | (9,001,828 | ) | (94,611,706 | ) | (7,517,732 | ) | (79,593,371 | ) | |||
| Net increase (decrease) | (2,505,256 | ) | $ | (26,386,053 | ) | 198,315 | $ | 2,168,874 | |||
64 | Annual Report
Franklin Strategic Series
Notes to Financial Statements (continued)
Franklin Strategic Income Fund
| 2. SHARES OF BENEFICIAL INTEREST (continued) | ||||||||||
| Year Ended April 30, | ||||||||||
| 2014 | 2013a | |||||||||
| Shares | Amount | Shares | Amount | |||||||
| Class R6 Sharesb: | ||||||||||
| Shares soldc | 22,906,764 | $ | 238,472,675 | |||||||
| Shares issued in reinvestment of | ||||||||||
| distributions | 984,342 | 10,336,351 | ||||||||
| Shares redeemed | (547,593 | ) | (5,766,333 | ) | ||||||
| Net increase (decrease) | 23,343,513 | $ | 243,042,693 | |||||||
| Advisor Class Shares: | ||||||||||
| Shares sold | 43,658,699 | $ | 460,708,567 | 33,927,651 | $ | 361,582,495 | ||||
| Shares issued in reinvestment of | ||||||||||
| distributions | 4,404,969 | 46,277,451 | 4,139,838 | 44,017,295 | ||||||
| Shares redeemedc | (40,514,204 | ) | (427,552,846 | ) | (18,102,184 | ) | (192,715,603 | ) | ||
| Net increase (decrease) | 7,549,464 | $ | 79,433,172 | 19,965,305 | $ | 212,884,187 | ||||
aEffective March 21, 2013, all Class B shares were converted to Class A.
bFor the year May 1, 2013 (effective date) to April 30, 2014. cEffective May 1, 2013, a portion of Advisor Class shares were exchanged into Class R6.
3. TRANSACTIONS WITH AFFILIATES
Franklin Resources, Inc. is the holding company for various subsidiaries that together are referred to as Franklin Templeton Investments. Certain officers and trustees of the Trust are also officers and/or directors of the following subsidiaries:
| Subsidiary | Affiliation |
| Franklin Advisers, Inc. (Advisers) | Investment manager |
| Franklin Templeton Services, LLC (FT Services) | Administrative manager |
| Franklin Templeton Distributors, Inc. (Distributors) | Principal underwriter |
| Franklin Templeton Investor Services, LLC (Investor Services) | Transfer agent |
Annual Report | 65
Franklin Strategic Series
Notes to Financial Statements (continued)
Franklin Strategic Income Fund
| 3. | TRANSACTIONS WITH AFFILIATES (continued) |
| a. | Management Fees |
The Fund pays an investment management fee to Advisers based on the average daily net assets of the Fund as follows:
| Annualized Fee Rate | Net Assets | |
| 0.625 | % | Up to and including $100 million |
| 0.500 | % | Over $100 million, up to and including $250 million |
| 0.450 | % | Over $250 million, up to and including $7.5 billion |
| 0.440 | % | Over $7.5 billion, up to and including $10 billion |
| 0.430 | % | Over $10 billion, up to and including $12.5 billion |
| 0.420 | % | Over $12.5 billion, up to and including $15 billion |
| 0.400 | % | Over $15 billion, up to and including $17.5 billion |
| 0.380 | % | Over $17.5 billion, up to and including $20 billion |
| 0.360 | % | Over $20 billion, up to and including $35 billion |
| 0.355 | % | Over $35 billion, up to and including $50 billion |
| 0.350 | % | In excess of $50 billion |
b. Administrative Fees
Under an agreement with Advisers, FT Services provides administrative services to the Fund. The fee is paid by Advisers based on the Fund’s average daily net assets, and is not an additional expense of the Fund.
c. Distribution Fees
The Board has adopted distribution plans for each share class, with the exception of Class R6 and Advisor Class shares, pursuant to Rule 12b-1 under the 1940 Act. Distribution fees are not charged on shares held by affiliates. Under the Fund’s Class A reimbursement distribution plan, the Fund reimburses Distributors for costs incurred in connection with the servicing, sale and distribution of the Fund’s shares up to the maximum annual plan rate. Under the Class A reimbursement distribution plan, costs exceeding the maximum for the current plan year cannot be reimbursed in subsequent periods. In addition, under the Fund’s Class C and R compensation distribution plans, the Fund pays Distributors for costs incurred in connection with the servicing, sale and distribution of the Fund’s shares up to the maximum annual plan rate for each class. The plan year, for purposes of monitoring compliance with the maximum annual plan rates, is February 1 through January 31.
The maximum annual plan rates, based on the average daily net assets, for each class, are as follows:
| Class A | 0.25 | % |
| Class C | 0.65 | % |
| Class R | 0.50 | % |
66 | Annual Report
Franklin Strategic Series
Notes to Financial Statements (continued)
Franklin Strategic Income Fund
| 3. | TRANSACTIONS WITH AFFILIATES (continued) |
| d. | Sales Charges/Underwriting Agreements |
Front-end sales charges and contingent deferred sales charges (CDSC) do not represent expenses of the Fund. These charges are deducted from the proceeds of sales of Fund shares prior to investment or from redemption proceeds prior to remittance, as applicable. Distributors has advised the Fund of the following commission transactions related to the sales and redemptions of the Fund’s shares for the year:
| Sales charges retained net of commissions paid to unaffiliated | ||
| broker/dealers | $ | 3,266,680 |
| CDSC retained | $ | 495,993 |
e. Transfer Agent Fees
Each class of shares, except for Class R6, pays transfer agent fees to Investor Services for its performance of shareholder servicing obligations and reimburses Investor Services for out of pocket expenses incurred, including shareholding servicing fees paid to third parties. These fees are allocated daily based upon their relative proportion of such classes’ aggregate net assets. Class R6 pays Investor Services transfer agent fees specific to that class.
For the year ended April 30, 2014, the Fund paid transfer agent fees of $10,848,533, of which $4,825,298 was retained by Investor Services.
f. Investment in Institutional Fiduciary Trust Money Market Portfolio
The Fund invests in the Institutional Fiduciary Trust Money Market Portfolio (Sweep Money Fund), an affiliated open-end investment company. Management fees paid by the Fund are waived on assets invested in the Sweep Money Fund, in an amount not to exceed the management and administrative fees paid directly or indirectly by the Sweep Money Fund, as noted on the Statement of Operations. Prior to May 1, 2013, the waiver was accounted for as a reduction to management fees.
g. Waiver and Expense Reimbursements
Investor Services has contractually agreed in advance to waive or limit its fees so that the Class R6 transfer agent fees for the Fund do not exceed 0.01% until August 31, 2014. There were no Class R6 transfer agent fees waived during the year ended April 30, 2014.
Annual Report | 67
Franklin Strategic Series
Notes to Financial Statements (continued)
Franklin Strategic Income Fund
4. EXPENSE OFFSET ARRANGEMENT
The Fund has entered into an arrangement with its custodian whereby credits realized as a result of uninvested cash balances are used to reduce a portion of the Fund’s custodian expenses. During the year ended April 30, 2014, the custodian fees were reduced as noted in the Statement of Operations.
5. INCOME TAXES
The tax character of distributions paid during the years ended April 30, 2014 and 2013 was as follows:
| 2014 | 2013 | |||
| Distributions from: | ||||
| Ordinary income | $ | 359,348,855 | $ | 385,981,179 |
| Long term capital gain | 72,095,694 | 19,549,006 | ||
| $ | 431,444,549 | $ | 405,530,185 |
At April 30, 2014, the cost of investments, net unrealized appreciation (depreciation) and undistributed long term capital gains for income tax purposes were as follows:
| Cost of investments | $ | 8,543,931,351 | |
| Unrealized appreciation | $ | 338,939,867 | |
| Unrealized depreciation | (108,287,958 | ) | |
| Net unrealized appreciation (depreciation) | $ | 230,651,909 | |
| Distributable earnings - undistributed long term | |||
| capital gains | $ | 35,368,524 | |
Differences between income and/or capital gains as determined on a book basis and a tax basis are primarily due to differing treatments of foreign currency transactions, bond discounts and premium, swaps and tax straddles.
6. INVESTMENT TRANSACTIONS
Purchases and sales of investments (excluding short term securities) for the year ended April 30, 2014, aggregated $4,764,305,757 and $4,029,465,090, respectively.
68 | Annual Report
Franklin Strategic Series
Notes to Financial Statements (continued)
Franklin Strategic Income Fund
7. CREDIT RISK AND DEFAULTED SECURITIES
At April 30, 2014, the Fund had 52.43% of its portfolio invested in high yield, senior secured floating rate notes, or other securities rated below investment grade. These securities may be more sensitive to economic conditions causing greater price volatility and are potentially subject to a greater risk of loss due to default than higher rated securities.
The Fund held a defaulted security and/or other securities for which the income has been deemed uncollectible. At April 30, 2014, the value of this security was $24,150,000, representing 0.28% of the Fund’s net assets. The Fund discontinues accruing income on securities for which income has been deemed uncollectible and provides an estimate for losses on interest receivable. The security has been identified on the accompanying Statement of Investments.
8. UNFUNDED LOAN COMMITMENTS
The Fund enters into certain credit agreements, all or a portion of which may be unfunded. The Fund is obligated to fund these loan commitments at the borrowers’ discretion. Funded portions of credit agreements are presented on the Statement of Investments.
At April 30, 2014, unfunded commitments were as follows:
| Unfunded | ||
| Borrower | Commitment | |
| Patriot Coal Corp., L/C Facility, 6.50%, 12/18/18 | $ | 2,415,156 |
Unfunded loan commitments and funded portions of credit agreements are marked to market daily and any unrealized appreciation or depreciation is included in the Statement of Assets and Liabilities and the Statement of Operations.
Annual Report | 69
Franklin Strategic Series
Notes to Financial Statements (continued)
Franklin Strategic Income Fund
9. OTHER DERIVATIVE INFORMATION
At April 30, 2014, the Fund’s investments in derivative contracts are reflected on the Statement of Assets and Liabilities as follows:
| Asset Derivatives | Liability Derivatives | ||||||||||
| Derivative Contracts | |||||||||||
| Not Accounted for as | Statement of Assets | Fair Value | Statement of Assets | Fair Value | |||||||
| Hedging Instruments | and Liabilities Location | Amount | and Liabilities Location | Amount | |||||||
| Foreign exchange | |||||||||||
| contracts | Unrealized appreciation | Unrealized depreciation | |||||||||
| on forward exchange | on forward exchange | ||||||||||
| contracts | $ | 12,950,365 | contracts | $ | 26,245,828 | ||||||
| Credit contracts | Unrealized appreciation | Unrealized depreciation | |||||||||
| on OTC swap contracts | 5,489,690 | on OTC swap contracts | — | ||||||||
| For the year ended April 30, 2014, the effect of derivative contracts on the Fund’s Statement of | |||||||||||
| Operations was as follows: | |||||||||||
| Change in | |||||||||||
| Unrealized | |||||||||||
| Derivative Contracts | Realized Gain | Appreciation | |||||||||
| Not Accounted for as | Statement of | (Loss) | (Depreciation) | ||||||||
| Hedging Instruments | Operations Locations | for the Year | for the Year | ||||||||
| Foreign exchange | |||||||||||
| contracts | Net realized gain (loss) from foreign | ||||||||||
| currency transactions / Net change in | |||||||||||
| unrealized appreciation (depreciation) | |||||||||||
| on translation of other assets and | |||||||||||
| liabilities denominated in foreign | |||||||||||
| currencies | $ | (9,612,139 | ) | $ | (36,180,213 | ) | |||||
| Credit contracts | Net realized gain (loss) from swap contracts / | ||||||||||
| Net change in unrealized appreciation | |||||||||||
| (depreciation) on investments | 10,928,084 | (318,352 | ) | ||||||||
70 | Annual Report
Franklin Strategic Series
Notes to Financial Statements (continued)
Franklin Strategic Income Fund
9. OTHER DERIVATIVE INFORMATION (continued)
At April 30, 2014, the Fund’s OTC derivative assets and liabilities are as follows:
| Gross and Net Amounts of Assets | ||||
| and Liabilities Presented in the | ||||
| Statement of Assets and Liabilities | ||||
| Assetsa | Liabilitiesa | |||
| Derivatives | ||||
| Forward exchange contracts | $ | 12,950,365 | $ | 26,245,828 |
| Swaps | 5,710,919 | 7,548,762 | ||
| Total | $ | 18,661,284 | $ | 33,794,590 |
aAbsent an event of default or early termination, OTC derivative assets and liabilities are presented gross and not offset in the Statement of Assets and Liabilities.
At April 30, 2014, the Fund’s OTC derivative assets which may be offset against the Fund’s OTC derivative liabilities and collateral received from the counterparty, is as follows:
| Amounts Not Offset in the | ||||||||||||||
| Statement of Assets and Liabilities | ||||||||||||||
| �� Gross and | ||||||||||||||
| Net Amounts of | ||||||||||||||
| Assets Presented | Financial | Financial | ||||||||||||
| in the Statement | Instruments | Instruments | Cash | Net Amount | ||||||||||
| of Assets and | Available for | Collateral | Collateral | (Not less | ||||||||||
| Liabilities | Offset | Receiveda | Received | than zero) | ||||||||||
| Counterparty | ||||||||||||||
| BZWS | $ | 1,476,140 | $ | (1,476,140 | ) | $ | — | $ | — | $ | — | |||
| CITI | 2,639,460 | (2,639,460 | ) | — | — | — | ||||||||
| DBAB | 7,410,619 | (7,410,619 | ) | — | — | — | ||||||||
| FBCO | 2,504,757 | (2,504,757 | ) | — | — | — | ||||||||
| GSCO | — | — | — | — | — | |||||||||
| HSBC | 1,891,428 | (277,147 | ) | (1,560,477 | ) | — | 53,804 | |||||||
| JPHQ | 2,728,288 | (2,728,288 | ) | — | — | — | ||||||||
| MSCO | 10,592 | (10,592 | ) | — | — | — | ||||||||
| UBSW | — | — | — | — | — | |||||||||
| Total | $ | 18,661,284 | $ | (17,047,003 | ) | $ | (1,560,477 | ) | $ | — | $ | 53,804 | ||
| aAt April 30 2014, the Fund received United Kingdom Treasury Bonds and Notes as collateral for derivatives. | ||||||||||||||
Annual Report | 71
Franklin Strategic Series
Notes to Financial Statements (continued)
Franklin Strategic Income Fund
9. OTHER DERIVATIVE INFORMATION (continued)
At April 30, 2014, the Fund’s OTC derivative liabilities which may be offset against the Fund’s OTC derivative assets and collateral pledged to the counterparty, is as follows:
| Amounts Not Offset in the | |||||||||||||
| Statement of Assets and Liabilities | |||||||||||||
| Gross and | |||||||||||||
| Net Amounts of | |||||||||||||
| Liabilities Presented | Financial | Financial | |||||||||||
| in the Statement | Instruments | Instruments | Cash | Net Amount | |||||||||
| of Assets and | Available for | Collateral | Collateral | (Not less | |||||||||
| Liabilities | Offset | Pledged | Pledgeda | than zero) | |||||||||
| Counterparty | |||||||||||||
| BZWS | $ | 1,562,292 | $ | (1,476,140 | ) | $ | — | $ | — | $ | 86,152 | ||
| CITI | 3,230,092 | (2,639,460 | ) | — | (590,632 | ) | — | ||||||
| DBAB | 19,174,953 | (7,410,619 | ) | — | (10,810,000 | ) | 954,334 | ||||||
| FBCO | 5,023,208 | (2,504,757 | ) | — | (2,518,451 | ) | — | ||||||
| GSCO | 170,245 | — | — | (170,245 | ) | — | |||||||
| HSBC | 277,147 | (277,147 | ) | — | — | — | |||||||
| JPHQ | 2,931,650 | (2,728,288 | ) | — | — | 203,362 | |||||||
| MSCO | 102,756 | (10,592 | ) | — | (92,164 | ) | — | ||||||
| UBSW | 1,322,247 | — | — | (1,322,247 | ) | — | |||||||
| Total | $ | 33,794,590 | $ | (17,047,003 | ) | $ | — | $ | (15,503,739 | ) | $ | 1,243,848 | |
aIn some instances, the collateral amounts disclosed in the table above were adjusted due to the requirement to limit collateral amounts to avoid the effect of overcollateralization. Actual collateral received and/or pledged may be more than the amount disclosed herein.
For the year ended April 30, 2014, the average month end fair value of derivatives represented 0.69% of average month end net assets. The average month end number of open derivative contracts for the year was 278.
See Note 1(d) regarding derivative financial instruments.
10. CREDIT FACILITY
The Fund, together with other U.S. registered and foreign investment funds (collectively, Borrowers), managed by Franklin Templeton Investments, are borrowers in a joint syndicated senior unsecured credit facility totaling $1.5 billion (Global Credit Facility) which matures on February 13, 2015. This Global Credit Facility provides a source of funds to the Borrowers for temporary and emergency purposes, including the ability to meet future unanticipated or unusually large redemption requests.
72 | Annual Report
Franklin Strategic Series
Notes to Financial Statements (continued)
Franklin Strategic Income Fund
10. CREDIT FACILITY (continued)
Under the terms of the Global Credit Facility, the Fund shall, in addition to interest charged on any borrowings made by the Fund and other costs incurred by the Fund, pay its share of fees and expenses incurred in connection with the implementation and maintenance of the Global Credit Facility, based upon its relative share of the aggregate net assets of all of the Borrowers, including an annual commitment fee of 0.07% based upon the unused portion of the Global Credit Facility. These fees are reflected in other expenses on the Statement of Operations. During the year ended April 30, 2014, the Fund did not use the Global Credit Facility.
11. FAIR VALUE MEASUREMENTS
The Fund follows a fair value hierarchy that distinguishes between market data obtained from independent sources (observable inputs) and the Fund’s own market assumptions (unobservable inputs). These inputs are used in determining the value of the Fund’s financial instruments and are summarized in the following fair value hierarchy:
- Level 1 – quoted prices in active markets for identical financial instruments
- Level 2 – other significant observable inputs (including quoted prices for similar financial instruments, interest rates, prepayment speed, credit risk, etc.)
- Level 3 – significant unobservable inputs (including the Fund’s own assumptions in determining the fair value of financial instruments)
The input levels are not necessarily an indication of the risk or liquidity associated with financial instruments at that level.
For movements between the levels within the fair value hierarchy, the Fund has adopted a policy of recognizing the transfers as of the date of the underlying event which caused the movement.
Annual Report | 73
Franklin Strategic Series
Notes to Financial Statements (continued)
Franklin Strategic Income Fund
11. FAIR VALUE MEASUREMENTS (continued)
A summary of inputs used as of April 30, 2014, in valuing the Fund’s assets and liabilities carried at fair value, is as follows:
| Level 1 | Level 2 | Level 3 | Total | |||||
| Assets: | ||||||||
| Investments in Securities: | ||||||||
| Equity Investments:a | ||||||||
| Consumer Services | $ | — | $ | 7,198,122 | $ | — | $ | 7,198,122 |
| Materials | — | 2,520,000 | — | 2,520,000 | ||||
| Transportation | — | 6,389,660 | — | 6,389,660 | ||||
| Other Equity Investmentsb | 98,567,962 | — | — | 98,567,962 | ||||
| Corporate Bonds | — | 3,200,109,698 | — | 3,200,109,698 | ||||
| Senior Floating Rate Interests | — | 1,275,860,837 | 1,160,988 | 1,277,021,825 | ||||
| Foreign Government and Agency | ||||||||
| Securities | — | 1,778,527,172 | — | 1,778,527,172 | ||||
| U.S. Government and Agency | ||||||||
| Securities | — | 153,804,794 | — | 153,804,794 | ||||
| Asset-Backed Securities and | ||||||||
| Commercial Mortgage-Backed | ||||||||
| Securities | — | 435,264,187 | — | 435,264,187 | ||||
| Mortgage-Backed Securities | — | 396,639,010 | — | 396,639,010 | ||||
| Municipal Bonds | — | 507,790,476 | — | 507,790,476 | ||||
| Escrows and Litigation Trusts | — | — | —c | — | ||||
| Short Term Investments | 725,462,930 | 185,287,424 | — | 910,750,354 | ||||
| Total Investments in | ||||||||
| Securities | $ | 824,030,892 | $ | 7,949,391,380 | $ | 1,160,988 | $ | 8,774,583,260 |
| Other Financial Instruments | ||||||||
| Forward Exchange Contracts | $ | — | $ | 12,950,365 | — | 12,950,365 | ||
| Swaps Contracts | — | 5,489,690 | — | 5,489,690 | ||||
| Total Other Financial | ||||||||
| Instruments | $ | — | $ | 18,440,055 | $ | — | $ | 18,440,055 |
| Liabilities: | ||||||||
| Other Financial Instruments | ||||||||
| Forward Exchange Contracts | $ | — | $ | 26,245,828 | $ | — | $ | 26,245,828 |
| Unfunded Loan Commitments | — | 233,543 | — | 233,543 | ||||
| Total Other Financial | ||||||||
| Instruments | $ | — | $ | 26,479,371 | $ | — | $ | 26,479,371 |
aIncludes common, preferred and convertible preferred stocks as well as other equity investments.
bFor detailed categories, see the accompanying Statement of Investments.
cIncludes securities determined to have no value at April 30, 2014.
74 | Annual Report
Franklin Strategic Series
Notes to Financial Statements (continued)
Franklin Strategic Income Fund
11. FAIR VALUE MEASUREMENTS (continued)
A reconciliation of assets in which Level 3 inputs are used in determining fair value is presented when there are significant Level 3 financial instruments at the end of the year.
12. NEW ACCOUNTING PRONOUNCEMENTS
In June 2013, the Financial Accounting Standards Board issued Accounting Standards Update (ASU) No. 2013-08, Investment Companies (Topic 946): Amendments to the Scope, Measurement, and Disclosure Requirements. The ASU modifies the criteria used in defining an investment company under U.S. Generally Accepted Accounting Principles and also sets forth certain measurement and disclosure requirements. Under the ASU, an entity that is registered under the 1940 Act automatically qualifies as an investment company. The ASU is effective for interim and annual reporting periods beginning after December 15, 2013. Management has reviewed the requirements and believes the adoption of this ASU will not have a material impact on the financial statements.
13. SUBSEQUENT EVENTS
The Fund has evaluated subsequent events through the issuance of the financial statements and determined that no events have occurred that require disclosure.

Franklin Strategic Series
Notes to Financial Statements (continued)
| Franklin Strategic Income Fund | |||||
| ABBREVIATIONS | |||||
| Counterparty | Currency | Selected Portfolio | |||
| BZWS | - Barclays Bank PLC | BRL | - Brazilian Real | AGMC | - Assured Guaranty Municipal Corp. |
| CITI | - Citigroup, Inc. | CAD | - Canadian Dollar | CDO | - Collateralized Debt Obligation |
| DBAB | - Deutsche Bank AG | EUR | - Euro | CLO | - Collateralized Loan Obligation |
| FBCO | - Credit Suisse Group AG | GBP | - British Pound | EDA | - Economic Development Authority |
| GSCO | - The Goldman Sachs Group, Inc. | HUF | - Hungarian Forint | ETF | - Exchange Traded Fund |
| HSBC | - HSBC Bank USA, N.A. | IDR | - Indonesian Rupiah | FGIC | - Financial Guaranty Insurance Co. |
| JPHQ | - JP Morgan Chase & Co. | KRW | - South Korean Won | FICO | - Financing Corp. |
| MSCO | - Morgan Stanley | LKR | - Sri Lankan Rupee | FRN | - Floating Rate Note |
| UBSW | - UBS AG | MXN | - Mexican Peso | GO | - General Obligation |
| MYR | - Malaysian Ringgit | HDC | - Housing Development Corp. | ||
| PHP | - Philippine Peso | ISD | - Independent School District | ||
| PLN | - Polish Zloty | L/C | - Letter of Credit | ||
| SEK | - Swedish Krona | NATL | - National Public Financial Guarantee Corp. | ||
| SGD | - Singapore Dollar | NATL RE | - National Public Financial Guarantee Corp. | ||
| UYU | - Uruguayan Peso | Reinsured | |||
| PIK | - Payment-In-Kind | ||||
| PSF | - Permanent School Fund | ||||
76 | Annual Report
Franklin Strategic Series
Report of Independent Registered Public Accounting Firm
Franklin Strategic Income Fund
To the Board of Franklin Strategic Series and Shareholders of The Franklin Strategic Series
In our opinion, the accompanying statement of assets and liabilities, including the statement of investments, and the related statements of operations and of changes in net assets and the financial highlights present fairly, in all material respects, the financial position of the Franklin Strategic Income Fund (one of the funds constituting the Franklin Strategic Series, hereafter referred to as the “Fund”) at April 30, 2014, the results of its operations for the year then ended, the changes in its net assets for each of the two years in the period then ended and the financial highlights for each of the five years in the period then ended, in conformity with accounting principles generally accepted in the United States of America. These financial statements and financial highlights (hereafter referred to as “financial statements”) are the responsibility of the Fund’s management. Our responsibility is to express an opinion on these financial statements based on our audits. We conducted our audits of these financial statements in accordance with the standards of the Public Company Accounting Oversight Board (United States). Those standards require that we plan and perform the audit to obtain reasonable assurance about whether the financial statements are free of material misstatement. An audit includes examining, on a test basis, evidence supporting the amounts and disclosures in the financial statements, assessing the accounting principles used and significant estimates made by management, and evaluating the overall financial statement presentation. We believe that our audits, which included confirmation of securities at April 30, 2014 by correspondence with the custodian, transfer agent and brokers, provide a reasonable basis for our opinion.
PricewaterhouseCoopers LLP
San Francisco, California June 13, 2014
Annual Report | 77
Franklin Strategic Series
Tax Information (unaudited)
Franklin Strategic Income Fund
Under Section 852(b)(3)(C) of the Internal Revenue Code (Code), the Fund hereby reports the maximum amount allowable but no less than $72,095,694 as a long term capital gain dividend for the fiscal year ended April 30, 2014.
Under Section 871(k)(2)(C) of the Code, the Fund hereby reports the maximum amount allowable but no less than $6,992,546 as a short term capital gain dividend for purposes of the tax imposed under Section 871(a)(1)(A) of the Code for the fiscal year ended April 30, 2014.
Franklin Strategic Series
Board Members and Officers
The name, year of birth and address of the officers and board members, as well as their affiliations, positions held with the Trust, principal occupations during at least the past five years and number of portfolios overseen in the Franklin Templeton Investments fund complex are shown below. Generally, each board member serves until that person’s successor is elected and qualified.
| Independent Board Members | ||||
| Number of Portfolios in | ||||
| Name, Year of Birth | Length of | Fund Complex Overseen | Other Directorships Held | |
| and Address | Position | Time Served | by Board Member* | During at Least the Past 5 Years |
| Harris J. Ashton (1932) | Trustee | Since 1991 | 139 | Bar-S Foods (meat packing company) |
| One Franklin Parkway | (1981-2010). | |||
| San Mateo, CA 94403-1906 | ||||
| Principal Occupation During at Least the Past 5 Years: | ||||
| Director of various companies; and formerly, Director, RBC Holdings, Inc. (bank holding company) (until 2002); and President, Chief Executive | ||||
| Officer and Chairman of the Board, General Host Corporation (nursery and craft centers) (until 1998). | ||||
| Sam Ginn (1937) | Trustee | Since 2007 | 113 | ICO Global Communications |
| One Franklin Parkway | (Holdings) Limited (satellite company) | |||
| San Mateo, CA 94403-1906 | (2006-2010), Chevron Corporation | |||
| (global energy company) (1989-2009), | ||||
| Hewlett-Packard Company (technology | ||||
| company) (1996-2002), Safeway, Inc. | ||||
| (grocery retailer) (1991-1998) and | ||||
| TransAmerica Corporation (insurance | ||||
| company) (1989-1999). | ||||
| Principal Occupation During at Least the Past 5 Years: | ||||
| Private investor; Chairman, First Responder Network Authority (FirstNet) (interoperable wireless broadband network) (2012); and formerly, | ||||
| Chairman of the Board, Vodafone AirTouch, PLC (wireless company) (1999-2000); Chairman of the Board and Chief Executive Officer, | ||||
| AirTouch Communications (cellular communications) (1993-1998) and Pacific Telesis Group (telephone holding company) (1988-1994). | ||||
| Edith E. Holiday (1952) | Trustee | Since 1998 | 139 | Hess Corporation (exploration and |
| One Franklin Parkway | refining of oil and gas), H.J. Heinz | |||
| San Mateo, CA 94403-1906 | Company (processed foods and | |||
| allied products) (1994-2013), RTI | ||||
| International Metals, Inc. (manu- | ||||
| facture and distribution of titanium), | ||||
| Canadian National Railway (railroad) | ||||
| and White Mountains Insurance | ||||
| Group, Ltd. (holding company). | ||||
| Principal Occupation During at Least the Past 5 Years: | ||||
| Director or Trustee of various companies and trusts; and formerly, Assistant to the President of the United States and Secretary of the | ||||
| Cabinet (1990-1993); General Counsel to the United States Treasury Department (1989-1990); and Counselor to the Secretary and Assistant | ||||
| Secretary for Public Affairs and Public Liaison – United States Treasury Department (1988-1989). | ||||
| J. Michael Luttig (1954) | Trustee | Since 2009 | 139 | Boeing Capital Corporation (aircraft |
| One Franklin Parkway | financing) (2006-2013). | |||
| San Mateo, CA 94403-1906 | ||||
| Principal Occupation During at Least the Past 5 Years: | ||||
| Executive Vice President, General Counsel and member of the Executive Council, The Boeing Company (aerospace company); and formerly, | ||||
| Federal Appeals Court Judge, U.S. Court of Appeals for the Fourth Circuit (1991-2006). | ||||
| Annual Report | 79 | ||||
| Number of Portfolios in | ||||
| Name, Year of Birth | Length of | Fund Complex Overseen | Other Directorships Held | |
| and Address | Position | Time Served | by Board Member* | During at Least the Past 5 Years |
| Frank A. Olson (1932) | Trustee | Since 2007 | 139 | Hess Corporation (exploration and |
| One Franklin Parkway | refining of oil and gas) (1998-2013). | |||
| San Mateo, CA 94403-1906 | ||||
| Principal Occupation During at Least the Past 5 Years: | ||||
| Chairman Emeritus, The Hertz Corporation (car rental) (since 2000) (Chairman of the Board (1980-2000) and Chief Executive Officer | ||||
| (1977-1999)); and formerly, Chairman of the Board, President and Chief Executive Officer, UAL Corporation (airlines) (until 1987). | ||||
| Larry D. Thompson (1945) | Trustee | Since 2007 | 139 | Cbeyond, Inc. (business commu- |
| One Franklin Parkway | nications provider) (2010-2012), | |||
| San Mateo, CA 94403-1906 | The Southern Company (energy | |||
| company) (2010-2012) and Graham | ||||
| Holdings Company (formerly, | ||||
| The Washington Post Company) | ||||
| (education and media organization). | ||||
| Principal Occupation During at Least the Past 5 Years: | ||||
| Executive Vice President – Government Affairs, General Counsel and Corporate Secretary, PepsiCo, Inc. (consumer products) (2012-present); | ||||
| and formerly, John A. Sibley Professor of Corporate and Business Law, University of Georgia School of Law (2011-2012); Senior Vice | ||||
| President – Government Affairs, General Counsel and Secretary, PepsiCo, Inc. (2004-2011); Senior Fellow of The Brookings Institution | ||||
| (2003-2004); Visiting Professor, University of Georgia School of Law (2004); and Deputy Attorney General, U.S. Department of Justice | ||||
| (2001-2003). | ||||
| John B. Wilson (1959) | Lead | Trustee since | 113 | None |
| One Franklin Parkway | Independent | 2006 and Lead | ||
| San Mateo, CA 94403-1906 | Trustee | Independent | ||
| Trustee since | ||||
| 2008 | ||||
| Principal Occupation During at Least the Past 5 Years: | ||||
| President, Staples Europe (office supplies) (2012-present); President and Founder, Hyannis Port Capital, Inc. (real estate and private equity | ||||
| investing); serves on private and non-profit boards; and formerly, Chief Operating Officer and Executive Vice President, Gap, Inc. (retail) | ||||
| (1996-2000); Chief Financial Officer and Executive Vice President – Finance and Strategy, Staples, Inc. (1992-1996); Senior Vice President – | ||||
| Corporate Planning, Northwest Airlines, Inc. (airlines) (1990-1992); and Vice President and Partner, Bain & Company (consulting firm) | ||||
| (1986-1990). | ||||
| Interested Board Members and Officers | ||||
| Number of Portfolios in | ||||
| Name, Year of Birth | Length of | Fund Complex Overseen | Other Directorships Held | |
| and Address | Position | Time Served | by Board Member* | During at Least the Past 5 Years |
| **Gregory E. Johnson (1961) | Trustee | Since June 2013 | 149 | None |
| One Franklin Parkway | ||||
| San Mateo, CA 94403-1906 | ||||
| Principal Occupation During at Least the Past 5 Years: | ||||
| Chairman of the Board, Member – Office of the Chairman, Director, President and Chief Executive Officer, Franklin Resources, Inc.; officer | ||||
| and/or director or trustee, as the case may be, of some of the other subsidiaries of Franklin Resources, Inc. and of 44 of the investment | ||||
| companies in Franklin Templeton Investments; and Chairman, Investment Company Institute. | ||||
80 | Annual Report
| Number of Portfolios in | ||||
| Name, Year of Birth | Length of | Fund Complex Overseen | Other Directorships Held | |
| and Address | Position | Time Served | by Board Member* | During at Least the Past 5 Years |
| **Rupert H. Johnson, Jr. (1940) | Chairman of | Chairman of the | 139 | None |
| One Franklin Parkway | the Board and | Board since June | ||
| San Mateo, CA 94403-1906 | Trustee | 2013 and Trustee | ||
| since 1991 | ||||
| Principal Occupation During at Least the Past 5 Years: | ||||
| Vice Chairman, Member – Office of the Chairman and Director, Franklin Resources, Inc.; Director, Franklin Advisers, Inc.; Senior Vice | ||||
| President, Franklin Advisory Services, LLC; and officer and/or director or trustee, as the case may be, of some of the other subsidiaries of | ||||
| Franklin Resources, Inc. and of 41 of the investment companies in Franklin Templeton Investments. | ||||
| Alison E. Baur (1964) | Vice President | Since 2012 | Not Applicable | Not Applicable |
| One Franklin Parkway | ||||
| San Mateo, CA 94403-1906 | ||||
| Principal Occupation During at Least the Past 5 Years: | ||||
| Deputy General Counsel, Franklin Templeton Investments; and officer of some of the other subsidiaries of Franklin Resources, Inc. and of 46 | ||||
| of the investment companies in Franklin Templeton Investments. | ||||
| Laura F. Fergerson (1962) | Chief | Since 2009 | Not Applicable | Not Applicable |
| One Franklin Parkway | Executive | |||
| San Mateo, CA 94403-1906 | Officer – | |||
| Finance and | ||||
| Administration | ||||
| Principal Occupation During at Least the Past 5 Years: | ||||
| Senior Vice President, Franklin Templeton Services, LLC; and officer of 46 of the investment companies in Franklin Templeton Investments. | ||||
| Gaston Gardey (1967) | Treasurer, | Since 2009 | Not Applicable | Not Applicable |
| One Franklin Parkway | Chief Financial | |||
| San Mateo, CA 94403-1906 | Officer and | |||
| Chief | ||||
| Accounting | ||||
| Officer | ||||
| Principal Occupation During at Least the Past 5 Years: | ||||
| Director, Fund Accounting, Franklin Templeton Investments; and officer of 27 of the investment companies in Franklin Templeton Investments. | ||||
| Aliya S. Gordon (1973) | Vice President | Since 2009 | Not Applicable | Not Applicable |
| One Franklin Parkway | ||||
| San Mateo, CA 94403-1906 | ||||
| Principal Occupation During at Least the Past 5 Years: | ||||
| Senior Associate General Counsel, Franklin Templeton Investments; officer of 46 of the investment companies in Franklin Templeton | ||||
| Investments; and formerly, Litigation Associate, Steefel, Levitt & Weiss, LLP (2000-2004). | ||||
| Steven J. Gray (1955) | Vice President | Since 2009 | Not Applicable | Not Applicable |
| One Franklin Parkway | ||||
| San Mateo, CA 94403-1906 | ||||
| Principal Occupation During at Least the Past 5 Years: | ||||
| Senior Associate General Counsel, Franklin Templeton Investments; Vice President, Franklin Templeton Distributors, Inc. and Franklin | ||||
| Alternative Strategies Advisers, LLC; and officer of 46 of the investment companies in Franklin Templeton Investments. | ||||

| Number of Portfolios in | ||||
| Name, Year of Birth | Length of | Fund Complex Overseen | Other Directorships Held | |
| and Address | Position | Time Served | by Board Member* | During at Least the Past 5 Years |
| Selena L. Holmes (1965) | Vice President | Since 2012 | Not Applicable | Not Applicable |
| 100 Fountain Parkway | – AML | |||
| St. Petersburg, FL 33716-1205 | Compliance | |||
| Principal Occupation During at Least the Past 5 Years: | ||||
| Director, Global Compliance Monitoring; Deputy Chief Compliance Officer, Franklin Alternative Strategies Advisers, LLC; and officer of 46 of | ||||
| the investment companies in Franklin Templeton Investments. | ||||
| Edward B. Jamieson (1948) | President and | Since 2010 | Not Applicable | Not Applicable |
| One Franklin Parkway | Chief | |||
| San Mateo, CA 94403-1906 | Executive | |||
| Officer – | ||||
| Investment | ||||
| Management | ||||
| Principal Occupation During at Least the Past 5 Years: | ||||
| President, Chief Investment Officer and Director, Franklin Advisers, Inc.; Executive Vice President, Franklin Templeton Institutional, LLC; | ||||
| and officer and/or trustee, as the case may be, of some of the other subsidiaries of Franklin Resources, Inc. and of 10 of the investment | ||||
| companies in Franklin Templeton Investments. | ||||
| Christopher J. Molumphy (1962) | Vice President | Since 2000 | Not Applicable | Not Applicable |
| One Franklin Parkway | ||||
| San Mateo, CA 94403-1906 | ||||
| Principal Occupation During at Least the Past 5 Years: | ||||
| Director and Executive Vice President, Franklin Advisers, Inc.; Executive Vice President, Franklin Templeton Institutional, LLC; and officer of | ||||
| some of the other subsidiaries of Franklin Resources, Inc. and of 22 of the investment companies in Franklin Templeton Investments. | ||||
| Kimberly H. Novotny (1972) | Vice President | Since 2013 | Not Applicable | Not Applicable |
| 300 S.E. 2nd Street | ||||
| Fort Lauderdale, FL 33301-1923 | ||||
| Principal Occupation During at Least the Past 5 Years: | ||||
| Associate General Counsel, Franklin Templeton Investments; Vice President and Secretary, Fiduciary Trust International of the South; Vice | ||||
| President, Templeton Investment Counsel, LLC; Assistant Secretary, Franklin Resources, Inc.; and officer of 46 of the investment companies | ||||
| in Franklin Templeton Investments. | ||||
| Robert C. Rosselot (1960) | Chief | Since 2013 | Not Applicable | Not Applicable |
| 300 S.E. 2nd Street | Compliance | |||
| Fort Lauderdale, FL 33301-1923 | Officer | |||
| Principal Occupation During at Least the Past 5 Years: | ||||
| Director, Global Compliance, Franklin Templeton Investments; Vice President, Franklin Templeton Companies, LLC; officer of 46 of the | ||||
| investment companies in Franklin Templeton Investments; and formerly, Senior Associate General Counsel, Franklin Templeton Investments | ||||
| (2007-2013); and Secretary and Vice President, Templeton Group of Funds (2004-2013). | ||||
| Karen L. Skidmore (1952) | Vice President | Since 2006 | Not Applicable | Not Applicable |
| One Franklin Parkway | and Secretary | |||
| San Mateo, CA 94403-1906 | ||||
| Principal Occupation During at Least the Past 5 Years: | ||||
| Senior Associate General Counsel, Franklin Templeton Investments; and officer of 46 of the investment companies in Franklin | ||||
| Templeton Investments. | ||||
82 | Annual Report
| Number of Portfolios in | ||||
| Name, Year of Birth | Length of | Fund Complex Overseen | Other Directorships Held | |
| and Address | Position | Time Served | by Board Member* | During at Least the Past 5 Years |
| Craig S. Tyle (1960) | Vice President | Since 2005 | Not Applicable | Not Applicable |
| One Franklin Parkway | ||||
| San Mateo, CA 94403-1906 | ||||
| Principal Occupation During at Least the Past 5 Years: | ||||
| General Counsel and Executive Vice President, Franklin Resources, Inc.; and officer of some of the other subsidiaries of Franklin Resources, | ||||
| Inc. and of 46 of the investment companies in Franklin Templeton Investments. | ||||
| Lori A. Weber (1964) | Vice President | Since 2011 | Not Applicable | Not Applicable |
| 300 S.E. 2nd Street | ||||
| Fort Lauderdale, FL 33301-1923 | ||||
| Principal Occupation During at Least the Past 5 Years: | ||||
| Senior Associate General Counsel, Franklin Templeton Investments; Assistant Secretary, Franklin Resources, Inc.; Vice President and | ||||
| Secretary, Templeton Investment Counsel, LLC; Vice President, Fiduciary Trust International of the South; and officer of 46 of the investment | ||||
| companies in Franklin Templeton Investments. | ||||
*We base the number of portfolios on each separate series of the U.S. registered investment companies within the Franklin Templeton Investments fund complex. These portfolios have a common investment manager or affiliated investment managers.
**Gregory E. Johnson is considered to be an interested person of the Fund under the federal securities laws due to his position as an officer and director of Franklin Resources, Inc. (Resources), which is the parent company of the Fund’s investment manager and distributor. Rupert H. Johnson, Jr. is considered to be an interested person of the Fund under the federal securities laws due to his position as officer and director and major shareholder of Resources.
Note 1: Rupert H. Johnson, Jr. is the uncle of Gregory E. Johnson.
Note 2: Officer information is current as of the date of this report. It is possible that after this date, information about officers may change. Note 3: Effective June 13, 2013, Charles B. Johnson ceased to be a trustee of the Fund.
The Sarbanes-Oxley Act of 2002 and Rules adopted by the Securities and Exchange Commission require the Fund to disclose whether the Fund’s Audit Committee includes at least one member who is an audit committee financial expert within the meaning of such Act and Rules. The Fund’s Board has determined that there is at least one such financial expert on the Audit Committee and has designated John B. Wilson as its audit committee financial expert. The Board believes that Mr. Wilson qualifies as such an expert in view of his extensive business background and experience, including service as chief financial officer of Staples, Inc. from 1992 to 1996. Mr. Wilson has been a Member and Chairman of the Fund’s Audit Committee since 2006. As a result of such background and experience, the Board believes that Mr. Wilson has acquired an understanding of generally accepted accounting principles and financial statements, the general application of such principles in connection with the accounting estimates, accruals and reserves, and analyzing and evaluating financial statements that present a breadth and level of complexity of accounting issues generally comparable to those of the Fund, as well as an understanding of internal controls and procedures for financial reporting and an understanding of audit committee functions. Mr. Wilson is an independent Board member as that term is defined under the relevant Securities and Exchange Commission Rules and Releases.
The Statement of Additional Information (SAI) includes additional information about the board members and is available, without charge, upon request. Shareholders may call (800) DIAL BEN/ 342-5236 to request the SAI.
Annual Report | 83
Franklin Strategic Series
Shareholder Information
Franklin Strategic Income Fund
Board Review of Investment Management Agreement
At a meeting held April 15, 2014, the Board of Trustees (Board), including a majority of non-interested or independent Trustees, approved renewal of the investment management agreement for each of the separate funds within the Trust, including Franklin Strategic Income Fund (Fund(s)). In reaching this decision, the Board took into account information furnished throughout the year at regular Board meetings, as well as information prepared specifically in connection with the annual renewal review process. Information furnished and discussed throughout the year included investment performance reports and related financial information for each Fund, along with periodic reports on expenses, shareholder services, legal and compliance matters, pricing, brokerage commissions and execution and other services provided by the Investment Manager (Manager) and its affiliates. Information furnished specifically in connection with the renewal process included a report for each Fund prepared by Lipper, Inc. (Lipper), an independent organization, as well as additional material, including a Fund profitability analysis prepared by management. The Lipper reports compared each Fund’s investment performance and expenses with those of other mutual funds deemed comparable to the Fund as selected by Lipper. The Fund profitability analysis discussed the profitability to Franklin Templeton Investments from its overall U.S. fund operations, as well as on an individual fund-by-fund basis. Additional material accompanying such profitability analysis included information on a fund-by-fund basis listing portfolio managers and other accounts they manage, as well as information on management fees charged by the Manager and its affiliates to U.S. mutual funds and other accounts, including management’s explanation of differences where relevant. Such material also included a memorandum prepared by management describing project initiatives and capital investments relating to the services provided to the Funds by the Franklin Templeton Investments organization, as well as a memorandum relating to economies of scale and an analysis concerning transfer agent fees charged by an affiliate of the Manager.
In considering such materials, the independent Trustees received assistance and advice from and met separately with independent counsel. While the investment management agreements for all Funds were considered at the same Board meeting, the Board dealt with each Fund separately. In approving continuance of the investment management agreement for each Fund, the Board, including a majority of independent Trustees, determined that the existing management fee structure was fair and reasonable and that continuance of the investment management agreement was in the best interests of each Fund and its shareholders. While attention was given to all information furnished, the following discusses some primary factors relevant to the Board’s decision.
NATURE, EXTENT AND QUALITY OF SERVICE. The Board was satisfied with the nature and quality of the overall services provided by the Manager and its affiliates to the Fund and its shareholders. In addition to investment performance and expenses discussed later, the Board’s opinion was based, in part, upon periodic reports furnished it showing that the investment policies and restrictions for the Fund were consistently complied with as well as other reports periodically furnished the Board covering matters such as the compliance of portfolio managers and other
84 | Annual Report
Franklin Strategic Series
Shareholder Information (continued)
Franklin Strategic Income Fund
Board Review of Investment Management Agreement (continued)
management personnel with the code of ethics adopted throughout the Franklin Templeton fund complex, the adherence to fair value pricing procedures established by the Board, and the accuracy of net asset value calculations. The Board also noted the extent of benefits provided Fund shareholders from being part of the Franklin Templeton family of funds, including the right to exchange investments between the same class of funds without a sales charge, the ability to reinvest Fund dividends into other funds and the right to combine holdings in other funds to obtain a reduced sales charge. Favorable consideration was given to management’s continual efforts and expenditures in establishing back-up systems and recovery procedures to function in the event of a natural disaster, it being noted that such systems and procedures had functioned well during the Florida hurricanes and blackouts experienced in previous years, and that those operations in the New York/New Jersey area ran smoothly during the period of the 2012 Hurricane Sandy. Among other factors taken into account by the Board were the Manager’s best execution trading policies, including a favorable report by an independent portfolio trading analytical firm, which also covered FOREX transactions. Consideration was also given to the experience of the Fund’s portfolio management team, the number of accounts managed and general method of compensation. In this latter respect, the Board noted that a primary factor in management’s determination of a portfolio manager’s bonus compensation was the relative investment performance of the funds he or she managed and that a portion of such bonus was required to be invested in a predesignated list of funds within such person’s fund management area so as to be aligned with the interests of shareholders. The Board also took into account the quality of transfer agent and shareholder services provided Fund shareholders by an affiliate of the Manager, and the continual enhancements to the Franklin Templeton website. Particular attention was given to management’s conservative approach and diligent risk management procedures, including continual monitoring of counterparty credit risk and attention given to derivatives and other complex instruments, including expanded collateralization requirements. The Board also took into account, among other things, management’s efforts in establishing a global credit facility for the benefit of the Fund and other accounts managed by Franklin Templeton Investments to provide a source of cash for temporary and emergency purposes or to meet unusual redemption requests as well as the strong financial position of the Manager’s parent company and its commitment to the mutual fund business as evidenced by its subsidization of money market funds.
INVESTMENT PERFORMANCE. The Board placed significant emphasis on the investment performance of the Fund in view of its importance to shareholders. While consideration was given to performance reports and discussions with portfolio managers at Board meetings throughout the year, particular attention in assessing performance was given to the Lipper reports furnished for the agreement renewal. The Lipper reports prepared for the Fund showed the investment performance of its Class A shares in comparison to a performance universe selected by Lipper. Comparative performance for the Fund was shown for the one-year period ended January 31, 2014, and previous periods ended that date of up to 10 years. The performance universe for the Fund consisted of
Annual Report | 85
Franklin Strategic Series
Shareholder Information (continued)
Franklin Strategic Income Fund
Board Review of Investment Management Agreement (continued)
the Fund and all retail and institutional multi-sector income funds as selected by Lipper. The Lipper report comparison showed the Fund’s income return for the one-year period to be in the second-highest performing quintile of its performance universe, and on an annualized basis to also be in the second-highest performing quintile of such universe during each of the previous three- and 10-year periods, and in the middle performing quintile of such universe during the previous five-year period. The Lipper report showed the Fund’s total return for the one-year period to be in the second-highest performing quintile of its performance universe, and on an annualized basis to also be in the second-highest performing quintile of such universe for the previous three-and 10-year periods, and the second-lowest performing quintile of such universe for the previous five-year period. The Board was satisfied with the Fund’s investment performance as set forth in the Lipper report and noted its income oriented investment objective.
COMPARATIVE EXPENSES. Consideration was given to a comparative analysis of the management fees and total expense ratio of the Fund compared with those of a group of other funds selected by Lipper as its appropriate Lipper expense group. Lipper expense data is based upon information taken from each fund’s most recent annual report, which reflects historical asset levels that may be quite different from those currently existing, particularly in a period of market volatility. While recognizing such inherent limitation and the fact that expense ratios generally increase as assets decline and decrease as assets grow, the Board believed the independent analysis conducted by Lipper to be an appropriate measure of comparative expenses. In reviewing comparative costs, Lipper provides information on the Fund’s contractual investment management fee in comparison with the investment management fee that would have been charged by other funds within its Lipper expense group assuming they were similar in size to the Fund, as well as the actual total expense ratio of the Fund in comparison with those of its Lipper expense group. The Lipper contractual investment management fee analysis includes administrative charges as being part of the investment management fee, and actual total expenses, for comparative consistency, are shown by Lipper for Fund Class A shares. The results of such expense comparisons showed the contractual investment management fee rate for the Fund was below the median of its Lipper expense group, while its actual total expense ratio was in the least expensive quintile of such expense group. The Board was satisfied with the contractual management fee rate and total expense ratio of the Fund in comparison to its expense group as shown in the Lipper report.
MANAGEMENT PROFITABILITY. The Board also considered the level of profits realized by the Manager and its affiliates in connection with the operation of the Fund. In this respect, the Board reviewed the Fund profitability analysis that addresses the overall profitability of Franklin Templeton’s U.S. fund business, as well as its profits in providing management and other services to each of the individual funds during the 12-month period ended September 30, 2013, being the most recent fiscal year-end for Franklin Resources, Inc., the Manager’s parent. In reviewing the analysis, the Board recognized that allocation methodologies are inherently subjective and various
86 | Annual Report
Franklin Strategic Series
Shareholder Information (continued)
Franklin Strategic Income Fund
Board Review of Investment Management Agreement (continued)
allocation methodologies may be reasonable while producing different results. In this respect, the Board noted that while management continually makes refinements to its methodologies in response to organizational and product related changes, the overall approach as defined by the primary drivers and activity measurements has remained consistent with that used in the Fund’s profitability report presentations from prior years. Additionally, the Fund’s independent registered public accounting firm had been engaged by the Manager to periodically review the reasonableness of the allocation methodologies to be used solely by the Fund’s Board in reference to the profitability analysis. In reviewing and discussing such analysis, management discussed with the Board its belief that costs incurred in establishing the infrastructure necessary for the type of mutual fund operations conducted by the Manager and its affiliates may not be fully reflected in the expenses allocated to the Fund in determining its profitability, as well as the fact that the level of profits, to a certain extent, reflected operational cost savings and efficiencies initiated by management. The Board also took into account management’s expenditures in improving shareholder services provided the Fund, as well as the need to implement systems and meet additional regulatory and compliance requirements resulting from statutes such as the Sarbanes-Oxley and Dodd-Frank Acts and recent SEC and other regulatory requirements. In addition, the Board considered a third-party study comparing the profitability of the Manager’s parent on an overall basis to other publicly held managers broken down to show profitability from management operations exclusive of distribution expenses, as well as profitability including distribution expenses. The Board also considered the extent to which the Manager and its affiliates might derive ancillary benefits from fund operations, including revenues generated from transfer agent services and potential benefits resulting from allocation of fund brokerage and the use of commission dollars to pay for research. Based upon its consideration of all these factors, the Board determined that the level of profits realized by the Manager and its affiliates from providing services to the Fund was not excessive in view of the nature, quality and extent of services provided.
ECONOMIES OF SCALE. The Board also considered whether economies of scale are realized by the Manager as the Fund grows larger and the extent to which this is reflected in the level of management fees charged. While recognizing that any precise determination is inherently subjective, the Board noted that based upon the Fund profitability analysis, it appears that as some funds get larger, at some point economies of scale do result in the Manager realizing a larger profit margin on management services provided such a fund. The Board noted that economies of scale were shared with the Fund and its shareholders through management fee breakpoints so that as a fund grows in size, its effective management fee rate declines. The fee structure under the investment management agreement for the Fund contains breakpoints that continued to asset levels that exceeded its asset size at December 31, 2013. In view of such fee structure and the favorable expense comparisons of the Fund within its expense group, the Board believed that to the extent economies of scale may be realized by the manager of the Fund and its affiliates, that there was a sharing of benefits with the Fund and its shareholders.
Annual Report | 87
Franklin Strategic Series
Shareholder Information (continued)
Franklin Strategic Income Fund
Proxy Voting Policies and Procedures
The Fund’s investment manager has established Proxy Voting Policies and Procedures (Policies) that the Fund uses to determine how to vote proxies relating to portfolio securities. Shareholders may view the Fund’s complete Policies online at franklintempleton.com. Alternatively, shareholders may request copies of the Policies free of charge by calling the Proxy Group collect at (954) 527-7678 or by sending a written request to: Franklin Templeton Companies, LLC, 300 S.E. 2nd Street, Fort Lauderdale, FL 33301, Attention: Proxy Group. Copies of the Fund’s proxy voting records are also made available online at franklintempleton.com and posted on the U.S. Securities and Exchange Commission’s website at sec.gov and reflect the most recent 12-month period ended June 30.
Quarterly Statement of Investments
The Fund files a complete statement of investments with the U.S. Securities and Exchange Commission for the first and third quarters for each fiscal year on Form N-Q. Shareholders may view the filed Form N-Q by visiting the Commission’s website at sec.gov. The filed form may also be viewed and copied at the Commission’s Public Reference Room in Washington, DC. Information regarding the operations of the Public Reference Room may be obtained by calling (800) SEC-0330.
Householding of Reports and Prospectuses
You will receive the Fund’s financial reports every six months as well as an annual updated summary prospectus (prospectus available upon request). To reduce Fund expenses, we try to identify related shareholders in a household and send only one copy of the financial reports and summary prospectus. This process, called “householding,” will continue indefinitely unless you instruct us otherwise. If you prefer not to have these documents householded, please call us at (800) 632-2301. At any time you may view current prospectuses/summary prospectuses and financial reports on our website. If you choose, you may receive these documents through electronic delivery.
88 | Annual Report

Annual Report and Shareholder Letter
Franklin Strategic Income Fund
Investment Manager
Franklin Advisers, Inc.
Distributor
Franklin Templeton Distributors, Inc.
(800) DIAL BEN®/342-5236
franklintempleton.com
Shareholder Services
(800) 632-2301
Authorized for distribution only when accompanied or preceded by a summary prospectus and/or prospectus.
Investors should carefully consider a fund’s investment goals, risks, charges and expenses before investing.
A prospectus contains this and other information; please read it carefully before investing.
To help ensure we provide you with quality service, all calls to and from our service areas are monitored and/or recorded.
© 2014 Franklin Templeton Investments. All rights reserved. 194 A 06/14
| Contents | |||||||
| Shareholder Letter | 1 | Annual Report | Financial Highlights and | Report of Independent | |||
| Statements of Investments | 15 | Registered Public | |||||
| Franklin Global Government | |||||||
| Accounting Firm | 39 | ||||||
| Bond Fund | 3 | Financial Statements | 22 | ||||
| Tax Information | 40 | ||||||
| Performance Summary | 8 | Notes to | |||||
| Financial Statements | 26 | Board Members and Officers | 42 | ||||
| Your Fund’s Expenses | 13 | ||||||
| Shareholder Information | 47 | ||||||
Annual Report
Franklin Global Government Bond Fund
Your Fund’s Goal and Main Investments: Franklin Global Government Bond Fund seeks total return, consisting of interest income and capital appreciation. Under normal market conditions, the Fund invests at least 80% of its net assets in government bonds of issuers located around the world. Government bonds include floating and fixed rate debt securities of any maturity, such as bonds, notes, bills and debentures, issued or guaranteed by governments, government agencies or instrumentalities, including government-sponsored entities, supra-national entities and public-private partnerships.
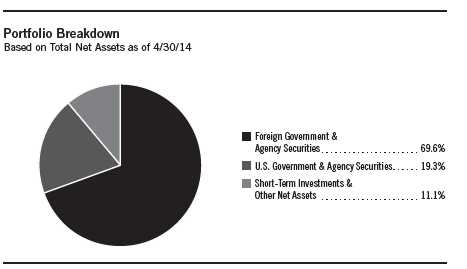
We are pleased to bring you Franklin Global Government Bond Fund’s inaugural annual report for the period since the Fund’s inception on September 6, 2013, through April 30, 2014.
Performance Overview
Franklin Global Government Bond Fund – Class A delivered a +5.81% cumulative total return from inception on September 6, 2013, through April 30, 2014. In comparison, global government bonds, as measured by the Fund’s benchmark, the Citigroup World Government Bond Index (WGBI), generated a +4.28% cumulative total return for the same period.1, 2 You can find more of the Fund’s performance data in the Performance Summary beginning on page 8.
| Performance data represent |
| past performance, which does |
| not guarantee future results. |
| Investment return and principal |
| value will fluctuate, and you may |
| have a gain or loss when you sell |
| your shares. Current performance |
| may differ from figures shown. |
| Please visit franklintempleton.com |
| or call (800) 342-5236 for most |
| recent month-end performance. |
The dollar value, number of shares or principal amount, and names of all portfolio holdings are listed in the Fund’s Statement of Investments (SOI). The SOI begins on page 20.
Annual Report | 3
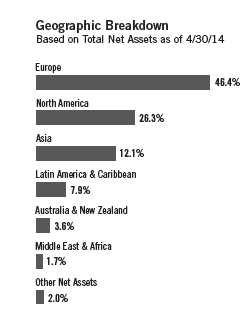
Economic and Market Overview
Global government debt generally delivered healthy returns during the period covering the Fund’s inception on September 6, 2013, through April 30, 2014, although non-government bonds generally performed better than higher rated government bonds amid increased investor appetite for yield and risk. Government bond yields experienced heightened volatility during the first part of the review period based on speculation about the U.S. Federal Reserve Board’s (Fed’s) potential reductions to its asset purchase program. In December 2013, the Fed decided that the U.S. economy was showing enough momentum to begin tapering its purchases in January 2014. The Fed’s confirmation sparked a further sell-off in the U.S. Treasury market. Yields, which generally move in the opposite direction of prices, ended 2013 at their highest level since mid-2011, and many government bond markets outside the U.S. had similar results. However, U.S. Treasury yields declined during the first quarter of 2014, in part because of severe U.S. weather conditions that appeared to temporarily slow the U.S. economy’s steady expansion.
Among other sovereign bonds often seen as offering some protection from market volatility, German Bunds performed relatively well during the review period. Bunds benefited from growing expectations among investors of further monetary stimulus from the European Central Bank (ECB) in an effort to combat potential eurozone deflation. As inflation in the region fell to its lowest rate since 2009, other European sovereign bonds experienced even stronger gains, particularly among the more indebted eurozone members, where many sovereign yields reached multi-year lows.
Japanese government bonds also delivered solid returns, helped by the Bank of Japan’s (BoJ’s) continued purchases. However, Japan’s core inflation rate remained unchanged in February 2014 after moving steadily higher during 2013, which raised doubts about the effectiveness of government policies intended to counter the country’s enduring deflation and promote growth, particularly in light of an increase in consumption tax that occurred at the start of April.
Many emerging market assets experienced steep losses early in 2014 amid heightened concerns about the structural weakness of some emerging economies, particularly those countries largely seen as reliant on foreign inflows to finance trade and budget deficits. However, despite further unease surrounding events in Ukraine, most emerging market bonds staged a strong recovery to end higher for the period owing to renewed demand driven by investors’ appetite for yield and confidence in the relative strength of many countries’ sovereign balance sheets.
4 | Annual Report
| Dividend Distributions* | |||||
| 9/6/13–4/30/14 | |||||
| Dividend per Share (cents) | |||||
| Month | Class A | Class C | Class R | Class R6 | Advisor Class |
| October | 1.25 | 1.26 | 1.25 | 1.39 | 1.28 |
| November | 2.71 | 2.71 | 2.70 | 2.80 | 2.72 |
| December | 2.40 | 2.11 | 2.21 | 2.66 | 2.58 |
| January | 1.57 | 1.19 | 1.35 | 1.87 | 1.67 |
| February | 0.95 | 0.45 | 0.61 | 1.11 | 1.01 |
| March | 2.31 | 1.67 | 1.67 | 2.32 | 2.24 |
| April | 1.57 | 1.00 | 1.11 | 1.62 | 1.53 |
| Total | 12.76 | 10.39 | 10.90 | 13.77 | 13.03 |
| *All Fund distributions will vary depending upon current market conditions, and past distributions are not indicative | |||||
| of future trends. | |||||
Investment Strategy
We invest selectively in bonds around the world based upon our assessment of changing market, political and economic conditions. While seeking opportunities, we monitor various factors including interest rates, currency exchange rates and credit risks. We use top-down macroeconomic research, bottom-up sector-specific research and quantitative analysis to identify and to seek to exploit market inefficiencies while employing a disciplined risk management process. In pursuing the Fund’s investment goal, we may use various currency-related derivative instruments, including currency forward and currency futures contracts, as well as various interest rate/bond-related derivative instruments, including interest rate/bond futures contracts and swap agreements.
Manager’s Discussion
For the period from the Fund’s inception on September 6, 2013, through April 30, 2014, the Fund delivered positive absolute returns. Currency allocation, security selection and positions denominated in currencies other than the British pound and the G-3 currencies (U.S. dollar, euro and Japanese yen) were among the largest contributors to performance relative to the Citigroup WGBI. However, sector allocation detracted from relative results.
The Fund’s currency positioning contributed to relative performance, partly because of its underweighted allocation to the Japanese yen. After a period of relative stability, the Japanese currency was again hampered by BoJ policies aimed at defeating Japan’s persistent deflation. The yen reached a five-year low versus the U.S. dollar at 2013 year-end.
| What is a currency forward |
| contract? |
| A currency forward contract is an |
| agreement between the Fund and a |
| counterparty to buy or sell a foreign |
| currency at a specific exchange rate |
| on a future date. |
| What is a futures contract? |
| A futures contract is an agreement |
| between the Fund and a counterparty |
| made through a U.S. or foreign futures |
| exchange to buy or sell an asset at a |
| specific price on a future date. |
| What are swap agreements? |
| Swap agreements, such as interest rate, |
| currency and credit default swaps, are |
| contracts between the Fund and, typically, |
| a brokerage firm, bank, or other finan- |
| cial institution (the swap counterparty). |
| In a basic swap transaction, the Fund |
| agrees with its counterparty to exchange |
| the returns (or differentials in rates of |
| return) earned or realized on a particular |
| “notional amount” of underlying instru- |
| ments. The notional amount is the set |
| amount selected by the parties as the |
| basis on which to calculate the obliga- |
| tions that they have agreed to exchange. |
| The parties typically do not actually |
| exchange the notional amount. Instead, |
| they agree to exchange the returns that |
| would be earned or realized if the |
| notional amount were invested in given |
| instruments or at given interest rates. |
Annual Report | 5
| Currency Breakdown* | ||
| 4/30/14 | ||
| % of Total | ||
| Net Assets | ||
| North America | 49.8 | % |
| U.S. Dollar | 47.7 | % |
| Canadian Dollar | 2.1 | % |
| Europe | 33.8 | % |
| Euro | 24.3 | % |
| Polish Zloty | 4.8 | % |
| British Pound | 4.7 | % |
| Asia | 10.5 | % |
| Malaysian Ringgit | 5.4 | % |
| Singapore Dollar | 5.1 | % |
| Latin America & Caribbean | 3.9 | % |
| Mexican Peso | 3.9 | % |
| Middle East & Africa | 1.8 | % |
| South Africa Rand | 1.8 | % |
| Australia & New Zealand | 0.2 | % |
| Australian Dollar | 0.2 | % |
*Currency breakdown figures are intended to illustrate
the Fund’s estimated exposure to various currencies as
a percentage of the Fund’s total exposure, and reflects
both direct and indirect (long and short) exposures
through the Fund’s use of derivatives, such as swaps,
forwards, futures and options. Figures may not equal
100% or be negative due to rounding, use of derivatives,
unsettled trades or other factors.
The Fund’s security selection also boosted relative returns, mainly resulting from our preference for holding Italian government bonds and largely avoiding German Bunds. Italian bonds were among the eurozone bonds issued by the more indebted eurozone countries that performed strongly over the review period, with demand from investors supported by comparatively attractive yields, an absence of inflationary pressures as well as the possibility of ECB measures to ease monetary policy in the region.
The Fund’s positions denominated in currencies other than the British pound and the G-3 currencies made a positive, although smaller, contribution to relative performance, partly from an overweighted allocation to Australian bonds. During the period, the Reserve Bank of Australia signaled an end to its monetary easing cycle, announcing that it expected the country’s growth to improve and sparking a rally in the Australian dollar, which had previously fallen sharply against the U.S. dollar. In contrast, the Fund’s sector allocation weighed on relative returns, mainly during the period shortly after the Fund’s inception as the Fund built its initial allocations.
During the period, the Fund invested in bonds without the use of interest rate-related derivatives and achieved its foreign currency allocation exclusively through the underlying bond investments.
Thank you for your continued participation in Franklin Global Government Bond Fund. We look forward to serving your future investment needs.

6 | Annual Report
The foregoing information reflects our analysis, opinions and portfolio holdings as of April 30, 2014, the end of the
reporting period. The way we implement our main investment strategies and the resulting portfolio holdings may
change depending on factors such as market and economic conditions. These opinions may not be relied upon as
investment advice or an offer for a particular security. The information is not a complete analysis of every aspect
of any market, country, industry, security or the Fund. Statements of fact are from sources considered reliable,
but the investment manager makes no representation or warranty as to their completeness or accuracy. Although
historical performance is no guarantee of future results, these insights may help you understand our investment
management philosophy.
The index is unmanaged and includes reinvested interest. One cannot invest directly in an index, and an index is not
representative of the Fund’s portfolio.
1. Source: © 2014 Morningstar. All Rights Reserved. The information contained herein: (1) is proprietary to Morningstar
and/or its content providers; (2) may not be copied or distributed; and (3) is not warranted to be accurate, complete or
timely. Neither Morningstar nor its content providers are responsible for any damages or losses arising from any use of
this information.
2. © Citigroup Index LLC 2014. All rights reserved.
Annual Report | 7
Performance Summary as of 4/30/14
Your dividend income will vary depending on dividends or interest paid by securities in the Fund’s portfolio, adjusted for operating expenses of each class. Capital gain distributions are net profits realized from the sale of portfolio securities. The performance table and graphs do not reflect any taxes that a shareholder would pay on Fund dividends, capital gain distributions, if any, or any realized gains on the sale of Fund shares. Total return reflects reinvestment of the Fund’s dividends and capital gain distributions, if any, and any unrealized gains or losses.
| Net Asset Value | ||||||
| Share Class | 4/30/14 | 9/6/13 | Change | |||
| A | $ | 10.45 | $ | 10.00 | +$ | 0.45 |
| C | $ | 10.44 | $ | 10.00 | +$ | 0.44 |
| R | $ | 10.44 | $ | 10.00 | +$ | 0.44 |
| R6 | $ | 10.45 | $ | 10.00 | +$ | 0.45 |
| Advisor | $ | 10.49 | $ | 10.00 | +$ | 0.49 |
| Distributions | ||||
| Dividend | ||||
| Share Class | Income | |||
| A | (9/6/13–4/30/14) | $ | 0.1276 | |
| C | (9/6/13–4/30/14) | $ | 0.1039 | |
| R | (9/6/13–4/30/14) | $ | 0.1090 | |
| R6 | (9/6/13–4/30/14) | $ | 0.1377 | |
| Advisor | (9/6/13–4/30/14) | $ | 0.1303 |
8 | Annual Report
Performance Summary (continued)
Performance as of 4/30/141
Cumulative total return excludes sales charges. Average annual total returns include maximum sales charges. Class A: 4.25% maximum initial sales
charge; Class C: 1% contingent deferred sales charge in first year only; Class R/R6/Advisor Class: no sales charges.
| Cumulative | Average Annual | Average Annual | Total Annual Operating Expenses5 | ||||||||||
| Share Class | Total Return2 | Total Return3 | Total Return (3/31/14)4 | (with waiver) | (without waiver) | ||||||||
| A | 0.85 | % | 3.28 | % | |||||||||
| Since Inception (9/6/13) | + | 5.81 | % | + | 1.35 | % | + | 0.23 | % | ||||
| C | 1.25 | % | 3.68 | % | |||||||||
| Since Inception (9/6/13) | + | 5.46 | % | + | 4.46 | % | + | 3.35 | % | ||||
| R | 1.10 | % | 3.53 | % | |||||||||
| Since Inception (9/6/13) | + | 5.52 | % | + | 5.52 | % | + | 4.39 | % | ||||
| R6 | 0.51 | % | 2.94 | % | |||||||||
| Since Inception (9/6/13) | + | 5.91 | % | + | 5.91 | % | + | 4.73 | % | ||||
| Advisor | 0.60 | % | 3.03 | % | |||||||||
| Since Inception (9/6/13) | + | 6.24 | % | + | 6.24 | % | + | 4.87 | % | ||||
| 30-Day Standardized Yield6 | ||||
| Share Class | (with waiver) | (without waiver) | ||
| A | 1.60 | % | -1.18 | % |
| C | 1.13 | % | -1.78 | % |
| R | 1.27 | % | -1.62 | % |
| R6 | 1.85 | % | -1.08 | % |
| Advisor | 1.77 | % | -1.14 | % |
Performance data represent past performance, which does not guarantee future results. Investment return and principal value will fluctuate,
and you may have a gain or loss when you sell your shares. Current performance may differ from figures shown. For most recent month-end
performance, go to franklintempleton.com or call (800) 342-5236.
Annual Report | 9
Performance Summary (continued)
Total Return Index Comparison for a Hypothetical $10,000 Investment1
Total return represents the change in value of an investment over the periods shown. It includes any applicable, maximum sales charge, Fund expenses, account fees and reinvested distributions. The unmanaged index includes reinvestment of any income or distributions. It differs from the Fund in composition and does not pay management fees or expenses. One cannot invest directly in an index.
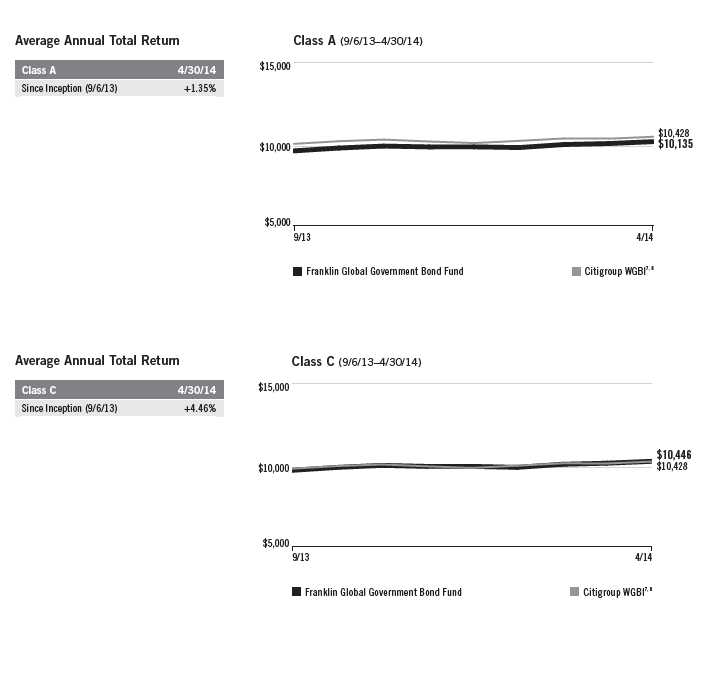
10 | Annual Report
Performance Summary (continued)
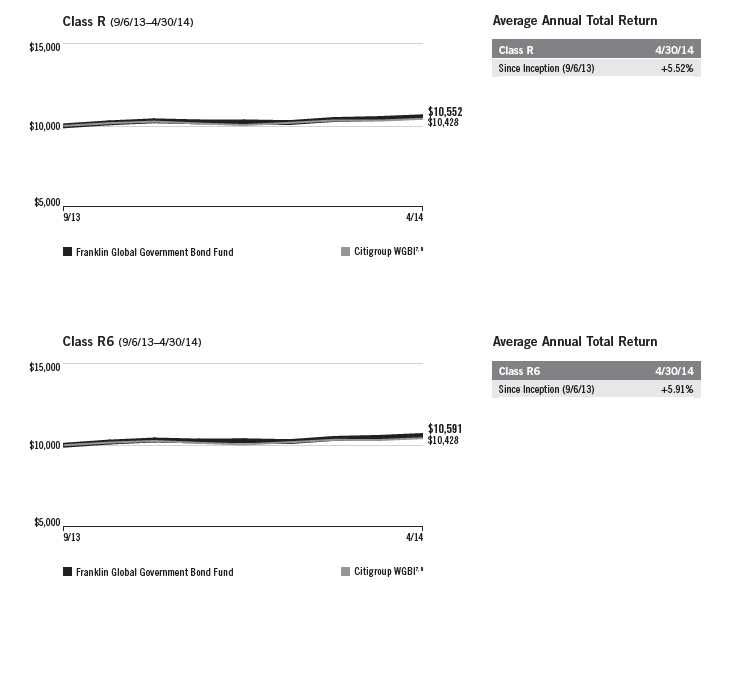

Performance Summary (continued)
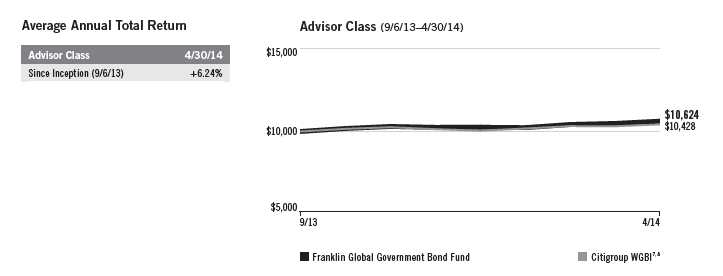
All investments involve risks, including possible loss of principal. Changes in interest rates will affect the value of
the Fund’s portfolio and its share price and yield. Bond prices generally move in the opposite direction of interest
rates. Thus, as prices of bonds in the Fund adjust to a rise in interest rates, the Fund’s share price may decline.
Special risks are associated with foreign investing, including currency rate fluctuations, economic instability and
political developments. Investments in developing markets involve heightened risks related to the same factors,
in addition to those associated with their relatively small size and lesser liquidity. Changes in the financial strength
of a bond issuer or in a bond’s credit rating may affect its value. Derivatives, including currency management
strategies, involve costs and can create economic leverage in the portfolio that may result in significant volatility
and cause the Fund to participate in losses (as well as enable gains) on an amount that exceeds the Fund’s initial
investment. The Fund may not achieve the anticipated benefits and may realize losses when a counterparty fails
to perform as promised. Currency rates may fluctuate significantly over short periods of time and can reduce
returns. The Fund is also nondiversified, which involves the risk of greater price fluctuation than a more diversified
portfolio. The Fund is actively managed but there is no guarantee that the manager’s investment decisions will
produce the desired results. The Fund’s prospectus also includes a description of the main investment risks.
Class C: These shares have higher annual fees and expenses than Class A shares.
Class R: Shares are available to certain eligible investors as described in the prospectus. These shares have
higher annual fees and expenses than Class A shares.
Class R6: Shares are available to certain eligible investors as described in the prospectus.
Advisor Class: Shares are available to certain eligible investors as described in the prospectus.
1. The Fund has an expense reduction contractually guaranteed through at least 9/6/14 and a fee waiver associated
with its investments in a Franklin Templeton money fund, contractually guaranteed through at least its current fiscal
year-end. Fund investment results reflect the expense reduction and fee waiver, to the extent applicable; without these
reductions, the results would have been lower.
2. Cumulative total return represents the change in value of an investment over the periods indicated.
3. Average annual total return represents the average annual change in value of an investment over the period indicated.
Since the Fund has existed for less than one year, performance is shown for the period since inception and is not annualized.
4. In accordance with SEC rules, we provide standardized total return information through the latest calendar quarter.
5. Figures are as stated in the Fund’s current prospectus. In periods of market volatility, assets may decline signifi-
cantly, causing total annual Fund operating expenses to become higher than the figures shown.
6. The 30-day standardized yield for the 30 days ended 4/30/14 reflects an estimated yield to maturity (assuming all
portfolio securities are held to maturity). It should be regarded as an estimate of the Fund’s rate of investment income,
and it may not equal the Fund’s actual income distribution rate (which reflects the Fund’s past dividends paid to
shareholders) or the income reported in the Fund’s financial statements.
7. Source: © 2014 Morningstar. The Citigroup WGBI is a market capitalization-weighted index consisting of investment-
grade world government bond markets.
8. © Citigroup Index LLC 2014. All rights reserved.
12 | Annual Report
Your Fund’s Expenses
Franklin Global Government Bond Fund
As a Fund shareholder, you can incur two types of costs:
- Transaction costs, including sales charges (loads) on Fund purchases; and
- Ongoing Fund costs, including management fees, distribution and service (12b-1) fees, and other Fund expenses. All mutual funds have ongoing costs, sometimes referred to as operating expenses.
The following table shows ongoing costs of investing in the Fund and can help you understand these costs and compare them with those of other mutual funds. The table assumes a $1,000 investment held for the six months indicated.
Actual Fund Expenses
The first line (Actual) for each share class listed in the table provides actual account values and expenses. The “Ending Account Value” is derived from the Fund’s actual return, which includes the effect of Fund expenses.
You can estimate the expenses you paid during the period by following these steps. Of course, your account value and expenses will differ from those in this illustration:
| 1. | Divide your account value by $1,000. |
| If an account had an $8,600 value, then $8,600 ÷ $1,000 = 8.6. | |
| 2. | Multiply the result by the number under the heading “Expenses Paid During Period.” |
| If Expenses Paid During Period were $7.50, then 8.6 x $7.50 = $64.50. |
In this illustration, the estimated expenses paid this period are $64.50.
Hypothetical Example for Comparison with Other Funds
Information in the second line (Hypothetical) for each class in the table can help you compare ongoing costs of investing in the Fund with those of other mutual funds. This information may not be used to estimate the actual ending account balance or expenses you paid during the period. The hypothetical “Ending Account Value” is based on the actual expense ratio for each class and an assumed 5% annual rate of return before expenses, which does not represent the Fund’s actual return. The figure under the heading “Expenses Paid During Period” shows the hypothetical expenses your account would have incurred under this scenario. You can compare this figure with the 5% hypothetical examples that appear in shareholder reports of other funds.
Annual Report | 13
Your Fund’s Expenses (continued)
Please note that expenses shown in the table are meant to highlight ongoing costs and do not reflect any transaction costs, such as sales charges. Therefore, the second line for each class is useful in comparing ongoing costs only, and will not help you compare total costs of owning different funds. In addition, if transaction costs were included, your total costs would have been higher. Please refer to the Fund prospectus for additional information on operating expenses.
| Beginning Account | Ending Account | Expenses Paid During | ||||
| Share Class | Value 11/1/13 | Value 4/30/14 | Period* 11/1/13–4/30/14 | |||
| A | ||||||
| Actual | $ | 1,000 | $ | 1,027.00 | $ | 2.86 |
| Hypothetical (5% return before expenses) | $ | 1,000 | $ | 1,021.97 | $ | 2.86 |
| C | ||||||
| Actual | $ | 1,000 | $ | 1,023.70 | $ | 5.82 |
| Hypothetical (5% return before expenses) | $ | 1,000 | $ | 1,019.04 | $ | 5.81 |
| R | ||||||
| Actual | $ | 1,000 | $ | 1,024.20 | $ | 5.07 |
| Hypothetical (5% return before expenses) | $ | 1,000 | $ | 1,019.79 | $ | 5.06 |
| R6 | ||||||
| Actual | $ | 1,000 | $ | 1,026.90 | $ | 2.56 |
| Hypothetical (5% return before expenses) | $ | 1,000 | $ | 1,022.27 | $ | 2.56 |
| Advisor | ||||||
| Actual | $ | 1,000 | $ | 1,031.20 | $ | 2.57 |
| Hypothetical (5% return before expenses) | $ | 1,000 | $ | 1,022.27 | $ | 2.56 |
*Expenses are calculated using the most recent six-month expense ratio, net of expense waivers, annualized for each class (A: 0.57%; C: 1.16%;
R: 1.01%; R6: 0.51%; and Advisor: 0.51%), multiplied by the average account value over the period, multiplied by 181/365 to reflect the one-half
year period.
14 | Annual Report
| Franklin Strategic Series | |||
| Financial Highlights | |||
| Franklin Global Government Bond Fund | |||
| Period Ended | |||
| April 30, | |||
| Class A | 2014 | a | |
| Per share operating performance | |||
| (for a share outstanding throughout the period) | |||
| Net asset value, beginning of period | $ | 10.00 | |
| Income from investment operationsb: | |||
| Net investment incomec | 0.11 | ||
| Net realized and unrealized gains (losses) | 0.47 | ||
| Total from investment operations | 0.58 | ||
| Less distributions from net investment income | (0.13 | ) | |
| Net asset value, end of period | $ | 10.45 | |
| Total returnd | 5.81 | % | |
| Ratios to average net assetse | |||
| Expenses before waiver and payments by affiliates | 3.22 | % | |
| Expenses net of waiver and payments by affiliates | 0.57 | % | |
| Net investment income | 1.62 | % | |
| Supplemental data | |||
| Net assets, end of period (000’s) | $ | 11,232 | |
| Portfolio turnover rate | 13.24 | % | |
aFor the period September 6, 2013 (commencement of operations) to April 30, 2014.
bThe amount shown for a share outstanding throughout the period may not correlate with the Statement of Operations for the period due to the timing of sales and repurchases of
the Fund shares in relation to income earned and/or fluctuating fair value of the investments of the Fund.
cBased on average daily shares outstanding.
dTotal return does not reflect sales commissions or contingent deferred sales charges, if applicable, and is not annualized for periods less than one year.
eRatios are annualized for periods less than one year.
Annual Report | The accompanying notes are an integral part of these financial statements. | 15
| Franklin Strategic Series | |||
| Financial Highlights (continued) | |||
| Franklin Global Government Bond Fund | |||
| Period Ended | |||
| April 30, | |||
| Class C | 2014 | a | |
| Per share operating performance | |||
| (for a share outstanding throughout the period) | |||
| Net asset value, beginning of period | $ | 10.00 | |
| Income from investment operationsb: | |||
| Net investment incomec | 0.08 | ||
| Net realized and unrealized gains (losses) | 0.46 | ||
| Total from investment operations | 0.54 | ||
| Less distributions from net investment income | (0.10 | ) | |
| Net asset value, end of period | $ | 10.44 | |
| Total returnd | 5.46 | % | |
| Ratios to average net assetse | |||
| Expenses before waiver and payments by affiliates | 3.81 | % | |
| Expenses net of waiver and payments by affiliates | 1.16 | % | |
| Net investment income | 1.03 | % | |
| Supplemental data | |||
| Net assets, end of period (000’s) | $ | 156 | |
| Portfolio turnover rate | 13.24 | % | |
aFor the period September 6, 2013 (commencement of operations) to April 30, 2014.
bThe amount shown for a share outstanding throughout the period may not correlate with the Statement of Operations for the period due to the timing of sales and repurchases of
the Fund shares in relation to income earned and/or fluctuating fair value of the investments of the Fund.
cBased on average daily shares outstanding.
dTotal return does not reflect sales commissions or contingent deferred sales charges, if applicable, and is not annualized for periods less than one year.
eRatios are annualized for periods less than one year.
16 | The accompanying notes are an integral part of these financial statements. | Annual Report
| Franklin Strategic Series | |||
| Financial Highlights (continued) | |||
| Franklin Global Government Bond Fund | |||
| Period Ended | |||
| April 30, | |||
| Class R | 2014 | a | |
| Per share operating performance | |||
| (for a share outstanding throughout the period) | |||
| Net asset value, beginning of period | $ | 10.00 | |
| Income from investment operationsb: | |||
| Net investment incomec | 0.08 | ||
| Net realized and unrealized gains (losses) | 0.47 | ||
| Total from investment operations | 0.55 | ||
| Less distributions from net investment income | (0.11 | ) | |
| Net asset value, end of period | $ | 10.44 | |
| Total returnd | 5.52 | % | |
| Ratios to average net assetse | |||
| Expenses before waiver and payments by affiliates | 3.66 | % | |
| Expenses net of waiver and payments by affiliates | 1.01 | % | |
| Net investment income | 1.18 | % | |
| Supplemental data | |||
| Net assets, end of period (000’s) | $ | 10 | |
| Portfolio turnover rate | 13.24 | % | |
aFor the period September 6, 2013 (commencement of operations) to April 30, 2014.
bThe amount shown for a share outstanding throughout the period may not correlate with the Statement of Operations for the period due to the timing of sales and repurchases of
the Fund shares in relation to income earned and/or fluctuating fair value of the investments of the Fund.
cBased on average daily shares outstanding.
dTotal return is not annualized for periods less than one year.
eRatios are annualized for periods less than one year.
Annual Report | The accompanying notes are an integral part of these financial statements. | 17
| Franklin Strategic Series | |||
| Financial Highlights (continued) | |||
| Franklin Global Government Bond Fund | |||
| Period Ended | |||
| April 30, | |||
| Class R6 | 2014 | a | |
| Per share operating performance | |||
| (for a share outstanding throughout the period) | |||
| Net asset value, beginning of period | $ | 10.00 | |
| Income from investment operationsb: | |||
| Net investment incomec | 0.11 | ||
| Net realized and unrealized gains (losses) | 0.48 | ||
| Total from investment operations | 0.59 | ||
| Less distributions from net investment income | (0.14 | ) | |
| Net asset value, end of period | $ | 10.45 | |
| Total returnd | 5.91 | % | |
| Ratios to average net assetse | |||
| Expenses before waiver and payments by affiliates | 3.78 | % | |
| Expenses net of waiver and payments by affiliates | 0.51 | % | |
| Net investment income | 1.68 | % | |
| Supplemental data | |||
| Net assets, end of period (000’s) | $ | 10 | |
| Portfolio turnover rate | 13.24 | % | |
aFor the period September 6, 2013 (commencement of operations) to April 30, 2014.
bThe amount shown for a share outstanding throughout the period may not correlate with the Statement of Operations for the period due to the timing of sales and repurchases of
the Fund shares in relation to income earned and/or fluctuating fair value of the investments of the Fund.
cBased on average daily shares outstanding.
dTotal return is not annualized for periods less than one year.
eRatios are annualized for periods less than one year.
18 | The accompanying notes are an integral part of these financial statements. | Annual Report
| Franklin Strategic Series | |||
| Financial Highlights (continued) | |||
| Franklin Global Government Bond Fund | |||
| Period Ended | |||
| April 30, | |||
| Advisor Class | 2014 | a | |
| Per share operating performance | |||
| (for a share outstanding throughout the period) | |||
| Net asset value, beginning of period | $ | 10.00 | |
| Income from investment operationsb: | |||
| Net investment incomec | 0.10 | ||
| Net realized and unrealized gains (losses) | 0.52 | ||
| Total from investment operations | 0.62 | ||
| Less distributions from net investment income | (0.13 | ) | |
| Net asset value, end of period | $ | 10.49 | |
| Total returnd | 6.24 | % | |
| Ratios to average net assetse | |||
| Expenses before waiver and payments by affiliates | 3.16 | % | |
| Expenses net of waiver and payments by affiliates | 0.51 | % | |
| Net investment income | 1.68 | % | |
| Supplemental data | |||
| Net assets, end of period (000’s) | $ | 10 | |
| Portfolio turnover rate | 13.24 | % | |
aFor the period September 6, 2013 (commencement of operations) to April 30, 2014.
bThe amount shown for a share outstanding throughout the period may not correlate with the Statement of Operations for the period due to the timing of sales and repurchases of
the Fund shares in relation to income earned and/or fluctuating fair value of the investments of the Fund.
cBased on average daily shares outstanding.
dTotal return is not annualized for periods less than one year.
eRatios are annualized for periods less than one year.
Annual Report | The accompanying notes are an integral part of these financial statements. | 19
Franklin Strategic Series
Statement of Investments, April 30, 2014
| Franklin Global Government Bond Fund | Country | Principal Amount* | Value | ||
| Foreign Government and Agency Securities 69.6% | |||||
| France Treasury Note, 1.75%, 2/25/17 | France | 150,000 | EUR | $ | 216,310 |
| Government of Canada, 2.75%, 6/01/22 | Canada | 250,000 | CAD | 238,034 | |
| Government of Chile, 3.875%, 8/05/20 | Chile | 100,000 | 107,150 | ||
| aGovernment of Finland, Reg S, 1.75%, 4/15/16 | Finland | 300,000 | EUR | 428,843 | |
| Government of France, 3.25%, 4/25/16 | France | 150,000 | EUR | 220,421 | |
| Government of Germany, 2.25%, 4/10/15 | Germany | 150,000 | EUR | 212,138 | |
| aGovernment of Indonesia, Reg S, 4.875%, 5/05/21 | Indonesia | 200,000 | 207,250 | ||
| aGovernment of Lithuania, senior note, Reg S, 6.625%, 2/01/22 | Lithuania | 200,000 | 238,591 | ||
| Government of Malaysia, | |||||
| 3.197%, 10/15/15 | Malaysia | 650,000 | MYR | 199,373 | |
| senior bond, 4.24%, 2/07/18 | Malaysia | 650,000 | MYR | 204,633 | |
| Government of Mexico, | |||||
| 7.75%, 12/14/17 | Mexico | 25,000b MXN | 210,287 | ||
| 8.00%, 12/07/23 | Mexico | 25,000b MXN | 216,805 | ||
| senior bond, 5.95%, 3/19/19 | Mexico | 100,000 | 116,750 | ||
| Government of Peru, 6.55%, 3/14/37 | Peru | 200,000 | 248,044 | ||
| Government of Poland, | |||||
| 5.75%, 9/23/22 | Poland | 750,000 | PLN | 278,644 | |
| 4.00%, 10/25/23 | Poland | 750,000 | PLN | 247,094 | |
| aGovernment of Russia, senior bond, Reg S, 7.50%, 3/31/30 | Russia | 137,000 | 152,899 | ||
| Government of Singapore, 2.375%, 4/01/17 | Singapore | 350,000 | SGD | 293,738 | |
| aGovernment of Slovenia, Reg S, 5.125%, 3/30/26 | Slovenia | 140,000 | EUR | 215,969 | |
| Government of South Africa, 8.00%, 12/21/18 | South Africa | 2,000,000 | ZAR | 191,741 | |
| aGovernment of Spain, senior bond, Reg S, 4.40%, 10/31/23 | Spain | 350,000 | EUR | 543,824 | |
| aGovernment of the Netherlands, Reg S, 4.50%, 7/15/17 | Netherlands | 150,000 | EUR | 235,198 | |
| Italy Treasury Bond, | |||||
| 5.50%, 9/01/22 | Italy | 140,000 | EUR | 233,355 | |
| aReg S, 4.50%, 3/01/26 | Italy | 350,000 | EUR | 541,877 | |
| aReg S, 4.75%, 9/01/44 | Italy | 350,000 | EUR | 539,405 | |
| asenior bond, Reg S, 4.75%, 9/01/28 | Italy | 300,000 | EUR | 469,801 | |
| Queensland Treasury Corp., | |||||
| 5.75%, 7/22/24 | Australia | 200,000 | AUD | 205,548 | |
| senior note, 6.00%, 7/21/22 | Australia | 200,000 | AUD | 208,752 | |
| aUnited Kingdom Treasury Bond, Reg S, 4.00%, 9/07/16 | United Kingdom | 150,000 | GBP | 271,628 | |
| aUnited Kingdom Treasury Note, Reg S, 2.75%, 1/22/15 | United Kingdom | 150,000 | GBP | 257,583 | |
| Total Foreign Government and Agency Securities | |||||
| (Cost $7,465,752) | 7,951,685 | ||||
| U.S. Government and Agency Securities 19.3% | |||||
| U.S. Treasury Bond, | |||||
| 4.375%, 11/15/39 | United States | 180,000 | 211,106 | ||
| cIndex Linked, 3.375%, 4/15/32 | United States | 158,706 | 223,701 | ||
| U.S. Treasury Note, | |||||
| 0.25%, 12/15/14 | United States | 200,000 | 200,238 | ||
| 2.125%, 5/31/15 | United States | 200,000 | 204,328 | ||
| 0.375%, 1/15/16 | United States | 200,000 | 200,273 | ||
| 1.00%, 8/31/16 | United States | 200,000 | 202,000 | ||
| 1.875%, 8/31/17 | United States | 200,000 | 205,508 | ||
| 2.625%, 11/15/20 | United States | 200,000 | 206,250 | ||
20 | Annual Report
| Franklin Strategic Series | |||||
| Statement of Investments, April 30, 2014 (continued) | |||||
| Franklin Global Government Bond Fund | Country | Principal Amount* | Value | ||
| U.S. Government and Agency Securities (continued) | |||||
| U.S. Treasury Note, (continued) | |||||
| cIndex Linked, 1.625%, 1/15/15 | United States | 184,413 | $ | 188,937 | |
| cIndex Linked, 2.00%, 1/15/16 | United States | 177,415 | 188,219 | ||
| cIndex Linked, 1.25%, 7/15/20 | United States | 161,464 | 175,302 | ||
| Total U.S. Government and Agency Securities | |||||
| (Cost $2,165,307) | 2,205,862 | ||||
| Total Investments before Short Term Investments | |||||
| (Cost $9,631,059) | 10,157,547 | ||||
| Short Term Investments 9.1% | |||||
| Foreign Government and Agency Securities 4.2% | |||||
| Government of Malaysia, 3.434%, 8/15/14 | Malaysia | 650,000 | MYR | 199,513 | |
| Government of Singapore, senior note, 1.375%, 10/01/14 | Singapore | 350,000 | SGD | 280,399 | |
| Total Foreign Government and Agency Securities | |||||
| (Cost $471,758) | 479,912 | ||||
| Total Investments before Money Market Funds | |||||
| (Cost $10,102,817) | 10,637,459 | ||||
| Shares | |||||
| Money Market Funds (Cost $550,067) 4.9% | |||||
| dInstitutional Fiduciary Trust Money Market Portfolio | United States | 550,067 | 550,067 | ||
| Total Investments (Cost $10,652,884) 98.0% | 11,187,526 | ||||
| Other Assets, less Liabilities 2.0% | 231,872 | ||||
| Net Assets 100.0% | $ | 11,419,398 | |||
*The principal amount is stated in U.S. dollars unless otherwise indicated.
aSecurity was purchased pursuant to Regulation S under the Securities Act of 1933, which exempts from registration securities offered and sold outside of the United States.
Such a security cannot be sold in the United States without either an effective registration statement filed pursuant to the Securities Act of 1933, or pursuant to an exemption
from registration. These securities have been deemed liquid under guidelines approved by the Trust’s Board of Trustees. At April 30, 2014, the aggregate value of these securities
was $4,102,868, representing 35.93% of net assets.
bPrincipal amount is stated in 100 Mexican Peso Units.
cPrincipal amount of security is adjusted for inflation. See Note 1(e).
dSee Note 3(f) regarding investments in the Institutional Fiduciary Trust Money Market Portfolio.
At April 30, 2014, the Fund had the following forward exchange contracts outstanding. See Note 1(c).
| Forward Exchange Contracts | |||||||||||
| Contract | Settlement | Unrealized | Unrealized | ||||||||
| Currency | Counterpartya | Type | Quantity | Amount | Date | Appreciation | Depreciation | ||||
| Australian Dollar | BZWS | Sell | 430,000 | $ | 382,141 | 6/11/14 | $ | — | $ | (16,134 | ) |
| Euro | CITI | Sell | 800,000 | 1,100,403 | 6/11/14 | — | (9,240 | ) | |||
| Net unrealized appreciation (depreciation) | $ | (25,374 | ) | ||||||||
| aMay be comprised of multiple contracts using the same currency and settlement date. | |||||||||||
| See Abbreviations on page 38. | |||||||||||
Annual Report | The accompanying notes are an integral part of these financial statements. | 21
| Franklin Strategic Series | |||
| Financial Statements | |||
| Statement of Assets and Liabilities | |||
| April 30, 2014 | |||
| Franklin | |||
| Global | |||
| Government | |||
| Bond Fund | |||
| Assets: | |||
| Investments in securities: | |||
| Cost - Unaffiliated issuers | $ | 10,102,817 | |
| Cost - Sweep Money Fund (Note 3f) | 550,067 | ||
| Total cost of investments | $ | 10,652,884 | |
| Value - Unaffiliated issuers | $ | 10,637,459 | |
| Value - Sweep Money Fund (Note 3f) | 550,067 | ||
| Total value of investments | 11,187,526 | ||
| Foreign currency, at value (cost $115,531) | 115,378 | ||
| Receivables: | |||
| Capital shares sold | 4,000 | ||
| Interest | 102,557 | ||
| Affiliates | 27,123 | ||
| Offering costs | 58,771 | ||
| Other assets | 6 | ||
| Total assets | 11,495,361 | ||
| Liabilities: | |||
| Payables: | |||
| Distribution fees | 999 | ||
| Transfer agent fees | 415 | ||
| Reports to shareholders | 4,395 | ||
| Professional fees | 42,770 | ||
| Unrealized depreciation on forward exchange contracts | 25,374 | ||
| Accrued expenses and other liabilities | 2,010 | ||
| Total liabilities | 75,963 | ||
| Net assets, at value | $ | 11,419,398 | |
| Net assets consist of: | |||
| Paid-in capital | $ | 10,921,771 | |
| Distributions in excess of net investment income | (9,958 | ) | |
| Net unrealized appreciation (depreciation) | 509,579 | ||
| Accumulated net realized gain (loss) | (1,994 | ) | |
| Net assets, at value | $ | 11,419,398 | |
22 | The accompanying notes are an integral part of these financial statements. | Annual Report
| Franklin Strategic Series | |||
| Financial Statements (continued) | |||
| Statement of Assets and Liabilities (continued) | |||
| April 30, 2014 | |||
| Franklin | |||
| Global | |||
| Government | |||
| Bond Fund | |||
| Class A: | |||
| Net assets, at value | $ | 11,232,263 | |
| Shares outstanding | 1,074,368 | ||
| Net asset value per sharea | $ | 10.45 | |
| Maximum offering price per share (net asset value per share ÷ 95.75%) | $ | 10.91 | |
| Class C: | |||
| Net assets, at value | $ | 155,752 | |
| Shares outstanding | 14,922 | ||
| Net asset value and maximum offering price per sharea | $ | 10.44 | |
| Class R: | |||
| Net assets, at value | $ | 10,444 | |
| Shares outstanding | 1,000 | ||
| Net asset value and maximum offering price per share | $ | 10.44 | |
| Class R6: | |||
| Net assets, at value | $ | 10,449 | |
| Shares outstanding | 1,000 | ||
| Net asset value and maximum offering price per share | $ | 10.45 | |
| Advisor Class: | |||
| Net assets, at value | $ | 10,490 | |
| Shares outstanding | 1,000 | ||
| Net asset value and maximum offering price per share | $ | 10.49 | |
| aRedemption price is equal to net asset value less contingent deferred sales charges, if applicable. | |||
Annual Report | The accompanying notes are an integral part of these financial statements. | 23
| Franklin Strategic Series | |||
| Financial Statements (continued) | |||
| Statement of Operations | |||
| for the period ended April 30, 2014a | |||
| Franklin | |||
| Global | |||
| Government | |||
| Bond Fund | |||
| Investment income: | |||
| Interest (net of foreign taxes of $5,254) | $ | 151,369 | |
| Expenses: | |||
| Management fees (Note 3a) | 44,954 | ||
| Distribution fees: (Note 3c) | |||
| Class A | 4,315 | ||
| Class C | 274 | ||
| Class R | 33 | ||
| Transfer agent fees: (Note 3e) | |||
| Class A | 990 | ||
| Class C | 6 | ||
| Class R | 1 | ||
| Class R6 | 42 | ||
| Advisor Class | 3 | ||
| Custodian fees (Note 4) | 1,045 | ||
| Reports to shareholders | 9,687 | ||
| Registration and filing fees | 6,743 | ||
| Professional fees | 44,263 | ||
| Amortization of offering costs | 108,816 | ||
| Other | 2,616 | ||
| Total expenses | 223,788 | ||
| Expenses waived/paid by affiliates (Note 3g) | (183,569 | ) | |
| Net expenses | 40,219 | ||
| Net investment income | 111,150 | ||
| Realized and unrealized gains (losses): | |||
| Net realized gain (loss) from: | |||
| Investments | 18,703 | ||
| Foreign currency transactions | (30,232 | ) | |
| Net realized gain (loss) | (11,529 | ) | |
| Net change in unrealized appreciation (depreciation) on: | |||
| Investments | 534,642 | ||
| Translation of other assets and liabilities denominated in foreign currencies | (25,063 | ) | |
| Net change in unrealized appreciation (depreciation) | 509,579 | ||
| Net realized and unrealized gain (loss) | 498,050 | ||
| Net increase (decrease) in net assets resulting from operations | $ | 609,200 | |
| aFor the period September 6, 2013 (commencement of operations) to April 30, 2014. | |||
24 | The accompanying notes are an integral part of these financial statements. | Annual Report
| Franklin Strategic Series | |||
| Financial Statements (continued) | |||
| Statement of Changes in Net Assets | |||
| Franklin Global | |||
| Government | |||
| Bond Fund | |||
| Period Ended | |||
| April 30, 2014a | |||
| Increase (decrease) in net assets: | |||
| Operations: | |||
| Net investment income | $ | 111,150 | |
| Net realized gain (loss) from investments and foreign currency transactions | (11,529 | ) | |
| Net change in unrealized appreciation (depreciation) on investments and translation of other assets and liabilities | |||
| denominated in foreign currencies | 509,579 | ||
| Net increase (decrease) in net assets resulting from operations | 609,200 | ||
| Distributions to shareholders from: | |||
| Net investment income: | |||
| Class A | (132,443 | ) | |
| Class C | (625 | ) | |
| Class R | (109 | ) | |
| Class R6 | (138 | ) | |
| Advisor Class | (454 | ) | |
| Total distributions to shareholders | (133,769 | ) | |
| Capital share transactions: (Note 2) | |||
| Class A | 10,760,752 | ||
| Class C | 152,968 | ||
| Class R | 10,000 | ||
| Class R6 | 10,000 | ||
| Advisor Class | 10,247 | ||
| Total capital share transactions | 10,943,967 | ||
| Net increase (decrease) in net assets | 11,419,398 | ||
| Net assets: | |||
| End of period | $ | 11,419,398 | |
| Distributions in excess of net investment income included in net assets: | |||
| End of period | $ | (9,958 | ) |
| aFor the period September 6, 2013 (commencement of operations) to April 30, 2014. | |||
Annual Report | The accompanying notes are an integral part of these financial statements. | 25
Franklin Strategic Series
Notes to Financial Statements
Franklin Global Government Bond Fund
1. ORGANIZATION AND SIGNIFICANT ACCOUNTING POLICIES
Franklin Strategic Series (Trust) is registered under the Investment Company Act of 1940, as amended, (1940 Act) as an open-end management investment company, consisting of nine separate funds. The Franklin Global Government Bond Fund (Fund) is included in this report. The financial statements of the remaining funds in the Trust are presented separately. Effective September 6, 2013, the Fund commenced operations offering five classes of shares: Class A, Class C, Class R, Class R6, and Advisor Class. Each class of shares differs by its initial sales load, contingent deferred sales charges, voting rights on matters affecting a single class, its exchange privilege and fees primarily due to differing arrangements for distribution and transfer agent fees.
The following summarizes the Fund’s significant accounting policies.
a. Financial Instrument Valuation
The Fund’s investments in financial instruments are carried at fair value daily. Fair value is the price that would be received to sell an asset or paid to transfer a liability in an orderly transaction between market participants on the measurement date. The Fund calculates the net asset value per share at the close of the New York Stock Exchange (NYSE), generally at 4 p.m. Eastern time (NYSE close) on each day the NYSE is open for trading. Under procedures approved by the Trust’s Board of Trustees (the Board), the Fund’s administrator, investment manager and other affiliates have formed the Valuation and Liquidity Oversight Committee (VLOC). The VLOC provides administration and oversight of the Fund’s valuation policies and procedures, which are approved annually by the Board. Among other things, these procedures allow the Fund to utilize independent pricing services, quotations from securities and financial instrument dealers, and other market sources to determine fair value.
Debt securities generally trade in the over-the-counter (OTC) market rather than on a securities exchange. The Fund’s pricing services use multiple valuation techniques to determine fair value. In instances where sufficient market activity exists, the pricing services may utilize a market-based approach through which quotes from market makers are used to determine fair value. In instances where sufficient market activity may not exist or is limited, the pricing services also utilize proprietary valuation models which may consider market characteristics such as benchmark yield curves, credit spreads, estimated default rates, anticipated market interest rate volatility, coupon rates, anticipated timing of principal repayments, underlying collateral, and other unique security features in order to estimate the relevant cash flows, which are then discounted to calculate the fair value. Securities denominated in a foreign currency are converted into their U.S. dollar equivalent at the foreign exchange rate in effect at the NYSE close on the date that the values of the foreign debt securities are determined. Investments in open-end mutual funds are valued at the closing net asset value.
26 | Annual Report
Franklin Strategic Series
Notes to Financial Statements (continued)
Franklin Global Government Bond Fund
| 1. | ORGANIZATION AND SIGNIFICANT ACCOUNTING POLICIES (continued) |
| a. | Financial Instrument Valuation (continued) |
Certain derivative financial instruments (derivatives) trade in the OTC market. The Fund’s pricing services use various techniques including industry standard option pricing models and proprietary discounted cash flow models to determine the fair value of those instruments. The Fund’s net benefit or obligation under the derivative contract, as measured by the fair value of the contract, is included in net assets.
The Fund has procedures to determine the fair value of financial instruments for which market prices are not reliable or readily available. Under these procedures, the VLOC convenes on a regular basis to review such financial instruments and considers a number of factors, including significant unobservable valuation inputs, when arriving at fair value. The VLOC primarily employs a market-based approach which may use related or comparable assets or liabilities, recent transactions, market multiples, book values, and other relevant information for the investment to determine the fair value of the investment. An income-based valuation approach may also be used in which the anticipated future cash flows of the investment are discounted to calculate fair value. Discounts may also be applied due to the nature or duration of any restrictions on the disposition of the investments. Due to the inherent uncertainty of valuations of such investments, the fair values may differ significantly from the values that would have been used had an active market existed. The VLOC employs various methods for calibrating these valuation approaches including a regular review of key inputs and assumptions, transactional back-testing or disposition analysis, and reviews of any related market activity.
Trading in securities on foreign securities stock exchanges and OTC markets may be completed before the daily NYSE close. In addition, trading in certain foreign markets may not take place on every NYSE business day. Occasionally, events occur between the time at which trading in a foreign security is completed and the close of the NYSE that might call into question the reliability of the value of a portfolio security held by the fund. As a result, differences may arise between the value of the Fund’s portfolio securities as determined at the foreign market close and the latest indications of value at the close of the NYSE. In order to minimize the potential for these differences, the VLOC monitors price movements following the close of trading in foreign stock markets through a series of country specific market proxies (such as baskets of American Depositary Receipts, futures contracts and exchange traded funds). These price movements are measured against established trigger thresholds for each specific market proxy to assist in determining if an event has occurred that may call into question the reliability of the values of the foreign securities held by the Fund. If such an event occurs, the securities may be valued using fair value procedures, which may include the use of independent pricing services.
Annual Report | 27
Franklin Strategic Series
Notes to Financial Statements (continued)
Franklin Global Government Bond Fund
| 1. | ORGANIZATION AND SIGNIFICANT ACCOUNTING POLICIES (continued) |
| a. | Financial Instrument Valuation (continued) |
Also, when the last day of the reporting period is a non-business day, certain foreign markets may be open on those days that the NYSE is closed, which could result in differences between the value of the Fund’s portfolio securities on the last business day and the last calendar day of the reporting period. Any significant security valuation changes due to an open foreign market are adjusted and reflected by the Fund for financial reporting purposes.
b. Foreign Currency Translation
Portfolio securities and other assets and liabilities denominated in foreign currencies are translated into U.S. dollars based on the exchange rate of such currencies against U.S. dollars on the date of valuation. The Fund may enter into foreign currency exchange contracts to facilitate transactions denominated in a foreign currency. Purchases and sales of securities, income and expense items denominated in foreign currencies are translated into U.S. dollars at the exchange rate in effect on the transaction date. Portfolio securities and assets and liabilities denominated in foreign currencies contain risks that those currencies will decline in value relative to the U.S. dollar. Occasionally, events may impact the availability or reliability of foreign exchange rates used to convert the U.S. dollar equivalent value. If such an event occurs, the foreign exchange rate will be valued at fair value using procedures established and approved by the Board.
The Fund does not separately report the effect of changes in foreign exchange rates from changes in market prices on securities held. Such changes are included in net realized and unrealized gain or loss from investments on the Statement of Operations.
Realized foreign exchange gains or losses arise from sales of foreign currencies, currency gains or losses realized between the trade and settlement dates on securities transactions and the difference between the recorded amounts of dividends, interest, and foreign withholding taxes and the U.S. dollar equivalent of the amounts actually received or paid. Net unrealized foreign exchange gains and losses arise from changes in foreign exchange rates on foreign denominated assets and liabilities other than investments in securities held at the end of the reporting period.
c. Derivative Financial Instruments
The Fund invested in derivatives in order to manage risk or gain exposure to various other investments or markets. Derivatives are financial contracts based on an underlying or notional amount, require no initial investment or an initial net investment that is smaller than would normally be required to have a similar response to changes in market factors, and require or permit net settlement. Derivatives contain various risks including the potential inability of the counterparty to fulfill their obligations under the terms of the contract, the potential for an illiquid secondary market, and/or the potential for market movements which expose the fund to gains or losses in
28 | Annual Report
Franklin Strategic Series
Notes to Financial Statements (continued)
Franklin Global Government Bond Fund
| 1. | ORGANIZATION AND SIGNIFICANT ACCOUNTING POLICIES (continued) |
| c. | Derivative Financial Instruments (continued) |
excess of the amounts shown on the Statement of Assets and Liabilities. Realized gain and loss and unrealized appreciation and depreciation on these contracts for the period are included in the Statement of Operations.
Derivative counterparty credit risk is managed through a formal evaluation of the creditworthi-ness of all potential counterparties. The Fund attempts to reduce its exposure to counterparty credit risk on OTC derivatives, whenever possible, by entering into International Swaps and Derivatives Association (ISDA) master agreements with certain counterparties. These agreements contain various provisions, including but not limited to collateral requirements, events of default, or early termination. Termination events applicable to the counterparty include certain deteriorations in the credit quality of the counterparty. Termination events applicable to the Fund include failure of the Fund to maintain certain net asset levels and/or limit the decline in net assets over various periods of time. In the event of default or early termination, the ISDA master agreement gives the non-defaulting party the right to net and close-out all transactions traded, whether or not arising under the ISDA agreement, to one net amount payable by one counterparty to the other. However, absent an event of default or early termination, OTC derivative assets and liabilities are presented gross and not offset in the Statement of Assets and Liabilities. Early termination by the counterparty may result in an immediate payment by the Fund of any net liability owed to that counterparty under the ISDA agreement. At April 30, 2014, the Fund had OTC derivatives in a net liability position of $25,374.
Collateral requirements differ by type of derivative. Collateral terms are contract specific for OTC derivatives. For OTC derivatives traded under an ISDA master agreement, posting of collateral is required by either the fund or the applicable counterparty if the total net exposure of all OTC derivatives with the applicable counterparty exceeds the minimum transfer amount, which typically ranges from $100,000 to $250,000, and can vary depending on the counterparty and the type of the agreement. Generally, collateral is determined at the close of fund business each day and any additional collateral required due to changes in derivative values may be delivered by the fund or the counterparty within a few business days. Collateral pledged and/or received by the fund, if any, is held in segregated accounts with the fund’s custodian/counterparty broker and can be in the form of cash and/or securities. Unrestricted cash may be invested according to the Fund’s investment objectives.
The Fund entered into OTC forward exchange contracts primarily to manage exposure to certain foreign currencies. A forward exchange contract is an agreement between the Fund and a counter-party to buy or sell a foreign currency at a specific exchange rate on a future date.
See Note 8 regarding other derivative information.
Annual Report | 29
Franklin Strategic Series
Notes to Financial Statements (continued)
Franklin Global Government Bond Fund
| 1. | ORGANIZATION AND SIGNIFICANT ACCOUNTING POLICIES (continued) |
| d. | Income and Deferred Taxes |
It is the Fund’s policy to qualify as a regulated investment company under the Internal Revenue Code. The Fund intends to distribute to shareholders substantially all of its taxable income and net realized gains to relieve it from federal income and excise taxes. As a result, no provision for U.S. federal income taxes is required.
The Fund may be subject to foreign taxation related to income received, capital gains on the sale of securities and certain foreign currency transactions in the foreign jurisdictions in which it invests. Foreign taxes, if any, are recorded based on the tax regulations and rates that exist in the foreign markets in which the Fund invests. When a capital gain tax is determined to apply the Fund records an estimated deferred tax liability in an amount that would be payable if the securities were disposed of on the valuation date.
The Fund recognizes the tax benefits of uncertain tax positions only when the position is “more likely than not” to be sustained upon examination by the tax authorities based on the technical merits of the tax position. As of April 30, 2014, the Fund has determined that no liability for unrecognized tax benefits is required in the Fund’s financial statements related to uncertain tax positions taken on a tax return (or expected to be taken on future tax returns).
e. Security Transactions, Investment Income, Expenses and Distributions
Security transactions are accounted for on trade date. Realized gains and losses on security transactions are determined on a specific identification basis. Interest income and estimated expenses are accrued daily. Amortization of premium and accretion of discount on debt securities are included in interest income. Distributions to shareholders are recorded on the ex-dividend date and are determined according to income tax regulations (tax basis). Distributable earnings determined on a tax basis may differ from earnings recorded in accordance with accounting principles generally accepted in the United States of America. These differences may be permanent or temporary. Permanent differences are reclassified among capital accounts to reflect their tax character. These reclassifications have no impact on net assets or the results of operations. Temporary differences are not reclassified, as they may reverse in subsequent periods.
Common expenses incurred by the Trust are allocated among the funds based on the ratio of net assets of each fund to the combined net assets of the Trust. Fund specific expenses are charged directly to the fund that incurred the expense.
30 | Annual Report
Franklin Strategic Series
Notes to Financial Statements (continued)
Franklin Global Government Bond Fund
| 1. | ORGANIZATION AND SIGNIFICANT ACCOUNTING POLICIES (continued) |
| e. | Security Transactions, Investment Income, Expenses and Distributions (continued) |
Realized and unrealized gains and losses and net investment income, not including class specific expenses, are allocated daily to each class of shares based upon the relative proportion of net assets of each class. Differences in per share distributions, by class, are generally due to differences in class specific expenses.
Inflation-indexed bonds are adjusted for inflation through periodic increases or decreases in the security’s interest accruals, face amount, or principal redemption value, by amounts corresponding to the rate of inflation as measured by an index. Any increase or decrease in the face amount or principal redemption value will be included as interest income on the Statement of Operations.
f. Offering Costs
Offering costs are amortized on a straight line basis over twelve months.
g. Accounting Estimates
The preparation of financial statements in accordance with accounting principles generally accepted in the United States of America requires management to make estimates and assumptions that affect the reported amounts of assets and liabilities at the date of the financial statements and the amounts of income and expenses during the reporting period. Actual results could differ from those estimates.
h. Guarantees and Indemnifications
Under the Trust’s organizational documents, its officers and trustees are indemnified by the Trust against certain liabilities arising out of the performance of their duties to the Trust. Additionally, in the normal course of business, the Trust, on behalf of the Fund, enters into contracts with service providers that contain general indemnification clauses. The Trust’s maximum exposure under these arrangements is unknown as this would involve future claims that may be made against the Trust that have not yet occurred. Currently, the Trust expects the risk of loss to be remote.
Annual Report | 31
Franklin Strategic Series
Notes to Financial Statements (continued)
Franklin Global Government Bond Fund
2. SHARES OF BENEFICIAL INTEREST
At April 30, 2014, there were an unlimited number of shares authorized (without par value).
Transactions in the Fund’s shares were as follows:
| Period Ended | ||||||
| April 30, 2014a | ||||||
| Shares | Amount | |||||
| Class A Shares: | ||||||
| Shares sold | 1,077,037 | $ | 10,788,066 | |||
| Shares issued in reinvestment of | ||||||
| distributions | 520 | 5,353 | ||||
| Shares redeemed | (3,189 | ) | (32,667 | ) | ||
| Net increase (decrease) | 1,074,368 | $ | 10,760,752 | |||
| Class C Shares: | ||||||
| Shares sold | 14,871 | $ | 152,447 | |||
| Shares issued in reinvestment of | ||||||
| distributions | 51 | 521 | ||||
| Net increase (decrease) | 14,922 | $ | 152,968 | |||
| Class R Shares: | ||||||
| Shares sold | 1,000 | $ | 10,000 | |||
| Class R6 Shares: | ||||||
| Shares sold | 1,000 | $ | 10,000 | |||
| Advisor Class Shares: | ||||||
| Shares sold | 5,902 | $ | 60,000 | |||
| Shares issued in reinvestment of | ||||||
| distributions | 32 | 323 | ||||
| Shares redeemed | (4,934 | ) | (50,076 | ) | ||
| Net increase (decrease) | 1,000 | $ | 10,247 | |||
| aFor the period September 6, 2013 (commencement of operations) to April 30, 2014. | ||||||
3. TRANSACTIONS WITH AFFILIATES
Franklin Resources, Inc. is the holding company for various subsidiaries that together are referred to as Franklin Templeton Investments. Certain officers and trustees of the Fund are also officers and/or directors of the following subsidiaries:
| Subsidiary | Affiliation |
| Franklin Templeton Investment Management Limited (FTIML) | Investment manager |
| Franklin Templeton Services, LLC (FT Services) | Administrative manager |
| Franklin Templeton Distributors, Inc. (Distributors) | Principal underwriter |
| Franklin Templeton Investor Services, LLC (Investor Services) | Transfer agent |
32 | Annual Report
Franklin Strategic Series
Notes to Financial Statements (continued)
Franklin Global Government Bond Fund
3. TRANSACTIONS WITH AFFILIATES (continued)
a. Management Fees
The Fund pays an investment management fee to FTIML based on the average daily net assets of the Fund as follows:
| Annualized Fee Rate | Net Assets | |
| 0.650 | % | Up to and including $1 billion |
| 0.600 | % | Over $1 billion up to and including $5 billion |
| 0.550 | % | Over $5 billion up to and including $10 billion |
| 0.545 | % | Over $10 billion up to and including $15 billion |
| 0.540 | % | Over $15 billion up to and including $20 billion |
| 0.535 | % | Over $20 billion |
b. Administrative Fees
Under an agreement with FTIML, FT Services provides administrative services to the Fund. The fee is paid by FTIML based on the Fund’s average daily net assets, and is not an additional expense of the Fund.
c. Distribution Fees
The Board has adopted distribution plans for each share class, with the exception of Class R6 and Advisor Class shares, pursuant to Rule 12b-1 under the 1940 Act. Distribution fees are not charged on shares held by affiliates. Under the Fund’s Class A reimbursement distribution plan, the Fund reimburses Distributors for costs incurred in connection with the servicing, sale and distribution of the Fund’s shares up to the maximum annual plan rate. Under the Class A reimbursement distribution plan, costs exceeding the maximum for the current plan year cannot be reimbursed in subsequent periods. In addition, under the Fund’s Class C and R compensation distribution plans, the Fund pays Distributors for costs incurred in connection with the servicing, sale and distribution of the Fund’s shares up to the maximum annual plan rate for each class. The plan year, for purposes of monitoring compliance with the maximum annual plan rates, is February 1 through January 31.
| The maximum annual plan rates, based on the average daily net assets, for each class, are | ||
| as follows: | ||
| Class A | 0.25 | % |
| Class C | 0.65 | % |
| Class R | 0.50 | % |
Annual Report | 33
Franklin Strategic Series
Notes to Financial Statements (continued)
Franklin Global Government Bond Fund
| 3. | TRANSACTIONS WITH AFFILIATES (continued) |
| d. | Sales Charges/Underwriting Agreements |
Front-end sales charges and contingent deferred sales charges (CDSC) do not represent expenses of the Fund. These charges are deducted from the proceeds of sales of Fund shares prior to investment or from redemption proceeds prior to remittance, as applicable. Distributors has advised the Fund of the following commission transactions related to the sales and redemptions of the Fund’s shares for the period:
| Sales charges retained net of commissions paid to unaffiliated | ||
| broker/dealers | $ | 881 |
| CDSC retained | $ | — |
e. Transfer Agent Fees
Each class of shares, except for Class R6, pays transfer agent fees to Investor Services for its performance of shareholder servicing obligations and reimburses Investor Services for out of pocket expenses incurred, including shareholding servicing fees paid to third parties. These fees are allocated daily based upon their relative proportion of such classes’ aggregate net assets. Class R6 pays Investor Services transfer agent fees specific to that class.
For the period ended April 30, 2014, the Fund paid transfer agent fees of $1,042, of which $373 was retained by Investor Services.
f. Investment in Institutional Fiduciary Trust Money Market Portfolio
The Fund invests in the Institutional Fiduciary Trust Money Market Portfolio (Sweep Money Fund), an affiliated open-end management investment company. Management fees paid by the Fund are waived on assets invested in the Sweep Money Fund, in an amount not to exceed the management and administrative fees paid directly or indirectly by the Sweep Money Fund.
g. Waiver and Expense Reimbursements
FTIML and Investor Services have contractually agreed in advance to waive or limit their respective fees and to assume as their own expense certain expenses otherwise payable by the Fund so that the expenses (excluding distribution fees, and acquired fund fees and expenses) for Class A, Class C, Class R, and Advisor Class of the fund do not exceed 0.60%, and Class R6 does not exceed 0.51% based on the average net assets of each class (other than certain non-routine expenses or costs, including those relating to litigation, indemnification, reorganizations, and liquidations) until September 6, 2014.
34 | Annual Report
Franklin Strategic Series
Notes to Financial Statements (continued)
Franklin Global Government Bond Fund
3. TRANSACTIONS WITH AFFILIATES (continued)
h. Other Affiliated Transactions
At April 30, 2014, Franklin Advisers, Inc. owned 91.55% of the Fund’s outstanding shares.
Investment activities of this shareholder could have a material impact on the Fund.
4. EXPENSE OFFSET ARRANGEMENT
The Fund has entered into an arrangement with its custodian whereby credits realized as a result
of uninvested cash balances are used to reduce a portion of the Fund’s custodian expenses. During
the period ended April 30, 2014, there were no credits earned.
5. INCOME TAXES
For tax purposes, capital losses may be carried over to offset future capital gains, if any.
At April 30, 2014, the Fund had short-term capital loss carryforwards of $1,540.
| The tax character of distributions paid during the period ended April 30, 2014, was as follows: | ||
| Distributions paid from ordinary income | $ | 133,769 |
At April 30, 2014, the cost of investments, net unrealized appreciation (depreciation), and undistributed ordinary income for income tax purposes were as follows:
| Cost of investments | $ | 10,702,596 | |
| Unrealized appreciation | $ | 513,938 | |
| Unrealized depreciation | (29,008 | ) | |
| Net unrealized appreciation (depreciation) | $ | 484,930 | |
| Distributable earnings – undistributed ordinary income | $ | 39,115 | |
Differences between income and/or capital gains as determined on a book basis and a tax basis are primarily due to differing treatments of bond discounts and premiums, tax straddles, and foreign currency transactions.
6. INVESTMENT TRANSACTIONS
Purchases and sales of investments (excluding short term securities) for the period ended April 30, 2014, aggregated $11,352,258 and $1,220,090, respectively.
Annual Report | 35
Franklin Strategic Series
Notes to Financial Statements (continued)
Franklin Global Government Bond Fund
7. CONCENTRATION OF RISK
Investing in foreign securities may include certain risks and considerations not typically associated with investing in U.S. securities, such as fluctuating currency values and changing local and regional economic, political and social conditions, which may result in greater market volatility. In addition, certain foreign securities may not be as liquid as U.S. securities.
8. OTHER DERIVATIVE INFORMATION
At April 30, 2014, the Fund’s investments in derivative contracts are reflected on the Statement of Assets and Liabilities as follows:
| Asset Derivatives | Liability Derivatives | |||||||
| Derivative Contracts | ||||||||
| Not Accounted for as | Statement of Assets | Fair Value | Statement of Assets | Fair Value | ||||
| Hedging Instruments | and Liabilities Location | Amount | and Liabilities Location | Amount | ||||
| Foreign exchange | ||||||||
| contracts | Unrealized appreciation on | Unrealized depreciation on | ||||||
| forward exchange contracts | $ — | forward exchange contracts | $ | 25,374 | ||||
| For the period ended April 30, 2014, the effect of derivative contracts on the Fund’s Statement | ||||||||
| of Operations was as follows: | ||||||||
| Change in | ||||||||
| Unrealized | ||||||||
| Derivative Contracts | Realized Gain | Appreciation | ||||||
| Not Accounted for as | (Loss) | (Depreciation) | ||||||
| Hedging Instruments | Statement of Operations Locations | for the Period | for the Period | |||||
| Foreign exchange contracts | Net realized gain (loss) from foreign currency | |||||||
| transactions / Net change in unrealized appreciation | ||||||||
| (depreciation) on translation of other assets and | ||||||||
| liabilities denominated in foreign currencies | $ | (10,147 | ) | $ | (25,374 | ) | ||
For the period ended April 30, 2014, the average month end fair value of derivatives represented 0.09% of average month end net assets. The average month end number of open derivative contracts for the period was 1.
See Note 1(c) regarding derivative financial instruments.
36 | Annual Report
Franklin Strategic Series
Notes to Financial Statements (continued)
Franklin Global Government Bond Fund
9. CREDIT FACILITY
The Fund, together with other U.S. registered and foreign investment funds (collectively, Borrowers), managed by Franklin Templeton Investments, are borrowers in a joint syndicated senior unsecured credit facility totaling $1.5 billion (Global Credit Facility) which, matures on February 13, 2015. This Global Credit Facility provides a source of funds to the Borrowers for temporary and emergency purposes, including the ability to meet future unanticipated or unusually large redemption requests. The Fund began participating in the Global Credit Facility on February 14, 2014.
Under the terms of the Global Credit Facility, the Fund shall, in addition to interest charged on any borrowings made by the Fund and other costs incurred by the Fund, pay its share of fees and expenses incurred in connection with the implementation and maintenance of the Global Credit Facility, based upon its relative share of the aggregate net assets of all of the Borrowers, including an annual commitment fee of 0.07% based upon the unused portion of the Global Credit Facility. These fees are reflected in other expenses on the Statement of Operations. During the period ended April 30, 2014, the Fund did not use the Global Credit Facility.
10. FAIR VALUE MEASUREMENTS
The Fund follows a fair value hierarchy that distinguishes between market data obtained from independent sources (observable inputs) and the Fund’s own market assumptions (unobservable inputs). These inputs are used in determining the value of the Fund’s financial instruments and are summarized in the following fair value hierarchy:
- Level 1 – quoted prices in active markets for identical financial instruments
- Level 2 – other significant observable inputs (including quoted prices for similar financial instruments, interest rates, prepayment speed, credit risk, etc.)
- Level 3 – significant unobservable inputs (including the Fund’s own assumptions in determining the fair value of financial instruments)
The input levels are not necessarily an indication of the risk or liquidity associated with financial instruments at that level.
For movements between the levels within the fair value hierarchy, the Fund has adopted a policy of recognizing the transfers as of the date of the underlying event which caused the movement.
Annual Report | 37
Franklin Strategic Series
Notes to Financial Statements (continued)
Franklin Global Government Bond Fund
10. FAIR VALUE MEASUREMENTS (continued)
A summary of inputs used as of April 30, 2014, in valuing the Fund’s assets and liabilities carried at fair value, is as follows:
| Level 1 | Level 2 | Level 3 | Total | |||||
| Assets: | ||||||||
| Investments in Securities: | ||||||||
| Foreign Government and Agency Securities | $ | — | $ | 7,951,685 | $ | — | $ | 7,951,685 |
| U.S. Government and Agency Securities | — | 2,205,862 | — | 2,205,862 | ||||
| Short Term Investments | 550,067 | 479,912 | — | 1,029,979 | ||||
| Total Investments in Securities | $ | 550,067 | $ | 10,637,459 | $ | — | $ | 11,187,526 |
| Liabilities: | ||||||||
| Other Financial Instruments | ||||||||
| Forward Exchange Contracts | $ | — | $ | 25,374 | $ | — | $ | 25,374 |
11. NEW ACCOUNTING PRONOUNCEMENTS
In June 2013, the Financial Accounting Standards Board issued Accounting Standards Update (ASU) No. 2013-08, Investment Companies (Topic 946): Amendments to the Scope, Measurement, and Disclosure Requirements. The ASU modifies the criteria used in defining an investment company under U.S. Generally Accepted Accounting Principles and also sets forth certain measurement and disclosure requirements. Under the ASU, an entity that is registered under the 1940 Act automatically qualifies as an investment company. The ASU is effective for interim and annual reporting periods beginning after December 15, 2013. Management has reviewed the requirements and believes the adoption of this ASU will not have a material impact on the financial statements.
12. SUBSEQUENT EVENTS
The Fund has evaluated subsequent events through the issuance of the financial statements and determined that no events have occurred that require disclosure.
| ABBREVIATIONS | |||||
| Counterparty | Currency | ||||
| BZWS | - | Barclays Bank PLC | AUD | - | Australian Dollar |
| CITI | - | Citigroup, Inc. | CAD | - | CanadianDollar |
| EUR | - | Euro | |||
| GBP | - | British Pound | |||
| MXN | - | Mexican Peso | |||
| MYR | - | Malaysian Ringgit | |||
| PLN | - | Polish Zloty | |||
| SGD | - | SingaporeDollar | |||
| ZAR | - | South African Rand | |||
| 38 | Annual Report | |||||
Franklin Strategic Series
Report of Independent Registered Public Accounting Firm
To the Board of Trustees and Shareholders of Franklin Global Government Bond Fund
In our opinion, the accompanying statement of assets and liabilities, including the statement of investments, and the related statements of operations and of changes in net assets and the financial highlights present fairly, in all material respects, the financial position of Franklin Global Government Bond Fund (the “Fund”) at April 30, 2014, and the results of its operations, the changes in its net assets and the financial highlights for the period September 6, 2013 (commencement of operations) through April 30, 2014, in conformity with accounting principles generally accepted in the United States of America. These financial statements and financial highlights (hereafter referred to as “financial statements”) are the responsibility of the Fund’s management. Our responsibility is to express an opinion on these financial statements based on our audit. We conducted our audit of these financial statements in accordance with the standards of the Public Company Accounting Oversight Board (United States). Those standards require that we plan and perform the audit to obtain reasonable assurance about whether the financial statements are free of material misstatement. An audit includes examining, on a test basis, evidence supporting the amounts and disclosures in the financial statements, assessing the accounting principles used and significant estimates made by management, and evaluating the overall financial statement presentation. We believe that our audit, which included confirmation of securities at April 30, 2014 by correspondence with the custodian, transfer agent and brokers, provides a reasonable basis for our opinion.
PricewaterhouseCoopers LLP
San Francisco, California
June 13, 2014
Annual Report | 39
Franklin Strategic Series
Tax Information (unaudited)
Franklin Global Government Bond Fund
At April 30, 2014 more than 50% of the Fund’s total assets were invested in securities of foreign issuers. In most instances, foreign taxes were withheld from income paid to the Fund on these investments. As shown in the table below, the Fund hereby reports to shareholders the foreign source income and foreign taxes paid, pursuant to Section 853 of the Internal Revenue Code (Code). This written statement will allow shareholders of record on April 14, 2014, to treat their proportionate share of foreign taxes paid by the Fund as having been paid directly by them. The shareholder shall consider these amounts as foreign taxes paid in the tax year in which they receive the Fund distribution.
The following table provides a detailed analysis of foreign tax paid, foreign source income, and foreign source qualified dividends as reported by the Fund, to Class A, Class C, Class R, Class R6, and Advisor Class shareholders of record.
| Foreign Tax Paid | Foreign Source Income | Foreign Source Qualified | ||||
| Class | Per Share | Per Share | Dividends Per Share | |||
| Class A | $ | 0.0048 | $ | 0.1497 | $ | 0.0000 |
| Class C | $ | 0.0048 | $ | 0.1370 | $ | 0.0000 |
| Class R | $ | 0.0048 | $ | 0.1232 | $ | 0.0000 |
| Class R6 | $ | 0.0048 | $ | 0.1542 | $ | 0.0000 |
| Advisor Class | $ | 0.0048 | $ | 0.1542 | $ | 0.0000 |
Foreign Tax Paid Per Share (Column 1) is the amount per share available to you, as a tax credit (assuming you held your shares in the Fund for a minimum of 16 days during the 31-day period beginning 15 days before the ex-dividend date of the Fund’s distribution to which the foreign taxes relate), or, as a tax deduction.
Foreign Source Income Per Share (Column 2) is the amount per share of income dividends attributable to foreign securities held by the Fund, plus any foreign taxes withheld on these dividends. The amounts reported include foreign source qualified dividends that have not been adjusted for the rate differential applicable to such dividend income.1
Foreign Source Qualified Dividends Per Share (Column 3) is the amount per share of foreign source qualified dividends, plus any foreign taxes withheld on these dividends. These amounts represent the portion of the Foreign Source Income reported to you in column 2 that were derived from qualified foreign securities held by the Fund.1
40 | Annual Report
Franklin Strategic Series
Tax Information (unaudited) (continued)
Franklin Global Government Bond Fund
By mid-February 2015, shareholders will receive Form 1099-DIV which will include their share
of taxes paid and foreign source income distributed during the calendar year 2014. The Foreign
Source Income reported on Form 1099-DIV has not been adjusted for the rate differential on
foreign source qualified dividend income. Shareholders are advised to check with their tax advi-
sors for information on the treatment of these amounts on their 2014 individual income tax returns.
1Qualified dividends are taxed at reduced long term capital gains tax rates. In determining the amount of foreign tax credit that may be applied
against the U.S. tax liability of individuals receiving foreign source qualified dividends, adjustments may be required to the foreign tax credit
limitation calculation to reflect the rate differential applicable to such dividend income. The rules however permit certain individuals to elect not to
apply the rate differential adjustments for capital gains and/or dividends for any taxable year. Please consult your tax advisor and the instructions
to Form 1116 for more information.
Annual Report | 41
Franklin Strategic Series
Board Members and Officers
The name, year of birth and address of the officers and board members, as well as their affiliations, positions held with the Trust, principal occupations during at least the past five years and number of portfolios overseen in the Franklin Templeton Investments fund complex are shown below. Generally, each board member serves until that person’s successor is elected and qualified.
| Independent Board Members | ||||
| Number of Portfolios in | ||||
| Name, Year of Birth | Length of | Fund Complex Overseen | Other Directorships Held | |
| and Address | Position | Time Served | by Board Member* | During at Least the Past 5 Years |
| Harris J. Ashton (1932) | Trustee | Since 1991 | 139 | Bar-S Foods (meat packing company) |
| One Franklin Parkway | (1981-2010). | |||
| San Mateo, CA 94403-1906 | ||||
| Principal Occupation During at Least the Past 5 Years: | ||||
| Director of various companies; and formerly, Director, RBC Holdings, Inc. (bank holding company) (until 2002); and President, Chief Executive | ||||
| Officer and Chairman of the Board, General Host Corporation (nursery and craft centers) (until 1998). | ||||
| Sam Ginn (1937) | Trustee | Since 2007 | 113 | ICO Global Communications |
| One Franklin Parkway | (Holdings) Limited (satellite company) | |||
| San Mateo, CA 94403-1906 | (2006-2010), Chevron Corporation | |||
| (global energy company) (1989-2009), | ||||
| Hewlett-Packard Company (technology | ||||
| company) (1996-2002), Safeway, Inc. | ||||
| (grocery retailer) (1991-1998) and | ||||
| TransAmerica Corporation (insurance | ||||
| company) (1989-1999). | ||||
| Principal Occupation During at Least the Past 5 Years: | ||||
| Private investor; Chairman, First Responder Network Authority (FirstNet) (interoperable wireless broadband network) (2012); and formerly, | ||||
| Chairman of the Board, Vodafone AirTouch, PLC (wireless company) (1999-2000); Chairman of the Board and Chief Executive Officer, | ||||
| AirTouch Communications (cellular communications) (1993-1998) and Pacific Telesis Group (telephone holding company) (1988-1994). | ||||
| Edith E. Holiday (1952) | Trustee | Since 1998 | 139 | Hess Corporation (exploration and |
| One Franklin Parkway | refining of oil and gas), H.J. Heinz | |||
| San Mateo, CA 94403-1906 | Company (processed foods and | |||
| allied products) (1994-2013), RTI | ||||
| International Metals, Inc. (manu- | ||||
| facture and distribution of titanium), | ||||
| Canadian National Railway (railroad) | ||||
| and White Mountains Insurance | ||||
| Group, Ltd. (holding company). | ||||
| Principal Occupation During at Least the Past 5 Years: | ||||
| Director or Trustee of various companies and trusts; and formerly, Assistant to the President of the United States and Secretary of the | ||||
| Cabinet (1990-1993); General Counsel to the United States Treasury Department (1989-1990); and Counselor to the Secretary and Assistant | ||||
| Secretary for Public Affairs and Public Liaison – United States Treasury Department (1988-1989). | ||||
| J. Michael Luttig (1954) | Trustee | Since 2009 | 139 | Boeing Capital Corporation (aircraft |
| One Franklin Parkway | financing) (2006-2013). | |||
| San Mateo, CA 94403-1906 | ||||
| Principal Occupation During at Least the Past 5 Years: | ||||
| Executive Vice President, General Counsel and member of the Executive Council, The Boeing Company (aerospace company); and formerly, | ||||
| Federal Appeals Court Judge, U.S. Court of Appeals for the Fourth Circuit (1991-2006). | ||||
| 42 | Annual Report | ||||
| Number of Portfolios in | ||||
| Name, Year of Birth | Length of | Fund Complex Overseen | Other Directorships Held | |
| and Address | Position | Time Served | by Board Member* | During at Least the Past 5 Years |
| Frank A. Olson (1932) | Trustee | Since 2007 | 139 | Hess Corporation (exploration and |
| One Franklin Parkway | refining of oil and gas) (1998-2013). | |||
| San Mateo, CA 94403-1906 | ||||
| Principal Occupation During at Least the Past 5 Years: | ||||
| Chairman Emeritus, The Hertz Corporation (car rental) (since 2000) (Chairman of the Board (1980-2000) and Chief Executive Officer | ||||
| (1977-1999)); and formerly, Chairman of the Board, President and Chief Executive Officer, UAL Corporation (airlines) (until 1987). | ||||
| Larry D. Thompson (1945) | Trustee | Since 2007 | 139 | Cbeyond, Inc. (business commu- |
| One Franklin Parkway | nications provider) (2010-2012), | |||
| San Mateo, CA 94403-1906 | The Southern Company (energy | |||
| company) (2010-2012) and Graham | ||||
| Holdings Company (formerly, | ||||
| The Washington Post Company) | ||||
| (education and media organization). | ||||
| Principal Occupation During at Least the Past 5 Years: | ||||
| Executive Vice President – Government Affairs, General Counsel and Corporate Secretary, PepsiCo, Inc. (consumer products) (2012-present); | ||||
| and formerly, John A. Sibley Professor of Corporate and Business Law, University of Georgia School of Law (2011-2012); Senior Vice | ||||
| President – Government Affairs, General Counsel and Secretary, PepsiCo, Inc. (2004-2011); Senior Fellow of The Brookings Institution | ||||
| (2003-2004); Visiting Professor, University of Georgia School of Law (2004); and Deputy Attorney General, U.S. Department of Justice | ||||
| (2001-2003). | ||||
| John B. Wilson (1959) | Lead | Trustee since | 113 | None |
| One Franklin Parkway | Independent | 2006 and Lead | ||
| San Mateo, CA 94403-1906 | Trustee | Independent | ||
| Trustee since | ||||
| 2008 | ||||
| Principal Occupation During at Least the Past 5 Years: | ||||
| President, Staples Europe (office supplies) (2012-present); President and Founder, Hyannis Port Capital, Inc. (real estate and private equity | ||||
| investing); serves on private and non-profit boards; and formerly, Chief Operating Officer and Executive Vice President, Gap, Inc. (retail) | ||||
| (1996-2000); Chief Financial Officer and Executive Vice President – Finance and Strategy, Staples, Inc. (1992-1996); Senior Vice President – | ||||
| Corporate Planning, Northwest Airlines, Inc. (airlines) (1990-1992); and Vice President and Partner, Bain & Company (consulting firm) | ||||
| (1986-1990). | ||||
| Interested Board Members and Officers | ||||
| Number of Portfolios in | ||||
| Name, Year of Birth | Length of | Fund Complex Overseen | Other Directorships Held | |
| and Address | Position | Time Served | by Board Member* | During at Least the Past 5 Years |
| **Gregory E. Johnson (1961) | Trustee | Since June 2013 | 149 | None |
| One Franklin Parkway | ||||
| San Mateo, CA 94403-1906 | ||||
| Principal Occupation During at Least the Past 5 Years: | ||||
| Chairman of the Board, Member – Office of the Chairman, Director, President and Chief Executive Officer, Franklin Resources, Inc.; officer | ||||
| and/or director or trustee, as the case may be, of some of the other subsidiaries of Franklin Resources, Inc. and of 44 of the investment | ||||
| companies in Franklin Templeton Investments; and Chairman, Investment Company Institute. | ||||
Annual Report | 43
| Number of Portfolios in | ||||
| Name, Year of Birth | Length of | Fund Complex Overseen | Other Directorships Held | |
| and Address | Position | Time Served | by Board Member* | During at Least the Past 5 Years |
| **Rupert H. Johnson, Jr. (1940) | Chairman of | Chairman of the | 139 | None |
| One Franklin Parkway | the Board and | Board since June | ||
| San Mateo, CA 94403-1906 | Trustee | 2013 and Trustee | ||
| since 1991 | ||||
| Principal Occupation During at Least the Past 5 Years: | ||||
| Vice Chairman, Member – Office of the Chairman and Director, Franklin Resources, Inc.; Director, Franklin Advisers, Inc.; Senior Vice | ||||
| President, Franklin Advisory Services, LLC; and officer and/or director or trustee, as the case may be, of some of the other subsidiaries of | ||||
| Franklin Resources, Inc. and of 41 of the investment companies in Franklin Templeton Investments. | ||||
| Alison E. Baur (1964) | Vice President | Since 2012 | Not Applicable | Not Applicable |
| One Franklin Parkway | ||||
| San Mateo, CA 94403-1906 | ||||
| Principal Occupation During at Least the Past 5 Years: | ||||
| Deputy General Counsel, Franklin Templeton Investments; and officer of some of the other subsidiaries of Franklin Resources, Inc. and of 46 | ||||
| of the investment companies in Franklin Templeton Investments. | ||||
| Laura F. Fergerson (1962) | Chief | Since 2009 | Not Applicable | Not Applicable |
| One Franklin Parkway | Executive | |||
| San Mateo, CA 94403-1906 | Officer – | |||
| Finance and | ||||
| Administration | ||||
| Principal Occupation During at Least the Past 5 Years: | ||||
| Senior Vice President, Franklin Templeton Services, LLC; and officer of 46 of the investment companies in Franklin Templeton Investments. | ||||
| Gaston Gardey (1967) | Treasurer, | Since 2009 | Not Applicable | Not Applicable |
| One Franklin Parkway | Chief Financial | |||
| San Mateo, CA 94403-1906 | Officer and | |||
| Chief | ||||
| Accounting | ||||
| Officer | ||||
| Principal Occupation During at Least the Past 5 Years: | ||||
| Director, Fund Accounting, Franklin Templeton Investments; and officer of 27 of the investment companies in Franklin Templeton Investments. | ||||
| Aliya S. Gordon (1973) | Vice President | Since 2009 | Not Applicable | Not Applicable |
| One Franklin Parkway | ||||
| San Mateo, CA 94403-1906 | ||||
| Principal Occupation During at Least the Past 5 Years: | ||||
| Senior Associate General Counsel, Franklin Templeton Investments; officer of 46 of the investment companies in Franklin Templeton | ||||
| Investments; and formerly, Litigation Associate, Steefel, Levitt & Weiss, LLP (2000-2004). | ||||
| Steven J. Gray (1955) | Vice President | Since 2009 | Not Applicable | Not Applicable |
| One Franklin Parkway | ||||
| San Mateo, CA 94403-1906 | ||||
| Principal Occupation During at Least the Past 5 Years: | ||||
| Senior Associate General Counsel, Franklin Templeton Investments; Vice President, Franklin Templeton Distributors, Inc. and Franklin | ||||
| Alternative Strategies Advisers, LLC; and officer of 46 of the investment companies in Franklin Templeton Investments. | ||||
44 | Annual Report
| Number of Portfolios in | ||||
| Name, Year of Birth | Length of | Fund Complex Overseen | Other Directorships Held | |
| and Address | Position | Time Served | by Board Member* | During at Least the Past 5 Years |
| Selena L. Holmes (1965) | Vice President | Since 2012 | Not Applicable | Not Applicable |
| 100 Fountain Parkway | – AML | |||
| St. Petersburg, FL 33716-1205 | Compliance | |||
| Principal Occupation During at Least the Past 5 Years: | ||||
| Director, Global Compliance Monitoring; Deputy Chief Compliance Officer, Franklin Alternative Strategies Advisers, LLC; and officer of 46 of | ||||
| the investment companies in Franklin Templeton Investments. | ||||
| Edward B. Jamieson (1948) | President and | Since 2010 | Not Applicable | Not Applicable |
| One Franklin Parkway | Chief | |||
| San Mateo, CA 94403-1906 | Executive | |||
| Officer – | ||||
| Investment | ||||
| Management | ||||
| Principal Occupation During at Least the Past 5 Years: | ||||
| President, Chief Investment Officer and Director, Franklin Advisers, Inc.; Executive Vice President, Franklin Templeton Institutional, LLC; | ||||
| and officer and/or trustee, as the case may be, of some of the other subsidiaries of Franklin Resources, Inc. and of 10 of the investment | ||||
| companies in Franklin Templeton Investments. | ||||
| Christopher J. Molumphy (1962) | Vice President | Since 2000 | Not Applicable | Not Applicable |
| One Franklin Parkway | ||||
| San Mateo, CA 94403-1906 | ||||
| Principal Occupation During at Least the Past 5 Years: | ||||
| Director and Executive Vice President, Franklin Advisers, Inc.; Executive Vice President, Franklin Templeton Institutional, LLC; and officer of | ||||
| some of the other subsidiaries of Franklin Resources, Inc. and of 22 of the investment companies in Franklin Templeton Investments. | ||||
| Kimberly H. Novotny (1972) | Vice President | Since 2013 | Not Applicable | Not Applicable |
| 300 S.E. 2nd Street | ||||
| Fort Lauderdale, FL 33301-1923 | ||||
| Principal Occupation During at Least the Past 5 Years: | ||||
| Associate General Counsel, Franklin Templeton Investments; Vice President and Secretary, Fiduciary Trust International of the South; Vice | ||||
| President, Templeton Investment Counsel, LLC; Assistant Secretary, Franklin Resources, Inc.; and officer of 46 of the investment companies | ||||
| in Franklin Templeton Investments. | ||||
| Robert C. Rosselot (1960) | Chief | Since 2013 | Not Applicable | Not Applicable |
| 300 S.E. 2nd Street | Compliance | |||
| Fort Lauderdale, FL 33301-1923 | Officer | |||
| Principal Occupation During at Least the Past 5 Years: | ||||
| Director, Global Compliance, Franklin Templeton Investments; Vice President, Franklin Templeton Companies, LLC; officer of 46 of the | ||||
| investment companies in Franklin Templeton Investments; and formerly, Senior Associate General Counsel, Franklin Templeton Investments | ||||
| (2007-2013); and Secretary and Vice President, Templeton Group of Funds (2004-2013). | ||||
| Karen L. Skidmore (1952) | Vice President | Since 2006 | Not Applicable | Not Applicable |
| One Franklin Parkway | and Secretary | |||
| San Mateo, CA 94403-1906 | ||||
| Principal Occupation During at Least the Past 5 Years: | ||||
| Senior Associate General Counsel, Franklin Templeton Investments; and officer of 46 of the investment companies in Franklin | ||||
| Templeton Investments. | ||||
Annual Report | 45
| Number of Portfolios in | ||||
| Name, Year of Birth | Length of | Fund Complex Overseen | Other Directorships Held | |
| and Address | Position | Time Served | by Board Member* | During at Least the Past 5 Years |
| Craig S. Tyle (1960) | Vice President | Since 2005 | Not Applicable | Not Applicable |
| One Franklin Parkway | ||||
| San Mateo, CA 94403-1906 | ||||
| Principal Occupation During at Least the Past 5 Years: | ||||
| General Counsel and Executive Vice President, Franklin Resources, Inc.; and officer of some of the other subsidiaries of Franklin Resources, | ||||
| Inc. and of 46 of the investment companies in Franklin Templeton Investments. | ||||
| Lori A. Weber (1964) | Vice President | Since 2011 | Not Applicable | Not Applicable |
| 300 S.E. 2nd Street | ||||
| Fort Lauderdale, FL 33301-1923 | ||||
| Principal Occupation During at Least the Past 5 Years: | ||||
| Senior Associate General Counsel, Franklin Templeton Investments; Assistant Secretary, Franklin Resources, Inc.; Vice President and | ||||
| Secretary, Templeton Investment Counsel, LLC; Vice President, Fiduciary Trust International of the South; and officer of 46 of the investment | ||||
| companies in Franklin Templeton Investments. | ||||
*We base the number of portfolios on each separate series of the U.S. registered investment companies within the Franklin Templeton Investments fund complex. These portfolios
have a common investment manager or affiliated investment managers.
**Gregory E. Johnson is considered to be an interested person of the Fund under the federal securities laws due to his position as an officer and director of Franklin Resources, Inc.
(Resources), which is the parent company of the Fund’s investment manager and distributor. Rupert H. Johnson, Jr. is considered to be an interested person of the Fund under the
federal securities laws due to his position as officer and director and major shareholder of Resources.
Note 1: Rupert H. Johnson, Jr. is the uncle of Gregory E. Johnson.
Note 2: Officer information is current as of the date of this report. It is possible that after this date, information about officers may change.
Note 3: Effective June 13, 2013, Charles B. Johnson ceased to be a trustee of the Fund.
The Sarbanes-Oxley Act of 2002 and Rules adopted by the Securities and Exchange Commission require the Fund to disclose whether the Fund’s Audit Committee includes at
least one member who is an audit committee financial expert within the meaning of such Act and Rules. The Fund’s Board has determined that there is at least one such finan-
cial expert on the Audit Committee and has designated John B. Wilson as its audit committee financial expert. The Board believes that Mr. Wilson qualifies as such an expert in
view of his extensive business background and experience, including service as chief financial officer of Staples, Inc. from 1992 to 1996. Mr. Wilson has been a Member and
Chairman of the Fund’s Audit Committee since 2006. As a result of such background and experience, the Board believes that Mr. Wilson has acquired an understanding of gen-
erally accepted accounting principles and financial statements, the general application of such principles in connection with the accounting estimates, accruals and reserves,
and analyzing and evaluating financial statements that present a breadth and level of complexity of accounting issues generally comparable to those of the Fund, as well as
an understanding of internal controls and procedures for financial reporting and an understanding of audit committee functions. Mr. Wilson is an independent Board member
as that term is defined under the relevant Securities and Exchange Commission Rules and Releases.
The Statement of Additional Information (SAI) includes additional information about the board members and is available, without charge, upon request. Shareholders may
call (800) DIAL BEN/ 342-5236 to request the SAI.
46 | Annual Report
Franklin Strategic Series
Shareholder Information
Franklin Global Government Bond Fund
Proxy Voting Policies and Procedures
The Fund’s investment manager has established Proxy Voting Policies and Procedures (Policies) that the Fund uses to determine how to vote proxies relating to portfolio securities. Shareholders may view the Fund’s complete Policies online at franklintempleton.com. Alternatively, shareholders may request copies of the Policies free of charge by calling the Proxy Group collect at (954) 527-7678 or by sending a written request to: Franklin Templeton Companies, LLC, 300 S.E. 2nd Street, Fort Lauderdale, FL 33301, Attention: Proxy Group. Copies of the Fund’s proxy voting records are also made available online at franklintempleton.com and posted on the U.S. Securities and Exchange Commission’s website at sec.gov and reflect the most recent 12-month period ended June 30.
Quarterly Statement of Investments
The Fund files a complete statement of investments with the U.S. Securities and Exchange Commission for the first and third quarters for each fiscal year on Form N-Q. Shareholders may view the filed Form N-Q by visiting the Commission’s website at sec.gov. The filed form may also be viewed and copied at the Commission’s Public Reference Room in Washington, DC. Information regarding the operations of the Public Reference Room may be obtained by calling (800) SEC-0330.
Householding of Reports and Prospectuses
You will receive the Fund’s financial reports every six months as well as an annual updated summary prospectus (prospectus available upon request). To reduce Fund expenses, we try to identify related shareholders in a household and send only one copy of the financial reports and summary prospectus. This process, called “householding,” will continue indefinitely unless you instruct us otherwise. If you prefer not to have these documents householded, please call us at (800) 632-2301. At any time you may view current prospectuses/summary prospectuses and financial reports on our website. If you choose, you may receive these documents through electronic delivery.
Annual Report | 47
This page intentionally left blank.

Annual Report and Shareholder Letter
Franklin Global
Government Bond Fund
Investment Manager
Franklin Templeton Investment Management Limited
Distributor
Franklin Templeton Distributors, Inc.
(800) DIAL BEN®/342-5236
franklintempleton.com
Shareholder Services
(800) 632-2301
Authorized for distribution only when accompanied or preceded by a summary prospectus and/or prospectus.
Investors should carefully consider a fund’s investment goals, risks, charges and expenses before investing.
A prospectus contains this and other information; please read it carefully before investing.
To help ensure we provide you with quality service, all calls to and from our service areas are monitored and/or recorded.
© 2014 Franklin Templeton Investments. All rights reserved. 058 A 06/14
Item 2. Code of Ethics.
(a) The Registrant has adopted a code of ethics that applies to its principal executive officers and principal financial and accounting officer.
(c) N/A
(d) N/A
(f) Pursuant to Item 12(a)(1), the Registrant is attaching as an exhibit a copy of its code of ethics that applies to its principal executive officers and principal financial and accounting officer.
Item 3. Audit Committee Financial Expert.
(a)(1) The Registrant has an audit committee financial expert serving on its audit committee.
(2) The audit committee financial expert is John B. Wilson and he is "independent" as defined under the relevant Securities and Exchange Commission Rules and Releases.
Item 4. Principal Accountant Fees and Services.
(a) Audit Fees
The aggregate fees paid to the principal accountant for professional services rendered by the principal accountant for the audit of the registrant’s annual financial statements or for services that are normally provided by the principal accountant in connection with statutory and regulatory filings or engagements were $418,227 for the fiscal year ended April 30, 2014 and $368,500 for the fiscal year ended April 30, 2013.
(b) Audit-Related Fees
There were no fees paid to the principal accountant for assurance and related services rendered by the principal accountant to the registrant that are reasonably related to the performance of the audit of the registrant's financial statements and are not reported under paragraph (a) of Item 4.
There were no fees paid to the principal accountant for assurance and related services rendered by the principal accountant to the registrant's investment adviser and any entity controlling, controlled by or under common control with the investment adviser that provides ongoing services to the registrant that are reasonably related to the performance of the audit of their financial statements.
(c) Tax Fees
There were no fees paid to the principal accountant for professional services rendered by the principal accountant to the registrant for tax compliance, tax advice and tax planning.
The aggregate fees paid to the principal accountant for professional services rendered by the principal accountant to the registrant’s investment adviser and any entity controlling, controlled by or under common control with the investment adviser that provides ongoing services to the registrant for tax compliance, tax advice and tax planning were $6,930 for the fiscal year ended April 30, 2014 and $4,600 for the fiscal year ended April 30, 2013. The services for which these fees were paid included technical tax consultation for capital gain tax reporting to foreign governments and requirements on local country’s self-certification forms.
(d) All Other Fees
The aggregate fees paid to the principal accountant for products and services rendered by the principal accountant to the registrant not reported in paragraphs (a)-(c) of Item 4 were $6,258 for the fiscal year ended April 30, 2014 and $0 for the fiscal year ended April 30, 2013. The services for which these fees were paid included review of materials provided to the fund Board in connection with the investment management contract renewal process.
The aggregate fees paid to the principal accountant for products and services rendered by the principal accountant to the registrant’s investment adviser and any entity controlling, controlled by or under common control with the investment adviser that provides ongoing services to the registrant other than services reported in paragraphs (a)-(c) of Item 4 were $155,553 for the fiscal year ended April 30, 2014 and $39,194 for the fiscal year ended April 30, 2013. The services for which these fees were paid included preparation and review of materials provided to the fund Board in connection with the investment management contract renewal process and XBRL tagging on financial statements.
(e) (1) The registrant’s audit committee is directly responsible for approving the services to be provided by the auditors, including:
(i) pre-approval of all audit and audit related services;
(ii) pre-approval of all non-audit related services to be provided to the Fund by the auditors;
(iii) pre-approval of all non-audit related services to be provided to the registrant by the auditors to the registrant’s investment adviser or to any entity that controls, is controlled by or is under common control with the registrant’s investment adviser and that provides ongoing services to the registrant where the non-audit services relate directly to the operations or financial reporting of the registrant; and
(iv) establishment by the audit committee, if deemed necessary or appropriate, as an alternative to committee pre-approval of services to be provided by the auditors, as required by paragraphs (ii) and (iii) above, of policies and procedures to permit such services to be pre-approved by other means, such as through establishment of guidelines or by action of a designated member or members of the committee; provided the policies and procedures are detailed as to the particular service and the committee is informed of each service and such policies and procedures do not include delegation of audit committee responsibilities, as contemplated under the Securities Exchange Act of 1934, to management; subject, in the case of (ii) through (iv), to any waivers, exceptions or exemptions that may be available under applicable law or rules.
(e) (2) None of the services provided to the registrant described in paragraphs (b)-(d) of Item 4 were approved by the audit committee pursuant to paragraph (c)(7)(i)(C) of Rule 2-01 of regulation S-X.
(f) No disclosures are required by this Item 4(f).
(g) The aggregate non-audit fees paid to the principal accountant for services rendered by the principal accountant to the registrant and the registrant’s investment adviser and any entity controlling, controlled by or under common control with the investment adviser that provides ongoing services to the registrant were $168,741 for the fiscal year ended April 30, 2014 and $43,794 for the fiscal year ended April 30, 2013.
(h) The registrant’s audit committee of the board has considered whether the provision of non-audit services that were rendered to the registrant’s investment adviser (not including any sub-adviser whose role is primarily portfolio management and is subcontracted with or overseen by another investment adviser), and any entity controlling, controlled by, or under common control with the investment adviser that provides ongoing services to the registrant that were not pre-approved pursuant to paragraph (c)(7)(ii) of Rule 2-01 of Regulation S-X is compatible with maintaining the principal accountant’s independence.
Item 5. Audit Committee of Listed Registrants. N/A
Item 6. Schedule of Investments. N/A
Item 7. Disclosure of Proxy Voting Policies and Procedures for Closed-End Management Investment Companies. N/A
Item 8. Portfolio Managers of Closed-End Management Investment Companies. N/A
Item 9. Purchases of Equity Securities by Closed-End Management Investment Company and Affiliated Purchasers. N/A
Item 10. Submission of Matters to a Vote of Security Holders.
There have been no changes to the procedures by which shareholders may recommend nominees to the Registrant's Board of Trustees that would require disclosure herein.
Item 11. Controls and Procedures.
(a) Evaluation of Disclosure Controls and Procedures. The Registrant maintains disclosure controls and procedures that are designed to ensure that information required to be disclosed in the Registrant’s filings under the Securities Exchange Act of 1934 and the Investment Company Act of 1940 is recorded, processed, summarized and reported within the periods specified in the rules and forms of the Securities and Exchange Commission. Such information is accumulated and communicated to the Registrant’s management, including its principal executive officer and principal financial officer, as appropriate, to allow timely decisions regarding required disclosure. The Registrant’s management, including the principal executive officer and the principal financial officer, recognizes that any set of controls and procedures, no matter how well designed and operated, can provide only reasonable assurance of achieving the desired control objectives.
Within 90 days prior to the filing date of this Shareholder Report on Form N-CSR, the Registrant had carried out an evaluation, under the supervision and with the participation of the Registrant’s management, including the Registrant’s principal executive officer and the Registrant’s principal financial officer, of the effectiveness of the design and operation of the Registrant’s disclosure controls and procedures. Based on such evaluation, the Registrant’s principal executive officer and principal financial officer concluded that the Registrant’s disclosure controls and procedures are effective.
(b) Changes in Internal Controls. There have been no changes in the Registrant’s internal controls or in other factors that could materially affect the internal controls over financial reporting subsequent to the date of their evaluation in connection with the preparation of this Shareholder Report on Form N-CSR.
Item 12. Exhibits.
(a) (1) Code of Ethics
(a) (2) Certifications pursuant to Section 302 of the Sarbanes-Oxley Act of 2002 of Laura F. Fergerson, Chief Executive Officer - Finance and Administration, and Gaston Gardey, Chief Financial Officer and Chief Accounting Officer
(b) Certifications pursuant to Section 906 of the Sarbanes-Oxley Act of 2002 of Laura F. Fergerson, Chief Executive Officer - Finance and Administration, and Gaston Gardey, Chief Financial Officer and Chief Accounting Officer
SIGNATURES
Pursuant to the requirements of the Securities Exchange Act of 1934 and the Investment Company Act of 1940, the registrant has duly caused this report to be signed on its behalf by the undersigned, thereunto duly authorized.
FRANKLIN STRATEGIC SERIES
By /s/ LAURA F. FERGERSON
Laura F. Fergerson
Chief Executive Officer –
Finance and Administration
Date June 26, 2014
Pursuant to the requirements of the Securities Exchange Act of 1934 and the Investment Company Act of 1940, this report has been signed below by the following persons on behalf of the registrant and in the capacities and on the dates indicated.
By /s/ LAURA F. FERGERSON
Laura F. Fergerson
Chief Executive Officer –
Finance and Administration
Date June 26, 2014
By /s/ GASTON GARDEY
Gaston Gardey
Chief Financial Officer and
Chief Accounting Officer
Date June 26, 2014