UNITED STATES
SECURITIES AND EXCHANGE COMMISSION
Washington, D.C. 20549
FORM N-CSR
CERTIFIED SHAREHOLDER REPORT OF REGISTERED
MANAGEMENT INVESTMENT COMPANIES
Investment Company Act file number: 811-06241
Loomis Sayles Funds II
(Exact name of Registrant as specified in charter)
399 Boylston Street, Boston, Massachusetts 02116
(Address of principal executive offices) (Zip code)
Coleen Downs Dinneen, Esq.
NGAM Distribution, L.P.
399 Boylston Street
Boston, Massachusetts 02116
(Name and address of agent for service)
Registrant’s telephone number, including area code: (617) 449-2810
Date of fiscal year end: September 30
Date of reporting period: September 30, 2015
Item 1. Reports to Stockholders.
The Registrant’s annual report transmitted to shareholders pursuant to Rule 30e-1 under the Investment Company Act of 1940 is as follows:
ANNUAL REPORT
September 30, 2015

Loomis Sayles Global Equity and Income Fund
Loomis Sayles Growth Fund
Loomis Sayles Value Fund

TABLE OF CONTENTS
Portfolio Review page 1
Portfolio of Investments page 23
Financial Statements page 49
Notes to Financial Statements page 68
LOOMIS SAYLES GLOBAL EQUITY AND INCOME FUND
| | |
| Managers | | Symbols |
| Daniel J. Fuss, CFA®, CIC | | Class A LGMAX |
| Eileen N. Riley, CFA® | | Class C LGMCX |
| David W. Rolley, CFA® | | Class Y LSWWX |
| Lee M. Rosenbaum | | |
| Loomis, Sayles & Company, L.P. | | |
Objective
The Fund seeks high total investment return through a combination of capital appreciation and current income
Market Conditions
Falling commodity prices and a strengthening U.S. dollar characterized the 12-month reporting period. For the first nine months of the period, global equity markets performed reasonably well, while core government bond yields remained near historic lows. In mid-August, however, concerns about commodity prices, emerging market currencies and the economic health of China led to a widely felt correction, with many equity markets declining 10% or more for the first time since 2011. Although the magnitude of China’s currency devaluation was small, it generated concerns about possible further negative adjustments. This, coupled with uncertainty linked to China’s stock market decline and economic slowdown, led to a broad decline among global stocks. The sell-off resulted in major markets turning negative for the year, with Japan close to flat, the S&P 500® Index down mid-single digits and emerging markets down in the mid-teens. Though central bankers around the world remained accommodative, investors were uncertain as to their next steps. Europe and Japan remained on their current course of monetary easing, while the Federal Reserve (the Fed) delayed a rate hike.
Performance Results
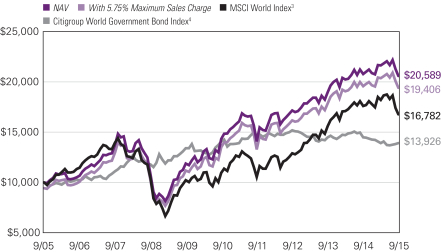
For the 12 months ended September 30, 2015, Class A shares of Loomis Sayles Global Equity and Income Fund returned -0.91% at net asset value. The Fund held up better than its primary benchmark, the Morgan Stanley Capital International (MSCI) World Index, which returned -4.57%. The Fund also outpaced its secondary benchmark, the Citigroup World Government Bond Index, which returned -3.83%.
Explanation of Fund Performance
The Fund started the year off with approximately 70% in equities and 30% in fixed income. As equities valuations started to become fairly valued, the Fund scaled back its exposure and redeployed some of its assets to fixed income where valuations started to look more attractive. This allowed the Fund to weather the market volatility.
Within the Fund’s equity component, positive stock selection, particularly in Europe and North America and within the consumer discretionary, financials and information technology sectors, contributed to performance. Autozone, a leading auto parts retailer,
1 |
continued to deliver impressive sales growth, expand margins and successfully deploy capital in a manner consistent with its long-term track record. The company was a major contributor to the Fund’s performance and remains a high-conviction holding. Autozone continues to make bolt-on acquisitions, which we believe will strengthen the firm further, and initiate stock buybacks. Valeant Pharmaceuticals, a specialty drug company, also contributed to Fund performance. We believe our ongoing investment thesis continues to be supported as the company demonstrated strong and focused business development, a diversified product portfolio operating in a decentralized environment and a highly favorable tax structure. Valeant successfully integrated its key investments of the past year, including Salix Pharmaceuticals and Solta Holdings, while deals completed more than a year ago (including Bausch and Lomb) continued to grow. Amazon, the web retailer, delivered strong top-line growth and impressive margin improvement, allocated capital wisely and increased the transparency of its financial divisions. Amazon Prime delivered impressive results, and the platform continued to build customer loyalty. We believe the stock remains undervalued relative to our expectations for future cash flow per share.
Within fixed income, the positioning along the longer end of the U.S. yield curve (a curve that shows the relationship among bond yields across the maturity spectrum) added value as the yield curve flattened throughout the period. Our allocation to longer-dated euro zone sovereigns also lifted results, as yields fell near the end of the reporting period due to Greece’s debt crisis moving out of the headlines. Although security selection detracted overall, we were able to find pockets of positive performance among retail, consumer goods and healthcare issuers – particularly among names with longer durations (greater price sensitivity to interest rate changes). Additionally, selected intermediate-maturity issuers from emerging market countries less vulnerable to the oil price decline, such as Hungary and India, also contributed positively. Elsewhere, a general bias toward the U.S. dollar was beneficial as the dollar rallied for the majority of the period. Although the dollar rally peaked during the second quarter of 2015, it maintained most of its strength throughout the final months of the fiscal year. Additionally, currency forwards, which are contracts that lock in exchange rates on future dates, were used to actively manage currency exposure and aided results.
Not surprisingly, energy was the largest detractor within the Fund’s equity component, as lower commodity prices continued to pressure energy stocks. A small out-of-Benchmark allocation to emerging markets also held back performance. Alibaba, the Chinese e-commerce company, detracted from results. The company’s stock struggled on concerns about deteriorating macroeconomic conditions in China, the banning of online lottery offerings, a declining monetization rate, bad press around fraud management and increased competition from JD.com. We believe these risks are more than adequately reflected in the stock’s valuation and the company is taking steps to deliver strong results in 2016. Genesee & Wyoming, a regional freight railroad company, performed poorly due to weakening end markets in coal, energy and iron ore. This pressure resulted in a reduction in forward earnings and cash flow estimates and muted the positive impact of the Freightliner acquisition announced earlier this year. We continue to see long-term value in the company’s rail and logistics assets. Lower oil prices forced Noble Energy to ration capital, which negatively affected growth in production and cash flow. In addition, increased scrutiny from the Israeli Antitrust Commissioner toward Noble and its partners in Israel
| 2
LOOMIS SAYLES GLOBAL EQUITY AND INCOME FUND
introduced material risk around the timing and economic value of the proposed Leviathan development. As a result, we exited the position during the first quarter of 2015.
Within fixed income, exposure to emerging markets currencies weighed on performance, specifically the currencies of commodity-driven countries such as Brazil, Mexico and Indonesia. Holdings in the New Zealand dollar, British pound, Canadian dollar and Norwegian krone also detracted due to U.S. dollar strength. Our allocation to corporate bonds had a negative effect on performance as spreads (the difference in yield between U.S. Treasury and non-Treasury securities of similar maturity) widened to multi-year highs due, in part, to increasing new issuance. Equity market volatility and concerns about global growth also played a role, creating a challenging environment for spread (non-Treasury) products. Security selection among energy and basic industry companies detracted, as industries sensitive to commodity prices generally underperformed. Additionally, the high-yield names held within these sectors faced intense selling pressure.
Outlook
We believe the Fed will slowly raise rates over the next year, with the first hike still on the table for 2015. However, the Fed may once again delay due to subdued U.S. inflation and increasing deflation risks from abroad. We believe equity investors have largely built in an initial rate hike and further rate increases will be considered at a deliberate pace. Rate hikes associated with a healthy economy are generally not considered a negative for stocks, and we expect the equity markets to take measured policy actions in stride. We expect the U.S. dollar to remain near current levels or strengthen modestly, as Fed policy diverges from that of other leading central banks, with the Bank of England the possible exception.
We believe energy earnings will continue to drag on U.S. aggregate earnings in 2016. However, healthy earnings growth outside of energy should continue. We anticipate that 2016 aggregate earnings growth may be in the mid-single digits. U.S. equity fundamentals remain supported by healthy dividend growth, ongoing shareholder activism and continued mergers and acquisitions (M&A) activity. High-yield bonds, on the other hand, could suffer if oil prices do not gain traction or higher U.S. rates trigger additional outflows. We believe there are pockets of opportunity in less vulnerable sectors, including finance and healthcare, or where market weakness has created attractive issuer-specific valuations.
We believe the global credit cycle favors developed over emerging markets. Emerging markets face challenges unlikely to abate in the near term, including deleveraging and a manufacturing slowdown in China, waning global trade and lower commodity prices. Emerging market currencies should recover at some point, but we do not expect short-term conditions to be broadly supportive.
Potential risks to our equity view include reversing global economic fundamentals, commodity price swings, volatility related to U.S. rate increases and geopolitics. Still, moderate price corrections should create selective buying opportunities for discerning investors. The primary risks for our fixed-income view include the potential for a more hawkish Fed, increasingly aggressive corporate behavior and further commodity weakness on continued negative China news flow.
3 |
Growth of $10,000 Investment in Class A Shares1,5
September 30, 2005 through September 30, 2015
See notes to chart on page 5.
| 4
LOOMIS SAYLES GLOBAL EQUITY AND INCOME FUND
Average Annual Total Returns — September 30, 20155
| | | | | | | | | | | | |
| | | | |
| | | 1 Year | | | 5 Years | | | 10 Years | |
| | | | |
| Class A (Inception 2/1/06)1 | | | | | | | | | | | | |
| NAV | | | -0.91 | % | | | 7.53 | % | | | 7.49 | % |
| With 5.75% Maximum Sales Charge | | | -6.62 | | | | 6.26 | | | | 6.86 | |
| | | | |
| Class C (Inception 2/1/06)1 | | | | | | | | | | | | |
| NAV | | | -1.66 | | | | 6.71 | | | | 6.69 | |
| With CDSC2 | | | -2.59 | | | | 6.71 | | | | 6.69 | |
| | | | |
| Class Y (Inception 5/1/96) | | | | | | | | | | | | |
| NAV | | | -0.72 | | | | 7.78 | | | | 7.75 | |
| | | | |
| Comparative Performance | | | | | | | | | | | | |
| MSCI World Index3 | | | -4.57 | | | | 8.89 | | | | 5.31 | |
| Citigroup World Government Bond Index4 | | | -3.83 | | | | -0.19 | | | | 3.37 | |
Past performance does not guarantee future results. The table(s) do not reflect taxes shareholders might owe on any Fund distributions or when they redeem their shares. Performance for periods less than one year is cumulative, not annualized. Returns reflect changes in share price and reinvestment of dividends and capital gains, if any. Unlike a fund, an index is not managed and does not reflect fees and expenses. It is not possible to invest directly in an index.
| 1 | Prior to the inception of Class A and C shares (2/1/06), performance is that of Institutional Class shares, which were redesignated as Class Y shares, restated to reflect the higher net expenses and sales loads of Class A and C shares. |
| 2 | Performance for Class C shares assumes a 1% contingent deferred sales charge (“CDSC”) applied when you sell shares within one year of purchase. |
| 3 | MSCI World Index is an unmanaged index that is designed to measure the equity market performance of developed markets. |
| 4 | Citigroup World Government Bond Index is an unmanaged index that includes the most significant and liquid government bond markets globally that carry at least an investment-grade rating. |
| 5 | Fund performance has been increased by fee waivers and/or expense reimbursements, if any, without which performance would have been lower. |
5 |
LOOMIS SAYLES GROWTH FUND
| | |
| Manager | | Symbols |
| Aziz V. Hamzaogullari, CFA® | | Class A LGRRX |
| Loomis, Sayles & Company, L.P. | | Class B LGRBX |
| | Class C LGRCX |
| | Class N LGRNX |
| | Class Y LSGRX |
Objective
The Fund seeks long-term growth of capital
Market Conditions
Despite achieving steady gains through much of the twelve months ending September 30, 2015, large-cap U.S. equities ended the period in negative territory. The U.S. led global equity performance until January, when aggressive accommodative actions from central banks in Europe and Japan helped those markets pull ahead. The U.S. market stabilized in February and continued on a path of respectable gains until August, with only a brief interruption in June, which was tied to Greek debt challenges. However, equities fell sharply in August, with the S&P 500® Index experiencing a 10% correction for the first time since 2011. The sell-off was triggered by concerns over the health of China’s economy, sharply falling commodity prices and a generally uncertain outlook for global growth. U.S. equities remained challenged through the end of the period as negative investor sentiment overshadowed healthy dividend yields, continued mergers and acquisitions activity (M&A), and more attractive valuations.
Performance Results
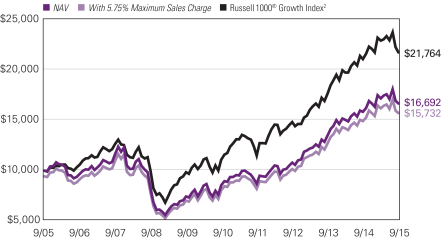
For the 12 months ended September 30, 2015, Class A shares of Loomis Sayles Growth Fund returned 5.30% at net asset value. The Fund outperformed its benchmark, the Russell 1000® Growth Index, which returned 3.17%.
Explanation of Fund Performance
Positions in Amazon, Monster Beverage and Visa drove the Fund’s absolute return. While our lower-than-benchmark allocation to the consumer discretionary sector weighed on results, strong stock selection in the sector significantly aided performance. Stock selection in industrials and our allocation to consumer staples also supported relative return. Positions in Alibaba, Qualcomm and Schlumberger detracted from performance, as did stock selection in information technology and healthcare.
Online retailer Amazon became a top contributor after rebounding from lows early in the period when we added to our position. The company reported strong revenue growth and better-than-expected margins and free cash flow growth, even as it continued strategic investments in key growth areas. High-margin third-party sales, today just 17% of total revenue, have been growing nearly three times faster than Amazon’s first-party sales and represented one of the largest drivers of expanding gross margins. With estimated gross
| 6
LOOMIS SAYLES GROWTH FUND
merchandise volume (GMV) growth nearly double the U.S. e-commerce industry, Amazon continued to take market share. The company began disclosing Amazon Web Services results during the period, reporting impressive growth and margins that were much higher than market expectations.
Energy drink company Monster Beverage was also a top contributor and reported solid global sales growth during the period. Monster’s strategic partnership with Coca-Cola, announced in August 2014, closed in June 2015. International sales growth generally outpaced U.S. growth, but each region experienced pockets of short-term weakness as global distribution was transitioned to Coke. We expect the deal will allow Monster to realize faster global expansion and profitability, which led us to increase our initial appraisal of intrinsic value (our estimate of the true worth of a business, which we define as the present value of all expected future net cash flows to the company). Gross margins increased each quarter compared to the year-ago quarter, due to scale gains in new markets, an increase in lower cost local production, and a positive mix of product sales and lower quarterly operating expenses.
Another top contributor, Visa, the leader in global digital payments technology, reported strong results that were above market expectations. The company’s low double-digit growth in payment volumes exceeded the increase in global consumer spending, demonstrating the strength of the long-term secular growth in the global shift from cash to electronic payments. Through its initiatives such as Visa Checkout, Token Services and Apple Pay, Visa is also aggressively pursuing growth in online and digital transactions. We believe attractive and improving margins, impressive free cash flow growth and the ability to implement a recent price increase reflect the strength of Visa’s business model.
China-based e-commerce company Alibaba reported fundamentally strong results during the period with the GMV increasing at a higher rate than the growth in China’s retail commerce. Mobile platform GMV increased by triple digits each quarter during the period compared to the year-ago quarter and accounted for 55% of the company’s total GMV. Most recently, Alibaba reported 367 million active monthly users with 307 million active monthly mobile users, a 63% increase compared with last year. Alibaba generated attractive operating margins and strong free cash flow. Although near-term macroeconomic concerns negatively affected its share price, we believe Alibaba is well positioned to potentially benefit from long-term structural growth in China’s e-commerce market. Based on this outlook, we took advantage of the price weakness to add to our position.
Shares of Qualcomm, a mobile device chip designer and manufacturer, were under pressure due to near-term slowdowns in the company’s licensing and chipset businesses. The implementation of new licensing agreements and improved device reporting and royalty payments progressed more slowly than anticipated following the company’s settlement with Chinese antitrust regulators. In Qualcomm’s chipset business, we believe the loss of market share in the premium tier market and higher-than-expected share in the low tier market will negatively skew the near-term sales mix. During the most recent quarter, the company announced the commencement of a strategic review to improve shareholder value. We
7 |
believe the market remains focused on the recent volatility of Qualcomm’s chipset business performance, ignoring the reaffirmation of its licensing and royalty business, which generates more than 60% of operating profits and an even greater portion of the company’s free cash flow. Therefore, we took advantage of current price weakness to add to our position.
Although Schlumberger reported solid fundamentals early in the period, increased oil production by OPEC countries coupled with weakening global demand triggered a sharp decline in oil prices and a slowdown in demand for Schlumberger’s oilfield services, particularly in North America. Accordingly, company revenues, margins and earnings declined significantly year-over-year. However, Schlumberger’s margins, especially internationally, proved more resilient than market expectations, and in the most recent quarter, Schlumberger generated $1.5 billion of free cash flow, representing 132% of earnings. We believe these results highlight the company’s high-quality characteristics, its strong execution and its proactive management of costs and resources. We believe current global production levels will not be sufficient to meet the increasing long-term global demand for oil. With its strong competitive advantages, we believe Schlumberger is well positioned to weather the downturn and capitalize on services demand when the market normalizes. We added to our position based on near-term price weakness.
Outlook
Our investment process is characterized by bottom-up, fundamental research and a long-term investment time horizon. The nature of the process leads to a lower-turnover portfolio in which sector positioning is the result of stock selection. The Fund ended the year with overweight positions in the information technology, consumer staples and energy sectors and underweight positions in the consumer discretionary, industrials, healthcare and financials sectors. We did not have positions in the materials, telecommunication services and utilities sectors.
| 8
LOOMIS SAYLES GROWTH FUND
Growth of $10,000 Investment in Class A Shares3
September 30, 2005 through September 30, 2015
9 |
Average Annual Total Returns — September 30, 20153
| | | | | | | | | | | | | | | | |
| | | | | |
| | | 1 Year | | | 5 Years | | | 10 Years | | | Life of
Class N | |
| | | | | |
| Class A (Inception 12/31/96) | | | | | | | | | | | | | | | | |
| NAV | | | 5.30 | % | | | 14.38 | % | | | 5.25 | % | | | — | % |
| With 5.75% Maximum Sales Charge | | | -0.79 | | | | 13.05 | | | | 4.63 | | | | — | |
| | | | | |
| Class B (Inception 9/12/03) | | | | | | | | | | | | | | | | |
| NAV | | | 4.55 | | | | 13.54 | | | | 4.46 | | | | — | |
| With CDSC1 | | | -0.45 | | | | 13.30 | | | | 4.46 | | | | — | |
| | | | | |
| Class C (Inception 9/12/03) | | | | | | | | | | | | | | | | |
| NAV | | | 4.44 | | | | 13.56 | | | | 4.47 | | | | — | |
| With CDSC1 | | | 3.44 | | | | 13.56 | | | | 4.47 | | | | — | |
| | | | | |
| Class N (Inception 2/1/13) | | | | | | | | | | | | | | | | |
| NAV | | | 5.65 | | | | — | | | | — | | | | 13.43 | |
| | | | | |
| Class Y (Inception 5/16/91) | | | | | | | | | | | | | | | | |
| NAV | | | 5.59 | | | | 14.67 | | | | 5.59 | | | | — | |
| | | | | |
| Comparative Performance | | | | | | | | | | | | | | | | |
| Russell 1000® Growth Index2 | | | 3.17 | | | | 14.47 | | | | 8.09 | | | | 13.83 | |
Past performance does not guarantee future results. The table(s) do not reflect taxes shareholders might owe on any Fund distributions or when they redeem their shares. Performance for periods less than one year is cumulative, not annualized. Returns reflect changes in share price and reinvestment of dividends and capital gains, if any. Unlike a fund, an index is not managed and does not reflect fees and expenses. It is not possible to invest directly in an index.
| 1 | Performance for Class B shares assumes a maximum of 5% contingent deferred sales charge (“CDSC”) applied when you sell shares, which declines annually between years 1-6 according to the following schedule: 5, 4, 3, 3, 2, 1, 0%. Class C shares performance assumes a 1% CDSC applied when you sell shares within one year of purchase. |
| 2 | Russell 1000® Growth Index is an unmanaged index that measures the performance of the large-cap growth segment of the U.S. equity universe. It includes those Russell 1000 companies with higher price-to-book ratios and higher forecasted growth values. |
| 3 | Fund performance has been increased by fee waivers and/or expense reimbursements, if any, without which performance would have been lower. |
| 10
LOOMIS SAYLES VALUE FUND
| | | | |
| Managers | | Symbols | | |
| Arthur J. Barry, CFA® | | Class A | | LSVRX |
| Adam C. Liebhoff | | Class B | | LSVBX |
| Loomis, Sayles & Company, L.P. | | Class C | | LSCVX |
| | Class N | | LSVNX |
| | Class Y | | LSGIX |
| | Admin Class | | LSAVX |
Objective
The Fund seeks long-term growth of capital and income
Market Conditions
Despite steady gains for most of the one-year period, large-cap U.S. equities landed in negative territory, as equity markets worldwide came under increasing pressure toward the end of the period. Given mounting concerns about China’s growth, falling commodity prices and uncertainty around the timing of the Federal Reserve’s (the Fed) first interest rate increases, market volatility spiked in August and triggered a broad equity market correction, with many benchmarks declining 10% or more for the first time since 2011. Therefore, despite positive U.S. economic data, major domestic indices erased strong performance for the year during the third quarter of 2015.
Performance Results
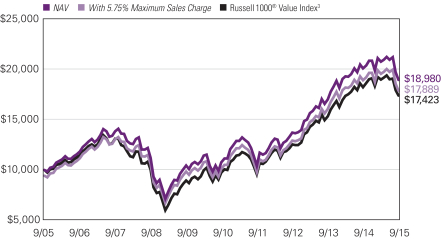
For the 12 months ended September 30, 2015, Class A shares of Loomis Sayles Value Fund returned -5.59% at net asset value. The Fund underperformed its benchmark, the Russell 1000® Value Index, which returned -4.42%.
Explanation of Fund Performance
The healthcare, materials and consumer staples sectors contributed meaningfully to the Fund’s absolute performance, reflecting the steady equity market performance for much of the period. Stock selection was also strong within these sectors. Falling oil prices pressured the energy sector, and while the Fund was underweight, our energy holdings detracted from results given their higher relative volatility. Individual stock underperformance in the financials and industrials sectors also weighed on return, especially as the latter had a very difficult earnings season.
In terms of individual holdings, the strongest contributors to performance were United Health Group, Vulcan Materials Company and Eli Lilly. United Health Group, a managed care company, contributed significantly to results because of stronger-than-expected earnings and an improving growth outlook, particularly in its Medicare Advantage and Optum health care services businesses. Vulcan Materials Company, a producer of construction aggregates, benefited from improving volumes and accelerating pricing gains in its core markets due to strengthening U.S. residential and non-residential construction.
11 |
Several strong earnings reports, a positive analyst day and a U.S.-centric business model also supported results. Eli Lilly, a pharmaceutical company, also performed well due to strong new product launches in its diabetes and oncology franchises. The stock price also benefited from increased investor optimism regarding its late-stage pipeline of potential new therapies in the areas of immunology, cholesterol management and Alzheimer’s.
Energy companies Marathon Oil, National Oilwell Varco and Hess Corporation were the largest laggards. Not surprisingly, all three companies underperformed as oil prices declined approximately 50% during the 12-month period. Investors were also concerned that Marathon Oil would reduce its dividend to boost liquidity. Fears that the offshore oilfield equipment market has entered a protracted downturn also put additional pressure on National Oilwell Varco, a worldwide provider of oil and gas equipment.
Outlook
Investors are unclear if the Fed will raise rates by year-end 2015 or early 2016. We believe that once initiated, the Fed will hike rates at a very deliberate pace as they assess global market conditions and economic data. We expect stocks to take policy actions in stride.
We believe energy earnings will continue to drag on U.S. aggregate earnings in 2016. However, healthy earnings growth outside of energy should continue, and we anticipate 2016 earnings growth to be in the mid-single digits. Domestic equity fundamentals remain supported by healthy dividend growth, growing shareholder activism and continued mergers and acquisitions (M&A) activity.
Despite the rapid pace of the August sell-off, we continue to focus on security selection to populate our portfolio. The pullback provided potential opportunities to adjust the position sizes of our current holdings. As always, we define our opportunities by our risk/reward analysis, regardless of the direction of the markets.
Potential risks include reversing global economic fundamentals, commodity price swings, volatility related to U.S. rate increases and geopolitics. Still, valuations appear attractive after the correction in August, which we believe has created opportunities for discerning investors.
| 12
LOOMIS SAYLES VALUE FUND
Growth of $10,000 Investment in Class A Shares1,4
September 30, 2005 through September 30, 2015
13 |
Average Annual Total Returns — September 30, 20154
| | | | | | | | | | | | | | | | |
| | | | | |
| | | 1 Year | | | 5 Years | | | 10 Years | | | Life of
Class N | |
| | | | | |
| Class A (Inception 6/30/06)1 | | | | | | | | | | | | | | | | |
| NAV | | | -5.59 | % | | | 12.02 | % | | | 6.62 | % | | | — | % |
| With 5.75% Maximum Sales Charge | | | -11.03 | | | | 10.71 | | | | 5.99 | | | | — | |
| | | | | |
| Class B (Inception 6/1/07)1 | | | | | | | | | | | | | | | | |
| NAV | | | -6.32 | | | | 11.18 | | | | 5.79 | | | | — | |
| With CDSC2 | | | -10.58 | | | | 10.92 | | | | 5.79 | | | | — | |
| | | | | |
| Class C (Inception 6/1/07)1 | | | | | | | | | | | | | | | | |
| NAV | | | -6.30 | | | | 11.19 | | | | 5.80 | | | | — | |
| With CDSC2 | | | -7.14 | | | | 11.19 | | | | 5.80 | | | | — | |
| | | | | |
| Class N (Inception 2/1/13) | | | | | | | | | | | | | | | | |
| NAV | | | -5.23 | | | | — | | | | — | | | | 9.54 | |
| | | | | |
| Class Y (Inception 5/13/91) | | | | | | | | | | | | | | | | |
| NAV | | | -5.37 | | | | 12.30 | | | | 6.92 | | | | — | |
| | | | | |
| Admin Class (Inception 2/1/10)1 | | | | | | | | | | | | | | | | |
| NAV | | | -5.83 | | | | 11.77 | | | | 6.34 | | | | — | |
| | | | | |
| Comparative Performance | | | | | | | | | | | | | | | | |
| Russell 1000® Value Index3 | | | -4.42 | | | | 12.29 | | | | 5.71 | | | | 9.54 | |
Past performance does not guarantee future results. The table(s) do not reflect taxes shareholders might owe on any Fund distributions or when they redeem their shares. Performance for periods less than one year is cumulative, not annualized. Returns reflect changes in share price and reinvestment of dividends and capital gains, if any. Unlike a fund, an index is not managed and does not reflect fees and expenses. It is not possible to invest directly in an index.
| 1 | Prior to 6/1/07, performance of Class A shares is that of Retail Class shares, which were redesignated as Class A shares, restated to reflect the sales load of Class A shares. Prior to the inception of Retail Class shares (6/30/06), performance is that of Institutional Class shares, which were redesignated as Class Y shares, restated to reflect the higher net expenses and sales loads of Class A shares. Prior to the inception of Class B and C shares (6/1/07), performance is that of Institutional Class shares, restated to reflect the higher net expenses and sales loads of Class B and C shares. Prior to the inception of Admin Class shares (2/1/10), performance is that of Class A shares, restated to reflect the higher net expenses of Admin Class shares. |
| 2 | Performance for Class B shares assumes a maximum of 5% contingent deferred sales charge (“CDSC”) applied when you sell shares, which declines annually between years 1-6 according to the following schedule: 5, 4, 3, 3, 2, 1, 0%. Class C shares performance assumes a 1% CDSC applied when you sell shares within one year of purchase. |
| 3 | Russell 1000® Value Index is an unmanaged index that measures the performance of the large-cap value segment of the U.S. equity universe. It includes those Russell 1000 companies with lower price-to-book ratios and higher forecasted growth values. |
| 4 | Fund performance has been increased by fee waivers and/or expense reimbursements, if any, without which performance would have been lower. |
| 14
ADDITIONAL INFORMATION
The views expressed in this report reflect those of the portfolio managers as of the dates indicated. The managers’ views are subject to change at any time without notice based on changes in market or other conditions. References to specific securities or industries should not be regarded as investment advice. Because the Funds are actively managed, there is no assurance that they will continue to invest in the securities or industries mentioned.
ADDITIONAL INDEX INFORMATION
This document may contain references to third party copyrights, indexes, and trademarks, each of which is the property of its respective owner. Such owner is not affiliated with Natixis Global Asset Management or any of its related or affiliated companies (collectively “NGAM”) and does not sponsor, endorse or participate in the provision of any NGAM services, funds or other financial products.
The index information contained herein is derived from third parties and is provided on an “as is” basis. The user of this information assumes the entire risk of use of this information. Each of the third party entities involved in compiling, computing or creating index information disclaims all warranties (including, without limitation, any warranties of originality, accuracy, completeness, timeliness, non-infringement, merchantability and fitness for a particular purpose) with respect to such information.
PROXY VOTING INFORMATION
A description of the Funds’ proxy voting policies and procedures is available without charge, upon request, by calling Natixis Funds at 800-225-5478; on the funds’ website at ngam.natixis.com; and on the Securities and Exchange Commission’s (“SEC’s”) website at www.sec.gov. Information regarding how the funds voted proxies relating to portfolio securities during the 12 months ended June 30, 2015 is available from the funds’ website and the SEC’s website.
QUARTERLY PORTFOLIO SCHEDULES
The funds file a complete schedule of portfolio holdings with the SEC for the first and third quarters of each fiscal year on Form N-Q. The funds’ Forms N-Q are available on the SEC’s website at www.sec.gov and may be reviewed and copied at the SEC’s Public Reference Room in Washington, DC. Information on the operation of the Public Reference Room may be obtained by calling 800-SEC-0330.
15 |
UNDERSTANDING FUND EXPENSES
As a mutual fund shareholder, you incur different types of costs: transaction costs, including sales charges (loads) on purchases and contingent deferred sales charges on redemptions, and ongoing costs, including management fees, distribution and/or service fees (12b-1 fees), and other fund expenses. Certain exemptions may apply. These costs are described in more detail in the Fund’s prospectus. The examples below are intended to help you understand the ongoing costs of investing in the Funds and help you compare these with the ongoing costs of investing in other mutual funds.
The first line in the table for each class of Fund shares shows the actual account values and actual fund expenses you would have paid on a $1,000 investment in the Fund from April 1, 2015 through September 30, 2015. To estimate the expenses you paid over the period, simply divide your account value by $1,000 (for example, $8,600 account value divided by $1,000 = 8.6) and multiply the result by the number in the Expenses Paid During Period row as shown below for your class.
The second line in the table for each class of Fund shares provides information about hypothetical account values and hypothetical expenses based on the Fund’s actual expense ratios and an assumed rate of return of 5% per year before expenses, which is not the Fund’s actual return. The hypothetical account values and expenses may not be used to estimate the actual ending account balance or expenses you paid on your investment for the period. You may use this information to compare the ongoing costs of investing in the Funds to other funds. To do so, compare this 5% hypothetical example with the 5% hypothetical examples that appear in the shareholder reports of the other funds.
Please note that the expenses shown reflect ongoing costs only, and do not include any transaction costs, such as sales charges. Therefore, the second line in the table of each fund is useful in comparing ongoing costs only, and will not help you determine the relative costs of owning different funds. If transaction costs were included, total costs would be higher.
| | | | | | | | | | | | |
LOOMIS SAYLES GLOBAL EQUITY AND
INCOME FUND | | BEGINNING
ACCOUNT VALUE
4/1/2015 | | | ENDING
ACCOUNT VALUE
9/30/2015 | | | EXPENSES PAID
DURING PERIOD*
4/1/2015 – 9/30/2015 | |
| Class A | | | | | | | | | | | | |
| Actual | | | $1,000.00 | | | | $952.00 | | | | $5.77 | |
| Hypothetical (5% return before expenses) | | | $1,000.00 | | | | $1,019.15 | | | | $5.97 | |
| Class C | | | | | | | | | | | | |
| Actual | | | $1,000.00 | | | | $948.40 | | | | $9.43 | |
| Hypothetical (5% return before expenses) | | | $1,000.00 | | | | $1,015.39 | | | | $9.75 | |
| Class Y | | | | | | | | | | | | |
| Actual | | | $1,000.00 | | | | $952.70 | | | | $4.50 | |
| Hypothetical (5% return before expenses) | | | $1,000.00 | | | | $1,020.46 | | | | $4.66 | |
| * | Expenses are equal to the Fund's annualized expense ratio: 1.18%, 1.93% and 0.92% for Class A, C and Y, respectively, multiplied by the average account value over the period, multiplied by the number of days in the most recent fiscal half-year (183), divided by 365 (to reflect the half-year period). |
| 16
| | | | | | | | | | | | |
| LOOMIS SAYLES GROWTH FUND | | BEGINNING
ACCOUNT VALUE
4/1/2015 | | | ENDING
ACCOUNT VALUE
9/30/2015 | | | EXPENSES PAID
DURING PERIOD*
4/1/2015 – 9/30/2015 | |
| Class A | | | | | | | | | | | | |
| Actual | | | $1,000.00 | | | | $971.50 | | | | $4.55 | |
| Hypothetical (5% return before expenses) | | | $1,000.00 | | | | $1,020.46 | | | | $4.66 | |
| Class B | | | | | | | | | | | | |
| Actual | | | $1,000.00 | | | | $968.40 | | | | $8.19 | |
| Hypothetical (5% return before expenses) | | | $1,000.00 | | | | $1,016.75 | | | | $8.39 | |
| Class C | | | | | | | | | | | | |
| Actual | | | $1,000.00 | | | | $968.40 | | | | $8.24 | |
| Hypothetical (5% return before expenses) | | | $1,000.00 | | | | $1,016.70 | | | | $8.44 | |
| Class N | | | | | | | | | | | | |
| Actual | | | $1,000.00 | | | | $974.10 | | | | $2.57 | |
| Hypothetical (5% return before expenses) | | | $1,000.00 | | | | $1,022.46 | | | | $2.64 | |
| Class Y | | | | | | | | | | | | |
| Actual | | | $1,000.00 | | | | $973.20 | | | | $3.31 | |
| Hypothetical (5% return before expenses) | | | $1,000.00 | | | | $1,021.71 | | | | $3.40 | |
| * | Expenses are equal to the Fund's annualized expense ratio (after waiver/reimbursement): 0.92%, 1.66%, 1.67%, 0.52% and 0.67% for Class A, B, C, N and Y, respectively, multiplied by the average account value over the period, multiplied by the number of days in the most recent fiscal half-year (183), divided by 365 (to reflect the half-year period). |
17 |
| | | | | | | | | | | | |
| LOOMIS SAYLES VALUE FUND | | BEGINNING
ACCOUNT VALUE
4/1/2015 | | | ENDING
ACCOUNT VALUE
9/30/2015 | | | EXPENSES PAID
DURING PERIOD*
4/1/2015 – 9/30/2015 | |
| Class A | | | | | | | | | | | | |
| Actual | | | $1,000.00 | | | | $913.90 | | | | $4.56 | |
| Hypothetical (5% return before expenses) | | | $1,000.00 | | | | $1,020.31 | | | | $4.81 | |
| Class B | | | | | | | | | | | | |
| Actual | | | $1,000.00 | | | | $910.20 | | | | $8.09 | |
| Hypothetical (5% return before expenses) | | | $1,000.00 | | | | $1,016.60 | | | | $8.54 | |
| Class C | | | | | | | | | | | | |
| Actual | | | $1,000.00 | | | | $910.50 | | | | $8.14 | |
| Hypothetical (5% return before expenses) | | | $1,000.00 | | | | $1,016.55 | | | | $8.59 | |
| Class N | | | | | | | | | | | | |
| Actual | | | $1,000.00 | | | | $915.60 | | | | $2.79 | |
| Hypothetical (5% return before expenses) | | | $1,000.00 | | | | $1,022.16 | | | | $2.94 | |
| Class Y | | | | | | | | | | | | |
| Actual | | | $1,000.00 | | | | $915.00 | | | | $3.36 | |
| Hypothetical (5% return before expenses) | | | $1,000.00 | | | | $1,021.56 | | | | $3.55 | |
| Admin Class | | | | | | | | | | | | |
| Actual | | | $1,000.00 | | | | $912.60 | | | | $5.90 | |
| Hypothetical (5% return before expenses) | | | $1,000.00 | | | | $1,018.90 | | | | $6.23 | |
| * | Expenses are equal to the Fund's annualized expense ratio: 0.95%, 1.69%, 1.70%, 0.58%, 0.70% and 1.23% for Class A, B, C, N, Y and Admin Class, respectively, multiplied by the average account value over the period, multiplied by the number of days in the most recent fiscal half-year (183), divided by 365 (to reflect the half-year period). |
| 18
BOARD APPROVAL OF THE EXISTING
ADVISORY AGREEMENTS
The Board of Trustees of the Trust (the “Board”), including the Independent Trustees, considers matters bearing on each Fund’s advisory agreement (collectively, the “Agreements”) at most of its meetings throughout the year. Each year, usually in the spring, the Contract Review Committee of the Board meets to review the Agreements to determine whether to recommend that the full Board approve the continuation of the Agreements, typically for an additional one-year period. After the Committee has made its recommendation, the full Board, including the Independent Trustees, determines whether to approve the continuation of the Agreements.
In connection with these meetings, the Trustees receive materials that the Funds’ investment adviser (the “Adviser”) believes to be reasonably necessary for the Trustees to evaluate the Agreements. These materials generally include, among other items, (i) information on the investment performance of the Funds and the performance of peer groups of funds and the Funds’ performance benchmarks, (ii) information on the Funds’ advisory fees and other expenses, including information comparing the Funds’ expenses to the fees charged to institutional accounts with similar strategies managed by the Adviser, if any, and to those of peer groups of funds and information about any applicable expense caps and/or fee “breakpoints,” (iii) sales and redemption data in respect of the Funds, (iv) information about the profitability of the Agreements to the Adviser and (v) information obtained through the completion by the Adviser of a questionnaire distributed on behalf of the Trustees. The Board, including the Independent Trustees, also considers other matters such as (i) the Adviser’s financial results and financial condition, (ii) each Fund’s investment objective and strategies and the size, education and experience of the Adviser’s investment staff and its use of technology, external research and trading cost measurement tools, (iii) arrangements in respect of the distribution of the Funds’ shares and the related costs, (iv) the procedures employed to determine the value of the Funds’ assets, (v) the allocation of the Funds’ brokerage, if any, including, if applicable, allocations to brokers affiliated with the Adviser and the use of “soft” commission dollars to pay Fund expenses and to pay for research and other similar services, (vi) the resources devoted to, and the record of compliance with, the Funds’ investment policies and restrictions, policies on personal securities transactions and other compliance policies, (vii) information about amounts invested by the Funds’ portfolio managers in the Funds or in similar accounts that they manage and (viii) the general economic outlook with particular emphasis on the mutual fund industry. Throughout the process, the Trustees are afforded the opportunity to ask questions of and request additional materials from the Adviser.
In addition to the materials requested by the Trustees in connection with their annual consideration of the continuation of the Agreements, the Trustees receive materials in advance of each regular quarterly meeting of the Board that provide detailed information about the Funds’ investment performance and the fees charged to the Funds for advisory and other services. This information generally includes, among other things, an internal performance rating for each Fund based on agreed-upon criteria, graphs showing each Fund’s performance and fee differentials against each Fund’s peer group/category, performance ratings provided by a third-party, total return information for various periods,
19 |
and third-party performance rankings for various periods comparing a Fund against similarly categorized funds. The portfolio management team for each Fund or other representatives of the Adviser make periodic presentations to the Contract Review Committee and/or the full Board, and Funds identified as presenting possible performance concerns may be subject to more frequent board presentations and reviews. In addition, each quarter the Trustees are provided with detailed statistical information about each Fund’s portfolio. The Trustees also receive periodic updates between meetings.
The Board most recently approved the continuation of the Agreements at its meeting held in June 2015. The Agreements were continued for a one-year period for the Funds. In considering whether to approve the continuation of the Agreements, the Board, including the Independent Trustees, did not identify any single factor as determinative. Individual Trustees may have evaluated the information presented differently from one another, giving different weights to various factors. Matters considered by the Trustees, including the Independent Trustees, in connection with their approval of the Agreements included, but were not limited to, the factors listed below.
The nature, extent and quality of the services provided to the Funds under the Agreements. The Trustees considered the nature, extent and quality of the services provided by the Adviser and its affiliates to the Funds and the resources dedicated to the Funds by the Adviser and its affiliates.
The Trustees considered not only the advisory services provided by the Adviser to the Funds, but also the monitoring and oversight services provided by NGAM Advisors, L.P. (“NGAM Advisors”). They also considered the administrative services provided by NGAM Advisors and its affiliates to the Funds. For each Fund, the Trustees also considered the benefits to shareholders of investing in a mutual fund that is part of a family of funds that offers shareholders the right to exchange shares of one type of fund for shares of another type of fund, and provides a variety of fund and shareholder services.
After reviewing these and related factors, the Trustees concluded, within the context of their overall conclusions regarding each of the Agreements, that the nature, extent and quality of services provided supported the renewal of the Agreements.
Investment performance of the Funds and the Adviser. As noted above, the Trustees received information about the performance of the Funds over various time periods, including information that compared the performance of the Funds to the performance of peer groups and categories of funds and the Funds’ respective performance benchmarks. In addition, the Trustees also reviewed data prepared by an independent third party that analyzed the performance of the Funds using a variety of performance metrics, including metrics that also measured the performance of the Funds on a risk adjusted basis.
With respect to each Fund, the Board concluded that the Fund’s performance or other relevant factors supported the renewal of the Agreement relating to that Fund. In the case of the Loomis Sayles Value Fund, the performance of which lagged that of a relevant peer group median and/or category median for certain (although not all) periods, the Board concluded that other factors relevant to performance supported renewal of the Agreements. These factors included the following: (1) that the underperformance was attributable, to a significant extent, to investment decisions (such as security selection or sector allocation) by the Adviser that were reasonable and consistent with the Fund’s investment objective and
| 20
policies; and (2) that the Fund’s long-term performance was competitive when compared to relevant performance benchmarks or peer groups.
The Trustees also considered the Adviser’s performance and reputation generally, the performance of the fund family generally, and the historical responsiveness of the Adviser to Trustee concerns about performance and the willingness of the Adviser to take steps intended to improve performance.
After reviewing these and related factors, the Trustees concluded, within the context of their overall conclusions regarding each of the Agreements, that the performance of the Funds and the Adviser supported the renewal of the Agreements.
The costs of the services to be provided and profits to be realized by the Adviser and its affiliates from their respective relationships with the Funds. The Trustees considered the fees charged to the Funds for advisory services as well as the total expense levels of the Funds. This information included comparisons (provided both by management and also by an independent third party) of the Funds’ advisory fees and total expense levels to those of their peer groups and information about the advisory fees charged by the Adviser to comparable accounts (such as institutional separate accounts), as well as information about differences in such fees and the reasons for any such differences. In considering the fees charged to comparable accounts, the Trustees considered, among other things, management’s representations about the differences between managing mutual funds as compared to other types of accounts, including the additional resources required to effectively manage mutual fund assets and the greater regulatory costs associated with the management of such assets. In evaluating each Fund’s advisory fee, the Trustees also took into account the demands, complexity and quality of the investment management of such Fund and the need for the Adviser to offer competitive compensation and to expend additional resources as the Funds grow in size. The Trustees considered that over the past several years, management had made recommendations regarding reductions in advisory fee rates, implementation of advisory fee breakpoints and the institution of advisory fee waivers and expense caps for various funds in the fund family. They noted that all three of the Funds included in this report have expense caps in place, and the Trustees considered that the current expenses of each Fund are below the cap.
The Trustees also considered the compensation directly or indirectly received by the Adviser and its affiliates from their relationships with the Funds. The Trustees reviewed information provided by management as to the profitability of the Adviser’s and its affiliates’ relationships with the Funds, and information about the allocation of expenses used to calculate profitability. They also reviewed information provided by management about the effect of distribution costs and changes in asset levels on Adviser profitability, including information regarding resources spent on distribution activities. When reviewing profitability, the Trustees also considered information about court cases in which adviser compensation or profitability were issues, the performance of the relevant Funds, the expense levels of the Funds, and whether the Adviser had implemented breakpoints and/or expense caps with respect to such Funds.
After reviewing these and related factors, the Trustees concluded, within the context of their overall conclusions regarding each of the Agreements, that the advisory fee charged to each of the Funds was fair and reasonable, and that the costs of these services generally and
21 |
the related profitability of the Adviser and its affiliates in respect of their relationships with the Funds supported the renewal of the Agreements.
Economies of Scale. The Trustees considered the existence of any economies of scale in the provision of services by the Adviser and whether those economies are shared with the Funds through breakpoints in their investment advisory fees or other means, such as expense waivers or caps. The Trustees also discussed with management the factors considered with respect to the implementation of breakpoints in investment advisory fees or expense waivers or caps for certain funds. Management explained that a number of factors are taken into account in considering the possible implementation of breakpoints or an expense cap for a fund, including, among other things, factors such as a fund’s assets, the projected growth of a fund, projected profitability and a fund’s fees and performance. With respect to economies of scale, the Trustees noted that each of the Funds was subject to an expense cap or waiver. In considering these issues, the Trustees also took note of the costs of the services provided (both on an absolute and a relative basis) and the profitability to the Adviser and its affiliates of their relationships with the Funds, as discussed above.
After reviewing these and related factors, the Trustees concluded, within the context of their overall conclusions regarding each of the Agreements, that the extent to which economies of scale were shared with the Funds supported the renewal of the Agreements.
The Trustees also considered other factors, which included but were not limited to the following:
| · | | The effect of recent market and economic events on the performance, asset levels and expense ratios of each Fund. |
| · | | Whether each Fund has operated in accordance with its investment objective and the Fund’s record of compliance with its investment restrictions, and the compliance programs of the Funds and the Adviser. They also considered the compliance-related resources the Adviser and its affiliates were providing to the Funds. |
| · | | Plans for maintaining continuity of portfolio management where that was thought to be a potential issue. |
| · | | The nature, quality, cost and extent of administrative and shareholder services performed by the Adviser and its affiliates, both under the Agreements and under separate agreements covering administrative services. |
| · | | So-called “fallout benefits” to the Adviser, such as the engagement of affiliates of the Adviser to provide distribution, administrative and brokerage services to the Funds, and the benefits of research made available to the Adviser by reason of brokerage commissions (if any) generated by the Funds’ securities transactions. The Trustees also considered the benefits to the parent company of NGAM Advisors from the retention of the Adviser. The Trustees considered the possible conflicts of interest associated with these fallout and other benefits, and the reporting, disclosure and other processes in place to disclose and monitor such possible conflicts of interest. |
| · | | The Trustees’ review and discussion of the Funds’ advisory arrangements in prior years, and management’s record of responding to Trustee concerns raised during the year and in prior years. |
Based on their evaluation of all factors that they deemed to be material, including those factors described above, and assisted by the advice of independent counsel, the Trustees, including the Independent Trustees, concluded that each of the existing Agreements should be continued through June 30, 2016.
| 22
Portfolio of Investments – as of September 30, 2015
Loomis Sayles Global Equity and Income Fund
| | | | | | | | |
Shares | | | Description | | Value (†) | |
| | Common Stocks — 61.7% of Net Assets | | | | |
| | | | Belgium — 1.5% | | | | |
| | 176,024 | | | Anheuser-Busch InBev SA/NV | | $ | 18,721,113 | |
| | | | | | | | |
| | | | Canada — 1.4% | | | | |
| | 479,600 | | | CGI Group, Inc., Class A(b) | | | 17,376,291 | |
| | | | | | | | |
| | | | China — 2.7% | | | | |
| | 339,283 | | | Alibaba Group Holding Ltd., Sponsored ADR(b) | | | 20,007,518 | |
| | 1,362,500 | | | Hengan International Group Co. Ltd. | | | 13,313,947 | |
| | | | | | | | |
| | | | | | | 33,321,465 | |
| | | | | | | | |
| | | | Denmark — 1.2% | | | | |
| | 279,074 | | | Novo Nordisk AS, Class B | | | 15,060,105 | |
| | | | | | | | |
| | | | France — 1.5% | | | | |
| | 258,257 | | | Thales S.A. | | | 18,006,952 | |
| | | | | | | | |
| | | | Germany — 0.3% | | | | |
| | 78,663 | | | Brenntag AG | | | 4,244,166 | |
| | | | | | | | |
| | | | Hong Kong — 1.4% | | | | |
| | 3,278,000 | | | AIA Group Ltd. | | | 17,048,044 | |
| | | | | | | | |
| | | | India — 2.3% | | | | |
| | 940,386 | | | HCL Technologies Ltd. | | | 14,103,053 | |
| | 724,642 | | | HDFC Bank Ltd. | | | 14,232,396 | |
| | | | | | | | |
| | | | | | | 28,335,449 | |
| | | | | | | | |
| | | | Italy — 0.7% | | | | |
| | 132,237 | | | Luxottica Group S.p.A. | | | 9,164,625 | |
| | | | | | | | |
| | | | Japan — 3.1% | | | | |
| | 326,000 | | | Asahi Group Holdings Ltd. | | | 10,576,501 | |
| | 2,286,600 | | | Mitsubishi UFJ Financial Group, Inc. | | | 13,816,182 | |
| | 373,670 | | | Nomura Research Institute Ltd. | | | 14,344,149 | |
| | | | | | | | |
| | | | | | | 38,736,832 | |
| | | | | | | | |
| | | | Netherlands — 1.5% | | | | |
| | 1,340,209 | | | ING Groep NV | | | 18,987,413 | |
| | | | | | | | |
| | | | Philippines — 0.7% | | | | |
| | 2,202,650 | | | Universal Robina Corp. | | | 9,056,184 | |
| | | | | | | | |
| | | | Sweden — 1.6% | | | | |
| | 440,273 | | | Assa Abloy AB | | | 7,896,638 | |
| | 519,588 | | | Atlas Copco AB, A Shares | | | 12,495,579 | |
| | | | | | | | |
| | | | | | | 20,392,217 | |
| | | | | | | | |
| | | | Switzerland — 1.9% | | | | |
| | 32,589 | | | Geberit AG, (Registered) | | | 9,969,484 | |
| | 49,881 | | | Roche Holding AG | | | 13,241,987 | |
| | | | | | | | |
| | | | | | | 23,211,471 | |
| | | | | | | | |
| | | | United Kingdom — 2.7% | | | | |
| | 4,468,565 | | | Legal & General Group PLC | | | 16,112,604 | |
| | 461,989 | | | London Stock Exchange Group PLC | | | 16,933,849 | |
| | | | | | | | |
| | | | | | | 33,046,453 | |
| | | | | | | | |
See accompanying notes to financial statements.
23 |
Portfolio of Investments – as of September 30, 2015
Loomis Sayles Global Equity and Income Fund – (continued)
| | | | | | | | |
Shares | | | Description | | Value (†) | |
| | | | United States — 37.2% | | | | |
| | 113,632 | | | Alexion Pharmaceuticals, Inc.(b) | | $ | 17,770,908 | |
| | 110,482 | | | Allergan PLC(b) | | | 30,030,112 | |
| | 35,840 | | | Amazon.com, Inc.(b) | | | 18,346,138 | |
| | 45,839 | | | AutoZone, Inc.(b) | | | 33,179,643 | |
| | 316,052 | | | Comcast Corp., Class A | | | 17,977,038 | |
| | 237,422 | | | Facebook, Inc., Class A(b) | | | 21,344,238 | |
| | 94,140 | | | FactSet Research Systems, Inc. | | | 15,044,513 | |
| | 211,847 | | | Genesee & Wyoming, Inc., Class A(b) | | | 12,515,921 | |
| | 97,473 | | | Goldman Sachs Group, Inc. (The) | | | 16,936,908 | |
| | 35,729 | | | Google, Inc., Class A(b) | | | 22,808,322 | |
| | 24,420 | | | Google, Inc., Class C(b) | | | 14,857,616 | |
| | 955 | | | Hawaiian Telcom Holdco, Inc.(b) | | | 19,845 | |
| | 556,441 | | | Jarden Corp.(b) | | | 27,198,836 | |
| | 512,886 | | | Kinder Morgan, Inc. | | | 14,196,684 | |
| | 106,695 | | | M&T Bank Corp. | | | 13,011,455 | |
| | 20,465 | | | Priceline Group, Inc. (The)(b) | | | 25,312,340 | |
| | 198,742 | | | Schlumberger Ltd. | | | 13,707,236 | |
| | 81,842 | | | Signet Jewelers Ltd. | | | 11,141,151 | |
| | 241,176 | | | Texas Instruments, Inc. | | | 11,943,036 | |
| | 137,777 | | | TransDigm Group, Inc.(b) | | | 29,265,213 | |
| | 170,467 | | | Travelers Cos., Inc. (The) | | | 16,966,581 | |
| | 163,321 | | | UnitedHealth Group, Inc. | | | 18,946,869 | |
| | 174,729 | | | Valeant Pharmaceuticals International, Inc.(b) | | | 31,168,159 | |
| | 63,461 | | | W.W. Grainger, Inc. | | | 13,644,750 | |
| | 295,611 | | | Wells Fargo & Co. | | | 15,179,625 | |
| | | | | | | | |
| | | | | | | 462,513,137 | |
| | | | | | | | |
| | | | Total Common Stocks (Identified Cost $694,312,966) | | | 767,221,917 | |
| | | | | | | | |
| | | | | | | | |
Principal
Amount (‡) | | | | | | |
| | Bonds and Notes — 32.1% | | | | |
| | Non-Convertible Bonds — 31.4% | | | | |
| | | | Argentina — 0.2% | | | | |
| $ | 382,136 | | | Transportadora de Gas del Sur S.A., 9.625%, 5/14/2020, 144A | | | 381,181 | |
| | 1,755,000 | | | YPF S.A., 8.750%, 4/04/2024, 144A | | | 1,551,069 | |
| | | | | | | | |
| | | | | | | 1,932,250 | |
| | | | | | | | |
| | | | Australia — 0.1% | | | | |
| | 110,000 | | | Incitec Pivot Finance LLC, 6.000%, 12/10/2019, 144A | | | 120,380 | |
| | 500,000 | | | Macquarie Bank Ltd., 6.625%, 4/07/2021, 144A | | | 560,443 | |
| | 95,000 | | | Sydney Airport Finance Co. Pty Ltd., 3.375%, 4/30/2025, 144A | | | 91,666 | |
| | 120,000 | | | Sydney Airport Finance Co. Pty Ltd., 5.125%, 2/22/2021, 144A | | | 131,861 | |
| | 950,000 | | | Telstra Corp. Ltd., 3.125%, 4/07/2025, 144A | | | 921,908 | |
| | | | | | | | |
| | | | | | | 1,826,258 | |
| | | | | | | | |
See accompanying notes to financial statements.
| 24
Portfolio of Investments – as of September 30, 2015
Loomis Sayles Global Equity and Income Fund – (continued)
| | | | | | | | |
Principal
Amount (‡) | | | Description | | Value (†) | |
| | | | Belgium — 0.0% | | | | |
| | 350,000 | | | Anheuser-Busch InBev SA/NV, EMTN, 6.500%, 6/23/2017, (GBP) | | $ | 568,813 | |
| | | | | | | | |
| | | | Brazil — 1.1% | | | | |
| | 800,000 | | | Banco do Brasil S.A., 3.875%, 10/10/2022 | | | 617,000 | |
| | 600,000 | | | Banco Santander Brasil S.A., 4.625%, 2/13/2017, 144A | | | 598,200 | |
| | 2,239,815 | | | Banco Votorantim S.A., 6.250%, 5/16/2016, 144A, (BRL) | | | 518,366 | |
| | 800,000 | | | Braskem Finance Ltd., 5.750%, 4/15/2021, 144A | | | 656,000 | |
| | 6,600(††) | | | Brazil Letras do Tesouro Nacional, Zero Coupon, 7/01/2016, (BRL)(c) | | | 1,496,486 | |
| | 2,250(††) | | | Brazil Notas do Tesouro Nacional, Series F, 10.000%, 1/01/2019, (BRL) | | | 491,169 | |
| | 1,115(††) | | | Brazil Notas do Tesouro Nacional, Series F, 10.000%, 1/01/2021, (BRL) | | | 228,887 | |
| | 2,300,000 | | | BRF S.A., 7.750%, 5/22/2018, 144A, (BRL) | | | 472,821 | |
| | 1,000,000 | | | CIMPOR Financial Operations BV, 5.750%, 7/17/2024, 144A | | | 671,000 | |
| | 400,000 | | | Cosan Luxembourg S.A., 5.000%, 3/14/2023, 144A | | | 300,000 | |
| | 240,000 | | | Embraer Netherlands Finance BV, 5.050%, 6/15/2025 | | | 222,060 | |
| | 800,000 | | | Gerdau Trade, Inc., 5.750%, 1/30/2021, 144A | | | 696,000 | |
| | 226,000 | | | GTL Trade Finance, Inc., 5.893%, 4/29/2024, 144A | | | 187,580 | |
| | 915,000 | | | Itau Unibanco Holding S.A., 2.850%, 5/26/2018, 144A | | | 857,081 | |
| | 300,000 | | | Itau Unibanco Holding S.A., 6.200%, 12/21/2021, 144A | | | 284,250 | |
| | 100,000 | | | LPG International, Inc., 7.250%, 12/20/2015 | | | 100,847 | |
| | 1,205,000 | | | Oi S.A., 9.750%, 9/15/2016, 144A, (BRL) | | | 204,496 | |
| | 1,825,000 | | | Petrobras Global Finance BV, 4.375%, 5/20/2023(c) | | | 1,190,812 | |
| | 320,000 | | | Petrobras Global Finance BV, 5.375%, 1/27/2021 | | | 232,800 | |
| | 775,000 | | | Petrobras Global Finance BV, 5.750%, 1/20/2020 | | | 578,111 | |
| | 1,125,000 | | | Petrobras Global Finance BV, 6.850%, 6/05/2115 | | | 717,188 | |
| | 300,000 | | | Petrobras Global Finance BV, 6.875%, 1/20/2040 | | | 195,000 | |
| | 800,000 | | | Samarco Mineracao S.A., 4.125%, 11/01/2022, 144A | | | 636,000 | |
| | 500,000 | | | Tupy Overseas S.A., 6.625%, 7/17/2024, 144A | | | 440,000 | |
| | 1,106,000 | | | Vale Overseas Ltd., 6.875%, 11/21/2036(c) | | | 868,321 | |
| | 470,000 | | | Vale S.A., 5.625%, 9/11/2042 | | | 321,950 | |
| | | | | | | | |
| | | | | | | 13,782,425 | |
| | | | | | | | |
| | | | Canada — 0.5% | | | | |
| | 1,085,000 | | | Air Canada, 7.625%, 10/01/2019, 144A, (CAD) | | | 863,853 | |
| | 3,000,000 | | | Canadian Government, 1.250%, 9/01/2018, (CAD)(c) | | | 2,293,466 | |
| | 2,065,000 | | | Canadian Government, 3.000%, 12/01/2015, (CAD)(c) | | | 1,553,678 | |
| | 1,335,000 | | | Institutional Mortgage Securities Canada, Inc., Series 2014-5A, Class A2, 2.616%, 7/12/2047, 144A, (CAD) | | | 1,019,892 | |
| | 600,000 | | | Telus Corp., Series CG, 5.050%, 12/04/2019, (CAD) | | | 498,187 | |
| | | | | | | | |
| | | | | | | 6,229,076 | |
| | | | | | | | |
| | | | Chile — 0.5% | | | | |
| | 1,450,000 | | | Banco de Credito e Inversiones, 3.000%, 9/13/2017, 144A(c) | | | 1,463,048 | |
| | 200,000 | | | Celulosa Arauco y Constitucion S.A., 4.750%, 1/11/2022 | | | 203,158 | |
| | 300,000,000 | | | Chile Government International Bond, 5.500%, 8/05/2020, (CLP)(c) | | | 445,883 | |
| | 1,160,000 | | | CODELCO, Inc., 4.500%, 9/16/2025, 144A | | | 1,114,324 | |
| | 550,000 | | | Corpbanca S.A., 3.125%, 1/15/2018 | | | 547,862 | |
| | 250,000 | | | E.CL S.A., 5.625%, 1/15/2021, 144A | | | 272,805 | |
| | 800,000 | | | Inversiones CMPC S.A., 4.375%, 5/15/2023, 144A | | | 781,909 | |
| | 1,120,000 | | | Transelec S.A., 4.250%, 1/14/2025, 144A(c) | | | 1,103,052 | |
See accompanying notes to financial statements.
25 |
Portfolio of Investments – as of September 30, 2015
Loomis Sayles Global Equity and Income Fund – (continued)
| | | | | | | | |
Principal
Amount (‡) | | | Description | | Value (†) | |
| | | | Chile — continued | | | | |
| $ | 400,000 | | | VTR Finance BV, 6.875%, 1/15/2024, 144A | | $ | 363,000 | |
| | | | | | | | |
| | | | | | | 6,295,041 | |
| | | | | | | | |
| | | | China — 0.4% | | | | |
| | 800,000 | | | Baidu, Inc., 2.250%, 11/28/2017 | | | 799,192 | |
| | 700,000 | | | Baidu, Inc., 3.250%, 8/06/2018 | | | 713,510 | |
| | 400,000 | | | China Resources Gas Group Ltd., 4.500%, 4/05/2022, 144A | | | 414,143 | |
| | 1,200,000 | | | CNOOC Finance 2013 Ltd., 3.000%, 5/09/2023(c) | | | 1,123,969 | |
| | 485,000 | | | CNOOC Finance 2015 Australia Pty Ltd., 2.625%, 5/05/2020 | | | 478,056 | |
| | 480,000 | | | CNOOC Finance 2015 USA LLC, 3.500%, 5/05/2025 | | | 456,791 | |
| | 1,000,000 | | | Parkson Retail Group Ltd., 4.500%, 5/03/2018 | | | 895,579 | |
| | | | | | | | |
| | | | | | | 4,881,240 | |
| | | | | | | | |
| | | | Colombia — 0.3% | | | | |
| | 555,000 | | | Colombia Telecomunicaciones S.A. E.S.P., 5.375%, 9/27/2022, 144A | | | 490,897 | |
| | 610,000 | | | Ecopetrol S.A., 4.125%, 1/16/2025 | | | 513,925 | |
| | 600,000 | | | Ecopetrol S.A., 5.875%, 9/18/2023(c) | | | 577,500 | |
| | 490,000 | | | Ecopetrol S.A., 5.875%, 5/28/2045 | | | 373,625 | |
| | 1,265,000,000 | | | Emgesa S.A. E.S.P., 8.750%, 1/25/2021, 144A, (COP) | | | 413,773 | |
| | 2,140,000,000 | | | Empresas Publicas de Medellin E.S.P., 8.375%, 2/01/2021, 144A, (COP) | | | 694,120 | |
| | 1,220,000 | | | Pacific Exploration and Production Corp., 5.125%, 3/28/2023, 144A | | | 420,900 | |
| | 580,000 | | | Pacific Exploration and Production Corp., 5.625%, 1/19/2025, 144A | | | 202,826 | |
| | 200,000,000 | | | Republic of Colombia, 7.750%, 4/14/2021, (COP) | | | 65,419 | |
| | | | | | | | |
| | | | | | | 3,752,985 | |
| | | | | | | | |
| | | | Dominican Republic — 0.1% | | | | |
| | 1,410,000 | | | Dominican Republic International Bond, 5.500%, 1/27/2025, 144A | | | 1,360,650 | |
| | 425,000 | | | Dominican Republic International Bond, 8.625%, 4/20/2027, 144A | | | 491,938 | |
| | | | | | | | |
| | | | | | | 1,852,588 | |
| | | | | | | | |
| | | | France — 0.3% | | | | |
| | 425,000 | | | Alcatel-Lucent USA, Inc., 6.450%, 3/15/2029 | | | 420,750 | |
| | 15,000 | | | Alcatel-Lucent USA, Inc., 6.500%, 1/15/2028 | | | 15,000 | |
| | 200,000 | | | AXA S.A., 7.125%, 12/15/2020, (GBP) | | | 351,611 | |
| | 435,000 | | | Credit Agricole S.A., 4.375%, 3/17/2025, 144A | | | 417,870 | |
| | 390,000 | | | Credit Agricole S.A., (fixed rate to 6/23/2026, variable rate thereafter), 7.500%, (GBP)(d) | | | 568,367 | |
| | 2,080,000 | | | Societe Generale S.A., 4.250%, 4/14/2025, 144A | | | 1,974,898 | |
| | 475,000 | | | Societe Generale S.A., (fixed rate to 4/07/2021, variable rate thereafter), 6.750%, (EUR)(d) | | | 520,149 | |
| | | | | | | | |
| | | | | | | 4,268,645 | |
| | | | | | | | |
| | | | Germany — 0.0% | | | | |
| | 515,000 | | | Volkswagen Group of America Finance LLC, 2.400%, 5/22/2020, 144A | | | 477,770 | |
| | | | | | | | |
| | | | Hong Kong — 0.1% | | | | |
| | 355,000 | | | AIA Group Ltd., 3.200%, 3/11/2025, 144A | | | 340,714 | |
| | 400,000 | | | Hutchison Whampoa International 11 Ltd., 3.500%, 1/13/2017, 144A | | | 410,217 | |
| | | | | | | | |
| | | | | | | 750,931 | |
| | | | | | | | |
See accompanying notes to financial statements.
| 26
Portfolio of Investments – as of September 30, 2015
Loomis Sayles Global Equity and Income Fund – (continued)
| | | | | | | | |
Principal
Amount (‡) | | | Description | | Value (†) | |
| | | | Hungary — 0.2% | | | | |
| $ | 1,330,000 | | | Hungary Government International Bond, 5.375%, 3/25/2024 | | $ | 1,443,050 | |
| | 980,000 | | | Hungary Government International Bond, 5.750%, 11/22/2023 | | | 1,090,250 | |
| | | | | | | | |
| | | | | | | 2,533,300 | |
| | | | | | | | |
| | | | Iceland — 0.1% | | | | |
| | 1,000,000 | | | Republic of Iceland, 5.875%, 5/11/2022, 144A(c) | | | 1,138,846 | |
| | | | | | | | |
| | | | India — 0.5% | | | | |
| | 550,000 | | | Axis Bank Ltd., 3.250%, 5/21/2020, 144A | | | 550,982 | |
| | 1,155,000 | | | Bharti Airtel International BV, 5.125%, 3/11/2023, 144A(c) | | | 1,217,924 | |
| | 990,000 | | | Bharti Airtel International BV, 5.350%, 5/20/2024, 144A | | | 1,059,828 | |
| | 1,400,000 | | | ICICI Bank Ltd., (fixed rate to 4/30/2017, variable rate thereafter), 6.375%, 4/30/2022, 144A | | | 1,418,166 | |
| | 750,000 | | | Reliance Holdings USA, Inc., 5.400%, 2/14/2022, 144A | | | 818,386 | |
| | 700,000 | | | State Bank of India/London, 4.125%, 8/01/2017, 144A | | | 723,654 | |
| | | | | | | | |
| | | | | | | 5,788,940 | |
| | | | | | | | |
| | | | Indonesia — 0.7% | | | | |
| | 300,000 | | | Indonesia Government International Bond, 4.125%, 1/15/2025, 144A | | | 278,013 | |
| | 725,000 | | | Indonesia Government International Bond, 5.125%, 1/15/2045, 144A | | | 636,067 | |
| | 3,500,000,000 | | | Indonesia Government International Bond, 9.500%, 7/15/2023, (IDR) | | | 234,815 | |
| | 781,000,000 | | | Indonesia Government International Bond, 11.500%, 9/15/2019, (IDR) | | | 56,463 | |
| | 12,100,000,000 | | | Indonesia Treasury Bond, 6.125%, 5/15/2028, (IDR) | | | 604,149 | |
| | 24,000,000,000 | | | Indonesia Treasury Bond, 7.875%, 4/15/2019, (IDR)(c) | | | 1,555,708 | |
| | 14,000,000,000 | | | Indonesia Treasury Bond, 8.375%, 3/15/2024, (IDR)(c) | | | 883,176 | |
| | 400,000 | | | Listrindo Capital BV, 6.950%, 2/21/2019, 144A | | | 405,000 | |
| | 2,800,000 | | | Pertamina Persero PT, 4.300%, 5/20/2023, 144A(c) | | | 2,554,575 | |
| | 545,000 | | | Republic of Indonesia, 2.875%, 7/08/2021, 144A, (EUR) | | | 583,101 | |
| | 500,000 | | | TBG Global Pte Ltd., 4.625%, 4/03/2018, 144A | | | 486,250 | |
| | | | | | | | |
| | | | | | | 8,277,317 | |
| | | | | | | | |
| | | | Italy — 0.7% | | | | |
| | 440,000 | | | Italy Buoni Poliennali Del Tesoro, 1.500%, 6/01/2025, (EUR) | | | 482,470 | |
| | 2,860,000 | | | Italy Buoni Poliennali Del Tesoro, 4.500%, 8/01/2018, (EUR)(c) | | | 3,572,863 | |
| | 2,295,000 | | | Italy Buoni Poliennali Del Tesoro, 4.750%, 8/01/2023, 144A, (EUR)(c) | | | 3,184,358 | |
| | 725,000 | | | UniCredit SpA, EMTN, 6.950%, 10/31/2022, (EUR) | | | 927,504 | |
| | 870,000 | | | Wind Acquisition Finance S.A., 7.375%, 4/23/2021, 144A | | | 859,125 | |
| | | | | | | | |
| | | | | | | 9,026,320 | |
| | | | | | | | |
| | | | Jamaica — 0.1% | | | | |
| | 665,000 | | | Jamaica Government International Bond, 6.750%, 4/28/2028 | | | 668,325 | |
| | | | | | | | |
| | | | Japan — 0.3% | | | | |
| | 940,000 | | | Bank of Tokyo-Mitsubishi UFJ Ltd., 2.150%, 9/14/2018, 144A | | | 946,325 | |
| | 900,000 | | | Bank of Tokyo-Mitsubishi UFJ Ltd. (The), 1.700%, 3/05/2018, 144A | | | 894,702 | |
| | 1,165,000 | | | Nomura Holdings, Inc., GMTN, 2.750%, 3/19/2019(c) | | | 1,183,337 | |
| | 850,000 | | | SoftBank Group Corp., 4.500%, 4/15/2020, 144A | | | 823,140 | |
| | | | | | | | |
| | | | | | | 3,847,504 | |
| | | | | | | | |
| | | | Korea — 0.7% | | | | |
| | 3,700,000 | | | Export-Import Bank of Korea, 3.000%, 5/22/2018, 144A, (NOK) | | | 449,401 | |
See accompanying notes to financial statements.
27 |
Portfolio of Investments – as of September 30, 2015
Loomis Sayles Global Equity and Income Fund – (continued)
| | | | | | | | |
Principal
Amount (‡) | | | Description | | Value (†) | |
| | | | Korea — continued | | | | |
| $ | 600,000 | | | Hyundai Capital Services, Inc., 3.500%, 9/13/2017, 144A | | $ | 618,461 | |
| | 600,000 | | | Hyundai Steel Co., 4.625%, 4/21/2016, 144A | | | 609,609 | |
| | 600,000 | | | Industrial Bank of Korea, 2.375%, 7/17/2017, 144A | | | 608,065 | |
| | 400,000 | | | KEB Hana Bank, 4.000%, 11/03/2016, 144A | | | 411,068 | |
| | 400,000 | | | Kia Motors Corp., 3.625%, 6/14/2016, 144A(c) | | | 405,348 | |
| | 400,000 | | | Korea Development Bank (The), 4.625%, 11/16/2021 | | | 443,442 | |
| | 400,000 | | | Korea National Oil Corp., 3.125%, 4/03/2017, 144A | | | 409,000 | |
| | 2,589,140,000 | | | Korea Treasury Bond, 2.750%, 9/10/2017, (KRW)(c) | | | 2,234,198 | |
| | 1,125,000 | | | Minera y Metalurgica del Boleo S.A. de CV, 2.875%, 5/07/2019, 144A(c) | | | 1,141,863 | |
| | 950,000 | | | Shinhan Bank, 2.250%, 4/15/2020, 144A | | | 945,060 | |
| | 140,000 | | | SK Telecom Co. Ltd., 6.625%, 7/20/2027, 144A | | | 181,216 | |
| | 200,000 | | | Woori Bank, 5.875%, 4/13/2021, 144A | | | 229,025 | |
| | | | | | | | |
| | | | | | | 8,685,756 | |
| | | | | | | | |
| | | | Luxembourg — 0.2% | | | | |
| | 500,000 | | | Altice Luxembourg S.A., 7.750%, 5/15/2022, 144A | | | 455,000 | |
| | 970,000 | | | ArcelorMittal, 7.500%, 3/01/2041 | | | 780,850 | |
| | 430,000 | | | INEOS Group Holdings S.A., 5.750%, 2/15/2019, (EUR) | | | 461,339 | |
| | 500,000 | | | Millicom International Cellular S.A., 4.750%, 5/22/2020, 144A | | | 477,600 | |
| | | | | | | | |
| | | | | | | 2,174,789 | |
| | | | | | | | |
| | | | Mexico — 1.2% | | | | |
| | 10,000,000 | | | America Movil SAB de CV, 6.450%, 12/05/2022, (MXN) | | | 563,683 | |
| | 300,000 | | | Banco Santander Mexico S.A. Institucion de Banca Multiple Grupo Financiero Santander, 4.125%, 11/09/2022, 144A | | | 296,220 | |
| | 640,000 | | | Cemex Finance LLC, 6.000%, 4/01/2024, 144A | | | 582,400 | |
| | 300,000 | | | Cemex SAB de CV, 4.375%, 3/05/2023, 144A, (EUR) | | | 301,698 | |
| | 505,000 | | | Cemex SAB de CV, 5.700%, 1/11/2025, 144A | | | 451,975 | |
| | 10,000,000 | | | Grupo Televisa SAB, EMTN, 7.250%, 5/14/2043, (MXN) | | | 499,584 | |
| | 746,500(†††) | | | Mexican Fixed Rate Bonds, Series M, 6.500%, 6/10/2021, (MXN)(c) | | | 4,624,009 | |
| | 186,200(†††) | | | Mexican Fixed Rate Bonds, Series M, 6.500%, 6/09/2022, (MXN)(c) | | | 1,142,294 | |
| | 395,000(†††) | | | Mexican Fixed Rate Bonds, Series M-10, 8.500%, 12/13/2018, (MXN)(c) | | | 2,589,886 | |
| | 135,113(†††) | | | Mexican Fixed Rate Bonds, Series M-20, 8.000%, 12/07/2023, (MXN) | | | 900,673 | |
| | 196,000 | | | Mexico Government International Bond, 4.000%, 3/15/2115, (EUR) | | | 180,410 | |
| | 780,000 | | | Petroleos Mexicanos, 4.250%, 1/15/2025, 144A | | | 713,700 | |
| | 625,000 | | | Petroleos Mexicanos, 5.625%, 1/23/2046, 144A | | | 508,656 | |
| | 135,000(†††) | | | Petroleos Mexicanos, 7.470%, 11/12/2026, (MXN) | | | 735,585 | |
| | 925,000 | | | Unifin Financiera S.A.P.I. de CV SOFOM ENR, 6.250%, 7/22/2019, 144A | | | 867,187 | |
| | | | | | | | |
| | | | | | | 14,957,960 | |
| | | | | | | | |
| | | | Morocco — 0.1% | | | | |
| | 965,000 | | | OCP S.A., 4.500%, 10/22/2025, 144A | | | 902,275 | |
| | 590,000 | | | OCP S.A., 6.875%, 4/25/2044, 144A | | | 590,590 | |
| | | | | | | | |
| | | | | | | 1,492,865 | |
| | | | | | | | |
| | | | Netherlands — 0.2% | | | | |
| | 870,000 | | | Cooperatieve Centrale Raiffeisen-Boerenleenbank BA/Netherlands, 4.375%, 8/04/2025 | | | 872,923 | |
| | 1,335,000 | | | Neptune Finco Corp., 10.875%, 10/15/2025, 144A(e) | | | 1,350,019 | |
See accompanying notes to financial statements.
| 28
Portfolio of Investments – as of September 30, 2015
Loomis Sayles Global Equity and Income Fund – (continued)
| | | | | | | | |
Principal
Amount (‡) | | | Description | | Value (†) | |
| | | | Netherlands — continued | | | | |
| $ | 500,000 | | | Shell International Finance BV, 3.250%, 5/11/2025 | | $ | 494,428 | |
| | | | | | | | |
| | | | | | | 2,717,370 | |
| | | | | | | | |
| | | | New Zealand — 0.5% | | | | |
| | 2,887,150 | | | New Zealand Government Bond, 3.000%, 9/20/2030, (NZD)(c) | | | 2,020,933 | |
| | 2,340,000 | | | New Zealand Government Bond, 5.000%, 3/15/2019, (NZD)(c) | | | 1,612,239 | |
| | 2,590,000 | | | New Zealand Government Bond, 5.500%, 4/15/2023, (NZD) | | | 1,935,265 | |
| | 120,000 | | | Reynolds Group Issuer, Inc./Reynolds Group Issuer LLC/Reynolds Group Issuer (Luxembourg)
S.A., 9.875%, 8/15/2019 | | | 124,200 | |
| | | | | | | | |
| | | | | | | 5,692,637 | |
| | | | | | | | |
| | | | Norway — 0.3% | | | | |
| | 13,275,000 | | | Norway Government Bond, 2.000%, 5/24/2023, 144A, (NOK) | | | 1,639,584 | |
| | 13,760,000 | | | Norway Government Bond, 4.500%, 5/22/2019, 144A, (NOK)(c) | | | 1,837,975 | |
| | | | | | | | |
| | | | | | | 3,477,559 | |
| | | | | | | | |
| | | | Panama — 0.1% | | | | |
| | 300,000 | | | Autoridad del Canal de Panama, 4.950%, 7/29/2035, 144A(e) | | | 299,037 | |
| | 680,000 | | | Banco Latinoamericano de Comercio Exterior S.A., 3.250%, 5/07/2020, 144A | | | 674,900 | |
| | 300,000 | | | Banco Latinoamericano de Comercio Exterior S.A., 3.750%, 4/04/2017, 144A | | | 303,563 | |
| | | | | | | | |
| | | | | | | 1,277,500 | |
| | | | | | | | |
| | | | Peru — 0.2% | | | | |
| | 580,000 | | | Southern Copper Corp., 3.875%, 4/23/2025 | | | 524,181 | |
| | 1,050,000 | | | Transportadora de Gas del Peru S.A., 4.250%, 4/30/2028, 144A | | | 983,062 | |
| | 1,050,000 | | | Union Andina de Cementos SAA, 5.875%, 10/30/2021, 144A | | | 1,010,625 | |
| | | | | | | | |
| | | | | | | 2,517,868 | |
| | | | | | | | |
| | | | Philippines — 0.1% | | | | |
| | 40,000,000 | | | Philippine Government International Bond, 3.900%, 11/26/2022, (PHP) | | | 830,039 | |
| | 30,000,000 | | | Philippine Government International Bond, 4.950%, 1/15/2021, (PHP) | | | 653,081 | |
| | 175,000 | | | Philippine Long Distance Telephone Co., EMTN, 8.350%, 3/06/2017 | | | 189,437 | |
| | | | | | | | |
| | | | | | | 1,672,557 | |
| | | | | | | | |
| | | | Poland — 0.5% | | | | |
| | 17,080,000 | | | Poland Government Bond, 4.000%, 10/25/2023, (PLN)(c) | | | 4,893,676 | |
| | 3,210,000 | | | Poland Government Bond, 5.500%, 10/25/2019, (PLN) | | | 951,221 | |
| | | | | | | | |
| | | | | | | 5,844,897 | |
| | | | | | | | |
| | | | Portugal — 0.1% | | | | |
| | 400,000 | | | EDP Finance BV, 4.125%, 1/15/2020, 144A | | | 405,446 | |
| | 225,000 | | | EDP Finance BV, EMTN, 2.000%, 4/22/2025, (EUR) | | | 229,155 | |
| | 380,000 | | | Portugal Obrigacoes do Tesouro OT, 4.100%, 2/15/2045, 144A, (EUR) | | | 478,584 | |
| | | | | | | | |
| | | | | | | 1,113,185 | |
| | | | | | | | |
| | | | Singapore — 0.2% | | | | |
| | 495,000 | | | BOC Aviation Pte Ltd., 3.000%, 3/30/2020 | | | 490,944 | |
| | 2,000,000 | | | DBS Bank Ltd., (fixed rate to 9/21/2017, variable rate thereafter), 3.625%, 9/21/2022, 144A(c) | | | 2,046,072 | |
| | | | | | | | |
| | | | | | | 2,537,016 | |
| | | | | | | | |
See accompanying notes to financial statements.
29 |
Portfolio of Investments – as of September 30, 2015
Loomis Sayles Global Equity and Income Fund – (continued)
| | | | | | | | |
Principal
Amount (‡) | | | Description | | Value (†) | |
| | | | South Africa — 0.4% | | | | |
| $ | 895,000 | | | Eskom Holdings SOC Ltd., 7.125%, 2/11/2025, 144A | | $ | 842,132 | |
| | 930,000 | | | MTN (Mauritius) Investments Ltd., 4.755%, 11/11/2024, 144A | | | 925,927 | |
| | 500,000 | | | Myriad International Holdings BV, 6.000%, 7/18/2020, 144A | | | 534,580 | |
| | 11,500,000 | | | South Africa Government Bond, Series 2023, 7.750%, 2/28/2023, (ZAR) | | | 804,506 | |
| | 8,500,000 | | | South Africa Government Bond, Series R186, 10.500%, 12/21/2026, (ZAR) | | | 703,135 | |
| | 600,000 | | | South Africa Government International Bond, 5.875%, 9/16/2025 | | | 639,000 | |
| | 285,000 | | | South Africa Government International Bond, EMTN, 4.500%, 4/05/2016, (EUR) | | | 324,561 | |
| | 700,000 | | | Transnet SOC Ltd., 4.000%, 7/26/2022, 144A | | | 646,625 | |
| | | | | | | | |
| | | | | | | 5,420,466 | |
| | | | | | | | |
| | | | Spain — 0.3% | | | | |
| | 430,000 | | | Spain Government Bond, 1.600%, 4/30/2025, 144A, (EUR) | | | 471,286 | |
| | 2,115,000 | | | Spain Government Bond, 4.300%, 10/31/2019, 144A, (EUR)(c) | | | 2,708,129 | |
| | 800,000 | | | Spain Government Bond, 4.400%, 10/31/2023, 144A, (EUR)(c) | | | 1,079,296 | |
| | | | | | | | |
| | | | | | | 4,258,711 | |
| | | | | | | | |
| | | | Supranationals — 0.3% | | | | |
| | 840,000 | | | Central American Bank for Economic Integration, 3.875%, 2/09/2017, 144A | | | 863,405 | |
| | 1,115,000 | | | Corporacion Andina de Fomento, 4.375%, 6/15/2022(c) | | | 1,210,198 | |
| | 1,140,000 | | | International Bank for Reconstruction & Development, 2.500%, 3/12/2020, (AUD) | | | 799,190 | |
| | 70,000,000 | | | International Finance Corp., 7.800%, 6/03/2019, (INR)(c) | | | 1,101,431 | |
| | | | | | | | |
| | | | | | | 3,974,224 | |
| | | | | | | | |
| | | | Sweden — 0.0% | | | | |
| | 2,450,000 | | | Sweden Government Bond, 5.000%, 12/01/2020, (SEK) | | | 367,314 | |
| | | | | | | | |
| | | | Switzerland — 0.1% | | | | |
| | 1,075,000 | | | Xstrata Finance Canada Ltd., 5.550%, 10/25/2042, 144A | | | 790,125 | |
| | | | | | | | |
| | | | Thailand — 0.2% | | | | |
| | 1,010,000 | | | Siam Commercial Bank PCL (The), 3.500%, 4/07/2019, 144A | | | 1,034,841 | |
| | 950,000 | | | Thai Oil PCL, 3.625%, 1/23/2023, 144A | | | 937,499 | |
| | | | | | | | |
| | | | | | | 1,972,340 | |
| | | | | | | | |
| | | | Turkey — 0.5% | | | | |
| | 445,000 | | | Akbank TAS, 4.000%, 1/24/2020, 144A | | | 418,803 | |
| | 800,000 | | | Arcelik AS, 5.000%, 4/03/2023, 144A | | | 709,520 | |
| | 545,000 | | | Export Credit Bank of Turkey, 5.000%, 9/23/2021, 144A | | | 520,823 | |
| | 920,000 | | | TC Ziraat Bankasi AS, 4.250%, 7/03/2019, 144A | | | 890,781 | |
| | 2,745,000 | | | Turkey Government Bond, 6.300%, 2/14/2018, (TRY) | | | 817,734 | |
| | 600,000 | | | Turkiye Garanti Bankasi AS, 4.000%, 9/13/2017, 144A | | | 596,250 | |
| | 490,000 | | | Turkiye Halk Bankasi AS, 4.750%, 2/11/2021, 144A | | | 458,703 | |
| | 800,000 | | | Turkiye Is Bankasi, 3.875%, 11/07/2017, 144A | | | 794,840 | |
| | 875,000 | | | Yapi ve Kredi Bankasi, 5.250%, 12/03/2018, 144A | | | 878,587 | |
| | | | | | | | |
| | | | | | | 6,086,041 | |
| | | | | | | | |
| | | | United Arab Emirates — 0.2% | | | | |
| | 850,000 | | | DP World Ltd., 3.250%, 5/18/2020, 144A | | | 846,813 | |
| | 600,000 | | | Dubai Electricity & Water Authority, 6.375%, 10/21/2016, 144A | | | 631,080 | |
See accompanying notes to financial statements.
| 30
Portfolio of Investments – as of September 30, 2015
Loomis Sayles Global Equity and Income Fund – (continued)
| | | | | | | | |
Principal
Amount (‡) | | | Description | | Value (†) | |
| | | | United Arab Emirates — continued | | | | |
| $ | 545,000 | | | Mubadala GE Capital Ltd., 3.000%, 11/10/2019, 144A | | $ | 540,705 | |
| | | | | | | | |
| | | | | | | 2,018,598 | |
| | | | | | | | |
| | | | United Kingdom — 0.6% | | | | |
| | 600,000 | | | Anglo American Capital PLC, 2.625%, 9/27/2017, 144A | | | 561,194 | |
| | 525,000 | | | Barclays PLC, 3.650%, 3/16/2025 | | | 500,551 | |
| | 400,000 | | | Barclays PLC, (fixed rate to 9/15/2019, variable rate thereafter), 7.000% , (GBP)(d) | | | 580,896 | |
| | 470,000 | | | British Telecommunications PLC, 5.750%, 12/07/2028, (GBP) | | | 853,260 | |
| | 150,000 | | | Imperial Tobacco Finance PLC, EMTN, 6.250%, 12/04/2018, (GBP) | | | 253,913 | |
| | 400,000 | | | Lloyds Banking Group PLC, 4.500%, 11/04/2024 | | | 402,100 | |
| | 400,000 | | | Old Mutual PLC, EMTN, 8.000%, 6/03/2021, (GBP) | | | 668,600 | |
| | 1,130,000 | | | Royal Bank of Scotland Group PLC, 6.000%, 12/19/2023(c) | | | 1,203,074 | |
| | 950,000 | | | Royal Bank of Scotland Group PLC, (fixed rate to 8/10/2020, variable rate thereafter), 7.500%(d) | | | 946,438 | |
| | 350,000 | | | Santander UK Group Holdings PLC, 4.750%, 9/15/2025, 144A | | | 347,072 | |
| | 250,000 | | | Standard Chartered PLC, EMTN, (fixed rate to 10/21/2020, variable rate thereafter),
4.000%, 10/21/2025, (EUR) | | | 271,480 | |
| | 130,000 | | | Virgin Media Finance PLC, 4.500%, 1/15/2025, 144A, (EUR) | | | 131,500 | |
| | 115,000 | | | Virgin Media Finance PLC, 6.375%, 10/15/2024, 144A, (GBP) | | | 173,044 | |
| | 100,000 | | | WPP PLC, 6.000%, 4/04/2017, (GBP) | | | 160,659 | |
| | | | | | | | |
| | | | | | | 7,053,781 | |
| | | | | | | | |
| | | | United States — 18.2% | | | | |
| | 15,000 | | | 21st Century Fox America, Inc., 6.400%, 12/15/2035 | | | 17,413 | |
| | 9,890,000 | | | AbbVie, Inc., 2.500%, 5/14/2020(c) | | | 9,835,368 | |
| | 45,000 | | | AECOM, 5.750%, 10/15/2022, 144A | | | 45,253 | |
| | 45,000 | | | AECOM, 5.875%, 10/15/2024, 144A | | | 45,338 | |
| | 500,000 | | | AES Corp. (The), 4.875%, 5/15/2023 | | | 438,750 | |
| | 475,000 | | | AES Corp. (The), 5.500%, 3/15/2024 | | | 421,088 | |
| | 975,000 | | | Alcoa, Inc., 5.900%, 2/01/2027 | | | 940,875 | |
| | 8,000,000 | | | Ally Financial, Inc., 3.750%, 11/18/2019 | | | 7,840,000 | |
| | 745,000 | | | Ally Financial, Inc., 5.125%, 9/30/2024 | | | 735,687 | |
| | 129,000 | | | Ally Financial, Inc., 8.000%, 12/31/2018 | | | 142,223 | |
| | 1,728,000 | | | Ally Financial, Inc., 8.000%, 11/01/2031 | | | 2,001,784 | |
| | 180,087 | | | American Airlines Pass Through Trust, Series 2013-1, Class A, 4.000%, 1/15/2027 | | | 182,957 | |
| | 51,000 | | | American International Group, Inc., (fixed rate to 5/15/2038, variable rate thereafter), 8.175%, 5/15/2068 | | | 67,448 | |
| | 7,145,000 | | | Amgen, Inc., 2.125%, 5/01/2020(c) | | | 7,051,751 | |
| | 400,000 | | | Antero Resources Corp., 5.125%, 12/01/2022 | | | 344,000 | |
| | 175,000 | | | Antero Resources Corp., 5.375%, 11/01/2021 | | | 154,000 | |
| | 6,901 | | | Atlas Air Pass Through Trust, Series 1998-1, Class B, 7.680%, 1/02/2016(f) | | | 7,129 | |
| | 495,000 | | | Atrium Windows & Doors, Inc., 7.750%, 5/01/2019, 144A | | | 362,588 | |
| | 925,000 | | | Aviation Capital Group Corp., 6.750%, 4/06/2021, 144A | | | 1,038,312 | |
| | 95,000 | | | Avon Products, Inc., 8.700%, 3/15/2043 | | | 67,260 | |
| | 200,000 | | | Bank of America Corp., 5.490%, 3/15/2019 | | | 219,703 | |
| | 115,000 | | | Bank of America Corp., MTN, 4.250%, 10/22/2026 | | | 113,691 | |
See accompanying notes to financial statements.
31 |
Portfolio of Investments – as of September 30, 2015
Loomis Sayles Global Equity and Income Fund – (continued)
| | | | | | | | |
Principal
Amount (‡) | | | Description | | Value (†) | |
| | | | United States — continued | | | | |
| $ | 50,000 | | | Beazer Homes USA, Inc., 7.250%, 2/01/2023 | | $ | 45,875 | |
| | 15,000 | | | Boston Scientific Corp., 5.125%, 1/12/2017 | | | 15,661 | |
| | 6,320,000 | | | California Resources Corp., 5.000%, 1/15/2020 | | | 4,064,518 | |
| | 670,000 | | | California Resources Corp., 5.500%, 9/15/2021 | | | 408,700 | |
| | 90,000 | | | California Resources Corp., 6.000%, 11/15/2024 | | | 53,606 | |
| | 1,995,000 | | | CenturyLink, Inc., 6.450%, 6/15/2021 | | | 1,825,425 | |
| | 510,000 | | | CenturyLink, Inc., 7.650%, 3/15/2042 | | | 390,150 | |
| | 55,000 | | | CenturyLink, Inc., Series G, 6.875%, 1/15/2028 | | | 45,375 | |
| | 605,000 | | | CenturyLink, Inc., Series P, 7.600%, 9/15/2039 | | | 458,288 | |
| | 1,025,000 | | | Chemours Co. (The), 6.625%, 5/15/2023, 144A | | | 689,312 | |
| | 190,000 | | | Chemours Co. (The), 7.000%, 5/15/2025, 144A | | | 124,925 | |
| | 2,030,000 | | | Chesapeake Energy Corp., 4.875%, 4/15/2022 | | | 1,324,575 | |
| | 135,000 | | | Chesapeake Energy Corp., 5.750%, 3/15/2023 | | | 88,045 | |
| | 495,000 | | | Chesapeake Energy Corp., 6.125%, 2/15/2021 | | | 344,953 | |
| | 190,000 | | | Chesapeake Energy Corp., 6.625%, 8/15/2020 | | | 141,193 | |
| | 95,000 | | | Chesapeake Energy Corp., 6.875%, 11/15/2020 | | | 69,825 | |
| | 100,000 | | | Chesapeake Energy Corp., 7.250%, 12/15/2018 | | | 82,750 | |
| | 1,635,000 | | | Cimarex Energy Co., 4.375%, 6/01/2024 | | | 1,591,879 | |
| | 1,470,000 | | | Clear Channel Worldwide Holdings, Inc., 7.625%, 3/15/2020 | | | 1,473,675 | |
| | 155,000 | | | Cleaver-Brooks, Inc., 8.750%, 12/15/2019, 144A | | | 146,475 | |
| | 265,000 | | | Constellation Brands, Inc., 4.750%, 11/15/2024 | | | 267,650 | |
| | 1,005,000 | | | Continental Airlines Pass Through Certificates, Series 2012-3, Class C, 6.125%, 4/29/2018 | | | 1,042,687 | |
| | 164,506 | | | Continental Airlines Pass Through Trust, Series 1999-1, Class B, 6.795%, 2/02/2020 | | | 173,554 | |
| | 280,000 | | | Continental Resources, Inc., 3.800%, 6/01/2024 | | | 227,106 | |
| | 25,000 | | | Continental Resources, Inc., 4.500%, 4/15/2023 | | | 21,709 | |
| | 155,000 | | | Cummins, Inc., 5.650%, 3/01/2098 | | | 165,640 | |
| | 181,325 | | | Delta Air Lines Pass Through Trust, Series 2007-1, Class B, 8.021%, 2/10/2024 | | | 204,897 | |
| | 42,000 | | | Dillard’s, Inc., 6.625%, 1/15/2018 | | | 45,420 | |
| | 50,000 | | | Dillard’s, Inc., 7.000%, 12/01/2028 | | | 56,675 | |
| | 8,000 | | | Dillard’s, Inc., 7.750%, 7/15/2026 | | | 9,365 | |
| | 300,000 | | | Discovery Communications LLC, 1.900%, 3/19/2027, (EUR) | | | 286,911 | |
| | 395,000 | | | DISH DBS Corp., 5.000%, 3/15/2023 | | | 330,813 | |
| | 1,370,000 | | | DISH DBS Corp., 5.875%, 11/15/2024 | | | 1,163,644 | |
| | 315,000 | | | DPL, Inc., 6.750%, 10/01/2019 | | | 326,813 | |
| | 310,000 | | | DR Horton, Inc., 4.375%, 9/15/2022 | | | 307,675 | |
| | 235,000 | | | DS Services of America, Inc., 10.000%, 9/01/2021, 144A | | | 269,956 | |
| | 1,121,000 | | | First Data Corp., 10.625%, 6/15/2021 | | | 1,228,896 | |
| | 150,000 | | | Foot Locker, Inc., 8.500%, 1/15/2022(f) | | | 164,657 | |
| | 25,000 | | | Ford Motor Co., 6.375%, 2/01/2029 | | | 27,880 | |
| | 50,000 | | | Ford Motor Co., 6.625%, 2/15/2028 | | | 56,487 | |
| | 2,105,000 | | | Ford Motor Co., 6.625%, 10/01/2028 | | | 2,463,648 | |
| | 40,000 | | | Ford Motor Co., 7.125%, 11/15/2025 | | | 47,585 | |
| | 560,000 | | | Ford Motor Co., 7.400%, 11/01/2046 | | | 709,375 | |
| | 5,000 | | | Ford Motor Co., 7.500%, 8/01/2026 | | | 6,038 | |
| | 5,000,000 | | | Ford Motor Credit Co. LLC, 2.459%, 3/27/2020 | | | 4,895,920 | |
See accompanying notes to financial statements.
| 32
Portfolio of Investments – as of September 30, 2015
Loomis Sayles Global Equity and Income Fund – (continued)
| | | | | | | | |
Principal
Amount (‡) | | | Description | | Value (†) | |
| | | | United States — continued | | | | |
| $ | 1,000,000 | | | Ford Motor Credit Co. LLC, 5.000%, 5/15/2018 | | $ | 1,063,587 | |
| | 905,000 | | | Forethought Financial Group, Inc., 8.625%, 4/15/2021, 144A | | | 1,051,699 | |
| | 2,370,000 | | | Freeport-McMoRan, Inc., 3.875%, 3/15/2023 | | | 1,762,687 | |
| | 475,000 | | | Freeport-McMoRan, Inc., 5.450%, 3/15/2043 | | | 330,125 | |
| | 865,000 | | | Frontier Communications Corp., 6.875%, 1/15/2025 | | | 683,350 | |
| | 205,000 | | | FTS International, Inc., 6.250%, 5/01/2022 | | | 63,550 | |
| | 50,000 | | | General Electric Capital Corp., GMTN, 3.100%, 1/09/2023 | | | 51,123 | |
| | 600,000 | | | General Electric Capital Corp., Series A, (fixed rate to 6/15/2022, variable rate thereafter), 7.125%(d) | | | 693,000 | |
| | 5,000,000 | | | General Motors Financial Co., Inc., 2.400%, 4/10/2018 | | | 4,961,570 | |
| | 240,000 | | | General Motors Financial Co., Inc., 3.450%, 4/10/2022 | | | 230,853 | |
| | 195,000 | | | Genworth Holdings, Inc., 4.800%, 2/15/2024 | | | 146,250 | |
| | 500,000 | | | Genworth Holdings, Inc., 4.900%, 8/15/2023 | | | 390,000 | |
| | 215,000 | | | Genworth Holdings, Inc., 6.500%, 6/15/2034 | | | 167,700 | |
| | 3,435,000 | | | Georgia-Pacific LLC, 7.250%, 6/01/2028(c) | | | 4,439,593 | |
| | 105,000 | | | Georgia-Pacific LLC, 7.375%, 12/01/2025 | | | 133,133 | |
| | 180,000 | | | Georgia-Pacific LLC, 7.750%, 11/15/2029 | | | 240,579 | |
| | 315,000 | | | Georgia-Pacific LLC, 8.875%, 5/15/2031 | | | 452,641 | |
| | 800,000 | | | Goldman Sachs Group, Inc. (The), 3.375%, 2/01/2018, (CAD) | | | 619,396 | |
| | 2,295,000 | | | Goldman Sachs Group, Inc. (The), 6.750%, 10/01/2037 | | | 2,737,747 | |
| | 3,045,000 | | | Goodyear Tire & Rubber Co. (The), 7.000%, 5/15/2022 | | | 3,235,312 | |
| | 165,000 | | | Goodyear Tire & Rubber Co. (The), 7.000%, 3/15/2028 | | | 172,425 | |
| | 70,000 | | | GS Mortgage Securities Corp. II, Series 2007-GG10, Class AM, 5.989%, 8/10/2045(g) | | | 70,237 | |
| | 425,000 | | | Halcon Resources Corp., 8.875%, 5/15/2021 | | | 127,500 | |
| | 410,000 | | | Hanover Insurance Group, Inc. (The), 6.375%, 6/15/2021 | | | 473,761 | |
| | 1,000,000 | | | HCA Holdings, Inc., 6.250%, 2/15/2021 | | | 1,065,000 | |
| | 20,000 | | | HCA, Inc., 4.750%, 5/01/2023 | | | 20,070 | |
| | 225,000 | | | HCA, Inc., 7.050%, 12/01/2027 | | | 232,875 | |
| | 245,000 | | | HCA, Inc., 7.190%, 11/15/2015 | | | 245,919 | |
| | 90,000 | | | HCA, Inc., 7.500%, 12/15/2023 | | | 100,350 | |
| | 820,000 | | | HCA, Inc., 7.500%, 11/06/2033 | | | 865,100 | |
| | 1,500,000 | | | HCA, Inc., 7.690%, 6/15/2025 | | | 1,665,000 | |
| | 395,000 | | | HCA, Inc., 8.360%, 4/15/2024 | | | 456,225 | |
| | 195,000 | | | HCA, Inc., MTN, 7.580%, 9/15/2025 | | | 213,525 | |
| | 75,000 | | | HCA, Inc., MTN, 7.750%, 7/15/2036 | | | 79,500 | |
| | 855,000 | | | Hecla Mining Co., 6.875%, 5/01/2021 | | | 688,275 | |
| | 585,000 | | | Hercules, Inc., 6.500%, 6/30/2029 | | | 539,662 | |
| | 310,000 | | | Hexion, Inc., 7.875%, 2/15/2023(h) | | | 164,300 | |
| | 470,000 | | | Highwoods Properties, Inc., 5.850%, 3/15/2017 | | | 500,270 | |
| | 450,000 | | | International Lease Finance Corp., 4.625%, 4/15/2021 | | | 452,250 | |
| | 1,250,000 | | | International Lease Finance Corp., 6.250%, 5/15/2019 | | | 1,331,250 | |
| | 745,000 | | | INVISTA Finance LLC, 4.250%, 10/15/2019, 144A | | | 718,925 | |
| | 45,000 | | | iStar, Inc., 3.875%, 7/01/2016 | | | 44,550 | |
| | 145,000 | | | iStar, Inc., 4.875%, 7/01/2018 | | | 140,288 | |
| | 3,460,000 | | | iStar, Inc., 5.000%, 7/01/2019 | | | 3,287,000 | |
| | 70,000 | | | iStar, Inc., 5.850%, 3/15/2017 | | | 71,400 | |
| | 200,000 | | | iStar, Inc., 7.125%, 2/15/2018 | | | 204,500 | |
See accompanying notes to financial statements.
33 |
Portfolio of Investments – as of September 30, 2015
Loomis Sayles Global Equity and Income Fund – (continued)
| | | | | | | | |
Principal
Amount (‡) | | | Description | | Value (†) | |
| | | | United States — continued | | | | |
| $ | 48,000 | | | J.C. Penney Corp., Inc., 6.375%, 10/15/2036 | | $ | 33,240 | |
| | 5,000 | | | J.C. Penney Corp., Inc., 7.625%, 3/01/2097 | | | 3,475 | |
| | 665,000 | | | Jefferies Group LLC, 5.125%, 4/13/2018 | | | 698,081 | |
| | 30,000 | | | Jefferies Group LLC, 5.125%, 1/20/2023 | | | 30,059 | |
| | 1,070,000 | | | Jefferies Group LLC, 6.250%, 1/15/2036 | | | 1,009,105 | |
| | 685,000 | | | Jefferies Group LLC, 6.450%, 6/08/2027 | | | 710,670 | |
| | 1,410,000 | | | Jefferies Group LLC, 6.875%, 4/15/2021 | | | 1,584,634 | |
| | 15,000 | | | K. Hovnanian Enterprises, Inc., 5.000%, 11/01/2021 | | | 10,575 | |
| | 110,000 | | | K. Hovnanian Enterprises, Inc., 7.000%, 1/15/2019, 144A | | | 80,300 | |
| | 165,000 | | | K. Hovnanian Enterprises, Inc., 8.000%, 11/01/2019, 144A | | | 118,388 | |
| | 1,665,000 | | | KB Home, 8.000%, 3/15/2020 | | | 1,764,900 | |
| | 190,000 | | | Ladder Capital Finance Holdings LLLP/Ladder Capital Finance Corp., 7.375%, 10/01/2017 | | | 190,950 | |
| | 55,000 | | | Lennar Corp., Series B, 6.500%, 4/15/2016 | | | 56,100 | |
| | 140,000 | | | Level 3 Communications, Inc., 5.750%, 12/01/2022 | | | 137,375 | |
| | 330,000 | | | Level 3 Financing, Inc., 5.125%, 5/01/2023, 144A | | | 314,738 | |
| | 760,000 | | | Level 3 Financing, Inc., 5.375%, 5/01/2025, 144A | | | 721,521 | |
| | 135,000 | | | Level 3 Financing, Inc., 7.000%, 6/01/2020 | | | 139,725 | |
| | 1,435,000 | | | Level 3 Financing, Inc., 8.625%, 7/15/2020 | | | 1,499,575 | |
| | 95,000 | | | MarkWest Energy Partners LP/MarkWest Energy Finance Corp., 4.875%, 6/01/2025 | | | 87,381 | |
| | 165,000 | | | Masco Corp., 6.500%, 8/15/2032 | | | 169,125 | |
| | 865,000 | | | Masco Corp., 7.750%, 8/01/2029 | | | 966,637 | |
| | 2,700,000 | | | Merrill Lynch & Co., Inc., 6.110%, 1/29/2037 | | | 3,105,648 | |
| | 460,000 | | | Micron Technology, Inc., 5.500%, 2/01/2025 | | | 422,050 | |
| | 610,000 | | | Micron Technology, Inc., 5.625%, 1/15/2026, 144A | | | 549,000 | |
| | 825,000 | | | Morgan Stanley, 2.125%, 4/25/2018 | | | 829,858 | |
| | 220,000 | | | Morgan Stanley, 2.500%, 1/24/2019 | | | 223,003 | |
| | 450,000 | | | Morgan Stanley, 3.750%, 2/25/2023 | | | 460,905 | |
| | 725,000 | | | Morgan Stanley, 5.750%, 1/25/2021 | | | 826,845 | |
| | 500,000 | | | Morgan Stanley, GMTN, 7.625%, 3/03/2016, (AUD) | | | 357,886 | |
| | 3,150,000 | | | Morgan Stanley, MTN, 4.100%, 5/22/2023 | | | 3,188,156 | |
| | 600,000 | | | Morgan Stanley, MTN, 6.250%, 8/09/2026 | | | 721,084 | |
| | 100,000 | | | Morgan Stanley, Series F, MTN, 0.737%, 10/18/2016(g) | | | 99,803 | |
| | 3,000,000 | | | Navient Corp., 5.000%, 10/26/2020 | | | 2,514,900 | |
| | 95,000 | | | Navient Corp., 5.875%, 10/25/2024 | | | 74,575 | |
| | 175,000 | | | Navient LLC, 4.875%, 6/17/2019 | | | 159,250 | |
| | 915,000 | | | Navient LLC, 5.500%, 1/25/2023 | | | 725,705 | |
| | 1,600(††††) | | | Navient LLC, 6.000%, 12/15/2043 | | | 27,435 | |
| | 40,000 | | | Navient LLC, MTN, 4.625%, 9/25/2017 | | | 39,275 | |
| | 60,000 | | | Navient LLC, MTN, 5.500%, 1/15/2019 | | | 55,763 | |
| | 1,130,000 | | | Navient LLC, MTN, 7.250%, 1/25/2022 | | | 988,750 | |
| | 10,000 | | | Navient LLC, Series A, MTN, 5.000%, 6/15/2018 | | | 9,550 | |
| | 2,560,000 | | | Navient LLC, Series A, MTN, 5.625%, 8/01/2033(h) | | | 1,657,600 | |
| | 360,000 | | | Navient LLC, Series A, MTN, 8.450%, 6/15/2018 | | | 370,123 | |
| | 4,457,000 | | | New Albertson’s, Inc., 7.450%, 8/01/2029 | | | 4,367,860 | |
| | 245,000 | | | New Albertson’s, Inc., 7.750%, 6/15/2026 | | | 233,975 | |
| | 4,155,000 | | | New Albertson’s, Inc., 8.000%, 5/01/2031 | | | 4,071,900 | |
See accompanying notes to financial statements.
| 34
Portfolio of Investments – as of September 30, 2015
Loomis Sayles Global Equity and Income Fund – (continued)
| | | | | | | | |
Principal
Amount (‡) | | | Description | | Value (†) | |
| | | | United States — continued | | | | |
| $ | 2,110,000 | | | New Albertson’s, Inc., 8.700%, 5/01/2030 | | $ | 2,131,100 | |
| | 315,000 | | | New Albertson’s, Inc., Series C, MTN, 6.625%, 6/01/2028 | | | 270,900 | |
| | 365,000 | | | Newell Rubbermaid, Inc., 4.000%, 12/01/2024 | | | 371,061 | |
| | 20,000 | | | NGPL PipeCo LLC, 7.768%, 12/15/2037, 144A | | | 16,800 | |
| | 1,970,000 | | | Noble Energy, Inc., 5.625%, 5/01/2021 | | | 1,981,820 | |
| | 135,000 | | | Oasis Petroleum, Inc., 6.875%, 3/15/2022 | | | 106,961 | |
| | 220,000 | | | Oasis Petroleum, Inc., 6.875%, 1/15/2023 | | | 170,500 | |
| | 290,000 | | | Oasis Petroleum, Inc., 7.250%, 2/01/2019 | | | 255,925 | |
| | 420,000 | | | Old Republic International Corp., 4.875%, 10/01/2024 | | | 440,290 | |
| | 55,000 | | | Outfront Media Capital LLC/Outfront Media Capital Corp., 5.250%, 2/15/2022 | | | 54,931 | |
| | 140,000 | | | Outfront Media Capital LLC/Outfront Media Capital Corp., 5.875%, 3/15/2025 | | | 142,450 | |
| | 7,000 | | | Owens Corning, 6.500%, 12/01/2016 | | | 7,470 | |
| | 535,000 | | | Owens Corning, 7.000%, 12/01/2036 | | | 626,645 | |
| | 2,965,000 | | | Owens-Brockway Glass Container, Inc., 5.375%, 1/15/2025, 144A | | | 2,846,400 | |
| | 540,000 | | | PulteGroup, Inc., 6.000%, 2/15/2035 | | | 529,200 | |
| | 785,000 | | | PulteGroup, Inc., 6.375%, 5/15/2033 | | | 806,587 | |
| | 220,000 | | | PulteGroup, Inc., 7.875%, 6/15/2032 | | | 253,000 | |
| | 255,000 | | | Quicken Loans, Inc., 5.750%, 5/01/2025, 144A | | | 239,381 | |
| | 1,335,000 | | | Qwest Capital Funding, Inc., 6.500%, 11/15/2018 | | | 1,391,737 | |
| | 650,000 | | | Qwest Capital Funding, Inc., 6.875%, 7/15/2028 | | | 549,250 | |
| | 400,000 | | | Qwest Capital Funding, Inc., 7.625%, 8/03/2021 | | | 422,000 | |
| | 60,000 | | | Qwest Capital Funding, Inc., 7.750%, 2/15/2031 | | | 55,200 | |
| | 476,000 | | | Qwest Corp., 6.875%, 9/15/2033 | | | 459,562 | |
| | 115,000 | | | Qwest Corp., 7.250%, 9/15/2025 | | | 128,297 | |
| | 480,000 | | | R.R. Donnelley & Sons Co., 7.000%, 2/15/2022 | | | 465,600 | |
| | 200,000 | | | Rain CII Carbon LLC/CII Carbon Corp., 8.250%, 1/15/2021, 144A | | | 160,000 | |
| | 230,000 | | | Range Resources Corp., 4.875%, 5/15/2025, 144A | | | 204,988 | |
| | 850,000 | | | Range Resources Corp., 5.000%, 8/15/2022 | | | 752,250 | |
| | 220,000 | | | Range Resources Corp., 5.000%, 3/15/2023 | | | 194,563 | |
| | 1,075,000 | | | Regency Energy Partners LP/Regency Energy Finance Corp., 5.000%, 10/01/2022 | | | 1,049,576 | |
| | 230,000 | | | Regency Energy Partners LP/Regency Energy Finance Corp., 5.500%, 4/15/2023 | | | 222,525 | |
| | 80,000 | | | Reynolds American, Inc., 6.750%, 6/15/2017 | | | 86,603 | |
| | 970,000 | | | Santander Holdings USA, Inc., 2.650%, 4/17/2020 | | | 952,380 | |
| | 25,000 | | | Sealed Air Corp., 4.875%, 12/01/2022, 144A | | | 24,719 | |
| | 640,000 | | | Sealed Air Corp., 5.500%, 9/15/2025, 144A | | | 649,600 | |
| | 760,000 | | | Shearer’s Foods LLC/Chip Finance Corp., 9.000%, 11/01/2019, 144A | | | 805,600 | |
| | 135,000 | | | Springleaf Finance Corp., 5.250%, 12/15/2019 | | | 131,963 | |
| | 330,000 | | | Springleaf Finance Corp., 7.750%, 10/01/2021 | | | 352,275 | |
| | 130,000 | | | Springleaf Finance Corp., 8.250%, 10/01/2023 | | | 141,700 | |
| | 400,000 | | | Springleaf Finance Corp., MTN, 5.750%, 9/15/2016 | | | 406,480 | |
| | 300,000 | | | Springleaf Finance Corp., Series I, MTN, 5.400%, 12/01/2015 | | | 300,000 | |
| | 2,349,000 | | | Sprint Capital Corp., 6.875%, 11/15/2028 | | | 1,685,407 | |
| | 2,240,000 | | | Sprint Capital Corp., 8.750%, 3/15/2032 | | | 1,741,600 | |
| | 26,000 | | | Sprint Communications, Inc., 6.000%, 12/01/2016 | | | 25,626 | |
See accompanying notes to financial statements.
35 |
Portfolio of Investments – as of September 30, 2015
Loomis Sayles Global Equity and Income Fund – (continued)
| | | | | | | | |
Principal
Amount (‡) | | | Description | | Value (†) | |
| | | | United States — continued | | | | |
| $ | 1,720,000 | | | Sprint Communications, Inc., 6.000%, 11/15/2022 | | $ | 1,294,300 | |
| | 120,000 | | | Sprint Corp., 7.125%, 6/15/2024 | | | 92,352 | |
| | 2,840,000 | | | Sprint Corp., 7.875%, 9/15/2023 | | | 2,298,625 | |
| | 2,910,000 | | | SUPERVALU, Inc., 6.750%, 6/01/2021 | | | 2,822,700 | |
| | 610,000 | | | Targa Resources Partners LP/Targa Resources Partners Finance Corp., 4.125%, 11/15/2019, 144A | | | 547,475 | |
| | 235,000 | | | Targa Resources Partners LP/Targa Resources Partners Finance Corp., 5.000%, 1/15/2018, 144A | | | 223,838 | |
| | 1,365,000 | | | Targa Resources Partners LP/Targa Resources Partners Finance Corp., 6.750%, 3/15/2024, 144A | | | 1,303,575 | |
| | 520,000 | | | Tenet Healthcare Corp., 5.000%, 3/01/2019 | | | 503,100 | |
| | 100,000 | | | Tenet Healthcare Corp., 6.750%, 6/15/2023 | | | 99,250 | |
| | 1,360,000 | | | Tenet Healthcare Corp., 6.875%, 11/15/2031 | | | 1,224,000 | |
| | 820,000 | | | Textron, Inc., 5.950%, 9/21/2021 | | | 950,732 | |
| | 90,000 | | | Time Warner Cable, Inc., 4.500%, 9/15/2042 | | | 71,156 | |
| | 565,000 | | | Time Warner Cable, Inc., 5.250%, 7/15/2042, (GBP) | | | 737,559 | |
| | 945,000 | | | Toys “R” Us, Inc., 7.375%, 10/15/2018 | | | 604,209 | |
| | 171,000 | | | TransDigm, Inc., 6.500%, 7/15/2024 | | | 160,714 | |
| | 185,000 | | | TransDigm, Inc., 6.500%, 5/15/2025, 144A | | | 173,900 | |
| | 90,000 | | | TRI Pointe Holdings, Inc., 4.375%, 6/15/2019 | | | 88,200 | |
| | 5,000 | | | TRI Pointe Holdings, Inc., 5.875%, 6/15/2024 | | | 4,900 | |
| | 5,000,000 | | | U.S. Treasury Note, 0.250%, 2/29/2016(c) | | | 5,002,345 | |
| | 3,785,000 | | | U.S. Treasury Note, 0.250%, 5/15/2016 | | | 3,785,246 | |
| | 7,500,000 | | | U.S. Treasury Note, 0.375%, 3/31/2016(c) | | | 7,507,327 | |
| | 8,530,000 | | | U.S. Treasury Note, 0.375%, 10/31/2016(c) | | | 8,528,115 | |
| | 8,520,000 | | | U.S. Treasury Note, 0.500%, 11/30/2016(c) | | | 8,526,211 | |
| | 9,545,000 | | | U.S. Treasury Note, 0.875%, 7/15/2017 | | | 9,589,871 | |
| | 5,555,000 | | | U.S. Treasury Note, 1.000%, 3/15/2018(i) | | | 5,583,858 | |
| | 15,291 | | | UAL Pass Through Trust, Series 2009-1, 10.400%, 5/01/2018 | | | 16,389 | |
| | 630,000 | | | United Continental Holdings, Inc., 6.375%, 6/01/2018 | | | 661,500 | |
| | 295,000 | | | United Rentals North America, Inc., 7.625%, 4/15/2022 | | | 312,700 | |
| | 1,940,000 | | | United States Steel Corp., 6.650%, 6/01/2037 | | | 1,378,370 | |
| | 770,000 | | | United States Steel Corp., 7.500%, 3/15/2022 | | | 608,300 | |
| | 120,695 | | | US Airways Pass Through Trust, Series 2012-1A, Class A, 5.900%, 4/01/2026 | | | 133,368 | |
| | 64,862 | | | US Airways Pass Through Trust, Series 2012-1B, Class B, 8.000%, 4/01/2021 | | | 72,808 | |
| | 458,780 | | | US Airways Pass Through Trust, Series 2012-2A, Class A, 4.625%, 12/03/2026 | | | 474,057 | |
| | 230,000 | | | USG Corp., 9.750%, 1/15/2018 | | | 255,875 | |
| | 110,000 | | | Verizon Pennsylvania, Inc., 6.000%, 12/01/2028 | | | 119,934 | |
| | 60,000 | | | Weyerhaeuser Co., 6.950%, 10/01/2027 | | | 71,844 | |
| | 315,000 | | | Weyerhaeuser Co., 7.375%, 3/15/2032 | | | 395,928 | |
| | 625,000 | | | Whiting Petroleum Corp., 5.000%, 3/15/2019 | | | 543,750 | |
| | 400,000 | | | Whiting Petroleum Corp., 6.500%, 10/01/2018 | | | 375,000 | |
| | 965,000 | | | Windstream Services LLC, 7.500%, 4/01/2023 | | | 714,100 | |
| | 500,000 | | | WPX Energy, Inc., 5.250%, 1/15/2017 | | | 497,500 | |
See accompanying notes to financial statements.
| 36
Portfolio of Investments – as of September 30, 2015
Loomis Sayles Global Equity and Income Fund – (continued)
| | | | | | | | |
Principal
Amount (‡) | | | Description | | Value (†) | |
| | | | United States — continued | | | | |
| $ | 125,000 | | | Xerox Corp., 6.750%, 2/01/2017 | | $ | 133,062 | |
| | 20,000 | | | Xerox Corp., MTN, 7.200%, 4/01/2016 | | | 20,586 | |
| | | | | | | | |
| | | | | | | 226,869,880 | |
| | | | | | | | |
| | | | Total Non-Convertible Bonds
(Identified Cost $410,711,326) | | | 390,872,013 | |
| | | | | | | | |
| | | | | | | | |
| | Convertible Bonds — 0.7% | | | | |
| | | | United States — 0.7% | | | | |
| | 495,000 | | | Brocade Communications Systems, Inc., 1.375%, 1/01/2020, 144A | | | 484,791 | |
| | 565,000 | | | Chesapeake Energy Corp., 2.500%, 5/15/2037 | | | 485,900 | |
| | 185,000 | | | Ciena Corp., 3.750%, 10/15/2018, 144A | | | 231,366 | |
| | 530,000 | | | Hologic, Inc., (accretes to principal after 3/01/2018), 2.000%, 3/01/2042(j) | | | 714,837 | |
| | 225,000 | | | Iconix Brand Group, Inc., 1.500%, 3/15/2018 | | | 178,875 | |
| | 1,125,000 | | | Intel Corp., 3.250%, 8/01/2039 | | | 1,697,344 | |
| | 275,000 | | | KB Home, 1.375%, 2/01/2019 | | | 255,406 | |
| | 83,000 | | | Macquarie Infrastructure Corp., 2.875%, 7/15/2019 | | | 94,205 | |
| | 2,200,000 | | | Old Republic International Corp., 3.750%, 3/15/2018 | | | 2,541,000 | |
| | 1,450,000 | | | Priceline Group, Inc. (The), 0.900%, 9/15/2021, 144A | | | 1,425,531 | |
| | 345,000 | | | Rovi Corp., 0.500%, 3/01/2020, 144A | | | 266,081 | |
| | 40,000 | | | RPM International, Inc., 2.250%, 12/15/2020 | | | 44,575 | |
| | 90,000 | | | Trinity Industries, Inc., 3.875%, 6/01/2036 | | | 106,144 | |
| | | | | | | | |
| | | | Total Convertible Bonds
(Identified Cost $7,308,877) | | | 8,526,055 | |
| | | | | | | | |
| | | | | | | | |
| | Municipals — 0.0% | | | | |
| | | | United States — 0.0% | | | | |
| | 415,000 | | | State of Illinois, 5.100%, 6/01/2033 | | | 388,772 | |
| | 130,000 | | | Virginia Tobacco Settlement Financing Corp., Series A-1, 6.706%, 6/01/2046 | | | 99,719 | |
| | | | | | | | |
| | | | Total Municipals
(Identified Cost $452,450) | | | 488,491 | |
| | | | | | | | |
| | | | | | | | |
| | | | Total Bonds and Notes
(Identified Cost $418,472,653) | | | 399,886,559 | |
| | | | | | | | |
| | | | | | | | |
| | Senior Loans — 0.3% | | | | |
| | | | United States — 0.3% | | | | |
| | 1,828,125 | | | Fairpoint Communications, Inc., Refi Term Loan, 7.500%, 2/14/2019(g) | | | 1,832,312 | |
| | 1,065,000 | | | Flying Fortress, Inc., New Term Loan, 3.500%, 4/30/2020(g) | | | 1,063,339 | |
| | 448,354 | | | PowerTeam Services LLC, 1st Lien Term Loan, 4.250%, 5/06/2020(g) | | | 442,377 | |
| | 120,000 | | | PowerTeam Services LLC, 2nd Lien Term Loan, 8.250%, 11/06/2020(g) | | | 114,000 | |
| | 14,464 | | | SuperMedia, Inc., Exit Term Loan, 11.600%, 12/30/2016(g) | | | 7,738 | |
| | 900,355 | | | Supervalu, Inc., Refi Term Loan B, 4.500%, 3/21/2019(g) | | | 900,733 | |
| | | | | | | | |
| | | | Total Senior Loans
(Identified Cost $4,369,081) | | | 4,360,499 | |
| | | | | | | | |
See accompanying notes to financial statements.
37 |
Portfolio of Investments – as of September 30, 2015
Loomis Sayles Global Equity and Income Fund – (continued)
| | | | | | | | |
Shares | | | Description | | Value (†) | |
| | Preferred Stocks — 0.1% | | | | |
| | Convertible Preferred Stocks — 0.1% | | | | |
| | | | United States — 0.1% | | | | |
| | 2,585 | | | Alcoa, Inc., Series 1, 5.375% | | $ | 86,339 | |
| | 460 | | | Chesapeake Energy Corp., 5.000% | | | 23,173 | |
| | 40 | | | Chesapeake Energy Corp., 5.750% | | | 15,800 | |
| | 650 | | | Chesapeake Energy Corp., 5.750% | | | 259,187 | |
| | 100 | | | Chesapeake Energy Corp., Series A, 5.750% 144A | | | 39,500 | |
| | | | | | | | |
| | | | Total Convertible Preferred Stocks
(Identified Cost $563,659) | | | 423,999 | |
| | | | | | | | |
| | | | | | | | |
| | Non-Convertible Preferred Stock — 0.0% | | | | |
| | | | United States — 0.0% | | | | |
| | 341 | | | Ally Financial, Inc., Series G, 7.000% 144A
(Identified Cost $75,329) | | | 342,076 | |
| | | | | | | | |
| | | | Total Preferred Stocks
(Identified Cost $638,988) | | | 766,075 | |
| | | | | | | | |
| | | | | | | | |
Principal
Amount (‡) | | | | | | |
| | Short-Term Investments — 4.7% | | | | |
| $ | 40,504 | | | Repurchase Agreement with State Street Bank and Trust Company, dated 9/30/2015 at 0.000% to be repurchased at $40,504 on 10/01/2015 collateralized by $40,600 U.S. Treasury Note, 1.500% due 8/31/2018 valued at $41,338 including accrued interest (Note 2 of Notes to Financial Statements) | | | 40,504 | |
| | 58,739,401 | | | Tri-Party Repurchase Agreement with Fixed Income Clearing Corporation, dated 9/30/2015 at 0.010% to be repurchased at $58,739,417 on 10/01/2015 collateralized by $56,725,000 U.S. Treasury Bond, 3.125% due 2/15/2042 valued at $59,915,781 including accrued interest (Note 2 of Notes to Financial Statements) | | | 58,739,401 | |
| | | | | | | | |
| | | | Total Short-Term Investments
(Identified Cost $58,779,905) | | | 58,779,905 | |
| | | | | | | | |
| | | | | | | | |
| | | | Total Investments — 98.9%
(Identified Cost $1,176,573,593)(a) | | | 1,231,014,955 | |
| | | | Other assets less liabilities — 1.1% | | | 13,381,378 | |
| | | | | | | | |
| | | | Net Assets — 100.0% | | $ | 1,244,396,333 | |
| | | | | | | | |
| | | | | | | | |
| | (‡) | | | Principal Amount stated in U.S. dollars unless otherwise noted. | | | | |
| | (†) | | | See Note 2 of Notes to Financial Statements. | | | | |
| | (††) | | | Amount shown represents units. One unit represents a principal amount of 1,000. | |
| | (†††) | | | Amount shown represents units. One unit represents a principal amount of 100. | |
| | (††††) | | | Amount shown represents units. One unit represents a principal amount of 25. | |
See accompanying notes to financial statements.
| 38
Portfolio of Investments – as of September 30, 2015
Loomis Sayles Global Equity and Income Fund – (continued)
| | | | | | | | |
| | | | | | | | |
| | (a) | | | Federal Tax Information: | | | | |
| | | | At September 30, 2015, the net unrealized appreciation on investments based on a cost of $1,174,528,149 for federal income tax purposes was as follows: | |
| | | | Aggregate gross unrealized appreciation for all investments in which there is an excess of value over tax cost | | $ | 125,848,575 | |
| | | | Aggregate gross unrealized depreciation for all investments in which there is an excess of tax cost over value | | | (69,361,769 | ) |
| | | | | | | | |
| | | | Net unrealized appreciation | | $ | 56,486,806 | |
| | | | | | | | |
| | | | | | | | |
| | (b) | | | Non-income producing security. | | | | |
| | (c) | | | All of this security has been designated to cover the Fund’s obligations under open forward foreign currency contracts. | |
| | (d) | | | Perpetual bond with no specified maturity date. | | | | |
| | (e) | | | When-issued/delayed delivery. See Note 2 of Notes to Financial Statements. | |
| | (f) | | | Fair valued by the Fund’s adviser. At September 30, 2015, the value of these securities amounted to $171,786 or less than 0.1% of net assets. See Note 2 of Notes to Financial Statements. | |
| | (g) | | | Variable rate security. Rate as of September 30, 2015 is disclosed. | | | | |
| | (h) | | | Illiquid security. At September 30, 2015, the value of these securities amounted to $1,821,900 or 0.1% of net assets. Illiquid securities are deemed to be fair valued pursuant to the Fund’s pricing policies and procedures. See Note 2 of Notes to Financial Statements. | |
| | (i) | | | A portion of this security has been pledged as collateral for open forward foreign currency contracts. | |
| | (j) | | | Coupon rate is a fixed rate for an initial period then resets at a specified date and rate. | |
| | | | | | | | |
| | 144A | | | All or a portion of these securities are exempt from registration under Rule 144A of the Securities Act of 1933. These securities may be resold in transactions exempt from registration, normally to qualified institutional buyers. At September 30, 2015, the value of Rule 144A holdings amounted to $102,731,538 or 8.3% of net assets. | |
| | ADR | | | An American Depositary Receipt is a certificate issued by a custodian bank representing the right to receive securities of the foreign issuer described. The values of ADRs may be significantly influenced by trading on exchanges not located in the United States. | |
| | EMTN | | | Euro Medium Term Note | | | | |
| | GMTN | | | Global Medium Term Note | | | | |
| | MTN | | | Medium Term Note | | | | |
| | | | | | | | |
| | AUD | | | Australian Dollar | | | | |
| | BRL | | | Brazilian Real | | | | |
| | CAD | | | Canadian Dollar | | | | |
| | CLP | | | Chilean Peso | | | | |
| | COP | | | Colombian Peso | | | | |
| | EUR | | | Euro | | | | |
| | GBP | | | British Pound | | | | |
| | IDR | | | Indonesian Rupiah | | | | |
| | INR | | | Indian Rupee | | | | |
| | KRW | | | South Korean Won | | | | |
| | MXN | | | Mexican Peso | | | | |
| | NOK | | | Norwegian Krone | | | | |
See accompanying notes to financial statements.
39 |
Portfolio of Investments – as of September 30, 2015
Loomis Sayles Global Equity and Income Fund – (continued)
| | | | | | |
| | NZD | | | New Zealand Dollar | | |
| | PHP | | | Philippine Peso | | |
| | PLN | | | Polish Zloty | | |
| | SEK | | | Swedish Krona | | |
| | TRY | | | Turkish Lira | | |
| | ZAR | | | South African Rand | | |
At September 30, 2015, the Fund had the following open forward foreign currency contracts:
| | | | | | | | | | | | | | | | | | |
Contract
to
Buy/Sell | | Delivery
Date | | | Currency | | Units
of
Currency | | | Notional
Value | | | Unrealized
Appreciation
(Depreciation) | |
| Sell1 | | | 12/16/2015 | | | Australian Dollar | | | 1,543,000 | | | $ | 1,078,741 | | | $ | 588 | |
| Sell1 | | | 12/09/2015 | | | Brazilian Real | | | 10,010,000 | | | | 2,465,482 | | | | 80,944 | |
| Buy1 | | | 12/16/2015 | | | British Pound | | | 3,740,000 | | | | 5,655,925 | | | | (112,052 | ) |
| Sell1 | | | 12/08/2015 | | | Canadian Dollar | | | 2,895,000 | | | | 2,168,701 | | | | 9,162 | |
| Buy2 | | | 12/16/2015 | | | Euro | | | 24,250,000 | | | | 27,131,423 | | | | (97,811 | ) |
| Sell3 | | | 10/15/2015 | | | Indonesian Rupiah | | | 39,600,000,000 | | | | 2,689,532 | | | | 214,332 | |
| Buy1 | | | 12/16/2015 | | | Japanese Yen | | | 2,276,500,000 | | | | 19,000,309 | | | | (22,123 | ) |
| Sell4 | | | 12/16/2015 | | | Mexican Peso | | | 107,500,000 | | | | 6,321,429 | | | | 55,933 | |
| Sell1 | | | 12/16/2015 | | | New Zealand Dollar | | | 8,162,000 | | | | 5,190,257 | | | | (59,951 | ) |
| Sell4 | | | 12/16/2015 | | | Norwegian Krone | | | 4,200,000 | | | | 492,771 | | | | 15,900 | |
| Sell3 | | | 12/16/2015 | | | Polish Zloty | | | 24,720,000 | | | | 6,491,010 | | | | 41,414 | |
| Sell4 | | | 10/28/2015 | | | Swedish Krona | | | 3,100,000 | | | | 370,582 | | | | (10,308 | ) |
| | | | | | | | | | | | | | | | | | |
| Total | | | | | | | | | | | | | | | | $ | 116,028 | |
| | | | | | | | | | | | | | | | | | |
At September 30, 2015, the Fund had the following open forward cross currency contracts:
| | | | | | | | | | | | | | | | | | |
| Settlement Date | | Deliver/Units of Currency | | Receive/Units of Currency | | | Unrealized
Appreciation
(Depreciation) | |
| 10/28/2015 | | | Norwegian Krone | | | 14,180,000 | | | Euro | 1 | | | 1,581,371 | | | $ | 102,769 | |
| | | | | | | | | | | | | | | | | | |
1 Counterparty is Credit Suisse International
2 Counterparty is Morgan Stanley & Co.
3 Counterparty is Citibank N.A.
4 Counterparty is UBS AG
See accompanying notes to financial statements.
| 40
Portfolio of Investments – as of September 30, 2015
Loomis Sayles Global Equity and Income Fund – (continued)
Industry Summary at September 30, 2015
| | | | |
Pharmaceuticals | | | 8.6 | % |
Treasuries | | | 8.3 | |
Internet Software & Services | | | 6.3 | |
Banks | | | 6.1 | |
Banking | | | 4.3 | |
Insurance | | | 4.1 | |
Aerospace & Defense | | | 4.0 | |
IT Services | | | 3.7 | |
Specialty Retail | | | 3.6 | |
Internet & Catalog Retail | | | 3.5 | |
Beverages | | | 2.3 | |
Household Durables | | | 2.2 | |
Government Owned – No Guarantee | | | 2.0 | |
Other Investments, less than 2% each | | | 35.2 | |
Short-Term Investments | | | 4.7 | |
| | | | |
Total Investments | | | 98.9 | |
Other assets less liabilities (including forward foreign currency contracts) | | | 1.1 | |
| | | | |
Net Assets | | | 100.0 | % |
| | | | |
Currency Exposure Summary at September 30, 2015
| | | | |
United States Dollar | | | 70.4 | % |
Euro | | | 6.6 | |
British Pound | | | 3.2 | |
Japanese Yen | | | 3.1 | |
Hong Kong Dollar | | | 2.5 | |
Indian Rupee | | | 2.4 | |
Canadian Dollar | | | 2.0 | |
Other, less than 2% each | | | 8.7 | |
| | | | |
Total Investments | | | 98.9 | |
Other assets less liabilities (including forward foreign currency contracts) | | | 1.1 | |
| | | | |
Net Assets | | | 100.0 | % |
| | | | |
See accompanying notes to financial statements.
41 |
Portfolio of Investments – as of September 30, 2015
Loomis Sayles Growth Fund
| | | | | | | | |
| Shares | | | Description | | Value (†) | |
| | Common Stocks — 98.6% of Net Assets | | | | |
| | | | Air Freight & Logistics — 6.6% | | | | |
| | 982,343 | | | Expeditors International of Washington, Inc. | | $ | 46,219,238 | |
| | 419,902 | | | United Parcel Service, Inc., Class B | | | 41,440,129 | |
| | | | | | | | |
| | | | | | | 87,659,367 | |
| | | | | | | | |
| | | | Beverages — 11.6% | | | | |
| | 1,294,766 | | | Coca-Cola Co. (The) | | | 51,946,012 | |
| | 452,656 | | | Monster Beverage Corp.(b) | | | 61,171,932 | |
| | 736,515 | | | SABMiller PLC, Sponsored ADR | | | 42,172,849 | |
| | | | | | | | |
| | | | | | | 155,290,793 | |
| | | | | | | | |
| | | | Biotechnology — 2.2% | | | | |
| | 211,490 | | | Amgen, Inc. | | | 29,253,297 | |
| | | | | | | | |
| | | | Capital Markets — 3.5% | | | | |
| | 146,414 | | | Greenhill & Co., Inc. | | | 4,168,406 | |
| | 875,834 | | | SEI Investments Co. | | | 42,241,474 | |
| | | | | | | | |
| | | | | | | 46,409,880 | |
| | | | | | | | |
| | | | Communications Equipment — 8.8% | | | | |
| | 2,622,138 | | | Cisco Systems, Inc. | | | 68,831,123 | |
| | 902,333 | | | QUALCOMM, Inc. | | | 48,482,352 | |
| | | | | | | | |
| | | | | | | 117,313,475 | |
| | | | | | | | |
| | | | Consumer Finance — 1.2% | | | | |
| | 214,346 | | | American Express Co. | | | 15,889,469 | |
| | | | | | | | |
| | | | Energy Equipment & Services — 2.6% | | | | |
| | 510,368 | | | Schlumberger Ltd. | | | 35,200,081 | |
| | | | | | | | |
| | | | Food Products — 3.8% | | | | |
| | 4,076,430 | | | Danone, Sponsored ADR | | | 51,363,018 | |
| | | | | | | | |
| | | | Health Care Equipment & Supplies — 3.9% | | | | |
| | 444,386 | | | Varian Medical Systems, Inc.(b) | | | 32,786,799 | |
| | 204,770 | | | Zimmer Biomet Holdings, Inc. | | | 19,234,046 | |
| | | | | | | | |
| | | | | | | 52,020,845 | |
| | | | | | | | |
| | | | Hotels, Restaurants & Leisure — 2.4% | | | | |
| | 400,650 | | | Yum! Brands, Inc. | | | 32,031,967 | |
| | | | | | | | |
| | | | Household Products — 3.5% | | | | |
| | 649,262 | | | Procter & Gamble Co. (The) | | | 46,707,908 | |
| | | | | | | | |
| | | | Internet & Catalog Retail — 5.4% | | | | |
| | 140,423 | | | Amazon.com, Inc.(b) | | | 71,881,129 | |
| | | | | | | | |
| | | | Internet Software & Services — 13.6% | | | | |
| | 752,099 | | | Alibaba Group Holding Ltd., Sponsored ADR(b) | | | 44,351,278 | |
| | 756,796 | | | Facebook, Inc., Class A(b) | | | 68,035,960 | |
| | 55,785 | | | Google, Inc., Class A(b) | | | 35,611,471 | |
| | 55,924 | | | Google, Inc., Class C(b) | | | 34,025,280 | |
| | | | | | | | |
| | | | | | | 182,023,989 | |
| | | | | | | | |
See accompanying notes to financial statements.
| 42
Portfolio of Investments – as of September 30, 2015
Loomis Sayles Growth Fund – (continued)
| | | | | | | | |
| Shares | | | Description | | Value (†) | |
| | | | IT Services — 5.8% | | | | |
| | 149,738 | | | Automatic Data Processing, Inc. | | $ | 12,032,946 | |
| | 949,462 | | | Visa, Inc., Class A | | | 66,139,523 | |
| | | | | | | | |
| | | | | | | 78,172,469 | |
| | | | | | | | |
| | | | Pharmaceuticals — 8.5% | | | | |
| | 386,813 | | | Merck & Co., Inc. | | | 19,104,694 | |
| | 469,340 | | | Novartis AG, ADR | | | 43,141,733 | |
| | 956,996 | | | Novo Nordisk AS, Sponsored ADR | | | 51,907,463 | |
| | | | | | | | |
| | | | | | | 114,153,890 | |
| | | | | | | | |
| | | | Semiconductors & Semiconductor Equipment — 2.7% | | | | |
| | 110,561 | | | Analog Devices, Inc. | | | 6,236,746 | |
| | 704,798 | | | ARM Holdings PLC, Sponsored ADR | | | 30,482,513 | |
| | | | | | | | |
| | | | | | | 36,719,259 | |
| | | | | | | | |
| | | | Software — 11.0% | | | | |
| | 648,123 | | | Autodesk, Inc.(b) | | | 28,608,149 | |
| | 156,642 | | | FactSet Research Systems, Inc. | | | 25,032,958 | |
| | 748,652 | | | Microsoft Corp. | | | 33,135,338 | |
| | 1,665,751 | | | Oracle Corp. | | | 60,166,926 | |
| | | | | | | | |
| | | | | | | 146,943,371 | |
| | | | | | | | |
| | | | Specialty Retail — 1.5% | | | | |
| | 293,788 | | | Lowe’s Cos., Inc. | | | 20,247,869 | |
| | | | | | | | |
| | | | Total Common Stocks
(Identified Cost $1,231,997,441) | | | 1,319,282,076 | |
| | | | | | | | |
| | | | | | | | |
Principal
Amount | | | | | | |
| | Short-Term Investments — 4.1% | | | | |
| $ | 54,314,835 | | | Tri-Party Repurchase Agreement with Fixed Income Clearing Corporation, dated 9/30/2015 at 0.010% to be repurchased at $54,314,850 on 10/01/2015 collateralized by $55,265,000 U.S. Treasury Note, 1.750% due 2/28/2022 valued at $55,403,163 including accrued interest (Note 2 of Notes to Financial Statements) (Identified Cost $54,314,835) | | | 54,314,835 | |
| | | | | | | | |
| | | | | | | | |
| | | | Total Investments — 102.7%
(Identified Cost $1,286,312,276)(a) | | | 1,373,596,911 | |
| | | | Other assets less liabilities — (2.7)% | | | (35,799,056 | ) |
| | | | | | | | |
| | | | Net Assets — 100.0% | | $ | 1,337,797,855 | |
| | | | | | | | |
| | | | | | | | |
| | (†) | | | See Note 2 of Notes to Financial Statements. | | | | |
| | (a) | | | Federal Tax Information: | | | | |
| | | | At September 30, 2015, the net unrealized appreciation on investments based on a cost of $1,286,351,875 for federal income tax purposes was as follows: | |
| | | | Aggregate gross unrealized appreciation for all investments in which there is an excess of value over tax cost | | $ | 148,684,813 | |
| | | | Aggregate gross unrealized depreciation for all investments in which there is an excess of tax cost over value | | | (61,439,777 | ) |
| | | | | | | | |
| | | | Net unrealized appreciation | | $ | 87,245,036 | |
| | | | | | | | |
See accompanying notes to financial statements.
43 |
Portfolio of Investments – as of September 30, 2015
Loomis Sayles Growth Fund – (continued)
| | | | | | |
| | | | | | |
| | (b) | | | Non-income producing security. | | |
| | | | | | |
| | ADR | | | An American Depositary Receipt is a certificate issued by a custodian bank representing the right to receive securities of the foreign issuer described. The values of ADRs may be significantly influenced by trading on exchanges not located in the United States. | | |
Industry Summary at September 30, 2015
| | | | |
Internet Software & Services | | | 13.6 | % |
Beverages | | | 11.6 | |
Software | | | 11.0 | |
Communications Equipment | | | 8.8 | |
Pharmaceuticals | | | 8.5 | |
Air Freight & Logistics | | | 6.6 | |
IT Services | | | 5.8 | |
Internet & Catalog Retail | | | 5.4 | |
Health Care Equipment & Supplies | | | 3.9 | |
Food Products | | | 3.8 | |
Household Products | | | 3.5 | |
Capital Markets | | | 3.5 | |
Semiconductors & Semiconductor Equipment | | | 2.7 | |
Energy Equipment & Services | | | 2.6 | |
Hotels, Restaurants & Leisure | | | 2.4 | |
Biotechnology | | | 2.2 | |
Other Investments, less than 2% each | | | 2.7 | |
Short-Term Investments | | | 4.1 | |
| | | | |
Total Investments | | | 102.7 | |
Other assets less liabilities | | | (2.7 | ) |
| | | | |
Net Assets | | | 100.0 | % |
| | | | |
See accompanying notes to financial statements.
| 44
Portfolio of Investments – as of September 30, 2015
Loomis Sayles Value Fund
| | | | | | | | |
| Shares | | | Description | | Value (†) | |
| | Common Stocks — 98.1% of Net Assets | | | | |
| | | | Aerospace & Defense — 4.7% | | | | |
| | 238,190 | | | Honeywell International, Inc. | | $ | 22,554,211 | |
| | 137,411 | | | Northrop Grumman Corp. | | | 22,803,355 | |
| | 263,628 | | | United Technologies Corp. | | | 23,460,256 | |
| | | | | | | | |
| | | | | | | 68,817,822 | |
| | | | | | | | |
| | | | Automobiles — 2.1% | | | | |
| | 575,017 | | | General Motors Co. | | | 17,262,010 | |
| | 250,475 | | | Harley-Davidson, Inc. | | | 13,751,078 | |
| | | | | | | | |
| | | | | | | 31,013,088 | |
| | | | | | | | |
| | | | Banks — 12.8% | | | | |
| | 2,097,528 | | | Bank of America Corp. | | | 32,679,486 | |
| | 623,897 | | | Citigroup, Inc. | | | 30,951,530 | |
| | 1,411,376 | | | Fifth Third Bancorp | | | 26,689,120 | |
| | 703,426 | | | JPMorgan Chase & Co. | | | 42,887,883 | |
| | 236,538 | | | PNC Financial Services Group, Inc. (The) | | | 21,099,190 | |
| | 632,460 | | | Wells Fargo & Co. | | | 32,476,821 | |
| | | | | | | | |
| | | | | | | 186,784,030 | |
| | | | | | | | |
| | | | Beverages — 1.6% | | | | |
| | 242,559 | | | PepsiCo, Inc. | | | 22,873,314 | |
| | | | | | | | |
| | | | Biotechnology — 1.2% | | | | |
| | 311,618 | | | AbbVie, Inc. | | | 16,955,135 | |
| | | | | | | | |
| | | | Capital Markets — 3.4% | | | | |
| | 196,473 | | | Ameriprise Financial, Inc. | | | 21,441,098 | |
| | 324,629 | | | Legg Mason, Inc. | | | 13,507,813 | |
| | 211,601 | | | State Street Corp. | | | 14,221,703 | |
| | | | | | | | |
| | | | | | | 49,170,614 | |
| | | | | | | | |
| | | | Chemicals — 1.3% | | | | |
| | 398,757 | | | E.I. du Pont de Nemours & Co. | | | 19,220,087 | |
| | | | | | | | |
| | | | Communications Equipment — 2.7% | | | | |
| | 798,764 | | | Cisco Systems, Inc. | | | 20,967,555 | |
| | 346,980 | | | QUALCOMM, Inc. | | | 18,643,235 | |
| | | | | | | | |
| | | | | | | 39,610,790 | |
| | | | | | | | |
| | | | Construction Materials — 1.6% | | | | |
| | 262,118 | | | Vulcan Materials Co. | | | 23,380,926 | |
| | | | | | | | |
| | | | Consumer Finance — 2.8% | | | | |
| | 222,018 | | | American Express Co. | | | 16,458,194 | |
| | 471,564 | | | Discover Financial Services | | | 24,516,613 | |
| | | | | | | | |
| | | | | | | 40,974,807 | |
| | | | | | | | |
| | | | Containers & Packaging — 1.5% | | | | |
| | 482,374 | | | Sealed Air Corp. | | | 22,613,693 | |
| | | | | | | | |
| | | | Diversified Telecommunication Services — 1.3% | | | | |
| | 444,880 | | | Verizon Communications, Inc. | | | 19,356,729 | |
| | | | | | | | |
| | | | Electric Utilities — 1.3% | | | | |
| | 195,455 | | | NextEra Energy, Inc. | | | 19,066,635 | |
| | | | | | | | |
See accompanying notes to financial statements.
45 |
Portfolio of Investments – as of September 30, 2015
Loomis Sayles Value Fund – (continued)
| | | | | | | | |
| Shares | | | Description | | Value (†) | |
| | | | Electrical Equipment — 1.3% | | | | |
| | 364,074 | | | Eaton Corp. PLC | | $ | 18,676,996 | |
| | | | | | | | |
| | | | Electronic Equipment, Instruments & Components — 1.0% | | | | |
| | 779,276 | | | Knowles Corp.(b) | | | 14,362,057 | |
| | | | | | | | |
| | | | Energy Equipment & Services — 2.3% | | | | |
| | 644,811 | | | Halliburton Co. | | | 22,794,069 | |
| | 293,920 | | | National Oilwell Varco, Inc. | | | 11,066,088 | |
| | | | | | | | |
| | | | | | | 33,860,157 | |
| | | | | | | | |
| | | | Food & Staples Retailing — 1.3% | | | | |
| | 192,654 | | | CVS Health Corp. | | | 18,587,258 | |
| | | | | | | | |
| | | | Food Products — 1.6% | | | | |
| | 548,147 | | | Mondelez International, Inc., Class A | | | 22,950,915 | |
| | | | | | | | |
| | | | Health Care Equipment & Supplies — 1.5% | | | | |
| | 330,120 | | | Medtronic PLC | | | 22,098,233 | |
| | | | | | | | |
| | | | Health Care Providers & Services — 4.8% | | | | |
| | 262,551 | | | Express Scripts Holding Co.(b) | | | 21,256,129 | |
| | 208,748 | | | HCA Holdings, Inc.(b) | | | 16,148,745 | |
| | 277,754 | | | UnitedHealth Group, Inc. | | | 32,222,242 | |
| | | | | | | | |
| | | | | | | 69,627,116 | |
| | | | | | | | |
| | | | Independent Power & Renewable Electricity Producers — 0.7% | | | | |
| | 715,134 | | | Calpine Corp.(b) | | | 10,440,956 | |
| | | | | | | | |
| | | | Insurance — 7.3% | | | | |
| | 451,730 | | | American International Group, Inc. | | | 25,667,299 | |
| | 549,047 | | | FNF Group | | | 19,474,697 | |
| | 487,875 | | | MetLife, Inc. | | | 23,003,306 | |
| | 196,521 | | | Travelers Cos., Inc. (The) | | | 19,559,735 | |
| | 590,183 | | | Unum Group | | | 18,933,071 | |
| | | | | | | | |
| | | | | | | 106,638,108 | |
| | | | | | | | |
| | | | Internet & Catalog Retail — 1.1% | | | | |
| | 603,855 | | | Liberty Interactive Corp./QVC Group, Class A(b) | | | 15,839,117 | |
| | | | | | | | |
| | | | Machinery — 2.1% | | | | |
| | 272,282 | | | Ingersoll-Rand PLC | | | 13,823,757 | |
| | 330,676 | | | Pentair PLC | | | 16,877,703 | |
| | | | | | | | |
| | | | | | | 30,701,460 | |
| | | | | | | | |
| | | | Media — 4.5% | | | | |
| | 436,759 | | | Comcast Corp., Class A | | | 24,842,852 | |
| | 288,984 | | | Liberty Global PLC, Class A(b) | | | 12,408,973 | |
| | 261,131 | | | Omnicom Group, Inc. | | | 17,208,533 | |
| | 265,571 | | | Viacom, Inc., Class B | | | 11,459,388 | |
| | | | | | | | |
| | | | | | | 65,919,746 | |
| | | | | | | | |
| | | | Multi-Utilities — 1.2% | | | | |
| | 335,865 | | | PG&E Corp. | | | 17,733,672 | |
| | | | | | | | |
| | | | Oil, Gas & Consumable Fuels — 5.8% | | | | |
| | 245,065 | | | Chevron Corp. | | | 19,330,727 | |
| | 315,598 | | | Hess Corp. | | | 15,798,836 | |
| | 1,090,376 | | | Marathon Oil Corp. | | | 16,791,791 | |
See accompanying notes to financial statements.
| 46
Portfolio of Investments – as of September 30, 2015
Loomis Sayles Value Fund – (continued)
| | | | | | | | |
| Shares | | | Description | | Value (†) | |
| | | | Oil, Gas & Consumable Fuels — continued | | | | |
| | 362,508 | | | Royal Dutch Shell PLC, Sponsored ADR | | $ | 17,179,254 | |
| | 262,259 | | | Valero Energy Corp. | | | 15,761,766 | |
| | | | | | | | |
| | | | | | | 84,862,374 | |
| | | | | | | | |
| | | | Pharmaceuticals — 9.5% | | | | |
| | 66,341 | | | Allergan PLC(b) | | | 18,032,147 | |
| | 347,080 | | | Eli Lilly & Co. | | | 29,047,125 | |
| | 529,933 | | | Merck & Co., Inc. | | | 26,173,391 | |
| | 1,056,462 | | | Pfizer, Inc. | | | 33,183,472 | |
| | 236,953 | | | Sanofi, ADR | | | 11,248,159 | |
| | 385,777 | | | Teva Pharmaceutical Industries Ltd., Sponsored ADR | | | 21,780,969 | |
| | | | | | | | |
| | | | | | | 139,465,263 | |
| | | | | | | | |
| | | | REITs – Diversified — 1.1% | | | | |
| | 593,076 | | | Weyerhaeuser Co. | | | 16,214,698 | |
| | | | | | | | |
| | | | Road & Rail — 1.4% | | | | |
| | 270,579 | | | Norfolk Southern Corp. | | | 20,672,236 | |
| | | | | | | | |
| | | | Software — 3.6% | | | | |
| | 806,679 | | | Microsoft Corp. | | | 35,703,612 | |
| | 867,921 | | | Symantec Corp. | | | 16,898,422 | |
| | | | | | | | |
| | | | | | | 52,602,034 | |
| | | | | | | | |
| | | | Specialty Retail — 1.3% | | | | |
| | 266,523 | | | Lowe’s Cos., Inc. | | | 18,368,765 | |
| | | | | | | | |
| | | | Technology Hardware, Storage & Peripherals — 2.6% | | | | |
| | 169,891 | | | Apple, Inc. | | | 18,738,977 | |
| | 801,407 | | | EMC Corp. | | | 19,361,993 | |
| | | | | | | | |
| | | | | | | 38,100,970 | |
| | | | | | | | |
| | | | Textiles, Apparel & Luxury Goods — 1.4% | | | | |
| | 169,099 | | | Ralph Lauren Corp. | | | 19,980,738 | |
| | | | | | | | |
| | | | Tobacco — 1.3% | | | | |
| | 238,897 | | | Philip Morris International, Inc. | | | 18,951,699 | |
| | | | | | | | |
| | | | Wireless Telecommunication Services — 1.1% | | | | |
| | 529,931 | | | Vodafone Group PLC, Sponsored ADR | | | 16,820,010 | |
| | | | | | | | |
| | | | Total Common Stocks (Identified Cost $1,263,418,025) | | | 1,433,312,248 | |
| | | | | | | | |
| | | | | | | | |
Principal
Amount | | | | | | |
| | Short-Term Investments — 1.2% | | | | |
| $ | 17,234,812 | | | Tri-Party Repurchase Agreement with Fixed Income Clearing Corporation, dated 9/30/2015 at 0.010% to be repurchased at $17,234,817 on 10/01/2015 collateralized by $17,540,000 U.S. Treasury Note, 1.750% due 2/28/2022 valued at $17,583,850 including accrued interest (Note 2 of Notes to Financial Statements) (Identified Cost $17,234,812) | | | 17,234,812 | |
| | | | | | | | |
| | | | | | | | |
| | | | Total Investments — 99.3%
(Identified Cost $1,280,652,837)(a) | | | 1,450,547,060 | |
| | | | Other assets less liabilities — 0.7% | | | 10,687,693 | |
| | | | | | | | |
| | | | Net Assets — 100.0% | | $ | 1,461,234,753 | |
| | | | | | | | |
See accompanying notes to financial statements.
47 |
Portfolio of Investments – as of September 30, 2015
Loomis Sayles Value Fund – (continued)
| | | | | | | | |
| | | | | | | | |
| | (†) | | | See Note 2 of Notes to Financial Statements. | | | | |
| | (a) | | | Federal Tax Information: | | | | |
| | | | At September 30, 2015, the net unrealized appreciation on investments based on a cost of $1,285,894,265 for federal income tax purposes was as follows: | | | | |
| | | | Aggregate gross unrealized appreciation for all investments in which there is an excess of value over tax cost | | $ | 277,617,465 | |
| | | | Aggregate gross unrealized depreciation for all investments in which there is an excess of tax cost over value | | | (112,964,670 | ) |
| | | | | | | | |
| | | | Net unrealized appreciation | | $ | 164,652,795 | |
| | | | | | | | |
| | | | | | | | |
| | (b) | | | Non-income producing security. | | | | |
| | | | | | | | |
| | ADR | | | An American Depositary Receipt is a certificate issued by a custodian bank representing the right to receive securities of the foreign issuer described. The values of ADRs may be significantly influenced by trading on exchanges not located in the United States. | |
| | REITs | | | Real Estate Investment Trusts | | | | |
Industry Summary at September 30, 2015
| | | | |
Banks | | | 12.8 | % |
Pharmaceuticals | | | 9.5 | |
Insurance | | | 7.3 | |
Oil, Gas & Consumable Fuels | | | 5.8 | |
Health Care Providers & Services | | | 4.8 | |
Aerospace & Defense | | | 4.7 | |
Media | | | 4.5 | |
Software | | | 3.6 | |
Capital Markets | | | 3.4 | |
Consumer Finance | | | 2.8 | |
Communications Equipment | | | 2.7 | |
Technology Hardware, Storage & Peripherals | | | 2.6 | |
Energy Equipment & Services | | | 2.3 | |
Automobiles | | | 2.1 | |
Machinery | | | 2.1 | |
Other Investments, less than 2% each | | | 27.1 | |
Short-Term Investments | | | 1.2 | |
| | | | |
Total Investments | | | 99.3 | |
Other assets less liabilities | | | 0.7 | |
| | | | |
Net Assets | | | 100.0 | % |
| | | | |
See accompanying notes to financial statements.
| 48
Statements of Assets and Liabilities
September 30, 2015
| | | | | | | | | | | | |
| | | Global Equity
and Income
Fund | | | Growth
Fund | | | Value
Fund | |
ASSETS | | | | | | | | | | | | |
Investments at cost | | $ | 1,176,573,593 | | | $ | 1,286,312,276 | | | $ | 1,280,652,837 | |
Net unrealized appreciation | | | 54,441,362 | | | | 87,284,635 | | | | 169,894,223 | |
| | | | | | | | | | | | |
Investments at value | | | 1,231,014,955 | | | | 1,373,596,911 | | | | 1,450,547,060 | |
Cash | | | 27,014 | | | | — | | | | 78,962 | |
Foreign currency at value (identified cost $9,604,261, $0 and $0, respectively) | | | 9,553,066 | | | | — | | | | — | |
Receivable for Fund shares sold | | | 4,576,325 | | | | 4,319,912 | | | | 3,746,158 | |
Receivable for securities sold | | | 2,295,800 | | | | — | | | | 16,467,476 | |
Collateral received for open forward foreign currency contracts (Notes 2 and 4) | | | 270,000 | | | | — | | | | — | |
Dividends and interest receivable | | | 6,156,412 | | | | 918,645 | | | | 1,521,358 | |
Unrealized appreciation on forward foreign currency contracts (Note 2) | | | 521,042 | | | | — | | | | — | |
Tax reclaims receivable | | | 339,511 | | | | 3,537 | | | | — | |
| | | | | | | | | | | | |
TOTAL ASSETS | | | 1,254,754,125 | | | | 1,378,839,005 | | | | 1,472,361,014 | |
| | | | | | | | | | | | |
LIABILITIES | | | | | | | | | | | | |
Payable for securities purchased | | | 5,023,786 | | | | 39,278,581 | | | | 8,662,915 | |
Payable for when-issued/delayed delivery securities purchased (Note 2) | | | 1,628,196 | | | | — | | | | — | |
Payable for Fund shares redeemed | | | 911,649 | | | | 911,255 | | | | 1,324,268 | |
Unrealized depreciation on forward foreign currency contracts (Note 2) | | | 302,245 | | | | — | | | | — | |
Foreign taxes payable (Note 2) | | | 1,094,252 | | | | — | | | | — | |
Due to broker (Note 2) | | | 270,000 | | | | — | | | | — | |
Management fees payable (Note 6) | | | 776,779 | | | | 530,280 | | | | 610,848 | |
Deferred Trustees’ fees (Note 6) | | | 125,486 | | | | 146,055 | | | | 329,144 | |
Administrative fees payable (Note 6) | | | 44,996 | | | | 46,048 | | | | 53,099 | |
Payable to distributor (Note 6d) | | | 11,829 | | | | 12,970 | | | | 18,255 | |
Other accounts payable and accrued expenses | | | 168,574 | | | | 115,961 | | | | 127,732 | |
| | | | | | | | | | | | |
TOTAL LIABILITIES | | | 10,357,792 | | | | 41,041,150 | | | | 11,126,261 | |
| | | | | | | | | | | | |
NET ASSETS | | $ | 1,244,396,333 | | | $ | 1,337,797,855 | | | $ | 1,461,234,753 | |
| | | | | | | | | | | | |
NET ASSETS CONSIST OF: | | | | | | | | | | | | |
Paid-in capital | | $ | 1,119,097,664 | | | $ | 1,263,386,498 | | | $ | 977,273,467 | |
Undistributed net investment income | | | 7,742,946 | | | | 6,076,156 | | | | 16,118,141 | |
Accumulated net realized gain (loss) on investments and foreign currency transactions | | | 64,080,393 | | | | (18,949,434 | ) | | | 297,948,922 | |
Net unrealized appreciation on investments and foreign currency translations | | | 53,475,330 | | | | 87,284,635 | | | | 169,894,223 | |
| | | | | | | | | | | | |
NET ASSETS | | $ | 1,244,396,333 | | | $ | 1,337,797,855 | | | $ | 1,461,234,753 | |
| | | | | | | | | | | | |
See accompanying notes to financial statements.
49 |
Statements of Assets and Liabilities (continued)
September 30, 2015
| | | | | | | | | | | | |
| | | Global Equity
and Income
Fund | | | Growth
Fund | | | Value
Fund | |
COMPUTATION OF NET ASSET VALUE AND OFFERING PRICE: | | | | | | | | | |
Class A shares: | | | | | | | | | | | | |
Net assets | | $ | 246,370,809 | | | $ | 122,202,598 | | | $ | 124,661,695 | |
| | | | | | | | | | | | |
Shares of beneficial interest | | | 13,356,703 | | | | 12,340,724 | | | | 5,198,611 | |
| | | | | | | | | | | | |
Net asset value and redemption price per share | | $ | 18.45 | | | $ | 9.90 | | | $ | 23.98 | |
| | | | | | | | | | | | |
Offering price per share (100/94.25 of net asset value) (Note 1) | | $ | 19.58 | | | $ | 10.50 | | | $ | 25.44 | |
| | | | | | | | | | | | |
Class B shares: (redemption price per share is equal to net asset value less any applicable contingent deferred sales charge) (Note 1) | | | | | | | | | | | | |
Net assets | | $ | — | | | $ | 22,370 | | | $ | 60,207 | |
| | | | | | | | | | | | |
Shares of beneficial interest | | | — | | | | 2,434 | | | | 2,454 | |
| | | | | | | | | | | | |
Net asset value and offering price per share | | $ | — | | | $ | 9.19 | | | $ | 24.54 | * |
| | | | | | | | | | | | |
Class C shares: (redemption price per share is equal to net asset value less any applicable contingent deferred sales charge) (Note 1) | | | | | | | | | | | | |
Net assets | | $ | 393,416,364 | | | $ | 41,421,057 | | | $ | 15,070,707 | |
| | | | | | | | | | | | |
Shares of beneficial interest | | | 21,625,751 | | | | 4,510,263 | | | | 636,116 | |
| | | | | | | | | | | | |
Net asset value and offering price per share | | $ | 18.19 | | | $ | 9.18 | | | $ | 23.69 | |
| | | | | | | | | | | | |
Class N shares: | | | | | | | | | | | | |
Net assets | | $ | — | | | $ | 1,400 | | | $ | 554,945,890 | |
| | | | | | | | | | | | |
Shares of beneficial interest | | | — | | | | 133 | | | | 23,035,081 | |
| | | | | | | | | | | | |
Net asset value, offering and redemption price per share | | $ | — | | | $ | 10.52 | * | | $ | 24.09 | |
| | | | | | | | | | | | |
Class Y shares: | | | | | | | | | | | | |
Net assets | | $ | 604,609,160 | | | $ | 1,174,150,430 | | | $ | 681,108,811 | |
| | | | | | | | | | | | |
Shares of beneficial interest | | | 32,584,906 | | | | 111,510,695 | | | | 28,258,630 | |
| | | | | | | | | | | | |
Net asset value, offering and redemption price per share | | $ | 18.55 | | | $ | 10.53 | | | $ | 24.10 | |
| | | | | | | | | | | | |
Admin Class shares: | | | | | | | | | | | | |
Net assets | | $ | — | | | $ | — | | | $ | 85,387,443 | |
| | | | | | | | | | | | |
Shares of beneficial interest | | | — | | | | — | | | | 3,585,874 | |
| | | | | | | | | | | | |
Net asset value, offering and redemption price per share | | $ | — | | | $ | — | | | $ | 23.81 | |
| | | | | | | | | | | | |
| * | Net asset value calculations reflect fractional share and dollar amounts. |
See accompanying notes to financial statements.
| 50
Statements of Operations
For the Year Ended September 30, 2015
| | | | | | | | | | | | |
| | | Global Equity
and Income
Fund | | | Growth
Fund | | | Value
Fund | |
INVESTMENT INCOME | | | | | | | | | | | | |
Dividends | | $ | 10,642,923 | | | $ | 16,209,231 | | | $ | 39,646,061 | |
Interest | | | 17,904,158 | | | | 2,614 | | | | 4,683 | |
Less net foreign taxes withheld | | | (614,812 | ) | | | (392,799 | ) | | | (455,025 | ) |
| | | | | | | | | | | | |
| | | 27,932,269 | | | | 15,819,046 | | | | 39,195,719 | |
| | | | | | | | | | | | |
Expenses | | | | | | | | | | | | |
Management fees (Note 6) | | | 9,385,904 | | | | 5,802,901 | | | | 9,462,497 | |
Service and distribution fees (Note 6) | | | 4,459,808 | | | | 588,393 | | | | 1,018,361 | |
Administrative fees (Note 6) | | | 533,866 | | | | 495,189 | | | | 807,293 | |
Trustees’ fees and expenses (Note 6) | | | 33,771 | | | | 32,260 | | | | 38,332 | |
Transfer agent fees and expenses (Notes 6 and 7) | | | 1,055,306 | | | | 1,096,667 | | | | 1,644,494 | |
Audit and tax services fees | | | 60,467 | | | | 40,292 | | | | 40,272 | |
Custodian fees and expenses | | | 244,811 | | | | 46,350 | | | | 53,953 | |
Legal fees | | | 14,083 | | | | 12,407 | | | | 21,793 | |
Registration fees | | | 101,164 | | | | 132,287 | | | | 205,981 | |
Shareholder reporting expenses | | | 102,958 | | | | 54,181 | | | | 107,793 | |
Miscellaneous expenses | | | 48,869 | | | | 31,356 | | | | 58,025 | |
| | | | | | | | | | | | |
Total expenses | | | 16,041,007 | | | | 8,332,283 | | | | 13,458,794 | |
Less waiver and/or expense reimbursement (Note 6) | | | — | | | | (144 | ) | | | — | |
| | | | | | | | | | | | |
Net expenses | | | 16,041,007 | | | | 8,332,139 | | | | 13,458,794 | |
| | | | | | | | | | | | |
Net investment income | | | 11,891,262 | | | | 7,486,907 | | | | 25,736,925 | |
| | | | | | | | | | | | |
NET REALIZED AND UNREALIZED GAIN (LOSS) ON INVESTMENTS AND FOREIGN CURRENCY TRANSACTIONS | | | | | | | | | | | | |
Net realized gain on: | | | | | | | | | | | | |
Investments | | | 65,593,516 | | | | 102,347,346 | | | | 324,209,929 | |
Foreign currency transactions | | | 2,128,654 | | | | — | | | | — | |
Net change in unrealized appreciation (depreciation) on: | | | | | | | | | | | | |
Investments | | | (93,596,095 | ) | | | (62,314,445 | ) | | | (400,601,216 | ) |
Foreign currency translations | | | (448,257 | ) | | | — | | | | — | |
| | | | | | | | | | | | |
Net realized and unrealized gain (loss) on investments and foreign currency transactions | | | (26,322,182 | ) | | | 40,032,901 | | | | (76,391,287 | ) |
| | | | | | | | | | | | |
NET INCREASE (DECREASE) IN NET ASSETS RESULTING FROM OPERATIONS | | $ | (14,430,920 | ) | | $ | 47,519,808 | | | $ | (50,654,362 | ) |
| | | | | | | | | | | | |
See accompanying notes to financial statements.
51 |
Statements of Changes in Net Assets
| | | | | | | | | | | | | | | | |
| | | Global Equity and Income Fund | | | Growth Fund | |
| | | Year Ended
September 30,
2015 | | | Year Ended
September 30,
2014 | | | Year Ended
September 30,
2015 | | | Year Ended
September 30,
2014 | |
FROM OPERATIONS: | | | | | | | | | | | | | | | | |
Net investment income | | $ | 11,891,262 | | | $ | 16,654,633 | | | $ | 7,486,907 | | | $ | 5,925,597 | |
Net realized gain on investments and foreign currency transactions | | | 67,722,170 | | | | 63,034,029 | | | | 102,347,346 | | | | 37,751,773 | |
Net change in unrealized appreciation (depreciation) on investments and foreign currency translations | | | (94,044,352 | ) | | | 30,721,127 | | | | (62,314,445 | ) | | | 73,439,555 | |
| | | | | | | | | | | | | | | | |
Net increase (decrease) in net assets resulting from operations | | | (14,430,920 | ) | | | 110,409,789 | | | | 47,519,808 | | | | 117,116,925 | |
| | | | | | | | | | | | | | | | |
FROM DISTRIBUTIONS TO SHAREHOLDERS: | | | | | | | | | | | | | | | | |
Net investment income | | | | | | | | | | | | | | | | |
Class A | | | (2,404,233 | ) | | | (4,662,019 | ) | | | (382,515 | ) | | | (62,431 | ) |
Class C | | | (1,155,191 | ) | | | (3,777,946 | ) | | | — | | | | — | |
Class N | | | — | | | | — | | | | (7 | ) | | | (3 | ) |
Class Y | | | (8,199,038 | ) | | | (11,208,754 | ) | | | (5,959,493 | ) | | | (1,861,749 | ) |
Net realized capital gains | | | | | | | | | | | | | | | | |
Class A | | | (11,493,040 | ) | | | (3,414,741 | ) | | | — | | | | — | |
Class C | | | (18,511,977 | ) | | | (4,537,332 | ) | | | — | | | | — | |
Class Y | | | (30,839,565 | ) | | | (7,216,843 | ) | | | — | | | | — | |
| | | | | | | | | | | | | | | | |
Total distributions | | | (72,603,044 | ) | | | (34,817,635 | ) | | | (6,342,015 | ) | | | (1,924,183 | ) |
| | | | | | | | | | | | | | | | |
NET INCREASE IN NET ASSETS FROM CAPITAL SHARE TRANSACTIONS (NOTE 12) | | | 84,205,723 | | | | 9,166,416 | | | | 198,516,181 | | | | 369,196,723 | |
| | | | | | | | | | | | | | | | |
Net increase (decrease) in net assets | | | (2,828,241 | ) | | | 84,758,570 | | | | 239,693,974 | | | | 484,389,465 | |
NET ASSETS | | | | | | | | | | | | | | | | |
Beginning of the year | | | 1,247,224,574 | | | | 1,162,466,004 | | | | 1,098,103,881 | | | | 613,714,416 | |
| | | | | | | | | | | | | | | | |
End of the year | | $ | 1,244,396,333 | | | $ | 1,247,224,574 | | | $ | 1,337,797,855 | | | $ | 1,098,103,881 | |
| | | | | | | | | | | | | | | | |
UNDISTRIBUTED NET INVESTMENT INCOME | | $ | 7,742,946 | | | $ | 9,047,574 | | | $ | 6,076,156 | | | $ | 4,934,562 | |
| | | | | | | | | | | | | | | | |
See accompanying notes to financial statements.
| 52
Statements of Changes in Net Assets (continued)
| | | | | | | | |
| | | Value Fund | |
| | | Year Ended
September 30,
2015 | | | Year Ended
September 30,
2014 | |
FROM OPERATIONS: | | | | | | | | |
Net investment income | | $ | 25,736,925 | | | $ | 46,159,044 | |
Net realized gain on investments and foreign currency transactions | | | 324,209,929 | | | | 193,094,685 | |
Net change in unrealized appreciation (depreciation) on investments and foreign currency translations | | | (400,601,216 | ) | | | 118,580,388 | |
| | | | | | | | |
Net increase (decrease) in net assets resulting from operations | | | (50,654,362 | ) | | | 357,834,117 | |
| | | | | | | | |
FROM DISTRIBUTIONS TO SHAREHOLDERS: | | | | | | | | |
Net investment income | | | | | | | | |
Class A | | | (10,401,685 | ) | | | (2,696,217 | ) |
Class C | | | (187,911 | ) | | | (56,045 | ) |
Class N | | | (13,964,469 | ) | | | (3,689,697 | ) |
Class Y | | | (21,235,238 | ) | | | (16,821,147 | ) |
Admin Class | | | (5,320 | ) | | | (119 | ) |
Net realized capital gains | | | | | | | | |
Class A | | | (52,482,381 | ) | | | (12,795,968 | ) |
Class B | | | (35,446 | ) | | | (52,578 | ) |
Class C | | | (1,642,866 | ) | | | (776,082 | ) |
Class N | | | (59,475,488 | ) | | | (14,085,769 | ) |
Class Y | | | (98,286,185 | ) | | | (71,586,232 | ) |
Admin Class | | | (27,631 | ) | | | (641 | ) |
| | | | | | | | |
Total distributions | | | (257,744,620 | ) | | | (122,560,495 | ) |
| | | | | | | | |
NET INCREASE (DECREASE) IN NET ASSETS FROM CAPITAL SHARE TRANSACTIONS (NOTE 12) | | | (524,658,028 | ) | | | 96,928,660 | |
| | | | | | | | |
Net increase (decrease) in net assets | | | (833,057,010 | ) | | | 332,202,282 | |
NET ASSETS | | | | | | | | |
Beginning of the year | | | 2,294,291,763 | | | | 1,962,089,481 | |
| | | | | | | | |
End of the year | | $ | 1,461,234,753 | | | $ | 2,294,291,763 | |
| | | | | | | | |
UNDISTRIBUTED NET INVESTMENT INCOME | | $ | 16,118,141 | | | $ | 38,569,726 | |
| | | | | | | | |
See accompanying notes to financial statements.
53 |
Financial Highlights
For a share outstanding throughout each period.
| | | | | | | | | | | | | | | | | | | | |
| | | Global Equity and Income Fund—Class A | |
| | | Year Ended
September 30,
2015 | | | Year Ended
September 30,
2014 | | | Year Ended
September 30,
2013 | | | Year Ended
September 30,
2012 | | | Year Ended
September 30,
2011 | |
Net asset value, beginning of the period | | $ | 19.77 | | | $ | 18.57 | | | $ | 17.07 | | | $ | 14.24 | | | $ | 14.72 | |
| | | | | | | | | | | | | | | | | | | | |
INCOME (LOSS) FROM INVESTMENT OPERATIONS: | | | | | | | | | | | | | | | | | | | | |
Net investment income(a) | | | 0.21 | | | | 0.28 | | | | 0.32 | (b) | | | 0.35 | (c) | | | 0.22 | |
Net realized and unrealized gain (loss) | | | (0.37 | ) | | | 1.49 | | | | 1.45 | | | | 2.71 | | | | (0.45 | ) |
| | | | | | | | | | | | | | | | | | | | |
Total from Investment Operations | | | (0.16 | ) | | | 1.77 | | | | 1.77 | | | | 3.06 | | | | (0.23 | ) |
| | | | | | | | | | | | | | | | | | | | |
LESS DISTRIBUTIONS FROM: | | | | | | | | | | | | | | | | | | | | |
Net investment income | | | (0.20 | ) | | | (0.33 | ) | | | (0.27 | ) | | | (0.23 | ) | | | (0.25 | ) |
Net realized capital gains | | | (0.96 | ) | | | (0.24 | ) | | | — | | | | — | | | | — | |
| | | | | | | | | | | | | | | | | | | | |
Total Distributions | | | (1.16 | ) | | | (0.57 | ) | | | (0.27 | ) | | | (0.23 | ) | | | (0.25 | ) |
| | | | | | | | | | | | | | | | | | | | |
Net asset value, end of the period | | $ | 18.45 | | | $ | 19.77 | | | $ | 18.57 | | | $ | 17.07 | | | $ | 14.24 | |
| | | | | | | | | | | | | | | | | | | | |
Total return(d) | | | (0.91 | )% | | | 9.62 | % | | | 10.54 | %(b) | | | 21.75 | %(c) | | | (1.67 | )% |
RATIOS TO AVERAGE NET ASSETS: | | | | | | | | | | | | | | | | | | | | |
Net assets, end of the period (000’s) | | $ | 246,371 | | | $ | 237,167 | | | $ | 251,211 | | | $ | 216,209 | | | $ | 111,589 | |
Net expenses | | | 1.18 | % | | | 1.17 | % | | | 1.18 | % | | | 1.21 | % | | | 1.24 | %(e) |
Gross expenses | | | 1.18 | % | | | 1.17 | % | | | 1.18 | % | | | 1.21 | % | | | 1.24 | %(e) |
Net investment income | | | 1.06 | % | | | 1.46 | % | | | 1.82 | %(b) | | | 2.16 | %(c) | | | 1.41 | % |
Portfolio turnover rate | | | 48 | % | | | 49 | % | | | 58 | % | | | 29 | % | | | 65 | % |
| (a) | Per share net investment income has been calculated using the average shares outstanding during the period. |
| (b) | Includes non-recurring dividends. Without these dividends, net investment income per share would have been $0.27, total return would have been 10.25% and the ratio of net investment income to average net assets would have been 1.51%. |
| (c) | Includes a non-recurring dividend. Without this dividend, net investment income per share would have been $0.31, total return would have been 21.46% and the ratio of net investment income to average net assets would have been 1.93%. |
| (d) | A sales charge for Class A shares is not reflected in total return calculations. |
| (e) | Includes fee/expense recovery of 0.02%. |
See accompanying notes to financial statements.
| 54
Financial Highlights (continued)
For a share outstanding throughout each period.
| | | | | | | | | | | | | | | | | | | | |
| | | Global Equity and Income Fund—Class C | |
| | | Year Ended
September 30,
2015 | | | Year Ended
September 30,
2014 | | | Year Ended
September 30,
2013 | | | Year Ended
September 30,
2012 | | | Year Ended
September 30,
2011 | |
Net asset value, beginning of the period | | $ | 19.51 | | | $ | 18.36 | | | $ | 16.90 | | | $ | 14.10 | | | $ | 14.59 | |
| | | | | | | | | | | | | | | | | | | | |
INCOME (LOSS) FROM INVESTMENT OPERATIONS: | | | | | | | | | | | | | | | | | | | | |
Net investment income(a) | | | 0.06 | | | | 0.14 | | | | 0.19 | (b) | | | 0.22 | (c) | | | 0.10 | |
Net realized and unrealized gain (loss) | | | (0.36 | ) | | | 1.45 | | | | 1.45 | | | | 2.70 | | | | (0.44 | ) |
| | | | | | | | | | | | | | | | | | | | |
Total from Investment Operations | | | (0.30 | ) | | | 1.59 | | | | 1.64 | | | | 2.92 | | | | (0.34 | ) |
| | | | | | | | | | | | | | | | | | | | |
LESS DISTRIBUTIONS FROM: | | | | | | | | | | | | | | | | | | | | |
Net investment income | | | (0.06 | ) | | | (0.20 | ) | | | (0.18 | ) | | | (0.12 | ) | | | (0.15 | ) |
Net realized capital gains | | | (0.96 | ) | | | (0.24 | ) | | | — | | | | — | | | | — | |
| | | | | | | | | | | | | | | | | | | | |
Total Distributions | | | (1.02 | ) | | | (0.44 | ) | | | (0.18 | ) | | | (0.12 | ) | | | (0.15 | ) |
| | | | | | | | | | | | | | | | | | | | |
Net asset value, end of the period | | $ | 18.19 | | | $ | 19.51 | | | $ | 18.36 | | | $ | 16.90 | | | $ | 14.10 | |
| | | | | | | | | | | | | | | | | | | | |
Total return(d) | | | (1.66 | )% | | | 8.72 | % | | | 9.77 | %(b) | | | 20.83 | %(c) | | | (2.42 | )% |
RATIOS TO AVERAGE NET ASSETS: | | | | | | | | | | | | | | | | | | | | |
Net assets, end of the period (000’s) | | $ | 393,416 | | | $ | 377,001 | | | $ | 340,561 | | | $ | 251,366 | | | $ | 145,369 | |
Net expenses | | | 1.93 | % | | | 1.92 | % | | | 1.93 | % | | | 1.96 | % | | | 1.99 | %(e) |
Gross expenses | | | 1.93 | % | | | 1.92 | % | | | 1.93 | % | | | 1.96 | % | | | 1.99 | %(e) |
Net investment income | | | 0.31 | % | | | 0.71 | % | | | 1.07 | %(b) | | | 1.40 | %(c) | | | 0.64 | % |
Portfolio turnover rate | | | 48 | % | | | 49 | % | | | 58 | % | | | 29 | % | | | 65 | % |
| (a) | Per share net investment income has been calculated using the average shares outstanding during the period. |
| (b) | Includes non-recurring dividends. Without these dividends, net investment income per share would have been $0.13, total return would have been 9.41% and the ratio of net investment income to average net assets would have been 0.76%. |
| (c) | Includes a non-recurring dividend. Without this dividend, net investment income per share would have been $0.19, total return would have been 20.55% and the ratio of net investment income to average net assets would have been 1.18%. |
| (d) | A contingent deferred sales charge for Class C shares is not reflected in total return calculations. |
| (e) | Includes fee/expense recovery of 0.02%. |
See accompanying notes to financial statements.
55 |
Financial Highlights (continued)
For a share outstanding throughout each period.
| | | | | | | | | | | | | | | | | | | | |
| | | Global Equity and Income Fund—Class Y | |
| | | Year Ended
September 30,
2015 | | | Year Ended
September 30,
2014 | | | Year Ended
September 30,
2013 | | | Year Ended
September 30,
2012 | | | Year Ended
September 30,
2011 | |
Net asset value, beginning of the period | | $ | 19.89 | | | $ | 18.68 | | | $ | 17.15 | | | $ | 14.31 | | | $ | 14.78 | |
| | | | | | | | | | | | | | | | | | | | |
INCOME (LOSS) FROM INVESTMENT OPERATIONS: | | | | | | | | | | | | | | | | | | | | |
Net investment income(a) | | | 0.25 | | | | 0.33 | | | | 0.37 | (b) | | | 0.40 | (c) | | | 0.26 | |
Net realized and unrealized gain (loss) | | | (0.37 | ) | | | 1.49 | | | | 1.47 | | | | 2.71 | | | | (0.45 | ) |
| | | | | | | | | | | | | | | | | | | | |
Total from Investment Operations | | | (0.12 | ) | | | 1.82 | | | | 1.84 | | | | 3.11 | | | | (0.19 | ) |
| | | | | | | | | | | | | | | | | | | | |
LESS DISTRIBUTIONS FROM: | | | | | | | | | | | | | | | | | | | | |
Net investment income | | | (0.26 | ) | | | (0.37 | ) | | | (0.31 | ) | | | (0.27 | ) | | | (0.28 | ) |
Net realized capital gains | | | (0.96 | ) | | | (0.24 | ) | | | — | | | | — | | | | — | |
| | | | | | | | | | | | | | | | | | | | |
Total Distributions | | | (1.22 | ) | | | (0.61 | ) | | | (0.31 | ) | | | (0.27 | ) | | | (0.28 | ) |
| | | | | | | | | | | | | | | | | | | | |
Net asset value, end of the period | | $ | 18.55 | | | $ | 19.89 | | | $ | 18.68 | | | $ | 17.15 | | | $ | 14.31 | |
| | | | | | | | | | | | | | | | | | | | |
Total return | | | (0.72 | )% | | | 9.87 | % | | | 10.90 | %(b) | | | 21.96 | %(c) | | | (1.42 | )% |
RATIOS TO AVERAGE NET ASSETS: | | | | | | | | | | | | | | | | | | | | |
Net assets, end of the period (000’s) | | $ | 604,609 | | | $ | 633,057 | | | $ | 570,694 | | | $ | 460,103 | | | $ | 216,136 | |
Net expenses | | | 0.93 | % | | | 0.92 | % | | | 0.93 | % | | | 0.96 | % | | | 0.99 | %(d) |
Gross expenses | | | 0.93 | % | | | 0.92 | % | | | 0.93 | % | | | 0.96 | % | | | 0.99 | %(d) |
Net investment income | | | 1.30 | % | | | 1.69 | % | | | 2.07 | %(b) | | | 2.44 | %(c) | | | 1.65 | % |
Portfolio turnover rate | | | 48 | % | | | 49 | % | | | 58 | % | | | 29 | % | | | 65 | % |
| (a) | Per share net investment income has been calculated using the average shares outstanding during the period. |
| (b) | Includes non-recurring dividends. Without these dividends, net investment income per share would have been $0.31, total return would have been 10.60% and the ratio of net investment income to average net assets would have been 1.76%. |
| (c) | Includes a non-recurring dividend. Without this dividend, net investment income per share would have been $0.36, total return would have been 21.75% and the ratio of net investment income to average net assets would have been 2.20%. |
| (d) | Includes fee/expense recovery of 0.02%. |
See accompanying notes to financial statements.
| 56
Financial Highlights (continued)
For a share outstanding throughout each period.
| | | | | | | | | | | | | | | | | | | | |
| | | Growth Fund—Class A | |
| | | Year Ended
September 30,
2015 | | | Year Ended
September 30,
2014 | | | Year Ended
September 30,
2013 | | | Year Ended
September 30,
2012 | | | Year Ended
September 30,
2011 | |
Net asset value, beginning of the period | | $ | 9.45 | | | $ | 8.07 | | | $ | 6.50 | | | $ | 5.24 | | | $ | 5.14 | |
| | | | | | | | | | | | | | | | | | | | |
INCOME (LOSS) FROM INVESTMENT OPERATIONS: | | | | | | | | | | | | | | | | | | | | |
Net investment income(a) | | | 0.05 | | | | 0.05 | | | | 0.04 | | | | 0.04 | | | | 0.01 | |
Net realized and unrealized gain (loss) | | | 0.45 | | | | 1.34 | | | | 1.59 | | | | 1.23 | | | | 0.09 | |
| | | | | | | | | | | | | | | | | | | | |
Total from Investment Operations | | | 0.50 | | | | 1.39 | | | | 1.63 | | | | 1.27 | | | | 0.10 | |
| | | | | | | | | | | | | | | | | | | | |
LESS DISTRIBUTIONS FROM: | | | | | | | | | | | | | | | | | | | | |
Net investment income | | | (0.05 | ) | | | (0.01 | ) | | | (0.06 | ) | | | (0.01 | ) | | | — | |
Net realized capital gains | | | — | | | | — | | | | — | | | | — | | | | — | |
| | | | | | | | | | | | | | | | | | | | |
Total Distributions | | | (0.05 | ) | | | (0.01 | ) | | | (0.06 | ) | | | (0.01 | ) | | | — | |
| | | | | | | | | | | | | | | | | | | | |
Net asset value, end of the period | | $ | 9.90 | | | $ | 9.45 | | | $ | 8.07 | | | $ | 6.50 | | | $ | 5.24 | |
| | | | | | | | | | | | | | | | | | | | |
Total return(b) | | | 5.30 | % | | | 17.23 | % | | | 25.23 | % | | | 24.22 | % | | | 1.95 | % |
RATIOS TO AVERAGE NET ASSETS: | | | | | | | | | | | | | | | | | | | | |
Net assets, end of the period (000’s) | | $ | 122,203 | | | $ | 63,682 | | | $ | 50,248 | | | $ | 33,663 | | | $ | 26,716 | |
Net expenses | | | 0.92 | % | | | 0.94 | % | | | 1.03 | % | | | 1.07 | % | | | 1.14 | % |
Gross expenses | | | 0.92 | % | | | 0.94 | % | | | 1.03 | % | | | 1.07 | % | | | 1.14 | % |
Net investment income | | | 0.45 | % | | | 0.55 | % | | | 0.57 | % | | | 0.61 | % | | | 0.23 | % |
Portfolio turnover rate | | | 27 | % | | | 14 | % | | | 6 | % | | | 16 | % | | | 16 | % |
| (a) | Per share net investment income has been calculated using the average shares outstanding during the period. |
| (b) | A sales charge for Class A shares is not reflected in total return calculations. |
See accompanying notes to financial statements.
57 |
Financial Highlights (continued)
For a share outstanding throughout each period.
| | | | | | | | | | | | | | | | | | | | |
| | | Growth Fund—Class B | |
| | | Year Ended
September 30,
2015 | | | Year Ended
September 30,
2014 | | | Year Ended
September 30,
2013 | | | Year Ended
September 30,
2012 | | | Year Ended
September 30,
2011 | |
Net asset value, beginning of the period | | $ | 8.79 | | | $ | 7.56 | | | $ | 6.09 | | | $ | 4.94 | | | $ | 4.87 | |
| | | | | | | | | | | | | | | | | | | | |
INCOME (LOSS) FROM INVESTMENT OPERATIONS: | | | | | | | | | | | | | | | | | | | | |
Net investment loss(a) | | | (0.03 | ) | | | (0.02 | ) | | | (0.01 | ) | | | (0.01 | ) | | | (0.03 | ) |
Net realized and unrealized gain (loss) | | | 0.43 | | | | 1.25 | | | | 1.48 | | | | 1.16 | | | | 0.10 | |
| | | | | | | | | | | | | | | | | | | | |
Total from Investment Operations | | | 0.40 | | | | 1.23 | | | | 1.47 | | | | 1.15 | | | | 0.07 | |
| | | | | | | | | | | | | | | | | | | | |
LESS DISTRIBUTIONS FROM: | | | | | | | | | | | | | | | | | | | | |
Net investment income | | | — | | | | — | | | | — | | | | — | | | | — | |
Net realized capital gains | | | — | | | | — | | | | — | | | | — | | | | — | |
| | | | | | | | | | | | | | | | | | | | |
Total Distributions | | | — | | | | — | | | | — | | | | — | | | | — | |
| | | | | | | | | | | | | | | | | | | | |
Net asset value, end of the period | | $ | 9.19 | | | $ | 8.79 | | | $ | 7.56 | | | $ | 6.09 | | | $ | 4.94 | |
| | | | | | | | | | | | | | | | | | | | |
Total return(b) | | | 4.55 | % | | | 16.27 | % | | | 24.14 | % | | | 23.28 | % | | | 1.44 | % |
RATIOS TO AVERAGE NET ASSETS: | | | | | | | | | | | | | | | | | | | | |
Net assets, end of the period (000’s) | | $ | 22 | | | $ | 428 | | | $ | 1,422 | | | $ | 1,908 | | | $ | 2,609 | |
Net expenses | | | 1.66 | % | | | 1.69 | % | | | 1.78 | % | | | 1.82 | % | | | 1.89 | % |
Gross expenses | | | 1.66 | % | | | 1.69 | % | | | 1.78 | % | | | 1.82 | % | | | 1.89 | % |
Net investment loss | | | (0.34 | )% | | | (0.25 | )% | | | (0.14 | )% | | | (0.12 | )% | | | (0.54 | )% |
Portfolio turnover rate | | | 27 | % | | | 14 | % | | | 6 | % | | | 16 | % | | | 16 | % |
| (a) | Per share net investment loss has been calculated using the average shares outstanding during the period. |
| (b) | A contingent deferred sales charge for Class B shares is not reflected in total return calculations. |
See accompanying notes to financial statements.
| 58
Financial Highlights (continued)
For a share outstanding throughout each period.
| | | | | | | | | | | | | | | | | | | | |
| | | Growth Fund—Class C | |
| | | Year Ended
September 30,
2015 | | | Year Ended
September 30,
2014 | | | Year Ended
September 30,
2013 | | | Year Ended
September 30,
2012 | | | Year Ended
September 30,
2011 | |
Net asset value, beginning of the period | | $ | 8.79 | | | $ | 7.55 | | | $ | 6.09 | | | $ | 4.94 | | | $ | 4.87 | |
| | | | | | | | | | | | | | | | | | | | |
INCOME (LOSS) FROM INVESTMENT OPERATIONS: | | | | | | | | | | | | | | | | | | | | |
Net investment loss(a) | | | (0.03 | ) | | | (0.02 | ) | | | (0.01 | ) | | | (0.01 | ) | | | (0.03 | ) |
Net realized and unrealized gain (loss) | | | 0.42 | | | | 1.26 | | | | 1.48 | | | | 1.16 | | | | 0.10 | |
| | | | | | | | | | | | | | | | | | | | |
Total from Investment Operations | | | 0.39 | | | | 1.24 | | | | 1.47 | | | | 1.15 | | | | 0.07 | |
| | | | | | | | | | | | | | | | | | | | |
LESS DISTRIBUTIONS FROM: | | | | | | | | | | | | | | | | | | | | |
Net investment income | | | — | | | | — | | | | (0.01 | ) | | | — | | | | — | |
Net realized capital gains | | | — | | | | — | | | | — | | | | — | | | | — | |
| | | | | | | | | | | | | | | | | | | | |
Total Distributions | | | — | | | | — | | | | (0.01 | ) | | | — | | | | — | |
| | | | | | | | | | | | | | | | | | | | |
Net asset value, end of the period | | $ | 9.18 | | | $ | 8.79 | | | $ | 7.55 | | | $ | 6.09 | | | $ | 4.94 | |
| | | | | | | | | | | | | | | | | | | | |
Total return(b) | | | 4.44 | % | | | 16.42 | % | | | 24.21 | % | | | 23.28 | % | | | 1.44 | % |
RATIOS TO AVERAGE NET ASSETS: | | | | | | | | | | | | | | | | | | | | |
Net assets, end of the period (000’s) | | $ | 41,421 | | | $ | 29,837 | | | $ | 20,798 | | | $ | 10,489 | | | $ | 10,262 | |
Net expenses | | | 1.67 | % | | | 1.69 | % | | | 1.78 | % | | | 1.82 | % | | | 1.89 | % |
Gross expenses | | | 1.67 | % | | | 1.69 | % | | | 1.78 | % | | | 1.82 | % | | | 1.89 | % |
Net investment loss | | | (0.29 | )% | | | (0.20 | )% | | | (0.20 | )% | | | (0.13 | )% | | | (0.53 | )% |
Portfolio turnover rate | | | 27 | % | | | 14 | % | | | 6 | % | | | 16 | % | | | 16 | % |
| (a) | Per share net investment loss has been calculated using the average shares outstanding during the period. |
| (b) | A contingent deferred sales charge for Class C shares is not reflected in total return calculations. |
See accompanying notes to financial statements.
59 |
Financial Highlights (continued)
For a share outstanding throughout each period.
| | | | | | | | | | | | |
| | | Growth Fund—Class N | |
| | | Year Ended
September 30,
2015 | | | Year Ended
September 30,
2014 | | | Period Ended
September 30,
2013* | |
Net asset value, beginning of the period | | $ | 10.01 | | | $ | 8.56 | | | $ | 7.58 | |
| | | | | | | | | | | | |
INCOME (LOSS) FROM INVESTMENT OPERATIONS: | | | | | | | | | | | | |
Net investment income(a) | | | 0.08 | | | | 0.05 | | | | 0.03 | |
Net realized and unrealized gain (loss) | | | 0.49 | | | | 1.42 | | | | 0.95 | |
| | | | | | | | | | | | |
Total from Investment Operations | | | 0.57 | | | | 1.47 | | | | 0.98 | |
| | | | | | | | | | | | |
LESS DISTRIBUTIONS FROM: | | | | | | | | | | | | |
Net investment income | | | (0.06 | ) | | | (0.02 | ) | | | — | |
Net realized capital gains | | | — | | | | — | | | | — | |
| | | | | | | | | | | | |
Total Distributions | | | (0.06 | ) | | | (0.02 | ) | | | — | |
| | | | | | | | | | | | |
Net asset value, end of the period | | $ | 10.52 | | | $ | 10.01 | | | $ | 8.56 | |
| | | | | | | | | | | | |
Total return(b) | | | 5.65 | % | | | 17.21 | % | | | 12.93 | %(c) |
RATIOS TO AVERAGE NET ASSETS: | | | | | | | | | | | | |
Net assets, end of the period (000’s) | | $ | 1 | | | $ | 1 | | | $ | 1 | |
Net expenses(d) | | | 0.55 | % | | | 0.95 | % | | | 0.95 | %(e) |
Gross expenses | | | 9.82 | % | | | 3.45 | % | | | 3.50 | %(e) |
Net investment income | | | 0.71 | % | | | 0.52 | % | | | 0.60 | %(e) |
Portfolio turnover rate | | | 27 | % | | | 14 | % | | | 6 | % |
| * | From commencement of Class operations on February 1, 2013 through September 30, 2013. |
| (a) | Per share net investment income has been calculated using the average shares outstanding during the period. |
| (b) | Had certain expenses not been waived/reimbursed during the period, total returns would have been lower. |
| (c) | Periods less than one year are not annualized. |
| (d) | The investment adviser agreed to waive its fees and/or reimburse a portion of the Fund’s expenses during the period. Without this waiver/reimbursement, expenses would have been higher. |
| (e) | Computed on an annualized basis for periods less than one year. |
See accompanying notes to financial statements.
| 60
Financial Highlights (continued)
For a share outstanding throughout each period.
| | | | | | | | | | | | | | | | | | | | |
| | | Growth Fund—Class Y | |
| | | Year Ended
September 30,
2015 | | | Year Ended
September 30,
2014 | | | Year Ended
September 30,
2013 | | | Year Ended
September 30,
2012 | | | Year Ended
September 30,
2011 | |
Net asset value, beginning of the period | | $ | 10.04 | | | $ | 8.57 | | | $ | 6.90 | | | $ | 5.56 | | | $ | 5.43 | |
| | | | | | | | | | | | | | | | | | | | |
INCOME (LOSS) FROM INVESTMENT OPERATIONS: | | | | | | | | | | | | | | | | | | | | |
Net investment income(a) | | | 0.07 | | | | 0.08 | | | | 0.05 | | | | 0.06 | | | | 0.03 | |
Net realized and unrealized gain (loss) | | | 0.49 | | | | 1.42 | | | | 1.69 | | | | 1.30 | | | | 0.10 | |
| | | | | | | | | | | | | | | | | | | | |
Total from Investment Operations | | | 0.56 | | | | 1.50 | | | | 1.74 | | | | 1.36 | | | | 0.13 | |
| | | | | | | | | | | | | | | | | | | | |
LESS DISTRIBUTIONS FROM: | | | | | | | | | | | | | | | | | | | | |
Net investment income | | | (0.07 | ) | | | (0.03 | ) | | | (0.07 | ) | | | (0.02 | ) | | | — | |
Net realized capital gains | | | — | | | | — | | | | — | | | | — | | | | — | |
| | | | | | | | | | | | | | | | | | | | |
Total Distributions | | | (0.07 | ) | | | (0.03 | ) | | | (0.07 | ) | | | (0.02 | ) | | | — | |
| | | | | | | | | | | | | | | | | | | | |
Net asset value, end of the period | | $ | 10.53 | | | $ | 10.04 | | | $ | 8.57 | | | $ | 6.90 | | | $ | 5.56 | |
| | | | | | | | | | | | | | | | | | | | |
Total return | | | 5.59 | % | | | 17.51 | % | | | 25.49 | % | | | 24.57 | % | | | 2.21 | % |
RATIOS TO AVERAGE NET ASSETS: | | | | | | | | | | | | | | | | | | | | |
Net assets, end of the period (000’s) | | $ | 1,174,150 | | | $ | 1,004,157 | | | $ | 541,245 | | | $ | 102,688 | | | $ | 70,177 | |
Net expenses | | | 0.67 | % | | | 0.69 | % | | | 0.77 | % | | | 0.82 | % | | | 0.89 | % |
Gross expenses | | | 0.67 | % | | | 0.69 | % | | | 0.77 | % | | | 0.82 | % | | | 0.89 | % |
Net investment income | | | 0.69 | % | | | 0.79 | % | | | 0.68 | % | | | 0.87 | % | | | 0.49 | % |
Portfolio turnover rate | | | 27 | % | | | 14 | % | | | 6 | % | | | 16 | % | | | 16 | % |
| (a) | Per share net investment income has been calculated using the average shares outstanding during the period. |
See accompanying notes to financial statements.
61 |
Financial Highlights (continued)
For a share outstanding throughout each period.
| | | | | | | | | | | | | | | | | | | | |
| | | Value Fund—Class A | |
| | | Year Ended
September 30,
2015 | | | Year Ended
September 30,
2014 | | | Year Ended
September 30,
2013 | | | Year Ended
September 30,
2012 | | | Year Ended
September 30,
2011 | |
Net asset value, beginning of the period | | $ | 28.47 | | | $ | 25.59 | | | $ | 20.86 | | | $ | 16.04 | | | $ | 16.78 | |
| | | | | | | | | | | | | | | | | | | | |
INCOME (LOSS) FROM INVESTMENT OPERATIONS: | | | | | | | | | | | | | | | | | | | | |
Net investment income(a) | | | 0.29 | | | | 0.45 | (b) | | | 0.31 | | | | 0.27 | | | | 0.20 | |
Net realized and unrealized gain (loss) | | | (1.58 | ) | | | 4.00 | | | | 4.70 | | | | 4.78 | | | | (0.72 | ) |
| | | | | | | | | | | | | | | | | | | | |
Total from Investment Operations | | | (1.29 | ) | | | 4.45 | | | | 5.01 | | | | 5.05 | | | | (0.52 | ) |
| | | | | | | | | | | | | | | | | | | | |
LESS DISTRIBUTIONS FROM: | | | | | | | | | | | | | | | | | | | | |
Net investment income | | | (0.53 | ) | | | (0.27 | ) | | | (0.28 | ) | | | (0.23 | ) | | | (0.22 | ) |
Net realized capital gains | | | (2.67 | ) | | | (1.30 | ) | | | — | | | | — | | | | — | |
| | | | | | | | | | | | | | | | | | | | |
Total Distributions | | | (3.20 | ) | | | (1.57 | ) | | | (0.28 | ) | | | (0.23 | ) | | | (0.22 | ) |
| | | | | | | | | | | | | | | | | | | | |
Net asset value, end of the period | | $ | 23.98 | | | $ | 28.47 | | | $ | 25.59 | | | $ | 20.86 | | | $ | 16.04 | |
| | | | | | | | | | | | | | | | | | | | |
Total return(c) | | | (5.59 | )% | | | 17.97 | %(b) | | | 24.35 | % | | | 31.71 | % | | | (3.28 | )% |
RATIOS TO AVERAGE NET ASSETS: | | | | | | | | | | | | | | | | | | | | |
Net assets, end of the period (000’s) | | $ | 124,662 | | | $ | 580,092 | | | $ | 171,327 | | | $ | 129,572 | | | $ | 126,789 | |
Net expenses | | | 0.95 | % | | | 0.96 | % | | | 0.97 | % | | | 0.98 | % | | | 0.98 | % |
Gross expenses | | | 0.95 | % | | | 0.96 | % | | | 0.97 | % | | | 0.98 | % | | | 0.98 | % |
Net investment income | | | 1.07 | % | | | 1.63 | %(b) | | | 1.31 | % | | | 1.45 | % | | | 1.09 | % |
Portfolio turnover rate | | | 20 | % | | | 28 | % | | | 24 | % | | | 25 | % | | | 29 | % |
| (a) | Per share net investment income has been calculated using the average shares outstanding during the period. |
| (b) | Includes non-recurring dividends. Without these dividends, net investment income per share would have been $0.29, total return would have been 17.02% and the ratio of net investment income to average net assets would have been 1.05%. |
| (c) | A sales charge for Class A shares is not reflected in total return calculations. |
See accompanying notes to financial statements.
| 62
Financial Highlights (continued)
For a share outstanding throughout each period.
| | | | | | | | | | | | | | | | | | | | |
| | | Value Fund—Class B | |
| | | Year Ended
September 30,
2015 | | | Year Ended
September 30,
2014 | | | Year Ended
September 30,
2013 | | | Year Ended
September 30,
2012 | | | Year Ended
September 30,
2011 | |
Net asset value, beginning of the period | | $ | 28.76 | | | $ | 25.77 | | | $ | 20.95 | | | $ | 16.05 | | | $ | 16.77 | |
| | | | | | | | | | | | | | | | | | | | |
INCOME (LOSS) FROM INVESTMENT OPERATIONS: | | | | | | | | | | | | | | | | | | | | |
Net investment income(a) | | | 0.08 | | | | 0.32 | (b) | | | 0.14 | | | | 0.13 | | | | 0.06 | |
Net realized and unrealized gain (loss) | | | (1.63 | ) | | | 3.97 | | | | 4.75 | | | | 4.81 | | | | (0.73 | ) |
| | | | | | | | | | | | | | | | | | | | |
Total from Investment Operations | | | (1.55 | ) | | | 4.29 | | | | 4.89 | | | | 4.94 | | | | (0.67 | ) |
| | | | | | | | | | | | | | | | | | | | |
LESS DISTRIBUTIONS FROM: | | | | | | | | | | | | | | | | | | | | |
Net investment income | | | — | | | | — | | | | (0.07 | ) | | | (0.04 | ) | | | (0.05 | ) |
Net realized capital gains | | | (2.67 | ) | | | (1.30 | ) | | | — | | | | — | | | | — | |
| | | | | | | | | | | | | | | | | | | | |
Total Distributions | | | (2.67 | ) | | | (1.30 | ) | | | (0.07 | ) | | | (0.04 | ) | | | (0.05 | ) |
| | | | | | | | | | | | | | | | | | | | |
Net asset value, end of the period | | $ | 24.54 | | | $ | 28.76 | | | $ | 25.77 | | | $ | 20.95 | | | $ | 16.05 | |
| | | | | | | | | | | | | | | | | | | | |
Total return(c) | | | (6.32 | )% | | | 17.08 | %(b) | | | 23.42 | % | | | 30.79 | % | | | (4.05 | )% |
RATIOS TO AVERAGE NET ASSETS: | | | | | | | | | | | | | | | | | | | | |
Net assets, end of the period (000’s) | | $ | 60 | | | $ | 672 | | | $ | 1,143 | | | $ | 1,534 | | | $ | 2,037 | |
Net expenses | | | 1.69 | % | | | 1.71 | % | | | 1.72 | % | | | 1.73 | % | | | 1.73 | % |
Gross expenses | | | 1.69 | % | | | 1.71 | % | | | 1.72 | % | | | 1.73 | % | | | 1.73 | % |
Net investment income | | | 0.29 | % | | | 1.16 | %(b) | | | 0.59 | % | | | 0.71 | % | | | 0.32 | % |
Portfolio turnover rate | | | 20 | % | | | 28 | % | | | 24 | % | | | 25 | % | | | 29 | % |
| (a) | Per share net investment income has been calculated using the average shares outstanding during the period. |
| (b) | Includes non-recurring dividends. Without these dividends, net investment income per share would have been $0.07, total return would have been 16.14% and the ratio of net investment income to average net assets would have been 0.26%. |
| (c) | A contingent deferred sales charge for Class B shares is not reflected in total return calculations. |
See accompanying notes to financial statements.
63 |
Financial Highlights (continued)
For a share outstanding throughout each period.
| | | | | | | | | | | | | | | | | | | | |
| | | Value Fund—Class C | |
| | | Year Ended
September 30,
2015 | | | Year Ended
September 30,
2014 | | | Year Ended
September 30,
2013 | | | Year Ended
September 30,
2012 | | | Year Ended
September 30,
2011 | |
Net asset value, beginning of the period | | $ | 28.14 | | | $ | 25.33 | | | $ | 20.65 | | | $ | 15.85 | | | $ | 16.58 | |
| | | | | | | | | | | | | | | | | | | | |
INCOME (LOSS) FROM INVESTMENT OPERATIONS: | | | | | | | | | | | | | | | | | | | | |
Net investment income(a) | | | 0.10 | | | | 0.31 | (b) | | | 0.13 | | | | 0.13 | | | | 0.06 | |
Net realized and unrealized gain (loss) | | | (1.57 | ) | | | 3.89 | | | | 4.68 | | | | 4.74 | | | | (0.71 | ) |
| | | | | | | | | | | | | | | | | | | | |
Total from Investment Operations | | | (1.47 | ) | | | 4.20 | | | | 4.81 | | | | 4.87 | | | | (0.65 | ) |
| | | | | | | | | | | | | | | | | | | | |
LESS DISTRIBUTIONS FROM: | | | | | | | | | | | | | | | | | | | | |
Net investment income | | | (0.31 | ) | | | (0.09 | ) | | | (0.13 | ) | | | (0.07 | ) | | | (0.08 | ) |
Net realized capital gains | | | (2.67 | ) | | | (1.30 | ) | | | — | | | | — | | | | — | |
| | | | | | | | | | | | | | | | | | | | |
Total Distributions | | | (2.98 | ) | | | (1.39 | ) | | | (0.13 | ) | | | (0.07 | ) | | | (0.08 | ) |
| | | | | | | | | | | | | | | | | | | | |
Net asset value, end of the period | | $ | 23.69 | | | $ | 28.14 | | | $ | 25.33 | | | $ | 20.65 | | | $ | 15.85 | |
| | | | | | | | | | | | | | | | | | | | |
Total return(c) | | | (6.30 | )% | | | 17.07 | %(b) | | | 23.41 | % | | | 30.78 | % | | | (4.00 | )% |
RATIOS TO AVERAGE NET ASSETS: | | | | | | | | | | | | | | | | | | | | |
Net assets, end of the period (000’s) | | $ | 15,071 | | | $ | 16,958 | | | $ | 15,158 | | | $ | 9,104 | | | $ | 8,996 | |
Net expenses | | | 1.70 | % | | | 1.71 | % | | | 1.72 | % | | | 1.73 | % | | | 1.73 | % |
Gross expenses | | | 1.70 | % | | | 1.71 | % | | | 1.72 | % | | | 1.73 | % | | | 1.73 | % |
Net investment income | | | 0.40 | % | | | 1.15 | %(b) | | | 0.55 | % | | | 0.70 | % | | | 0.33 | % |
Portfolio turnover rate | | | 20 | % | | | 28 | % | | | 24 | % | | | 25 | % | | | 29 | % |
| (a) | Per share net investment income has been calculated using the average shares outstanding during the period. |
| (b) | Includes non-recurring dividends. Without these dividends, net investment income per share would have been $0.08, total return would have been 16.11% and the ratio of net investment income to average net assets would have been 0.28%. |
| (c) | A contingent deferred sales charge for Class C shares is not reflected in total return calculations. |
See accompanying notes to financial statements.
| 64
Financial Highlights (continued)
For a share outstanding throughout each period.
| | | | | | | | | | | | |
| | | Value Fund—Class N | |
| | | Year Ended
September 30,
2015 | | | Year Ended
September 30,
2014 | | | Period Ended
September 30,
2013* | |
Net asset value, beginning of the period | | $ | 28.58 | | | $ | 25.65 | | | $ | 22.59 | |
| | | | | | | | | | | | |
INCOME (LOSS) FROM INVESTMENT OPERATIONS: | | | | | | | | | | | | |
Net investment income(a) | | | 0.42 | | | | 0.63 | (b) | | | 0.25 | |
Net realized and unrealized gain (loss) | | | (1.61 | ) | | | 3.94 | | | | 2.81 | |
| | | | | | | | | | | | |
Total from Investment Operations | | | (1.19 | ) | | | 4.57 | | | | 3.06 | |
| | | | | | | | | | | | |
LESS DISTRIBUTIONS FROM: | | | | | | | | | | | | |
Net investment income | | | (0.63 | ) | | | (0.34 | ) | | | — | |
Net realized capital gains | | | (2.67 | ) | | | (1.30 | ) | | | — | |
| | | | | | | | | | | | |
Total Distributions | | | (3.30 | ) | | | (1.64 | ) | | | — | |
| | | | | | | | | | | | |
Net asset value, end of the period | | $ | 24.09 | | | $ | 28.58 | | | $ | 25.65 | |
| | | | | | | | | | | | |
Total return | | | (5.23 | )% | | | 18.43 | %(b) | | | 13.55 | %(c) |
RATIOS TO AVERAGE NET ASSETS: | | | | | | | | | | | | |
Net assets, end of the period (000’s) | | $ | 554,946 | | | $ | 392,811 | | | $ | 260,643 | |
Net expenses | | | 0.57 | % | | | 0.57 | % | | | 0.57 | %(d) |
Gross expenses | | | 0.57 | % | | | 0.57 | % | | | 0.57 | %(d) |
Net investment income | | | 1.55 | % | | | 2.28 | %(b) | | | 1.50 | %(d) |
Portfolio turnover rate | | | 20 | % | | | 28 | % | | | 24 | % |
| * | From commencement of Class operations on February 1, 2013 through September 30, 2013. |
| (a) | Per share net investment income has been calculated using the average shares outstanding during the period. |
| (b) | Includes non-recurring dividends. Without these dividends, net investment income per share would have been $0.39, total return would have been 17.48% and the ratio of net investment income to average net assets would have been 1.43%. |
| (c) | Periods less than one year are not annualized. |
| (d) | Computed on an annualized basis for periods less than one year. |
See accompanying notes to financial statements.
65 |
Financial Highlights (continued)
For a share outstanding throughout each period.
| | | | | | | | | | | | | | | | | | | | |
| | | Value Fund—Class Y | |
| | | Year Ended
September 30,
2015 | | | Year Ended
September 30,
2014 | | | Year Ended
September 30,
2013 | | | Year Ended
September 30,
2012 | | | Year Ended
September 30,
2011 | |
Net asset value, beginning of the period | | $ | 28.58 | | | $ | 25.65 | | | $ | 20.91 | | | $ | 16.08 | | | $ | 16.82 | |
| | | | | | | | | | | | | | | | | | | | |
INCOME (LOSS) FROM INVESTMENT OPERATIONS: | | | | | | | | | | | | | | | | | | | | |
Net investment income(a) | | | 0.37 | | | | 0.60 | (b) | | | 0.36 | | | | 0.32 | | | | 0.25 | |
Net realized and unrealized gain (loss) | | | (1.60 | ) | | | 3.94 | | | | 4.72 | | | | 4.78 | | | | (0.73 | ) |
| | | | | | | | | | | | | | | | | | | | |
Total from Investment Operations | | | (1.23 | ) | | | 4.54 | | | | 5.08 | | | | 5.10 | | | | (0.48 | ) |
| | | | | | | | | | | | | | | | | | | | |
LESS DISTRIBUTIONS FROM: | | | | | | | | | | | | | | | | | | | | |
Net investment income | | | (0.58 | ) | | | (0.31 | ) | | | (0.34 | ) | | | (0.27 | ) | | | (0.26 | ) |
Net realized capital gains | | | (2.67 | ) | | | (1.30 | ) | | | — | | | | — | | | | — | |
| | | | | | | | | | | | | | | | | | | | |
Total Distributions | | | (3.25 | ) | | | (1.61 | ) | | | (0.34 | ) | | | (0.27 | ) | | | (0.26 | ) |
| | | | | | | | | | | | | | | | | | | | |
Net asset value, end of the period | | $ | 24.10 | | | $ | 28.58 | | | $ | 25.65 | | | $ | 20.91 | | | $ | 16.08 | |
| | | | | | | | | | | | | | | | | | | | |
Total return | | | (5.37 | )% | | | 18.27 | %(b) | | | 24.65 | % | | | 32.05 | % | | | (3.05 | )% |
RATIOS TO AVERAGE NET ASSETS: | | | | | | | | | | | | | | | | | | | | |
Net assets, end of the period (000’s) | | $ | 681,109 | | | $ | 1,303,492 | | | $ | 1,513,807 | | | $ | 1,240,093 | | | $ | 957,584 | |
Net expenses | | | 0.70 | % | | | 0.71 | % | | | 0.72 | % | | | 0.73 | % | | | 0.74 | % |
Gross expenses | | | 0.70 | % | | | 0.71 | % | | | 0.72 | % | | | 0.73 | % | | | 0.74 | % |
Net investment income | | | 1.36 | % | | | 2.19 | %(b) | | | 1.56 | % | | | 1.68 | % | | | 1.34 | % |
Portfolio turnover rate | | | 20 | % | | | 28 | % | | | 24 | % | | | 25 | % | | | 29 | % |
| (a) | Per share net investment income has been calculated using the average shares outstanding during the period. |
| (b) | Includes non-recurring dividends. Without these dividends, net investment income per share would have been $0.35, total return would have been 17.32% and the ratio of net investment income to average net assets would have been 1.28%. |
See accompanying notes to financial statements.
| 66
Financial Highlights (continued)
For a share outstanding throughout each period.
| | | | | | | | | | | | | | | | | | | | |
| | | Value Fund—Admin Class | |
| | | Year Ended
September 30,
2015 | | | Year Ended
September 30,
2014 | | | Year Ended
September 30,
2013 | | | Year Ended
September 30,
2012 | | | Year Ended
September 30,
2011 | |
Net asset value, beginning of the period | | $ | 28.34 | | | $ | 25.51 | | | $ | 20.79 | | | $ | 16.00 | | | $ | 16.74 | |
| | | | | | | | | | | | | | | | | | | | |
INCOME (LOSS) FROM INVESTMENT OPERATIONS: | | | | | | | | | | | | | | | | | | | | |
Net investment income(a) | | | 0.26 | | | | 0.30 | (b) | | | 0.24 | | | | 0.22 | | | | 0.17 | |
Net realized and unrealized gain (loss) | | | (1.61 | ) | | | 4.07 | | | | 4.71 | | | | 4.77 | | | | (0.73 | ) |
| | | | | | | | | | | | | | | | | | | | |
Total from Investment Operations | | | (1.35 | ) | | | 4.37 | | | | 4.95 | | | | 4.99 | | | | (0.56 | ) |
| | | | | | | | | | | | | | | | | | | | |
LESS DISTRIBUTIONS FROM: | | | | | | | | | | | | | | | | | | | | |
Net investment income | | | (0.51 | ) | | | (0.24 | ) | | | (0.23 | ) | | | (0.20 | ) | | | (0.18 | ) |
Net realized capital gains | | | (2.67 | ) | | | (1.30 | ) | | | — | | | | — | | | | — | |
| | | | | | | | | | | | | | | | | | | | |
Total Distributions | | | (3.18 | ) | | | (1.54 | ) | | | (0.23 | ) | | | (0.20 | ) | | | (0.18 | ) |
| | | | | | | | | | | | | | | | | | | | |
Net asset value, end of the period | | $ | 23.81 | | | $ | 28.34 | | | $ | 25.51 | | | $ | 20.79 | | | $ | 16.00 | |
| | | | | | | | | | | | | | | | | | | | |
Total return | | | (5.83 | )% | | | 17.68 | %(b) | | | 24.08 | % | | | 31.43 | % | | | (3.48 | )% |
RATIOS TO AVERAGE NET ASSETS: | | | | | | | | | | | | | | | | | | | | |
Net assets, end of the period (000’s) | | $ | 85,387 | | | $ | 268 | | | $ | 12 | | | $ | 2 | | | $ | 1 | |
Net expenses | | | 1.23 | % | | | 1.21 | % | | | 1.19 | % | | | 1.24 | % | | | 1.17 | % |
Gross expenses | | | 1.23 | % | | | 1.21 | % | | | 1.19 | % | | | 1.24 | % | | | 1.17 | % |
Net investment income | | | 1.03 | % | | | 1.07 | %(b) | | | 1.01 | % | | | 1.17 | % | | | 0.90 | % |
Portfolio turnover rate | | | 20 | % | | | 28 | % | | | 24 | % | | | 25 | % | | | 29 | % |
| (a) | Per share net investment income has been calculated using the average shares outstanding during the period. |
| (b) | Includes non-recurring dividends. Without these dividends, net investment income per share would have been $0.27, total return would have been 16.73% and the ratio of net investment income to average net assets would have been 0.96%. |
See accompanying notes to financial statements.
67 |
Notes to Financial Statements
September 30, 2015
1. Organization. Loomis Sayles Funds II (the “Trust”) is organized as a Massachusetts business trust. The Trust is registered under the Investment Company Act of 1940, as amended (the “1940 Act”), as an open-end management investment company. The Declaration of Trust permits the Board of Trustees to authorize the issuance of an unlimited number of shares of the Trust in multiple series. The financial statements for certain funds of the Trust are presented in separate reports. The following funds (individually, a “Fund” and collectively, the “Funds”) are included in this report:
Loomis Sayles Global Equity and Income Fund (the “Global Equity and Income Fund”)
Loomis Sayles Growth Fund (the “Growth Fund”)
Loomis Sayles Value Fund (the “Value Fund”)
Each Fund is a diversified investment company.
Each Fund offers Class A, Class C and Class Y shares. In addition, Growth Fund and Value Fund offer Class N shares and Value Fund offers Admin Class shares. Effective October 12, 2007, Class B shares are no longer offered. Existing Class B shareholders of Growth Fund and Value Fund may continue to reinvest dividends into Class B shares and exchange their Class B shares for Class B shares of other Natixis Funds subject to existing exchange privileges as described in the prospectus.
Class A shares are sold with a maximum front-end sales charge of 5.75%. Class B shares do not pay a front-end sales charge; however, they are charged higher Rule 12b-1 fees, and are subject to a contingent deferred sales charge (“CDSC”) if such shares are redeemed within six years of purchase. After eight years of ownership, Class B shares convert to Class A shares. Class C shares do not pay a front-end sales charge, do not convert to any other class of shares, pay higher Rule 12b-1 fees than Class A shares and may be subject to a CDSC of 1.00% if those shares are redeemed within one year of acquisition, except for reinvested distributions. Class N and Class Y shares do not pay a front-end sales charge, a CDSC or Rule 12b-1 fees. Class N shares are primarily intended for employer-sponsored retirement plans. Class Y shares are intended for institutional investors with a minimum initial investment of $100,000, though some categories of investors are exempted from the minimum investment amount as outlined in the Funds’ prospectus. Admin Class shares do not pay a front-end sales charge or a CDSC, but do pay a Rule 12b-1 fee. Class N and Admin Class shares are offered exclusively through intermediaries.
See Note 14 for changes that take effect subsequent to September 30, 2015.
Most expenses can be directly attributed to a fund. Expenses which cannot be directly attributed to a Fund are generally apportioned based on the relative net assets of each of the funds in Natixis Funds Trust I, Natixis Funds Trust II, Natixis Funds Trust IV, Gateway Trust (“Natixis Funds Trusts”), Loomis Sayles Funds I and Loomis Sayles Funds II (“Loomis Sayles Funds Trusts”). Expenses of a Fund are borne pro rata by the holders of each class of shares, except that each class bears expenses unique to that class (including the Rule 12b-1 service and distribution fees and, for Growth Fund and
| 68
Notes to Financial Statements (continued)
September 30, 2015
Value Fund Class A, Class B, Class C and Admin Class (for Value Fund) collectively, and Class N individually, transfer agent fees). In addition, each class votes as a class only with respect to its own Rule 12b-1 Plan. Shares of each class would receive their pro rata share of the net assets of a Fund if the Fund were liquidated. The Trustees approve separate distributions from net investment income on each class of shares.
2. Significant Accounting Policies. The following is a summary of significant accounting policies consistently followed by each Fund in the preparation of its financial statements. The Funds’ financial statements follow the accounting and reporting guidelines provided for investment companies and are prepared in accordance with accounting principles generally accepted in the United States of America which require the use of management estimates that affect the reported amounts and disclosures in the financial statements. Actual results could differ from those estimates. Management has evaluated the events and transactions subsequent to year-end through the date the financial statements were issued and has determined that there were no material events that would require disclosure in the Funds’ financial statements, except as disclosed in Note 14.
a. Valuation. Fund securities and other investments are valued at market value based on market quotations obtained or determined by independent pricing services recommended by the adviser and approved by the Board of Trustees. Fund securities and other investments for which market quotations are not readily available are valued at fair value as determined in good faith by the adviser pursuant to procedures approved by the Board of Trustees, as described below. Market value is determined as follows:
Listed equity securities (including closed-end investment companies and exchange-traded funds) are valued at the last sale price quoted on the exchange where they are traded most extensively or, if there is no reported sale during the day, the closing bid quotation. Securities traded on the NASDAQ Global Select Market, NASDAQ Global Market and NASDAQ Capital Market are valued at the NASDAQ Official Closing Price (“NOCP”), or if lacking an NOCP, at the most recent bid quotations on the applicable NASDAQ Market. Unlisted equity securities (except unlisted preferred equity securities) are valued at the last sale price quoted in the market where they are traded most extensively or, if there is no reported sale during the day, the closing bid quotation. If there is no last sale price or closing bid quotation available, unlisted equity securities will be valued using evaluated bids furnished by an independent pricing service, if available. In some foreign markets, an official close price and a last sale price may be available from the foreign exchange or market. In those cases, the official close price is used. Debt securities and unlisted preferred equity securities are valued based on evaluated bids furnished to the Fund by an independent pricing service or bid prices obtained from broker-dealers. Senior loans are valued at bid prices supplied by an independent pricing service, if available. Broker-dealer bid prices may be used to value debt and unlisted equity securities and senior loans where an independent pricing service is unable to price a security or where an independent pricing service does not
69 |
Notes to Financial Statements (continued)
September 30, 2015
provide a reliable price for the security. Forward foreign currency contracts are valued utilizing interpolated rates determined based on information provided by an independent pricing service.
Fund securities and other investments for which market quotations are not readily available are valued at fair value as determined in good faith by the adviser pursuant to procedures approved by the Board of Trustees. The Funds may also value securities and other investments at fair value in other circumstances such as when extraordinary events occur after the close of a foreign market but prior to the close of the New York Stock Exchange (“NYSE”). This may include situations relating to a single issuer (such as a declaration of bankruptcy or a delisting of the issuer’s security from the primary market on which it has traded) as well as events affecting the securities markets in general (such as market disruptions or closings and significant fluctuations in U.S. and/or foreign markets). When fair valuing its securities or other investments, the Funds may, among other things, use modeling tools or other processes that may take into account factors such as securities or other market activity and/or significant events that occur after the close of the foreign market and before the time the Fund’s net asset value (“NAV”) is calculated. Fair value pricing may require subjective determinations about the value of a security, and fair values used to determine a Fund’s NAV may differ from quoted or published prices, or from prices that are used by others, for the same securities. In addition, the use of fair value pricing may not always result in adjustments to the prices of securities held by a Fund.
As of September 30, 2015, securities of the funds included in net assets (reflected at absolute value) were fair valued as follows:
| | | | | | | | | | | | | | | | | | | | | | | | |
Fund | | Equity securities1 | | | Percentage of Net Assets | | | Illiquid
securities2 | | | Percentage of Net Assets | | | Other fair valued
securities3 | | | Percentage of Net Assets | |
Global Equity and Income Fund | | $ | 253,092,575 | | | | 20.3 | % | | $ | 1,821,900 | | | | 0.1 | % | | $ | 171,786 | | | | Less than 0.1 | % |
| 1 | Certain foreign equity securities were fair valued pursuant to procedures approved by the Board of Trustees as events occurring after the close of the foreign market were believed to materially affect the value of those securities. |
| 2 | Illiquid securities are deemed to be fair valued pursuant to the Fund’s pricing policies and procedures. |
| 3 | Fair valued by the Fund’s adviser. |
b. Investment Transactions and Related Investment Income. Investment transactions are accounted for on a trade date plus one day basis for daily NAV calculation. However, for financial reporting purposes, investment transactions are reported on trade date. Dividend income is recorded on ex-dividend date, or in the case of certain foreign securities, as soon as a Fund is notified, and interest income is recorded on an accrual basis. Interest income is increased by the accretion of discount and decreased by the amortization of premium. Periodic principal adjustments for inflation-protected
| 70
Notes to Financial Statements (continued)
September 30, 2015
securities are recorded to interest income. In determining net gain or loss on securities sold, the cost of securities has been determined on an identified cost basis. Investment income, non-class specific expenses and realized and unrealized gains and losses are allocated on a pro rata basis to each class based on the relative net assets of each class to the total net assets of the Fund.
c. Foreign Currency Translation. The books and records of the Funds are maintained in U.S. dollars. The values of securities, currencies and other assets and liabilities denominated in currencies other than U.S. dollars are translated into U.S. dollars based upon foreign exchange rates prevailing at the end of the period. Purchases and sales of investment securities, income and expenses are translated into U.S. dollars on the respective dates of such transactions.
Net realized foreign exchange gains or losses arise from sales of foreign currency, changes in exchange rates between the trade and settlement dates on securities transactions and the difference between the amounts of dividends, interest and foreign withholding taxes recorded on the Funds’ books and the U.S. dollar equivalent of the amounts actually received or paid. Net unrealized foreign exchange gains or losses arise from changes in the value of assets and liabilities, other than investment securities, as of the end of the fiscal period, resulting from changes in exchange rates. Net realized foreign exchange gains or losses and the net change in unrealized foreign exchange gains or losses are disclosed in the Statements of Operations.
The values of investment securities are presented at the foreign exchange rates prevailing at the end of the period for financial reporting purposes. Net realized and unrealized gains or losses on investments reported in the Statements of Operations reflect gains or losses resulting from changes in exchange rates and fluctuations which arise due to changes in market prices of investment securities. For federal income tax purposes, a portion of the net realized gain or loss on investments arising from changes in exchange rates, which is reflected in the Statements of Operations, may be characterized as ordinary income and may, if the Funds have net losses, reduce the amount of income available to be distributed by the Funds.
The Funds may use foreign currency exchange contracts to facilitate transactions in foreign-denominated investments. Losses may arise from changes in the value of the foreign currency or if the counterparties do not perform under the contracts’ terms.
d. Forward Foreign Currency Contracts. The Funds may enter into forward foreign currency contracts, including forward foreign cross currency contracts to acquire exposure to foreign currencies or to hedge the Funds’ investments against currency fluctuation. A contract can also be used to offset a previous contract. These contracts involve market risk in excess of the unrealized gain or loss reflected in the Funds’ Statements of Assets and Liabilities. The U.S. dollar value of the currencies a Fund has committed to buy or sell represents the aggregate exposure to each currency the Fund
71 |
Notes to Financial Statements (continued)
September 30, 2015
has acquired or hedged through currency contracts outstanding at period end. Gains or losses are recorded for financial statement purposes as unrealized until settlement date. Contracts are traded over-the-counter directly with a counterparty. Risks may arise upon entering into these contracts from the potential inability of counterparties to meet the terms of their contracts and from unanticipated movements in the value of a foreign currency relative to the U.S. dollar. Certain contracts may require the movement of cash and/or securities as collateral for the Funds’ or counterparty’s net obligations under the contracts.
e. Due to Broker. Transactions and positions in certain forward foreign currency contracts are maintained and cleared by registered U.S. broker/dealers pursuant to customer agreements between a Fund and the various broker/dealers. The due to broker balance in the Statement of Assets and Liabilities for Global Equity and Income Fund represents cash received as collateral for forward foreign currency contracts. In certain circumstances the Fund’s use of cash held at brokers is restricted by regulation or broker mandated limits.
f. When-Issued and Delayed Delivery Transactions. The Funds may enter into when-issued or delayed delivery transactions. When-issued refers to transactions made conditionally because a security, although authorized, has not been issued. Delayed delivery refers to transactions for which delivery or payment will occur at a later date, beyond the normal settlement period. The price of when-issued and delayed delivery securities and the date when the securities will be delivered and paid for are fixed at the time the transaction is negotiated. The security and the obligation to pay for it are recorded by the Funds at the time the commitment is entered into. The value of the security may vary with market fluctuations during the time before the Funds take delivery of the security. No interest accrues to the Funds until the transaction settles.
Delayed delivery transactions include those designated as To Be Announced (“TBAs”) in the Portfolios of Investments. For TBAs, the actual security that will be delivered to fulfill the transaction is not designated at the time of the trade. The security is “to be announced” 48 hours prior to the established trade settlement date. Certain transactions require the Funds or counterparty to post cash and/or securities as collateral for the net mark-to-market exposure to the other party. The Funds cover their net obligations under outstanding delayed delivery commitments by segregating or earmarking cash or securities at the custodian.
Purchases of when-issued or delayed delivery securities may have a similar effect on the Funds’ NAV as if the Funds’ had created a degree of leverage in the portfolio. Risks may arise upon entering into such transactions from the potential inability of counterparties to meet their obligations under the transactions. Additionally, losses may arise due to changes in the value of the underlying securities.
g. Federal and Foreign Income Taxes. The Trust treats each Fund as a separate entity for federal income tax purposes. Each Fund intends to meet the requirements of the
| 72
Notes to Financial Statements (continued)
September 30, 2015
Internal Revenue Code of 1986, as amended, applicable to regulated investment companies, and to distribute to its shareholders substantially all of its net investment income and any net realized capital gains at least annually. Management has performed an analysis of each Fund’s tax positions for the open tax years as of September 30, 2015 and has concluded that no provisions for income tax are required. The Funds’ federal tax returns for the prior three fiscal years remain subject to examination by the Internal Revenue Service. Management is not aware of any events that are reasonably possible to occur in the next twelve months that would result in the amounts of any unrecognized tax benefits significantly increasing or decreasing for the Funds. However, management’s conclusions regarding tax positions taken may be subject to review and adjustment at a later date based on factors including, but not limited to, new tax laws and accounting regulations and interpretations thereof.
A Fund may be subject to foreign withholding taxes on investment income and taxes on capital gains on investments that are accrued and paid based upon the Fund’s understanding of the tax rules and regulations that exist in the countries in which the Fund invests. Foreign withholding taxes on dividend and interest income are reflected on the Statements of Operations as a reduction of investment income, net of amounts eligible to be reclaimed. Dividends and interest receivable on the Statements of Assets and Liabilities are net of foreign withholding taxes. Foreign withholding taxes where reclaims have been or will be filed are reflected on the Statements of Assets and Liabilities as tax reclaims receivable. Capital gains taxes paid are included in net realized gain (loss) on investments in the Statements of Operations. Accrued but unpaid capital gains taxes are reflected as foreign taxes payable on the Statements of Assets and Liabilities, if applicable, and reduce unrealized gains on investments. In the event that realized gains on investments are subsequently offset by realized losses, taxes paid on realized gains may be returned to a Fund. Such amounts, if applicable, are reflected as foreign tax rebates receivable on the Statements of Assets and Liabilities and are recorded as a realized gain when received.
h. Dividends and Distributions to Shareholders. Dividends and distributions are recorded on ex-dividend date. The timing and characterization of certain income and capital gain distributions are determined in accordance with federal tax regulations, which may differ from accounting principles generally accepted in the United States of America. Permanent differences are primarily due to differing treatments for book and tax purposes of items such as foreign currency gains and losses, paydown gains and losses, contingent payment debt instruments, capital gain and return of capital distributions received, deferred Trustees’ fees, convertible bonds, redemption-in-kind, distribution re-designations and premium amortization. Permanent book and tax basis differences relating to shareholder distributions will result in reclassifications to capital accounts reported on the Statements of Assets and Liabilities. Temporary differences between book and tax distributable earnings are primarily due to deferred Trustees’ fees, forward foreign currency contract mark-to-market, wash sales, premium
73 |
Notes to Financial Statements (continued)
September 30, 2015
amortization, contingent payment debt instruments, capital gain tax, convertible bonds and return of capital distributions received. Amounts of income and capital gain available to be distributed on a tax basis are determined annually, and at other times during the Funds’ fiscal year as may be necessary to avoid knowingly declaring and paying a return of capital distribution. Distributions from net investment income and short-term capital gains are considered to be distributed from ordinary income for tax purposes.
The tax characterization of distributions is determined on an annual basis. The tax character of distributions paid to shareholders during the years ended September 30, 2015 and 2014 were as follows:
| | | | | | | | | | | | | | | | | | | | | | | | |
| | | 2015 Distributions Paid From: | | | 2014 Distributions Paid From: | |
Fund | | Ordinary Income | | | Long-Term Capital Gains | | | Total | | | Ordinary Income | | | Long-Term Capital Gains | | | Total | |
Global Equity and Income Fund | | $ | 29,430,584 | | | $ | 43,172,460 | | | $ | 72,603,044 | | | $ | 23,348,919 | | | $ | 11,468,716 | | | $ | 34,817,635 | |
Growth Fund | | | 6,342,015 | | | | — | | | | 6,342,015 | | | | 1,924,183 | | | | — | | | | 1,924,183 | |
Value Fund | | | 56,748,378 | | | | 200,996,242 | | | | 257,744,620 | | | | 23,545,450 | | | | 99,015,045 | | | | 122,560,495 | |
Differences between these amounts and those reported in the Statements of Changes in Net Assets are primarily attributable to different book and tax treatment for short-term capital gains.
As of September 30, 2015, the components of distributable earnings on a tax basis were as follows:
| | | | | | | | | | | | |
| | | Global
Equity and
Income Fund | | | Growth
Fund | | | Value
Fund | |
Undistributed ordinary income | | $ | 11,929,161 | | | $ | 6,222,212 | | | $ | 16,447,285 | |
Undistributed long-term capital gains | | | 57,954,573 | | | | — | | | | 303,190,350 | |
| | | | | | | | | | | | |
Total undistributed earnings | | | 69,883,734 | | | | 6,222,212 | | | | 319,637,635 | |
| | | | | | | | | | | | |
Capital loss carryforward: | | | | | | | | | | | | |
Expires: | | | | | | | | | | | | |
September 30, 2018 | | | — | | | | (18,909,834 | ) | | | — | |
| | | | | | | | | | | | |
Total capital loss carryforward | | | — | | | | (18,909,834 | ) | | | — | |
| | | | | | | | | | | | |
Unrealized appreciation | | | 55,563,732 | | | | 87,245,036 | | | | 164,652,795 | |
| | | | | | | | | | | | |
Total accumulated earnings | | $ | 125,447,466 | | | $ | 74,557,414 | | | $ | 484,290,430 | |
| | | | | | | | | | | | |
Capital loss carryforward utilized in the current year | | $ | — | | | $ | 27,363,638 | | | $ | — | |
| | | | | | | | | | | | |
| 74
Notes to Financial Statements (continued)
September 30, 2015
i. Repurchase Agreements. Each Fund may enter into repurchase agreements, under the terms of a Master Repurchase Agreement, under which each Fund acquires securities as collateral and agrees to resell the securities at an agreed upon time and at an agreed upon price. It is each Fund’s policy that the market value of the collateral for repurchase agreements be at least equal to 102% of the repurchase price, including interest. Certain repurchase agreements are tri-party arrangements whereby the collateral is held in a segregated account for the benefit of the Fund and on behalf of the counterparty. Repurchase agreements could involve certain risks in the event of default or insolvency of the counterparty, including possible delays or restrictions upon a Fund’s ability to dispose of the underlying securities. As of September 30, 2015, each Fund, as applicable, had investments in repurchase agreements for which the value of the related collateral exceeded the value of the repurchase agreement. The gross value of repurchase agreements is included in the Statements of Assets and Liabilities for financial reporting purposes.
j. Securities Lending. The Funds have entered into an agreement with State Street Bank and Trust Company (“State Street Bank”), as agent of the Funds, to lend securities to certain designated borrowers. The loans are collateralized with cash or securities in an amount equal to at least 105% or 102% of the market value (including accrued interest) of the loaned international or domestic securities, respectively, when the loan is initiated. Thereafter, the value of the collateral must remain at least 102% of the market value (including accrued interest) of loaned securities for U.S. equities and U.S. corporate debt; at least 105% of the market value (including accrued interest) of loaned securities for non-U.S. equities; and at least 100% of the market value (including accrued interest) of loaned securities for U.S. Government securities, sovereign debt issued by non-U.S. Governments and non-U.S. corporate debt. In the event that the market value of the collateral falls below the required percentages described above, the borrower will deliver additional collateral on the next business day. As with other extensions of credit, the Funds may bear the risk of loss with respect to the investment of the collateral. The Funds invest cash collateral in short-term investments, a portion of the income from which is remitted to the borrowers and the remainder allocated between the Funds and State Street Bank as lending agent.
For the year ended September 30, 2015, none of the Funds had loaned securities under this agreement.
k. Indemnifications. Under the Trust’s organizational documents, its officers and Trustees are indemnified against certain liabilities arising out of the performance of their duties to the Funds. Additionally, in the normal course of business, the Funds enter into contracts with service providers that contain general indemnification clauses. The Funds’ maximum exposure under these arrangements is unknown as this would involve future claims that may be made against the Funds that have not yet occurred. However, based on experience, the Funds expect the risk of loss to be remote.
75 |
Notes to Financial Statements (continued)
September 30, 2015
3. Fair Value Measurements. In accordance with accounting standards related to fair value measurements and disclosures, the Funds have categorized the inputs utilized in determining the value of each Fund’s assets or liabilities. These inputs are summarized in the three broad levels listed below:
| | • | | Level 1 – quoted prices in active markets for identical assets or liabilities; |
| | • | | Level 2 – prices determined using other significant inputs that are observable either directly, or indirectly through corroboration with observable market data (which could include quoted prices for similar assets or liabilities, interest rates, credit risk, etc.); and |
| | • | | Level 3 – prices determined using significant unobservable inputs when quoted prices or observable inputs are unavailable such as when there is little or no market activity for an asset or liability (unobservable inputs reflect each Fund’s own assumptions in determining the fair value of assets or liabilities and would be based on the best information available). |
The inputs or methodology used for valuing securities are not necessarily an indication of the risk associated with investing in those securities.
The Fund’s pricing policies and procedures are recommended by the adviser and approved by the Board of Trustees. Debt securities are valued based on evaluated bids furnished to the Fund by an independent pricing service. Broker-dealer bid prices may be used if an independent pricing service either is unable to price a security or does not provide a reliable price for a security. Broker-dealer bid prices for which the Fund does not have knowledge of the inputs used by the broker-dealer are categorized in Level 3. All security prices, including those obtained from an independent pricing service and broker-dealer bid prices, are reviewed on a daily basis by the adviser, subject to oversight by Fund management and the Board of Trustees. If the adviser, in good faith, believes that the price provided by an independent pricing service is unreliable, broker-dealer bid prices may be used until the price provided by the independent pricing service is considered to be reliable. Reliability of all security prices, including those obtained from an independent pricing service and broker-dealer bid prices, is tested in a variety of ways, including comparison to recent transaction prices and daily fluctuations, amongst other validation procedures in place. Securities for which market quotations are not readily available are valued at fair value as determined in good faith by the Fund’s adviser pursuant to procedures approved by the Board of Trustees. Fair valued securities may be categorized in Level 3.
| 76
Notes to Financial Statements (continued)
September 30, 2015
The following is a summary of the inputs used to value the Funds’ investments as of September 30, 2015, at value:
Global Equity and Income Fund
Asset Valuation Inputs
| | | | | | | | | | | | | | | | |
Description | | Level 1 | | | Level 2 | | | Level 3 | | | Total | |
Common Stocks | | | | | | | | | | | | | | | | |
Belgium | | $ | — | | | $ | 18,721,113 | | | $ | — | | | $ | 18,721,113 | |
China | | | 20,007,518 | | | | 13,313,947 | | | | — | | | | 33,321,465 | |
Denmark | | | — | | | | 15,060,105 | | | | — | | | | 15,060,105 | |
France | | | — | | | | 18,006,952 | | | | — | | | | 18,006,952 | |
Germany | | | — | | | | 4,244,166 | | | | — | | | | 4,244,166 | |
Hong Kong | | | — | | | | 17,048,044 | | | | — | | | | 17,048,044 | |
India | | | 14,232,396 | | | | 14,103,053 | | | | — | | | | 28,335,449 | |
Italy | | | — | | | | 9,164,625 | | | | — | | | | 9,164,625 | |
Japan | | | — | | | | 38,736,832 | | | | — | | | | 38,736,832 | |
Netherlands | | | — | | | | 18,987,413 | | | | — | | | | 18,987,413 | |
Philippines | | | — | | | | 9,056,184 | | | | — | | | | 9,056,184 | |
Sweden | | | — | | | | 20,392,217 | | | | — | | | | 20,392,217 | |
Switzerland | | | —
| | | | 23,211,471 | | | | — | | | | 23,211,471 | |
United Kingdom | | | — | | | | 33,046,453 | | | | — | | | | 33,046,453 | |
All Other Common Stocks(a) | | | 479,889,428 | | | | — | | | | — | | | | 479,889,428 | |
| | | | | | | | | | | | | | | | |
Total Common Stocks | | | 514,129,342 | | | | 253,092,575 | | | | — | | | | 767,221,917 | |
| | | | | | | | | | | | | | | | |
Bonds and Notes | | | | | | | | | | | | | | | | |
Non-Convertible Bonds | | | | | | | | | | | | | | | | |
United States | | | 27,435 | | | | 226,670,659 | | | | 171,786 | (b) | | | 226,869,880 | |
All Other Non-Convertible Bonds(a) | | | — | | | | 164,002,133 | | | | — | | | | 164,002,133 | |
| | | | | | | | | | | | | | | | |
Total Non-Convertible Bonds | | | 27,435 | | | | 390,672,792 | | | | 171,786 | | | | 390,872,013 | |
| | | | | | | | | | | | | | | | |
Convertible Bonds(a) | | | — | | | | 8,526,055 | | | | — | | | | 8,526,055 | |
Municipals(a) | | | — | | | | 488,491 | | | | — | | | | 488,491 | |
| | | | | | | | | | | | | | | | |
Total Bonds and Notes | | | 27,435 | | | | 399,687,338 | | | | 171,786 | | | | 399,886,559 | |
| | | | | | | | | | | | | | | | |
Senior Loans(a) | | | — | | | | 4,360,499 | | | | — | | | | 4,360,499 | |
Preferred Stocks | | | | | | | | | | | | | | | | |
Convertible Preferred Stocks(a) | | | 86,339 | | | | 337,660 | | | | — | | | | 423,999 | |
Non-Convertible Preferred Stock(a) | | | 342,076 | | | | — | | | | — | | | | 342,076 | |
| | | | | | | | | | | | | | | | |
Total Preferred Stocks | | | 428,415 | | | | 337,660 | | | | — | | | | 766,075 | |
| | | | | | | | | | | | | | | | |
Short-Term Investments | | | — | | | | 58,779,905 | | | | — | | | | 58,779,905 | |
| | | | | | | | | | | | | | | | |
Total Investments | | | 514,585,192 | | | | 716,257,977 | | | | 171,786 | | | | 1,231,014,955 | |
| | | | | | | | | | | | | | | | |
77 |
Notes to Financial Statements (continued)
September 30, 2015
Global Equity and Income Fund (continued)
Asset Valuation Inputs (continued)
| | | | | | | | | | | | | | | | |
Description | | Level 1 | | | Level 2 | | | Level 3 | | | Total | |
Forward Foreign Currency Contracts (unrealized appreciation) | | $ | — | | | $ | 521,042 | | | $ | — | | | $ | 521,042 | |
| | | | | | | | | | | | | | | | |
Total | | $ | 514,585,192 | | | $ | 716,779,019 | | | $ | 171,786 | | | $ | 1,231,535,997 | |
| | | | | | | | | | | | | | | | |
Liability Valuation Inputs | | | | | | | | | | | | | | | | |
Description | | Level 1 | | | Level 2 | | | Level 3 | | | Total | |
Forward Foreign Currency Contracts (unrealized depreciation) | | $ | — | | | $ | (302,245 | ) | | $ | — | | | $ | (302,245 | ) |
| | | | | | | | | | | | | | | | |
| (a) | Details of the major categories of the Fund’s investments are reflected within the Portfolio of Investments. |
| (b) | Fair valued by the Fund’s adviser. |
A preferred stock valued at $45,080 was transferred from Level 1 to Level 2 during the period ended September 30, 2015. At September 30, 2014, this security was valued at the last sale price. At September 30, 2015, this security was valued on the basis of evaluated bids furnished to the Fund by an independent pricing service.
All transfers are recognized as of the beginning of the reporting period.
Growth Fund
Asset Valuation Inputs
| | | | | | | | | | | | | | | | |
Description | | Level 1 | | | Level 2 | | | Level 3 | | | Total | |
Common Stocks(a) | | $ | 1,319,282,076 | | | $ | — | | | $ | — | | | $ | 1,319,282,076 | |
Short-Term Investments | | | — | | | | 54,314,835 | | | | — | | | | 54,314,835 | |
| | | | | | | | | | | | | | | | |
Total | | $ | 1,319,282,076 | | | $ | 54,314,835 | | | $ | — | | | $ | 1,373,596,911 | |
| | | | | | | | | | | | | | | | |
| (a) | Details of the major categories of the Fund’s investments are reflected within the Portfolio of Investments. |
For the year ended September 30, 2015, there were no transfers among Levels 1, 2 and 3.
| 78
Notes to Financial Statements (continued)
September 30, 2015
Value Fund
Asset Valuation Inputs
| | | | | | | | | | | | | | | | |
Description | | Level 1 | | | Level 2 | | | Level 3 | | | Total | |
Common Stocks(a) | | $ | 1,433,312,248 | | | $ | — | | | $ | — | | | $ | 1,433,312,248 | |
Short-Term Investments | | | — | | | | 17,234,812 | | | | — | | | | 17,234,812 | |
| | | | | | | | | | | | | | | | |
Total | | $ | 1,433,312,248 | | | $ | 17,234,812 | | | $ | — | | | $ | 1,450,547,060 | |
| | | | | | | | | | | | | | | | |
| (a) | Details of the major categories of the Fund’s investments are reflected within the Portfolio of Investments. |
For the year ended September 30, 2015, there were no transfers among Levels 1, 2 and 3.
The following is a reconciliation of Level 3 investments for which significant unobservable inputs were used to determine fair value as of September 30, 2014 and/or September 30, 2015:
Global Equity and Income Fund
Asset Valuation Inputs
| | | | | | | | | | | | | | | | | | | | |
Investments in Securities | | Balance as of
September 30,
2014 | | | Accrued
Discounts
(Premiums) | | | Realized
Gain
(Loss) | | | Change in
Unrealized
Appreciation
(Depreciation) | | | Purchases | |
Bonds and Notes | | | | | | | | | | | | | | | | | | | | |
Non-Convertible Bonds | | | | | | | | | | | | | | | | | | | | |
Korea | | $ | 4,567,994 | | | $ | — | | | $ | 18,693 | | | $ | (43,564 | ) | | $ | — | |
United States | | | 2,546,713 | | | | 1,992 | | | | 707 | | | | (2,076 | ) | | | — | |
| | | | | | | | | | | | | | | | | | | | |
Total | | $ | 7,114,707 | | | $ | 1,992 | | | $ | 19,400 | | | $ | (45,640 | ) | | $ | — | |
| | | | | | | | | | | | | | | | | | | | |
| | | | | |
Investments in Securities | | Sales | | | Transfers
into Level 3 | | | Transfers
out of
Level 3 | | | Balance as of
September 30,
2015 | | | Change in
Unrealized
Appreciation
(Depreciation)
from
Investments
Still Held at
September 30,
2015 | |
Bonds and Notes | | | | | | | | | | | | | | | | | | | | |
Non-Convertible Bonds | | | | | | | | | | | | | | | | | | | | |
Korea | | $ | (911,424 | ) | | $ | — | | | $ | (3,631,699 | ) | | $ | — | | | $ | — | |
United States | | | (5,145 | ) | | | — | | | | (2,370,405 | ) | | | 171,786 | | | | (1,278 | ) |
| | | | | | | | | | | | | | | | | | | | |
Total | | $ | (916,569 | ) | | $ | — | | | $ | (6,002,104 | ) | | $ | 171,786 | | | $ | (1,278 | ) |
| | | | | | | | | | | | | | | | | | | | |
79 |
Notes to Financial Statements (continued)
September 30, 2015
Debt securities valued at $6,002,104 were transferred from Level 3 to Level 2 during the period ended September 30, 2015. At September 30, 2014, these securities were valued using broker-dealer bid prices based on inputs unobservable to the Fund as an independent pricing service was unable to price the securities. At September 30, 2015, these securities were valued on the basis of evaluated bids furnished to the Fund by an independent pricing service in accordance with the Fund’s valuation policies.
All transfers are recognized as of the beginning of the reporting period.
4. Derivatives. Derivative instruments are defined as financial instruments whose value and performance are based on the value and performance of an underlying asset, reference rate or index. Derivative instruments that Global Equity and Income Fund used during the period include forward foreign currency contracts.
Global Equity and Income Fund is subject to the risk that changes in foreign currency exchange rates will have an unfavorable effect on the value of Fund assets denominated in foreign currencies. The Fund may enter into forward foreign currency contracts for hedging purposes to protect the value of the Fund’s holdings of foreign securities. The Fund may also use forward foreign currency contracts to gain exposure to foreign currencies, regardless of whether securities denominated in such currencies are held in the Fund. During the year ended September 30, 2015, the Fund engaged in forward foreign currency transactions for hedging purposes and to gain exposure to foreign currencies.
The following is a summary of derivative instruments for Global Equity and Income Fund as of September 30, 2015, as reflected within the Statements of Assets and Liabilities
| | | | |
Assets | | Unrealized
appreciation on
forward foreign
currency contracts | |
Over-the-counter asset derivatives | | | | |
Foreign exchange contracts | | | $ 521,042 | |
| |
Liabilities | | Unrealized
depreciation on
forward foreign
currency contracts | |
Over-the-counter liability derivatives | | | | |
Foreign exchange contracts | | | $(302,245) | |
| 80
Notes to Financial Statements (continued)
September 30, 2015
Transactions in derivative instruments for Global Equity and Income Fund during the year ended September 30, 2015 as reflected within the Statements of Operations were as follows:
| | | | |
Net Realized Gain on: | | Foreign currency transactions1 | |
Foreign exchange contracts | | $ | 2,983,251 | |
| |
Net Change in Unrealized
Appreciation (Depreciation) on: | | Foreign currency translations1 | |
Foreign exchange contracts | | $ | (464,262 | ) |
| 1 | Represents realized gain and change in unrealized appreciation (depreciation), respectively, for forward foreign currency contracts during the period. Does not include other foreign currency gains or losses included in the Statements of Operations. |
As the Fund values its derivatives at fair value and recognizes changes in fair value through the Statement of Operations, it does not qualify for hedge accounting under authoritative guidance for derivative instruments. The Fund’s investments in derivatives may represent an economic hedge; however, they are considered to be non-hedge transactions for the purpose of these disclosures.
The volume of forward foreign currency contract activity, as a percentage of net assets, for Global Equity and Income Fund, based on gross month-end notional amounts outstanding during the period, including long and short positions at absolute value, was as follows for the year ended September 30, 2015:
| | | | |
Global Equity and Income Fund | | Forwards | |
Average Notional Amount Outstanding | | | 6.43 | % |
Highest Notional Amount Outstanding | | | 7.62 | % |
Lowest Notional Amount Outstanding | | | 5.36 | % |
Notional Amount Outstanding as of September 30, 2015 | | | 6.63 | % |
Notional amounts outstanding at the end of the prior period are included in the average notional amount outstanding.
Unrealized gain and/or loss on open forwards is recorded in the Statements of Assets and Liabilities. The aggregate notional values of forward contracts are not recorded in the Statements of Assets and Liabilities, and therefore are not included in the Fund’s net assets.
Global Equity and Income Fund enters into over-the-counter derivatives, including forward foreign currency contracts, pursuant to International Swaps and Derivatives Association, Inc. (“ISDA”) agreements negotiated between the Fund and its counterparties. ISDA agreements typically contain, among other things, terms for posting of collateral and master netting provisions in the event of a default or other termination event. Collateral is posted by the Fund or the counterparty to the extent of
81 |
Notes to Financial Statements (continued)
September 30, 2015
the net mark-to-market exposure to the other party of all open contracts under the agreement, subject to minimum transfer requirements. Master netting provisions allow the Fund and the counterparty, in the event of a default or other termination event, to offset amounts owed by each related to derivative contracts, including any posted collateral, to one net amount payable by either the Fund or the counterparty. The Fund’s ISDA agreements typically contain provisions that allow a counterparty to terminate open contracts early if the net asset value of the Fund declines beyond a certain threshold. For financial reporting purposes, the Fund does not offset derivative assets and liabilities, and any related collateral received or pledged, on the Statements of Assets and Liabilities.
As of September 30, 2015, gross amounts of over-the-counter derivative assets and liabilities not offset in the Statements of Assets and Liabilities and the related net amounts after taking into account master netting arrangements for Global Equity and Income Fund, by counterparty, are as follows:
| | | | | | | | | | | | | | | | | | | | |
Counterparty | | Gross Amounts of
Assets | | | Offset
Amount | | | Net Asset
Balance | | | Collateral
(Received)/
Pledged | | | Net
Amount | |
Citibank N.A. | | $ | 255,746 | | | $ | — | | | $ | 255,746 | | | $ | (255,746 | ) | | $ | — | |
Credit Suisse International | | | 193,463 | | | | (193,463 | ) | | | — | | | | — | | | | — | |
UBS AG | | | 71,833 | | | | (10,308 | ) | | | 61,525 | | | | — | | | | 61,525 | |
| | | | | | | | | | | | | | | | | | | | |
| | $ | 521,042 | | | $ | (203,771 | ) | | $ | 317,271 | | | $ | (255,746 | ) | | $ | 61,525 | |
| | | | | | | | | | | | | | | | | | | | |
| | | | | |
Counterparty | | Gross Amounts of
Liabilities | | | Offset
Amount | | | Net
Liability
Balance | | | Collateral
(Received)/
Pledged | | | Net
Amount | |
Credit Suisse International | | $ | (194,126 | ) | | $ | 193,463 | | | $ | (663 | ) | | $ | — | | | $ | (663 | ) |
Morgan Stanley & Co. | | | (97,811 | ) | | | — | | | | (97,811 | ) | | | 97,811 | | | | — | |
UBS AG | | | (10,308 | ) | | | 10,308 | | | | — | | | | — | | | | — | |
| | | | | | | | | | | | | | | | | | | | |
| | $ | (302,245 | ) | | $ | 203,771 | | | $ | (98,474 | ) | | $ | 97,811 | | | $ | (663 | ) |
| | | | | | | | | | | | | | | | | | | | |
The actual collateral received or pledged, if any, may exceed the amounts shown in the table due to overcollateralization. Timing differences may exist between when contracts under the ISDA agreements are marked-to-market and when collateral moves. The ISDA agreements include tri-party control agreements under which collateral is held for the benefit of the secured party at a third party custodian, State Street Bank.
Counterparty risk is managed based on policies and procedures established by the Fund’s adviser. Such policies and procedures may include, but are not limited to,
| 82
Notes to Financial Statements (continued)
September 30, 2015
minimum counterparty credit rating requirements, monitoring of counterparty credit default swap spreads and posting of collateral. The Fund’s risk of loss from counterparty credit risk on over-the-counter derivatives is generally limited to the Fund’s aggregated unrealized gains and the amount of any collateral pledged to the counterparty, which may be offset by any collateral posted to the Fund by the counterparty. ISDA master agreements can help to manage counterparty risk by specifying collateral posting arrangements at pre-arranged exposure levels. Under these ISDA agreements, collateral is routinely transferred if the total net exposure in respect of certain transactions, net of existing collateral already in place, exceeds a specified amount (typically $250,000, depending on the counterparty). With exchange-traded derivatives, there is minimal counterparty credit risk to the Fund because the exchange’s clearinghouse, as counterparty to these instruments, stands between the buyer and the seller of the contract. Credit risk still exists in exchange-traded derivatives with respect to initial and variation margin that is held in a broker’s customer accounts. While brokers are required to segregate customer margin from their own assets, in the event that a broker becomes insolvent or goes into bankruptcy and at that time there is a shortfall in the aggregate amount of margin held by the broker for all its clients, U.S. bankruptcy laws will typically allocate that shortfall on a pro rata basis across all of the broker’s customers, potentially resulting in losses to the Fund. Based on balances reflected on the Fund’s Statement of Assets and Liabilities, the following table shows (i) the maximum amount of loss due to credit risk that, based on the gross fair value of the financial instrument, the Fund would incur if parties to the relevant financial instruments failed completely to perform according to the terms of the contracts and the collateral or other security, if any, for the amount due proved to be of no value to the Fund, and (ii) the amount of loss that the Fund would incur after taking into account master netting provisions pursuant to ISDA agreements, as of September 30, 2015:
| | | | |
Maximum Amount of Loss - Gross | | Maximum Amount of Loss - Net | |
| $720,071 | | $ | 162,743 | |
These amounts include cash received as collateral for Global Equity and Income Fund of $270,000.
5. Purchases and Sales of Securities. For the year ended September 30, 2015, purchases and sales of securities (excluding short-term investments and U.S. Government/Agency securities and including paydowns) were as follows:
| | | | | | | | |
Fund | | Purchases | | | Sales | |
Global Equity and Income Fund | | $ | 524,990,285 | | | $ | 543,011,136 | |
Growth Fund | | | 505,227,282 | | | | 304,720,520 | |
Value Fund | | | 375,837,194 | | | | 1,108,114,632 | |
83 |
Notes to Financial Statements (continued)
September 30, 2015
For the year ended September 30, 2015, purchases and sales of U.S. Government/Agency securities by the Global Equity and Income Fund were $59,748,527 and $57,172,398, respectively.
6. Management Fees and Other Transactions with Affiliates.
a. Management Fees. Loomis, Sayles & Company, L.P. (“Loomis Sayles”) serves as investment adviser to each Fund. Separate management agreements for each Fund in effect for the year ended September 30, 2015, provided for fees at the following annual percentage rates of each Fund’s average daily net assets:
| | | | | | | | |
| | | Percentage of
Average
Daily Net Assets | |
Fund | | First $2 billion | | | Over $2 billion | |
Global Equity and Income Fund | | | 0.75 | % | | | 0.73 | % |
Growth Fund | | | 0.50 | % | | | 0.50 | % |
Value Fund | | | 0.50 | % | | | 0.50 | % |
Loomis Sayles has given binding undertakings to the Funds to waive management fees and/or reimburse certain expenses to limit the Funds’ operating expenses, exclusive of acquired fund fees and expenses, brokerage expenses, interest expense, taxes, organizational and extraordinary expenses such as litigation and indemnification expenses. These undertakings are in effect until January 31, 2016, may be terminated before then only with the consent of the Funds’ Board of Trustees and are reevaluated on an annual basis. Management fees payable, as reflected on the Statements of Assets and Liabilities, is net of waivers and/or expense reimbursements, if any, pursuant to these undertakings.
For the year ended September 30, 2015, the expense limits as a percentage of average daily net assets under the expense limitation agreements were as follows:
| | | | | | | | | | | | | | | | | | | | | | | | |
| | | Expense Limit as a Percentage of Average
Daily Net Assets | |
Fund | | Class A | | | Class B | | | Class C | | | Class N | | | Class Y | | | Admin
Class | |
Global Equity and Income Fund | | | 1.25 | % | | | — | | | | 2.00 | % | | | — | | | | 1.00 | % | | | — | |
Growth Fund | | | 1.25 | % | | | 2.00 | % | | | 2.00 | % | | | 0.95 | % | | | 1.00 | % | | | — | |
Value Fund | | | 1.10 | % | | | 1.85 | % | | | 1.85 | % | | | 0.80 | % | | | 0.85 | % | | | 1.35 | % |
Loomis Sayles shall be permitted to recover expenses it has borne under the expense limitation agreements (whether through waiver of its management fees or otherwise) on a class by class basis in later periods to the extent the annual operating expenses of a class fall below a class’ expense limits, provided, however, that a class is not obligated
| 84
Notes to Financial Statements (continued)
September 30, 2015
to pay such waived/reimbursed fees or expenses more than one year after the end of the fiscal year in which the fees or expenses were waived/reimbursed.
For the year ended September 30, 2015, the management fees and waivers of management fees for each Fund were as follows:
| | | | | | | | | | | | | | | | | | | | |
Fund | | Gross
Management
Fees | | | Waivers of
Management
Fees | | | Net
Management
Fees | | | Percentage of
Average
Daily Net Assets | |
| | | | | Gross | | | Net | |
Global Equity and Income Fund | | $ | 9,385,904 | | | $ | — | | | $ | 9,385,904 | | | | 0.75 | % | | | 0.75 | % |
Growth Fund | | | 5,802,901 | | | | — | | | | 5,802,901 | | | | 0.50 | % | | | 0.50 | % |
Value Fund | | | 9,462,497 | | | | — | | | | 9,462,497 | | | | 0.50 | % | | | 0.50 | % |
No expenses were recovered for any of the Funds during the year ended September 30, 2015 under the terms of the expense agreements.
Certain officers and employees of Loomis Sayles are also officers or Trustees of the Trust. Loomis Sayles’ general partner is indirectly owned by Natixis Global Asset Management, L.P. (“Natixis US”), which is part of Natixis Global Asset Management, an international asset management group based in Paris, France.
b. Service and Distribution Fees. NGAM Distribution, L.P. (“NGAM Distribution”), which is a wholly-owned subsidiary of Natixis US, has entered into a distribution agreement with the Trust. Pursuant to this agreement, NGAM Distribution serves as principal underwriter of the Funds of the Trust.
Pursuant to Rule 12b-1 under the 1940 Act, the Trust has adopted a Service Plan relating to each Fund’s Class A shares (the “Class A Plans”), a Distribution and Service Plan relating to each Fund’s Class B (if applicable) and Class C shares (the “Class B and Class C Plans”), and Value Fund has adopted a Distribution Plan relating to its Admin Class shares (the “Admin Class Plan”).
Under the Class A Plans, each Fund pays NGAM Distribution a monthly service fee at an annual rate not to exceed 0.25% of the average daily net assets attributable to the Fund’s Class A shares, as reimbursement for expenses incurred by NGAM Distribution in providing personal services to investors in Class A shares and/or the maintenance of shareholder accounts.
Under the Class B (if applicable) and Class C Plans, each Fund pays NGAM Distribution a monthly service fee at an annual rate not to exceed 0.25% of the average daily net assets attributable to the Fund’s Class B (if applicable) and Class C shares, as compensation for services provided by NGAM Distribution in providing personal services to investors in Class B (if applicable) and Class C shares and/or the maintenance of shareholder accounts.
85 |
Notes to Financial Statements (continued)
September 30, 2015
Also under the Class B (if applicable) and Class C Plans, each Fund pays NGAM Distribution a monthly distribution fee at an annual rate of 0.75% of the average daily net assets attributable to the Funds’ Class B (if applicable) and Class C shares, as compensation for services provided by NGAM Distribution in connection with the marketing or sale of Class B (if applicable) and Class C shares.
Under the Admin Class Plan, Value Fund pays NGAM Distribution a monthly distribution fee at an annual rate not to exceed 0.25% of the average daily net assets attributable to the Fund’s Admin Class shares, as compensation for services provided by NGAM Distribution in connection with the marketing or sale of Admin Class shares or for payments made by NGAM Distribution to securities dealers or other financial intermediaries as commissions, asset-based sales charges or other compensation with respect to the sale of Admin Class shares, or for providing personal services to investors and/or the maintenance of shareholder accounts.
In addition, the Admin Class shares of Value Fund may pay NGAM Distribution an administrative service fee, at an annual rate not to exceed 0.25% of the average daily net assets attributable to Admin Class shares. These fees are subsequently paid to securities dealers or financial intermediaries for providing personal services and/or account maintenance for their customers who hold such shares.
For the year ended September 30, 2015, the service and distribution fees for each Fund were as follows:
| | | | | | | | | | | | | | | | | | | | | | | | | | | | |
| | | Service Fees | | | Distribution Fees | |
Fund | | Class A | | | Class B | | | Class C | | | Admin
Class | | | Class B | | | Class C | | | Admin
Class | |
Global Equity and Income Fund | | $ | 611,000 | | | $ | — | | | $ | 962,202 | | | $ | — | | | $ | — | | | $ | 2,886,606 | | | $ | — | |
Growth Fund | | | 205,806 | | | | 522 | | | | 95,125 | | | | — | | | | 1,566 | | | | 285,374 | | | | — | |
Value Fund | | | 746,244 | | | | 714 | | | | 42,852 | | | | 48,927 | | | | 2,141 | | | | 128,555 | | | | 48,928 | |
c. Administrative Fees. NGAM Advisors, L.P. (“NGAM Advisors”) provides certain administrative services for the Funds and contracts with State Street Bank to serve as sub-administrator. NGAM Advisors is a wholly-owned subsidiary of Natixis US. Pursuant to an agreement among Natixis Funds Trusts, Loomis Sayles Funds Trusts and NGAM Advisors, each Fund pays NGAM Advisors monthly its pro rata portion of fees equal to an annual rate of 0.0575% of the first $15 billion of the average daily net assets of the Natixis Funds Trusts and Loomis Sayles Funds Trusts, 0.0500% of the next $15 billion, 0.0400% of the next $30 billion, 0.0350% of the next $30 billion and 0.0325% of such assets in excess of $90 billion, subject to an annual aggregate minimum fee for the Natixis Funds Trusts and Loomis Sayles Funds Trusts of $10 million, which is reevaluated on an annual basis.
| 86
Notes to Financial Statements (continued)
September 30, 2015
For the year ended September 30, 2015, the administrative fees for each Fund were as follows:
| | | | |
Fund | | Administrative Fees | |
Global Equity and Income Fund | | $ | 533,866 | |
Growth Fund | | | 495,189 | |
Value Fund | | | 807,293 | |
d. Sub-Transfer Agent Fees. NGAM Distribution has entered into agreements, which include servicing agreements, with financial intermediaries that provide recordkeeping, processing, shareholder communications and other services to customers of the intermediaries that hold positions in the Funds and has agreed to compensate the intermediaries for providing those services. Intermediaries transact with the Funds primarily through the use of omnibus accounts on behalf of their customers who hold positions in the Funds. These services would have been provided by the Funds’ transfer agent and other service providers if the shareholders’ accounts were maintained directly at the Funds’ transfer agent. Accordingly, the Funds have agreed to reimburse NGAM Distribution for all or a portion of the servicing fees paid to these intermediaries. The reimbursement amounts (sub-transfer agent fees) paid to NGAM Distribution are subject to a current per-account equivalent fee limit approved by the Funds’ Board, which is based on fees for similar services paid to the Funds’ transfer agent and other service providers. Class N shares do not bear such expenses.
For the year ended September 30, 2015, the sub-transfer agent fees (which are reflected in transfer agent fees and expenses in the Statements of Operations) for each Fund were as follows:
| | | | |
Fund | | Sub-Transfer Agent Fees | |
Global Equity and Income Fund | | $ | 989,949 | |
Growth Fund | | | 950,196 | |
Value Fund | | | 1,541,449 | |
As of September 30, 2015, the Funds owe NGAM Distribution the following reimbursements for sub-transfer agent fees (which are reflected in the Statements of Assets and Liabilities as payable to distributor):
| | | | |
Fund | | Reimbursements of
Sub-Transfer Agent Fees | |
Global Equity and Income Fund | | $ | 11,829 | |
Growth Fund | | | 12,970 | |
Value Fund | | | 18,255 | |
Sub-transfer agent fees attributable to Class A, Class B, Class C, Class Y, and Admin Class are allocated on a pro rata basis to each class based on the relative net assets of each class to the total net assets of those classes.
87 |
Notes to Financial Statements (continued)
September 30, 2015
e. Commissions. Commissions (including CDSCs) on Fund shares retained by NGAM Distribution during the year ended September 30, 2015, were as follows:
| | | | |
Fund | | Commissions | |
Global Equity and Income Fund | | $ | 109,919 | |
Growth Fund | | | 25,373 | |
Value Fund | | | 9,085 | |
f. Trustees Fees and Expenses. The Trust does not pay any compensation directly to its officers or Trustees who are directors, officers or employees of NGAM Advisors, NGAM Distribution, Natixis US or their affiliates. The Chairperson of the Board of Trustees receives a retainer fee at the annual rate of $300,000. The Chairperson does not receive any meeting attendance fees for Board of Trustees meetings or committee meetings that she attends. Each Independent Trustee (other than the Chairperson) receives, in the aggregate, a retainer fee at the annual rate of $130,000. Each Independent Trustee also receives a meeting attendance fee of $10,000 for each meeting of the Board of Trustees that he or she attends in person and $5,000 for each meeting of the Board of Trustees that he or she attends telephonically. In addition, the chairperson of the Contract Review Committee and the chairperson of the Audit Committee each receive an additional retainer fee at the annual rate of $17,500. The chairperson of the Governance Committee receives an additional retainer fee at the annual rate of $5,000. Each Contract Review Committee member is compensated $6,000 for each Committee meeting that he or she attends in person and $3,000 for each meeting that he or she attends telephonically. Each Audit Committee member is compensated $6,000 for each Committee meeting that he or she attends in person and $3,000 for each meeting that he or she attends telephonically. These fees are allocated among the funds in the Natixis Funds Trusts, Loomis Sayles Funds Trusts and Gateway Trust based on a formula that takes into account, among other factors, the relative net assets of each fund. Trustees are reimbursed for travel expenses in connection with attendance at meetings.
A deferred compensation plan (the “Plan”) is available to the Trustees on a voluntary basis. Deferred amounts remain in the Funds until distributed in accordance with the provisions of the Plan. The value of a participating Trustee’s deferral account is based on theoretical investments of deferred amounts, on the normal payment dates, in certain funds of the Natixis Funds Trusts and Loomis Sayles Funds Trusts as designated by the participating Trustees. Changes in the value of participants’ deferral accounts are allocated pro rata among the funds in the Natixis Funds Trusts and Loomis Sayles Funds Trusts, and are normally reflected as Trustees’ fees and expenses in the Statements of Operations. The portions of the accrued obligations allocated to the Funds under the Plan are reflected as Deferred Trustees’ fees in the Statements of Assets and Liabilities.
| 88
Notes to Financial Statements (continued)
September 30, 2015
g. Affiliated Ownership. As of September 30, 2015, Loomis Sayles Funded Pension Plan and Trust (“Pension Plan”) and Loomis Sayles Employees’ Profit Sharing Retirement Plan (“Retirement Plan”) held shares of the Funds representing the following percentages of the Fund’s net assets:
| | | | | | | | | | | | |
Fund | | Pension Plan | | | Retirement Plan | | | Total Affiliated
Ownership | |
Global Equity and Income Fund | | | 1.27 | % | | | 1.14 | % | | | 2.41 | % |
Growth Fund | | | 0.92 | % | | | 2.19 | % | | | 3.11 | % |
Value Fund | | | 0.94 | % | | | 1.59 | % | | | 2.53 | % |
Additionally, as of September 30, 2015 NGAM Advisors held shares of Growth Fund representing less than 0.01% of the Fund’s net assets.
Investment activities of affiliated shareholders could have material impacts on the Funds.
h. Reimbursement of Transfer Agent Fees and Expenses. NGAM Advisors has given a binding contractual undertaking to the Growth Fund to reimburse any and all transfer agency expenses for the Fund’s Class N shares. This undertaking is in effect through January 31, 2016 and is not subject to recovery under the expense limitation agreement described above.
For the year ended September 30, 2015, NGAM Advisors reimbursed the Fund $144 for transfer agency expenses related to Class N shares.
i. Payment by Affiliates. For the year ended September 30, 2015, Loomis Sayles reimbursed Global Equity and Income Fund $9,621 in connection with a trading error.
7. Class-Specific Transfer Agent Fees and Expenses. For the year ended September 30, 2015, the Funds incurred the following class-specific transfer agent fees and expenses (including sub-transfer agent fees, where applicable):
| | | | | | | | | | | | | | | | | | | | | | | | |
| | | Transfer Agent Fees and Expenses | |
Fund | | Class A | | | Class B | | | Class C | | | Class N | | | Class Y | | | Admin
Class | |
Growth Fund | | $ | 78,138 | | | $ | 197 | | | $ | 36,081 | | | $ | 144 | | | $ | 982,107 | | | $ | — | |
Value Fund | | | 385,151 | | | | 363 | | | | 21,616 | | | | 1,281 | | | | 1,208,866 | | | | 27,217 | |
Transfer agent fees and expenses attributable to Class A, Class B, Class C, Class Y and Admin Class are allocated on a pro rata basis to each class based on the relative net assets of each class to the total net assets of those classes. Transfer agent fees and expenses attributable to Class N are allocated to Class N.
The Global Equity and Income Fund allocates transfer agent fees and expenses on a pro rata basis based on the relative net assets of each class to the total net assets of those classes.
89 |
Notes to Financial Statements (continued)
September 30, 2015
8. Line of Credit. Each Fund, together with certain other funds of Natixis Funds Trusts and Loomis Sayles Funds Trusts, participates in a $150,000,000 committed unsecured line of credit provided by State Street Bank. Any one Fund may borrow up to the full $150,000,000 under the line of credit (as long as all borrowings by all Funds in the aggregate do not exceed the $150,000,000 limit at any time). Interest is charged to each participating Fund based on its borrowings at a rate per annum equal to the greater of the Federal Funds rate or overnight LIBOR, plus 1.25%. In addition, a commitment fee of 0.15% per annum, payable at the end of each calendar quarter, is accrued and apportioned among the participating funds based on their average daily unused portion of the line of credit.
For the year ended September 30, 2015, Value Fund had an average daily balance on the line of credit (for those days on which there were borrowings) of $45,446,091 at a weighted average interest rate of 1.39%. Interest expense incurred (which is reflected in miscellaneous expenses in the Statements of Operations) was $5,264.
Prior to April 16, 2015, the committed unsecured line of credit was $200,000,000 with an individual limit of $125,000,000 for each Fund that participated in the line of credit. In addition, the commitment fee was 0.10% per annum, payable at the end of each calendar quarter.
9. Brokerage Commission Recapture. Each Fund has entered into agreements with certain brokers whereby the brokers will rebate a portion of brokerage commissions. All amounts rebated by the brokers are returned to the Funds under such agreements and are included in realized gains on investments on the Statements of Operations. For the year ended September 30, 2015, amounts rebated under these agreements were as follows:
| | | | |
Fund | | Rebates | |
Global Equity and Income Fund | | $ | 49,146 | |
Growth Fund | | | 26,880 | |
Value Fund | | | 108,334 | |
10. Concentration of Risk. Each Fund’s investments in foreign securities are subject to foreign currency fluctuations, higher volatility than U.S. securities, varying degrees of regulation and limited liquidity. Greater political, economic, credit and information risks are also associated with foreign securities.
11. Concentration of Ownership. From time to time, a Fund may have a concentration of one or more accounts constituting a significant percentage of shares outstanding. Investment activities by holders of such accounts could have material impacts on the Funds. As of September 30, 2015 based on management’s evaluation of the shareholder account base, the Funds had accounts representing controlling ownership of more than 5% of the Fund’s total outstanding shares. The number of such accounts, based on
| 90
Notes to Financial Statements (continued)
September 30, 2015
accounts that represent more than 5% of an individual class of shares, and the aggregate percentage of net assets represented by such holdings were as follows:
| | | | | | | | | | | | | | | | |
Fund | | Number of 5%
Non-Affiliated
Account Holders | | | Percentage of
Non-Affiliated
Ownership | | | Percentage of
Affiliated Ownership
(Note 6) | | | Total
Percentage of
Ownership | |
Global Equity and Income Fund | | | — | | | | — | | | | 2.41 | % | | | 2.41 | % |
Growth Fund | | | 2 | | | | 37.16 | % | | | 3.11 | % | | | 40.27 | % |
Value Fund | | | 2 | | | | 38.42 | % | | | 2.53 | % | | | 40.95 | % |
Omnibus shareholder accounts for which NGAM Advisors understands that the intermediary has discretion over the underlying shareholder accounts or investment models where a shareholder account may be invested for a non-discretionary customer are included in the table above. For other omnibus accounts, the Funds do not have information on the individual shareholder accounts underlying the omnibus accounts; therefore, there could be other 5% shareholders in addition to those disclosed in the table above.
12. Capital Shares. Each Fund may issue an unlimited number of shares of beneficial interest, without par value. Transactions in capital shares were as follows:
| | | | | | | | | | | | | | | | |
| |
| Year Ended
September 30, 2015 |
| |
| Year Ended
September 30, 2014 |
|
Global Equity and Income Fund | | | Shares | | | | Amount | | | | Shares | | | | Amount | |
| Class A | | | | | | | | | | | | | | | | |
Issued from the sale of shares | | | 4,329,411 | | | $ | 83,633,755 | | | | 4,685,713 | | | $ | 90,264,674 | |
Issued in connection with the reinvestment of distributions | | | 543,357 | | | | 10,198,816 | | | | 320,675 | | | | 6,115,265 | |
Redeemed | | | (3,512,804 | ) | | | (67,808,443 | ) | | | (6,534,023 | ) | | | (128,000,618 | ) |
| | | | | | | | | | | | | | | | |
Net change | | | 1,359,964 | | | $ | 26,024,128 | | | | (1,527,635 | ) | | $ | (31,620,679 | ) |
| | | | | | | | | | | | | | | | |
| Class C | | | | | | | | | | | | | | | | |
Issued from the sale of shares | | | 5,429,765 | | | $ | 103,964,870 | | | | 4,201,270 | | | $ | 80,327,199 | |
Issued in connection with the reinvestment of distributions | | | 555,784 | | | | 10,348,688 | | | | 215,331 | | | | 4,076,209 | |
Redeemed | | | (3,679,631 | ) | | | (70,272,069 | ) | | | (3,650,704 | ) | | | (70,124,476 | ) |
| | | | | | | | | | | | | | | | |
Net change | | | 2,305,918 | | | $ | 44,041,489 | | | | 765,897 | | | $ | 14,278,932 | |
| | | | | | | | | | | | | | | | |
| Class Y | | | | | | | | | | | | | | | | |
Issued from the sale of shares | | | 11,734,160 | | | $ | 227,617,351 | | | | 9,211,425 | | | $ | 180,672,006 | |
Issued in connection with the reinvestment of distributions | | | 1,570,256 | | | | 29,583,620 | | | | 680,676 | | | | 13,034,936 | |
Redeemed | | | (12,553,471 | ) | | | (243,060,865 | ) | | | (8,613,247 | ) | | | (167,198,779 | ) |
| | | | | | | | | | | | | | | | |
Net change | | | 750,945 | | | $ | 14,140,106 | | | | 1,278,854 | | | $ | 26,508,163 | |
| | | | | | | | | | | | | | | | |
Increase (decrease) from capital share transactions | | | 4,416,827 | | | $ | 84,205,723 | | | | 517,116 | | | $ | 9,166,416 | |
| | | | | | | | | | | | | | | | |
91 |
Notes to Financial Statements (continued)
September 30, 2015
12. Capital Shares (continued).
| | | | | | | | | | | | | | | | |
| |
| Year Ended
September 30, 2015 |
| |
| Year Ended
September 30, 2014 |
|
Growth Fund | | | Shares | | | | Amount | | | | Shares | | | | Amount | |
| Class A | | | | | | | | | | | | | | | | |
Issued from the sale of shares | | | 7,627,613 | | | $ | 76,862,467 | | | | 3,007,220 | | | $ | 27,233,233 | |
Issued in connection with the reinvestment of distributions | | | 32,331 | | | | 321,374 | | | | 6,400 | | | | 55,872 | |
Redeemed | | | (2,055,747 | ) | | | (20,446,591 | ) | | | (2,503,981 | ) | | | (22,914,837 | ) |
| | | | | | | | | | | | | | | | |
Net change | | | 5,604,197 | | | $ | 56,737,250 | | | | 509,639 | | | $ | 4,374,268 | |
| | | | | | | | | | | | | | | | |
| Class B | | | | | | | | | | | | | | | | |
Issued from the sale of shares | | | 342 | | | $ | 3,298 | | | | 2,541 | | | $ | 20,382 | |
Redeemed | | | (46,536 | ) | | | (434,022 | ) | | | (141,955 | ) | | | (1,161,919 | ) |
| | | | | | | | | | | | | | | | |
Net change | | | (46,194 | ) | | $ | (430,724 | ) | | | (139,414 | ) | | $ | (1,141,537 | ) |
| | | | | | | | | | | | | | | | |
| Class C | | | | | | | | | | | | | | | | |
Issued from the sale of shares | | | 1,853,819 | | | $ | 17,439,832 | | | | 1,212,100 | | | $ | 10,078,324 | |
Issued in connection with the reinvestment of distributions | | | — | | | | — | | | | — | | | | — | |
Redeemed | | | (738,782 | ) | | | (6,915,130 | ) | | | (571,652 | ) | | | (4,797,966 | ) |
| | | | | | | | | | | | | | | | |
Net change | | | 1,115,037 | | | $ | 10,524,702 | | | | 640,448 | | | $ | 5,280,358 | |
| | | | | | | | | | | | | | | | |
| Class N | | | | | | | | | | | | | | | | |
Issued from the sale of shares | | | — | | | $ | — | | | | 0 | * | | $ | 1 | |
Issued in connection with the reinvestment of distributions | | | 1 | | | | 7 | | | | 0 | * | | | 3 | |
| | | | | | | | | | | | | | | | |
Net change | | | 1 | | | $ | 7 | | | | 0 | * | | $ | 4 | |
| | | | | | | | | | | | | | | | |
| Class Y | | | | | | | | | | | | | | | | |
Issued from the sale of shares | | | 52,581,221 | | | $ | 564,535,215 | | | | 49,660,184 | | | $ | 483,150,619 | |
Issued in connection with the reinvestment of distributions | | | 466,174 | | | | 4,918,135 | | | | 174,623 | | | | 1,617,014 | |
Redeemed | | | (18,517,808 | ) | | | (199,164,033 | ) | | | (13,014,287 | ) | | | (124,084,003 | ) |
Redeemed in-kind (Note 13) | | | (23,009,100 | ) | | | (238,604,371 | ) | | | — | | | | — | |
| | | | | | | | | | | | | | | | |
Net change | | | 11,520,487 | | | $ | 131,684,946 | | | | 36,820,520 | | | $ | 360,683,630 | |
| | | | | | | | | | | | | | | | |
Increase (decrease) from capital share transactions | | | 18,193,528 | | | $ | 198,516,181 | | | | 37,831,193 | | | $ | 369,196,723 | |
| | | | | | | | | | | | | | | | |
| * | Amount rounds to less than one share. |
| 92
Notes to Financial Statements (continued)
September 30, 2015
12. Capital Shares (continued).
| | | | | | | | | | | | | | | | |
| |
| Year Ended
September 30, 2015 |
| |
| Year Ended
September 30, 2014 |
|
Value Fund | | | Shares | | | | Amount | | | | Shares | | | | Amount | |
| Class A | | | | | | | | | | | | | | | | |
Issued from the sale of shares | | | 1,738,963 | | | $ | 46,569,244 | | | | 15,747,402 | | | $ | 429,600,872 | |
Issued in connection with the reinvestment of distributions | | | 2,328,240 | | | | 61,605,209 | | | | 579,679 | | | | 15,129,608 | |
Redeemed | | | (19,246,045 | ) | | | (514,711,447 | ) | | | (2,644,187 | ) | | | (72,446,851 | ) |
| | | | | | | | | | | | | | | | |
Net change | | | (15,178,842 | ) | | $ | (406,536,994 | ) | | | 13,682,894 | | | $ | 372,283,629 | |
| | | | | | | | | | | | | | | | |
| Class B | | | | | | | | | | | | | | | | |
Issued from the sale of shares | | | 107 | | | $ | 2,889 | | | | 1,447 | | | $ | 38,410 | |
Issued in connection with the reinvestment of distributions | | | 1,136 | | | | 30,982 | | | | 1,686 | | | | 44,736 | |
Redeemed | | | (22,159 | ) | | | (612,219 | ) | | | (24,118 | ) | | | (659,371 | ) |
| | | | | | | | | | | | | | | | |
Net change | | | (20,916 | ) | | $ | (578,348 | ) | | | (20,985 | ) | | $ | (576,225 | ) |
| | | | | | | | | | | | | | | | |
| Class C | | | | | | | | | | | | | | | | |
Issued from the sale of shares | | | 168,212 | | | $ | 4,489,770 | | | | 116,820 | | | $ | 3,134,859 | |
Issued in connection with the reinvestment of distributions | | | 46,757 | | | | 1,229,708 | | | | 21,199 | | | | 550,342 | |
Redeemed | | | (181,426 | ) | | | (4,774,431 | ) | | | (133,849 | ) | | | (3,668,131 | ) |
| | | | | | | | | | | | | | | | |
Net change | | | 33,543 | | | $ | 945,047 | | | | 4,170 | | | $ | 17,070 | |
| | | | | | | | | | | | | | | | |
| Class N | | | | | | | | | | | | | | | | |
Issued from the sale of shares | | | 12,753,984 | | | $ | 350,880,527 | | | | 4,027,342 | | | $ | 109,873,134 | |
Issued in connection with the reinvestment of distributions | | | 2,770,273 | | | | 73,439,957 | | | | 680,270 | | | | 17,775,466 | |
Redeemed | | | (6,232,756 | ) | | | (161,942,813 | ) | | | (1,123,644 | ) | | | (30,658,707 | ) |
| | | | | | | | | | | | | | | | |
Net change | | | 9,291,501 | | | $ | 262,377,671 | | | | 3,583,968 | | | $ | 96,989,893 | |
| | | | | | | | | | | | | | | | |
| Class Y | | | | | | | | | | | | | | | | |
Issued from the sale of shares | | | 7,557,970 | | | $ | 201,571,556 | | | | 9,269,260 | | | $ | 253,687,659 | |
Issued in connection with the reinvestment of distributions | | | 4,074,597 | | | | 108,180,554 | | | | 3,181,533 | | | | 83,197,088 | |
Redeemed | | | (28,985,641 | ) | | | (786,537,213 | ) | | | (25,850,524 | ) | | | (708,914,565 | ) |
| | | | | | | | | | | | | | | | |
Net change | | | (17,353,074 | ) | | $ | (476,785,103 | ) | | | (13,399,731 | ) | | $ | (372,029,818 | ) |
| | | | | | | | | | | | | | | | |
| Admin Class | | | | | | | | | | | | | | | | |
Issued from the sale of shares | | | 3,750,246 | | | $ | 100,404,741 | | | | 10,291 | | | $ | 280,894 | |
Issued in connection with the reinvestment of distributions | | | 8 | | | | 209 | | | | 4 | | | | 96 | |
Redeemed | | | (173,819 | ) | | | (4,485,251 | ) | | | (1,317 | ) | | | (36,879 | ) |
| | | | | | | | | | | | | | | | |
Net change | | | 3,576,435 | | | $ | 95,919,699 | | | | 8,978 | | | $ | 244,111 | |
| | | | | | | | | | | | | | | | |
Increase (decrease) from capital share transactions | | | (19,651,353 | ) | | $ | (524,658,028 | ) | | | 3,859,294 | | | $ | 96,928,660 | |
| | | | | | | | | | | | | | | | |
93 |
Notes to Financial Statements (continued)
September 30, 2015
13. Redemption In-Kind. In certain circumstances, a Fund may distribute portfolio securities rather than cash as payment for redemption of Fund shares (redemption in-kind). For financial reporting purposes, the Fund will recognize a gain on in-kind redemptions to the extent the value of the distributed securities on the date of redemption exceeds the cost of those securities; the Fund will recognize a loss if the cost exceeds value. Gains and losses realized on redemptions in-kind are not recognized for tax purposes, and are re-classified from realized gain (loss) to paid-in-capital. The Growth Fund realized a gain of $74,984,028 on redemptions in-kind during the year ended September 30, 2015. This amount is included in realized gain (loss) on the Statements of Operations.
14. Subsequent Event. On September 10, 2015, the Board of Trustees approved the following changes: (i) the early conversion of all of the Funds’ remaining Class B shares into Class A shares for Growth Fund and Value Fund, effective at the close of business on January 11, 2016, and (ii) a broadening of eligibility requirements for Class N shares of Growth Fund and Value Fund to include investors with an initial minimum investment of $1,000,000, effective November 2, 2015.
| 94
Report of Independent Registered Public Accounting Firm
To the Trustees of Loomis Sayles Funds II and Shareholders of Loomis Sayles Global Equity and Income Fund, Loomis Sayles Growth Fund and Loomis Sayles Value Fund:
In our opinion, the accompanying statements of assets and liabilities, including the portfolios of investments, and the related statements of operations and of changes in net assets and the financial highlights present fairly, in all material respects, the financial position of the Loomis Sayles Global Equity and Income Fund, Loomis Sayles Growth Fund and Loomis Sayles Value Fund, each a series of Loomis Sayles Funds II (collectively, the “Funds”) at September 30, 2015, and the results of each of their operations, the changes in each of their net assets and the financial highlights for each of the periods indicated, in conformity with accounting principles generally accepted in the United States of America. These financial statements and financial highlights (hereafter referred to as “financial statements”) are the responsibility of the Funds’ management. Our responsibility is to express an opinion on these financial statements based on our audits. We conducted our audits of these financial statements in accordance with the standards of the Public Company Accounting Oversight Board (United States). Those standards require that we plan and perform the audit to obtain reasonable assurance about whether the financial statements are free of material misstatement. An audit includes examining, on a test basis, evidence supporting the amounts and disclosures in the financial statements, assessing the accounting principles used and significant estimates made by management, and evaluating the overall financial statement presentation. We believe that our audits, which included confirmation of securities at September 30, 2015 by correspondence with the custodian, agent banks and brokers, and the application of alternative auditing procedures where securities purchased had not been received, provide a reasonable basis for the opinion expressed above.
PricewaterhouseCoopers LLP
Boston, Massachusetts
November 20, 2015
95 |
2015 U.S. Tax Distribution Information to Shareholders (Unaudited)
Corporate Dividends Received Deduction. For the fiscal year ended September 30, 2015, a percentage of dividends distributed by the Funds listed below qualify for the dividends received deduction for corporate shareholders. These percentages are as follows:
| | | | |
Fund | | Qualifying
Percentage | |
Global Equity and Income | | | 21.21 | % |
Growth | | | 100.00 | % |
Value | | | 74.20 | % |
Capital Gains Distributions. Pursuant to Internal Revenue Section 852(b), the following Funds paid distributions, which have been designated as capital gains distributions for the fiscal year ended September 30, 2015, unless subsequently determined to be different.
| | | | |
Fund | | Amount | |
Global Equity and Income | | | $43,172,460 | |
Value | | | 200,996,242 | |
Qualified Dividend Income. For the fiscal year ended September 30, 2015, the Funds below will designate up to the maximum amount allowable pursuant to the Internal Revenue Code as qualified dividend income eligible for reduced tax rates. These lower rates range from 0% to 20% depending on an individual’s tax bracket. If the Funds pay a distribution during calendar year 2015, complete information will be reported in conjunction with Form 1099-DIV.
| | |
Fund | | |
Global Equity and Income | | |
Growth | | |
Value | | |
| 96
Trustee and Officer Information
The tables below provide certain information regarding the trustees and officers of Loomis Sayles Funds II (the “Trust”). Unless otherwise indicated, the address of all persons below is 399 Boylston Street, Boston, MA 02116. The Funds’ Statements of Additional Information include additional information about the trustees of the Trust and are available by calling Natixis Funds at 800-225-5478.
| | | | | | | | |
Name and Year of Birth | | Position(s) Held
with the Trust,
Length of Time
Served and Term of Office1 | | Principal
Occupation(s)
During Past 5 Years | | Number of
Portfolios in
Fund Complex
Overseen2
and Other
Directorships Held
During Past 5 Years | | Experience,
Qualifications,
Attributes, Skills
for Board Membership |
| | | |
| INDEPENDENT TRUSTEES | | | | | | |
| | | | |
Kenneth A. Drucker (1945) | | Trustee since 2008 Chairperson of the Audit Committee and Governance Committee Member | | Retired | | 42 None | | Significant experience on the Board and on the boards of other business organizations (including at investment companies); executive experience (including as treasurer of an aerospace, automotive, and metal manufacturing corporation) |
| | | | |
Edmond J. English (1953) | | Trustee since 2013 Contract Review Committee Member | | Chief Executive Officer of Bob’s Discount Furniture (retail) | | 42 Formerly, Director, BJ’s Wholesale Club (retail); formerly, Director, Citizens Financial Group (bank) | | Experience on the Board and significant experience on the boards of other business organizations (including at a retail company and a bank); executive experience (including at a retail company) |
97 |
Trustee and Officer Information
| | | | | | | | |
Name and Year of Birth | | Position(s) Held
with the Trust,
Length of Time
Served and Term of Office1 | | Principal
Occupation(s)
During Past 5 Years | | Number of
Portfolios in
Fund Complex
Overseen2
and Other
Directorships Held
During Past 5 Years | | Experience,
Qualifications,
Attributes, Skills
for Board Membership |
| | | |
INDEPENDENT TRUSTEES continued | | | | | | |
| | | | |
Richard A. Goglia (1951) | | Trustee since 2015 Audit Committee Member | | Retired; formerly Vice President and Treasurer of Raytheon Company (defense) | | 42 None | | Experience on the Board and executive experience (including his role as vice president and treasurer of a defense company and experience at a financial services company) |
| | | | |
Wendell J. Knox (1948) | | Trustee since 2009 Audit Committee Member and Governance Committee Member | | Director of Abt Associates Inc. (research and consulting) | | 42 Director, Eastern Bank (bank); Director, The Hanover Insurance Group (property and casualty insurance) | | Significant experience on the Board and on the boards of other business organizations (including at a bank and at a property and casualty insurance firm); executive experience (including roles as president and chief executive officer of a research and consulting company) |
| 98
Trustee and Officer Information
| | | | | | | | |
Name and Year of Birth | | Position(s) Held
with the Trust,
Length of Time
Served and Term of Office1 | | Principal
Occupation(s)
During Past 5 Years | | Number of
Portfolios in
Fund Complex
Overseen2
and Other
Directorships Held
During Past 5 Years | | Experience,
Qualifications,
Attributes, Skills
for Board Membership |
| | | |
INDEPENDENT TRUSTEES continued | | | | | | |
| | | | |
Martin T. Meehan (1956) | | Trustee since 2012 Contract Review Committee Member | | President, University of Massachusetts (formerly, Chancellor and faculty member, University of Massachusetts Lowell) | | 42 None | | Experience on the Board and on the boards of other business organizations; experience as President of the University of Massachusetts; government experience (including as a member of the U.S. House of Representatives); academic experience |
| | | | |
Sandra O. Moose (1942) | | Chairperson of the Board of Trustees since November 2005 Trustee since 2003 Ex Officio member of the Audit Committee, the Contract Review Committee and the Governance Committee | | President, Strategic Advisory Services (management consulting) | | 42 Director, AES Corporation (international power company); formerly, Director, Verizon Communications (telecommunications company) | | Significant experience on the Board and on the boards of other business organizations (including at a telecommunications company, an international power company and a specialty chemicals corporation); executive experience (including at a management consulting company) |
99 |
Trustee and Officer Information
| | | | | | | | |
Name and Year of Birth | | Position(s) Held
with the Trust,
Length of Time
Served and Term of Office1 | | Principal
Occupation(s)
During Past 5 Years | | Number of
Portfolios in
Fund Complex
Overseen2
and Other
Directorships Held
During Past 5 Years | | Experience,
Qualifications,
Attributes, Skills
for Board Membership |
| | | |
INDEPENDENT TRUSTEES continued | | | | | | |
| | | | |
Erik R. Sirri (1958) | | Trustee since 2009 Audit Committee Member | | Professor of Finance at Babson College | | 42 None | | Significant experience on the Board; experience as Director of the Division of Trading and Markets at the Securities and Exchange Commission; academic experience; training as an economist |
| | | | |
Peter J. Smail (1952) | | Trustee since 2009 Chairperson of the Contract Review Committee and Governance Committee Member | | Retired | | 42 None | | Significant experience on the Board; mutual fund industry and executive experience (including roles as president and chief executive officer for an investment adviser) |
| | | | |
Cynthia L. Walker (1956) | | Trustee since 2005 Chairperson of the Governance Committee and Contract Review Committee Member | | Deputy Dean for Finance and Administration, Yale University School of Medicine | | 42 None | | Significant experience on the Board; executive experience in a variety of academic organizations (including roles as dean for finance and administration) |
| 100
Trustee and Officer Information
| | | | | | | | |
Name and Year of Birth | | Position(s) Held
with the Trust,
Length of Time
Served and Term of Office1 | | Principal
Occupation(s)
During Past 5 Years | | Number of
Portfolios in
Fund Complex
Overseen2
and Other
Directorships Held
During Past 5 Years | | Experience,
Qualifications,
Attributes, Skills
for Board Membership |
| | | |
| INTERESTED TRUSTEES | | | | | | |
| | | | |
Kevin P. Charleston3 (1965) One Financial Center Boston, MA 02111 | | Trustee since 2015 | | President, Chief Executive Officer and Director; formerly, Chief Financial Officer, Loomis, Sayles & Company, L.P. | | 42 None | | Continuing service as President, Chief Executive Officer and Director of Loomis, Sayles & Company, L.P. |
| | | | |
David L. Giunta4 (1965) | | Trustee since 2011 President since 2008 and Chief Executive Officer since 2015 | | President and Chief Executive Officer, NGAM Distribution Corporation, NGAM Advisors, L.P. and NGAM Distribution, L.P. | | 42 None | | Experience on the Board; continuing experience as President and Chief Executive Officer of NGAM Advisors, L.P. |
| | | | |
John T. Hailer5 (1960) | | Trustee since 2003 | | President and Chief Executive Officer – U.S. and Asia, Natixis Global Asset Management, L.P. | | 42 None | | Significant experience on the Board; continuing experience as President and Chief Executive Officer – U.S. and Asia, Natixis Global Asset Management, L.P. |
| 1 | Each trustee serves until retirement, resignation or removal from the Board. The current retirement age is 75. The position of Chairperson of the Board is appointed for a three-year term. Ms. Moose was appointed to serve an additional three-year term as the Chairperson of the Board on December 13, 2013. |
| 2 | The trustees of the Trusts serve as trustees of a fund complex that includes all series of the Natixis Funds Trust I, Natixis Funds Trust II, Natixis Funds Trust IV and Gateway Trust (collectively, the “Natixis Funds Trusts”), Loomis Sayles Funds I and Loomis Sayles Funds II (collectively, the “Loomis Sayles Funds Trusts”) (collectively, the “Fund Complex”). |
| 3 | Mr. Charleston is deemed an “interested person” of the Trusts because he holds the following positions with an affiliated person of the Trusts: President, Chief Executive Officer and Director of Loomis, Sayles & Company, L.P. |
| 4 | Mr. Giunta is deemed an “interested person” of the Trusts because he holds the following positions with an affiliated person of the Trusts: President and Chief Executive Officer of NGAM Distribution Corporation, NGAM Advisors, L.P. and NGAM Distribution, L.P. |
| 5 | Mr. Hailer is deemed an “interested person” of the Trusts because he holds the following positions with an affiliated person of the Trusts: President and Chief Executive Officer – U.S. and Asia, Natixis Global Asset Management, L.P. |
101 |
Trustee and Officer Information
| | | | | | |
Name and Year of Birth | | Position(s) Held with the Trust(s) | | Term of Office1 and Length of Time Served | | Principal Occupation(s) During Past 5 Years2 |
| | |
| OFFICERS OF THE TRUST | | | | |
| | | |
Coleen Downs Dinneen (1960) | | Secretary, Clerk and Chief Legal Officer | | Since September 2004 | | Executive Vice President, General Counsel, Secretary and Clerk, NGAM Distribution Corporation, NGAM Advisors, L.P. and NGAM Distribution, L.P. |
| | | |
Daniel J. Fuss (1933) One Financial Center Boston, MA 02111 | | Executive Vice President | | Since June 2003 | | Vice Chairman and Director, Loomis, Sayles & Company, L.P. |
| | | |
Russell L. Kane (1969) | | Chief Compliance Officer, Assistant Secretary and Anti-Money Laundering Officer | | Chief Compliance Officer since May 2006; Assistant Secretary since June 2004; and Anti-Money Laundering Officer since April 2007 | | Chief Compliance Officer for Mutual Funds, Senior Vice President, Deputy General Counsel, Assistant Secretary and Assistant Clerk, NGAM Distribution Corporation, NGAM Advisors, L.P. and NGAM Distribution, L.P. |
| | | |
Michael C. Kardok (1959) | | Treasurer, Principal Financial and Accounting Officer | | Since October 2004 | | Senior Vice President, NGAM Advisors, L.P. and NGAM Distribution, L.P. |
| 1 | Each officer of the Trusts serves for an indefinite term in accordance with the Trusts’ current by-laws until the date his or her successor is elected and qualified, or until he or she sooner dies, retires, is removed or becomes disqualified. |
| 2 | Each person listed above, except as noted, holds the same position(s) with the Fund Complex. Mr. Fuss is not an officer of the Natixis Funds Trusts. Previous positions during the past five years with NGAM Distribution, L.P., NGAM Advisors, L.P. or Loomis, Sayles & Company, L.P. are omitted, if not materially different from a trustee’s or officer’s current position with such entity. |
| 102

Loomis Sayles Small Cap Growth Fund
Loomis Sayles Small Cap Value Fund
Loomis Sayles Small/Mid Cap Growth Fund
Annual Report
September 30, 2015
LOOMIS SAYLES SMALL CAP GROWTH FUND
| | | | |
| Managers | | Symbols | | |
| Mark F. Burns, CFA® | | Institutional Class | | LSSIX |
| John J. Slavik, CFA® | | Retail Class | | LCGRX |
| | Class N | | LSSNX |
Objective
The Fund’s investment objective is long-term capital growth from investments in common stocks or other equity securities.
Market Conditions
Performance in the U.S. equity markets was mixed during the 12-month period ended September 30, 2015, and growth stocks generally outperformed value stocks in the small-cap segment of the market. Though volatility remained relatively muted for the majority of the fiscal year, it did begin to increase in August and September due to concerns over slower global growth. The period closed with negative investor sentiment overshadowing continued mergers-and-acquisition (M&A) activity and more attractive valuations.
Performance Results
For the 12 months ended September 30, 2015, Institutional Class shares of Loomis Sayles Small Cap Growth Fund returned 5.78% at net asset value. The Fund outperformed its benchmark, the Russell 2000® Growth Index, which returned 4.04%.
Explanation of Fund Performance
Stock selection drove the majority of the Fund’s outperformance, particularly in the healthcare and consumer discretionary sectors. Stock selection in the industrials and consumer staples sectors detracted from relative results.
Among the Fund’s top contributors to performance was biotechnology company Anacor Pharmaceuticals. Sales of the company’s drug Kerydin® were better than expected. Anacor also announced positive late-stage trial data for a different drug in its pipeline. Another biotechnology company, Receptos, was also a top-performing stock after announcing it would be acquired by Celgene at an attractive premium. Elsewhere in the healthcare sector, Cambrex, a manufacturer of active pharmaceutical ingredients (APIs), also performed well. The company reported a strong quarter, with demand increasing across all of its product categories. Cambrex also announced an expansion of existing facilities to keep up with demand levels.
The plummeting price of oil pressured shares of energy and commodity-related companies, with the benchmark’s energy sector down more than 50% during the fiscal year. Within the Fund, Oasis Petroleum, an oil and natural gas exploration and production company; Forum Energy Technologies, a manufacturer and distributor of products to the oil and natural gas industries; and Flotek Industries, a developer and supplier of oilfield products, services and equipment, were the largest performance detractors.
Outlook
We believe volatility in the small-cap market may persist through the end of 2015. Valuations have trended toward more normal levels relative to large-cap companies, but
1 |
investors remain cautious. The upcoming earnings season will be particularly important for small-cap growth managers. We will continue to seek out strong secular growth companies with high-quality business models that should enable wealth creation for shareholders over time. As investors digest critical economic data, indications of positive trends may favor businesses of a more cyclical nature. Regardless, we always monitor market conditions in order to mitigate volatility and to tightly control position sizes, especially in those holdings most prone to mirror a pullback in the market.
Growth of $100,000 Investment in Institutional Class Shares2
September 30, 2005 through September 30, 2015
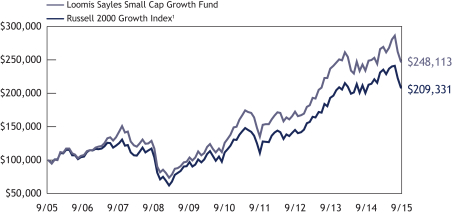
Average Annual Total Returns — September 30, 20152
| | | | | | | | | | | | | | | | | | |
| | | | | | |
| | | | | 1 year | | | 5 years | | | 10 years | | | Life of Class N | |
| | | | | | |
| Institutional Class (Inception 12/31/96) | | | | | 5.78 | % | | | 14.41 | % | | | 9.52 | % | | | — | % |
| Retail Class (Inception 12/31/96) | | | | | 5.58 | | | | 14.11 | | | | 9.23 | | | | — | |
| Class N (Inception 2/1/13) | | | | | 5.92 | | | | — | | | | — | | | | 12.35 | |
| | | | | | |
| Comparative Performance | | | | | | | | | | | | | | | | | | |
| Russell 2000® Growth Index1 | | | | | 4.04 | | | | 13.26 | | | | 7.67 | | | | 11.32 | |
Past performance does not guarantee future results. The table(s) do not reflect taxes shareholders might owe on any Fund distributions or when they redeem their shares. Performance for periods less than one year is cumulative, not annualized. Returns reflect changes in share price and reinvestment of dividends and capital gains, if any. Unlike a fund, an index is not managed and does not reflect fees and expenses. It is not possible to invest directly in an index.
| 1 | | Russell 2000® Growth Index is an unmanaged index that measures the performance of the small-cap growth segment of the U.S. equity universe. It includes those Russell 2000® companies with higher price-to-book ratios and forecasted growth values. |
| 2 | | Fund performance has been increased by fee waivers and/or expense reimbursements, if any, without which performance would have been lower. |
| 2
LOOMIS SAYLES SMALL CAP VALUE FUND
| | | | |
| Managers | | Symbols | | |
| Joseph R. Gatz, CFA® | | Institutional Class | | LSSCX |
| Jeffrey Schwartz, CFA® | | Retail Class | | LSCRX |
| | Admin Class | | LSVAX |
| | Class N | | LSCNX |
Objective
The Fund’s investment objective is long-term capital growth from investments in common stocks or other equity securities.
Market Conditions
After posting gains through the first three quarters of the fiscal year, stocks generally tumbled during the period’s final quarter. Concerns about the pace of growth in China and elsewhere triggered the late-quarter volatility. The Federal Reserve’s (the Fed’s) decision to hold off raising short-term interest rates added to investors’ unease.
Small-cap stocks broadly outperformed large-cap stocks for the first three quarters of the reporting period but underperformed in the last quarter of the fiscal year. Overall, small-cap stocks outpaced large-cap stocks for the 12-month period. Additionally, growth stocks outperformed value stocks for the entire period but lagged value stocks during the final three months of the fiscal year.
Performance Results
For the 12 months ended September 30, 2015, Institutional Class shares of Loomis Sayles Small Cap Value Fund returned 1.20 % at net asset value. The Fund outperformed its benchmark, the Russell 2000® Value Index, which returned -1.60%.
Explanation of Fund Performance
Stock selection was mostly positive, with strength in the financials, particularly among real estate investment trusts (REITs), and consumer discretionary sectors. Stock selection lagged in the materials sector. Mergers-and-acquisitions (M&A) activity among portfolio holdings was strong, as eight companies were acquired during the 12-month period.
Top performers included HCC Insurance Holdings, Post Holdings and Euronet Worldwide. Specialty insurance provider HCC Insurance Holdings announced it was being acquired by Tokio Marine Holdings at a significant premium to HCC’s closing price the day before the announcement. Post Holdings, a breakfast cereal company, announced an acquisition and delivered earnings that surpassed analyst expectations. Euronet Worldwide, a provider of payment processing and transaction solutions to financial institutions, retailers and mobile device operators, reported better-than-expected earnings. With 30% of revenues denominated in the euro, core growth remained strong despite the currency headwinds.
3 |
Meanwhile, performance among holdings in the materials sector weighed down results. Main detractors included Helix Energy Solutions Group, SunCoke Energy and Tronox Limited. Helix Energy Solutions is an international offshore energy company that provides development solutions and other key life-of-field services to the energy industry. The energy industry downturn affected the company’s well intervention business more than previously thought. SunCoke Energy produces metallurgical coke, a key ingredient in the production of steel. More than 90% of the metallurgical coke produced is used in the iron and steel industries. SunCoke shares suffered due to energy sector weakness, but the company possesses different characteristics from other, more commodity-sensitive stocks. Tronox is a producer of titanium dioxide pigment, which is used in paints, coatings and plastics. The company’s share price weakened over the fiscal year as the desired improvement in industry volumes and pricing did not materialize.
Outlook
Investors are unclear if the Fed will raise rates by year-end 2015 or early 2016. We believe equity investors have largely built in an initial rate hike. Assuming inflation remains well-contained, further rate increases will be considered at a deliberate pace. Rate hikes associated with a healthy economy are generally not considered a negative for stocks, and we expect stocks to take measured policy actions in stride.
We believe that energy earnings will continue to drag on U.S. aggregate earnings in 2016. However, healthy earnings growth outside of energy should continue. We anticipate that 2016 aggregate earnings growth may be in the mid-single digits. Domestic equity fundamentals remain supported by healthy dividend growth, ongoing shareholder activism and continued M&A activity.
Potential risks include reversing global economic fundamentals, commodity price swings, volatility related to U.S. rate increases, and geopolitics. Still, valuations are attractive after the correction in August, which has created buying opportunities for discerning investors.
| 4
LOOMIS SAYLES SMALL CAP VALUE FUND
Growth of $100,000 Investment in Institutional Class Shares3
September 30, 2005 through September 30, 2015
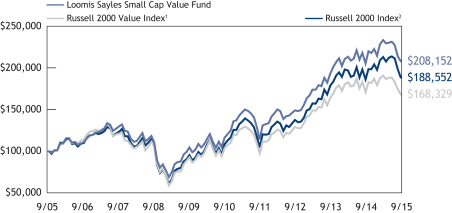
Average Annual Total Returns — September 30, 20153
| | | | | | | | | | | | | | | | | | |
| | | | | | |
| | | | | 1 year | | | 5 years | | | 10 years | | | Life of Class N | |
| | | | | | |
| Institutional Class (Inception 5/13/91) | | | | | 1.20 | % | | | 12.31 | % | | | 7.61 | % | | | — | % |
| Retail Class (Inception 12/31/96) | | | | | 0.94 | | | | 12.03 | | | | 7.34 | | | | — | |
| Admin Class (Inception 1/2/98) | | | | | 0.71 | | | | 11.75 | | | | 7.06 | | | | — | |
| Class N (Inception 2/1/13) | | | | | 1.25 | | | | — | | | | — | | | | 8.93 | |
| | | |
| Comparative Performance | | | | | | | | | |
| Russell 2000® Value Index1 | | | | | -1.60 | | | | 10.17 | | | | 5.35 | | | | 6.37 | |
| Russell 2000® Index2 | | | | | 1.25 | | | | 11.73 | | | | 6.55 | | | | 8.81 | |
Past performance does not guarantee future results. The table(s) do not reflect taxes shareholders might owe on any Fund distributions or when they redeem their shares. Performance for periods less than one year is cumulative, not annualized. Returns reflect changes in share price and reinvestment of dividends and capital gains, if any. Unlike a fund, an index is not managed and does not reflect fees and expenses. It is not possible to invest directly in an index.
| 1 | | Russell 2000® Value Index is an unmanaged index that measures the performance of the small-cap value segment of the U.S. equity universe. It includes those Russell 2000® companies with lower price-to-book ratios and lower forecasted growth values. |
| 2 | | Russell 2000® Index is an unmanaged index that measures the performance of the small-cap segment of the U.S. equity universe. |
| 3 | | Fund performance has been increased by fee waivers and/or expense reimbursements, if any, without which performance would have been lower. |
5 |
LOOMIS SAYLES SMALL/MID CAP GROWTH FUND
| | | | |
| Managers | | Symbols | | |
| Mark F. Burns, CFA® | | Institutional Class | | LSMIX |
| John J. Slavik, CFA® | | | | |
Objective
The Fund’s investment objective is long-term capital growth from investments in common stocks or other equity securities.
Market Conditions
Increased, intense equity market volatility characterized the time period from the Fund’s inception on June 30, 2015, through its fiscal year-end on September 30, 2015. After posting strong absolute returns in July, markets reversed course, and returns were generally negative in August and September. During the period, leadership shifted, and small-cap and growth stocks generally underperformed their large-cap and value counterparts.
Performance Results
For the three months ended September 30, 2015, Institutional Class shares of Loomis Sayles Small/Mid Cap Growth Fund returned -9.50%. The Fund held up better than its benchmark, the Russell 2500® Growth Index, which returned -11.05%.
Explanation of Fund Performance
Though the Fund posted negative absolute results, it outpaced its benchmark during a particularly challenging period for small- and mid-cap stocks. Stock selection accounted for the majority of the Fund’s outperformance, particularly in the healthcare sector, and to a lesser extent, in the information technology sector. Stock selection in the industrials sector detracted the most from relative performance.
Among the Fund’s top contributors to performance was biotechnology company Intra-Cellular, which advanced significantly after announcing positive results from a final-stage trial for its schizophrenia drug. In addition, a position in ZS Pharma, a biopharmaceutical company, was another top-performing stock. Shares increased following reports that Actelion made a preliminary acquisition bid for ZS Pharma. Another leading contributor was Tyler Technologies, a provider of software and services to state and local governments. The company reported a solid quarter with strong software license and royalty sales, further increasing its market share in a large addressable market.
Meanwhile, a position in XPO Logistics, a provider of transportation and logistics services, was a large performance detractor. The company, which historically has operated on an asset-light business model, appeared to shift its strategy with the announced acquisition of a trucking company. Investors reacted negatively, and shares declined. In addition, a position in Astronics Corporation, an aerospace and defense company, was also a major detractor as the company reported weaker-than-expected growth in its aerospace division.
| 6
LOOMIS SAYLES SMALL/MID CAP GROWTH FUND
The Fund’s exposure to Endurance International Group Holdings, a web solutions provider, also weighed on results. While expectations for the stock were high, the company reported in-line quarter results, weaker guidance and flat average revenues per subscriber, which disappointed investors.
Outlook
We believe volatility may persist through the end of the year, given the market uncertainty surrounding global growth and interest rates. Valuations have trended toward more “normal” levels relative to large-cap companies, but investors remain cautious. We will continue to seek out strong secular growth companies with high-quality business models that should enable wealth creation for shareholders over time. Our active risk management has served our clients well during this most recent period of heightened volatility. Risk management and stock selection will remain paramount as we navigate these markets.
Total Returns — September 30, 20152
| | | | | | |
| | | |
| | | | | Life of
Fund | |
| | | |
| Institutional Class (Inception 6/30/15) | | | | | -9.50 | % |
| |
| Comparative Performance | |
| Russell 2500® Growth Index1 | | | | | -11.05 | |
Past performance does not guarantee future results. The table(s) do not reflect taxes shareholders might owe on any Fund distributions or when they redeem their shares. Performance for periods less than one year is cumulative, not annualized. Returns reflect changes in share price and reinvestment of dividends and capital gains, if any. Unlike a fund, an index is not managed and does not reflect fees and expenses. It is not possible to invest directly in an index.
| 1 | | Russell 2500® Growth Index is an unmanaged index that measures the performance of the small-to-mid-cap growth segment of the U.S. equity universe. It includes those Russell 2500® companies with higher price-to-book ratios and higher forecasted growth values. |
| 2 | | Fund performance has been increased by fee waivers and/or expense reimbursements, if any, without which performance would have been lower. |
7 |
ADDITIONAL INFORMATION
The views expressed in this report reflect those of the portfolio managers as of the dates indicated. The managers’ views are subject to change at any time without notice based on changes in market or other conditions. References to specific securities or industries should not be regarded as investment advice. Because the Funds are actively managed, there is no assurance that they will continue to invest in the securities or industries mentioned.
Additional Index Information
This document may contain references to third party copyrights, indexes, and trademarks, each of which is the property of its respective owner. Such owner is not affiliated with Natixis Global Asset Management or any of its related or affiliated companies (collectively “NGAM”) and does not sponsor, endorse or participate in the provision of any NGAM services, funds or other financial products.
The index information contained herein is derived from third parties and is provided on an “as is” basis. The user of this information assumes the entire risk of use of this information. Each of the third party entities involved in compiling, computing or creating index information disclaims all warranties (including, without limitation, any warranties of originality, accuracy, completeness, timeliness, non-infringement, merchantability and fitness for a particular purpose) with respect to such information.
Proxy Voting Information
A description of the Funds’ proxy voting policies and procedures is available without charge upon request, by calling Loomis Sayles at 800-633-3330; on the Funds’ website, at www.loomissayles.com, and on the Securities and Exchange Commission’s (SEC’s) website at www.sec.gov. Information about how the Funds voted proxies relating to portfolio securities during the 12 months ended June 30, 2015 is available on the Funds’ website and the SEC’s website.
Quarterly Portfolio Schedules
The Funds file a complete schedule of portfolio holdings with the SEC for the first and third quarters of each fiscal year on Form N-Q. The Funds’ Forms N-Q are available on the SEC’s website at www.sec.gov and may be reviewed and copied at the SEC’s Public Reference Room in Washington, DC. Information on the operation of the Public Reference Room may be obtained by calling 800-SEC-0330.
UNDERSTANDING YOUR FUND’S EXPENSES
As a mutual fund shareholder you incur two types of costs: (1) transaction costs and (2) ongoing costs, including management fees, distribution and/or service fees (12b-1 fees), and other fund expenses. Certain exemptions may apply. These costs are described in more detail in the Funds’ prospectus. The following examples are intended to help you understand the ongoing costs of investing in the Funds and help you compare these with the ongoing costs of investing in other mutual funds.
The first line in the table of each Fund shows the actual amount of Fund expenses you would have paid on a $1,000 investment in the Fund from April 1, 2015 through
| 8
September 30, 2015. To estimate the expenses you paid over the period, simply divide your account value by $1,000 (for example $8,600 account value divided by $1,000 = 8.6) and multiply the result by the number in the Expenses Paid During Period column as shown below for your class.
The second line in the table of each Fund provides information about hypothetical account values and hypothetical expenses based on the Fund’s actual expense ratios and an assumed rate of return of 5% per year before expenses, which is not the Fund’s actual return. The hypothetical account values and expenses may not be used to estimate the actual ending account balance or expenses you paid on your investment for the period. You may use this information to compare the ongoing costs of investing in the Funds to other funds. To do so, compare this 5% hypothetical example with the 5% hypothetical examples that appear in the shareholder reports of other funds.
Please note that the expenses shown reflect ongoing costs only, and do not include any transaction costs. Therefore, the second line in the table is useful in comparing ongoing costs only, and will not help you determine the relative costs of owning different funds. If transaction costs were included, total costs would be higher.
Loomis Sayles Small Cap Growth Fund
| | | | | | | | | | | | |
Institutional Class | | Beginning
Account Value
4/1/2015 | | | Ending
Account Value
9/30/2015 | | | Expenses Paid
During Period*
4/1/2015 – 9/30/2015 | |
Actual | | | $1,000.00 | | | | $919.30 | | | | $4.52 | |
Hypothetical (5% return before expenses) | | | $1,000.00 | | | | $1,020.36 | | | | $4.76 | |
| | | |
Retail Class | | | | | | | | | |
Actual | | | $1,000.00 | | | | $918.40 | | | | $5.72 | |
Hypothetical (5% return before expenses) | | | $1,000.00 | | �� | | $1,019.10 | | | | $6.02 | |
| | | |
Class N | | | | | | | | | |
Actual | | | $1,000.00 | | | | $919.90 | | | | $3.99 | |
Hypothetical (5% return before expenses) | | | $1,000.00 | | | | $1,020.91 | | | | $4.20 | |
* Expenses are equal to the Fund’s annualized expense ratio: 0.94%, 1.19% and 0.83% for Institutional Class, Retail Class and Class N, respectively, multiplied by the average account value over the period, multiplied by the number of days in the most recent fiscal half-year (183), divided by 365 (to reflect the half-year period). | |
9 |
Loomis Sayles Small Cap Value Fund
| | | | | | | | | | | | |
Institutional Class | | Beginning
Account Value
4/1/2015 | | | Ending
Account Value
9/30/2015 | | | Expenses Paid
During Period*
4/1/2015 – 9/30/2015 | |
Actual | | | $1,000.00 | | | | $891.70 | | | | $4.27 | |
Hypothetical (5% return before expenses) | | | $1,000.00 | | | | $1,020.56 | | | | $4.56 | |
| | | |
Retail Class | | | | | | | | | |
Actual | | | $1,000.00 | | | | $890.70 | | | | $5.45 | |
Hypothetical (5% return before expenses) | | | $1,000.00 | | | | $1,019.30 | | | | $5.82 | |
| | | |
Admin Class | | | | | | | | | |
Actual | | | $1,000.00 | | | | $889.40 | | | | $6.63 | |
Hypothetical (5% return before expenses) | | | $1,000.00 | | | | $1,018.05 | | | | $7.08 | |
| | | |
Class N | | | | | | | | | |
Actual | | | $1,000.00 | | | | $892.00 | | | | $3.94 | |
Hypothetical (5% return before expenses) | | | $1,000.00 | | | | $1,020.91 | | | | $4.20 | |
* Expenses are equal to the Fund’s annualized expense ratio (after waiver/reimbursement): 0.90%, 1.15%, 1.40% and 0.83% for Institutional Class, Retail Class, Admin Class and Class N, respectively, multiplied by the average account value over the period, multiplied by the number of days in the most recent fiscal half-year (183), divided by 365 (to reflect the half-year period). | |
Loomis Sayles Small/Mid Cap Growth Fund
| | | | | | | | | | | | |
Institutional Class | | Beginning
Account Value
4/1/20151 | | | Ending
Account Value
9/30/2015 | | | Expenses Paid
During Period*
4/1/20151 – 9/30/2015 | |
Actual | | | $1,000.00 | | | | $905.00 | | | | $2.041 | |
Hypothetical (5% return before expenses) | | | $1,000.00 | | | | $1,020.81 | | | | $4.31* | |
* Hypothetical expenses are equal to the Fund’s annualized expense ratio (after waiver/reimbursement) of 0.85% for Institutional Class, multiplied by the average account value over the period, multiplied by the number of days in the most recent half-year (183), divided by 365 (to reflect the half-year period). | |
1 Fund commenced operations on June 30, 2015. Actual expenses are equal to the Fund's annualized expense ratio (after waiver/reimbursement) of 0.85% for Institutional Class, multiplied by the average account value over the period, multiplied by the number of days in the most recent fiscal period (92), divided by 365 (to reflect the partial period). | |
| 10
BOARD APPROVAL OF ADVISORY AGREEMENTS
The Board of Trustees of the Trusts (the “Board”), including the Independent Trustees, considers matters bearing on each Fund’s advisory agreement (collectively, the “Agreements”) at most of its meetings throughout the year. Each year, usually in the spring, the Contract Review Committee of the Board meets to review the Agreements to determine whether to recommend that the full Board approve the continuation of the Agreements, typically for an additional one-year period. After the Committee has made its recommendation, the full Board, including the Independent Trustees, determines whether to approve the continuation of the Agreements.
In connection with these meetings, the Trustees receive materials that the Funds’ investment adviser (the “Adviser”) believes to be reasonably necessary for the Trustees to evaluate the Agreements. These materials generally include, among other items, (i) information on the investment performance of the Funds and the performance of peer groups and categories of funds and the Funds’ performance benchmarks, (ii) information on the Funds’ advisory fees and other expenses, including information comparing the Funds’ expenses to the fees charged to institutional accounts with similar strategies managed by the Adviser, if any, and to those of peer groups of funds and information about applicable expense caps and/or fee “breakpoints,” (iii) sales and redemption data in respect of the Funds, (iv) information about the profitability of the Agreements to the Adviser and (v) information obtained through the completion by the Adviser of a questionnaire distributed on behalf of the Trustees. The Board, including the Independent Trustees, also considers other matters such as (i) the Adviser’s financial results and/or financial condition, (ii) each Fund’s investment objective and strategies and the size, education and experience of the Adviser’s investment staff and its use of technology, external research and trading cost measurement tools, (iii) arrangements in respect of the distribution of the Funds’ shares and the related costs, (iv) the procedures employed to determine the value of the Funds’ assets, (v) the allocation of the Funds’ brokerage, if any, including, if applicable, allocations to brokers affiliated with the Adviser and the use of “soft” commission dollars to pay Fund expenses and to pay for research and other similar services, (vi) the resources devoted to, and the record of compliance with, the Funds’ investment policies and restrictions, policies on personal securities transactions and other compliance policies, (vii) information about amounts invested by the Funds’ portfolio managers in the Funds or in similar accounts that they manage and (viii) the general economic outlook with particular emphasis on the mutual fund industry. Throughout the process, the Trustees are afforded the opportunity to ask questions of and request additional materials from the Adviser.
In addition to the materials requested by the Trustees in connection with their annual consideration of the continuation of the Agreements, the Trustees receive materials in advance of each regular quarterly meeting of the Board that provide detailed information about the Funds’ investment performance and the fees charged to the Funds for advisory and other services. This information generally includes, among other things, an internal performance rating for each Fund based on agreed-upon criteria, graphs showing each Fund’s performance and fee differentials against each Fund’s peer group/category,
11 |
performance ratings provided by a third-party, total return information for various periods, and third-party performance rankings for various periods comparing a Fund against similarly categorized funds. The portfolio management team for each Fund or other representatives of the Adviser make periodic presentations to the Contract Review Committee and/or the full Board, and Funds identified as presenting possible performance concerns may be subject to more frequent board presentations and reviews. In addition, each quarter the Trustees are provided with detailed statistical information about each Fund’s portfolio. The Trustees also receive periodic updates between meetings.
The Board most recently approved the continuation of the Agreements at its meeting held in June 2015. The Agreements were continued for a one-year period for the Funds. In considering whether to approve the continuation of the Agreements, the Board, including the Independent Trustees, did not identify any single factor as determinative. Individual Trustees may have evaluated the information presented differently from one another, giving different weights to various factors. Matters considered by the Trustees, including the Independent Trustees, in connection with their approval of the Agreements included, but were not limited to, the factors listed below.
The nature, extent and quality of the services provided to the Funds under the Agreements. The Trustees considered the nature, extent and quality of the services provided by the Adviser and its affiliates to the Funds and the resources dedicated to the Funds by the Adviser and its affiliates.
The Trustees considered not only the advisory services provided by the Adviser to the Funds, but also the monitoring and oversight services provided by NGAM Advisors, L.P. (“NGAM Advisors”). They also considered the administrative services provided by NGAM Advisors and its affiliates to the Funds. For each Fund, the Trustees also considered the benefits to shareholders of investing in a mutual fund that is part of a family of funds that offers shareholders the right to exchange shares of one type of fund for shares of another type of fund, and provides a variety of fund and shareholder services.
After reviewing these and related factors, the Trustees concluded, within the context of their overall conclusions regarding each of the Agreements, that the nature, extent and quality of services provided supported the renewal of the Agreements.
Investment performance of the Funds and the Adviser. As noted above, the Trustees received information about the performance of the Funds over various time periods, including information that compared the performance of the Funds to the performance of peer groups and categories of funds and the Funds’ respective performance benchmarks. In addition, the Trustees also reviewed data prepared by an independent third party that analyzed the performance of the Funds using a variety of performance metrics, including metrics that also measured the performance of the Funds on a risk adjusted basis. With respect to each Fund, the Board concluded that the Fund’s performance or other relevant factors supported the renewal of the Agreement relating to that Fund. Although the Trustees noted that each Fund had performance that lagged that of a relevant peer group median and/or category median of funds for certain (although not necessarily all) periods, the Board concluded that other factors relevant to performance supported renewal of the
| 12
relevant Agreement. These factors included one or more of the following: (1) that the underperformance was attributable, to a significant extent, to investment decisions (such as security selection or sector allocation) by the Adviser that were reasonable and consistent with the Fund’s investment objective and policies; (2) that the Fund’s more recent performance was competitive when compared to relevant performance benchmarks or peer groups; and (3) that the Fund’s long-term performance was competitive when compared to relevant performance benchmarks or peer groups.
The Trustees also considered the Adviser’s performance and reputation generally, the performance of the fund family generally, and the historical responsiveness of the Adviser to Trustee concerns about performance and the willingness of the Adviser to take steps intended to improve performance.
After reviewing these and related factors, the Trustees concluded, within the context of their overall conclusions regarding each of the Agreements, that the performance of the Funds and the Adviser supported the renewal of the Agreements.
The costs of the services to be provided and profits to be realized by the Adviser and its affiliates from their respective relationships with the Funds. The Trustees considered the fees charged to the Funds for advisory services as well as the total expense levels of the Funds. This information included comparisons (provided both by management and also by an independent third party) of the Funds’ advisory fees and total expense levels to those of their peer groups and information about the advisory fees charged by the Adviser to comparable accounts (such as institutional separate accounts), as well as information about differences in such fees and the reasons for any such differences. In considering the fees charged to comparable accounts, the Trustees considered, among other things, management’s representations about the differences between managing mutual funds as compared to other types of accounts, including the additional resources required to effectively manage mutual fund assets and the greater regulatory costs associated with the management of such assets. In evaluating each Fund’s advisory fee, the Trustees also took into account the demands, complexity and quality of the investment management of such Fund and the need for the Adviser to offer competitive compensation and to expend additional resources as the Funds grow in size. The Trustees considered that over the past several years, management had made recommendations regarding reductions in advisory fee rates, implementation of advisory fee breakpoints and the institution of advisory fee waivers and expense caps for various funds in the fund family. They noted that both of the Funds in this report have expense caps in place, and they considered the amounts waived or reimbursed by the Adviser for the Loomis Sayles Small Cap Value Fund. The Loomis Sayles Small Cap Growth Fund’s current expenses are below the cap.
The Trustees also considered the compensation directly or indirectly received by the Adviser and its affiliates from their relationships with the Funds. The Trustees reviewed information provided by management as to the profitability of the Adviser and its affiliates’ relationships with the Funds, and information about the allocation of expenses used to calculate profitability. They also reviewed information provided by management about the effect of distribution costs and changes in asset levels on Adviser profitability, including information regarding resources spent on distribution activities. When reviewing
13 |
profitability, the Trustees also considered information about court cases in which adviser compensation or profitability were issues, the performance of the relevant Funds, the expense levels of the Funds, and whether the Adviser had implemented breakpoints and/or expense caps with respect to such Funds.
After reviewing these and related factors, the Trustees concluded, within the context of their overall conclusions regarding each of the Agreements, that the advisory fee charged to each of the Funds was fair and reasonable, and that the costs of these services generally and the related profitability of the Adviser and its affiliates in respect of their relationships with the Funds supported the renewal of the Agreements.
Economies of Scale. The Trustees considered the existence of any economies of scale in the provision of services by the Adviser and whether those economies are shared with the Funds through breakpoints in their investment advisory fees or other means, such as expense waivers or caps. The Trustees also discussed with management the factors considered with respect to the implementation of breakpoints in investment advisory fees or expense waivers or caps for certain funds. Management explained that a number of factors are taken into account in considering the implementation of breakpoints or an expense cap for a fund, including, among other things, factors such as a fund’s assets, the projected growth of a fund, projected profitability and a fund’s fees and performance. With respect to economies of scale, the Trustees noted that although neither Fund’s management fee was subject to breakpoints, each Fund’s management fee and overall net expense ratio was below the median fee for a peer group of funds and that each Fund was subject to an expense cap. In considering these issues, the Trustees also took note of the costs of the services provided (both on an absolute and a relative basis) and the profitability to the Adviser and its affiliates of their relationships with the Funds, as discussed above.
After reviewing these and related factors, the Trustees concluded, within the context of their overall conclusions regarding each of the Agreements, that the extent to which economies of scale were shared with the Funds supported the renewal of the Agreements.
The Trustees also considered other factors, which included but were not limited to the following:
| • | | the effect of recent market and economic events on the performance, asset levels and expense ratios of each Fund. |
| • | | whether each Fund has operated in accordance with its investment objective and the Fund’s record of compliance with its investment restrictions, and the compliance programs of the Funds and the Adviser. They also considered the compliance-related resources the Adviser and its affiliates were providing to the Funds. |
| • | | Plans for maintaining continuity of portfolio management where that was thought to be a potential issue. |
| • | | the nature, quality, cost and extent of administrative and shareholder services performed by the Adviser and its affiliates, both under the Agreements and under separate agreements covering administrative services. |
| 14
| • | | so-called “fallout benefits” to the Adviser, such as the engagement of affiliates of the Adviser to provide distribution, administrative and brokerage services to the Funds, and the benefits of research made available to the Adviser by reason of brokerage commissions (if any) generated by the Funds’ securities transactions. The Trustees also considered the benefits to the parent company of NGAM Advisors from the retention of the Adviser. The Trustees considered the possible conflicts of interest associated with these fallout and other benefits, and the reporting, disclosure and other processes in place to disclose and monitor such possible conflicts of interest. |
| • | | the Trustees’ review and discussion of the Funds’ advisory arrangements in prior years, and management’s record of responding to Trustee concerns raised during the year and in prior years. |
Based on their evaluation of all factors that they deemed to be material, including those factors described above, and assisted by the advice of independent counsel, the Trustees, including the Independent Trustees, concluded that each of the existing Agreements should be continued through June 30, 2016.
15 |
BOARD APPROVAL OF THE INITIAL ADVISORY AGREEMENT
The Investment Company Act of 1940, as amended (the “1940 Act”), requires that both the full Board of Trustees of the Trust and a majority of the Trustees who are not “interested persons” (as defined in the 1940 Act) of the Trust (the “Independent Trustees”), voting separately, initially approve for a two-year term any new investment advisory and sub-advisory agreements for a registered investment company, including newly formed funds such as the Loomis Sayles Small/Mid Cap Growth Fund (the“Fund”). The Trustees, including the Independent Trustees, unanimously approved the proposed investment advisory agreement (the “Agreement”) for the Fund at an in-person meeting held on June 19, 2015.
In connection with this review, Fund management and other representatives of the Fund’s adviser, Loomis, Sayles & Company, L.P. (the “Adviser”), distributed to the Trustees materials including, among other items, (i) information on the proposed advisory fees and other expenses to be charged to the Fund, including information comparing the Fund’s expenses to those of peer groups of funds and information on fees charged to other accounts advised or sub-advised by the Adviser and the proposed expense cap, (ii) the Fund’s investment objective and strategies, (iii) the size, education and experience of the Adviser’s investment staff and the investment strategies proposed to be used in managing the Fund, (iv) proposed arrangements for the distribution of the Fund’s shares, (v) the procedures proposed to be employed to determine the value of the Fund’s assets, (vi) the Fund’s investment policies and restrictions, policies on personal securities transactions and other compliance policies, (vii) information about the Adviser’s performance, and (viii) the general economic outlook with particular emphasis on the mutual fund industry. The Trustees also considered the fact that they oversee other funds advised by the Adviser as well as information about the Adviser they had received in connection with their oversight of those other funds. Because the Fund is newly formed and had not commenced operations at the time of the Trustees’ review, certain information, including data relating to Fund performance, was not available, and therefore could not be distributed to the Trustees. Throughout the process, the Trustees were afforded the opportunity to ask questions of, and request additional materials from, the Adviser.
In considering whether to initially approve the Agreement, the Board of Trustees, including the Independent Trustees, did not identify any single factor as determinative. Individual Trustees may have evaluated the information presented differently from one another, giving weight to various factors. Matters considered by the Trustees, including the Independent Trustees, in connection with their approval of the Agreement included, but were not limited to, the factors listed below:
The nature, extent and quality of the services to be provided to the Fund under the Agreement. The Trustees considered the nature, extent and quality of the services to be provided by the Adviser and its affiliates to the Fund, and the resources to be dedicated to the Fund by the Adviser and its affiliates. The Trustees considered their experience with other funds advised by the Adviser, as well as the affiliation between the Adviser and Natixis Global Asset Management, L.P. (“Natixis US”), whose affiliates provide investment advisory
| 16
services to other funds in the same family of mutual funds. In this regard, the Trustees considered not only the advisory services proposed to be provided by the Adviser to the Fund, but also the monitoring and administrative services proposed to be provided by NGAM Advisors, L.P. (“NGAM Advisors”) and its affiliates to the Fund.
The Trustees also considered the benefits to shareholders of investing in a mutual fund that is part of a family of funds that offers shareholders the right to exchange shares of one type of fund for shares of another type of fund, and provides a variety of fund and shareholder services.
After reviewing these and related factors, the Trustees concluded, within the context of their overall conclusions regarding the Agreement, that the scope of the services to be provided to the Fund under the Agreement seemed consistent with the Fund’s operational requirements, and that the Adviser had the capabilities, resources and personnel necessary to provide the advisory services that would be required by the Fund. The Trustees determined that the nature, extent and quality of services proposed to be provided under the Agreement supported approval of the Agreement.
Investment performance of the Fund and the Adviser. Because the Fund had not yet commenced operations, performance information for the Fund was not considered; however, the Board considered the performance of other funds and accounts managed by the Adviser, including accounts managed in accordance with the Fund’s proposed strategies.
The Trustees also considered the Adviser’s performance and reputation generally, the performance of the fund family generally, and the historical responsiveness of the Adviser to Trustee concerns about performance and the willingness of the Adviser to take steps intended to improve performance.
Based on this and other information, the Trustees concluded, within the context of their overall conclusions regarding the Agreement, that these relevant factors supported approval of the Agreement.
The costs of the services to be provided by the Adviser and its affiliates from its relationship with the Fund. Although the Fund had not yet commenced operations at the time of the Trustees’ review of the Agreement, the Trustees reviewed information comparing the proposed advisory fees and estimated total expenses of the Fund’s share classes with the fees and expenses of comparable share classes of comparable funds identified by the Adviser, as well as information about differences in such fees. In evaluating the fees charged to such comparable accounts, the Trustees considered, among other things, management’s representations about the differences between managing mutual funds as compared to other types of accounts, including the additional resources required to effectively manage, and the greater regulatory costs associated with the management of, mutual fund assets. In evaluating the Fund’s proposed advisory fees, the Trustees also took into account the demands, complexity and quality of the investment management of the Fund and the need for the Adviser to offer competitive compensation. The Trustees also noted that the Fund would have an expense cap in place. In addition, the Trustees considered information regarding the administrative fees to be paid by the Fund to the Adviser’s affiliates.
17 |
Because the Fund had not yet commenced operations, historical profitability information with respect to the Fund was not considered. However, the Trustees noted the information provided in court cases in which adviser profitability was an issue, the estimated expense level of the Fund, and that the Fund would be subject to an expense cap.
After reviewing these and related factors, the Trustees concluded, within the context of their overall conclusions regarding the Agreement, that the advisory fees and expenses proposed to be charged to the Fund were fair and reasonable, and supported the approval of the Agreement.
Economies of scale. The Trustees considered the extent to which the Adviser may realize economies of scale or other efficiencies in managing the Fund, and whether those economies could be shared with the Fund through breakpoints in the advisory fees or other means, such as expense waivers or caps. The Trustees noted that the Fund will be subject to an expense cap. After reviewing these and related factors, the Trustees concluded, within the context of their overall conclusions regarding the Agreement, that the extent to which economies of scale might be shared with the Fund supported the approval of the Agreement.
The Trustees also considered other factors, which included but were not limited to the following:
| • | | The compliance-related resources the Adviser and its affiliates would provide to the Fund. |
| • | | So-called “fallout benefits” to the Adviser, such as the engagement of affiliates of the Adviser to provide distribution and administrative services to the Fund, and the benefits of research made available to the Adviser by reason of brokerage commissions (if any) generated by the Fund’s securities transactions. The Trustees also considered the benefits to the Natixis organization from the retention of the Adviser. The Trustees considered the possible conflicts of interest associated with these fallout and other benefits, and the reporting, disclosure and other processes in place to disclose and monitor such possible conflicts of interest. |
Based on their evaluation of all factors that they deemed to be material, including those factors described above, and assisted by the advice of independent counsel, the Trustees, including the Independent Trustees, concluded that the Agreement should be approved.
| 18
Portfolio of Investments – as of September 30, 2015
Loomis Sayles Small Cap Growth Fund
| | | | | | | | |
| Shares | | | Description | | Value (†) | |
| |
| | Common Stocks – 96.3% of Net Assets | | | | |
| | |
| | | | Aerospace & Defense – 1.6% | | | | |
| | 385,168 | | | DigitalGlobe, Inc.(b) | | $ | 7,325,895 | |
| | 239,132 | | | Hexcel Corp. | | | 10,727,462 | |
| | | | | | | | |
| | | | | | | 18,053,357 | |
| | | | | | | | |
| | | | Air Freight & Logistics – 0.2% | | | | |
| | 112,137 | | | Echo Global Logistics, Inc.(b) | | | 2,197,885 | |
| | | | | | | | |
| | | | Auto Components – 1.0% | | | | |
| | 254,863 | | | Gentherm, Inc.(b) | | | 11,448,446 | |
| | | | | | | | |
| | | | Banks – 5.1% | | | | |
| | 365,917 | | | Bank of the Ozarks, Inc. | | | 16,012,528 | |
| | 260,394 | | | Pinnacle Financial Partners, Inc. | | | 12,866,068 | |
| | 361,894 | | | PrivateBancorp, Inc. | | | 13,871,397 | |
| | 902,582 | | | Talmer Bancorp, Inc., Class A | | | 15,027,990 | |
| | | | | | | | |
| | | | | | | 57,777,983 | |
| | | | | | | | |
| | | | Biotechnology – 6.6% | | | | |
| | 293,294 | | | Acorda Therapeutics, Inc.(b) | | | 7,775,224 | |
| | 474,098 | | | Amicus Therapeutics, Inc.(b) | | | 6,632,631 | |
| | 47,912 | | | Anacor Pharmaceuticals, Inc.(b) | | | 5,639,722 | |
| | 183,533 | | | Chimerix, Inc.(b) | | | 7,010,961 | |
| | 447,878 | | | Emergent Biosolutions, Inc.(b) | | | 12,760,044 | |
| | 218,731 | | | Insys Therapeutics, Inc.(b) | | | 6,225,084 | |
| | 843,966 | | | MiMedx Group, Inc.(b) | | | 8,144,272 | |
| | 160,331 | | | Neurocrine Biosciences, Inc.(b) | | | 6,379,570 | |
| | 72,517 | | | Retrophin, Inc.(b) | | | 1,469,194 | |
| | 119,242 | | | TESARO, Inc.(b) | | | 4,781,604 | |
| | 225,483 | | | Zafgen, Inc.(b) | | | 7,204,182 | |
| | | | | | | | |
| | | | | | | 74,022,488 | |
| | | | | | | | |
| | | | Building Products – 1.8% | | | | |
| | 240,209 | | | Apogee Enterprises, Inc. | | | 10,725,332 | |
| | 282,088 | | | Trex Co., Inc.(b) | | | 9,401,993 | |
| | | | | | | | |
| | | | | | | 20,127,325 | |
| | | | | | | | |
| | | | Capital Markets – 2.0% | | | | |
| | 315,418 | | | Artisan Partners Asset Management, Inc. | | | 11,112,176 | |
| | 350,832 | | | HFF, Inc., Class A | | | 11,844,088 | |
| | | | | | | | |
| | | | | | | 22,956,264 | |
| | | | | | | | |
| | | | Commercial Services & Supplies – 1.4% | | | | |
| | 459,731 | | | Healthcare Services Group, Inc. | | | 15,492,935 | |
| | | | | | | | |
| | | | Communications Equipment – 0.6% | | | | |
| | 317,502 | | | Ciena Corp.(b) | | | 6,578,641 | |
| | | | | | | | |
See accompanying notes to financial statements.
19 |
Portfolio of Investments – as of September 30, 2015
Loomis Sayles Small Cap Growth Fund – continued
| | | | | | | | |
| Shares | | | Description | | Value (†) | |
| |
| | Common Stocks – continued | | | | |
| | |
| | | | Construction & Engineering – 0.8% | | | | |
| | 303,063 | | | Granite Construction, Inc. | | $ | 8,991,879 | |
| | | | | | | | |
| | | | Consumer Finance – 0.9% | | | | |
| | 259,963 | | | Encore Capital Group, Inc.(b) | | | 9,618,631 | |
| | | | | | | | |
| | | | Distributors – 1.4% | | | | |
| | 211,189 | | | Pool Corp. | | | 15,268,965 | |
| | | | | | | | |
| | | | Diversified Consumer Services – 3.6% | | | | |
| | 280,292 | | | 2U, Inc.(b) | | | 10,062,483 | |
| | 265,782 | | | Bright Horizons Family Solutions, Inc.(b) | | | 17,073,836 | |
| | 674,655 | | | Nord Anglia Education, Inc.(b) | | | 13,715,736 | |
| | | | | | | | |
| | | | | | | 40,852,055 | |
| | | | | | | | |
| | | | Diversified Financial Services – 1.3% | | | | |
| | 162,701 | | | MarketAxess Holdings, Inc. | | | 15,111,669 | |
| | | | | | | | |
| | | | Electronic Equipment, Instruments & Components – 2.0% | | | | |
| | 163,779 | | | FEI Co. | | | 11,962,418 | |
| | 141,511 | | | IPG Photonics Corp.(b) | | | 10,750,591 | |
| | | | | | | | |
| | | | | | | 22,713,009 | |
| | | | | | | | |
| | | | Energy Equipment & Services – 0.8% | | | | |
| | 160,293 | | | Dril-Quip, Inc.(b) | | | 9,332,258 | |
| | | | | | | | |
| | | | Food Products – 0.5% | | | | |
| | 117,016 | | | Calavo Growers, Inc. | | | 5,223,594 | |
| | | | | | | | |
| | | | Health Care Equipment & Supplies – 5.6% | | | | |
| | 384,091 | | | Cynosure, Inc., Class A(b) | | | 11,538,094 | |
| | 277,275 | | | Inogen, Inc.(b) | | | 13,461,701 | |
| | 125,499 | | | Insulet Corp.(b) | | | 3,251,679 | |
| | 272,390 | | | LDR Holding Corp.(b) | | | 9,405,627 | |
| | 359,679 | | | Merit Medical Systems, Inc.(b) | | | 8,599,925 | |
| | 282,542 | | | Natus Medical, Inc.(b) | | | 11,146,282 | |
| | 314,772 | | | Quidel Corp.(b) | | | 5,942,895 | |
| | | | | | | | |
| | | | | | | 63,346,203 | |
| | | | | | | | |
| | | | Health Care Providers & Services – 6.1% | | | | |
| | 178,002 | | | Acadia Healthcare Co., Inc.(b) | | | 11,796,193 | |
| | 83,254 | | | Adeptus Health, Inc., Class A(b) | | | 6,723,593 | |
| | 396,949 | | | AMN Healthcare Services, Inc.(b) | | | 11,912,439 | |
| | 224,119 | | | Amsurg Corp.(b) | | | 17,416,288 | |
| | 162,845 | | | Ensign Group, Inc. (The) | | | 6,942,082 | |
| | 267,407 | | | Team Health Holdings, Inc.(b) | | | 14,448,000 | |
| | | | | | | | |
| | | | | | | 69,238,595 | |
| | | | | | | | |
| | | | Health Care Technology – 1.0% | | | | |
| | 277,347 | | | Medidata Solutions, Inc.(b) | | | 11,679,082 | |
| | | | | | | | |
See accompanying notes to financial statements.
| 20
Portfolio of Investments – as of September 30, 2015
Loomis Sayles Small Cap Growth Fund – continued
| | | | | | | | |
| Shares | | | Description | | Value (†) | |
| |
| | Common Stocks – continued | | | | |
| | |
| | | | Hotels, Restaurants & Leisure – 6.2% | | | | |
| | 330,934 | | | Chuy’s Holdings, Inc.(b) | | $ | 9,398,526 | |
| | 345,660 | | | Diamond Resorts International, Inc.(b) | | | 8,084,987 | |
| | 211,476 | | | Popeyes Louisiana Kitchen, Inc.(b) | | | 11,918,787 | |
| | 364,132 | | | Texas Roadhouse, Inc. | | | 13,545,711 | |
| | 149,843 | | | Vail Resorts, Inc. | | | 15,685,565 | |
| | 280,795 | | | Zoe’s Kitchen, Inc.(b) | | | 11,088,595 | |
| | | | | | | | |
| | | | | | | 69,722,171 | |
| | | | | | | | |
| | | | Internet & Catalog Retail – 0.7% | | | | |
| | 224,919 | | | Wayfair, Inc., Class A(b) | | | 7,885,660 | |
| | | | | | | | |
| | | | Internet Software & Services – 4.7% | | | | |
| | 227,279 | | | comScore, Inc.(b) | | | 10,488,926 | |
| | 315,347 | | | Criteo S.A., Sponsored ADR(b) | | | 11,838,126 | |
| | 234,606 | | | Demandware, Inc.(b) | | | 12,124,438 | |
| | 429,633 | | | Q2 Holdings, Inc.(b) | | | 10,620,528 | |
| | 467,920 | | | Wix.com Ltd.(b) | | | 8,151,166 | |
| | | | | | | | |
| | | | | | | 53,223,184 | |
| | | | | | | | |
| | | | IT Services – 4.4% | | | | |
| | 190,924 | | | Blackhawk Network Holdings, Inc.(b) | | | 8,093,268 | |
| | 188,849 | | | EPAM Systems, Inc.(b) | | | 14,073,027 | |
| | 242,723 | | | Euronet Worldwide, Inc.(b) | | | 17,983,347 | |
| | 329,857 | | | InterXion Holding NV(b) | | | 8,932,528 | |
| | | | | | | | |
| | | | | | | 49,082,170 | |
| | | | | | | | |
| | | | Leisure Products – 0.7% | | | | |
| | 183,461 | | | Vista Outdoor, Inc.(b) | | | 8,151,172 | |
| | | | | | | | |
| | | | Life Sciences Tools & Services – 1.8% | | | | |
| | 221,892 | | | Cambrex Corp.(b) | | | 8,804,675 | |
| | 289,415 | | | INC Research Holdings, Inc., Class A(b) | | | 11,576,600 | |
| | | | | | | | |
| | | | | | | 20,381,275 | |
| | | | | | | | |
| | | | Machinery – 3.0% | | | | |
| | 119,817 | | | Middleby Corp. (The)(b) | | | 12,603,550 | |
| | 206,735 | | | Proto Labs, Inc.(b) | | | 13,851,245 | |
| | 115,220 | | | RBC Bearings, Inc.(b) | | | 6,882,091 | |
| | | | | | | | |
| | | | | | | 33,336,886 | |
| | | | | | | | |
| | | | Media – 0.9% | | | | |
| | 293,581 | | | IMAX Corp.(b) | | | 9,920,102 | |
| | | | | | | | |
| | | | Oil, Gas & Consumable Fuels – 1.6% | | | | |
| | 131,535 | | | Diamondback Energy, Inc.(b) | | | 8,497,161 | |
| | 179,675 | | | PDC Energy, Inc.(b) | | | 9,524,572 | |
| | | | | | | | |
| | | | | | | 18,021,733 | |
| | | | | | | | |
See accompanying notes to financial statements.
21 |
Portfolio of Investments – as of September 30, 2015
Loomis Sayles Small Cap Growth Fund – continued
| | | | | | | | |
| Shares | | | Description | | Value (†) | |
| |
| | Common Stocks – continued | | | | |
| | |
| | | | Pharmaceuticals – 2.3% | | | | |
| | 332,606 | | | Flamel Technologies S.A., Sponsored ADR(b) | | $ | 5,424,804 | |
| | 269,086 | | | Impax Laboratories, Inc.(b) | | | 9,474,518 | |
| | 110,525 | | | Intra-Cellular Therapies, Inc.(b) | | | 4,425,421 | |
| | 102,649 | | | ZS Pharma, Inc.(b) | | | 6,739,933 | |
| | | | | | | | |
| | | | | | | 26,064,676 | |
| | | | | | | | |
| | | | Professional Services – 2.2% | | | | |
| | 60,310 | | | Advisory Board Co. (The)(b) | | | 2,746,518 | |
| | 153,938 | | | CEB, Inc. | | | 10,520,123 | |
| | 184,395 | | | Huron Consulting Group, Inc.(b) | | | 11,530,219 | |
| | | | | | | | |
| | | | | | | 24,796,860 | |
| | | | | | | | |
| | | | Road & Rail – 0.7% | | | | |
| | 138,494 | | | Genesee & Wyoming, Inc., Class A(b) | | | 8,182,225 | |
| | | | | | | | |
| | | | Semiconductors & Semiconductor Equipment – 5.9% | | | | |
| | 193,877 | | | Cavium, Inc.(b) | | | 11,898,231 | |
| | 442,419 | | | Inphi Corp.(b) | | | 10,635,753 | |
| | 862,211 | | | Intersil Corp. | | | 10,087,869 | |
| | 327,702 | | | MKS Instruments, Inc. | | | 10,987,848 | |
| | 241,789 | | | Monolithic Power Systems, Inc. | | | 12,379,597 | |
| | 246,961 | | | Silicon Laboratories, Inc.(b) | | | 10,258,760 | |
| | | | | | | | |
| | | | | | | 66,248,058 | |
| | | | | | | | |
| | | | Software – 8.8% | | | | |
| | 27,564 | | | Blackbaud, Inc. | | | 1,546,892 | |
| | 569,982 | | | Callidus Software, Inc.(b) | | | 9,683,994 | |
| | 131,885 | | | Ellie Mae, Inc.(b) | | | 8,779,584 | |
| | 333,161 | | | FleetMatics Group PLC(b) | | | 16,354,874 | |
| | 384,737 | | | Guidewire Software, Inc.(b) | | | 20,229,472 | |
| | 173,979 | | | Imperva, Inc.(b) | | | 11,392,145 | |
| | 221,317 | | | Proofpoint, Inc.(b) | | | 13,349,841 | |
| | 96,615 | | | Ultimate Software Group, Inc. (The)(b) | | | 17,295,051 | |
| | | | | | | | |
| | | | | | | 98,631,853 | |
| | | | | | | | |
| | | | Specialty Retail – 3.6% | | | | |
| | 184,826 | | | Asbury Automotive Group, Inc.(b) | | | 14,998,630 | |
| | 243,154 | | | Monro Muffler Brake, Inc. | | | 16,425,053 | |
| | 99,488 | | | Restoration Hardware Holdings, Inc.(b) | | | 9,283,225 | |
| | | | | | | | |
| | | | | | | 40,706,908 | |
| | | | | | | | |
| | | | Textiles, Apparel & Luxury Goods – 3.3% | | | | |
| | 221,227 | | | Columbia Sportswear Co. | | | 13,005,935 | |
| | 161,767 | | | Oxford Industries, Inc. | | | 11,951,346 | |
| | 338,477 | | | Steven Madden Ltd.(b) | | | 12,395,028 | |
| | | | | | | | |
| | | | | | | 37,352,309 | |
| | | | | | | | |
See accompanying notes to financial statements.
| 22
Portfolio of Investments – as of September 30, 2015
Loomis Sayles Small Cap Growth Fund – continued
| | | | | | | | |
| Shares | | | Description | | Value (†) | |
| |
| | Common Stocks – continued | | | | |
| | |
| | | | Thrifts & Mortgage Finance – 1.2% | | | | |
| | 526,176 | | | Essent Group Ltd.(b) | | $ | 13,075,474 | |
| | | | | | | | |
| | |
| | | | Total Common Stocks
(Identified Cost $960,613,858) | | | 1,084,813,980 | |
| | | | | | | | |
| | |
| Principal
Amount |
| | | | | | |
| |
| | Short-Term Investments – 4.7% | | | | |
| $ | 52,824,100 | | | Tri-Party Repurchase Agreement with Fixed Income Clearing Corporation, dated 9/30/2015 at 0.010% to be repurchased at $52,824,114 on 10/01/2015 collateralized by $53,885,000 U.S. Treasury Note, 1.750% due 3/31/2022 valued at $53,885,000 including accrued interest (Note 2 of Notes to Financial Statements)
(Identified Cost $52,824,100) | | | 52,824,100 | |
| | | | | | | | |
| | |
| | | | Total Investments – 101.0%
(Identified Cost $1,013,437,958)(a) | | | 1,137,638,080 | |
| | | | Other assets less liabilities—(1.0)% | | | (11,259,297 | ) |
| | | | | | | | |
| | | | Net Assets – 100.0% | | $ | 1,126,378,783 | |
| | | | | | | | |
| | |
| | (†) | | | See Note 2 of Notes to Financial Statements. | | | | |
| | (a) | | | Federal Tax Information: | |
| | | | At September 30, 2015, the net unrealized appreciation on investments based on a cost of $1,013,771,679 for federal income tax purposes was as follows: | |
| | | | Aggregate gross unrealized appreciation for all investments in which there is an excess of value over tax cost | | $ | 175,925,721 | |
| | | | Aggregate gross unrealized depreciation for all investments in which there is an excess of tax cost over value | | | (52,059,320 | ) |
| | | | | | | | |
| | | | Net unrealized appreciation | | $ | 123,866,401 | |
| | | | | | | | |
| | (b) | | | Non-income producing security. | |
| |
| | ADR | | | An American Depositary Receipt is a certificate issued by a custodian bank representing the right to receive securities of the foreign issuer described. The values of ADRs may be significantly influenced by trading on exchanges not located in the United States. | |
See accompanying notes to financial statements.
23 |
Portfolio of Investments – as of September 30, 2015
Loomis Sayles Small Cap Growth Fund – continued
Industry Summary at September 30, 2015
| | | | |
Software | | | 8.8 | % |
Biotechnology | | | 6.6 | |
Hotels, Restaurants & Leisure | | | 6.2 | |
Health Care Providers & Services | | | 6.1 | |
Semiconductors & Semiconductor Equipment | | | 5.9 | |
Health Care Equipment & Supplies | | | 5.6 | |
Banks | | | 5.1 | |
Internet Software & Services | | | 4.7 | |
IT Services | | | 4.4 | |
Diversified Consumer Services | | | 3.6 | |
Specialty Retail | | | 3.6 | |
Textiles, Apparel & Luxury Goods | | | 3.3 | |
Machinery | | | 3.0 | |
Pharmaceuticals | | | 2.3 | |
Professional Services | | | 2.2 | |
Capital Markets | | | 2.0 | |
Electronic Equipment, Instruments & Components | | | 2.0 | |
Other Investments, less than 2% each | | | 20.9 | |
Short-Term Investments | | | 4.7 | |
| | | | |
Total Investments | | | 101.0 | |
Other assets less liabilities | | | (1.0 | ) |
| | | | |
Net Assets | | | 100.0 | % |
| | | | |
See accompanying notes to financial statements.
| 24
Portfolio of Investments – as of September 30, 2015
Loomis Sayles Small Cap Value Fund
| | | | | | | | |
| Shares | | | Description | | Value (†) | |
| |
| | Common Stocks – 97.9% of Net Assets | | | | |
| | |
| | | | Aerospace & Defense – 1.3% | | | | |
| | 317,222 | | | BWX Technologies, Inc. | | $ | 8,361,972 | |
| | 281,044 | | | DigitalGlobe, Inc.(b) | | | 5,345,457 | |
| | | | | | | | |
| | | | | | | 13,707,429 | |
| | | | | | | | |
| | | | Auto Components – 2.3% | | | | |
| | 451,308 | | | Fox Factory Holding Corp.(b) | | | 7,609,053 | |
| | 195,841 | | | Horizon Global Corp.(b) | | | 1,727,318 | |
| | 395,941 | | | Metaldyne Performance Group, Inc. | | | 8,318,720 | |
| | 152,747 | | | Tenneco, Inc.(b) | | | 6,838,483 | |
| | | | | | | | |
| | | | | | | 24,493,574 | |
| | | | | | | | |
| | | | Banks – 17.2% | | | | |
| | 494,275 | | | BancorpSouth, Inc. | | | 11,748,917 | |
| | 204,385 | | | Bryn Mawr Bank Corp. | | | 6,350,242 | |
| | 499,290 | | | Cathay General Bancorp | | | 14,958,728 | |
| | 49,434 | | | City National Corp. | | | 4,353,158 | |
| | 560,734 | | | CVB Financial Corp. | | | 9,364,258 | |
| | 569,745 | | | First Financial Bancorp | | | 10,870,735 | |
| | 265,484 | | | First Financial Bankshares, Inc. | | | 8,437,081 | |
| | 216,203 | | | Home BancShares, Inc. | | | 8,756,221 | |
| | 182,679 | | | IBERIABANK Corp. | | | 10,633,744 | |
| | 176,840 | | | LegacyTexas Financial Group, Inc. | | | 5,390,083 | |
| | 260,649 | | | PacWest Bancorp | | | 11,158,384 | |
| | 206,760 | | | Pinnacle Financial Partners, Inc. | | | 10,216,012 | |
| | 299,752 | | | Popular, Inc. | | | 9,061,503 | |
| | 211,501 | | | Prosperity Bancshares, Inc. | | | 10,386,814 | |
| | 118,843 | | | Signature Bank(b) | | | 16,348,043 | |
| | 633,098 | | | Talmer Bancorp, Inc., Class A | | | 10,541,082 | |
| | 157,054 | | | Texas Capital Bancshares, Inc.(b) | | | 8,232,771 | |
| | 139,009 | | | Triumph Bancorp, Inc.(b) | | | 2,335,351 | |
| | 238,400 | | | Wintrust Financial Corp. | | | 12,737,712 | |
| | | | | | | | |
| | | | | | | 181,880,839 | |
| | | | | | | | |
| | | | Beverages – 0.8% | | | | |
| | 789,498 | | | Cott Corp. | | | 8,550,263 | |
| | | | | | | | |
| | | | Building Products – 1.2% | | | | |
| | 139,945 | | | Armstrong World Industries, Inc.(b) | | | 6,680,975 | |
| | 98,359 | | | Masonite International Corp.(b) | | | 5,958,588 | |
| | | | | | | | |
| | | | | | | 12,639,563 | |
| | | | | | | | |
| | | | Capital Markets – 1.2% | | | | |
| | 177,681 | | | Safeguard Scientifics, Inc.(b) | | | 2,761,163 | |
| | 228,175 | | | Stifel Financial Corp.(b) | | | 9,606,167 | |
| | | | | | | | |
| | | | | | | 12,367,330 | |
| | | | | | | | |
See accompanying notes to financial statements.
25 |
Portfolio of Investments – as of September 30, 2015
Loomis Sayles Small Cap Value Fund – continued
| | | | | | | | |
| Shares | | | Description | | Value (†) | |
| |
| | Common Stocks – continued | | | | |
| | |
| | | | Chemicals – 1.1% | | | | |
| | 108,174 | | | Cabot Corp. | | $ | 3,413,972 | |
| | 143,561 | | | Minerals Technologies, Inc. | | | 6,913,898 | |
| | 344,990 | | | Tronox Ltd., Class A | | | 1,507,606 | |
| | | | | | | | |
| | | | | | | 11,835,476 | |
| | | | | | | | |
| | | | Commercial Services & Supplies – 3.7% | | | | |
| | 345,742 | | | KAR Auction Services, Inc. | | | 12,273,841 | |
| | 235,563 | | | Knoll, Inc. | | | 5,177,675 | |
| | 208,319 | | | Viad Corp. | | | 6,039,168 | |
| | 130,366 | | | Waste Connections, Inc. | | | 6,333,180 | |
| | 388,044 | | | West Corp. | | | 8,692,185 | |
| | | | | | | | |
| | | | | | | 38,516,049 | |
| | | | | | | | |
| | | | Communications Equipment – 1.2% | | | | |
| | 203,510 | | | ARRIS Group, Inc.(b) | | | 5,285,155 | |
| | 523,445 | | | Calix, Inc.(b) | | | 4,077,636 | |
| | 310,315 | | | Digi International, Inc.(b) | | | 3,658,614 | |
| | | | | | | | |
| | | | | | | 13,021,405 | |
| | | | | | | | |
| | | | Construction & Engineering – 0.9% | | | | |
| | 71,594 | | | Argan, Inc. | | | 2,482,880 | |
| | 275,303 | | | MYR Group, Inc.(b) | | | 7,212,939 | |
| | | | | | | | |
| | | | | | | 9,695,819 | |
| | | | | | | | |
| | | | Construction Materials – 0.4% | | | | |
| | 209,429 | | | Summit Materials, Inc., Class A(b) | | | 3,930,982 | |
| | | | | | | | |
| | | | Consumer Finance – 0.3% | | | | |
| | 14,933 | | | Credit Acceptance Corp.(b) | | | 2,939,860 | |
| | | | | | | | |
| | | | Distributors – 0.9% | | | | |
| | 143,568 | | | Core-Mark Holding Co., Inc. | | | 9,396,526 | |
| | | | | | | | |
| | | | Diversified Financial Services – 1.2% | | | | |
| | 633,112 | | | FNFV Group(b) | | | 7,420,073 | |
| | 58,041 | | | MarketAxess Holdings, Inc. | | | 5,390,848 | |
| | | | | | | | |
| | | | | | | 12,810,921 | |
| | | | | | | | |
| | | | Electric Utilities – 1.5% | | | | |
| | 243,095 | | | ALLETE, Inc. | | | 12,273,867 | |
| | 78,615 | | | UIL Holdings Corp. | | | 3,951,976 | |
| | | | | | | | |
| | | | | | | 16,225,843 | |
| | | | | | | | |
| | | | Electrical Equipment – 1.7% | | | | |
| | 62,827 | | | AZZ, Inc. | | | 3,059,047 | |
| | 431,497 | | | Babcock & Wilcox Enterprises, Inc.(b) | | | 7,249,149 | |
| | 133,840 | | | EnerSys | | | 7,171,147 | |
| | | | | | | | |
| | | | | | | 17,479,343 | |
| | | | | | | | |
See accompanying notes to financial statements.
| 26
Portfolio of Investments – as of September 30, 2015
Loomis Sayles Small Cap Value Fund – continued
| | | | | | | | |
| Shares | | | Description | | Value (†) | |
| |
| | Common Stocks – continued | | | | |
| | |
| | | | Electronic Equipment, Instruments & Components – 4.3% | | | | |
| | 149,198 | | | Belden, Inc. | | $ | 6,966,055 | |
| | 147,369 | | | Littelfuse, Inc. | | | 13,432,684 | |
| | 200,908 | | | Methode Electronics, Inc. | | | 6,408,965 | |
| | 166,356 | | | Rogers Corp.(b) | | | 8,846,812 | |
| | 328,817 | | | Vishay Intertechnology, Inc. | | | 3,186,237 | |
| | 78,665 | | | Zebra Technologies Corp., Class A(b) | | | 6,021,806 | |
| | | | | | | | |
| | | | | | | 44,862,559 | |
| | | | | | | | |
| | | | Energy Equipment & Services – 1.4% | | | | |
| | 158,279 | | | Bristow Group, Inc. | | | 4,140,579 | |
| | 655,627 | | | Helix Energy Solutions Group, Inc.(b) | | | 3,140,453 | |
| | 211,268 | | | Natural Gas Services Group, Inc.(b) | | | 4,077,472 | |
| | 1,386,770 | | | Parker Drilling Co.(b) | | | 3,647,205 | |
| | | | | | | | |
| | | | | | | 15,005,709 | |
| | | | | | | | |
| | | | Food & Staples Retailing – 0.8% | |
| | 325,761 | | | SpartanNash Co. | | | 8,420,922 | |
| | | | | | | | |
| | | | Food Products – 1.9% | |
| | 328,780 | | | Boulder Brands, Inc.(b) | | | 2,692,708 | |
| | 28,478 | | | J & J Snack Foods Corp. | | | 3,236,810 | |
| | 240,763 | | | Post Holdings, Inc.(b) | | | 14,229,093 | |
| | | | | | | | |
| | | | | | | 20,158,611 | |
| | | | | | | | |
| | | | Health Care Equipment & Supplies – 2.2% | |
| | 153,448 | | | Cynosure, Inc., Class A(b) | | | 4,609,578 | |
| | 221,646 | | | Halyard Health, Inc.(b) | | | 6,303,612 | |
| | 170,898 | | | SurModics, Inc.(b) | | | 3,732,413 | |
| | 69,153 | | | Teleflex, Inc. | | | 8,589,494 | |
| | | | | | | | |
| | | | | | | 23,235,097 | |
| | | | | | | | |
| | | | Health Care Providers & Services – 0.5% | |
| | 65,656 | | | WellCare Health Plans, Inc.(b) | | | 5,658,234 | |
| | | | | | | | |
| | | | Hotels, Restaurants & Leisure – 5.0% | |
| | 309,088 | | | Carrols Restaurant Group, Inc.(b) | | | 3,678,147 | |
| | 106,867 | | | Churchill Downs, Inc. | | | 14,299,873 | |
| | 26,119 | | | Cracker Barrel Old Country Store, Inc. | | | 3,846,806 | |
| | 171,951 | | | Del Frisco’s Restaurant Group, Inc.(b) | | | 2,388,399 | |
| | 329,509 | | | Diamond Resorts International, Inc.(b) | | | 7,707,216 | |
| | 109,351 | | | J. Alexander’s Holdings, Inc.(b) | | | 1,090,231 | |
| | 137,191 | | | Marriott Vacations Worldwide Corp. | | | 9,348,195 | |
| | 231,721 | | | Six Flags Entertainment Corp. | | | 10,608,187 | |
| | | | | | | | |
| | | | | | | 52,967,054 | |
| | | | | | | | |
| | | | Household Durables – 2.2% | |
| | 31,629 | | | Helen of Troy Ltd.(b) | | | 2,824,470 | |
See accompanying notes to financial statements.
27 |
Portfolio of Investments – as of September 30, 2015
Loomis Sayles Small Cap Value Fund – continued
| | | | | | | | |
| Shares | | | Description | | Value (†) | |
| |
| | Common Stocks – continued | | | | |
| |
| | | | Household Durables – continued | |
| | 183,588 | | | Jarden Corp.(b) | | $ | 8,973,781 | |
| | 103,531 | | | La-Z-Boy, Inc. | | | 2,749,783 | |
| | 252,996 | | | Libbey, Inc. | | | 8,250,200 | |
| | | | | | | | |
| | | | | | | 22,798,234 | |
| | | | | | | | |
| | | | Industrial Conglomerates – 0.5% | |
| | 301,400 | | | Raven Industries, Inc. | | | 5,108,730 | |
| | | | | | | | |
| | | | Insurance – 3.1% | |
| | 489,245 | | | Employers Holdings, Inc. | | | 10,905,271 | |
| | 35,058 | | | HCC Insurance Holdings, Inc. | | | 2,715,943 | |
| | 181,171 | | | ProAssurance Corp. | | | 8,890,061 | |
| | 111,529 | | | Reinsurance Group of America, Inc., Class A | | | 10,103,412 | |
| | | | | | | | |
| | | | | | | 32,614,687 | |
| | | | | | | | |
| | | | Internet & Catalog Retail – 1.2% | |
| | 123,622 | | | HSN, Inc. | | | 7,076,123 | |
| | 130,426 | | | Liberty Ventures, Series A(b) | | | 5,262,689 | |
| | | | | | | | |
| | | | | | | 12,338,812 | |
| | | | | | | | |
| | | | IT Services – 6.0% | |
| | 321,390 | | | Booz Allen Hamilton Holding Corp. | | | 8,423,632 | |
| | 390,625 | | | Convergys Corp. | | | 9,027,344 | |
| | 262,300 | | | CSG Systems International, Inc. | | | 8,078,840 | |
| | 103,219 | | | DST Systems, Inc. | | | 10,852,446 | |
| | 166,019 | | | Euronet Worldwide, Inc.(b) | | | 12,300,348 | |
| | 340,631 | | | Perficient, Inc.(b) | | | 5,255,936 | |
| | 113,774 | | | WEX, Inc.(b) | | | 9,880,134 | |
| | | | | | | | |
| | | | | | | 63,818,680 | |
| | | | | | | | |
| | | | Life Sciences Tools & Services – 0.8% | |
| | 324,561 | | | VWR Corp.(b) | | | 8,337,972 | |
| | | | | | | | |
| | | | Machinery – 4.7% | |
| | 76,178 | | | Alamo Group, Inc. | | | 3,561,321 | |
| | 194,753 | | | Albany International Corp., Class A | | | 5,571,883 | |
| | 174,249 | | | Altra Industrial Motion Corp. | | | 4,028,637 | |
| | 372,123 | | | John Bean Technologies Corp. | | | 14,233,705 | |
| | 156,818 | | | RBC Bearings, Inc.(b) | | | 9,366,739 | |
| | 268,633 | | | TriMas Corp.(b) | | | 4,392,150 | |
| | 93,820 | | | Wabtec Corp. | | | 8,260,851 | |
| | | | | | | | |
| | | | | | | 49,415,286 | |
| | | | | | | | |
| | | | Marine – 0.5% | |
| | 77,157 | | | Kirby Corp.(b) | | | 4,779,876 | |
| | | | | | | | |
See accompanying notes to financial statements.
| 28
Portfolio of Investments – as of September 30, 2015
Loomis Sayles Small Cap Value Fund – continued
| | | | | | | | |
| Shares | | | Description | | Value (†) | |
| |
| | Common Stocks – continued | | | | |
| |
| | | | Media – 4.0% | |
| | 297,021 | | | Carmike Cinemas, Inc.(b) | | $ | 5,967,152 | |
| | 439,086 | | | E.W. Scripps Co. (The), Class A | | | 7,758,649 | |
| | 158,806 | | | John Wiley & Sons, Inc., Class A | | | 7,945,064 | |
| | 549,516 | | | National CineMedia, Inc. | | | 7,374,505 | |
| | 559,058 | | | New Media Investment Group, Inc. | | | 8,643,037 | |
| | 258,038 | | | Time, Inc. | | | 4,915,624 | |
| | | | | | | | |
| | | | | | | 42,604,031 | |
| | | | | | | | |
| | | | Metals & Mining – 1.4% | |
| | 322,094 | | | Globe Specialty Metals, Inc. | | | 3,907,000 | |
| | 172,244 | | | Haynes International, Inc. | | | 6,517,713 | |
| | 289,777 | | | Horsehead Holding Corp.(b) | | | 880,922 | |
| | 494,790 | | | SunCoke Energy, Inc. | | | 3,849,466 | |
| | | | | | | | |
| | | | | | | 15,155,101 | |
| | | | | | | | |
| | | | Multi-Utilities – 1.1% | |
| | 204,934 | | | NorthWestern Corp. | | | 11,031,597 | |
| | | | | | | | |
| | | | Multiline Retail – 0.3% | |
| | 288,924 | | | Fred’s, Inc., Class A | | | 3,423,749 | |
| | | | | | | | |
| | | | Oil, Gas & Consumable Fuels – 0.8% | |
| | 295,474 | | | QEP Resources, Inc. | | | 3,702,289 | |
| | 526,235 | | | Synergy Resources Corp.(b) | | | 5,157,103 | |
| | | | | | | | |
| | | | | | | 8,859,392 | |
| | | | | | | | |
| | | | Pharmaceuticals – 0.7% | |
| | 304,594 | | | Catalent, Inc.(b) | | | 7,401,634 | |
| | | | | | | | |
| | | | Professional Services – 1.5% | |
| | 226,711 | | | FTI Consulting, Inc.(b) | | | 9,410,774 | |
| | 490,539 | | | RPX Corp.(b) | | | 6,730,195 | |
| | | | | | | | |
| | | | | | | 16,140,969 | |
| | | | | | | | |
| | | | REITs – Apartments – 1.7% | |
| | 209,828 | | | American Campus Communities, Inc. | | | 7,604,167 | |
| | 130,670 | | | Mid-America Apartment Communities, Inc. | | | 10,697,953 | |
| | | | | | | | |
| | | | | | | 18,302,120 | |
| | | | | | | | |
| | | | REITs – Health Care – 0.7% | | | | |
| | 127,521 | | | Omega Healthcare Investors, Inc. | | | 4,482,363 | |
| | 112,953 | | | Sabra Healthcare REIT, Inc. | | | 2,618,251 | |
| | | | | | | | |
| | | | | | | 7,100,614 | |
| | | | | | | | |
| | | | REITs – Hotels – 0.6% | | | | |
| | 298,295 | | | Hersha Hospitality Trust | | | 6,759,365 | |
| | | | | | | | |
See accompanying notes to financial statements.
29 |
Portfolio of Investments – as of September 30, 2015
Loomis Sayles Small Cap Value Fund – continued
| | | | | | | | |
| Shares | | | Description | | Value (†) | |
| |
| | Common Stocks – continued | | | | |
| | |
| | | | REITs – Office Property – 0.8% | | | | |
| | 391,510 | | | BioMed Realty Trust, Inc. | | $ | 7,822,370 | |
| | | | | | | | |
| | | | REITs – Shopping Centers – 1.1% | | | | |
| | 724,312 | | | Retail Opportunity Investments Corp. | | | 11,980,121 | |
| | | | | | | | |
| | | | REITs – Single Tenant – 0.6% | | | | |
| | 167,884 | | | National Retail Properties, Inc. | | | 6,089,153 | |
| | | | | | | | |
| | | | REITs – Storage – 2.2% | | | | |
| | 476,518 | | | CubeSmart | | | 12,966,055 | |
| | 111,124 | | | Sovran Self Storage, Inc. | | | 10,478,993 | |
| | | | | | | | |
| | | | | | | 23,445,048 | |
| | | | | | | | |
| | | | Road & Rail – 1.5% | | | | |
| | 110,195 | | | Avis Budget Group, Inc.(b) | | | 4,813,318 | |
| | 60,044 | | | Genesee & Wyoming, Inc., Class A(b) | | | 3,547,399 | |
| | 114,466 | | | Old Dominion Freight Line, Inc.(b) | | | 6,982,426 | |
| | | | | | | | |
| | | | | | | 15,343,143 | |
| | | | | | | | |
| | | | Semiconductors & Semiconductor Equipment – 2.0% | | | | |
| | 217,129 | | | Advanced Energy Industries, Inc.(b) | | | 5,710,493 | |
| | 246,237 | | | Diodes, Inc.(b) | | | 5,262,085 | |
| | 173,703 | | | Semtech Corp.(b) | | | 2,622,915 | |
| | 386,510 | | | Teradyne, Inc. | | | 6,961,045 | |
| | | | | | | | |
| | | | | | | 20,556,538 | |
| | | | | | | | |
| | | | Software – 1.3% | | | | |
| | 200,858 | | | Synchronoss Technologies, Inc.(b) | | | 6,588,143 | |
| | 173,981 | | | Verint Systems, Inc.(b) | | | 7,507,280 | |
| | | | | | | | |
| | | | | | | 14,095,423 | |
| | | | | | | | |
| | | | Specialty Retail – 2.3% | | | | |
| | 256,610 | | | Barnes & Noble Education, Inc.(b) | | | 3,261,513 | |
| | 270,990 | | | Barnes & Noble, Inc. | | | 3,281,689 | |
| | 152,955 | | | Genesco, Inc.(b) | | | 8,729,142 | |
| | 323,945 | | | MarineMax, Inc.(b) | | | 4,577,343 | |
| | 202,581 | | | Sally Beauty Holdings, Inc.(b) | | | 4,811,298 | |
| | | | | | | | |
| | | | | | | 24,660,985 | |
| | | | | | | | |
| | | | Thrifts & Mortgage Finance – 0.3% | | | | |
| | 138,484 | | | Federal Agricultural Mortgage Corp., Class C | | | 3,590,890 | |
| | | | | | | | |
| | | | Trading Companies & Distributors – 0.4% | | | | |
| | 276,178 | | | H&E Equipment Services, Inc. | | | 4,617,696 | |
| | | | | | | | |
| | | | Transportation Infrastructure – 0.6% | | | | |
| | 87,631 | | | Macquarie Infrastructure Corp. | | | 6,542,530 | |
| | | | | | | | |
| | |
| | | | Total Common Stocks
(Identified Cost $794,790,207) | | | 1,034,534,154 | |
| | | | | | | | |
See accompanying notes to financial statements.
| 30
Portfolio of Investments – as of September 30, 2015
Loomis Sayles Small Cap Value Fund – continued
| | | | | | | | |
| Shares | | | Description | | Value (†) | |
| |
| | Closed-End Investment Companies – 0.5% | | | | |
| | 486,012 | | | Hercules Technology Growth Capital, Inc. (Identified Cost $6,305,502) | | $ | 4,913,581 | |
| | | | | | | | |
| | |
| Principal
Amount |
| | | | | | |
| |
| | Short-Term Investments – 1.6% | | | | |
| $ | 17,043,053 | | | Tri-Party Repurchase Agreement with Fixed Income Clearing Corporation, dated 9/30/2015 at 0.010% to be repurchased at $17,043,057 on 10/01/2015 collateralized by $17,345,000 U.S. Treasury Note, 1.750% due 2/28/2022 valued at $17,388,363 including accrued interest (Note 2 of Notes to Financial Statements) (Identified Cost $17,043,053) | | | 17,043,053 | |
| | | | | | | | |
| | |
| | | | Total Investments – 100.0%
(Identified Cost $818,138,762)(a) | | | 1,056,490,788 | |
| | | | Other assets less liabilities—0.0% | | | 294,010 | |
| | | | | | | | |
| | | | Net Assets – 100.0% | | $ | 1,056,784,798 | |
| | | | | | | | |
| | |
| | (†) | | | See Note 2 of Notes to Financial Statements. | | | | |
| | (a) | | | Federal Tax Information: | | | | |
| | | | At September 30, 2015, the net unrealized appreciation on investments based on a cost of $816,167,316 for federal income tax purposes was as follows: | |
| | | | Aggregate gross unrealized appreciation for all investments in which there is an excess of value over tax cost | | $ | 302,004,555 | |
| | | | Aggregate gross unrealized depreciation for all investments in which there is an excess of tax cost over value | | | (61,681,083 | ) |
| | | | | | | | |
| | | | Net unrealized appreciation | | $ | 240,323,472 | |
| | | | | | | | |
| | (b) | | | Non-income producing security. | | | | |
| | |
| | REITs | | | Real Estate Investment Trusts | | | | |
See accompanying notes to financial statements.
31 |
Portfolio of Investments – as of September 30, 2015
Loomis Sayles Small Cap Value Fund – continued
Industry Summary at September 30, 2015
| | | | |
Banks | | | 17.2 | % |
IT Services | | | 6.0 | |
Hotels, Restaurants & Leisure | | | 5.0 | |
Machinery | | | 4.7 | |
Electronic Equipment, Instruments & Components | | | 4.3 | |
Media | | | 4.0 | |
Commercial Services & Supplies | | | 3.7 | |
Insurance | | | 3.1 | |
Specialty Retail | | | 2.3 | |
Auto Components | | | 2.3 | |
REITs – Storage | | | 2.2 | |
Health Care Equipment & Supplies | | | 2.2 | |
Household Durables | | | 2.2 | |
Semiconductors & Semiconductor Equipment | | | 2.0 | |
Other Investments, less than 2% each | | | 37.2 | |
Short-Term Investments | | | 1.6 | |
| | | | |
Total Investments | | | 100.0 | |
Other assets less liabilities | | | 0.0 | |
| | | | |
Net Assets | | | 100.0 | % |
| | | | |
See accompanying notes to financial statements.
| 32
Portfolio of Investments – as of September 30, 2015
Loomis Sayles Small/Mid Cap Growth Fund
| | | | | | | | |
| Shares | | | Description | | Value (†) | |
| |
| | Common Stocks – 95.6% of Net Assets | | | | |
| | |
| | | | Aerospace & Defense – 3.3% | | | | |
| | 1,324 | | | Astronics Corp.(b) | | $ | 53,529 | |
| | 2,570 | | | Hexcel Corp. | | | 115,290 | |
| | 655 | | | TransDigm Group, Inc.(b) | | | 139,129 | |
| | | | | | | | |
| | | | | | | 307,948 | |
| | | | | | | | |
| | | | Airlines – 1.0% | | | | |
| | 442 | | | Allegiant Travel Co. | | | 95,583 | |
| | | | | | | | |
| | | | Auto Components – 1.2% | | | | |
| | 2,033 | | | Drew Industries, Inc. | | | 111,022 | |
| | | | | | | | |
| | | | Banks – 4.2% | | | | |
| | 2,425 | | | First Republic Bank | | | 152,217 | |
| | 1,031 | | | Signature Bank(b) | | | 141,824 | |
| | 3,019 | | | Western Alliance Bancorp(b) | | | 92,714 | |
| | | | | | | | |
| | | | | | | 386,755 | |
| | | | | | | | |
| | | | Biotechnology – 3.6% | | | | |
| | 2,770 | | | Acorda Therapeutics, Inc.(b) | | | 73,433 | |
| | 1,789 | | | Alkermes PLC(b) | | | 104,961 | |
| | 1,692 | | | Cepheid, Inc.(b) | | | 76,478 | |
| | 1,836 | | | Medivation, Inc.(b) | | | 78,030 | |
| | | | | | | | |
| | | | | | | 332,902 | |
| | | | | | | | |
| | | | Capital Markets – 2.6% | | | | |
| | 632 | | | Affiliated Managers Group, Inc.(b) | | | 108,065 | |
| | 2,777 | | | SEI Investments Co. | | | 133,935 | |
| | | | | | | | |
| | | | | | | 242,000 | |
| | | | | | | | |
| | | | Commercial Services & Supplies – 2.8% | | | | |
| | 4,949 | | | Healthcare Services Group, Inc. | | | 166,781 | |
| | 3,583 | | | Ritchie Bros. Auctioneers, Inc. | | | 92,728 | |
| | | | | | | | |
| | | | | | | 259,509 | |
| | | | | | | | |
| | | | Communications Equipment – 1.3% | | | | |
| | 693 | | | Palo Alto Networks, Inc.(b) | | | 119,196 | |
| | | | | | | | |
| | | | Consumer Finance – 1.2% | | | | |
| | 2,061 | | | PRA Group, Inc.(b) | | | 109,068 | |
| | | | | | | | |
| | | | Diversified Consumer Services – 2.5% | | | | |
| | 1,551 | | | Bright Horizons Family Solutions, Inc.(b) | | | 99,636 | |
| | 6,272 | | | Nord Anglia Education, Inc.(b) | | | 127,510 | |
| | | | | | | | |
| | | | | | | 227,146 | |
| | | | | | | | |
| | | | Diversified Financial Services – 1.3% | | | | |
| | 1,269 | | | MarketAxess Holdings, Inc. | | | 117,865 | |
| | | | | | | | |
See accompanying notes to financial statements.
33 |
Portfolio of Investments – as of September 30, 2015
Loomis Sayles Small/Mid Cap Growth Fund – continued
| | | | | | | | |
| Shares | | | Description | | Value (†) | |
| |
| | Common Stocks – continued | | | | |
| | |
| | | | Electrical Equipment – 2.4% | | | | |
| | 754 | | | Acuity Brands, Inc. | | $ | 132,387 | |
| | 2,035 | | | Sensata Technologies Holding NV(b) | | | 90,232 | |
| | | | | | | | |
| | | | | | | 222,619 | |
| | | | | | | | |
| | | | Electronic Equipment, Instruments & Components – 1.1% | | | | |
| | 1,373 | | | FEI Co. | | | 100,284 | |
| | | | | | | | |
| | | | Energy Equipment & Services – 1.6% | | | | |
| | 1,331 | | | Dril-Quip, Inc.(b) | | | 77,491 | |
| | 1,838 | | | Oceaneering International, Inc. | | | 72,196 | |
| | | | | | | | |
| | | | | | | 149,687 | |
| | | | | | | | |
| | | | Food & Staples Retailing – 1.4% | | | | |
| | 1,244 | | | Casey’s General Stores, Inc. | | | 128,032 | |
| | | | | | | | |
| | | | Health Care Equipment & Supplies – 4.5% | | | | |
| | 2,935 | | | Cantel Medical Corp. | | | 166,414 | |
| | 1,414 | | | DexCom, Inc.(b) | | | 121,406 | |
| | 2,290 | | | West Pharmaceutical Services, Inc. | | | 123,935 | |
| | | | | | | | |
| | | | | | | 411,755 | |
| | | | | | | | |
| | | | Health Care Providers & Services – 7.4% | | | | |
| | 2,792 | | | Brookdale Senior Living, Inc.(b) | | | 64,104 | |
| | 3,822 | | | Envision Healthcare Holdings, Inc.(b) | | | 140,612 | |
| | 1,660 | | | MEDNAX, Inc.(b) | | | 127,472 | |
| | 2,046 | | | Team Health Holdings, Inc.(b) | | | 110,545 | |
| | 1,862 | | | VCA, Inc.(b) | | | 98,034 | |
| | 1,671 | | | WellCare Health Plans, Inc.(b) | | | 144,007 | |
| | | | | | | | |
| | | | | | | 684,774 | |
| | | | | | | | |
| | | | Health Care Technology – 2.1% | | | | |
| | 6,329 | | | Evolent Health, Inc., Class A(b) | | | 101,011 | |
| | 4,273 | | | HealthStream, Inc.(b) | | | 93,194 | |
| | | | | | | | |
| | | | | | | 194,205 | |
| | | | | | | | |
| | | | Hotels, Restaurants & Leisure – 5.6% | | | | |
| | 2,895 | | | Dunkin’ Brands Group, Inc. | | | 141,855 | |
| | 399 | | | Panera Bread Co., Class A(b) | | | 77,171 | |
| | 4,176 | | | Texas Roadhouse, Inc. | | | 155,347 | |
| | 1,379 | | | Vail Resorts, Inc. | | | 144,354 | |
| | | | | | | | |
| | | | | | | 518,727 | |
| | | | | | | | |
| | | | Internet Software & Services – 5.0% | | | | |
| | 785 | | | CoStar Group, Inc.(b) | | | 135,852 | |
| | 1,166 | | | j2 Global, Inc. | | | 82,611 | |
| | 2,076 | | | SPS Commerce, Inc.(b) | | | 140,940 | |
| | 1,455 | | | Stamps.com, Inc.(b) | | | 107,684 | |
| | | | | | | | |
| | | | | | | 467,087 | |
| | | | | | | | |
See accompanying notes to financial statements.
| 34
Portfolio of Investments – as of September 30, 2015
Loomis Sayles Small/Mid Cap Growth Fund – continued
| | | | | | | | |
| Shares | | | Description | | Value (†) | |
| |
| | Common Stocks – continued | | | | |
| | |
| | | | IT Services – 4.3% | | | | |
| | 1,742 | | | Gartner, Inc.(b) | | $ | 146,206 | |
| | 1,295 | | | MAXIMUS, Inc. | | | 77,130 | |
| | 3,404 | | | Virtusa Corp.(b) | | | 174,660 | |
| | | | | | | | |
| | | | | | | 397,996 | |
| | | | | | | | |
| | | | Leisure Products – 1.4% | | | | |
| | 2,751 | | | Brunswick Corp. | | | 131,745 | |
| | | | | | | | |
| | | | Life Sciences Tools & Services – 1.5% | | | | |
| | 1,940 | | | ICON PLC(b) | | | 137,682 | |
| | | | | | | | |
| | | | Machinery – 2.3% | | | | |
| | 1,204 | | | Middleby Corp. (The)(b) | | | 126,649 | |
| | 3,103 | | | Sun Hydraulics Corp. | | | 85,239 | |
| | | | | | | | |
| | | | | | | 211,888 | |
| | | | | | | | |
| | | | Media – 2.4% | | | | |
| | 1,452 | | | AMC Networks, Inc., Class A(b) | | | 106,243 | |
| | 3,321 | | | IMAX Corp.(b) | | | 112,216 | |
| | | | | | | | |
| | | | | | | 218,459 | |
| | | | | | | | |
| | | | Oil, Gas & Consumable Fuels – 1.5% | | | | |
| | 1,145 | | | Diamondback Energy, Inc.(b) | | | 73,967 | |
| | 4,406 | | | Parsley Energy, Inc., Class A(b) | | | 66,398 | |
| | | | | | | | |
| | | | | | | 140,365 | |
| | | | | | | | |
| | | | Pharmaceuticals – 2.7% | | | | |
| | 2,017 | | | Intra-Cellular Therapies, Inc.(b) | | | 80,761 | |
| | 755 | | | Jazz Pharmaceuticals PLC(b) | | | 100,272 | |
| | 984 | | | ZS Pharma, Inc.(b) | | | 64,609 | |
| | | | | | | | |
| | | | | | | 245,642 | |
| | | | | | | | |
| | | | Professional Services – 1.0% | | | | |
| | 1,350 | | | CEB, Inc. | | | 92,259 | |
| | | | | | | | |
| | | | Real Estate Management & Development – 2.9% | | | | |
| | 996 | | | Jones Lang LaSalle, Inc. | | | 143,195 | |
| | 2,792 | | | Marcus & Millichap, Inc.(b) | | | 128,404 | |
| | | | | | | | |
| | | | | | | 271,599 | |
| | | | | | | | |
| | | | Road & Rail – 0.8% | | | | |
| | 1,232 | | | Genesee & Wyoming, Inc., Class A(b) | | | 72,787 | |
| | | | | | | | |
| | | | Semiconductors & Semiconductor Equipment – 1.8% | | | | |
| | 2,595 | | | M/A-COM Technology Solutions Holdings, Inc.(b) | | | 75,229 | |
| | 2,314 | | | Silicon Laboratories, Inc.(b) | | | 96,124 | |
| | | | | | | | |
| | | | | | | 171,353 | |
| | | | | | | | |
See accompanying notes to financial statements.
35 |
Portfolio of Investments – as of September 30, 2015
Loomis Sayles Small/Mid Cap Growth Fund – continued
| | | | | | | | |
| Shares | | | Description | | Value (†) | |
| |
| | Common Stocks – continued | | | | |
| | |
| | | | Software – 9.1% | | | | |
| | 2,553 | | | Blackbaud, Inc. | | $ | 143,274 | |
| | 2,777 | | | Fortinet, Inc.(b) | | | 117,967 | |
| | 3,139 | | | Guidewire Software, Inc.(b) | | | 165,049 | |
| | 2,713 | | | Paylocity Holding Corp.(b) | | | 81,363 | |
| | 1,111 | | | Tyler Technologies, Inc.(b) | | | 165,883 | |
| | 948 | | | Ultimate Software Group, Inc. (The)(b) | | | 169,702 | |
| | | | | | | | |
| | | | | | | 843,238 | |
| | | | | | | | |
| | | | Specialty Retail – 3.7% | | | | |
| | 2,511 | | | Aaron’s, Inc. | | | 90,672 | |
| | 2,506 | | | Penske Automotive Group, Inc. | | | 121,391 | |
| | 1,348 | | | Restoration Hardware Holdings, Inc.(b) | | | 125,782 | |
| | | | | | | | |
| | | | | | | 337,845 | |
| | | | | | | | |
| | | | Textiles, Apparel & Luxury Goods – 4.1% | | | | |
| | 1,234 | | | Carter’s, Inc. | | | 111,850 | |
| | 2,401 | | | Columbia Sportswear Co. | | | 141,155 | |
| | 2,042 | | | G-III Apparel Group Ltd.(b) | | | 125,909 | |
| | | | | | | | |
| | | | | | | 378,914 | |
| | | | | | | | |
| | |
| | | | Total Common Stocks
(Identified Cost $9,612,383) | | | 8,837,936 | |
| | | | | | | | |
| | |
| Principal
Amount |
| | | | | | |
| |
| | Short-Term Investments – 5.8% | | | | |
| $ | 531,621 | | | Tri-Party Repurchase Agreement with Fixed Income Clearing Corporation, dated 9/30/2015 at 0.010% to be repurchased at $531,621 on 10/01/2015 collateralized by $545,000 U.S. Treasury Note, 1.750% due 2/28/2022 valued at $546,363 including accrued interest (Note 2 of Notes to Financial Statements) (Identified Cost $531,621) | | | 531,621 | |
| | | | | | | | |
| | |
| | | | Total Investments – 101.4%
(Identified Cost $10,144,004)(a) | | | 9,369,557 | |
| | | | Other assets less liabilities—(1.4)% | | | (127,387 | ) |
| | | | | | | | |
| | | | Net Assets – 100.0% | | $ | 9,242,170 | |
| | | | | | | | |
| | |
| | (†) | | | See Note 2 of Notes to Financial Statements. | | | | |
| | (a) | | | Federal Tax Information: | |
| | | | At September 30, 2015, the net unrealized depreciation on investments based on a cost of $10,144,746 for federal income tax purposes was as follows: | |
| | | | Aggregate gross unrealized appreciation for all investments in which there is an excess of value over tax cost | | $ | 122,415 | |
| | | | Aggregate gross unrealized depreciation for all investments in which there is an excess of tax cost over value | | | (897,604 | ) |
| | | | | | | | |
| | | | Net unrealized depreciation | | $ | (775,189 | ) |
| | | | | | | | |
| | (b) | | | Non-income producing security. | |
See accompanying notes to financial statements.
| 36
Portfolio of Investments – as of September 30, 2015
Loomis Sayles Small/Mid Cap Growth Fund – continued
Industry Summary at September 30, 2015
| | | | |
Software | | | 9.1 | % |
Health Care Providers & Services | | | 7.4 | |
Hotels, Restaurants & Leisure | | | 5.6 | |
Internet Software & Services | | | 5.0 | |
Health Care Equipment & Supplies | | | 4.5 | |
IT Services | | | 4.3 | |
Banks | | | 4.2 | |
Textiles, Apparel & Luxury Goods | | | 4.1 | |
Specialty Retail | | | 3.7 | |
Biotechnology | | | 3.6 | |
Aerospace & Defense | | | 3.3 | |
Real Estate Management & Development | | | 2.9 | |
Commercial Services & Supplies | | | 2.8 | |
Pharmaceuticals | | | 2.7 | |
Capital Markets | | | 2.6 | |
Diversified Consumer Services | | | 2.5 | |
Electrical Equipment | | | 2.4 | |
Media | | | 2.4 | |
Machinery | | | 2.3 | |
Health Care Technology | | | 2.1 | |
Other Investments, less than 2% each | | | 18.1 | |
Short-Term Investments | | | 5.8 | |
| | | | |
Total Investments | | | 101.4 | |
Other assets less liabilities | | | (1.4 | ) |
| | | | |
Net Assets | | | 100.0 | % |
| | | | |
See accompanying notes to financial statements.
37 |
Statements of Assets and Liabilities
September 30, 2015
| | | | | | | | | | | | |
| | | Small Cap
Growth Fund | | | Small Cap
Value Fund | | | Small/Mid Cap
Growth Fund | |
ASSETS | | | | | | | | | | | | |
Investments at cost | | $ | 1,013,437,958 | | | $ | 818,138,762 | | | $ | 10,144,004 | |
Net unrealized appreciation (depreciation) | | | 124,200,122 | | | | 238,352,026 | | | | (774,447 | ) |
| | | | | | | | | | | | |
Investments at value | | | 1,137,638,080 | | | | 1,056,490,788 | | | | 9,369,557 | |
Receivable for Fund shares sold | | | 1,108,514 | | | | 1,994,507 | | | | — | |
Receivable from investment adviser (Note 5) | | | — | | | | — | | | | 5,623 | |
Receivable for securities sold | | | 11,581,599 | | | | — | | | | 10,762 | |
Dividends and interest receivable | | | 155,314 | | | | 961,993 | | | | 1,047 | |
| | | | | | | | | | | | |
TOTAL ASSETS | | | 1,150,483,507 | | | | 1,059,447,288 | | | | 9,386,989 | |
| | | | | | | | | | | | |
LIABILITIES | | | | | | | | | | | | |
Payable for securities purchased | | | 20,498,522 | | | | 704,313 | | | | 105,303 | |
Payable for Fund shares redeemed | | | 2,605,807 | | | | 993,920 | | | | — | |
Management fees payable (Note 5) | | | 732,565 | | | | 641,246 | | | | — | |
Deferred Trustees’ fees (Note 5) | | | 116,453 | | | | 174,403 | | | | 1,922 | |
Administrative fees payable (Note 5) | | | 42,401 | | | | 38,469 | | | | 328 | |
Payable to distributor (Note 5d) | | | 13,733 | | | | 14,059 | | | | 18 | |
Other accounts payable and accrued expenses | | | 95,243 | | | | 96,080 | | | | 37,248 | |
| | | | | | | | | | | | |
TOTAL LIABILITIES | | | 24,104,724 | | | | 2,662,490 | | | | 144,819 | |
| | | | | | | | | | | | |
NET ASSETS | | $ | 1,126,378,783 | | | $ | 1,056,784,798 | | | $ | 9,242,170 | |
| | | | | | | | | | | | |
NET ASSETS CONSIST OF: | | | | | | | | | | | | |
Paid-in capital | | $ | 922,112,871 | | | $ | 720,229,194 | | | $ | 10,187,792 | |
Accumulated net investment (loss)/Undistributed net investment income | | | (5,262,820 | ) | | | 3,993,205 | | | | (1,922 | ) |
Accumulated net realized gain (loss) on investments | | | 85,328,610 | | | | 94,210,373 | | | | (169,253 | ) |
Net unrealized appreciation (depreciation) on investments | | | 124,200,122 | | | | 238,352,026 | | | | (774,447 | ) |
| | | | | | | | | | | | |
NET ASSETS | | $ | 1,126,378,783 | | | $ | 1,056,784,798 | | | $ | 9,242,170 | |
| | | | | | | | | | | | |
| | |
COMPUTATION OF NET ASSET VALUE AND OFFERING PRICE: | | | | | | | | | |
Institutional Class: | | | | | | | | | | | | |
Net assets | | $ | 800,882,509 | | | $ | 666,106,758 | | | $ | 9,242,170 | |
| | | | | | | | | | | | |
Shares of beneficial interest | | | 36,042,937 | | | | 20,694,801 | | | | 1,020,804 | |
| | | | | | | | | | | | |
Net asset value, offering and redemption price per share | | $ | 22.22 | | | $ | 32.19 | | | $ | 9.05 | |
| | | | | | | | | | | | |
Retail Class: | | | | | | | | | | | | |
Net assets | | $ | 162,905,617 | | | $ | 306,360,228 | | | $ | — | |
| | | | | | | | | | | | |
Shares of beneficial interest | | | 7,781,658 | | | | 9,640,257 | | | | — | |
| | | | | | | | | | | | |
Net asset value, offering and redemption price per share | | $ | 20.93 | | | $ | 31.78 | | | $ | — | |
| | | | | | | | | | | | |
Admin Class shares: | | | | | | | | | | | | |
Net assets | | $ | — | | | $ | 45,762,404 | | | $ | — | |
| | | | | | | | | | | | |
Shares of beneficial interest | | | — | | | | 1,481,867 | | | | — | |
| | | | | | | | | | | | |
Net asset value, offering and redemption price per share | | $ | — | | | $ | 30.88 | | | $ | — | |
| | | | | | | | | | | | |
Class N shares: | | | | | | | | | | | | |
Net assets | | $ | 162,590,657 | | | $ | 38,555,408 | | | $ | — | |
| | | | | | | | | | | | |
Shares of beneficial interest | | | 7,301,616 | | | | 1,196,750 | | | | — | |
| | | | | | | | | | | | |
Net asset value, offering and redemption price per share | | $ | 22.27 | | | $ | 32.22 | | | $ | — | |
| | | | | | | | | | | | |
See accompanying notes to financial statements.
| 38
Statements of Operations
For the Year Ended September 30, 2015
| | | | | | | | | | | | |
| | | Small Cap
Growth Fund | | | Small Cap
Value Fund | | | Small/Mid Cap
Growth Fund(a) | |
INVESTMENT INCOME | | | | | | | | | | | | |
Dividends | | $ | 4,138,298 | | | $ | 19,547,456 | | | $ | 7,831 | |
Interest | | | 4,296 | | | | 1,853 | | | | 20 | |
Less net foreign taxes withheld | | | — | | | | (20,869 | ) | | | (63 | ) |
| | | | | | | | | | | | |
| | | 4,142,594 | | | | 19,528,440 | | | | 7,788 | |
| | | | | | | | | | | | |
Expenses | | | | | | | | | | | | |
Management fees (Note 5) | | | 8,447,388 | | | | 8,862,889 | | | | 18,520 | |
Service and distribution fees (Note 5) | | | 438,180 | | | | 1,159,361 | | | | — | |
Administrative fees (Note 5) | | | 480,487 | | | | 504,004 | | | | 1,049 | |
Trustees’ fees and expenses (Note 5) | | | 32,361 | | | | 30,909 | | | | 3,087 | |
Transfer agent fees and expenses (Notes 5 and 6) | | | 1,227,590 | | | | 1,208,061 | | | | 41 | |
Audit and tax services fees | | | 40,237 | | | | 41,111 | | | | 30,910 | |
Custodian fees and expenses | | | 45,773 | | | | 38,679 | | | | 2,524 | |
Legal fees | | | 12,578 | | | | 13,588 | | | | 29 | |
Registration fees | | | 107,695 | | | | 82,965 | | | | 6,601 | |
Shareholder reporting expenses | | | 49,193 | | | | 71,578 | | | | 668 | |
Miscellaneous expenses | | | 29,495 | | | | 31,912 | | | | 2,039 | |
| | | | | | | | | | | | |
Total expenses | | | 10,910,977 | | | | 12,045,057 | | | | 65,468 | |
Fee/expense recovery (Note 5) | | | — | | | | 577 | | | | — | |
Less waiver and/or expense reimbursement (Note 5) | | | — | | | | (261,818 | ) | | | (44,478 | ) |
| | | | | | | | | | | | |
Net expenses | | | 10,910,977 | | | | 11,783,816 | | | | 20,990 | |
| | | | | | | | | | | | |
Net investment income (loss) | | | (6,768,383 | ) | | | 7,744,624 | | | | (13,202 | ) |
| | | | | | | | | | | | |
| | | |
NET REALIZED AND UNREALIZED GAIN (LOSS) ON INVESTMENTS | | | | | | | | | | | | |
Net realized gain (loss) on: | | | | | | | | | | | | |
Investments | | | 96,389,671 | | | | 106,149,654 | | | | (169,253 | ) |
Net change in unrealized appreciation (depreciation) on: | | | | | | | | | | | | |
Investments | | | (39,045,091 | ) | | | (93,246,609 | ) | | | (774,447 | ) |
| | | | | | | | | | | | |
Net realized and unrealized gain (loss) on investments | | | 57,344,580 | | | | 12,903,045 | | | | (943,700 | ) |
| | | | | | | | | | | | |
| | | |
NET INCREASE (DECREASE) IN NET ASSETS RESULTING FROM OPERATIONS | | $ | 50,576,197 | | | $ | 20,647,669 | | | $ | (956,902 | ) |
| | | | | | | | | | | | |
| (a) | From commencement of operations on June 30, 2015 through September 30, 2015. |
See accompanying notes to financial statements.
39 |
Statements of Changes in Net Assets
| | | | | | | | | | | | | | | | |
| | | Small Cap Growth Fund | | | Small Cap Value Fund | |
| | | Year Ended
September 30,
2015 | | | Year Ended
September 30,
2014 | | | Year Ended
September 30,
2015 | | | Year Ended
September 30,
2014 | |
FROM OPERATIONS: | | | | | | | | | | | | | | | | |
Net investment income (loss) | | $ | (6,768,383 | ) | | $ | (7,845,552 | ) | | $ | 7,744,624 | | | $ | 5,191,535 | |
Net realized gain on investments | | | 96,389,671 | | | | 146,827,349 | | | | 106,149,654 | | | | 145,244,540 | |
Net change in unrealized appreciation (depreciation) on investments | | | (39,045,091 | ) | | | (156,740,215 | ) | | | (93,246,609 | ) | | | (73,587,700 | ) |
| | | | | | | | | | | | | | | | |
Net increase (decrease) in net assets resulting from operations | | | 50,576,197 | | | | (17,758,418 | ) | | | 20,647,669 | | | | 76,848,375 | |
| | | | | | | | | | | | | | | | |
FROM DISTRIBUTIONS TO SHAREHOLDERS: | | | | | | | | | | | | | | | | |
Net investment income | | | | | | | | | | | | | | | | |
Institutional Class | | | — | | | | — | | | | (4,236,276 | ) | | | (1,957,501 | ) |
Retail Class | | | — | | | | — | | | | (1,054,845 | ) | | | (74,356 | ) |
Admin Class | | | — | | | | — | | | | (1,677 | ) | | | — | |
Class N | | | — | | | | — | | | | (44,634 | ) | | | (3 | ) |
Net realized capital gains | | | | | | | | | | | | | | | | |
Institutional Class | | | (121,284,863 | ) | | | (64,424,433 | ) | | | (93,076,570 | ) | | | (64,817,421 | ) |
Retail Class | | | (25,100,168 | ) | | | (15,631,057 | ) | | | (45,284,938 | ) | | | (35,067,106 | ) |
Admin Class | | | — | | | | — | | | | (7,970,136 | ) | | | (6,651,623 | ) |
Class N | | | (2,724,416 | ) | | | (529,097 | ) | | | (870,050 | ) | | | (103 | ) |
| | | | | | | | | | | | | | | | |
Total distributions | | | (149,109,447 | ) | | | (80,584,587 | ) | | | (152,539,126 | ) | | | (108,568,113 | ) |
| | | | | | | | | | | | | | | | |
NET INCREASE (DECREASE) IN NET ASSETS FROM CAPITAL SHARE TRANSACTIONS (NOTE 10) | | | 182,307,468 | | | | 7,643,805 | | | | 34,718,995 | | | | (26,204,128 | ) |
| | | | | | | | | | | | | | | | |
Net increase (decrease) in net assets | | | 83,774,218 | | | | (90,699,200 | ) | | | (97,172,462 | ) | | | (57,923,866 | ) |
NET ASSETS | | | | | | | | | | | | | | | | |
Beginning of the year | | | 1,042,604,565 | | | | 1,133,303,765 | | | | 1,153,957,260 | | | | 1,211,881,126 | |
| | | | | | | | | | | | | | | | |
End of the year | | $ | 1,126,378,783 | | | $ | 1,042,604,565 | | | $ | 1,056,784,798 | | | $ | 1,153,957,260 | |
| | | | | | | | | | | | | | | | |
ACCUMULATED NET INVESTMENT (LOSS)/UNDISTRIBUTED NET INVESTMENT INCOME | | $ | (5,262,820 | ) | | $ | (6,062,036 | ) | | $ | 3,993,205 | | | $ | 2,845,587 | |
| | | | | | | | | | | | | | | | |
See accompanying notes to financial statements.
| 40
Statements of Changes in Net Assets – continued
| | | | |
| | | Small/Mid Cap
Growth Fund | |
| | | Period Ended
September 30,
2015(a) | |
FROM OPERATIONS: | | | | |
Net investment loss | | $ | (13,202 | ) |
Net realized loss on investments | | | (169,253 | ) |
Net change in unrealized appreciation (depreciation) on investments | | | (774,447 | ) |
| | | | |
Net decrease in net assets resulting from operations | | | (956,902 | ) |
| | | | |
NET INCREASE IN NET ASSETS FROM CAPITAL SHARE TRANSACTIONS (NOTE 10) | | | 10,199,072 | |
| | | | |
Net increase in net assets | | | 9,242,170 | |
| |
NET ASSETS | | | | |
Beginning of the year | | | — | |
| | | | |
End of the year | | $ | 9,242,170 | |
| | | | |
ACCUMULATED NET INVESTMENT (LOSS) | | $ | (1,922 | ) |
| | | | |
| (a) | From commencement of operations on June 30, 2015 through September 30, 2015. |
See accompanying notes to financial statements.
41 |
Financial Highlights
For a share outstanding throughout each period.
| | | | | | | | | | | | | | | | | | | | | | |
| | | Small Cap Growth Fund—Institutional Class | | | |
| | | Year Ended
September 30,
2015 | | | Year Ended
September 30,
2014 | | | Year Ended
September 30,
2013 | | | Year Ended
September 30,
2012 | | | Year Ended
September 30,
2011 | | | |
Net asset value, beginning of the period | | $ | 24.27 | | | $ | 26.35 | | | $ | 19.17 | | | $ | 15.06 | | | $ | 14.03 | | | |
| | | |
INCOME (LOSS) FROM INVESTMENT OPERATIONS: | | | | | | | | | | | | | | | | | | | | | | |
Net investment loss(a) | | | (0.14 | ) | | | (0.16 | )(b) | | | (0.15 | )(c) | | | (0.14 | ) | | | (0.13 | ) | | |
Net realized and unrealized gain (loss) | | | 1.63 | | | | (0.09 | ) | | | 7.33 | | | | 4.25 | | | | 1.16 | (d) | | |
| | | |
Total from Investment Operations | | | 1.49 | | | | (0.25 | ) | | | 7.18 | | | | 4.11 | | | | 1.03 | | | |
| | | |
LESS DISTRIBUTIONS FROM: | | | | | | | | | | | | | | | | | | | | | | |
Net investment income | | | — | | | | — | | | | — | | | | — | | | | — | | | |
Net realized capital gains | | | (3.54 | ) | | | (1.83 | ) | | | — | | | | — | | | | — | | | |
| | | |
Total Distributions | | | (3.54 | ) | | | (1.83 | ) | | | — | | | | — | | | | — | | | |
| | | |
Net asset value, end of the period | | $ | 22.22 | | | $ | 24.27 | | | $ | 26.35 | | | $ | 19.17 | | | $ | 15.06 | | | |
| | | |
Total return | | | 5.78 | % | | | (1.31 | )%(b) | | | 37.45 | %(c) | | | 27.29 | % | | | 7.34 | % | | |
RATIOS TO AVERAGE NET ASSETS: | | | | | | | | | | | | | | | | | | | | | | |
Net assets, end of the period (000’s) | | $ | 800,883 | | | $ | 852,131 | | | $ | 914,000 | | | $ | 599,469 | | | $ | 154,313 | | | |
Net expenses | | | 0.94 | % | | | 0.94 | % | | | 0.94 | % | | | 0.95 | % | | | 0.98 | %(e) | | |
Gross expenses | | | 0.94 | % | | | 0.94 | % | | | 0.94 | % | | | 0.95 | % | | | 0.98 | %(e) | | |
Net investment loss | | | (0.57 | )% | | | (0.63 | )%(b) | | | (0.70 | )%(c) | | | (0.79 | )% | | | (0.78 | )% | | |
Portfolio turnover rate | | | 78 | % | | | 63 | % | | | 56 | % | | | 77 | % | | | 76 | % | | |
| (a) | Per share net investment loss has been calculated using the average shares outstanding during the period. |
| (b) | Includes a non-recurring dividend. Without this dividend, net investment loss per share would have been $(0.17), total return would have been (1.35)% and the ratio of net investment loss to average net assets would have been (0.66)%. |
| (c) | Includes non-recurring dividends. Without these dividends, net investment loss per share would have been $(0.16), total return would have been 37.40% and the ratio of net investment loss to average net assets would have been (0.75)%. |
| (d) | The amount shown for a share outstanding does not correspond with the aggregate realized and unrealized gain (loss) on investments for the period due to the timing of sales and redemptions of fund shares in relation to fluctuating market values of investments of the Fund. |
| (e) | Includes fee/expense recovery of 0.03%. |
See accompanying notes to financial statements.
| 42
Financial Highlights – continued
For a share outstanding throughout each period.
| | | | | | | | | | | | | | | | | | | | | | |
| | | Small Cap Growth Fund—Retail Class | | | |
| | | Year Ended
September 30,
2015 | | | Year Ended
September 30,
2014 | | | Year Ended
September 30,
2013 | | | Year Ended
September 30,
2012 | | | Year Ended
September 30,
2011 | | | |
Net asset value, beginning of the period | | $ | 23.10 | | | $ | 25.23 | | | $ | 18.41 | | | $ | 14.52 | | | $ | 13.55 | | | |
| | | |
INCOME (LOSS) FROM INVESTMENT OPERATIONS: | | | | | | | | | | | | | | | | | | | | | | |
Net investment loss(a) | | | (0.19 | ) | | | (0.22 | )(b) | | | (0.20 | )(c) | | | (0.19 | ) | | | (0.18 | ) | | |
Net realized and unrealized gain (loss) | | | 1.56 | | | | (0.08 | ) | | | 7.02 | | | | 4.08 | | | | 1.15 | (d) | | |
| | | |
Total from Investment Operations | | | 1.37 | | | | (0.30 | ) | | | 6.82 | | | | 3.89 | | | | 0.97 | | | |
| | | |
LESS DISTRIBUTIONS FROM: | | | | | | | | | | | | | | | | | | | | | | |
Net investment income | | | — | | | | — | | | | — | | | | — | | | | — | | | |
Net realized capital gains | | | (3.54 | ) | | | (1.83 | ) | | | — | | | | — | | | | — | | | |
| | | |
Total Distributions | | | (3.54 | ) | | | (1.83 | ) | | | — | | | | — | | | | — | | | |
| | | |
Net asset value, end of the period | | $ | 20.93 | | | $ | 23.10 | | | $ | 25.23 | | | $ | 18.41 | | | $ | 14.52 | | | |
| | | |
Total return | | | 5.58 | % | | | (1.58 | )%(b) | | | 37.05 | %(c) | | | 26.79 | %(e) | | | 7.16 | %(e) | | |
RATIOS TO AVERAGE NET ASSETS: | | | | | | | | | | | | | | | | | | | | | | |
Net assets, end of the period (000’s) | | $ | 162,906 | | | $ | 175,393 | | | $ | 211,724 | | | $ | 229,822 | | | $ | 113,110 | | | |
Net expenses | | | 1.19 | % | | | 1.21 | % | | | 1.25 | %(f) | | | 1.25 | %(g) | | | 1.25 | %(g) | | |
Gross expenses | | | 1.19 | % | | | 1.21 | % | | | 1.25 | %(f) | | | 1.28 | % | | | 1.27 | % | | |
Net investment loss | | | (0.82 | )% | | | (0.90 | )%(b) | | | (0.99 | )%(c) | | | (1.09 | )% | | | (1.07 | )% | | |
Portfolio turnover rate | | | 78 | % | | | 63 | % | | | 56 | % | | | 77 | % | | | 76 | % | | |
| (a) | Per share net investment loss has been calculated using the average shares outstanding during the period. |
| (b) | Includes a non-recurring dividend. Without this dividend, net investment loss per share would have been $(0.23), total return would have been (1.58)% and the ratio of net investment loss to average net assets would have been (0.93)%. |
| (c) | Includes non-recurring dividends. Without these dividends, net investment loss per share would have been $(0.21), total return would have been 36.99% and the ratio of net investment loss to average net assets would have been (1.05)%. |
| (d) | The amount shown for a share outstanding does not correspond with the aggregate realized and unrealized gain (loss) on investments for the period due to the timing of sales and redemptions of fund shares in relation to fluctuating market values of investments of the Fund. |
| (e) | Had certain expenses not been waived/reimbursed during the period, total returns would have been lower. |
| (f) | Includes fee/expense recovery of 0.01%. |
| (g) | The investment adviser agreed to waive its fees and/or reimburse a portion of the Fund’s expenses during the period. Without this waiver/reimbursement, expenses would have been higher. |
See accompanying notes to financial statements.
43 |
Financial Highlights – continued
For a share outstanding throughout each period.
| | | | | | | | | | | | | | | | |
| | | Small Cap Growth Fund—Class N | | | | | |
| | | Year Ended
September 30,
2015 | | | Year Ended
September 30,
2014 | | | Period Ended
September 30,
2013* | | | | | |
Net asset value, beginning of the period | | $ | 24.29 | | | $ | 26.36 | | | $ | 20.22 | | | | | |
| | | |
INCOME (LOSS) FROM INVESTMENT OPERATIONS: | | | | | | | | | | | | | | | | |
Net investment loss(a) | | | (0.12 | ) | | | (0.14 | )(b) | | | (0.11 | ) | | | | |
Net realized and unrealized gain (loss) | | | 1.64 | | | | (0.10 | ) | | | 6.25 | | | | | |
| | | |
Total from Investment Operations | | | 1.52 | | | | (0.24 | ) | | | 6.14 | | | | | |
| | | |
LESS DISTRIBUTIONS FROM: | | | | | | | | | | | | | | | | |
Net investment income | | | — | | | | — | | | | — | | | | | |
Net realized capital gains | | | (3.54 | ) | | | (1.83 | ) | | | — | | | | | |
| | | |
Total Distributions | | | (3.54 | ) | | | (1.83 | ) | | | — | | | | | |
| | | |
Net asset value, end of the period | | $ | 22.27 | | | $ | 24.29 | | | $ | 26.36 | | | | | |
| | | |
Total return | | | 5.92 | % | | | (1.27 | )%(b) | | | 30.37 | %(c) | | | | |
RATIOS TO AVERAGE NET ASSETS: | | | | | | | | | | | | | | | | |
Net assets, end of the period (000’s) | | $ | 162,591 | | | $ | 15,080 | | | $ | 7,580 | | | | | |
Net expenses | | | 0.83 | % | | | 0.83 | % | | | 0.83 | %(d) | | | | |
Gross expenses | | | 0.83 | % | | | 0.83 | % | | | 0.83 | %(d) | | | | |
Net investment loss | | | (0.51 | )% | | | (0.53 | )%(b) | | | (0.63 | )%(d) | | | | |
Portfolio turnover rate | | | 78 | % | | | 63 | % | | | 56 | % | | | | |
| * | From commencement of Class operations on February 1, 2013 through September 30, 2013. |
| (a) | Per share net investment loss has been calculated using the average shares outstanding during the period. |
| (b) | Includes a non-recurring dividend. Without this dividend, net investment loss per share would have been $(0.14), total return would have been (1.31)% and the ratio of net investment loss to average net assets would have been (0.56)%. |
| (c) | Periods less than one year are not annualized. |
| (d) | Computed on an annualized basis for periods less than one year. |
See accompanying notes to financial statements.
| 44
Financial Highlights – continued
For a share outstanding throughout each period.
| | | | | | | | | | | | | | | | | | | | | | |
| | | Small Cap Value Fund—Institutional Class | | | |
| | | Year Ended
September 30,
2015 | | | Year Ended
September 30,
2014 | | | Year Ended
September 30,
2013 | | | Year Ended
September 30,
2012 | | | Year Ended
September 30,
2011 | | | |
Net asset value, beginning of the period | | $ | 36.40 | | | $ | 37.42 | | | $ | 29.14 | | | $ | 22.36 | | | $ | 22.93 | | | |
| | | |
INCOME (LOSS) FROM INVESTMENT OPERATIONS: | | | | | | | | | | | | | | | | | | | | | | |
Net investment income(a) | | | 0.27 | | | | 0.20 | | | | 0.20 | | | | 0.21 | | | | 0.09 | (b) | | |
Net realized and unrealized gain (loss) | | | 0.49 | | | | 2.18 | | | | 8.41 | | | | 6.62 | | | | (0.50 | ) | | |
| | | |
Total from Investment Operations | | | 0.76 | | | | 2.38 | | | | 8.61 | | | | 6.83 | | | | (0.41 | ) | | |
| | | |
LESS DISTRIBUTIONS FROM: | | | | | | | | | | | | | | | | | | | | | | |
Net investment income | | | (0.22 | ) | | | (0.10 | ) | | | (0.30 | ) | | | (0.05 | ) | | | (0.16 | ) | | |
Net realized capital gains | | | (4.75 | ) | | | (3.30 | ) | | | (0.03 | ) | | | — | | | | — | | | |
| | | |
Total Distributions | | | (4.97 | ) | | | (3.40 | ) | | | (0.33 | ) | | | (0.05 | ) | | | (0.16 | ) | | |
| | | |
Net asset value, end of the period | | $ | 32.19 | | | $ | 36.40 | | | $ | 37.42 | | | $ | 29.14 | | | $ | 22.36 | | | |
| | | |
Total return | | | 1.20 | %(c) | | | 6.17 | %(c) | | | 29.82 | %(c) | | | 30.59 | % | | | (1.88 | )%(b)(c) | | |
RATIOS TO AVERAGE NET ASSETS: | | | | | | | | | | | | | | | | | | | | | | |
Net assets, end of the period (000’s) | | $ | 666,107 | | | $ | 730,901 | | | $ | 733,512 | | | $ | 572,776 | | | $ | 431,761 | | | |
Net expenses | | | 0.90 | %(d) | | | 0.90 | %(d) | | | 0.90 | %(d) | | | 0.90 | %(e) | | | 0.90 | %(d) | | |
Gross expenses | | | 0.92 | % | | | 0.91 | % | | | 0.91 | % | | | 0.90 | %(e) | | | 0.93 | % | | |
Net investment income | | | 0.75 | % | | | 0.53 | % | | | 0.61 | % | | | 0.76 | % | | | 0.33 | %(b) | | |
Portfolio turnover rate | | | 22 | % | | | 23 | % | | | 22 | % | | | 19 | % | | | 42 | % | | |
| (a) | Per share net investment income has been calculated using the average shares outstanding during the period. |
| (b) | Includes a non-recurring dividend. Without this dividend, net investment income per share would have been $0.07, total return would have been (1.93)% and the ratio of net investment income to average net assets would have been 0.28%. |
| (c) | Had certain expenses not been waived/reimbursed during the period, total returns would have been lower. |
| (d) | The investment adviser agreed to waive its fees and/or reimburse a portion of the Fund’s expenses during the period. Without this waiver/reimbursement, expenses would have been higher. |
| (e) | Includes fee/expense recovery of less than 0.01%. |
See accompanying notes to financial statements.
45 |
Financial Highlights – continued
For a share outstanding throughout each period.
| | | | | | | | | | | | | | | | | | | | | | |
| | | Small Cap Value Fund—Retail Class | | | |
| | | Year Ended
September 30,
2015 | | | Year Ended
September 30,
2014 | | | Year Ended
September 30,
2013 | | | Year Ended
September 30,
2012 | | | Year Ended
September 30,
2011 | | | |
Net asset value, beginning of the period | | $ | 35.98 | | | $ | 37.03 | | | $ | 28.84 | | | $ | 22.14 | | | $ | 22.71 | | | |
| | | |
INCOME (LOSS) FROM INVESTMENT OPERATIONS: | | | | | | | | | | | | | | | | | | | | | | |
Net investment income(a) | | | 0.18 | | | | 0.10 | | | | 0.12 | | | | 0.13 | | | | 0.02 | (b) | | |
Net realized and unrealized gain (loss) | | | 0.48 | | | | 2.16 | | | | 8.32 | | | | 6.57 | | | | (0.48 | ) | | |
| | | |
Total from Investment Operations | | | 0.66 | | | | 2.26 | | | | 8.44 | | | | 6.70 | | | | (0.46 | ) | | |
| | | |
LESS DISTRIBUTIONS FROM: | | | | | | | | | | | | | | | | | | | | | | |
Net investment income | | | (0.11 | ) | | | (0.01 | ) | | | (0.22 | ) | | | — | | | | (0.11 | ) | | |
Net realized capital gains | | | (4.75 | ) | | | (3.30 | ) | | | (0.03 | ) | | | — | | | | — | | | |
| | | |
Total Distributions | | | (4.86 | ) | | | (3.31 | ) | | | (0.25 | ) | | | — | | | | (0.11 | ) | | |
| | | |
Net asset value, end of the period | | $ | 31.78 | | | $ | 35.98 | | | $ | 37.03 | | | $ | 28.84 | | | $ | 22.14 | | | |
| | | |
Total return(c) | | | 0.94 | % | | | 5.90 | % | | | 29.48 | % | | | 30.26 | % | | | (2.12 | )%(b) | | |
RATIOS TO AVERAGE NET ASSETS: | | | | | | | | | | | | | | | | | | | | | | |
Net assets, end of the period (000’s) | | $ | 306,360 | | | $ | 358,698 | | | $ | 403,475 | | | $ | 343,480 | | | $ | 347,759 | | | |
Net expenses(d) | | | 1.15 | % | | | 1.15 | % | | | 1.15 | % | | | 1.15 | % | | | 1.15 | % | | |
Gross expenses | | | 1.17 | % | | | 1.20 | % | | | 1.22 | % | | | 1.22 | % | | | 1.22 | % | | |
Net investment income | | | 0.50 | % | | | 0.28 | % | | | 0.37 | % | | | 0.49 | % | | | 0.08 | %(b) | | |
Portfolio turnover rate | | | 22 | % | | | 23 | % | | | 22 | % | | | 19 | % | | | 42 | % | | |
| (a) | Per share net investment income has been calculated using the average shares outstanding during the period. |
| (b) | Includes a non-recurring dividend. Without this dividend, net investment income per share would have been $0.01, total return would have been (2.16)% and the ratio of net investment income to average net assets would have been 0.03%. |
| (c) | Had certain expenses not been waived/reimbursed during the period, total returns would have been lower. |
| (d) | The investment adviser agreed to waive its fees and/or reimburse a portion of the Fund’s expenses during the period. Without this waiver/reimbursement, expenses would have been higher. |
See accompanying notes to financial statements.
| 46
Financial Highlights – continued
For a share outstanding throughout each period.
| | | | | | | | | | | | | | | | | | | | | | |
| | | Small Cap Value Fund —Admin Class | | | |
| | | Year Ended
September 30,
2015 | | | Year Ended
September 30,
2014 | | | Year Ended
September 30,
2013 | | | Year Ended
September 30,
2012 | | | Year Ended
September 30,
2011 | | | |
Net asset value, beginning of the period | | $ | 35.06 | | | $ | 36.24 | | | $ | 28.22 | | | $ | 21.72 | | | $ | 22.30 | | | |
| | | |
INCOME (LOSS) FROM INVESTMENT OPERATIONS: | | | | | | | | | | | | | | | | | | | | | | |
Net investment income (loss)(a) | | | 0.09 | | | | 0.01 | | | | 0.04 | | | | 0.06 | | | | (0.04 | )(b) | | |
Net realized and unrealized gain (loss) | | | 0.48 | | | | 2.11 | | | | 8.15 | | | | 6.44 | | | | (0.49 | ) | | |
| | | |
Total from Investment Operations | | | 0.57 | | | | 2.12 | | | | 8.19 | | | | 6.50 | | | | (0.53 | ) | | |
| | | |
LESS DISTRIBUTIONS FROM: | | | | | | | | | | | | | | | | | | | | | | |
Net investment income | | | (0.00 | )(c) | | | — | | | | (0.14 | ) | | | — | | | | (0.05 | ) | | |
Net realized capital gains | | | (4.75 | ) | | | (3.30 | ) | | | (0.03 | ) | | | — | | | | — | | | |
| | | |
Total Distributions | | | (4.75 | ) | | | (3.30 | ) | | | (0.17 | ) | | | — | | | | (0.05 | ) | | |
| | | |
Net asset value, end of the period | | $ | 30.88 | | | $ | 35.06 | | | $ | 36.24 | | | $ | 28.22 | | | $ | 21.72 | | | |
| | | |
Total return(d) | | | 0.71 | % | | | 5.63 | % | | | 29.17 | % | | | 29.93 | % | | | (2.40 | )%(b) | | |
RATIOS TO AVERAGE NET ASSETS: | | | | | | | | | | | | | | | | | | | | | | |
Net assets, end of the period (000’s) | | $ | 45,762 | | | $ | 61,791 | | | $ | 74,892 | | | $ | 67,853 | | | $ | 65,500 | | | |
Net expenses(e) | | | 1.38 | %(f) | | | 1.40 | % | | | 1.40 | % | | | 1.40 | % | | | 1.40 | % | | |
Gross expenses | | | 1.40 | %(f) | | | 1.51 | % | | | 1.52 | % | | | 1.52 | % | | | 1.52 | % | | |
Net investment income (loss) | | | 0.28 | % | | | 0.02 | % | | | 0.11 | % | | | 0.24 | % | | | (0.17 | )%(b) | | |
Portfolio turnover rate | | | 22 | % | | | 23 | % | | | 22 | % | | | 19 | % | | | 42 | % | | |
| (a) | Per share net investment income (loss) has been calculated using the average shares outstanding during the period. |
| (b) | Includes a non-recurring dividend. Without this dividend, net investment loss per share would have been $(0.06), total return would have been (2.44)% and the ratio of net investment loss to average net assets would have been (0.22)%. |
| (c) | Amount rounds to less than $0.01 per share. |
| (d) | Had certain expenses not been waived/reimbursed during the period, total returns would have been lower. |
| (e) | The investment adviser agreed to waive its fees and/or reimburse a portion of the Fund’s expenses during the period. Without this waiver/reimbursement, expenses would have been higher. |
| (f) | Includes refund of prior year service fee of 0.02%. See Note 5g of Notes to Financial Statements. |
See accompanying notes to financial statements.
47 |
Financial Highlights – continued
For a share outstanding throughout each period.
| | | | | | | | | | | | | | |
| | | Small Cap Value Fund—Class N | | | |
| | | Year Ended
September 30,
2015 | | | Year Ended
September 30,
2014 | | | Period Ended
September 30,
2013* | | | |
Net asset value, beginning of the period | | $ | 36.44 | | | $ | 37.44 | | | $ | 32.08 | | | |
| | | |
INCOME (LOSS) FROM INVESTMENT OPERATIONS: | | | | | | | | | | | | | | |
Net investment income(a) | | | 0.27 | | | | 0.23 | | | | 0.06 | | | |
Net realized and unrealized gain (loss) | | | 0.50 | | | | 2.18 | | | | 5.30 | | | |
| | | |
Total from Investment Operations | | | 0.77 | | | | 2.41 | | | | 5.36 | | | |
| | | |
LESS DISTRIBUTIONS FROM: | | | | | | | | | | | | | | |
Net investment income | | | (0.24 | ) | | | (0.11 | ) | | | — | | | |
Net realized capital gains | | | (4.75 | ) | | | (3.30 | ) | | | — | | | |
| | | |
Total Distributions | | | (4.99 | ) | | | (3.41 | ) | | | — | | | |
| | | |
Net asset value, end of the period | | $ | 32.22 | | | $ | 36.44 | | | $ | 37.44 | | | |
| | | |
Total return | | | 1.25 | % | | | 6.25 | %(b) | | | 16.71 | %(b)(c) | | |
RATIOS TO AVERAGE NET ASSETS: | | | | | | | | | | | | | | |
Net assets, end of the period (000’s) | | $ | 38,555 | | | $ | 2,568 | | | $ | 1 | | | |
Net expenses | | | 0.83 | %(d) | | | 0.85 | %(e) | | | 0.85 | %(e)(f) | | |
Gross expenses | | | 0.83 | %(d) | | | 0.89 | % | | | 14.45 | %(f) | | |
Net investment income | | | 0.76 | % | | | 0.60 | % | | | 0.27 | %(f) | | |
Portfolio turnover rate | | | 22 | % | | | 23 | % | | | 22 | % | | |
| * | From commencement of Class operations on February 1, 2013 through September 30, 2013. |
| (a) | Per share net investment income has been calculated using the average shares outstanding during the period. |
| (b) | Had certain expenses not been waived/reimbursed during the period, total returns would have been lower. |
| (c) | Periods less than one year are not annualized. |
| (d) | Includes fee/expense recovery of less than 0.01%. |
| (e) | The investment adviser agreed to waive its fees and/or reimburse a portion of the Fund’s expenses during the period. Without this waiver/reimbursement, expenses would have been higher. |
| (f) | Computed on an annualized basis for periods less than one year. |
See accompanying notes to financial statements.
| 48
Financial Highlights – continued
For a share outstanding throughout each period.
| | | | | | |
| | | Small/Mid Cap
Growth Fund—
Institutional Class | | | |
| | | Period Ended
September 30,
2015* | | | |
Net asset value, beginning of the period | | $ | 10.00 | | | |
| | | |
INCOME (LOSS) FROM INVESTMENT OPERATIONS: | | | | | | |
Net investment loss(a) | | | (0.01 | ) | | |
Net realized and unrealized gain (loss) | | | (0.94 | ) | | |
| | | |
Total from Investment Operations | | | (0.95 | ) | | |
| | | |
LESS DISTRIBUTIONS FROM: | | | | | | |
Net investment income | | | — | | | |
Net realized capital gains | | | — | | | |
| | | |
Total Distributions | | | — | | | |
| | | |
Net asset value, end of the period | | $ | 9.05 | | | |
| | | |
Total return(b) | | | (9.50 | )% | | |
RATIOS TO AVERAGE NET ASSETS: | | | | | | |
Net assets, end of the period (000’s) | | $ | 9,242 | | | |
Net expenses(c)(d) | | | 0.85 | % | | |
Gross expenses(d) | | | 2.65 | % | | |
Net investment loss(d) | | | (0.53 | )% | | |
Portfolio turnover rate | | | 14 | % | | |
| * | From commencement of operations on June 30, 2015 through September 30, 2015. |
| (a) | Per share net investment loss has been calculated using the average shares outstanding during the period. |
| (b) | Had certain expenses not been waived/reimbursed during the period, total returns would have been lower. Periods less than one year are not annualized. |
| (c) | The investment adviser agreed to waive its fees and/or reimburse a portion of the Fund’s expenses during the period. Without this waiver/reimbursement, expenses would have been higher. |
| (d) | Computed on an annualized basis for periods less than one year. |
See accompanying notes to financial statements.
49 |
Notes to Financial Statements
September 30, 2015
1. Organization. Loomis Sayles Funds I and Loomis Sayles Funds II (the “Trusts” and each a “Trust”) are each organized as a Massachusetts business trust. Each Trust is registered under the Investment Company Act of 1940, as amended (the “1940 Act”), as an open-end management investment company. Each Declaration of Trust permits the Board of Trustees to authorize the issuance of an unlimited number of shares of the Trust in multiple series. The financial statements for certain funds of the Trusts are presented in separate reports. The following funds (individually, a “Fund” and collectively, the “Funds”) are included in this report:
Loomis Sayles Funds I:
Loomis Sayles Small Cap Value Fund (the “Small Cap Value Fund”)
Loomis Sayles Funds II:
Loomis Sayles Small Cap Growth Fund (the “Small Cap Growth Fund”)
Loomis Sayles Small/Mid Cap Growth Fund (the “Small/Mid Cap Growth Fund”)
The Small/Mid Cap Growth Fund commenced operations on June 30, 2015 via contribution to the Fund by Natixis Global Asset Management, L.P. (“Natixis US”) of $10,000,000.
Each Fund is a diversified investment company.
Small Cap Growth Fund and Small Cap Value Fund were closed to new investors effective September 14, 2012 and September 15, 2008, respectively. Small Cap Growth Fund and Small Cap Value Fund continue to offer Institutional Class, Retail Class and Class N shares to existing investors and Small Cap Value Fund continues to offer Admin Class shares to existing investors.
Each share class is sold without a sales charge. Retail Class and Admin Class shares pay a Rule 12b-1 fee. Class N shares are primarily intended for employer-sponsored retirement plans. Institutional Class shares are intended for institutional investors with a minimum initial investment of $100,000 for Small Cap Growth Fund and Small Cap Value Fund and $1,000,000 for Small/Mid Cap Growth Fund, though some categories of investors are exempted from the minimum investment amount as outlined in the Fund’s prospectus. Admin Class and Class N shares are offered exclusively through intermediaries.
See Note 11 for changes that take effect subsequent to September 30, 2015.
Most expenses can be directly attributed to a Fund. Expenses which cannot be directly attributed to a Fund are generally apportioned based on the relative net assets of each of the funds in Natixis Funds Trust I, Natixis Funds Trust II, Natixis Funds Trust IV, Gateway Trust (“Natixis Funds Trusts”), Loomis Sayles Funds I and Loomis Sayles Funds II (“Loomis Sayles Funds Trusts”). Expenses of a Fund are borne pro rata by the holders of each class of shares, except that each class bears expenses unique to that class (including Rule 12b-1 service and distribution fees and for Institutional Class, Retail Class and Admin Class (for the Small Cap Value Fund), collectively, and Class N, individually,
| 50
Notes to Financial Statements – continued
September 30, 2015
transfer agent fees). In addition, each class votes as a class only with respect to its own Rule 12b-1 Plan. Shares of each class would receive their pro rata share of the net assets of a Fund if the Fund were liquidated. The Trustees approve separate distributions from net investment income on each class of shares.
2. Significant Accounting Policies. The following is a summary of significant accounting policies consistently followed by each Fund in the preparation of its financial statements. The Funds’ financial statements follow the accounting and reporting guidelines provided for investment companies and are prepared in accordance with accounting principles generally accepted in the United States of America which require the use of management estimates that affect the reported amounts and disclosures in the financial statements. Actual results could differ from those estimates. Management has evaluated the events and transactions subsequent to year-end through the date the financial statements were issued and has determined that there were no material events that would require disclosure in the Funds’ financial statements except as disclosed in Note 11.
a. Valuation. Fund securities and other investments are valued at market value based on market quotations obtained or determined by independent pricing services recommended by the adviser and approved by the Board of Trustees. Fund securities and other investments for which market quotations are not readily available are valued at fair value as determined in good faith by the adviser pursuant to procedures approved by the Board of Trustees, as described below. Market value is determined as follows:
Listed equity securities (including closed-end investment companies and exchange-traded funds) are valued at the last sale price quoted on the exchange where they are traded most extensively or, if there is no reported sale during the day, the closing bid quotation. Securities traded on the NASDAQ Global Select Market, NASDAQ Global Market and NASDAQ Capital Market are valued at the NASDAQ Official Closing Price (“NOCP”), or if lacking an NOCP, at the most recent bid quotations on the applicable NASDAQ Market. Unlisted equity securities (except unlisted preferred equity securities) are valued at the last sale price quoted in the market where they are traded most extensively or, if there is no reported sale during the day, the closing bid quotation. If there is no last sale price or closing bid quotation available, unlisted equity securities will be valued using evaluated bids furnished by an independent pricing service, if available. In some foreign markets, an official close price and a last sale price may be available from the foreign exchange or market. In those cases, the official close price is used. Debt securities and unlisted preferred equity securities are valued based on evaluated bids furnished to the Fund by an independent pricing service or bid prices obtained from broker-dealers. Broker-dealer bid prices may be used to value debt and unlisted equity securities where an independent pricing service is unable to price a security or where an independent pricing service does not provide a reliable price for the security.
Fund securities and other investments for which market quotations are not readily available are valued at fair value as determined in good faith by the adviser pursuant to
51 |
Notes to Financial Statements – continued
September 30, 2015
procedures approved by the Board of Trustees. The Funds may also value securities and other investments at fair value in other circumstances such as when extraordinary events occur after the close of a foreign market but prior to the close of the New York Stock Exchange (“NYSE”). This may include situations relating to a single issuer (such as a declaration of bankruptcy or a delisting of the issuer’s security from the primary market on which it has traded) as well as events affecting the securities markets in general (such as market disruptions or closings and significant fluctuations in U.S. and/or foreign markets). When fair valuing its securities or other investments, the Funds may, among other things, use modeling tools or other processes that may take into account factors such as securities or other market activity and/or significant events that occur after the close of the foreign market and before the time the Fund’s net asset value (“NAV”) is calculated. Fair value pricing may require subjective determinations about the value of a security, and fair values used to determine a Fund’s NAV may differ from quoted or published prices, or from prices that are used by others, for the same securities. In addition, the use of fair value pricing may not always result in adjustments to the prices of securities held by a Fund.
b. Investment Transactions and Related Investment Income. Investment transactions are accounted for on a trade date plus one day basis for daily NAV calculation. However, for financial reporting purposes, investment transactions are reported on trade date. Dividend income is recorded on ex-dividend date, or in the case of certain foreign securities, as soon as a Fund is notified, and interest income is recorded on an accrual basis. Interest income is increased by the accretion of discount and decreased by the amortization of premium. Distributions received from investments in securities that represent a return of capital or capital gain are recorded as a reduction of cost of investments or as a realized gain, respectively. The calendar year-end amounts of ordinary income, capital gains and return of capital included in distributions received from the Funds’ investments in real estate investment trusts (“REITs”) are reported to the Funds after the end of the fiscal year; accordingly, the Funds estimate these amounts for accounting purposes until the characterization of REIT distributions is reported to the Funds after the end of the fiscal year. Estimates are based on the most recent REIT distribution information available. In determining net gain or loss on securities sold, the cost of securities has been determined on an identified cost basis. Investment income, non-class specific expenses and realized and unrealized gains and losses are allocated on a pro rata basis to each class based on the relative net assets of each class to the total net assets of the Fund.
c. Foreign Currency Translation. The books and records of the Funds are maintained in U.S. dollars. The values of securities, currencies and other assets and liabilities denominated in currencies other than U.S. dollars are translated into U.S. dollars based upon foreign exchange rates prevailing at the end of the period. Purchases and sales of investment securities, income and expenses are translated into U.S. dollars on the respective dates of such transactions.
Net realized foreign exchange gains or losses arise from sales of foreign currency, changes in exchange rates between the trade and settlement dates on securities transactions and the
| 52
Notes to Financial Statements – continued
September 30, 2015
difference between the amounts of dividends, interest and foreign withholding taxes recorded on the Fund’s books and the U.S. dollar equivalent of the amounts actually received or paid. Net unrealized foreign exchange gains or losses arise from changes in the value of assets and liabilities, other than investment securities, as of the end of the fiscal period, resulting from changes in exchange rates. Net realized foreign exchange gains or losses and the net change in unrealized foreign exchange gains or losses are disclosed in the Statements of Operations.
The values of investment securities are presented at the foreign exchange rates prevailing at the end of the period for financial reporting purposes. Net realized and unrealized gains or losses on investments reported in the Statements of Operations reflect gains or losses resulting from changes in exchange rates and fluctuations which arise due to changes in market prices of investment securities.
The Funds may use foreign currency exchange contracts to facilitate transactions in foreign-denominated investments. Losses may arise from changes in the value of the foreign currency or if the counterparties do not perform under the contracts’ terms.
d. Federal and Foreign Income Taxes. The Trusts treat each Fund as a separate entity for federal income tax purposes. Each Fund intends to meet the requirements of the Internal Revenue Code of 1986, as amended, applicable to regulated investment companies, and to distribute to its shareholders substantially all of its net investment income and any net realized capital gains at least annually. Management has performed an analysis of each Fund’s tax positions for the open tax years as of September 30, 2015 and has concluded that no provisions for income tax are required. The Funds’ federal tax returns for the prior three fiscal years remain subject to examination by the Internal Revenue Service. Management is not aware of any events that are reasonably possible to occur in the next twelve months that would result in the amounts of any unrecognized tax benefits significantly increasing or decreasing for the Funds. However, management’s conclusions regarding tax positions taken may be subject to review and adjustment at a later date based on factors including, but not limited to, new tax laws and accounting regulations and interpretations thereof.
A Fund may be subject to foreign withholding taxes on investment income and taxes on capital gains on investments that are accrued and paid based upon the Fund’s understanding of the tax rules and regulations that exist in the countries in which the Fund invests. Foreign withholding taxes on dividend and interest income are reflected on the Statements of Operations as a reduction of investment income, net of amounts eligible to be reclaimed. Dividends and interest receivable on the Statements of Assets and Liabilities are net of foreign withholding taxes. Foreign withholding taxes where reclaims have been or will be filed are reflected on the Statements of Assets and Liabilities as tax reclaims receivable. Capital gains taxes paid are included in net realized gain (loss) on investments in the Statements of Operations. Accrued but unpaid capital gains taxes are reflected as foreign taxes payable on the Statements of Assets and Liabilities, if applicable,
53 |
Notes to Financial Statements – continued
September 30, 2015
and reduce unrealized gains on investments. In the event that realized gains on investments are subsequently offset by realized losses, taxes paid on realized gains may be returned to a Fund. Such amounts, if applicable, are reflected as foreign tax rebates receivable on the Statements of Assets and Liabilities and are recorded as a realized gain when received.
e. Dividends and Distributions to Shareholders. Dividends and distributions are recorded on ex-dividend date. The timing and characterization of certain income and capital gain distributions are determined in accordance with federal tax regulations, which may differ from accounting principles generally accepted in the United States of America. Permanent differences are primarily due to differing treatments for book and tax purposes of items such as return of capital distributions received, deferred Trustees’ fees, net operating losses and non-deductible expenses. Permanent book and tax basis differences relating to shareholder distributions will result in reclassifications to capital accounts reported on the Statements of Assets and Liabilities. Temporary differences between book and tax distributable earnings are primarily due to return of capital distributions received, deferred Trustees’ fees and wash sales. Amounts of income and capital gain available to be distributed on a tax basis are determined annually, and at other times during the Funds’ fiscal year as may be necessary to avoid knowingly declaring and paying a return of capital distribution. Distributions from net investment income and short-term capital gains are considered to be distributed from ordinary income for tax purposes.
The tax characterization of distributions is determined on an annual basis. The tax character of distributions paid to shareholders during the years ended September 30, 2015 and 2014 were as follows:
| | | | | | | | | | | | | | | | | | | | | | | | |
| | | 2015 Distributions Paid From: | | | 2014 Distributions Paid From: | |
Fund | | Ordinary
Income | | | Long-Term
Capital Gains | | | Total | | | Ordinary
Income | | | Long-Term
Capital Gains | | | Total | |
Small Cap Growth Fund | | $ | — | | | $ | 149,109,447 | | | $ | 149,109,447 | | | $ | — | | | $ | 80,584,587 | | | $ | 80,584,587 | |
Small Cap Value Fund | | | 10,451,269 | | | | 142,087,857 | | | | 152,539,126 | | | | 2,574,013 | | | | 105,994,100 | | | | 108,568,113 | |
Small/Mid Cap Growth Fund | | | — | | | | — | | | | — | | | | — | | | | — | | | | — | |
As of September 30, 2015, the components of distributable earnings on a tax basis were as follows:
| | | | | | | | | | | | |
| | | Small Cap
Growth Fund | | | Small Cap
Value Fund | | | Small/Mid Cap
Growth Fund | |
Undistributed ordinary income | | $ | — | | | $ | 5,506,157 | | | $ | — | |
Undistributed long-term capital gain | | | 85,662,331 | | | | 90,900,378 | | | | — | |
| | | | | | | | | | | | |
Total undistributed earnings | | | 85,662,331 | | | | 96,406,535 | | | | — | |
| | | | | | | | | | | | |
Capital loss carryforward: | | | | | | | | | | | | |
Short-term: | | | | | | | | | | | | |
No expiration date | | | — | | | | — | | | | (168,511 | ) |
| | | | | | | | | | | | |
| 54
Notes to Financial Statements – continued
September 30, 2015
| | | | | | | | | | | | |
| | | Small Cap
Growth Fund | | | Small Cap
Value Fund | | | Small/Mid Cap
Growth Fund | |
Late-year ordinary and post-October capital loss deferrals* | | $ | (5,146,367 | ) | | $ | — | | | $ | — | |
Unrealized appreciation (depreciation) | | | 123,866,401 | | | | 240,323,472 | | | | (775,189 | ) |
| | | | | | | | | | | | |
Total accumulated earnings | | $ | 204,382,365 | | | $ | 336,730,007 | | | $ | (943,700 | ) |
| | | | | | | | | | | | |
* Under current tax law, capital losses, foreign currency losses, and losses on passive foreign investment companies and contingent payment debt instruments after October 31 or December 31, as applicable, may be deferred and treated as occurring on the first day of the following taxable year.
f. Repurchase Agreements. Each Fund may enter into repurchase agreements, under the terms of a Master Repurchase Agreement, under which each Fund acquires securities as collateral and agrees to resell the securities at an agreed upon time and at an agreed upon price. It is each Fund’s policy that the market value of the collateral for repurchase agreements be at least equal to 102% of the repurchase price, including interest. Certain repurchase agreements are tri-party arrangements whereby the collateral is held in a segregated account for the benefit of the Fund and on behalf of the counterparty. Repurchase agreements could involve certain risks in the event of default or insolvency of the counterparty, including possible delays or restrictions upon a Fund’s ability to dispose of the underlying securities. As of September 30, 2015, each Fund, as applicable, had investments in repurchase agreements for which the value of the related collateral exceeded the value of the repurchase agreement. The gross value of repurchase agreements is included in the Statements of Assets and Liabilities for financial reporting purposes.
g. Securities Lending. The Funds have entered into an agreement with State Street Bank and Trust Company (“State Street Bank”), as agent of the Funds, to lend securities to certain designated borrowers. The loans are collateralized with cash or securities in an amount equal to at least 105% or 102% of the market value (including accrued interest) of the loaned international or domestic securities, respectively, when the loan is initiated. Thereafter, the value of the collateral must remain at least 102% of the market value (including accrued interest) of loaned securities for U.S. equities and U.S. corporate debt; at least 105% of the market value (including accrued interest) of loaned securities for non-U.S. equities; and at least 100% of the market value (including accrued interest) of loaned securities for U.S. Government securities, sovereign debt issued by non-U.S. Governments and non-U.S. corporate debt. In the event that the market value of the collateral falls below the required percentages described above, the borrower will deliver additional collateral on the next business day. As with other extensions of credit, the Funds may bear the risk of loss with respect to the investment of the collateral. The Funds invest cash collateral in short-term investments, a portion of the income from which is remitted to the borrowers and the remainder allocated between the Funds and State Street Bank as lending agent.
For the year ended September 30, 2015, none of the Funds had loaned securities under this agreement.
55 |
Notes to Financial Statements – continued
September 30, 2015
h. Indemnifications. Under the Trusts’ organizational documents, their officers and Trustees are indemnified against certain liabilities arising out of the performance of their duties to the Funds. Additionally, in the normal course of business, the Funds enter into contracts with service providers that contain general indemnification clauses. The Funds’ maximum exposure under these arrangements is unknown as this would involve future claims that may be made against the Funds that have not yet occurred. However, based on experience, the Funds expect the risk of loss to be remote.
3. Fair Value Measurements. In accordance with accounting standards related to fair value measurements and disclosures, the Funds have categorized the inputs utilized in determining the value of each Fund’s assets or liabilities. These inputs are summarized in the three broad levels listed below:
| | • | | Level 1—quoted prices in active markets for identical assets or liabilities; |
| | • | | Level 2—prices determined using other significant inputs that are observable either directly, or indirectly through corroboration with observable market data (which could include quoted prices for similar assets or liabilities, interest rates, credit risk, etc.); and |
| | • | | Level 3—prices determined using significant unobservable inputs when quoted prices or observable inputs are unavailable such as when there is little or no market activity for an asset or liability (unobservable inputs reflect each Fund’s own assumptions in determining the fair value of assets or liabilities and would be based on the best information available). |
The inputs or methodology used for valuing securities are not necessarily an indication of the risk associated with investing in those securities.
The following is a summary of the inputs used to value the Funds’ investments as of September 30, 2015, at value:
Small Cap Growth Fund
Asset Valuation Inputs
| | | | | | | | | | | | | | | | |
Description | | Level 1 | | | Level 2 | | | Level 3 | | | Total | |
Common Stocks(a) | | $ | 1,084,813,980 | | | $ | — | | | $ | — | | | $ | 1,084,813,980 | |
Short-Term Investments | | | — | | | | 52,824,100 | | | | — | | | | 52,824,100 | |
| | | | | | | | | | | | | | | | |
Total | | $ | 1,084,813,980 | | | $ | 52,824,100 | | | $ | — | | | $ | 1,137,638,080 | |
| | | | | | | | | | | | | | | | |
(a) Details of the major categories of the Fund’s investments are reflected within the Portfolio of Investments.
For the year ended September 30, 2015, there were no transfers among Levels 1, 2 and 3.
| 56
Notes to Financial Statements – continued
September 30, 2015
Small Cap Value Fund
Asset Valuation Inputs
| | | | | | | | | | | | | | | | |
Description | | Level 1 | | | Level 2 | | | Level 3 | | | Total | |
Common Stocks(a) | | $ | 1,034,534,154 | | | $ | — | | | $ | — | | | $ | 1,034,534,154 | |
Closed-End Investment Companies | | | 4,913,581 | | | | — | | | | — | | | | 4,913,581 | |
Short-Term Investments | | | — | | | | 17,043,053 | | | | — | | | | 17,043,053 | |
| | | | | | | | | | | | | | | | |
Total | | $ | 1,039,447,735 | | | $ | 17,043,053 | | | $ | — | | | $ | 1,056,490,788 | |
| | | | | | | | | | | | | | | | |
(a) Details of the major categories of the Fund’s investments are reflected within the Portfolio of Investments.
For the year ended September 30, 2015, there were no transfers among Levels 1, 2 and 3.
|
Small/Mid Cap Growth Fund Asset Valuation Inputs |
| | | | | | | | | | | | | | | | |
Description | | Level 1 | | | Level 2 | | | Level 3 | | | Total | |
Common Stocks(a) | | $ | 8,837,936 | | | $ | — | | | $ | — | | | $ | 8,837,936 | |
Short-Term Investments | | | — | | | | 531,621 | | | | — | | | | 531,621 | |
| | | | | | | | | | | | | | | | |
Total | | $ | 8,837,936 | | | $ | 531,621 | | | $ | — | | | $ | 9,369,557 | |
| | | | | | | | | | | | | | | | |
(a) Details of the major categories of the Fund’s investments are reflected within the Portfolio of Investments.
For the period ended September 30, 2015, there were no transfers among Levels 1, 2 and 3.
4. Purchases and Sales of Securities. For the year ended September 30, 2015, purchases and sales of securities (excluding short-term investments) were as follows:
| | | | | | | | |
Fund | | Purchases | | | Sales | |
Small Cap Growth Fund | | $ | 854,894,956 | | | $ | 851,461,206 | |
Small Cap Value Fund | | | 249,202,891 | | | | 356,210,684 | |
Small/Mid Cap Growth Fund | | | 11,093,062 | | | | 1,311,191 | |
5. Management Fees and Other Transactions with Affiliates.
a. Management Fees. Loomis, Sayles & Company, L.P. (“Loomis Sayles”) serves as investment adviser to each Fund. Under the terms of the management agreements, each Fund pays a management fee at the following annual rates, calculated daily and payable monthly, based on each Fund’s average daily net assets:
| | |
Fund | | Percentage of
Average Daily Net Assets |
Small Cap Growth Fund | | 0.75% |
Small Cap Value Fund | | 0.75% |
Small/Mid Cap Growth Fund | | 0.75% |
57 |
Notes to Financial Statements – continued
September 30, 2015
Loomis Sayles has given binding undertakings to the Funds to waive management fees and/or reimburse certain expenses to limit the Funds’ operating expenses, exclusive of acquired fund fees and expenses, brokerage expenses, interest expense, taxes, organizational and extraordinary expenses such as litigation and indemnification expenses. These undertakings are in effect until January 31, 2016, (January 31, 2017 for Small/Mid Cap Growth Fund) may be terminated before then only with the consent of the Funds’ Board of Trustees and are reevaluated on an annual basis. Management fees payable, as reflected on the Statements of Assets and Liabilities, is net of waivers and/or expense reimbursements, if any, pursuant to these undertakings. Waivers/reimbursements that exceed management fees payable are reflected on the Statement of Assets and Liabilities as receivable from investment adviser.
For the year ended September 30, 2015, the expense limits as a percentage of average daily net assets under the expense limitation agreements were as follows:
| | | | | | | | |
| | | Expense Limit as a Percentage of
Average Daily Net Assets |
Fund | | Institutional Class | | Retail Class | | Admin Class | | Class N |
Small Cap Growth Fund | | 1.00% | | 1.25% | | — | | 0.95% |
Small Cap Value Fund | | 0.90% | | 1.15% | | 1.40% | | 0.85% |
Small/Mid Cap Growth Fund | | 0.85% | | — | | — | | — |
Loomis Sayles shall be permitted to recover expenses it has borne under the expense limitation agreements (whether through waiver of its management fees or otherwise) on a class by class basis in later periods to the extent the annual operating expenses of a class fall below a class’ expense limits, provided, however, that a class is not obligated to pay such waived/reimbursed fees or expenses more than one year after the end of the fiscal year in which the fees or expenses were waived/reimbursed.
For the year ended September 30, 2015, the management fees for each Fund were as follows:
| | | | | | | | | | | | | | | | | | | | |
| | | Management
Fees | | | Waivers of
Management
Fees1 | | | Net
Management
Fees | | | Percentage of
Average Net Assets | |
Fund | | | | | Gross | | | Net | |
Small Cap Growth Fund | | $ | 8,447,388 | | | $ | — | | | $ | 8,447,388 | | | | 0.75% | | | | 0.75% | |
Small Cap Value Fund | | | 8,862,889 | | | | — | | | | 8,862,889 | | | | 0.75% | | | | 0.75% | |
Small/Mid Cap Growth Fund | | | 18,520 | | | | 18,520 | | | | — | | | | 0.75% | | | | — | |
For the year ended September 30, 2015, class-specific expenses have been reimbursed as follows:
| | | | | | | | | | | | | | | | | | | | |
| | | Reimbursement1 | |
Fund | | Institutional
Class | | | Retail
Class | | | Admin
Class | | | Class N | | | Total | |
Small Cap Value Fund | | $ | 170,510 | | | $ | 78,388 | | | $ | 12,920 | | | $ | — | | | $ | 261,818 | |
In addition, the investment adviser reimbursed non-class specific expenses of Small/Mid Cap Growth Fund in the amount of $25,958 for the year ended September 30, 20151.
1 Expense reimbursements are subject to possible recovery until September 30, 2016.
| 58
Notes to Financial Statements – continued
September 30, 2015
For the year ended September 30, 2015, expense reimbursements related to the prior fiscal year were recovered as follows:
| | | | |
Fund | | Class N | |
Small Cap Value Fund | | $ | 577 | |
Certain officers and employees of Loomis Sayles are also officers or Trustees of the Trusts. Loomis Sayles’ general partner is indirectly owned by Natixis US, which is part of Natixis Global Asset Management, an international asset management group based in Paris, France.
b. Service and Distribution Fees. NGAM Distribution, L.P. (“NGAM Distribution”), which is a wholly-owned subsidiary of Natixis US, has entered into a distribution agreement with the Trusts. Pursuant to this agreement, NGAM Distribution serves as principal underwriter of the Funds of the Trusts.
Pursuant to Rule 12b-1 under the 1940 Act, Small Cap Growth Fund and Small Cap Value Fund have adopted a Distribution Plan relating to each Fund’s Retail Class shares (the “Retail Class Plans”) and Small Cap Value Fund has adopted a Distribution Plan relating to its Admin Class shares (the “Admin Class Plan”).
Under the Retail Class Plans, each Fund pays NGAM Distribution a monthly distribution fee at an annual rate not to exceed 0.25% of the average daily net assets attributable to the Funds’ Retail Class shares, as compensation for services provided by NGAM Distribution in connection with the marketing or sale of Retail Class shares or for payments made by NGAM Distribution to securities dealers or other financial intermediaries as commissions, asset-based sales charges or other compensation with respect to the sale of Retail Class shares, or for providing personal services to investors and/or maintenance of shareholder accounts.
Under the Admin Class Plan, Small Cap Value Fund pays NGAM Distribution a monthly distribution fee at an annual rate not to exceed 0.25% of the average daily net assets attributable to the Fund’s Admin Class shares, as compensation for services provided by NGAM Distribution in connection with the marketing or sale of Admin Class shares or for payments made by NGAM Distribution to securities dealers or other financial intermediaries as commissions, asset-based sales charges or other compensation with respect to the sale of Admin Class shares, or for providing personal services to investors and/or the maintenance of shareholder accounts.
In addition, the Admin Class shares of Small Cap Value Fund may pay NGAM Distribution an administrative service fee, at an annual rate not to exceed 0.25% of the average daily net assets attributable to Admin Class shares. These fees are subsequently paid to securities dealers or financial intermediaries for providing personal services and/or account maintenance for their customers who hold such shares.
59 |
Notes to Financial Statements – continued
September 30, 2015
For the year ended September 30, 2015, the service and distribution fees for each Fund were as follows:
| | | | | | | | | | | | |
| | | Service Fees | | | Distribution Fees | |
Fund | | Admin Class | | | Retail Class | | | Admin Class | |
Small Cap Growth Fund | | $ | — | | | $ | 438,180 | | | $ | — | |
Small Cap Value Fund | | | 135,605 | | | | 876,758 | | | | 146,998 | |
For the year ended September 30, 2015, NGAM Distribution refunded Small Cap Value Fund $11,393 in connection with an overpayment of prior year Admin Class service fees. Service and distribution fees on the Statements of Operations have been reduced by this amount.
c. Administrative Fees. NGAM Advisors, L.P. (“NGAM Advisors”) provides certain administrative services for the Funds and contracts with State Street Bank to serve as sub-administrator. NGAM Advisors is a wholly-owned subsidiary of Natixis US. Pursuant to an agreement among Natixis Funds Trusts, Loomis Sayles Funds Trusts and NGAM Advisors, each Fund pays NGAM Advisors monthly its pro rata portion of fees equal to an annual rate of 0.0575% of the first $15 billion of the average daily net assets of the Natixis Funds Trusts and Loomis Sayles Funds Trusts, 0.0500% of the next $15 billion, 0.0400% of the next $30 billion, 0.0350% of the next $30 billion and 0.0325% of such assets in excess of $90 billion, subject to an annual aggregate minimum fee for the Natixis Funds Trusts and Loomis Sayles Funds Trusts of $10 million, which is reevaluated on an annual basis.
For the year ended September 30, 2015, the administrative fees for each Fund were as follows:
| | | | |
Fund | | Administrative
Fees | |
Small Cap Growth Fund | | $ | 480,487 | |
Small Cap Value Fund | | | 504,004 | |
Small/Mid Cap Growth Fund | | | 1,049 | |
d. Sub-Transfer Agent Fees. NGAM Distribution has entered into agreements, which include servicing agreements, with financial intermediaries that provide recordkeeping, processing, shareholder communications and other services to customers of the intermediaries that hold positions in the Funds and has agreed to compensate the intermediaries for providing those services. Intermediaries transact with the Funds primarily through the use of omnibus accounts on behalf of their customers who hold positions in the Funds. These services would have been provided by the Funds’ transfer agent and other service providers if the shareholders’ accounts were maintained directly at the Funds’ transfer agent. Accordingly, the Funds have agreed to reimburse NGAM Distribution for all or a portion of the servicing fees paid to these intermediaries. The reimbursement amounts (sub-transfer agent fees) paid to NGAM Distribution are subject to a current per-account equivalent fee limit approved by the Funds’ Board of Trustees, which is based on fees for similar services paid to the Funds’ transfer agent and other service providers. Class N shares do not bear such expenses.
| 60
Notes to Financial Statements – continued
September 30, 2015
For the year ended September 30, 2015, the sub-transfer agent fees (which are reflected in transfer agent fees and expenses in the Statements of Operations) for each Fund were as follows:
| | | | |
Fund | | Sub-Transfer
Agent Fees | |
Small Cap Growth Fund | | $ | 1,206,925 | |
Small Cap Value Fund | | | 1,168,368 | |
Small/Mid Cap Growth Fund | | | 18 | |
As of September 30, 2015, the Funds owe NGAM Distribution the following reimbursements for sub-transfer agent fees (which are reflected in the Statements of Assets and Liabilities as payable to distributor):
| | | | |
Fund | | Reimbursements
of Sub-Transfer
Agent Fees | |
Small Cap Growth Fund | | $ | 13,733 | |
Small Cap Value Fund | | | 14,059 | |
Small/Mid Cap Growth Fund | | | 18 | |
Sub-transfer agent fees attributable to Institutional Class, Retail Class and Admin Class are allocated on a pro rata basis to each class based on the relative net assets of each class to the total net assets of those classes.
e. Trustees Fees and Expenses. The Trusts do not pay any compensation directly to their officers or Trustees who are directors, officers or employees of NGAM Advisors, NGAM Distribution, Natixis US or their affiliates. The Chairperson of the Board of Trustees receives a retainer fee at the annual rate of $300,000. The Chairperson does not receive any meeting attendance fees for Board of Trustees meetings or committee meetings that she attends. Each Independent Trustee (other than the Chairperson) receives, in the aggregate, a retainer fee at the annual rate of $130,000. Each Independent Trustee also receives a meeting attendance fee of $10,000 for each meeting of the Board of Trustees that he or she attends in person and $5,000 for each meeting of the Board of Trustees that he or she attends telephonically. In addition, the chairperson of the Contract Review Committee and the chairperson of the Audit Committee each receive an additional retainer fee at the annual rate of $17,500. The chairperson of the Governance Committee receives an additional retainer fee at the annual rate of $5,000. Each Contract Review Committee member is compensated $6,000 for each Committee meeting that he or she attends in person and $3,000 for each meeting that he or she attends telephonically. Each Audit Committee member is compensated $6,000 for each Committee meeting that he or she attends in person and $3,000 for each meeting that he or she attends telephonically. These fees are allocated among the funds in the Natixis Funds Trusts, Loomis Sayles Funds Trusts and Gateway Trust based on a formula that takes into account, among other factors, the relative net assets of each fund. Trustees are reimbursed for travel expenses in connection with attendance at meetings.
61 |
Notes to Financial Statements – continued
September 30, 2015
A deferred compensation plan (the “Plan”) is available to the Trustees on a voluntary basis. Deferred amounts remain in the Funds until distributed in accordance with the provisions of the Plan. The value of a participating Trustee’s deferral account is based on theoretical investments of deferred amounts, on the normal payment dates, in certain funds of the Natixis Funds Trusts and Loomis Sayles Funds Trusts as designated by the participating Trustees. Changes in the value of participants’ deferral accounts are allocated pro rata among the funds in the Natixis Funds Trusts and Loomis Sayles Funds Trusts, and are normally reflected as Trustees’ fees and expenses in the Statements of Operations. The portions of the accrued obligations allocated to the Funds under the Plan are reflected as Deferred Trustees’ fees in the Statements of Assets and Liabilities.
f. Affiliated Ownership. As of September 30, 2015, Loomis Sayles Funded Pension Plan and Trust (“Pension Plan”) and Loomis Sayles Employees’ Profit Sharing Retirement Plan (“Retirement Plan”) and Natixis US held shares of the Funds representing the following percentages of the Fund’s net assets:
| | | | | | | | |
Fund | | Pension Plan | | Retirement Plan | | Natixis US | | Total Affiliated
Ownership |
Small Cap Growth Fund | | 0.93% | | 1.32% | | — | | 2.25% |
Small Cap Value Fund | | 1.59% | | 2.38% | | — | | 3.97% |
Small/Mid Cap Growth | | — | | — | | 97.92% | | 97.92% |
Investment activities of affiliated shareholders could have material impacts on the Funds.
g. Payments by Affiliates. For the year ended September 30, 2015, Loomis Sayles reimbursed the Small Cap Value Fund $6,186 for losses incurred in connection with a trading error.
6. Class-Specific Transfer Agent Fees and Expenses. For the year ended September 30, 2015, the Funds incurred the following class-specific transfer agent fees and expenses (including sub-transfer agent fees, where applicable):
| | | | | | | | | | | | | | | | |
| | | Transfer Agent Fees and Expenses | |
Fund | | Institutional
Class | | | Retail Class | | | Admin
Class | | | Class N | |
Small Cap Growth Fund | | $ | 1,022,569 | | | $ | 204,597 | | | $ | — | | | $ | 424 | |
Small Cap Value Fund | | | 783,309 | | | | 363,564 | | | | 60,873 | | | | 315 | |
Small/Mid Cap Growth Fund | | | 41 | | | | — | | | | — | | | | — | |
Transfer agent fees and expenses attributable to Institutional Class, Retail Class and Admin Class are allocated on a pro rata basis to each class based on relative net assets of each class to the total net assets of those classes. Transfer agent fees and expenses attributable to Class N are allocated to Class N.
7. Line of Credit. Each Fund, together with certain other funds of Natixis Funds Trusts and Loomis Sayles Funds Trusts, participates in a $150,000,000 committed unsecured line of credit provided by State Street Bank. Any one Fund may borrow up to the full $150,000,000 under the line of credit (as long as all borrowings by all Funds in the
| 62
Notes to Financial Statements – continued
September 30, 2015
aggregate do not exceed the $150,000,000 limit at any time). Interest is charged to each participating Fund based on its borrowings at a rate per annum equal to the greater of the Federal Funds rate or overnight LIBOR, plus 1.25%. In addition, a commitment fee of 0.15% per annum, payable at the end of each calendar quarter, is accrued and apportioned among the participating funds based on their average daily unused portion of the line of credit.
For the year ended September 30, 2015, none of the Funds had borrowings under this agreement.
Prior to April 16, 2015, the committed unsecured line of credit was $200,000,000 with an individual limit of $125,000,000 for each Fund that participated in the line of credit. In addition, the commitment fee was 0.10% per annum, payable at the end of each calendar quarter.
8. Brokerage Commission Recapture. Each Fund has entered into agreements with certain brokers whereby the brokers will rebate a portion of brokerage commissions. All amounts rebated by the brokers are returned to the Funds under such agreements and are included in realized gains on investments in the Statements of Operations. For the year ended September 30, 2015, amounts rebated under these agreements were as follows:
| | | | |
Fund | | Rebates | |
Small Cap Growth Fund | | $ | 87,724 | |
Small Cap Value Fund | | | 42,327 | |
Small/Mid Cap Growth Fund | | | 235 | |
9. Concentration of Ownership. From time to time, a Fund may have a concentration of one or more accounts constituting a significant percentage of shares outstanding. Investment activities by holders of such accounts could have material impacts on the Funds. As of September 30, 2015, based on management’s evaluation of the shareholder account base, the Funds had accounts representing controlling ownership of more than 5% of the Fund’s total outstanding shares. The number of such accounts, based on accounts that represent more than 5% of an individual class of shares, and the aggregate percentage of net assets represented by such holdings were as follows:
| | | | | | | | |
Fund | | Number of 5%
Non-Affiliated
Account Holders | | Percentage of
Non-Affiliated
Ownership | | Percentage of
Affiliated Ownership
(Note 5) | | Total
Percentage of
Ownership |
Small Cap Growth Fund | | 2 | | 32.12% | | 2.25% | | 34.37% |
Small Cap Value Fund | | 3 | | 24.55% | | 3.97% | | 28.52% |
Small/Mid Cap Growth | | — | | — | | 97.92% | | 97.92% |
Omnibus shareholder accounts for which NGAM Advisors understands that the intermediary has discretion over the underlying shareholder accounts or investment models where a shareholder account may be invested for a non-discretionary customer are included in the table above. For other omnibus accounts, the Funds do not have information on the
63 |
Notes to Financial Statements – continued
September 30, 2015
individual shareholder accounts underlying the omnibus accounts; therefore, there could be other 5% shareholders in addition to those disclosed in the table above.
10. Capital Shares. Each Fund may issue an unlimited number of shares of beneficial interest, without par value. Transactions in capital shares were as follows:
| | | | | | | | | | | | | | | | |
| | | Small Cap Growth Fund | |
| | | Year Ended
September 30, 2015 | | | Year Ended
September 30, 2014 | |
| Institutional Class | | Shares | | | Amount | | | Shares | | | Amount | |
Issued from the sale of shares | | | 7,265,268 | | | $ | 175,813,770 | | | | 8,265,332 | | | $ | 214,034,486 | |
Issued in connection with the reinvestment of distributions | | | 5,134,319 | | | | 117,062,465 | | | | 2,386,288 | | | | 61,256,020 | |
Redeemed | | | (11,470,816 | ) | | | (274,541,353 | ) | | | (10,228,143 | ) | | | (257,989,269 | ) |
| | | | | | | | | | | | | | | | |
Net change | | | 928,771 | | | $ | 18,334,882 | | | | 423,477 | | | $ | 17,301,237 | |
| | | | | | | | | | | | | | | | |
| Retail Class | | | | | | | | | | | | |
Issued from the sale of shares | | | 1,423,680 | | | $ | 32,677,891 | | | | 1,803,527 | | | $ | 44,732,574 | |
Issued in connection with the reinvestment of distributions | | | 1,163,810 | | | | 25,045,197 | | | | 637,221 | | | | 15,605,531 | |
Redeemed | | | (2,397,388 | ) | | | (53,969,398 | ) | | | (3,240,173 | ) | | | (78,525,108 | ) |
| | | | | | | | | | | | | | | | |
Net change | | | 190,102 | | | $ | 3,753,690 | | | | (799,425 | ) | | $ | (18,187,003 | ) |
| | | | | | | | | | | | | | | | |
| Class N | | | | | | | | | | | | |
Issued from the sale of shares | | | 6,907,906 | | | $ | 165,784,056 | | | | 426,210 | | | $ | 10,866,912 | |
Issued in connection with the reinvestment of distributions | | | 119,335 | | | | 2,724,416 | | | | 20,604 | | | | 529,097 | |
Redeemed | | | (346,462 | ) | | | (8,289,576 | ) | | | (113,573 | ) | | | (2,866,438 | ) |
| | | | | | | | | | | | | | | | |
Net change | | | 6,680,779 | | | $ | 160,218,896 | | | | 333,241 | | | $ | 8,529,571 | |
| | | | | | | | | | | | | | | | |
Increase (decrease) from capital share transactions | | | 7,799,652 | | | $ | 182,307,468 | | | | (42,707 | ) | | $ | 7,643,805 | |
| | | | | | | | | | | | | | | | |
| | | | | | | | | | | | | | | | |
| | | Small Cap Value Fund | |
| | | Year Ended
September 30, 2015 | | | Year Ended
September 30, 2014 | |
| Institutional Class | | Shares | | | Amount | | | Shares | | | Amount | |
Issued from the sale of shares | | | 3,379,231 | | | $ | 118,476,722 | | | | 3,763,242 | | | $ | 142,391,032 | |
Issued in connection with the reinvestment of distributions | | | 2,730,775 | | | | 93,993,275 | | | | 1,733,383 | | | | 64,429,846 | |
Redeemed | | | (5,495,573 | ) | | | (195,820,490 | ) | | | (5,018,897 | ) | | | (188,920,687 | ) |
| | | | | | | | | | | | | | | | |
Net change | | | 614,433 | | | $ | 16,649,507 | | | | 477,728 | | | $ | 17,900,191 | |
| | | | | | | | | | | | | | | | |
| 64
Notes to Financial Statements – continued
September 30, 2015
10. Capital Shares – continued.
| | | | | | | | | | | | | | | | |
| | | Small Cap Value Fund | |
| | | Year Ended
September 30, 2015 | | | Year Ended
September 30, 2014 | |
| Retail Class | | Shares | | | Amount | | | Shares | | | Amount | |
Issued from the sale of shares | | | 931,124 | | | $ | 32,655,794 | | | | 981,833 | | | $ | 36,703,146 | |
Issued in connection with the reinvestment of distributions | | | 1,357,910 | | | | 46,236,825 | | | | 952,559 | | | | 35,063,705 | |
Redeemed | | | (2,618,373 | ) | | | (91,431,051 | ) | | | (2,862,025 | ) | | | (107,131,359 | ) |
| | | | | | | | | | | | | | | | |
Net change | | | (329,339 | ) | | $ | (12,538,432 | ) | | | (927,633 | ) | | $ | (35,364,508 | ) |
| | | | | | | | | | | | | | | | |
| Admin Class | | | | | | | | | | | | |
Issued from the sale of shares | | | 314,600 | | | $ | 10,633,628 | | | | 613,122 | | | $ | 22,321,084 | |
Issued in connection with the reinvestment of distributions | | | 179,802 | | | | 5,960,432 | | | | 143,514 | | | | 5,157,882 | |
Redeemed | | | (774,906 | ) | | | (26,217,314 | ) | | | (1,060,940 | ) | | | (38,817,639 | ) |
| | | | | | | | | | | | | | | | |
Net change | | | (280,504 | ) | | $ | (9,623,254 | ) | | | (304,304 | ) | | $ | (11,338,673 | ) |
| | | | | | | | | | | | | | | | |
| Class N | | | | | | | | | | | | |
Issued from the sale of shares | | | 1,179,383 | | | $ | 42,095,614 | | | | 95,239 | | | $ | 3,550,943 | |
Issued in connection with the reinvestment of distributions | | | 26,566 | | | | 914,684 | | | | 3 | | | | 106 | |
Redeemed | | | (79,684 | ) | | | (2,779,124 | ) | | | (24,788 | ) | | | (952,187 | ) |
| | | | | | | | | | | | | | | | |
Net change | | | 1,126,265 | | | $ | 40,231,174 | | | | 70,454 | | | $ | 2,598,862 | |
| | | | | | | | | | | | | | | | |
Increase (decrease) from capital share transactions | | | 1,130,855 | | | $ | 34,718,995 | | | | (683,755 | ) | | $ | (26,204,128 | ) |
| | | | | | | | | | | | | | | | |
| | | |
| | | Small/Mid Cap Growth
Fund | | | | | | | |
| | | Period Ended
September 30, 2015(a) | | | | | | | |
| Institutional Class | | Shares | | | Amount | | | | | | | |
Issued from the sale of shares | | | 1,020,804 | | | $ | 10,199,072 | | | | | | | | | |
Issued in connection with the reinvestment of distributions | | | — | | | | — | | | | | | | | | |
Redeemed | | | — | | | | — | | | | | | | | | |
| | | | | | | | | | | | | | | | |
Net change | | | 1,020,804 | | | $ | 10,199,072 | | | | | | | | | |
| | | | | | | | | | | | | | | | |
Increase (decrease) from capital share transactions | | | 1,020,804 | | | $ | 10,199,072 | | | | | | | | | |
| | | | | | | | | | | | | | | | |
(a) From commencement of operations on June 30, 2015 through September 30, 2015.
65 |
Notes to Financial Statements – continued
September 30, 2015
11. Subsequent Event. On September 10, 2015, the Board of Trustees approved the broadening of eligibility requirements for Class N shares of Small Cap Value Fund to include investors with an initial minimum investment of $1,000,000, effective November 2, 2015.
| 66
Report of Independent Registered Public Accounting Firm
To the Trustees of Loomis Sayles Funds I and Loomis Sayles Funds II and Shareholders of Loomis Sayles Small Cap Growth Fund, Loomis Sayles Small Cap Value Fund, and Loomis Sayles Small/Mid Cap Growth Fund:
In our opinion, the accompanying statements of assets and liabilities, including the portfolios of investments, and the related statements of operations and of changes in net assets and the financial highlights present fairly, in all material respects, the financial position of the Loomis Sayles Small Cap Growth Fund, a series of Loomis Sayles Funds II, Loomis Sayles Small Cap Value Fund, a series of Loomis Sayles Funds I, and Loomis Sayles Small/Mid Cap Growth Fund, a series of Loomis Sayles Funds II (collectively, the “Funds”) at September 30, 2015, and the results of each of their operations, the changes in each of their net assets and the financial highlights for each of the periods indicated, in conformity with accounting principles generally accepted in the United States of America. These financial statements and financial highlights (hereafter referred to as “financial statements”) are the responsibility of the Funds’ management. Our responsibility is to express an opinion on these financial statements based on our audits. We conducted our audits of these financial statements in accordance with the standards of the Public Company Accounting Oversight Board (United States). Those standards require that we plan and perform the audit to obtain reasonable assurance about whether the financial statements are free of material misstatement. An audit includes examining, on a test basis, evidence supporting the amounts and disclosures in the financial statements, assessing the accounting principles used and significant estimates made by management, and evaluating the overall financial statement presentation. We believe that our audits, which included confirmation of securities at September 30, 2015 by correspondence with the custodian and brokers, and the application of alternative auditing procedures where securities purchased had not been received, provide a reasonable basis for the opinion expressed above.
PricewaterhouseCoopers LLP
Boston, Massachusetts
November 20, 2015
67 |
2015 U.S. Tax Distribution Information to Shareholders (Unaudited)
Corporate Dividends Received Deduction. For the fiscal year ended September 30, 2015, a percentage of dividends distributed by the Fund listed below qualifies for the dividends received deduction for corporate shareholders. This percentage is as follows:
| | | | |
Fund | | Qualifying Percentage | |
Small Cap Value | | | 100.00% | |
Capital Gains Distributions. Pursuant to Internal Revenue Section 852(b), the following Funds paid distributions, which have been designated as capital gains distributions for the fiscal year ended September 30, 2015, unless subsequently determined to be different.
| | | | |
Fund | | Amount | |
Small Cap Growth | | $ | 149,109,447 | |
Small Cap Value | | | 142,087,857 | |
Qualified Dividend Income. For the fiscal year ended September 30, 2015, the Fund below will designate up to the maximum amount allowable pursuant to the Internal Revenue Code as qualified dividend income eligible for reduced tax rates. These lower rates range from 0% to 20% depending on an individual’s tax bracket. If the Fund pays a distribution during calendar year 2015, complete information will be reported in conjunction with Form 1099-DIV.
| 68
Trustee and Officer Information
As of 9/30/15
The tables below provide certain information regarding the trustees and officers of Loomis Sayles Funds I and Loomis Sayles Funds II (the “Trusts”). Unless otherwise indicated, the address of all persons below is 399 Boylston Street, Boston, MA 02116. The Funds’ Statements of Additional Information include additional information about the trustees of the Trusts and are available by calling Natixis Funds at 800-225-5478.
| | | | | | | | |
Name and Year of Birth | | Position(s) Held
with the Trust(s),
Length of Time
Served and
Term of Office1 | | Principal
Occupation(s)
During Past 5 Years | | Number of
Portfolios in
Fund Complex
Overseen2 and
Other
Directorships Held
During Past 5 Years | | Experience,
Qualifications,
Attributes, Skills
for Board
Membership |
| | | |
| INDEPENDENT TRUSTEES | | | | | | |
| | | | |
Kenneth A. Drucker (1945) | | Trustee since 2008 Chairperson of the Audit Committee and Governance Committee Member | | Retired | | 42 None | | Significant experience on the Board and on the boards of other business organizations (including at investment companies); executive experience (including as treasurer of an aerospace, automotive, and metal manufacturing corporation) |
| | | | |
Edmond J. English (1953) | | Trustee since 2013 Contract Review Committee Member | | Chief Executive Officer of Bob’s Discount Furniture (retail) | | 42 Formerly, Director, BJ’s Wholesale Club (retail); formerly, Director, Citizens Financial Group (bank) | | Experience on the Board and significant experience on the boards of other business organizations (including at a retail company and a bank); executive experience (including at a retail company) |
| | | | |
Richard A. Goglia (1951) | | Trustee since 2015 Audit Committee Member | | Retired; formerly Vice President and Treasurer of Raytheon Company (defense) | | 42 None | | Experience on the Board and executive experience (including his role as vice president and treasurer of a defense company and experience at a financial services company) |
69 |
Trustee and Officer Information – continued
| | | | | | | | |
Name and Year of Birth | | Position(s) Held
with the Trust(s),
Length of Time
Served and
Term of Office1 | | Principal
Occupation(s)
During Past 5 Years | | Number of
Portfolios in
Fund Complex
Overseen2 and
Other
Directorships Held
During Past 5 Years | | Experience,
Qualifications,
Attributes, Skills
for Board
Membership |
| | | |
| INDEPENDENT TRUSTEES – continued | | | | | | |
| | | | |
Wendell J. Knox (1948) | | Trustee since 2009 Audit Committee Member and Governance Committee Member | | Director of Abt Associates Inc. (research and consulting) | | 42 Director, Eastern Bank (bank); Director, The Hanover Insurance Group (property and casualty insurance) | | Significant experience on the Board and on the boards of other business organizations (including at a bank and at a property and casualty insurance firm); executive experience (including roles as president and chief executive officer of a research and consulting company) |
| | | | |
| Martin T. Meehan (1956) | | Trustee since 2012 Contract Review Committee Member | | President, University of Massachusetts (formerly, Chancellor and faculty member, University of Massachusetts Lowell) | | 42 None | | Experience on the Board and on the boards of other business organizations; experience as President of the University of Massachusetts; government experience (including as a member of the U.S. House of Representatives); academic experience |
| | | | |
Sandra O. Moose (1942) | | Chairperson of the Board of Trustees since November 2005 Trustee since 2003 Ex Officio member of the Audit Committee, the Contract Review Committee and the Governance Committee | | President, Strategic Advisory Services (management consulting) | | 42 Director, AES Corporation (international power company); formerly, Director, Verizon Communications (telecommunications company) | | Significant experience on the Board and on the boards of other business organizations (including at a telecommunications company, an international power company and a specialty chemicals corporation); executive experience (including at a management consulting company) |
| 70
Trustee and Officer Information – continued
| | | | | | | | |
Name and Year of Birth | | Position(s) Held
with the Trust(s),
Length of Time
Served and
Term of Office1 | | Principal
Occupation(s)
During Past 5 Years | | Number of
Portfolios in
Fund Complex
Overseen2 and
Other
Directorships Held
During Past 5 Years | | Experience,
Qualifications,
Attributes, Skills
for Board
Membership |
| | | |
| INDEPENDENT TRUSTEES – continued | | | | | | |
| | | | |
Erik R. Sirri (1958) | | Trustee since 2009 Audit Committee Member | | Professor of Finance at Babson College | | 42 None | | Significant experience on the Board; experience as Director of the Division of Trading and Markets at the Securities and Exchange Commission; academic experience; training as an economist |
| | | | |
Peter J. Smail (1952) | | Trustee since 2009 Chairperson of the Contract Review Committee and Governance Committee Member | | Retired | | 42 None | | Significant experience on the Board; mutual fund industry and executive experience (including roles as president and chief executive officer for an investment adviser) |
| | | | |
Cynthia L. Walker (1956) | | Trustee since 2005 Chairperson of the Governance Committee and Contract Review Committee Member | | Deputy Dean for Finance and Administration, Yale University School of Medicine | | 42 None | | Significant experience on the Board; executive experience in a variety of academic organizations (including roles as dean for finance and administration) |
| | |
| INTERESTED TRUSTEES | | | | |
| | | | |
Kevin P. Charleston3 (1965) One Financial Center Boston, MA 02111 | | Trustee since 2015 President and Chief Executive Officer of Loomis Sayles Funds I since 2015 | | President, Chief Executive Officer and Director; formerly, Chief Financial Officer, Loomis, Sayles & Company, L.P. | | 42 None | | Continuing service as President, Chief Executive Officer and Director of Loomis, Sayles & Company, L.P. |
71 |
Trustee and Officer Information – continued
| | | | | | | | |
Name and Year of Birth | | Position(s) Held
with the Trust(s),
Length of Time
Served and
Term of Office1 | | Principal
Occupation(s)
During Past 5 Years | | Number of
Portfolios in
Fund Complex
Overseen2 and
Other
Directorships Held
During Past 5 Years | | Experience,
Qualifications,
Attributes, Skills
for Board
Membership |
| | | |
| INTERESTED TRUSTEES – continued | | | | | | |
| | | | |
David L. Giunta4
(1965) | | Trustee since 2008 President since 2008 and Chief Executive Officer since 2015 of Loomis Sayles Funds II and Executive Vice President of Loomis Sayles Funds I since 2008 | | President and Chief Executive Officer, NGAM Distribution Corporation, NGAM Advisors, L.P. and NGAM Distribution, L.P. | | 42 None | | Experience on the Board; continuing experience as President and Chief Executive Officer of NGAM Advisors, L.P. |
| | | | |
John T. Hailer5 (1960) | | Trustee since 2000 | | President and Chief Executive Officer – U.S. and Asia, Natixis Global Asset Management, L.P. | | 42 None | | Significant experience on the Board; continuing experience as President and Chief Executive Officer – U.S. and Asia, Natixis Global Asset Management, L.P. |
| 1 | Each trustee serves until retirement, resignation or removal from the Board. The current retirement age is 75. The position of Chairperson of the Board is appointed for a three-year term. Ms. Moose was appointed to serve an additional three-year term as the Chairperson of the Board on December 13, 2013. |
| 2 | The trustees of the Trusts serve as trustees of a fund complex that includes all series of the Natixis Funds Trust I, Natixis Funds Trust II, Natixis Funds Trust IV and Gateway Trust (collectively, the “Natixis Funds Trusts”), Loomis Sayles Funds I and Loomis Sayles Funds II (collectively, the “Loomis Sayles Funds Trusts”)(collectively, the “Fund Complex”). |
| 3 | Mr. Charleston is deemed an “interested person” of the Trusts because he holds the following positions with an affiliated person of the Trusts: President and Chief Executive Officer of Loomis, Sayles & Company, L.P. |
| 4 | Mr. Giunta is deemed an “interested person” of the Trusts because he holds the following positions with an affiliated person of the Trusts: President, Chief Executive Officer and Director of NGAM Distribution Corporation, NGAM Advisors, L.P. and NGAM Distribution, L.P. |
| 5 | Mr. Hailer is deemed an “interested person” of the Trusts because he holds the following positions with an affiliated person of the Trusts: President and Chief Executive Officer – U.S. and Asia, Natixis Global Asset Management, L.P. |
| 72
Trustee and Officer Information – continued
| | | | | | |
| Name and Year of Birth | | Position(s) Held with
the Trust(s) | | Term of Office1 and
Length of Time Served | | Principal Occupation(s)
During Past 5 Years2 |
|
| OFFICERS OF THE TRUST |
| | | |
Coleen Downs Dinneen (1960) | | Secretary, Clerk and Chief Legal Officer | | Since September 2004 | | Executive Vice President, General Counsel, Secretary and Clerk, NGAM Distribution Corporation, NGAM Advisors, L.P. and NGAM Distribution, L.P. |
| | | |
Daniel J. Fuss (1933) One Financial Center Boston, MA 02111 | | Executive Vice President of Loomis Sayles Funds I and Loomis Sayles Funds II | | Since June 2003 | | Vice Chairman and Director, Loomis, Sayles & Company, L.P. |
| | | |
Russell L. Kane (1969) | | Chief Compliance Officer, Assistant Secretary and Anti-Money Laundering Officer | | Chief Compliance Officer since May 2006; Assistant Secretary since June 2004; and Anti-Money Laundering Officer since April 2007 | | Chief Compliance Officer for Mutual Funds, Senior Vice President, Deputy General Counsel, Assistant Secretary and Assistant Clerk, NGAM Distribution Corporation, NGAM Advisors, L.P. and NGAM Distribution, L.P. |
| | | |
Michael C. Kardok (1959) | | Treasurer, Principal Financial and Accounting Officer | | Since October 2004 | | Senior Vice President, NGAM Advisors, L.P. and NGAM Distribution, L.P. |
| 1 | Each officer of the Trusts serves for an indefinite term in accordance with the Trusts’ current by-laws until the date his or her successor is elected and qualified, or until he or she sooner dies, retires, is removed or becomes disqualified. |
| 2 | Each person listed above, except as noted, holds the same position(s) with the Fund Complex. Mr. Fuss is not an officer of the Natixis Funds Trusts. Previous positions during the past five years with NGAM Distribution, L.P., NGAM Advisors, L.P. or Loomis, Sayles & Company, L.P. are omitted, if not materially different from a trustee’s or officer’s current position with such entity. |
73 |
ANNUAL REPORT
September 30, 2015

Loomis Sayles Core Plus Bond Fund
Loomis Sayles High Income Fund
Loomis Sayles Limited Term Government
and Agency Fund

TABLE OF CONTENTS
Portfolio Review page 1
Portfolio of Investments page 20
Financial Statements page 63
Notes to Financial Statements page 81
LOOMIS SAYLES CORE PLUS BOND FUND
| | | | |
| Managers | | Symbols | | |
| Peter W. Palfrey, CFA® | | Class A | | NEFRX |
| Richard G. Raczkowski | | Class B | | NERBX |
| Loomis, Sayles & Company, L.P. | | Class C | | NECRX |
| | Class N | | NERNX |
| | Class Y | | NERYX |
Objective
The Fund seeks high total investment return through a combination of current income and capital appreciation
Market Conditions
Falling commodity prices and a strengthening U.S. dollar characterized the reporting period. Commodity prices declined significantly, with oil falling approximately 50 percent. The U.S. dollar generally advanced versus most currencies due to global divergence of economic growth and central bank policy. Most emerging market currencies declined versus their developed market counterparts, and commodity exporters were the hardest hit.
In the second half of the period, the world’s two largest economies — the U.S. and China — dominated the landscape. Investors generally expected the Federal Reserve (the Fed) to tighten monetary policy in September, but the Fed kept short-term rates unchanged due to global economic and market turbulence triggered by China’s economic slowdown. The market interpreted the Fed’s decision as confirmation of global growth risks, which further strained commodities, emerging markets and other risk assets.
Developed market government bonds posted positive local currency returns, benefiting from investor risk aversion caused by sluggish global demand and commodity price weakness. Investment grade corporates underperformed government bonds. However, slower growth in China, commodity price pressures and uncertainty about the Fed rate increase weighed more heavily on high yield and emerging market bonds.
Performance Results
For the 12 months ended September 30, 2015, Class A shares of the Loomis Sayles Core Plus Bond Fund returned -3.13% at net asset value. The Fund underperformed its benchmark, the Barclays U.S. Aggregate Bond Index, which returned 2.94%.
Explanation of Fund Performance
The Fund’s holdings denominated in the Brazilian real, Mexican peso and Philippine peso hurt relative performance as the U.S. dollar strengthened during the period. In addition, an out-of-benchmark allocation to high yield holdings, particularly industrials, detracted from performance. Energy-related names were the largest laggards due to the prolonged decline in oil prices. Investment grade corporates also underperformed relative to the benchmark, primarily due to security selection and an overweight allocation to the industrials sector. In
1 |
addition, selected Yankee bonds (U.S. dollar-denominated bonds issued by non-U.S. entities) detracted from results and limited the overall performance of the Fund’s government-related allocation. Meanwhile, security selection among U.S. Treasuries, along with an underweight allocation to the sector, detracted from relative performance.
The Fund’s longer duration (greater price sensitivity to interest rate changes) posture contributed to performance as the yield curve (a curve that shows the relationship among bond yields across the maturity spectrum) flattened with longer-term rates moving lower. Security selection among electric utilities also aided relative performance.
Outlook
We expect the Fed will begin tightening in the fourth quarter of 2015 with one rate hike followed by a 25 basis point increase at every other policy meeting, perhaps until a terminal federal funds rate of 2.50% is reached.
We have sought to position the Fund for continued expansion of the U.S. and global economies, emphasizing securities we believe will benefit from improved global growth. Specifically, the Fund has underweight positions in currently overpriced government bonds and overweight positions in spread (non-nominal Treasury) sectors, including high yield, emerging markets, Yankee corporates, foreign currency (Mexico and Philippines), energy-related bonds and Treasury inflation-protected securities (TIPS).
Within the investment grade credit allocation, the Fund has an underweight position in U.S. securities and an overweight position in Yankee bonds. We believe the U.S. investment grade sector still looks attractive but is approaching the late-expansion cycle, making it vulnerable to releveraging events, including mergers and acquisitions, stock buybacks and increased stock dividends. The Fund is near its maximum allocation to high yield, with a bias toward higher-rated securities in the 5- to 10-year maturity range. We believe investment grade structured products, including asset-backed securities (ABS) and commercial mortgage-backed securities (CMBS), remain sources of high quality, shorter-maturity yield and liquidity.
The Fund has significant direct exposure to the energy sector through investment grade and high yield bonds and indirect exposure through energy-influenced currency and sovereign exposure. The Fund’s non-U.S. dollar allocation is slightly less than 3% in pro-cyclical currencies and offers significant carry and yield advantages. This should mitigate the effects of additional modest U.S. dollar appreciation as markets anticipate the start of Fed tightening. Additionally, the Fund has an underweight position to mortgages, which have provided high quality yield but look relatively expensive and may be vulnerable to a significant duration extension or shortening, should rates rise or fall much beyond recent ranges.
| 2
LOOMIS SAYLES CORE PLUS BOND FUND
Growth of $10,000 Investment in Class A Shares3
September 30, 2005 through September 30, 2015
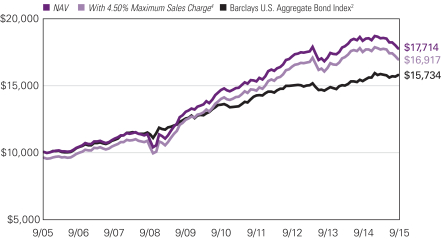
3 |
Average Annual Total Returns — September 30, 20153
| | | | | | | | | | | | | | | | |
| | | | | |
| | | 1 Year | | | 5 Years | | | 10 Years | | | Life of Class N | |
| | | | | |
| Class A (Inception 11/7/73) | | | | | | | | | | | | | | | | |
| NAV | | | -3.13 | % | | | 3.91 | % | | | 5.89 | % | | | — | % |
| With 4.50% Maximum Sales Charge4 | | | -7.48 | | | | 2.96 | | | | 5.40 | | | | — | |
| | | | | |
| Class B (Inception 9/13/93) | | | | | | | | | | | | | | | | |
| NAV | | | -3.82 | | | | 3.14 | | | | 5.10 | | | | — | |
| With CDSC1 | | | -8.50 | | | | 2.79 | | | | 5.10 | | | | — | |
| | | | | |
| Class C (Inception 12/30/94) | | | | | | | | | | | | | | | | |
| NAV | | | -3.86 | | | | 3.12 | | | | 5.09 | | | | — | |
| With CDSC1 | | | -4.80 | | | | 3.12 | | | | 5.09 | | | | | |
| | | | | |
| Class N (Inception 2/1/13) | | | | | | | | | | | | | | | | |
| NAV | | | -2.82 | | | | — | | | | — | | | | 0.99 | |
| | | | | |
| Class Y (Inception 12/30/94) | | | | | | | | | | | | | | | | |
| NAV | | | -2.89 | | | | 4.17 | | | | 6.16 | | | | — | |
| | | | | |
| Comparative Performance | | | | | | | | | | | | | | | | |
| Barclays U.S. Aggregate Bond Index2 | | | 2.94 | | | | 3.10 | | | | 4.64 | | | | 2.15 | |
Past performance does not guarantee future results. The table(s) do not reflect taxes shareholders might owe on any Fund distributions or when they redeem their shares. Performance for periods less than one year is cumulative, not annualized. Returns reflect changes in share price and reinvestment of dividends and capital gains, if any. Unlike a fund, an index is not managed and does not reflect fees and expenses. It is not possible to invest directly in an index.
| 1 | Performance for Class B shares assumes a maximum 5% contingent deferred sales charge (“CDSC”) applied when you sell shares, which declines annually between years 1-6 according to the following schedule: 5, 4, 3, 3, 2, 1, 0%. Class C shares performance assumes a 1% CDSC applied when you sell shares within one year of purchase. |
| 2 | Barclays U.S. Aggregate Bond Index is an unmanaged index that covers the U.S.-dollar denominated, investment-grade, fixed-rate, taxable bond market of SEC-registered securities. The index includes bonds from the Treasury, government-related, corporate, mortgage-backed securities, asset-backed securities, and collateralized mortgage-backed securities sectors. |
| 3 | Fund performance has been increased by fee waivers and/or expense reimbursements, if any, without which performance would have been lower. |
| 4 | Effective November 2, 2015, the maximum sales charge was reduced to 4.25%. See Note 12 of Notes to Financial Statements. |
| 4
LOOMIS SAYLES HIGH INCOME FUND
| | | | |
| Managers | | Symbols | | |
| Matthew J. Eagan, CFA® | | Class A | | NEFHX |
| Elaine M. Stokes | | Class B | | NEHBX |
| Loomis, Sayles & Company, L.P. | | Class C | | NEHCX |
| | Class Y | | NEHYX |
Objective
The Fund seeks high current income plus the opportunity for capital appreciation to produce a high total return
Market Conditions
Falling commodity prices and a strengthening U.S. dollar characterized the reporting period. Commodity prices declined significantly, with oil falling approximately 50 percent. The U.S. dollar generally advanced versus most currencies due to global divergence of economic growth and central bank policy. Most emerging market currencies declined versus their developed market counterparts, and commodity exporters were the hardest hit.
In the second half of the period, the world’s two largest economies — the U.S. and China — dominated the landscape. Investors generally expected the Federal Reserve (the Fed) to tighten monetary policy in September, but the Fed kept short-term rates unchanged due to global economic and market turbulence triggered by China’s economic slowdown. The market interpreted the Fed’s decision as confirmation of global growth risks, which further strained commodities, emerging markets and other risk assets.
Developed market government bonds posted positive local currency returns, benefiting from investor risk aversion caused by sluggish global demand and commodity price weakness. Investment grade corporates underperformed government bonds. However, slower growth in China, commodity price pressures and uncertainty about the Fed rate increase weighed more heavily on high yield and commodity-linked bonds.
Performance Results
For the 12 months ended September 30, 2015, Class A shares of the Loomis Sayles High Income Fund returned -4.78%. The Fund underperformed its benchmark, the Barclays U.S. Corporate High Yield Bond Index, which returned -3.43%.
Explanation of Fund Performance
The Fund’s relative underperformance was primarily due to out-of-benchmark allocations. Holdings in non-U.S.-dollar-denominated securities suffered throughout the period due to a strong U.S. dollar, which pressured emerging market currencies. Exposure to the Brazilian real dragged on results and was the largest detractor. A small position in emerging market bonds detracted from performance due to uncertain growth prospects for many emerging market countries. Out-of-benchmark exposure to investment grade corporates also detracted from performance, with industrials the notable laggard. Furthermore, exposure to
5 |
equities and convertibles weighed negatively on results due to equity market volatility. High yield financials and utilities also weighed down return.
Although high yield securities generated mixed results for the period, they generally performed well in the industrial sector. In particular, basic industry and technology securities were the largest contributors to performance. In addition, the Fund’s securitized holdings contributed to results. Residential mortgage-backed securities (RMBS), asset-backed securities (ABS) and commercial mortgage-backed securities (CMBS) produced positive returns. Meanwhile, a small, out-of-benchmark position in U.S. Treasuries, which we held as reserves, contributed to relative performance.
Outlook
We continue to have a positive outlook for the U.S. economy, despite some recent softer data. Steady improvement in employment and consumer sentiment should support consumption trends. We do not believe current low rates reflect the state of the U.S. economy. However, uncertainty about Chinese growth and weakening global economic trends may delay U.S. monetary policy changes. We believe the path for rates, which is likely to be very slow and shallow, is more important than timing. The downside risks to global growth have increased in our view; however, we believe conditions will remain reasonably strong overall.
The steady pace of U.S. economic growth should support risk assets, and we are maintaining exposure to corporate bonds. We view the investment grade and high yield markets as being distorted by global, not U.S., factors, and spread widening over the past 12 months has significantly improved valuations.
Risk profiles in non-U.S. markets should continue to be driven by oil prices, a strengthening U.S. dollar and central bank action. We are monitoring cheaper non-U.S.-dollar asset valuations, but we remain cautious. Since we do not see a positive catalyst at this point, we think it is too early to add exposure.
Our long-term themes remain intact, and we believe we are well positioned for this market environment. We have been investing away from the benchmark in sectors with low or negative correlations to U.S. rates. We are using portfolio flexibility to identify attractive income opportunities, broaden diversification and maintain a higher level of reserves. Our antidote for highly volatile markets is a patient, selective approach that seeks to capture value when investors are mispricing risk.
| 6
LOOMIS SAYLES HIGH INCOME FUND
Growth of $10,000 Investment in Class A Shares4
September 30, 2005 through September 30, 2015
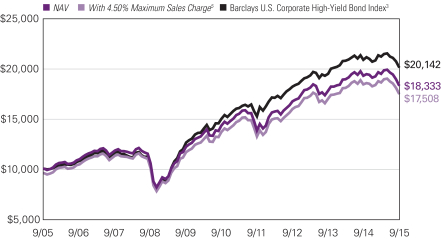
7 |
Average Annual Total Returns — September 30, 20154
| | | | | | | | | | | | |
| | | | |
| | | 1 Year | | | 5 Years | | | 10 Years | |
| | | | |
| Class A (Inception 2/22/84) | | | | | | | | | | | | |
| NAV | | | -4.78 | % | | | 5.10 | % | | | 6.25 | % |
| With 4.50% Maximum Sales Charge5 | | | -9.04 | | | | 4.15 | | | | 5.77 | |
| | | | |
| Class B (Inception 9/20/93) | | | | | | | | | | | | |
| NAV | | | -6.05 | | | | 4.20 | | | | 5.40 | |
| With CDSC2 | | | -10.48 | | | | 3.92 | | | | 5.40 | |
| | | | |
| Class C (Inception 3/2/98) | | | | | | | | | | | | |
| NAV | | | -5.48 | | | | 4.31 | | | | 5.46 | |
| With CDSC2 | | | -6.37 | | | | 4.31 | | | | 5.46 | |
| | | | |
| Class Y (Inception 2/29/08)1 | | | | | | | | | | | | |
| NAV | | | -4.54 | | | | 5.37 | | | | 6.43 | |
| | | | |
| Comparative Performance | | | | | | | | | | | | |
| Barclays U.S. Corporate High-Yield Bond Index3 | | | -3.43 | | | | 6.15 | | | | 7.25 | |
Past performance does not guarantee future results. The table(s) do not reflect taxes shareholders might owe on any Fund distributions or when they redeem their shares. Performance for periods less than one year is cumulative, not annualized. Returns reflect changes in share price and reinvestment of dividends and capital gains, if any. Unlike a fund, an index is not managed and does not reflect fees and expenses. It is not possible to invest directly in an index.
| 1 | Prior to the inception of Class Y shares (2/29/08), performance is that of Class A shares, restated to reflect the higher net expenses of that share class. |
| 2 | Performance for Class B shares assumes a maximum 5% contingent deferred sales charge (“CDSC”) applied when you sell shares, which declines annually between years 1-6 according to the following schedule: 5, 4, 3, 3, 2, 1, 0%. Class C shares performance assumes a 1% CDSC applied when you sell shares within one year of purchase. |
| 3 | Barclays U.S. Corporate High-Yield Bond Index is an unmanaged index that covers the U.S. dollar-denominated, non-investment grade, fixed-rate, taxable corporate bond market. |
| 4 | Fund performance has been increased by fee waivers and/or expense reimbursements, if any, without which performance would have been lower. |
| 5 | Effective November 2, 2015, the maximum sales charge was reduced to 4.25%. See Note 12 of Notes to Financial Statements. |
| 8
LOOMIS SAYLES LIMITED TERM GOVERNMENT AND AGENCY FUND
| | | | |
| Managers | | Symbols | | |
| Christopher T. Harms | | Class A | | NEFLX |
| Clifton V. Rowe, CFA® | | Class B | | NELBX |
| Kurt L. Wagner, CFA®, CIC | | Class C | | NECLX |
| Loomis, Sayles & Company, L.P. | | Class Y | | NELYX |
Objective
The Fund seeks a high current return consistent with preservation of capital
Market Conditions
Falling commodity prices and a strengthening U.S. dollar characterized the reporting period. Commodity prices declined significantly, with oil falling approximately 50 percent. The U.S. dollar generally advanced versus most currencies due to global divergence of economic growth and central bank policy. Most emerging market currencies declined versus their developed market counterparts, and commodity exporters were the hardest hit.
In the second half of the period, the world’s two largest economies — the U.S. and China — dominated the landscape. Investors generally expected the Federal Reserve (the Fed) to tighten monetary policy in September, but the Fed kept short-term rates unchanged due to global economic and market turbulence triggered by China’s economic slowdown. The market interpreted the Fed’s decision as confirmation of global growth risks, which further strained commodities, emerging markets and other risk assets.
Developed market government bonds posted positive local currency returns, benefiting from investor risk aversion caused by sluggish global demand and commodity price weakness. Investment grade corporates underperformed government bonds. However, slower growth in China, commodity price pressures and uncertainty about the Fed rate increase weighed more heavily on high yield and emerging market bonds.
Performance Results
For the 12 months ended September 30, 2015, Class A shares of the Loomis Sayles Limited Term Government and Agency Fund returned 1.26% at net asset value. The Fund underperformed its benchmark, the Barclays U.S. 1-5 Year Government Bond Index, which returned 2.05%.
Explanation of Fund Performance
The Fund’s relative underperformance was driven primarily by shorter-than-benchmark duration (price sensitivity to interest rate changes) and yield curve (a curve that shows the relationship among bond yields across the maturity spectrum) positioning. In addition, a small underweight position in U.S. agency securities detracted from relative performance despite generating a positive absolute return.
9 |
The Fund’s sizeable allocation to agency mortgage-backed securities (MBS) was a main driver of positive results. Agency MBS outperformed the benchmark on a duration-adjusted basis, which considers a security’s return relative to similar-duration U.S. Treasuries. The Fund’s agency collateralized-mortgage obligations (CMOs) were also among the leading contributors, considerably outperforming duration-matched Treasuries. Additionally, agency commercial mortgage-backed securities (CMBS) aided the Fund’s relative and absolute performance.
Outlook
Spreads (the difference in yield compared with similar-maturity Treasuries) for agency MBS are narrow on a historical basis, and refinancing risk has recently begun to increase as recently issued mortgages are of relatively high quality compared with earlier years. Therefore, we tend to underweight recently issued 30-year MBS and prefer sectors that are less likely to face refinance risk, such as low loan balance mortgages and home equity conversion mortgages. Within the commercial real estate sector, top-tier assets and markets have generally recovered and are currently at or above prior peak levels. We believe investment grade CMBS remain attractive. We also believe senior AAA-rated ABS currently offer an attractive combination of strong credit quality and enhanced yield. We favor buying bonds of less-frequent issuers, as our analysis indicates the credit risk of these securities is inefficiently priced, offering opportunities for additional yield.
Growth of $10,000 Investment in Class A Shares3
September 30, 2005 through September 30, 2015
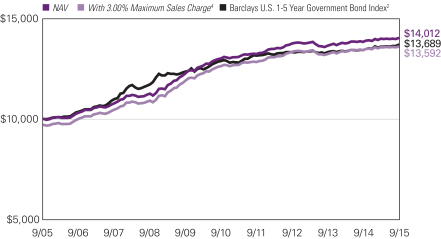
See notes to chart on page 11.
| 10
LOOMIS SAYLES LIMITED TERM GOVERNMENT AND AGENCY FUND
Average Annual Total Returns — September 30, 20153
| | | | | | | | | | | | |
| | | | |
| | | 1 Year | | | 5 Years | | | 10 Years | |
| | | | |
| Class A (Inception 1/3/89) | | | | | | | | | | | | |
| NAV | | | 1.26 | % | | | 1.50 | % | | | 3.42 | % |
| With 3.00% Maximum Sales Charge4 | | | -1.79 | | | | 0.88 | | | | 3.11 | |
| | | | |
| Class B (Inception 9/27/93) | | | | | | | | | | | | |
| NAV | | | 0.50 | | | | 0.76 | | | | 2.65 | |
| With CDSC1 | | | -4.48 | | | | 0.38 | | | | 2.65 | |
| | | | |
| Class C (Inception 12/30/94) | | | | | | | | | | | | |
| NAV | | | 0.51 | | | | 0.74 | | | | 2.66 | |
| With CDSC1 | | | -0.49 | | | | 0.74 | | | | 2.66 | |
| | | | |
| Class Y (Inception 3/31/94) | | | | | | | | | | | | |
| NAV | | | 1.51 | | | | 1.77 | | | | 3.69 | |
| | | | |
| Comparative Performance | | | | | | | | | | | | |
| Barclays U.S. 1-5 Year Government Bond Index2 | | | 2.05 | | | | 1.24 | | | | 3.19 | |
Past performance does not guarantee future results. The table(s) do not reflect taxes shareholders might owe on any Fund distributions or when they redeem their shares. Performance for periods less than one year is cumulative, not annualized. Returns reflect changes in share price and reinvestment of dividends and capital gains, if any. Unlike a fund, an index is not managed and does not reflect fees and expenses. It is not possible to invest directly in an index.
| 1 | Performance for Class B shares assumes a maximum 5% contingent deferred sales charge (“CDSC”) applied when you sell shares, which declines annually between years 1-6 according to the following schedule: 5, 4, 3, 3, 2, 1, 0%. Class C shares performance assumes a 1% CDSC applied when you sell shares within one year of purchase. |
| 2 | Barclays U.S. 1-5 Year Government Bond Index is an unmanaged index that includes U.S. Treasury and agency securities with remaining maturities of one to five years. |
| 3 | Fund performance has been increased by fee waivers and/or expense reimbursements, if any, without which performance would have been lower. |
| 4 | Effective November 2, 2015, the maximum sales charge was reduced to 2.25%. See Note 12 of Notes to Financial Statements. |
11 |
ADDITIONAL INFORMATION
The views expressed in this report reflect those of the portfolio managers as of the dates indicated. The managers’ views are subject to change at any time without notice based on changes in market or other conditions. References to specific securities or industries should not be regarded as investment advice. Because the Funds are actively managed, there is no assurance that they will continue to invest in the securities or industries mentioned.
ADDITIONAL INDEX INFORMATION
This document may contain references to third party copyrights, indexes, and trademarks, each of which is the property of its respective owner. Such owner is not affiliated with Natixis Global Asset Management or any of its related or affiliated companies (collectively “NGAM”) and does not sponsor, endorse or participate in the provision of any NGAM services, funds or other financial products.
The index information contained herein is derived from third parties and is provided on an “as is” basis. The user of this information assumes the entire risk of use of this information. Each of the third party entities involved in compiling, computing or creating index information disclaims all warranties (including, without limitation, any warranties of originality, accuracy, completeness, timeliness, non-infringement, merchantability and fitness for a particular purpose) with respect to such information.
PROXY VOTING INFORMATION
A description of the funds’ proxy voting policies and procedures is available without charge, upon request, by calling Natixis Funds at 800-225-5478; on the funds’ website at ngam.natixis.com; and on the Securities and Exchange Commission’s (“SEC’s”) website at www.sec.gov. Information regarding how the funds voted proxies relating to portfolio securities during the 12-months ended June 30, 2015 is available from the funds’ website and the SEC’s website.
QUARTERLY PORTFOLIO SCHEDULES
The funds files a complete schedule of portfolio holdings with the SEC for the first and third quarters of each fiscal year on Form N-Q. The funds’ Forms N-Q are available on the SEC’s website at www.sec.gov and may be reviewed and copied at the SEC’s Public Reference Room in Washington, DC. Information on the operation of the Public Reference Room may be obtained by calling 800-SEC-0330.
| 12
UNDERSTANDING FUND EXPENSES
As a mutual fund shareholder, you incur different costs: transaction costs, including sales charges (loads) on purchases and contingent deferred sales charges on redemptions, and ongoing costs, including management fees, distribution and/or service fees (12b-1 fees), and other fund expenses. Certain exemptions may apply. Certain exemptions may apply. These costs are described in more detail in the Funds’ prospectuses. The following examples are intended to help you understand the ongoing costs of investing in the Funds and help you compare these with the ongoing costs of investing in other mutual funds.
The first line in the table of each class of Fund shares shows the actual account values and actual fund expenses you would have paid on a $1,000 investment in the Fund from April 1, 2015 through September 30, 2015. To estimate the expenses you paid over the period, simply divide your account value by $1,000 (for example $8,600 account value divided by $1,000 = 8.60) and multiply the result by the number in the Expenses Paid During Period column as shown below for your class.
The second line in the table of each class of fund shares provides information about hypothetical account values and hypothetical expenses based on the Fund’s actual expense ratios and an assumed rate of return of 5% per year before expenses, which is not the Fund’s actual return. The hypothetical account values and expenses may not be used to estimate the actual ending account balance or expenses you paid on your investment for the period. You may use this information to compare the ongoing costs of investing in the Fund to other funds. To do so, compare this 5% hypothetical example with the 5% hypothetical examples that appear in the shareholder reports of the other funds.
Please note that the expenses shown reflect ongoing costs only, and do not include any transaction costs such as sales charges. Therefore, the second line in the table of each fund is useful in comparing ongoing costs only, and will not help you determine the relative costs of owning different funds. If transaction costs were included, total costs would be higher.
13 |
| | | | | | | | | | | | |
| LOOMIS SAYLES CORE PLUS BOND FUND | | BEGINNING
ACCOUNT VALUE
4/1/2015 | | | ENDING
ACCOUNT VALUE
9/30/2015 | | | EXPENSES PAID
DURING PERIOD*
4/1/2015 – 9/30/2015 | |
| Class A | | | | | | | | | | | | |
| Actual | | | $1,000.00 | | | | $958.80 | | | | $3.63 | |
| Hypothetical (5% return before expenses) | | | $1,000.00 | | | | $1,021.36 | | | | $3.75 | |
| Class B | | | | | | | | | | | | |
| Actual | | | $1,000.00 | | | | $955.20 | | | | $7.30 | |
| Hypothetical (5% return before expenses) | | | $1,000.00 | | | | $1,017.60 | | | | $7.54 | |
| Class C | | | | | | | | | | | | |
| Actual | | | $1,000.00 | | | | $955.00 | | | | $7.30 | |
| Hypothetical (5% return before expenses) | | | $1,000.00 | | | | $1,017.60 | | | | $7.54 | |
| Class N | | | | | | | | | | | | |
| Actual | | | $1,000.00 | | | | $960.50 | | | | $1.97 | |
| Hypothetical (5% return before expenses) | | | $1,000.00 | | | | $1,023.06 | | | | $2.03 | |
| Class Y | | | | | | | | | | | | |
| Actual | | | $1,000.00 | | | | $960.10 | | | | $2.41 | |
| Hypothetical (5% return before expenses) | | | $1,000.00 | | | | $1,022.61 | | | | $2.48 | |
| * | Expenses are equal to the Fund’s annualized expense ratio: 0.74%, 1.49%, 1.49%, 0.40% and 0.49% for Class A, B, C, N and Y, respectively, multiplied by the average account value over the period, multiplied by the number of days in the most recent fiscal half-year (183), divided by 365 (to reflect the half-year period). |
| | | | | | | | | | | | |
| LOOMIS SAYLES HIGH INCOME FUND | | BEGINNING ACCOUNT VALUE
4/1/2015 | | | ENDING
ACCOUNT VALUE
9/30/2015 | | | EXPENSES PAID
DURING PERIOD*
4/1/2015 – 9/30/2015 | |
| Class A | | | | | | | | | | | | |
| Actual | | | $1,000.00 | | | | $942.60 | | | | $5.41 | |
| Hypothetical (5% return before expenses) | | | $1,000.00 | | | | $1,019.50 | | | | $5.62 | |
| Class B | | | | | | | | | | | | |
| Actual | | | $1,000.00 | | | | $934.00 | | | | $8.97 | |
| Hypothetical (5% return before expenses) | | | $1,000.00 | | | | $1,015.79 | | | | $9.35 | |
| Class C | | | | | | | | | | | | |
| Actual | | | $1,000.00 | | | | $939.20 | | | | $9.04 | |
| Hypothetical (5% return before expenses) | | | $1,000.00 | | | | $1,015.74 | | | | $9.40 | |
| Class Y | | | | | | | | | | | | |
| Actual | | | $1,000.00 | | | | $943.70 | | | | $4.19 | |
| Hypothetical (5% return before expenses) | | | $1,000.00 | | | | $1,020.76 | | | | $4.36 | |
| * | Expenses are equal to the Fund’s annualized expense ratio (after waiver/reimbursement): 1.11%, 1.85%, 1.86% and 0.86% for Class A, B, C and Y, respectively, multiplied by the average account value over the period, multiplied by the number of days in the most recent fiscal half-year (183), divided by 365 (to reflect the half-year period). |
| 14
| | | | | | | | | | | | |
LOOMIS SAYLES LIMITED TERM
GOVERNMENT AND AGENCY FUND | | BEGINNING
ACCOUNT VALUE
4/1/2015 | | | ENDING
ACCOUNT VALUE
9/30/2015 | | | EXPENSES PAID
DURING PERIOD*
4/1/2015 – 9/30/2015 | |
| Class A | | | | | | | | | | | | |
| Actual | | | $1,000.00 | | | | $1,002.10 | | | | $3.86 | |
| Hypothetical (5% return before expenses) | | | $1,000.00 | | | | $1,021.21 | | | | $3.90 | |
| Class B | | | | | | | | | | | | |
| Actual | | | $1,000.00 | | | | $999.20 | | | | $7.62 | |
| Hypothetical (5% return before expenses) | | | $1,000.00 | | | | $1,017.45 | | | | $7.69 | |
| Class C | | | | | | | | | | | | |
| Actual | | | $1,000.00 | | | | $998.30 | | | | $7.61 | |
| Hypothetical (5% return before expenses) | | | $1,000.00 | | | | $1,017.45 | | | | $7.69 | |
| Class Y | | | | | | | | | | | | |
| Actual | | | $1,000.00 | | | | $1,004.20 | | | | $2.61 | |
| Hypothetical (5% return before expenses) | | | $1,000.00 | | | | $1,022.46 | | | | $2.64 | |
| * | Expenses are equal to the Fund’s annualized expense ratio: 0.77%, 1.52%, 1.52% and 0.52% for Class A, B, C and Y, respectively, multiplied by the average account value over the period, multiplied by the number of days in the most recent fiscal half-year (183), divided by 365 (to reflect the half-year period). |
15 |
BOARD APPROVAL OF THE EXISTING ADVISORY AGREEMENTS
The Board of Trustees of the Trusts (the “Board”), including the Independent Trustees, considers matters bearing on each Fund’s advisory agreement and, with respect to the Loomis Sayles Core Plus Bond Fund, its Advisory Administration Agreement (collectively, the “Agreements”) at most of its meetings throughout the year. Each year, usually in the spring, the Contract Review Committee of the Board meets to review the Agreements to determine whether to recommend that the full Board approve the continuation of the Agreements, typically for an additional one-year period. After the Committee has made its recommendation, the full Board, including the Independent Trustees, determines whether to approve the continuation of the Agreements.
In connection with these meetings, the Trustees receive materials that the Funds’ investment adviser (the “Adviser”) believes to be reasonably necessary for the Trustees to evaluate the Agreements. These materials generally include, among other items, (i) information on the investment performance of the Funds and the performance of peer groups of funds and the Funds’ performance benchmarks, (ii) information on the Funds’ advisory fees and other expenses, including information comparing the Funds’ expenses to the fees charged to institutional accounts with similar strategies managed by the Adviser, if any, and to those of peer groups of funds and information about any applicable expense caps and fee “breakpoints,” (iii) sales and redemption data in respect of the Funds, (iv) information about the profitability of the Agreements to the Adviser and (v) information obtained through the completion by the Adviser of a questionnaire distributed on behalf of the Trustees. The Board, including the Independent Trustees, also considers other matters such as (i) the Adviser’s financial results and financial condition, (ii) each Fund’s investment objective and strategies and the size, education and experience of the Adviser’s investment staff and its use of technology, external research and trading cost measurement tools, (iii) arrangements in respect of the distribution of the Funds’ shares and the related costs, (iv) the procedures employed to determine the value of the Funds’ assets, (v) the allocation of the Funds’ brokerage, if any, including, if applicable, allocations to brokers affiliated with the Adviser and the use of “soft” commission dollars to pay Fund expenses and to pay for research and other similar services, (vi) the resources devoted to, and the record of compliance with, the Funds’ investment policies and restrictions, policies on personal securities transactions and other compliance policies, (vii) information about amounts invested by the Funds’ portfolio managers in the Funds or in similar accounts that they manage and (viii) the general economic outlook with particular emphasis on the mutual fund industry. Throughout the process, the Trustees are afforded the opportunity to ask questions of and request additional materials from the Adviser.
In addition to the materials requested by the Trustees in connection with their annual consideration of the continuation of the Agreements, the Trustees receive materials in advance of each regular quarterly meeting of the Board that provide detailed information about the Funds’ investment performance and the fees charged to the Funds for advisory and other services. This information generally includes, among other things, an internal performance rating for each Fund based on agreed-upon criteria, graphs showing each Fund’s performance and fee differentials against each Fund’s peer group/category,
| 16
performance ratings provided by a third-party, total return information for various periods, and third-party performance rankings for various periods comparing a Fund against similarly categorized funds. The portfolio management team for each Fund or other representatives of the Adviser make periodic presentations to the Contract Review Committee and/or the full Board, and Funds identified as presenting possible performance concerns may be subject to more frequent board presentations and reviews. In addition, each quarter the Trustees are provided with detailed statistical information about each Fund’s portfolio. The Trustees also receive periodic updates between meetings.
The Board most recently approved the continuation of the Agreements at its meeting held in June 2015. The Agreements were continued for a one-year period for the Funds. In considering whether to approve the continuation of the Agreements, the Board, including the Independent Trustees, did not identify any single factor as determinative. Individual Trustees may have evaluated the information presented differently from one another, giving different weights to various factors. Matters considered by the Trustees, including the Independent Trustees, in connection with their approval of the Agreements included, but were not limited to, the factors listed below.
The nature, extent and quality of the services provided to the Funds under the Agreements. The Trustees considered the nature, extent and quality of the services provided by the Adviser and its affiliates to the Funds and the resources dedicated to the Funds by the Adviser and its affiliates.
The Trustees considered not only the advisory services provided by the Adviser to the Funds, but also the monitoring and oversight services provided by NGAM Advisors, L.P. (“NGAM Advisors”). They also considered the administrative services provided by NGAM Advisors and its affiliates to the Funds.
For each Fund, the Trustees also considered the benefits to shareholders of investing in a mutual fund that is part of a family of funds that offers shareholders the right to exchange shares of one type of fund for shares of another type of fund, and provides a variety of fund and shareholder services.
After reviewing these and related factors, the Trustees concluded, within the context of their overall conclusions regarding each of the Agreements, that the nature, extent and quality of services provided supported the renewal of the Agreements.
Investment performance of the Funds and the Adviser. As noted above, the Trustees received information about the performance of the Funds over various time periods, including information that compared the performance of the Funds to the performance of peer groups and categories of funds and the Funds’ respective performance benchmarks. In addition, the Trustees also reviewed data prepared by an independent third party that analyzed the performance of the Funds using a variety of performance metrics, including metrics that also measured the performance of the Funds on a risk adjusted basis. With respect to each Fund, the Board concluded that the Fund’s performance or other relevant factors supported the renewal of the Agreement relating to that Fund.
The Trustees also considered the Adviser’s performance and reputation generally, the performance of the fund family generally, and the historical responsiveness of the Adviser to Trustee concerns about performance and the willingness of the Adviser to take steps intended to improve performance.
17 |
After reviewing these and related factors, the Trustees concluded, within the context of their overall conclusions regarding each of the Agreements, that the performance of the Funds and the Adviser and/or other relevant factors supported the renewal of the Agreements.
The costs of the services to be provided and profits to be realized by the Adviser and its affiliates from their respective relationships with the Funds. The Trustees considered the fees charged to the Funds for advisory services as well as the total expense levels of the Funds. This information included comparisons (provided both by management and also by an independent third party) of the Funds’ advisory fees and total expense levels to those of their peer groups and information about the advisory fees charged by the Adviser to comparable accounts (such as institutional separate accounts), as well as information about differences in such fees and the reasons for any such differences. In considering the fees charged to comparable accounts, the Trustees considered, among other things, management’s representations about the differences between managing mutual funds as compared to other types of accounts, including the additional resources required to effectively manage mutual fund assets and the greater regulatory costs associated with the management of such assets. In evaluating each fund’s advisory fee, the Trustees also took into account the demands, complexity and quality of the investment management of such Fund, as well as the need for the Adviser to offer competitive compensation and to expend additional resources as the Funds grow in size. The Trustees considered that over the past several years, management had made recommendations regarding reductions in advisory fee rates, implementation of advisory fee breakpoints and the institution of advisory fee waivers and expense caps for various funds in the fund family. They noted that the Funds in this report have expense caps in place, although the current expenses of each Fund are below the cap. The Trustees further noted that management had proposed to reduce the expense cap of the Loomis Sayles High Income Fund.
The Trustees also considered the compensation directly or indirectly received or to be received by the Adviser and its affiliates from their relationships with the Funds. The Trustees reviewed information provided by management as to the profitability of the Adviser’s and its affiliates’ relationships with the Funds, and information about the allocation of expenses used to calculate profitability. They also reviewed information provided by management about the effect of distribution costs and changes in asset levels on Adviser profitability, including information regarding resources spent on distribution activities. When reviewing profitability, the Trustees also considered information about court cases in which adviser compensation or profitability were issues and the performance of the relevant Funds, the expense levels of the Funds, whether the Adviser had implemented breakpoints and/or expense caps with respect to such Funds.
After reviewing these and related factors, the Trustees concluded, within the context of their overall conclusions regarding each of the Agreements, that the advisory fee charged to each of the Funds was fair and reasonable, and that the costs of these services generally and the related profitability of the Adviser and its affiliates in respect of their relationships with the Funds supported the renewal of the Agreements.
Economies of Scale. The Trustees considered the existence of any economies of scale in the provision of services by the Adviser and whether those economies are shared with the Funds through breakpoints in their investment advisory fees or other means, such as expense
| 18
waivers or caps. The Trustees also discussed with management the factors considered with respect to the implementation of breakpoints in investment advisory fees or expense waivers or caps for certain funds. Management explained that a number of factors are taken into account in considering the possible implementation of breakpoints or an expense cap for a fund, including, among other things, factors such as a fund’s assets, the projected growth of a fund, projected profitability and a fund’s fees and performance. With respect to economies of scale, the Trustees noted that each of the Funds was subject to an expense cap or waiver. The Trustees further noted that management had proposed to reduce the expense cap of the Loomis Sayles High Income Fund. In considering these issues, the Trustees also took note of the costs of the services provided (both on an absolute and a relative basis) and the profitability to the Adviser and its affiliates of their relationships with the Funds, as discussed above.
After reviewing these and related factors, the Trustees concluded, within the context of their overall conclusions regarding each of the Agreements, that the extent to which economies of scale were shared with the Funds supported the renewal of the Agreements.
The Trustees also considered other factors, which included but were not limited to the following:
| · | | The effect of recent market and economic events on the performance, asset levels and expense ratios of each Fund. |
| · | | Whether each Fund has operated in accordance with its investment objective and the Fund’s record of compliance with its investment restrictions, and the compliance programs of the Funds and the Adviser. They also considered the compliance-related resources the Adviser and its affiliates were providing to the Funds. |
| · | | Plans for maintaining continuity of portfolio management where that was thought to be a potential issue. |
| · | | The nature, quality, cost and extent of administrative and shareholder services performed by the Adviser and its affiliates, both under the Agreements and under separate agreements covering administrative services. |
| · | | So-called “fallout benefits” to the Adviser, such as the engagement of affiliates of the Adviser to provide distribution, administrative and brokerage services to the Funds, and the benefits of research made available to the Adviser by reason of brokerage commissions (if any) generated by the Funds’ securities transactions. The Trustees also considered the benefits to the parent company of NGAM Advisors from the retention of the Adviser. The Trustees considered the possible conflicts of interest associated with these fallout and other benefits, and the reporting, disclosure and other processes in place to disclose and monitor such possible conflicts of interest. |
| · | | The Trustees’ review and discussion of the Funds’ advisory arrangements in prior years, and management’s record of responding to Trustee concerns raised during the year and in prior years. |
Based on their evaluation of all factors that they deemed to be material, including those factors described above, and assisted by the advice of independent counsel, the Trustees, including the Independent Trustees, concluded that each of the existing Agreements should be continued through June 30, 2016.
19 |
Portfolio of Investments – as of September 30, 2015
Loomis Sayles Core Plus Bond Fund
| | | | | | | | |
Principal Amount (‡) | | | Description | | Value (†) | |
| | | | | | | | |
| | Bonds and Notes — 97.2% of Net Assets | | | | |
| | | | ABS Car Loan — 3.2% | | | | |
| $ | 8,905,000 | | | Ally Master Owner Trust, Series 2014-4, Class A2, 1.430%, 6/17/2019 | | $ | 8,920,735 | |
| | 2,610,915 | | | AmeriCredit Automobile Receivables, Series 2012-5, Class B, 1.120%, 11/08/2017 | | | 2,611,500 | |
| | 2,355,000 | | | AmeriCredit Automobile Receivables Trust, Series 2013-2, Class B, 1.190%, 5/08/2018 | | | 2,356,693 | |
| | 1,860,000 | | | AmeriCredit Automobile Receivables Trust, Series 2013-2, Class C, 1.790%, 3/08/2019 | | | 1,868,335 | |
| | 3,170,000 | | | AmeriCredit Automobile Receivables Trust, Series 2014-2, Class C, 2.180%, 6/08/2020 | | | 3,184,297 | |
| | 2,040,000 | | | AmeriCredit Automobile Receivables Trust, Series 2014-3, Class B, 1.920%, 11/08/2019 | | | 2,054,339 | |
| | 4,415,000 | | | AmeriCredit Automobile Receivables Trust, Series 2014-3, Class C, 2.580%, 9/08/2020 | | | 4,453,154 | |
| | 2,525,000 | | | AmeriCredit Automobile Receivables Trust, Series 2014-4, Class C, 2.470%, 11/09/2020 | | | 2,554,914 | |
| | 17,010,000 | | | AmeriCredit Automobile Receivables Trust, Series 2015-1, Class C, 2.510%, 1/08/2021 | | | 17,249,552 | |
| | 1,950,000 | | | Avis Budget Rental Car Funding AESOP LLC, Series 2012-3A, Class A, 2.100%, 3/20/2019, 144A | | | 1,964,297 | |
| | 1,535,000 | | | Avis Budget Rental Car Funding AESOP LLC, Series 2013-1A, Class B, 2.620%, 9/20/2019, 144A | | | 1,553,798 | |
| | 4,040,000 | | | Avis Budget Rental Car Funding AESOP LLC, Series 2013-2A, Class A, 2.970%, 2/20/2020, 144A | | | 4,160,267 | |
| | 2,000,000 | | | Avis Budget Rental Car Funding AESOP LLC, Series 2015-1A, Class A, 2.500%, 7/20/2021, 144A | | | 2,017,272 | |
| | 22,707,318 | | | CPS Auto Receivables Trust, Series 2015-A, Class A, 1.530%, 7/15/2019, 144A | | | 22,598,572 | |
| | 14,792,483 | | | CPS Auto Receivables Trust, Series 2015-B, Class A,
1.650%, 11/15/2019, 144A | | | 14,713,684 | |
| | 14,900,000 | | | CPS Auto Receivables Trust, Series 2015-C, Class C,
3.420%, 8/16/2021, 144A | | | 14,951,777 | |
| | 630,000 | | | Credit Acceptance Auto Loan Trust, Series 2014-1A, Class A, 1.550%, 10/15/2021, 144A | | | 629,022 | |
| | 11,380,000 | | | Credit Acceptance Auto Loan Trust, Series 2014-2A, Class B, 2.670%, 9/15/2022, 144A | | | 11,473,407 | |
| | 2,000,000 | | | Credit Acceptance Auto Loan Trust, Series 2015-1A, Class A, 2.000%, 7/15/2022, 144A | | | 2,006,288 | |
| | 10,810,000 | | | DT Auto Owner Trust, Series 2014-3A, Class C, 3.040%, 9/15/2020, 144A | | | 10,936,801 | |
| | 404,286 | | | Exeter Automobile Receivables Trust, Series 2013-2A, Class A, 1.490%, 11/15/2017, 144A | | | 404,524 | |
| | 5,000,000 | | | Exeter Automobile Receivables Trust, Series 2014-3A, Class B, 2.770%, 11/15/2019, 144A | | | 5,056,600 | |
| | 26,750,683 | | | Exeter Automobile Receivables Trust, Series 2015-1A, Class A, 1.600%, 6/17/2019, 144A | | | 26,773,634 | |
| | 9,285,000 | | | First Investors Auto Owner Trust, Series 2014-3A, Class A3,
1.670%, 11/16/2020, 144A | | | 9,268,816 | |
| | 3,175,152 | | | Flagship Credit Auto Trust, Series 2014-2, Class A, 1.430%, 12/16/2019, 144A | | | 3,165,643 | |
| | 3,655,757 | | | Santander Drive Auto Receivables Trust, Series 2012-3, Class C, 3.010%, 4/16/2018 | | | 3,676,072 | |
See accompanying notes to financial statements.
| 20
Portfolio of Investments – as of September 30, 2015
Loomis Sayles Core Plus Bond Fund – (continued)
| | | | | | | | |
Principal Amount (‡) | | | Description | | Value (†) | |
| | | | | | | | |
| | | | ABS Car Loan — continued | | | | |
| $ | 885,000 | | | Santander Drive Auto Receivables Trust, Series 2012-3, Class D, 3.640%, 5/15/2018 | | $ | 901,703 | |
| | 2,393,475 | | | Santander Drive Auto Receivables Trust, Series 2012-4, Class C, 2.940%, 12/15/2017 | | | 2,411,759 | |
| | 2,090,000 | | | Santander Drive Auto Receivables Trust, Series 2012-5, Class C, 2.700%, 8/15/2018 | | | 2,105,017 | |
| | 2,193,284 | | | Santander Drive Auto Receivables Trust, Series 2012-6, Class C, 1.940%, 3/15/2018 | | | 2,200,601 | |
| | 11,035,000 | | | Santander Drive Auto Receivables Trust, Series 2014-2, Class C, 2.330%, 11/15/2019 | | | 11,128,102 | |
| | 3,185,000 | | | Santander Drive Auto Receivables Trust, Series 2014-3, Class C, 2.130%, 8/17/2020 | | | 3,209,381 | |
| | 3,490,000 | | | Santander Drive Auto Receivables Trust, Series 2014-4, Class C, 2.600%, 11/16/2020 | | | 3,535,112 | |
| | 7,170,000 | | | Santander Drive Auto Receivables Trust, Series 2014-5, Class C, 2.460%, 6/15/2020 | | | 7,204,466 | |
| | | | | | | | |
| | | | | | | 213,300,134 | |
| | | | | | | | |
| | | | ABS Credit Card — 0.0% | | | | |
| | 480,000 | | | World Financial Network Credit Card Master Trust, Series 2012-A, Class A, 3.140%, 1/17/2023 | | | 502,403 | |
| | | | | | | | |
| | | | ABS Home Equity — 0.6% | | | | |
| | 2,615,000 | | | American Homes 4 Rent, 5.036%, 10/17/2045, 144A | | | 2,644,887 | |
| | 4,564,848 | | | Colony American Homes, Series 2014-1A, Class A,
1.400%, 5/17/2031, 144A(b) | | | 4,510,417 | |
| | 200,470 | | | Countrywide Asset-Backed Certificates, Series 2004-S1, Class A3, 5.115%, 2/25/2035(b) | | | 204,000 | |
| | 5,586,852 | | | Sequoia Mortgage Trust, Series 2013-5, Class A1,
2.500%, 5/25/2043, 144A(b) | | | 5,341,556 | |
| | 27,172,871 | | | Towd Point Mortgage Trust, Series 2015-2, Class 1AE2,
2.750%, 11/25/2060, 144A | | | 27,234,281 | |
| | | | | | | | |
| | | | | | | 39,935,141 | |
| | | | | | | | |
| | | | ABS Other — 0.9% | | | | |
| | 9,611,700 | | | DB Master Finance LLC, Series 2015-1A, Class A2I, 3.262%, 2/20/2045, 144A | | | 9,669,783 | |
| | 4,305,327 | | | Global Container Assets Ltd., Series 2013-1A, Class A1,
2.200%, 11/05/2028, 144A | | | 4,303,105 | |
| | 1,535,000 | | | OneMain Financial Issuance Trust, Series 2014-2A, Class A,
2.470%, 9/18/2024, 144A | | | 1,534,880 | |
| | 19,945,000 | | | OneMain Financial Issuance Trust, Series 2015-1A, Class A,
3.190%, 3/18/2026, 144A | | | 20,146,006 | |
| | 8,615,000 | | | Springleaf Funding Trust, Series 2013-BA, Class A, 3.920%, 1/16/2023, 144A | | | 8,615,000 | |
| | 8,227,083 | | | TAL Advantage V LLC, Series 2014-3A, Class A, 3.270%, 11/21/2039, 144A | | | 8,340,132 | |
| | 9,569,292 | | | Textainer Marine Containers Ltd., Series 2014-1A, Class A,
3.270%, 10/20/2039, 144A | | | 9,716,860 | |
| | | | | | | | |
| | | | | | | 62,325,766 | |
| | | | | | | | |
| | | | ABS Student Loan — 0.1% | | | | |
| | 1,647,954 | | | SoFi Professional Loan Program LLC, Series 2014-A, Class A2,
3.020%, 10/25/2027, 144A | | | 1,677,365 | |
See accompanying notes to financial statements.
21 |
Portfolio of Investments – as of September 30, 2015
Loomis Sayles Core Plus Bond Fund – (continued)
| | | | | | | | |
Principal Amount (‡) | | | Description | | Value (†) | |
| | | | | | | | |
| | | | ABS Student Loan — continued | | | | |
| $ | 5,490,503 | | | SoFi Professional Loan Program LLC, Series 2014-B, Class A2,
2.550%, 8/27/2029, 144A | | $ | 5,516,105 | |
| | | | | | | | |
| | | | | | | 7,193,470 | |
| | | | | | | | |
| | | | Aerospace & Defense — 0.8% | | | | |
| | 4,400,000 | | | Bombardier, Inc., 5.750%, 3/15/2022, 144A | | | 3,234,000 | |
| | 3,965,000 | | | Bombardier, Inc., 6.000%, 10/15/2022, 144A | | | 2,944,013 | |
| | 1,480,000 | | | Bombardier, Inc., 7.500%, 3/15/2018, 144A | | | 1,376,400 | |
| | 32,010,000 | | | Embraer Netherlands Finance BV, 5.050%, 6/15/2025 | | | 29,617,252 | |
| | 8,475,000 | | | Huntington Ingalls Industries, Inc., 5.000%, 12/15/2021, 144A | | | 8,644,500 | |
| | 3,765,000 | | | Textron, Inc., 3.875%, 3/01/2025 | | | 3,775,214 | |
| | | | | | | | |
| | | | | | | 49,591,379 | |
| | | | | | | | |
| | | | Airlines — 0.1% | | | | |
| | 3,028,307 | | | Continental Airlines Pass Through Certificates, Series 2012-2, Class A, 4.000%, 4/29/2026 | | | 3,079,122 | |
| | 948,565 | | | Continental Airlines Pass Through Trust, Series 2010-1, Class A,
4.750%, 7/12/2022 | | | 995,993 | |
| | | | | | | | |
| | | | | | | 4,075,115 | |
| | | | | | | | |
| | | | Automotive — 2.6% | | | | |
| | 665,000 | | | American Axle & Manufacturing, Inc., 5.125%, 2/15/2019 | | | 665,000 | |
| | 1,285,000 | | | Ford Motor Credit Co. LLC, 2.375%, 1/16/2018 | | | 1,286,439 | |
| | 25,270,000 | | | Ford Motor Credit Co. LLC, 2.375%, 3/12/2019 | | | 25,069,255 | |
| | 7,885,000 | | | Ford Motor Credit Co. LLC, 5.000%, 5/15/2018 | | | 8,386,384 | |
| | 28,680,000 | | | Ford Motor Credit Co. LLC, 5.750%, 2/01/2021 | | | 32,217,506 | |
| | 17,000,000 | | | Ford Motor Credit Co. LLC, 5.875%, 8/02/2021 | | | 19,244,068 | |
| | 5,585,000 | | | Ford Motor Credit Co. LLC, 6.625%, 8/15/2017(c) | | | 6,029,332 | |
| | 12,680,000 | | | General Motors Co., 5.000%, 4/01/2035 | | | 11,745,801 | |
| | 11,655,000 | | | General Motors Co., 5.200%, 4/01/2045 | | | 10,937,553 | |
| | 34,495,000 | | | General Motors Co., 6.250%, 10/02/2043 | | | 36,691,538 | |
| | 3,310,000 | | | General Motors Financial Co., Inc., 3.250%, 5/15/2018 | | | 3,348,432 | |
| | 8,160,000 | | | General Motors Financial Co., Inc., 6.750%, 6/01/2018(c) | | | 8,918,570 | |
| | 4,290,000 | | | Hyundai Capital Services, Inc., 3.500%, 9/13/2017, 144A | | | 4,421,995 | |
| | | | | | | | |
| | | | | | | 168,961,873 | |
| | | | | | | | |
| | | | Banking — 8.8% | | | | |
| | 18,380,000 | | | Ally Financial, Inc., 3.500%, 1/27/2019 | | | 18,098,602 | |
| | 47,310,000 | | | Ally Financial, Inc., 3.750%, 11/18/2019 | | | 46,363,800 | |
| | 5,000,000 | | | Ally Financial, Inc., 4.750%, 9/10/2018 | | | 5,093,750 | |
| | 21,355,000 | | | Banco Santander Brasil S.A., 4.625%, 2/13/2017, 144A | | | 21,290,935 | |
| | 17,780,000 | | | Banco Santander Chile, 3.875%, 9/20/2022, 144A | | | 17,714,463 | |
| | 12,810,000 | | | Bangkok Bank PCL, 2.750%, 3/27/2018, 144A | | | 12,948,438 | |
| | 43,640,000 | | | Bangkok Bank PCL, 3.300%, 10/03/2018, 144A | | | 44,753,256 | |
| | 6,845,000 | | | Bank of America Corp., 2.650%, 4/01/2019 | | | 6,922,280 | |
| | 2,500,000 | | | Bank of America Corp., 5.650%, 5/01/2018 | | | 2,727,768 | |
| | 49,225,000 | | | Bank of America Corp., MTN, 5.000%, 5/13/2021(c) | | | 54,240,141 | |
| | 61,255,000 | | | Barclays PLC, 2.875%, 6/08/2020 | | | 61,260,513 | |
| | 26,235,000 | | | BBVA Banco Continental S.A., 3.250%, 4/08/2018, 144A | | | 26,464,556 | |
See accompanying notes to financial statements.
| 22
Portfolio of Investments – as of September 30, 2015
Loomis Sayles Core Plus Bond Fund – (continued)
| | | | | | | | |
Principal Amount (‡) | | | Description | | Value (†) | |
| | | | | | | | |
| | | | Banking — continued | | | | |
| $ | 19,630,000 | | | Citigroup, Inc., 2.500%, 9/26/2018 | | $ | 19,890,667 | |
| | 28,025,000 | | | Citigroup, Inc., 4.050%, 7/30/2022 | | | 28,569,133 | |
| | 5,230,000 | | | Citigroup, Inc., 6.125%, 5/15/2018 | | | 5,780,902 | |
| | 13,860,000 | | | Goldman Sachs Group, Inc. (The), 3.625%, 1/22/2023 | | | 14,040,665 | |
| | 15,400,000 | | | Goldman Sachs Group, Inc. (The), 5.750%, 1/24/2022 | | | 17,674,411 | |
| | 3,985,000 | | | Goldman Sachs Group, Inc. (The), 6.000%, 6/15/2020 | | | 4,579,749 | |
| | 13,930,000 | | | Goldman Sachs Group, Inc. (The), 6.750%, 10/01/2037 | | | 16,617,348 | |
| | 3,035,000 | | | Goldman Sachs Group, Inc. (The), 7.500%, 2/15/2019 | | | 3,547,317 | |
| | 9,135,000 | | | JPMorgan Chase & Co., 3.200%, 1/25/2023 | | | 9,067,995 | |
| | 9,025,000 | | | JPMorgan Chase & Co., 4.350%, 8/15/2021 | | | 9,725,999 | |
| | 27,965,000 | | | JPMorgan Chase & Co., 4.500%, 1/24/2022(c) | | | 30,173,368 | |
| | 1,985,000 | | | KEB Hana Bank, 4.250%, 6/14/2017, 144A | | | 2,068,033 | |
| | 4,350,000 | | | Merrill Lynch & Co., Inc., MTN, 6.875%, 4/25/2018 | | | 4,861,717 | |
| | 8,060,000 | | | Morgan Stanley, 3.700%, 10/23/2024 | | | 8,098,446 | |
| | 20,300,000 | | | Morgan Stanley, 5.750%, 1/25/2021 | | | 23,151,663 | |
| | 14,560,000 | | | Morgan Stanley, GMTN, 5.500%, 1/26/2020 | | | 16,278,138 | |
| | 13,000,000 | | | Morgan Stanley, GMTN, 5.500%, 7/28/2021 | | | 14,691,547 | |
| | 22,550,000 | | | Morgan Stanley, Series F, 3.875%, 4/29/2024 | | | 23,032,818 | |
| | 5,155,000 | | | Morgan Stanley, Series F, GMTN, 6.625%, 4/01/2018 | | | 5,740,268 | |
| | 9,450,000 | | | Santander UK Group Holdings PLC, 5.625%, 9/15/2045, 144A | | | 9,369,892 | |
| | | | | | | | |
| | | | | | | 584,838,578 | |
| | | | | | | | |
| | | | Building Materials — 0.2% | | | | |
| | 3,965,000 | | | CRH America, Inc., 3.875%, 5/18/2025, 144A | | | 3,971,166 | |
| | 8,870,000 | | | Owens Corning, 4.200%, 12/01/2024 | | | 8,811,458 | |
| | 2,860,000 | | | USG Corp., 5.500%, 3/01/2025, 144A | | | 2,852,850 | |
| | | | | | | | |
| | | | | | | 15,635,474 | |
| | | | | | | | |
| | | | Cable Satellite — 2.2% | | | | |
| | 2,383,000 | | | CCO Holdings LLC/CCO Holdings Capital Corp., 5.125%, 2/15/2023 | | | 2,198,318 | |
| | 3,935,000 | | | CCO Holdings LLC/CCO Holdings Capital Corp., 5.250%, 3/15/2021 | | | 3,875,483 | |
| | 22,730,000 | | | CCO Holdings LLC/CCO Holdings Capital Corp., 5.250%, 9/30/2022 | | | 21,309,375 | |
| | 7,000,000 | | | CCO Holdings LLC/CCO Holdings Capital Corp., 5.750%, 1/15/2024 | | | 6,685,000 | |
| | 2,965,000 | | | CCO Holdings LLC/CCO Holdings Capital Corp., 6.500%, 4/30/2021 | | | 2,979,825 | |
| | 20,065,000 | | | CCO Safari II LLC, 6.484%, 10/23/2045, 144A | | | 20,242,575 | |
| | 7,925,000 | | | DISH DBS Corp., 5.000%, 3/15/2023 | | | 6,637,187 | |
| | 27,950,000 | | | DISH DBS Corp., 5.875%, 11/15/2024 | | | 23,740,031 | |
| | 21,385,000 | | | Time Warner Cable, Inc., 4.500%, 9/15/2042 | | | 16,907,473 | |
| | 4,080,000 | | | Time Warner Cable, Inc., 5.500%, 9/01/2041 | | | 3,654,097 | |
| | 2,743,000 | | | Time Warner Cable, Inc., 5.875%, 11/15/2040 | | | 2,610,859 | |
| | 8,750,000 | | | Time Warner Cable, Inc., 6.550%, 5/01/2037 | | | 8,597,575 | |
| | 2,085,000 | | | Time Warner Cable, Inc., 6.750%, 6/15/2039 | | | 2,085,494 | |
| | 10,935,000 | | | Virgin Media Finance PLC, 5.750%, 1/15/2025, 144A | | | 10,278,900 | |
| | 2,825,000 | | | Virgin Media Finance PLC, 6.375%, 4/15/2023, 144A | | | 2,810,875 | |
| | 2,535,000 | | | Virgin Media Secured Finance PLC, 5.250%, 1/15/2021 | | | 2,642,737 | |
| | 382,500 | | | Virgin Media Secured Finance PLC, 5.375%, 4/15/2021, 144A | | | 384,891 | |
| | 5,000,000 | | | Virgin Media Secured Finance PLC, 5.500%, 1/15/2025, 144A | | | 4,850,000 | |
| | | | | | | | |
| | | | | | | 142,490,695 | |
| | | | | | | | |
See accompanying notes to financial statements.
23 |
Portfolio of Investments – as of September 30, 2015
Loomis Sayles Core Plus Bond Fund – (continued)
| | | | | | | | |
Principal Amount (‡) | | | Description | | Value (†) | |
| | | | | | | | |
| | | | Chemicals — 1.3% | | | | |
| $ | 29,365,000 | | | Braskem America Finance Co., 7.125%, 7/22/2041, 144A(c) | | $ | 20,496,770 | |
| | 4,375,000 | | | Methanex Corp., 3.250%, 12/15/2019 | | | 4,366,666 | |
| | 16,185,000 | | | Methanex Corp., 5.250%, 3/01/2022 | | | 17,233,594 | |
| | 10,625,000 | | | Mexichem SAB de CV, 5.875%, 9/17/2044, 144A | | | 8,978,125 | |
| | 11,565,000 | | | Mexichem SAB de CV, 6.750%, 9/19/2042, 144A(c) | | | 11,218,050 | |
| | 18,345,000 | | | PolyOne Corp., 5.250%, 3/15/2023 | | | 17,345,197 | |
| | 4,560,000 | | | RPM International, Inc., 3.450%, 11/15/2022 | | | 4,438,804 | |
| | 3,685,000 | | | RPM International, Inc., 6.125%, 10/15/2019 | | | 4,126,308 | |
| | | | | | | | |
| | | | | | | 88,203,514 | |
| | | | | | | | |
| | | | Collateralized Mortgage Obligations — 1.0% | | | | |
| | 730,214 | | | Government National Mortgage Association, Series 2010-H20, Class AF, 0.522%, 10/20/2060(b) | | | 725,529 | |
| | 557,873 | | | Government National Mortgage Association, Series 2010-H24, Class FA, 0.542%, 10/20/2060(b) | | | 555,719 | |
| | 532,723 | | | Government National Mortgage Association, Series 2011-H06, Class FA, 0.642%, 2/20/2061(b) | | | 532,071 | |
| | 5,189,625 | | | Government National Mortgage Association, Series 2012-H12, Class FA, 0.742%, 4/20/2062(b) | | | 5,207,581 | |
| | 628,587 | | | Government National Mortgage Association, Series 2012-H18, Class NA, 0.712%, 8/20/2062(b) | | | 629,383 | |
| | 3,436,203 | | | Government National Mortgage Association, Series 2013-H01, Class FA, 1.650%, 1/20/2063 | | | 3,458,510 | |
| | 4,405,008 | | | Government National Mortgage Association, Series 2013-H03, Class HA, 1.750%, 12/20/2062 | | | 4,459,344 | |
| | 1,906,998 | | | Government National Mortgage Association, Series 2013-H04, Class BA, 1.650%, 2/20/2063 | | | 1,919,479 | |
| | 19,271,323 | | | Government National Mortgage Association, Series 2013-H07, Class DA, 2.500%, 3/20/2063 | | | 19,879,141 | |
| | 27,315,133 | | | Government National Mortgage Association, Series 2015-H10, Class JA, 2.250%, 4/20/2065 | | | 27,601,560 | |
| | | | | | | | |
| | | | | | | 64,968,317 | |
| | | | | | | | |
| | | | Consumer Cyclical Services — 0.3% | | | | |
| | 17,635,000 | | | Alibaba Group Holding Ltd., 4.500%, 11/28/2034, 144A | | | 16,389,722 | |
| | 5,980,000 | | | IHS, Inc., 5.000%, 11/01/2022 | | | 5,748,275 | |
| | | | | | | | |
| | | | | | | 22,137,997 | |
| | | | | | | | |
| | | | Consumer Products — 0.1% | | | | |
| | 3,620,000 | | | Whirlpool Corp., MTN, 4.850%, 6/15/2021 | | | 3,974,123 | |
| | | | | | | | |
| | | | Diversified Manufacturing — 0.5% | | | | |
| | 1,200,000 | | | Crane Co., 6.550%, 11/15/2036 | | | 1,438,632 | |
| | 5,620,000 | | | EnerSys, 5.000%, 4/30/2023, 144A | | | 5,451,400 | |
| | 37,955,000 | | | Votorantim Cimentos S.A., 7.250%, 4/05/2041, 144A | | | 27,802,038 | |
| | | | | | | | |
| | | | | | | 34,692,070 | |
| | | | | | | | |
| | | | Electric — 2.0% | | | | |
| | 20,370,000 | | | AES Corp. (The), 3.324%, 6/01/2019(b) | | | 19,351,500 | |
| | 2,200,000 | | | AES Corp. (The), 7.375%, 7/01/2021 | | | 2,282,500 | |
See accompanying notes to financial statements.
| 24
Portfolio of Investments – as of September 30, 2015
Loomis Sayles Core Plus Bond Fund – (continued)
| | | | | | | | |
Principal Amount (‡) | | | Description | | Value (†) | |
| | | | | | | | |
| | | | Electric — continued | | | | |
| $ | 33,840,000 | | | Dynegy, Inc., 6.750%, 11/01/2019 | | $ | 33,924,600 | |
| | 20,995,000 | | | EDP Finance BV, 5.250%, 1/14/2021, 144A | | | 22,156,443 | |
| | 3,485,000 | | | Empresa Nacional de Electricidad S.A., 4.250%, 4/15/2024 | | | 3,477,824 | |
| | 12,390,000 | | | FirstEnergy Corp., 2.750%, 3/15/2018 | | | 12,423,812 | |
| | 1,010,000 | | | Ipalco Enterprises, Inc., 5.000%, 5/01/2018 | | | 1,057,975 | |
| | 17,865,000 | | | National Rural Utilities Cooperative Finance Corp., (fixed rate to 4/30/2023, variable rate thereafter), 4.750%, 4/30/2043 | | | 17,713,148 | |
| | 6,590,000 | | | Talen Energy Supply LLC, 6.500%, 6/01/2025, 144A | | | 5,667,400 | |
| | 8,715,000 | | | Transelec S.A., 4.250%, 1/14/2025, 144A | | | 8,583,125 | |
| | 4,380,000 | | | Transelec S.A., 4.625%, 7/26/2023, 144A | | | 4,490,731 | |
| | | | | | | | |
| | | | | | | 131,129,058 | |
| | | | | | | | |
| | | | Finance Companies — 4.4% | | | | |
| | 30,145,000 | | | AerCap Ireland Capital Ltd./AerCap Global Aviation Trust, 3.750%, 5/15/2019 | | | 29,617,463 | |
| | 5,275,000 | | | Aircastle Ltd., 5.500%, 2/15/2022 | | | 5,327,750 | |
| | 4,770,000 | | | CIT Group, Inc., 5.250%, 3/15/2018 | | | 4,901,175 | |
| | 17,090,000 | | | CIT Group, Inc., 5.375%, 5/15/2020 | | | 17,901,775 | |
| | 27,670,000 | | | CIT Group, Inc., 5.500%, 2/15/2019, 144A | | | 28,707,625 | |
| | 13,125,000 | | | International Lease Finance Corp., 3.875%, 4/15/2018 | | | 13,092,188 | |
| | 16,438,000 | | | International Lease Finance Corp., 5.875%, 4/01/2019 | | | 17,284,557 | |
| | 2,450,000 | | | International Lease Finance Corp., 5.875%, 8/15/2022 | | | 2,609,250 | |
| | 19,039,000 | | | International Lease Finance Corp., 6.250%, 5/15/2019 | | | 20,276,535 | |
| | 4,635,000 | | | Navient Corp., 5.875%, 3/25/2021 | | | 3,899,194 | |
| | 7,510,000 | | | Navient Corp., MTN, 6.125%, 3/25/2024 | | | 6,008,000 | |
| | 26,085,000 | | | Navient LLC, 4.875%, 6/17/2019 | | | 23,737,350 | |
| | 27,625,000 | | | Navient LLC, MTN, 5.500%, 1/15/2019 | | | 25,673,984 | |
| | 1,100,000 | | | Navient LLC, MTN, 6.000%, 1/25/2017 | | | 1,105,500 | |
| | 6,560,000 | | | Navient LLC, MTN, 6.250%, 1/25/2016 | | | 6,617,662 | |
| | 14,840,000 | | | Navient LLC, MTN, 8.000%, 3/25/2020 | | | 14,209,300 | |
| | 120,000 | | | Navient LLC, Series A, MTN, 5.000%, 6/15/2018 | | | 114,600 | |
| | 6,960,000 | | | Quicken Loans, Inc., 5.750%, 5/01/2025, 144A | | | 6,533,700 | |
| | 60,315,000 | | | Springleaf Finance Corp., 5.250%, 12/15/2019 | | | 58,957,912 | |
| | 3,135,000 | | | Springleaf Finance Corp., 6.000%, 6/01/2020 | | | 3,146,756 | |
| | | | | | | | |
| | | | | | | 289,722,276 | |
| | | | | | | | |
| | | | Financial Other — 0.5% | | | | |
| | 36,870,000 | | | Cielo S.A./Cielo USA, Inc., 3.750%, 11/16/2022, 144A | | | 31,155,150 | |
| | | | | | | | |
| | | | Food & Beverage — 0.9% | | | | |
| | 8,760,000 | | | Alicorp SAA, 3.875%, 3/20/2023, 144A | | | 8,370,180 | |
| | 9,775,000 | | | Constellation Brands, Inc., 3.750%, 5/01/2021 | | | 9,701,687 | |
| | 3,500,000 | | | Constellation Brands, Inc., 3.875%, 11/15/2019 | | | 3,570,000 | |
| | 1,340,000 | | | Cosan Luxembourg S.A., 5.000%, 3/14/2023, 144A | | | 1,005,000 | |
| | 3,490,000 | | | Gruma SAB de CV, 4.875%, 12/01/2024, 144A | | | 3,670,084 | |
| | 17,770,000 | | | Kraft Heinz Foods Co., 3.950%, 7/15/2025, 144A | | | 18,181,962 | |
| | 12,530,000 | | | Sigma Alimentos S.A. de CV, 5.625%, 4/14/2018, 144A | | | 13,046,236 | |
| | 1,230,000 | | | Sigma Alimentos S.A. de CV, 6.875%, 12/16/2019, 144A | | | 1,360,626 | |
| | | | | | | | |
| | | | | | | 58,905,775 | |
| | | | | | | | |
See accompanying notes to financial statements.
25 |
Portfolio of Investments – as of September 30, 2015
Loomis Sayles Core Plus Bond Fund – (continued)
| | | | | | | | |
Principal Amount (‡) | | | Description | | Value (†) | |
| | | | | | | | |
| | | | Government Owned – No Guarantee — 5.7% | | | | |
| $ | 2,355,000 | | | Abu Dhabi National Energy Co. PJSC, 2.500%, 1/12/2018, 144A | | $ | 2,352,946 | |
| | 9,135,000 | | | CEZ AS, 5.625%, 4/03/2042, 144A | | | 10,074,717 | |
| | 19,995,000 | | | China Resources Gas Group Ltd., 4.500%, 4/05/2022, 144A | | | 20,701,983 | |
| | 2,045,000 | | | CNPC General Capital Ltd., 3.400%, 4/16/2023, 144A | | | 1,990,623 | |
| | 17,400,000 | | | CNPC General Capital Ltd., 3.950%, 4/19/2022, 144A | | | 17,742,293 | |
| | 18,760,000 | | | Dolphin Energy Ltd., 5.500%, 12/15/2021, 144A | | | 21,171,523 | |
| | 1,665,000 | | | Dubai Electricity & Water Authority, 6.375%, 10/21/2016, 144A | | | 1,751,247 | |
| | 20,395,000 | | | Ecopetrol S.A., 5.375%, 6/26/2026 | | | 17,794,637 | |
| | 6,310,000 | | | IPIC GMTN Ltd., 6.875%, 11/01/2041, 144A | | | 8,328,039 | |
| | 19,285,000 | | | OCP S.A., 5.625%, 4/25/2024, 144A | | | 19,671,471 | |
| | 5,000,000 | | | Ooredoo International Finance Ltd., 3.250%, 2/21/2023, 144A | | | 4,856,450 | |
| | 1,290,000 | | | Ooredoo International Finance Ltd., 3.875%, 1/31/2028, 144A | | | 1,227,758 | |
| | 2,895,000 | | | Ooredoo International Finance Ltd., 4.750%, 2/16/2021, 144A | | | 3,161,919 | |
| | 2,965,000 | | | Ooredoo International Finance Ltd., 7.875%, 6/10/2019, 144A | | | 3,548,008 | |
| | 49,230,000 | | | Pertamina Persero PT, 5.625%, 5/20/2043, 144A(c) | | | 38,269,728 | |
| | 3,720,000 | | | Pertamina Persero PT, 6.000%, 5/03/2042, 144A | | | 3,077,764 | |
| | 8,395,000 | | | Pertamina Persero PT, 6.450%, 5/30/2044, 144A | | | 7,281,479 | |
| | 43,020,000 | | | Petrobras Global Finance BV, 5.625%, 5/20/2043 | | | 26,349,750 | |
| | 9,705,000 | | | Petrobras Global Finance BV, 6.750%, 1/27/2041 | | | 6,332,513 | |
| | 30,650,000 | | | Petrobras Global Finance BV, 6.850%, 6/05/2115 | | | 19,539,375 | |
| | 8,325,000 | | | Petroleos Mexicanos, 3.125%, 1/23/2019 | | | 8,148,094 | |
| | 1,210,000 | | | Petroleos Mexicanos, 3.500%, 7/18/2018 | | | 1,223,310 | |
| | 10,935,000 | | | Petroleos Mexicanos, 3.500%, 7/23/2020, 144A | | | 10,611,871 | |
| | 6,470,000 | | | Petroleos Mexicanos, 5.500%, 1/21/2021 | | | 6,802,882 | |
| | 41,622,000 | | | Rio Oil Finance Trust, Series 2014-1, 6.250%, 7/06/2024, 144A | | | 26,638,080 | |
| | 53,905,000 | | | Tennessee Valley Authority, 3.500%, 12/15/2042(c) | | | 51,713,762 | |
| | 14,830,000 | | | Tennessee Valley Authority, 4.250%, 9/15/2065 | | | 14,903,750 | |
| | 6,630,000 | | | Tennessee Valley Authority, 4.875%, 1/15/2048 | | | 7,738,098 | |
| | 11,350,000 | | | Tennessee Valley Authority, 5.250%, 9/15/2039 | | | 14,081,355 | |
| | | | | | | | |
| | | | | | | 377,085,425 | |
| | | | | | | | |
| | | | Healthcare — 1.6% | | | | |
| | 11,450,000 | | | Halyard Health, Inc., 6.250%, 10/15/2022 | | | 11,679,000 | |
| | 1,580,000 | | | HCA Holdings, Inc., 6.250%, 2/15/2021 | | | 1,682,700 | |
| | 5,690,000 | | | HCA, Inc., 5.375%, 2/01/2025 | | | 5,633,100 | |
| | 2,915,000 | | | HCA, Inc., 5.875%, 5/01/2023 | | | 3,024,313 | |
| | 28,295,000 | | | HCA, Inc., 7.500%, 2/15/2022 | | | 31,973,350 | |
| | 575,000 | | | HCA, Inc., 7.500%, 12/15/2023 | | | 641,125 | |
| | 20,490,000 | | | Kindred Healthcare, Inc., 8.000%, 1/15/2020, 144A | | | 21,719,400 | |
| | 4,451,000 | | | Omnicare, Inc., 4.750%, 12/01/2022 | | | 4,807,080 | |
| | 2,124,000 | | | Omnicare, Inc., 5.000%, 12/01/2024 | | | 2,304,540 | |
| | 3,200,000 | | | PerkinElmer, Inc., 5.000%, 11/15/2021 | | | 3,443,434 | |
| | 10,029,000 | | | Universal Health Services, Inc., 3.750%, 8/01/2019, 144A | | | 10,154,362 | |
| | 9,410,000 | | | Universal Health Services, Inc., 4.750%, 8/01/2022, 144A | | | 9,598,200 | |
| | | | | | | | |
| | | | | | | 106,660,604 | |
| | | | | | | | |
| | | | Home Construction — 0.1% | | | | |
| | 8,630,000 | | | KB Home, 4.750%, 5/15/2019 | | | 8,295,588 | |
| | | | | | | | |
See accompanying notes to financial statements.
| 26
Portfolio of Investments – as of September 30, 2015
Loomis Sayles Core Plus Bond Fund – (continued)
| | | | | | | | |
Principal Amount (‡) | | | Description | | Value (†) | |
| | | | | | | | |
| | | | Hybrid ARMs — 0.0% | | | | |
| $ | 115,416 | | | FNMA, 1.922%, 2/01/2037(b) | | $ | 120,707 | |
| | | | | | | | |
| | | | Independent Energy — 1.5% | | | | |
| | 5,060,000 | | | MEG Energy Corp., 7.000%, 3/31/2024, 144A | | | 4,022,700 | |
| | 13,973,000 | | | Newfield Exploration Co., 5.375%, 1/01/2026 | | | 12,785,295 | |
| | 10,875,000 | | | Newfield Exploration Co., 5.750%, 1/30/2022 | | | 10,548,750 | |
| | 14,386,000 | | | Pan American Energy LLC/Argentine Branch, 7.875%, 5/07/2021, 144A | | | 14,237,824 | |
| | 14,100,000 | | | QEP Resources, Inc., 5.250%, 5/01/2023 | | | 11,787,600 | |
| | 8,765,000 | | | QEP Resources, Inc., 5.375%, 10/01/2022 | | | 7,450,250 | |
| | 11,085,000 | | | Range Resources Corp., 5.000%, 8/15/2022 | | | 9,810,225 | |
| | 13,340,000 | | | SM Energy Co., 5.000%, 1/15/2024 | | | 11,288,975 | |
| | 16,580,000 | | | SM Energy Co., 6.125%, 11/15/2022 | | | 15,353,080 | |
| | 1,125,000 | | | SM Energy Co., 6.500%, 11/15/2021 | | | 1,068,750 | |
| | 4,170,000 | | | SM Energy Co., 6.500%, 1/01/2023 | | | 3,878,100 | |
| | | | | | | | |
| | | | | | | 102,231,549 | |
| | | | | | | | |
| | | | Industrial Other — 0.6% | | | | |
| | 6,131,000 | | | Briggs & Stratton Corp., 6.875%, 12/15/2020 | | | 6,621,480 | |
| | 5,987,000 | | | CBRE Services, Inc., 5.000%, 3/15/2023 | | | 6,017,851 | |
| | 9,170,000 | | | Deluxe Corp., 6.000%, 11/15/2020 | | | 9,617,038 | |
| | 17,370,000 | | | Ferreycorp SAA, 4.875%, 4/26/2020, 144A | | | 16,067,250 | |
| | | | | | | | |
| | | | | | | 38,323,619 | |
| | | | | | | | |
| | | | Integrated Energy — 0.2% | | | | |
| | 29,005,000 | | | Pacific Exploration and Production Corp., 5.375%, 1/26/2019, 144A | | | 10,731,850 | |
| | 6,165,000 | | | Pacific Exploration and Production Corp., 7.250%, 12/12/2021, 144A | | | 2,219,400 | |
| | | | | | | | |
| | | | | | | 12,951,250 | |
| | | | | | | | |
| | | | Leisure — 0.2% | | | | |
| | 12,095,000 | | | Regal Entertainment Group, 5.750%, 3/15/2022 | | | 11,883,338 | |
| | | | | | | | |
| | | | Media Entertainment — 1.0% | | | | |
| | 66,000,000 | | | Grupo Televisa SAB, EMTN, 7.250%, 5/14/2043, (MXN) | | | 3,297,255 | |
| | 31,592,000 | | | Myriad International Holdings BV, 6.000%, 7/18/2020, 144A | | | 33,776,903 | |
| | 4,284,000 | | | Myriad International Holdings BV, 6.375%, 7/28/2017, 144A | | | 4,524,418 | |
| | 18,985,000 | | | Nielsen Finance LLC/Nielsen Finance Co., 5.000%, 4/15/2022, 144A | | | 18,391,719 | |
| | 5,840,000 | | | Viacom, Inc., 5.250%, 4/01/2044 | | | 5,098,308 | |
| | | | | | | | |
| | | | | | | 65,088,603 | |
| | | | | | | | |
| | | | Metals & Mining — 2.1% | | | | |
| | 9,173,000 | | | Anglo American Capital PLC, 3.625%, 5/14/2020, 144A | | | 8,003,800 | |
| | 22,865,000 | | | Anglo American Capital PLC, 4.875%, 5/14/2025, 144A | | | 18,309,926 | |
| | 23,235,000 | | | ArcelorMittal, 7.500%, 3/01/2041 | | | 18,704,175 | |
| | 4,630,000 | | | ArcelorMittal, 7.750%, 10/15/2039 | | | 3,773,450 | |
| | 5,280,000 | | | Freeport-McMoran Oil & Gas LLC/FCX Oil & Gas, Inc., 6.875%, 2/15/2023 | | | 4,671,480 | |
| | 15,430,000 | | | Freeport-McMoRan, Inc., 2.375%, 3/15/2018 | | | 13,501,250 | |
| | 13,080,000 | | | Freeport-McMoRan, Inc., 3.550%, 3/01/2022 | | | 9,810,000 | |
| | 11,605,000 | | | Goldcorp, Inc., 2.125%, 3/15/2018 | | | 11,469,431 | |
| | 2,675,000 | | | Samarco Mineracao S.A., 4.125%, 11/01/2022, 144A | | | 2,126,625 | |
| | 5,460,000 | | | Samarco Mineracao S.A., 5.375%, 9/26/2024, 144A | | | 4,399,395 | |
See accompanying notes to financial statements.
27 |
Portfolio of Investments – as of September 30, 2015
Loomis Sayles Core Plus Bond Fund – (continued)
| | | | | | | | |
Principal Amount (‡) | | | Description | | Value (†) | |
| | | | | | | | |
| | | | Metals & Mining — continued | | | | |
| $ | 11,500,000 | | | Samarco Mineracao S.A., 5.750%, 10/24/2023, 144A | | $ | 9,746,250 | |
| | 38,900,000 | | | Southern Copper Corp., 5.875%, 4/23/2045 | | | 31,580,965 | |
| | 4,150,000 | | | Steel Dynamics, Inc., 5.125%, 10/01/2021 | | | 3,932,125 | |
| | 1,445,000 | | | Steel Dynamics, Inc., 5.250%, 4/15/2023 | | | 1,322,175 | |
| | | | | | | | |
| | | | | | | 141,351,047 | |
| | | | | | | | |
| | | | Midstream — 2.0% | | | | |
| | 11,050,000 | | | El Paso Pipeline Partners Operating Co. LLC, 4.300%, 5/01/2024 | | | 10,087,899 | |
| | 6,390,000 | | | Energy Transfer Partners LP, 5.950%, 10/01/2043 | | | 5,647,552 | |
| | 23,745,000 | | | Energy Transfer Partners LP, 6.050%, 6/01/2041 | | | 21,065,947 | |
| | 9,345,000 | | | Energy Transfer Partners LP, 6.500%, 2/01/2042 | | | 8,575,355 | |
| | 1,635,000 | | | Energy Transfer Partners LP, 6.625%, 10/15/2036 | | | 1,555,554 | |
| | 3,565,000 | | | Kinder Morgan Finance Co. LLC, 6.000%, 1/15/2018, 144A | | | 3,772,700 | |
| | 5,035,000 | | | Kinder Morgan, Inc., 5.000%, 2/15/2021, 144A | | | 5,144,980 | |
| | 19,525,000 | | | Kinder Morgan, Inc., 5.625%, 11/15/2023, 144A | | | 19,143,794 | |
| | 13,710,000 | | | Regency Energy Partners LP/Regency Energy Finance Corp.,
5.000%, 10/01/2022 | | | 13,385,758 | |
| | 343,000 | | | Regency Energy Partners LP/Regency Energy Finance Corp.,
5.500%, 4/15/2023 | | | 331,852 | |
| | 12,031,000 | | | Regency Energy Partners LP/Regency Energy Finance Corp.,
5.875%, 3/01/2022 | | | 12,329,008 | |
| | 22,580,000 | | | Targa Resources Partners LP/Targa Resources Partners Finance Corp.,
4.125%, 11/15/2019, 144A | | | 20,265,550 | |
| | 1,345,000 | | | Tesoro Logistics LP/Tesoro Logistics Finance Corp.,
5.500%, 10/15/2019, 144A | | | 1,318,100 | |
| | 7,200,000 | | | Tesoro Logistics LP/Tesoro Logistics Finance Corp.,
6.250%, 10/15/2022, 144A | | | 7,047,000 | |
| | | | | | | | |
| | | | | | | 129,671,049 | |
| | | | | | | | |
| | | | Mortgage Related — 13.4% | | | | |
| | 3,717,855 | | | FHLMC, 3.000%, 11/01/2042 | | | 3,774,450 | |
| | 48,488,820 | | | FHLMC, 3.500%, with various maturities from 2043 to 2045(d) | | | 50,635,296 | |
| | 9,004,111 | | | FHLMC, 4.000%, with various maturities in 2045(d) | | | 9,622,486 | |
| | 19,614 | | | FHLMC, 5.500%, 12/01/2018 | | | 20,658 | |
| | 22,970 | | | FHLMC, 6.000%, 6/01/2035 | | | 26,248 | |
| | 37,484,771 | | | FNMA, 3.000%, with various maturities from 2043 to 2045(d) | | | 38,032,796 | |
| | 124,088,937 | | | FNMA, 3.500%, with various maturities from 2042 to 2045(d) | | | 129,700,265 | |
| | 22,239,464 | | | FNMA, 4.000%, with various maturities from 2042 to 2045(d) | | | 23,823,072 | |
| | 422,412 | | | FNMA, 6.000%, with various maturities from 2016 to 2037(d) | | | 478,535 | |
| | 34,665 | | | FNMA, 6.500%, with various maturities from 2029 to 2036(d) | | | 40,016 | |
| | 56,278 | | | FNMA, 7.000%, with various maturities in 2030(d) | | | 64,062 | |
| | 45,571 | | | FNMA, 7.500%, with various maturities from 2024 to 2032(d) | | | 52,296 | |
| | 254,340,000 | | | FNMA (TBA), 3.500%, 11/01/2045(e) | | | 264,750,045 | |
| | 202,670,000 | | | FNMA (TBA), 4.000%, 11/01/2045(e) | | | 215,788,195 | |
| | 733,397 | | | GNMA, 2.133%, 9/20/2063(b) | | | 772,366 | |
| | 167,454 | | | GNMA, 4.144%, 1/20/2063 | | | 181,602 | |
| | 149,422 | | | GNMA, 4.323%, 5/20/2063 | | | 163,006 | |
| | 200,440 | | | GNMA, 4.423%, 7/20/2063 | | | 219,991 | |
| | 1,009,576 | | | GNMA, 4.499%, 12/20/2062 | | | 1,097,617 | |
| | 635,487 | | | GNMA, 4.515%, 7/20/2063 | | | 698,007 | |
See accompanying notes to financial statements.
| 28
Portfolio of Investments – as of September 30, 2015
Loomis Sayles Core Plus Bond Fund – (continued)
| | | | | | | | |
Principal Amount (‡) | | | Description | | Value (†) | |
| | | | | | | | |
| | | | Mortgage Related — continued | | | | |
| $ | 1,113,376 | | | GNMA, 4.522%, 8/20/2062 | | $ | 1,205,354 | |
| | 616,665 | | | GNMA, 4.524%, 5/20/2063 | | | 676,926 | |
| | 5,386,202 | | | GNMA, 4.527%, 1/20/2065 | | | 6,031,038 | |
| | 4,682,875 | | | GNMA, 4.533%, 6/20/2064 | | | 5,222,417 | |
| | 1,089,545 | | | GNMA, 4.538%, 11/20/2062 | | | 1,183,882 | |
| | 6,088,770 | | | GNMA, 4.544%, 12/20/2064 | | | 6,807,281 | |
| | 15,350,071 | | | GNMA, 4.546%, 11/20/2062 | | | 16,668,903 | |
| | 3,158,333 | | | GNMA, 4.551%, 1/20/2065 | | | 3,534,352 | |
| | 20,073,007 | | | GNMA, 4.556%, 12/20/2061(c) | | | 21,482,192 | |
| | 6,765,549 | | | GNMA, 4.575%, 10/20/2064 | | | 7,566,732 | |
| | 5,346,942 | | | GNMA, 4.581%, 2/20/2065 | | | 5,981,522 | |
| | 4,433,037 | | | GNMA, 4.587%, 12/20/2063 | | | 4,902,810 | |
| | 2,742,564 | | | GNMA, 4.604%, 6/20/2062 | | | 2,962,410 | |
| | 7,229,115 | | | GNMA, 4.608%, 2/20/2065 | | | 8,122,352 | |
| | 2,132,487 | | | GNMA, 4.616%, with various maturities from 2061 to 2062(d) | | | 2,299,590 | |
| | 4,102,875 | | | GNMA, 4.619%, 3/20/2065 | | | 4,605,945 | |
| | 3,109,621 | | | GNMA, 4.627%, with various maturities from 2061 to 2064(d) | | | 3,381,805 | |
| | 2,378,917 | | | GNMA 4.631%, 10/20/2062 | | | 2,578,765 | |
| | 7,605,911 | | | GNMA, 4.650%, 1/20/2061 | | | 8,032,823 | |
| | 4,243,516 | | | GNMA, 4.653%, 1/20/2064 | | | 4,736,697 | |
| | 886,793 | | | GNMA, 4.668%, 5/20/2062 | | | 952,351 | |
| | 7,211,816 | | | GNMA, 4.673%, with various maturities from 2062 to 2064(d) | | | 8,076,427 | |
| | 8,752,662 | | | GNMA, 4.676%, 4/20/2062 | | | 9,444,788 | |
| | 960,047 | | | GNMA, 4.698%, 7/20/2061 | | | 1,018,102 | |
| | 677,172 | | | GNMA, 4.700%, 10/20/2061 | | | 720,879 | |
| | 4,123,395 | | | GNMA, 4.701%, 1/20/2064 | | | 4,641,582 | |
| | 614,108 | | | GNMA, 5.500%, 4/15/2038 | | | 689,628 | |
| | 128,085 | | | GNMA, 6.000%, with various maturities from 2029 to 2038(d) | | | 146,152 | |
| | 91,689 | | | GNMA, 6.500%, with various maturities from 2029 to 2032(d) | | | 106,358 | |
| | 95,608 | | | GNMA, 7.000%, with various maturities from 2025 to 2029(d) | | | 101,852 | |
| | 35,230 | | | GNMA, 7.500%, with various maturities from 2025 to 2030(d) | | | 39,950 | |
| | 32,842 | | | GNMA, 8.500%, with various maturities from 2017 to 2023(d) | | | 33,144 | |
| | 321 | | | GNMA, 9.000%, 11/15/2016 | | | 322 | |
| | | | | | | | |
| | | | | | | 883,896,340 | |
| | | | | | | | |
| | | | Non-Agency Commercial Mortgage-Backed Securities — 5.6% | | | | |
| | 3,421,441 | | | A10 Securitization LLC, Series 2014-1, Class A1, 1.720%, 4/15/2033, 144A | | | 3,414,447 | |
| | 1,670,000 | | | Banc of America Merrill Lynch Commercial Mortgage, Inc., Series 2007-2, Class A4, 5.784%, 4/10/2049(b) | | | 1,732,817 | |
| | 1,051,000 | | | Banc of America Merrill Lynch Commercial Mortgage, Inc., Series 2007-3, Class A5, 5.377%, 6/10/2049 | | | 1,112,855 | |
| | 1,691,407 | | | Barclays Commercial Mortgage Securities, Series 2015-SLP, Class A, 1.316%, 2/15/2028, 144A(b) | | | 1,670,733 | |
| | 97,120 | | | Bear Stearns Commercial Mortgage Securities, Series 2007-PW16, Class A2, 5.843%, 6/11/2040(b) | | | 97,424 | |
| | 913,045 | | | Citigroup Commercial Mortgage Trust, Series 2008-C7, Class A4, 6.349%, 12/10/2049(b) | | | 974,875 | |
See accompanying notes to financial statements.
29 |
Portfolio of Investments – as of September 30, 2015
Loomis Sayles Core Plus Bond Fund – (continued)
| | | | | | | | |
Principal Amount (‡) | | | Description | | Value (†) | |
| | | | | | | | |
| | | | Non-Agency Commercial Mortgage-Backed Securities — continued | | | | |
| $ | 26,539,975 | | | Commercial Mortgage Pass Through Certificates, Series 2007-C9, Class A4, 5.989%, 12/10/2049(b) | | $ | 28,137,310 | |
| | 2,435,000 | | | Commercial Mortgage Pass Through Certificates, Series 2014-KYO, Class A, 1.104%, 6/11/2027, 144A(b) | | | 2,416,772 | |
| | 8,236,000 | | | Commercial Mortgage Pass Through Certificates, Series 2014-KYO, Class D, 2.204%, 6/11/2027, 144A(b) | | | 8,146,030 | |
| | 1,025,000 | | | Commercial Mortgage Trust, Series 2010-C1, Class D,
6.188%, 7/10/2046, 144A(b) | | | 1,123,051 | |
| | 12,295,000 | | | Commercial Mortgage Trust, Series 2014-FL5, Class SV1,
2.048%, 10/15/2031, 144A(b)(g) | | | 12,286,799 | |
| | 1,885,000 | | | Commercial Mortgage Trust, Series 2014-KYO, Class B,
1.504%, 6/11/2027, 144A(b) | | | 1,864,998 | |
| | 13,225,000 | | | Commercial Mortgage Trust, Series 2014-SAVA, Class C,
2.607%, 6/15/2034, 144A(b) | | | 13,137,451 | |
| | 6,010,000 | | | Credit Suisse Mortgage Capital Certificates, Series 2007-C2, Class A3, 5.542%, 1/15/2049(b) | | | 6,278,316 | |
| | 2,428,511 | | | Credit Suisse Mortgage Capital Certificates, Series 2007-C4, Class A4, 6.147%, 9/15/2039(b) | | | 2,567,572 | |
| | 14,060,000 | | | Credit Suisse Mortgage Capital Certificates, Series 2007-C5, Class A4, 5.695%, 9/15/2040(b) | | | 14,813,897 | |
| | 5,790,000 | | | Credit Suisse Mortgage Capital Certificates, Series 2008-C1, Class A3, 6.270%, 2/15/2041(b) | | | 6,190,992 | |
| | 3,161,500 | | | DBUBS Mortgage Trust, Series 2011-LC1A, Class E,
5.735%, 11/10/2046, 144A(b) | | | 3,413,510 | |
| | 1,334,842 | | | GP Portfolio Trust, Series 2014-GPP, Class A, 1.157%, 2/15/2027, 144A(b) | | | 1,326,917 | |
| | 3,295,000 | | | GP Portfolio Trust, Series 2014-GPP, Class D, 2.957%, 2/15/2027, 144A(b) | | | 3,272,386 | |
| | 395,350 | | | Greenwich Capital Commercial Funding Corp., Series 2006-GG7, Class A4, 6.014%, 7/10/2038(b) | | | 399,969 | |
| | 24,032,149 | | | Greenwich Capital Commercial Funding Corp., Series 2007-GG9, Class A4, 5.444%, 3/10/2039 | | | 24,946,380 | |
| | 11,009,972 | | | Greenwich Capital Commercial Funding Corp., Series 2007-GG11, Class A4, 5.736%, 12/10/2049 | | | 11,558,368 | |
| | 26,847,047 | | | GS Mortgage Securities Corp. II, Series 2007-GG10, Class A4,
5.989%, 8/10/2045(b) | | | 28,314,667 | |
| | 1,844,319 | | | JPMorgan Chase Commercial Mortgage Securities Corp., Series 2007-CB19, Class A4, 5.884%, 2/12/2049(b) | | | 1,934,283 | |
| | 19,317,206 | | | JPMorgan Chase Commercial Mortgage Securities Trust, Series 2006-LDP9, Class A3, 5.336%, 5/15/2047 | | | 19,962,265 | |
| | 2,275,209 | | | JPMorgan Chase Commercial Mortgage Securities Trust, Series 2007-C1, Class A4, 5.716%, 2/15/2051 | | | 2,405,141 | |
| | 6,492,000 | | | JPMorgan Chase Commercial Mortgage Securities Trust, Series 2007-LD11, Class A4, 5.961%, 6/15/2049(b) | | | 6,733,782 | |
| | 372,429 | | | JPMorgan Chase Commercial Mortgage Securities Trust, Series 2007-LDPX, Class A3, 5.420%, 1/15/2049 | | | 386,550 | |
| | 6,355,000 | | | JPMorgan Chase Commercial Mortgage Securities Trust, Series 2014-FL5, Class A, 1.187%, 7/15/2031, 144A(b) | | | 6,310,858 | |
| | 4,110,000 | | | JPMorgan Chase Commercial Mortgage Securities Trust, Series 2014-FL5, Class B, 1.557%, 7/15/2031, 144A(b) | | | 4,110,814 | |
See accompanying notes to financial statements.
| 30
Portfolio of Investments – as of September 30, 2015
Loomis Sayles Core Plus Bond Fund – (continued)
| | | | | | | | |
Principal Amount (‡) | | | Description | | Value (†) | |
| | | | | | | | |
| | | | Non-Agency Commercial Mortgage-Backed Securities — continued | | | | |
| $ | 2,205,000 | | | JPMorgan Chase Commercial Mortgage Securities Trust, Series 2014-FL5, Class C, 2.307%, 7/15/2031, 144A(b) | | $ | 2,193,955 | |
| | 11,955,000 | | | JPMorgan Chase Commercial Mortgage Securities Corp., Series 2014-PHH, Class A, 1.407%, 8/15/2027, 144A(b)(c) | | | 11,908,172 | |
| | 7,184,500 | | | LB-UBS Commercial Mortgage Trust, Series 2007-C2, Class A3,
5.430%, 2/15/2040 | | | 7,485,890 | |
| | 5,957,513 | | | Merrill Lynch/Countrywide Commercial Mortgage Trust, Series 2007-5,
Class A4, 5.378%, 8/12/2048 | | | 6,178,942 | |
| | 14,150,000 | | | Merrill Lynch/Countrywide Commercial Mortgage Trust, Series 2007-6,
Class A4, 5.485%, 3/12/2051(b) | | | 14,771,525 | |
| | 9,795,000 | | | Merrill Lynch/Countrywide Commercial Mortgage Trust, Series 2007-8,
Class A3, 6.073%, 8/12/2049(b) | | | 10,389,978 | |
| | 5,000,000 | | | Merrill Lynch/Countrywide Commercial Mortgage Trust, Series 2007-9,
Class A4, 5.700%, 9/12/2049 | | | 5,290,065 | |
| | 90,323 | | | Morgan Stanley Capital I, Series 2007-HQ12, Class A5, 5.902%, 4/12/2049(b) | | | 90,178 | |
| | 1,756,346 | | | Morgan Stanley Capital I, Series 2007-HQ13, Class A3, 5.569%, 12/15/2044 | | | 1,852,272 | |
| | 4,620,000 | | | Morgan Stanley Capital I, Series 2007-IQ14, Class A4, 5.692%, 4/15/2049(b) | | | 4,820,004 | |
| | 302,314 | | | Morgan Stanley Capital I, Series 2007-T27, Class A4, 5.821%, 6/11/2042(b) | | | 321,641 | |
| | 1,043,813 | | | Morgan Stanley Capital I, Series 2008-T29, Class A4, 6.461%, 1/11/2043(b) | | | 1,132,382 | |
| | 6,399,000 | | | Morgan Stanley Re-REMIC Trust, Series 2010-GG10, Class A4B, 5.989%, 8/15/2045, 144A(b) | | | 6,736,611 | |
| | 10,200,000 | | | Motel 6 Trust, Series 2015-MTL6, Class B, 3.298%, 2/05/2030, 144A | | | 10,259,272 | |
| | 11,435,000 | | | Motel 6 Trust, Series 2015-MTL6, Class C, 3.644%, 2/05/2030, 144A | | | 11,450,392 | |
| | 7,270,000 | | | SCG Trust, Series 2013-SRP1, Class B, 2.707%, 11/15/2026, 144A(b) | | | 7,268,422 | |
| | 865,313 | | | Wachovia Bank Commercial Mortgage Trust, Series 2006-C28, Class A4, 5.572%, 10/15/2048 | | | 886,412 | |
| | 9,325,000 | | | Wachovia Bank Commercial Mortgage Trust, Series 2007-C30, Class A5, 5.342%, 12/15/2043 | | | 9,647,692 | |
| | 13,839,000 | | | Wachovia Bank Commercial Mortgage Trust, Series 2007-C31, Class A5, 5.500%, 4/15/2047 | | | 14,573,546 | |
| | 2,445,277 | | | Wachovia Bank Commercial Mortgage Trust, Series 2007-C34, Class A3, 5.678%, 5/15/2046 | | | 2,581,885 | |
| | 9,750,000 | | | Wells Fargo Commercial Mortgage Trust, Series 2010-C1, Class D, 5.799%, 11/15/2043, 144A(b) | | | 10,421,268 | |
| | 6,087,000 | | | WFRBS Commercial Mortgage Trust, Series 2011-C4, Class D, 5.433%, 6/15/2044, 144A(b) | | | 6,432,036 | |
| | | | | | | | |
| | | | | | | 367,734,769 | |
| | | | | | | | |
| | | | Oil Field Services — 1.2% | | | | |
| | 9,827,000 | | | Ensco PLC, 4.500%, 10/01/2024 | | | 7,259,549 | |
| | 7,605,000 | | | Ensco PLC, 5.750%, 10/01/2044 | | | 5,261,070 | |
| | 2,535,000 | | | Nabors Industries, Inc., 4.625%, 9/15/2021 | | | 2,301,063 | |
| | 3,557,000 | | | Nabors Industries, Inc., 5.000%, 9/15/2020 | | | 3,454,409 | |
| | 24,480,000 | | | Nabors Industries, Inc., 5.100%, 9/15/2023 | | | 21,602,621 | |
| | 17,580,000 | | | Paragon Offshore PLC, 6.750%, 7/15/2022, 144A | | | 2,285,400 | |
| | 14,145,000 | | | Paragon Offshore PLC, 7.250%, 8/15/2024, 144A | | | 2,210,156 | |
| | 8,820,000 | | | Rowan Cos., Inc., 4.750%, 1/15/2024 | | | 6,460,976 | |
| | 14,645,000 | | | Rowan Cos., Inc., 4.875%, 6/01/2022 | | | 10,914,538 | |
See accompanying notes to financial statements.
31 |
Portfolio of Investments – as of September 30, 2015
Loomis Sayles Core Plus Bond Fund – (continued)
| | | | | | | | |
Principal Amount (‡) | | | Description | | Value (†) | |
| | | | | | | | |
| | | | Oil Field Services — continued | | | | |
| $ | 1,330,000 | | | Rowan Cos., Inc., 7.875%, 8/01/2019 | | $ | 1,319,070 | |
| | 2,295,000 | | | Sidewinder Drilling, Inc., 9.750%, 11/15/2019, 144A(g)(h) | | | 940,950 | |
| | 7,280,000 | | | Transocean, Inc., 4.300%, 10/15/2022 | | | 4,495,400 | |
| | 12,100,000 | | | Transocean, Inc., 6.500%, 11/15/2020 | | | 9,256,500 | |
| | 575,000 | | | Transocean, Inc., 6.875%, 12/15/2021 | | | 428,904 | |
| | | | | | | | |
| | | | | | | 78,190,606 | |
| | | | | | | | |
| | | | Packaging — 0.3% | | | | |
| | 5,345,000 | | | Sealed Air Corp., 4.875%, 12/01/2022, 144A | | | 5,284,869 | |
| | 5,275,000 | | | Sealed Air Corp., 5.250%, 4/01/2023, 144A | | | 5,288,187 | |
| | 7,925,000 | | | Sealed Air Corp., 6.500%, 12/01/2020, 144A | | | 8,677,875 | |
| | | | | | | | |
| | | | | | | 19,250,931 | |
| | | | | | | | |
| | | | Paper — 0.5% | | | | |
| | 6,005,000 | | | Celulosa Arauco y Constitucion S.A., 4.500%, 8/01/2024 | | | 5,899,540 | |
| | 6,920,000 | | | Celulosa Arauco y Constitucion S.A., 4.750%, 1/11/2022 | | | 7,029,260 | |
| | 8,610,000 | | | Celulosa Arauco y Constitucion S.A., 5.000%, 1/21/2021 | | | 9,014,662 | |
| | 9,670,000 | | | Rock-Tenn Co., 4.000%, 3/01/2023 | | | 9,923,141 | |
| | 2,060,000 | | | Rock-Tenn Co., 4.900%, 3/01/2022 | | | 2,235,300 | |
| | | | | | | | |
| | | | | | | 34,101,903 | |
| | | | | | | | |
| | | | Pharmaceuticals — 2.0% | | | | |
| | 13,575,000 | | | Actavis Funding SCS, 4.550%, 3/15/2035 | | | 12,489,828 | |
| | 2,240,000 | | | Actavis Funding SCS, 4.750%, 3/15/2045 | | | 2,033,817 | |
| | 15,330,000 | | | Actavis Funding SCS, 4.850%, 6/15/2044 | | | 13,972,176 | |
| | 10,290,000 | | | Biogen, Inc., 2.900%, 9/15/2020 | | | 10,394,135 | |
| | 17,165,000 | | | Celgene Corp., 5.000%, 8/15/2045 | | | 17,025,929 | |
| | 13,705,000 | | | Mallinckrodt International Finance S.A./Mallinckrodt CB LLC, 4.875%, 4/15/2020, 144A | | | 13,088,275 | |
| | 10,705,000 | | | Quintiles Transnational Corp., 4.875%, 5/15/2023, 144A | | | 10,597,950 | |
| | 21,185,000 | | | Valeant Pharmaceuticals International, 6.375%, 10/15/2020, 144A | | | 21,065,835 | |
| | 760,000 | | | Valeant Pharmaceuticals International, 6.750%, 8/15/2021, 144A | | | 767,600 | |
| | 10,755,000 | | | Valeant Pharmaceuticals International, Inc., 5.500%, 3/01/2023, 144A | | | 10,217,250 | |
| | 16,615,000 | | | Valeant Pharmaceuticals International, Inc., 5.625%, 12/01/2021, 144A | | | 15,784,250 | |
| | 8,255,000 | | | VRX Escrow Corp., 5.375%, 3/15/2020, 144A | | | 7,997,031 | |
| | | | | | | | |
| | | | | | | 135,434,076 | |
| | | | | | | | |
| | | | Property & Casualty Insurance — 0.1% | | | | |
| | 3,285,000 | | | Willis Group Holdings PLC, 5.750%, 3/15/2021 | | | 3,674,601 | |
| | | | | | | | |
| | | | Refining — 0.8% | | | | |
| | 15,900,000 | | | Phillips 66, 5.875%, 5/01/2042 | | | 17,209,858 | |
| | 36,936,000 | | | Thai Oil PCL, 4.875%, 1/23/2043, 144A | | | 34,369,096 | |
| | | | | | | | |
| | | | | | | 51,578,954 | |
| | | | | | | | |
| | | | Retailers — 1.7% | | | | |
| | 12,212,000 | | | Asbury Automotive Group, Inc., 6.000%, 12/15/2024 | | | 12,639,420 | |
| | 4,565,000 | | | AutoNation, Inc., 3.350%, 1/15/2021 | | | 4,614,074 | |
| | 17,655,000 | | | CVS Health Corp., 3.875%, 7/20/2025 | | | 18,198,915 | |
| | 11,120,000 | | | CVS Health Corp., 5.125%, 7/20/2045 | | | 11,953,477 | |
See accompanying notes to financial statements.
| 32
Portfolio of Investments – as of September 30, 2015
Loomis Sayles Core Plus Bond Fund – (continued)
| | | | | | | | |
Principal Amount (‡) | | | Description | | Value (†) | |
| | | | | | | | |
| | | | Retailers — continued | | | | |
| $ | 21,794,000 | | | GameStop Corp., 5.500%, 10/01/2019, 144A | | $ | 22,454,358 | |
| | 25,896,000 | | | Lotte Shopping Co. Ltd., 3.375%, 5/09/2017, 144A(c) | | | 26,476,019 | |
| | 10,285,000 | | | SACI Falabella, 3.750%, 4/30/2023, 144A | | | 9,909,166 | |
| | 7,830,000 | | | SACI Falabella, 4.375%, 1/27/2025, 144A | | | 7,727,317 | |
| | 1,125,000 | | | Wolverine World Wide, Inc., 6.125%, 10/15/2020 | | | 1,168,594 | |
| | | | | | | | |
| | | | | | | 115,141,340 | |
| | | | | | | | |
| | | | Sovereigns — 1.4% | | | | |
| | 3,475,000 | | | Colombia Government International Bond, 4.000%, 2/26/2024 | | | 3,367,275 | |
| | 50,475,000 | | | Colombia Government International Bond, 4.500%, 1/28/2026 | | | 49,086,937 | |
| | 26,820,000 | | | Indonesia Government International Bond, 5.250%, 1/17/2042, 144A | | | 24,021,306 | |
| | 14,688,000 | | | Mexico Government International Bond, 4.000%, 3/15/2115, (EUR) | | | 13,519,686 | |
| | 3,686,000 | | | Mexico Government International Bond, Series A, MTN, 6.050%, 1/11/2040 | | | 4,036,170 | |
| | | | | | | | |
| | | | | | | 94,031,374 | |
| | | | | | | | |
| | | | Supranational — 0.1% | | | | |
| | 55,370,000 | | | International Bank for Reconstruction & Development,
2.625%, 11/07/2016, (MXN) | | | 3,248,818 | |
| | 13,630,000 | | | International Bank for Reconstruction & Development,
4.000%, 8/16/2018, (MXN) | | | 807,928 | |
| | | | | | | | |
| | | | | | | 4,056,746 | |
| | | | | | | | |
| | | | Technology — 3.1% | | | | |
| | 3,145,000 | | | Dun & Bradstreet Corp. (The), 3.250%, 12/01/2017 | | | 3,193,405 | |
| | 4,046,000 | | | Equifax, Inc., 7.000%, 7/01/2037 | | | 4,717,935 | |
| | 12,275,000 | | | Flextronics International Ltd., 4.750%, 6/15/2025, 144A | | | 11,891,038 | |
| | 31,310,000 | | | Hewlett Packard Enterprise Co., 3.600%, 10/15/2020, 144A(e) | | | 31,301,233 | |
| | 17,460,000 | | | Hewlett Packard Enterprise Co., 6.200%, 10/15/2035, 144A(e) | | | 17,449,873 | |
| | 17,530,000 | | | Hewlett-Packard Co., 2.750%, 1/14/2019 | | | 17,805,694 | |
| | 3,730,000 | | | KLA-Tencor Corp., 3.375%, 11/01/2019 | | | 3,826,353 | |
| | 37,440,000 | | | Micron Technology, Inc., 5.250%, 8/01/2023, 144A | | | 34,437,312 | |
| | 1,165,000 | | | Micron Technology, Inc., 5.250%, 1/15/2024, 144A | | | 1,068,888 | |
| | 11,390,000 | | | Molex Electronic Technologies LLC, 2.878%, 4/15/2020, 144A | | | 11,265,416 | |
| | 7,515,000 | | | Molex Electronic Technologies LLC, 3.900%, 4/15/2025, 144A | | | 7,323,323 | |
| | 69,000 | | | Motorola Solutions, Inc., 6.625%, 11/15/2037 | | | 72,224 | |
| | 340,000 | | | Motorola Solutions, Inc., 7.500%, 5/15/2025 | | | 391,326 | |
| | 1,995,000 | | | Tencent Holdings Ltd., 2.000%, 5/02/2017, 144A | | | 1,993,651 | |
| | 3,515,000 | | | Tencent Holdings Ltd., 2.875%, 2/11/2020, 144A | | | 3,488,641 | |
| | 7,029,000 | | | Tencent Holdings Ltd., 3.375%, 3/05/2018, 144A | | | 7,195,763 | |
| | 49,305,000 | | | Tencent Holdings Ltd., 3.375%, 5/02/2019, 144A | | | 50,127,950 | |
| | | | | | | | |
| | | | | | | 207,550,025 | |
| | | | | | | | |
| | | | Tobacco — 0.6% | | | | |
| | 12,555,000 | | | Reynolds American, Inc., 4.750%, 11/01/2042 | | | 12,047,025 | |
| | 4,365,000 | | | Reynolds American, Inc., 6.150%, 9/15/2043 | | | 4,956,763 | |
| | 18,555,000 | | | Reynolds American, Inc., 7.250%, 6/15/2037 | | | 22,956,320 | |
| | | | | | | | |
| | | | | | | 39,960,108 | |
| | | | | | | | |
See accompanying notes to financial statements.
33 |
Portfolio of Investments – as of September 30, 2015
Loomis Sayles Core Plus Bond Fund – (continued)
| | | | | | | | |
Principal Amount (‡) | | | Description | | Value (†) | |
| | | | | | | | |
| | | | Treasuries — 15.4% | | | | |
| | 25,422,933(††) | | | Mexican Fixed Rate Bonds, Series M, 6.500%, 6/10/2021, (MXN)(c) | | $ | 157,476,038 | |
| | 747,000,000 | | | Philippine Government International Bond, 3.900%, 11/26/2022, (PHP) | | | 15,500,969 | |
| | 222,000,000 | | | Philippine Government International Bond, 4.950%, 1/15/2021, (PHP) | | | 4,832,798 | |
| | 989,000,000 | | | Philippine Government International Bond, 6.250%, 1/14/2036, (PHP) | | | 23,222,668 | |
| | 63,475,000 | | | U.S. Treasury Bond, 2.500%, 2/15/2045 | | | 58,435,022 | |
| | 16,385,000 | | | U.S. Treasury Bond, 3.000%, 5/15/2045 | | | 16,767,737 | |
| | 455,000 | | | U.S. Treasury Bond, 3.375%, 5/15/2044 | | | 499,374 | |
| | 1,050,000 | | | U.S. Treasury Bond, 3.625%, 2/15/2044 | | | 1,207,473 | |
| | 5,870,000 | | | U.S. Treasury Bond, 3.750%, 11/15/2043 | | | 6,911,162 | |
| | 120,577,648 | | | U.S. Treasury Inflation Indexed Bond, 0.750%, 2/15/2042(f)(i) | | | 105,527,387 | |
| | 9,734,379 | | | U.S. Treasury Inflation Indexed Bond, 0.750%, 2/15/2045(i) | | | 8,441,663 | |
| | 100,669,440 | | | U.S. Treasury Inflation Indexed Bond, 1.375%, 2/15/2044(i) | | | 102,141,429 | |
| | 76,422,018 | | | U.S. Treasury Inflation Indexed Note, 0.125%, 7/15/2024(i) | | | 72,915,394 | |
| | 31,734,362 | | | U.S. Treasury Inflation Indexed Note, 0.250%, 1/15/2025(i) | | | 30,416,656 | |
| | 69,663,589 | | | U.S. Treasury Inflation Indexed Note, 0.625%, 1/15/2024(f)(i) | | | 69,327,044 | |
| | 19,880,000 | | | U.S. Treasury Note, 0.375%, 3/15/2016 | | | 19,899,940 | |
| | 30,000,000 | | | U.S. Treasury Note, 0.375%, 5/31/2016 | | | 30,024,600 | |
| | 71,435,000 | | | U.S. Treasury Note, 0.500%, 11/30/2016 | | | 71,487,076 | |
| | 27,800,000 | | | U.S. Treasury Note, 0.500%, 1/31/2017 | | | 27,810,870 | |
| | 107,000,000 | | | U.S. Treasury Note, 0.625%, 12/31/2016(c) | | | 107,210,362 | |
| | 35,000,000 | | | U.S. Treasury Note, 0.625%, 8/31/2017 | | | 34,998,635 | |
| | 35,320,000 | | | U.S. Treasury Note, 0.875%, 11/30/2016 | | | 35,498,896 | |
| | 17,260,000 | | | U.S. Treasury Note, 2.125%, 5/15/2025 | | | 17,363,836 | |
| | | | | | | | |
| | | | | | | 1,017,917,029 | |
| | | | | | | | |
| | | | Wireless — 1.6% | | | | |
| | 1,475,000 | | | American Tower Corp., 4.700%, 3/15/2022 | | | 1,550,647 | |
| | 20,400,000 | | | Bharti Airtel International BV, 5.125%, 3/11/2023, 144A | | | 21,511,392 | |
| | 21,725,000 | | | Bharti Airtel Ltd., 4.375%, 6/10/2025, 144A | | | 21,665,539 | |
| | 10,000,000 | | | MTN (Mauritius) Investments Ltd., 4.755%, 11/11/2024, 144A | | | 9,956,200 | |
| | 11,460,000 | | | SK Telecom Co. Ltd., 2.125%, 5/01/2018, 144A | | | 11,508,716 | |
| | 3,165,000 | | | SK Telecom Co. Ltd., 6.625%, 7/20/2027, 144A | | | 4,096,776 | |
| | 29,560,000 | | | SoftBank Group Corp., 4.500%, 4/15/2020, 144A | | | 28,625,904 | |
| | 11,980,000 | | | Sprint Capital Corp., 6.875%, 11/15/2028 | | | 8,595,650 | |
| | | | | | | | |
| | | | | | | 107,510,824 | |
| | | | | | | | |
| | | | Wirelines — 3.9% | | | | |
| | 19,990,000 | | | AT&T, Inc., 4.750%, 5/15/2046 | | | 18,316,777 | |
| | 1,717,000 | | | AT&T, Inc., 5.550%, 8/15/2041 | | | 1,742,339 | |
| | 10,880,000 | | | CenturyLink, Inc., 5.625%, 4/01/2020 | | | 10,125,146 | |
| | 1,885,000 | | | CenturyLink, Inc., Series T, 5.800%, 3/15/2022 | | | 1,611,675 | |
| | 7,175,000 | | | Colombia Telecomunicaciones S.A. E.S.P., 5.375%, 9/27/2022, 144A | | | 6,346,288 | |
| | 46,943,000 | | | Embarq Corp., 7.995%, 6/01/2036 | | | 48,424,521 | |
| | 12,050,000 | | | Frontier Communications Corp., 6.875%, 1/15/2025 | | | 9,519,500 | |
| | 9,885,000 | | | Frontier Communications Corp., 7.125%, 1/15/2023 | | | 8,124,482 | |
| | 1,575,000 | | | Frontier Communications Corp., 7.875%, 1/15/2027 | | | 1,291,500 | |
| | 5,820,000 | | | Frontier Communications Corp., 8.500%, 4/15/2020 | | | 5,659,950 | |
| | 13,565,000 | | | Frontier Communications Corp., 8.750%, 4/15/2022 | | | 12,080,039 | |
See accompanying notes to financial statements.
| 34
Portfolio of Investments – as of September 30, 2015
Loomis Sayles Core Plus Bond Fund – (continued)
| | | | | | | | |
Principal Amount (‡) | | | Description | | Value (†) | |
| | | | | | | | |
| | | | Wirelines — continued | | | | |
| $ | 415,000 | | | Frontier Communications Corp., 9.000%, 8/15/2031 | | $ | 342,375 | |
| | 9,185,000 | | | Level 3 Financing, Inc., 5.625%, 2/01/2023 | | | 9,024,262 | |
| | 5,160,000 | | | Oi S.A., 5.750%, 2/10/2022, 144A | | | 2,399,400 | |
| | 1,975,000 | | | Qwest Corp., 6.750%, 12/01/2021 | | | 2,089,797 | |
| | 5,000,000 | | | Telefonica Celular del Paraguay S.A., 6.750%, 12/13/2022, 144A | | | 4,825,000 | |
| | 4,029,000 | | | Telefonica Emisiones SAU, 5.134%, 4/27/2020 | | | 4,439,998 | |
| | 21,226,000 | | | Telefonica Emisiones SAU, 5.462%, 2/16/2021 | | | 23,717,126 | |
| | 12,004,000 | | | Telemar Norte Leste S.A., 5.500%, 10/23/2020, 144A | | | 6,437,145 | |
| | 10,803,000 | | | Verizon Communications, Inc., 2.625%, 2/21/2020 | | | 10,835,052 | |
| | 26,115,000 | | | Verizon Communications, Inc., 4.400%, 11/01/2034(c) | | | 24,298,911 | |
| | 25,610,000 | | | Verizon Communications, Inc., 5.050%, 3/15/2034 | | | 25,550,841 | |
| | 27,760,000 | | | Windstream Services LLC, 7.500%, 4/01/2023 | | | 20,542,400 | |
| | | | | | | | |
| | | | | | | 257,744,524 | |
| | | | | | | | |
| | | | Total Bonds and Notes (Identified Cost $6,802,671,007) | | | 6,425,175,237 | |
| | | | | | | | |
| | | | | | | | |
| | Senior Loans — 1.2% | | | | |
| | | | Automotive — 0.0% | | | | |
| | 275,215 | | | KAR Auction Services, Inc., Term Loan B2, 3.500%, 3/11/2021(b) | | | 274,642 | |
| | 1,487,781 | | | Visteon Corp., Delayed Draw Term Loan B, 3.500%, 4/09/2021(b) | | | 1,477,560 | |
| | | | | | | | |
| | | | | | | 1,752,202 | |
| | | | | | | | |
| | | | Cable Satellite — 0.1% | | | | |
| | 3,594,268 | | | Charter Communications Operating LLC, Term Loan E, 3.000%, 7/01/2020(b) | | | 3,547,111 | |
| | | | | | | | |
| | | | Diversified Manufacturing — 0.0% | | | | |
| | 2,972,646 | | | Ameriforge Group, Inc., 1st Lien Term Loan, 5.000%, 12/19/2019(b) | | | 2,028,831 | |
| | | | | | | | |
| | | | Electric — 0.1% | | | | |
| | 5,360,032 | | | NRG Energy, Inc., Refi Term Loan B, 2.750%, 7/02/2018(b) | | | 5,235,411 | |
| | | | | | | | |
| | | | Food & Beverage — 0.1% | | | | |
| | 11,623,000 | | | Aramark Services, Inc., USD Term Loan F, 3.250%, 2/24/2021(b) | | | 11,572,207 | |
| | | | | | | | |
| | | | Industrial Other — 0.1% | | | | |
| | 4,470,456 | | | Allison Transmission, Inc., New Term Loan B3, 3.500%, 8/23/2019(b) | | | 4,464,376 | |
| | | | | | | | |
| | | | Lodging — 0.2% | | | | |
| | 11,894,105 | | | Four Seasons Holdings, Inc., New 1st Lien Term Loan, 3.500%, 6/27/2020(b) | | | 11,801,212 | |
| | | | | | | | |
| | | | Midstream — 0.2% | | | | |
| | 6,263,000 | | | Energy Transfer Equity LP, New Term Loan, 3.250%, 12/02/2019(b) | | | 6,032,584 | |
| | 7,146,463 | | | Energy Transfer Equity LP, 2015 Term Loan, 4.000%, 12/02/2019(b) | | | 7,021,400 | |
| | | | | | | | |
| | | | | | | 13,053,984 | |
| | | | | | | | |
| | | | Pharmaceuticals — 0.1% | | | | |
| | 5,266,200 | | | Valeant Pharmaceuticals International, Term Loan B F1, 4.000%, 4/01/2022(b) | | | 5,206,323 | |
| | | | | | | | |
| | | | Retailers — 0.1% | | | | |
| | 11,389,614 | | | Staples, Inc., Term Loan B, 4/07/2021(j) | | | 11,322,757 | |
| | | | | | | | |
See accompanying notes to financial statements.
35 |
Portfolio of Investments – as of September 30, 2015
Loomis Sayles Core Plus Bond Fund – (continued)
| | | | | | | | |
Principal Amount (‡) | | | Description | | Value (†) | |
| | | | | | | | |
| | | | Wirelines — 0.2% | | | | |
| $ | 11,729,000 | | | Level 3 Financing, Inc., 2015 Term Loan B2, 3.500%, 5/31/2022(b) | | $ | 11,621,445 | |
| | | | | | | | |
| | | | Total Senior Loans (Identified Cost $83,109,328) | | | 81,605,859 | |
| | | | | | | | |
| | | | | | | | |
| Shares | | | | | | |
| | Preferred Stocks — 0.3% | | | | |
| | | | Banking — 0.0% | | | | |
| | 28,431 | | | Ally Financial, Inc., Series A,
(fixed rate to 5/15/2016, variable rate thereafter), 8.500% | | | 737,216 | |
| | 266 | | | Ally Financial, Inc., Series G, 7.000%, 144A | | | 266,839 | |
| | | | | | | | |
| | | | | | | 1,004,055 | |
| | | | | | | | |
| | | | Cable Satellite — 0.3% | | | | |
| | 18,192,000 | | | NBCUniversal Enterprise, Inc., 5.250%, 144A(c) | | | 19,215,300 | |
| | | | | | | | |
| | | | Finance Companies — 0.0% | | | | |
| | 5,510 | | | SLM Corp., Series A, 6.970% | | | 243,542 | |
| | | | | | | | |
| | | | Total Preferred Stocks
(Identified Cost $19,854,851) | | | 20,462,897 | |
| | | | | | | | |
| | | | | | | | |
Principal Amount (‡) | | | | | | |
| | Short-Term Investments — 7.3% | | | | |
| $ | 152,743 | | | Repurchase Agreement with State Street Bank and Trust Company, dated 9/30/2015 at 0.000% to be repurchased at $152,743 on 10/01/2015 collateralized by $153,100 U.S. Treasury Note, 1.500% due 8/31/2018 valued at $155,885 including accrued interest (Note 2 of Notes to Financial Statements) | | | 152,743 | |
| | 473,669,019 | | | Tri-Party Repurchase Agreement with Fixed Income Clearing Corporation, dated 9/30/2015 at 0.010% to be repurchased at $473,669,151 on 10/01/2015 collateralized by $58,670,000 Federal Home Loan Mortgage Corp., 2.375% due 1/13/2022 valued at $60,758,065; $426,360,000 U.S. Treasury Note, 1.500% due 1/31/2022 valued at $422,096,400; $295,000 U.S. Treasury Note, 0.625% due 9/30/2017 valued at $294,631 including accrued interest (Note 2 of Notes to Financial Statements) | | | 473,669,019 | |
| | 8,940,000 | | | U.S. Treasury Bills, 0.228%, 2/04/2016(k) | | | 8,939,410 | |
| | | | | | | | |
| | | | Total Short-Term Investments
(Identified Cost $482,754,697) | | | 482,761,172 | |
| | | | | | | | |
| | | | | | | | |
| | | | Total Investments — 106.0%
(Identified Cost $7,388,389,883)(a) | | | 7,010,005,165 | |
| | | | Other assets less liabilities — (6.0)% | | | (396,488,402 | ) |
| | | | | | | | |
| | | | Net Assets — 100.0% | | $ | 6,613,516,763 | |
| | | | | | | | |
| | | | | | | | |
See accompanying notes to financial statements.
| 36
Portfolio of Investments – as of September 30, 2015
Loomis Sayles Core Plus Bond Fund – (continued)
| | | | | | | | |
| | (‡) | | | Principal Amount stated in U.S. dollars unless otherwise noted. | | | | |
| | (†) | | | See Note 2 of Notes to Financial Statements. | | | | |
| | (††) | | | Amount shown represents units. One unit represents a principal amount of 100. | |
| | (a) | | | Federal Tax Information: | | | | |
| | | | At September 30, 2015, the net unrealized depreciation on investments based on a cost of $7,409,615,674 for federal income tax purposes was as follows: | |
| | | | Aggregate gross unrealized appreciation for all investments in which there is an excess of value over tax cost | | $ | 22,733,335 | |
| | | | Aggregate gross unrealized depreciation for all investments in which there is an excess of tax cost over value | | | (422,343,844 | ) |
| | | | | | | | |
| | | | Net unrealized depreciation | | $ | (399,610,509 | ) |
| | | | | | | | |
| | | | | | | | |
| | (b) | | | Variable rate security. Rate as of September 30, 2015 is disclosed. | | | | |
| | (c) | | | All of this security has been designated to cover the Fund’s obligations under open forward foreign currency contracts or TBA transactions. | |
| | (d) | | | The Fund’s investment in mortgage related securities of Federal Home Loan Mortgage Corporation, Federal National Mortgage Association and Government National Mortgage Association are interests in separate pools of mortgages. All separate investments in securities of each issuer which have the same coupon rate have been aggregated for the purpose of presentation in the Portfolio of Investments. | |
| | (e) | | | When-issued/delayed delivery. See Note 2 of Notes to Financial Statements. | |
| | (f) | | | A portion of this security has been designated to cover the Fund’s obligations under open forward foreign currency contracts or TBA transactions. | |
| | (g) | | | Illiquid security. At September 30, 2015, the value of these securities amounted to $13,227,749 or 0.2% of net assets. Illiquid securities are deemed to be fair valued pursuant to the Fund’s pricing policies and procedures. See Note 2 of Notes to Financial Statements. | |
| | (h) | | | Fair valued by the Fund’s adviser. At September 30, 2015, the value of this security amounted to $940,950 or less than 0.1% of net assets. See Note 2 of Notes to Financial Statements. | |
| | (i) | | | Treasury Inflation Protected Security (TIPS). | |
| | (j) | | | Position is unsettled. Contract rate was not determined at September 30, 2015 and does not take effect until settlement date. Maturity date is not finalized until settlement date. | |
| | (k) | | | Interest rate represents discount rate at time of purchase; not a coupon rate. | |
| | | | | | | | |
| | 144A | | | All or a portion of these securities are exempt from registration under Rule 144A of the Securities Act of 1933. These securities may be resold in transactions exempt from registration, normally to qualified institutional buyers. At September 30, 2015, the value of Rule 144A holdings amounted to $1,804,716,300 or 27.3% of net assets. | |
| | ABS | | | Asset-Backed Securities | | | | |
| | ARMs | | | Adjustable Rate Mortgages | | | | |
| | EMTN | | | Euro Medium Term Note | | | | |
| | FHLMC | | | Federal Home Loan Mortgage Corp. | | | | |
| | FNMA | | | Federal National Mortgage Association | | | | |
| | GMTN | | | Global Medium Term Note | | | | |
| | GNMA | | | Government National Mortgage Association | | | | |
| | MTN | | | Medium Term Note | | | | |
| | REMIC | | | Real Estate Mortgage Investment Conduit | | | | |
| | TBA | | | To Be Announced | | | | |
| | | | | | | | |
| | EUR | | | Euro | | | | |
| | MXN | | | Mexican Peso | | | | |
| | PHP | | | Philippine Peso | | | | |
| | USD | | | U.S. Dollar | | | | |
See accompanying notes to financial statements.
37 |
Portfolio of Investments – as of September 30, 2015
Loomis Sayles Core Plus Bond Fund – (continued)
At September 30, 2015, the Fund had the following open forward foreign currency contracts:
| | | | | | | | | | | | | | | | | | |
Contract to Buy/Sell1 | | Delivery
Date | | | Currency | | Units of
Currency | | | Notional
Value | | | Unrealized
Appreciation
(Depreciation) | |
| Sell | | | 10/14/2015 | | | Euro | | | 12,644,000 | | | $ | 14,130,871 | | | $ | (3,135 | ) |
| | | | | | | | | | | | | | | | | | |
1 Counterparty is Bank of America, N.A.
Industry Summary at September 30, 2015
| | | | |
Treasuries | | | 15.4 | % |
Mortgage Related | | | 13.4 | |
Banking | | | 8.8 | |
Government Owned - No Guarantee | | | 5.7 | |
Non-Agency Commercial Mortgage-Backed Securities | | | 5.6 | |
Finance Companies | | | 4.4 | |
Wirelines | | | 4.1 | |
ABS Car Loan | | | 3.2 | |
Technology | | | 3.1 | |
Automotive | | | 2.6 | |
Cable Satellite | | | 2.6 | |
Midstream | | | 2.2 | |
Metals & Mining | | | 2.1 | |
Pharmaceuticals | | | 2.1 | |
Electric | | | 2.1 | |
Other Investments, less than 2% each | | | 21.3 | |
Short-Term Investments | | | 7.3 | |
| | | | |
Total Investments | | | 106.0 | |
Other assets less liabilities (including forward foreign currency contracts) | | | (6.0 | ) |
| | | | |
Net Assets | | | 100.0 | % |
| | | | |
See accompanying notes to financial statements.
| 38
Portfolio of Investments – as of September 30, 2015
Loomis Sayles High Income Fund
| | | | | | | | |
Principal Amount (‡) | | | Description | | Value (†) | |
| | Bonds and Notes — 90.5% of Net Assets | | | | |
| | Non-Convertible Bonds — 85.3% | | | | |
| | | | ABS Home Equity — 3.1% | | | | |
| $ | 300,000 | | | American Homes 4 Rent, Series 2014-SFR1, Class E,
2.750%, 6/17/2031, 144A(b) | | $ | 288,108 | |
| | 228,268 | | | Banc of America Alternative Loan Trust, Series 2003-10, Class 3A1,
5.500%, 12/25/2033 | | | 233,498 | |
| | 152,072 | | | Banc of America Alternative Loan Trust, Series 2003-8, Class 1CB1,
5.500%, 10/25/2033 | | | 159,102 | |
| | 126,824 | | | Banc of America Funding Corp., Series 2007-4, Class 5A1,
5.500%, 11/25/2034 | | | 128,703 | |
| | 176,321 | | | Banc of America Funding Trust, Series 2005-7, Class 3A1,
5.750%, 11/25/2035 | | | 180,701 | |
| | 39,343 | | | Banc of America Mortgage Securities, Inc., Series 2005-A, Class 2A1,
2.646%, 2/25/2035(b) | | | 38,386 | |
| | 82,798 | | | Citicorp Mortgage Securities Trust, Series 2006-4, Class 1A2,
6.000%, 8/25/2036 | | | 83,613 | |
| | 80,603 | | | Citigroup Mortgage Loan Trust, Inc., Series 2005-2, Class 1A4,
2.617%, 5/25/2035(b) | | | 78,476 | |
| | 453,864 | | | Countrywide Alternative Loan Trust, Series 2004-27CB, Class A1,
6.000%, 12/25/2034 | | | 452,659 | |
| | 288,161 | | | Countrywide Home Loan Mortgage Pass Through Trust, Series 2005-11, Class 4A1, 0.464%, 4/25/2035(b) | | | 250,282 | |
| | 149,037 | | | Countrywide Home Loan Mortgage Pass Through Trust,
Series 2005-HYB7, Class 2A, 2.665%, 11/20/2035(b) | | | 139,323 | |
| | 250,000 | | | Freddie Mac Structured Agency Credit Risk Debt Notes, Series 2013-DN2, Class M2, 4.444%, 11/25/2023(b) | | | 249,869 | |
| | 53,146 | | | GMAC Mortgage Corp. Loan Trust, Series 2003-J7, Class A7,
5.000%, 11/25/2033 | | | 53,402 | |
| | 335,977 | | | GMAC Mortgage Corp. Loan Trust, Series 2005-AR3, Class 2A1,
2.874%, 6/19/2035(b) | | | 325,856 | |
| | 244,621 | | | GMAC Mortgage Corp. Loan Trust, Series 2005-AR4, Class 3A1,
3.165%, 7/19/2035(b) | | | 231,754 | |
| | 68,674 | | | GSR Mortgage Loan Trust, Series 2004-14, Class 3A1,
2.843%, 12/25/2034(b) | | | 66,213 | |
| | 434,861 | | | GSR Mortgage Loan Trust, Series 2005-AR6, Class 4A5,
2.809%, 9/25/2035(b) | | | 438,961 | |
| | 158,000 | | | GSR Mortgage Loan Trust, Series 2006-8F, Class 4A17, 6.000%, 9/25/2036 | | | 131,399 | |
| | 85,121 | | | JPMorgan Alternative Loan Trust, Series 2006-A1, Class 5A1,
4.135%, 3/25/2036(b) | | | 69,711 | |
| | 324,499 | | | Lehman Mortgage Trust, Series 2005-3, Class 1A6, 0.694%, 1/25/2036(b) | | | 211,559 | |
| | 124,278 | | | Lehman Mortgage Trust, Series 2006-1, Class 3A5, 5.500%, 2/25/2036 | | | 119,985 | |
| | 425,313 | | | MASTR Adjustable Rate Mortgages Trust, Series 2005-2, Class 3A1,
2.751%, 3/25/2035(b) | | | 367,039 | |
| | 86,685 | | | New York Mortgage Trust, Series 2006-1, Class 2A2, 2.619%, 5/25/2036(b) | | | 78,418 | |
| | 261,688 | | | Residential Funding Mortgage Securities, Series 2006-S1, Class 1A3,
5.750%, 1/25/2036 | | | 268,842 | |
See accompanying notes to financial statements.
39 |
Portfolio of Investments – as of September 30, 2015
Loomis Sayles High Income Fund – (continued)
| | | | | | | | |
Principal Amount (‡) | | | Description | | Value (†) | |
| | | | ABS Home Equity — continued | | | | |
| $ | 515,505 | | | WaMu Mortgage Pass Through Certificates, Series 2006-AR19, Class 2A, 1.909%, 1/25/2047(b) | | $ | 464,580 | |
| | 98,242 | | | WaMu Mortgage Pass Through Certificates, Series 2007-OA3, Class 2A1A, 0.959%, 4/25/2047(b) | | | 82,831 | |
| | | | | | | | |
| | | | | | | 5,193,270 | |
| | | | | | | | |
| | | | ABS Other — 0.5% | | | | |
| | 297,083 | | | AIM Aviation Finance Ltd., Series 2015-1A, Class B1,
5.072%, 2/15/2040, 144A(b) | | | 299,059 | |
| | 110,053 | | | Sierra Receivables Funding Co. LLC, Series 2011-3A, Class C,
9.310%, 7/20/2028, 144A | | | 116,297 | |
| | 450,000 | | | Springleaf Funding Trust, Series 2014-AA, Class C, 4.450%, 12/15/2022, 144A | | | 451,907 | |
| | | | | | | | |
| | | | | | | 867,263 | |
| | | | | | | | |
| | | | Aerospace & Defense — 2.3% | | | | |
| | 125,000 | | | Huntington Ingalls Industries, Inc., 5.000%, 12/15/2021, 144A | | | 127,500 | |
| | 355,000 | | | KLX, Inc., 5.875%, 12/01/2022, 144A | | | 345,347 | |
| | 1,500,000 | | | Meccanica Holdings USA, Inc., 6.250%, 1/15/2040, 144A | | | 1,440,000 | |
| | 900,000 | | | Meccanica Holdings USA, Inc., 7.375%, 7/15/2039, 144A | | | 949,500 | |
| | 620,000 | | | TransDigm, Inc., 6.000%, 7/15/2022 | | | 578,150 | |
| | 515,000 | | | TransDigm, Inc., 6.500%, 7/15/2024 | | | 484,023 | |
| | | | | | | | |
| | | | | | | 3,924,520 | |
| | | | | | | | |
| | | | Airlines — 0.2% | | | | |
| | 110,382 | | | Virgin Australia Pass Through Trust, Series 2013-1B,
6.000%, 4/23/2022, 144A | | | 113,142 | |
| | 167,752 | | | Virgin Australia Pass Through Trust, Series 2013-1C,
7.125%, 10/23/2018, 144A | | | 170,268 | |
| | | | | | | | |
| | | | | | | 283,410 | |
| | | | | | | | |
| | | | Automotive — 1.0% | | | | |
| | 170,000 | | | General Motors Financial Co., Inc., 3.450%, 4/10/2022 | | | 163,520 | |
| | 620,000 | | | Midas Intermediate Holdco II LLC/Midas Intermediate Holdco II Finance, Inc., 7.875%, 10/01/2022, 144A | | | 604,500 | |
| | 310,000 | | | Nexteer Automotive Group Ltd., 5.875%, 11/15/2021, 144A | | | 300,700 | |
| | 735,000 | | | ZF North America Capital, Inc., 4.750%, 4/29/2025, 144A | | | 673,444 | |
| | | | | | | | |
| | | | | | | 1,742,164 | |
| | | | | | | | |
| | | | Banking — 4.2% | | | | |
| | 730,000 | | | Ally Financial, Inc., 4.125%, 2/13/2022 | | | 703,538 | |
| | 1,985,000 | | | Ally Financial, Inc., 4.625%, 3/30/2025 | | | 1,875,825 | |
| | 2,100,000 | | | Banco Santander Brasil S.A., 8.000%, 3/18/2016, 144A, (BRL) | | | 503,216 | |
| | 725,000 | | | Commerzbank AG, 8.125%, 9/19/2023, 144A | | | 840,717 | |
| | 470,000 | | | Intesa Sanpaolo SpA, 5.017%, 6/26/2024, 144A | | | 463,795 | |
| | 900,000 | | | Morgan Stanley, GMTN, 7.625%, 3/03/2016, (AUD)(c) | | | 644,194 | |
| | 65,000 | | | Royal Bank of Scotland Group PLC, 5.250%, (EUR)(d) | | | 71,905 | |
| | 740,000 | | | Royal Bank of Scotland Group PLC, 5.500%, (EUR)(d) | | | 822,129 | |
| | 1,025,000 | | | Royal Bank of Scotland Group PLC, 6.125%, 12/15/2022(c) | | | 1,109,263 | |
| | | | | | | | |
| | | | | | | 7,034,582 | |
| | | | | | | | |
See accompanying notes to financial statements.
| 40
Portfolio of Investments – as of September 30, 2015
Loomis Sayles High Income Fund – (continued)
| | | | | | | | |
Principal Amount (‡) | | | Description | | Value (†) | |
| | | | Brokerage — 0.3% | | | | |
| $ | 535,000 | | | Jefferies Finance LLC/JFIN Co-Issuer Corp., 6.875%, 4/15/2022, 144A | | $ | 486,850 | |
| | | | | | | | |
| | | | Building Materials — 1.5% | | | | |
| | 890,000 | | | Atrium Windows & Doors, Inc., 7.750%, 5/01/2019, 144A | | | 651,925 | |
| | 556,000 | | | CPG Merger Sub LLC, 8.000%, 10/01/2021, 144A | | | 553,220 | |
| | 50,000 | | | Masco Corp., 6.500%, 8/15/2032 | | | 51,250 | |
| | 345,000 | | | Masco Corp., 7.750%, 8/01/2029 | | | 385,537 | |
| | 245,000 | | | NCI Building Systems, Inc., 8.250%, 1/15/2023, 144A | | | 256,638 | |
| | 200,000 | | | Odebrecht Finance Ltd., 4.375%, 4/25/2025, 144A | | | 115,000 | |
| | 555,000 | | | Vulcan Materials Co., 4.500%, 4/01/2025 | | | 543,900 | |
| | | | | | | | |
| | | | | | | 2,557,470 | |
| | | | | | | | |
| | | | Cable Satellite — 5.3% | | | | |
| | 795,000 | | | Altice Financing S.A., 6.625%, 2/15/2023, 144A | | | 764,691 | |
| | 475,000 | | | CCO Holdings LLC/CCO Holdings Capital Corp., 5.125%, 2/15/2023 | | | 438,188 | |
| | 625,000 | | | CCO Holdings LLC/CCO Holdings Capital Corp., 5.125%, 5/01/2023, 144A | | | 576,188 | |
| | 430,000 | | | CCO Holdings LLC/CCO Holdings Capital Corp., 5.250%, 9/30/2022 | | | 403,125 | |
| | 15,000 | | | CCO Holdings LLC/CCO Holdings Capital Corp., 5.750%, 1/15/2024 | | | 14,325 | |
| | 760,000 | | | CSC Holdings LLC, 5.250%, 6/01/2024 | | | 599,450 | |
| | 75,000 | | | CSC Holdings LLC, 6.750%, 11/15/2021 | | | 67,125 | |
| | 895,000 | | | DISH DBS Corp., 5.125%, 5/01/2020 | | | 839,062 | |
| | 1,620,000 | | | DISH DBS Corp., 5.875%, 11/15/2024 | | | 1,375,987 | |
| | 220,000 | | | Neptune Finco Corp., 10.125%, 1/15/2023, 144A(e) | | | 222,475 | |
| | 200,000 | | | Neptune Finco Corp., 10.875%, 10/15/2025, 144A(e) | | | 202,250 | |
| | 155,000 | | | Numericable-SFR, 5.375%, 5/15/2022, 144A, (EUR) | | | 173,564 | |
| | 1,485,000 | | | Unitymedia GmbH, 6.125%, 1/15/2025, 144A | | | 1,466,437 | |
| | 515,000 | | | Unitymedia Hessen GmbH & Co.KG/Unitymedia NRW GmbH,
5.000%, 1/15/2025, 144A | | | 484,100 | |
| | 265,000 | | | Virgin Media Finance PLC, 6.000%, 10/15/2024, 144A | | | 255,063 | |
| | 485,000 | | | Virgin Media Finance PLC, 6.375%, 4/15/2023, 144A | | | 482,575 | |
| | 375,000 | | | Virgin Media Secured Finance PLC, 5.500%, 1/15/2025, 144A | | | 363,750 | |
| | 130,000 | | | Wave Holdco LLC/Wave Holdco Corp., PIK, 8.250%, 7/15/2019, 144A(f) | | | 126,750 | |
| | | | | | | | |
| | | | | | | 8,855,105 | |
| | | | | | | | |
| | | | Chemicals — 1.4% | | | | |
| | 1,510,000 | | | Hercules, Inc., 6.500%, 6/30/2029 | | | 1,392,975 | |
| | 1,125,000 | | | TPC Group, Inc., 8.750%, 12/15/2020, 144A | | | 961,875 | |
| | | | | | | | |
| | | | | | | 2,354,850 | |
| | | | | | | | |
| | | | Construction Machinery — 0.5% | | | | |
| | 800,000 | | | United Rentals North America, Inc., 5.750%, 11/15/2024 | | | 766,000 | |
| | | | | | | | |
| | | | Consumer Cyclical Services — 1.2% | | | | |
| | 515,000 | | | IHS, Inc., 5.000%, 11/01/2022 | | | 495,044 | |
| | 455,000 | | | Interval Acquisition Corp., 5.625%, 4/15/2023, 144A | | | 448,175 | |
| | 1,095,000 | | | ServiceMaster Co. LLC (The), 7.450%, 8/15/2027 | | | 1,100,475 | |
| | | | | | | | |
| | | | | | | 2,043,694 | |
| | | | | | | | |
See accompanying notes to financial statements.
41 |
Portfolio of Investments – as of September 30, 2015
Loomis Sayles High Income Fund – (continued)
| | | | | | | | |
Principal Amount (‡) | | | Description | | Value (†) | |
| | | | Electric — 1.9% | | | | |
| $ | 520,000 | | | AES Corp. (The), 5.500%, 4/15/2025 | | $ | 460,200 | |
| | 525,000 | | | Dynegy, Inc., 7.375%, 11/01/2022 | | | 529,594 | |
| | 1,502,000 | | | Enel SpA, (fixed rate to 9/24/2023, variable rate thereafter), 8.750%, 9/24/2073, 144A(c) | | | 1,723,124 | |
| | 11,288 | | | Red Oak Power LLC, Series A, 8.540%, 11/30/2019 | | | 11,965 | |
| | 175,000 | | | Talen Energy Supply LLC, 6.500%, 6/01/2025, 144A | | | 150,500 | |
| | 255,000 | | | TerraForm Power Operating LLC, 5.875%, 2/01/2023, 144A | | | 225,038 | |
| | 190,000 | | | TerraForm Power Operating LLC, 6.125%, 6/15/2025, 144A | | | 164,350 | |
| | | | | | | | |
| | | | | | | 3,264,771 | |
| | | | | | | | |
| | | | Environmental — 0.2% | | | | |
| | 335,000 | | | GFL Environmental, Inc., 7.875%, 4/01/2020, 144A | | | 342,956 | |
| | | | | | | | |
| | | | Finance Companies — 6.3% | | | | |
| | 740,000 | | | AerCap Ireland Capital Ltd./AerCap Global Aviation Trust, 4.500%, 5/15/2021 | | | 739,075 | |
| | 685,000 | | | AerCap Ireland Capital Ltd./AerCap Global Aviation Trust, 5.000%, 10/01/2021 | | | 698,700 | |
| | 515,000 | | | Aircastle Ltd., 5.500%, 2/15/2022 | | | 520,150 | |
| | 910,000 | | | CIT Group, Inc., 3.875%, 2/19/2019 | | | 904,881 | |
| | 65,000 | | | CIT Group, Inc., 5.000%, 8/15/2022 | | | 64,919 | |
| | 545,000 | | | CIT Group, Inc., 5.000%, 8/01/2023 | | | 541,594 | |
| | 600,000 | | | iStar, Inc., 4.000%, 11/01/2017 | | | 577,500 | |
| | 505,000 | | | iStar, Inc., 5.000%, 7/01/2019 | | | 479,750 | |
| | 1,015,000 | | | Ladder Capital Finance Holdings LLLP/Ladder Capital Finance Corp.,
5.875%, 8/01/2021, 144A | | | 949,025 | |
| | 585,000 | | | Ladder Capital Finance Holdings LLLP/Ladder Capital Finance Corp.,
7.375%, 10/01/2017 | | | 587,925 | |
| | 870,000 | | | Navient Corp., 5.000%, 10/26/2020 | | | 729,321 | |
| | 200,000 | | | Navient Corp., 5.875%, 3/25/2021 | | | 168,250 | |
| | 435,000 | | | Oxford Finance LLC/Oxford Finance Co-Issuer, Inc., 7.250%, 1/15/2018, 144A | | | 442,612 | |
| | 540,000 | | | Provident Funding Associates LP/PFG Finance Corp., 6.750%, 6/15/2021, 144A | | | 511,650 | |
| | 1,000,000 | | | Quicken Loans, Inc., 5.750%, 5/01/2025, 144A | | | 938,750 | |
| | 445,000 | | | Springleaf Finance Corp., 5.250%, 12/15/2019 | | | 434,988 | |
| | 1,110,000 | | | Springleaf Finance Corp., 7.750%, 10/01/2021 | | | 1,184,925 | |
| | | | | | | | |
| | | | | | | 10,474,015 | |
| | | | | | | | |
| | | | Financial Other — 1.0% | | | | |
| | 695,000 | | | Icahn Enterprises LP/Icahn Enterprises Finance Corp., 4.875%, 3/15/2019(c) | | | 696,043 | |
| | 180,000 | | | Icahn Enterprises LP/Icahn Enterprises Finance Corp., 5.875%, 2/01/2022 | | | 181,125 | |
| | 804,000 | | | Rialto Holdings LLC/Rialto Corp., 7.000%, 12/01/2018, 144A | | | 816,060 | |
| | | | | | | | |
| | | | | | | 1,693,228 | |
| | | | | | | | |
| | | | Food & Beverage — 0.6% | | | | |
| | 1,800,000 | | | BRF S.A., 7.750%, 5/22/2018, 144A, (BRL) | | | 370,034 | |
| | 600,000 | | | Cosan Luxembourg S.A., 9.500%, 3/14/2018, 144A, (BRL) | | | 118,320 | |
| | 480,000 | | | WhiteWave Foods Co. (The), 5.375%, 10/01/2022 | | | 498,000 | |
| | | | | | | | |
| | | | | | | 986,354 | |
| | | | | | | | |
| | | | Gaming — 1.7% | | | | |
| | 100,000 | | | GLP Capital LP/GLP Financing II, Inc., 4.375%, 11/01/2018 | | | 100,750 | |
| | 740,000 | | | GLP Capital LP/GLP Financing II, Inc., 4.875%, 11/01/2020(c) | | | 749,250 | |
See accompanying notes to financial statements.
| 42
Portfolio of Investments – as of September 30, 2015
Loomis Sayles High Income Fund – (continued)
| | | | | | | | |
Principal Amount (‡) | | | Description | | Value (†) | |
| | | | Gaming — continued | | | | |
| $ | 725,000 | | | MGM Resorts International, 6.000%, 3/15/2023 | | $ | 704,156 | |
| | 1,205,000 | | | MGM Resorts International, 6.750%, 10/01/2020 | | | 1,244,163 | |
| | | | | | | | |
| | | | | | | 2,798,319 | |
| | | | | | | | |
| | | | Government Owned – No Guarantee — 1.3% | | | | |
| | 335,000 | | | Petrobras Global Finance BV, 5.625%, 5/20/2043 | | | 205,188 | |
| | 530,000 | | | Petrobras Global Finance BV, 6.250%, 3/17/2024 | | | 385,734 | |
| | 545,000 | | | Petrobras Global Finance BV, 6.750%, 1/27/2041 | | | 355,612 | |
| | 575,000 | | | Petrobras Global Finance BV, 6.875%, 1/20/2040 | | | 373,750 | |
| | 145,000 | | | Petrobras Global Finance BV, 7.250%, 3/17/2044 | | | 96,164 | |
| | 129,850(††) | | | Petroleos Mexicanos, 7.470%, 11/12/2026, (MXN)(c) | | | 707,523 | |
| | | | | | | | |
| | | | | | | 2,123,971 | |
| | | | | | | | |
| | | | Health Insurance — 0.6% | | | | |
| | 1,025,000 | | | WellCare Health Plans, Inc., 5.750%, 11/15/2020 | | | 1,066,000 | |
| | | | | | | | |
| | | | Healthcare — 5.1% | | | | |
| | 360,000 | | | Amsurg Corp., 5.625%, 7/15/2022 | | | 359,550 | |
| | 1,330,000 | | | CHS/Community Health Systems, Inc., 6.875%, 2/01/2022 | | | 1,358,209 | |
| | 560,000 | | | ExamWorks Group, Inc., 5.625%, 4/15/2023 | | | 567,700 | |
| | 155,000 | | | Fresenius Medical Care U.S. Finance II, Inc., 4.125%, 10/15/2020, 144A | | | 154,613 | |
| | 145,000 | | | Fresenius Medical Care U.S. Finance II, Inc., 4.750%, 10/15/2024, 144A | | | 143,188 | |
| | 260,000 | | | HCA, Inc., 5.375%, 2/01/2025 | | | 257,400 | |
| | 170,000 | | | HCA, Inc., 7.050%, 12/01/2027 | | | 175,950 | |
| | 655,000 | | | HCA, Inc., 7.500%, 12/15/2023 | | | 730,325 | |
| | 145,000 | | | HCA, Inc., 7.500%, 11/06/2033 | | | 152,975 | |
| | 590,000 | | | HCA, Inc., 7.690%, 6/15/2025 | | | 654,900 | |
| | 480,000 | | | HCA, Inc., 8.360%, 4/15/2024 | | | 554,400 | |
| | 820,000 | | | HCA, Inc., MTN, 7.580%, 9/15/2025 | | | 897,900 | |
| | 515,000 | | | HCA, Inc., MTN, 7.750%, 7/15/2036 | | | 545,900 | |
| | 305,000 | | | LifePoint Health, Inc., 5.500%, 12/01/2021 | | | 308,050 | |
| | 540,000 | | | Tenet Healthcare Corp., 4.500%, 4/01/2021 | | | 531,900 | |
| | 310,000 | | | Tenet Healthcare Corp., 5.000%, 3/01/2019 | | | 299,925 | |
| | 225,000 | | | Tenet Healthcare Corp., 6.750%, 6/15/2023 | | | 223,312 | |
| | 635,000 | | | Tenet Healthcare Corp., 6.875%, 11/15/2031 | | | 571,500 | |
| | | | | | | | |
| | | | | | | 8,487,697 | |
| | | | | | | | |
| | | | Home Construction — 2.0% | | | | |
| | 1,200,000 | | | Corporacion GEO SAB de CV, 8.875%, 3/27/2022, 144A(g) | | | 24,000 | |
| | 750,000 | | | K. Hovnanian Enterprises, Inc., 5.000%, 11/01/2021 | | | 528,750 | |
| | 2,005,000 | | | Lennar Corp., 4.750%, 5/30/2025 | | | 1,914,775 | |
| | 915,000 | | | TRI Pointe Holdings, Inc., 4.375%, 6/15/2019 | | | 896,700 | |
| | 200,000 | | | Urbi Desarrollos Urbanos SAB de CV, 9.500%, 1/21/2020, 144A(g) | | | 8,020 | |
| | 900,000 | | | Urbi Desarrollos Urbanos SAB de CV, 9.750%, 2/03/2022, 144A(g) | | | 36,090 | |
| | | | | | | | |
| | | | | | | 3,408,335 | |
| | | | | | | | |
| | | | Independent Energy — 8.2% | | | | |
| | 785,000 | | | Antero Resources Corp., 5.125%, 12/01/2022 | | | 675,100 | |
| | 110,000 | | | Antero Resources Corp., 5.375%, 11/01/2021 | | | 96,800 | |
| | 90,000 | | | Baytex Energy Corp., 5.125%, 6/01/2021, 144A | | | 71,550 | |
See accompanying notes to financial statements.
43 |
Portfolio of Investments – as of September 30, 2015
Loomis Sayles High Income Fund – (continued)
| | | | | | | | |
Principal Amount (‡) | | | Description | | Value (†) | |
| | | | Independent Energy — continued | | | | |
| $ | 1,005,000 | | | Baytex Energy Corp., 5.625%, 6/01/2024, 144A | | $ | 793,950 | |
| | 370,000 | | | Bonanza Creek Energy, Inc., 5.750%, 2/01/2023 | | | 240,500 | |
| | 650,000 | | | Bonanza Creek Energy, Inc., 6.750%, 4/15/2021 | | | 453,375 | |
| | 75,000 | | | California Resources Corp., 5.000%, 1/15/2020 | | | 48,234 | |
| | 845,000 | | | California Resources Corp., 5.500%, 9/15/2021 | | | 515,450 | |
| | 380,000 | | | California Resources Corp., 6.000%, 11/15/2024 | | | 226,338 | |
| | 1,035,000 | | | Chesapeake Energy Corp., 4.875%, 4/15/2022 | | | 675,337 | |
| | 20,000 | | | Chesapeake Energy Corp., 5.750%, 3/15/2023 | | | 13,044 | |
| | 110,000 | | | Chesapeake Energy Corp., 6.125%, 2/15/2021 | | | 76,656 | |
| | 300,000 | | | Chesapeake Energy Corp., 6.625%, 8/15/2020 | | | 222,936 | |
| | 70,000 | | | Concho Resources, Inc., 5.500%, 10/01/2022 | | | 66,675 | |
| | 125,000 | | | Concho Resources, Inc., 5.500%, 4/01/2023 | | | 119,063 | |
| | 335,000 | | | Continental Resources, Inc., 3.800%, 6/01/2024 | | | 271,716 | |
| | 215,000 | | | Continental Resources, Inc., 4.500%, 4/15/2023 | | | 186,701 | |
| | 690,000 | | | Eclipse Resources Corp., 8.875%, 7/15/2023, 144A | | | 555,450 | |
| | 170,000 | | | Halcon Resources Corp., 8.625%, 2/01/2020, 144A | | | 141,313 | |
| | 115,000 | | | Halcon Resources Corp., 8.875%, 5/15/2021 | | | 34,500 | |
| | 490,000 | | | Halcon Resources Corp., 9.750%, 7/15/2020 | | | 166,600 | |
| | 220,000 | | | Jones Energy Holdings LLC/Jones Energy Finance Corp., 6.750%, 4/01/2022 | | | 174,764 | |
| | 145,000 | | | Matador Resources Co., 6.875%, 4/15/2023, 144A | | | 139,200 | |
| | 410,000 | | | MEG Energy Corp., 6.375%, 1/30/2023, 144A | | | 320,825 | |
| | 180,000 | | | MEG Energy Corp., 6.500%, 3/15/2021, 144A | | | 147,600 | |
| | 570,000 | | | MEG Energy Corp., 7.000%, 3/31/2024, 144A | | | 453,150 | |
| | 1,295,000 | | | Noble Energy, Inc., 5.875%, 6/01/2022 | | | 1,292,558 | |
| | 625,000 | | | Oasis Petroleum, Inc., 6.875%, 3/15/2022 | | | 495,187 | |
| | 485,000 | | | Oasis Petroleum, Inc., 7.250%, 2/01/2019 | | | 428,012 | |
| | 400,000 | | | QEP Resources, Inc., 5.250%, 5/01/2023 | | | 334,400 | |
| | 520,000 | | | QEP Resources, Inc., 5.375%, 10/01/2022 | | | 442,000 | |
| | 1,000,000 | | | Rex Energy Corp., 6.250%, 8/01/2022 | | | 400,000 | |
| | 150,000 | | | Rex Energy Corp., 8.875%, 12/01/2020 | | | 78,000 | |
| | 1,025,000 | | | Rice Energy, Inc., 6.250%, 5/01/2022 | | | 914,177 | |
| | 340,000 | | | RSP Permian, Inc., 6.625%, 10/01/2022 | | | 326,400 | |
| | 105,000 | | | RSP Permian, Inc., 6.625%, 10/01/2022, 144A | | | 100,800 | |
| | 330,000 | | | Sanchez Energy Corp., 6.125%, 1/15/2023 | | | 221,100 | |
| | 70,000 | | | Sanchez Energy Corp., 7.750%, 6/15/2021 | | | 51,800 | |
| | 920,000 | | | SM Energy Co., 5.000%, 1/15/2024 | | | 778,550 | |
| | 35,000 | | | SM Energy Co., 6.125%, 11/15/2022 | | | 32,410 | |
| | 395,000 | | | Southwestern Energy Co., 4.950%, 1/23/2025 | | | 353,028 | |
| | 115,000 | | | Ultra Petroleum Corp., 5.750%, 12/15/2018, 144A | | | 82,800 | |
| | 55,000 | | | Whiting Petroleum Corp., 5.000%, 3/15/2019 | | | 47,850 | |
| | 455,000 | | | Whiting Petroleum Corp., 5.750%, 3/15/2021 | | | 393,802 | |
| | | | | | | | |
| | | | | | | 13,659,701 | |
| | | | | | | | |
| | | | Industrial Other — 0.4% | | | | |
| | 265,000 | | | AECOM, 5.750%, 10/15/2022, 144A | | | 266,492 | |
| | 330,000 | | | Transfield Services Ltd., 8.375%, 5/15/2020, 144A | | | 339,487 | |
| | | | | | | | |
| | | | | | | 605,979 | |
| | | | | | | | |
See accompanying notes to financial statements.
| 44
Portfolio of Investments – as of September 30, 2015
Loomis Sayles High Income Fund – (continued)
| | | | | | | | |
Principal Amount (‡) | | | Description | | Value (†) | |
| | | | Integrated Energy — 0.3% | | | | |
| $ | 100,000 | | | Pacific Exploration and Production Corp., 5.125%, 3/28/2023, 144A | | $ | 34,500 | |
| | 800,000 | | | Pacific Exploration and Production Corp., 5.375%, 1/26/2019, 144A | | | 296,000 | |
| | 580,000 | | | Pacific Exploration and Production Corp., 5.625%, 1/19/2025, 144A | | | 202,826 | |
| | | | | | | | |
| | | | | | | 533,326 | |
| | | | | | | | |
| | | | Life Insurance — 0.2% | | | | |
| | 340,000 | | | CNO Financial Group, Inc., 5.250%, 5/30/2025 | | | 345,100 | |
| | | | | | | | |
| | | | Media Entertainment — 1.2% | | | | |
| | 470,000 | | | Clear Channel Worldwide Holdings, Inc., 7.625%, 3/15/2020 | | | 471,175 | |
| | 1,000,000 | | | Clear Channel Worldwide Holdings, Inc., Series B, 6.500%, 11/15/2022 | | | 1,003,750 | |
| | 481,000 | | | DreamWorks Animation SKG, Inc., 6.875%, 8/15/2020, 144A | | | 466,570 | |
| | | | | | | | |
| | | | | | | 1,941,495 | |
| | | | | | | | |
| | | | Metals & Mining — 2.3% | | | | |
| | 1,395,000 | | | ArcelorMittal, 7.500%, 3/01/2041 | | | 1,122,975 | |
| | 795,000 | | | CONSOL Energy, Inc., 5.875%, 4/15/2022 | | | 534,637 | |
| | 180,000 | | | Constellium NV, 4.625%, 5/15/2021, 144A, (EUR) | | | 168,951 | |
| | 460,000 | | | Emeco Pty Ltd., 9.875%, 3/15/2019, 144A | | | 241,500 | |
| | 460,000 | | | Essar Steel Algoma, Inc., 9.500%, 11/15/2019, 144A | | | 253,000 | |
| | 175,000 | | | First Quantum Minerals Ltd., 7.000%, 2/15/2021, 144A | | | 113,313 | |
| | 270,000 | | | First Quantum Minerals Ltd., 7.250%, 5/15/2022, 144A | | | 167,400 | |
| | 1,375,000 | | | Freeport-McMoRan, Inc., 4.550%, 11/14/2024(c) | | | 1,024,375 | |
| | 245,000 | | | Xstrata Finance Canada Ltd., 5.550%, 10/25/2042, 144A | | | 180,075 | |
| | | | | | | | |
| | | | | | | 3,806,226 | |
| | | | | | | | |
| | | | Midstream — 4.9% | | | | |
| | 200,000 | | | Gibson Energy, Inc., 6.750%, 7/15/2021, 144A | | | 192,250 | |
| | 270,000 | | | MarkWest Energy Partners LP/MarkWest Energy Finance Corp., 4.875%, 12/01/2024 | | | 247,050 | |
| | 365,000 | | | NGL Energy Partners LP/NGL Energy Finance Corp., 6.875%, 10/15/2021 | | | 343,100 | |
| | 405,000 | | | NGL Energy Partners LP/NGL Energy Finance Corp., 5.125%, 7/15/2019 | | | 368,550 | |
| | 445,000 | | | Regency Energy Partners LP/Regency Energy Finance Corp., 4.500%, 11/01/2023 | | | 411,382 | |
| | 295,000 | | | Regency Energy Partners LP/Regency Energy Finance Corp., 5.875%, 3/01/2022 | | | 302,307 | |
| | 385,000 | | | Rose Rock Midstream LP/Rose Rock Finance Corp., 5.625%, 7/15/2022 | | | 338,800 | |
| | 985,000 | | | Sabine Pass Liquefaction LLC, 5.625%, 2/01/2021 | | | 913,587 | |
| | 480,000 | | | Sabine Pass Liquefaction LLC, 5.625%, 3/01/2025, 144A | | | 423,000 | |
| | 425,000 | | | Sabine Pass Liquefaction LLC, 6.250%, 3/15/2022 | | | 395,250 | |
| | 935,000 | | | Summit Midstream Holdings LLC/Summit Midstream Finance Corp.,
5.500%, 8/15/2022 | | | 804,100 | |
| | 1,863,000 | | | Targa Resources Partners LP/Targa Resources Partners Finance Corp.,
4.125%, 11/15/2019, 144A | | | 1,672,042 | |
| | 95,000 | | | Targa Resources Partners LP/Targa Resources Partners Finance Corp.,
4.250%, 11/15/2023 | | | 79,088 | |
| | 640,000 | | | Targa Resources Partners LP/Targa Resources Partners Finance Corp.,
5.250%, 5/01/2023 | | | 568,000 | |
| | 300,000 | | | Targa Resources Partners LP/Targa Resources Partners Finance Corp.,
6.375%, 8/01/2022 | | | 286,875 | |
See accompanying notes to financial statements.
45 |
Portfolio of Investments – as of September 30, 2015
Loomis Sayles High Income Fund – (continued)
| | | | | | | | |
Principal Amount (‡) | | | Description | | Value (†) | |
| | | | Midstream — continued | | | | |
| $ | 15,000 | | | Targa Resources Partners LP/Targa Resources Partners Finance Corp.,
6.875%, 2/01/2021 | | $ | 14,513 | |
| | 355,000 | | | Tesoro Logistics LP/Tesoro Logistics Finance Corp., 5.500%, 10/15/2019, 144A | | | 347,900 | |
| | 360,000 | | | Tesoro Logistics LP/Tesoro Logistics Finance Corp., 6.250%, 10/15/2022, 144A | | | 352,350 | |
| | 180,000 | | | Western Refining Logistics LP/WNRL Finance Corp., 7.500%, 2/15/2023 | | | 178,650 | |
| | | | | | | | |
| | | | | | | 8,238,794 | |
| | | | | | | | |
| | | | Non-Agency Commercial Mortgage-Backed Securities — 2.1% | | | | |
| | 935,000 | | | BXHTL Mortgage Trust, Series 2015-DRMZ, Class M,
8.392%, 5/15/2018, 144A(b)(h) | | | 935,000 | |
| | 1,690,000 | | | GS Mortgage Securities Corp. II, Series 2007-GG10, Class AM,
5.989%, 8/10/2045(b) | | | 1,695,719 | |
| | 805,000 | | | Hilton USA Trust, Series 2013-HLT, Class EFX, 4.602%, 11/05/2030, 144A(b) | | | 812,799 | |
| | 125,000 | | | JPMorgan Chase Commercial Mortgage Securities Trust, Series 2007-LDPX, Class AM,
5.464%, 1/15/2049(b) | | | 128,489 | |
| | | | | | | | |
| | | | | | | 3,572,007 | |
| | | | | | | | |
| | | | Oil Field Services — 0.3% | | | | |
| | 45,000 | | | Diamond Offshore Drilling, Inc., 4.875%, 11/01/2043 | | | 29,427 | |
| | 285,000 | | | Hercules Offshore, Inc., 8.750%, 7/15/2021, 144A(g) | | | 59,850 | |
| | 435,000 | | | Paragon Offshore PLC, 6.750%, 7/15/2022, 144A | | | 56,550 | |
| | 905,000 | | | Paragon Offshore PLC, 7.250%, 8/15/2024, 144A | | | 141,406 | |
| | 35,000 | | | Parker Drilling Co., 6.750%, 7/15/2022 | | | 27,825 | |
| | 155,000 | | | Pioneer Energy Services Corp., 6.125%, 3/15/2022 | | | 87,575 | |
| | 40,000 | | | Transocean, Inc., 4.300%, 10/15/2022 | | | 24,700 | |
| | | | | | | | |
| | | | | | | 427,333 | |
| | | | | | | | |
| | | | Packaging — 0.9% | | | | |
| | 755,000 | | | Sealed Air Corp., 6.875%, 7/15/2033, 144A | | | 756,888 | |
| | 775,000 | | | Signode Industrial Group Lux S.A./Signode Industrial Group U.S., Inc.,
6.375%, 5/01/2022, 144A | | | 732,375 | |
| | | | | | | | |
| | | | | | | 1,489,263 | |
| | | | | | | | |
| | | | Pharmaceuticals — 1.4% | | | | |
| | 1,540,000 | | | Valeant Pharmaceuticals International, 6.375%, 10/15/2020, 144A | | | 1,531,337 | |
| | 530,000 | | | Valeant Pharmaceuticals International, 7.250%, 7/15/2022, 144A | | | 539,673 | |
| | 335,000 | | | VRX Escrow Corp., 5.375%, 3/15/2020, 144A | | | 324,531 | |
| | | | | | | | |
| | | | | | | 2,395,541 | |
| | | | | | | | |
| | | | Property & Casualty Insurance — 0.4% | | | | |
| | 786,000 | | | Hockey Merger Sub 2, Inc., 7.875%, 10/01/2021, 144A | | | 750,630 | |
| | | | | | | | |
| | | | Retailers — 1.7% | | | | |
| | 40,000 | | | Dillard’s, Inc., 7.000%, 12/01/2028 | | | 45,340 | |
| | 435,000 | | | Dillard’s, Inc., 7.750%, 7/15/2026 | | | 509,224 | |
| | 205,000 | | | Dillard’s, Inc., 7.750%, 5/15/2027 | | | 240,411 | |
| | 35,000 | | | Dillard’s, Inc., 7.875%, 1/01/2023 | | | 41,639 | |
| | 280,000 | | | Dollar Tree, Inc., 5.750%, 3/01/2023, 144A | | | 290,500 | |
| | 1,035,000 | | | GameStop Corp., 5.500%, 10/01/2019, 144A | | | 1,066,361 | |
| | 280,000 | | | Group 1 Automotive, Inc., 5.000%, 6/01/2022 | | | 275,800 | |
See accompanying notes to financial statements.
| 46
Portfolio of Investments – as of September 30, 2015
Loomis Sayles High Income Fund – (continued)
| | | | | | | | |
Principal Amount (‡) | | | Description | | Value (†) | |
| | | | Retailers — continued | | | | |
| $ | 255,000 | | | J.C. Penney Corp., Inc., 5.750%, 2/15/2018 | | $ | 245,438 | |
| | 520,000 | | | Nine West Holdings, Inc., 6.125%, 11/15/2034 | | | 182,000 | |
| | | | | | | | |
| | | | | | | 2,896,713 | |
| | | | | | | | |
| | | | Supermarkets — 0.6% | | | | |
| | 935,000 | | | New Albertson’s, Inc., Series C, MTN, 6.625%, 6/01/2028 | | | 804,100 | |
| | 140,000 | | | SUPERVALU, Inc., 7.750%, 11/15/2022 | | | 140,000 | |
| | | | | | | | |
| | | | | | | 944,100 | |
| | | | | | | | |
| | | | Supranational — 3.2% | | | | |
| | 30,700,000 | | | European Bank for Reconstruction & Development, GMTN,
6.000%, 3/03/2016, (INR) | | | 464,237 | |
| | 5,420,000,000 | | | International Bank for Reconstruction & Development,
4.500%, 8/03/2017, (COP) | | | 1,750,026 | |
| | 458,000,000 | | | International Bank for Reconstruction & Development, EMTN,
4.250%, 2/05/2016, (CLP)(c) | | | 658,177 | |
| | 21,150,000 | | | International Bank for Reconstruction & Development, Series GDIF,
5.000%, 5/24/2017, (INR) | | | 313,487 | |
| | 100,890,000 | | | International Finance Corp., 7.800%, 6/03/2019, (INR)(c) | | | 1,587,478 | |
| | 2,175,000 | | | International Finance Corp., GMTN, 10.500%, 4/17/2018, (BRL) | | | 525,028 | |
| | | | | | | | |
| | | | | | | 5,298,433 | |
| | | | | | | | |
| | | | Technology — 4.6% | | | | |
| | 1,545,000 | | | Alcatel-Lucent USA, Inc., 6.450%, 3/15/2029 | | | 1,529,550 | |
| | 1,930,000 | | | Alcatel-Lucent USA, Inc., 6.500%, 1/15/2028 | | | 1,930,000 | |
| | 550,000 | | | Blackboard, Inc., 7.750%, 11/15/2019, 144A | | | 462,000 | |
| | 60,000 | | | CommScope Technologies Finance LLC, 6.000%, 6/15/2025, 144A | | | 57,563 | |
| | 75,000 | | | CommScope, Inc., 4.375%, 6/15/2020, 144A | | | 74,437 | |
| | 330,000 | | | CommScope, Inc., 5.000%, 6/15/2021, 144A | | | 322,575 | |
| | 430,000 | | | Equinix, Inc., 4.875%, 4/01/2020 | | | 437,525 | |
| | 480,000 | | | Equinix, Inc., 5.375%, 1/01/2022 | | | 477,600 | |
| | 260,000 | | | First Data Corp., 10.625%, 6/15/2021 | | | 285,025 | |
| | 510,000 | | | Micron Technology, Inc., 5.250%, 1/15/2024, 144A | | | 467,925 | |
| | 515,000 | | | Micron Technology, Inc., 5.625%, 1/15/2026, 144A | | | 463,500 | |
| | 215,000 | | | MSCI, Inc., 5.250%, 11/15/2024, 144A | | | 217,150 | |
| | 515,000 | | | Open Text Corp., 5.625%, 1/15/2023, 144A | | | 510,816 | |
| | 405,000 | | | Sabre GLBL, Inc., 5.375%, 4/15/2023, 144A | | | 398,925 | |
| | | | | | | | |
| | | | | | | 7,634,591 | |
| | | | | | | | |
| | | | Transportation Services — 0.4% | | | | |
| | 275,000 | | | APL Ltd., 8.000%, 1/15/2024(h) | | | 214,500 | |
| | 550,000 | | | Avis Budget Car Rental LLC/Avis Budget Finance, Inc.,
5.125%, 6/01/2022, 144A | | | 530,750 | |
| | | | | | | | |
| | | | | | | 745,250 | |
| | | | | | | | |
| | | | Treasuries — 6.0% | | | | |
| | 55,000 | | | Hellenic Republic Government Bond, Series PSI, (Step to 3.650% on 2/24/2020),
3.000%, 2/24/2035, (EUR)(j) | | | 36,025 | |
| | 55,000 | | | Hellenic Republic Government Bond, Series PSI, (Step to 3.650% on 2/24/2020),
3.000%, 2/24/2036, (EUR)(j) | | | 35,632 | |
See accompanying notes to financial statements.
47 |
Portfolio of Investments – as of September 30, 2015
Loomis Sayles High Income Fund – (continued)
| | | | | | | | |
Principal Amount (‡) | | | Description | | Value (†) | |
| | | | Treasuries — continued | | | | |
| | 20,000 | | | Hellenic Republic Government Bond, Series PSI, (Step to 3.650% on 2/24/2020), 3.000%, 2/24/2041, (EUR)(j) | | $ | 12,748 | |
| | 165,000(††) | | | Mexican Fixed Rate Bonds, Series M, 4.750%, 6/14/2018, (MXN)(c) | | | 979,653 | |
| | 131,500(††) | | | Mexican Fixed Rate Bonds, Series M, 6.500%, 6/10/2021, (MXN)(c) | | | 814,544 | |
| | 116,500(††) | | | Mexican Fixed Rate Bonds, Series M-20, 8.000%, 12/07/2023, (MXN)(c) | | | 776,597 | |
| | 151,030(††) | | | Mexican Fixed Rate Bonds, Series M-20, 10.000%, 12/05/2024, (MXN)(c) | | | 1,138,072 | |
| | 74,000,000 | | | Philippine Government International Bond, 6.250%, 1/14/2036, (PHP) | | | 1,737,591 | |
| | 1,050,000 | | | Republic of Brazil, 8.500%, 1/05/2024, (BRL) | | | 197,314 | |
| | 2,250,000 | | | Republic of Brazil, 10.250%, 1/10/2028, (BRL)(c) | | | 459,705 | |
| | 3,785,000 | | | U.S. Treasury Note, 0.875%, 5/15/2017(c) | | | 3,804,171 | |
| | | | | | | | |
| | | | | | | 9,992,052 | |
| | | | | | | | |
| | | | Wireless — 2.2% | | | | |
| | 100,000 | | | Altice Luxembourg S.A., 7.250%, 5/15/2022, 144A, (EUR) | | | 105,315 | |
| | 355,000 | | | Altice Luxembourg S.A., 7.625%, 2/15/2025, 144A | | | 313,509 | |
| | 785,000 | | | Altice Luxembourg S.A., 7.750%, 5/15/2022, 144A | | | 714,350 | |
| | 6,000,000 | | | America Movil SAB de CV, 6.450%, 12/05/2022, (MXN) | | | 338,210 | |
| | 6,100,000 | | | America Movil SAB de CV, 8.460%, 12/18/2036, (MXN) | | | 347,727 | |
| | 786,000 | | | Sprint Capital Corp., 6.875%, 11/15/2028 | | | 563,955 | |
| | 370,000 | | | T-Mobile USA, Inc., 6.125%, 1/15/2022 | | | 357,050 | |
| | 515,000 | | | T-Mobile USA, Inc., 6.731%, 4/28/2022 | | | 513,713 | |
| | 180,000 | | | Wind Acquisition Finance S.A., 3.981%, 7/15/2020, 144A, (EUR)(b) | | | 199,724 | |
| | 200,000 | | | Wind Acquisition Finance S.A., 4.750%, 7/15/2020, 144A | | | 198,000 | |
| | | | | | | | |
| | | | | | | 3,651,553 | |
| | | | | | | | |
| | | | Wirelines — 1.8% | | | | |
| | 705,000 | | | CenturyLink, Inc., 7.650%, 3/15/2042 | | | 539,325 | |
| | 130,000 | | | Cincinnati Bell Telephone Co. LLC, 6.300%, 12/01/2028 | | | 121,550 | |
| | 60,000,000 | | | Empresa de Telecomunicaniones de Bogota, 7.000%, 1/17/2023, 144A, (COP) | | | 16,904 | |
| | 405,000 | | | Frontier Communications Corp., 9.000%, 8/15/2031 | | | 334,125 | |
| | 340,000 | | | Frontier Communications Corp., 10.500%, 9/15/2022, 144A | | | 331,500 | |
| | 705,000 | | | Level 3 Communications, Inc., 5.750%, 12/01/2022 | | | 691,781 | |
| | 345,000 | | | Telecom Italia Capital S.A., 6.375%, 11/15/2033 | | | 330,338 | |
| | 35,000 | | | Telecom Italia Capital S.A., 7.200%, 7/18/2036 | | | 36,925 | |
| | 85,000 | | | Telecom Italia Capital S.A., 7.721%, 6/04/2038 | | | 92,225 | |
| | 450,000 | | | Telecom Italia SpA, 5.303%, 5/30/2024, 144A | | | 439,875 | |
| | | | | | | | |
| | | | | | | 2,934,548 | |
| | | | | | | | |
| | | | Total Non-Convertible Bonds (Identified Cost $156,914,568) | | | 142,617,459 | |
| | | | | | | | |
| | | | | | | | |
| | Convertible Bonds — 5.2% | | | | |
| | | | Building Materials — 0.7% | | | | |
| | 575,000 | | | Lennar Corp., 3.250%, 11/15/2021, 144A | | | 1,182,703 | |
| | | | | | | | |
| | | | Consumer Cyclical Services — 0.6% | | | | |
| | 875,000 | | | Jarden Corp., 1.125%, 3/15/2034 | | | 1,000,781 | |
| | 115,000 | | | Macquarie Infrastructure Corp., 2.875%, 7/15/2019 | | | 130,525 | |
| | | | | | | | |
| | | | | | | 1,131,306 | |
| | | | | | | | |
See accompanying notes to financial statements.
| 48
Portfolio of Investments – as of September 30, 2015
Loomis Sayles High Income Fund – (continued)
| | | | | | | | |
Principal Amount (‡) | | | Description | | Value (†) | |
| | | | Consumer Products — 0.4% | | | | |
| $ | 845,000 | | | Iconix Brand Group, Inc., 1.500%, 3/15/2018 | | $ | 671,775 | |
| | | | | | | | |
| | | | Energy — 0.4% | | | | |
| | 945,000 | | | Hornbeck Offshore Services, Inc., 1.500%, 9/01/2019 | | | 701,072 | |
| | | | | | | | |
| | | | Leisure — 0.5% | | | | |
| | 1,035,000 | | | Rovi Corp., 0.500%, 3/01/2020, 144A | | | 798,244 | |
| | | | | | | | |
| | | | Metals & Mining — 0.1% | | | | |
| | 95,000 | | | RTI International Metals, Inc., 1.625%, 10/15/2019 | | | 99,869 | |
| | | | | | | | |
| | | | Midstream — 1.0% | | | | |
| | 420,000 | | | Chesapeake Energy Corp., 2.500%, 5/15/2037 | | | 361,200 | |
| | 1,570,000 | | | Whiting Petroleum Corp., 1.250%, 4/01/2020, 144A | | | 1,278,569 | |
| | | | | | | | |
| | | | | | | 1,639,769 | |
| | | | | | | | |
| | | | Pharmaceuticals — 0.7% | | | | |
| | 58,000 | | | BioMarin Pharmaceutical, Inc., 0.750%, 10/15/2018 | | | 74,929 | |
| | 644,000 | | | BioMarin Pharmaceutical, Inc., 1.500%, 10/15/2020 | | | 865,375 | |
| | 211,000 | | | Emergent Biosolutions, Inc., 2.875%, 1/15/2021 | | | 239,617 | |
| | | | | | | | |
| | | | | | | 1,179,921 | |
| | | | | | | | |
| | | | REITs – Diversified — 0.1% | | | | |
| | 105,000 | | | RWT Holdings, Inc., 5.625%, 11/15/2019, 144A | | | 98,437 | |
| | | | | | | | |
| | | | REITs – Mortgage — 0.0% | | | | |
| | 30,000 | | | Redwood Trust, Inc., 4.625%, 4/15/2018 | | | 28,781 | |
| | | | | | | | |
| | | | Technology — 0.7% | | | | |
| | 306,000 | | | Brocade Communications Systems, Inc., 1.375%, 1/01/2020, 144A | | | 299,689 | |
| | 140,000 | | | MercadoLibre, Inc., 2.250%, 7/01/2019 | | | 136,938 | |
| | 340,000 | | | Micron Technology, Inc., Series G, 3.000%, 11/15/2043 | | | 285,812 | |
| | 108,000 | | | Nuance Communications, Inc., 1.500%, 11/01/2035 | | | 111,173 | |
| | 386,000 | | | SunEdison, Inc., 2.625%, 6/01/2023, 144A | | | 194,447 | |
| | 370,000 | | | SunEdison, Inc., 3.375%, 6/01/2025, 144A | | | 188,006 | |
| | | | | | | | |
| | | | | | | 1,216,065 | |
| | | | | | | | |
| | | | Total Convertible Bonds
(Identified Cost $10,257,809) | | | 8,747,942 | |
| | | | | | | | |
| | | | | | | | |
| | | | Total Bonds and Notes
(Identified Cost $167,172,377) | | | 151,365,401 | |
| | | | | | | | |
| | | | | | | | |
| | Senior Loans — 1.9% | | | | |
| | | | Consumer Cyclical Services — 0.3% | | | | |
| | 493,569 | | | SourceHov LLC, 2014 1st Lien Term Loan, 7.750%, 10/31/2019(b) | | | 444,829 | |
| | | | | | | | |
| | | | Media Entertainment — 0.0% | | | | |
| | 88,743 | | | SuperMedia, Inc., Exit Term Loan, 11.600%, 12/30/2016(b) | | | 47,478 | |
| | | | | | | | |
| | | | Other Utility — 0.2% | | | | |
| | 242,335 | | | PowerTeam Services LLC, 1st Lien Term Loan, 4.250%, 5/06/2020(b) | | | 239,104 | |
| | 95,000 | | | PowerTeam Services LLC, 2nd Lien Term Loan, 8.250%, 11/06/2020(b) | | | 90,250 | |
| | | | | | | | |
| | | | | | | 329,354 | |
| | | | | | | | |
See accompanying notes to financial statements.
49 |
Portfolio of Investments – as of September 30, 2015
Loomis Sayles High Income Fund – (continued)
| | | | | | | | |
Principal Amount (‡) | | | Description | | Value (†) | |
| | | | Supermarkets — 0.5% | | | | |
| $ | 545,972 | | | Albertson’s LLC, Term Loan B4, 5.500%, 8/25/2021(b) | | $ | 545,634 | |
| | 281,160 | | | New Albertson’s, Inc., Term Loan, 4.750%, 6/27/2021(b) | | | 280,597 | |
| | | | | | | | |
| | | | | | | 826,231 | |
| | | | | | | | |
| | | | Transportation Services — 0.1% | | | | |
| | 98,750 | | | OSG Bulk Ships, Inc., Exit Term Loan, 5.250%, 8/05/2019(b) | | | 97,639 | |
| | | | | | | | |
| | | | Wirelines — 0.8% | | | | |
| | 1,218,750 | | | Fairpoint Communications, Inc., Refi Term Loan, 7.500%, 2/14/2019(b) | | | 1,221,541 | |
| | 159,324 | | | Integra Telecom, Inc., 2nd Lien Term Loan, 9.750%, 2/21/2020(b) | | | 158,196 | |
| | | | | | | | |
| | | | | | | 1,379,737 | |
| | | | | | | | |
| | | | | | | | |
| | | | Total Senior Loans
(Identified Cost $3,198,177) | | | 3,125,268 | |
| | | | | | | | |
| | | | | | | | |
| Shares | | | | | | |
| | Preferred Stocks — 3.6% | | | | |
| | Convertible Preferred Stocks — 2.5% | | | | |
| | | | Consumer Non-Cyclical Services — 0.5% | | | | |
| | 18,265 | | | Tyson Foods, Inc., 4.750% | | | 936,264 | |
| | | | | | | | |
| | | | Electric — 0.4% | | | | |
| | 5,356 | | | Dominion Resources, Inc., Series B, 6.000% | | | 299,829 | |
| | 7,126 | | | Dominion Resources, Inc., Series A, 6.125% | | | 394,139 | |
| | 1,424 | | | Dominion Resources, Inc., 6.375% | | | 70,644 | |
| | | | | | | | |
| | | | | | | 764,612 | |
| | | | | | | | |
| | | | Metals & Mining — 0.7% | | | | |
| | 34,097 | | | Alcoa, Inc., Series 1, 5.375% | | | 1,138,840 | |
| | | | | | | | |
| | | | Midstream — 0.3% | | | | |
| | 988 | | | Chesapeake Energy Corp., 5.750% | | | 393,965 | |
| | 20 | | | Chesapeake Energy Corp., 5.750%, 144A | | | 7,975 | |
| | 137 | | | Chesapeake Energy Corp., 5.750% | | | 54,115 | |
| | | | | | | | |
| | | | | | | 456,055 | |
| | | | | | | | |
| | | | Pharmaceuticals — 0.5% | | | | |
| | 860 | | | Allergan PLC, Series A, 5.500% | | | 811,376 | |
| | | | | | | | |
| | | | REITs – Mortgage — 0.1% | | | | |
| | 2,107 | | | iStar, Inc., Series J, 4.500% | | | 112,008 | |
| | | | | | | | |
| | | | | | | | |
| | | | Total Convertible Preferred Stocks
(Identified Cost $5,000,761) | | | 4,219,155 | |
| | | | | | | | |
| | | | | | | | |
| | Non-Convertible Preferred Stocks — 1.1% | | | | |
| | | | Banking — 0.8% | | | | |
| | 32,853 | | | Ally Financial, Inc., Series A, (fixed rate to 5/15/2016, variable rate thereafter), 8.500% | | | 851,878 | |
| | 483 | | | Ally Financial, Inc., Series G, 7.000%, 144A | | | 484,525 | |
| | | | | | | | |
| | | | | | | 1,336,403 | |
| | | | | | | | |
See accompanying notes to financial statements.
| 50
Portfolio of Investments – as of September 30, 2015
Loomis Sayles High Income Fund – (continued)
| | | | | | | | |
| Shares | | | Description | | Value (†) | |
| | | | Finance Companies — 0.3% | | | | |
| | 12,925 | | | iStar, Inc., Series E, 7.875% | | $ | 306,322 | |
| | 7,500 | | | iStar, Inc., Series F, 7.800% | | | 176,325 | |
| | 550 | | | iStar, Inc., Series G, 7.650% | | | 12,953 | |
| | | | | | | | |
| | | | | | | 495,600 | |
| | | | | | | | |
| | | | Total Non-Convertible Preferred Stocks
(Identified Cost $1,701,534) | | | 1,832,003 | |
| | | | | | | | |
| | | | | | | | |
| | | | Total Preferred Stocks
(Identified Cost $6,702,295) | | | 6,051,158 | |
| | | | | | | | |
| | | | | | | | |
| | Common Stocks — 0.7% | | | | |
| | | | Automobiles — 0.3% | | | | |
| | 14,625 | | | General Motors Co. | | | 439,042 | |
| | | | | | | | |
| | | | Electric Utilities — 0.1% | | | | |
| | 1,973 | | | NextEra Energy, Inc. | | | 192,466 | |
| | | | | | | | |
| | | | Oil, Gas & Consumable Fuels — 0.2% | | | | |
| | 14,882 | | | Kinder Morgan, Inc. | | | 411,934 | |
| | | | | | | | |
| | | | Trading Companies & Distributors — 0.1% | | | | |
| | 2,696 | | | United Rentals, Inc.(i) | | | 161,895 | |
| | | | | | | | |
| | | | Total Common Stocks
(Identified Cost $1,215,367) | | | 1,205,337 | |
| | | | | | | | |
| | | | | | | | |
| | Warrants — 0.0% | | | | |
| | 10,360 | | | FairPoint Communications, Inc., Expiration on 1/24/2018 at $48.81(h)(i)(k) | | | — | |
| | 22,512 | | | Kinder Morgan, Inc., Expiration on 5/25/2017 at $40.00(i) | | | 20,711 | |
| | | | | | | | |
| | | | Total Warrants
(Identified Cost $29,892) | | | 20,711 | |
| | | | | | | | |
| | | | | | | | |
| | Other Investments — 0.6% | | | | |
| | | | Aircraft ABS — 0.6% | | | | |
| | 100 | | | ECAF I Blocker Ltd.(h)(k)
(Identified Cost $1,000,000) | | | 1,000,000 | |
| | | | | | | | |
| | | | | | | | |
Principal
Amount (‡) | | | | | | |
| | Short-Term Investments — 0.9% | | | | |
| $ | 46,381 | | | Repurchase Agreement with State Street Bank and Trust Company, dated 9/30/2015 at 0.000% to be repurchased at $46,381 on 10/01/2015 collateralized by $46,500 U.S. Treasury Note, 1.500% due 8/31/2018 valued at $47,346 including accrued interest (Note 2 of Notes to Financial Statements) | | | 46,381 | |
| | 1,047,489 | | | Tri-Party Repurchase Agreement with Fixed Income Clearing Corporation, dated 9/30/2015 at 0.010% to be repurchased at $1,047,489 on 10/01/2015 collateralized by $945,000 U.S. Treasury Note, 1.750% due 2/28/2022 valued at $947,363; $125,000 U.S. Treasury Note, 0.625% due 9/30/2017 valued at $124,844 including accrued interest (Note 2 of Notes to Financial Statements) | | | 1,047,489 | |
See accompanying notes to financial statements.
51 |
Portfolio of Investments – as of September 30, 2015
Loomis Sayles High Income Fund – (continued)
| | | | | | | | |
Principal
Amount (‡) | | | Description | | Value (†) | |
| | Short-Term Investments — continued | | | | |
| $ | 470,000 | | | U.S. Treasury Bills, 0.160%, 1/28/2016(l)(m) | | $ | 469,982 | |
| | | | | | | | |
| | | | Total Short-Term Investments (Identified Cost $1,563,636) | | | 1,563,852 | |
| | | | | | | | |
| | | | | | | | |
| | | | Total Investments — 98.2%
(Identified Cost $180,881,744)(a) | | | 164,331,727 | |
| | | | Other assets less liabilities — 1.8% | | | 2,986,645 | |
| | | | | | | | |
| | | | Net Assets — 100.0% | | $ | 167,318,372 | |
| | | | | | | | |
| | | | | | | | |
| | (‡) | | | Principal Amount stated in U.S. dollars unless otherwise noted. | | | | |
| | (†) | | | See Note 2 of Notes to Financial Statements. | | | | |
| | (††) | | | Amount shown represents units. One unit represents a principal amount of 100. | | | | |
| | (a) | | | Federal Tax Information: | | | | |
| | | | At September 30, 2015, the net unrealized depreciation on investments based on a cost of $180,920,943 for federal income tax purposes was as follows: | | | | |
| | | | Aggregate gross unrealized appreciation for all investments in which there is an excess of value over tax cost | | $ | 5,142,031 | |
| | | | Aggregate gross unrealized depreciation for all investments in which there is an excess of tax cost over value | | | (21,731,247 | ) |
| | | | | | | | |
| | | | Net unrealized depreciation | | $ | (16,589,216 | ) |
| | | | | | | | |
| | | | | | | | |
| | (b) | | | Variable rate security. Rate as of September 30, 2015 is disclosed. | | | | |
| | (c) | | | All of this security has been designated to cover the Fund’s obligations under open forward foreign currency and futures contracts. | |
| | (d) | | | Perpetual bond with no specified maturity date. | | | | |
| | (e) | | | When-issued/delayed delivery. See Note 2 of Notes to Financial Statements. | |
| | (f) | | | Payment-in-kind security for which the issuer has the option at each interest payment date of making interest payments in cash or additional debt securities. For the period ended September 30, 2015, interest payments were made in cash. | |
| | (g) | | | The issuer is in default with respect to interest and/or principal payments. Income is not being accrued. | |
| | (h) | | | Illiquid security. At September 30, 2015, the value of these securities amounted to $2,149,500 or 1.3% of net assets. Illiquid securities are deemed to be fair valued pursuant to the Fund’s pricing policies and procedures. See Note 2 of Notes to Financial Statements. | |
| | (i) | | | Non-income producing security. | | | | |
| | (j) | | | Coupon rate is a fixed rate for an initial period then resets at a specified date and rate. | | | | |
| | (k) | | | Fair valued by the Fund’s adviser. At September 30, 2015, the value of these securities amounted to $1,000,000 or 0.6% of net assets. See Note 2 of Notes to Financial Statements. | |
| | (l) | | | Interest rate represents discount rate at time of purchase; not a coupon rate. | | | | |
| | (m) | | | A portion of this security has been pledged as initial margin for open futures contracts. | | | | |
See accompanying notes to financial statements.
| 52
Portfolio of Investments – as of September 30, 2015
Loomis Sayles High Income Fund – (continued)
| | | | | | |
| | | | | | |
| | 144A | | | All or a portion of these securities are exempt from registration under Rule 144A of the Securities Act of 1933. These securities may be resold in transactions exempt from registration, normally to qualified institutional buyers. At September 30, 2015, the value of Rule 144A holdings amounted to $50,276,963 or 30.0% of net assets. |
| | ABS | | | Asset-Backed Securities | | |
| | EMTN | | | Euro Medium Term Note | | |
| | GMTN | | | Global Medium Term Note | | |
| | MTN | | | Medium Term Note | | |
| | PIK | | | Payment-in-Kind | | |
| | REITs | | | Real Estate Investment Trusts | | |
| | | | | | |
| | AUD | | | Australian Dollar | | |
| | BRL | | | Brazilian Real | | |
| | CLP | | | Chilean Peso | | |
| | COP | | | Colombian Peso | | |
| | EUR | | | Euro | | |
| | INR | | | Indian Rupee | | |
| | MXN | | | Mexican Peso | | |
| | PHP | | | Philippine Peso | | |
At September 30, 2015, the Fund had the following open forward foreign currency contracts:
| | | | | | | | | | | | | | | | | | |
Contract to Buy/Sell1 | | Delivery
Date | | | Currency | | Units of
Currency | | | Notional
Value | | | Unrealized
Appreciation
(Depreciation) | |
| Sell | | | 10/30/2015 | | | Euro | | | 1,300,000 | | | $ | 1,453,229 | | | $ | (25,491 | ) |
| Buy | | | 10/23/2015 | | | Mexican Peso | | | 88,300,000 | | | | 5,214,376 | | | | (12,994 | ) |
| Sell | | | 10/23/2015 | | | Mexican Peso | | | 88,300,000 | | | | 5,214,376 | | | | 301,892 | |
| | | | | | | | | | | | | | | | | | |
| Total | | | | | | | | | | | | | | | | $ | 263,407 | |
| | | | | | | | | | | | | | | | | | |
1 Counterparty is Bank of America, N.A.
At September 30, 2015, open short futures contracts were as follows:
| | | | | | | | | | | | | | |
| Financial Futures | | Expiration
Date | | | Contracts | | Notional
Value | | | Unrealized
Appreciation
(Depreciation) | |
| 10 Year U.S. Treasury Note | | | 12/21/2015 | | | 69 | | $ | 8,882,672 | | | $ | (100,583 | ) |
| 30 Year U.S. Treasury Bond | | | 12/21/2015 | | | 23 | | | 3,618,906 | | | | (60,285 | ) |
| | | | | | | | | | | | | | |
| Total | | | | | | | | | | | | $ | (160,868 | ) |
| | | | | | | | | | | | | | |
See accompanying notes to financial statements.
53 |
Portfolio of Investments – as of September 30, 2015
Loomis Sayles High Income Fund – (continued)
Industry Summary at September 30, 2015
| | | | |
Independent Energy | | | 8.2 | % |
Finance Companies | | | 6.6 | |
Midstream | | | 6.2 | |
Treasuries | | | 6.0 | |
Cable Satellite | | | 5.3 | |
Technology | | | 5.3 | |
Healthcare | | | 5.1 | |
Banking | | | 5.0 | |
Supranational | | | 3.2 | |
ABS Home Equity | | | 3.1 | |
Metals & Mining | | | 3.1 | |
Pharmaceuticals | | | 2.6 | |
Wirelines | | | 2.6 | |
Electric | | | 2.3 | |
Aerospace & Defense | | | 2.3 | |
Building Materials | | | 2.2 | |
Wireless | | | 2.2 | |
Consumer Cyclical Services | | | 2.1 | |
Non-Agency Commercial Mortgage-Backed Securities | | | 2.1 | |
Home Construction | | | 2.0 | |
Other Investments, less than 2% each | | | 19.8 | |
Short-Term Investments | | | 0.9 | |
| | | | |
Total Investments | | | 98.2 | |
Other assets less liabilities (including forward foreign currency contracts and futures contracts) | | | 1.8 | |
| | | | |
Net Assets | | | 100.0 | % |
| | | | |
See accompanying notes to financial statements.
| 54
Portfolio of Investments – as of September 30, 2015
Loomis Sayles Limited Term Government and Agency Fund
| | | | | | | | |
Principal Amount | | | Description | | Value (†) | |
| | | | | | | | |
| | Bonds and Notes — 97.2% of Net Assets | | | | |
| | | | ABS Car Loan — 1.7% | | | | |
| $ | 4,150,000 | | | CPS Auto Receivables Trust, Series 2015-C, Class A, 1.770%, 6/17/2019, 144A | | $ | 4,152,299 | |
| | 1,165,000 | | | Credit Acceptance Auto Loan Trust, Series 2013-2A, Class A,
1.500%, 4/15/2021, 144A | | | 1,165,861 | |
| | 2,695,000 | | | Credit Acceptance Auto Loan Trust, Series 2014-2A, Class A,
1.880%, 3/15/2022, 144A | | | 2,695,032 | |
| | 1,045,000 | | | First Investors Auto Owner Trust, Series 2014-1A, Class A3,
1.490%, 1/15/2020, 144A | | | 1,044,639 | |
| | 3,500,000 | | | NextGear Floorplan Master Owner Trust, Series 2014-1A, Class A,
1.920%, 10/15/2019, 144A | | | 3,518,326 | |
| | 2,120,000 | | | Tidewater Auto Receivables Trust, Series 2014-AA, Class A3,
1.400%, 7/15/2018, 144A | | | 2,121,601 | |
| | | | | | | | |
| | | | | | | 14,697,758 | |
| | | | | | | | |
| | | | ABS Home Equity — 0.3% | | | | |
| | 2,804,253 | | | Towd Point Mortgage Trust, Series 2015-2, Class 1AE2,
2.750%, 11/25/2060, 144A | | | 2,810,591 | |
| | | | | | | | |
| | | | Agency Commercial Mortgage-Backed Securities — 10.6% | | | | |
| | 6,000,000 | | | FHLMC Multifamily Structured Pass Through Certificates, Series K006, Class A2,
4.251%, 1/25/2020 | | | 6,615,162 | |
| | 4,305,000 | | | FHLMC Multifamily Structured Pass Through Certificates, Series K014, Class A2,
3.871%, 4/25/2021 | | | 4,725,224 | |
| | 4,000,000 | | | FHLMC Multifamily Structured Pass Through Certificates, Series K015, Class A2,
3.230%, 7/25/2021 | | | 4,263,156 | |
| | 6,625,000 | | | FHLMC Multifamily Structured Pass Through Certificates, Series K017, Class A2,
2.873%, 12/25/2021 | | | 6,928,869 | |
| | 3,535,000 | | | FHLMC Multifamily Structured Pass Through Certificates, Series K703, Class A2,
2.699%, 5/25/2018 | | | 3,657,067 | |
| | 700,000 | | | FHLMC Multifamily Structured Pass Through Certificates, Series K704, Class A2,
2.412%, 8/25/2018 | | | 719,838 | |
| | 2,590,000 | | | FHLMC Multifamily Structured Pass Through Certificates, Series K706, Class A2,
2.323%, 10/25/2018 | | | 2,660,013 | |
| | 7,910,000 | | | FHLMC Multifamily Structured Pass Through Certificates, Series K708, Class A2,
2.130%, 1/25/2019 | | | 8,080,508 | |
| | 34,370,000 | | | FHLMC Multifamily Structured Pass Through Certificates, Series K711, Class A2,
1.730%, 7/25/2019 | | | 34,608,769 | |
| | 681,060 | | | FHLMC Multifamily Structured Pass Through Certificates, Series KF01, Class A,
0.549%, 4/25/2019(b) | | | 679,664 | |
| | 2,253,042 | | | FHLMC Multifamily Structured Pass Through Certificates, Series KF06, Class A,
0.522%, 11/25/2021(b) | | | 2,246,891 | |
| | 239,108 | | | Government National Mortgage Association, Series 2003-72, Class Z,
5.249%, 11/16/2045(b) | | | 259,089 | |
| | 204,548 | | | Government National Mortgage Association, Series 2003-88, Class Z,
4.898%, 3/16/2046(b) | | | 220,674 | |
| | 13,260,000 | | | Government National Mortgage Association, Series 2013-52, Class KX,
3.929%, 8/16/2051(b) | | | 14,113,679 | |
| | | | | | | | |
| | | | | | | 89,778,603 | |
| | | | | | | | |
See accompanying notes to financial statements.
55 |
Portfolio of Investments – as of September 30, 2015
Loomis Sayles Limited Term Government and Agency Fund – (continued)
| | | | | | | | |
Principal Amount | | | Description | | Value (†) | |
| | | | | | | | |
| | | | Collateralized Mortgage Obligations — 15.7% | | | | |
| $ | 126,334 | | | Federal Home Loan Mortgage Corp., REMIC, Series 1500, Class FD,
1.670%, 5/15/2023(b) | | $ | 124,076 | |
| | 83,723 | | | Federal Home Loan Mortgage Corp., REMIC, Series 1552, Class I,
1.470%, 8/15/2023(b) | | | 84,622 | |
| | 315,988 | | | Federal Home Loan Mortgage Corp., REMIC, Series 2131, Class ZB,
6.000%, 3/15/2029 | | | 349,536 | |
| | 246,422 | | | Federal Home Loan Mortgage Corp., REMIC, Series 2646, Class FM,
0.607%, 11/15/2032(b) | | | 247,200 | |
| | 1,760,575 | | | Federal Home Loan Mortgage Corp., REMIC, Series 2874, Class BC,
5.000%, 10/15/2019 | | | 1,854,225 | |
| | 2,713,828 | | | Federal Home Loan Mortgage Corp., REMIC, Series 2931, Class DE,
4.000%, 2/15/2020 | | | 2,820,493 | |
| | 2,651,042 | | | Federal Home Loan Mortgage Corp., REMIC, Series 2978, Class JG,
5.500%, 5/15/2035 | | | 2,944,435 | |
| | 3,510,000 | | | Federal Home Loan Mortgage Corp., REMIC, Series 3036, Class NE,
5.000%, 9/15/2035 | | | 3,932,186 | |
| | 1,757,854 | | | Federal Home Loan Mortgage Corp., REMIC, Series 3057, Class PE,
5.500%, 11/15/2034 | | | 1,797,144 | |
| | 4,805,716 | | | Federal Home Loan Mortgage Corp., REMIC, Series 3412, Class AY,
5.500%, 2/15/2038 | | | 5,269,669 | |
| | 2,443,071 | | | Federal Home Loan Mortgage Corp., REMIC, Series 3561, Class W,
3.915%, 6/15/2048(b) | | | 2,480,255 | |
| | 3,087,434 | | | Federal Home Loan Mortgage Corp., REMIC, Series 3620, Class AT,
4.323%, 12/15/2036(b) | | | 3,239,737 | |
| | 78,433 | | | Federal Home Loan Mortgage Corp., REMIC, Series 3802, Class BA,
4.500%, 11/15/2028 | | | 79,438 | |
| | 927,995 | | | Federal Home Loan Mortgage Corp., REMIC, Series 4212, Class FW,
2.307%, 6/15/2043(b) | | | 937,923 | |
| | 1,846,623 | | | Federal National Mortgage Association, REMIC, Series 2003-48, Class GH,
5.500%, 6/25/2033 | | | 2,095,953 | |
| | 95,126 | | | Federal National Mortgage Association, REMIC, Series 1992-162, Class FB,
1.870%, 9/25/2022(b) | | | 97,113 | |
| | 82,481 | | | Federal National Mortgage Association, REMIC, Series 1994-42, Class FD,
1.620%, 4/25/2024(b) | | | 83,652 | |
| | 20,876 | | | Federal National Mortgage Association, REMIC, Series 2002-W10, Class A7,
3.767%, 8/25/2042(b) | | | 20,837 | |
| | 1,397,725 | | | Federal National Mortgage Association, REMIC, Series 2005-100, Class BQ,
5.500%, 11/25/2025 | | | 1,526,229 | |
| | 1,152,304 | | | Federal National Mortgage Association, REMIC, Series 2005-33, Class QD,
5.000%, 1/25/2034 | | | 1,194,370 | |
| | 1,500,624 | | | Federal National Mortgage Association, REMIC, Series 2007-73, Class A1,
0.254%, 7/25/2037(b) | | | 1,410,697 | |
| | 2,928,554 | | | Federal National Mortgage Association, REMIC, Series 2008-86, Class LA,
3.659%, 8/25/2038(b) | | | 3,148,427 | |
| | 5,412,360 | | | Federal National Mortgage Association, REMIC, Series 2013-67, Class NF,
1.194%, 7/25/2043(b) | | | 5,249,746 | |
| | 68,379 | | | Federal National Mortgage Association, REMIC, Series G93-19, Class FD,
1.570%, 4/25/2023(b) | | | 69,174 | |
See accompanying notes to financial statements.
| 56
Portfolio of Investments – as of September 30, 2015
Loomis Sayles Limited Term Government and Agency Fund – (continued)
| | | | | | | | |
Principal Amount | | | Description | | Value (†) | |
| | | | | | | | |
| | | | Collateralized Mortgage Obligations — continued | | | | |
| $ | 12,777 | | | FHLMC Structured Pass Through Securities, Series T-60, Class 2A1,
3.329%, 3/25/2044(b) | | $ | 13,465 | |
| | 8,403,981 | | | Government National Mortgage Association, 0.492%, 7/20/2065(b) | | | 8,379,812 | |
| | 1,490,853 | | | Government National Mortgage Association, Series 2010-H20, Class AF,
0.522%, 10/20/2060(b) | | | 1,481,288 | |
| | 1,331,200 | | | Government National Mortgage Association, Series 2010-H24, Class FA,
0.542%, 10/20/2060(b) | | | 1,326,061 | |
| | 1,230,246 | | | Government National Mortgage Association, Series 2011-H06, Class FA,
0.642%, 2/20/2061(b) | | | 1,228,740 | |
| | 2,569,260 | | | Government National Mortgage Association, Series 2012-124, Class HT,
7.218%, 7/20/2032(b) | | | 2,932,404 | |
| | 5,912,726 | | | Government National Mortgage Association, Series 2012-H15, Class FA,
0.642%, 5/20/2062(b) | | | 5,923,646 | |
| | 1,404,127 | | | Government National Mortgage Association, Series 2012-H18, Class NA,
0.712%, 8/20/2062(b) | | | 1,405,903 | |
| | 7,332,773 | | | Government National Mortgage Association, Series 2012-H29, Class HF,
0.692%, 10/20/2062(b) | | | 7,341,455 | |
| | 6,921,265 | | | Government National Mortgage Association, Series 2013-H02, Class GF,
0.692%, 12/20/2062(b) | | | 6,931,267 | |
| | 5,107,925 | | | Government National Mortgage Association, Series 2013-H08, Class FA,
0.542%, 3/20/2063(b) | | | 5,080,986 | |
| | 4,175,131 | | | Government National Mortgage Association, Series 2013-H10, Class FA,
0.592%, 3/20/2063(b) | | | 4,166,492 | |
| | 13,098,184 | | | Government National Mortgage Association, Series 2013-H22, Class FT,
0.980%, 4/20/2063(b) | | | 13,293,831 | |
| | 7,776,056 | | | Government National Mortgage Association, Series 2014-H14, Class FA,
0.692%, 7/20/2064(b) | | | 7,756,017 | |
| | 5,376,093 | | | Government National Mortgage Association, Series 2014-H15, Class FA,
0.692%, 7/20/2064(b) | | | 5,366,959 | |
| | 11,172,580 | | | Government National Mortgage Association, Series 2015-H10, Class JA,
2.250%, 4/20/2065 | | | 11,289,735 | |
| | 3,867,734 | | | Government National Mortgage Association, Series 2015-H11, Class FA,
0.442%, 4/20/2065(b) | | | 3,849,277 | |
| | 470,830 | | | NCUA Guaranteed Notes, Series 2010-A1, Class A, 0.554%, 12/07/2020(b) | | | 470,389 | |
| | 1,078,026 | | | NCUA Guaranteed Notes, Series 2010-R1, Class 1A, 0.653%, 10/07/2020(b) | | | 1,083,329 | |
| | 1,593,862 | | | NCUA Guaranteed Notes, Series 2010-R3, Class 1A, 0.763%, 12/08/2020(b) | | | 1,605,009 | |
| | 101,404 | | | NCUA Guaranteed Notes, Series 2010-R3, Class 2A, 0.763%, 12/08/2020(b) | | | 102,083 | |
| | | | | | | | |
| | | | | | | 132,085,285 | |
| | | | | | | | |
| | | | Hybrid ARMs — 15.5% | | | | |
| | 1,331,952 | | | FHLMC, 2.124%, 6/01/2037(b) | | | 1,405,983 | |
| | 745,868 | | | FHLMC, 2.312%, 11/01/2038(b) | | | 793,115 | |
| | 1,546,424 | | | FHLMC, 2.368%, 4/01/2036(b) | | | 1,638,043 | |
| | 967,155 | | | FHLMC, 2.400%, 4/01/2037(b) | | | 1,027,047 | |
| | 378,881 | | | FHLMC, 2.409%, 9/01/2038(b) | | | 403,264 | |
| | 4,649,040 | | | FHLMC, 2.419%, 2/01/2036(b) | | | 4,941,925 | |
| | 2,213,168 | | | FHLMC, 2.426%, 2/01/2036(b) | | | 2,360,825 | |
| | 1,159,707 | | | FHLMC, 2.433%, 11/01/2038(b) | | | 1,236,085 | |
See accompanying notes to financial statements.
57 |
Portfolio of Investments – as of September 30, 2015
Loomis Sayles Limited Term Government and Agency Fund – (continued)
| | | | | | | | |
Principal Amount | | | Description | | Value (†) | |
| | | | | | | | |
| | | | Hybrid ARMs — continued | | | | |
| $ | 6,970,887 | | | FHLMC, 2.440%, 3/01/2037(b) | | $ | 7,409,942 | |
| | 1,733,771 | | | FHLMC, 2.469%, 9/01/2038(b) | | | 1,844,221 | |
| | 2,735,086 | | | FHLMC, 2.470%, 7/01/2033(b) | | | 2,899,358 | |
| | 3,904,448 | | | FHLMC, 2.470%, 9/01/2035(b) | | | 4,149,454 | |
| | 2,178,905 | | | FHLMC, 2.477%, 3/01/2036(b) | | | 2,310,487 | |
| | 3,137,970 | | | FHLMC, 2.483%, 4/01/2037(b) | | | 3,347,922 | |
| | 712,493 | | | FHLMC, 2.487%, 2/01/2035(b) | | | 764,524 | |
| | 1,821,022 | | | FHLMC, 2.522%, 3/01/2038(b) | | | 1,941,463 | |
| | 778,927 | | | FHLMC, 2.582%, 12/01/2034(b) | | | 830,203 | |
| | 710,339 | | | FHLMC, 2.805%, 3/01/2037(b) | | | 765,292 | |
| | 1,317,396 | | | FHLMC, 2.992%, 9/01/2038(b) | | | 1,395,479 | |
| | 154,304 | | | FHLMC, 4.818%, 12/01/2037(b) | | | 162,027 | |
| | 263,281 | | | FNMA, 1.922%, 2/01/2037(b) | | | 275,351 | |
| | 2,594,972 | | | FNMA, 1.936%, 7/01/2035(b) | | | 2,716,597 | |
| | 4,166,156 | | | FNMA, 2.234%, 4/01/2037(b) | | | 4,392,328 | |
| | 847,956 | | | FNMA, 2.238%, 10/01/2033(b) | | | 898,811 | |
| | 4,206,875 | | | FNMA, 2.247%, 7/01/2035(b) | | | 4,452,948 | |
| | 5,773,005 | | | FNMA, 2.265%, 9/01/2037(b) | | | 6,167,812 | |
| | 2,330,097 | | | FNMA, 2.282%, 4/01/2037(b) | | | 2,476,326 | |
| | 1,426,519 | | | FNMA, 2.310%, 1/01/2036(b) | | | 1,521,742 | |
| | 770,409 | | | FNMA, 2.332%, 9/01/2034(b) | | | 817,436 | |
| | 785,838 | | | FNMA, 2.349%, 12/01/2034(b) | | | 837,236 | |
| | 3,757,429 | | | FNMA, 2.364%, 11/01/2033(b) | | | 3,985,916 | |
| | 970,881 | | | FNMA, 2.380%, 8/01/2038(b) | | | 1,035,034 | |
| | 5,666,485 | | | FNMA, 2.386%, 4/01/2034(b) | | | 6,016,741 | |
| | 1,539,441 | | | FNMA, 2.395%, 9/01/2036(b) | | | 1,636,939 | |
| | 501,723 | | | FNMA, 2.405%, 8/01/2035(b) | | | 532,780 | |
| | 1,186,907 | | | FNMA, 2.406%, 8/01/2034(b) | | | 1,265,109 | |
| | 5,345,369 | | | FNMA, 2.426%, 3/01/2037(b) | | | 5,695,971 | |
| | 3,748,056 | | | FNMA, 2.437%, 9/01/2037(b) | | | 3,986,526 | |
| | 7,559,953 | | | FNMA, 2.438%, 10/01/2034(b) | | | 8,037,209 | |
| | 1,635,810 | | | FNMA, 2.445%, 2/01/2047(b) | | | 1,746,882 | |
| | 1,799,098 | | | FNMA, 2.450%, 6/01/2036(b) | | | 1,918,708 | |
| | 2,590,727 | | | FNMA, 2.453%, 10/01/2033(b) | | | 2,751,307 | |
| | 1,759,002 | | | FNMA, 2.453%, 4/01/2034(b) | | | 1,866,410 | |
| | 910,397 | | | FNMA, 2.454%, 2/01/2037(b) | | | 968,882 | |
| | 416,166 | | | FNMA, 2.455%, 4/01/2033(b) | | | 441,756 | |
| | 3,321,880 | | | FNMA, 2.473%, 8/01/2035(b) | | | 3,517,206 | |
| | 4,846,105 | | | FNMA, 2.530%, 6/01/2037(b) | | | 5,202,758 | |
| | 1,988,197 | | | FNMA, 2.537%, 6/01/2033(b) | | | 2,106,773 | |
| | 4,812,687 | | | FNMA, 2.550%, 7/01/2037(b) | | | 5,123,955 | |
| | 1,522,741 | | | FNMA, 2.679%, 5/01/2035(b) | | | 1,635,228 | |
| | 418,979 | | | FNMA, 2.682%, 8/01/2033(b) | | | 446,304 | |
| | 569,391 | | | FNMA, 2.698%, 8/01/2036(b) | | | 608,504 | |
| | 965,069 | | | FNMA, 2.854%, 7/01/2041(b) | | | 1,011,346 | |
| | 2,468,688 | | | FNMA, 3.223%, 6/01/2035(b) | | | 2,642,021 | |
| | | | | | | | |
| | | | | | | 130,363,511 | |
| | | | | | | | |
See accompanying notes to financial statements.
| 58
Portfolio of Investments – as of September 30, 2015
Loomis Sayles Limited Term Government and Agency Fund – (continued)
| | | | | | | | |
Principal Amount | | | Description | | Value (†) | |
| | | | | | | | |
| | | | Mortgage Related — 19.3% | | | | |
| $ | 145,835 | | | FHLMC, 3.000%, 10/01/2026 | | $ | 151,995 | |
| | 1,044,738 | | | FHLMC, 4.000%, with various maturities from 2024 to 2042(c) | | | 1,116,041 | |
| | 815,780 | | | FHLMC, 4.500%, with various maturities from 2025 to 2034(c) | | | 872,312 | |
| | 360,504 | | | FHLMC, 5.500%, 10/01/2023 | | | 393,191 | |
| | 33,459 | | | FHLMC, 6.000%, 11/01/2019 | | | 35,518 | |
| | 481,905 | | | FHLMC, 6.500%, with various maturities from 2017 to 2034(c) | | | 557,327 | |
| | 4,010 | | | FHLMC, 7.000%, 2/01/2016 | | | 4,030 | |
| | 539 | | | FHLMC, 7.500%, 6/01/2026 | | | 621 | |
| | 1,612 | | | FHLMC, 10.000%, 7/01/2019 | | | 1,753 | |
| | 24,352 | | | FHLMC, 11.500%, 4/01/2020 | | | 24,805 | |
| | 200,621 | | | FNMA, 3.000%, 3/01/2042 | | | 203,869 | |
| | 2,869,735 | | | FNMA, 5.000%, with various maturities from 2037 to 2038(c) | | | 3,176,383 | |
| | 1,443,411 | | | FNMA, 5.500%, with various maturities from 2018 to 2033(c) | | | 1,610,274 | |
| | 2,292,867 | | | FNMA, 6.000%, with various maturities from 2017 to 2022(c) | | | 2,532,667 | |
| | 336,868 | | | FNMA, 6.500%, with various maturities from 2017 to 2037(c) | | | 382,576 | |
| | 19,106 | | | FNMA, 7.000%, 12/01/2022 | | | 19,164 | |
| | 113,436 | | | FNMA, 7.500%, with various maturities from 2017 to 2032(c) | | | 131,013 | |
| | 561 | | | FNMA, 8.000%, 5/01/2016 | | | 564 | |
| | 4,920,020 | | | GNMA, 1.868%, 2/20/2061(b) | | | 5,127,876 | |
| | 3,769,552 | | | GNMA, 2.077%, 2/20/2063(b) | | | 3,948,255 | |
| | 4,660,869 | | | GNMA, 2.352%, 3/20/2063(b) | | | 4,936,261 | |
| | 2,663,276 | | | GNMA, 2.564%, 2/20/2063(b) | | | 2,832,874 | |
| | 4,430,433 | | | GNMA, 4.479%, 2/20/2062 | | | 4,761,931 | |
| | 4,612,167 | | | GNMA, 4.521%, 12/20/2061 | | | 4,942,334 | |
| | 6,923,353 | | | GNMA, 4.532%, 12/20/2062 | | | 7,547,881 | |
| | 18,065,706 | | | GNMA, 4.556%, 12/20/2061 | | | 19,333,973 | |
| | 2,291,013 | | | GNMA, 4.560%, 3/20/2062 | | | 2,459,991 | |
| | 12,388,989 | | | GNMA, 4.583%, 11/20/2062 | | | 13,461,776 | |
| | 1,501,360 | | | GNMA, 4.599%, 4/20/2063 | | | 1,643,580 | |
| | 4,341,803 | | | GNMA, 4.604%, 6/20/2062 | | | 4,689,846 | |
| | 1,452,170 | | | GNMA, 4.616%, 8/20/2061 | | | 1,544,588 | |
| | 1,842,992 | | | GNMA, 4.639%, 3/20/2062 | | | 1,981,901 | |
| | 7,782,336 | | | GNMA, 4.659%, 2/20/2062 | | | 8,376,245 | |
| | 9,315,158 | | | GNMA, 4.685%, 8/20/2061 | | | 9,859,033 | |
| | 3,662,786 | | | GNMA, 4.689%, 2/20/2062 | | | 3,928,979 | |
| | 1,891,717 | | | GNMA, 4.698%, 7/20/2061 | | | 2,006,111 | |
| | 8,125,557 | | | GNMA, 4.700%, with various maturities in 2061(c) | | | 8,636,082 | |
| | 1,785,270 | | | GNMA, 4.717%, 3/20/2061 | | | 1,888,762 | |
| | 1,492,773 | | | GNMA, 4.808%, 8/20/2062 | | | 1,599,642 | |
| | 782,874 | | | GNMA, 5.167%, 4/20/2061 | | | 834,156 | |
| | 21,222 | | | GNMA, 6.000%, 12/15/2031 | | | 24,543 | |
| | 96,304 | | | GNMA, 6.500%, 5/15/2031 | | | 113,865 | |
| | 100,076 | | | GNMA, 7.000%, 10/15/2028 | | | 115,811 | |
| | 4,755,627 | | | Government National Mortgage Association, Series 2015-H04, Class FL,
0.662%, 2/20/2065(b) | | | 4,756,388 | |
| | 7,152,002 | | | Government National Mortgage Association, Series 2015-H05, Class FA,
0.492%, 4/20/2061(b) | | | 7,125,225 | |
See accompanying notes to financial statements.
59 |
Portfolio of Investments – as of September 30, 2015
Loomis Sayles Limited Term Government and Agency Fund – (continued)
| | | | | | | | |
Principal Amount | | | Description | | Value (†) | |
| | | | | | | | |
| | | | Mortgage Related — continued | | | | |
| $ | 15,879,318 | | | Government National Mortgage Association, Series 2015-H09, Class HA,
1.750%, 3/20/2065 | | $ | 16,047,036 | |
| | 7,313,506 | | | Government National Mortgage Association, Series 2015-H12, Class FL,
0.422%, 5/20/2065(b) | | | 7,233,043 | |
| | | | | | | | |
| | | | | | | 162,972,091 | |
| | | | | | | | |
| | | | Non-Agency Commercial Mortgage-Backed Securities — 6.4% | | | | |
| | 1,199,364 | | | A10 Securitization LLC, Series 2014-1, Class A1, 1.720%, 4/15/2033, 144A | | | 1,196,912 | |
| | 1,780,000 | | | Banc of America Merrill Lynch Commercial Mortgage, Inc., Series 2007-2,
Class A4, 5.784%, 4/10/2049(b) | | | 1,846,955 | |
| | 319,287 | | | Banc of America Merrill Lynch Commercial Mortgage, Inc., Series 2007-5,
Class A4, 5.492%, 2/10/2051 | | | 335,523 | |
| | 3,700,000 | | | CDGJ Commercial Mortgage Trust Pass Through Certificates,
Series 2014-BXCH, 1.607%, 12/15/2027, 144A(b) | | | 3,676,035 | |
| | 3,215,000 | | | CG-CCRE Commercial Mortgage Trust, Series 2014-FL1, Class A,
1.148%, 6/15/2031, 144A(b) | | | 3,201,295 | |
| | 3,040,000 | | | Commercial Mortgage Trust, Series 2014-FL5, Class SV1,
2.048%, 10/15/2031, 144A(b)(d) | | | 3,037,972 | |
| | 2,981,147 | | | GP Portfolio Trust, Series 2014-GPP, Class A, 1.157%, 2/15/2027, 144A(b) | | | 2,963,448 | |
| | 4,140,377 | | | Greenwich Capital Commercial Funding Corp., Series 2007-GG11, Class A4,
5.736%, 12/10/2049 | | | 4,346,605 | |
| | 4,228,779 | | | Greenwich Capital Commercial Funding Corp., Series 2007-GG9, Class A4,
5.444%, 3/10/2039 | | | 4,389,650 | |
| | 5,535,000 | | | JPMorgan Chase Commercial Mortgage Securities Corp., Series 2014-CBM,
Class A, 1.107%, 10/15/2029, 144A(b) | | | 5,492,065 | |
| | 248,913 | | | JPMorgan Chase Commercial Mortgage Securities Trust, Series 2006-CB15,
Class A4, 5.814%, 6/12/2043(b) | | | 252,112 | |
| | 2,380,000 | | | JPMorgan Chase Commercial Mortgage Securities Trust, Series 2014-FL5,
Class A, 1.187%, 7/15/2031, 144A(b) | | | 2,363,469 | |
| | 4,115,000 | | | JPMorgan Chase Commercial Mortgage Securities Trust, Series 2015-SGP,
Class A, 1.894%, 7/15/2036, 144A(b) | | | 4,115,000 | |
| | 1,627,874 | | | LB-UBS Commercial Mortgage Trust, Series 2007-C2, Class A3,
5.430%, 2/15/2040 | | | 1,696,163 | |
| | 1,067,710 | | | Merrill Lynch/Countrywide Commercial Mortgage Trust, Series 2007-5,
Class A4, 5.378%, 8/12/2048 | | | 1,107,395 | |
| | 375,103 | | | Morgan Stanley Capital I, Series 2007-HQ12, Class A5, 5.902%, 4/12/2049(b) | | | 374,503 | |
| | 667,774 | | | PFP III Ltd., Series 2014-1, Class A, 1.629%, 6/14/2031, 144A(b) | | | 667,365 | |
| | 3,420,000 | | | Resource Capital Corp. Ltd., Series 2014-CRE2, Class A,
1.257%, 4/15/2032, 144A(b) | | | 3,396,836 | |
| | 3,700,000 | | | Starwood Retail Property Trust, Inc., 1.427%, 11/15/2027, 144A(b) | | | 3,668,916 | |
| | 3,816,030 | | | Wachovia Bank Commercial Mortgage Trust, Series 2006-C28, Class A4,
5.572%, 10/15/2048 | | | 3,909,076 | |
| | 1,402,310 | | | Wachovia Bank Commercial Mortgage Trust, Series 2007-C34, Class A3,
5.678%, 5/15/2046 | | | 1,480,651 | |
| | | | | | | | |
| | | | | | | 53,517,946 | |
| | | | | | | | |
See accompanying notes to financial statements.
| 60
Portfolio of Investments – as of September 30, 2015
Loomis Sayles Limited Term Government and Agency Fund – (continued)
| | | | | | | | |
Principal Amount | | | Description | | Value (†) | |
| | | | | | | | |
| | | | Sovereigns — 0.2% | | | | |
| $ | 1,955,000 | | | U.S. Department of Housing and Urban Development, Series 4,
1.880%, 8/01/2019 | | $ | 1,992,829 | |
| | | | | | | | |
| | | | Treasuries — 27.5% | | | | |
| | 8,060,000 | | | U.S. Treasury Note, 0.625%, 6/30/2017 | | | 8,064,618 | |
| | 8,375,000 | | | U.S. Treasury Note, 0.750%, 3/31/2018 | | | 8,363,007 | |
| | 31,080,000 | | | U.S. Treasury Note, 0.875%, 10/15/2017 | | | 31,208,702 | |
| | 30,745,000 | | | U.S. Treasury Note, 0.875%, 1/15/2018 | | | 30,827,458 | |
| | 12,805,000 | | | U.S. Treasury Note, 1.000%, 12/15/2017 | | | 12,884,365 | |
| | 38,250,000 | | | U.S. Treasury Note, 1.125%, 6/15/2018 | | | 38,511,477 | |
| | 8,120,000 | | | U.S. Treasury Note, 1.250%, 10/31/2018 | | | 8,189,361 | |
| | 23,950,000 | | | U.S. Treasury Note, 1.250%, 1/31/2020 | | | 23,924,422 | |
| | 4,860,000 | | | U.S. Treasury Note, 1.500%, 5/31/2020 | | | 4,902,272 | |
| | 21,810,000 | | | U.S. Treasury Note, 1.625%, 3/31/2019 | | | 22,209,843 | |
| | 2,385,000 | | | U.S. Treasury Note, 1.625%, 8/31/2019 | | | 2,425,929 | |
| | 10,050,000 | | | U.S. Treasury Note, 1.625%, 12/31/2019 | | | 10,200,750 | |
| | 17,125,000 | | | U.S. Treasury Note, 1.625%, 7/31/2020 | | | 17,334,165 | |
| | 6,140,000 | | | U.S. Treasury Note, 1.750%, 9/30/2022 | | | 6,136,801 | |
| | 6,265,000 | | | U.S. Treasury Note, 2.125%, 8/31/2020 | | | 6,483,135 | |
| | | | | | | | |
| | | | | | | 231,666,305 | |
| | | | | | | | |
| | | | Total Bonds and Notes (Identified Cost $820,727,322) | | | 819,884,919 | |
| | | | | | | | |
| | | | | | | | |
| | Short-Term Investments — 2.9% | | | | |
| | 10,330,000 | | | Federal Home Loan Bank Discount Notes, 0.050%, 11/02/2015(e) | | | 10,329,401 | |
| | 14,220,457 | | | Tri-Party Repurchase Agreement with Fixed Income Clearing Corporation, dated 9/30/2015 at 0.010% to be repurchased at $14,220,461 on 10/01/2015 collateralized by $14,665,000 U.S. Treasury Note, 1.500% due 1/31/2022 valued at $14,508,450 including accrued interest (Note 2 of Notes to Financial Statements) | | | 14,220,457 | |
| | | | | | | | |
| | | | Total Short-Term Investments (Identified Cost $24,549,998) | | | 24,549,858 | |
| | | | | | | | |
| | | | | | | | |
| | | | Total Investments — 100.1% (Identified Cost $845,277,320)(a) | | | 844,434,777 | |
| | | | Other assets less liabilities — (0.1)% | | | (580,652 | ) |
| | | | | | | | |
| | | | Net Assets — 100.0% | | $ | 843,854,125 | |
| | | | | | | | |
| | | | | | | | |
| | (†) | | | See Note 2 of Notes to Financial Statements. | | | | |
| | (a) | | | Federal Tax Information: | | | | |
| | | | At September 30, 2015, the net unrealized depreciation on investments based on a cost of $845,367,402 for federal income tax purposes was as follows: | |
| | | | Aggregate gross unrealized appreciation for all investments in which there is an excess of value over tax cost | | $ | 5,870,425 | |
| | | | Aggregate gross unrealized depreciation for all investments in which there is an excess of tax cost over value | | | (6,803,050 | ) |
| | | | | | | | |
| | | | Net unrealized depreciation | | $ | (932,625 | ) |
| | | | | | | | |
See accompanying notes to financial statements.
61 |
Portfolio of Investments – as of September 30, 2015
Loomis Sayles Limited Term Government and Agency Fund – (continued)
| | | | | | |
| | (b) | | | Variable rate security. Rate as of September 30, 2015 is disclosed. | | |
| | (c) | | | The Fund’s investment in mortgage related securities of Federal Home Loan Mortgage Corporation, Federal National Mortgage Association and Government National Mortgage Association are interests in separate pools of mortgages. All separate investments in securities of each issuer which have the same coupon rate have been aggregated for the purpose of presentation in the Portfolio of Investments. | | |
| | (d) | | | Illiquid security. At September 30, 2015, the value of this security amounted to $3,037,972 or 0.4% of net assets. Illiquid securities are deemed to be fair valued pursuant to the Fund’s pricing policies and procedures. See Note 2 of Notes to Financial Statements. | | |
| | (e) | | | Interest rate represents discount rate at time of purchase; not a coupon rate. | | |
| | | | | | |
| | 144A | | | All or a portion of these securities are exempt from registration under Rule 144A of the Securities Act of 1933. These securities may be resold in transactions exempt from registration, normally to qualified institutional buyers. At September 30, 2015, the value of Rule 144A holdings amounted to $51,287,662 or 6.1% of net assets. | | |
| | ABS | | | Asset-Backed Securities | | |
| | ARMs | | | Adjustable Rate Mortgages | | |
| | FHLMC | | | Federal Home Loan Mortgage Corp. | | |
| | FNMA | | | Federal National Mortgage Association | | |
| | GNMA | | | Government National Mortgage Association | | |
| | REMIC | | | Real Estate Mortgage Investment Conduit | | |
Industry Summary at September 30, 2015
| | | | |
Treasuries | | | 27.5 | % |
Mortgage Related | | | 19.3 | |
Collateralized Mortgage Obligations | | | 15.7 | |
Hybrid ARMs | | | 15.5 | |
Agency Commercial Mortgage-Backed Securities | | | 10.6 | |
Non-Agency Commercial Mortgage-Backed Securities | | | 6.4 | |
Other Investments, less than 2% each | | | 2.2 | |
Short-Term Investments | | | 2.9 | |
| | | | |
Total Investments | | | 100.1 | |
Other assets less liabilities | | | (0.1 | ) |
| | | | |
Net Assets | | | 100.0 | % |
| | | | |
See accompanying notes to financial statements.
| 62
Statements of Assets and Liabilities
September 30, 2015
| | | | | | | | | | | | |
| | | Core Plus
Bond Fund | | | High Income
Fund | | | Limited Term
Government
and Agency
Fund | |
ASSETS | | | | | | | | | | | | |
Investments at cost | | $ | 7,388,389,883 | | | $ | 180,881,744 | | | $ | 845,277,320 | |
Net unrealized depreciation | | | (378,384,718 | ) | | | (16,550,017 | ) | | | (842,543 | ) |
| | | | | | | | | | | | |
Investments at value | | | 7,010,005,165 | | | | 164,331,727 | | | | 844,434,777 | |
Cash | | | 177,099 | | | | — | | | | 94,509 | |
Receivable for Fund shares sold | | | 10,734,646 | | | | 70,968 | | | | 9,636,232 | |
Receivable for securities sold | | | 104,101,505 | | | | 2,364,913 | | | | 10,322,670 | |
Receivable for when-issued/delayed delivery securities sold (Note 2) | | | 721,865,212 | | | | — | | | | — | |
Collateral received for delayed delivery securities or forward foreign currency contracts (Notes 2 and 4) | | | 1,948,000 | | | | 278,566 | | | | — | |
Dividends and interest receivable | | | 65,880,437 | | | | 2,571,514 | | | | 2,772,449 | |
Unrealized appreciation on forward foreign currency contracts (Note 2) | | | — | | | | 301,892 | | | | — | |
Tax reclaims receivable | | | 15,030 | | | | 100 | | | | — | |
Receivable for variation margin on futures contracts (Note 2) | | | — | | | | 18,328 | | | | — | |
| | | | | | | | | | | | |
TOTAL ASSETS | | | 7,914,727,094 | | | | 169,938,008 | | | | 867,260,637 | |
| | | | | | | | | | | | |
LIABILITIES | | | | | | | | | | | | |
Payable for securities purchased | | | 16,979,482 | | | | 1,232,845 | | | | 18,562,115 | |
Payable for when-issued/delayed delivery securities purchased (Note 2) | | | 1,248,491,798 | | | | 420,000 | | | | — | |
Payable for Fund shares redeemed | | | 30,456,768 | | | | 238,359 | | | | 3,812,999 | |
Unrealized depreciation on forward foreign currency contracts (Note 2) | | | 3,135 | | | | 38,485 | | | | — | |
Due to brokers (Note 2) | | | 1,948,000 | | | | 278,566 | | | | — | |
Distributions payable | | | — | | | | — | | | | 329,820 | |
Management fees payable (Note 6) | | | 1,822,532 | | | | 58,386 | | | | 248,384 | |
Deferred Trustees’ fees (Note 6) | | | 294,558 | | | | 133,558 | | | | 270,830 | |
Administrative fees payable (Note 6) | | | 245,756 | | | | 6,191 | | | | 29,563 | |
Payable to distributor (Note 6d) | | | 48,571 | | | | 4,889 | | | | 4,333 | |
Other accounts payable and accrued expenses | | | 919,731 | | | | 208,357 | | | | 148,468 | |
| | | | | | | | | | | | |
TOTAL LIABILITIES | | | 1,301,210,331 | | | | 2,619,636 | | | | 23,406,512 | |
| | | | | | | | | | | | |
NET ASSETS | | $ | 6,613,516,763 | | | $ | 167,318,372 | | | $ | 843,854,125 | |
| | | | | | | | | | | | |
NET ASSETS CONSIST OF: | | | | | | | | | | | | |
Paid-in capital | | $ | 7,038,551,795 | | | $ | 183,112,242 | | | $ | 855,258,532 | |
Undistributed (Distributions in excess of) net investment income | | | (24,672,798 | ) | | | 61,927 | | | | 38,911 | |
Accumulated net realized gain (loss) on investments, futures contracts and foreign currency transactions | | | (21,843,320 | ) | | | 609,037 | | | | (10,600,775 | ) |
Net unrealized depreciation on investments, futures contracts and foreign currency translations | | | (378,518,914 | ) | | | (16,464,834 | ) | | | (842,543 | ) |
| | | | | | | | | | | | |
NET ASSETS | | $ | 6,613,516,763 | | | $ | 167,318,372 | | | $ | 843,854,125 | |
| | | | | | | | | | | | |
See accompanying notes to financial statements.
63 |
Statements of Assets and Liabilities (continued)
September 30, 2015
| | | | | | | | | | | | |
| | | Core Plus
Bond Fund | | | High Income
Fund | | | Limited Term
Government
and Agency
Fund | |
COMPUTATION OF NET ASSET VALUE AND OFFERING PRICE: | | | | | | | | | | | | |
Class A shares: | | | | | | | | | | | | |
Net assets | | $ | 912,661,701 | | | $ | 37,869,625 | | | $ | 346,317,011 | |
| | | | | | | | | | | | |
Shares of beneficial interest | | | 73,970,101 | | | | 9,493,697 | | | | 29,931,223 | |
| | | | | | | | | | | | |
Net asset value and redemption price per share | | $ | 12.34 | | | $ | 3.99 | | | $ | 11.57 | |
| | | | | | | | | | | | |
Offering price per share (100/[100-maximum sales charge] of net asset value) (Note 1) | | $ | 12.92 | | | $ | 4.18 | | | $ | 11.93 | |
| | | | | | | | | | | | |
Class B shares: (redemption price per share is equal to net asset value less any applicable contingent deferred sales charge) (Note 1) | | | | | | | | | | | | |
Net assets | | $ | 89,174 | | | $ | 2,475 | | | $ | 2,643,128 | |
| | | | | | | | | | | | |
Shares of beneficial interest | | | 7,187 | | | | 619 | | | | 228,721 | |
| | | | | | | | | | | | |
Net asset value and offering price per share | | $ | 12.41 | | | $ | 4.00 | | | $ | 11.56 | |
| | | | | | | | | | | | |
Class C shares: (redemption price per share is equal to net asset value less any applicable contingent deferred sales charge) (Note 1) | | | | | | | | | | | | |
Net assets | | $ | 354,284,534 | | | $ | 12,609,310 | | | $ | 63,167,138 | |
| | | | | | | | | | | | |
Shares of beneficial interest | | | 28,722,913 | | | | 3,153,387 | | | | 5,454,860 | |
| | | | | | | | | | | | |
Net asset value and offering price per share | | $ | 12.33 | | | $ | 4.00 | | | $ | 11.58 | |
| | | | | | | | | | | | |
Class N shares: | | | | | | | | | | | | |
Net assets | | $ | 2,209,109,859 | | | $ | — | | | $ | — | |
| | | | | | | | | | | | |
Shares of beneficial interest | | | 177,608,361 | | | | — | | | | — | |
| | | | | | | | | | | | |
Net asset value, offering and redemption price per share | | $ | 12.44 | | | $ | — | | | $ | — | |
| | | | | | | | | | | | |
Class Y shares: | | | | | | | | | | | | |
Net assets | | $ | 3,137,371,495 | | | $ | 116,836,962 | | | $ | 431,726,848 | |
| | | | | | | | | | | | |
Shares of beneficial interest | | | 252,374,522 | | | | 29,355,096 | | | | 37,197,009 | |
| | | | | | | | | | | | |
Net asset value, offering and redemption price per share | | $ | 12.43 | | | $ | 3.98 | | | $ | 11.61 | |
| | | | | | | | | | | | |
See accompanying notes to financial statements.
| 64
Statements of Operations
For the Year Ended September 30, 2015
| | | | | | | | | | | | |
| | | Core Plus
Bond Fund | | | High Income
Fund | | | Limited Term
Government
and Agency
Fund | |
INVESTMENT INCOME | | | | | | | | | | | | |
Interest | | $ | 209,831,815 | | | $ | 10,007,638 | | | $ | 15,234,240 | |
Dividends | | | 173,901 | | | | 678,019 | | | | — | |
Less net foreign taxes withheld | | | — | | | | (1,031 | ) | | | — | |
| | | | | | | | | | | | |
| | | 210,005,716 | | | | 10,684,626 | | | | 15,234,240 | |
| | | | | | | | | | | | |
Expenses | | | | | | | | | | | | |
Management fees (Note 6) | | | 18,852,460 | | | | 1,159,904 | | | | 2,812,348 | |
Service and distribution fees (Note 6) | | | 6,016,587 | | | | 253,780 | | | | 1,448,782 | |
Administrative fees (Note 6) | | | 2,462,399 | | | | 82,447 | | | | 327,599 | |
Trustees’ fees and expenses (Note 6) | | | 102,201 | | | | 18,127 | | | | 23,504 | |
Transfer agent fees and expenses (Note 6 and 7) | | | 3,661,302 | | | | 200,124 | | | | 578,014 | |
Audit and tax services fees | | | 53,058 | | | | 57,144 | | | | 55,749 | |
Custodian fees and expenses | | | 266,068 | | | | 51,418 | | | | 41,073 | |
Legal fees | | | 63,453 | | | | 2,208 | | | | 8,522 | |
Registration fees | | | 1,165,592 | | | | 92,511 | | | | 109,138 | |
Shareholder reporting expenses | | | 241,067 | | | | 16,457 | | | | 45,821 | |
Miscellaneous expenses | | | 78,541 | | | | 16,351 | | | | 22,184 | |
| | | | | | | | | | | | |
Total expenses | | | 32,962,728 | | | | 1,950,471 | | | | 5,472,734 | |
Less waiver and/or expense reimbursement (Note 6) | | | — | | | | (34,189 | ) | | | — | |
| | | | | | | | | | | | |
Net expenses | | | 32,962,728 | | | | 1,916,282 | | | | 5,472,734 | |
| | | | | | | | | | | | |
Net investment income | | | 177,042,988 | | | | 8,768,344 | | | | 9,761,506 | |
| | | | | | | | | | | | |
NET REALIZED AND UNREALIZED GAIN (LOSS) ON INVESTMENTS, FUTURES CONTRACTS AND FOREIGN CURRENCY TRANSACTIONS | | | | | | | | | | | | |
Net realized gain (loss) on: | | | | | | | | | | | | |
Investments | | | (41,502,080 | ) | | | 1,051,322 | | | | 4,686,019 | |
Futures contracts | | | — | | | | (207,831 | ) | | | — | |
Foreign currency transactions | | | (4,124,724 | ) | | | 576,927 | | | | — | |
Net change in unrealized appreciation (depreciation) on: | | | | | | | | | | | | |
Investments | | | (386,095,386 | ) | | | (19,011,656 | ) | | | (4,747,808 | ) |
Futures contracts | | | — | | | | (211,910 | ) | | | — | |
Foreign currency translations | | | 112,686 | | | | 142,815 | | | | — | |
| | | | | | | | | | | | |
Net realized and unrealized loss on investments, futures contracts and foreign currency transactions | | | (431,609,504 | ) | | | (17,660,333 | ) | | | (61,789 | ) |
| | | | | | | | | | | | |
NET INCREASE (DECREASE) IN NET ASSETS RESULTING FROM OPERATIONS | | $ | (254,566,516 | ) | | $ | (8,891,989 | ) | | $ | 9,699,717 | |
| | | | | | | | | | | | |
See accompanying notes to financial statements.
65 |
Statements of Changes in Net Assets
| | | | | | | | | | | | | | | | |
| | | Core Plus Bond Fund | | |
High Income Fund | |
| | | Year Ended
September 30,
2015 | | | Year Ended
September 30,
2014 | | | Year Ended
September 30,
2015 | | | Year Ended
September 30,
2014 | |
FROM OPERATIONS: | | | | | | | | | | | | | | | | |
Net investment income | | $ | 177,042,988 | | | $ | 50,461,918 | | | $ | 8,768,344 | | | $ | 8,288,158 | |
Net realized gain (loss) on investments, futures contracts and foreign currency transactions | | | (45,626,804 | ) | | | 24,167,793 | | | | 1,420,418 | | | | 4,801,655 | |
Net change in unrealized appreciation (depreciation) on investments, futures contracts and foreign currency translations | | | (385,982,700 | ) | | | 20,916,723 | | | | (19,080,751 | ) | | | 619,322 | |
| | | | | | | | | | | | | | | | |
Net increase (decrease) in net assets resulting from operations | | | (254,566,516 | ) | | | 95,546,434 | | | | (8,891,989 | ) | | | 13,709,135 | |
| | | | | | | | | | | | | | | | |
FROM DISTRIBUTIONS TO SHAREHOLDERS: | | | | | | | | | | | | | |
Net investment income | | | | | | | | | | | | | | | | |
Class A | | | (26,885,360 | ) | | | (16,342,911 | ) | | | (1,926,317 | ) | | | (2,319,281 | ) |
Class B | | | (7,582 | ) | | | (25,257 | ) | | | (2,085 | ) | | | (10,542 | ) |
Class C | | | (7,733,753 | ) | | | (5,957,503 | ) | | | (515,596 | ) | | | (607,126 | ) |
Class N | | | (49,766,784 | ) | | | (1,590,647 | ) | | | — | | | | — | |
Class Y | | | (87,014,555 | ) | | | (31,114,909 | ) | | | (6,296,139 | ) | | | (5,768,684 | ) |
Net realized capital gains | | | | | | | | | | | | | | | | |
Class A | | | (4,930,224 | ) | | | (136,985 | ) | | | (1,004,492 | ) | | | (2,541,543 | ) |
Class B | | | (3,385 | ) | | | (359 | ) | | | (2,711 | ) | | | (15,464 | ) |
Class C | | | (2,095,167 | ) | | | (68,534 | ) | | | (348,393 | ) | | | (825,367 | ) |
Class N | | | (4,180,187 | ) | | | (6,286 | ) | | | — | | | | — | |
Class Y | | | (12,020,152 | ) | | | (216,547 | ) | | | (3,159,866 | ) | | | (5,865,247 | ) |
| | | | | | | | | | | | | | | | |
Total distributions | | | (194,637,149 | ) | | | (55,459,938 | ) | | | (13,255,599 | ) | | | (17,953,254 | ) |
| | | | | | | | | | | | | | | | |
NET INCREASE IN NET ASSETS FROM CAPITAL SHARE TRANSACTIONS (NOTE 11) | | | 4,746,612,794 | | | | 959,743,921 | | | | 6,973,865 | | | | 17,157,058 | |
| | | | | | | | | | | | | | | | |
Net increase (decrease) in net assets | | | 4,297,409,129 | | | | 999,830,417 | | | | (15,173,723 | ) | | | 12,912,939 | |
NET ASSETS | | | | | | | | | | | | | | | | |
Beginning of the year | | | 2,316,107,634 | | | | 1,316,277,217 | | | | 182,492,095 | | | | 169,579,156 | |
| | | | | | | | | | | | | | | | |
End of the year | | $ | 6,613,516,763 | | | $ | 2,316,107,634 | | | $ | 167,318,372 | | | $ | 182,492,095 | |
| | | | | | | | | | | | | | | | |
UNDISTRIBUTED (DISTRIBUTIONS IN EXCESS OF) NET INVESTMENT INCOME | | $ | (24,672,798 | ) | | $ | 2,265,864 | | | $ | 61,927 | | | $ | (990,073 | ) |
| | | | | | | | | | | | | | | | |
See accompanying notes to financial statements.
| 66
Statements of Changes in Net Assets (continued)
| | | | | | | | |
| | | Limited Term Government and
Agency Fund | |
| | | Year Ended
September 30,
2015 | | | Year Ended
September 30,
2014 | |
FROM OPERATIONS: | | | | | | | | |
Net investment income | | $ | 9,761,506 | | | $ | 9,093,415 | |
Net realized gain on investments | | | 4,686,019 | | | | 685,538 | |
Net change in unrealized appreciation (depreciation) on investments | | | (4,747,808 | ) | | | (170,093 | ) |
| | | | | | | | |
Net increase (decrease) in net assets resulting from operations | | | 9,699,717 | | | | 9,608,860 | |
| | | | | | | | |
FROM DISTRIBUTIONS TO SHAREHOLDERS: | | | | | |
Net investment income | | | | | | | | |
Class A | | | (5,253,842 | ) | | | (7,143,858 | ) |
Class B | | | (29,227 | ) | | | (70,496 | ) |
Class C | | | (503,848 | ) | | | (819,006 | ) |
Class Y | | | (6,898,857 | ) | | | (5,695,825 | ) |
| | | | | | | | |
Total distributions | | | (12,685,774 | ) | | | (13,729,185 | ) |
| | | | | | | | |
NET INCREASE IN NET ASSETS FROM CAPITAL SHARE TRANSACTIONS (NOTE 11) | | | 141,117,260 | | | | 24,611,252 | |
| | | | | | | | |
Net increase (decrease) in net assets | | | 138,131,203 | | | | 20,490,927 | |
NET ASSETS | | | | | | | | |
Beginning of the year | | | 705,722,922 | | | | 685,231,995 | |
| | | | | | | | |
End of the year | | $ | 843,854,125 | | | $ | 705,722,922 | |
| | | | | | | | |
UNDISTRIBUTED (DISTRIBUTIONS IN EXCESS OF) NET INVESTMENT INCOME | | $ | 38,911 | | | $ | (509,665 | ) |
| | | | | | | | |
See accompanying notes to financial statements.
67 |
Financial Highlights
For a share outstanding throughout each period.
| | | | | | | | | | | | | | | | | | | | |
| | | Core Plus Bond Fund—Class A | |
| | | Year Ended
September 30,
2015 | | | Year Ended
September 30,
2014 | | | Year Ended
September 30,
2013 | | | Year Ended
September 30,
2012 | | | Year Ended
September 30,
2011 | |
Net asset value, beginning of the period | | $ | 13.18 | | | $ | 12.71 | | | $ | 13.52 | | | $ | 12.71 | | | $ | 12.75 | |
| | | | | | | | | | | | | | | | | | | | |
INCOME (LOSS) FROM INVESTMENT OPERATIONS: | | | | | | | | | | | | | | | | | | | | |
Net investment income(a) | | | 0.37 | | | | 0.42 | | | | 0.44 | | | | 0.43 | | | | 0.52 | |
Net realized and unrealized gain (loss) | | | (0.77 | ) | | | 0.51 | | | | (0.51 | ) | | | 1.07 | | | | 0.03 | (b) |
| | | | | | | | | | | | | | | | | | | | |
Total from Investment Operations | | | (0.40 | ) | | | 0.93 | | | | (0.07 | ) | | | 1.50 | | | | 0.55 | |
| | | | | | | | | | | | | | | | | | | | |
LESS DISTRIBUTIONS FROM: | | | | | | | | | | | | | | | | | | | | |
Net investment income | | | (0.36 | ) | | | (0.46 | ) | | | (0.55 | ) | | | (0.50 | ) | | | (0.59 | ) |
Net realized capital gains | | | (0.08 | ) | | | (0.00 | )(c) | | | (0.19 | ) | | | (0.19 | ) | | | — | |
| | | | | | | | | | | | | | | | | | | | |
Total Distributions | | | (0.44 | ) | | | (0.46 | ) | | | (0.74 | ) | | | (0.69 | ) | | | (0.59 | ) |
| | | | | | | | | | | | | | | | | | | | |
Net asset value, end of the period | | $ | 12.34 | | | $ | 13.18 | | | $ | 12.71 | | | $ | 13.52 | | | $ | 12.71 | |
| | | | | | | | | | | | | | | | | | | | |
Total return(d) | | | (3.13 | )% | | | 7.43 | % | | | (0.61 | )% | | | 12.18 | % | | | 4.42 | % |
RATIOS TO AVERAGE NET ASSETS: | | | | | | | | | | | | | | | | | | | | |
Net assets, end of the period (000’s) | | $ | 912,662 | | | $ | 642,784 | | | $ | 436,199 | | | $ | 479,823 | | | $ | 237,759 | |
Net expenses | | | 0.74 | % | | | 0.79 | %(e) | | | 0.79 | % | | | 0.82 | % | | | 0.87 | % |
Gross expenses | | | 0.74 | % | | | 0.79 | %(e) | | | 0.79 | % | | | 0.82 | % | | | 0.87 | % |
Net investment income | | | 2.87 | % | | | 3.19 | % | | | 3.29 | % | | | 3.31 | % | | | 4.07 | % |
Portfolio turnover rate | | | 175 | % | | | 122 | % | | | 107 | % | | | 78 | % | | | 86 | % |
| (a) | Per share net investment income has been calculated using the average shares outstanding during the period. |
| (b) | The amount shown for a share outstanding does not correspond with the aggregate realized and unrealized gain (loss) on investments for the period due to the timing of sales and redemptions of fund shares in relation to fluctuating market values of investments of the Fund. |
| (c) | Amount rounds to less than $0.01 per share. |
| (d) | A sales charge for Class A shares is not reflected in total return calculations. |
| (e) | Includes fee/expense recovery of less than 0.01%. |
See accompanying notes to financial statements.
| 68
Financial Highlights (continued)
For a share outstanding throughout each period.
| | | | | | | | | | | | | | | | | | | | |
| | | Core Plus Bond Fund—Class B | |
| | | Year Ended
September 30,
2015 | | | Year Ended
September 30,
2014 | | | Year Ended
September 30,
2013 | | | Year Ended
September 30,
2012 | | | Year Ended
September 30,
2011 | |
Net asset value, beginning of the period | | $ | 13.24 | | | $ | 12.77 | | | $ | 13.57 | | | $ | 12.75 | | | $ | 12.79 | |
| | | | | | | | | | | | | | | | | | | | |
INCOME (LOSS) FROM INVESTMENT OPERATIONS: | | | | | | | | | | | | | | | | | | | | |
Net investment income(a) | | | 0.26 | | | | 0.33 | | | | 0.33 | | | | 0.34 | | | | 0.42 | |
Net realized and unrealized gain (loss) | | | (0.75 | ) | | | 0.50 | | | | (0.50 | ) | | | 1.07 | | | | 0.03 | (b) |
| | | | | | | | | | | | | | | | | | | | |
Total from Investment Operations | | | (0.49 | ) | | | 0.83 | | | | (0.17 | ) | | | 1.41 | | | | 0.45 | |
| | | | | | | | | | | | | | | | | | | | |
LESS DISTRIBUTIONS FROM: | | | | | | | | | | | | | | | | | | | | |
Net investment income | | | (0.26 | ) | | | (0.36 | ) | | | (0.44 | ) | | | (0.40 | ) | | | (0.49 | ) |
Net realized capital gains | | | (0.08 | ) | | | (0.00 | )(c) | | | (0.19 | ) | | | (0.19 | ) | | | — | |
| | | | | | | | | | | | | | | | | | | | |
Total Distributions | | | (0.34 | ) | | | (0.36 | ) | | | (0.63 | ) | | | (0.59 | ) | | | (0.49 | ) |
| | | | | | | | | | | | | | | | | | | | |
Net asset value, end of the period | | $ | 12.41 | | | $ | 13.24 | | | $ | 12.77 | | | $ | 13.57 | | | $ | 12.75 | |
| | | | | | | | | | | | | | | | | | | | |
Total return(d) | | | (3.82 | )% | | | 6.56 | % | | | (1.32 | )% | | | 11.38 | % | | | 3.60 | % |
RATIOS TO AVERAGE NET ASSETS: | | | | | | | | | | | | | | | | | | | | |
Net assets, end of the period (000’s) | | $ | 89 | | | $ | 678 | | | $ | 1,180 | | | $ | 2,386 | | | $ | 3,092 | |
Net expenses | | | 1.49 | % | | | 1.55 | %(e) | | | 1.54 | % | | | 1.57 | % | | | 1.62 | % |
Gross expenses | | | 1.49 | % | | | 1.55 | %(e) | | | 1.54 | % | | | 1.57 | % | | | 1.62 | % |
Net investment income | | | 2.00 | % | | | 2.51 | % | | | 2.50 | % | | | 2.61 | % | | | 3.32 | % |
Portfolio turnover rate | | | 175 | % | | | 122 | % | | | 107 | % | | | 78 | % | | | 86 | % |
| (a) | Per share net investment income has been calculated using the average shares outstanding during the period. |
| (b) | The amount shown for a share outstanding does not correspond with the aggregate realized and unrealized gain (loss) on investments for the period due to the timing of sales and redemptions of fund shares in relation to fluctuating market values of investments of the Fund. |
| (c) | Amount rounds to less than $0.01 per share. |
| (d) | A contingent deferred sales charge for Class B shares is not reflected in total return calculations. |
| (e) | Includes fee/expense recovery of less than 0.01%. |
See accompanying notes to financial statements.
69 |
Financial Highlights (continued)
For a share outstanding throughout each period.
| | | | | | | | | | | | | | | | | | | | |
| | | Core Plus Bond Fund—Class C | |
| | | Year Ended
September 30,
2015 | | | Year Ended
September 30,
2014 | | | Year Ended
September 30,
2013 | | | Year Ended
September 30,
2012 | | | Year Ended
September 30,
2011 | |
Net asset value, beginning of the period | | $ | 13.18 | | | $ | 12.72 | | | $ | 13.53 | | | $ | 12.71 | | | $ | 12.76 | |
| | | | | | | | | | | | | | | | | | | | |
INCOME (LOSS) FROM INVESTMENT OPERATIONS: | | | | | | | | | | | | | | | | | | | | |
Net investment income(a) | | | 0.27 | | | | 0.32 | | | | 0.34 | | | | 0.33 | | | | 0.42 | |
Net realized and unrealized gain (loss) | | | (0.77 | ) | | | 0.50 | | | | (0.51 | ) | | | 1.08 | | | | 0.02 | (b) |
| | | | | | | | | | | | | | | | | | | | |
Total from Investment Operations | | | (0.50 | ) | | | 0.82 | | | | (0.17 | ) | | | 1.41 | | | | 0.44 | |
| | | | | | | | | | | | | | | | | | | | |
LESS DISTRIBUTIONS FROM: | | | | | | | | | | | | | | | | | | | | |
Net investment income | | | (0.27 | ) | | | (0.36 | ) | | | (0.45 | ) | | | (0.40 | ) | | | (0.49 | ) |
Net realized capital gains | | | (0.08 | ) | | | (0.00 | )(c) | | | (0.19 | ) | | | (0.19 | ) | | | — | |
| | | | | | | | | | | | | | | | | | | | |
Total Distributions | | | (0.35 | ) | | | (0.36 | ) | | | (0.64 | ) | | | (0.59 | ) | | | (0.49 | ) |
| | | | | | | | | | | | | | | | | | | | |
Net asset value, end of the period | | $ | 12.33 | | | $ | 13.18 | | | $ | 12.72 | | | $ | 13.53 | | | $ | 12.71 | |
| | | | | | | | | | | | | | | | | | | | |
Total return(d) | | | (3.86 | )% | | | 6.54 | % | | | (1.36 | )% | | | 11.46 | % | | | 3.56 | % |
RATIOS TO AVERAGE NET ASSETS: | | | | | | | | | | | | | | | | | | | | |
Net assets, end of the period (000’s) | | $ | 354,285 | | | $ | 256,307 | | | $ | 232,034 | | | $ | 275,346 | | | $ | 137,836 | |
Net expenses | | | 1.49 | % | | | 1.54 | %(e) | | | 1.54 | % | | | 1.57 | % | | | 1.62 | % |
Gross expenses | | | 1.49 | % | | | 1.54 | %(e) | | | 1.54 | % | | | 1.57 | % | | | 1.62 | % |
Net investment income | | | 2.11 | % | | | 2.46 | % | | | 2.54 | % | | | 2.55 | % | | | 3.32 | % |
Portfolio turnover rate | | | 175 | % | | | 122 | % | | | 107 | % | | | 78 | % | | | 86 | % |
| (a) | Per share net investment income has been calculated using the average shares outstanding during the period. |
| (b) | The amount shown for a share outstanding does not correspond with the aggregate realized and unrealized gain (loss) on investments for the period due to the timing of sales and redemptions of fund shares in relation to fluctuating market values of investments of the Fund. |
| (c) | Amount rounds to less than $0.01 per share. |
| (d) | A contingent deferred sales charge for Class C shares is not reflected in total return calculations. |
| (e) | Includes fee/expense recovery of less than 0.01%. |
See accompanying notes to financial statements.
| 70
Financial Highlights (continued)
For a share outstanding throughout each period.
| | | | | | | | | | | | |
| | | Core Plus Bond Fund—Class N | |
| | | Year Ended
September 30,
2015 | | | Year Ended
September 30,
2014 | | | Period Ended
September 30,
2013* | |
Net asset value, beginning of the period | | $ | 13.28 | | | $ | 12.80 | | | $ | 13.43 | |
| | | | | | | | | | | | |
INCOME (LOSS) FROM INVESTMENT OPERATIONS: | | | | | | | | | | | | |
Net investment income(a) | | | 0.42 | | | | 0.46 | | | | 0.32 | |
Net realized and unrealized gain (loss) | | | (0.78 | ) | | | 0.52 | | | | (0.59 | ) |
| | | | | | | | | | | | |
Total from Investment Operations | | | (0.36 | ) | | | 0.98 | | | | (0.27 | ) |
| | | | | | | | | | | | |
LESS DISTRIBUTIONS FROM: | | | | | | | | | | | | |
Net investment income | | | (0.40 | ) | | | (0.50 | ) | | | (0.36 | ) |
Net realized capital gains | | | (0.08 | ) | | | (0.00 | )(b) | | | — | |
| | | | | | | | | | | | |
Total Distributions | | | (0.48 | ) | | | (0.50 | ) | | | (0.36 | ) |
| | | | | | | | | | | | |
Net asset value, end of the period | | $ | 12.44 | | | $ | 13.28 | | | $ | 12.80 | |
| | | | | | | | | | | | |
Total return | | | (2.82 | )% | | | 7.81 | % | | | (2.02 | )%(c) |
RATIOS TO AVERAGE NET ASSETS: | | | | | | | | | | | | |
Net assets, end of the period (000’s) | | $ | 2,209,110 | | | $ | 105,514 | | | $ | 19,247 | |
Net expenses | | | 0.40 | % | | | 0.46 | % | | | 0.44 | %(d) |
Gross expenses | | | 0.40 | % | | | 0.46 | % | | | 0.44 | %(d) |
Net investment income | | | 3.27 | % | | | 3.42 | % | | | 3.81 | %(d) |
Portfolio turnover rate | | | 175 | % | | | 122 | % | | | 107 | % |
| * | From commencement of Class operations on February 1, 2013 through September 30, 2013. |
| (a) | Per share net investment income has been calculated using the average shares outstanding during the period. |
| (b) | Amount rounds to less than $0.01 per share. |
| (c) | Periods less than one year are not annualized. |
| (d) | Computed on an annualized basis for periods less than one year. |
See accompanying notes to financial statements.
71 |
Financial Highlights (continued)
For a share outstanding throughout each period.
| | | | | | | | | | | | | | | | | | | | |
| | | Core Plus Bond Fund—Class Y | |
| | | Year Ended
September 30,
2015 | | | Year Ended
September 30,
2014 | | | Year Ended
September 30,
2013 | | | Year Ended
September 30,
2012 | | | Year Ended
September 30,
2011 | |
Net asset value, beginning of the period | | $ | 13.27 | | | $ | 12.80 | | | $ | 13.61 | | | $ | 12.78 | | | $ | 12.82 | |
| | | | | | | | | | | | | | | | | | | | |
INCOME (LOSS) FROM INVESTMENT OPERATIONS: | | | | | | | | | | | | | | | | | | | | |
Net investment income(a) | | | 0.41 | | | | 0.45 | | | | 0.47 | | | | 0.46 | | | | 0.55 | |
Net realized and unrealized gain (loss) | | | (0.78 | ) | | | 0.51 | | | | (0.51 | ) | | | 1.09 | | | | 0.03 | (b) |
| | | | | | | | | | | | | | | | | | | | |
Total from Investment Operations | | | (0.37 | ) | | | 0.96 | | | | (0.04 | ) | | | 1.55 | | | | 0.58 | |
| | | | | | | | | | | | | | | | | | | | |
LESS DISTRIBUTIONS FROM: | | | | | | | | | | | | | | | | | | | | |
Net investment income | | | (0.39 | ) | | | (0.49 | ) | | | (0.58 | ) | | | (0.53 | ) | | | (0.62 | ) |
Net realized capital gains | | | (0.08 | ) | | | (0.00 | )(c) | | | (0.19 | ) | | | (0.19 | ) | | | — | |
| | | | | | | | | | | | | | | | | | | | |
Total Distributions | | | (0.47 | ) | | | (0.49 | ) | | | (0.77 | ) | | | (0.72 | ) | | | (0.62 | ) |
| | | | | | | | | | | | | | | | | | | | |
Net asset value, end of the period | | $ | 12.43 | | | $ | 13.27 | | | $ | 12.80 | | | $ | 13.61 | | | $ | 12.78 | |
| | | | | | | | | | | | | | | | | | | | |
Total return | | | (2.89 | )% | | | 7.65 | % | | | (0.35 | )% | | | 12.54 | % | | | 4.65 | % |
RATIOS TO AVERAGE NET ASSETS: | | | | | | | | | | | | | | | | | | | | |
Net assets, end of the period (000’s) | | $ | 3,137,371 | | | $ | 1,310,824 | | | $ | 627,617 | | | $ | 634,946 | | | $ | 143,215 | |
Net expenses | | | 0.49 | % | | | 0.54 | %(d) | | | 0.54 | % | | | 0.58 | % | | | 0.62 | % |
Gross expenses | | | 0.49 | % | | | 0.54 | %(d) | | | 0.54 | % | | | 0.58 | % | | | 0.62 | % |
Net investment income | | | 3.14 | % | | | 3.42 | % | | | 3.54 | % | | | 3.50 | % | | | 4.31 | % |
Portfolio turnover rate | | | 175 | % | | | 122 | % | | | 107 | % | | | 78 | % | | | 86 | % |
| (a) | Per share net investment income has been calculated using the average shares outstanding during the period. |
| (b) | The amount shown for a share outstanding does not correspond with the aggregate realized and unrealized gain (loss) on investments for the period due to the timing of sales and redemptions of fund shares in relation to fluctuating market values of investments of the Fund. |
| (c) | Amount rounds to less than $0.01 per share. |
| (d) | Includes fee/expense recovery of less than 0.01%. |
See accompanying notes to financial statements.
| 72
Financial Highlights (continued)
For a share outstanding throughout each period.
| | | | | | | | | | | | | | | | | | | | |
| | | High Income Fund—Class A | |
| | | Year Ended
September 30,
2015 | | | Year Ended
September 30,
2014 | | | Year Ended
September 30,
2013 | | | Year Ended
September 30,
2012 | | | Year Ended
September 30,
2011 | |
Net asset value, beginning of the period | | $ | 4.49 | | | $ | 4.59 | | | $ | 4.60 | | | $ | 4.46 | | | $ | 4.91 | |
| | | | | | | | | | | | | | | | | | | | |
INCOME (LOSS) FROM INVESTMENT OPERATIONS: | | | | | | | | | | | | | | | | | | | | |
Net investment income(a) | | | 0.19 | | | | 0.21 | | | | 0.24 | | | | 0.24 | | | | 0.28 | |
Net realized and unrealized gain (loss) | | | (0.39 | ) | | | 0.17 | | | | 0.03 | | | | 0.59 | | | | (0.42 | ) |
| | | | | | | | | | | | | | | | | | | | |
Total from Investment Operations | | | (0.20 | ) | | | 0.38 | | | | 0.27 | | | | 0.83 | | | | (0.14 | ) |
| | | | | | | | | | | | | | | | | | | | |
LESS DISTRIBUTIONS FROM: | | | | | | | | | | | | | | | | | | | | |
Net investment income | | | (0.19 | ) | | | (0.22 | ) | | | (0.27 | ) | | | (0.30 | ) | | | (0.31 | ) |
Net realized capital gains | | | (0.11 | ) | | | (0.26 | ) | | | (0.01 | ) | | | (0.39 | ) | | | — | |
| | | | | | | | | | | | | | | | | | | | |
Total Distributions | | | (0.30 | ) | | | (0.48 | ) | | | (0.28 | ) | | | (0.69 | ) | | | (0.31 | ) |
| | | | | | | | | | | | | | | | | | | | |
Net asset value, end of the period | | $ | 3.99 | | | $ | 4.49 | | | $ | 4.59 | | | $ | 4.60 | | | $ | 4.46 | |
| | | | | | | | | | | | | | | | | | | | |
Total return(b) | | | (4.78 | )%(c) | | | 8.42 | % | | | 6.27 | % | | | 20.90 | %(c) | | | (3.30 | )% |
RATIOS TO AVERAGE NET ASSETS: | | | | | | | | | | | | | | | | | | | | |
Net assets, end of the period (000’s) | | $ | 37,870 | | | $ | 42,630 | | | $ | 45,791 | | | $ | 95,876 | | | $ | 59,907 | |
Net expenses | | | 1.11 | %(d)(e) | | | 1.14 | % | | | 1.15 | %(f) | | | 1.15 | %(d) | | | 1.15 | %(g) |
Gross expenses | | | 1.13 | % | | | 1.14 | % | | | 1.15 | %(f) | | | 1.19 | % | | | 1.15 | %(g) |
Net investment income | | | 4.41 | % | | | 4.57 | % | | | 5.11 | % | | | 5.50 | % | | | 5.60 | % |
Portfolio turnover rate | | | 69 | % | | | 59 | % | | | 47 | % | | | 34 | % | | | 67 | % |
| (a) | Per share net investment income has been calculated using the average shares outstanding during the period. |
| (b) | A sales charge for Class A shares is not reflected in total return calculations. |
| (c) | Had certain expenses not been waived/reimbursed during the period, total returns would have been lower. |
| (d) | The investment adviser agreed to waive its fees and/or reimburse a portion of the Fund’s expenses during the period. Without this waiver/reimbursement, expenses would have been higher. |
| (e) | Effective July 1, 2015, the expense limit decreased to 1.10%. |
| (f) | Includes fee/expense recovery of 0.02%. |
| (g) | Includes fee/expense recovery of 0.01%. |
See accompanying notes to financial statements.
73 |
Financial Highlights (continued)
For a share outstanding throughout each period.
| | | | | | | | | | | | | | | | | | | | |
| | | High Income Fund—Class B | |
| | | Year Ended
September 30,
2015 | | | Year Ended
September 30,
2014 | | | Year Ended
September 30,
2013 | | | Year Ended
September 30,
2012 | | | Year Ended
September 30,
2011 | |
Net asset value, beginning of the period | | $ | 4.51 | | | $ | 4.61 | | | $ | 4.61 | | | $ | 4.47 | | | $ | 4.92 | |
| | | | | | | | | | | | | | | | | | | | |
INCOME (LOSS) FROM INVESTMENT OPERATIONS: | | | | | | | | | | | | | | | | | | | | |
Net investment income(a) | | | 0.16 | | | | 0.18 | | | | 0.21 | | | | 0.21 | | | | 0.25 | |
Net realized and unrealized gain (loss) | | | (0.42 | ) | | | 0.16 | | | | 0.03 | | | | 0.58 | | | | (0.43 | ) |
| | | | | | | | | | | | | | | | | | | | |
Total from Investment Operations | | | (0.26 | ) | | | 0.34 | | | | 0.24 | | | | 0.79 | | | | (0.18 | ) |
| | | | | | | | | | | | | | | | | | | | |
LESS DISTRIBUTIONS FROM: | | | | | | | | | | | | | | | | | | | | |
Net investment income | | | (0.14 | ) | | | (0.18 | ) | | | (0.23 | ) | | | (0.26 | ) | | | (0.27 | ) |
Net realized capital gains | | | (0.11 | ) | | | (0.26 | ) | | | (0.01 | ) | | | (0.39 | ) | | | — | |
| | | | | | | | | | | | | | | | | | | | |
Total Distributions | | | (0.25 | ) | | | (0.44 | ) | | | (0.24 | ) | | | (0.65 | ) | | | (0.27 | ) |
| | | | | | | | | | | | | | | | | | | | |
Net asset value, end of the period | | $ | 4.00 | | | $ | 4.51 | | | $ | 4.61 | | | $ | 4.61 | | | $ | 4.47 | |
| | | | | | | | | | | | | | | | | | | | |
Total return(b) | | | (6.05 | )% | | | 7.51 | % | | | 5.66 | % | | | 19.93 | %(c) | | | (4.04 | )% |
RATIOS TO AVERAGE NET ASSETS: | | | | | | | | | | | | | | | | | | | | |
Net assets, end of the period (000’s) | | $ | 2 | | | $ | 122 | | | $ | 385 | | | $ | 560 | | | $ | 738 | |
Net expenses | | | 1.86 | %(d) | | | 1.90 | % | | | 1.90 | %(e) | | | 1.90 | %(f) | | | 1.90 | %(e) |
Gross expenses | | | 1.86 | % | | | 1.90 | % | | | 1.90 | %(e) | | | 1.94 | % | | | 1.90 | %(e) |
Net investment income | | | 3.59 | % | | | 3.88 | % | | | 4.37 | % | | | 4.79 | % | | | 4.90 | % |
Portfolio turnover rate | | | 69 | % | | | 59 | % | | | 47 | % | | | 34 | % | | | 67 | % |
| (a) | Per share net investment income has been calculated using the average shares outstanding during the period. |
| (b) | A contingent deferred sales charge for Class B shares is not reflected in total return calculations. |
| (c) | Had certain expenses not been waived/reimbursed during the period, total returns would have been lower. |
| (d) | Effective July 1, 2015, the expense limit decreased to 1.85%. |
| (e) | Includes fee/expense recovery of 0.01%. |
| (f) | The investment adviser agreed to waive its fees and/or reimburse a portion of the Fund’s expenses during the period. Without this waiver/reimbursement, expenses would have been higher. |
See accompanying notes to financial statements.
| 74
Financial Highlights (continued)
For a share outstanding throughout each period.
| | | | | | | | | | | | | | | | | | | | |
| | | High Income Fund—Class C | |
| | | Year Ended
September 30,
2015 | | | Year Ended
September 30,
2014 | | | Year Ended
September 30,
2013 | | | Year Ended
September 30,
2012 | | | Year Ended
September 30,
2011 | |
Net asset value, beginning of the period | | $ | 4.50 | | | $ | 4.61 | | | $ | 4.61 | | | $ | 4.47 | | | $ | 4.92 | |
| | | | | | | | | | | | | | | | | | | | |
INCOME (LOSS) FROM INVESTMENT OPERATIONS: | | | | | | | | | | | | | | | | | | | | |
Net investment income(a) | | | 0.16 | | | | 0.18 | | | | 0.21 | | | | 0.21 | | | | 0.25 | |
Net realized and unrealized gain (loss) | | | (0.39 | ) | | | 0.16 | | | | 0.04 | | | | 0.59 | | | | (0.43 | ) |
| | | | | | | | | | | | | | | | | | | | |
Total from Investment Operations | | | (0.23 | ) | | | 0.34 | | | | 0.25 | | | | 0.80 | | | | (0.18 | ) |
| | | | | | | | | | | | | | | | | | | | |
LESS DISTRIBUTIONS FROM: | | | | | | | | | | | | | | | | | | | | |
Net investment income | | | (0.16 | ) | | | (0.19 | ) | | | (0.24 | ) | | | (0.27 | ) | | | (0.27 | ) |
Net realized capital gains | | | (0.11 | ) | | | (0.26 | ) | | | (0.01 | ) | | | (0.39 | ) | | | — | |
| | | | | | | | | | | | | | | | | | | | |
Total Distributions | | | (0.27 | ) | | | (0.45 | ) | | | (0.25 | ) | | | (0.66 | ) | | | (0.27 | ) |
| | | | | | | | | | | | | | | | | | | | |
Net asset value, end of the period | | $ | 4.00 | | | $ | 4.50 | | | $ | 4.61 | | | $ | 4.61 | | | $ | 4.47 | |
| | | | | | | | | | | | | | | | | | | | |
Total return(b) | | | (5.48 | )%(c) | | | 7.60 | % | | | 5.46 | % | | | 19.96 | %(c) | | | (4.02 | )% |
RATIOS TO AVERAGE NET ASSETS: | | | | | | | | | | | | | | | | | | | | |
Net assets, end of the period (000’s) | | $ | 12,609 | | | $ | 14,555 | | | $ | 15,233 | | | $ | 16,863 | | | $ | 15,790 | |
Net expenses | | | 1.86 | %(d)(e) | | | 1.89 | % | | | 1.90 | %(f) | | | 1.90 | %(d) | | | 1.90 | %(f) |
Gross expenses | | | 1.88 | % | | | 1.89 | % | | | 1.90 | %(f) | | | 1.94 | % | | | 1.90 | %(f) |
Net investment income | | | 3.68 | % | | | 3.84 | % | | | 4.36 | % | | | 4.78 | % | | | 4.89 | % |
Portfolio turnover rate | | | 69 | % | | | 59 | % | | | 47 | % | | | 34 | % | | | 67 | % |
| (a) | Per share net investment income has been calculated using the average shares outstanding during the period. |
| (b) | A contingent deferred sales charge for Class C shares is not reflected in total return calculations. |
| (c) | Had certain expenses not been waived/reimbursed during the period, total returns would have been lower. |
| (d) | The investment adviser agreed to waive its fees and/or reimburse a portion of the Fund’s expenses during the period. Without this waiver/reimbursement, expenses would have been higher. |
| (e) | Effective July 1, 2015, the expense limit decreased to 1.85%. |
| (f) | Includes fee/expense recovery of 0.01%. |
See accompanying notes to financial statements.
75 |
Financial Highlights (continued)
For a share outstanding throughout each period.
| | | | | | | | | | | | | | | | | | | | |
| | | High Income Fund—Class Y | |
| | | Year Ended
September 30,
2015 | | | Year Ended
September 30,
2014 | | | Year Ended
September 30,
2013 | | | Year Ended
September 30,
2012 | | | Year Ended
September 30,
2011 | |
Net asset value, beginning of the period | | $ | 4.48 | | | $ | 4.59 | | | $ | 4.59 | | | $ | 4.46 | | | $ | 4.90 | |
| | | | | | | | | | | | | | | | | | | | |
INCOME (LOSS) FROM INVESTMENT OPERATIONS: | | | | | | | | | | | | | | | | | | | | |
Net investment income(a) | | | 0.20 | | | | 0.22 | | | | 0.25 | | | | 0.26 | | | | 0.29 | |
Net realized and unrealized gain (loss) | | | (0.39 | ) | | | 0.16 | | | | 0.04 | | | | 0.57 | | | | (0.41 | ) |
| | | | | | | | | | | | | | | | | | | | |
Total from Investment Operations | | | (0.19 | ) | | | 0.38 | | | | 0.29 | | | | 0.83 | | | | (0.12 | ) |
| | | | | | | | | | | | | | | | | | | | |
LESS DISTRIBUTIONS FROM: | | | | | | | | | | | | | | | | | | | | |
Net investment income | | | (0.20 | ) | | | (0.23 | ) | | | (0.28 | ) | | | (0.31 | ) | | | (0.32 | ) |
Net realized capital gains | | | (0.11 | ) | | | (0.26 | ) | | | (0.01 | ) | | | (0.39 | ) | | | — | |
| | | | | | | | | | | | | | | | | | | | |
Total Distributions | | | (0.31 | ) | | | (0.49 | ) | | | (0.29 | ) | | | (0.70 | ) | | | (0.32 | ) |
| | | | | | | | | | | | | | | | | | | | |
Net asset value, end of the period | | $ | 3.98 | | | $ | 4.48 | | | $ | 4.59 | | | $ | 4.59 | | | $ | 4.46 | |
| | | | | | | | | | | | | | | | | | | | |
Total return | | | (4.54 | )%(b) | | | 8.72 | % | | | 6.56 | % | | | 20.93 | %(b) | | | (2.86 | )% |
RATIOS TO AVERAGE NET ASSETS: | | | | | | | | | | | | | | | | | | | | |
Net assets, end of the period (000’s) | | $ | 116,837 | | | $ | 125,185 | | | $ | 108,170 | | | $ | 110,917 | | | $ | 38,011 | |
Net expenses | | | 0.86 | %(c)(d) | | | 0.89 | % | | | 0.90 | %(e) | | | 0.90 | %(c) | | | 0.90 | %(e) |
Gross expenses | | | 0.88 | % | | | 0.89 | % | | | 0.90 | %(e) | | | 0.95 | % | | | 0.90 | %(e) |
Net investment income | | | 4.67 | % | | | 4.83 | % | | | 5.37 | % | | | 5.78 | % | | | 5.86 | % |
Portfolio turnover rate | | | 69 | % | | | 59 | % | | | 47 | % | | | 34 | % | | | 67 | % |
| (a) | Per share net investment income has been calculated using the average shares outstanding during the period. |
| (b) | Had certain expenses not been waived/reimbursed during the period, total returns would have been lower. |
| (c) | The investment adviser agreed to waive its fees and/or reimburse a portion of the Fund’s expenses during the period. Without this waiver/reimbursement, expenses would have been higher. |
| (d) | Effective July 1, 2015, the expense limit decreased to 0.85%. |
| (e) | Includes fee/expense recovery of 0.01%. |
See accompanying notes to financial statements.
| 76
Financial Highlights (continued)
For a share outstanding throughout each period.
| | | | | | | | | | | | | | | | | | | | |
| | | Limited Term Government and Agency Fund—Class A | |
| | | Year Ended
September 30,
2015 | | | Year Ended
September 30,
2014 | | | Year Ended
September 30,
2013 | | | Year Ended
September 30,
2012 | | | Year Ended
September 30,
2011 | |
Net asset value, beginning of the period | | $ | 11.61 | | | $ | 11.68 | | | $ | 12.04 | | | $ | 11.87 | | | $ | 12.02 | |
| | | | | | | | | | | | | | | | | | | | |
INCOME (LOSS) FROM INVESTMENT OPERATIONS: | | | | | | | | | | | | | | | | | | | | |
Net investment income(a) | | | 0.14 | | | | 0.16 | | | | 0.13 | | | | 0.18 | | | | 0.17 | |
Net realized and unrealized gain (loss) | | | 0.01 | (b) | | | 0.01 | | | | (0.23 | ) | | | 0.28 | | | | 0.03 | |
| | | | | | | | | | | | | | | | | | | | |
Total from Investment Operations | | | 0.15 | | | | 0.17 | | | | (0.10 | ) | | | 0.46 | | | | 0.20 | |
| | | | | | | | | | | | | | | | | | | | |
LESS DISTRIBUTIONS FROM: | | | | | | | | | | | | | | | | | | | | |
Net investment income | | | (0.19 | ) | | | (0.24 | ) | | | (0.26 | ) | | | (0.29 | ) | | | (0.26 | ) |
Net realized capital gains | | | — | | | | — | | | | (0.00 | )(c) | | | (0.00 | )(c) | | | (0.09 | ) |
Paid-in capital | | | — | | | | — | | | | (0.00 | )(c) | | | — | | | | — | |
| | | | | | | | | | | | | | | | | | | | |
Total Distributions | | | (0.19 | ) | | | (0.24 | ) | | | (0.26 | ) | | | (0.29 | ) | | | (0.35 | ) |
| | | | | | | | | | | | | | | | | | | | |
Net asset value, end of the period | | $ | 11.57 | | | $ | 11.61 | | | $ | 11.68 | | | $ | 12.04 | | | $ | 11.87 | |
| | | | | | | | | | | | | | | | | | | | |
Total return(d) | | | 1.26 | % | | | 1.44 | % | | | (0.81 | )% | | | 3.94 | %(e) | | | 1.71 | %(e) |
RATIOS TO AVERAGE NET ASSETS: | | | | | | | | | | | | | | | | | | | | |
Net assets, end of the period (000’s) | | $ | 346,317 | | | $ | 314,360 | | | $ | 355,212 | | | $ | 357,870 | | | $ | 293,675 | |
Net expenses | | | 0.77 | % | | | 0.80 | %(f) | | | 0.87 | %(g) | | | 0.85 | %(h) | | | 0.85 | %(h) |
Gross expenses | | | 0.77 | % | | | 0.80 | %(f) | | | 0.87 | %(g) | | | 0.90 | % | | | 0.92 | % |
Net investment income | | | 1.21 | % | | | 1.35 | % | | | 1.11 | % | | | 1.54 | % | | | 1.44 | % |
Portfolio turnover rate | | | 48 | % | | | 24 | % | | | 39 | % | | | 56 | % | | | 66 | % |
| (a) | Per share net investment income has been calculated using the average shares outstanding during the period. |
| (b) | The amount shown for a share outstanding does not correspond with the aggregate realized and unrealized gain (loss) on investments for the period due to the timing of sales and redemptions of fund shares in relation to fluctuating market values of investments of the Fund. |
| (c) | Amount rounds to less than $0.01 per share. |
| (d) | A sales charge for Class A shares is not reflected in total return calculations. |
| (e) | Had certain expenses not been waived/reimbursed during the period, total returns would have been lower. |
| (f) | Includes fee/expense recovery of less than 0.01%. |
| (g) | Includes corporate tax expenses of 0.03%. Without this expense the ratio of net expenses would have been 0.84%. |
| (h) | The investment adviser agreed to waive its fees and/or reimburse a portion of the Fund’s expenses during the period. Without this waiver/reimbursement, expenses would have been higher. |
See accompanying notes to financial statements.
77 |
Financial Highlights (continued)
For a share outstanding throughout each period.
| | | | | | | | | | | | | | | | | | | | |
| | | Limited Term Government and Agency Fund—Class B | |
| | | Year Ended
September 30,
2015 | | | Year Ended
September 30,
2014 | | | Year Ended
September 30,
2013 | | | Year Ended
September 30,
2012 | | | Year Ended
September 30,
2011 | |
Net asset value, beginning of the period | | $ | 11.60 | | | $ | 11.67 | | | $ | 12.03 | | | $ | 11.86 | | | $ | 12.00 | |
| | | | | | | | | | | | | | | | | | | | |
INCOME (LOSS) FROM INVESTMENT OPERATIONS: | | | | | | | | | | | | | | | | | | | | |
Net investment income(a) | | | 0.06 | | | | 0.07 | | | | 0.04 | | | | 0.10 | | | | 0.09 | |
Net realized and unrealized gain (loss) | | | (0.00 | )(b) | | | 0.01 | | | | (0.23 | ) | | | 0.27 | | | | 0.03 | |
| | | | | | | | | | | | | | | | | | | | |
Total from Investment Operations | | | 0.06 | | | | 0.08 | | | | (0.19 | ) | | | 0.37 | | | | 0.12 | |
| | | | | | | | | | | | | | | | | | | | |
LESS DISTRIBUTIONS FROM: | | | | | | | | | | | | | | | | | | | | |
Net investment income | | | (0.10 | ) | | | (0.15 | ) | | | (0.17 | ) | | | (0.20 | ) | | | (0.17 | ) |
Net realized capital gains | | | — | | | | — | | | | (0.00 | )(b) | | | (0.00 | )(b) | | | (0.09 | ) |
Paid-in capital | | | — | | | | — | | | | (0.00 | )(b) | | | — | | | | — | |
| | | | | | | | | | | | | | | | | | | | |
Total Distributions | | | (0.10 | ) | | | (0.15 | ) | | | (0.17 | ) | | | (0.20 | ) | | | (0.26 | ) |
| | | | | | | | | | | | | | | | | | | | |
Net asset value, end of the period | | $ | 11.56 | | | $ | 11.60 | | | $ | 11.67 | | | $ | 12.03 | | | $ | 11.86 | |
| | | | | | | | | | | | | | | | | | | | |
Total return(c) | | | 0.50 | % | | | 0.69 | % | | | (1.56 | )% | | | 3.17 | %(d) | | | 1.04 | %(d) |
RATIOS TO AVERAGE NET ASSETS: | | | | | | | | | | | | | | | | | | | | |
Net assets, end of the period (000’s) | | $ | 2,643 | | | $ | 4,203 | | | $ | 5,930 | | | $ | 8,370 | | | $ | 10,976 | |
Net expenses | | | 1.53 | % | | | 1.55 | %(e) | | | 1.62 | %(f) | | | 1.60 | %(g) | | | 1.60 | %(g) |
Gross expenses | | | 1.53 | % | | | 1.55 | %(e) | | | 1.62 | %(f) | | | 1.65 | % | | | 1.68 | % |
Net investment income | | | 0.49 | % | | | 0.61 | % | | | 0.34 | % | | | 0.81 | % | | | 0.72 | % |
Portfolio turnover rate | | | 48 | % | | | 24 | % | | | 39 | % | | | 56 | % | | | 66 | % |
| (a) | Per share net investment income has been calculated using the average shares outstanding during the period. |
| (b) | Amount rounds to less than $0.01 per share. |
| (c) | A contingent deferred sales charge for Class B shares is not reflected in total return calculations. |
| (d) | Had certain expenses not been waived/reimbursed during the period, total returns would have been lower. |
| (e) | Includes fee/expense recovery of less than 0.01%. |
| (f) | Includes corporate tax expenses of 0.03%. Without this expense the ratio of net expenses would have been 1.59%. |
| (g) | The investment adviser agreed to waive its fees and/or reimburse a portion of the Fund’s expenses during the period. Without this waiver/reimbursement, expenses would have been higher. |
See accompanying notes to financial statements.
| 78
Financial Highlights (continued)
For a share outstanding throughout each period.
| | | | | | | | | | | | | | | | | | | | |
| | | Limited Term Government and Agency Fund—Class C | |
| | | Year Ended
September 30,
2015 | | | Year Ended
September 30,
2014 | | | Year Ended
September 30,
2013 | | | Year Ended
September 30,
2012 | | | Year Ended
September 30,
2011 | |
Net asset value, beginning of the period | | $ | 11.62 | | | $ | 11.69 | | | $ | 12.05 | | | $ | 11.88 | | | $ | 12.03 | |
| | | | | | | | | | | | | | | | | | | | |
INCOME (LOSS) FROM INVESTMENT OPERATIONS: | | | | | | | | | | | | | | | | | | | | |
Net investment income(a) | | | 0.05 | | | | 0.07 | | | | 0.04 | | | | 0.10 | | | | 0.08 | |
Net realized and unrealized gain (loss) | | | 0.01 | (b) | | | 0.01 | | | | (0.23 | ) | | | 0.27 | | | | 0.03 | |
| | | | | | | | | | | | | | | | | | | | |
Total from Investment Operations | | | 0.06 | | | | 0.08 | | | | (0.19 | ) | | | 0.37 | | | | 0.11 | |
| | | | | | | | | | | | | | | | | | | | |
LESS DISTRIBUTIONS FROM: | | | | | | | | | | | | | | | | | | | | |
Net investment income | | | (0.10 | ) | | | (0.15 | ) | | | (0.17 | ) | | | (0.20 | ) | | | (0.17 | ) |
Net realized capital gains | | | — | | | | — | | | | (0.00 | )(c) | | | (0.00 | )(c) | | | (0.09 | ) |
Paid-in capital | | | — | | | | — | | | | (0.00 | )(c) | | | — | | | | — | |
| | | | | | | | | | | | | | | | | | | | |
Total Distributions | | | (0.10 | ) | | | (0.15 | ) | | | (0.17 | ) | | | (0.20 | ) | | | (0.26 | ) |
| | | | | | | | | | | | | | | | | | | | |
Net asset value, end of the period | | $ | 11.58 | | | $ | 11.62 | | | $ | 11.69 | | | $ | 12.05 | | | $ | 11.88 | |
| | | | | | | | | | | | | | | | | | | | |
Total return(d) | | | 0.51 | % | | | 0.69 | % | | | (1.55 | )% | | | 3.17 | %(e) | | | 0.96 | %(e) |
RATIOS TO AVERAGE NET ASSETS: | | | | | | | | | | | | | | | | | | | | |
Net assets, end of the period (000’s) | | $ | 63,167 | | | $ | 56,936 | | | $ | 71,963 | | | $ | 75,522 | | | $ | 68,776 | |
Net expenses | | | 1.53 | % | | | 1.55 | %(f) | | | 1.62 | %(g) | | | 1.60 | %(h) | | | 1.60 | %(h) |
Gross expenses | | | 1.53 | % | | | 1.55 | %(f) | | | 1.62 | %(g) | | | 1.65 | % | | | 1.67 | % |
Net investment income | | | 0.47 | % | | | 0.61 | % | | | 0.36 | % | | | 0.80 | % | | | 0.68 | % |
Portfolio turnover rate | | | 48 | % | | | 24 | % | | | 39 | % | | | 56 | % | | | 66 | % |
| (a) | Per share net investment income has been calculated using the average shares outstanding during the period. |
| (b) | The amount shown for a share outstanding does not correspond with the aggregate realized and unrealized gain (loss) on investments for the period due to the timing of sales and redemptions of fund shares in relation to fluctuating market values of investments of the Fund. |
| (c) | Amount rounds to less than $0.01 per share. |
| (d) | A contingent deferred sales charge for Class C shares is not reflected in total return calculations. |
| (e) | Had certain expenses not been waived/reimbursed during the period, total returns would have been lower. |
| (f) | Includes fee/expense recovery of less than 0.01%. |
| (g) | Includes corporate tax expenses of 0.03%. Without this expense the ratio of net expenses would have been 1.59%. |
| (h) | The investment adviser agreed to waive its fees and/or reimburse a portion of the Fund’s expenses during the period. Without this waiver/reimbursement, expenses would have been higher. |
See accompanying notes to financial statements.
79 |
Financial Highlights (continued)
For a share outstanding throughout each period.
| | | | | | | | | | | | | | | | | | | | |
| | | Limited Term Government and Agency Fund—Class Y | |
| | | Year Ended
September 30,
2015 | | | Year Ended
September 30,
2014 | | | Year Ended
September 30,
2013 | | | Year Ended
September 30,
2012 | | | Year Ended
September 30,
2011 | |
Net asset value, beginning of the period | | $ | 11.65 | | | $ | 11.72 | | | $ | 12.08 | | | $ | 11.91 | | | $ | 12.05 | |
| | | | | | | | | | | | | | | | | | | | |
INCOME (LOSS) FROM INVESTMENT OPERATIONS: | | | | | | | | | | | | | | | | | | | | |
Net investment income(a) | | | 0.17 | | | | 0.18 | | | | 0.16 | | | | 0.21 | | | | 0.20 | |
Net realized and unrealized gain (loss) | | | 0.01 | (b) | | | 0.02 | | | | (0.23 | ) | | | 0.28 | | | | 0.04 | |
| | | | | | | | | | | | | | | | | | | | |
Total from Investment Operations | | | 0.18 | | | | 0.20 | | | | (0.07 | ) | | | 0.49 | | | | 0.24 | |
| | | | | | | | | | | | | | | | | | | | |
LESS DISTRIBUTIONS FROM: | | | | | | | | | | | | | | | | | | | | |
Net investment income | | | (0.22 | ) | | | (0.27 | ) | | | (0.29 | ) | | | (0.32 | ) | | | (0.29 | ) |
Net realized capital gains | | | — | | | | — | | | | (0.00 | )(c) | | | (0.00 | )(c) | | | (0.09 | ) |
Paid-in capital | | | — | | | | — | | | | (0.00 | )(c) | | | — | | | | — | |
| | | | | | | | | | | | | | | | | | | | |
Total Distributions | | | (0.22 | ) | | | (0.27 | ) | | | (0.29 | ) | | | (0.32 | ) | | | (0.38 | ) |
| | | | | | | | | | | | | | | | | | | | |
Net asset value, end of the period | | $ | 11.61 | | | $ | 11.65 | | | $ | 11.72 | | | $ | 12.08 | | | $ | 11.91 | |
| | | | | | | | | | | | | | | | | | | | |
Total return | | | 1.51 | % | | | 1.70 | % | | | (0.56 | )% | | | 4.19 | %(d) | | | 2.05 | %(d) |
RATIOS TO AVERAGE NET ASSETS: | | | | | | | | | | | | | | | | | | | | |
Net assets, end of the period (000’s) | | $ | 431,727 | | | $ | 330,224 | | | $ | 252,127 | | | $ | 220,444 | | | $ | 130,874 | |
Net expenses | | | 0.52 | % | | | 0.55 | %(e) | | | 0.62 | %(f) | | | 0.60 | %(g) | | | 0.60 | %(g) |
Gross expenses | | | 0.52 | % | | | 0.55 | %(e) | | | 0.62 | %(f) | | | 0.65 | % | | | 0.67 | % |
Net investment income | | | 1.45 | % | | | 1.58 | % | | | 1.35 | % | | | 1.77 | % | | | 1.68 | % |
Portfolio turnover rate | | | 48 | % | | | 24 | % | | | 39 | % | | | 56 | % | | | 66 | % |
| (a) | Per share net investment income has been calculated using the average shares outstanding during the period. |
| (b) | The amount shown for a share outstanding does not correspond with the aggregate realized and unrealized gain (loss) on investments for the period due to the timing of sales and redemptions of fund shares in relation to fluctuating market values of investments of the Fund. |
| (c) | Amount rounds to less than $0.01 per share. |
| (d) | Had certain expenses not been waived/reimbursed during the period, total returns would have been lower. |
| (e) | Includes fee/expense recovery of less than 0.01%. |
| (f) | Includes corporate tax expenses of 0.03%. Without this expense the ratio of net expenses would have been 0.59%. |
| (g) | The investment adviser agreed to waive its fees and/or reimburse a portion of the Fund’s expenses during the period. Without this waiver/reimbursement, expenses would have been higher. |
See accompanying notes to financial statements.
| 80
Notes to Financial Statements
September 30, 2015
1. Organization. Natixis Funds Trust I and Loomis Sayles Funds II (the “Trusts” and each a “Trust”) are each organized as a Massachusetts business trust. Each Trust is registered under the Investment Company Act of 1940, as amended (the “1940 Act”), as an open-end management investment company. Each Declaration of Trust permits the Board of Trustees to authorize the issuance of an unlimited number of shares of the Trust in multiple series. The financial statements for certain funds of the Trusts are presented in separate reports. The following funds (individually, a “Fund” and collectively, the “Funds”) are included in this report:
Natixis Funds Trust I:
Loomis Sayles Core Plus Bond Fund (the “Core Plus Bond Fund”)
Loomis Sayles Funds II:
Loomis Sayles High Income Fund (the “High Income Fund”)
Loomis Sayles Limited Term Government and Agency Fund (the “Limited Term Government and Agency Fund”)
Each Fund is a diversified investment company.
The Funds each offer Class A, Class C and Class Y shares. In addition, Core Plus Bond Fund offers Class N shares. Effective October 12, 2007, Class B shares are no longer offered. Existing Class B shareholders may continue to reinvest dividends into Class B shares and exchange their Class B shares for Class B shares of other Natixis Funds subject to existing exchange privileges as described in the prospectus.
Class A shares of Core Plus Bond Fund and High Income Fund are sold with a maximum front-end sales charge of 4.50%. Class A shares of Limited Term Government and Agency Fund are sold with a maximum front-end sales charge of 3.00%. Class B shares do not pay a front-end sales charge; however, they are charged higher Rule 12b-1 fees, and are subject to a contingent deferred sales charge (“CDSC”) if such shares are redeemed within six years of purchase. After eight years of ownership, Class B shares convert to Class A shares. Class C shares do not pay a front-end sales charge, do not convert to any other class of shares, pay higher Rule 12b-1 fees than Class A shares and may be subject to a CDSC of 1.00% if those shares are redeemed within one year of acquisition, except for reinvested distributions. Class N and Class Y shares do not pay a front-end sales charge, a CDSC or Rule 12b-1 fees. Class N shares are offered exclusively through intermediaries and are primarily intended for employer-sponsored retirement plans. Class Y shares are intended for institutional investors with a minimum initial investment of $100,000, though some categories of investors are exempted from the minimum investment amount as outlined in the Funds’ prospectus.
See Note 12 for changes that take effect subsequent to September 30, 2015.
Most expenses can be directly attributed to a Fund. Expenses which cannot be directly attributed to a Fund are generally apportioned based on the relative net assets of each of the funds in Natixis Funds Trust I, Natixis Funds Trust II, Natixis Funds Trust IV,
81 |
Notes to Financial Statements (continued)
September 30, 2015
Gateway Trust (“Natixis Funds Trusts”), Loomis Sayles Funds I and Loomis Sayles Funds II (“Loomis Sayles Funds Trusts”). Expenses of a Fund are borne pro rata by the holders of each class of shares, except that each class bears expenses unique to that class (including the Rule 12b-1 service and distribution fees and, for Core Plus Bond Fund Class A, Class B, Class C and Class Y, collectively, and Class N individually, transfer agent fees). In addition, each class votes as a class only with respect to its own Rule 12b-1 Plan. Shares of each class would receive their pro rata share of the net assets of a Fund if the Fund were liquidated. The Trustees approve separate distributions from net investment income on each class of shares.
2. Significant Accounting Policies. The following is a summary of significant accounting policies consistently followed by each Fund in the preparation of its financial statements. The Funds’ financial statements follow the accounting and reporting guidelines provided for investment companies and are prepared in accordance with accounting principles generally accepted in the United States of America which require the use of management estimates that affect the reported amounts and disclosures in the financial statements. Actual results could differ from those estimates. Management has evaluated the events and transactions subsequent to year-end through the date the financial statements were issued and has determined that there were no material events that would require disclosure in the Funds’ financial statements except as disclosed in Note 12.
a. Valuation. Fund securities and other investments are valued at market value based on market quotations obtained or determined by independent pricing services recommended by the adviser and approved by the Board of Trustees. Fund securities and other investments for which market quotations are not readily available are valued at fair value as determined in good faith by the adviser pursuant to procedures approved by the Board of Trustees, as described below. Market value is determined as follows:
Debt securities and unlisted preferred equity securities are valued based on evaluated bids furnished to the Fund by an independent pricing service or bid prices obtained from broker-dealers. Senior loans are valued at bid prices supplied by an independent pricing service, if available. Listed equity securities (including closed-end investment companies and exchange-traded funds) are valued at the last sale price quoted on the exchange where they are traded most extensively or, if there is no reported sale during the day, the closing bid quotation. Securities traded on the NASDAQ Global Select Market, NASDAQ Global Market and NASDAQ Capital Market are valued at the NASDAQ Official Closing Price (“NOCP”), or if lacking an NOCP, at the most recent bid quotations on the applicable NASDAQ Market. Unlisted equity securities (except unlisted preferred equity securities) are valued at the last sale price quoted in the market where they are traded most extensively or, if there is no reported sale during the day, the closing bid quotation. If there is no last sale price or closing bid quotation available, unlisted equity securities will be valued using evaluated bids furnished by an
| 82
Notes to Financial Statements (continued)
September 30, 2015
independent pricing service, if available. In some foreign markets, an official close price and a last sale price may be available from the foreign exchange or market. In those cases, the official close price is used. Broker-dealer bid prices may be used to value debt and unlisted equity securities and senior loans where an independent pricing service is unable to price a security or where an independent pricing service does not provide a reliable price for the security. Forward foreign currency contracts are valued utilizing interpolated rates determined based on information provided by an independent pricing service. Futures contracts are valued at the current settlement price on the exchange on which the adviser believes that, over time, they are traded most extensively. Centrally cleared credit default swap agreements are valued at settlement prices of the clearinghouse on which the contracts were traded or prices obtained from broker-dealers. Bilateral credit default swaps are valued based on mid prices (between the bid price and the ask price) supplied by an independent pricing service.
Fund securities and other investments for which market quotations are not readily available are valued at fair value as determined in good faith by the adviser pursuant to procedures approved by the Board of Trustees. The Fund may also value securities and other investments at fair value in other circumstances such as when extraordinary events occur after the close of a foreign market but prior to the close of the New York Stock Exchange (“NYSE”). This may include situations relating to a single issuer (such as a declaration of bankruptcy or a delisting of the issuer’s security from the primary market on which it has traded) as well as events affecting the securities markets in general (such as market disruptions or closings and significant fluctuations in U.S. and/or foreign markets). When fair valuing its securities or other investments, the Fund may, among other things, use modeling tools or other processes that may take into account factors such as securities or other market activity and/or significant events that occur after the close of the foreign market and before the time the Fund’s net asset value (“NAV”) is calculated. Fair value pricing may require subjective determinations about the value of a security, and fair values used to determine a Fund’s NAV may differ from quoted or published prices, or from prices that are used by others, for the same securities. In addition, the use of fair value pricing may not always result in adjustments to the prices of securities held by the Fund.
As of September 30, 2015, securities of the funds included in Net Assets (reflected at absolute value) were fair valued as follows:
| | | | | | | | | | | | | | | | |
Fund | | Illiquid
Securities1 | | | Percentage of
Net Assets | | | Other Fair Valued
Securities2 | | | Percentage of Net Assets | |
Core Plus Bond Fund | | $ | 13,227,749 | | | | 0.2 | % | | $ | 940,950 | | | | Less than 0.1 | % |
High Income Fund | | | 2,149,500 | | | | 1.3 | % | | | 1,000,000 | | | | 0.6 | % |
Limited Term Government and Agency Fund | | | 3,037,972 | | | | 0.4 | % | | | — | | | | — | |
| 1 | Illiquid securities are deemed to be fair valued pursuant to the Fund’s pricing policies and procedures. |
| 2 | Fair valued by the Fund’s adviser. |
83 |
Notes to Financial Statements (continued)
September 30, 2015
b. Investment Transactions and Related Investment Income. Investment transactions are accounted for on a trade date plus one day basis for daily NAV calculation. However, for financial reporting purposes, investment transactions are reported on trade date. Dividend income is recorded on ex-dividend date, or in the case of certain foreign securities, as soon as a Fund is notified, and interest income is recorded on an accrual basis. Interest income is increased by the accretion of discount and decreased by the amortization of premium. Periodic principal adjustments for inflation-protected securities are recorded to interest income. Negative principal adjustments (in the event of deflation) are recorded as reductions of interest income to the extent of interest income earned, not to exceed the amount of positive principal adjustments on a cumulative basis. In determining net gain or loss on securities sold, the cost of securities has been determined on an identified cost basis. Investment income, non-class specific expenses and realized and unrealized gains and losses are allocated on a pro rata basis to each class based on the relative net assets of each class to the total net assets of the Fund.
c. Foreign Currency Translation. The books and records of the Funds are maintained in U.S. dollars. The values of securities, currencies and other assets and liabilities denominated in currencies other than U.S. dollars are translated into U.S. dollars based upon foreign exchange rates prevailing at the end of the period. Purchases and sales of investment securities, income and expenses are translated into U.S. dollars on the respective dates of such transactions.
Net realized foreign exchange gains or losses arise from sales of foreign currency, changes in exchange rates between the trade and settlement dates on securities transactions and the difference between the amounts of dividends, interest and foreign withholding taxes recorded on the Fund’s books and the U.S. dollar equivalent of the amounts actually received or paid. Net unrealized foreign exchange gains or losses arise from changes in the value of assets and liabilities, other than investment securities, as of the end of the fiscal period, resulting from changes in exchange rates. Net realized foreign exchange gains or losses and the net change in unrealized foreign exchange gains or losses are disclosed in the Statements of Operations. For federal income tax purposes, net realized foreign exchange gains or losses are characterized as ordinary income and may, if the funds have net losses, reduce the amount of income available to be distributed by the funds.
The values of investment securities are presented at the foreign exchange rates prevailing at the end of the period for financial reporting purposes. Net realized and unrealized gains or losses on investments reported in the Statements of Operations reflect gains or losses resulting from changes in exchange rates and fluctuations which arise due to changes in market prices of investment securities. For federal income tax purposes, a portion of the net realized gain or loss on investments arising from changes in exchange rates, which is reflected in the Statements of Operations, may be characterized as ordinary income and may, if the Funds have net losses, reduce the amount of income available to be distributed by the Funds.
| 84
Notes to Financial Statements (continued)
September 30, 2015
During the year ended September 30, 2015, the amount of income available to be distributed by Core Plus Bond Fund and High Income Fund was reduced by $47,101,242 and $163,355, respectively, as a result of losses arising from changes in exchange rates.
The Funds may use foreign currency exchange contracts to facilitate transactions in foreign-denominated investments. Losses may arise from changes in the value of the foreign currency or if the counterparties do not perform under the contracts’ terms.
d. Forward Foreign Currency Contracts. The Funds may enter into forward foreign currency contracts, including forward foreign cross currency contracts to acquire exposure to foreign currencies or to hedge the Funds’ investments against currency fluctuation. A contract can also be used to offset a previous contract. These contracts involve market risk in excess of the unrealized gain or loss reflected in the Funds’ Statements of Assets and Liabilities. The U.S. dollar value of the currencies a Fund has committed to buy or sell represents the aggregate exposure to each currency a Fund has acquired or hedged through currency contracts outstanding at period end. Gains or losses are recorded for financial statement purposes as unrealized until settlement date. Contracts are traded over-the-counter directly with a counterparty. Risks may arise upon entering into these contracts from the potential inability of counterparties to meet the terms of their contracts and from unanticipated movements in the value of a foreign currency relative to the U.S. dollar. Certain contracts may require the movement of cash and/or securities as collateral for the Funds’ or counterparty’s net obligations under the contracts.
e. Futures Contracts. The Funds may enter into futures contracts. Futures contracts are agreements between two parties to buy and sell a particular instrument or index for a specified price on a specified future date.
When a Fund enters into a futures contract, it is required to deposit with (or for the benefit of) its broker an amount of cash or short-term high-quality securities as “initial margin.” As the value of the contract changes, the value of the futures contract position increases or declines. Subsequent payments, known as “variation margin,” are made or received by a Fund, depending on the price fluctuations in the fair value of the contract and the value of cash or securities on deposit with the broker. The aggregate principal amounts of the contracts are not recorded in the financial statements. Fluctuations in the value of the contracts are recorded in the Statements of Assets and Liabilities as an asset (liability) and in the Statements of Operations as unrealized appreciation (depreciation) until the contracts are closed, when they are recorded as realized gains (losses). Realized gain or loss on a futures position is equal to the difference between the value of the contract at the time it was opened and the value at the time it was closed, minus brokerage commissions. When a Fund enters into a futures contract certain risks may arise, such as illiquidity in the futures market, which may limit a Fund’s ability to close out a futures contract prior to settlement date, and unanticipated movements in the value of securities or interest rates.
Futures contracts are exchange-traded. Exchange-traded futures contracts are standardized and are settled through a clearing house with fulfillment supported by the
85 |
Notes to Financial Statements (continued)
September 30, 2015
credit of the exchange. Therefore, counterparty credit risks to the Funds are reduced; however, in the event that a counterparty enters into bankruptcy, a Fund’s claim against initial/variation margin on deposit with the counterparty may be subject to terms of a final settlement in bankruptcy court.
f. Swap Agreements. The Funds may enter into credit default swaps. A credit default swap is an agreement between two parties (the “protection buyer” and “protection seller”) to exchange the credit risk of an issuer (“reference obligation”) for a specified time period. The reference obligation may be one or more debt securities or an index of such securities. The Funds may be either the protection buyer or the protection seller. As a protection buyer, the Funds have the ability to hedge the downside risk of an issuer or group of issuers. As a protection seller, the Funds have the ability to gain exposure to an issuer or group of issuers whose bonds are unavailable or in short supply in the cash bond market, as well as realize additional income in the form of fees paid by the protection buyer. The protection buyer is obligated to pay the protection seller a stream of payments (“fees”) over the term of the contract, provided that no credit event, such as a default or a downgrade in credit rating, occurs on the reference obligation. The Funds may also pay or receive upfront premiums. If a credit event occurs, the protection seller must pay the protection buyer the difference between the agreed upon notional value and market value of the reference obligation. Market value in this case is determined by a facilitated auction whereby a minimum number of allowable broker bids, together with a specified valuation method, are used to calculate the value. The maximum potential amount of undiscounted future payments that a Fund as the protection seller could be required to make under a credit default swap agreement would be an amount equal to the notional amount of the agreement.
The notional amounts of swap agreements are not recorded in the financial statements. Swap agreements are valued daily and fluctuations in the value are recorded in the Statements of Operations as change in unrealized appreciation (depreciation) on swap agreements. Fees are accrued in accordance with the terms of the agreement and are recorded in the Statement of Assets and Liabilities as fees receivable or payable. When received or paid, fees are recorded in the Statement of Operations as realized gain or loss. Upfront premiums paid or received by the Funds are recorded on the Statements of Assets and Liabilities as an asset or liability, respectively, and are amortized or accreted over the term of the agreement and recorded as realized gain or loss. Payments made or received by the Funds as a result of a credit event or termination of the agreement are recorded as realized gain or loss.
Swap agreements are privately negotiated in the over-the-counter market and may be entered into as a bilateral contract or centrally cleared (“centrally cleared swaps”). Bilateral swap agreements are traded between counterparties and, as such, are subject to the risk that a party to the agreement will not be able to meet its obligations. In a centrally cleared swap, immediately following execution of the swap agreement, the swap agreement is novated to a central counterparty (the “CCP”) and the Fund is
| 86
Notes to Financial Statements (continued)
September 30, 2015
required to deposit initial margin with the broker in the form of cash or securities in an amount that varies depending on the size and risk profile of the particular swap. Subsequent payments, known as “variation margin,” are made or received by the Fund based on the daily change in the value of the centrally cleared swap agreement. For centrally cleared swaps, the Fund’s counterparty credit risk is reduced as the CCP stands between the Fund and the counterparty. The Funds cover their net obligations under outstanding swap agreements by segregating or earmarking liquid assets or cash.
No swap agreements were held by the Funds during the year ended September 30, 2015.
g. When-Issued and Delayed Delivery Transactions. The Funds may enter into when-issued or delayed delivery transactions. When-issued refers to transactions made conditionally because a security, although authorized, has not been issued. Delayed delivery refers to transactions for which delivery or payment will occur at a later date, beyond the normal settlement period. The price of when-issued and delayed delivery securities and the date when the securities will be delivered and paid for are fixed at the time the transaction is negotiated. The security and the obligation to pay for it are recorded by the Funds at the time the commitment is entered into. The value of the security may vary with market fluctuations during the time before the Funds take delivery of the security. No interest accrues to the Funds until the transaction settles.
Delayed delivery transactions include those designated as To Be Announced (“TBAs”) in the Portfolios of Investments. For TBAs, the actual security that will be delivered to fulfill the transaction is not designated at the time of the trade. The security is “to be announced” 48 hours prior to the established trade settlement date. Certain transactions require the Funds or counterparty to post cash and/or securities as collateral for the net mark-to-market exposure to the other party. The Funds cover their net obligations under outstanding delayed delivery commitments by segregating or earmarking cash or securities at the custodian.
Purchases of when-issued or delayed delivery securities may have a similar effect on the Funds’ NAV as if the Funds’ had created a degree of leverage in the portfolio. Risks may arise upon entering into such transactions from the potential inability of counterparties to meet their obligations under the transactions. Additionally, losses may arise due to changes in the value of the underlying securities.
h. Federal and Foreign Income Taxes. The Trusts treat each Fund as a separate entity for federal income tax purposes. Each Fund intends to meet the requirements of the Internal Revenue Code of 1986, as amended, applicable to regulated investment companies, and to distribute to its shareholders substantially all of its net investment income and any net realized capital gains at least annually. Management has performed an analysis of each Fund’s tax positions for the open tax years as of September 30, 2015 and has concluded that no provisions for income tax are required.
87 |
Notes to Financial Statements (continued)
September 30, 2015
The Funds’ federal tax returns for the prior three fiscal years remain subject to examination by the Internal Revenue Service. Management is not aware of any events that are reasonably possible to occur in the next twelve months that would result in the amounts of any unrecognized tax benefits significantly increasing or decreasing for the Funds. However, management’s conclusions regarding tax positions taken may be subject to review and adjustment at a later date based on factors including, but not limited to, new tax laws and accounting regulations and interpretations thereof.
A Fund may be subject to foreign withholding taxes on investment income and taxes on capital gains on investments that are accrued and paid based upon the Fund’s understanding of the tax rules and regulations that exist in the countries in which the Fund invests. Foreign withholding taxes on dividend and interest income are reflected on the Statements of Operations as a reduction of investment income, net of amounts eligible to be reclaimed. Dividends and interest receivable on the Statements of Assets and Liabilities are net of foreign withholding taxes. Foreign withholding taxes where reclaims have been or will be filed are reflected on the Statements of Assets and Liabilities as tax reclaims receivable. Capital gains taxes paid are included in net realized gain (loss) on investments in the Statements of Operations. Accrued but unpaid capital gains taxes are reflected as foreign taxes payable on the Statements of Assets and Liabilities, if applicable, and reduce unrealized gains on investments. In the event that realized gains on investments are subsequently offset by realized losses, taxes paid on realized gains may be returned to a Fund. Such amounts, if applicable, are reflected as foreign tax rebates receivable on the Statements of Assets and Liabilities and are recorded as a realized gain when received.
i. Dividends and Distributions to Shareholders. Dividends and distributions are recorded on ex-dividend date. The timing and characterization of certain income and capital gain distributions are determined in accordance with federal tax regulations, which may differ from accounting principles generally accepted in the United States of America. Permanent differences are primarily due to differing treatments for book and tax purposes of items such as foreign currency gains and losses, contingent payment debt instruments, treasury inflation protected bonds, premium amortization, defaulted and/or non-income producing securities, paydown gains and losses, return of capital and capital gain distributions received, convertible bonds, deferred Trustees’ fees and distribution re-designations. Permanent book and tax basis differences relating to shareholder distributions will result in reclassifications to capital accounts. Temporary differences between book and tax distributable earnings are primarily due to deferred Trustees’ fees, wash sales, premium amortization, forward foreign currency and futures contracts mark-to-market, dividends payable, straddle deferrals, contingent payment debt instruments, convertible bonds, defaulted and/or non-income producing securities and return of capital distributions received. Amounts of income and capital gain available to be distributed on a tax basis are determined annually, and at other times during the Funds’ fiscal year as may be necessary to avoid knowingly declaring and paying a return of capital distribution. Distributions from net investment income and short-term capital gains are considered to be distributed from ordinary income for tax purposes.
| 88
Notes to Financial Statements (continued)
September 30, 2015
The tax characterization of distributions is determined on an annual basis. The tax character of distributions paid to shareholders during the years ended September 30, 2015 and 2014 were as follows:
| | | | | | | | | | | | | | | | | | | | | | | | |
| | | 2015 Distributions Paid From: | | | 2014 Distributions Paid From: | |
Fund | | Ordinary Income | | | Long-Term Capital Gains | | | Total | | | Ordinary Income | | | Long-Term Capital Gains | | | Total | |
Core Plus Bond Fund | | $ | 185,171,010 | | | $ | 9,466,139 | | | $ | 194,637,149 | | | $ | 55,031,227 | | | $ | 428,711 | | | $ | 55,459,938 | |
High Income Fund | | | 9,843,443 | | | | 3,412,156 | | | | 13,255,599 | | | | 10,202,315 | | | | 7,750,939 | | | | 17,953,254 | |
Limited Term Government and Agency Fund | | | 12,685,774 | | | | — | | | | 12,685,774 | | | | 13,729,185 | | | | — | | | | 13,729,185 | |
Differences between these amounts and those reported in the Statements of Changes in Net Assets are primarily attributable to different book and tax treatment for short-term capital gains.
As of September 30, 2015, the components of distributable earnings on a tax basis were as follows:
| | | | | | | | | | | | |
| | | Core Plus Bond Fund | | | High Income Fund | | | Limited Term Government and Agency Fund | |
Undistributed ordinary income | | $ | — | | | $ | 873,445 | | | $ | 639,561 | |
Undistributed long-term capital gains | | | — | | | | 384,263 | | | | — | |
| | | | | | | | | | | | |
Total undistributed earnings | | | — | | | | 1,257,708 | | | | 639,561 | |
| | | | | | | | | | | | |
Capital loss carryforward: | | | — | | | | — | | | | — | |
Short-term: | | | | | | | | | | | | |
No expiration date | | | — | | | | — | | | | (2,555,389 | ) |
Long-term: | | | | | | | | | | | | |
No expiration date | | | — | | | | — | | | | (7,955,304 | ) |
| | | | | | | | | | | | |
Total capital loss carryforward | | | — | | | | — | | | | (10,510,693 | ) |
| | | | | | | | | | | | |
Late-year ordinary and post-October capital loss deferrals* | | | (24,998,903 | ) | | | — | | | | — | |
| | | | | | | | | | | | |
Unrealized (depreciation) | | | | | | | | | | | | |
Investments | | | (363,985,156 | ) | | | (11,875,311 | ) | | | (932,625 | ) |
Foreign currency translations | | | (35,756,415 | ) | | | (4,730,391 | ) | | | — | |
| | | | | | | | | | | | |
Total unrealized (depreciation) | | | (399,741,571 | ) | | | (16,605,702 | ) | | | (932,625 | ) |
| | | | | | | | | | | | |
Total accumulated losses | | $ | (424,740,474 | ) | | $ | (15,347,994 | ) | | $ | (10,803,757 | ) |
| | | | | | | | | | | | |
Capital loss carryforward utilized in the current year | | $ | — | | | $ | — | | | $ | 1,288,133 | |
| | | | | | | | | | | | |
| * | Under current tax law, capital losses, foreign currency losses, and losses on passive foreign investment companies and contingent payment debt instruments after October 31 or December 31, as applicable, may be deferred and treated as occurring on the first day of the following taxable year. Core Plus Bond Fund is deferring foreign currency losses that occurred after October 31, 2014. |
89 |
Notes to Financial Statements (continued)
September 30, 2015
j. Repurchase Agreements. Each Fund may enter into repurchase agreements, under the terms of a Master Repurchase Agreement, under which each Fund acquires securities as collateral and agrees to resell the securities at an agreed upon time and at an agreed upon price. It is each Fund’s policy that the market value of the collateral for repurchase agreements be at least equal to 102% of the repurchase price, including interest. Certain repurchase agreements are tri-party arrangements whereby the collateral is held in a segregated account for the benefit of the Fund and on behalf of the counterparty. Repurchase agreements could involve certain risks in the event of default or insolvency of the counterparty, including possible delays or restrictions upon a Fund’s ability to dispose of the underlying securities. As of September 30, 2015, each Fund, as applicable, had investments in repurchase agreements for which the value of the related collateral exceeded the value of the repurchase agreement. The gross value of repurchase agreements is included in the Statements of Assets and Liabilities for financial reporting purposes.
k. Due to Brokers. Transactions and positions in certain futures, forward foreign currency contracts, swap agreements and delayed delivery commitments are maintained and cleared by registered U.S. broker/dealers pursuant to customer agreements between the Funds and the various broker/dealers. The due to broker balance in the Statement of Assets and Liabilities for Core Plus Bond Fund represents cash received as collateral for delayed delivery securities. The due to broker balance in the Statement of Assets and Liabilities for High Income Fund represents securities received as collateral for forward foreign currency contracts. In certain circumstances the Fund’s use of cash held at brokers is restricted by regulation or broker mandated limits.
l. Securities Lending. The Funds have entered into an agreement with State Street Bank and Trust Company (“State Street Bank”), as agent of the Funds, to lend securities to certain designated borrowers. The loans are collateralized with cash or securities in an amount equal to at least 105% or 102% of the market value (including accrued interest) of the loaned international or domestic securities, respectively, when the loan is initiated. Thereafter, the value of the collateral must remain at least 102% of the market value (including accrued interest) of loaned securities for U.S. equities and U.S. corporate debt; at least 105% of the market value (including accrued interest) of loaned securities for non-U.S. equities; and at least 100% of the market value (including accrued interest) of loaned securities for U.S. Government securities, sovereign debt issued by non-U.S. Governments and non-U.S. corporate debt. In the event that the market value of the collateral falls below the required percentages described above, the borrower will deliver additional collateral on the next business day. As with other extensions of credit, the Funds may bear the risk of loss with respect to the investment of the collateral. The Funds invest cash collateral in short-term investments, a portion of the income from which is remitted to the borrowers and the remainder allocated between the Funds and State Street Bank as lending agent.
| 90
Notes to Financial Statements (continued)
September 30, 2015
For the year ended September 30, 2015, none of the Funds had loaned securities under this agreement.
m. Indemnifications. Under the Trusts’ organizational documents, their officers and Trustees are indemnified against certain liabilities arising out of the performance of their duties to the Funds. Additionally, in the normal course of business, the Funds enter into contracts with service providers that contain general indemnification clauses. The Funds’ maximum exposure under these arrangements is unknown as this would involve future claims that may be made against the Funds that have not yet occurred. However, based on experience, the Funds expect the risk of loss to be remote.
3. Fair Value Measurements. In accordance with accounting standards related to fair value measurements and disclosures, the Funds have categorized the inputs utilized in determining the value of each Fund’s assets or liabilities. These inputs are summarized in the three broad levels listed below:
| | • | | Level 1 – quoted prices in active markets for identical assets or liabilities; |
| | • | | Level 2 – prices determined using other significant inputs that are observable either directly, or indirectly through corroboration with observable market data (which could include quoted prices for similar assets or liabilities, interest rates, credit risk, etc.); and |
| | • | | Level 3 – prices determined using significant unobservable inputs when quoted prices or observable inputs are unavailable such as when there is little or no market activity for an asset or liability (unobservable inputs reflect each Fund’s own assumptions in determining the fair value of assets or liabilities and would be based on the best information available). |
The inputs or methodology used for valuing securities are not necessarily an indication of the risk associated with investing in those securities.
The Fund’s pricing policies and procedures are recommended by the adviser and approved by the Board of Trustees. Debt securities are valued based on evaluated bids furnished to the Fund by an independent pricing service. Broker-dealer bid prices may be used if an independent pricing service either is unable to price a security or does not provide a reliable price for a security. Broker-dealer bid prices for which the Fund does not have knowledge of the inputs used by the broker-dealer are categorized in Level 3. All security prices, including those obtained from an independent pricing service and broker-dealer bid prices, are reviewed on a daily basis by the adviser, subject to oversight by Fund management and the Board of Trustees. If the adviser, in good faith, believes that the price provided by an independent pricing service is unreliable, broker-dealer bid prices may be used until the price provided by the independent pricing service is considered to be reliable. Reliability of all security prices, including those obtained from an independent pricing service and broker-dealer bid prices, is tested in
91 |
Notes to Financial Statements (continued)
September 30, 2015
a variety of ways, including comparison to recent transaction prices and daily fluctuations, amongst other validation procedures in place. Securities for which market quotations are not readily available are valued at fair value as determined in good faith by the Funds’ adviser pursuant to procedures approved by the Board of Trustees. Fair valued securities may be categorized in Level 3.
The following is a summary of the inputs used to value the Funds’ investments as of September 30, 2015, at value:
Core Plus Bond Fund
Asset Valuation Inputs
| | | | | | | | | | | | | | | | |
Description | | Level 1 | | | Level 2 | | | Level 3 | | | Total | |
Bonds and Notes | | | | | | | | | | | | | | | | |
Non-Agency Commercial Mortgage-Backed Securities | | $ | — | | | $ | 355,447,970 | | | $ | 12,286,799 | (b) | | $ | 367,734,769 | |
Oil Field Services | | | — | | | | 77,249,656 | | | | 940,950 | (c) | | | 78,190,606 | |
All Other Bonds and Notes(a) | | | — | | | | 5,979,249,862 | | | | — | | | | 5,979,249,862 | |
| | | | | | | | | | | | | | | | |
Total Bonds and Notes | | | — | | | | 6,411,947,488 | | | | 13,227,749 | | | | 6,425,175,237 | |
| | | | | | | | | | | | | | | | |
Senior Loans(a) | | | — | | | | 81,605,859 | | | | — | | | | 81,605,859 | |
Preferred Stocks(a) | | | 1,247,597 | | | | 19,215,300 | | | | — | | | | 20,462,897 | |
Short-Term Investments | | | — | | | | 482,761,172 | | | | — | | | | 482,761,172 | |
| | | | | | | | | | | | | | | | |
Total | | $ | 1,247,597 | | | $ | 6,995,529,819 | | | $ | 13,227,749 | | | $ | 7,010,005,165 | |
| | | | | | | | | | | | | | | | |
| | | | |
| Liability Valuation Inputs | | | | | | | | | | | | | | | | |
| | | | |
Description | | Level 1 | | | Level 2 | | | Level 3 | | | Total | |
Forward Foreign Currency Contracts (unrealized depreciation) | | $ | — | | | $ | (3,135 | ) | | $ | — | | | $ | (3,135 | ) |
| | | | | | | | | | | | | | | | |
| (a) | Details of the major categories of the Fund’s investments are reflected within the Portfolio of Investments. |
| (b) | Valued using broker-dealer bid prices. |
| (c) | Fair valued by the Fund’s adviser. |
| 92
Notes to Financial Statements (continued)
September 30, 2015
High Income Fund
Asset Valuation Inputs
| | | | | | | | | | | | | | | | |
Description | | Level 1 | | | Level 2 | | | Level 3 | | | Total | |
Bonds and Notes | | | | | | | | | | | | | | | | |
Non-Convertible Bonds | | | | | | | | | | | | | | | | |
ABS Other | | $ | — | | | $ | 116,297 | | | $ | 750,966 | (b) | | $ | 867,263 | |
Non-Agency Commercial Mortgage-Backed Securities | | | — | | | | 2,637,007 | | | | 935,000 | (b) | | | 3,572,007 | |
All Other Non-Convertible Bonds(a) | | | — | | | | 138,178,189 | | | | — | | | | 138,178,189 | |
| | | | | | | | | | | | | | | | |
Total Non-Convertible Bonds | | | — | | | | 140,931,493 | | | | 1,685,966 | | | | 142,617,459 | |
| | | | | | | | | | | | | | | | |
Convertible Bonds(a) | | | — | | | | 8,747,942 | | | | — | | | | 8,747,942 | |
| | | | | | | | | | | | | | | | |
Total Bonds and Notes | | | — | | | | 149,679,435 | | | | 1,685,966 | | | | 151,365,401 | |
| | | | | | | | | | | | | | | | |
Senior Loans(a) | | | — | | | | 3,125,268 | | | | — | | | | 3,125,268 | |
Preferred Stocks | | | | | | | | | | | | | | | | |
Convertible Preferred Stocks | | | | | | | | | | | | | | | | |
Midstream | | | — | | | | 456,055 | | | | — | | | | 456,055 | |
REITs - Mortgage | | | — | | | | 112,008 | | | | — | | | | 112,008 | |
All Other Convertible Preferred Stocks(a) | | | 3,651,092 | | | | — | | | | — | | | | 3,651,092 | |
| | | | | | | | | | | | | | | | |
Total Convertible Preferred Stocks | | | 3,651,092 | | | | 568,063 | | | | — | | | | 4,219,155 | |
| | | | | | | | | | | | | | | | |
Non-Convertible Preferred Stocks(a) | | | 1,832,003 | | | | — | | | | — | | | | 1,832,003 | |
| | | | | | | | | | | | | | | | |
Total Preferred Stocks | | | 5,483,095 | | | | 568,063 | | | | — | | | | 6,051,158 | |
| | | | | | | | | | | | | | | | |
Common Stocks(a) | | | 1,205,337 | | | | — | | | | — | | | | 1,205,337 | |
Warrants(d) | | | 20,711 | | | | — | | | | — | | | | 20,711 | |
Other Investments(a) | | | — | | | | — | | | | 1,000,000 | (c) | | | 1,000,000 | |
Short-Term Investments | | | — | | | | 1,563,852 | | | | — | | | | 1,563,852 | |
| | | | | | | | | | | | | | | | |
Total Investments | | | 6,709,143 | | | | 154,936,618 | | | | 2,685,966 | | | | 164,331,727 | |
| | | | | | | | | | | | | | | | |
Forward Foreign Currency Contracts (unrealized appreciation) | | | — | | | | 301,892 | | | | — | | | | 301,892 | |
| | | | | | | | | | | | | | | | |
Total | | $ | 6,709,143 | | | $ | 155,238,510 | | | $ | 2,685,966 | | | $ | 164,633,619 | |
| | | | | | | | | | | | | | | | |
93 |
Notes to Financial Statements (continued)
September 30, 2015
High Income Fund (continued)
Liability Valuation Inputs
| | | | | | | | | | | | | | | | |
Description | | Level 1 | | | Level 2 | | | Level 3 | | | Total | |
Forward Foreign Currency Contracts (unrealized depreciation) | | $ | — | | | $ | (38,485 | ) | | $ | — | | | $ | (38,485 | ) |
Futures Contracts (unrealized depreciation) | | | (160,868 | ) | | | — | | | | — | | | | (160,868 | ) |
| | | | | | | | | | | | | | | | |
Total | | $ | (160,868 | ) | | $ | (38,485 | ) | | $ | — | | | $ | (199,353 | ) |
| | | | | | | | | | | | | | | | |
| (a) | Details of the major categories of the Fund’s investments are reflected within the Portfolio of Investments. |
| (b) | Valued using broker-dealer bid prices. |
| (c) | Fair valued by the Fund’s adviser. |
| (d) | Includes a security fair valued at zero using Level 2 inputs. |
A preferred stock valued at $941,666 was transferred from Level 2 to Level 1 during the period ended September 30, 2015. At September 30, 2014, this security was valued on the basis of evaluated bids furnished to the Fund by an independent pricing service. At September 30, 2015, this security was valued at the last sale price in accordance with the Fund’s valuation policies.
All transfers are recognized as of the beginning of the reporting period.
Limited Term Government and Agency Fund
Asset Valuation Inputs
| | | | | | | | | | | | | | | | |
Description | | Level 1 | | | Level 2 | | | Level 3 | | | Total | |
Bonds and Notes | | | | | | | | | | | | | | | | |
Agency Commercial Mortgage-Backed Securities | | $ | — | | | $ | 75,664,924 | | | $ | 14,113,679 | (b) | | $ | 89,778,603 | |
Collateralized Mortgage Obligations | | | — | | | | 132,064,448 | | | | 20,837 | (b) | | | 132,085,285 | |
Non-Agency Commercial Mortgage-Backed Securities | | | — | | | | 50,479,974 | | | | 3,037,972 | (b) | | | 53,517,946 | |
All Other Bonds and Notes(a) | | | — | | | | 544,503,085 | | | | — | | | | 544,503,085 | |
| | | | | | | | | | | | | | | | |
Total Bonds and Notes | | | — | | | | 802,712,431 | | | | 17,172,488 | | | | 819,884,919 | |
| | | | | | | | | | | | | | | | |
Short-Term Investments | | | — | | | | 24,549,858 | | | | — | | | | 24,549,858 | |
| | | | | | | | | | | | | | | | |
Total | | $ | — | | | $ | 827,262,289 | | | $ | 17,172,488 | | | $ | 844,434,777 | |
| | | | | | | | | | | | | | | | |
| (a) | Details of the major categories of the Fund’s investments are reflected within the Portfolio of Investments. |
| (b) | Valued using broker-dealer bid prices. |
| 94
Notes to Financial Statements (continued)
September 30, 2015
The following is a reconciliation of Level 3 investments for which significant unobservable inputs were used to determine fair value as of September 30, 2014 and/or September 30, 2015:
Core Plus Bond Fund
Asset Valuation Inputs
| | | | | | | | | | | | | | | | | | | | |
Investments in Securities | | Balance as of
September 30,
2014 | | | Accrued
Discounts
(Premiums) | | | Realized
Gain
(Loss) | | | Change in
Unrealized
Appreciation
(Depreciation) | | | Purchases | |
Bonds and Notes | | | | | | | | | | | | | | | | | | | | |
Non-Convertible Bonds | | | | | | | | | | | | | | | | | | | | |
ABS Other | | $ | 12,623,552 | | | $ | — | | | $ | — | | | $ | — | | | $ | — | |
Airlines | | | 4,362,720 | | | | — | | | | — | | | | — | | | | — | |
Non-Agency Commercial Mortgage-Backed Securities | | | — | | | | — | | | | — | | | | (24,175 | ) | | | 12,310,974 | |
Oil Field Services | | | — | | | | — | | | | (51,637 | ) | | | (1,354,050 | ) | | | — | |
Convertible Bonds | | | | | | | | | | | | | | | | | | | | |
Wirelines | | | 265,482 | | | | — | | | | (103,458 | ) | | | 81,425 | | | | — | |
| | | | | | | | | | | | | | | | | | | | |
Total | | $ | 17,251,754 | | | $ | — | | | $ | (155,095 | ) | | $ | (1,296,800 | ) | | $ | 12,310,974 | |
| | | | | | | | | | | | | | | | | | | | |
| | | | | |
Investments in Securities | | Sales | | | Transfers
into Level 3 | | | Transfers
out of
Level 3 | | | Balance as of
September 30,
2015 | | | Change in
Unrealized
Appreciation
(Depreciation)
from
Investments
Still Held at
September 30,
2015 | |
Bonds and Notes | | | | | | | | | | | | | | | | | | | | |
Non-Convertible Bonds | | | | | | | | | | | | | | | | | | | | |
ABS Other | | $ | — | | | $ | — | | | $ | (12,623,552 | ) | | $ | — | | | $ | — | |
Airlines | | | — | | | | — | | | | (4,362,720 | ) | | | — | | | | — | |
Non-Agency Commercial Mortgage-Backed Securities | | | — | | | | — | | | | — | | | | 12,286,799 | | | | (24,175 | ) |
Oil Field Services | | | (83,363 | ) | | | 2,430,000 | | | | — | | | | 940,950 | | | | (1,354,050 | ) |
Convertible Bonds | | | | | | | | | | | | | | | | | | | | |
Wirelines | | | (243,449 | ) | | | — | | | | — | | | | — | | | | — | |
| | | | | | | | | | | | | | | | | | | | |
Total | | $ | (326,812 | ) | | $ | 2,430,000 | | | $ | (16,986,272 | ) | | $ | 13,227,749 | | | $ | (1,378,225 | ) |
| | | | | | | | | | | | | | | | | | | | |
A debt security valued at $2,430,000 was transferred from Level 2 to Level 3 during the period ended September 30, 2015. At September 30, 2014, this security was valued on the basis of evaluated bids furnished to the Fund by an independent pricing service in accordance with the Fund’s valuation policies. At September 30, 2015, this security was valued at fair value as determined in good faith by the Fund’s adviser as an independent pricing service did not provide a reliable price for the security.
95 |
Notes to Financial Statements (continued)
September 30, 2015
Debt securities valued at $16,986,272 were transferred from Level 3 to Level 2 during the period ended September 30, 2015. At September 30, 2014, these securities were valued using broker-dealer bid prices based on inputs unobservable to the Fund as an independent pricing service was unable to price the securities. At September 30, 2015, these securities were valued on the basis of evaluated bids furnished to the Fund by an independent pricing service in accordance with the Fund’s valuation policies.
All transfers are recognized as of the beginning of the reporting period.
High Income Fund
Asset Valuation Inputs
| | | | | | | | | | | | | | | | | | | | |
Investments in Securities | | Balance as of
September 30,
2014 | | | Accrued
Discounts
(Premiums) | | | Realized
Gain
(Loss) | | | Change in
Unrealized
Appreciation
(Depreciation) | | | Purchases | |
Bonds and Notes | | | | | | | | | | | | | | | | | | | | |
Non-Convertible Bonds | | | | | | | | | | | | | | | | | | | | |
ABS Other | | $ | 447,739 | | | $ | — | | | $ | — | | | $ | 6,144 | | | $ | 310,000 | |
Airlines | | | 4,985 | | | | — | | | | 934 | | | | (1,031 | ) | | | — | |
Non-Agency Commercial Mortgage-Backed Securities | | | — | | | | — | | | | — | | | | — | | | | 935,000 | |
Convertible Bonds | | | | | | | | | | | | | | | | | | | | |
Wirelines | | | 5,740 | | | | — | | | | (1,628 | ) | | | 1,152 | | | | — | |
Other investments | | | | | | | | | | | | | | | | | | | | |
Aircraft ABS | | | — | | | | — | | | | — | | | | — | | | | 1,000,000 | |
| | | | | | | | | | | | | | | | | | | | |
Total | | $ | 458,464 | | | $ | — | | | $ | (694 | ) | | $ | 6,265 | | | $ | 2,245,000 | |
| | | | | | | | | | | | | | | | | | | | |
| | | | | |
Investments in Securities | | Sales | | | Transfers
into Level 3 | | | Transfers
out of
Level 3 | | | Balance as of
September 30,
2015 | | | Change in
Unrealized
Appreciation
(Depreciation)
from
Investments
Still Held at
September 30,
2015 | |
Bonds and Notes | | | | | | | | | | | | | | | | | | | | |
Non-Convertible Bonds | | | | | | | | | | | | | | | | | | | | |
ABS Other | | $ | (12,917 | ) | | $ | — | | | $ | — | | | $ | 750,966 | | | $ | 6,144 | |
Airlines | | | (4,888 | ) | | | — | | | | — | | | | — | | | | — | |
Non-Agency Commercial Mortgage-Backed Securities | | | — | | | | — | | | | — | | | | 935,000 | | | | — | |
Convertible Bonds | | | | | | | | | | | | | | | | | | | | |
Wirelines | | | (5,264 | ) | | | — | | | | — | | | | — | | | | — | |
Other investments | | | | | | | | | | | | | | | | | | | | |
Aircraft ABS | | | — | | | | — | | | | — | | | | 1,000,000 | | | | — | |
| | | | | | | | | | | | | | | | | | | | |
Total | | $ | (23,069 | ) | | $ | — | | | $ | — | | | $ | 2,685,966 | | | $ | 6,144 | |
| | | | | | | | | | | | | | | | | | | | |
| 96
Notes to Financial Statements (continued)
September 30, 2015
Limited Term Government and Agency Fund
Asset Valuation Inputs
| | | | | | | | | | | | | | | | | | | | |
Investments in Securities | | Balance as of September 30, 2014 | | | Accrued Discounts (Premiums) | | | Realized Gain (Loss) | | | Change in Unrealized Appreciation (Depreciation) | | | Purchases | |
Bonds and Notes | | | | | | | | | | | | | | | | | | | | |
Non-Convertible Bonds | | | | | | | | | | | | | | | | | | | | |
ABS Car Loan | | $ | 2,694,542 | | | $ | — | | | $ | — | | | $ | — | | | $ | — | |
ABS Home Equity | | | 160,459 | | | | — | | | | 1,375 | | | | 1,136 | | | | — | |
Agency Commercial Mortgage-Backed Securities | | | 14,488,062 | | | | — | | | | — | | | | (374,383 | ) | | | — | |
Collateralized Mortgage Obligations | | | 604,116 | | | | — | | | | 10 | | | | 41 | | | | — | |
Non-Agency Commercial Mortgage-Backed Securities | | | — | | | | — | | | | — | | | | (5,977 | ) | | | 3,043,949 | |
| | | | | | | | | | | | | | | | | | | | |
Total | | $ | 17,947,179 | | | $ | — | | | $ | 1,385 | | | $ | (379,183 | ) | | $ | 3,043,949 | |
| | | | | | | | | | | | | | | | | | | | |
| | | | | |
Investments in Securities | | Sales | | | Transfers into Level 3 | | | Transfers out of Level 3 | | | Balance as of September 30, 2015 | | | Change in Unrealized Appreciation (Depreciation) from Investments Still Held at September 30, 2015 | |
Bonds and Notes | | | | | | | | | | | | | | | | | | | | |
Non-Convertible Bonds | | | | | | | | | | | | | | | | | | | | |
ABS Car Loan | | $ | — | | | $ | — | | | $ | (2,694,542 | ) | | $ | — | | | $ | — | |
ABS Home Equity | | | (162,970 | ) | | | — | | | | — | | | | — | | | | — | |
Agency Commercial Mortgage-Backed Securities | | | — | | | | — | | | | — | | | | 14,113,679 | | | | (374,383 | ) |
Collateralized Mortgage Obligations | | | (3,089 | ) | | | — | | | | (580,241 | ) | | | 20,837 | | | | 39 | |
Non-Agency Commercial Mortgage-Backed Securities | | | — | | | | — | | | | — | | | | 3,037,972 | | | | (5,977 | ) |
| | | | | | | | | | | | | | | | | | | | |
Total | | $ | (166,059 | ) | | $ | — | | | $ | (3,274,783 | ) | | $ | 17,172,488 | | | $ | (380,321 | ) |
| | | | | | | | | | | | | | | | | | | | |
Debt securities valued at $3,274,783 were transferred from Level 3 to Level 2 during the period ended September 30, 2015. At September 30, 2014, these securities were valued using broker-dealer bid prices based on inputs unobservable to the Fund as an independent pricing service was unable to price the securities. At September 30, 2015, these securities were valued on the basis of evaluated bids furnished to the Fund by an independent pricing service in accordance with the Fund’s valuation policies.
97 |
Notes to Financial Statements (continued)
September 30, 2015
All transfers are recognized as of the beginning of the reporting period.
4. Derivatives. Derivative instruments are defined as financial instruments whose value and performance are based on the value and performance of an underlying asset, reference rate or index. Derivative instruments that High Income Fund used during the period include forward foreign currency contracts and futures contracts. Derivative instruments that Core Plus Bond Fund used during the period include forward foreign currency contracts.
High Income Fund and Core Plus Bond Fund are subject to the risk that changes in foreign currency exchange rates will have an unfavorable effect on the value of Fund assets denominated in foreign currencies. The Funds may enter into forward foreign currency contracts for hedging purposes to protect the value of the Funds’ holdings of foreign securities. The Funds may also use forward foreign currency contracts to gain exposure to foreign currencies, regardless of whether securities denominated in such currencies are held in the Funds. During the year ended September 30, 2015, High Income Fund and Core Plus Bond Fund engaged in forward foreign currency transactions for hedging purposes.
High Income Fund is subject to the risk that changes in interest rates will affect the value of the Funds’ investments in fixed-income securities. A Fund will be subject to increased interest rate risk to the extent that it invests in fixed-income securities with longer maturities or durations, as compared to investing in fixed-income securities with shorter maturities or durations. The Funds may use futures contracts to hedge against changes in interest rates and to manage duration without having to buy or sell portfolio securities. During the year ended September 30, 2015, High Income Fund used futures contracts to manage duration.
The following is a summary of derivative instruments for Core Plus Bond Fund as of September 30, 2015, as reflected within the Statement of Assets and Liabilities:
| | | | |
Liabilities | | Unrealized Depreciation on Forward Foreign Currency Contracts | |
Over-the-counter liability derivatives Foreign exchange contracts | | $ | (3,135 | ) |
Transactions in derivative instruments for Core Plus Bond Fund during the year ended September 30, 2015, as reflected within the Statement of Operations, were as follows:
| | | | |
Net Realized Loss on: | | Foreign Currency Transactions1 | |
Foreign exchange contracts | | $ | (495,722 | ) |
| | | | |
Net Change in Unrealized
Appreciation (Depreciation) on: | | Foreign Currency Translations1 | |
Foreign exchange contracts | | $ | (3,135 | ) |
| 1 | Represents realized loss and change in unrealized appreciation (depreciation), respectively, for forward foreign currency contracts during the period. Does not include other foreign currency gains or losses included in the Statement of Operations. |
| 98
Notes to Financial Statements (continued)
September 30, 2015
The following is a summary of derivative instruments for High Income Fund as of September 30, 2015, as reflected within the Statement of Assets and Liabilities:
| | | | | | | | | | | | |
Assets | | Unrealized
Appreciation on
Forward Foreign
Currency Contracts | | | Unrealized
Appreciation
on Futures
Contracts1 | | | Total | |
Over-the-counter asset derivatives Foreign exchange contracts | | $ | 301,892 | | | $ | — | | | $ | 301,892 | |
| | | | | | | | | | | | |
| | | |
Liabilities | | Unrealized
Depreciation on
Forward Foreign
Currency Contracts | | | Unrealized
Depreciation
on Futures
Contracts1 | | | Total | |
Over-the-counter liability derivatives Foreign exchange contracts | | $ | (38,485 | ) | | $ | — | | | $ | (38,485 | ) |
Exchange-traded/cleared liability derivatives
Interest rate contracts | | | — | | | | (160,868 | ) | | | (160,868 | ) |
| | | | | | | | | | | | |
Total liability derivatives | | $ | (38,485 | ) | | $ | (160,868 | ) | | $ | (199,353 | ) |
| | | | | | | | | | | | |
| 1 | Represents cumulative unrealized appreciation (depreciation) on futures contracts. Only the current day’s variation margin on futures contracts is reported within the Statement of Assets and Liabilities as receivable or payable for variation margin, as applicable. |
Transactions in derivative instruments for High Income Fund during the year ended September 30, 2015, as reflected within the Statement of Operations, were as follows:
| | | | | | | | |
Net Realized Gain (Loss) on: | | Futures Contracts | | | Foreign Currency Transactions2 | |
Interest rate contracts | | $ | (207,831 | ) | | $ | — | |
Foreign exchange contracts | | | — | | | | 664,567 | |
| | | | | | | | |
Total | | $ | (207,831 | ) | | $ | 664,567 | |
| | | | | | | | |
| | | | | | | | |
Net Change in Unrealized
Appreciation (Depreciation) on: | | Futures Contracts | | | Foreign Currency Translations2 | |
Interest rate contracts | | $ | (211,910 | ) | | $ | — | |
Foreign exchange contracts | | | — | | | | 141,322 | |
| | | | | | | | |
Total | | $ | (211,910 | ) | | $ | 141,322 | |
| | | | | | | | |
| 2 | Represents realized gain and change in unrealized appreciation (depreciation), respectively, for forward foreign currency contracts during the period. Does not include other foreign currency gains or losses included in the Statement of Operations. |
99 |
Notes to Financial Statements (continued)
September 30, 2015
As the Funds value their derivatives at fair value and recognize changes in fair value through the Statements of Operations, they do not qualify for hedge accounting under authoritative guidance for derivative instruments. The Funds’ investments in derivatives may represent an economic hedge; however, they are considered to be non-hedge transactions for the purpose of these disclosures.
The volume of forward foreign currency contract and futures contract activity, as a percentage of net assets, based on gross month-end notional amounts outstanding during the period, including long and short positions at absolute value, was as follows for the year ended September 30, 2015:
| | |
Core Plus Bond Fund | | Forwards |
| Average Notional Amount Outstanding | | 0.12% |
| Highest Notional Amount Outstanding | | 0.21% |
| Lowest Notional Amount Outstanding | | 0.00% |
Notional Amount Outstanding as of September 30, 2015 | | 0.21% |
| | | | |
High Income Bond Fund | | Forwards | | Futures |
| Average Notional Amount Outstanding | | 2.84% | | 4.10% |
| Highest Notional Amount Outstanding | | 7.10% | | 7.47% |
| Lowest Notional Amount Outstanding | | 0.71% | | 2.75% |
Notional Amount Outstanding as of September 30, 2015 | | 7.10% | | 7.47% |
Notional amounts outstanding at the end of the prior period are included in the average notional amount outstanding.
Unrealized gain and/or loss on open forwards and futures is recorded in the Statements of Assets and Liabilities. The aggregate notional values of forward and futures contracts are not recorded in the Statements of Assets and Liabilities, and therefore are not included in the Funds’ net assets.
Over-the-counter derivatives, including forward foreign currency contracts, are entered into pursuant to International Swaps and Derivatives Association, Inc. (“ISDA”) agreements negotiated between the Funds and their counterparties. ISDA agreements typically contain, among other things, terms for the posting of collateral and master netting provisions in the event of a default or other termination event. Collateral is posted by a Fund or the counterparty to the extent of the net mark-to-market exposure to the other party of all open contracts under the agreement, subject to minimum transfer requirements. Master netting provisions allow the Funds and the counterparty, in the event of a default or other termination event, to offset amounts owed by each related to derivative contracts, including any posted collateral, to one net amount payable by either the Funds or the counterparty. The Funds’ ISDA agreements typically
| 100
Notes to Financial Statements (continued)
September 30, 2015
contain provisions that allow a counterparty to terminate open contracts early if the net asset value of a Fund declines beyond a certain threshold. For financial reporting purposes, the Funds do not offset derivative assets and liabilities, and any related collateral received or pledged, on the Statements of Assets and Liabilities.
As of September 30, 2015, gross amounts of over-the-counter derivative assets and liabilities not offset in the Statements of Assets and Liabilities and the related net amounts after taking into account master netting arrangements by counterparty, are as follows:
| | | | | | | | | | | | | | | | | | | | |
| | | | | |
| Core Plus Bond Fund | | | | | | | | | | | | | | | | | | | | |
Counterparty | | Gross Amounts of
Liabilities | | | Offset
Amount | | | Net Liability
Balance | | | Collateral
(Received)/
Pledged | | | Net
Amount | |
Bank of America, N.A. | | $ | (3,135 | ) | | $ | — | | | $ | (3,135 | ) | | $ | — | | | $ | (3,135 | ) |
| | | | | |
| High Income Fund | | | | | | | | | | | | | | | | | | | | |
Counterparty | | Gross Amounts of
Assets | | | Offset
Amount | | | Net Asset
Balance | | | Collateral
(Received)/
Pledged | | | Net
Amount | |
Bank of America, N.A. | | $ | 301,892 | | | $ | (38,485 | ) | | $ | 263,407 | | | $ | (263,407 | ) | | $ | — | |
| | | | | |
Counterparty | | Gross Amounts of
Liabilities | | | Offset
Amount | | | Net Liability
Balance | | | Collateral
(Received)/
Pledged | | | Net
Amount | |
Bank of America, N.A. | | $ | (38,485 | ) | | $ | 38,485 | | | $ | — | | | $ | — | | | $ | — | |
The actual collateral received or pledged, if any, may exceed the amounts shown in the table due to overcollateralization. Timing differences may exist between when contracts under the ISDA agreements are marked-to-market and when collateral moves. The ISDA agreements include tri-party control agreements under which collateral is held for the benefit of the secured party at a third party custodian, State Street Bank.
Counterparty risk is managed based on policies and procedures established by each Fund’s adviser. Such policies and procedures may include, but are not limited to, minimum counterparty credit rating requirements, monitoring of counterparty credit default swap spreads and posting of collateral. A Fund’s risk of loss from counterparty credit risk on over-the-counter derivatives is generally limited to the Fund’s aggregated unrealized gains and the amount of any collateral pledged to the counterparty, which may be offset by any collateral posted to the Fund by the counterparty. ISDA master agreements can help to manage counterparty risk by specifying collateral posting arrangements at pre-arranged exposure levels. Under these ISDA agreements, collateral is routinely transferred if the total net exposure in respect of certain
101 |
Notes to Financial Statements (continued)
September 30, 2015
transactions, net of existing collateral already in place, exceeds a specified amount (typically $250,000, depending on the counterparty). With exchange-traded derivatives, there is minimal counterparty credit risk to the Fund because the exchange’s clearinghouse, as counterparty to these instruments, stands between the buyer and the seller of the contract. Credit risk still exists in exchange-traded derivatives with respect to initial and variation margin that is held in a broker’s customer accounts. While brokers are required to segregate customer margin from their own assets, in the event that a broker becomes insolvent or goes into bankruptcy and at that time there is a shortfall in the aggregate amount of margin held by the broker for all its clients, U.S. bankruptcy laws will typically allocate that shortfall on a pro rata basis across all of the broker’s customers, potentially resulting in losses to the Fund. Based on balances reflected on each Fund’s Statement of Assets and Liabilities, the following table shows (i) the maximum amount of loss due to credit risk that, based on the gross fair value of the financial instrument, the applicable Fund would incur if parties to the relevant financial instruments failed completely to perform according to the terms of the contracts and the collateral or other security, if any, for the amount due proved to be of no value to the Fund, and (ii) the amount of loss that the applicable Fund would incur after taking into account master netting provisions pursuant to ISDA agreements, as of September 30, 2015:
| | | | | | | | |
Fund | | Maximum Amount
of Loss - Gross | | | Maximum Amount
of Loss - Net | |
High Income Fund | | $ | 515,213 | | | $ | 213,321 | |
These amounts include U.S. government and agency securities received as collateral for High Income Fund of $278,566. U.S. government and agency securities received as collateral are valued in accordance with the Fund’s valuation policies and are recorded on the Statement of Assets and Liabilities.
5. Purchases and Sales of Securities. For the year ended September 30, 2015, purchases and sales of securities (excluding short-term investments and including paydowns) were as follows:
| | | | | | | | | | | | | | | | |
| | | U.S. Government/
Agency Securities | | | Other Securities | |
Fund | | Purchases | | | Sales | | | Purchases | | | Sales | |
Core Plus Bond Fund | | $ | 9,669,674,474 | | | $ | 8,539,268,482 | | | $ | 4,823,941,311 | | | $ | 1,110,740,401 | |
High Income Fund | | | 38,571,187 | | | | 40,779,934 | | | | 90,755,823 | | | | 83,667,832 | |
Limited Term Government and Agency Fund | | | 389,959,280 | | | | 235,812,742 | | | | 137,682,640 | | | | 126,999,616 | |
| 102
Notes to Financial Statements (continued)
September 30, 2015
6. Management Fees and Other Transactions with Affiliates.
a. Management Fees. Loomis, Sayles & Company, L.P. (“Loomis Sayles”) serves as investment adviser to each Fund. Under the terms of the management agreements, each Fund pays a management fee at the following annual rates, calculated daily and payable monthly, based on each Fund’s average daily net assets:
| | | | | | | | | | | | | | | | |
| | | Percentage of Average Daily Net Assets | |
Fund | | First $100 million | | | Next $400 million | | | Next $1.5 billion | | | Over $2 billion | |
Core Plus Bond Fund | | | 0.2000 | % | | | 0.1875 | % | | | 0.1875 | % | | | 0.1500 | % |
High Income Fund | | | 0.6000 | % | | | 0.6000 | % | | | 0.6000 | % | | | 0.6000 | % |
Limited Term Government and Agency Fund | | | 0.3750 | % | | | 0.3750 | % | | | 0.3500 | % | | | 0.3000 | % |
NGAM Advisors, L.P. (“NGAM Advisors”) serves as the advisory administrator to Core Plus Bond Fund. Under the terms of the advisory administration agreement, the Fund pays an advisory administration fee at the following annual rates, calculated daily and payable monthly, based on its average daily net assets:
| | | | | | | | | | | | |
| | | Percentage of Average Daily Net Assets | |
Fund | | First $100 million | | | Next $1.9 billion | | | Over $2 billion | |
Core Plus Bond Fund | | | 0.2000 | % | | | 0.1875 | % | | | 0.1500 | % |
Management and advisory administration fees are presented in the Statements of Operations as management fees.
Loomis Sayles has given binding undertakings to the Funds to waive management fees and/or reimburse certain expenses to limit the Funds’ operating expenses, exclusive of acquired fund fees and expenses, brokerage expenses, interest expense, taxes, organizational and extraordinary expenses such as litigation and indemnification expenses. These undertakings are in effect until January 31, 2016 for Core Plus Bond Fund and Limited Term Government and Agency Fund and January 31, 2017 for High Income Fund, may be terminated before then only with the consent of the Funds’ Board of Trustees, and are reevaluated on an annual basis. Management fees payable, as reflected on the Statements of Assets and Liabilities, is net of waivers and/or expense reimbursements, if any, pursuant to these undertakings. Waivers/reimbursements that exceed management fees payable are reflected on the Statements of Assets and Liabilities as receivable from investment adviser.
103 |
Notes to Financial Statements (continued)
September 30, 2015
For the year ended September 30, 2015, the expense limits as a percentage of average daily net assets under the expense limitation agreements were as follows:
| | | | | | | | | | | | | | | | | | | | |
| | | Expense Limit as a Percentage of
Average Daily Net Assets | |
Fund | | Class A | | | Class B | | | Class C | | | Class N | | | Class Y | |
Core Plus Bond Fund | | | 0.80 | % | | | 1.55 | % | | | 1.55 | % | | | 0.50 | % | | | 0.55 | % |
High Income Fund | | | 1.10 | % | | | 1.85 | % | | | 1.85 | % | | | — | | | | 0.85 | % |
Limited Term Government and Agency Fund | | | 0.80 | % | | | 1.55 | % | | | 1.55 | % | | | — | | | | 0.55 | % |
Prior to July 1, 2015, the expense limits as a percentage of average daily net assets under the expense limitation agreement were as follows:
| | | | | | | | | | | | | | | | | | | | |
| | | Expense Limit as a Percentage of
Average Daily Net Assets | |
Fund | | Class A | | | Class B | | | Class C | | | Class N | | | Class Y | |
High Income Fund | | | 1.15 | % | | | 1.90 | % | | | 1.90 | % | | | — | | | | 0.90 | % |
Loomis Sayles and NGAM Advisors have agreed to equally bear the waivers and/or expense reimbursements for Core Plus Bond Fund.
Loomis Sayles (and NGAM Advisors for Core Plus Bond Fund) shall be permitted to recover expenses borne under the expense limitation agreements (whether through waiver of its management fees or otherwise) on a class by class basis in later periods to the extent the annual operating expenses of a class fall below a class’ expense limits, provided, however, that a class is not obligated to pay such waived/reimbursed fees or expenses more than one year after the end of the fiscal year in which the fees or expenses were waived/reimbursed.
For the year ended September 30, 2015, the management fees and waivers of management fees for each Fund were as follows:
| | | | | | | | | | | | | | | | | | | | |
Fund | | Gross
Management
Fees | | | Waivers of
Management
Fees1 | | | Net
Management
Fees | | | Percentage of
Average
Daily Net Assets | |
| | | | | Gross | | | Net | |
Core Plus Bond Fund | | $ | 9,426,230 | | | $ | — | | | $ | 9,426,230 | | | | 0.163 | % | | | 0.163 | % |
High Income Fund | | | 1,159,904 | | | | 34,189 | | | | 1,125,715 | | | | 0.600 | % | | | 0.582 | % |
Limited Term Government and Agency Fund | | | 2,812,348 | | | | — | | | | 2,812,348 | | | | 0.366 | % | | | 0.366 | % |
| 1 | Management fee waivers are subject to possible recovery until September 30, 2016. |
| 104
Notes to Financial Statements (continued)
September 30, 2015
For the year ended September 30, 2015, the advisory administration fees for Core Plus Bond Fund were as follows:
| | | | |
Advisory
Administration
Fee | | Percentage of
Average
Daily Net Assets | |
| $9,426,230 | | | 0.163 | % |
No expenses were recovered for any of the Funds during the year ended September 30, 2015 under the terms of the expense agreements.
Certain officers and employees of Loomis Sayles are also officers or Trustees of the Trust. Loomis Sayles’ general partner is indirectly owned by Natixis Global Asset Management, L.P. (“Natixis US”), which is part of Natixis Global Asset Management, an international asset management group based in Paris, France.
b. Service and Distribution Fees. NGAM Distribution, L.P. (“NGAM Distribution”), which is a wholly-owned subsidiary of Natixis US, has entered into a distribution agreement with the Trusts. Pursuant to this agreement, NGAM Distribution serves as principal underwriter of the Funds of the Trusts.
Pursuant to Rule 12b-1 under the 1940 Act, the Trusts have adopted a Service Plan relating to each Fund’s Class A shares (the “Class A Plans”), and a Distribution and Service Plan relating to each Fund’s Class B and Class C shares (the “Class B and Class C Plans”).
Under the Class A Plans, each Fund pays NGAM Distribution a monthly service fee at an annual rate not to exceed 0.25% of the average daily net assets attributable to the Funds’ Class A shares, as reimbursement for expenses incurred by NGAM Distribution in providing personal services to investors in Class A shares and/or the maintenance of shareholder accounts.
Under the Class B and Class C Plans, each Fund pays NGAM Distribution a monthly service fee at an annual rate not to exceed 0.25% of the average daily net assets attributable to the Funds’ Class B and Class C shares, as compensation for services provided by NGAM Distribution in providing personal services to investors in Class B and Class C shares and/or the maintenance of shareholder accounts.
Also under the Class B and Class C Plans, each Fund pays NGAM Distribution a monthly distribution fee at the annual rate of 0.75% of the average daily net assets attributable to the Funds’ Class B and Class C shares, as compensation for services provided by NGAM Distribution in connection with the marketing or sale of Class B and Class C shares.
105 |
Notes to Financial Statements (continued)
September 30, 2015
For the year ended September 30, 2015, the service and distribution fees for each Fund were as follows:
| | | | | | | | | | | | | | | | | | | | |
| | | Service Fees | | | Distribution Fees | |
Fund | | Class A | | | Class B | | | Class C | | | Class B | | | Class C | |
Core Plus Bond Fund | | $ | 2,386,947 | | | $ | 972 | | | $ | 906,438 | | | $ | 2,916 | | | $ | 2,719,314 | |
High Income Fund | | | 110,209 | | | | 164 | | | | 35,729 | | | | 491 | | | | 107,187 | |
Limited Term Government and Agency Fund | | | 823,258 | | | | 8,396 | | | | 147,985 | | | | 25,188 | | | | 443,955 | |
c. Administrative Fees. NGAM Advisors provides certain administrative services for the Funds and contracts with State Street Bank to serve as sub-administrator. NGAM Advisors is a wholly-owned subsidiary of Natixis US. Pursuant to an agreement among Natixis Funds Trusts, Loomis Sayles Funds Trusts and NGAM Advisors, each Fund pays NGAM Advisors monthly its pro rata portion of fees equal to an annual rate of 0.0575% of the first $15 billion of the average daily net assets of the Natixis Funds Trusts and Loomis Sayles Funds Trusts, 0.0500% of the next $15 billion, 0.0400% of the next $30 billion, 0.0350% of the next $30 billion and 0.0325% of such assets in excess of $90 billion, subject to an annual aggregate minimum fee for the Natixis Funds Trusts and Loomis Sayles Funds Trusts of $10 million, which is reevaluated on an annual basis.
For the year ended September 30, 2015, the administrative fees for each Fund were as follows:
| | | | |
Fund | | Administrative
Fees | |
Core Plus Bond Fund | | $ | 2,462,399 | |
High Income Fund | | | 82,447 | |
Limited Term Government and Agency Fund | | | 327,599 | |
d. Sub-Transfer Agent Fees. NGAM Distribution has entered into agreements, which include servicing agreements, with financial intermediaries that provide recordkeeping, processing, shareholder communications and other services to customers of the intermediaries that hold positions in the Funds and has agreed to compensate the intermediaries for providing those services. Intermediaries transact with the Funds primarily through the use of omnibus accounts on behalf of their customers who hold positions in the Funds. These services would have been provided by the Funds’ transfer agent and other service providers if the shareholders’ accounts were maintained directly at the Funds’ transfer agent. Accordingly, the Funds have agreed to reimburse NGAM Distribution for all or a portion of the servicing fees paid to these intermediaries. The reimbursement amounts (sub-transfer agent fees) paid to NGAM Distribution are subject to a current per-account equivalent fee limit approved by the Funds’ Board of Trustees, which is based on fees for similar services paid to the Funds’ transfer agent and other service providers. Class N shares do not bear such expenses.
| 106
Notes to Financial Statements (continued)
September 30, 2015
For the year ended September 30, 2015, the sub-transfer agent fees (which are reflected in transfer agent fees and expenses in the Statements of Operations) for each Fund were as follows:
| | | | |
Fund | | Sub-Transfer
Agent Fees | |
Core Plus Bond Fund | | $ | 3,427,448 | |
High Income Fund | | | 164,031 | |
Limited Term Government and Agency Fund | | | 320,818 | |
As of September 30, 2015, the Funds owe NGAM Distribution the following reimbursements for sub-transfer agent fees (which are reflected in the Statements of Assets and Liabilities as payable to distributor):
| | | | |
Fund | | Reimbursements
of Sub-Transfer
Agent Fees | |
Core Plus Bond Fund | | $ | 48,571 | |
High Income Fund | | | 4,889 | |
Limited Term Government and Agency Fund | | | 4,333 | |
Sub-transfer agent fees attributable to Class A, Class B, Class C and Class Y are allocated on a pro rata basis to each class based on the relative net assets of each class to the total net assets of those classes.
e. Commissions. Commissions (including CDSCs) on Fund shares retained by NGAM Distribution during the year ended September 30, 2015 were as follows:
| | | | |
Fund | | Commissions | |
Core Plus Bond Fund | | $ | 277,763 | |
High Income Fund | | | 8,814 | |
Limited Term Government and Agency Fund | | | 50,710 | |
f. Trustees Fees and Expenses. The Trusts do not pay any compensation directly to their officers or Trustees who are directors, officers or employees of NGAM Advisors, NGAM Distribution, Natixis US or their affiliates. The Chairperson of the Board of Trustees receives a retainer fee at the annual rate of $300,000. The Chairperson does not receive any meeting attendance fees for Board of Trustees meetings or committee meetings that she attends. Each Independent Trustee (other than the Chairperson) receives, in the aggregate, a retainer fee at the annual rate of $130,000. Each Independent Trustee also receives a meeting attendance fee of $10,000 for each meeting of the Board of Trustees that he or she attends in person and $5,000 for each meeting of the Board of Trustees that he or she attends telephonically. In addition, the chairperson of the Contract Review Committee and the chairperson of the Audit Committee each receive an additional retainer fee at the annual rate of $17,500. The
107 |
Notes to Financial Statements (continued)
September 30, 2015
chairperson of the Governance Committee receives an additional retainer fee at the annual rate of $5,000. Each Contract Review Committee member is compensated $6,000 for each Committee meeting that he or she attends in person and $3,000 for each meeting that he or she attends telephonically. Each Audit Committee member is compensated $6,000 for each Committee meeting that he or she attends in person and $3,000 for each meeting that he or she attends telephonically. These fees are allocated among the funds in the Natixis Funds Trusts, Loomis Sayles Funds Trusts and Gateway Trust based on a formula that takes into account, among other factors, the relative net assets of each fund. Trustees are reimbursed for travel expenses in connection with attendance at meetings.
A deferred compensation plan (the “Plan”) is available to the Trustees on a voluntary basis. Deferred amounts remain in the Funds until distributed in accordance with the provisions of the Plan. The value of a participating Trustee’s deferral account is based on theoretical investments of deferred amounts, on the normal payment dates, in certain funds of the Natixis Funds Trusts and Loomis Sayles Funds Trusts as designated by the participating Trustees. Changes in the value of participants’ deferral accounts are allocated pro rata among the funds in the Natixis Funds Trusts and Loomis Sayles Funds Trusts, and are normally reflected as Trustees’ fees and expenses in the Statements of Operations. The portions of the accrued obligations allocated to the Funds under the Plan are reflected as Deferred Trustees’ fees in the Statements of Assets and Liabilities.
g. Affiliated Ownership. As of September 30, 2015, Loomis Sayles Employees’ Profit Sharing Retirement Plan (“Retirement Plan”) held shares of the Funds representing the following percentages of the Fund’s net assets:
| | | | |
Fund | | Retirement Plan | |
Core Plus Bond Fund | | | 0.06 | % |
Limited Term Government and Agency Fund | | | 0.14 | % |
Investment activities of affiliated shareholders could have material impacts on the Funds.
7. Class-Specific Transfer Agent Fees and Expenses. For the year ended September 30, 2015, Core Plus Bond Fund incurred the following class-specific transfer agent fees and expenses (including sub-transfer agent fees, where applicable):
| | | | | | | | | | | | | | | | | | | | |
| | | Class A | | | Class B | | | Class C | | | Class N | | | Class Y | |
Transfer Agent Fees and Expenses | | $ | 826,832 | | | $ | 318 | | | $ | 312,197 | | | $ | 2,280 | | | $ | 2,519,675 | |
Transfer agent fees and expenses attributable to Class A, Class B, Class C and Class Y are allocated on a pro rata basis to each class based on the relative net assets of each class to the total net assets of those classes. Transfer agent fees and expenses attributable to Class N are allocated to Class N.
| 108
Notes to Financial Statements (continued)
September 30, 2015
All other Funds in this report allocate transfer agent fees and expenses on a pro rata basis based on the relative net assets of each class to the total net assets of those classes.
8. Line of Credit. Each Fund, together with certain other funds of Natixis Funds Trusts and Loomis Sayles Funds Trusts, participates in a $150,000,000 committed unsecured line of credit provided by State Street Bank. Any one Fund may borrow up to the full $150,000,000 under the line of credit (as long as all borrowings by all Funds in the aggregate do not exceed the $150,000,000 limit at any time). Interest is charged to each participating Fund based on its borrowings at a rate per annum equal to the greater of the Federal Funds rate or overnight LIBOR, plus 1.25%. In addition, a commitment fee of 0.15% per annum, payable at the end of each calendar quarter, is accrued and apportioned among the participating funds based on their average daily unused portion of the line of credit.
For the year ended September 30, 2015, none of the Funds had borrowings under this agreement.
Prior to April 16, 2015, the committed unsecured line of credit was $200,000,000 with an individual limit of $125,000,000 for each Fund that participated in the line of credit. In addition, the commitment fee was 0.10% per annum, payable at the end of each calendar quarter.
9. Concentration of Risk. Limited Term Government and Agency Fund’s investments in mortgage-related and asset-backed securities are subject to certain risks not associated with investments in other securities. Mortgage-related and asset-backed securities are subject to the risk that unexpected changes in interest rates will have a direct effect on expected maturity. A shortened maturity may result in the reinvestment of prepaid amounts in securities with lower yields than the original obligations. An extended maturity may result in a reduction of a security’s value.
Each Fund’s investments in foreign securities are subject to foreign currency fluctuations, higher volatility than U.S. securities, varying degrees of regulation and limited liquidity. Greater political, economic, credit and information risks are also associated with foreign securities.
109 |
Notes to Financial Statements (continued)
September 30, 2015
10. Concentration of Ownership. From time to time, a Fund may have a concentration of one or more accounts constituting a significant percentage of shares outstanding. Investment activities by holders of such accounts could have material impacts on the Funds. As of September 30, 2015, based on management’s evaluation of the shareholder account base, the Funds had accounts representing controlling ownership of more than 5% of the Fund’s total outstanding shares. The number of such accounts, based on accounts that represent more than 5% of an individual class of shares, and the aggregate percentage of net assets represented by such holdings were as follows:
| | | | | | | | | | | | | | | | |
Fund | | Number of 5%
Non-Affiliated
Account Holders | | | Percentage of
Non-Affiliated
Ownership | | | Percentage of
Affiliated
Ownership
(Note 6) | | | Total
Percentage of
Ownership | |
Core Plus Bond Fund | | | 1 | | | | 6.06 | % | | | 0.06 | % | | | 6.12 | % |
High Income Fund | | | 3 | | | | 27.42 | % | | | — | | | | 27.42 | % |
Limited Term Government and Agency Fund | | | 1 | | | | 10.35 | % | | | 0.14 | % | | | 10.49 | % |
Omnibus shareholder accounts for which NGAM Advisors understands that the intermediary has discretion over the underlying shareholder accounts or investment models where a shareholder account may be invested for a non-discretionary customer are included in the table above. For other omnibus accounts, the Funds do not have information on the individual shareholder accounts underlying the omnibus accounts; therefore, there could be other 5% shareholders in addition to those disclosed in the table above.
| 110
Notes to Financial Statements (continued)
September 30, 2015
11. Capital Shares. Each Fund may issue an unlimited number of shares of beneficial interest, without par value. Transactions in capital shares were as follows:
| | | | | | | | | | | | | | | | |
| |
| Year Ended
September 30, 2015 |
| |
| Year Ended
September 30, 2014 |
|
Core Plus Bond Fund | | | Shares | | | | Amount | | | | Shares | | | | Amount | |
| Class A | | | | | | | | | | | | | | | | |
Issued from the sale of shares | | | 57,949,399 | | | $ | 757,297,253 | | | | 29,795,175 | | | $ | 393,768,013 | |
Issued in connection with the reinvestment of distributions | | | 1,930,361 | | | | 24,960,078 | | | | 1,003,545 | | | | 13,146,005 | |
Redeemed | | | (34,689,593 | ) | | | (445,393,927 | ) | | | (16,328,796 | ) | | | (214,096,387 | ) |
| | | | | | | | | | | | | | | | |
Net change | | | 25,190,167 | | | $ | 336,863,404 | | | | 14,469,924 | | | $ | 192,817,631 | |
| | | | | | | | | | | | | | | | |
| Class B | | | | | | | | | | | | | | | | |
Issued from the sale of shares | | | 90 | | | $ | 1,655 | | | | 923 | | | $ | 12,023 | |
Issued in connection with the reinvestment of distributions | | | 527 | | | | 6,876 | | | | 1,536 | | | | 20,111 | |
Redeemed | | | (44,652 | ) | | | (582,052 | ) | | | (43,656 | ) | | | (574,001 | ) |
| | | | | | | | | | | | | | | | |
Net change | | | (44,035 | ) | | $ | (573,521 | ) | | | (41,197 | ) | | $ | (541,867 | ) |
| | | | | | | | | | | | | | | | |
| Class C | | | | | | | | | | | | | | | | |
Issued from the sale of shares | | | 15,015,219 | | | $ | 196,948,567 | | | | 7,230,506 | | | $ | 95,528,924 | |
Issued in connection with the reinvestment of distributions | | | 455,968 | | | | 5,896,096 | | | | 260,172 | | | | 3,405,772 | |
Redeemed | | | (6,190,729 | ) | | | (79,756,335 | ) | | | (6,291,404 | ) | | | (81,808,202 | ) |
| | | | | | | | | | | | | | | | |
Net change | | | 9,280,458 | | | $ | 123,088,328 | | | | 1,199,274 | | | $ | 17,126,494 | |
| | | | | | | | | | | | | | | | |
| Class N | | | | | | | | | | | | | | | | |
Issued from the sale of shares | | | 189,587,048 | | | $ | 2,500,232,956 | | | | 7,101,873 | | | $ | 95,126,708 | |
Issued in connection with the reinvestment of distributions | | | 4,023,156 | | | | 52,220,483 | | | | 119,610 | | | | 1,591,071 | |
Redeemed | | | (23,949,864 | ) | | | (310,530,852 | ) | | | (776,670 | ) | | | (10,310,123 | ) |
| | | | | | | | | | | | | | | | |
Net change | | | 169,660,340 | | | $ | 2,241,922,587 | | | | 6,444,813 | | | $ | 86,407,656 | |
| | | | | | | | | | | | | | | | |
| Class Y | | | | | | | | | | | | | | | | |
Issued from the sale of shares | | | 237,417,381 | | | $ | 3,125,367,592 | | | | 68,813,227 | | | $ | 914,578,778 | |
Issued in connection with the reinvestment of distributions | | | 6,287,665 | | | | 81,758,696 | | | | 1,861,139 | | | | 24,597,610 | |
Redeemed | | | (90,106,606 | ) | | | (1,161,814,292 | ) | | | (20,930,186 | ) | | | (275,242,381 | ) |
| | | | | | | | | | | | | | | | |
Net change | | | 153,598,440 | | | $ | 2,045,311,996 | | | | 49,744,180 | | | $ | 663,934,007 | |
| | | | | | | | | | | | | | | | |
Increase (decrease) from capital share transactions | | | 357,685,370 | | | $ | 4,746,612,794 | | | | 71,816,994 | | | $ | 959,743,921 | |
| | | | | | | | | | | | | | | | |
111 |
Notes to Financial Statements (continued)
September 30, 2015
11. Capital Shares (continued)
| | | | | | | | | | | | | | | | |
| |
| Year Ended
September 30, 2015 |
| |
| Year Ended
September 30, 2014 |
|
High Income Fund | | | Shares | | | | Amount | | | | Shares | | | | Amount | |
| Class A | | | | | | | | | | | | | | | | |
Issued from the sale of shares | | | 7,165,895 | | | $ | 31,113,644 | | | | 5,133,818 | | | $ | 23,326,417 | |
Issued in connection with the reinvestment of distributions | | | 580,589 | | | | 2,471,372 | | | | 971,866 | | | | 4,324,321 | |
Redeemed | | | (7,757,369 | ) | | | (33,308,895 | ) | | | (6,566,505 | ) | | | (29,978,953 | ) |
| | | | | | | | | | | | | | | | |
Net change | | | (10,885 | ) | | $ | 276,121 | | | | (460,821 | ) | | $ | (2,328,215 | ) |
| | | | | | | | | | | | | | | | |
| Class B | | | | | | | | | | | | | | | | |
Issued from the sale of shares | | | — | | | $ | — | | | | 3,463 | | | $ | 15,765 | |
Issued in connection with the reinvestment of distributions | | | 790 | | | | 3,364 | | | | 4,994 | | | | 22,266 | |
Redeemed | | | (27,193 | ) | | | (117,824 | ) | | | (64,948 | ) | | | (299,817 | ) |
| | | | | | | | | | | | | | | | |
Net change | | | (26,403 | ) | | $ | (114,460 | ) | | | (56,491 | ) | | $ | (261,786 | ) |
| | | | | | | | | | | | | | | | |
| Class C | | | | | | | | | | | | | | | | |
Issued from the sale of shares | | | 649,877 | | | $ | 2,832,749 | | | | 504,940 | | | $ | 2,306,974 | |
Issued in connection with the reinvestment of distributions | | | 166,683 | | | | 709,594 | | | | 269,328 | | | | 1,199,074 | |
Redeemed | | | (900,836 | ) | | | (3,893,227 | ) | | | (844,464 | ) | | | (3,842,672 | ) |
| | | | | | | | | | | | | | | | |
Net change | | | (84,276 | ) | | $ | (350,884 | ) | | | (70,196 | ) | | $ | (336,624 | ) |
| | | | | | | | | | | | | | | | |
| Class Y | | | | | | | | | | | | | | | | |
Issued from the sale of shares | | | 28,556,251 | | | $ | 124,963,285 | | | | 12,451,931 | | | $ | 56,610,742 | |
Issued in connection with the reinvestment of distributions | | | 1,781,224 | | | | 7,571,272 | | | | 1,946,529 | | | | 8,656,379 | |
Redeemed | | | (28,942,559 | ) | | | (125,371,469 | ) | | | (10,009,792 | ) | | | (45,183,438 | ) |
| | | | | | | | | | | | | | | | |
Net change | | | 1,394,916 | | | $ | 7,163,088 | | | | 4,388,668 | | | $ | 20,083,683 | |
| | | | | | | | | | | | | | | | |
Increase (decrease) from capital share transactions | | | 1,273,352 | | | $ | 6,973,865 | | | | 3,801,160 | | | $ | 17,157,058 | |
| | | | | | | | | | | | | | | | |
| 112
Notes to Financial Statements (continued)
September 30, 2015
11. Capital Shares (continued)
| | | | | | | | | | | | | | | | |
| |
| Year Ended
September 30, 2015 |
| |
| Year Ended
September 30, 2014 |
|
Limited Term Government and Agency Fund | | | Shares | | | | Amount | | | | Shares | | | | Amount | |
| Class A | | | | | | | | | | | | | | | | |
Issued from the sale of shares | | | 9,649,293 | | | $ | 111,950,383 | | | | 10,352,825 | | | $ | 120,783,887 | |
Issued in connection with the reinvestment of distributions | | | 375,777 | | | | 4,361,038 | | | | 509,189 | | | | 5,940,640 | |
Redeemed | | | (7,161,541 | ) | | | (83,105,890 | ) | | | (14,196,566 | ) | | | (165,594,450 | ) |
| | | | | | | | | | | | | | | | |
Net change | | | 2,863,529 | | | $ | 33,205,531 | | | | (3,334,552 | ) | | $ | (38,869,923 | ) |
| | | | | | | | | | | | | | | | |
| Class B | | | | | | | | | | | | | | | | |
Issued from the sale of shares | | | 4,412 | | | $ | 51,055 | | | | 109,804 | | | $ | 1,281,761 | |
Issued in connection with the reinvestment of distributions | | | 2,463 | | | | 28,567 | | | | 5,851 | | | | 68,193 | |
Redeemed | | | (140,481 | ) | | | (1,628,030 | ) | | | (261,431 | ) | | | (3,046,644 | ) |
| | | | | | | | | | | | | | | | |
Net change | | | (133,606 | ) | | $ | (1,548,408 | ) | | | (145,776 | ) | | $ | (1,696,690 | ) |
| | | | | | | | | | | | | | | | |
| Class C | | | | | | | | | | | | | | | | |
Issued from the sale of shares | | | 2,240,435 | | | $ | 26,003,916 | | | | 1,307,714 | | | $ | 15,266,049 | |
Issued in connection with the reinvestment of distributions | | | 27,082 | | | | 314,602 | | | | 43,490 | | | | 507,877 | |
Redeemed | | | (1,711,009 | ) | | | (19,866,952 | ) | | | (2,606,942 | ) | | | (30,440,808 | ) |
| | | | | | | | | | | | | | | | |
Net change | | | 556,508 | | | $ | 6,451,566 | | | | (1,255,738 | ) | | $ | (14,666,882 | ) |
| | | | | | | | | | | | | | | | |
| Class Y | | | | | | | | | | | | | | | | |
Issued from the sale of shares | | | 24,653,312 | | | $ | 286,964,981 | | | | 19,913,274 | | | $ | 232,904,721 | |
Issued in connection with the reinvestment of distributions | | | 339,019 | | | | 3,946,537 | | | | 270,399 | | | | 3,163,665 | |
Redeemed | | | (16,140,773 | ) | | | (187,902,947 | ) | | | (13,350,830 | ) | | | (156,223,639 | ) |
| | | | | | | | | | | | | | | | |
Net change | | | 8,851,558 | | | $ | 103,008,571 | | | | 6,832,843 | | | $ | 79,844,747 | |
| | | | | | | | | | | | | | | | |
Increase (decrease) from capital share transactions | | | 12,137,989 | | | $ | 141,117,260 | | | | 2,096,777 | | | $ | 24,611,252 | |
| | | | | | | | | | | | | | | | |
12. Subsequent Event. On September 10, 2015, the Board of Trustees approved the following changes: (i) the early conversion of all of the Funds’ remaining Class B shares into Class A shares, effective at the close of business on January 11, 2016, (ii) a reduction of the maximum sales charge on purchases of Class A shares of Core Plus Bond Fund and High Income Fund from 4.50% to 4.25% and Limited Term Government and Agency Fund from 3.00% to 2.25% (plus other changes to the sales charge schedule), effective November 2, 2015, and (iii) a broadening of eligibility requirements for Class N shares to include investors with an initial minimum investment of $1,000,000, effective November 2, 2015.
113 |
Report of Independent Registered Public
Accounting Firm
To the Trustees of Natixis Funds Trust I and Shareholders of Loomis Sayles Core Plus Bond Fund and the Trustees of Loomis Sayles Funds II and Shareholders of Loomis Sayles High Income Fund and Loomis Sayles Limited Term Government and Agency Fund:
In our opinion, the accompanying statements of assets and liabilities, including the portfolios of investments, and the related statements of operations and of changes in net assets and the financial highlights present fairly, in all material respects, the financial position of the Loomis Sayles Core Bond Plus Fund, a series of Natixis Funds Trust I, and Loomis Sayles High Income Fund and Loomis Sayles Limited Term Government and Agency Fund, each a series of Loomis Sayles Funds II (collectively, the “Funds”) at September 30, 2015, and the results of each of their operations, the changes in each of their net assets and the financial highlights for each of the periods indicated, in conformity with accounting principles generally accepted in the United States of America. These financial statements and financial highlights (hereafter referred to as “financial statements”) are the responsibility of the Funds’ management. Our responsibility is to express an opinion on these financial statements based on our audits. We conducted our audits of these financial statements in accordance with the standards of the Public Company Accounting Oversight Board (United States). Those standards require that we plan and perform the audit to obtain reasonable assurance about whether the financial statements are free of material misstatement. An audit includes examining, on a test basis, evidence supporting the amounts and disclosures in the financial statements, assessing the accounting principles used and significant estimates made by management, and evaluating the overall financial statement presentation. We believe that our audits, which included confirmation of securities at September 30, 2015 by correspondence with the custodian, agent banks and brokers, and the application of alternative auditing procedures where securities purchased had not been received, provide a reasonable basis for the opinion expressed above.
PricewaterhouseCoopers LLP
Boston, Massachusetts
November 20, 2015
| 114
2015 U.S. Tax Distribution Information to
Shareholders (Unaudited)
Corporate Dividends Received Deduction. For the fiscal year ended September 30, 2015, a percentage of dividends distributed by the Funds listed below qualify for the dividends received deduction for corporate shareholders. These percentages are as follows:
| | | | |
Fund | | Qualifying Percentage | |
Core Plus Bond | | | 0.11 | % |
High Income | | | 5.80 | % |
Capital Gains Distributions. Pursuant to Internal Revenue Section 852(b), the following Funds paid distributions, which have been designated as capital gains distributions for the fiscal year ended September 30, 2015, unless subsequently determined to be different.
| | | | |
Fund | | Amount | |
Core Plus Bond | | $ | 9,466,139 | |
High Income | | | 3,412,156 | |
Qualified Dividend Income. For the fiscal year ended September 30, 2015, the Funds below will designate up to the maximum amount allowable pursuant to the Internal Revenue Code as qualified dividend income eligible for reduced tax rates. These lower rates range from 0% to 20% depending on an individual’s tax bracket. If the Funds pay a distribution during calendar year 2015, complete information will be reported in conjunction with Form 1099-DIV.
| | |
Fund | | |
Core Plus Bond | | |
High Income | | |
115 |
Trustee and Officer Information
The tables below provide certain information regarding the trustees and officers of Natixis Funds Trust I and Loomis Sayles Funds II (the “Trusts”). Unless otherwise indicated, the address of all persons below is 399 Boylston Street, Boston, MA 02116. The Funds’ Statements of Additional Information include additional information about the trustees of the Trusts and are available by calling Natixis Funds at 800-225-5478.
| | | | | | | | |
Name and Year of Birth | | Position(s) Held with the Trusts, Length of Time Served and Term of Office1 | | Principal Occupation(s) During Past 5 Years | | Number of Portfolios in Fund Complex Overseen2 and Other Directorships Held During Past 5 Years | | Experience, Qualifications, Attributes, Skills for Board Membership |
| | | |
| INDEPENDENT TRUSTEES | | | | | | |
| | | | |
Kenneth A. Drucker
(1945) | | Trustee since 2008 for Natixis Funds Trust I and Loomis Sayles Funds II Chairperson of the Audit Committee and Governance Committee Member | | Retired | | 42 None | | Significant experience on the Board and on the boards of other business organizations (including at investment companies); executive experience (including as treasurer of an aerospace, automotive, and metal manufacturing corporation) |
| | | | |
Edmond J. English
(1953) | | Trustee since 2013 for Natixis Funds Trust I and Loomis Sayles Funds II Contract Review Committee Member | | Chief Executive Officer of Bob’s Discount Furniture (retail) | | 42 Formerly, Director, BJ’s Wholesale Club (retail); formerly, Director, Citizens Financial Group (bank) | | Experience on the Board and significant experience on the boards of other business organizations (including at a retail company and a bank); executive experience (including at a retail company) |
| 116
Trustee and Officer Information
| | | | | | | | |
Name and Year of Birth | | Position(s) Held with the Trusts, Length of Time Served and Term of Office1 | | Principal Occupation(s) During Past 5 Years | | Number of Portfolios in Fund Complex Overseen2 and Other Directorships Held During Past 5 Years | | Experience, Qualifications, Attributes, Skills for Board Membership |
| | | |
INDEPENDENT TRUSTEES continued | | | | | | |
| | | | |
Richard A. Goglia
(1951) | | Trustee since 2015 for Natixis Funds Trust I and Loomis Sayles Funds II Audit Committee Member | | Retired; formerly Vice President and Treasurer of Raytheon Company (defense) | | 42 None | | Experience on the Board and executive experience (including his role as vice president and treasurer of a defense company and experience at a financial services company) |
| | | | |
Wendell J. Knox
(1948) | | Trustee since 2009 for Natixis Funds Trust I and Loomis Sayles Funds II Audit Committee Member and Governance Committee Member | | Director of Abt Associates Inc. (research and consulting) | | 42 Director, Eastern Bank (bank); Director, The Hanover Insurance Group (property and casualty insurance) | | Significant experience on the Board and on the boards of other business organizations (including at a bank and at a property and casualty insurance firm); executive experience (including roles as president and chief executive officer of a research and consulting company) |
117 |
Trustee and Officer Information
| | | | | | | | |
Name and Year of Birth | | Position(s) Held with the Trusts, Length of Time Served and Term of Office1 | | Principal Occupation(s) During Past 5 Years | | Number of Portfolios in Fund Complex Overseen2 and Other Directorships Held During Past 5 Years | | Experience, Qualifications, Attributes, Skills for Board Membership |
| | | |
INDEPENDENT TRUSTEES continued | | | | | | |
| | | | |
Martin T. Meehan
(1956) | | Trustee since 2012 for Natixis Funds Trust I and Loomis Sayles Funds II Contract Review Committee Member | | President, University of Massachusetts (formerly, Chancellor and faculty member, University of Massachusetts Lowell) | | 42 None | | Experience on the Board and on the boards of other business organizations; experience as President of the University of Massachusetts; government experience (including as a member of the U.S. House of Representatives); academic experience |
| | | | |
Sandra O. Moose
(1942) | | Chairperson of the Board of Trustees since November 2005 Trustee since 1982 for Natixis Funds Trust I (including its predecessors); and since 2003 for Loomis Sayles Funds II Ex Officio member of the Audit Committee, the Contract Review Committee and the Governance Committee | | President, Strategic Advisory Services (management consulting) | | 42 Director, AES Corporation (international power company); formerly, Director, Verizon Communications (telecommunications company) | | Significant experience on the Board and on the boards of other business organizations (including at a telecommunications company, an international power company and a specialty chemicals corporation); executive experience (including at a management consulting company) |
| 118
Trustee and Officer Information
| | | | | | | | |
Name and Year of Birth | | Position(s) Held with the Trusts, Length of Time Served and Term of Office1 | | Principal Occupation(s) During Past 5 Years | | Number of Portfolios in Fund Complex Overseen2 and Other Directorships Held During Past 5 Years | | Experience, Qualifications, Attributes, Skills for Board Membership |
| | | |
INDEPENDENT TRUSTEES continued | | | | | | |
| | | | |
Erik R. Sirri
(1958) | | Trustee since 2009 for Natixis Funds Trust I and Loomis Sayles Funds II Audit Committee Member | | Professor of Finance at Babson College | | 42 None | | Significant experience on the Board; experience as Director of the Division of Trading and Markets at the Securities and Exchange Commission; academic experience; training as an economist |
| | | | |
Peter J. Smail
(1952) | | Trustee since 2009 for Natixis Funds Trust I and Loomis Sayles Funds II Chairperson of the Contract Review Committee and Governance Committee Member | | Retired | | 42 None | | Significant experience on the Board; mutual fund industry and executive experience (including roles as president and chief executive officer for an investment adviser) |
| | | | |
Cynthia L. Walker
(1956) | | Trustee since 2005 for Natixis Funds Trust I and Loomis Sayles Funds II Chairperson of the Governance Committee and Contract Review Committee Member | | Deputy Dean for Finance and Administration, Yale University School of Medicine | | 42 None | | Significant experience on the Board; executive experience in a variety of academic organizations (including roles as dean for finance and administration) |
119 |
Trustee and Officer Information
| | | | | | | | |
Name and Year of Birth | | Position(s) Held with the Trusts, Length of Time Served and Term of Office1 | | Principal Occupation(s) During Past 5 Years | | Number of Portfolios in Fund Complex Overseen2 and Other Directorships Held During Past 5 Years | | Experience, Qualifications, Attributes, Skills for Board Membership |
| | | |
| INTERESTED TRUSTEES | | | | | | |
| | | | |
Kevin P. Charleston3
(1965)
One Financial Center
Boston, MA 02111 | | Trustee since 2015 for Natixis Funds Trust I and Loomis Sayles Funds II | | President, Chief Executive Officer and Director; formerly, Chief Financial Officer, Loomis, Sayles & Company, L.P. | | 42 None | | Continuing service as President, Chief Executive Officer and Director of Loomis, Sayles & Company, L.P. |
| | | | |
David L. Giunta4
(1965) | | Trustee since 2011 for Natixis Funds Trust I and Loomis Sayles Funds II President and Chief Executive Officer of Natixis Funds Trust I; President since 2008 and Chief Executive Officer since 2015 of Loomis Sayles Funds II | | President and Chief Executive Officer, NGAM Distribution Corporation, NGAM Advisors, L.P. and NGAM Distribution, L.P. | | 42 None | | Experience on the Board; continuing experience as President and Chief Executive Officer of NGAM Advisors, L.P. |
| | | | |
John T. Hailer5
(1960) | | Trustee since 2000 for Natixis Funds Trust I; since 2003 for Loomis Sayles Funds II | | President and Chief Executive Officer – U.S. and Asia, Natixis Global Asset Management, L.P. | | 42 None | | Significant experience on the Board; continuing experience as President and Chief Executive Officer – U.S. and Asia, Natixis Global Asset Management, L.P. |
| 1 | Each trustee serves until retirement, resignation or removal from the Board. The current retirement age is 75. The position of Chairperson of the Board is appointed for a three-year term. Ms. Moose was appointed to serve an additional three-year term as the Chairperson of the Board on December 13, 2013. |
| 2 | The trustees of the Trusts serve as trustees of a fund complex that includes all series of the Natixis Funds Trust I, Natixis Funds Trust II, Natixis Funds Trust IV and Gateway Trust (collectively, the “Natixis Funds Trusts”), Loomis Sayles Funds I and Loomis Sayles Funds II (collectively, the “Loomis Sayles Funds Trusts”) (collectively, the “Fund Complex”). |
| 3 | Mr. Charleston is deemed an “interested person” of the Trusts because he holds the following positions with an affiliated person of the Trusts: President, Chief Executive Officer and Director of Loomis, Sayles & Company, L.P. |
| 4 | Mr. Giunta is deemed an “interested person” of the Trusts because he holds the following positions with an affiliated person of the Trusts: President and Chief Executive Officer of NGAM Distribution Corporation, NGAM Advisors, L.P. and NGAM Distribution, L.P. |
| 5 | Mr. Hailer is deemed an “interested person” of the Trusts because he holds the following positions with an affiliated person of the Trusts: President and Chief Executive Officer – U.S. and Asia, Natixis Global Asset Management, L.P. |
| 120
Trustee and Officer Information
| | | | | | |
Name and Year of Birth | | Position(s) Held with the Trust(s) | | Term of Office1 and Length of Time Served | | Principal Occupation(s) During Past 5 Years2 |
| | |
| OFFICERS OF THE TRUST | | | | |
| | | |
Coleen Downs Dinneen
(1960) | | Secretary, Clerk and Chief Legal Officer | | Since September 2004 | | Executive Vice President, General Counsel, Secretary and Clerk, NGAM Distribution Corporation, NGAM Advisors, L.P. and NGAM Distribution, L.P. |
| | | |
Daniel J. Fuss
(1933)
One Financial Center
Boston, MA 02111 | | Executive Vice President of Loomis Sayles Funds II | | Since June 2003 | | Vice Chairman and Director, Loomis, Sayles & Company, L.P. |
| | | |
Russell L. Kane
(1969) | | Chief Compliance Officer, Assistant Secretary and Anti-Money Laundering Officer | | Chief Compliance Officer since May 2006; Assistant Secretary since June 2004; and Anti-Money Laundering Officer since April 2007 | | Chief Compliance Officer for Mutual Funds, Senior Vice President, Deputy General Counsel, Assistant Secretary and Assistant Clerk, NGAM Distribution Corporation, NGAM Advisors, L.P. and NGAM Distribution, L.P. |
| | | |
Michael C. Kardok
(1959) | | Treasurer, Principal Financial and Accounting Officer | | Since October 2004 | | Senior Vice President, NGAM Advisors, L.P. and NGAM Distribution, L.P. |
| 1 | Each officer of the Trusts serves for an indefinite term in accordance with the Trusts’ current by-laws until the date his or her successor is elected and qualified, or until he or she sooner dies, retires, is removed or becomes disqualified. |
| 2 | Each person listed above, except as noted, holds the same position(s) with the Fund Complex. Mr. Fuss is not an officer of the Natixis Funds Trusts. Previous positions during the past five years with NGAM Distribution, L.P., NGAM Advisors, L.P. or Loomis, Sayles & Company, L.P. are omitted, if not materially different from a trustee’s or officer’s current position with such entity. |
121 |
ANNUAL REPORT
September 30, 2015

Loomis Sayles Investment Grade Bond Fund

TABLE OF CONTENTS
Portfolio Review page 1
Portfolio of Investments page 12
Financial Statements page 28
Notes to Financial Statements page 38
LOOMIS SAYLES INVESTMENT GRADE BOND FUND
| | |
| Managers | | Symbols |
| Matthew J. Eagan, CFA® | | Class A LIGRX |
| Daniel J. Fuss, CFA®, CIC | | Class B LGBBX |
| Brian P. Kennedy | | Class C LGBCX |
| Elaine M. Stokes | | Class N LGBNX |
| Loomis, Sayles & Company, L.P. | | Class Y LSIIX |
| | Admin Class LIGAX |
Objective
The Fund seeks high total investment return through a combination of current income and capital appreciation.
Market Conditions
Falling commodity prices and a strengthening U.S. dollar characterized the reporting period. Commodity prices declined significantly, with oil falling approximately 50%. The U.S. dollar generally advanced versus most currencies due to global divergence of economic growth and central bank policy. Most emerging market currencies declined versus their developed market counterparts, and commodity exporters were the hardest hit.
In the second half of the period, the world’s two largest economies — the United States and China – dominated the landscape. Investors generally expected the Federal Reserve Board (the Fed) to tighten monetary policy in September, but the Fed kept short-term rates unchanged due to global economic and market turbulence triggered by China’s economic slowdown. The market interpreted the Fed’s decision as confirmation of global growth risks, which further strained commodities, emerging markets and other risk assets.
Developed market government bonds posted positive local currency returns, benefitting from investor risk aversion caused by sluggish global demand and commodity price weakness. Pressures from a rising U.S. dollar largely hampered returns for U.S. dollar-based investors. Investment grade corporates underperformed government bonds. However, slower growth in China, commodity price pressures and uncertainty about the Fed rate increase weighed more heavily on high yield and commodity-related bonds.
Performance Results
For the 12 months ended September 30, 2015, Class A shares of the Loomis Sayles Investment Grade Bond Fund returned -4.72% at net asset value. The Fund underperformed its benchmark, the Barclays U.S. Government/Credit Bond Index, which returned 2.73%.
Explanation of Fund Performance
The Fund’s underperformance was primarily due to out-of-benchmark allocations. Non-U.S.-dollar-denominated securities detracted from performance. Given the continued strength of the U.S. dollar and the decline in commodity prices, holdings denominated in the Canadian dollar, Mexican peso, New Zealand dollar, Norwegian krone, Australian
1 |
dollar and Brazilian real weighed negatively on return. In addition, the Fund’s exposure to high yield securities, particularly industrials and financials, hindered performance. Holdings in the metals and mining industry, which suffered along with other commodities, were among the greatest laggards. Meanwhile, the Fund’s significant underweight position in the U.S. Treasury sector weighed on relative performance; we held short-maturity Treasuries as reserves. Furthermore, selected technology names within the convertibles and equity allocations limited relative results.
Our allocation to investment grade bonds generated a positive absolute return and contributed to relative performance. Security selection and an underweight allocation within industrials were the primary drivers of results. Investment grade financials and utilities also lifted the Fund’s relative return. Additionally, selected municipal and Yankee bonds (U.S.-dollar-denominated bonds issued by non-U.S. entities) contributed positively to return. Furthermore, security selection among consumer non-cyclical holdings aided performance.
Outlook
We continue to have a positive outlook for the U.S. economy, despite some recent softer data. Steady improvement in employment and consumer sentiment should support consumption trends. We do not believe current low rates reflect the state of the U.S. economy. However, uncertainty about Chinese growth and weakening global economic trends may delay U.S. monetary policy changes. We believe the path for rates, which is likely to be very slow and shallow, is more important than timing. The downside risks to global growth have increased in our view; however, we believe conditions will remain reasonably strong overall.
The steady pace of U.S. economic growth should support risk assets, and we are maintaining exposure to corporate bonds. We view the investment grade and high yield markets as being distorted by global, not U.S., factors, and spread widening over the past 12 months has significantly improved valuations.
Risk profiles in non-U.S. markets should continue to be driven by oil prices, a strengthening U.S. dollar and central bank action. We are monitoring cheaper non-U.S.-dollar asset valuations, but we remain cautious. Since we do not see a positive catalyst at this point, we think it is too early to add exposure.
Our long-term themes remain intact, and we believe we are well positioned for this market environment. We have been investing away from the benchmark in sectors with low or negative correlations to U.S. rates. We are using portfolio flexibility to identify attractive income opportunities, broaden diversification and maintain a higher level of reserves. Our antidote for highly volatile markets is a patient, selective approach that seeks to capture value when investors are mispricing risk.
| 2
LOOMIS SAYLES INVESTMENT GRADE BOND FUND
Growth of $10,000 Investment in Class A Shares4
September 30, 2005 through September 30, 2015
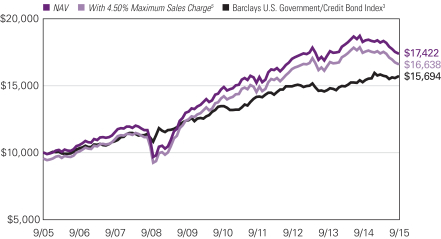
3 |
Average Annual Total Returns — September 30, 20154
| | | | | | | | | | | | | | | | |
| | | | | |
| | | 1 Year | | | 5 Years | | | 10 Years | | | Life of
Class N | |
| | | | | |
| Class A (Inception 12/31/96) | | | | | | | | | | | | | | | | |
| NAV | | | -4.72 | % | | | 3.43 | % | | | 5.71 | % | | | — | % |
| With 4.50% Maximum Sales Charge5 | | | -9.00 | | | | 2.49 | | | | 5.23 | | | | — | |
| | | | | |
| Class B (Inception 9/12/03) | | | | | | | | | | | | | | | | |
| NAV | | | -5.46 | | | | 2.65 | | | | 4.86 | | | | — | |
| With CDSC2 | | | -10.04 | | | | 2.33 | | | | 4.86 | | | | — | |
| | | | | |
| Class C (Inception 9/12/03) | | | | | | | | | | | | | | | | |
| NAV | | | -5.40 | | | | 2.66 | | | | 4.93 | | | | — | |
| With CDSC2 | | | -6.31 | | | | 2.66 | | | | 4.93 | | | | — | |
| | | | | |
| Class N (Inception 2/1/13) | | | | | | | | | | | | | | | | |
| NAV | | | -4.28 | | | | — | | | | — | | | | 0.33 | |
| | | | | |
| Class Y (Inception 12/31/96) | | | | | | | | | | | | | | | | |
| NAV | | | -4.47 | | | | 3.71 | | | | 6.00 | | | | — | |
| | | | | |
| Admin Class (Inception 2/1/10)1 | | | | | | | | | | | | | | | | |
| NAV | | | -4.95 | | | | 3.18 | | | | 5.34 | | | | — | |
| | | | | |
| Comparative Performance | | | | | | | | | | | | | | | | |
| Barclays U.S. Government/Credit Bond Index3 | | | 2.73 | | | | 3.09 | | | | 4.61 | | | | 2.01 | |
Past performance does not guarantee future results. The table(s) do not reflect taxes shareholders might owe on any Fund distributions or when they redeem their shares. Performance for periods less than one year is cumulative, not annualized. Returns reflect changes in share price and reinvestment of dividends and capital gains, if any. Unlike a fund, an index is not managed and does not reflect fees and expenses. It is not possible to invest directly in an index.
| 1 | Prior to the inception of Admin Class shares (2/1/10), performance is that of Class A shares, restated to reflect the higher net expenses of Admin Class shares. |
| 2 | Performance for Class B shares assumes a maximum 5% contingent deferred sales charge (“CDSC”) applied when you sell shares, which declines annually between years 1-6 according to the following schedule: 5, 4, 3, 3, 2, 1, 0%. Class C shares performance assumes a 1% CDSC applied when you sell shares within one year of purchase. |
| 3 | Barclays U.S. Government/Credit Bond Index is an unmanaged index that includes U.S. Treasuries, government-related issues, and investment grade U.S. corporate securities. |
| 4 | Fund performance has been increased by fee waivers and/or expense reimbursements, if any, without which performance would have been lower. |
| 5 | Effective November 2, 2015, the maximum sales charge was reduced to 4.25%. See Note 11 of Notes to Financial Statements. |
| 4
ADDITIONAL INFORMATION
The views expressed in this report reflect those of the portfolio managers as of the dates indicated. The managers’ views are subject to change at any time without notice based on changes in market or other conditions. References to specific securities or industries should not be regarded as investment advice. Because the Fund is actively managed, there is no assurance that it will continue to invest in the securities or industries mentioned.
ADDITIONAL INDEX INFORMATION
This document may contain references to third party copyrights, indexes, and trademarks, each of which is the property of its respective owner. Such owner is not affiliated with Natixis Global Asset Management or any of its related or affiliated companies (collectively “NGAM”) and does not sponsor, endorse or participate in the provision of any NGAM services, funds or other financial products.
The index information contained herein is derived from third parties and is provided on an “as is” basis. The user of this information assumes the entire risk of use of this information. Each of the third party entities involved in compiling, computing or creating index information disclaims all warranties (including, without limitation, any warranties of originality, accuracy, completeness, timeliness, non-infringement, merchantability and fitness for a particular purpose) with respect to such information.
PROXY VOTING INFORMATION
A description of the Fund’s proxy voting policies and procedures is available without charge, upon request, by calling Natixis Funds at 800-225-5478; on the fund’s website at ngam.natixis.com; and on the Securities and Exchange Commission’s (“SEC’s”) website at www.sec.gov. Information regarding how the fund voted proxies relating to portfolio securities during the 12 months ended June 30, 2015 is available from the fund’s website and the SEC’s website.
QUARTERLY PORTFOLIO SCHEDULES
The fund files a complete schedule of portfolio holdings with the SEC for the first and third quarters of each fiscal year on Form N-Q. The fund’s Forms N-Q are available on the SEC’s website at www.sec.gov and may be reviewed and copied at the SEC’s Public Reference Room in Washington, DC. Information on the operation of the Public Reference Room may be obtained by calling 800-SEC-0330.
5 |
UNDERSTANDING YOUR FUND’S EXPENSES
As a mutual fund shareholder, you incur different types of costs: transaction costs, including sales charges (loads) on purchases and contingent deferred sales charges on redemptions; and ongoing costs, including management fees, distribution fees (12b-1 fees) and/or service fees, and other fund expenses. Certain exemptions may apply. These costs are described in more detail in the Fund’s prospectus. The following examples are intended to help you understand the ongoing costs of investing in the Fund and help you compare these with the ongoing costs of investing in other mutual funds.
The first line in the table for each class of Fund shares shows the actual account values and actual fund expenses you would have paid on a $1,000 investment in the Fund from April 1, 2015 through September 30, 2015. To estimate the expenses you paid over the period, simply divide your account value by $1,000 (for example $8,600 account value divided by $1,000 = 8.60) and multiply the result by the number in the Expenses Paid During Period row as shown below for your class.
The second line in the table for each class of Fund shares provides information about hypothetical account values and hypothetical expenses based on the Fund’s actual expense ratios and an assumed rate of return of 5% per year before expenses, which is not the Fund’s actual return. The hypothetical account values and expenses may not be used to estimate the actual ending account balance or expenses you paid on your investment for the period. You may use this information to compare the ongoing costs of investing in the Fund to other funds. To do so, compare this 5% hypothetical example with the 5% hypothetical examples that appear in the shareholder reports of the other funds.
Please note that the expenses shown reflect ongoing costs only, and do not include any transaction costs. Therefore, the second line in the table is useful in comparing ongoing costs only, and will not help you determine the relative costs of owning different funds. If transaction costs were included, total costs would be higher.
| 6
| | | | | | | | | | | | |
LOOMIS SAYLES INVESTMENT GRADE
BOND FUND | | BEGINNING ACCOUNT VALUE 4/1/2015 | | | ENDING ACCOUNT VALUE 9/30/2015 | | | EXPENSES PAID DURING PERIOD* 4/1/2015 – 9/30/2015 | |
| Class A | | | | | | | | | | | | |
| Actual | | | $1,000.00 | | | | $955.20 | | | | $4.07 | |
| Hypothetical (5% return before expenses) | | | $1,000.00 | | | | $1,020.91 | | | | $4.20 | |
| Class B | | | | | | | | | | | | |
| Actual | | | $1,000.00 | | | | $950.80 | | | | $7.68 | |
| Hypothetical (5% return before expenses) | | | $1,000.00 | | | | $1,017.20 | | | | $7.94 | |
| Class C | | | | | | | | | | | | |
| Actual | | | $1,000.00 | | | | $951.90 | | | | $7.73 | |
| Hypothetical (5% return before expenses) | | | $1,000.00 | | | | $1,017.15 | | | | $7.99 | |
| Class N | | | | | | | | | | | | |
| Actual | | | $1,000.00 | | | | $957.80 | | | | $2.26 | |
| Hypothetical (5% return before expenses) | | | $1,000.00 | | | | $1,022.76 | | | | $2.33 | |
| Class Y | | | | | | | | | | | | |
| Actual | | | $1,000.00 | | | | $956.40 | | | | $2.84 | |
| Hypothetical (5% return before expenses) | | | $1,000.00 | | | | $1,022.16 | | | | $2.94 | |
| Admin Class | | | | | | | | | | | | |
| Actual | | | $1,000.00 | | | | $953.90 | | | | $5.29 | |
| Hypothetical (5% return before expenses) | | | $1,000.00 | | | | $1,019.65 | | | | $5.47 | |
| * | Expenses are equal to the Fund’s annualized expense ratio (after waiver/reimbursement): 0.83%, 1.57%, 1.58%, 0.46%, 0.58% and 1.08% for Class A, B, C, N, Y and Admin Class, respectively, multiplied by the average account value over the period, multiplied by the number of days in the most recent fiscal half-year (183), divided by 365 (to reflect the half-year period). |
7 |
BOARD APPROVAL OF THE EXISTING ADVISORY AGREEMENT
The Board of Trustees of the Trust (the “Board”), including the Independent Trustees, considers matters bearing on the Fund’s advisory agreement (the “Agreement”) at most of its meetings throughout the year. Each year, usually in the spring, the Contract Review Committee of the Board meets to review the Agreement to determine whether to recommend that the full Board approve the continuation of the Agreement, typically for an additional one-year period. After the Committee has made its recommendation, the full Board, including the Independent Trustees, determines whether to approve the continuation of the Agreement.
In connection with these meetings, the Trustees receive materials that the Fund’s investment adviser (the “Adviser”) believes to be reasonably necessary for the Trustees to evaluate the Agreement. These materials generally include, among other items, (i) information on the investment performance of the Fund and the performance of a peer group and category of funds and the Fund’s performance benchmarks, (ii) information on the Fund’s advisory fee and other expenses, including information comparing the Fund’s expenses to the fees charged to institutional accounts with similar strategies managed by the Adviser, if any, and to those of a peer group of funds and information about any applicable expense caps and/or fee “breakpoints,” (iii) sales and redemption data in respect of the Fund, (iv) information about the profitability of the Agreement to the Adviser and (v) information obtained through the completion by the Adviser of a questionnaire distributed on behalf of the Trustees. The Board, including the Independent Trustees, also considers other matters such as (i) the Adviser’s financial results and/or financial condition, (ii) the Fund’s investment objective and strategies and the size, education and experience of the Adviser’s investment staff and its use of technology, external research and trading cost measurement tools, (iii) arrangements in respect of the distribution of the Fund’s shares and the related costs, (iv) the procedures employed to determine the value of the Fund’s assets, (v) the allocation of the Fund’s brokerage, if any, including, if applicable, allocations to brokers affiliated with the Adviser and the use of “soft” commission dollars to pay Fund expenses and to pay for research and other similar services, (vi) the resources devoted to, and the record of compliance with, the Fund’s investment policies and restrictions, policies on personal securities transactions and other compliance policies, (vii) information about amounts invested by the Fund’s portfolio managers in the Fund or in similar accounts that they manage and (viii) the general economic outlook with particular emphasis on the mutual fund industry. Throughout the process, the Trustees are afforded the opportunity to ask questions of and request additional materials from the Adviser.
In addition to the materials requested by the Trustees in connection with their annual consideration of the continuation of the Agreement, the Trustees receive materials in advance of each regular quarterly meeting of the Board that provide detailed information about the Fund’s investment performance and the fees charged to the Fund for advisory and other services. This information generally includes, among other things, an internal performance rating for the Fund based on agreed-upon criteria, graphs showing the Fund’s performance and fee differentials against the Fund’s peer group/category, performance ratings provided by a third-party, total return information for various periods, and third-party performance rankings for various periods comparing the Fund against similarly categorized funds. The
| 8
portfolio management team for the Fund or other representatives of the Adviser make periodic presentations to the Contract Review Committee and/or the full Board, and if the Fund is identified as presenting possible performance concerns it may be subject to more frequent board presentations and reviews. In addition, each quarter the Trustees are provided with detailed statistical information about the Fund’s portfolio. The Trustees also receive periodic updates between meetings.
The Board most recently approved the continuation of the Agreement at its meeting held in June 2015. The Agreement was continued for a one-year period. In considering whether to approve the continuation of the Agreement, the Board, including the Independent Trustees, did not identify any single factor as determinative. Individual Trustees may have evaluated the information presented differently from one another, giving different weights to various factors. Matters considered by the Trustees, including the Independent Trustees, in connection with their approval of the Agreement included, but were not limited to, the factors listed below.
The nature, extent and quality of the services provided to the Fund under the Agreement. The Trustees considered the nature, extent and quality of the services provided by the Adviser and its affiliates to the Fund and the resources dedicated to the Fund by the Adviser and its affiliates.
The Trustees considered not only the advisory services provided by the Adviser to the Fund, but also the monitoring and oversight services provided by NGAM Advisors, L.P. (“NGAM Advisors”). They also considered the administrative services provided by NGAM Advisors and its affiliates to the Fund. The Trustees also considered the benefits to shareholders of investing in a mutual fund that is part of a family of funds that offers shareholders the right to exchange shares of one type of fund for shares of another type of fund, and provides a variety of fund and shareholder services.
After reviewing these and related factors, the Trustees concluded, within the context of their overall conclusions regarding the Agreement, that the nature, extent and quality of services provided supported the renewal of the Agreement.
Investment performance of the Fund and the Adviser. As noted above, the Trustees received information about the performance of the Fund over various time periods, including information that compared the performance of the Fund to the performance of a peer group and category of funds and the Fund’s performance benchmark. In addition, the Trustees also reviewed data prepared by an independent third party that analyzed the performance of the Fund using a variety of performance metrics, including metrics that also measured the performance of the Fund on a risk adjusted basis.
The Board concluded that the Fund’s performance or other relevant factors supported the renewal of the Fund’s Agreement. The Trustees noted that while the Fund had performance that lagged that of its peer group and/or category for certain (although not all) periods, the Board concluded that other factors relevant to performance supported renewal of the Agreement. These factors included the following: (1) that the underperformance was attributable, to a significant extent, to investment decisions (such as security selection or sector allocation) by the Adviser that were reasonable and consistent with the Fund’s investment objective and policies; and (2) that the Fund’s long-term performance was competitive when compared to relevant performance benchmarks or peer groups.
9 |
The Trustees also considered the Adviser’s performance and reputation generally, the performance of the fund family generally, and the historical responsiveness of the Adviser to Trustee concerns about performance and the willingness of the Adviser to take steps intended to improve performance.
After reviewing these and related factors, the Trustees concluded, within the context of their overall conclusions regarding the Agreement, that the performance of the Fund and the Adviser supported the renewal of the Agreement.
The costs of the services to be provided and profits to be realized by the Adviser and its affiliates from their respective relationships with the Fund. The Trustees considered the fees charged to the Fund for advisory services as well as the total expense level of the Fund. This information included comparisons (provided both by management and also by an independent third party) of the Fund’s advisory fee and total expense level to those of its peer group and information about the advisory fees charged by the Adviser to comparable accounts (such as institutional separate accounts), as well as information about differences in such fees and the reasons for any such differences. In considering the fees charged to comparable accounts, the Trustees considered, among other things, management’s representations about the differences between managing mutual funds as compared to other types of accounts, including the additional resources required to effectively manage mutual fund assets and the greater regulatory costs associated with the management of such assets. In evaluating the Fund’s advisory fee, the Trustees also took into account the demands, complexity and quality of the investment management of the Fund, as well as the need for the Adviser to offer competitive compensation and to expend additional resources as the Fund grows in size. The Trustees considered that over the past several years, management had made recommendations regarding reductions in advisory fee rates, implementation of advisory fee breakpoints and the institution of advisory fee waivers and expense caps for various funds in the fund family. They noted that the Fund has an expense cap in place, and the Trustees considered that the current expenses are below the cap.
The Trustees also considered the compensation directly or indirectly received by the Adviser and its affiliates from their relationships with the Fund. The Trustees reviewed information provided by management as to the profitability of the Adviser’s and its affiliates’ relationships with the Fund, and information about the allocation of expenses used to calculate profitability. They also reviewed information provided by management about the effect of distribution costs and changes in asset levels on Adviser profitability, including information regarding resources spent on distribution activities. When reviewing profitability, the Trustees also considered information about court cases in which adviser compensation or profitability were issues, the performance of the Fund, the expense levels of the Fund and whether the Adviser had implemented breakpoints and/or expense caps with respect to the Fund.
After reviewing these and related factors, the Trustees concluded, within the context of their overall conclusions regarding the Agreement, that the advisory fee charged to the Fund was fair and reasonable, and that the costs of these services generally and the related profitability of the Adviser and its affiliates in respect of their relationships with the Fund supported the renewal of the Agreement.
Economies of Scale. The Trustees considered the existence of any economies of scale in the provision of services by the Adviser and whether those economies are shared with the Fund
| 10
through breakpoints in its investment advisory fee or other means, such as expense waivers or caps. The Trustees also discussed with management the factors considered with respect to the implementation of breakpoints in investment advisory fees or expense waivers or caps for certain funds. Management explained that a number of factors are taken into account in considering the possible implementation of breakpoints or an expense cap for a fund, including, among other things, factors such as a fund’s assets, the projected growth of a fund, projected profitability and a fund’s fees and performance. With respect to economies of scale, the Trustees noted that the Fund was subject to an expense cap and the Fund’s overall net expense ratio was equal to the median compared to a peer group of funds. The Trustees considered that current expenses are below the cap. In considering these issues, the Trustees also took note of the costs of the services provided (both on an absolute and a relative basis) and the profitability to the Adviser and its affiliates of their relationships with the Fund, as discussed above.
After reviewing these and related factors, the Trustees concluded, within the context of their overall conclusions regarding the Agreement, that the extent to which economies of scale were shared with the Fund supported the renewal of the Agreement.
The Trustees also considered other factors, which included but were not limited to the following:
| · | | The effect of recent market and economic events on the performance, asset levels and expense ratios of the Fund. |
| · | | Whether the Fund has operated in accordance with its investment objective and the Fund’s record of compliance with its investment restrictions, and the compliance programs of the Fund and the Adviser. They also considered the compliance-related resources the Adviser and its affiliates were providing to the Fund. |
| · | | Plans for maintaining continuity of portfolio management where that was thought to be a potential issue. |
| · | | The nature, quality, cost and extent of administrative and shareholder services performed by the Adviser and its affiliates, both under the Agreement and under a separate agreement covering administrative services. |
| · | | So-called “fallout benefits” to the Adviser, such as the engagement of affiliates of the Adviser to provide distribution, administrative and brokerage services to the Fund, and the benefits of research made available to the Adviser by reason of brokerage commissions (if any) generated by the Fund’s securities transactions. The Trustees also considered the benefits to the parent company of NGAM Advisors from the retention of the Adviser. The Trustees considered the possible conflicts of interest associated with these fallout and other benefits, and the reporting, disclosure and other processes in place to disclose and monitor such possible conflicts of interest. |
| · | | The Trustees’ review and discussion of the Fund’s advisory arrangements in prior years, and management’s record of responding to Trustee concerns raised during the year and in prior years. |
Based on their evaluation of all factors that they deemed to be material, including those factors described above, and assisted by the advice of independent counsel, the Trustees, including the Independent Trustees, concluded that the existing Agreement should be continued through June 30, 2016.
11 |
Portfolio of Investments – as of September 30, 2015
Loomis Sayles Investment Grade Bond Fund
| | | | | | | | |
Principal Amount (‡) | | | Description | | Value (†) | |
| | Bonds and Notes — 93.6% of Net Assets | |
| | Non-Convertible Bonds — 87.8% | | | | |
| | | | ABS Car Loan — 0.2% | | | | |
| $ | 20,999,250 | | | Avis Budget Rental Car Funding AESOP LLC, Series 2010-5A, Class B, 5.110%, 3/20/2017, 144A | | $ | 21,203,594 | |
| | | | | | | | |
| | | | ABS Other — 2.7% | | | | |
| | 57,694,000 | | | Crown Castle Towers LLC, 6.113%, 1/15/2040, 144A | | | 65,016,984 | |
| | 2,165,706 | | | Diamond Resorts Owner Trust, Series 2011-1, Class A,
4.000%, 3/20/2023, 144A | | | 2,203,352 | |
| | 56,794,501 | | | FAN Engine Securitization Ltd., Series 2013-1A, Class 1A,
4.625%, 10/15/2043, 144A(b) | | | 56,516,208 | |
| | 44,878,000 | | | John Deere Owner Trust, Series 2015-A, Class A3, 1.320%, 6/17/2019 | | | 45,007,069 | |
| | 11,600,000 | | | John Deere Owner Trust, Series 2015-A, Class A4, 1.650%, 12/15/2021 | | | 11,654,566 | |
| | 34,385,084 | | | Trinity Rail Leasing LP, Series 2009-1A, Class A, 6.657%, 11/16/2039, 144A | | | 39,706,726 | |
| | 12,144,361 | | | Trinity Rail Leasing LP, Series 2010-1A, Class A, 5.194%, 10/16/2040, 144A | | | 12,899,109 | |
| | 3,092,731 | | | Trinity Rail Leasing LP, Series 2012-1A, Class A1, 2.266%, 1/15/2043, 144A | | | 3,056,855 | |
| | 6,792,153 | | | Trip Rail Master Funding LLC, Series 2011-1A, Class A1A,
4.370%, 7/15/2041, 144A | | | 7,052,768 | |
| | | | | | | | |
| | | | | | | 243,113,637 | |
| | | | | | | | |
| | | | Aerospace & Defense — 1.4% | | | | |
| | 2,100,000 | | | Bombardier, Inc., 7.450%, 5/01/2034, 144A | | | 1,407,000 | |
| | 78,795,000 | | | Textron, Inc., 5.950%, 9/21/2021 | | | 91,357,208 | |
| | 11,040,000 | | | Textron, Inc., EMTN, 6.625%, 4/07/2020, (GBP) | | | 18,935,281 | |
| | 10,280,000 | | | TransDigm, Inc., 6.500%, 5/15/2025, 144A | | | 9,663,200 | |
| | | | | | | | |
| | | | | | | 121,362,689 | |
| | | | | | | | |
| | | | Airlines — 2.5% | | | | |
| | 4,614,033 | | | Air Canada Pass Through Trust, Series 2013-1, Class B, 5.375%, 11/15/2022, 144A | | | 4,740,919 | |
| | 10,805,211 | | | American Airlines Pass Through Trust, Series 2013-1, Class A, 4.000%, 1/15/2027 | | | 10,977,446 | |
| | 18,340,000 | | | Continental Airlines Pass Through Certificates, Series 2012-3, Class C, 6.125%, 4/29/2018 | | | 19,027,750 | |
| | 260,029 | | | Continental Airlines Pass Through Trust, Series 1998-1, Class A, 6.648%, 3/15/2019 | | | 266,998 | |
| | 656,622 | | | Continental Airlines Pass Through Trust, Series 1999-1, Class A, 6.545%, 8/02/2020 | | | 706,657 | |
| | 3,040,289 | | | Continental Airlines Pass Through Trust, Series 2001-1, Class A-1, 6.703%, 12/15/2022 | | | 3,184,702 | |
| | 48,473,423 | | | Continental Airlines Pass Through Trust, Series 2007-1, Class A, 5.983%, 10/19/2023 | | | 53,563,132 | |
| | 10,648,202 | | | Continental Airlines Pass Through Trust, Series 2007-1, Class B, 6.903%, 10/19/2023 | | | 11,233,853 | |
| | 20,048,881 | | | Continental Airlines Pass Through Trust, Series 2009-1, 9.000%, 1/08/2018 | | | 21,066,562 | |
| | 2,443,708 | | | Continental Airlines Pass Through Trust, Series 2012-1, Class B, 6.250%, 10/11/2021 | | | 2,547,565 | |
| | 1,465,586 | | | Delta Air Lines Pass Through Trust, Series 2007-1, Class A, 6.821%, 2/10/2024 | | | 1,700,079 | |
See accompanying notes to financial statements.
| 12
Portfolio of Investments – as of September 30, 2015
Loomis Sayles Investment Grade Bond Fund – (continued)
| | | | | | | | |
Principal Amount (‡) | | | Description | | Value (†) | |
| | | | Airlines — continued | | | | |
| $ | 9,538,621 | | | Delta Air Lines Pass Through Trust, Series 2007-1, Class B, 8.021%, 2/10/2024 | | $ | 10,778,642 | |
| | 21,038,309 | | | Delta Air Lines Pass Through Trust, Series 2009-1, Class A, 7.750%, 6/17/2021 | | | 23,983,672 | |
| | 2,032,473 | | | Delta Air Lines Pass Through Trust, Series 2009-1, Series B, 9.750%, 6/17/2018 | | | 2,195,071 | |
| | 12,873,324 | | | Delta Air Lines Pass Through Trust, Series 2010-1, Class A, 6.200%, 1/02/2020 | | | 13,903,190 | |
| | 19,082,961 | | | UAL Pass Through Trust, Series 2007-1, Class A, 6.636%, 1/02/2024 | | | 20,334,804 | |
| | 249,918 | | | UAL Pass Through Trust, Series 2009-1, 10.400%, 5/01/2018 | | | 267,862 | |
| | 13,638,616 | | | US Airways Pass Through Trust, Series 2011-1, Class A, 7.125%, 4/22/2025 | | | 15,854,892 | |
| | 8,595,631 | | | US Airways Pass Through Trust, Series 2012-2A, Class A, 4.625%, 12/03/2026 | | | 8,881,866 | |
| | 2,372,625 | | | Virgin Australia Pass Through Trust, Series 2013-1A,
5.000%, 4/23/2025, 144A | | | 2,459,273 | |
| | | | | | | | |
| | | | | | | 227,674,935 | |
| | | | | | | | |
| | | | Automotive — 1.0% | | | | |
| | 23,581,000 | | | Cummins, Inc., 5.650%, 3/01/2098 | | | 25,199,670 | |
| | 5,274,000 | | | Cummins, Inc., 6.750%, 2/15/2027 | | | 6,695,222 | |
| | 125,000 | | | Ford Motor Co., 6.500%, 8/01/2018 | | | 139,381 | |
| | 255,000 | | | Ford Motor Co., 6.625%, 2/15/2028 | | | 288,084 | |
| | 2,186,000 | | | Ford Motor Co., 7.400%, 11/01/2046 | | | 2,769,096 | |
| | 240,000 | | | Ford Motor Co., 7.500%, 8/01/2026 | | | 289,827 | |
| | 5,000,000 | | | Ford Motor Credit Co. LLC, 5.000%, 5/15/2018 | | | 5,317,935 | |
| | 40,126,000 | | | Ford Motor Credit Co. LLC, 6.625%, 8/15/2017 | | | 43,318,344 | |
| | 2,370,000 | | | Goodyear Tire & Rubber Co. (The), 7.000%, 3/15/2028 | | | 2,476,650 | |
| | | | | | | | |
| | | | | | | 86,494,209 | |
| | | | | | | | |
| | | | Banking — 14.4% | | | | |
| | 13,792,000 | | | AgriBank FCB, 9.125%, 7/15/2019, 144A | | | 17,036,927 | |
| | 1,468,000 | | | Ally Financial, Inc., 8.000%, 11/01/2031 | | | 1,746,920 | |
| | 7,200,000 | | | American Express Centurion Bank, Series BKN1, 6.000%, 9/13/2017 | | | 7,805,174 | |
| | 11,400,000 | | | Banco Santander Brasil S.A., 8.000%, 3/18/2016, 144A, (BRL) | | | 2,731,744 | |
| | 11,641,000 | | | Bank of America Corp., 2.600%, 1/15/2019 | | | 11,759,273 | |
| | 3,590,000 | | | Bank of America Corp., 5.420%, 3/15/2017 | | | 3,771,159 | |
| | 25,627,000 | | | Bank of America Corp., MTN, 3.300%, 1/11/2023 | | | 25,431,056 | |
| | 100,000 | | | Bank of America Corp., MTN, 4.250%, 10/22/2026 | | | 98,862 | |
| | 11,000,000 | | | Bank of America Corp., MTN, 5.000%, 5/13/2021 | | | 12,120,702 | |
| | 17,249,000 | | | Bank of America NA, 5.300%, 3/15/2017 | | | 18,119,902 | |
| | 1,056,000 | | | Barclays Bank PLC, 6.050%, 12/04/2017, 144A | | | 1,142,008 | |
| | 2,173,000 | | | Bear Stearns Cos., Inc. (The), 4.650%, 7/02/2018 | | | 2,324,595 | |
| | 370,000 | | | BNP Paribas/Australia, 7.000%, 5/24/2016, (AUD) | | | 266,829 | |
| | 8,994,000 | | | Capital One Financial Corp., 6.150%, 9/01/2016 | | | 9,368,528 | |
| | 56,000,000 | | | Citigroup, Inc., 2.500%, 9/26/2018 | | | 56,743,624 | |
| | 17,000,000 | | | Citigroup, Inc., 3.500%, 5/15/2023 | | | 16,549,415 | |
| | 1,660,000 | | | Citigroup, Inc., 4.500%, 1/14/2022 | | | 1,795,433 | |
See accompanying notes to financial statements.
13 |
Portfolio of Investments – as of September 30, 2015
Loomis Sayles Investment Grade Bond Fund – (continued)
| | | | | | | | |
Principal Amount (‡) | | | Description | | Value (†) | |
| | | | Banking — continued | | | | |
| $ | 22,960,000 | | | Citigroup, Inc., 5.130%, 11/12/2019, (NZD) | | $ | 15,374,153 | |
| | 5,445,000 | | | Citigroup, Inc., 6.125%, 5/15/2018 | | | 6,018,549 | |
| | 44,910,000 | | | Citigroup, Inc., 6.250%, 6/29/2017, (NZD) | | | 30,091,039 | |
| | 21,855,000 | | | Cooperatieve Centrale Raiffeisen-Boerenleenbank BA/Netherlands, 3.875%, 2/08/2022 | | | 23,017,620 | |
| | 5,265,000 | | | Cooperatieve Centrale Raiffeisen-Boerenleenbank BA/Netherlands, 3.950%, 11/09/2022 | | | 5,287,729 | |
| | 86,800,000 | | | Goldman Sachs Group, Inc. (The), 3.375%, 2/01/2018, (CAD) | | | 67,204,469 | |
| | 1,174,000 | | | Goldman Sachs Group, Inc. (The), 6.450%, 5/01/2036 | | | 1,370,543 | |
| | 112,330,000 | | | Goldman Sachs Group, Inc. (The), 6.750%, 10/01/2037 | | | 134,000,479 | |
| | 6,645,000 | | | Goldman Sachs Group, Inc. (The), GMTN, 5.375%, 3/15/2020 | | | 7,412,385 | |
| | 4,467,000 | | | HBOS PLC, 6.000%, 11/01/2033, 144A | | | 4,967,224 | |
| | 700,000 | | | ICICI Bank Ltd., (fixed rate to 4/30/2017, variable rate thereafter), 6.375%, 4/30/2022, 144A | | | 709,083 | |
| | 70,245,000 | | | JPMorgan Chase & Co., 4.125%, 12/15/2026 | | | 69,967,111 | |
| | 36,745,000 | | | JPMorgan Chase & Co., 4.250%, 11/02/2018, (NZD) | | | 23,900,902 | |
| | 2,950,000 | | | JPMorgan Chase & Co., EMTN, 1.068%, 5/30/2017, (GBP)(c) | | | 4,391,209 | |
| | 16,000,000,000 | | | JPMorgan Chase Bank NA, 7.700%, 6/01/2016, 144A, (IDR) | | | 1,030,334 | |
| | 100,000 | | | Keybank NA, 6.950%, 2/01/2028 | | | 127,262 | |
| | 9,787,000 | | | Lloyds Bank PLC, EMTN, 4.570%, 10/13/2015, (CAD) | | | 7,338,453 | |
| | 81,622,000 | | | Lloyds Bank PLC, MTN, 6.500%, 9/14/2020, 144A | | | 94,142,570 | |
| | 103,309,000 | | | Merrill Lynch & Co., Inc., 6.110%, 1/29/2037 | | | 118,830,144 | |
| | 40,126,000 | | | Merrill Lynch & Co., Inc., Series C, MTN, 6.050%, 6/01/2034(b) | | | 45,407,866 | |
| | 78,200,000 | | | Morgan Stanley, 2.125%, 4/25/2018 | | | 78,660,520 | |
| | 4,250,000 | | | Morgan Stanley, 3.450%, 11/02/2015 | | | 4,259,596 | |
| | 1,845,000 | | | Morgan Stanley, 4.350%, 9/08/2026 | | | 1,854,494 | |
| | 30,000,000 | | | Morgan Stanley, 4.750%, 11/16/2018, (AUD) | | | 21,849,065 | |
| | 56,867,000 | | | Morgan Stanley, 5.500%, 7/24/2020 | | | 63,841,908 | |
| | 5,900,000 | | | Morgan Stanley, 5.750%, 1/25/2021 | | | 6,728,808 | |
| | 151,076,000 | | | Morgan Stanley, 7.600%, 8/08/2017, (NZD) | | | 102,982,556 | |
| | 60,800,000 | | | Morgan Stanley, 8.000%, 5/09/2017, (AUD) | | | 45,785,468 | |
| | 550,000 | | | Morgan Stanley, EMTN, 5.750%, 2/14/2017, (GBP) | | | 879,162 | |
| | 24,100,000 | | | Morgan Stanley, GMTN, 7.625%, 3/03/2016, (AUD) | | | 17,250,084 | |
| | 20,695,000 | | | Morgan Stanley, MTN, 4.100%, 5/22/2023 | | | 20,945,679 | |
| | 38,206,000 | | | Morgan Stanley, Series F, GMTN, 5.625%, 9/23/2019 | | | 42,682,024 | |
| | 2,239,000 | | | Morgan Stanley, Series G & H, GMTN, 5.125%, 11/30/2015, (GBP) | | | 3,408,567 | |
| | 2,875,000 | | | National City Bank of Indiana, 4.250%, 7/01/2018 | | | 3,054,250 | |
| | 8,638,000 | | | National City Corp., 6.875%, 5/15/2019 | | | 9,957,843 | |
| | 700,000 | | | Santander Central Hispano Issuances Ltd., 7.250%, 11/01/2015 | | | 702,603 | |
| | 16,175,000 | | | Santander Holdings USA, Inc., 4.625%, 4/19/2016 | | | 16,482,001 | |
| | 1,800,000 | | | Santander Issuances SAU, 5.911%, 6/20/2016, 144A | | | 1,842,993 | |
| | 3,300,000 | | | Standard Chartered Bank, 6.400%, 9/26/2017, 144A | | | 3,551,130 | |
| | | | | | | | |
| | | | | | | 1,296,120,026 | |
| | | | | | | | |
| | | | Brokerage — 0.9% | | | | |
| | 50,270,000 | | | Jefferies Group LLC, 5.125%, 1/20/2023 | | | 50,369,183 | |
| | 19,498,000 | | | Jefferies Group LLC, 6.250%, 1/15/2036 | | | 18,388,349 | |
| | 8,760,000 | | | Jefferies Group LLC, 6.450%, 6/08/2027 | | | 9,088,281 | |
See accompanying notes to financial statements.
| 14
Portfolio of Investments – as of September 30, 2015
Loomis Sayles Investment Grade Bond Fund – (continued)
| | | | | | | | |
Principal Amount (‡) | | | Description | | Value (†) | |
| | | | Brokerage — continued | | | | |
| $ | 1,693,000 | | | Jefferies Group LLC, 6.875%, 4/15/2021 | | $ | 1,902,685 | |
| | | | | | | | |
| | | | | | | 79,748,498 | |
| | | | | | | | |
| | | | Building Materials — 1.3% | | | | |
| | 10,942,000 | | | Masco Corp., 5.850%, 3/15/2017 | | | 11,407,035 | |
| | 6,616,000 | | | Masco Corp., 6.125%, 10/03/2016 | | | 6,864,232 | |
| | 6,058,000 | | | Masco Corp., 6.500%, 8/15/2032 | | | 6,209,450 | |
| | 28,539,000 | | | Masco Corp., 7.125%, 3/15/2020 | | | 32,891,197 | |
| | 5,725,000 | | | Masco Corp., 7.750%, 8/01/2029 | | | 6,397,688 | |
| | 9,300,000 | | | Odebrecht Finance Ltd., 8.250%, 4/25/2018, 144A, (BRL) | | | 1,303,337 | |
| | 284,000 | | | Owens Corning, 6.500%, 12/01/2016 | | | 303,064 | |
| | 41,379,000 | | | Owens Corning, 7.000%, 12/01/2036 | | | 48,467,223 | |
| | | | | | | | |
| | | | | | | 113,843,226 | |
| | | | | | | | |
| | | | Cable Satellite — 1.2% | | | | |
| | 17,832,000 | | | Shaw Communications, Inc., 5.650%, 10/01/2019, (CAD) | | | 14,984,893 | |
| | 13,630,000 | | | Time Warner Cable, Inc., 4.125%, 2/15/2021 | | | 14,009,200 | |
| | 2,800,000 | | | Time Warner Cable, Inc., 4.500%, 9/15/2042 | | | 2,213,745 | |
| | 4,101,000 | | | Time Warner Cable, Inc., 5.850%, 5/01/2017 | | | 4,340,265 | |
| | 64,548,000 | | | Time Warner Cable, Inc., 6.750%, 7/01/2018 | | | 71,825,593 | |
| | | | | | | | |
| | | | | | | 107,373,696 | |
| | | | | | | | |
| | | | Chemicals — 0.5% | | | | |
| | 50,500,000 | | | INVISTA Finance LLC, 4.250%, 10/15/2019, 144A | | | 48,732,500 | |
| | | | | | | | |
| | | | Construction Machinery — 0.1% | | | | |
| | 6,787,000 | | | Toro Co., 6.625%, 5/01/2037(b) | | | 7,829,802 | |
| | | | | | | | |
| | | | Consumer Products — 0.2% | | | | |
| | 7,458,000 | | | Hasbro, Inc., 6.600%, 7/15/2028 | | | 8,558,510 | |
| | 5,525,000 | | | Newell Rubbermaid, Inc., 4.000%, 12/01/2024 | | | 5,616,748 | |
| | | | | | | | |
| | | | | | | 14,175,258 | |
| | | | | | | | |
| | | | Diversified Manufacturing — 0.2% | | | | |
| | 1,395,000 | | | Ingersoll-Rand Global Holding Co. Ltd., 6.875%, 8/15/2018 | | | 1,572,247 | |
| | 11,754,000 | | | Snap-on, Inc., 6.700%, 3/01/2019 | | | 13,518,558 | |
| | | | | | | | |
| | | | | | | 15,090,805 | |
| | | | | | | | |
| | | | Electric — 2.4% | | | | |
| | 29,767,079 | | | Alta Wind Holdings LLC, 7.000%, 6/30/2035, 144A | | | 32,994,247 | |
| | 8,906,393 | | | Bruce Mansfield Unit Pass Through Trust, 6.850%, 6/01/2034 | | | 9,219,186 | |
| | 9,066,000 | | | Cleveland Electric Illuminating Co. (The), 5.700%, 4/01/2017 | | | 9,603,514 | |
| | 30,430,000 | | | EDP Finance BV, 4.125%, 1/15/2020, 144A | | | 30,844,335 | |
| | 7,215,000 | | | EDP Finance BV, 4.900%, 10/01/2019, 144A | | | 7,507,207 | |
| | 4,491,000 | | | Empresa Nacional de Electricidad S.A., 7.875%, 2/01/2027 | | | 5,843,016 | |
| | 40,453,000 | | | Enel Finance International NV, 6.000%, 10/07/2039, 144A | | | 45,899,106 | |
| | 9,007,000 | | | Enel Finance International NV, 6.800%, 9/15/2037, 144A | | | 11,260,813 | |
| | 5,077,043 | | | Mackinaw Power LLC, 6.296%, 10/31/2023, 144A(b) | | | 5,578,147 | |
| | 50,026,000 | | | Southwestern Electric Power Co., 6.450%, 1/15/2019 | | | 56,903,875 | |
| | | | | | | | |
| | | | | | | 215,653,446 | |
| | | | | | | | |
See accompanying notes to financial statements.
15 |
Portfolio of Investments – as of September 30, 2015
Loomis Sayles Investment Grade Bond Fund – (continued)
| | | | | | | | |
Principal Amount (‡) | | | Description | | Value (†) | |
| | | | Finance Companies — 4.5% | | | | |
| $ | 66,384,000 | | | Aviation Capital Group Corp., 6.750%, 4/06/2021, 144A | | $ | 74,516,040 | |
| | 3,500,000 | | | GE Capital Australia Funding Pty Ltd., 7.000%, 10/08/2015, (AUD) | | | 2,459,088 | |
| | 1,874,000 | | | GE Capital Australia Funding Pty Ltd., MTN, 6.000%, 3/15/2019, (AUD) | | | 1,448,410 | |
| | 35,580,000 | | | General Electric Capital Corp., GMTN, 4.250%, 1/17/2018, (NZD) | | | 23,221,576 | |
| | 14,225,000 | | | General Electric Capital Corp., Series A, EMTN, 6.750%, 9/26/2016, (NZD) | | | 9,400,511 | |
| | 51,370,000 | | | General Electric Capital Corp., Series A, GMTN, 5.500%, 2/01/2017, (NZD) | | | 33,815,850 | |
| | 5,305,000 | | | General Electric Capital Corp., Series A, MTN, 0.589%, 5/13/2024(c) | | | 4,967,602 | |
| | 18,830,000 | | | International Lease Finance Corp., 4.625%, 4/15/2021 | | | 18,924,150 | |
| | 13,365,000 | | | International Lease Finance Corp., 5.875%, 4/01/2019 | | | 14,053,297 | |
| | 1,322,000 | | | International Lease Finance Corp., 5.875%, 8/15/2022 | | | 1,407,930 | |
| | 3,565,000 | | | International Lease Finance Corp., 7.125%, 9/01/2018, 144A | | | 3,921,143 | |
| | 90,196,000 | | | Navient LLC, 5.500%, 1/25/2023 | | | 71,536,252 | |
| | 62,425(††) | | | Navient LLC, 6.000%, 12/15/2043 | | | 1,070,381 | |
| | 1,785,000 | | | Navient LLC, MTN, 4.625%, 9/25/2017 | | | 1,752,647 | |
| | 8,895,000 | | | Navient LLC, MTN, 7.250%, 1/25/2022 | | | 7,783,125 | |
| | 641,000 | | | Navient LLC, MTN, 8.000%, 3/25/2020 | | | 613,757 | |
| | 15,792,000 | | | Navient LLC, Series A, MTN, 5.000%, 6/15/2018 | | | 15,081,360 | |
| | 19,496,000 | | | Navient LLC, Series A, MTN, 5.625%, 8/01/2033(b) | | | 12,623,660 | |
| | 14,625,000 | | | Quicken Loans, Inc., 5.750%, 5/01/2025, 144A | | | 13,729,219 | |
| | 18,597,000 | | | Springleaf Finance Corp., 5.250%, 12/15/2019 | | | 18,178,567 | |
| | 48,285,000 | | | Springleaf Finance Corp., 7.750%, 10/01/2021 | | | 51,544,237 | |
| | 19,414,000 | | | Springleaf Finance Corp., 8.250%, 10/01/2023 | | | 21,161,260 | |
| | | | | | | | |
| | | | | | | 403,210,062 | |
| | | | | | | | |
| | | | Government Guaranteed — 0.4% | | | | |
| | 12,910,000 | | | Instituto de Credito Oficial, EMTN, 4.530%, 3/17/2016, (CAD) | | | 9,793,606 | |
| | 4,000,000 | | | Japan Bank for International Cooperation (Japan),
2.300%, 3/19/2018, (CAD) | | | 3,070,813 | |
| | 31,142,000 | | | Queensland Treasury Corp., 7.125%, 9/18/2017, 144A, (NZD) | | | 21,475,127 | |
| | | | | | | | |
| | | | | | | 34,339,546 | |
| | | | | | | | |
| | | | Government Owned – No Guarantee — 0.7% | | | | |
| | 3,720,000 | | | Abu Dhabi National Energy Co. PJSC, 6.500%, 10/27/2036, 144A | | | 4,557,000 | |
| | 36,975,000 | | | Abu Dhabi National Energy Co. PJSC, 7.250%, 8/01/2018, 144A | | | 41,707,060 | |
| | 12,575,000 | | | Pertamina Persero PT, 6.450%, 5/30/2044, 144A | | | 10,907,039 | |
| | 7,565,000 | | | Petrobras Global Finance BV, 5.625%, 5/20/2043 | | | 4,633,563 | |
| | 1,000,000 | | | Telekom Malaysia Berhad, 7.875%, 8/01/2025, 144A | | | 1,297,391 | |
| | | | | | | | |
| | | | | | | 63,102,053 | |
| | | | | | | | |
| | | | Health Insurance — 0.0% | | | | |
| | 1,569,000 | | | Cigna Corp., 7.875%, 5/15/2027 | | | 2,111,557 | |
| | 1,174,000 | | | Cigna Corp., (Step to 8.080% on 1/15/2023), 8.300%, 1/15/2033(d) | | | 1,549,876 | |
| | | | | | | | |
| | | | | | | 3,661,433 | |
| | | | | | | | |
| | | | Healthcare — 1.9% | | | | |
| | 7,692,000 | | | Boston Scientific Corp., 6.000%, 1/15/2020 | | | 8,626,540 | |
| | 7,374,000 | | | Covidien International Finance S.A., 6.000%, 10/15/2017 | | | 8,053,079 | |
| | 9,459,000 | | | Express Scripts, Inc., 7.250%, 6/15/2019 | | | 11,021,958 | |
| | 6,440,000 | | | HCA, Inc., 4.750%, 5/01/2023 | | | 6,462,540 | |
See accompanying notes to financial statements.
| 16
Portfolio of Investments – as of September 30, 2015
Loomis Sayles Investment Grade Bond Fund – (continued)
| | | | | | | | |
Principal Amount (‡) | | | Description | | Value (†) | |
| | | | Healthcare — continued | | | | |
| $ | 57,155,000 | | | HCA, Inc., 5.250%, 4/15/2025 | | $ | 58,369,544 | |
| | 1,055,000 | | | HCA, Inc., 5.375%, 2/01/2025 | | | 1,044,450 | |
| | 802,000 | | | HCA, Inc., 5.875%, 3/15/2022 | | | 860,145 | |
| | 52,905,000 | | | HCA, Inc., 5.875%, 5/01/2023 | | | 54,888,937 | |
| | 2,936,000 | | | HCA, Inc., 7.050%, 12/01/2027 | | | 3,038,760 | |
| | 4,119,000 | | | HCA, Inc., 7.500%, 12/15/2023 | | | 4,592,685 | |
| | 1,282,000 | | | HCA, Inc., 7.500%, 11/06/2033 | | | 1,352,510 | |
| | 3,807,000 | | | HCA, Inc., 7.690%, 6/15/2025 | | | 4,225,770 | |
| | 4,164,000 | | | HCA, Inc., 8.360%, 4/15/2024 | | | 4,809,420 | |
| | 1,199,000 | | | HCA, Inc., MTN, 7.580%, 9/15/2025 | | | 1,312,905 | |
| | 3,068,000 | | | HCA, Inc., MTN, 7.750%, 7/15/2036 | | | 3,252,080 | |
| | 2,200,000 | | | Tenet Healthcare Corp., 6.875%, 11/15/2031 | | | 1,980,000 | |
| | | | | | | | |
| | | | | | | 173,891,323 | |
| | | | | | | | |
| | | | Home Construction — 0.1% | | | | |
| | 9,200,000 | | | PulteGroup, Inc., 6.000%, 2/15/2035 | | | 9,016,000 | |
| | 3,567,000 | | | PulteGroup, Inc., 6.375%, 5/15/2033 | | | 3,665,093 | |
| | | | | | | | |
| | | | | | | 12,681,093 | |
| | | | | | | | |
| | | | Independent Energy — 1.0% | | | | |
| | 8,105,000 | | | Continental Resources, Inc., 3.800%, 6/01/2024 | | | 6,573,909 | |
| | 610,000 | | | Continental Resources, Inc., 4.500%, 4/15/2023 | | | 529,709 | |
| | 9,787,000 | | | EQT Corp., 8.125%, 6/01/2019 | | | 11,499,187 | |
| | 60,038,000 | | | Equitable Resources, Inc., 6.500%, 4/01/2018 | | | 64,933,258 | |
| | 7,240,000 | | | Newfield Exploration Co., 5.625%, 7/01/2024 | | | 6,841,800 | |
| | | | | | | | |
| | | | | | | 90,377,863 | |
| | | | | | | | |
| | | | Integrated Energy — 0.1% | | | | |
| | 7,700,000 | | | Reliance Holdings USA, Inc., 5.400%, 2/14/2022, 144A | | | 8,402,094 | |
| | | | | | | | |
| | | | Life Insurance — 1.3% | | | | |
| | 1,475,000 | | | American International Group, Inc., 4.875%, 6/01/2022 | | | 1,627,592 | |
| | 600,000 | | | AXA S.A., EMTN, (fixed rate to 10/16/2019, variable rate thereafter), 6.772%, (GBP)(e) | | | 960,747 | |
| | 5,900,000 | | | AXA S.A., EMTN, (fixed rate to 4/16/2020, variable rate thereafter), 5.250%, 4/16/2040, (EUR) | | | 7,216,817 | |
| | 15,000,000 | | | Forethought Financial Group, Inc., 8.625%, 4/15/2021, 144A | | | 17,431,470 | |
| | 9,063,000 | | | Mutual of Omaha Insurance Co., 6.800%, 6/15/2036, 144A | | | 11,557,844 | |
| | 26,914,000 | | | National Life Insurance Co., 10.500%, 9/15/2039, 144A | | | 41,702,059 | |
| | 6,440,000 | | | NLV Financial Corp., 7.500%, 8/15/2033, 144A | | | 7,447,493 | |
| | 2,872,000 | | | Penn Mutual Life Insurance Co. (The), 6.650%, 6/15/2034, 144A | | | 3,411,152 | |
| | 14,489,000 | | | Penn Mutual Life Insurance Co. (The), 7.625%, 6/15/2040, 144A | | | 19,439,573 | |
| | 4,732,000 | | | Unum Group, 7.125%, 9/30/2016 | | | 4,988,995 | |
| | | | | | | | |
| | | | | | | 115,783,742 | |
| | | | | | | | |
| | | | Local Authorities — 2.0% | | | | |
| | 37,829,000 | | | New South Wales Treasury Corp., 3.500%, 3/20/2019, (AUD) | | | 27,784,708 | |
| | 152,895,000 | | | New South Wales Treasury Corp., 6.000%, 2/01/2018, (AUD) | | | 117,128,273 | |
| | 17,930,000 | | | New South Wales Treasury Corp., Series 17RG, 5.500%, 3/01/2017, (AUD) | | | 13,206,773 | |
| | 4,171 | | | Province of Alberta, 5.930%, 9/16/2016, (CAD) | | | 3,239 | |
See accompanying notes to financial statements.
17 |
Portfolio of Investments – as of September 30, 2015
Loomis Sayles Investment Grade Bond Fund – (continued)
| | | | | | | | |
Principal Amount (‡) | | | Description | | Value (†) | |
| | | | Local Authorities — continued | | | | |
| $ | 489,000 | | | Province of Nova Scotia, 6.600%, 6/01/2027, (CAD) | | $ | 507,325 | |
| | 29,791,000 | | | Province of Quebec, Canada, Series QC, 6.750%, 11/09/2015, (NZD) | | | 19,117,757 | |
| | | | | | | | |
| | | | | | | 177,748,075 | |
| | | | | | | | |
| | | | Lodging — 0.6% | | | | |
| | 52,516,000 | | | Choice Hotels International, Inc., 5.700%, 8/28/2020 | | | 56,257,765 | |
| | 100,000 | | | Wyndham Worldwide Corp., 6.000%, 12/01/2016 | | | 104,859 | |
| | | | | | | | |
| | | | | | | 56,362,624 | |
| | | | | | | | |
| | | | Media Entertainment — 0.4% | | | | |
| | 4,482,000 | | | 21st Century Fox America, Inc., 8.150%, 10/17/2036 | | | 6,056,455 | |
| | 358,000,000 | | | Grupo Televisa SAB, EMTN, 7.250%, 5/14/2043, (MXN) | | | 17,885,112 | |
| | 5,000,000 | | | iHeartCommunications, Inc., 9.000%, 3/01/2021 | | | 4,201,250 | |
| | 1,805,000 | | | R.R. Donnelley & Sons Co., 6.500%, 11/15/2023 | | | 1,696,700 | |
| | 4,445,000 | | | R.R. Donnelley & Sons Co., 7.875%, 3/15/2021 | | | 4,622,800 | |
| | 3,616,000 | | | Viacom, Inc., 6.125%, 10/05/2017 | | | 3,908,893 | |
| | | | | | | | |
| | | | | | | 38,371,210 | |
| | | | | | | | |
| | | | Metals & Mining — 2.4% | | | | |
| | 1,689,997 | | | 1839688 Alberta ULC, PIK, 14.000%, 2/13/2020(b)(f)(g) | | | 540,799 | |
| | 15,000,000 | | | Alcoa, Inc., 5.400%, 4/15/2021 | | | 15,375,000 | |
| | 15,060,000 | | | Alcoa, Inc., 5.870%, 2/23/2022 | | | 15,511,800 | |
| | 45,700,000 | | | Alcoa, Inc., 5.900%, 2/01/2027 | | | 44,100,500 | |
| | 5,505,000 | | | Alcoa, Inc., 5.950%, 2/01/2037 | | | 4,954,500 | |
| | 5,804,000 | | | Alcoa, Inc., 6.750%, 1/15/2028 | | | 5,978,120 | |
| | 430,000 | | | ArcelorMittal, 6.250%, 3/01/2021 | | | 387,804 | |
| | 4,085,000 | | | ArcelorMittal, 7.000%, 2/25/2022 | | | 3,717,350 | |
| | 47,920,000 | | | ArcelorMittal, 7.500%, 3/01/2041 | | �� | 38,575,600 | |
| | 19,365,000 | | | ArcelorMittal, 7.750%, 10/15/2039 | | | 15,782,475 | |
| | 20,625,000 | | | Barminco Finance Pty Ltd., 9.000%, 6/01/2018, 144A | | | 15,004,687 | |
| | 15,701,000 | | | Freeport-McMoran Oil & Gas LLC/FCX Oil & Gas, Inc., 6.500%, 11/15/2020 | | | 14,160,418 | |
| | 4,612,000 | | | United States Steel Corp., 6.650%, 6/01/2037 | | | 3,276,826 | |
| | 31,210,000 | | | United States Steel Corp., 7.000%, 2/01/2018 | | | 28,010,975 | |
| | 3,655,000 | | | Vale Overseas Ltd., 6.875%, 11/21/2036 | | | 2,869,541 | |
| | 4,893,000 | | | Worthington Industries, Inc., 6.500%, 4/15/2020 | | | 5,569,893 | |
| | | | | | | | |
| | | | | | | 213,816,288 | |
| | | | | | | | |
| | | | Midstream — 2.4% | | | | |
| | 650,000 | | | DCP Midstream LP, 6.450%, 11/03/2036, 144A | | | 564,043 | |
| | 3,328,000 | | | Florida Gas Transmission Co., 7.900%, 5/15/2019, 144A | | | 3,859,864 | |
| | 14,300,000 | | | IFM U.S. Colonial Pipeline 2 LLC, 6.450%, 5/01/2021, 144A | | | 15,621,935 | |
| | 14,660,000 | | | Kinder Morgan Energy Partners LP, 3.500%, 9/01/2023 | | | 12,970,069 | |
| | 3,105,000 | | | Kinder Morgan Energy Partners LP, 5.300%, 9/15/2020 | | | 3,295,684 | |
| | 7,461,000 | | | Kinder Morgan Energy Partners LP, 5.800%, 3/01/2021 | | | 7,932,334 | |
| | 303,000 | | | Kinder Morgan Finance Co. LLC, 5.700%, 1/05/2016 | | | 306,130 | |
| | 8,715,000 | | | NGPL PipeCo LLC, 7.119%, 12/15/2017, 144A | | | 8,279,250 | |
| | 85,000 | | | NGPL PipeCo LLC, 7.768%, 12/15/2037, 144A | | | 71,400 | |
| | 46,655,000 | | | ONEOK Partners LP, 4.900%, 3/15/2025 | | | 43,439,071 | |
| | 9,899,000 | | | Panhandle Eastern Pipeline Co., 6.200%, 11/01/2017 | | | 10,703,205 | |
See accompanying notes to financial statements.
| 18
Portfolio of Investments – as of September 30, 2015
Loomis Sayles Investment Grade Bond Fund – (continued)
| | | | | | | | |
Principal Amount (‡) | | | Description | | Value (†) | |
| | | | Midstream — continued | | | | |
| $ | 47,594,000 | | | Panhandle Eastern Pipeline Co., 7.000%, 6/15/2018 | | $ | 53,139,320 | |
| | 1,404,000 | | | Panhandle Eastern Pipeline Co., 8.125%, 6/01/2019 | | | 1,643,337 | |
| | 1,880,000 | | | Plains All American Pipeline LP, 6.125%, 1/15/2017 | | | 1,976,927 | |
| | 15,683,000 | | | Plains All American Pipeline LP/PAA Finance Corp., 6.500%, 5/01/2018 | | | 17,261,855 | |
| | 525,000 | | | Regency Energy Partners LP/Regency Energy Finance Corp., 4.500%, 11/01/2023 | | | 485,338 | |
| | 4,125,000 | | | Southern Natural Gas Co., 5.900%, 4/01/2017, 144A | | | 4,344,454 | |
| | 19,574,000 | | | Texas Eastern Transmission LP, 6.000%, 9/15/2017, 144A | | | 21,065,343 | |
| | 8,405,000 | | | Williams Partners LP, 3.350%, 8/15/2022 | | | 7,582,403 | |
| | | | | | | | |
| | | | | | | 214,541,962 | |
| | | | | | | | |
| | | | Mortgage Related — 0.0% | | | | |
| | 29,399 | | | FHLMC, 5.000%, 12/01/2031 | | | 32,570 | |
| | 4,525 | | | FNMA, 6.000%, 7/01/2029 | | | 5,157 | |
| | | | | | | | |
| | | | | | | 37,727 | |
| | | | | | | | |
| | | | Natural Gas — 0.4% | | | | |
| | 1,745,000 | | | NiSource Finance Corp., 6.125%, 3/01/2022 | | | 2,032,557 | |
| | 8,900,000 | | | NiSource Finance Corp., 6.400%, 3/15/2018 | | | 9,882,506 | |
| | 21,614,000 | | | NiSource Finance Corp., 6.800%, 1/15/2019 | | | 24,736,402 | |
| | | | | | | | |
| | | | | | | 36,651,465 | |
| | | | | | | | |
| | | | Non-Agency Commercial Mortgage-Backed Securities — 1.6% | | | | |
| | 11,450,000 | | | CDGJ Commercial Mortgage Trust Pass Through Certificates, Series 2014-BXCH, 2.707%, 12/15/2027, 144A(c) | | | 11,379,571 | |
| | 1,066,665 | | | Column Canada Issuer Corp., Series 2006-WEM, Class A1, 4.591%, 1/15/2022, (CAD) | | | 805,622 | |
| | 3,514,000 | | | Column Canada Issuer Corp., Series 2006-WEM, Class A2, 4.934%, 1/15/2022, (CAD) | | | 2,701,870 | |
| | 9,785,000 | | | Commercial Mortgage Trust, Series 2014-FL5, Class SV3, 3.148%, 10/15/2031, 144A(b)(c) | | | 9,764,882 | |
| | 8,515,000 | | | Commercial Mortgage Trust, Series 2014-FL5, Class SV4, 4.348%, 10/15/2031, 144A(b)(c) | | | 8,508,512 | |
| | 69,500,000 | | | Extended Stay America Trust, Series 2013, Class 7-ESH7, 3.902%, 12/05/2031, 144A | | | 69,912,204 | |
| | 8,461,985 | | | Institutional Mortgage Securities Canada, Inc., Series 2014-5A, Class A1, 2.003%, 7/12/2047, 144A, (CAD) | | | 6,377,274 | |
| | 27,000,000 | | | Institutional Mortgage Securities Canada, Inc., Series 2014-5A, Class A2, 2.616%, 7/12/2047, 144A, (CAD) | | | 20,627,029 | |
| | 9,786,870 | | | Morgan Stanley Re-REMIC Trust, Series 2009-GG10, Class A4B, 5.989%, 8/12/2045, 144A(c) | | | 10,364,843 | |
| | 2,125,000 | | | WFRBS Commercial Mortgage Trust, Series 2011-C3, Class D, 5.724%, 3/15/2044, 144A(c) | | | 2,254,102 | |
| | | | | | | | |
| | | | | | | 142,695,909 | |
| | | | | | | | |
| | | | Oil Field Services — 0.3% | | | | |
| | 5,000,000 | | | Nabors Industries, Inc., 5.100%, 9/15/2023 | | | 4,412,300 | |
| | 23,338,000 | | | Rowan Cos., Inc., 7.875%, 8/01/2019 | | | 23,146,208 | |
| | 587,000 | | | Transocean Ltd., 7.375%, 4/15/2018 | | | 557,650 | |
| | | | | | | | |
| | | | | | | 28,116,158 | |
| | | | | | | | |
See accompanying notes to financial statements.
19 |
Portfolio of Investments – as of September 30, 2015
Loomis Sayles Investment Grade Bond Fund – (continued)
| | | | | | | | |
Principal Amount (‡) | | | Description | | Value (†) | |
| | | | Packaging — 0.1% | | | | |
| $ | 5,735,000 | | | Sealed Air Corp., 5.500%, 9/15/2025, 144A | | $ | 5,821,025 | |
| | | | | | | | |
| | | | Paper — 1.2% | | | | |
| | 4,365,000 | | | Celulosa Arauco y Constitucion S.A., 7.250%, 7/29/2019 | | | 4,972,097 | |
| | 23,225,000 | | | Georgia-Pacific LLC, 5.400%, 11/01/2020, 144A | | | 26,024,960 | |
| | 644,000 | | | Georgia-Pacific LLC, 7.750%, 11/15/2029 | | | 860,738 | |
| | 1,031,000 | | | Georgia-Pacific LLC, 8.875%, 5/15/2031 | | | 1,481,501 | |
| | 7,049,000 | | | International Paper Co., 8.700%, 6/15/2038 | | | 9,475,033 | |
| | 5,270,000 | | | MeadWestvaco Corp., 7.550%, 3/01/2047(b) | | | 6,678,508 | |
| | 4,273,000 | | | MeadWestvaco Corp., 8.200%, 1/15/2030 | | | 5,864,564 | |
| | 26,007,000 | | | Weyerhaeuser Co., 6.875%, 12/15/2033 | | | 30,979,617 | |
| | 7,374,000 | | | Weyerhaeuser Co., 7.375%, 10/01/2019 | | | 8,683,718 | |
| | 13,539,000 | | | Weyerhaeuser Co., 7.375%, 3/15/2032 | | | 17,017,372 | |
| | | | | | | | |
| | | | | | | 112,038,108 | |
| | | | | | | | |
| | | | Property & Casualty Insurance — 0.4% | | | | |
| | 2,740,000 | | | Fidelity National Financial, Inc., 5.500%, 9/01/2022 | | | 2,931,340 | |
| | 9,038,000 | | | Liberty Mutual Group, Inc., 6.500%, 3/15/2035, 144A | | | 10,556,239 | |
| | 3,250,000 | | | Loews Corp., 2.625%, 5/15/2023 | | | 3,123,881 | |
| | 1,889,000 | | | MBIA Insurance Corp., 11.549%, 1/15/2033, 144A(c)(h) | | | 859,495 | |
| | 5,765,000 | | | Old Republic International Corp., 4.875%, 10/01/2024 | | | 6,043,501 | |
| | 7,609,000 | | | Sirius International Group, 6.375%, 3/20/2017, 144A | | | 7,948,803 | |
| | 2,212,000 | | | XLIT Ltd., 6.250%, 5/15/2027 | | | 2,635,724 | |
| | 1,043,000 | | | XLIT Ltd., 6.375%, 11/15/2024 | | | 1,236,450 | |
| | | | | | | | |
| | | | | | | 35,335,433 | |
| | | | | | | | |
| | | | Railroads — 0.1% | | | | |
| | 9,787,000 | | | Canadian Pacific Railway Co., 7.250%, 5/15/2019 | | | 11,474,700 | |
| | 237,000 | | | Missouri Pacific Railroad Co., 4.750%, 1/01/2030(b) | | | 232,984 | |
| | 1,701,000 | | | Missouri Pacific Railroad Co., 5.000%, 1/01/2045(b) | | | 1,566,386 | |
| | 191,000 | | | Missouri Pacific Railroad Co., Series A, 4.750%, 1/01/2020(b) | | | 190,998 | |
| | | | | | | | |
| | | | | | | 13,465,068 | |
| | | | | | | | |
| | | | Real Estate Operations/Development — 0.4% | | | | |
| | 10,276,000 | | | First Industrial LP, 5.950%, 5/15/2017 | | | 10,903,319 | |
| | 18,869,000 | | | ProLogis LP, 7.375%, 10/30/2019 | | | 21,859,548 | |
| | | | | | | | |
| | | | | | | 32,762,867 | |
| | | | | | | | |
| | | | REITs – Apartments — 0.2% | | | | |
| | 16,491,000 | | | Camden Property Trust, 5.700%, 5/15/2017 | | | 17,557,473 | |
| | | | | | | | |
| | | | REITs – Diversified — 0.2% | | | | |
| | 380,000 | | | Duke Realty LP, 5.950%, 2/15/2017 | | | 402,865 | |
| | 18,243,000 | | | Duke Realty LP, 6.500%, 1/15/2018 | | | 20,046,448 | |
| | | | | | | | |
| | | | | | | 20,449,313 | |
| | | | | | | | |
| | | | REITs – Health Care — 0.1% | | | | |
| | 5,972,000 | | | Welltower, Inc., 6.500%, 3/15/2041 | | | 7,187,427 | |
| | | | | | | | |
| | | | REITs – Office Property — 0.4% | | | | |
| | 20,817,000 | | | Highwoods Properties, Inc., 5.850%, 3/15/2017 | | | 22,157,698 | |
See accompanying notes to financial statements.
| 20
Portfolio of Investments – as of September 30, 2015
Loomis Sayles Investment Grade Bond Fund – (continued)
| | | | | | | | |
Principal Amount (‡) | | | Description | | Value (†) | |
| | | | REITs – Office Property — continued | | | | |
| $ | 11,306,000 | | | Highwoods Properties, Inc., 7.500%, 4/15/2018 | | $ | 12,735,587 | |
| | | | | | | | |
| | | | | | | 34,893,285 | |
| | | | | | | | |
| | | | REITs – Shopping Centers — 0.1% | | | | |
| | 4,893,000 | | | Equity One, Inc., 6.000%, 9/15/2017 | | | 5,275,422 | |
| | | | | | | | |
| | | | REITs – Single Tenant — 0.4% | | | | |
| | 8,690,000 | | | Realty Income Corp., 5.750%, 1/15/2021 | | | 9,821,255 | |
| | 22,701,000 | | | Realty Income Corp., 6.750%, 8/15/2019 | | | 26,279,200 | |
| | | | | | | | |
| | | | | | | 36,100,455 | |
| | | | | | | | |
| | | | Restaurants — 0.1% | | | | |
| | 10,320,000 | | | Darden Restaurants, Inc., 6.000%, 8/15/2035 | | | 10,366,450 | |
| | | | | | | | |
| | | | Retailers — 0.4% | | | | |
| | 1,696,000 | | | J.C. Penney Corp., Inc., 5.750%, 2/15/2018 | | | 1,632,400 | |
| | 5,979,000 | | | J.C. Penney Corp., Inc., 6.375%, 10/15/2036 | | | 4,140,458 | |
| | 5,446,000 | | | J.C. Penney Corp., Inc., 7.625%, 3/01/2097 | | | 3,784,970 | |
| | 10,467,000 | | | Macy’s Retail Holdings, Inc., 6.790%, 7/15/2027 | | | 12,770,284 | |
| | 8,064,000 | | | Marks & Spencer PLC, 7.125%, 12/01/2037, 144A | | | 9,372,795 | |
| | 3,755,000 | | | Phillips-Van Heusen Corp., 7.750%, 11/15/2023 | | | 4,393,350 | |
| | | | | | | | |
| | | | | | | 36,094,257 | |
| | | | | | | | |
| | | | Sovereigns — 0.4% | | | | |
| | 33,600,000 | | | Republic of Iceland, 5.875%, 5/11/2022, 144A | | | 38,265,226 | |
| | | | | | | | |
| | | | Supermarkets — 0.7% | | | | |
| | 23,950,000 | | | Albertson’s Holdings LLC/Safeway, Inc., 7.750%, 10/15/2022, 144A | | | 25,663,622 | |
| | 1,120,000 | | | Delhaize Group, 5.700%, 10/01/2040 | | | 1,184,518 | |
| | 3,269,000 | | | Kroger Co. (The), 6.400%, 8/15/2017 | | | 3,560,157 | |
| | 6,595,000 | | | New Albertson’s, Inc., 7.450%, 8/01/2029 | | | 6,463,100 | |
| | 7,875,000 | | | New Albertson’s, Inc., 8.000%, 5/01/2031 | | | 7,717,500 | |
| | 989,000 | | | New Albertson’s, Inc., Series C, MTN, 6.625%, 6/01/2028 | | | 850,540 | |
| | 17,290,000 | | | SUPERVALU, Inc., 6.750%, 6/01/2021 | | | 16,771,300 | |
| | | | | | | | |
| | | | | | | 62,210,737 | |
| | | | | | | | |
| | | | Supranational — 0.3% | | | | |
| | 9,640,000 | | | European Investment Bank, MTN, 6.000%, 8/06/2020, (AUD) | | | 7,761,900 | |
| | 12,982,000 | | | Inter-American Development Bank, EMTN, 6.000%, 12/15/2017, (NZD) | | | 8,822,087 | |
| | 58,420,000 | | | International Finance Corp., GMTN, 5.000%, 12/21/2015, (BRL) | | | 14,367,386 | |
| | | | | | | | |
| | | | | | | 30,951,373 | |
| | | | | | | | |
| | | | Technology — 1.6% | | | | |
| | 4,335,000 | | | Alcatel-Lucent USA, Inc., 6.450%, 3/15/2029 | | | 4,291,650 | |
| | 1,028,000 | | | Arrow Electronics, Inc., 6.875%, 6/01/2018 | | | 1,124,416 | |
| | 1,507,000 | | | Avnet, Inc., 6.625%, 9/15/2016 | | | 1,576,117 | |
| | 7,487,000 | | | Corning, Inc., 7.250%, 8/15/2036 | | | 9,170,242 | |
| | 7,051,000 | | | Equifax, Inc., 7.000%, 7/01/2037 | | | 8,221,988 | |
| | 70,969,000 | | | Ingram Micro, Inc., 5.250%, 9/01/2017 | | | 74,980,949 | |
| | 7,795,000 | | | Intuit, Inc., 5.750%, 3/15/2017 | | | 8,247,180 | |
| | 16,735,000 | | | KLA-Tencor Corp., 5.650%, 11/01/2034 | | | 16,273,683 | |
See accompanying notes to financial statements.
21 |
Portfolio of Investments – as of September 30, 2015
Loomis Sayles Investment Grade Bond Fund – (continued)
| | | | | | | | |
Principal Amount (‡) | | | Description | | Value (†) | |
| | | | Technology — continued | | | | |
| $ | 1,502,000 | | | Motorola Solutions, Inc., 6.625%, 11/15/2037 | | $ | 1,572,179 | |
| | 1,833,000 | | | Samsung Electronics Co. Ltd., 7.700%, 10/01/2027, 144A | | | 2,330,817 | |
| | 5,603,000 | | | Tyco Electronics Group S.A., 6.550%, 10/01/2017 | | | 6,139,801 | |
| | 561,000 | | | Xerox Corp., 6.350%, 5/15/2018 | | | 619,281 | |
| | 7,110,000 | | | Xerox Corp., 6.750%, 2/01/2017 | | | 7,568,538 | |
| | | | | | | | |
| | | | | | | 142,116,841 | |
| | | | | | | | |
| | | | Transportation Services — 0.8% | | | | |
| | 8,436,000 | | | Erac USA Finance Co., 6.375%, 10/15/2017, 144A | | | 9,212,264 | |
| | 2,824,000 | | | Erac USA Finance Co., 6.700%, 6/01/2034, 144A | | | 3,386,131 | |
| | 47,741,000 | | | Erac USA Finance Co., 7.000%, 10/15/2037, 144A | | | 59,367,461 | |
| | | | | | | | |
| | | | | | | 71,965,856 | |
| | | | | | | | |
| | | | Treasuries — 25.6% | | | | |
| | 372,145,000 | | | Canadian Government, 0.250%, 5/01/2017, (CAD) | | | 277,640,527 | |
| | 312,405,000 | | | Canadian Government, 1.000%, 8/01/2016, (CAD) | | | 235,032,968 | |
| | 209,501,000 | | | Canadian Government, 1.250%, 9/01/2018, (CAD) | | | 160,161,120 | |
| | 61,795,000 | | | Canadian Government, 1.750%, 9/01/2019, (CAD) | | | 48,231,125 | |
| | 90,055,000 | | | Canadian Government, 2.750%, 9/01/2016, (CAD) | | | 68,853,441 | |
| | 156,655,000 | | | Canadian Government, 3.000%, 12/01/2015, (CAD) | | | 117,865,133 | |
| | 4,159,000 | | | Canadian Government, 4.000%, 6/01/2016, (CAD) | | | 3,188,390 | |
| | 2,755,000(†††) | | | Mexican Fixed Rate Bonds, Series M, 7.750%, 5/29/2031, (MXN) | | | 18,106,528 | |
| | 2,965,000(†††) | | | Mexican Fixed Rate Bonds, Series M-20, 7.500%, 6/03/2027, (MXN) | | | 19,135,737 | |
| | 7,555,000(†††) | | | Mexican Fixed Rate Bonds, Series M-20, 8.000%, 12/07/2023, (MXN) | | | 50,362,183 | |
| | 1,925,000(†††) | | | Mexican Fixed Rate Bonds, Series M-20, 8.500%, 5/31/2029, (MXN) | | | 13,437,718 | |
| | 23,970,000(†††) | | | Mexican Fixed Rate Bonds, Series M-20, 10.000%, 12/05/2024, (MXN) | | | 180,623,703 | |
| | 36,850,000 | | | New Zealand Government Bond, 5.000%, 3/15/2019, (NZD) | | | 25,389,311 | |
| | 109,763,000 | | | New Zealand Government Bond, 6.000%, 12/15/2017, (NZD) | | | 75,364,520 | |
| | 290,574,000 | | | Norway Government Bond, 3.750%, 5/25/2021, 144A, (NOK) | | | 39,262,714 | |
| | 974,276,000 | | | Norway Government Bond, 4.250%, 5/19/2017, 144A, (NOK) | | | 121,315,284 | |
| | 416,760,000 | | | Norway Government Bond, 4.500%, 5/22/2019, 144A, (NOK) | | | 55,668,194 | |
| | 43,590,000 | | | Republic of Brazil, 8.500%, 1/05/2024, (BRL) | | | 8,191,336 | |
| | 23,848,000 | | | Republic of Brazil, 10.250%, 1/10/2028, (BRL) | | | 4,872,463 | |
| | 1,040,764,000 | | | Republic of Iceland, 6.000%, 10/13/2016, (ISK) | | | 5,528,935 | |
| | 391,985,000 | | | Republic of Iceland, 7.250%, 10/26/2022, (ISK) | | | 2,252,358 | |
| | 1,195,394,000 | | | Republic of Iceland, 8.750%, 2/26/2019, (ISK) | | | 6,875,097 | |
| | 132,105,000 | | | U.S. Treasury Note, 0.375%, 3/31/2016 | | | 132,234,067 | |
| | 110,000,000 | | | U.S. Treasury Note, 0.375%, 4/30/2016 | | | 110,104,610 | |
| | 125,000,000 | | | U.S. Treasury Note, 0.500%, 6/30/2016 | | | 125,214,875 | |
| | 250,000,000 | | | U.S. Treasury Note, 0.500%, 1/31/2017 | | | 250,097,750 | |
| | 150,000,000 | | | U.S. Treasury Note, 0.500%, 3/31/2017 | | | 149,974,650 | |
| | | | | | | | |
| | | | | | | 2,304,984,737 | |
| | | | | | | | |
| | | | Wireless — 0.5% | | | | |
| | 559,910,000 | | | America Movil SAB de CV, 6.450%, 12/05/2022, (MXN) | | | 31,561,159 | |
| | 58,200,000 | | | America Movil SAB de CV, 8.460%, 12/18/2036, (MXN) | | | 3,317,661 | |
| | 6,373,000 | | | Sprint Capital Corp., 6.875%, 11/15/2028 | | | 4,572,627 | |
| | 612,000 | | | Sprint Capital Corp., 8.750%, 3/15/2032 | | | 475,830 | |
| | 1,609,000 | | | Sprint Communications, Inc., 6.000%, 11/15/2022 | | | 1,210,773 | |
See accompanying notes to financial statements.
| 22
Portfolio of Investments – as of September 30, 2015
Loomis Sayles Investment Grade Bond Fund – (continued)
| | | | | | | | |
Principal Amount (‡) | | | Description | | Value (†) | |
| | | | Wireless — continued | | | | |
| $ | 985,000 | | | Sprint Corp., 7.125%, 6/15/2024 | | $ | 758,056 | |
| | | | | | | | |
| | | | | | | 41,896,106 | |
| | | | | | | | |
| | | | Wirelines — 4.7% | | | | |
| | 33,710,000 | | | AT&T, Inc., 2.625%, 12/01/2022 | | | 32,043,681 | |
| | 26,815,000 | | | AT&T, Inc., 3.000%, 2/15/2022 | | | 26,316,536 | |
| | 406,000 | | | Bell Canada, MTN, 7.300%, 2/23/2032, (CAD) | | | 391,230 | |
| | 2,936,000 | | | BellSouth Telecommunications LLC, 5.850%, 11/15/2045 | | | 2,872,259 | |
| | 62,040,000 | | | CenturyLink, Inc., 6.450%, 6/15/2021 | | | 56,766,600 | |
| | 4,990,000 | | | CenturyLink, Inc., Series G, 6.875%, 1/15/2028 | | | 4,116,750 | |
| | 2,708,000 | | | CenturyLink, Inc., Series P, 7.600%, 9/15/2039 | | | 2,051,310 | |
| | 24,103,000 | | | Embarq Corp., 7.995%, 6/01/2036 | | | 24,863,691 | |
| | 825,000 | | | Level 3 Financing, Inc., 7.000%, 6/01/2020 | | | 853,875 | |
| | 5,200,000 | | | Oi S.A., 9.750%, 9/15/2016, 144A, (BRL) | | | 882,472 | |
| | 8,450,000 | | | Portugal Telecom International Finance BV, EMTN,
4.500%, 6/16/2025, (EUR) | | | 5,547,191 | |
| | 18,850,000 | | | Portugal Telecom International Finance BV, EMTN,
5.000%, 11/04/2019, (EUR) | | | 16,125,398 | |
| | 2,755,000 | | | Qwest Capital Funding, Inc., 6.875%, 7/15/2028 | | | 2,327,975 | |
| | 4,370,000 | | | Qwest Capital Funding, Inc., 7.625%, 8/03/2021 | | | 4,610,350 | |
| | 3,469,000 | | | Qwest Capital Funding, Inc., 7.750%, 2/15/2031 | | | 3,191,480 | |
| | 333,000 | | | Qwest Corp., 6.500%, 6/01/2017 | | | 355,544 | |
| | 12,308,000 | | | Qwest Corp., 6.875%, 9/15/2033 | | | 11,882,956 | |
| | 4,668,000 | | | Qwest Corp., 7.200%, 11/10/2026 | | | 4,675,936 | |
| | 9,077,000 | | | Qwest Corp., 7.250%, 9/15/2025 | | | 10,126,564 | |
| | 9,474,000 | | | Qwest Corp., 7.250%, 10/15/2035 | | | 9,380,302 | |
| | 46,411,000 | | | Telecom Italia Capital S.A., 6.000%, 9/30/2034 | | | 42,930,175 | |
| | 23,660,000 | | | Telecom Italia Capital S.A., 6.375%, 11/15/2033 | | | 22,654,450 | |
| | 525,000 | | | Telefonica Emisiones SAU, 5.134%, 4/27/2020 | | | 578,555 | |
| | 975,000 | | | Telefonica Emisiones SAU, 5.462%, 2/16/2021 | | | 1,089,428 | |
| | 14,375,000 | | | Telefonica Emisiones SAU, 7.045%, 6/20/2036 | | | 16,857,864 | |
| | 4,100,000 | | | Telefonica Emisiones SAU, EMTN, 5.289%, 12/09/2022, (GBP) | | | 6,847,061 | |
| | 9,100,000 | | | Telefonica Emisiones SAU, EMTN, 5.375%, 2/02/2026, (GBP) | | | 15,364,062 | |
| | 14,137,000 | | | Telus Corp., 4.950%, 3/15/2017, (CAD) | | | 11,071,141 | |
| | 54,665,000 | | | Telus Corp., Series CG, 5.050%, 12/04/2019, (CAD) | | | 45,388,950 | |
| | 32,509,000 | | | Verizon Communications, Inc., 2.450%, 11/01/2022 | | | 30,699,614 | |
| | 2,642,000 | | | Verizon New England, Inc., 7.875%, 11/15/2029 | | | 3,377,633 | |
| | 2,095,000 | | | Verizon Pennsylvania, Inc., 6.000%, 12/01/2028 | | | 2,284,195 | |
| | | | | | | | |
| | | | | | | 418,525,228 | |
| | | | | | | | |
| | | | Total Non-Convertible Bonds
(Identified Cost $8,084,712,233) | | | 7,890,469,635 | |
| | | | | | | | |
| | | | | | | | |
| | Convertible Bonds — 4.8% | |
| | | | Consumer Products — 0.1% | | | | |
| | 3,905,000 | | | Euronet Worldwide, Inc., 1.500%, 10/01/2044, 144A | | | 4,776,303 | |
| | | | | | | | |
| | | | Midstream — 0.4% | | | | |
| | 45,925,000 | | | Chesapeake Energy Corp., 2.500%, 5/15/2037 | | | 39,495,500 | |
| | | | | | | | |
See accompanying notes to financial statements.
23 |
Portfolio of Investments – as of September 30, 2015
Loomis Sayles Investment Grade Bond Fund – (continued)
| | | | | | | | |
Principal Amount (‡) | | | Description | | Value (†) | |
| | | | Property & Casualty Insurance — 0.9% | | | | |
| $ | 72,915,000 | | | Old Republic International Corp., 3.750%, 3/15/2018 | | $ | 84,216,825 | |
| | | | | | | | |
| | | | Technology — 3.4% | | | | |
| | 35,120,000 | | | Intel Corp., 2.950%, 12/15/2035 | | | 42,648,850 | |
| | 137,016,000 | | | Intel Corp., 3.250%, 8/01/2039 | | | 206,722,890 | |
| | 11,515,000 | | | Lam Research Corp., Series B, 1.250%, 5/15/2018 | | | 14,436,931 | |
| | 367,170 | | | Liberty Media LLC, 3.500%, 1/15/2031 | | | 328,335 | |
| | 45,525,000 | | | Priceline Group, Inc. (The), 0.900%, 9/15/2021, 144A | | | 44,756,766 | |
| | | | | | | | |
| | | | | | | 308,893,772 | |
| | | | | | | | |
| | | | Total Convertible Bonds
(Identified Cost $343,436,993) | | | 437,382,400 | |
| | | | | | | | |
| | | | | | | | |
| | Municipals — 1.0% | |
| | | | District of Columbia — 0.2% | | | | |
| | 14,680,000 | | | Metropolitan Washington Airports Authority, 7.462%, 10/01/2046 | | | 18,891,398 | |
| | | | | | | | |
| | | | Illinois — 0.6% | | | | |
| | 24,640,000 | | | State of Illinois, 5.100%, 6/01/2033 | | | 23,082,752 | |
| | 33,395,000 | | | State of Illinois, Series B, 5.520%, 4/01/2038 | | | 29,657,098 | |
| | | | | | | | |
| | | | | | | 52,739,850 | |
| | | | | | | | |
| | | | Michigan — 0.0% | | | | |
| | 2,275,000 | | | Michigan Tobacco Settlement Finance Authority Taxable Turbo, Series A, 7.309%, 6/01/2034 | | | 1,973,904 | |
| | | | | | | | |
| | | | Ohio — 0.1% | | | | |
| | 5,075,000 | | | Buckeye Tobacco Settlement Financing Authority, Series A-2, 5.875%, 6/01/2047 | | | 4,186,165 | |
| | | | | | | | |
| | | | Virginia — 0.1% | | | | |
| | 13,605,000 | | | Virginia Tobacco Settlement Financing Corp., Series A-1, 6.706%, 6/01/2046 | | | 10,435,987 | |
| | | | | | | | |
| | | | Total Municipals
(Identified Cost $87,760,418) | | | 88,227,304 | |
| | | | | | | | |
| | | | | | | | |
| | | | Total Bonds and Notes
(Identified Cost $8,515,909,644) | | | 8,416,079,339 | |
| | | | | | | | |
| | | | | | | | |
| | Senior Loans — 0.5% | |
| | | | Finance Companies — 0.4% | | | | |
| | 19,990,283 | | | AWAS Finance Luxembourg 2012 S.A., New Term Loan, 3.500%, 7/16/2018(c) | | | 19,877,937 | |
| | 13,390,562 | | | AWAS Finance Luxembourg S.A.R.L., Term Loan B, 3.500%, 6/10/2016(c) | | | 13,332,045 | |
| | | | | | | | |
| | | | | | | 33,209,982 | |
| | | | | | | | |
| | | | Supermarkets — 0.1% | | | | |
| | 9,003,549 | | | Supervalu, Inc., Refi Term Loan B, 4.500%, 3/21/2019(c) | | | 9,007,331 | |
| | | | | | | | |
| | | | Total Senior Loans
(Identified Cost $42,376,679) | | | 42,217,313 | |
| | | | | | | | |
See accompanying notes to financial statements.
| 24
Portfolio of Investments – as of September 30, 2015
Loomis Sayles Investment Grade Bond Fund – (continued)
| | | | | | | | |
Shares | | | Description | | Value (†) | |
| | Common Stocks — 3.9% | | | | |
| | | | Automobiles — 0.6% | | | | |
| | 4,063,816 | | | Ford Motor Co. | | $ | 55,145,983 | |
| | | | | | | | |
| | | | Electronic Equipment, Instruments & Components — 3.3% | | | | |
| | 17,550,000 | | | Corning, Inc. | | | 300,456,000 | |
| | | | | | | | |
| | | | Total Common Stocks
(Identified Cost $261,481,587) | | | 355,601,983 | |
| | | | | | | | |
| | | | | | | | |
| | Preferred Stocks — 0.2% | |
| | | | Metals & Mining — 0.0% | | | | |
| | 340,285 | | | ArcelorMittal, 6.000% | | | 2,797,143 | |
| | | | | | | | |
| | | | Midstream — 0.0% | | | | |
| | 43,031 | | | Chesapeake Energy Corp., 5.000% | | | 2,167,686 | |
| | | | | | | | |
| | | | REITs – Diversified — 0.2% | | | | |
| | 258,873 | | | Weyerhaeuser Co., Series A, 6.375% | | | 12,350,831 | |
| | | | | | | | |
| | | | Total Preferred Stocks
(Identified Cost $25,066,559) | | | 17,315,660 | |
| | | | | | | | |
| | | | | | | | |
Principal
Amount (‡) | | | | | | |
| | Short-Term Investments — 0.6% | | | | |
| $ | 51,756,899 | | | Tri-Party Repurchase Agreement with Fixed Income Clearing Corporation, dated 9/30/2015 at 0.010% to be repurchased at $51,756,913 on 10/01/2015 collateralized by $3,825,000 U.S. Treasury Note, 1.750% due 3/31/2022 valued at $3,825,000; $28,470,000 U.S. Treasury Note, 0.625% due 9/30/2017 valued at $28,434,413; $20,435,000 U.S. Treasury Note, 1.375% due 5/31/2020 valued at $20,537,175 including accrued interest (Note 2 of Notes to Financial Statements) (Identified Cost $51,756,899) | | | 51,756,899 | |
| | | | | | | | |
| | | | | | | | |
| | | | Total Investments — 98.8%
(Identified Cost $8,896,591,368)(a) | | | 8,882,971,194 | |
| | | | Other assets less liabilities — 1.2% | | | 105,810,163 | |
| | | | | | | | |
| | | | Net Assets — 100.0% | | $ | 8,988,781,357 | |
| | | | | | | | |
| | | | | | | | |
| | (‡) | | | Principal Amount stated in U.S. dollars unless otherwise noted. | |
| | (†) | | | See Note 2 of Notes to Financial Statements. | |
| | (††) | | | Amount shown represents units. One unit represents a principal amount of 25. | |
| | (†††) | | | Amount shown represents units. One unit represents a principal amount of 100. | |
| | (a) | | | Federal Tax Information: | |
| | | | At September 30, 2015, the net unrealized depreciation on investments based on a cost of $9,009,882,985 for federal income tax purposes was as follows: | |
| | | | Aggregate gross unrealized appreciation for all investments in which there is an excess of value over tax cost | | $ | 669,480,642 | |
| | | | Aggregate gross unrealized depreciation for all investments in which there is an excess of tax cost over value | | | (796,392,433 | ) |
| | | | | | | | |
| | | | Net unrealized depreciation | | $ | (126,911,791 | ) |
| | | | | | | | |
See accompanying notes to financial statements.
25 |
Portfolio of Investments – as of September 30, 2015
Loomis Sayles Investment Grade Bond Fund – (continued)
| | | | | | |
| | | | | | |
| | (b) | | | Illiquid security. At September 30, 2015, the value of these securities amounted to $155,438,752 or 1.7% of net assets. Illiquid securities are deemed to be fair valued pursuant to the Fund’s pricing policies and procedures. See Note 2 of Notes to Financial Statements. |
| | (c) | | | Variable rate security. Rate as of September 30, 2015 is disclosed. |
| | (d) | | | Coupon rate is a fixed rate for an initial period then resets at a specified date and rate. |
| | (e) | | | Perpetual bond with no specified maturity date. |
| | (f) | | | Payment-in-kind security for which the issuer has the option at each interest payment date of making interest payments in cash or additional debt securities. For the period ended September 30, 2015, interest payments were made in additional debt securities. |
| | (g) | | | Fair valued by the Fund’s adviser. At September 30, 2015, the value of this security amounted to $540,799 or less than 0.1% of net assets. See Note 2 of Notes to Financial Statements. |
| | (h) | | | Non-income producing security. |
| | | | | | |
| | 144A | | | All or a portion of these securities are exempt from registration under Rule 144A of the Securities Act of 1933. These securities may be resold in transactions exempt from registration, normally to qualified institutional buyers. At September 30, 2015, the value of Rule 144A holdings amounted to $1,492,171,361 or 16.6% of net assets. |
| | ABS | | | Asset-Backed Securities | | |
| | EMTN | | | Euro Medium Term Note | | |
| | FHLMC | | | Federal Home Loan Mortgage Corp. | | |
| | FNMA | | | Federal National Mortgage Association | | |
| | GMTN | | | Global Medium Term Note | | |
| | MTN | | | Medium Term Note | | |
| | PIK | | | Payment-in-Kind | | |
| | REITs | | | Real Estate Investment Trusts | | |
| | REMIC | | | Real Estate Mortgage Investment Conduit | | |
| | | | | | |
| | AUD | | | Australian Dollar | | |
| | BRL | | | Brazilian Real | | |
| | CAD | | | Canadian Dollar | | |
| | EUR | | | Euro | | |
| | GBP | | | British Pound | | |
| | IDR | | | Indonesian Rupiah | | |
| | ISK | | | Icelandic Krona | | |
| | MXN | | | Mexican Peso | | |
| | NOK | | | Norwegian Krone | | |
| | NZD | | | New Zealand Dollar | | |
See accompanying notes to financial statements.
| 26
Portfolio of Investments – as of September 30, 2015
Loomis Sayles Investment Grade Bond Fund – (continued)
Industry Summary at September 30, 2015
| | | | |
Treasuries | | | 25.6 | % |
Banking | | | 14.4 | |
Technology | | | 5.0 | |
Finance Companies | | | 4.9 | |
Wirelines | | | 4.7 | |
Electronic Equipment, Instruments & Components | | | 3.3 | |
Midstream | | | 2.8 | |
ABS Other | | | 2.7 | |
Airlines | | | 2.5 | |
Metals & Mining | | | 2.4 | |
Electric | | | 2.4 | |
Local Authorities | | | 2.0 | |
Other Investments, less than 2% each | | | 25.5 | |
Short-Term Investments | | | 0.6 | |
| | | | |
Total Investments | | | 98.8 | |
Other assets less liabilities | | | 1.2 | |
| | | | |
Net Assets | | | 100.0 | % |
| | | | |
Currency Exposure Summary at September 30, 2015
| | | | |
United States Dollar | | | 71.8 | % |
Canadian Dollar | | | 12.3 | |
New Zealand Dollar | | | 4.4 | |
Mexican Peso | | | 3.7 | |
Australian Dollar | | | 2.8 | |
Norwegian Krone | | | 2.3 | |
Other, less than 2% each | | | 1.5 | |
| | | | |
Total Investments | | | 98.8 | |
Other assets less liabilities | | | 1.2 | |
| | | | |
Net Assets | | | 100.0 | % |
| | | | |
See accompanying notes to financial statements.
27 |
Statement of Assets and Liabilities
September 30, 2015
| | | | |
ASSETS | | | | |
Investments at cost | | $ | 8,896,591,368 | |
Net unrealized depreciation | | | (13,620,174 | ) |
| | | | |
Investments at value | | | 8,882,971,194 | |
Cash | | | 2,183,604 | |
Foreign currency at value (identified cost $17,235,815) | | | 17,406,361 | |
Receivable for Fund shares sold | | | 13,960,673 | |
Receivable for securities sold | | | 14,411,371 | |
Dividends and interest receivable | | | 98,676,750 | |
| | | | |
TOTAL ASSETS | | | 9,029,609,953 | |
| | | | |
LIABILITIES | | | | |
Payable for Fund shares redeemed | | | 36,241,048 | |
Management fees payable (Note 5) | | | 3,011,770 | |
Deferred Trustees’ fees (Note 5) | | | 568,359 | |
Administrative fees payable (Note 5) | | | 327,306 | |
Payable to distributor (Note 5d) | | | 144,296 | |
Other accounts payable and accrued expenses | | | 535,817 | |
| | | | |
TOTAL LIABILITIES | | | 40,828,596 | |
| | | | |
NET ASSETS | | $ | 8,988,781,357 | |
| | | | |
NET ASSETS CONSIST OF: | | | | |
Paid-in capital | | $ | 8,979,738,233 | |
Distributions in excess of net investment income | | | (38,523,098 | ) |
Accumulated net realized gain on investments and foreign currency transactions | | | 62,269,869 | |
Net unrealized depreciation on investments and foreign currency translations | | | (14,703,647 | ) |
| | | | |
NET ASSETS | | $ | 8,988,781,357 | |
| | | | |
See accompanying notes to financial statements.
| 28
Statement of Assets and Liabilities (continued)
September 30, 2015
| | | | |
COMPUTATION OF NET ASSET VALUE AND OFFERING PRICE: | | | | |
Class A shares: | | | | |
Net assets | | $ | 1,628,215,572 | |
| | | | |
Shares of beneficial interest | | | 146,640,671 | |
| | | | |
Net asset value and redemption price per share | | $ | 11.10 | |
| | | | |
Offering price per share (100/95.50 of net asset value) (Note 1) | | $ | 11.62 | |
| | | | |
Class B shares: (redemption price per share is equal to net asset value less any applicable contingent deferred sales charge) (Note 1) | | | | |
Net assets | | $ | 136,543 | |
| | | | |
Shares of beneficial interest | | | 12,352 | |
| | | | |
Net asset value and offering price per share | | $ | 11.05 | |
| | | | |
Class C shares: (redemption price per share is equal to net asset value less any applicable contingent deferred sales charge) (Note 1) | | | | |
Net assets | | $ | 1,219,686,844 | |
| | | | |
Shares of beneficial interest | | | 110,888,150 | |
| | | | |
Net asset value and offering price per share | | $ | 11.00 | |
| | | | |
| | | | |
Class N shares: | | | | |
Net assets | | $ | 21,850,818 | |
| | | | |
Shares of beneficial interest | | | 1,967,524 | |
| | | | |
Net asset value, offering and redemption price per share | | $ | 11.11 | |
| | | | |
Class Y shares: | | | | |
Net assets | | $ | 6,081,536,345 | |
| | | | |
Shares of beneficial interest | | | 547,344,600 | |
| | | | |
Net asset value, offering and redemption price per share | | $ | 11.11 | |
| | | | |
Admin Class shares: | | | | |
Net assets | | $ | 37,355,235 | |
| | | | |
Shares of beneficial interest | | | 3,371,231 | |
| | | | |
Net asset value, offering and redemption price per share | | $ | 11.08 | |
| | | | |
See accompanying notes to financial statements.
29 |
Statement of Operations
For the Year Ended September 30, 2015
| | | | |
INVESTMENT INCOME | | | | |
Interest | | $ | 429,804,226 | |
Dividends | | | 11,546,121 | |
| | | | |
| | | 441,350,347 | |
| | | | |
Expenses | | | | |
Management fees (Note 5) | | | 41,910,112 | |
Service and distribution fees (Note 5) | | | 19,326,303 | |
Administrative fees (Note 5) | | | 4,468,550 | |
Trustees’ fees and expenses (Note 5) | | | 157,880 | |
Transfer agent fees and expenses (Notes 5 and 6) | | | 12,394,235 | |
Audit and tax services fees | | | 68,045 | |
Custodian fees and expenses | | | 522,959 | |
Legal fees | | | 120,796 | |
Registration fees | | | 329,933 | |
Shareholder reporting expenses | | | 730,540 | |
Miscellaneous expenses | | | 198,927 | |
| | | | |
Total expenses | | | 80,228,280 | |
Less waiver and/or expense reimbursement (Note 5) | | | (476 | ) |
| | | | |
Net expenses | | | 80,227,804 | |
| | | | |
Net investment income | | | 361,122,543 | |
| | | | |
NET REALIZED AND UNREALIZED GAIN (LOSS) ON INVESTMENTS AND FOREIGN CURRENCY TRANSACTIONS | | | | |
Net realized gain (loss) on: | | | | |
Investments | | | 9,927,890 | |
Foreign currency transactions | | | (7,626,844 | ) |
Net change in unrealized appreciation (depreciation) on: | | | | |
Investments | | | (838,142,132 | ) |
Foreign currency translations | | | 298,597 | |
| | | | |
Net realized and unrealized loss on investments and foreign currency transactions | | | (835,542,489 | ) |
| | | | |
NET DECREASE IN NET ASSETS RESULTING FROM OPERATIONS | | $ | (474,419,946 | ) |
| | | | |
See accompanying notes to financial statements.
| 30
Statement of Changes in Net Assets
| | | | | | | | |
| | | Year Ended
September 30,
2015 | | | Year Ended
September 30,
2014 | |
FROM OPERATIONS: | | | | | | | | |
Net investment income | | $ | 361,122,543 | | | $ | 381,334,880 | |
Net realized gain on investments and foreign currency transactions | | | 2,301,046 | | | | 165,435,720 | |
Net change in unrealized appreciation (depreciation) on investments and foreign currency translations | | | (837,843,535 | ) | | | 37,179,796 | |
| | | | | | | | |
Net increase (decrease) in net assets resulting from operations | | | (474,419,946 | ) | | | 583,950,396 | |
| | | | | | | | |
FROM DISTRIBUTIONS TO SHAREHOLDERS: | | | | | | | | |
Net investment income | | | | | | | | |
Class A | | | (56,457,196 | ) | | | (97,103,740 | ) |
Class B | | | (75,127 | ) | | | (240,518 | ) |
Class C | | | (32,106,690 | ) | | | (55,536,557 | ) |
Class N | | | (471,295 | ) | | | (146,112 | ) |
Class Y | | | (223,960,105 | ) | | | (267,549,875 | ) |
Admin Class | | | (810,779 | ) | | | (853,378 | ) |
Net realized capital gains | | | | | | | | |
Class A | | | (19,188,288 | ) | | | (61,443,747 | ) |
Class B | | | (40,831 | ) | | | (193,236 | ) |
Class C | | | (14,769,296 | ) | | | (42,676,071 | ) |
Class N | | | (70,374 | ) | | | (71,304 | ) |
Class Y | | | (69,414,542 | ) | | | (149,212,926 | ) |
Admin Class | | | (286,059 | ) | | | (529,493 | ) |
| | | | | | | | |
Total distributions | | | (417,650,582 | ) | | | (675,556,957 | ) |
| | | | | | | | |
NET INCREASE (DECREASE) IN NET ASSETS FROM CAPITAL SHARE TRANSACTIONS (NOTE 10) | | | (525,645,130 | ) | | | 159,293,101 | |
| | | | | | | | |
Net increase (decrease) in net assets | | | (1,417,715,658 | ) | | | 67,686,540 | |
NET ASSETS | | | | | | | | |
Beginning of the year | | | 10,406,497,015 | | | | 10,338,810,475 | |
| | | | | | | | |
End of the year | | $ | 8,988,781,357 | | | $ | 10,406,497,015 | |
| | | | | | | | |
UNDISTRIBUTED (DISTRIBUTIONS IN EXCESS OF) NET INVESTMENT INCOME | | $ | (38,523,098 | ) | | $ | 17,386,896 | |
| | | | | | | | |
See accompanying notes to financial statements.
31 |
Financial Highlights
For a share outstanding throughout each period.
| | | | | | | | | | | | | | | | | | | | |
| | | Class A | |
| | | Year Ended
September 30,
2015 | | | Year Ended
September 30,
2014 | | | Year Ended
September 30,
2013 | | | Year Ended
September 30,
2012 | | | Year Ended
September 30,
2011 | |
Net asset value, beginning of the period | | $ | 12.11 | | | $ | 12.22 | | | $ | 12.76 | | | $ | 12.12 | | | $ | 12.56 | |
| | | | | | | | | | | | | | | | | | | | |
INCOME (LOSS) FROM INVESTMENT OPERATIONS: | | | | | | | | | | | | | | | | | | | | |
Net investment income(a) | | | 0.40 | | | | 0.46 | | | | 0.48 | | | | 0.51 | | | | 0.57 | |
Net realized and unrealized gain (loss) | | | (0.95 | ) | | | 0.26 | | | | (0.30 | ) | | | 0.86 | | | | (0.15 | ) |
| | | | | | | | | | | | | | | | | | | | |
Total from Investment Operations | | | (0.55 | ) | | | 0.72 | | | | 0.18 | | | | 1.37 | | | | 0.42 | |
| | | | | | | | | | | | | | | | | | | | |
LESS DISTRIBUTIONS FROM: | | | | | | | | | | | | | | | | | | | | |
Net investment income | | | (0.34 | ) | | | (0.51 | ) | | | (0.60 | ) | | | (0.62 | ) | | | (0.60 | ) |
Net realized capital gains | | | (0.12 | ) | | | (0.32 | ) | | | (0.12 | ) | | | (0.11 | ) | | | (0.26 | ) |
| | | | | | | | | | | | | | | | | | | | |
Total Distributions | | | (0.46 | ) | | | (0.83 | ) | | | (0.72 | ) | | | (0.73 | ) | | | (0.86 | ) |
| | | | | | | | | | | | | | | | | | | | |
Net asset value, end of the period | | $ | 11.10 | | | $ | 12.11 | | | $ | 12.22 | | | $ | 12.76 | | | $ | 12.12 | |
| | | | | | | | | | | | | | | | | | | | |
Total return(b) | | | (4.72 | )% | | | 6.04 | % | | | 1.34 | % | | | 11.74 | % | | | 3.47 | % |
RATIOS TO AVERAGE NET ASSETS: | | | | | | | | | | | | | | | | | | | | |
Net assets, end of the period (000’s) | | $ | 1,628,216 | | | $ | 1,932,847 | | | $ | 2,431,718 | | | $ | 2,960,119 | | | $ | 2,705,810 | |
Net expenses | | | 0.83 | % | | | 0.83 | % | | | 0.83 | % | | | 0.84 | % | | | 0.81 | % |
Gross expenses | | | 0.83 | % | | | 0.83 | % | | | 0.83 | % | | | 0.84 | % | | | 0.81 | % |
Net investment income | | | 3.38 | % | | | 3.75 | % | | | 3.85 | % | | | 4.17 | % | | | 4.56 | % |
Portfolio turnover rate | | | 23 | % | | | 19 | % | | | 30 | % | | | 19 | % | | | 19 | % |
| (a) | Per share net investment income has been calculated using the average shares outstanding during the period. |
| (b) | A sales charge for Class A shares is not reflected in total return calculations. |
See accompanying notes to financial statements.
| 32
Financial Highlights (continued)
For a share outstanding throughout each period.
| | | | | | | | | | | | | | | | | | | | |
| | | Class B | |
| | | Year Ended
September 30,
2015 | | | Year Ended
September 30,
2014 | | | Year Ended
September 30,
2013 | | | Year Ended
September 30,
2012 | | | Year Ended
September 30,
2011 | |
Net asset value, beginning of the period | | $ | 12.04 | | | $ | 12.16 | | | $ | 12.70 | | | $ | 12.06 | | | $ | 12.50 | |
| | | | | | | | | | | | | | | | | | | | |
INCOME (LOSS) FROM INVESTMENT OPERATIONS: | | | | | | | | | | | | | | | | | | | | |
Net investment income(a) | | | 0.31 | | | | 0.37 | | | | 0.39 | | | | 0.42 | | | | 0.47 | |
Net realized and unrealized gain (loss) | | | (0.94 | ) | | | 0.24 | | | | (0.31 | ) | | | 0.86 | | | | (0.14 | ) |
| | | | | | | | | | | | | | | | | | | | |
Total from Investment Operations | | | (0.63 | ) | | | 0.61 | | | | 0.08 | | | | 1.28 | | | | 0.33 | |
| | | | | | | | | | | | | | | | | | | | |
LESS DISTRIBUTIONS FROM: | | | | | | | | | | | | | | | | | | | | |
Net investment income | | | (0.24 | ) | | | (0.41 | ) | | | (0.50 | ) | | | (0.53 | ) | | | (0.51 | ) |
Net realized capital gains | | | (0.12 | ) | | | (0.32 | ) | | | (0.12 | ) | | | (0.11 | ) | | | (0.26 | ) |
| | | | | | | | | | | | | | | | | | | | |
Total Distributions | | | (0.36 | ) | | | (0.73 | ) | | | (0.62 | ) | | | (0.64 | ) | | | (0.77 | ) |
| | | | | | | | | | | | | | | | | | | | |
Net asset value, end of the period | | $ | 11.05 | | | $ | 12.04 | | | $ | 12.16 | | | $ | 12.70 | | | $ | 12.06 | |
| | | | | | | | | | | | | | | | | | | | |
Total return(b) | | | (5.46 | )% | | | 5.17 | % | | | 0.57 | % | | | 10.96 | % | | | 2.70 | % |
RATIOS TO AVERAGE NET ASSETS: | | | | | | | | | | | | | | | | | | | | |
Net assets, end of the period (000’s) | | $ | 137 | | | $ | 5,220 | | | $ | 7,972 | | | $ | 12,507 | | | $ | 13,549 | |
Net expenses | | | 1.58 | % | | | 1.58 | % | | | 1.58 | % | | | 1.59 | % | | | 1.56 | % |
Gross expenses | | | 1.58 | % | | | 1.58 | % | | | 1.58 | % | | | 1.59 | % | | | 1.56 | % |
Net investment income | | | 2.58 | % | | | 3.02 | % | | | 3.09 | % | | | 3.42 | % | | | 3.81 | % |
Portfolio turnover rate | | | 23 | % | | | 19 | % | | | 30 | % | | | 19 | % | | | 19 | % |
| (a) | Per share net investment income has been calculated using the average shares outstanding during the period. |
| (b) | A contingent deferred sales charge for Class B shares is not reflected in total return calculations. |
See accompanying notes to financial statements.
33 |
Financial Highlights (continued)
For a share outstanding throughout each period.
| | | | | | | | | | | | | | | | | | | | |
| | | Class C | |
| | | Year Ended
September 30,
2015 | | | Year Ended
September 30,
2014 | | | Year Ended
September 30,
2013 | | | Year Ended
September 30,
2012 | | | Year Ended
September 30,
2011 | |
Net asset value, beginning of the period | | $ | 12.00 | | | $ | 12.11 | | | $ | 12.66 | | | $ | 12.03 | | | $ | 12.47 | |
| | | | | | | | | | | | | | | | | | | | |
INCOME (LOSS) FROM INVESTMENT OPERATIONS: | | | | | | | | | | | | | | | | | | | | |
Net investment income(a) | | | 0.31 | | | | 0.36 | | | | 0.39 | | | | 0.42 | | | | 0.47 | |
Net realized and unrealized gain (loss) | | | (0.94 | ) | | | 0.27 | | | | (0.32 | ) | | | 0.85 | | | | (0.14 | ) |
| | | | | | | | | | | | | | | | | | | | |
Total from Investment Operations | | | (0.63 | ) | | | 0.63 | | | | 0.07 | | | | 1.27 | | | | 0.33 | |
| | | | | | | | | | | | | | | | | | | | |
LESS DISTRIBUTIONS FROM: | | | | | | | | | | | | | | | | | | | | |
Net investment income | | | (0.25 | ) | | | (0.42 | ) | | | (0.50 | ) | | | (0.53 | ) | | | (0.51 | ) |
Net realized capital gains | | | (0.12 | ) | | | (0.32 | ) | | | (0.12 | ) | | | (0.11 | ) | | | (0.26 | ) |
| | | | | | | | | | | | | | | | | | | | |
Total Distributions | | | (0.37 | ) | | | (0.74 | ) | | | (0.62 | ) | | | (0.64 | ) | | | (0.77 | ) |
| | | | | | | | | | | | | | | | | | | | |
Net asset value, end of the period | | $ | 11.00 | | | $ | 12.00 | | | $ | 12.11 | | | $ | 12.66 | | | $ | 12.03 | |
| | | | | | | | | | | | | | | | | | | | |
Total return(b) | | | (5.40 | )% | | | 5.29 | % | | | 0.50 | % | | | 10.91 | % | | | 2.71 | % |
RATIOS TO AVERAGE NET ASSETS: | | | | | | | | | | | | | | | | | | | | |
Net assets, end of the period (000’s) | | $ | 1,219,687 | | | $ | 1,524,806 | | | $ | 1,746,822 | | | $ | 2,281,142 | | | $ | 2,091,834 | |
Net expenses | | | 1.58 | % | | | 1.58 | % | | | 1.58 | % | | | 1.59 | % | | | 1.56 | % |
Gross expenses | | | 1.58 | % | | | 1.58 | % | | | 1.58 | % | | | 1.59 | % | | | 1.56 | % |
Net investment income | | | 2.63 | % | | | 3.00 | % | | | 3.10 | % | | | 3.42 | % | | | 3.81 | % |
Portfolio turnover rate | | | 23 | % | | | 19 | % | | | 30 | % | | | 19 | % | | | 19 | % |
| (a) | Per share net investment income has been calculated using the average shares outstanding during the period. |
| (b) | A contingent deferred sales charge for Class C shares is not reflected in total return calculations. |
See accompanying notes to financial statements.
| 34
Financial Highlights (continued)
For a share outstanding throughout each period.
| | | | | | | | | | | | |
| | | Class N | |
| | | Year Ended
September 30,
2015 | | | Year Ended
September 30,
2014 | | | Period Ended
September 30,
2013* | |
Net asset value, beginning of the period | | $ | 12.11 | | | $ | 12.22 | | | $ | 12.66 | |
| | | | | | | | | | | | |
INCOME (LOSS) FROM INVESTMENT OPERATIONS: | | | | | | | | | | | | |
Net investment income(a) | | | 0.44 | | | | 0.50 | | | | 0.34 | |
Net realized and unrealized gain (loss) | | | (0.93 | ) | | | 0.26 | | | | (0.46 | ) |
| | | | | | | | | | | | |
Total from Investment Operations | | | (0.49 | ) | | | 0.76 | | | | (0.12 | ) |
| | | | | | | | | | | | |
LESS DISTRIBUTIONS FROM: | | | | | | | | | | | | |
Net investment income | | | (0.39 | ) | | | (0.55 | ) | | | (0.32 | ) |
Net realized capital gains | | | (0.12 | ) | | | (0.32 | ) | | | — | |
| | | | | | | | | | | | |
Total Distributions | | | (0.51 | ) | | | (0.87 | ) | | | (0.32 | ) |
| | | | | | | | | | | | |
Net asset value, end of the period | | $ | 11.11 | | | $ | 12.11 | | | $ | 12.22 | |
| | | | | | | | | | | | |
Total return | | | (4.28 | )% | | | 6.41 | % | | | (0.95 | )%(b) |
RATIOS TO AVERAGE NET ASSETS: | | | | | | | | | | | | |
Net assets, end of the period (000’s) | | $ | 21,851 | | | $ | 6,101 | | | $ | 41 | |
Net expenses | | | 0.47 | % | | | 0.47 | %(c) | | | 0.65 | %(d)(e) |
Gross expenses | | | 0.47 | % | | | 0.47 | %(c) | | | 0.78 | %(e) |
Net investment income | | | 3.78 | % | | | 4.07 | % | | | 4.18 | %(e) |
Portfolio turnover rate | | | 23 | % | | | 19 | % | | | 30 | % |
| * | From commencement of Class operations on February 1, 2013 through September 30, 2013. |
| (a) | Per share net investment income has been calculated using the average shares outstanding during the period. |
| (b) | Had certain expenses not been waived/reimbursed during the period, total returns would have been lower. Periods less than one year are not annualized. |
| (c) | Includes fee/expense recovery of less than 0.01%. |
| (d) | The investment adviser agreed to waive its fees and/or reimburse a portion of the Fund’s expenses during the period. Without this waiver/reimbursement, expenses would have been higher. |
| (e) | Computed on an annualized basis for periods less than one year. |
See accompanying notes to financial statements.
35 |
Financial Highlights (continued)
For a share outstanding throughout each period.
| | | | | | | | | | | | | | | | | | | | |
| | | Class Y | |
| | | Year Ended
September 30,
2015 | | | Year Ended
September 30,
2014 | | | Year Ended
September 30,
2013 | | | Year Ended
September 30,
2012 | | | Year Ended
September 30,
2011 | |
Net asset value, beginning of the period | | $ | 12.12 | | | $ | 12.23 | | | $ | 12.77 | | | $ | 12.13 | | | $ | 12.56 | |
| | | | | | | | | | | | | | | | | | | | |
INCOME (LOSS) FROM INVESTMENT OPERATIONS: | | | | | | | | | | | | | | | | | | | | |
Net investment income(a) | | | 0.43 | | | | 0.49 | | | | 0.52 | | | | 0.54 | | | | 0.60 | |
Net realized and unrealized gain (loss) | | | (0.95 | ) | | | 0.26 | | | | (0.31 | ) | | | 0.86 | | | | (0.14 | ) |
| | | | | | | | | | | | | | | | | | | | |
Total from Investment Operations | | | (0.52 | ) | | | 0.75 | | | | 0.21 | | | | 1.40 | | | | 0.46 | |
| | | | | | | | | | | | | | | | | | | | |
LESS DISTRIBUTIONS FROM: | | | | | | | | | | | | | | | | | | | | |
Net investment income | | | (0.37 | ) | | | (0.54 | ) | | | (0.63 | ) | | | (0.65 | ) | | | (0.63 | ) |
Net realized capital gains | | | (0.12 | ) | | | (0.32 | ) | | | (0.12 | ) | | | (0.11 | ) | | | (0.26 | ) |
| | | | | | | | | | | | | | | | | | | | |
Total Distributions | | | (0.49 | ) | | | (0.86 | ) | | | (0.75 | ) | | | (0.76 | ) | | | (0.89 | ) |
| | | | | | | | | | | | | | | | | | | | |
Net asset value, end of the period | | $ | 11.11 | | | $ | 12.12 | | | $ | 12.23 | | | $ | 12.77 | | | $ | 12.13 | |
| | | | | | | | | | | | | | | | | | | | |
Total return | | | (4.47 | )% | | | 6.30 | % | | | 1.60 | % | | | 12.01 | % | | | 3.81 | % |
RATIOS TO AVERAGE NET ASSETS: | | | | | | | | | | | | | | | | | | | | |
Net assets, end of the period (000’s) | | $ | 6,081,536 | | | $ | 6,911,938 | | | $ | 6,130,700 | | | $ | 6,817,911 | | | $ | 4,887,742 | |
Net expenses | | | 0.58 | % | | | 0.59 | % | | | 0.58 | % | | | 0.59 | % | | | 0.56 | % |
Gross expenses | | | 0.58 | % | | | 0.59 | % | | | 0.58 | % | | | 0.59 | % | | | 0.56 | % |
Net investment income | | | 3.63 | % | | | 3.99 | % | | | 4.11 | % | | | 4.41 | % | | | 4.81 | % |
Portfolio turnover rate | | | 23 | % | | | 19 | % | | | 30 | % | | | 19 | % | | | 19 | % |
| (a) | Per share net investment income has been calculated using the average shares outstanding during the period. |
See accompanying notes to financial statements.
| 36
Financial Highlights (continued)
For a share outstanding throughout each period.
| | | | | | | | | | | | | | | | | | | | |
| | | Admin Class | |
| | | Year Ended
September 30,
2015 | | | Year Ended
September 30,
2014 | | | Year Ended
September 30,
2013 | | | Year Ended
September 30,
2012 | | | Year Ended
September 30,
2011 | |
Net asset value, beginning of the period | | $ | 12.09 | | | $ | 12.20 | | | $ | 12.74 | | | $ | 12.11 | | | $ | 12.55 | |
| | | | | | | | | | | | | | | | | | | | |
INCOME (LOSS) FROM INVESTMENT OPERATIONS: | | | | | | | | | | | | | | | | | | | | |
Net investment income(a) | | | 0.37 | | | | 0.43 | | | | 0.45 | | | | 0.48 | | | | 0.54 | |
Net realized and unrealized gain (loss) | | | (0.95 | ) | | | 0.26 | | | | (0.30 | ) | | | 0.85 | | | | (0.15 | ) |
| | | | | | | | | | | | | | | | | | | | |
Total from Investment Operations | | | (0.58 | ) | | | 0.69 | | | | 0.15 | | | | 1.33 | | | | 0.39 | |
| | | | | | | | | | | | | | | | | | | | |
LESS DISTRIBUTIONS FROM: | | | | | | | | | | | | | | | | | | | | |
Net investment income | | | (0.31 | ) | | | (0.48 | ) | | | (0.57 | ) | | | (0.59 | ) | | | (0.57 | ) |
Net realized capital gains | | | (0.12 | ) | | | (0.32 | ) | | | (0.12 | ) | | | (0.11 | ) | | | (0.26 | ) |
| | | | | | | | | | | | | | | | | | | | |
Total Distributions | | | (0.43 | ) | | | (0.80 | ) | | | (0.69 | ) | | | (0.70 | ) | | | (0.83 | ) |
| | | | | | | | | | | | | | | | | | | | |
Net asset value, end of the period | | $ | 11.08 | | | $ | 12.09 | | | $ | 12.20 | | | $ | 12.74 | | | $ | 12.11 | |
| | | | | | | | | | | | | | | | | | | | |
Total return | | | (4.95 | )% | | | 5.79 | % | | | 1.10 | % | | | 11.41 | % | | | 3.26 | % |
RATIOS TO AVERAGE NET ASSETS: | | | | | | | | | | | | | | | | | | | | |
Net assets, end of the period (000’s) | | $ | 37,355 | | | $ | 25,585 | | | $ | 21,557 | | | $ | 15,968 | | | $ | 5,967 | |
Net expenses | | | 1.08 | % | | | 1.09 | % | | | 1.08 | % | | | 1.09 | % | | | 1.07 | % |
Gross expenses | | | 1.08 | % | | | 1.09 | % | | | 1.08 | % | | | 1.09 | % | | | 1.07 | % |
Net investment income | | | 3.14 | % | | | 3.49 | % | | | 3.62 | % | | | 3.89 | % | | | 4.32 | % |
Portfolio turnover rate | | | 23 | % | | | 19 | % | | | 30 | % | | | 19 | % | | | 19 | % |
| (a) | Per share net investment income has been calculated using the average shares outstanding during the period. |
See accompanying notes to financial statements.
37 |
Notes to Financial Statements
September 30, 2015
1. Organization. Loomis Sayles Funds II (the “Trust”) is organized as a Massachusetts business trust. The Trust is registered under the Investment Company Act of 1940, as amended (the “1940 Act”), as an open-end management investment company. The Declaration of Trust permits the Board of Trustees to authorize the issuance of an unlimited number of shares of the Trust in multiple series. The financial statements for certain funds of the Trust are presented in separate reports. Information presented in these financial statements pertains to Loomis Sayles Investment Grade Bond Fund (the “Fund”).
The Fund is a diversified investment company.
The Fund offers Class A, Class C, Class N, Class Y and Admin Class shares. Effective October 12, 2007, Class B shares are no longer offered. Existing Class B shareholders may continue to reinvest dividends into Class B shares and exchange their Class B shares for Class B shares of other Natixis Funds subject to existing exchange privileges as described in the prospectus.
Class A shares are sold with a maximum front-end sales charge of 4.50%. Class B shares do not pay a front-end sales charge; however, they are charged higher Rule 12b-1 fees, and are subject to a contingent deferred sales charge (“CDSC”) if such shares are redeemed within six years of purchase. After eight years of ownership, Class B shares convert to Class A shares. Class C shares do not pay a front-end sales charge, do not convert to any other class of shares, pay higher Rule 12b-1 fees than Class A shares and may be subject to a CDSC of 1.00% if those shares are redeemed within one year of acquisition, except for reinvested distributions. Class N and Class Y shares do not pay a front-end sales charge, a CDSC or Rule 12b-1 fees. Class N shares are primarily intended for employer-sponsored retirement plans. Class Y shares are intended for institutional investors with a minimum initial investment of $100,000, though some categories of investors are exempted from the minimum investment amount as outlined in the Fund’s prospectus. Admin Class shares do not pay a front-end sales charge or a CDSC, but do pay a Rule 12b-1 fee. Class N and Admin Class shares are offered exclusively through intermediaries.
See Note 11 for changes that take effect subsequent to September 30, 2015.
Most expenses can be directly attributed to a Fund. Expenses which cannot be directly attributed to a Fund are generally apportioned based on the relative net assets of each of the funds in Natixis Funds Trust I, Natixis Funds Trust II, Natixis Funds Trust IV, Gateway Trust (“Natixis Funds Trusts”), Loomis Sayles Funds I and Loomis Sayles Funds II (“Loomis Sayles Funds Trusts”). Expenses of the Fund are borne pro rata by the holders of each class of shares, except that each class bears expenses unique to that class (including the Rule 12b-1 service and distribution fees for Class A, Class B, Class C and Admin Class and, for Class A, Class B, Class C, Class Y and Admin Class, collectively, and Class N, individually, transfer agent fees). In addition, each class votes as a class only with respect to its own Rule 12b-1 Plan. Shares of each class would receive their pro rata share of the net assets of the Fund if the Fund were liquidated. The Trustees approve separate distributions from net investment income on each class of shares.
| 38
Notes to Financial Statements (continued)
September 30, 2015
2. Significant Accounting Policies. The following is a summary of significant accounting policies consistently followed by the Fund in the preparation of its financial statements. The Fund’s financial statements follow the accounting and reporting guidelines provided for investment companies and are prepared in accordance with accounting principles generally accepted in the United States of America which require the use of management estimates that affect the reported amounts and disclosures in the financial statements. Actual results could differ from those estimates. Management has evaluated the events and transactions subsequent to year-end through the date the financial statements were issued and has determined that there were no material events that would require disclosure in the Fund’s financial statements, except as disclosed in Note 11.
a. Valuation. Fund securities and other investments are valued at market value based on market quotations obtained or determined by independent pricing services recommended by the adviser and approved by the Board of Trustees. Fund securities and other investments for which market quotations are not readily available are valued at fair value as determined in good faith by the adviser pursuant to procedures approved by the Board of Trustees, as described below. Market value is determined as follows:
Debt securities and unlisted preferred equity securities are valued based on evaluated bids furnished to the Fund by an independent pricing service, or bid prices obtained from broker-dealers. Senior loans are valued at bid prices supplied by an independent pricing service, if available. Listed equity securities (including closed-end investment companies and exchange-traded funds) are valued at the last sale price quoted on the exchange where they are traded most extensively or, if there is no reported sale during the day, the closing bid quotation. Securities traded on the NASDAQ Global Select Market, NASDAQ Global Market and NASDAQ Capital Market are valued at the NASDAQ Official Closing Price (“NOCP”), or if lacking an NOCP, at the most recent bid quotations on the applicable NASDAQ Market. Unlisted equity securities (except unlisted preferred equity securities) are valued at the last sale price quoted in the market where they are traded most extensively or, if there is no reported sale during the day, the closing bid quotation. If there is no last sale price or closing bid quotation available, unlisted equity securities will be valued using evaluated bids furnished by an independent pricing service, if available. In some foreign markets, an official close price and a last sale price may be available from the foreign exchange or market. In those cases, the official close price is used. Broker-dealer bid prices may be used to value debt and unlisted equity securities and senior loans where an independent pricing service is unable to price a security or where an independent pricing service does not provide a reliable price for the security. Forward foreign currency contracts are valued utilizing interpolated rates determined based on information provided by an independent pricing service.
39 |
Notes to Financial Statements (continued)
September 30, 2015
Fund securities and other investments for which market quotations are not readily available are valued at fair value as determined in good faith by the adviser pursuant to procedures approved by the Board of Trustees. The Fund may also value securities and other investments at fair value in other circumstances such as when extraordinary events occur after the close of a foreign market but prior to the close of the New York Stock Exchange (“NYSE”). This may include situations relating to a single issuer (such as a declaration of bankruptcy or a delisting of the issuer’s security from the primary market on which it has traded) as well as events affecting the securities markets in general (such as market disruptions or closings and significant fluctuations in U.S. and/or foreign markets). When fair valuing its securities or other investments, the Fund may, among other things, use modeling tools or other processes that may take into account factors such as securities or other market activity and/or significant events that occur after the close of the foreign market and before the time a Fund’s net asset value (“NAV”) is calculated. Fair value pricing may require subjective determinations about the value of a security, and fair values used to determine the Fund’s NAV may differ from quoted or published prices, or from prices that are used by others, for the same securities. In addition, the use of fair value pricing may not always result in adjustments to the prices of securities held by the Fund.
As of September 30, 2015, securities of the Fund included in net assets (reflected at absolute value) were fair valued as follows:
| | | | | | | | | | | | |
Illiquid
securities1 | | Percentage of
Net Assets | | | Other fair valued securities2 | | | Percentage of Net Assets | |
| $155,438,752 | | | 1.7% | | | $ | 540,799 | | | | Less than 0.1% | |
| 1 | Illiquid securities are deemed to be fair valued pursuant to the Fund’s pricing policies and procedures. |
| 2 | Fair valued by the Fund’s adviser. |
b. Investment Transactions and Related Investment Income. Investment transactions are accounted for on a trade date plus one day basis for daily NAV calculation. However, for financial reporting purposes, investment transactions are reported on trade date. Dividend income is recorded on ex-dividend date, or in the case of certain foreign securities, as soon as a Fund is notified, and interest income is recorded on an accrual basis. Interest income is increased by the accretion of discount and decreased by the amortization of premium. In determining net gain or loss on securities sold, the cost of securities has been determined on an identified cost basis. Investment income, non-class specific expenses and realized and unrealized gains and losses are allocated on a pro rata basis to each class based on the relative net assets of each class to the total net assets of the Fund.
c. Foreign Currency Translation. The books and records of the Fund are maintained in U.S. dollars. The values of securities, currencies and other assets and liabilities denominated in currencies other than U.S. dollars are translated into U.S. dollars based upon foreign exchange rates prevailing at the end of the period. Purchases and sales of
| 40
Notes to Financial Statements (continued)
September 30, 2015
investment securities, income and expenses are translated into U.S. dollars on the respective dates of such transactions.
Net realized foreign exchange gains or losses arise from sales of foreign currency, changes in exchange rates between the trade and settlement dates on securities transactions and the difference between the amounts of dividends, interest and foreign withholding taxes recorded on the Fund’s books and the U.S. dollar equivalent of the amounts actually received or paid. Net unrealized foreign exchange gains or losses arise from changes in the value of assets and liabilities, other than investment securities, as of the end of the fiscal period, resulting from changes in exchange rates. Net realized foreign exchange gains or losses and the net change in unrealized foreign exchange gains or losses are disclosed in the Statement of Operations. For federal income tax purposes, net realized foreign exchange gains or losses are characterized as ordinary income, and may, if the Fund has net losses, reduce the amount of income available to be distributed by the Fund.
The values of investment securities are presented at the foreign exchange rates prevailing at the end of the period for financial reporting purposes. Net realized and unrealized gains or losses on investments reported in the Statement of Operations reflect gains or losses resulting from changes in exchange rates and fluctuations which arise due to changes in market prices of investment securities. For federal income tax purposes, a portion of the net realized gain or loss on investments arising from changes in exchange rates, which is reflected in the Statement of Operations, may be characterized as ordinary income and may, if the Fund has net losses, reduce the amount of income available to be distributed by the Fund.
During the year ended September 30, 2015, the amount of income available to be distributed by the Fund was reduced by $127,094,662 as a result of losses arising from changes in exchange rates.
The Fund may use foreign currency exchange contracts to facilitate transactions in foreign-denominated investments. Losses may arise from changes in the value of the foreign currency or if the counterparties do not perform under the contracts’ terms.
d. Forward Foreign Currency Contracts. The Fund may enter into forward foreign currency contracts, including forward foreign cross currency contracts, to acquire exposure to foreign currencies or to hedge the Fund’s investments against currency fluctuation. A contract can also be used to offset a previous contract. These contracts involve market risk in excess of the unrealized gain or loss reflected in the Fund’s Statement of Assets and Liabilities. The U.S. dollar value of the currencies the Fund has committed to buy or sell represents the aggregate exposure to each currency the Fund has acquired or hedged through currency contracts outstanding at period end. Gains or losses are recorded for financial statement purposes as unrealized until settlement date. Contracts are traded over-the-counter directly with a counterparty. Risks may arise upon entering into these contracts from the potential inability of counterparties to meet the terms of their contracts and from unanticipated movements in the value of a
41 |
Notes to Financial Statements (continued)
September 30, 2015
foreign currency relative to the U.S. dollar. Certain contracts may require the movement of cash and/or securities as collateral for the Fund’s or counterparty’s net obligations under the contracts.
No forward foreign currency contracts were held by the Fund during the year ended September 30, 2015.
e. Federal and Foreign Income Taxes. The Trust treats each Fund as a separate entity for federal income tax purposes. The Fund intends to meet the requirements of the Internal Revenue Code of 1986, as amended, applicable to regulated investment companies, and to distribute to its shareholders substantially all of its net investment income and any net realized capital gains at least annually. Management has performed an analysis of the Fund’s tax positions for the open tax years as of September 30, 2015 and has concluded that no provisions for income tax are required. The Fund’s federal tax returns for the prior three fiscal years remain subject to examination by the Internal Revenue Service. Management is not aware of any events that are reasonably possible to occur in the next twelve months that would result in the amounts of any unrecognized tax benefits significantly increasing or decreasing for the Fund. However, management’s conclusions regarding tax positions taken may be subject to review and adjustment at a later date based on factors including, but not limited to, new tax laws and accounting regulations and interpretations thereof.
The Fund may be subject to foreign withholding taxes on investment income and taxes on capital gains on investments that are accrued and paid based upon the Fund’s understanding of the tax rules and regulations that exist in the countries in which the Fund invests. Foreign withholding taxes on dividend and interest income are reflected on the Statement of Operations as a reduction of investment income, net of amounts eligible to be reclaimed. Dividends and interest receivable on the Statement of Assets and Liabilities are net of foreign withholding taxes. Foreign withholding taxes where reclaims have been or will be filed are reflected on the Statement of Assets and Liabilities as tax reclaims receivable. Capital gains taxes paid are included in net realized gain (loss) on investments in the Statement of Operations. Accrued but unpaid capital gains taxes are reflected as foreign taxes payable on the Statement of Assets and Liabilities, if applicable, and reduce unrealized gains on investments. In the event that realized gains on investments are subsequently offset by realized losses, taxes paid on realized gains may be returned to the Fund. Such amounts, if applicable, are reflected as foreign tax rebates receivable on the Statement of Assets and Liabilities and are recorded as a realized gain when received.
f. Dividends and Distributions to Shareholders. Dividends and distributions are recorded on ex-dividend date. The timing and characterization of certain income and capital gain distributions are determined in accordance with federal tax regulations, which may differ from accounting principles generally accepted in the United States of America. Permanent differences are primarily due to differing treatments for book and
| 42
Notes to Financial Statements (continued)
September 30, 2015
tax purposes of items such as foreign currency gains and losses, paydown gains and losses, capital gain distributions received, premium amortization, deferred Trustees’ fees, contingent payment debt instruments and convertible bonds. Permanent book and tax basis differences relating to shareholder distributions will result in reclassifications to capital accounts reported on the Statement of Assets and Liabilities. Temporary differences between book and tax distributable earnings are primarily due to wash sales, deferred Trustees’ fees, convertible bonds, defaulted and/or non-income producing securities, premium amortization and contingent payment debt instruments. Amounts of income and capital gain available to be distributed on a tax basis are determined annually, and at other times during the Fund’s fiscal year as may be necessary to avoid knowingly declaring and paying a return of capital distribution. Distributions from net investment income and short-term capital gains are considered to be distributed from ordinary income for tax purposes.
The tax characterization of distributions is determined on an annual basis. The tax character of distributions paid to shareholders during the years ended September 30, 2015 and 2014 was as follows:
| | | | | | | | | | |
2015 Distributions Paid From: | | 2014 Distributions Paid From: |
Ordinary Income | | Long-Term
Capital Gains | | Total | | Ordinary Income | | Long-Term
Capital Gains | | Total |
| $313,881,192 | | $103,769,390 | | $417,650,582 | | $423,122,747 | | $252,434,210 | | $675,556,957 |
Differences between these amounts and those reported in the Statement of Changes in Net Assets are primarily attributable to different book and tax treatment for short-term capital gains.
As of September 30, 2015, the components of distributable earnings on a tax basis were as follows:
| | | | |
Undistributed ordinary income | | $ | 31,760,997 | |
Undistributed long-term capital gains | | | 97,186,598 | |
| | | | |
Total undistributed earnings | | | 128,947,595 | |
| | | | |
Unrealized appreciation/(depreciation) | | | | |
Investments | | | 461,702,545 | |
Foreign currency translations | | | (580,295,234 | ) |
| | | | |
Total unrealized depreciation | | | (118,592,689 | ) |
| | | | |
Total accumulated earnings | | $ | 10,354,906 | |
| | | | |
g. Repurchase Agreements. The Fund may enter into repurchase agreements, under the terms of a Master Repurchase Agreement, under which the Fund acquires securities as collateral and agrees to resell the securities at an agreed upon time and at an agreed upon price. It is the Fund’s policy that the market value of the collateral for
repurchase agreements be at least equal to 102% of the repurchase price, including
43 |
Notes to Financial Statements (continued)
September 30, 2015
interest. Certain repurchase agreements are tri-party arrangements whereby the collateral is held in a segregated account for the benefit of the Fund and on behalf of the counterparty. Repurchase agreements could involve certain risks in the event of default or insolvency of the counterparty, including possible delays or restrictions upon the Fund’s ability to dispose of the underlying securities. As of September 30, 2015, the Fund had investments in repurchase agreements for which the value of the related collateral exceeded the value of the repurchase agreement. The gross value of repurchase agreements is included in the Statement of Assets and Liabilities for financial reporting purposes.
h. Securities Lending. The Fund has entered into an agreement with State Street Bank and Trust Company (“State Street Bank”), as agent of the Fund, to lend securities to certain designated borrowers. The loans are collateralized with cash or securities in an amount equal to at least 105% or 102% of the market value (including accrued interest) of the loaned international or domestic securities, respectively, when the loan is initiated. Thereafter, the value of the collateral must remain at least 102% of the market value (including accrued interest) of loaned securities for U.S. equities and U.S. corporate debt; at least 105% of the market value (including accrued interest) of loaned securities for non-U.S. equities; and at least 100% of the market value (including accrued interest) of loaned securities for U.S. Government securities, sovereign debt issued by non-U.S. Governments and non-U.S. corporate debt. In the event that the market value of the collateral falls below the required percentages described above, the borrower will deliver additional collateral on the next business day. As with other extensions of credit, the Fund may bear the risk of loss with respect to the investment of the collateral. The Fund invests cash collateral in short-term investments, a portion of the income from which is remitted to the borrowers and the remainder allocated between the Fund and State Street Bank as lending agent.
For the year ended September 30, 2015, the Fund did not loan securities under this agreement.
i. Indemnifications. Under the Trust’s organizational documents, its officers and Trustees are indemnified against certain liabilities arising out of the performance of their duties to the Fund. Additionally, in the normal course of business, the Fund enters into contracts with service providers that contain general indemnification clauses. The Fund’s maximum exposure under these arrangements is unknown as this would involve future claims that may be made against the Fund that have not yet occurred. However, based on experience, the Fund expects the risk of loss to be remote.
3. Fair Value Measurements. In accordance with accounting standards related to fair value measurements and disclosures, the Fund has categorized the inputs utilized in determining the value of the Fund’s assets or liabilities. These inputs are summarized in the three broad levels listed below:
| | • | | Level 1 – quoted prices in active markets for identical assets or liabilities; |
| 44
Notes to Financial Statements (continued)
September 30, 2015
| | • | | Level 2 – prices determined using other significant inputs that are observable either directly, or indirectly through corroboration with observable market data (which could include quoted prices for similar assets or liabilities, interest rates, credit risk, etc.); and |
| | • | | Level 3 – prices determined using significant unobservable inputs when quoted prices or observable inputs are unavailable such as when there is little or no market activity for an asset or liability (unobservable inputs reflect the Fund’s own assumptions in determining the fair value of assets or liabilities and would be based on the best information available). |
The inputs or methodology used for valuing securities are not necessarily an indication of the risk associated with investing in those securities.
The Fund’s pricing policies and procedures are recommended by the adviser and approved by the Board of Trustees. Debt securities are valued based on evaluated bids furnished to the Fund by an independent pricing service. Broker-dealer bid prices may be used if an independent pricing service either is unable to price a security or does not provide a reliable price for a security. Broker-dealer bid prices for which the Fund does not have knowledge of the inputs used by the broker-dealer are categorized in Level 3. All security prices, including those obtained from an independent pricing service and broker-dealer bid prices, are reviewed on a daily basis by the adviser, subject to oversight by Fund management and the Board of Trustees. If the adviser, in good faith, believes that the price provided by an independent pricing service is unreliable, broker-dealer bid prices may be used until the price provided by the independent pricing service is considered to be reliable. Reliability of all security prices, including those obtained from an independent pricing service and broker-dealer bid prices, is tested in a variety of ways, including comparison to recent transaction prices and daily fluctuations, amongst other validation procedures in place. Securities for which market quotations are not readily available are valued at fair value as determined in good faith by the Funds’ adviser pursuant to procedures approved by the Board of Trustees. Fair valued securities may be categorized in Level 3.
45 |
Notes to Financial Statements (continued)
September 30, 2015
The following is a summary of the inputs used to value the Fund’s investments as of September 30, 2015, at value:
Asset Valuation Inputs
| | | | | | | | | | | | | | | | |
Description | | Level 1 | | | Level 2 | | | Level 3 | | | Total | |
Bonds and Notes | | | | | | | | | | | | | | | | |
Non-Convertible Bonds | | | | | | | | | | | | | | | | |
ABS Other | | $ | — | | | $ | 141,630,496 | | | $ | 101,483,141 | (b) | | $ | 243,113,637 | |
Finance Companies | | | 1,070,381 | | | | 402,139,681 | | | | — | | | | 403,210,062 | |
Metals & Mining | | | — | | | | 213,275,489 | | | | 540,799 | (c) | | | 213,816,288 | |
Non-Agency Commercial Mortgage-Backed Securities | | | — | | | | 124,422,515 | | | | 18,273,394 | (b) | | | 142,695,909 | |
All Other Non-Convertible Bonds(a) | | | — | | | $ | 6,887,633,739 | | | | — | | | | 6,887,633,739 | |
| | | | | | | | | | | | | | | | |
Total Non-Convertible Bonds | | | 1,070,381 | | | | 7,769,101,920 | | | | 120,297,334 | | | | 7,890,469,635 | |
| | | | | | | | | | | | | | | | |
Convertible Bonds(a) | | | — | | | | 437,382,400 | | | | — | | | | 437,382,400 | |
Municipals(a) | | | — | | | | 88,227,304 | | | | — | | | | 88,227,304 | |
| | | | | | | | | | | | | | | | |
Total Bonds and Notes | | | 1,070,381 | | | | 8,294,711,624 | | | | 120,297,334 | | | | 8,416,079,339 | |
| | | | | | | | | | | | | | | | |
Senior Loans(a) | | | — | | | | 42,217,313 | | | | — | | | | 42,217,313 | |
Common Stocks(a) | | | 355,601,983 | | | | — | | | | — | | | | 355,601,983 | |
Preferred Stocks(a) | | | 15,147,974 | | | | 2,167,686 | | | | — | | | | 17,315,660 | |
Short-Term Investments | | | — | | | | 51,756,899 | | | | — | | | | 51,756,899 | |
| | | | | | | | | | | | | | | | |
Total | | $ | 371,820,338 | | | $ | 8,390,853,522 | | | $ | 120,297,334 | | | $ | 8,882,971,194 | |
| | | | | | | | | | | | | | | | |
| (a) | Details of the major categories of the Fund’s investments are reflected within the Portfolio of Investments. |
| (b) | Valued using broker-dealer bid prices. |
| (c) | Fair valued by the Fund’s adviser. |
A preferred stock valued at $4,217,042 was transferred from Level 1 to Level 2 during the period ended September 30, 2015. At September 30, 2014, this security was valued at the last sale price. At September 30, 2015, this security was valued on the basis of evaluated bids furnished to the Fund by an independent pricing service.
All transfers are recognized as of the beginning of the reporting period.
The following is a reconciliation of Level 3 investments for which significant unobservable inputs were used to determine fair value as of September 30, 2014 and/or September 30, 2015:
| 46
Notes to Financial Statements (continued)
September 30, 2015
Asset Valuation Inputs
| | | | | | | | | | | | | | | | | | | | |
Investments in Securities | | Balance as of
September 30,
2014 | | | Accrued
Discounts
(Premiums) | | | Realized
Gain
(Loss) | | | Change in
Unrealized
Appreciation
(Depreciation) | | | Purchases | |
Bonds and Notes | | | | | | | | | | | | | | | | | | | | |
Non-Convertible Bonds | | | | | | | | | | | | | | | | | | | | |
ABS Other | | $ | 121,211,469 | | | $ | — | | | $ | 20,377 | | | $ | 35,613 | | | $ | — | |
Airlines | | | 272,473,977 | | | | — | | | | 4,108,302 | | | | (5,395,161 | ) | | | — | |
Metals & Mining | | | 1,720,500 | | | | 16,708 | | | | 376 | | | | (537,732 | ) | | | 1,624,375 | |
Non-Agency Commercial Mortgage-Backed Securities | | | — | | | | — | | | | — | | | | (58,786 | ) | | | 18,332,180 | |
| | | | | | | | | | | | | | | | | | | | |
Total | | $ | 395,405,946 | | | $ | 16,708 | | | $ | 4,129,055 | | | $ | (5,956,066 | ) | | $ | 19,956,555 | |
| | | | | | | | | | | | | | | | | | | | |
| | | | | | | | | | | | | | | | | | | | |
Investments in Securities | | Sales | | | Transfers
into Level 3 | | | Transfers
out of
Level 3 | | | Balance as of
September 30,
2015 | | | Change in
Unrealized
Appreciation
(Depreciation)
from
Investments
Still Held at
September 30,
2015 | |
Bonds and Notes | | | | | | | | | | | | | | | | | | | | |
Non-Convertible Bonds | | | | | | | | | | | | | | | | | | | | |
ABS Other | | $ | (4,700,590 | ) | | $ | — | | | $ | (15,083,728 | ) | | $ | 101,483,141 | | | $ | 344,658 | |
Airlines | | | (35,406,107 | ) | | | — | | | | (235,781,011 | ) | | | — | | | | — | |
Metals & Mining | | | (2,283,428 | ) | | | — | | | | — | | | | 540,799 | | | | (1,091,448 | ) |
Non-Agency Commercial Mortgage-Backed Securities | | | — | | | | — | | | | — | | | | 18,273,394 | | | | (58,786 | ) |
| | | | | | | | | | | | | | | | | | | | |
Total | | $ | (42,390,125 | ) | | $ | — | | | $ | (250,864,739 | ) | | $ | 120,297,334 | | | $ | (805,576 | ) |
| | | | | | | | | | | | | | | | | | | | |
Debt securities valued at $250,864,739 were transferred from Level 3 to Level 2 during the period ended September 30, 2015. At September 30, 2014, these securities were
47 |
Notes to Financial Statements (continued)
September 30, 2015
valued using broker-dealer bid prices based on inputs unobservable to the Fund as an independent pricing service was unable to price the securities. At September 30, 2015, these securities were valued on the basis of evaluated bids furnished to the Fund by an independent pricing service in accordance with the Fund’s valuation policies.
All transfers are recognized as of the beginning of the reporting period.
4. Purchases and Sales of Securities. For the year ended September 30, 2015, purchases and sales of securities (excluding short-term investments and U.S. Government/Agency securities and including paydowns) were $1,338,616,577 and $1,399,732,791, respectively. Purchases and sales of U.S. Government/Agency securities (excluding short-term investments and including paydowns) were $1,024,871,539 and $1,151,798,143, respectively.
5. Management Fees and Other Transactions with Affiliates.
a. Management Fees. Loomis, Sayles & Company, L.P. (“Loomis Sayles”) serves as investment adviser to the Fund. Under the terms of the management agreement, the Fund pays a management fee at the annual rate of 0.40% of the first $15 billion of the Fund’s average daily net assets and 0.38% of the Fund’s average daily net assets in excess of $15 billion, calculated daily and payable monthly.
Loomis Sayles has given a binding undertaking to the Fund to waive management fees and/or reimburse certain expenses to limit the Fund’s operating expenses, exclusive of acquired fund fees and expenses, brokerage expenses, interest expense, taxes, organizational and extraordinary expenses such as litigation and indemnification expenses. This undertaking is in effect until January 31, 2016, may be terminated before then only with the consent of the Fund’s Board of Trustees, and is reevaluated on an annual basis. Management fees payable, as reflected on the Statement of Assets and Liabilities, is net of waivers and/or expense reimbursements, if any, pursuant to these undertakings.
For the year ended September 30, 2015, the expense limits as a percentage of average daily net assets under the expense limitation agreement were as follows:
| | | | | | | | | | | | | | | | | | | | |
Expense Limit as a Percentage of Average Daily Net Assets | |
Class A | | Class B | | | Class C | | | Class N | | | Class Y | | | Admin Class | |
| 0.95% | | | 1.70% | | | | 1.70% | | | | 0.65% | | | | 0.70% | | | | 1.20% | |
Loomis Sayles shall be permitted to recover expenses it has borne under the expense limitation agreement (whether through waiver of its management fees or otherwise) on a class by class basis in later periods to the extent the annual operating expenses of a class fall below a class’ expense limits, provided, however, that a class is not obligated to pay such waived/reimbursed fees or expenses more than one year after the end of the fiscal year in which the fees or expenses were waived/reimbursed.
| 48
Notes to Financial Statements (continued)
September 30, 2015
For the year ended September 30, 2015, the management fees for the Fund were $41,910,112 (effective rate of 0.40% of average daily net assets).
No expenses were recovered during the year ended September 30, 2015 under the terms of the expense limitation agreement.
Certain officers and employees of Loomis Sayles are also officers or Trustees of the Trust. Loomis Sayles’ general partner is indirectly owned by Natixis Global Asset Management, L.P. (“Natixis US”), which is part of Natixis Global Asset Management, an international asset management group based in Paris, France.
b. Service and Distribution Fees. NGAM Distribution, L.P. (“NGAM Distribution”), which is a wholly-owned subsidiary of Natixis US, has entered into a distribution agreement with the Trust. Pursuant to this agreement, NGAM Distribution serves as principal underwriter of the Funds of the Trust.
Pursuant to Rule 12b-1 under the 1940 Act, the Trust has adopted a Service Plan relating to the Fund’s Class A shares (the “Class A Plan”), a Distribution and Service Plan relating to the Fund’s Class B and Class C shares (the “Class B and Class C Plans”), and a Distribution Plan relating to its Admin Class shares (the “Admin Class Plan”).
Under the Class A Plan, the Fund pays NGAM Distribution a monthly service fee at an annual rate not to exceed 0.25% of the average daily net assets attributable to the Fund’s Class A shares, as reimbursement for expenses incurred by NGAM Distribution in providing personal services to investors in Class A shares and/or the maintenance of shareholder accounts.
Under the Class B and Class C Plans, the Fund pays NGAM Distribution a monthly service fee at an annual rate not to exceed 0.25% of the average daily net assets attributable to the Fund’s Class B and Class C shares, as compensation for services provided by NGAM Distribution in providing personal services to investors in Class B and Class C shares and/or the maintenance of shareholder accounts.
Also under the Class B and Class C Plans, the Fund pays NGAM Distribution a monthly distribution fee at an annual rate of 0.75% of the average daily net assets attributable to the Fund’s Class B and Class C shares, as compensation for services provided by NGAM Distribution in connection with the marketing or sale of Class B and Class C shares.
Under the Admin Class Plan, the Fund pays NGAM Distribution a monthly distribution fee at an annual rate not to exceed 0.25% of the average daily net assets attributable to the Fund’s Admin Class shares, as compensation for services provided by NGAM Distribution in connection with the marketing or sale of Admin Class shares or for payments made by NGAM Distribution to securities dealers or other financial intermediaries as commissions, asset-based sales charges or other compensation with respect to the sale of Admin Class shares, or for providing personal services to investors and/or the maintenance of shareholder accounts.
49 |
Notes to Financial Statements (continued)
September 30, 2015
In addition, the Admin Class shares of the Fund may pay NGAM Distribution an administrative service fee, at an annual rate not to exceed 0.25% of the average daily net assets attributable to Admin Class shares. These fees are subsequently paid to securities dealers or financial intermediaries for providing personal services and/or account maintenance for their customers who hold such shares.
For the year ended September 30, 2015, the service and distribution fees for the Fund were as follows:
| | | | | | | | | | | | | | | | | | | | | | | | |
Service Fees | | | Distribution Fees | |
Class A | | Class B | | | Class C | | | Admin Class | | | Class B | | | Class C | | | Admin Class | |
| $4,799,919 | | $ | 6,327 | | | $ | 3,585,436 | | | $ | 79,665 | | | $ | 18,982 | | | $ | 10,756,309 | | | $ | 79,665 | |
c. Administrative Fees. NGAM Advisors, L.P. (“NGAM Advisors”) provides certain administrative services for the Fund and contracts with State Street Bank to serve as sub-administrator. NGAM Advisors is a wholly-owned subsidiary of Natixis US. Pursuant to an agreement among Natixis Funds Trusts, Loomis Sayles Funds Trusts and NGAM Advisors, the Fund pays NGAM Advisors monthly its pro rata portion of fees equal to an annual rate of 0.0575% of the first $15 billion of the average daily net assets of the Natixis Funds Trusts and Loomis Sayles Funds Trusts, 0.0500% of the next $15 billion, 0.0400% of the next $30 billion, 0.0350% of the next $30 billion and 0.0325% of such assets in excess of $90 billion, subject to an annual aggregate minimum fee for the Natixis Funds Trusts and Loomis Sayles Funds Trusts of $10 million, which is reevaluated on an annual basis.
For the year ended September 30, 2015, the administrative fees for the Fund were $4,468,550.
d. Sub-Transfer Agent Fees. NGAM Distribution has entered into agreements, which include servicing agreements, with financial intermediaries that provide recordkeeping, processing, shareholder communications and other services to customers of the intermediaries that hold positions in the Fund and has agreed to compensate the intermediaries for providing those services. Intermediaries transact with the Fund primarily through the use of omnibus accounts on behalf of their customers who hold positions in the Fund. These services would have been provided by the Fund’s transfer agent and other service providers if the shareholders’ accounts were maintained directly at the Fund’s transfer agent. Accordingly, the Fund has agreed to reimburse NGAM Distribution for all or a portion of the servicing fees paid to these intermediaries. The reimbursement amounts (sub-transfer agent fees) paid to NGAM Distribution are subject to a current per-account equivalent fee limit approved by the Fund’s Board of Trustees, which is based on fees for similar services paid to the Fund’s transfer agent and other service providers. Class N shares do not bear such expenses.
For the year ended September 30, 2015, the sub-transfer agent fees (which are reflected in transfer agent fees and expenses in the Statement of Operations) for the Fund were $11,946,647.
| 50
Notes to Financial Statements (continued)
September 30, 2015
As of September 30, 2015, the Fund owes NGAM Distribution $144,296 in reimbursements for sub-transfer agent fees (which are reflected in the Statement of Assets and Liabilities as payable to distributor).
Sub-transfer agent fees attributable to Class A, Class B, Class C, Class Y and Admin Class are allocated on a pro rata basis to each class based on the relative net assets of each class to the total net assets of those classes.
e. Commissions. Commissions (including CDSCs) on Fund shares retained by NGAM Distribution were $267,772 for the year ended September 30, 2015.
f. Trustees Fees and Expenses. The Trust does not pay any compensation directly to its officers or Trustees who are directors, officers or employees of NGAM Advisors, NGAM Distribution, Natixis US or their affiliates. The Chairperson of the Board of Trustees receives a retainer fee at the annual rate of $300,000. The Chairperson does not receive any meeting attendance fees for Board of Trustees meetings or committee meetings that she attends. Each Independent Trustee (other than the Chairperson) receives, in the aggregate, a retainer fee at the annual rate of $130,000. Each Independent Trustee also receives a meeting attendance fee of $10,000 for each meeting of the Board of Trustees that he or she attends in person and $5,000 for each meeting of the Board of Trustees that he or she attends telephonically. In addition, the chairperson of the Contract Review Committee and the chairperson of the Audit Committee each receive an additional retainer fee at the annual rate of $17,500. The chairperson of the Governance Committee receives an additional retainer fee at the annual rate of $5,000. Each Contract Review Committee member is compensated $6,000 for each Committee meeting that he or she attends in person and $3,000 for each meeting that he or she attends telephonically. Each Audit Committee member is compensated $6,000 for each Committee meeting that he or she attends in person and $3,000 for each meeting that he or she attends telephonically. These fees are allocated among the funds in the Natixis Funds Trusts, Loomis Sayles Funds Trusts and Gateway Trust based on a formula that takes into account, among other factors, the relative net assets of each fund. Trustees are reimbursed for travel expenses in connection with attendance at meetings.
A deferred compensation plan (the “Plan”) is available to the Trustees on a voluntary basis. Deferred amounts remain in the Fund until distributed in accordance with the provisions of the Plan. The value of a participating Trustee’s deferral account is based on theoretical investments of deferred amounts, on the normal payment dates, in certain funds of the Natixis Funds Trusts and Loomis Sayles Funds Trusts as designated by the participating Trustees. Changes in the value of participants’ deferral accounts are allocated pro rata among the funds in the Natixis Funds Trusts and Loomis Sayles Funds Trusts, and are normally reflected as Trustees’ fees and expenses in the Statement of Operations. The portions of the accrued obligations allocated to the Fund under the Plan are reflected as Deferred Trustees’ fees in the Statement of Assets and Liabilities.
51 |
Notes to Financial Statements (continued)
September 30, 2015
g. Affiliated Ownership. As of September 30, 2015, Loomis Sayles Employees’ Profit Sharing Retirement Plan held shares of the Fund representing 0.07% of the Fund’s net assets.
Investment activities of affiliated shareholders could have material impacts on the Fund.
h. Reimbursement of Transfer Agent Fees and Expenses. NGAM Advisors has given a binding contractual undertaking to the Fund to reimburse any and all transfer agency expenses for the Fund’s Class N shares. This undertaking is in effect through January 31, 2016 and is not subject to recovery under the expense limitation agreement described above.
For the year ended September 30, 2015, NGAM Advisors reimbursed the Fund $476 for transfer agency expenses related to Class N shares.
6. Class-Specific Transfer Agent Fees and Expenses. For the year ended September 30, 2015, the Fund incurred the following class-specific expenses (including sub-transfer agent fees, where applicable):
| | | | | | | | | | | | | | | | | | | | | | | | |
| | | Class A | | | Class B | | | Class C | | | Class N | | | Class Y | | | Admin Class | |
Transfer Agent Fees and Expenses | | $ | 2,274,758 | | | $ | 2,935 | | | $ | 1,698,450 | | | $ | 476 | | | $ | 8,379,683 | | | $ | 37,933 | |
Transfer agent fees and expenses attributable to Class A, Class B, Class C, Class Y and Admin Class are allocated on a pro rata basis to each class based on the relative net assets of each class to the total net assets of those classes. Transfer agent fees and expenses attributable to Class N are allocated to Class N.
7. Line of Credit. The Fund, together with certain other funds of Natixis Funds Trusts and Loomis Sayles Funds Trusts, participates in a $150,000,000 committed unsecured line of credit provided by State Street Bank. Any one Fund may borrow up to the full $150,000,000 under the line of credit (as long as all borrowings by all Funds in the aggregate do not exceed the $150,000,000 limit at any time). Interest is charged to each participating Fund based on its borrowings at a rate per annum equal to the greater of the Federal Funds rate or overnight LIBOR, plus 1.25%. In addition, a commitment fee of 0.15% per annum, payable at the end of each calendar quarter, is accrued and apportioned among the participating funds based on their average daily unused portion of the line of credit.
For the year ended September 30, 2015, the Fund had no borrowings under this agreement.
Prior to April 16, 2015, the committed unsecured line of credit was $200,000,000 with an individual limit of $125,000,000 for each Fund that participated in the line of credit. In addition, the commitment fee was 0.10% per annum, payable at the end of each calendar quarter.
| 52
Notes to Financial Statements (continued)
September 30, 2015
8. Concentration of Risk. The Fund’s investments in foreign securities are subject to foreign currency fluctuations, higher volatility than U.S. securities, varying degrees of regulation and limited liquidity. Greater political, economic, credit and information risks are also associated with foreign securities.
9. Concentration of Ownership. From time to time, a Fund may have a concentration of one or more accounts constituting a significant percentage of shares outstanding. Investment activities by holders of such accounts could have material impacts on the Fund. As of September 30, 2015, based on management’s evaluation of the shareholder account base, the Fund had accounts representing controlling ownership of more than 5% of the Fund’s total outstanding shares. The number of such accounts, based on accounts that represent more than 5% of an individual class of shares, and the aggregate percentage of net assets represented by such holdings were as follows:
| | | | | | | | | | | | |
Number of 5%
Non-Affiliated
Account Holders | | Percentage of
Non-Affiliated
Ownership | | | Percentage of
Affiliated Ownership
(Note 5) | | | Total
Percentage of Ownership | |
| 1 | | | 18.48% | | | | 0.07% | | | | 18.55% | |
Omnibus shareholder accounts for which NGAM Advisors understands that the intermediary has discretion over the underlying shareholder accounts or investment models where a shareholder account may be invested for a non-discretionary customer are included in the table above. For other omnibus accounts, the Fund does not have information on the individual shareholder accounts underlying the omnibus accounts; therefore, there could be other 5% shareholders in addition to those disclosed in the table above.
10. Capital Shares. The Fund may issue an unlimited number of shares of beneficial interest, without par value. Transactions in capital shares were as follows:
| | | | | | | | | | | | | | | | |
| | | Year Ended
September 30, 2015 | | | Year Ended
September 30, 2014 | |
| | | Shares | | | Amount | | | Shares | | | Amount | |
| Class A | | | | | | | | | | | | | | | | |
Issued from the sale of shares | | | 50,766,517 | | | $ | 600,413,342 | | | | 61,980,287 | | | $ | 757,402,370 | |
Issued in connection with the reinvestment of distributions | | | 5,370,833 | | | | 63,307,123 | | | | 11,402,236 | | | | 137,522,730 | |
Redeemed | | | (69,121,484 | ) | | | (805,049,363 | ) | | | (112,771,964 | ) | | | (1,382,727,194 | ) |
| | | | | | | | | | | | | | | | |
Net change | | | (12,984,134 | ) | | $ | (141,328,898 | ) | | | (39,389,441 | ) | | $ | (487,802,094 | ) |
| | | | | | | | | | | | | | | | |
| Class B | | | | | | | | | | | | | | | | |
Issued from the sale of shares | | | 2,376 | | | $ | 27,982 | | | | 12,684 | | | $ | 152,583 | |
Issued in connection with the reinvestment of distributions | | | 6,685 | | | | 78,892 | | | | 22,585 | | | | 270,690 | |
Redeemed | | | (430,116 | ) | | | (5,024,441 | ) | | | (257,679 | ) | | | (3,138,970 | ) |
| | | | | | | | | | | | | | | | |
Net change | | | (421,055 | ) | | $ | (4,917,567 | ) | | | (222,410 | ) | | $ | (2,715,697 | ) |
| | | | | | | | | | | | | | | | |
53 |
Notes to Financial Statements (continued)
September 30, 2015
10. Capital Shares (continued).
| | | | | | | | | | | | | | | | |
| | | Year Ended
September 30, 2015 | | | Year Ended
September 30, 2014 | |
| | | Shares | | | Amount | | | Shares | | | Amount | |
| Class C | | | | | | | | | | | | | | | | |
Issued from the sale of shares | | | 12,852,371 | | | $ | 151,180,866 | | | | 13,814,441 | | | $ | 167,086,533 | |
Issued in connection with the reinvestment of distributions | | | 2,611,403 | | | | 30,561,859 | | | | 5,186,123 | | | | 61,978,474 | |
Redeemed | | | (31,658,857 | ) | | | (365,540,475 | ) | | | (36,110,742 | ) | | | (436,564,015 | ) |
| | | | | | | | | | | | | | | | |
Net change | | | (16,195,083 | ) | | $ | (183,797,750 | ) | | | (17,110,178 | ) | | $ | (207,499,008 | ) |
| | | | | | | | | | | | | | | | |
| Class N | | | | | | | | | | | | | | | | |
Issued from the sale of shares | | | 1,864,131 | | | $ | 22,024,796 | | | | 549,445 | | | $ | 6,730,576 | |
Issued in connection with the reinvestment of distributions | | | 46,286 | | | | 540,713 | | | | 17,975 | | | | 217,415 | |
Redeemed | | | (446,650 | ) | | | (5,162,629 | ) | | | (67,008 | ) | | | (816,584 | ) |
| | | | | | | | | | | | | | | | |
Net change | | | 1,463,767 | | | $ | 17,402,880 | | | | 500,412 | | | $ | 6,131,407 | |
| | | | | | | | | | | | | | | | |
| Class Y | | | | | | | | | | | | | | | | |
Issued from the sale of shares | | | 185,813,381 | | | $ | 2,194,472,200 | | | | 207,507,155 | | | $ | 2,542,512,176 | |
Issued in connection with the reinvestment of distributions | | | 22,378,908 | | | | 263,725,134 | | | | 30,655,508 | | | | 370,436,791 | |
Redeemed | | | (231,275,254 | ) | | | (2,685,801,589 | ) | | | (169,118,479 | ) | | | (2,066,048,547 | ) |
| | | | | | | | | | | | | | | | |
Net change | | | (23,082,965 | ) | | $ | (227,604,255 | ) | | | 69,044,184 | | | $ | 846,900,420 | |
| | | | | | | | | | | | | | | | |
| Admin Class | | | | | | | | | | | | | | | | |
Issued from the sale of shares | | | 2,406,562 | | | $ | 28,067,886 | | | | 1,285,768 | | | $ | 15,672,285 | |
Issued in connection with the reinvestment of distributions | | | 43,693 | | | | 512,939 | | | | 46,748 | | | | 562,942 | |
Redeemed | | | (1,195,940 | ) | | | (13,980,365 | ) | | | (982,879 | ) | | | (11,957,154 | ) |
| | | | | | | | | | | | | | | | |
Net change | | | 1,254,315 | | | $ | 14,600,460 | | | | 349,637 | | | $ | 4,278,073 | |
| | | | | | | | | | | | | | | | |
Increase (decrease) from capital share transactions | | | (49,965,155 | ) | | $ | (525,645,130 | ) | | | 13,172,204 | | | $ | 159,293,101 | |
| | | | | | | | | | | | | | | | |
11. Subsequent Event. On September 10, 2015, the Board of Trustees approved the following changes: (i) the early conversion of all of the Fund’s remaining Class B shares into Class A shares, effective at the close of business on January 11, 2016, (ii) a reduction of the maximum sales charge on purchases of Class A shares from 4.50% to 4.25%, effective November 2, 2015, and (iii) a broadening of eligibility requirements for Class N shares to include investors with an initial minimum investment of $1,000,000, effective November 2, 2015.
| 54
Report of Independent Registered Public Accounting Firm
To the Trustees of Loomis Sayles Funds II and Shareholders of Loomis Sayles Investment Grade Bond Fund:
In our opinion, the accompanying statement of assets and liabilities, including the portfolio of investments, and the related statements of operations and of changes in net assets and the financial highlights present fairly, in all material respects, the financial position of the Loomis Sayles Investment Grade Bond Fund, a series of Loomis Sayles Funds II (the “Fund”) at September 30, 2015, and the results of its operations, the changes in its net assets and the financial highlights for each of the periods indicated, in conformity with accounting principles generally accepted in the United States of America. These financial statements and financial highlights (hereafter referred to as “financial statements”) are the responsibility of the Fund’s management. Our responsibility is to express an opinion on these financial statements based on our audits. We conducted our audits of these financial statements in accordance with the standards of the Public Company Accounting Oversight Board (United States). Those standards require that we plan and perform the audit to obtain reasonable assurance about whether the financial statements are free of material misstatement. An audit includes examining, on a test basis, evidence supporting the amounts and disclosures in the financial statements, assessing the accounting principles used and significant estimates made by management, and evaluating the overall financial statement presentation. We believe that our audits, which included confirmation of securities at September 30, 2015 by correspondence with the custodian and agent banks, provide a reasonable basis for our opinion.
PricewaterhouseCoopers LLP
Boston, Massachusetts
November 20, 2015
55 |
2015 U.S. Tax Distribution Information to Shareholders (Unaudited)
Corporate Dividends Received Deduction. For the fiscal year ended September 30, 2015, 5.30% of dividends distributed by Investment Grade Bond Fund qualify for the dividends received deduction for corporate shareholders.
Capital Gains Distributions. Pursuant to Internal Revenue Section 852(b), the Investment Grade Bond Fund designated $103,769,390 as capital gains distributions for the fiscal year ended September 30, 2015, unless subsequently determined to be different.
Qualified Dividend Income. For the fiscal year ended September 30, 2015, the Investment Grade Bond Fund will designate up to the maximum amount allowable pursuant to the Internal Revenue Code as qualified dividend income eligible for reduced tax rates. These lower rates range from 0% to 20% depending on an individual’s tax bracket. If the Fund pays a distribution during calendar year 2015 complete information will be reported in conjunction with Form 1099-DIV.
| 56
Trustee and Officer Information
The tables below provide certain information regarding the trustees and officers of Loomis Sayles Funds II (the “Trust”). Unless otherwise indicated, the address of all persons below is 399 Boylston Street, Boston, MA 02116. The Fund’s Statement of Additional Information include additional information about the trustees of the Trust and is available by calling Natixis Funds at 800-225-5478.
| | | | | | | | |
Name and Year of Birth | | Position(s) Held with the Trust, Length of Time Served and Term of Office1 | | Principal Occupation(s) During Past 5 Years | | Number of Portfolios in Fund Complex Overseen2 and Other Directorships Held During Past 5 Years | | Experience, Qualifications, Attributes, Skills for Board Membership |
| | | |
| INDEPENDENT TRUSTEES | | | | | | |
| | | | |
Kenneth A. Drucker (1945) | | Trustee since 2008 Chairperson of the Audit Committee and Governance Committee Member | | Retired | | 42 None | | Significant experience on the Board and on the boards of other business organizations (including at investment companies); executive experience (including as treasurer of an aerospace, automotive, and metal manufacturing corporation) |
| | | | |
Edmond J. English (1953) | | Trustee since 2013 Contract Review Committee Member | | Chief Executive Officer of Bob’s Discount Furniture (retail) | | 42 Formerly, Director, BJ’s Wholesale Club (retail); formerly, Director, Citizens Financial Group (bank) | | Experience on the Board and significant experience on the boards of other business organizations (including at a retail company and a bank); executive experience (including at a retail company) |
57 |
Trustee and Officer Information
| | | | | | | | |
Name and Year of Birth | | Position(s) Held with the Trust, Length of Time Served and Term of Office1 | | Principal Occupation(s) During Past 5 Years | | Number of Portfolios in Fund Complex Overseen2 and Other Directorships Held During Past 5 Years | | Experience, Qualifications, Attributes, Skills for Board Membership |
| | | |
INDEPENDENT TRUSTEES continued | | | | | | |
| | | | |
Richard A. Goglia (1951) | | Trustee since 2015 Audit Committee Member | | Retired; formerly Vice President and Treasurer of Raytheon Company (defense) | | 42 None | | Experience on the Board and executive experience (including his role as vice president and treasurer of a defense company and experience at a financial services company) |
| | | | |
Wendell J. Knox (1948) | | Trustee since 2009 Audit Committee Member and Governance Committee Member | | Director of Abt Associates Inc. (research and consulting) | | 42 Director, Eastern Bank (bank); Director, The Hanover Insurance Group (property and casualty insurance) | | Significant experience on the Board and on the boards of other business organizations (including at a bank and at a property and casualty insurance firm); executive experience (including roles as president and chief executive officer of a research and consulting company) |
| 58
Trustee and Officer Information
| | | | | | | | |
Name and Year of Birth | | Position(s) Held with the Trust, Length of Time Served and Term of Office1 | | Principal Occupation(s) During Past 5 Years | | Number of Portfolios in Fund Complex Overseen2 and Other Directorships Held During Past 5 Years | | Experience, Qualifications, Attributes, Skills for Board Membership |
| | | |
INDEPENDENT TRUSTEES continued | | | | | | |
| | | | |
Martin T. Meehan (1956) | | Trustee since 2012 Contract Review Committee Member | | President, University of Massachusetts (formerly, Chancellor and faculty member, University of Massachusetts Lowell) | | 42 None | | Experience on the Board and on the boards of other business organizations; experience as President of the University of Massachusetts; government experience (including as a member of the U.S. House of Representatives); academic experience |
| | | | |
Sandra O. Moose (1942) | | Chairperson of the Board of Trustees since November 2005 Trustee since 2003 Ex Officio member of the Audit Committee, the Contract Review Committee and the Governance Committee | | President, Strategic Advisory Services (management consulting) | | 42 Director, AES Corporation (international power company); formerly, Director, Verizon Communications (telecommunications company) | | Significant experience on the Board and on the boards of other business organizations (including at a telecommunications company, an international power company and a specialty chemicals corporation); executive experience (including at a management consulting company) |
59 |
Trustee and Officer Information
| | | | | | | | |
Name and Year of Birth | | Position(s) Held with the Trust, Length of Time Served and Term of Office1 | | Principal Occupation(s) During Past 5 Years | | Number of Portfolios in Fund Complex Overseen2 and Other Directorships Held During Past 5 Years | | Experience, Qualifications, Attributes, Skills for Board Membership |
| | | |
INDEPENDENT TRUSTEES continued | | | | | | |
| | | | |
Erik R. Sirri (1958) | | Trustee since 2009 Audit Committee Member | | Professor of Finance at Babson College | | 42 None | | Significant experience on the Board; experience as Director of the Division of Trading and Markets at the Securities and Exchange Commission; academic experience; training as an economist |
| | | | |
Peter J. Smail (1952) | | Trustee since 2009 Chairperson of the Contract Review Committee and Governance Committee Member | | Retired | | 42 None | | Significant experience on the Board; mutual fund industry and executive experience (including roles as president and chief executive officer for an investment adviser) |
| | | | |
Cynthia L. Walker (1956) | | Trustee since 2005 Chairperson of the Governance Committee and Contract Review Committee Member | | Deputy Dean for Finance and Administration, Yale University School of Medicine | | 42 None | | Significant experience on the Board; executive experience in a variety of academic organizations (including roles as dean for finance and administration) |
| 60
Trustee and Officer Information
| | | | | | | | |
Name and Year of Birth | | Position(s) Held with the Trust, Length of Time Served and Term of Office1 | | Principal Occupation(s) During Past 5 Years | | Number of Portfolios in Fund Complex Overseen2 and Other Directorships Held During Past 5 Years | | Experience, Qualifications, Attributes, Skills for Board Membership |
| | | |
| INTERESTED TRUSTEES | | | | | | |
| | | | |
Kevin P. Charleston3 (1965) One Financial Center Boston, MA 02111 | | Trustee since 2015 | | President, Chief Executive Officer and Director; formerly, Chief Financial Officer, Loomis, Sayles & Company, L.P. | | 42 None | | Continuing service as President, Chief Executive Officer and Director of Loomis, Sayles & Company, L.P. |
| | | | |
David L. Giunta4 (1965) | | Trustee since 2011 President since 2008 and Chief Executive Officer since 2015 | | President and Chief Executive Officer, NGAM Distribution Corporation, NGAM Advisors, L.P. and NGAM Distribution, L.P. | | 42 None | | Experience on the Board; continuing experience as President and Chief Executive Officer of NGAM Advisors, L.P. |
| | | | |
John T. Hailer5 (1960) | | Trustee since 2003 | | President and Chief Executive Officer – U.S. and Asia, Natixis Global Asset Management, L.P. | | 42 None | | Significant experience on the Board; continuing experience as President and Chief Executive Officer – U.S. and Asia, Natixis Global Asset Management, L.P. |
| 1 | Each trustee serves until retirement, resignation or removal from the Board. The current retirement age is 75. The position of Chairperson of the Board is appointed for a three-year term. Ms. Moose was appointed to serve an additional three-year term as the Chairperson of the Board on December 13, 2013. |
| 2 | The trustees of the Trust serve as trustees of a fund complex that includes all series of the Natixis Funds Trust I, Natixis Funds Trust II, Natixis Funds Trust IV and Gateway Trust (collectively, the “Natixis Funds Trusts”), Loomis Sayles Funds I and Loomis Sayles Funds II (collectively, the “Loomis Sayles Funds Trusts”), (collectively, the “Fund Complex”). |
| 3 | Mr. Charleston is deemed an “interested person” of the Trust because he holds the following positions with an affiliated person of the Trust: President, Chief Executive Officer and Director of Loomis, Sayles & Company, L.P. |
| 4 | Mr. Giunta is deemed an “interested person” of the Trust because he holds the following positions with an affiliated person of the Trust: President and Chief Executive Officer of NGAM Distribution Corporation, NGAM Advisors, L.P. and NGAM Distribution, L.P. |
| 5 | Mr. Hailer is deemed an “interested person” of the Trust because he holds the following positions with an affiliated person of the Trust: President and Chief Executive Officer – U.S. and Asia, Natixis Global Asset Management, L.P. |
61 |
Trustee and Officer Information
| | | | | | |
Name and Year of Birth | | Position(s) Held with the Trust(s) | | Term of Office1 and Length of Time Served | | Principal Occupation(s) During Past 5 Years2 |
|
| OFFICERS OF THE TRUST |
| | | |
Coleen Downs Dinneen (1960) | | Secretary, Clerk and Chief Legal Officer | | Since September 2004 | | Executive Vice President, General Counsel, Secretary and Clerk, NGAM Distribution Corporation, NGAM Advisors, L.P. and NGAM Distribution, L.P. |
| | | |
Daniel J. Fuss (1933) One Financial Center Boston, MA 02111 | | Executive Vice President | | Since June 2003 | | Vice Chairman and Director, Loomis, Sayles & Company, L.P. |
| | | |
Russell L. Kane (1969) | | Chief Compliance Officer, Assistant Secretary and Anti-Money Laundering Officer | | Chief Compliance Officer since May 2006; Assistant Secretary since June 2004; and Anti-Money Laundering Officer since April 2007 | | Chief Compliance Officer for Mutual Funds, Senior Vice President, Deputy General Counsel, Assistant Secretary and Assistant Clerk, NGAM Distribution Corporation, NGAM Advisors, L.P. and NGAM Distribution, L.P. |
| | | |
Michael C. Kardok (1959) | | Treasurer, Principal Financial and Accounting Officer | | Since October 2004 | | Senior Vice President, NGAM Advisors, L.P. and NGAM Distribution, L.P. |
| 1 | Each officer of the Trust serves for an indefinite term in accordance with the Trust’s current by-laws until the date his or her successorg is elected and qualified, or until he or she sooner dies, retires, is removed or becomes disqualified. |
| 2 | Each person listed above, except as noted, holds the same position(s) with the Fund Complex. Mr. Fuss is not an officer of the Natixis Funds Trusts. Previous positions during the past five years with NGAM Distribution, L.P., NGAM Advisors, L.P. or Loomis, Sayles & Company, L.P. are omitted, if not materially different from a trustee’s or officer’s current position with such entity. |
| 62
ANNUAL REPORT
September 30, 2015

Loomis Sayles Strategic Income Fund

TABLE OF CONTENTS
Portfolio Review page 1
Portfolio of Investments page 12
Financial Statements page 35
Notes to Financial Statements page 45
LOOMIS SAYLES STRATEGIC INCOME FUND
| | | | |
| Managers | | Symbols | | |
| Matthew J. Eagan, CFA® | | Class A | | NEFZX |
| Daniel J. Fuss, CFA®, CIC | | Class B | | NEZBX |
| Elaine M. Stokes | | Class C | | NECZX |
| Loomis, Sayles & Company, L.P. | | Class N | | NEZNX |
| | Class Y | | NEZYX |
| | Admin Class | | NEZAX |
Objective
The Fund seeks high current income with a secondary objective of capital growth.
Market Conditions
Falling commodity prices and a strengthening U.S. dollar characterized the reporting period. Commodity prices declined significantly, with oil falling approximately 50%. The U.S. dollar generally advanced versus most currencies due to global divergence of economic growth and central bank policy. Most emerging market currencies declined versus their developed market counterparts, and commodity exporters were the hardest hit.
In the second half of the period, the world’s two largest economies — the U.S. and China — dominated the landscape. Investors generally expected the Federal Reserve (the Fed) to tighten monetary policy in September, but the Fed kept short-term rates unchanged due to global economic and market turbulence triggered by China’s economic slowdown. The market interpreted the Fed’s decision as confirmation of global growth risks, which further strained commodities, emerging markets and other risk assets.
Developed market government bonds posted positive local currency returns, benefiting from investor risk aversion caused by sluggish global demand and commodity price weakness. Pressures from a rising U.S. dollar largely hampered returns for U.S. dollar-based investors. Investment grade corporates underperformed government bonds. However, slower growth in China, commodity price pressures and uncertainty about the Fed rate increase weighed more heavily on high yield and commodity-related bonds.
Performance Results
For the 12 months ended September 30, 2015, Class A shares of the Loomis Sayles Strategic Income Fund returned -6.88% at net asset value. The Fund underperformed its benchmark, the Barclays U.S. Aggregate Bond Index, which returned 2.94%.
Explanation of Fund Performance
The Fund’s underperformance was primarily due to our out-of-benchmark allocations, including non-U.S.-dollar-denominated issues, high yield bonds and common stocks. Within the non-U.S.-dollar allocation, positions denominated in the Canadian dollar were the main laggards, hindered by weak oil and energy prices. A volatile commodities environment and weakening growth in China weighed on positions denominated in the New Zealand dollar, Australian dollar and Mexican peso. High yield bonds were generally
1 |
weak during the 12-month period, and our exposure among industrial issues detracted from results. In addition, equity market volatility hurt performance within our common stock and equity-linked allocations. Technology and energy stocks were the primary laggards. The Fund’s significant underweight positioning in the Treasury sector weighed negatively on relative performance; we held short-maturity Treasuries as reserves.
Our underweight allocation to investment grade industrial issues aided relative results. Holdings in the paper and technology industries generally delivered the best performance within this allocation. Though high yield issues were generally poor performers, a small allocation to high yield utilities contributed modestly to Fund performance.
Outlook
We continue to have a positive outlook for the U.S. economy, despite some recent softer data. Steady improvement in employment and consumer sentiment should support consumption trends. We do not believe current low rates reflect the state of the U.S. economy. However, uncertainty about Chinese growth and weakening global economic trends may delay U.S. monetary policy changes. We believe the path for rates, which is likely to be very slow and shallow, is more important than timing. The downside risks to global growth have increased in our view; however, we believe conditions will remain reasonably strong overall.
The steady pace of U.S. economic growth should support risk assets, and we are maintaining exposure to corporate bonds. We view the investment grade and high yield markets as being distorted by global, not U.S., factors, and spread widening over the past 12 months has significantly improved valuations.
Risk profiles in non-U.S. markets should continue to be driven by oil prices, a strengthening U.S. dollar and central bank action. We are monitoring cheaper non-U.S.-dollar asset valuations, but we remain cautious. Since we do not see a positive catalyst at this point, we think it is too early to add exposure.
Our long-term themes remain intact, and we believe we are well positioned for this market environment. We have been investing away from the benchmark in sectors with low or negative correlations to U.S. rates. We are using portfolio flexibility to identify attractive income opportunities, broaden diversification and maintain a higher level of reserves. Our antidote for highly volatile markets is a patient, selective approach that seeks to capture value when investors are mispricing risk.
| 2
LOOMIS SAYLES STRATEGIC INCOME FUND
Growth of $10,000 Investment in Class A Shares5
September 30, 2005 through September 30, 2015
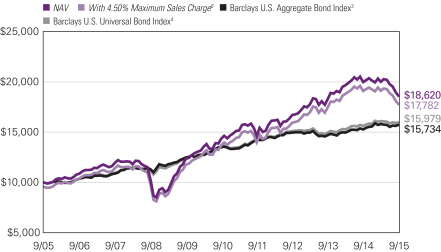
3 |
Average Annual Total Returns — September 30, 20155
| | | | | | | | | | | | | | | | |
| | | | | |
| | | 1 Year | | | 5 Years | | | 10 Years | | | Life of Class N | |
| | | | | |
| Class A (Inception 5/1/95) | | | | | | | | | | | | | | | | |
| NAV | | | -6.88 | % | | | 5.36 | % | | | 6.42 | % | | | — | % |
| With 4.50% Maximum Sales Charge6 | | | -11.08 | | | | 4.40 | | | | 5.93 | | | | — | |
| | | | | |
| Class B (Inception 5/1/95) | | | | | | | | | | | | | | | | |
| NAV | | | -7.62 | | | | 4.57 | | | | 5.62 | | | | — | |
| With CDSC2 | | | -12.02 | | | | 4.23 | | | | 5.62 | | | | — | |
| | | | | |
| Class C (Inception 5/1/95) | | | | | | | | | | | | | | | | |
| NAV | | | -7.60 | | | | 4.57 | | | | 5.62 | | | | — | |
| With CDSC2 | | | -8.48 | | | | 4.57 | | | | 5.62 | | | | — | |
| | | | | |
| Class N (Inception 2/1/13) | | | | | | | | | | | | | | | | |
| NAV | | | -6.58 | | | | — | | | | — | | | | 2.43 | |
| | | | | |
| Class Y (Inception 12/1/99) | | | | | | | | | | | | | | | | |
| NAV | | | -6.65 | | | | 5.63 | | | | 6.69 | | | | — | |
| | | | | |
| Admin Class (Inception 2/1/10)1 | | | | | | | | | | | | | | | | |
| NAV | | | -7.13 | | | | 5.11 | | | | 6.13 | | | | — | |
| | | | | |
| Comparative Performance | | | | | | | | | | | | | | | | |
| Barclays U.S. Aggregate Bond Index3 | | | 2.94 | | | | 3.10 | | | | 4.64 | | | | 2.15 | |
| Barclays U.S. Universal Bond Index4 | | | 2.33 | | | | 3.36 | | | | 4.80 | | | | 2.15 | |
Past performance does not guarantee future results. The table(s) do not reflect taxes shareholders might owe on any Fund distributions or when they redeem their shares. Performance for periods less than one year is cumulative, not annualized. Returns reflect changes in share price and reinvestment of dividends and capital gains, if any. Unlike a fund, an index is not managed and does not reflect fees and expenses. It is not possible to invest directly in an index.
| 1 | Prior to the inception of Admin Class shares (2/1/10), performance is that of Class A shares, restated to reflect the higher net expenses of Admin Class shares. |
| 2 | Performance for Class B shares assumes a maximum 5% contingent deferred sales charge (“CDSC”) applied when you sell shares, which declines annually between years 1-6 according to the following schedule: 5, 4, 3, 3, 2, 1, 0%. Class C share performance assumes a 1% CDSC applied when you sell shares within one year of purchase. |
| 3 | Barclays U.S. Aggregate Bond Index is an unmanaged index that covers the U.S.-dollar denominated, investment-grade, fixed-rate, taxable bond market of SEC-registered securities. The index includes bonds from the Treasury, government-related, corporate, mortgage-backed securities, asset-backed securities, and collateralized mortgage-backed securities sectors. |
| 4 | Barclays U.S. Universal Bond Index is an unmanaged index that covers U.S. dollar-denominated taxable bonds, including U.S. government and investment grade debt, non-investment grade debt, asset-backed and mortgage-backed securities, Eurobonds, 144A securities and emerging market debt. |
| 5 | Fund performance has been increased by fee waivers and/or expense reimbursements, if any, without which performance would have been lower. |
| 6 | Effective November 2, 2015, the maximum sales charge on purchases of Class A shares was reduced to 4.25%. See Note 10 of Notes to Financial Statements. |
| 4
ADDITIONAL INFORMATION
The views expressed in this report reflect those of the portfolio managers as of the dates indicated. The managers’ views are subject to change at any time without notice based on changes in market or other conditions. References to specific securities or industries should not be regarded as investment advice. Because the Fund is actively managed, there is no assurance that it will continue to invest in the securities or industries mentioned.
ADDITIONAL INDEX INFORMATION
This document may contain references to third party copyrights, indexes, and trademarks, each of which is the property of its respective owner. Such owner is not affiliated with Natixis Global Asset Management or any of its related or affiliated companies (collectively “NGAM”) and does not sponsor, endorse or participate in the provision of any NGAM services, funds or other financial products.
The index information contained herein is derived from third parties and is provided on an “as is” basis. The user of this information assumes the entire risk of use of this information. Each of the third party entities involved in compiling, computing or creating index information disclaims all warranties (including, without limitation, any warranties of originality, accuracy, completeness, timeliness, non-infringement, merchantability and fitness for a particular purpose) with respect to such information.
PROXY VOTING INFORMATION
A description of the Fund’s proxy voting policies and procedures is available without charge, upon request, by calling Natixis Funds at 800-225-5478; on the Fund’s website at ngam.natixis.com; and on the Securities and Exchange Commission’s (“SEC’s”) website at www.sec.gov. Information regarding how the Fund voted proxies relating to portfolio securities during the 12 months ended June 30, 2015 is available from the Fund’s website and the SEC’s website.
QUARTERLY PORTFOLIO SCHEDULES
The Fund files a complete schedule of portfolio holdings with the SEC for the first and third quarters of each fiscal year on Form N-Q. The Fund’s Forms N-Q are available on the SEC’s website at www.sec.gov and may be reviewed and copied at the SEC’s Public Reference Room in Washington, DC. Information on the operation of the Public Reference Room may be obtained by calling 800-SEC-0330.
5 |
UNDERSTANDING YOUR FUND’S EXPENSES
As a mutual fund shareholder, you incur different types of costs: transaction costs, including sales charges (loads) on purchases and contingent deferred sales charges on redemptions; and ongoing costs, including management fees, distribution fees (12b-1 fees) and/or service fees, and other fund expenses. Certain exemptions may apply. These costs are described in more detail in the Fund’s prospectus. The following examples are intended to help you understand the ongoing costs of investing in the Fund and help you compare these with the ongoing costs of investing in other mutual funds.
The first line in the table for each class of Fund shares shows the actual account values and actual Fund expenses you would have paid on a $1,000 investment in the Fund from April 1, 2015 through September 30, 2015. To estimate the expenses you paid over the period, simply divide your account value by $1,000 (for example $8,600 account value divided by $1,000 =8.60) and multiply the result by the number in Expenses Paid During Period column as shown below for your class.
The second line in the table for each class of Fund shares provides information about hypothetical account values and hypothetical expenses based on the Fund’s actual expense ratios and an assumed rate of return of 5% per year before expenses, which is not the Fund’s actual return. The hypothetical account values and expenses may not be used to estimate the actual ending account balance or expenses you paid on your investment for the period. You may use this information to compare the ongoing costs of investing in the Fund to other funds. To do so, compare this 5% hypothetical example with the 5% hypothetical examples that appear in the shareholder reports of the other funds.
Please note that the expenses shown reflect ongoing costs only, and do not include any transaction costs. Therefore, the second line in the table is useful in comparing ongoing costs only, and will not help you determine the relative costs of owning different funds. If transaction costs were included, total costs would be higher.
| 6
| | | | | | | | | | | | |
| LOOMIS SAYLES STRATEGIC INCOME FUND | | BEGINNING
ACCOUNT VALUE
4/1/2015 | | | ENDING
ACCOUNT VALUE
9/30/2015 | | | EXPENSES PAID
DURING PERIOD*
4/1/2015 – 9/30/2015 | |
| Class A | | | | | | | | | | | | |
| Actual | | | $1,000.00 | | | | $929.70 | | | | $4.55 | |
| Hypothetical (5% return before expenses) | | | $1,000.00 | | | | $1,020.36 | | | | $4.76 | |
| Class B | | | | | | | | | | | | |
| Actual | | | $1,000.00 | | | | $925.80 | | | | $8.11 | |
| Hypothetical (5% return before expenses) | | | $1,000.00 | | | | $1,016.65 | | | | $8.49 | |
| Class C | | | | | | | | | | | | |
| Actual | | | $1,000.00 | | | | $926.00 | | | | $8.16 | |
| Hypothetical (5% return before expenses) | | | $1,000.00 | | | | $1,016.60 | | | | $8.54 | |
| Class N | | | | | | | | | | | | |
| Actual | | | $1,000.00 | | | | $931.20 | | | | $3.00 | |
| Hypothetical (5% return before expenses) | | | $1,000.00 | | | | $1,021.96 | | | | $3.14 | |
| Class Y | | | | | | | | | | | | |
| Actual | | | $1,000.00 | | | | $930.90 | | | | $3.34 | |
| Hypothetical (5% return before expenses) | | | $1,000.00 | | | | $1,021.61 | | | | $3.50 | |
| Admin Class | | | | | | | | | | | | |
| Actual | | | $1,000.00 | | | | $928.40 | | | | $5.75 | |
| Hypothetical (5% return before expenses) | | | $1,000.00 | | | | $1,019.10 | | | | $6.02 | |
| * | Expenses are equal to the Fund's annualized expense ratio: 0.94%, 1.68%, 1.69%, 0.62%, 0.69% and 1.19% for Class A, B, C, N, Y and Admin Class, respectively, multiplied by the average account value over the period, multiplied by the number of days in the most recent fiscal half-year (183), divided by 365 (to reflect the half-year period). |
7 |
BOARD APPROVAL OF THE EXISTING ADVISORY AGREEMENT
The Board of Trustees of the Trust (the “Board”), including the Independent Trustees, considers matters bearing on the Fund’s advisory agreement (the “Agreement”) at most of its meetings throughout the year. Each year, usually in the spring, the Contract Review Committee of the Board meets to review the Agreement to determine whether to recommend that the full Board approve the continuation of the Agreement, typically for an additional one-year period. After the Committee has made its recommendation, the full Board, including the Independent Trustees, determines whether to approve the continuation of the Agreement.
In connection with these meetings, the Trustees receive materials that the Fund’s investment adviser (the “Adviser”) believes to be reasonably necessary for the Trustees to evaluate the Agreement. These materials generally include, among other items, (i) information on the investment performance of the Fund and the performance of a peer group of funds and the Fund’s performance benchmarks, (ii) information on the Fund’s advisory fee and other expenses, including information comparing the Fund’s expenses to the fees charged to institutional accounts with similar strategies managed by the Adviser, if any, and to those of a peer group of funds and information about any applicable expense caps and/or fee “breakpoints,” (iii) sales and redemption data in respect of the Fund, (iv) information about the profitability of the Agreement to the Adviser and (v) information obtained through the completion by the Adviser of a questionnaire distributed on behalf of the Trustees. The Board, including the Independent Trustees, also considers other matters such as (i) the Adviser’s financial results and financial condition, (ii) the Fund’s investment objective and strategies and the size, education and experience of the Adviser’s investment staff and its use of technology, external research and trading cost measurement tools, (iii) arrangements in respect of the distribution of the Fund’s shares and the related costs, (iv) the procedures employed to determine the value of the Fund’s assets, (v) the allocation of the Fund’s brokerage, if any, including, if applicable, allocations to brokers affiliated with the Adviser and the use of “soft” commission dollars to pay Fund expenses and to pay for research and other similar services, (vi) the resources devoted to, and the record of compliance with, the Fund’s investment policies and restrictions, policies on personal securities transactions and other compliance policies, (vii) information about amounts invested by the Fund’s portfolio managers in the Fund or in similar accounts that they manage and (viii) the general economic outlook with particular emphasis on the mutual fund industry. Throughout the process, the Trustees are afforded the opportunity to ask questions of and request additional materials from the Adviser.
In addition to the materials requested by the Trustees in connection with their annual consideration of the continuation of the Agreement, the Trustees receive materials in advance of each regular quarterly meeting of the Board that provide detailed information about the Fund’s investment performance and the fees charged to the Fund for advisory and other services. This information generally includes, among other things, an internal performance rating for the Fund based on agreed-upon criteria, graphs showing the Fund’s performance and fee differentials against the Fund’s peer group/category, performance ratings provided by a third-party, total return information for various periods, and third-party performance rankings
| 8
for various periods comparing the Fund against similarly categorized funds. The portfolio management team for the Fund or other representatives of the Adviser make periodic presentations to the Contract Review Committee and/or the full Board, and if the Fund is identified as presenting possible performance concerns it may be subject to more frequent board presentations and reviews. In addition, each quarter the Trustees are provided with detailed statistical information about the Fund’s portfolio. The Trustees also receive periodic updates between meetings.
The Board most recently approved the continuation of the Agreement at its meeting held in June 2015. The Agreement was continued for a one-year period for the Fund. In considering whether to approve the continuation of the Agreement, the Board, including the Independent Trustees, did not identify any single factor as determinative. Individual Trustees may have evaluated the information presented differently from one another, giving different weights to various factors. Matters considered by the Trustees, including the Independent Trustees, in connection with their approval of the Agreement included, but were not limited to, the factors listed below.
The nature, extent and quality of the services provided to the Fund under the Agreement. The Trustees considered the nature, extent and quality of the services provided by the Adviser and its affiliates to the Fund and the resources dedicated to the Fund by the Adviser and its affiliates.
The Trustees considered not only the advisory services provided by the Adviser to the Fund, but also the monitoring and oversight services provided by NGAM Advisors, L.P. (“NGAM Advisors”). They also considered the administrative services provided by NGAM Advisors and its affiliates to the Fund. The Trustees also considered the benefits to shareholders of investing in a mutual fund that is part of a family of funds that offers shareholders the right to exchange shares of one type of fund for shares of another type of fund, and provides a variety of fund and shareholder services.
After reviewing these and related factors, the Trustees concluded, within the context of their overall conclusions regarding the Agreement, that the nature, extent and quality of services provided supported the renewal of the Agreement.
Investment performance of the Fund and the Adviser. As noted above, the Trustees received information about the performance of the Fund over various time periods, including information that compared the performance of the Fund to the performance of a peer group and category of funds and the Fund’s performance benchmarks. In addition, the Trustees also reviewed data prepared by an independent third party that analyzed the performance of the Fund using a variety of performance metrics, including metrics that also measured the performance of the Fund on a risk adjusted basis. The Board concluded that the Fund’s performance or other relevant factors supported the renewal of the Agreement.
The Trustees also considered the Adviser’s performance and reputation generally, the performance of the fund family generally, and the historical responsiveness of the Adviser to Trustee concerns about performance and the willingness of the Adviser to take steps intended to improve performance.
After reviewing these and related factors, the Trustees concluded, within the context of their overall conclusions regarding each of the Agreement, that the performance of the
9 |
Fund and the Adviser and/or other relevant factors supported the renewal of the Agreement.
The costs of the services to be provided and profits to be realized by the Adviser and its affiliates from their respective relationships with the Fund. The Trustees considered the fees charged to the Fund for advisory services as well as the total expense levels of the Fund. This information included comparisons (provided both by management and also by an independent third party) of the Fund’s advisory fee and total expense levels to those of its peer group and information about the advisory fees charged by the Adviser to comparable accounts (such as institutional separate accounts), as well as information about differences in such fees and the reasons for any such differences. In considering the fees charged to comparable accounts, the Trustees considered, among other things, management’s representations about the differences between managing mutual funds as compared to other types of accounts, including the additional resources required to effectively manage mutual fund assets and the greater regulatory costs associated with the management of such assets. In evaluating the Fund’s advisory fee, the Trustees also took into account the demands, complexity and quality of the investment management of the Fund, as well as the need for the Adviser to offer competitive compensation and to expend additional resources as the Fund grows in size. The Trustees considered that over the past several years, management had made recommendations regarding reductions in advisory fee rates, implementation of advisory fee breakpoints and the institution of advisory fee waivers and expense caps for various funds in the fund family. They noted that the Fund has an expense cap in place, and the Trustees considered that the current expenses are below the cap.
The Trustees also considered the compensation directly or indirectly received by the Adviser and its affiliates from their relationships with the Fund. The Trustees reviewed information provided by management as to the profitability of the Adviser’s and its affiliates’ relationships with the Fund, and information about the allocation of expenses used to calculate profitability. The Trustees also considered information about investments the Adviser had made to support the Fund’s investment strategy. They also reviewed information provided by management about the effect of distribution costs and changes in asset levels on Adviser profitability, including information regarding resources spent on distribution activities. When reviewing profitability, the Trustees also considered information about court cases in which adviser compensation or profitability were issues, the performance of the Fund, the expense levels of the Fund, whether the Adviser had implemented breakpoints and/or expense caps with respect to the Fund and the overall profit margin of the Adviser compared to other investment managers.
After reviewing these and related factors, the Trustees concluded, within the context of their overall conclusions regarding the Agreement, that the advisory fee charged to the Fund was fair and reasonable, and that the costs of these services generally and the related profitability of the Adviser and its affiliates in respect of their relationships with the Fund supported the renewal of the Agreement.
Economies of Scale. The Trustees considered the existence of any economies of scale in the provision of services by the Adviser and whether those economies are shared with the Fund through breakpoints in its investment advisory fee or other means, such as expense waivers or caps. The Trustees also discussed with management the factors considered with respect to the implementation of breakpoints in investment advisory fees or expense waivers or caps
| 10
for certain funds. Management explained that a number of factors are taken into account in considering the possible implementation of breakpoints or an expense cap for a fund, including, among other things, factors such as a fund’s assets, the projected growth of a fund, projected profitability and a fund’s fees and performance. With respect to economies of scale, the Trustees noted the Fund is subject to breakpoints in its advisory fee. The Trustees further noted that the Fund was subject to an expense cap. In considering these issues, the Trustees also took note of the costs of the services provided (both on an absolute and a relative basis) and the profitability to the Adviser and its affiliates of their relationships with the Fund, as discussed above.
After reviewing these and related factors, the Trustees concluded, within the context of their overall conclusions regarding the Agreement, that the extent to which economies of scale were shared with the Fund supported the renewal of the Agreement.
The Trustees also considered other factors, which included but were not limited to the following:
| · | | The effect of recent market and economic events on the performance, asset levels and expense ratios of the Fund. |
| · | | Whether the Fund has operated in accordance with its investment objective and the Fund’s record of compliance with its investment restrictions, and the compliance programs of the Fund and the Adviser. They also considered the compliance-related resources the Adviser and its affiliates were providing to the Fund. |
| · | | Plans for maintaining continuity of portfolio management where that was thought to be a potential issue. |
| · | | The nature, quality, cost and extent of administrative and shareholder services performed by the Adviser and its affiliates, both under the Agreement and under a separate agreement covering administrative services. |
| · | | So-called “fallout benefits” to the Adviser, such as the engagement of affiliates of the Adviser to provide distribution, administrative and brokerage services to the Fund, and the benefits of research made available to the Adviser by reason of brokerage commissions (if any) generated by the Fund’s securities transactions. The Trustees also considered the benefits to the parent company of NGAM Advisors from the retention of the Adviser. The Trustees considered the possible conflicts of interest associated with these fallout and other benefits, and the reporting, disclosure and other processes in place to disclose and monitor such possible conflicts of interest. |
| · | | The Trustees’ review and discussion of the Fund’s advisory arrangements in prior years, and management’s record of responding to Trustee concerns raised during the year and in prior years. |
Based on their evaluation of all factors that they deemed to be material, including those factors described above, and assisted by the advice of independent counsel, the Trustees, including the Independent Trustees, concluded that the existing Agreement should be continued through June 30, 2016.
11 |
Portfolio of Investments – as of September 30, 2015
Loomis Sayles Strategic Income Fund
| | | | | | | | |
Principal
Amount (‡) | | | Description | | Value (†) | |
| | Bonds and Notes — 70.6% of Net Assets | | | | |
| | Non-Convertible Bonds — 63.1% | | | | |
| | | | ABS Car Loan — 0.0% | | | | |
| $ | 4,093,750 | | | Avis Budget Rental Car Funding AESOP LLC, Series 2010-5A, Class B, 5.110%, 3/20/2017, 144A | | $ | 4,133,586 | |
| | | | | | | | |
| | | | ABS Other — 0.5% | | | | |
| | 21,886,191 | | | GCA2014 Holdings Ltd., Series 2014-1, Class C, 6.000%, 1/05/2030, 144A(b)(c) | | | 21,886,191 | |
| | 7,957,381 | | | GCA2014 Holdings Ltd., Series 2014-1, Class D, 7.500%, 1/05/2030, 144A(b)(c) | | | 7,957,381 | |
| | 42,000,000 | | | GCA2014 Holdings Ltd., Series 2014-1, Class E, Zero Coupon, 1/05/2030, 144A(b)(c)(d) | | | 24,000,834 | |
| | 12,486,910 | | | Global Container Assets Ltd., Series 2015-1A, Class B, 4.500%, 2/05/2030, 144A | | | 12,636,215 | |
| | | | | | | | |
| | | | | | | 66,480,621 | |
| | | | | | | | |
| | | | Aerospace & Defense — 0.8% | | | | |
| | 620,000 | | | Bombardier, Inc., 7.350%, 12/22/2026, 144A, (CAD) | | | 347,865 | |
| | 11,800,000 | | | Bombardier, Inc., 7.450%, 5/01/2034, 144A | | | 7,906,000 | |
| | 16,246,000 | | | KLX, Inc., 5.875%, 12/01/2022, 144A | | | 15,804,271 | |
| | 22,548,000 | | | Meccanica Holdings USA, Inc., 6.250%, 1/15/2040, 144A | | | 21,646,080 | |
| | 20,755,000 | | | Meccanica Holdings USA, Inc., 7.375%, 7/15/2039, 144A | | | 21,896,525 | |
| | 5,310,000 | | | Textron Financial Corp., (fixed rate to 2/15/2017, variable rate thereafter), 6.000%, 2/15/2067, 144A | | | 4,261,275 | |
| | 24,513,000 | | | TransDigm, Inc., 6.500%, 7/15/2024 | | | 23,038,543 | |
| | 17,765,000 | | | TransDigm, Inc., 6.500%, 5/15/2025, 144A | | | 16,699,100 | |
| | | | | | | | |
| | | | | | | 111,599,659 | |
| | | | | | | | |
| | | | Airlines — 3.0% | | | | |
| | 13,620,000 | | | Air Canada, 7.625%, 10/01/2019, 144A, (CAD) | | | 10,843,949 | |
| | 4,614,033 | | | Air Canada Pass Through Trust, Series 2013-1, Class B, 5.375%, 11/15/2022, 144A | | | 4,740,919 | |
| | 174,725,000 | | | American Airlines Group, Inc., 5.500%, 10/01/2019, 144A | | | 176,646,975 | |
| | 13,146,340 | | | American Airlines Pass Through Trust, Series 2013-1, Class A, 4.000%, 1/15/2027 | | | 13,355,893 | |
| | 2,389,246 | | | American Airlines Pass Through Trust, Series 2013-1, Class B, 5.625%, 1/15/2021, 144A | | | 2,426,135 | |
| | 10,288,467 | | | American Airlines Pass Through Trust, Series 2013-2, Class C, 6.000%, 1/15/2017, 144A | | | 10,577,984 | |
| | 2,823,638 | | | Continental Airlines Pass Through Certificates, Series 2012-2, Class B, 5.500%, 4/29/2022 | | | 2,922,946 | |
| | 21,015,000 | | | Continental Airlines Pass Through Certificates, Series 2012-3, Class C, 6.125%, 4/29/2018 | | | 21,803,062 | |
| | 283,816 | | | Continental Airlines Pass Through Trust, Series 1997-4, Class B, 6.900%, 7/02/2018 | | | 291,791 | |
| | 954,674 | | | Continental Airlines Pass Through Trust, Series 1999-1, Class B, 6.795%, 2/02/2020 | | | 1,007,182 | |
| | 529,569 | | | Continental Airlines Pass Through Trust, Series 1999-2, Class B, 7.566%, 9/15/2021 | | | 540,160 | |
See accompanying notes to financial statements.
| 12
Portfolio of Investments – as of September 30, 2015
Loomis Sayles Strategic Income Fund – (continued)
| | | | | | | | |
Principal
Amount (‡) | | | Description | | Value (†) | |
| | | | Airlines — continued | | | | |
| $ | 1,128,292 | | | Continental Airlines Pass Through Trust, Series 2000-2, Class B, 8.307%, 10/02/2019 | | $ | 1,195,990 | |
| | 1,811,595 | | | Continental Airlines Pass Through Trust, Series 2001-1, Class A-1, 6.703%, 12/15/2022 | | | 1,897,646 | |
| | 1,063,631 | | | Continental Airlines Pass Through Trust, Series 2001-1, Class B, 7.373%, 6/15/2017 | | | 1,066,290 | |
| | 4,141,463 | | | Continental Airlines Pass Through Trust, Series 2007-1, Class B, 6.903%, 10/19/2023 | | | 4,369,243 | |
| | 13,656,810 | | | Continental Airlines Pass Through Trust, Series 2009-1, 9.000%, 1/08/2018 | | | 14,350,030 | |
| | 3,173,232 | | | Continental Airlines Pass Through Trust, Series 2012-1, Class B, 6.250%, 10/11/2021 | | | 3,308,095 | |
| | 814,665 | | | Northwest Airlines, Inc., Series 2002-1, Class G2, (MBIA insured), 6.264%, 5/20/2023 | | | 847,741 | |
| | 14,395,474 | | | UAL Pass Through Trust, Series 2007-1, Class A, 6.636%, 1/02/2024 | | | 15,339,817 | |
| | 351,439 | | | UAL Pass Through Trust, Series 2009-1, 10.400%, 5/01/2018 | | | 376,672 | |
| | 9,585,000 | | | United Airlines Pass Through Trust, Series 2014-1, Class B, 4.750%, 10/11/2023 | | | 9,608,963 | |
| | 10,375,000 | | | United Airlines Pass Through Trust, Series 2014-2, Class B, 4.625%, 3/03/2024 | | | 10,323,125 | |
| | 9,905,714 | | | US Airways Pass Through Trust, Series 2010-1B, Class B, 8.500%, 10/22/2018 | | | 10,306,003 | |
| | 40,645,067 | | | US Airways Pass Through Trust, Series 2011-1B, Class B, 9.750%, 4/22/2020 | | | 46,132,152 | |
| | 6,295,953 | | | US Airways Pass Through Trust, Series 2012-1B, Class B, 8.000%, 4/01/2021 | | | 7,067,207 | |
| | 2,400,341 | | | US Airways Pass Through Trust, Series 2012-1C, Class C, 9.125%, 10/01/2015 | | | 2,400,581 | |
| | 4,447,767 | | | US Airways Pass Through Trust, Series 2013-1, Class B, 5.375%, 5/15/2023 | | | 4,592,319 | |
| | 48,950,000 | | | Virgin Australia Holdings Ltd., 8.500%, 11/15/2019, 144A | | | 50,296,125 | |
| | 4,996,421 | | | Virgin Australia Pass Through Trust, Series 2013-1B, 6.000%, 4/23/2022, 144A | | | 5,121,332 | |
| | 7,991,978 | | | Virgin Australia Pass Through Trust, Series 2013-1C, 7.125%, 10/23/2018, 144A | | | 8,111,858 | |
| | | | | | | | |
| | | | | | | 441,868,185 | |
| | | | | | | | |
| | | | Automotive — 0.4% | | | | |
| | 1,220,000 | | | Ford Motor Co., 6.625%, 2/15/2028 | | | 1,378,283 | |
| | 2,365,000 | | | Ford Motor Co., 7.125%, 11/15/2025 | | | 2,813,449 | |
| | 1,345,000 | | | Ford Motor Co., 7.500%, 8/01/2026 | | | 1,624,237 | |
| | 29,265,000 | | | General Motors Financial Co., Inc., 4.375%, 9/25/2021 | | | 29,879,038 | |
| | 4,977,000 | | | Goodyear Tire & Rubber Co. (The), 7.000%, 3/15/2028 | | | 5,200,965 | |
| | 25,345,000 | | | Midas Intermediate Holdco II LLC/Midas Intermediate Holdco II Finance, Inc., 7.875%, 10/01/2022, 144A | | | 24,711,375 | |
| | | | | | | | |
| | | | | | | 65,607,347 | |
| | | | | | | | |
See accompanying notes to financial statements.
13 |
Portfolio of Investments – as of September 30, 2015
Loomis Sayles Strategic Income Fund – (continued)
| | | | | | | | |
Principal
Amount (‡) | | | Description | | Value (†) | |
| | | | Banking — 5.4% | | | | |
| $ | 29,332,000 | | | Ally Financial, Inc., 8.000%, 11/01/2031 | | $ | 33,979,362 | |
| | 63,900,000 | | | Banco Santander Brasil S.A., 8.000%, 3/18/2016, 144A, (BRL) | | | 15,312,145 | |
| | 7,045,000 | | | Bank of America Corp., MTN, 3.300%, 1/11/2023 | | | 6,991,134 | |
| | 265,000 | | | Bank of America Corp., MTN, 4.250%, 10/22/2026 | | | 261,983 | |
| | 1,500,000 | | | Bank of America Corp., Series K, (fixed rate to 1/30/2018, variable rate thereafter), 8.000%(e) | | | 1,567,500 | |
| | 10,000,000 | | | Bank of Nova Scotia, 2.462%, 3/14/2019, (CAD) | | | 7,658,973 | |
| | 57,792,000,000 | | | Barclays Financial LLC, EMTN, 3.500%, 11/29/2016, (KRW) | | | 49,738,273 | |
| | 36,445,000 | | | Citigroup, Inc., 5.130%, 11/12/2019, (NZD) | | | 24,403,789 | |
| | 22,091,000 | | | Citigroup, Inc., 6.250%, 6/29/2017, (NZD) | | | 14,801,629 | |
| | 14,330,000 | | | Cooperatieve Centrale Raiffeisen-Boerenleenbank BA/Netherlands, 3.875%, 2/08/2022 | | | 15,092,313 | |
| | 3,450,000 | | | Cooperatieve Centrale Raiffeisen-Boerenleenbank BA/Netherlands, 3.950%, 11/09/2022 | | | 3,464,894 | |
| | 25,000,000 | | | Goldman Sachs Group, Inc. (The), 3.550%, 2/12/2021, (CAD) | | | 19,582,990 | |
| | 9,090,000 | | | ICICI Bank Ltd., (fixed rate to 4/30/2017, variable rate thereafter), 6.375%, 4/30/2022, 144A | | | 9,207,952 | |
| | 40,305,000 | | | Intesa Sanpaolo SpA, 5.017%, 6/26/2024, 144A | | | 39,772,893 | |
| | 45,620,000 | | | JPMorgan Chase & Co., 4.250%, 11/02/2018, (NZD) | | | 29,673,674 | |
| | 227,000,000,000 | | | JPMorgan Chase Bank NA, 7.700%, 6/01/2016, 144A, (IDR) | | | 14,617,870 | |
| | 27,555,000 | | | Lloyds Bank PLC, MTN, 6.500%, 9/14/2020, 144A | | | 31,781,854 | |
| | 800,000 | | | Merrill Lynch & Co., Inc., Series C, MTN, 6.050%, 6/01/2034(c) | | | 905,306 | |
| | 36,195,000 | | | Morgan Stanley, 4.350%, 9/08/2026 | | | 36,381,259 | |
| | 35,325,000 | | | Morgan Stanley, 4.750%, 11/16/2018, (AUD) | | | 25,727,274 | |
| | 185,000,000 | | | Morgan Stanley, 5.000%, 9/30/2021, (AUD) | | | 137,232,685 | |
| | 74,310,000 | | | Morgan Stanley, 7.600%, 8/08/2017, (NZD) | | | 50,654,199 | |
| | 100,265,000 | | | Morgan Stanley, 8.000%, 5/09/2017, (AUD) | | | 75,504,604 | |
| | 950,000 | | | Morgan Stanley, EMTN, 5.750%, 2/14/2017, (GBP) | | | 1,518,553 | |
| | 79,700,000 | | | Morgan Stanley, GMTN, 7.625%, 3/03/2016, (AUD) | | | 57,046,959 | |
| | 46,735,000 | | | Morgan Stanley, MTN, 4.100%, 5/22/2023 | | | 47,301,101 | |
| | 10,000,000 | | | Morgan Stanley, MTN, 6.250%, 8/09/2026 | | | 12,018,070 | |
| | 53,095,000 | | | Morgan Stanley, Series MPLE, 3.125%, 8/05/2021, (CAD) | | | 40,561,477 | |
| | 700,000 | | | Santander Central Hispano Issuances Ltd., 7.250%, 11/01/2015 | | | 702,603 | |
| | 1,800,000 | | | Santander Issuances SAU, 5.911%, 6/20/2016, 144A | | | 1,842,993 | |
| | | | | | | | |
| | | | | | | 805,306,311 | |
| | | | | | | | |
| | | | Brokerage — 1.0% | | | | |
| | 5,000,000 | | | Jefferies Finance LLC/JFIN Co-Issuer Corp., 6.875%, 4/15/2022, 144A | | | 4,550,000 | |
| | 22,540,000 | | | Jefferies Finance LLC/JFIN Co-Issuer Corp., 7.500%, 4/15/2021, 144A | | | 21,074,900 | |
| | 43,025,000 | | | Jefferies Group LLC, 5.125%, 1/20/2023 | | | 43,109,889 | |
| | 20,010,000 | | | Jefferies Group LLC, 6.250%, 1/15/2036 | | | 18,871,211 | |
| | 15,215,000 | | | Jefferies Group LLC, 6.450%, 6/08/2027 | | | 15,785,182 | |
| | 39,040,000 | | | Jefferies Group LLC, 6.875%, 4/15/2021 | | | 43,875,260 | |
| | | | | | | | |
| | | | | | | 147,266,442 | |
| | | | | | | | |
| | | | Building Materials — 0.5% | | | | |
| | 19,945,000 | | | Atrium Windows & Doors, Inc., 7.750%, 5/01/2019, 144A | | | 14,609,713 | |
| | 6,995,000 | | | Masco Corp., 6.500%, 8/15/2032 | | | 7,169,875 | |
See accompanying notes to financial statements.
| 14
Portfolio of Investments – as of September 30, 2015
Loomis Sayles Strategic Income Fund – (continued)
| | | | | | | | |
Principal
Amount (‡) | | | Description | | Value (†) | |
| | | | Building Materials — continued | | | | |
| $ | 5,320,000 | | | Masco Corp., 7.125%, 3/15/2020 | | $ | 6,131,300 | |
| | 2,630,000 | | | Masco Corp., 7.750%, 8/01/2029 | | | 2,939,025 | |
| | 2,000,000 | | | NCI Building Systems, Inc., 8.250%, 1/15/2023, 144A | | | 2,095,000 | |
| | 32,100,000 | | | Odebrecht Finance Ltd., 8.250%, 4/25/2018, 144A, (BRL) | | | 4,498,615 | |
| | 35,980,000 | | | Owens Corning, 7.000%, 12/01/2036 | | | 42,143,374 | |
| | | | | | | | |
| | | | | | | 79,586,902 | |
| | | | | | | | |
| | | | Cable Satellite — 1.2% | | | | |
| | 850,000 | | | CCO Holdings LLC/CCO Holdings Capital Corp., 5.125%, 5/01/2023, 144A | | | 783,615 | |
| | 975,000 | | | CCO Holdings LLC/CCO Holdings Capital Corp., 5.375%, 5/01/2025, 144A | | | 888,469 | |
| | 3,315,000 | | | CCO Holdings LLC/CCO Holdings Capital Corp., 5.750%, 1/15/2024 | | | 3,165,825 | |
| | 4,360,000 | | | CCO Holdings LLC/CCO Holdings Capital Corp., 5.875%, 5/01/2027, 144A | | | 4,043,900 | |
| | 17,679,000 | | | DISH DBS Corp., 5.875%, 11/15/2024 | | | 15,016,101 | |
| | 11,620,000 | | | Intelsat Jackson Holdings S.A., 5.500%, 8/01/2023 | | | 9,586,500 | |
| | 3,995,000 | | | Intelsat Luxembourg S.A., 6.750%, 6/01/2018 | | | 3,405,737 | |
| | 28,785,000 | | | Intelsat Luxembourg S.A., 7.750%, 6/01/2021 | | | 18,998,100 | |
| | 16,000,000 | | | Intelsat Luxembourg S.A., 8.125%, 6/01/2023 | | | 10,400,000 | |
| | 25,270,000 | | | Shaw Communications, Inc., 5.650%, 10/01/2019, (CAD) | | | 21,235,321 | |
| | 4,835,000 | | | Time Warner Cable, Inc., 4.500%, 9/15/2042 | | | 3,822,662 | |
| | 135,000 | | | Time Warner Cable, Inc., 5.875%, 11/15/2040 | | | 128,497 | |
| | 44,800,000 | | | UPC Holding BV, 6.375%, 9/15/2022, 144A, (EUR) | | | 53,313,369 | |
| | 11,275,000 | | | Videotron Ltd., 5.625%, 6/15/2025, 144A, (CAD) | | | 8,448,857 | |
| | 7,000,000 | | | Virgin Media Finance PLC, 6.000%, 10/15/2024, 144A | | | 6,737,500 | |
| | 20,300,000 | | | VTR Finance BV, 6.875%, 1/15/2024, 144A | | | 18,422,250 | |
| | | | | | | | |
| | | | | | | 178,396,703 | |
| | | | | | | | |
| | | | Chemicals — 2.3% | | | | |
| | 19,810,000 | | | Aruba Investments, Inc., 8.750%, 2/15/2023, 144A | | | 19,810,000 | |
| | 99,610,000 | | | Chemours Co. (The), 6.625%, 5/15/2023, 144A | | | 66,987,725 | |
| | 18,370,000 | | | Chemours Co. (The), 7.000%, 5/15/2025, 144A | | | 12,078,275 | |
| | 85,854,000 | | | Consolidated Energy Finance S.A., 6.750%, 10/15/2019, 144A | | | 81,132,030 | |
| | 20,000,000 | | | Eco Services Operations LLC/Eco Finance Corp., 8.500%, 11/01/2022, 144A | | | 17,800,000 | |
| | 20,070,000 | | | Hercules, Inc., 6.500%, 6/30/2029 | | | 18,514,575 | |
| | 26,164,000 | | | Hexion, Inc., 7.875%, 2/15/2023(c) | | | 13,866,920 | |
| | 6,010,000 | | | Hexion, Inc., 8.875%, 2/01/2018 | | | 4,808,000 | |
| | 8,757,000 | | | Hexion, Inc., 9.200%, 3/15/2021(c) | | | 5,670,157 | |
| | 16,660,000 | | | Hexion, Inc./Hexion Nova Scotia Finance ULC, 9.000%, 11/15/2020 | | | 9,996,000 | |
| | 90,205,000 | | | INVISTA Finance LLC, 4.250%, 10/15/2019, 144A | | | 87,047,825 | |
| | 885,000 | | | TPC Group, Inc., 8.750%, 12/15/2020, 144A | | | 756,675 | |
| | | | | | | | |
| | | | | | | 338,468,182 | |
| | | | | | | | |
| | | | Construction Machinery — 0.1% | | | | |
| | 1,425,000 | | | Joy Global, Inc., 6.625%, 11/15/2036 | | | 1,331,926 | |
| | 5,105,000 | | | United Rentals North America, Inc., 5.750%, 11/15/2024 | | | 4,888,038 | |
| | 11,655,000 | | | United Rentals North America, Inc., 7.625%, 4/15/2022 | | | 12,354,300 | |
| | | | | | | | |
| | | | | | | 18,574,264 | |
| | | | | | | | |
See accompanying notes to financial statements.
15 |
Portfolio of Investments – as of September 30, 2015
Loomis Sayles Strategic Income Fund – (continued)
| | | | | | | | |
Principal
Amount (‡) | | | Description | | Value (†) | |
| | | | Consumer Cyclical Services — 0.1% | | | | |
| $ | 670,000 | | | ServiceMaster Co. LLC (The), 7.100%, 3/01/2018 | | $ | 676,700 | |
| | 5,500,000 | | | ServiceMaster Co. LLC (The), 7.450%, 8/15/2027 | | | 5,527,500 | |
| | | | | | | | |
| | | | | | | 6,204,200 | |
| | | | | | | | |
| | | | Consumer Products — 0.2% | | | | |
| | 11,545,000 | | | Avon Products, Inc., 8.700%, 3/15/2043 | | | 8,173,860 | |
| | 20,395,000 | | | Newell Rubbermaid, Inc., 4.000%, 12/01/2024 | | | 20,733,679 | |
| | | | | | | | |
| | | | | | | 28,907,539 | |
| | | | | | | | |
| | | | Electric — 2.0% | | | | |
| | 5,093,000 | | | AES Corp. (The), 4.875%, 5/15/2023 | | | 4,469,108 | |
| | 23,940,000 | | | AES Corp. (The), 5.500%, 3/15/2024 | | | 21,222,810 | |
| | 10,185,000 | | | AES Corp. (The), 5.500%, 4/15/2025 | | | 9,013,725 | |
| | 40,736,120 | | | Alta Wind Holdings LLC, 7.000%, 6/30/2035, 144A | | | 45,152,486 | |
| | 53,605,030 | | | Bruce Mansfield Unit Pass Through Trust, 6.850%, 6/01/2034 | | | 55,487,638 | |
| | 1,680,384 | | | CE Generation LLC, 7.416%, 12/15/2018 | | | 1,602,666 | |
| | 35,784,000 | | | DPL, Inc., 6.750%, 10/01/2019 | | | 37,125,900 | |
| | 34,530,000 | | | Dynegy, Inc., 7.625%, 11/01/2024 | | | 34,875,300 | |
| | 52,140,000 | | | EDP Finance BV, 4.125%, 1/15/2020, 144A | | | 52,849,938 | |
| | 21,005,000 | | | EDP Finance BV, 4.900%, 10/01/2019, 144A | | | 21,855,702 | |
| | 3,570,000 | | | Empresa Nacional de Electricidad S.A., 7.875%, 2/01/2027 | | | 4,644,749 | |
| | 555,000 | | | Enersis S.A., 7.400%, 12/01/2016 | | | 591,998 | |
| | 534,288 | | | Red Oak Power LLC, Series A, 8.540%, 11/30/2019 | | | 566,345 | |
| | | | | | | | |
| | | | | | | 289,458,365 | |
| | | | | | | | |
| | | | Finance Companies — 4.5% | | | | |
| | 18,527,000 | | | Aviation Capital Group Corp., 6.750%, 4/06/2021, 144A | | | 20,796,557 | |
| | 57,000,000 | | | General Electric Capital Corp., GMTN, 4.250%, 1/17/2018, (NZD) | | | 37,201,512 | |
| | 79,035,000 | | | General Electric Capital Corp., Series A, EMTN, 6.750%, 9/26/2016, (NZD) | | | 52,229,833 | |
| | 25,320,000 | | | General Electric Capital Corp., Series A, GMTN, 5.500%, 2/01/2017, (NZD) | | | 16,667,653 | |
| | 1,435,000 | | | International Lease Finance Corp., 4.625%, 4/15/2021 | | | 1,442,175 | |
| | 10,758,000 | | | International Lease Finance Corp., 5.875%, 8/15/2022 | | | 11,457,270 | |
| | 1,215,000 | | | International Lease Finance Corp., 7.125%, 9/01/2018, 144A | | | 1,336,379 | |
| | 4,525,000 | | | International Lease Finance Corp., 8.250%, 12/15/2020 | | | 5,294,250 | |
| | 6,095,000 | | | iStar, Inc., 4.875%, 7/01/2018 | | | 5,896,913 | |
| | 14,060,000 | | | iStar, Inc., 5.000%, 7/01/2019 | | | 13,357,000 | |
| | 23,175,000 | | | iStar, Inc., 5.850%, 3/15/2017 | | | 23,638,500 | |
| | 19,240,000 | | | iStar, Inc., 7.125%, 2/15/2018 | | | 19,672,900 | |
| | 19,915,000 | | | Ladder Capital Finance Holdings LLLP/Ladder Capital Finance Corp., 7.375%, 10/01/2017 | | | 20,014,575 | |
| | 2,260,000 | | | Navient Corp., 5.875%, 10/25/2024 | | | 1,774,100 | |
| | 19,155,000 | | | Navient Corp., MTN, 6.125%, 3/25/2024 | | | 15,324,000 | |
| | 23,020,000 | | | Navient LLC, 4.875%, 6/17/2019 | | | 20,948,200 | |
| | 22,945,000 | | | Navient LLC, 5.500%, 1/25/2023 | | | 18,198,138 | |
| | 109,950(††) | | | Navient LLC, 6.000%, 12/15/2043 | | | 1,885,276 | |
| | 5,910,000 | | | Navient LLC, MTN, 4.625%, 9/25/2017 | | | 5,802,881 | |
| | 7,780,000 | | | Navient LLC, MTN, 5.500%, 1/15/2019 | | | 7,230,538 | |
See accompanying notes to financial statements.
| 16
Portfolio of Investments – as of September 30, 2015
Loomis Sayles Strategic Income Fund – (continued)
| | | | | | | | |
Principal
Amount (‡) | | | Description | | Value (†) | |
| | | | Finance Companies — continued | | | | |
| $ | 17,600,000 | | | Navient LLC, MTN, 7.250%, 1/25/2022 | | $ | 15,400,000 | |
| | 2,160,000 | | | Navient LLC, MTN, 8.000%, 3/25/2020 | | | 2,068,200 | |
| | 14,465,000 | | | Navient LLC, Series A, MTN, 5.000%, 6/15/2018 | | | 13,814,075 | |
| | 50,910,000 | | | Navient LLC, Series A, MTN, 5.625%, 8/01/2033(c) | | | 32,964,225 | |
| | 39,420,000 | | | Navient LLC, Series A, MTN, 8.450%, 6/15/2018 | | | 40,528,490 | |
| | 51,680,000 | | | Springleaf Finance Corp., 5.250%, 12/15/2019 | | | 50,517,200 | |
| | 136,835,000 | | | Springleaf Finance Corp., 7.750%, 10/01/2021 | | | 146,071,362 | |
| | 55,015,000 | | | Springleaf Finance Corp., 8.250%, 10/01/2023 | | | 59,966,350 | |
| | 10,120,000 | | | Springleaf Finance Corp., MTN, 5.750%, 9/15/2016 | | | 10,283,944 | |
| | | | | | | | |
| | | | | | | 671,782,496 | |
| | | | | | | | |
| | | | Food & Beverage — 0.1% | | | | |
| | 12,300,000 | | | DS Services of America, Inc., 10.000%, 9/01/2021, 144A | | | 14,129,625 | |
| | 4,880,000 | | | Shearer’s Foods LLC/Chip Finance Corp., 9.000%, 11/01/2019, 144A | | | 5,172,800 | |
| | | | | | | | |
| | | | | | | 19,302,425 | |
| | | | | | | | |
| | | | Government Owned – No Guarantee — 0.2% | | | | |
| | 22,160,000 | | | Pertamina Persero PT, 6.450%, 5/30/2044, 144A | | | 19,220,675 | |
| | 26,120,000 | | | Petrobras Global Finance BV, 5.625%, 5/20/2043 | | | 15,998,500 | |
| | | | | | | | |
| | | | | | | 35,219,175 | |
| | | | | | | | |
| | | | Healthcare — 3.4% | | | | |
| | 2,160,000 | | | BioScrip, Inc., 8.875%, 2/15/2021 | | | 1,663,200 | |
| | 2,795,000 | | | HCA Holdings, Inc., 6.250%, 2/15/2021 | | | 2,976,675 | |
| | 144,485,000 | | | HCA, Inc., 5.250%, 4/15/2025 | | | 147,555,306 | |
| | 9,960,000 | | | HCA, Inc., 5.875%, 3/15/2022 | | | 10,682,100 | |
| | 74,561,000 | | | HCA, Inc., 5.875%, 5/01/2023 | | | 77,357,038 | |
| | 14,620,000 | | | HCA, Inc., 7.050%, 12/01/2027 | | | 15,131,700 | |
| | 20,447,000 | | | HCA, Inc., 7.500%, 12/15/2023 | | | 22,798,405 | |
| | 24,215,000 | | | HCA, Inc., 7.500%, 11/06/2033 | | | 25,546,825 | |
| | 46,148,000 | | | HCA, Inc., 7.690%, 6/15/2025 | | | 51,224,280 | |
| | 32,745,000 | | | HCA, Inc., 8.360%, 4/15/2024 | | | 37,820,475 | |
| | 15,815,000 | | | HCA, Inc., MTN, 7.580%, 9/15/2025 | | | 17,317,425 | |
| | 9,492,000 | | | HCA, Inc., MTN, 7.750%, 7/15/2036 | | | 10,061,520 | |
| | 955,000 | | | Tenet Healthcare Corp., 4.375%, 10/01/2021 | | | 931,125 | |
| | 1,495,000 | | | Tenet Healthcare Corp., 4.500%, 4/01/2021 | | | 1,472,575 | |
| | 29,130,000 | | | Tenet Healthcare Corp., 5.000%, 3/01/2019 | | | 28,183,275 | |
| | 25,530,000 | | | Tenet Healthcare Corp., 6.750%, 6/15/2023 | | | 25,338,525 | |
| | 32,559,000 | | | Tenet Healthcare Corp., 6.875%, 11/15/2031 | | | 29,303,100 | |
| | | | | | | | |
| | | | | | | 505,363,549 | |
| | | | | | | | |
| | | | Home Construction — 0.7% | | | | |
| | 3,075,000 | | | Beazer Homes USA, Inc., 7.250%, 2/01/2023 | | | 2,821,313 | |
| | 13,360,000 | | | K. Hovnanian Enterprises, Inc., 5.000%, 11/01/2021 | | | 9,418,800 | |
| | 29,735,000 | | | K. Hovnanian Enterprises, Inc., 8.000%, 11/01/2019, 144A | | | 21,334,862 | |
| | 3,620,000 | | | KB Home, 4.750%, 5/15/2019 | | | 3,479,725 | |
| | 47,260,000 | | | PulteGroup, Inc., 6.000%, 2/15/2035 | | | 46,314,800 | |
| | 13,190,000 | | | PulteGroup, Inc., 6.375%, 5/15/2033 | | | 13,552,725 | |
| | 10,305,000 | | | TRI Pointe Holdings, Inc., 4.375%, 6/15/2019 | | | 10,098,900 | |
See accompanying notes to financial statements.
17 |
Portfolio of Investments – as of September 30, 2015
Loomis Sayles Strategic Income Fund – (continued)
| | | | | | | | |
Principal
Amount (‡) | | | Description | | Value (†) | |
| | | | Home Construction — continued | | | | |
| $ | 195,000 | | | TRI Pointe Holdings, Inc., 5.875%, 6/15/2024 | | $ | 191,100 | |
| | | | | | | | |
| | | | | | | 107,212,225 | |
| | | | | | | | |
| | | | Independent Energy — 1.7% | | | | |
| | 7,550,000 | | | Baytex Energy Corp., 5.125%, 6/01/2021, 144A | | | 6,002,250 | |
| | 6,930,000 | | | Baytex Energy Corp., 5.625%, 6/01/2024, 144A | | | 5,474,700 | |
| | 15,000,000 | | | Bellatrix Exploration Ltd., 8.500%, 5/15/2020, 144A | | | 11,700,000 | |
| | 1,705,000 | | | Bonanza Creek Energy, Inc., 6.750%, 4/15/2021 | | | 1,189,238 | |
| | 4,945,000 | | | California Resources Corp., 5.000%, 1/15/2020 | | | 3,180,228 | |
| | 81,805,000 | | | California Resources Corp., 5.500%, 9/15/2021 | | | 49,901,050 | |
| | 11,240,000 | | | California Resources Corp., 6.000%, 11/15/2024 | | | 6,694,825 | |
| | 1,310,000 | | | Chesapeake Energy Corp., 4.875%, 4/15/2022 | | | 854,775 | |
| | 55,000 | | | Chesapeake Energy Corp., 6.875%, 11/15/2020 | | | 40,425 | |
| | 7,190,000 | | | Continental Resources, Inc., 3.800%, 6/01/2024 | | | 5,831,759 | |
| | 540,000 | | | Continental Resources, Inc., 4.500%, 4/15/2023 | | | 468,923 | |
| | 19,290,000 | | | Eclipse Resources Corp., 8.875%, 7/15/2023, 144A | | | 15,528,450 | |
| | 2,990,000 | | | Halcon Resources Corp., 9.250%, 2/15/2022 | | | 926,900 | |
| | 9,700,000 | | | Halcon Resources Corp., 9.750%, 7/15/2020 | | | 3,298,000 | |
| | 1,975,000 | | | Noble Energy, Inc., 5.625%, 5/01/2021 | | | 1,986,850 | |
| | 1,940,000 | | | Oasis Petroleum, Inc., 6.875%, 1/15/2023 | | | 1,503,500 | |
| | 1,545,000 | | | Oasis Petroleum, Inc., 7.250%, 2/01/2019 | | | 1,363,462 | |
| | 7,170,000 | | | Pan American Energy LLC/Argentine Branch, 7.875%, 5/07/2021, 144A | | | 7,096,149 | |
| | 3,000,000 | | | QEP Resources, Inc., 5.250%, 5/01/2023 | | | 2,508,000 | |
| | 12,635,000 | | | QEP Resources, Inc., 6.875%, 3/01/2021 | | | 11,624,200 | |
| | 14,844,000 | | | Rex Energy Corp., 6.250%, 8/01/2022 | | | 5,937,600 | |
| | 2,343,000 | | | Rex Energy Corp., 8.875%, 12/01/2020 | | | 1,218,360 | |
| | 6,250,000 | | | Rice Energy, Inc., 6.250%, 5/01/2022 | | | 5,574,250 | |
| | 9,700,000 | | | RSP Permian, Inc., 6.625%, 10/01/2022 | | | 9,312,000 | |
| | 17,908,000 | | | Sanchez Energy Corp., 6.125%, 1/15/2023 | | | 11,998,360 | |
| | 9,520,000 | | | Sanchez Energy Corp., 7.750%, 6/15/2021 | | | 7,044,800 | |
| | 8,241,000 | | | SM Energy Co., 5.000%, 1/15/2024 | | | 6,973,946 | |
| | 22,844,000 | | | SM Energy Co., 6.125%, 11/15/2022 | | | 21,153,544 | |
| | 801,000 | | | SM Energy Co., 6.500%, 11/15/2021 | | | 760,950 | |
| | 2,522,000 | | | SM Energy Co., 6.500%, 1/01/2023 | | | 2,345,460 | |
| | 6,283,000 | | | Ultra Petroleum Corp., 5.750%, 12/15/2018, 144A | | | 4,523,760 | |
| | 45,515,000 | | | Ultra Petroleum Corp., 6.125%, 10/01/2024, 144A | | | 25,943,550 | |
| | 10,845,000 | | | Whiting Petroleum Corp., 5.000%, 3/15/2019 | | | 9,435,150 | |
| | | | | | | | |
| | | | | | | 249,395,414 | |
| | | | | | | | |
| | | | Industrial Other — 0.2% | | | | |
| | 7,875,000 | | | AECOM, 5.750%, 10/15/2022, 144A | | | 7,919,336 | |
| | 8,215,000 | | | AECOM, 5.875%, 10/15/2024, 144A | | | 8,276,613 | |
| | 11,370,000 | | | Permian Holdings, Inc., 10.500%, 1/15/2018, 144A | | | 6,310,350 | |
| | 6,880,000 | | | Transfield Services Ltd., 8.375%, 5/15/2020, 144A | | | 7,077,800 | |
| | | | | | | | |
| | | | | | | 29,584,099 | |
| | | | | | | | |
| | | | Integrated Energy — 0.0% | | | | |
| | 5,385,000 | | | Pacific Exploration and Production Corp., 5.125%, 3/28/2023, 144A | | | 1,857,825 | |
See accompanying notes to financial statements.
| 18
Portfolio of Investments – as of September 30, 2015
Loomis Sayles Strategic Income Fund – (continued)
| | | | | | | | |
Principal
Amount (‡) | | | Description | | Value (†) | |
| | | | Integrated Energy — continued | | | | |
| $ | 3,125,000 | | | Pacific Exploration and Production Corp., 5.625%, 1/19/2025, 144A | | $ | 1,092,812 | |
| | | | | | | | |
| | | | | | | 2,950,637 | |
| | | | | | | | |
| | | | Life Insurance — 1.0% | | | | |
| | 4,190,000 | | | American International Group, Inc., 4.875%, 6/01/2022 | | | 4,623,464 | |
| | 21,175,000 | | | AXA S.A., (fixed rate to 12/14/2036, variable rate thereafter), 6.379%, 144A(e) | | | 22,564,715 | |
| | 1,000,000 | | | AXA S.A., EMTN, (fixed rate to 10/16/2019, variable rate thereafter), 6.772%, (GBP)(e) | | | 1,601,245 | |
| | 1,350,000 | | | AXA S.A., EMTN, (fixed rate to 4/16/2020, variable rate thereafter), 5.250%, 4/16/2040, (EUR) | | | 1,651,306 | |
| | 15,000,000 | | | Forethought Financial Group, Inc., 8.625%, 4/15/2021, 144A | | | 17,431,470 | |
| | 1,225,000 | | | Genworth Financial, Inc., (fixed rate to 11/15/2016, variable rate thereafter), 6.150%, 11/15/2066 | | | 558,906 | |
| | 3,695,000 | | | Genworth Holdings, Inc., 4.800%, 2/15/2024 | | | 2,771,250 | |
| | 27,200,000 | | | Genworth Holdings, Inc., 4.900%, 8/15/2023 | | | 21,216,000 | |
| | 10,990,000 | | | Genworth Holdings, Inc., 6.500%, 6/15/2034 | | | 8,572,200 | |
| | 1,475,000 | | | MetLife Capital Trust X, 9.250%, 4/08/2068, 144A | | | 2,035,500 | |
| | 8,145,000 | | | MetLife, Inc., 10.750%, 8/01/2069 | | | 12,706,200 | |
| | 20,000,000 | | | National Life Insurance Co., 10.500%, 9/15/2039, 144A | | | 30,989,120 | |
| | 8,920,000 | | | NLV Financial Corp., 7.500%, 8/15/2033, 144A | | | 10,315,472 | |
| | 3,705,000 | | | Penn Mutual Life Insurance Co. (The), 6.650%, 6/15/2034, 144A | | | 4,400,528 | |
| | | | | | | | |
| | | | | | | 141,437,376 | |
| | | | | | | | |
| | | | Local Authorities — 0.9% | | | | |
| | 95,480,000 | | | New South Wales Treasury Corp., 4.000%, 4/08/2021, (AUD) | | | 72,423,994 | |
| | 82,840,000 | | | New South Wales Treasury Corp., 6.000%, 2/01/2018, (AUD) | | | 63,461,239 | |
| | | | | | | | |
| | | | | | | 135,885,233 | |
| | | | | | | | |
| | | | Media Entertainment — 1.0% | | | | |
| | 111,590,000 | | | Grupo Televisa SAB, EMTN, 7.250%, 5/14/2043, (MXN) | | | 5,574,859 | |
| | 64,250,000 | | | iHeartCommunications, Inc., 9.000%, 3/01/2021 | | | 53,986,063 | |
| | 33,370,000 | | | iHeartCommunications, Inc., 9.000%, 9/15/2022 | | | 27,363,400 | |
| | 7,180,000 | | | Outfront Media Capital LLC/Outfront Media Capital Corp., 5.250%, 2/15/2022 | | | 7,171,025 | |
| | 17,950,000 | | | Outfront Media Capital LLC/Outfront Media Capital Corp., 5.875%, 3/15/2025 | | | 18,264,125 | |
| | 27,185,000 | | | R.R. Donnelley & Sons Co., 6.000%, 4/01/2024 | | | 25,010,200 | |
| | 2,410,000 | | | R.R. Donnelley & Sons Co., 6.500%, 11/15/2023 | | | 2,265,400 | |
| | 3,730,000 | | | R.R. Donnelley & Sons Co., 7.000%, 2/15/2022 | | | 3,618,100 | |
| | 5,925,000 | | | R.R. Donnelley & Sons Co., 7.875%, 3/15/2021 | | | 6,162,000 | |
| | | | | | | | |
| | | | | | | 149,415,172 | |
| | | | | | | | |
| | | | Metals & Mining — 1.6% | | | | |
| | 8,202,122 | | | 1839688 Alberta ULC, PIK, 14.000%, 2/13/2020(b)(c)(f) | | | 2,624,679 | |
| | 2,000,000 | | | AK Steel Corp., 7.625%, 10/01/2021 | | | 1,075,000 | |
| | 3,949,000 | | | Alcoa, Inc., 5.870%, 2/23/2022 | | | 4,067,470 | |
| | 5,075,000 | | | Alcoa, Inc., 5.900%, 2/01/2027 | | | 4,897,375 | |
| | 1,405,000 | | | Alcoa, Inc., 5.950%, 2/01/2037 | | | 1,264,500 | |
See accompanying notes to financial statements.
19 |
Portfolio of Investments – as of September 30, 2015
Loomis Sayles Strategic Income Fund – (continued)
| | | | | | | | |
Principal
Amount (‡) | | | Description | | Value (†) | |
| | | | Metals & Mining — continued | | | | |
| $ | 4,330,000 | | | Alcoa, Inc., 6.750%, 1/15/2028 | | $ | 4,459,900 | |
| | 25,271,000 | | | ArcelorMittal, 7.500%, 3/01/2041 | | | 20,343,155 | |
| | 30,695,000 | | | Barminco Finance Pty Ltd., 9.000%, 6/01/2018, 144A | | | 22,330,612 | |
| | 8,705,000 | | | Barrick North America Finance LLC, 5.750%, 5/01/2043 | | | 7,412,725 | |
| | 8,625,000 | | | Cliffs Natural Resources, Inc., 4.800%, 10/01/2020 | | | 2,630,625 | |
| | 3,980,000 | | | Cliffs Natural Resources, Inc., 4.875%, 4/01/2021 | | | 1,213,900 | |
| | 46,334,000 | | | Cliffs Natural Resources, Inc., 6.250%, 10/01/2040 | | | 13,436,860 | |
| | 20,408,000 | | | Emeco Pty Ltd., 9.875%, 3/15/2019, 144A | | | 10,714,200 | |
| | 26,350,000 | | | Essar Steel Algoma, Inc., 9.500%, 11/15/2019, 144A | | | 14,492,500 | |
| | 12,315,000 | | | First Quantum Minerals Ltd., 7.250%, 5/15/2022, 144A | | | 7,635,300 | |
| | 14,645,000 | | | Lundin Mining Corp., 7.500%, 11/01/2020, 144A | | | 14,169,038 | |
| | 51,000,000 | | | Lundin Mining Corp., 7.875%, 11/01/2022, 144A | | | 48,960,000 | |
| | 4,200,000 | | | Rain CII Carbon LLC/CII Carbon Corp., 8.250%, 1/15/2021, 144A | | | 3,360,000 | |
| | 16,135,000 | | | Russel Metals, Inc., 6.000%, 4/19/2022, 144A, (CAD) | | | 11,909,311 | |
| | 11,719,000 | | | United States Steel Corp., 6.650%, 6/01/2037 | | | 8,326,350 | |
| | 7,490,000 | | | United States Steel Corp., 6.875%, 4/01/2021 | | | 5,692,400 | |
| | 16,435,000 | | | United States Steel Corp., 7.000%, 2/01/2018 | | | 14,750,412 | |
| | 10,000,000 | | | Worthington Industries, Inc., 6.500%, 4/15/2020 | | | 11,383,390 | |
| | | | | | | | |
| | | | | | | 237,149,702 | |
| | | | | | | | |
| | | | Midstream — 0.3% | | | | |
| | 8,935,000 | | | IFM U.S. Colonial Pipeline 2 LLC, 6.450%, 5/01/2021, 144A | | | 9,760,978 | |
| | 23,179,000 | | | NGPL PipeCo LLC, 7.119%, 12/15/2017, 144A | | | 22,020,050 | |
| | 505,000 | | | NGPL PipeCo LLC, 7.768%, 12/15/2037, 144A | | | 424,200 | |
| | 12,790,000 | | | Targa Resources Partners LP/Targa Resources Partners Finance Corp., 5.000%, 1/15/2018, 144A | | | 12,182,475 | |
| | 3,185,492 | | | Transportadora de Gas del Sur S.A., 9.625%, 5/14/2020, 144A | | | 3,177,528 | |
| | | | | | | | |
| | | | | | | 47,565,231 | |
| | | | | | | | |
| | | | Non-Agency Commercial Mortgage-Backed Securities — 1.0% | | | | |
| | 2,820,508 | | | Column Canada Issuer Corp., Series 2006-WEM, Class A1, 4.591%, 1/15/2022, (CAD) | | | 2,130,250 | |
| | 2,785,000 | | | Column Canada Issuer Corp., Series 2006-WEM, Class A2, 4.934%, 1/15/2022, (CAD) | | | 2,141,351 | |
| | 27,611,163 | | | Commercial Mortgage Pass Through Certificates, Series 2014-FL4, Class AR1, 1.907%, 5/13/2031, 144A(c)(g) | | | 27,445,414 | |
| | 12,902,000 | | | Commercial Mortgage Pass Through Certificates, Series 2014-FL4, Class AR2, 2.407%, 5/13/2031, 144A(c)(g) | | | 12,820,872 | |
| | 8,622,000 | | | Commercial Mortgage Pass Through Certificates, Series 2014-FL4, Class AR3, 2.857%, 5/13/2031, 144A(c)(g) | | | 8,568,337 | |
| | 16,080,000 | | | Commercial Mortgage Pass Through Certificates, Series 2014-FL4, Class AR4, 3.957%, 5/13/2031, 144A(c)(g) | | | 15,982,394 | |
| | 35,060,000 | | | GS Mortgage Securities Corp. II, Series 2007-GG10, Class AM, 5.989%, 8/10/2045(g) | | | 35,178,643 | |
| | 15,530,886 | | | Institutional Mortgage Securities Canada, Inc., Series 2014-5A, Class A1, 2.003%, 7/12/2047, 144A, (CAD) | | | 11,704,667 | |
| | 30,100,000 | | | Motel 6 Trust, Series 2015-M6MZ, Class M, 8.230%, 2/05/2020, 144A(c) | | | 30,346,820 | |
| | | | | | | | |
| | | | | | | 146,318,748 | |
| | | | | | | | |
See accompanying notes to financial statements.
| 20
Portfolio of Investments – as of September 30, 2015
Loomis Sayles Strategic Income Fund – (continued)
| | | | | | | | |
Principal
Amount (‡) | | | Description | | Value (†) | |
| | | | Oil Field Services — 0.5% | | | | |
| $ | 19,335,000 | | | FTS International, Inc., 6.250%, 5/01/2022 | | $ | 5,993,850 | |
| | 7,120,000 | | | Global Marine, Inc., 7.000%, 6/01/2028 | | | 4,058,400 | |
| | 5,636,000 | | | Hercules Offshore, Inc., 6.750%, 4/01/2022, 144A(d) | | | 1,127,200 | |
| | 952,000 | | | Hercules Offshore, Inc., 7.500%, 10/01/2021, 144A(d) | | | 190,400 | |
| | 6,101,000 | | | Hercules Offshore, Inc., 8.750%, 7/15/2021, 144A(j) | | | 1,281,210 | |
| | 1,053,000 | | | Hercules Offshore, Inc., 10.250%, 4/01/2019, 144A(d) | | | 221,130 | |
| | 17,482,000 | | | Paragon Offshore PLC, 6.750%, 7/15/2022, 144A | | | 2,272,660 | |
| | 40,403,000 | | | Paragon Offshore PLC, 7.250%, 8/15/2024, 144A | | | 6,312,969 | |
| | 18,385,000 | | | Pioneer Energy Services Corp., 6.125%, 3/15/2022 | | | 10,387,525 | |
| | 12,020,000 | | | Precision Drilling Corp., 5.250%, 11/15/2024 | | | 9,555,900 | |
| | 594,000 | | | Precision Drilling Corp., 6.500%, 12/15/2021 | | | 504,900 | |
| | 2,590,000 | | | Precision Drilling Corp., 6.625%, 11/15/2020 | | | 2,259,775 | |
| | 500,000 | | | Sidewinder Drilling, Inc., 9.750%, 11/15/2019, 144A(b)(c) | | | 205,000 | |
| | 39,300,000 | | | Transocean, Inc., 4.300%, 10/15/2022 | | | 24,267,750 | |
| | 1,500,000 | | | Transocean, Inc., 6.500%, 11/15/2020 | | | 1,147,500 | |
| | 1,320,000 | | | Transocean, Inc., 6.800%, 3/15/2038 | | | 818,400 | |
| | 4,355,000 | | | Transocean, Inc., 6.875%, 12/15/2021 | | | 3,248,481 | |
| | | | | | | | |
| | | | | | | 73,853,050 | |
| | | | | | | | |
| | | | Packaging — 0.0% | | | | |
| | 1,180,000 | | | Beverage Packaging Holdings Luxembourg II S.A./Beverage Packaging Holdings II Issuer, Inc., 6.000%, 6/15/2017, 144A | | | 1,154,925 | |
| | 1,560,000 | | | Sealed Air Corp., 5.500%, 9/15/2025, 144A | | | 1,583,400 | |
| | 1,705,000 | | | Signode Industrial Group Lux S.A./Signode Industrial Group U.S., Inc., 6.375%, 5/01/2022, 144A | | | 1,611,225 | |
| | | | | | | | |
| | | | | | | 4,349,550 | |
| | | | | | | | |
| | | | Paper — 0.8% | | | | |
| | 13,735,000 | | | Georgia-Pacific LLC, 7.250%, 6/01/2028 | | | 17,751,911 | |
| | 42,475,000 | | | Georgia-Pacific LLC, 7.750%, 11/15/2029 | | | 56,769,961 | |
| | 775,000 | | | Georgia-Pacific LLC, 8.875%, 5/15/2031 | | | 1,113,640 | |
| | 4,865,000 | | | MeadWestvaco Corp., 7.950%, 2/15/2031 | | | 6,323,143 | |
| | 19,700,000 | | | MeadWestvaco Corp., 8.200%, 1/15/2030 | | | 27,037,659 | |
| | 2,840,000 | | | Weyerhaeuser Co., 6.950%, 10/01/2027 | | | 3,400,596 | |
| | | | | | | | |
| | | | | | | 112,396,910 | |
| | | | | | | | |
| | | | Property & Casualty Insurance — 0.4% | | | | |
| | 14,855,000 | | | Hanover Insurance Group, Inc. (The), 6.375%, 6/15/2021 | | | 17,165,175 | |
| | 5,640,000 | | | Loews Corp., 2.625%, 5/15/2023 | | | 5,421,134 | |
| | 12,510,000 | | | MBIA Insurance Corp., 11.549%, 1/15/2033, 144A(d)(g) | | | 5,692,050 | |
| | 5,140,000 | | | Old Republic International Corp., 4.875%, 10/01/2024 | | | 5,388,308 | |
| | 11,200,000 | | | Sirius International Group, 6.375%, 3/20/2017, 144A | | | 11,700,170 | |
| | 3,000,000 | | | Sirius International Group, (fixed rate to 6/30/2017, variable rate thereafter), 7.506%, 144A(e) | | | 3,030,000 | |
| | 17,870,000 | | | XL Group PLC, (fixed rate to 4/15/2017, variable rate thereafter), 6.500%(e) | | | 14,188,780 | |
| | 1,020,000 | | | XLIT Ltd., 6.375%, 11/15/2024 | | | 1,209,185 | |
| | | | | | | | |
| | | | | | | 63,794,802 | |
| | | | | | | | |
See accompanying notes to financial statements.
21 |
Portfolio of Investments – as of September 30, 2015
Loomis Sayles Strategic Income Fund – (continued)
| | | | | | | | |
Principal
Amount (‡) | | | Description | | Value (†) | |
| | | | Railroads — 0.6% | | | | |
| | 90,000,000 | | | Hellenic Railways Organization S.A., EMTN, 0.247%, 5/24/2016, (EUR)(c)(g) | | $ | 85,481,068 | |
| | 1,153,000 | | | Missouri Pacific Railroad Co., 5.000%, 1/01/2045(c) | | | 1,061,754 | |
| | | | | | | | |
| | | | | | | 86,542,822 | |
| | | | | | | | |
| | | | Restaurants — 0.0% | | | | |
| | 1,330,000 | | | Wagamama Finance PLC, 7.875%, 2/01/2020, 144A, (GBP) | | | 2,105,010 | |
| | | | | | | | |
| | | | Retailers — 0.7% | | | | |
| | 3,325,000 | | | Dillard’s, Inc., 7.000%, 12/01/2028 | | | 3,768,907 | |
| | 1,500,000 | | | Dillard’s, Inc., 7.750%, 7/15/2026 | | | 1,755,947 | |
| | 425,000 | | | Dillard’s, Inc., 7.875%, 1/01/2023 | | | 505,616 | |
| | 10,270,000 | | | Foot Locker, Inc., 8.500%, 1/15/2022(b) | | | 11,273,545 | |
| | 7,490,000 | | | J.C. Penney Corp., Inc., 5.750%, 2/15/2018 | | | 7,209,125 | |
| | 27,224,000 | | | J.C. Penney Corp., Inc., 6.375%, 10/15/2036 | | | 18,852,620 | |
| | 2,510,000 | | �� | J.C. Penney Corp., Inc., 7.625%, 3/01/2097 | | | 1,744,450 | |
| | 11,000,000 | | | J.C. Penney Corp., Inc., 8.125%, 10/01/2019 | | | 11,000,000 | |
| | 12,275,000 | | | Macy’s Retail Holdings, Inc., 6.790%, 7/15/2027 | | | 14,976,138 | |
| | 6,365,000 | | | Marks & Spencer PLC, 7.125%, 12/01/2037, 144A | | | 7,398,046 | |
| | 3,910,000 | | | Nine West Holdings, Inc., 6.125%, 11/15/2034 | | | 1,368,500 | |
| | 24,860,000 | | | Toys “R” Us, Inc., 7.375%, 10/15/2018 | | | 15,894,863 | |
| | | | | | | | |
| | | | | | | 95,747,757 | |
| | | | | | | | |
| | | | Sovereigns — 2.3% | | | | |
| | 317,570,000 | | | Portugal Government International Bond, 5.125%, 10/15/2024, 144A | | | 336,503,523 | |
| | | | | | | | |
| | | | Supermarkets — 1.6% | | | | |
| | 32,456,000 | | | Albertson’s Holdings LLC/Safeway, Inc., 7.750%, 10/15/2022, 144A | | | 34,778,227 | |
| | 79,276,000 | | | New Albertson’s, Inc., 7.450%, 8/01/2029 | | | 77,690,480 | |
| | 25,595,000 | | | New Albertson’s, Inc., 7.750%, 6/15/2026 | | | 24,443,225 | |
| | 24,085,000 | | | New Albertson’s, Inc., 8.000%, 5/01/2031 | | | 23,603,300 | |
| | 5,815,000 | | | New Albertson’s, Inc., 8.700%, 5/01/2030 | | | 5,873,150 | |
| | 16,342,000 | | | New Albertson’s, Inc., Series C, MTN, 6.625%, 6/01/2028 | | | 14,054,120 | |
| | 34,580,000 | | | SUPERVALU, Inc., 6.750%, 6/01/2021 | | | 33,542,600 | |
| | 23,400,000 | | | SUPERVALU, Inc., 7.750%, 11/15/2022 | | | 23,400,000 | |
| | | | | | | | |
| | | | | | | 237,385,102 | |
| | | | | | | | |
| | | | Supranational — 0.4% | | | | |
| | 16,375,000 | | | European Bank for Reconstruction & Development, 6.250%, 2/05/2016, (BRL) | | | 4,020,539 | |
| | 250,500,000,000 | | | European Bank for Reconstruction & Development, 7.200%, 6/08/2016, (IDR) | | | 16,176,315 | |
| | 24,450,000 | | | Inter-American Development Bank, EMTN, 6.000%, 12/15/2017, (NZD) | | | 16,615,317 | |
| | 72,900,000 | | | International Finance Corp., GMTN, 5.000%, 12/21/2015, (BRL) | | | 17,928,490 | |
| | | | | | | | |
| | | | | | | 54,740,661 | |
| | | | | | | | |
| | | | Technology — 1.6% | | | | |
| | 6,475,000 | | | Advanced Micro Devices, Inc., 7.000%, 7/01/2024 | | | 4,014,500 | |
| | 2,255,000 | | | Advanced Micro Devices, Inc., 7.750%, 8/01/2020 | | | 1,460,112 | |
| | 88,923,000 | | | Alcatel-Lucent USA, Inc., 6.450%, 3/15/2029 | | | 88,033,770 | |
See accompanying notes to financial statements.
| 22
Portfolio of Investments – as of September 30, 2015
Loomis Sayles Strategic Income Fund – (continued)
| | | | | | | | |
Principal
Amount (‡) | | | Description | | Value (†) | |
| | | | Technology — continued | | | | |
| $ | 5,845,000 | | | Alcatel-Lucent USA, Inc., 6.500%, 1/15/2028 | | $ | 5,845,000 | |
| | 34,955,000 | | | Amkor Technology, Inc., 6.375%, 10/01/2022 | | | 32,311,528 | |
| | 30,531,000 | | | First Data Corp., 11.750%, 8/15/2021 | | | 33,889,410 | |
| | 56,340,000 | | | KLA-Tencor Corp., 4.650%, 11/01/2024 | | | 56,299,548 | |
| | 15,170,000 | | | KLA-Tencor Corp., 5.650%, 11/01/2034 | | | 14,751,824 | |
| | 2,562,000 | | | Motorola Solutions, Inc., 6.625%, 11/15/2037 | | | 2,681,707 | |
| | 195,000 | | | Samsung Electronics Co. Ltd., 7.700%, 10/01/2027, 144A | | | 247,959 | |
| | | | | | | | |
| | | | | | | 239,535,358 | |
| | | | | | | | |
| | | | Transportation Services — 0.1% | | | | |
| | 10,503,000 | | | APL Ltd., 8.000%, 1/15/2024(c) | | | 8,192,340 | |
| | 2,829,266 | | | Atlas Air Pass Through Trust, Series 1998-1, Class B, 7.680%, 1/02/2016(b) | | | 2,922,631 | |
| | 3,082,034 | | | Atlas Air Pass Through Trust, Series 1998-1, Class C, 8.010%, 7/02/2011(b)(h) | | | 3,189,905 | |
| | 416,160 | | | Atlas Air Pass Through Trust, Series 1999-1, Class A-1, 7.200%, 7/02/2020(b) | | | 416,160 | |
| | 1,374,422 | | | Atlas Air Pass Through Trust, Series 1999-1, Class B, 7.630%, 7/02/2016(b) | | | 1,374,422 | |
| | 2,754,305 | | | Atlas Air Pass Through Trust, Series 1999-1, Class C, 8.770%, 7/02/2012(b)(h) | | | 2,836,934 | |
| | 1,864,358 | | | Atlas Air Pass Through Trust, Series 2000-1, Class B, 9.057%, 7/02/2017(b) | | | 1,892,324 | |
| | | | | | | | |
| | | | | | | 20,824,716 | |
| | | | | | | | |
| | | | Treasuries — 15.8% | | | | |
| | 201,485,000 | | | Canadian Government, 0.250%, 5/01/2017, (CAD) | | | 150,318,832 | |
| | 352,975,000 | | | Canadian Government, 1.000%, 8/01/2016, (CAD) | | | 265,555,167 | |
| | 317,256,000 | | | Canadian Government, 1.250%, 2/01/2016, (CAD) | | | 238,311,676 | |
| | 29,490,000 | | | Canadian Government, 1.250%, 9/01/2018, (CAD) | | | 22,544,768 | |
| | 80,645,000 | | | Canadian Government, 1.750%, 9/01/2019, (CAD) | | | 62,943,589 | |
| | 89,045,000 | | | Canadian Government, 3.000%, 12/01/2015, (CAD) | | | 66,996,270 | |
| | 6,710,000 | | | Hellenic Republic Government Bond, 3.375%, 7/17/2017, 144A, (EUR) | | | 6,652,905 | |
| | 1,010,000 | | | Hellenic Republic Government Bond, Series PSI, (Step to 3.650% on 2/24/2020), 3.000%, 2/24/2024, (EUR)(i) | | | 788,749 | |
| | 1,100,000 | | | Hellenic Republic Government Bond, Series PSI, (Step to 3.650% on 2/24/2020), 3.000%, 2/24/2035, (EUR)(i) | | | 720,497 | |
| | 4,000,000 | | | Hellenic Republic Government Bond, Series PSI, (Step to 3.650% on 2/24/2020), 3.000%, 2/24/2036, (EUR)(i) | | | 2,591,384 | |
| | 4,455,000 | | | Hellenic Republic Government Bond, Series PSI, (Step to 3.650% on 2/24/2020), 3.000%, 2/24/2037, (EUR)(i) | | | 2,868,880 | |
| | 5,820,000 | | | Hellenic Republic Government Bond, Series PSI, (Step to 3.650% on 2/24/2020), 3.000%, 2/24/2038, (EUR)(i) | | | 3,715,251 | |
| | 4,000,000 | | | Hellenic Republic Government Bond, Series PSI, (Step to 3.650% on 2/24/2020), 3.000%, 2/24/2039, (EUR)(i) | | | 2,544,051 | |
| | 4,680,000 | | | Hellenic Republic Government Bond, Series PSI, (Step to 3.650% on 2/24/2020), 3.000%, 2/24/2040, (EUR)(i) | | | 2,972,837 | |
See accompanying notes to financial statements.
23 |
Portfolio of Investments – as of September 30, 2015
Loomis Sayles Strategic Income Fund – (continued)
| | | | | | | | |
Principal
Amount (‡) | | | Description | | Value (†) | |
| | | | Treasuries — continued | | | | |
| | 5,970,000 | | | Hellenic Republic Government Bond, Series PSI, (Step to 3.650% on 2/24/2020), 3.000%, 2/24/2041, (EUR)(i) | | $ | 3,805,267 | |
| | 4,000,000 | | | Hellenic Republic Government Bond, Series PSI, (Step to 3.650% on 2/24/2020), 3.000%, 2/24/2042, (EUR)(i) | | | 2,555,582 | |
| | 9,710,000(†††) | | | Mexican Fixed Rate Bonds, Series M, 5.000%, 6/15/2017, (MXN) | | | 58,367,641 | |
| | 9,930,439(†††) | | | Mexican Fixed Rate Bonds, Series M, 6.500%, 6/10/2021, (MXN) | | | 61,511,635 | |
| | 4,250,000(†††) | | | Mexican Fixed Rate Bonds, Series M, 7.750%, 5/29/2031, (MXN) | | | 27,932,030 | |
| | 7,740,000(†††) | | | Mexican Fixed Rate Bonds, Series M-20, 7.500%, 6/03/2027, (MXN) | | | 49,952,987 | |
| | 27,224,481(†††) | | | Mexican Fixed Rate Bonds, Series M-20, 8.000%, 12/07/2023, (MXN) | | | 181,480,382 | |
| | 3,035,000(†††) | | | Mexican Fixed Rate Bonds, Series M-20, 8.500%, 5/31/2029, (MXN) | | | 21,186,221 | |
| | 21,700,000(†††) | | | Mexican Fixed Rate Bonds, Series M-20, 10.000%, 12/05/2024, (MXN) | | | 163,518,329 | |
| | 252,700,000 | | | New Zealand Government Bond, 5.000%, 3/15/2019, (NZD) | | | 174,107,977 | |
| | 175,365,000 | | | New Zealand Government Bond, 6.000%, 5/15/2021, (NZD) | | | 130,742,534 | |
| | 458,725,000 | | | Norway Government Bond, 3.750%, 5/25/2021, 144A, (NOK) | | | 61,983,483 | |
| | 836,485,000 | | | Norway Government Bond, 4.250%, 5/19/2017, 144A, (NOK) | | | 104,157,770 | |
| | 658,049,000 | | | Norway Government Bond, 4.500%, 5/22/2019, 144A, (NOK) | | | 87,898,069 | |
| | 162,850,000 | | | Republic of Brazil, 8.500%, 1/05/2024, (BRL) | | | 30,602,409 | |
| | 55,925,000 | | | Republic of Brazil, 10.250%, 1/10/2028, (BRL) | | | 11,426,220 | |
| | 49,120,000 | | | Republic of Brazil, 12.500%, 1/05/2016, (BRL) | | | 12,210,306 | |
| | 3,842,906,000 | | | Republic of Iceland, 6.000%, 10/13/2016, (ISK) | | | 20,414,981 | |
| | 1,605,660,000 | | | Republic of Iceland, 7.250%, 10/26/2022, (ISK) | | | 9,226,173 | |
| | 4,496,156,000 | | | Republic of Iceland, 8.750%, 2/26/2019, (ISK) | | | 25,858,844 | |
| | 95,000,000 | | | U.S. Treasury Note, 0.375%, 4/30/2016 | | | 95,090,345 | |
| | 35,075,000 | | | U.S. Treasury Note, 0.500%, 6/30/2016 | | | 35,135,294 | |
| | 150,000,000 | | | U.S. Treasury Note, 0.500%, 3/31/2017 | | | 149,974,650 | |
| | | | | | | | |
| | | | | | | 2,348,663,985 | |
| | | | | | | | |
| | | | Wireless — 0.6% | | | | |
| | 293,000,000 | | | America Movil SAB de CV, 6.450%, 12/05/2022, (MXN) | | | 16,515,904 | |
| | 134,600,000 | | | America Movil SAB de CV, 8.460%, 12/18/2036, (MXN) | | | 7,672,803 | |
| | 31,041,000 | | | Sprint Capital Corp., 6.875%, 11/15/2028 | | | 22,271,917 | |
| | 6,260,000 | | | Sprint Capital Corp., 8.750%, 3/15/2032 | | | 4,867,150 | |
| | 21,052,000 | | | Sprint Communications, Inc., 6.000%, 11/15/2022 | | | 15,841,630 | |
| | 8,200,000 | | | Sprint Corp., 7.125%, 6/15/2024 | | | 6,310,720 | |
| | 23,641,000 | | | Sprint Corp., 7.250%, 9/15/2021 | | | 19,356,069 | |
| | | | | | | | |
| | | | | | | 92,836,193 | |
| | | | | | | | |
| | | | Wirelines — 3.6% | | | | |
| | 4,370,000 | | | Bell Canada, MTN, 6.550%, 5/01/2029, 144A, (CAD) | | | 3,982,905 | |
| | 7,545,000 | | | Bell Canada, Series M-17, 6.100%, 3/16/2035, (CAD) | | | 6,579,613 | |
| | 72,320,000 | | | CenturyLink, Inc., 6.450%, 6/15/2021 | | | 66,172,800 | |
| | 765,000 | | | CenturyLink, Inc., 7.650%, 3/15/2042 | | | 585,225 | |
| | 7,410,000 | | | CenturyLink, Inc., Series G, 6.875%, 1/15/2028 | | | 6,113,250 | |
| | 2,965,000 | | | CenturyLink, Inc., Series P, 7.600%, 9/15/2039 | | | 2,245,988 | |
| | 350,000 | | | Cincinnati Bell Telephone Co. LLC, 6.300%, 12/01/2028 | | | 327,250 | |
| | 10,703,000 | | | Consolidated Communications, Inc., 6.500%, 10/01/2022, 144A | | | 9,579,185 | |
| | 17,900,000 | | | Eircom Finance Ltd., 9.250%, 5/15/2020, 144A, (EUR) | | | 21,442,197 | |
| | 5,330,000 | | | Embarq Corp., 7.995%, 6/01/2036 | | | 5,498,215 | |
See accompanying notes to financial statements.
| 24
Portfolio of Investments – as of September 30, 2015
Loomis Sayles Strategic Income Fund – (continued)
| | | | | | | | |
Principal
Amount (‡) | | | Description | | Value (†) | |
| | | | Wirelines — continued | | | | |
| $ | 37,225,000 | | | FairPoint Communications, Inc., 8.750%, 8/15/2019, 144A | | $ | 38,714,000 | |
| | 16,755,000 | | | Frontier Communications Corp., 6.250%, 9/15/2021 | | | 13,948,537 | |
| | 18,725,000 | | | Frontier Communications Corp., 6.875%, 1/15/2025 | | | 14,792,750 | |
| | 38,336,000 | | | Frontier Communications Corp., 7.875%, 1/15/2027 | | | 31,435,520 | |
| | 1,120,000 | | | Koninklijke (Royal) KPN NV, EMTN, 5.750%, 3/18/2016, (GBP) | | | 1,726,403 | |
| | 25,745,000 | | | Level 3 Communications, Inc., 5.750%, 12/01/2022 | | | 25,262,281 | |
| | 4,667,000 | | | Oi S.A., 5.750%, 2/10/2022, 144A | | | 2,170,155 | |
| | 16,550,000 | | | Portugal Telecom International Finance BV, EMTN, 4.500%, 6/16/2025, (EUR) | | | 10,864,616 | |
| | 29,750,000 | | | Portugal Telecom International Finance BV, EMTN, 5.000%, 11/04/2019, (EUR) | | | 25,449,899 | |
| | 42,460,000 | | | Qwest Capital Funding, Inc., 6.875%, 7/15/2028 | | | 35,878,700 | |
| | 12,463,000 | | | Qwest Capital Funding, Inc., 7.625%, 8/03/2021 | | | 13,148,465 | |
| | 32,395,000 | | | Qwest Capital Funding, Inc., 7.750%, 2/15/2031 | | | 29,803,400 | |
| | 26,401,000 | | | Qwest Corp., 6.875%, 9/15/2033 | | | 25,489,268 | |
| | 3,075,000 | | | Qwest Corp., 7.200%, 11/10/2026 | | | 3,080,227 | |
| | 3,999,000 | | | Qwest Corp., 7.250%, 9/15/2025 | | | 4,461,400 | |
| | 39,171,000 | | | Telecom Italia Capital S.A., 6.000%, 9/30/2034 | | | 36,233,175 | |
| | 22,645,000 | | | Telecom Italia Capital S.A., 6.375%, 11/15/2033 | | | 21,682,587 | |
| | 4,000,000 | | | Telecom Italia SpA, EMTN, 5.250%, 3/17/2055, (EUR) | | | 4,302,972 | |
| | 420,000 | | | Telefonica Emisiones SAU, 7.045%, 6/20/2036 | | | 492,543 | |
| | 31,690,000 | | | Telus Corp., 4.950%, 3/15/2017, (CAD) | | | 24,817,461 | |
| | 18,600,000 | | | Telus Corp., Series CG, 5.050%, 12/04/2019, (CAD) | | | 15,443,784 | |
| | 29,552,000 | | | Verizon Communications, Inc., 2.450%, 11/01/2022 | | | 27,907,195 | |
| | 3,346,000 | | | Verizon New England, Inc., 7.875%, 11/15/2029 | | | 4,277,654 | |
| | 2,080,000 | | | Verizon Pennsylvania, Inc., 6.000%, 12/01/2028 | | | 2,267,841 | |
| | 1,225,000 | | | Windstream Services LLC, 7.500%, 6/01/2022 | | | 924,875 | |
| | 3,760,000 | | | Windstream Services LLC, 7.500%, 4/01/2023 | | | 2,782,400 | |
| | | | | | | | |
| | | | | | | 539,884,736 | |
| | | | | | | | |
| | | | Total Non-Convertible Bonds
(Identified Cost $10,505,759,323) | | | 9,369,603,963 | |
| | | | | | | | |
| | | | | | | | |
| | Convertible Bonds — 6.1% | |
| | | | Building Materials — 0.9% | | | | |
| | 19,486,000 | | | KB Home, 1.375%, 2/01/2019 | | | 18,097,623 | |
| | 52,005,000 | | | Lennar Corp., 3.250%, 11/15/2021, 144A | | | 106,967,784 | |
| | 9,592,000 | | | Ryland Group, Inc. (The), 0.250%, 6/01/2019 | | | 8,806,655 | |
| | | | | | | | |
| | | | | | | 133,872,062 | |
| | | | | | | | |
| | | | Chemicals — 0.0% | | | | |
| | 4,305,000 | | | RPM International, Inc., 2.250%, 12/15/2020 | | | 4,797,384 | |
| | | | | | | | |
| | | | Consumer Cyclical Services — 0.2% | | | | |
| | 20,848,000 | | | Jarden Corp., 1.125%, 3/15/2034 | | | 23,844,900 | |
| | | | | | | | |
| | | | Consumer Products — 0.1% | | | | |
| | 13,670,000 | | | Euronet Worldwide, Inc., 1.500%, 10/01/2044, 144A | | | 16,720,119 | |
| | | | | | | | |
See accompanying notes to financial statements.
25 |
Portfolio of Investments – as of September 30, 2015
Loomis Sayles Strategic Income Fund – (continued)
| | | | | | | | |
Principal
Amount (‡) | | | Description | | Value (†) | |
| | | | Diversified Manufacturing — 0.1% | | | | |
| $ | 16,727,000 | | | Trinity Industries, Inc., 3.875%, 6/01/2036 | | $ | 19,727,405 | |
| | | | | | | | |
| | | | Healthcare — 0.1% | | | | |
| | 15,025,000 | | | Hologic, Inc., (accretes to principal after 3/01/2018), 2.000%, 3/01/2042(i) | | | 20,264,969 | |
| | | | | | | | |
| | | | Leisure — 0.1% | | | | |
| | 27,795,000 | | | Rovi Corp., 0.500%, 3/01/2020, 144A | | | 21,436,894 | |
| | | | | | | | |
| | | | Midstream — 0.6% | | | | |
| | 63,121,000 | | | Chesapeake Energy Corp., 2.250%, 12/15/2038 | | | 44,815,910 | |
| | 49,165,000 | | | Chesapeake Energy Corp., 2.500%, 5/15/2037 | | | 42,281,900 | |
| | | | | | | | |
| | | | | | | 87,097,810 | |
| | | | | | | | |
| | | | Pharmaceuticals — 0.1% | | | | |
| | 1,195,000 | | | BioMarin Pharmaceutical, Inc., 0.750%, 10/15/2018 | | | 1,543,791 | |
| | 1,655,000 | | | BioMarin Pharmaceutical, Inc., 1.500%, 10/15/2020 | | | 2,223,906 | |
| | 1,810,000 | | | Illumina, Inc., 0.250%, 3/15/2016 | | | 3,795,344 | |
| | | | | | | | |
| | | | | | | 7,563,041 | |
| | | | | | | | |
| | | | Property & Casualty Insurance — 0.6% | | | | |
| | 72,915,000 | | | Old Republic International Corp., 3.750%, 3/15/2018 | | | 84,216,825 | |
| | | | | | | | |
| | | | Technology — 3.3% | | | | |
| | 7,680,000(††††) | | | Alcatel-Lucent, Series ALU, 0.125%, 1/30/2020, (EUR) | | | 37,305,498 | |
| | 7,520,000 | | | Brocade Communications Systems, Inc., 1.375%, 1/01/2020, 144A | | | 7,364,900 | |
| | 60,405,000 | | | Ciena Corp., 0.875%, 6/15/2017 | | | 59,574,431 | |
| | 7,185,000 | | | Ciena Corp., 3.750%, 10/15/2018, 144A | | | 8,985,741 | |
| | 2,429,000 | | | Intel Corp., 2.950%, 12/15/2035 | | | 2,949,717 | |
| | 205,005,000 | | | Intel Corp., 3.250%, 8/01/2039 | | | 309,301,294 | |
| | 1,055,000 | | | Lam Research Corp., Series B, 1.250%, 5/15/2018 | | | 1,322,706 | |
| | 5,446,925 | | | Liberty Media LLC, 3.500%, 1/15/2031 | | | 4,870,820 | |
| | 39,460,000 | | | Nuance Communications, Inc., 1.500%, 11/01/2035 | | | 40,619,137 | |
| | 10,415,000 | | | Priceline Group, Inc. (The), 0.900%, 9/15/2021, 144A | | | 10,239,247 | |
| | 11,570,000 | | | Viavi Solutions, Inc., 0.625%, 8/15/2033 | | | 10,796,256 | |
| | | | | | | | |
| | | | | | | 493,329,747 | |
| | | | | | | | |
| | | | Total Convertible Bonds
(Identified Cost $738,873,680) | | | 912,871,156 | |
| | | | | | | | |
| | | | | | | | |
| | Municipals — 1.4% | | | | |
| | | | District of Columbia — 0.0% | | | | |
| | 3,850,000 | | | Metropolitan Washington Airports Authority, Series D, 8.000%, 10/01/2047 | | | 4,951,023 | |
| | | | | | | | |
| | | | Illinois — 0.3% | | | | |
| | 47,285,000 | | | State of Illinois, 5.100%, 6/01/2033 | | | 44,296,588 | |
| | | | | | | | |
| | | | Michigan — 0.1% | | | | |
| | 12,220,000 | | | Michigan Tobacco Settlement Finance Authority Taxable Turbo, Series A, 7.309%, 6/01/2034 | | | 10,602,683 | |
| | | | | | | | |
See accompanying notes to financial statements.
| 26
Portfolio of Investments – as of September 30, 2015
Loomis Sayles Strategic Income Fund – (continued)
| | | | | | | | |
Principal
Amount (‡) | | | Description | | Value (†) | |
| | | | Puerto Rico — 0.3% | | | | |
| $ | 63,900,000 | | | Commonwealth of Puerto Rico, GO, Refunding, Series A, 8.000%, 7/01/2035 | | $ | 47,925,000 | |
| | | | | | | | |
| | | | Virginia — 0.7% | | | | |
| | 123,115,000 | | | Virginia Tobacco Settlement Financing Corp., Series A-1, 6.706%, 6/01/2046 | | | 94,437,823 | |
| | | | | | | | |
| | | | Total Municipals
(Identified Cost $229,259,861) | | | 202,213,117 | |
| | | | | | | | |
| | | | | | | | |
| | | | Total Bonds and Notes
(Identified Cost $11,473,892,864) | | | 10,484,688,236 | |
| | | | | | | | |
| | | | | | | | |
| | Loan Participations — 0.1% | | | | |
| | | | ABS Other — 0.1% | | | | |
| | 13,925,595 | | | Rise Ltd., Series 2014-1, Class B, 6.500%, 2/15/2039(c)(g)
(Identified Cost $14,030,037) | | | 13,995,223 | |
| | | | | | | | |
| | | | | | | | |
| | Senior Loans — 2.6% | | | | |
| | | | Automotive — 0.2% | | | | |
| | 22,193,813 | | | IBC Capital Ltd., 1st Lien Term Loan, 4.750%, 9/09/2021(g) | | | 21,158,028 | |
| | 5,948,124 | | | IBC Capital Ltd., 2nd Lien Term Loan, 8.000%, 9/09/2022(g) | | | 5,620,977 | |
| | | | | | | | |
| | | | | | | 26,779,005 | |
| | | | | | | | |
| | | | Chemicals — 0.3% | | | | |
| | 4,752,245 | | | Ascend Performance Materials Operations LLC, Term Loan B, 6.750%, 4/10/2018(g) | | | 4,288,901 | |
| | 5,631,795 | | | Emerald Performance Materials LLC, New 1st Lien Term Loan, 4.500%, 8/01/2021(g) | | | 5,589,557 | |
| | 6,147,386 | | | Emerald Performance Materials LLC, New 2nd Lien Term Loan, 7.750%, 8/01/2022(g) | | | 6,075,646 | |
| | 31,355,000 | | | Houghton International, Inc., New 2nd Lien Term Loan, 9.750%, 12/20/2020(g) | | | 31,041,450 | |
| | | | | | | | |
| | | | | | | 46,995,554 | |
| | | | | | | | |
| | | | Construction Machinery — 0.3% | | | | |
| | 44,226,482 | | | Onsite U.S. Finco LLC, Term Loan, 5.500%, 7/30/2021(g) | | | 41,130,628 | |
| | | | | | | | |
| | | | Consumer Cyclical Services — 0.5% | | | | |
| | 42,193,750 | | | SourceHov LLC, 2014 1st Lien Term Loan, 7.750%, 10/31/2019(g) | | | 38,027,117 | |
| | 43,000,000 | | | SourceHov LLC, 2014 2nd Lien Term Loan, 11.500%, 4/30/2020(g) | | | 36,980,000 | |
| | | | | | | | |
| | | | | | | 75,007,117 | |
| | | | | | | | |
| | | | Consumer Products — 0.1% | | | | |
| | 13,587,044 | | | Visant Corp., New Term Loan, 7.000%, 9/23/2021(g) | | | 12,477,390 | |
| | | | | | | | |
| | | | Diversified Manufacturing — 0.1% | | | | |
| | 9,930,830 | | | Ameriforge Group, Inc., 1st Lien Term Loan, 5.000%, 12/19/2019(g) | | | 6,777,791 | |
| | 21,863,132 | | | Ameriforge Group, Inc., 2nd Lien Term Loan, 8.750%, 12/19/2020(g) | | | 12,571,301 | |
| | | | | | | | |
| | | | | | | 19,349,092 | |
| | | | | | | | |
See accompanying notes to financial statements.
27 |
Portfolio of Investments – as of September 30, 2015
Loomis Sayles Strategic Income Fund – (continued)
| | | | | | | | |
Principal
Amount (‡) | | | Description | | Value (†) | |
| | | | Finance Companies — 0.4% | | | | |
| $ | 60,740,995 | | | iStar Financial, Inc., Add on Term Loan A2, 7.000%, 3/19/2017(g) | | $ | 61,955,816 | |
| | | | | | | | |
| | | | Financial Other — 0.1% | | | | |
| | 13,077,085 | | | DBRS Ltd., Term Loan, 6.250%, 3/04/2022(g) | | | 13,044,392 | |
| | | | | | | | |
| | | | Industrial Other — 0.0% | | | | |
| | 4,801,101 | | | Eastman Kodak Co., Exit Term Loan, 7.250%, 9/03/2019(g) | | | 4,589,853 | |
| | | | | | | | |
| | | | Media Entertainment — 0.0% | | | | |
| | 6,537,105 | | | SuperMedia, Inc., Exit Term Loan, 11.600%, 12/30/2016(g) | | | 3,497,351 | |
| | | | | | | | |
| | | | Natural Gas — 0.1% | | | | |
| | 10,114,035 | | | Southcross Holdings Borrower LP, Term Loan B, 6.000%, 8/04/2021(g) | | | 7,366,355 | |
| | | | | | | | |
| | | | Oil Field Services — 0.1% | | | | |
| | 2,618,182 | | | FTS International, Inc., New Term Loan B, 5.750%, 4/16/2021(g) | | | 793,309 | |
| | 5,426,858 | | | Paragon Offshore Finance Co., Term Loan B, 3.750%, 7/18/2021(g) | | | 2,136,825 | |
| | 2,947,848 | | | Petroleum Geo-Services ASA, New Term Loan B, 3.250%, 3/19/2021(g) | | | 2,177,723 | |
| | 2,760,596 | | | UTEX Industries, Inc., 2nd Lien Term Loan 2014, 8.250%, 5/22/2022(g) | | | 2,203,867 | |
| | | | | | | | |
| | | | | | | 7,311,724 | |
| | | | | | | | |
| | | | Other Utility — 0.0% | | | | |
| | 1,298,000 | | | PowerTeam Services LLC, 2nd Lien Term Loan, 8.250%, 11/06/2020(g) | | | 1,233,100 | |
| | | | | | | | |
| | | | Property & Casualty Insurance — 0.0% | | | | |
| | 2,250,800 | | | CGSC of Delaware Holding Corp., 2nd Lien Term Loan C, 8.250%, 10/16/2020(g) | | | 1,890,672 | |
| | | | | | | | |
| | | | Retailers — 0.1% | | | | |
| | 7,276,773 | | | J.C. Penney Corp., Inc., New Term Loan, 5.000%, 6/20/2019(g) | | | 7,243,008 | |
| | 2,829,809 | | | Toys ‘R’ Us Property Co. I LLC, New Term Loan B, 6.000%, 8/21/2019(g) | | | 2,575,127 | |
| | | | | | | | |
| | | | | | | 9,818,135 | |
| | | | | | | | |
| | | | Technology — 0.1% | | | | |
| | 4,070,400 | | | Aptean, Inc., 2nd Lien Term Loan, 8.500%, 2/26/2021(g) | | | 3,897,408 | |
| | 9,507,380 | | | IQOR U.S., Inc., 2nd Lien Term Loan, 9.750%, 4/01/2022(g) | | | 7,320,683 | |
| | | | | | | | |
| | | | | | | 11,218,091 | |
| | | | | | | | |
| | | | Transportation Services — 0.0% | | | | |
| | 4,364,471 | | | OSG Bulk Ships, Inc., Exit Term Loan, 5.250%, 8/05/2019(g) | | | 4,315,370 | |
| | | | | | | | |
| | | | Wireless — 0.0% | | | | |
| | 3,384,615 | | | Asurion LLC, New 2nd Lien Term Loan, 8.500%, 3/03/2021(g) | | | 3,032,615 | |
| | | | | | | | |
| | | | Wirelines — 0.2% | | | | |
| | 17,348,422 | | | Hawaiian Telcom Communications, Inc., Term Loan B, 5.000%, 6/06/2019(g) | | | 17,294,295 | |
| | 14,998,206 | | | Integra Telecom, Inc., 2nd Lien Term Loan, 9.750%, 2/21/2020(g) | | | 14,892,019 | |
| | 1,672,963 | | | LTS Buyer LLC, 2nd Lien Term Loan, 8.000%, 4/12/2021(g) | | | 1,652,050 | |
| | | | | | | | |
| | | | | | | 33,838,364 | |
| | | | | | | | |
| | | | Total Senior Loans
(Identified Cost $418,079,323) | | | 384,850,624 | |
| | | | | | | | |
| | | | | | | | |
See accompanying notes to financial statements.
| 28
Portfolio of Investments – as of September 30, 2015
Loomis Sayles Strategic Income Fund – (continued)
| | | | | | | | |
Shares | | | Description | | Value (†) | |
| | Common Stocks — 20.3% | | | | |
| | | | Airlines — 0.0% | | | | |
| | 38,455 | | | United Continental Holdings, Inc.(d) | | $ | 2,040,038 | |
| | | | | | | | |
| | | | Automobiles — 2.1% | | | | |
| | 15,608,933 | | | Ford Motor Co. | | | 211,813,221 | |
| | 3,379,086 | | | General Motors Co. | | | 101,440,162 | |
| | | | | | | | |
| | | | | | | 313,253,383 | |
| | | | | | | | |
| | | | Banks — 0.4% | | | | |
| | 3,979,932 | | | Bank of America Corp. | | | 62,007,341 | |
| | | | | | | | |
| | | | Chemicals — 0.4% | | | | |
| | 1,364,851 | | | Dow Chemical Co. (The) | | | 57,869,682 | |
| | | | | | | | |
| | | | Containers & Packaging — 0.1% | | | | |
| | 460,656 | | | Owens-Illinois, Inc.(d) | | | 9,544,792 | |
| | | | | | | | |
| | | | Diversified Telecommunication Services — 2.0% | | | | |
| | 283,397 | | | Hawaiian Telcom Holdco, Inc.(d) | | | 5,888,990 | |
| | 607,219 | | | Level 3 Communications, Inc.(d) | | | 26,529,398 | |
| | 2,511,895 | | | Telecom Italia SpA, Sponsored ADR | | | 25,746,924 | |
| | 19,550,590 | | | Telefonica S.A., Sponsored ADR | | | 235,389,103 | |
| | | | | | | | |
| | | | | | | 293,554,415 | |
| | | | | | | | |
| | | | Electric Utilities — 0.0% | | | | |
| | 94,166 | | | Duke Energy Corp. | | | 6,774,302 | |
| | | | | | | | |
| | | | Electronic Equipment, Instruments & Components — 3.7% | | | | |
| | 32,000,000 | | | Corning, Inc. | | | 547,840,000 | |
| | | | | | | | |
| | | | Household Durables — 0.2% | | | | |
| | 477,725 | | | KB Home | | | 6,473,174 | |
| | 549,450 | | | Lennar Corp., Class A | | | 26,445,028 | |
| | | | | | | | |
| | | | | | | 32,918,202 | |
| | | | | | | | |
| | | | Insurance — 0.8% | | | | |
| | 1,510,275 | | | Prudential Financial, Inc. | | | 115,098,058 | |
| | | | | | | | |
| | | | IT Services — 1.9% | | | | |
| | 2,000,000 | | | International Business Machines Corp. | | | 289,940,000 | |
| | | | | | | | |
| | | | Multi-Utilities — 0.0% | | | | |
| | 73,618 | | | CMS Energy Corp. | | | 2,600,188 | |
| | | | | | | | |
| | | | Oil, Gas & Consumable Fuels — 1.2% | | | | |
| | 846,398 | | | Chesapeake Energy Corp. | | | 6,204,097 | |
| | 5,351,804 | | | Repsol YPF S.A., Sponsored ADR | | | 62,348,517 | |
| | 2,134,173 | | | Royal Dutch Shell PLC, Sponsored ADR | | | 101,138,459 | |
| | 141,249 | | | Spectra Energy Corp. | | | 3,710,611 | |
| | | | | | | | |
| | | | | | | 173,401,684 | |
| | | | | | | | |
| | | | Pharmaceuticals — 3.4% | | | | |
| | 8,514,190 | | | Bristol-Myers Squibb Co. | | | 504,040,048 | |
| | | | | | | | |
| | | | REITs – Apartments — 0.3% | | | | |
| | 290,904 | | | Apartment Investment & Management Co., Class A | | | 10,769,266 | |
See accompanying notes to financial statements.
29 |
Portfolio of Investments – as of September 30, 2015
Loomis Sayles Strategic Income Fund – (continued)
| | | | | | | | |
Shares | | | Description | | Value (†) | |
| | | | REITs – Apartments — continued | | | | |
| | 460,000 | | | Equity Residential | | $ | 34,555,200 | |
| | | | | | | | |
| | | | | | | 45,324,466 | |
| | | | | | | | |
| | | | REITs – Diversified — 0.0% | | | | |
| | 227,043 | | | NexPoint Residential Trust, Inc. | | | 3,033,294 | |
| | | | | | | | |
| | | | REITs – Regional Malls — 0.2% | | | | |
| | 123,159 | | | Simon Property Group, Inc. | | | 22,626,771 | |
| | | | | | | | |
| | | | REITs – Shopping Centers — 0.0% | | | | |
| | 201,557 | | | DDR Corp. | | | 3,099,947 | |
| | 61,579 | | | WP GLIMCHER, Inc. | | | 718,011 | |
| | | | | | | | |
| | | | | | | 3,817,958 | |
| | | | | | | | |
| | | | Semiconductors & Semiconductor Equipment — 3.5% | | | | |
| | 17,300,541 | | | Intel Corp. | | | 521,438,306 | |
| | | | | | | | |
| | | | Trading Companies & Distributors — 0.1% | | | | |
| | 176,859 | | | United Rentals, Inc.(d) | | | 10,620,383 | |
| | | | | | | | |
| | | | Total Common Stocks
(Identified Cost $2,590,220,996) | | | 3,017,743,311 | |
| | | | | | | | |
| | | | | | | | |
| | Preferred Stocks — 1.6% | | | | |
| | Convertible Preferred Stocks — 1.5% | | | | |
| | | | Banking — 0.2% | | | | |
| | 19,062 | | | Bank of America Corp., Series L, 7.250% | | | 20,529,774 | |
| | 8,533 | | | Wells Fargo & Co., Series L, Class A, 7.500% | | | 9,966,544 | |
| | | | | | | | |
| | | | | | | 30,496,318 | |
| | | | | | | | |
| | | | Communications — 0.0% | | | | |
| | 10,483 | | | Cincinnati Bell, Inc., 6.750% | | | 502,869 | |
| | | | | | | | |
| | | | Electric — 0.1% | | | | |
| | 374,593 | | | AES Trust III, 6.750% | | | 18,587,305 | |
| | | | | | | | |
| | | | Energy — 0.1% | | | | |
| | 242,297 | | | El Paso Energy Capital Trust I, 4.750% | | | 11,872,553 | |
| | | | | | | | |
| | | | Metals & Mining — 0.5% | | | | |
| | 906,807 | | | Alcoa, Inc., Series 1, 5.375% | | | 30,287,354 | |
| | 4,549,323 | | | ArcelorMittal, 6.000% | | | 37,395,435 | |
| | 250,639 | | | Cliffs Natural Resources, Inc., 7.000% | | | 601,533 | |
| | | | | | | | |
| | | | | | | 68,284,322 | |
| | | | | | | | |
| | | | Midstream — 0.4% | | | | |
| | 172,972 | | | Chesapeake Energy Corp., 4.500% | | | 10,122,321 | |
| | 231,033 | | | Chesapeake Energy Corp., 5.000% | | | 11,638,287 | |
| | 43,178 | | | Chesapeake Energy Corp., 5.750%, 144A | | | 17,217,228 | |
| | 38,539 | | | Chesapeake Energy Corp., Series A, 5.750%, 144A | | | 15,222,905 | |
| | | | | | | | |
| | | | | | | 54,200,741 | |
| | | | | | | | |
| | | | REITs – Diversified — 0.1% | | | | |
| | 29,153 | | | Crown Castle International Corp., Series A, 4.500% | | | 2,969,525 | |
See accompanying notes to financial statements.
| 30
Portfolio of Investments – as of September 30, 2015
Loomis Sayles Strategic Income Fund – (continued)
| | | | | | | | |
Shares | | | Description | | Value (†) | |
| | | | REITs – Diversified — continued | | | | |
| | 391,776 | | | Weyerhaeuser Co., Series A, 6.375% | | $ | 18,691,633 | |
| | | | | | | | |
| | | | | | | 21,661,158 | |
| | | | | | | | |
| | | | REITs – Health Care — 0.1% | | | | |
| | 116,700 | | | Welltower, Inc., 6.500% | | | 7,087,191 | |
| | | | | | | | |
| | | | REITs – Hotels — 0.0% | | | | |
| | 167,167 | | | FelCor Lodging Trust, Inc., Series A, 1.950% | | | 4,150,757 | |
| | | | | | | | |
| | | | REITs – Mortgage — 0.0% | | | | |
| | 38,767 | | | iStar, Inc., Series J, 4.500% | | | 2,060,854 | |
| | | | | | | | |
| | | | Total Convertible Preferred Stocks
(Identified Cost $341,824,870) | | | 218,904,068 | |
| | | | | | | | |
| | | | | | | | |
| | Non-Convertible Preferred Stocks — 0.1% | | | | |
| | | | Banking — 0.0% | | | | |
| | 154,002 | | | Countrywide Capital IV, 6.750% | | | 3,907,030 | |
| | | | | | | | |
| | | | Electric — 0.0% | | | | |
| | 393 | | | Entergy New Orleans, Inc., 4.750% | | | 38,637 | |
| | | | | | | | |
| | | | Finance Companies — 0.0% | | | | |
| | 39,200 | | | iStar, Inc., Series E, 7.875% | | | 929,040 | |
| | 39,300 | | | iStar, Inc., Series F, 7.800% | | | 923,943 | |
| | 10,425 | | | iStar, Inc., Series G, 7.650% | | | 245,509 | |
| | 101,175 | | | SLM Corp., Series A, 6.970% | | | 4,471,935 | |
| | | | | | | | |
| | | | | | | 6,570,427 | |
| | | | | | | | |
| | | | Home Construction — 0.0% | | | | |
| | 208,246 | | | Hovnanian Enterprises, Inc., 7.625%(d) | | | 916,282 | |
| | | | | | | | |
| | | | REITs – Office Property — 0.0% | | | | |
| | 1,596 | | | Highwoods Properties, Inc., Series A, 8.625% | | | 1,945,624 | |
| | | | | | | | |
| | | | REITs – Warehouse/Industrials — 0.1% | | | | |
| | 116,192 | | | ProLogis, Inc., Series Q, 8.540% | | | 7,436,288 | |
| | | | | | | | |
| | | | Total Non-Convertible Preferred Stocks
(Identified Cost $16,997,613) | | | 20,814,288 | |
| | | | | | | | |
| | | | | | | | |
| | | | Total Preferred Stocks
(Identified Cost $358,822,483) | | | 239,718,356 | |
| | | | | | | | |
| | | | | | | | |
| | Closed-End Investment Companies — 0.0% | | | | |
| | 681,131 | | | NexPoint Credit Strategies Fund
(Identified Cost $10,230,352) | | | 3,902,881 | |
| | | | | | | | |
| | | | | | | | |
See accompanying notes to financial statements.
31 |
Portfolio of Investments – as of September 30, 2015
Loomis Sayles Strategic Income Fund – (continued)
| | | | | | | | |
Principal
Amount (‡) | | | Description | | Value (†) | |
| | Short-Term Investments — 2.6% | | | | |
| $ | 2,559,436 | | | Repurchase Agreement with State Street Bank and Trust Company, dated 9/30/2015 at 0.000% to be repurchased at $2,559,436 on 10/01/2015 collateralized by $2,564,000 U.S. Treasury Note, 1.500% due 8/31/2018 valued at $2,610,637 including accrued interest (Note 2 of Notes to Financial Statements) | | $ | 2,559,436 | |
| | 382,613,018 | | | Tri-Party Repurchase Agreement with Fixed Income Clearing Corporation, dated 9/30/2015 at 0.010% to be repurchased at $382,613,124 on 10/01/2015 collateralized by $815,000 U.S. Treasury Note, 0.625% due 9/30/2017 valued at $813,981; $388,485,000 U.S. Treasury Note, 1.750% due 2/28/2022 valued at $389,456,213 including accrued interest (Note 2 of Notes to Financial Statements) | | | 382,613,018 | |
| | | | | | | | |
| | | | Total Short-Term Investments
(Identified Cost $385,172,454) | | | 385,172,454 | |
| | | | | | | | |
| | | | | | | | |
| | | | Total Investments — 97.8%
(Identified Cost $15,250,448,509)(a) | | | 14,530,071,085 | |
| | | | Other assets less liabilities — 2.2% | | | 327,914,341 | |
| | | | | | | | |
| | | | Net Assets — 100.0% | | $ | 14,857,985,426 | |
| | | | | | | | |
| | | | | | | | |
| | (‡) | | | Principal Amount stated in U.S. dollars unless otherwise noted. | |
| | (†) | | | See Note 2 of Notes to Financial Statements. | |
| | (††) | | | Amount shown represents units. One unit represents a principal amount of 25. | |
| | (†††) | | | Amount shown represents units. One unit represents a principal amount of 100. | |
| | (††††) | | | Amount shown represents units. One unit represents a principal amount of 4.02. | |
| | (a) | | | Federal Tax Information: | |
| | | | At September 30, 2015, the net unrealized depreciation on investments based on a cost of $15,410,697,907 for federal income tax purposes was as follows: | |
| | | | Aggregate gross unrealized appreciation for all investments in which there is an excess of value over tax cost | | $ | 1,371,519,306 | |
| | | | Aggregate gross unrealized depreciation for all investments in which there is an excess of tax cost over value | | | (2,252,146,128 | ) |
| | | | | | | | |
| | | | Net unrealized depreciation | | $ | (880,626,822 | ) |
| | | | | | | | |
| | | | | | | | |
| | (b) | | | Fair valued by the Fund’s adviser. At September 30, 2015, the value of these securities amounted to $80,580,006 or 0.5% of net assets. See Note 2 of Notes to Financial Statements. | |
| | (c) | | | Illiquid security. At September 30, 2015, the value of these securities amounted to $313,974,915 or 2.1% of net assets. Illiquid securities are deemed to be fair valued pursuant to the Fund’s pricing policies and procedures. See Note 2 of Notes to Financial Statements. | |
| | (d) | | | Non-income producing security. | |
| | (e) | | | Perpetual bond with no specified maturity date. | |
| | (f) | | | Payment-in-kind security for which the issuer has the option at each interest payment date of making interest payments in cash or additional debt securities. For the period ended September 30, 2015, interest payments were made in additional debt securities. | |
See accompanying notes to financial statements.
| 32
Portfolio of Investments – as of September 30, 2015
Loomis Sayles Strategic Income Fund – (continued)
| | | | | | |
| | (g) | | | Variable rate security. Rate as of September 30, 2015 is disclosed. |
| | (h) | | | Maturity has been extended under the terms of a plan of reorganization. |
| | (i) | | | Coupon rate is a fixed rate for an initial period then resets at a specified date and rate. |
| | (j) | | | The issuer is in default with respect to interest and/or principal payments. Income is not being accrued. |
| | | | | | |
| | 144A | | | All or a portion of these securities are exempt from registration under Rule 144A of the Securities Act of 1933. These securities may be resold in transactions exempt from registration, normally to qualified institutional buyers. At September 30, 2015, the value of Rule 144A holdings amounted to $2,634,811,111 or 17.7% of net assets. |
| | ABS | | | Asset-Backed Securities | | |
| | ADR | | | An American Depositary Receipt is a certificate issued by a custodian bank representing the right to receive securities of the foreign issuer described. The values of ADRs may be significantly influenced by trading on exchanges not located in the United States. |
| | EMTN | | | Euro Medium Term Note | | |
| | GMTN | | | Global Medium Term Note | | |
| | GO | | | General Obligation | | |
| | MBIA | | | Municipal Bond Investors Assurance Corp. | | |
| | MTN | | | Medium Term Note | | |
| | PIK | | | Payment-in-Kind | | |
| | REITs | | | Real Estate Investment Trusts | | |
| | | | | | |
| | AUD | | | Australian Dollar | | |
| | BRL | | | Brazilian Real | | |
| | CAD | | | Canadian Dollar | | |
| | EUR | | | Euro | | |
| | GBP | | | British Pound | | |
| | IDR | | | Indonesian Rupiah | | |
| | ISK | | | Icelandic Krona | | |
| | KRW | | | South Korean Won | | |
| | MXN | | | Mexican Peso | | |
| | NOK | | | Norwegian Krone | | |
| | NZD | | | New Zealand Dollar | | |
See accompanying notes to financial statements.
33 |
Portfolio of Investments – as of September 30, 2015
Loomis Sayles Strategic Income Fund – (continued)
Industry Summary at September 30, 2015
| | | | |
Treasuries | | | 15.8 | % |
Banking | | | 5.6 | |
Technology | | | 5.0 | |
Finance Companies | | | 4.9 | |
Wirelines | | | 3.8 | |
Electronic Equipment, Instruments & Components | | | 3.7 | |
Healthcare | | | 3.5 | |
Semiconductors & Semiconductor Equipment | | | 3.5 | |
Pharmaceuticals | | | 3.5 | |
Chemicals | | | 3.0 | |
Airlines | | | 3.0 | |
Sovereigns | | | 2.3 | |
Automobiles | | | 2.1 | |
Electric | | | 2.1 | |
Metals & Mining | | | 2.1 | |
Diversified Telecommunication Services | | | 2.0 | |
Other Investments, less than 2% each | | | 29.3 | |
Short-Term Investments | | | 2.6 | |
| | | | |
Total Investments | | | 97.8 | |
Other assets less liabilities | | | 2.2 | |
| | | | |
Net Assets | | | 100.0 | % |
| | | | |
Currency Exposure Summary at September 30, 2015
| | | | |
United States Dollar | | | 75.2 | % |
Canadian Dollar | | | 6.8 | |
Mexican Peso | | | 4.0 | |
New Zealand Dollar | | | 3.8 | |
Australian Dollar | | | 2.9 | |
Other, less than 2% each | | | 5.1 | |
| | | | |
Total Investments | | | 97.8 | |
Other assets less liabilities | | | 2.2 | |
| | | | |
Net Assets | | | 100.0 | % |
| | | | |
See accompanying notes to financial statements.
| 34
Statement of Assets and Liabilities
September 30, 2015
| | | | |
ASSETS | | | | |
Investments at cost | | $ | 15,250,448,509 | |
Net unrealized depreciation | | | (720,377,424 | ) |
| | | | |
Investments at value | | | 14,530,071,085 | |
Foreign currency at value (identified cost $140,215,950) | | | 141,607,086 | |
Receivable for Fund shares sold | | | 22,742,348 | |
Receivable for securities sold | | | 37,488,414 | |
Dividends and interest receivable | | | 180,965,409 | |
Tax reclaims receivable | | | 1,318,825 | |
| | | | |
TOTAL ASSETS | | | 14,914,193,167 | |
| | | | |
LIABILITIES | | | | |
Payable for Fund shares redeemed | | | 46,694,895 | |
Management fees payable (Note 5) | | | 7,034,910 | |
Deferred Trustees’ fees (Note 5) | | | 1,054,764 | |
Administrative fees payable (Note 5) | | | 549,061 | |
Payable to distributor (Note 5d) | | | 144,846 | |
Other accounts payable and accrued expenses | | | 729,265 | |
| | | | |
TOTAL LIABILITIES | | | 56,207,741 | |
| | | | |
NET ASSETS | | $ | 14,857,985,426 | |
| | | | |
NET ASSETS CONSIST OF: | | | | |
Paid-in capital | | $ | 14,908,450,232 | |
Distributions in excess of net investment income | | | (11,238,936 | ) |
Accumulated net realized gain on investments and foreign currency transactions | | | 682,497,726 | |
Net unrealized depreciation on investments and foreign currency translations | | | (721,723,596 | ) |
| | | | |
NET ASSETS | | $ | 14,857,985,426 | |
| | | | |
See accompanying notes to financial statements.
35 |
Statement of Assets and Liabilities (continued)
September 30, 2015
| | | | |
COMPUTATION OF NET ASSET VALUE AND OFFERING PRICE: | | | | |
Class A shares: | | | | |
Net assets | | $ | 3,318,261,523 | |
| | | | |
Shares of beneficial interest | | | 225,679,005 | |
| | | | |
Net asset value and redemption price per share | | $ | 14.70 | |
| | | | |
Offering price per share (100/95.50 of net asset value) (Note 1) | | $ | 15.39 | |
| | | | |
Class B shares: (redemption price per share is equal to net asset value less any applicable contingent deferred sales charge) (Note 1) | | | | |
Net assets | | $ | 966,924 | |
| | | | |
Shares of beneficial interest | | | 65,063 | |
| | | | |
Net asset value and offering price per share | | $ | 14.86 | |
| | | | |
Class C shares: (redemption price per share is equal to net asset value less any applicable contingent deferred sales charge) (Note 1) | | | | |
Net assets | | $ | 4,295,139,076 | |
| | | | |
Shares of beneficial interest | | | 290,135,431 | |
| | | | |
Net asset value and offering price per share | | $ | 14.80 | |
| | | | |
Class N shares: | | | | |
Net assets | | $ | 83,404,879 | |
| | | | |
Shares of beneficial interest | | | 5,677,403 | |
| | | | |
Net asset value, offering and redemption price per share | | $ | 14.69 | |
| | | | |
Class Y shares: | | | | |
Net assets | | $ | 7,018,369,069 | |
| | | | |
Shares of beneficial interest | | | 477,760,594 | |
| | | | |
Net asset value, offering and redemption price per share | | $ | 14.69 | |
| | | | |
Admin Class shares: | | | | |
Net assets | | $ | 141,843,955 | |
| | | | |
Shares of beneficial interest | | | 9,676,581 | |
| | | | |
Net asset value, offering and redemption price per share | | $ | 14.66 | |
| | | | |
See accompanying notes to financial statements.
| 36
Statement of Operations
For the Year Ended September 30, 2015
| | | | |
INVESTMENT INCOME | | | | |
Interest | | $ | 748,907,637 | |
Dividends | | | 145,076,068 | |
Less net foreign taxes withheld | | | (5,234,577 | ) |
| | | | |
| | | 888,749,128 | |
| | | | |
Expenses | | | | |
Management fees (Note 5) | | | 100,697,086 | |
Service and distribution fees (Note 5) | | | 62,448,916 | |
Administrative fees (Note 5) | | | 7,747,451 | |
Trustees’ fees and expenses (Note 5) | | | 258,432 | |
Transfer agent fees and expenses (Notes 5 and 6) | | | 13,193,531 | |
Audit and tax services fees | | | 69,085 | |
Custodian fees and expenses | | | 1,170,889 | |
Legal fees | | | 209,972 | |
Registration fees | | | 511,842 | |
Shareholder reporting expenses | | | 831,603 | |
Miscellaneous expenses | | | 350,388 | |
| | | | |
Total expenses | | | 187,489,195 | |
| | | | |
Net investment income | | | 701,259,933 | |
| | | | |
NET REALIZED AND UNREALIZED GAIN (LOSS) ON INVESTMENTS AND FOREIGN CURRENCY TRANSACTIONS | | | | |
Net realized gain (loss) on: | | | | |
Investments | | | 698,798,847 | |
Foreign currency transactions | | | (11,359,685 | ) |
Net change in unrealized appreciation (depreciation) on: | | | | |
Investments | | | (2,578,085,203 | ) |
Foreign currency translations | | | 788,956 | |
| | | | |
Net realized and unrealized loss on investments and foreign currency transactions | | | (1,889,857,085 | ) |
| | | | |
NET DECREASE IN NET ASSETS RESULTING FROM OPERATIONS | | $ | (1,188,597,152 | ) |
| | | | |
See accompanying notes to financial statements.
37 |
Statement of Changes in Net Assets
| | | | | | | | |
| | | Year Ended
September 30,
2015 | | | Year Ended
September 30,
2014 | |
FROM OPERATIONS: | | | | | | | | |
Net investment income | | $ | 701,259,933 | | | $ | 571,519,078 | |
Net realized gain on investments and foreign currency transactions | | | 687,439,162 | | | | 453,441,646 | |
Net change in unrealized appreciation (depreciation) on investments and foreign currency translations | | | (2,577,296,247 | ) | | | 415,862,441 | |
| | | | | | | | |
Net increase (decrease) in net assets resulting from operations | | | (1,188,597,152 | ) | | | 1,440,823,165 | |
| | | | | | | | |
FROM DISTRIBUTIONS TO SHAREHOLDERS: | | | | | | | | |
Net investment income | | | | | | | | |
Class A | | | (147,603,925 | ) | | | (208,260,687 | ) |
Class B | | | (357,567 | ) | | | (1,352,357 | ) |
Class C | | | (140,541,036 | ) | | | (153,941,242 | ) |
Class N | | | (2,897,849 | ) | | | (1,422,761 | ) |
Class Y | | | (326,016,878 | ) | | | (247,038,167 | ) |
Admin Class | | | (4,780,012 | ) | | | (3,946,091 | ) |
Net realized capital gains | | | | | | | | |
Class A | | | (100,184,376 | ) | | | (14,707,851 | ) |
Class B | | | (473,223 | ) | | | (138,778 | ) |
Class C | | | (120,460,405 | ) | | | (13,369,858 | ) |
Class N | | | (1,367,218 | ) | | | (37,074 | ) |
Class Y | | | (201,694,191 | ) | | | (13,975,709 | ) |
Admin Class | | | (3,134,857 | ) | | | (252,447 | ) |
| | | | | | | | |
Total distributions | | | (1,049,511,537 | ) | | | (658,443,022 | ) |
| | | | | | | | |
NET INCREASE (DECREASE) IN NET ASSETS FROM CAPITAL SHARE TRANSACTIONS (NOTE 9) | | | (1,677,689,547 | ) | | | 2,898,606,286 | |
| | | | | | | | |
Net increase (decrease) in net assets | | | (3,915,798,236 | ) | | | 3,680,986,429 | |
NET ASSETS | | | | | | | | |
Beginning of the year | | | 18,773,783,662 | | | | 15,092,797,233 | |
| | | | | | | | |
End of the year | | $ | 14,857,985,426 | | | $ | 18,773,783,662 | |
| | | | | | | | |
DISTRIBUTIONS IN EXCESS OF NET INVESTMENT INCOME | | $ | (11,238,936 | ) | | $ | (53,367,332 | ) |
| | | | | | | | |
See accompanying notes to financial statements.
| 38
Financial Highlights
For a share outstanding throughout each period.
| | | | | | | | | | | | | | | | | | | | |
| | | Class A | |
| | | Year Ended
September 30,
2015 | | | Year Ended
September 30,
2014 | | | Year Ended
September 30,
2013 | | | Year Ended
September 30,
2012 | | | Year Ended
September 30,
2011 | |
Net asset value, beginning of the period | | $ | 16.75 | | | $ | 15.93 | | | $ | 15.30 | | | $ | 14.21 | | | $ | 14.69 | |
| | | | | | | | | | | | | | | | | | | | |
INCOME (LOSS) FROM INVESTMENT OPERATIONS: | | | | | | | | | | | | | | | | | | | | |
Net investment income(a) | | | 0.64 | | | | 0.58 | | | | 0.65 | | | | 0.72 | | | | 0.77 | |
Net realized and unrealized gain (loss) | | | (1.74 | ) | | | 0.90 | | | | 0.76 | | | | 1.21 | | | | (0.42 | ) |
| | | | | | | | | | | | | | | | | | | | |
Total from Investment Operations | | | (1.10 | ) | | | 1.48 | | | | 1.41 | | | | 1.93 | | | | 0.35 | |
| | | | | | | | | | | | | | | | | | | | |
LESS DISTRIBUTIONS FROM: | | | | | | | | | | | | | | | | | | | | |
Net investment income | | | (0.57 | ) | | | (0.62 | ) | | | (0.78 | ) | | | (0.84 | ) | | | (0.83 | ) |
Net realized capital gains | | | (0.38 | ) | | | (0.04 | ) | | | — | | | | — | | | | — | |
| | | | | | | | | | | | | | | | | | | | |
Total Distributions | | | (0.95 | ) | | | (0.66 | ) | | | (0.78 | ) | | | (0.84 | ) | | | (0.83 | ) |
| | | | | | | | | | | | | | | | | | | | |
Net asset value, end of the period | | $ | 14.70 | | | $ | 16.75 | | | $ | 15.93 | | | $ | 15.30 | | | $ | 14.21 | |
| | | | | | | | | | | | | | | | | | | | |
Total return(b) | | | (6.88 | )% | | | 9.34 | % | | | 9.43 | % | | | 14.02 | % | | | 2.20 | % |
RATIOS TO AVERAGE NET ASSETS: | | | | | | | | | | | | | | | | | | | | |
Net assets, end of the period (000’s) | | $ | 3,318,262 | | | $ | 4,408,257 | | | $ | 5,239,885 | | | $ | 5,155,287 | | | $ | 5,262,765 | |
Net expenses | | | 0.94 | % | | | 0.94 | % | | | 0.95 | % | | | 0.96 | % | | | 0.95 | % |
Gross expenses | | | 0.94 | % | | | 0.94 | % | | | 0.95 | % | | | 0.96 | % | | | 0.95 | % |
Net investment income | | | 3.95 | % | | | 3.44 | % | | | 4.14 | % | | | 4.84 | % | | | 5.10 | % |
Portfolio turnover rate | | | 23 | % | | | 26 | % | | | 22 | % | | | 30 | % | | | 25 | % |
| (a) | Per share net investment income has been calculated using the average shares outstanding during the period. |
| (b) | A sales charge for Class A shares is not reflected in total return calculations. |
See accompanying notes to financial statements.
39 |
Financial Highlights (continued)
For a share outstanding throughout each period.
| | | | | | | | | | | | | | | | | | | | |
| | | Class B | |
| | | Year Ended
September 30,
2015 | | | Year Ended
September 30,
2014 | | | Year Ended
September 30,
2013 | | | Year Ended
September 30,
2012 | | | Year Ended
September 30,
2011 | |
Net asset value, beginning of the period | | $ | 16.88 | | | $ | 16.05 | | | $ | 15.41 | | | $ | 14.30 | | | $ | 14.78 | |
| | | | | | | | | | | | | | | | | | | | |
INCOME (LOSS) FROM INVESTMENT OPERATIONS: | | | | | | | | | | | | | | | | | | | | |
Net investment income(a) | | | 0.50 | | | | 0.46 | | | | 0.54 | | | | 0.61 | | | | 0.66 | |
Net realized and unrealized gain (loss) | | | (1.73 | ) | | | 0.90 | | | | 0.76 | | | | 1.23 | | | | (0.43 | ) |
| | | | | | | | | | | | | | | | | | | | |
Total from Investment Operations | | | (1.23 | ) | | | 1.36 | | | | 1.30 | | | | 1.84 | | | | 0.23 | |
| | | | | | | | | | | | | | | | | | | | |
LESS DISTRIBUTIONS FROM: | | | | | | | | | | | | | | | | | | | | |
Net investment income | | | (0.41 | ) | | | (0.49 | ) | | | (0.66 | ) | | | (0.73 | ) | | | (0.71 | ) |
Net realized capital gains | | | (0.38 | ) | | | (0.04 | ) | | | — | | | | — | | | | — | |
| | | | | | | | | | | | | | | | | | | | |
Total Distributions | | | (0.79 | ) | | | (0.53 | ) | | | (0.66 | ) | | | (0.73 | ) | | | (0.71 | ) |
| | | | | | | | | | | | | | | | | | | | |
Net asset value, end of the period | | $ | 14.86 | | | $ | 16.88 | | | $ | 16.05 | | | $ | 15.41 | | | $ | 14.30 | |
| | | | | | | | | | | | | | | | | | | | |
Total return(b) | | | (7.62 | )% | | | 8.55 | % | | | 8.58 | % | | | 13.15 | % | | | 1.48 | % |
RATIOS TO AVERAGE NET ASSETS: | | | | | | | | | | | | | | | | | | | | |
Net assets, end of the period (000’s) | | $ | 967 | | | $ | 30,746 | | | $ | 57,276 | | | $ | 89,552 | | | $ | 107,400 | |
Net expenses | | | 1.68 | % | | | 1.69 | % | | | 1.70 | % | | | 1.70 | % | | | 1.70 | % |
Gross expenses | | | 1.68 | % | | | 1.69 | % | | | 1.70 | % | | | 1.70 | % | | | 1.70 | % |
Net investment income | | | 3.01 | % | | | 2.75 | % | | | 3.39 | % | | | 4.11 | % | | | 4.35 | % |
Portfolio turnover rate | | | 23 | % | | | 26 | % | | | 22 | % | | | 30 | % | | | 25 | % |
| (a) | Per share net investment income has been calculated using the average shares outstanding during the period. |
| (b) | A contingent deferred sales charge for Class B shares is not reflected in total return calculations. |
See accompanying notes to financial statements.
| 40
Financial Highlights (continued)
For a share outstanding throughout each period.
| | | | | | | | | | | | | | | | | | | | |
| | | Class C | |
| | | Year Ended
September 30,
2015 | | | Year Ended
September 30,
2014 | | | Year Ended
September 30,
2013 | | | Year Ended
September 30,
2012 | | | Year Ended
September 30,
2011 | |
Net asset value, beginning of the period | | $ | 16.85 | | | $ | 16.03 | | | $ | 15.39 | | | $ | 14.29 | | | $ | 14.77 | |
| | | | | | | | | | | | | | | | | | | | |
INCOME (LOSS) FROM INVESTMENT OPERATIONS: | | | | | | | | | | | | | | | | | | | | |
Net investment income(a) | | | 0.52 | | | | 0.45 | | | | 0.54 | | | | 0.61 | | | | 0.66 | |
Net realized and unrealized gain (loss) | | | (1.74 | ) | | | 0.90 | | | | 0.76 | | | | 1.23 | | | | (0.43 | ) |
| | | | | | | | | | | | | | | | | | | | |
Total from Investment Operations | | | (1.22 | ) | | | 1.35 | | | | 1.30 | | | | 1.84 | | | | 0.23 | |
| | | | | | | | | | | | | | | | | | | | |
LESS DISTRIBUTIONS FROM: | | | | | | | | | | | | | | | | | | | | |
Net investment income | | | (0.45 | ) | | | (0.49 | ) | | | (0.66 | ) | | | (0.74 | ) | | | (0.71 | ) |
Net realized capital gains | | | (0.38 | ) | | | (0.04 | ) | | | — | | | | — | | | | — | |
| | | | | | | | | | | | | | | | | | | | |
Total Distributions | | | (0.83 | ) | | | (0.53 | ) | | | (0.66 | ) | | | (0.74 | ) | | | (0.71 | ) |
| | | | | | | | | | | | | | | | | | | | |
Net asset value, end of the period | | $ | 14.80 | | | $ | 16.85 | | | $ | 16.03 | | | $ | 15.39 | | | $ | 14.29 | |
| | | | | | | | | | | | | | | | | | | | |
Total return(b) | | | (7.60 | )% | | | 8.54 | % | | | 8.61 | % | | | 13.18 | % | | | 1.42 | % |
RATIOS TO AVERAGE NET ASSETS: | | | | | | | | | | | | | | | | | | | | |
Net assets, end of the period (000’s) | | $ | 4,295,139 | | | $ | 5,390,222 | | | $ | 4,912,727 | | | $ | 5,064,186 | | | $ | 4,666,077 | |
Net expenses | | | 1.69 | % | | | 1.69 | % | | | 1.70 | % | | | 1.71 | % | | | 1.70 | % |
Gross expenses | | | 1.69 | % | | | 1.69 | % | | | 1.70 | % | | | 1.71 | % | | | 1.70 | % |
Net investment income | | | 3.20 | % | | | 2.68 | % | | | 3.39 | % | | | 4.08 | % | | | 4.35 | % |
Portfolio turnover rate | | | 23 | % | | | 26 | % | | | 22 | % | | | 30 | % | | | 25 | % |
| (a) | Per share net investment income has been calculated using the average shares outstanding during the period. |
| (b) | A contingent deferred sales charge for Class C shares is not reflected in total return calculations. |
See accompanying notes to financial statements.
41 |
Financial Highlights (continued)
For a share outstanding throughout each period.
| | | | | | | | | | | | |
| | | Class N | |
| | | Year Ended
September 30,
2015 | | | Year Ended
September 30,
2014 | | | Period Ended
September 30,
2013* | |
Net asset value, beginning of the period | | $ | 16.73 | | | $ | 15.92 | | | $ | 15.78 | |
| | | | | | | | | | | | |
INCOME (LOSS) FROM INVESTMENT OPERATIONS: | | | | | | | | | | | | |
Net investment income(a) | | | 0.69 | | | | 0.61 | | | | 0.46 | |
Net realized and unrealized gain (loss) | | | (1.73 | ) | | | 0.91 | | | | 0.16 | |
| | | | | | | | | | | | |
Total from Investment Operations | | | (1.04 | ) | | | 1.52 | | | | 0.62 | |
| | | | | | | | | | | | |
LESS DISTRIBUTIONS FROM: | | | | | | | | | | | | |
Net investment income | | | (0.62 | ) | | | (0.67 | ) | | | (0.48 | ) |
Net realized capital gains | | | (0.38 | ) | | | (0.04 | ) | | | — | |
| | | | | | | | | | | | |
Total Distributions | | | (1.00 | ) | | | (0.71 | ) | | | (0.48 | ) |
| | | | | | | | | | | | |
Net asset value, end of the period | | $ | 14.69 | | | $ | 16.73 | | | $ | 15.92 | |
| | | | | | | | | | | | |
Total return | | | (6.58 | )% | | | 9.70 | % | | | 4.01 | %(b) |
RATIOS TO AVERAGE NET ASSETS: | | | | | | | | | | | | |
Net assets, end of the period (000’s) | | $ | 83,405 | | | $ | 57,752 | | | $ | 12,921 | |
Net expenses | | | 0.62 | % | | | 0.62 | % | | | 0.63 | %(c) |
Gross expenses | | | 0.62 | % | | | 0.62 | % | | | 0.63 | %(c) |
Net investment income | | | 4.33 | % | | | 3.62 | % | | | 4.38 | %(c) |
Portfolio turnover rate | | | 23 | % | | | 26 | % | | | 22 | % |
| * | From commencement of Class operations on February 1, 2013 through September 30, 2013. |
| (a) | Per share net investment income has been calculated using the average shares outstanding during the period. |
| (b) | Periods less than one year are not annualized. |
| (c) | Computed on an annualized basis for periods less than one year. |
See accompanying notes to financial statements.
| 42
Financial Highlights (continued)
For a share outstanding throughout each period.
| | | | | | | | | | | | | | | | | | | | |
| | | Class Y | |
| | | Year Ended
September 30,
2015 | | | Year Ended
September 30,
2014 | | | Year Ended
September 30,
2013 | | | Year Ended
September 30,
2012 | | | Year Ended
September 30,
2011 | |
Net asset value, beginning of the period | | $ | 16.73 | | | $ | 15.92 | | | $ | 15.29 | | | $ | 14.20 | | | $ | 14.68 | |
| | | | | | | | | | | | | | | | | | | | |
INCOME (LOSS) FROM INVESTMENT OPERATIONS: | | | | | | | | | | | | | | | | | | | | |
Net investment income(a) | | | 0.68 | | | | 0.61 | | | | 0.69 | | | | 0.75 | | | | 0.81 | |
Net realized and unrealized gain (loss) | | | (1.73 | ) | | | 0.90 | | | | 0.76 | | | | 1.22 | | | | (0.43 | ) |
| | | | | | | | | | | | | | | | | | | | |
Total from Investment Operations | | | (1.05 | ) | | | 1.51 | | | | 1.45 | | | | 1.97 | | | | 0.38 | |
| | | | | | | | | | | | | | | | | | | | |
LESS DISTRIBUTIONS FROM: | | | | | | | | | | | | | | | | | | | | |
Net investment income | | | (0.61 | ) | | | (0.66 | ) | | | (0.82 | ) | | | (0.88 | ) | | | (0.86 | ) |
Net realized capital gains | | | (0.38 | ) | | | (0.04 | ) | | | — | | | | — | | | | — | |
| | | | | | | | | | | | | | | | | | | | |
Total Distributions | | | (0.99 | ) | | | (0.70 | ) | | | (0.82 | ) | | | (0.88 | ) | | | (0.86 | ) |
| | | | | | | | | | | | | | | | | | | | |
Net asset value, end of the period | | $ | 14.69 | | | $ | 16.73 | | | $ | 15.92 | | | $ | 15.29 | | | $ | 14.20 | |
| | | | | | | | | | | | | | | | | | | | |
Total return | | | (6.65 | )% | | | 9.63 | % | | | 9.72 | % | | | 14.31 | % | | | 2.46 | % |
RATIOS TO AVERAGE NET ASSETS: | | | | | | | | | | | | | | | | | | | | |
Net assets, end of the period (000’s) | | $ | 7,018,369 | | | $ | 8,747,384 | | | $ | 4,789,322 | | | $ | 4,339,240 | | | $ | 2,807,777 | |
Net expenses | | | 0.69 | % | | | 0.69 | % | | | 0.70 | % | | | 0.71 | % | | | 0.70 | % |
Gross expenses | | | 0.69 | % | | | 0.69 | % | | | 0.70 | % | | | 0.71 | % | | | 0.70 | % |
Net investment income | | | 4.21 | % | | | 3.65 | % | | | 4.39 | % | | | 5.05 | % | | | 5.35 | % |
Portfolio turnover rate | | | 23 | % | | | 26 | % | | | 22 | % | | | 30 | % | | | 25 | % |
| (a) | Per share net investment income has been calculated using the average shares outstanding during the period. |
See accompanying notes to financial statements.
43 |
Financial Highlights (continued)
For a share outstanding throughout each period.
| | | | | | | | | | | | | | | | | | | | |
| | | Admin Class | |
| | | Year Ended
September 30,
2015 | | | Year Ended
September 30,
2014 | | | Year Ended
September 30,
2013 | | | Year Ended
September 30,
2012 | | | Year Ended
September 30,
2011 | |
Net asset value, beginning of the period | | $ | 16.70 | | | $ | 15.89 | | | $ | 15.27 | | | $ | 14.18 | | | $ | 14.66 | |
| | | | | | | | | | | | | | | | | | | | |
INCOME (LOSS) FROM INVESTMENT OPERATIONS: | | | | | | | | | | | | | | | | | | | | |
Net investment income(a) | | | 0.60 | | | | 0.53 | | | | 0.61 | | | | 0.67 | | | | 0.73 | |
Net realized and unrealized gain (loss) | | | (1.73 | ) | | | 0.90 | | | | 0.75 | | | | 1.23 | | | | (0.42 | ) |
| | | | | | | | | | | | | | | | | | | | |
Total from Investment Operations | | | (1.13 | ) | | | 1.43 | | | | 1.36 | | | | 1.90 | | | | 0.31 | |
| | | | | | | | | | | | | | | | | | | | |
LESS DISTRIBUTIONS FROM: | | | | | | | | | | | | | | | | | | | | |
Net investment income | | | (0.53 | ) | | | (0.58 | ) | | | (0.74 | ) | | | (0.81 | ) | | | (0.79 | ) |
Net realized capital gains | | | (0.38 | ) | | | (0.04 | ) | | | — | | | | — | | | | — | |
| | | | | | | | | | | | | | | | | | | | |
Total Distributions | | | (0.91 | ) | | | (0.62 | ) | | | (0.74 | ) | | | (0.81 | ) | | | (0.79 | ) |
| | | | | | | | | | | | | | | | | | | | |
Net asset value, end of the period | | $ | 14.66 | | | $ | 16.70 | | | $ | 15.89 | | | $ | 15.27 | | | $ | 14.18 | |
| | | | | | | | | | | | | | | | | | | | |
Total return | | | (7.13 | )% | | | 9.12 | % | | | 9.12 | % | | | 13.79 | % | | | 1.98 | % |
RATIOS TO AVERAGE NET ASSETS: | | | | | | | | | | | | | | | | | | | | |
Net assets, end of the period (000’s) | | $ | 141,844 | | | $ | 139,423 | | | $ | 80,666 | | | $ | 49,486 | | | $ | 25,424 | |
Net expenses | | | 1.19 | % | | | 1.19 | % | | | 1.20 | % | | | 1.21 | % | | | 1.21 | % |
Gross expenses | | | 1.19 | % | | | 1.19 | % | | | 1.20 | % | | | 1.21 | % | | | 1.21 | % |
Net investment income | | | 3.73 | % | | | 3.15 | % | | | 3.89 | % | | | 4.52 | % | | | 4.87 | % |
Portfolio turnover rate | | | 23 | % | | | 26 | % | | | 22 | % | | | 30 | % | | | 25 | % |
| (a) | Per share net investment income (loss) has been calculated using the average shares outstanding during the period. |
See accompanying notes to financial statements.
| 44
Notes to Financial Statements
September 30, 2015
1. Organization. Loomis Sayles Funds II (the “Trust”) is organized as a Massachusetts business trust. The Trust is registered under the Investment Company Act of 1940, as amended (the “1940 Act”), as an open-end management investment company. The Declaration of Trust permits the Board of Trustees to authorize the issuance of an unlimited number of shares of the Trust in multiple series. The financial statements for certain funds of the Trust are presented in separate reports. Information presented in these financial statements pertains to Loomis Sayles Strategic Income Fund (the “Fund”).
The Fund is a diversified investment company.
The Fund offers Class A, Class C, Class N, Class Y and Admin Class shares. Effective October 12, 2007, Class B shares are no longer offered. Existing Class B shareholders may continue to reinvest dividends into Class B shares and exchange their Class B shares for Class B shares of other Natixis Funds subject to existing exchange privileges as described in the prospectus.
Class A shares are sold with a maximum front-end sales charge of 4.50%. Class B shares do not pay a front-end sales charge; however, they are charged higher Rule 12b-1 fees, and are subject to a contingent deferred sales charge (“CDSC”) if such shares are redeemed within six years of purchase. After eight years of ownership, Class B shares convert to Class A shares. Class C shares do not pay a front-end sales charge, do not convert to any other class of shares, pay higher Rule 12b-1 fees than Class A shares and may be subject to a CDSC of 1.00% if those shares are redeemed within one year of acquisition, except for reinvested distributions. Class N and Class Y shares do not pay a front-end sales charge, a CDSC or Rule 12b-1 fees. Class N shares are primarily intended for employer-sponsored retirement plans. Class Y shares are intended for institutional investors with a minimum initial investment of $100,000, though some categories of investors are exempted from the minimum investment amount as outlined in the Fund’s prospectus. Admin Class shares do not pay a front-end sales charge or a CDSC, but do pay a Rule 12b-1 fee. Class N and Admin Class shares are offered exclusively through intermediaries.
See Note 10 for changes that take effect subsequent to September 30, 2015.
Most expenses can be directly attributed to a Fund. Expenses which cannot be directly attributed to a Fund are generally apportioned based on the relative net assets of each of the funds in Natixis Funds Trust I, Natixis Funds Trust II, Natixis Funds Trust IV, Gateway Trust (“Natixis Funds Trusts”), Loomis Sayles Funds I and Loomis Sayles Funds II (“Loomis Sayles Funds Trusts”). Expenses of the Fund are borne pro rata by the holders of each class of shares, except that each class bears expenses unique to that class (including the Rule 12b-1 service and distribution fees and, for Class A, Class B, Class C, Class Y, and Admin Class, collectively, and Class N, individually, transfer agent fees). In addition, each class votes as a class only with respect to its own Rule 12b-1 Plan. Shares of each class would receive their pro rata share of the net assets of the
45 |
Notes to Financial Statements (continued)
September 30, 2015
Fund if the Fund were liquidated. The Trustees approve separate distributions from net investment income on each class of shares.
2. Significant Accounting Policies. The following is a summary of significant accounting policies consistently followed by the Fund in the preparation of its financial statements. The Fund’s financial statements follow the accounting and reporting guidelines provided for investment companies and are prepared in accordance with accounting principles generally accepted in the United States of America which require the use of management estimates that affect the reported amounts and disclosures in the financial statements. Actual results could differ from those estimates. Management has evaluated the events and transactions subsequent to year-end through the date the financial statements were issued and has determined that there were no material events that would require disclosure in the Fund’s financial statements except as disclosed in Note 10.
a. Valuation. Fund securities and other investments are valued at market value based on market quotations obtained or determined by independent pricing services recommended by the adviser and approved by the Board of Trustees. Fund securities and other investments for which market quotations are not readily available are valued at fair value as determined in good faith by the adviser pursuant to procedures approved by the Board of Trustees, as described below. Market value is determined as follows:
Debt securities and unlisted preferred equity securities are valued based on evaluated bids furnished to the Fund by an independent pricing service or bid prices obtained from broker-dealers. Senior loans are valued at bid prices supplied by an independent pricing service, if available. Listed equity securities (including closed-end investment companies and exchange-traded funds) are valued at the last sale price quoted on the exchange where they are traded most extensively or, if there is no reported sale during the day, the closing bid quotation. Securities traded on the NASDAQ Global Select Market, NASDAQ Global Market and NASDAQ Capital Market are valued at the NASDAQ Official Closing Price (“NOCP”), or if lacking an NOCP, at the most recent bid quotations on the applicable NASDAQ Market. Unlisted equity securities (except unlisted preferred equity securities) are valued at the last sale price quoted in the market where they are traded most extensively or, if there is no reported sale during the day, the closing bid quotation. If there is no last sale price or closing bid quotation available, unlisted equity securities will be valued using evaluated bids furnished by an independent pricing service, if available. In some foreign markets, an official close price and a last sale price may be available from the foreign exchange or market. In those cases, the official close price is used. Broker-dealer bid prices may be used to value debt and unlisted equity securities and senior loans where an independent pricing service is unable to price a security or where an independent pricing service does not provide a reliable price for the security.
| 46
Notes to Financial Statements (continued)
September 30, 2015
Fund securities and other investments for which market quotations are not readily available are valued at fair value as determined in good faith by the adviser pursuant to procedures approved by the Board of Trustees. The Fund may also value securities and other investments at fair value in other circumstances such as when extraordinary events occur after the close of a foreign market but prior to the close of the New York Stock Exchange (“NYSE”). This may include situations relating to a single issuer (such as a declaration of bankruptcy or a delisting of the issuer’s security from the primary market on which it has traded) as well as events affecting the securities markets in general (such as market disruptions or closings and significant fluctuations in U.S. and/or foreign markets). When fair valuing its securities or other investments, the Fund may, among other things, use modeling tools or other processes that may take into account factors such as securities or other market activity and/or significant events that occur after the close of the foreign market and before the time the Fund’s net asset value (“NAV”) is calculated. Fair value pricing may require subjective determinations about the value of a security, and fair values used to determine a Fund’s NAV may differ from quoted or published prices, or from prices that are used by others, for the same securities. In addition, the use of fair value pricing may not always result in adjustments to the prices of securities held by the Fund.
As of September 30, 2015, securities of the Fund included in Net Assets (reflected at absolute value) were fair valued as follows:
| | | | | | | | | | | | |
Illiquid
securities1 | | Percentage of
Net Assets | | | Other fair valued securities2 | | | Percentage of Net Assets | |
| $313,974,915 | | | 2.1% | | | | $80,580,006 | | | | 0.5% | |
| 1 | Illiquid securities are deemed to be fair valued pursuant to the Fund’s pricing policies and procedures. |
| 2 | Fair valued by the Fund’s adviser. |
b. Investment Transactions and Related Investment Income. Investment transactions are accounted for on a trade date plus one day basis for daily NAV calculation. However, for financial reporting purposes, investment transactions are reported on trade date. Dividend income is recorded on ex-dividend date, or in the case of certain foreign securities, as soon as the Fund is notified, and interest income is recorded on an accrual basis. Interest income is increased by the accretion of discount and decreased by the amortization of premium. Distributions received from investments in securities that represent a return of capital or capital gain are recorded as a reduction of the cost of investments or as a realized gain, respectively. In determining net gain or loss on securities sold, the cost of securities has been determined on an identified cost basis. Investment income, non-class specific expenses and realized and unrealized gains and losses are allocated on a pro rata basis to each class based on the relative net assets of each class to the total net assets of the Fund.
c. Foreign Currency Translation. The books and records of the Fund are maintained in U.S. dollars. The values of securities, currencies and other assets and liabilities
47 |
Notes to Financial Statements (continued)
September 30, 2015
denominated in currencies other than U.S. dollars are translated into U.S. dollars based upon foreign exchange rates prevailing at the end of the period. Purchases and sales of investment securities, income and expenses are translated into U.S. dollars on the respective dates of such transactions.
Net realized foreign exchange gains or losses arise from sales of foreign currency, changes in exchange rates between the trade and settlement dates on securities transactions and the difference between the amounts of dividends, interest and foreign withholding taxes recorded on the Fund’s books and the U.S. dollar equivalent of the amounts actually received or paid. Net unrealized foreign exchange gains or losses arise from changes in the value of assets and liabilities, other than investment securities, as of the end of the fiscal period, resulting from changes in exchange rates. Net realized foreign exchange gains or losses and the net change in unrealized foreign exchange gains or losses are disclosed in the Statement of Operations. For federal income tax purposes, net realized foreign exchange gains or losses are characterized as ordinary income and may, if the Fund has net losses, reduce the amount of income available to be distributed by the Fund.
The values of investment securities are presented at the foreign exchange rates prevailing at the end of the period for financial reporting purposes. Net realized and unrealized gains or losses on investments reported in the Statement of Operations reflect gains or losses resulting from changes in exchange rates and fluctuations which arise due to changes in market prices of investment securities. For federal income tax purposes, a portion of the net realized gain or loss on investments arising from changes in exchange rates, which is reflected in the Statement of Operations, may be characterized as ordinary income and may, if the Fund has net losses, reduce the amount of income available to be distributed by the Fund.
During the year ended September 30, 2015, the amount of income available to be distributed by the Fund was reduced by $120,635,103 as a result of losses arising from changes in exchange rates.
The Fund may use foreign currency exchange contracts to facilitate transactions in foreign-denominated investments. Losses may arise from changes in the value of the foreign currency or if the counterparties do not perform under the contracts’ terms.
d. Federal and Foreign Income Taxes. The Trust treats each Fund as a separate entity for federal income tax purposes. The Fund intends to meet the requirements of the Internal Revenue Code of 1986, as amended, applicable to regulated investment companies, and to distribute to its shareholders substantially all of its net investment income and any net realized capital gains at least annually. Management has performed an analysis of the Fund’s tax positions for the open tax years as of September 30, 2015 and has concluded that no provisions for income tax are required. The Fund’s federal tax returns for the prior three fiscal years remain subject to
| 48
Notes to Financial Statements (continued)
September 30, 2015
examination by the Internal Revenue Service. Management is not aware of any events that are reasonably possible to occur in the next twelve months that would result in the amounts of any unrecognized tax benefits significantly increasing or decreasing for the Fund. However, management’s conclusions regarding tax positions taken may be subject to review and adjustment at a later date based on factors including, but not limited to, new tax laws and accounting regulations and interpretations thereof.
The Fund may be subject to foreign withholding taxes on investment income and taxes on capital gains on investments that are accrued and paid based upon the Fund’s understanding of the tax rules and regulations that exist in the countries in which the Fund invests. Foreign withholding taxes on dividend and interest income are reflected on the Statement of Operations as a reduction of investment income, net of amounts eligible to be reclaimed. Dividends and interest receivable on the Statement of Assets and Liabilities are net of foreign withholding taxes. Foreign withholding taxes where reclaims have been or will be filed are reflected on the Statement of Assets and Liabilities as tax reclaims receivable. Capital gains taxes paid are included in net realized gain (loss) on investments in the Statement of Operations. Accrued but unpaid capital gains taxes are reflected as foreign taxes payable on the Statement of Assets and Liabilities, if applicable, and reduce unrealized gains on investments. In the event that realized gains on investments are subsequently offset by realized losses, taxes paid on realized gains may be returned to the Fund. Such amounts, if applicable, are reflected as foreign tax rebates receivable on the Statement of Assets and Liabilities and are recorded as a realized gain when received.
e. Dividends and Distributions to Shareholders. Dividends and distributions are recorded on ex-dividend date. The timing and characterization of certain income and capital gain distributions are determined in accordance with federal tax regulations, which may differ from accounting principles generally accepted in the United States of America. Permanent differences are primarily due to differing treatments for book and tax purposes of items such as foreign currency gains and losses, premium amortization, convertible bonds, paydown gains and losses, trust preferred securities, deferred Trustees’ fees, contingent payment debt instruments and return of capital and capital gain distributions received. Permanent book and tax basis differences relating to shareholder distributions will result in reclassifications to capital accounts reported on the Statement of Assets and Liabilities. Temporary differences between book and tax distributable earnings are primarily due to wash sales, deferred Trustees’ fees, premium amortization, return of capital distributions received, trust preferred securities, defaulted and/or non-income producing securities, contingent payment debt instruments and convertible bonds. Amounts of income and capital gain available to be distributed on a tax basis are determined annually, and at other times during the Fund’s fiscal year as may be necessary to avoid knowingly declaring and paying a return of capital distribution. Distributions from net investment income and short-term capital gains are considered to be distributed from ordinary income for tax purposes.
49 |
Notes to Financial Statements (continued)
September 30, 2015
The tax characterization of distributions is determined on an annual basis. The tax character of distributions paid to shareholders during the years ended September 30, 2015 and 2014 were as follows:
| | | | | | | | | | | | | | | | | | | | | | |
| 2015 Distributions Paid From: | | | 2014 Distributions Paid From: | |
Ordinary Income | | | Long-Term Capital Gains | | | Total | | | Ordinary Income | | | Long-Term Capital Gains | | | Total | |
| | $660,241,145 | | | $ | 389,270,392 | | | $ | 1,049,511,537 | | | $ | 617,621,510 | | | $ | 40,821,512 | | | $ | 658,443,022 | |
Differences between these amounts and those reported in the Statement of Changes in Net Assets are primarily attributable to different book and tax treatment for short-term capital gains.
As of September 30, 2015, the components of distributable earnings on a tax basis were as follows:
| | | | |
Undistributed ordinary income | | $ | 107,423,785 | |
Undistributed long-term capital gains | | | 712,777,816 | |
| | | | |
Total undistributed earnings | | | 820,201,601 | |
| | | | |
Unrealized appreciation (depreciation) | | | | |
Investments | | | 30,086,766 | |
Foreign currency translations | | | (894,320,846 | ) |
| | | | |
Total unrealized depreciation | | | (864,234,080 | ) |
| | | | |
Total accumulated losses | | $ | (44,032,479 | ) |
| | | | |
f. Loan Participations. The Fund may invest in loans to corporate, governmental or other borrowers. The Fund’s investments in loans may be in the form of participations in loans or assignments of all or a portion of loans. A loan is often administered by a bank or other financial institution that acts as agent for all holders. The agent administers the terms of the loan, as specified in the loan agreement. When investing in a loan participation, (i) the Fund has the right to receive payments of principal, interest and any fees to which it is entitled only from the party from whom the Fund has purchased the participation and only upon receipt by that party of payments from the borrower and (ii) the Fund generally has no right to enforce compliance by the borrower with the terms of the loan agreement or to vote on matters arising under the loan agreement. Thus, the Fund may be subject to credit risk both of the party from whom it purchased the loan participation and the borrower and the Fund may have minimal control over the terms of any loan modification. When the Fund purchases assignments from lenders, it acquires direct rights against the borrower on the loan. Loan agreements and participations outstanding at the end of the period, if any, are listed in each applicable Fund’s Schedule of Investments.
g. Repurchase Agreements. The Fund may enter into repurchase agreements, under the terms of a Master Repurchase Agreement, under which the Fund acquires
| 50
Notes to Financial Statements (continued)
September 30, 2015
securities as collateral and agrees to resell the securities at an agreed upon time and at an agreed upon price. It is the Fund’s policy that the market value of the collateral for repurchase agreements be at least equal to 102% of the repurchase price, including interest. Certain repurchase agreements are tri-party arrangements whereby the collateral is held in a segregated account for the benefit of the Fund and on behalf of the counterparty. Repurchase agreements could involve certain risks in the event of default or insolvency of the counterparty, including possible delays or restrictions upon the Fund’s ability to dispose of the underlying securities. As of September 30, 2015, the Fund had investments in repurchase agreements for which the value of the related collateral exceeded the value of the repurchase agreement. The gross value of repurchase agreements is included in the Statement of Assets and Liabilities for financial reporting purposes.
h. Securities Lending. The Fund has entered into an agreement with State Street Bank and Trust Company (“State Street Bank”), as agent of the Fund, to lend securities to certain designated borrowers. The loans are collateralized with cash or securities in an amount equal to at least 105% or 102% of the market value (including accrued interest) of the loaned international or domestic securities, respectively, when the loan is initiated. Thereafter, the value of the collateral must remain at least 102% of the market value (including accrued interest) of loaned securities for U.S. equities and U.S. corporate debt; at least 105% of the market value (including accrued interest) of loaned securities for non-U.S. equities; and at least 100% of the market value (including accrued interest) of loaned securities for U.S. Government securities, sovereign debt issued by non-U.S. Governments and non-U.S. corporate debt. In the event that the market value of the collateral falls below the required percentages described above, the borrower will deliver additional collateral on the next business day. As with other extensions of credit, the Fund may bear the risk of loss with respect to the investment of the collateral. The Fund invests cash collateral in short-term investments, a portion of the income from which is remitted to the borrowers and the remainder allocated between the Fund and State Street Bank as lending agent. Excess collateral in the amount of $2,475,961 related to terminated loans with a bankrupt borrower is held by State Street Bank on behalf of the Fund.
For the year ended September 30, 2015, the Fund did not loan securities under this agreement.
i. Indemnifications. Under the Trust’s organizational documents, its officers and Trustees are indemnified against certain liabilities arising out of the performance of their duties to the Fund. Additionally, in the normal course of business, the Fund enters into contracts with service providers that contain general indemnification clauses. The Fund’s maximum exposure under these arrangements is unknown as this would involve future claims that may be made against the Fund that have not yet occurred. However, based on experience, the Fund expects the risk of loss to be remote.
51 |
Notes to Financial Statements (continued)
September 30, 2015
3. Fair Value Measurements. In accordance with accounting standards related to fair value measurements and disclosures, the Fund has categorized the inputs utilized in determining the value of the Fund’s assets or liabilities. These inputs are summarized in the three broad levels listed below:
| | • | | Level 1 – quoted prices in active markets for identical assets or liabilities; |
| | • | | Level 2 – prices determined using other significant inputs that are observable either directly, or indirectly through corroboration with observable market data (which could include quoted prices for similar assets or liabilities, interest rates, credit risk, etc.); and |
| | • | | Level 3 – prices determined using significant unobservable inputs when quoted prices or observable inputs are unavailable such as when there is little or no market activity for an asset or liability (unobservable inputs reflect the Fund’s own assumptions in determining the fair value of assets or liabilities and would be based on the best information available). |
The inputs or methodology used for valuing securities are not necessarily an indication of the risk associated with investing in those securities.
The Fund’s pricing policies and procedures are recommended by the adviser and approved by the Board of Trustees. Debt securities are valued based on evaluated bids furnished to the Fund by an independent pricing service. Broker-dealer bid prices may be used if an independent pricing service either is unable to price a security or does not provide a reliable price for a security. Broker-dealer bid prices for which the Fund does not have knowledge of the inputs used by the broker-dealer are categorized in Level 3. All security prices, including those obtained from an independent pricing service and broker-dealer bid prices, are reviewed on a daily basis by the adviser, subject to oversight by Fund management and the Board of Trustees. If the adviser, in good faith, believes that the price provided by an independent pricing service is unreliable, broker-dealer bid prices may be used until the price provided by the independent pricing service is considered to be reliable. Reliability of all security prices, including those obtained from an independent pricing service and broker-dealer bid prices, is tested in a variety of ways, including comparison to recent transaction prices and daily fluctuations, amongst other validation procedures in place. Securities for which market quotations are not readily available are valued at fair value as determined in good faith by the Fund’s adviser pursuant to procedures approved by the Board of Trustees. Fair valued securities may be categorized in Level 3.
| 52
Notes to Financial Statements (continued)
September 30, 2015
The following is a summary of the inputs used to value the Fund’s investments as of September 30, 2015, at value:
Asset Valuation Inputs
| | | | | | | | | | | | | | | | |
Description | | Level 1 | | | Level 2 | | | Level 3 | | | Total | |
Bonds and Notes | | | | | | | | | | | | | | | | |
Non-Convertible Bonds | | | | | | | | | | | | | | | | |
ABS Other | | $ | — | | | $ | 12,636,215 | | | $ | 53,844,406 | (b) | | $ | 66,480,621 | |
Airlines | | | — | | | | 395,736,033 | | | | 46,132,152 | (c) | | | 441,868,185 | |
Finance Companies | | | 1,885,276 | | | | 669,897,220 | | | | — | | | | 671,782,496 | |
Metals & Mining | | | — | | | | 234,525,023 | | | | 2,624,679 | (b) | | | 237,149,702 | |
Non-Agency Commercial Mortgage-Backed Securities | | | — | | | | 115,971,928 | | | | 30,346,820 | (c) | | | 146,318,748 | |
Oil Field Services | | | — | | | | 73,648,050 | | | | 205,000 | (b) | | | 73,853,050 | |
Retailers | | | — | | | | 84,474,212 | | | | 11,273,545 | (b) | | | 95,747,757 | |
Transportation Services | | | — | | | | 8,192,340 | | | | 12,632,376 | (b) | | | 20,824,716 | |
All Other Non-Convertible Bonds(a) | | | — | | | | 7,615,578,688 | | | | — | | | | 7,615,578,688 | |
| | | | | | | | | | | | | | | | |
Total Non-Convertible Bonds | | | 1,885,276 | | | | 9,210,659,709 | | | | 157,058,978 | | | | 9,369,603,963 | |
| | | | | | | | | | | | | | | | |
Convertible Bonds(a) | | | — | | | | 912,871,156 | | | | — | | | | 912,871,156 | |
Municipals(a) | | | — | | | | 202,213,117 | | | | — | | | | 202,213,117 | |
| | | | | | | | | | | | | | | | |
Total Bonds and Notes | | | 1,885,276 | | | | 10,325,743,982 | | | | 157,058,978 | | | | 10,484,688,236 | |
| | | | | | | | | | | | | | | | |
Loan Participations(a) | | | — | | | | — | | | | 13,995,223 | (c) | | | 13,995,223 | |
Senior Loans(a) | | | — | | | | 384,850,624 | | | | — | | | | 384,850,624 | |
Common Stocks(a) | | | 3,017,743,311 | | | | — | | | | — | | | | 3,017,743,311 | |
Preferred Stocks | | | | | | | | | | | | | | | | |
Convertible Preferred Stocks | | | | | �� | | | | | | | | | | | |
Midstream | | | 10,122,321 | | | | 44,078,420 | | | | — | | | | 54,200,741 | |
REITs – Mortgage | | | — | | | | 2,060,854 | | | | — | | | | 2,060,854 | |
All Other Convertible Preferred Stocks(a) | | | 162,642,473 | | | | — | | | | — | | | | 162,642,473 | |
| | | | | | | | | | | | | | | | |
Total Convertible Preferred Stocks | | | 172,764,794 | | | | 46,139,274 | | | | — | | | | 218,904,068 | |
| | | | | | | | | | | | | | | | |
53 |
Notes to Financial Statements (continued)
September 30, 2015
Asset Valuation Inputs (continued)
| | | | | | | | | | | | | | | | |
Description | | Level 1 | | | Level 2 | | | Level 3 | | | Total | |
Preferred Stocks (continued) | | | | | | | | | | | | | |
Non-Convertible Preferred Stocks | | | | | | | | | | | | | | | | |
Electric | | $ | — | | | $ | 38,637 | | | $ | — | | | $ | 38,637 | |
Non-Convertible Preferred Stocks (continued) | | | | | | | | | | | | | | | | |
REITs – Office Property | | | — | | | | 1,945,624 | | | | — | | | | 1,945,624 | |
REITs –Warehouse/Industrials | | | — | | | | 7,436,288 | | | | — | | | | 7,436,288 | |
All Other Non-Convertible Preferred Stocks(a) | | | 11,393,739 | | | | — | | | | — | | | | 11,393,739 | |
| | | | | | | | | | | | | | | | |
Total Non-Convertible Preferred Stocks | | | 11,393,739 | | | | 9,420,549 | | | | — | | | | 20,814,288 | |
| | | | | | | | | | | | | | | | |
Total Preferred Stocks | | | 184,158,533 | | | | 55,559,823 | | | | — | | | | 239,718,356 | |
| | | | | | | | | | | | | | | | |
Closed-End Investment Companies | | | 3,902,881 | | | | — | | | | — | | | | 3,902,881 | |
Short-Term Investments | | | — | | | | 385,172,454 | | | | — | | | | 385,172,454 | |
| | | | | | | | | | | | | | | | |
Total | | $ | 3,207,690,001 | | | $ | 11,151,326,883 | | | $ | 171,054,201 | | | $ | 14,530,071,085 | |
| | | | | | | | | | | | | | | | |
| (a) | Details of the major categories of the Fund’s investments are reflected within the Portfolio of Investments. |
| (b) | Fair valued by the Fund’s adviser. |
| (c) | Valued using broker-dealer bid prices. |
Preferred stocks valued at $13,943,684 were transferred from Level 1 to Level 2 during the period ended September 30, 2015. At September 30, 2014, these securities were valued at the last sale price. At September 30, 2015, these securities were valued on the basis of evaluated bids furnished to the Fund by an independent pricing service.
A preferred stock valued at $466,429 was transferred from Level 2 to Level 1 during the period ended September 30, 2015. At September 30, 2014, this security was valued on the basis of evaluated bids furnished to the Fund by an independent pricing service. At September 30, 2015, this security was valued at the last sale price in accordance with the Fund’s valuation policies.
All transfers are recognized as of the beginning of the reporting period.
| 54
Notes to Financial Statements (continued)
September 30, 2015
The following is a reconciliation of Level 3 investments for which significant unobservable inputs were used to determine fair value as of September 30, 2014 and/or September 30, 2015:
Asset Valuation Inputs
| | | | | | | | | | | | | | | | | | | | |
Investments in Securities | | Balance as of
September 30,
2014 | | | Accrued
Discounts
(Premiums) | | | Realized
Gain
(Loss) | | | Change in
Unrealized
Appreciation
(Depreciation) | | | Purchases | |
Bonds and Notes | | | | | | | | | | | | | | | | | | | | |
Non-Convertible Bonds | | | | | | | | | | | | | | | | | | | | |
ABS Other | | $ | — | | | $ | — | | | $ | — | | | $ | (10,309,343 | ) | | $ | 71,177,326 | |
Airlines | | | 270,539,686 | | | | 97,635 | | | | 6,393,798 | | | | (9,894,759 | ) | | | — | |
Banking | | | 162,624,689 | | | | — | | | | — | | | | — | | | | — | |
Metals & Mining | | | 8,350,160 | | | | 78,733 | | | | 2,236 | | | | (2,607,845 | ) | | | 7,882,584 | |
Non-Agency Commercial Mortgage-Backed Securities | | | — | | | | — | | | | — | | | | 246,820 | | | | 30,100,000 | |
Oil Field Services | | | — | | | | 18,735 | | | | — | | | | (94,985 | ) | | | 281,250 | |
Retailers | | | 11,232,004 | | | | 37,495 | | | | — | | | | 4,046 | | | | — | |
Transportation Services | | | 29,689,394 | | | | — | | | | 2,587,015 | | | | (6,229,303 | ) | | | — | |
Convertible Bonds | | | | | | | | | | | | | | | | | | | | |
Wirelines | | | 53,861 | | | | — | | | | (21,838 | ) | | | 17,377 | | | | — | |
Loan Participations | | | 15,059,064 | | | | — | | | | (7,246 | ) | | | (90,658 | ) | | | — | |
| | | | | | | | | | | | | | | | | | | | |
Total | | $ | 497,548,858 | | | $ | 232,598 | | | $ | 8,953,965 | | | $ | (28,958,650 | ) | | $ | 109,441,160 | |
| | | | | | | | | | | | | | | | | | | | |
55 |
Notes to Financial Statements (continued)
September 30, 2015
Asset Valuation Inputs (continued)
| | | | | | | | | | | | | | | | | | | | |
Investments in Securities | | Sales | | | Transfers
into Level 3 | | | Transfers
out of
Level 3 | | | Balance as of
September 30,
2015 | | | Change in
Unrealized
Appreciation
(Depreciation)
from
Investments
Still Held at
September 30,
2015 | |
Bonds and Notes | | | | | | | | | | | | | | | | | | | | |
Non-Convertible Bonds | | | | | | | | | | | | | | | | | | | | |
ABS Other | | $ | (7,023,577 | ) | | $ | — | | | $ | — | | | $ | 53,844,406 | | | $ | (10,309,343 | ) |
Airlines | | | (90,971,250 | ) | | | — | | | | (130,032,958 | ) | | | 46,132,152 | | | | (1,117,738 | ) |
Banking | | | — | | | | — | | | | (162,624,689 | ) | | | — | | | | — | |
Metals & Mining | | | (11,081,189 | ) | | | — | | | | — | | | | 2,624,679 | | | | (5,295,046 | ) |
Non-Agency Commercial Mortgage-Backed Securities | | | — | | | | — | | | | — | | | | 30,346,820 | | | | 246,820 | |
Oil Field Services | | | — | | | | — | | | | — | | | | 205,000 | | | | (94,985 | ) |
Retailers | | | — | | | | — | | | | — | | | | 11,273,545 | | | | 4,046 | |
Transportation Services | | | (13,414,730 | ) | | | — | | | | — | | | | 12,632,376 | | | | (1,715,712 | ) |
Convertible Bonds | | | | | | | | | | | | | | | | | | | | |
Wirelines | | | (49,400 | ) | | | — | | | | — | | | | — | | | | — | |
Loan Participations | | | (965,937 | ) | | | — | | | | — | | | | 13,995,223 | | | | (87,035 | ) |
| | | | | | | | | | | | | | | | | | | | |
Total | | $ | (123,506,083 | ) | | $ | — | | | $ | (292,657,647 | ) | | $ | 171,054,201 | | | $ | (18,368,993 | ) |
| | | | | | | | | | | | | | | | | | | | |
Debt securities valued at $292,657,647 were transferred from Level 3 to Level 2 during the period ended September 30, 2015. At September 30, 2014, these securities were valued using broker-dealer bid prices based on inputs unobservable to the Fund as an independent pricing service was unable to price the securities. At September 30, 2015, these securities were valued on the basis of evaluated bids furnished to the Fund by an independent pricing service in accordance with the Fund’s valuation policies.
All transfers are recognized as of the beginning of the reporting period.
4. Purchases and Sales of Securities. For the year ended September 30, 2015, purchases and sales of securities (excluding short-term investments and U.S. Government/Agency securities and including paydowns) were $3,693,918,345 and $3,649,950,883, respectively. Purchases and sales of U.S. Government/Agency securities
| 56
Notes to Financial Statements (continued)
September 30, 2015
(excluding short-term investments and including paydowns) were $415,314,499 and $2,967,635,644 respectively.
5. Management Fees and Other Transactions with Affiliates.
a. Management Fees. Loomis, Sayles & Company, L.P. (“Loomis Sayles”) serves as investment adviser to the Fund. Under the terms of the management agreement, the Fund pays a management fee at the following annual rates, calculated daily and payable monthly, based on the Fund’s average daily net assets:
| | | | | | | | | | | | | | | | |
Percentage of Average Daily Net Assets | |
First $200 million | | Next $1.8 billion | | | Next
$13 billion | | | Next
$10 billion | | | Over
$25 billion | |
0.65% | | | 0.60% | | | | 0.55% | | | | 0.54% | | | | 0.53% | |
Loomis Sayles has given a binding undertaking to the Fund to waive management fees and/or reimburse certain expenses to limit the Fund’s operating expenses, exclusive of acquired fund fees and expenses, brokerage expenses, interest expense, taxes, organizational and extraordinary expenses such as litigation and indemnification expenses. This undertaking is in effect until January 31, 2016, may be terminated before then only with the consent of the Fund’s Board of Trustees, and is reevaluated on an annual basis. Management fees payable, as reflected on the Statement of Assets and Liabilities, is net of waivers and/or expense reimbursements, if any, pursuant to this undertaking.
For the year ended September 30, 2015, the expense limits as a percentage of average daily net assets under the expense limitation agreement were as follows:
| | | | | | | | | | | | | | | | | | | | |
Expense Limit as a Percentage of Average Daily Net Assets | |
Class A | | Class B | | | Class C | | | Class N | | | Class Y | | | Admin Class | |
1.25% | | | 2.00% | | | | 2.00% | | | | 0.95% | | | | 1.00% | | | | 1.50% | |
Loomis Sayles shall be permitted to recover expenses it has borne under the expense limitation agreement (whether through waiver of its management fees or otherwise) on a class by class basis in later periods to the extent the annual operating expenses of a class fall below a class’ expense limits, provided, however, that a class is not obligated to pay such waived/reimbursed fees or expenses more than one year after the end of the fiscal year in which the fees or expenses were waived/reimbursed.
For the year ended September 30, 2015, the management fees for the Fund were $100,697,086 (effective rate of 0.55% of average daily net assets).
No expenses were recovered during the year ended September 30, 2015 under the terms of the expense limitation agreement.
57 |
Notes to Financial Statements (continued)
September 30, 2015
Certain officers and employees of Loomis Sayles are also officers or Trustees of the Trust. Loomis Sayles’ general partner is indirectly owned by Natixis Global Asset Management, L.P. (“Natixis US”), which is part of Natixis Global Asset Management, an international asset management group based in Paris, France.
b. Service and Distribution Fees. NGAM Distribution, L.P. (“NGAM Distribution”), which is a wholly-owned subsidiary of Natixis US, has entered into a distribution agreement with the Trust. Pursuant to this agreement, NGAM Distribution serves as principal underwriter of the Funds of the Trust.
Pursuant to Rule 12b-1 under the 1940 Act, the Trust has adopted a Service Plan relating to the Fund’s Class A shares (the “Class A Plan”), a Distribution and Service Plan relating to the Fund’s Class B and Class C shares (the “Class B and Class C Plans”), and a Distribution Plan relating to its Admin Class shares (the “Admin Class Plan”).
Under the Class A Plan, the Fund pays NGAM Distribution a monthly service fee at an annual rate not to exceed 0.25% of the average daily net assets attributable to the Fund’s Class A shares, as reimbursement for expenses incurred by NGAM Distribution in providing personal services to investors in Class A shares and/or the maintenance of shareholder accounts.
Under the Class B and Class C Plans, the Fund pays NGAM Distribution a monthly service fee at an annual rate not to exceed 0.25% of the average daily net assets attributable to the Fund’s Class B and Class C shares, as compensation for services provided by NGAM Distribution in providing personal services to investors in Class B and Class C shares and/or the maintenance of shareholder accounts.
Also under the Class B and Class C Plans, the Fund pays NGAM Distribution a monthly distribution fee at an annual rate of 0.75% of the average daily net assets attributable to the Fund’s Class B and Class C shares, as compensation for services provided by NGAM Distribution in connection with the marketing or sale of Class B and Class C shares.
Under the Admin Class Plan, the Fund pays NGAM Distribution a monthly distribution fee at an annual rate not to exceed 0.25% of the average daily net assets attributable to the Fund’s Admin Class shares, as compensation for services provided by NGAM Distribution in connection with the marketing or sale of Admin Class shares or for payments made by NGAM Distribution to securities dealers or other financial intermediaries as commissions, asset-based sales charges or other compensation with respect to the sale of Admin Class shares, or for providing personal services to investors and/or the maintenance of shareholder accounts.
In addition, the Admin Class shares of the Fund may pay NGAM Distribution an administrative service fee, at an annual rate not to exceed 0.25% of the average daily net assets attributable to Admin Class shares. These fees are subsequently paid to
| 58
Notes to Financial Statements (continued)
September 30, 2015
securities dealers or financial intermediaries for providing personal services and/or account maintenance for their customers who hold such shares.
For the year ended September 30, 2015, the service and distribution fees for the Fund were as follows:
| | | | | | | | | | | | | | | | | | | | | | | | |
Service Fees | | | Distribution Fees | |
Class A | | Class B | | | Class C | | | Admin Class | | | Class B | | | Class C | | | Admin Class | |
$10,458,979 | | | $32,643 | | | | $12,781,687 | | | | $366,309 | | | | $97,928 | | | | $38,345,061 | | | | $366,309 | |
c. Administrative Fees. NGAM Advisors, L.P. (“NGAM Advisors”) provides certain administrative services for the Fund and contracts with State Street Bank to serve as sub-administrator. NGAM Advisors is a wholly-owned subsidiary of Natixis US. Pursuant to an agreement among Natixis Funds Trusts, Loomis Sayles Funds Trusts and NGAM Advisors, the Fund pays NGAM Advisors monthly its pro rata portion of fees equal to an annual rate of 0.0575% of the first $15 billion of the average daily net assets of the Natixis Funds Trusts and Loomis Sayles Funds Trusts, 0.0500% of the next $15 billion, 0.0400% of the next $30 billion, 0.0350% of the next $30 billion and 0.0325% of such assets in excess of $90 billion, subject to an annual aggregate minimum fee for the Natixis Funds Trusts and Loomis Sayles Funds Trusts of $10 million, which is reevaluated on an annual basis.
For the year ended September 30, 2015, the administrative fees for the Fund were $7,747,451.
d. Sub-Transfer Agent Fees. NGAM Distribution has entered into agreements, which include servicing agreements, with financial intermediaries that provide recordkeeping, processing, shareholder communications and other services to customers of the intermediaries that hold positions in the Fund and has agreed to compensate the intermediaries for providing those services. Intermediaries transact with the Fund primarily through the use of omnibus accounts on behalf of their customers who hold positions in the Fund. These services would have been provided by the Fund’s transfer agent and other service providers if the shareholders’ accounts were maintained directly at the Fund’s transfer agent. Accordingly, the Fund has agreed to reimburse NGAM Distribution for all or a portion of the servicing fees paid to these intermediaries. The reimbursement amounts (sub-transfer agent fees) paid to NGAM Distribution are subject to a current per-account equivalent fee limit approved by the Fund’s Board, which is based on fees for similar services paid to the Fund’s transfer agent and other service providers. Class N shares do not bear such expenses.
For the year ended September 30, 2015, the sub-transfer agent fees (which are reflected in transfer agent fees and expenses in the Statement of Operations) for the Fund were $12,328,178.
59 |
Notes to Financial Statements (continued)
September 30, 2015
As of September 30, 2015, the Fund owes NGAM Distribution $144,846 in reimbursements for sub-transfer agent fees (which are reflected in the Statement of Assets and Liabilities as payable to distributor).
Sub-transfer agent fees attributable to Class A, Class B, Class C, Class Y and Admin Class are allocated on a pro rata basis to each class based on the relative net assets of each class to the total net assets of those classes.
e. Commissions. Commissions (including CDSCs) on Fund shares retained by NGAM Distribution during the year ended September 30, 2015 amounted to $891,067.
f. Trustees Fees and Expenses. The Trust does not pay any compensation directly to its officers or Trustees who are directors, officers or employees of NGAM Advisors, NGAM Distribution, Natixis US or their affiliates. The Chairperson of the Board of Trustees receives a retainer fee at the annual rate of $300,000. The Chairperson does not receive any meeting attendance fees for Board of Trustees meetings or committee meetings that she attends. Each Independent Trustee (other than the Chairperson) receives, in the aggregate, a retainer fee at the annual rate of $130,000. Each Independent Trustee also receives a meeting attendance fee of $10,000 for each meeting of the Board of Trustees that he or she attends in person and $5,000 for each meeting of the Board of Trustees that he or she attends telephonically. In addition, the chairperson of the Contract Review Committee and the chairperson of the Audit Committee each receive an additional retainer fee at the annual rate of $17,500. The chairperson of the Governance Committee receives an additional retainer fee at the annual rate of $5,000. Each Contract Review Committee member is compensated $6,000 for each Committee meeting that he or she attends in person and $3,000 for each meeting that he or she attends telephonically. Each Audit Committee member is compensated $6,000 for each Committee meeting that he or she attends in person and $3,000 for each meeting that he or she attends telephonically. These fees are allocated among the funds in the Natixis Funds Trusts, Loomis Sayles Funds Trusts and Gateway Trust based on a formula that takes into account, among other factors, the relative net assets of each fund. Trustees are reimbursed for travel expenses in connection with attendance at meetings.
A deferred compensation plan (the “Plan”) is available to the Trustees on a voluntary basis. Deferred amounts remain in the Fund until distributed in accordance with the provisions of the Plan. The value of a participating Trustee’s deferral account is based on theoretical investments of deferred amounts, on the normal payment dates, in certain funds of the Natixis Funds Trusts and Loomis Sayles Funds Trusts as designated by the participating Trustees. Changes in the value of participants’ deferral accounts are allocated pro rata among the funds in the Natixis Funds Trusts and Loomis Sayles Funds Trusts, and are normally reflected as Trustees’ fees and expenses in the Statement of Operations. The portions of the accrued obligations allocated to the Fund under the Plan are reflected as Deferred Trustees’ fees in the Statement of Assets and Liabilities.
| 60
Notes to Financial Statements (continued)
September 30, 2015
6. Class-Specific Transfer Agent Fees and Expenses. For the year ended September 30, 2015, the Fund incurred the following class-specific transfer agent fees and expenses (including sub-transfer agent fees, where applicable):
| | | | | | | | | | | | | | | | | | | | | | | | |
| | | Class A | | | Class B | | | Class C | | | Class N | | | Class Y | | | Admin Class | |
Transfer Agent Fees and Expenses | | $ | 3,049,222 | | | $ | 9,319 | | | $ | 3,729,801 | | | $ | 928 | | | $ | 6,296,983 | | | $ | 107,278 | |
Transfer agent fees and expenses attributable to Class A, Class B, Class C, Class Y and Admin Class are allocated on a pro rata basis to each class based on the relative net assets of each class to the total net assets of those classes. Transfer agent fees and expenses attributable to Class N are allocated to Class N.
7. Line of Credit. The Fund, together with certain other funds of Natixis Funds Trusts and Loomis Sayles Funds Trusts, participates in a $150,000,000 committed unsecured line of credit provided by State Street Bank. Any one Fund may borrow up to the full $150,000,000 under the line of credit (as long as all borrowings by all Funds in the aggregate do not exceed the $150,000,000 limit at any time). Interest is charged to each participating Fund based on its borrowings at a rate per annum equal to the greater of the Federal Funds rate or overnight LIBOR, plus 1.25%. In addition, a commitment fee of 0.15% per annum, payable at the end of each calendar quarter, is accrued and apportioned among the participating funds based on their average daily unused portion of the line of credit.
For the year ended September 30, 2015, the Fund had no borrowings under this agreement.
Prior to April 16, 2015, the committed unsecured line of credit was $200,000,000 with an individual limit of $125,000,000 for each Fund that participated in the line of credit. In addition, the commitment fee was 0.10% per annum, payable at the end of each calendar quarter.
8. Concentration of Risk. The Fund’s investments in foreign securities are subject to foreign currency fluctuations, higher volatility than U.S. securities, varying degrees of regulation and limited liquidity. Greater political, economic, credit and information risks are also associated with foreign securities.
61 |
Notes to Financial Statements (continued)
September 30, 2015
9. Capital Shares. The Fund may issue an unlimited number of shares of beneficial interest, without par value. Transactions in capital shares were as follows:
| | | | | | | | | | | | | | | | |
| |
| Year Ended
September 30, 2015 |
| |
| Year Ended
September 30, 2014 |
|
| | | | Shares | | | | Amount | | | | Shares | | | | Amount | |
| Class A | | | | | | | | | | | | | | | | |
Issued from the sale of shares | | | 55,230,250 | | | $ | 895,787,000 | | | | 96,833,211 | | | $ | 1,613,333,700 | |
Issued in connection with the reinvestment of distributions | | | 12,108,946 | | | | 193,880,215 | | | | 10,982,373 | | | | 182,518,046 | |
Redeemed | | | (104,911,251 | ) | | | (1,667,771,545 | ) | | | (173,467,513 | ) | | | (2,943,275,774 | ) |
| | | | | | | | | | | | | | | | |
Net change | | | (37,572,055 | ) | | $ | (578,104,330 | ) | | | (65,651,929 | ) | | $ | (1,147,424,028 | ) |
| | | | | | | | | | | | | | | | |
| Class B | | | | | | | | | | | | | | | | |
Issued from the sale of shares | | | 13,353 | | | $ | 217,477 | | | | 36,090 | | | $ | 598,526 | |
Issued in connection with the reinvestment of distributions | | | 34,044 | | | | 554,036 | | | | 55,643 | | | | 927,891 | |
Redeemed | | | (1,803,775 | ) | | | (29,572,377 | ) | | | (1,838,778 | ) | | | (31,002,903 | ) |
| | | | | | | | | | | | | | | | |
Net change | | | (1,756,378 | ) | | $ | (28,800,864 | ) | | | (1,747,045 | ) | | $ | (29,476,486 | ) |
| | | | | | | | | | | | | | | | |
| Class C | | | | | | | | | | | | | | | | |
Issued from the sale of shares | | | 28,023,664 | | | $ | 458,267,601 | | | | 52,092,722 | | | $ | 875,512,700 | |
Issued in connection with the reinvestment of distributions | | | 9,349,838 | | | | 150,703,635 | | | | 5,620,301 | | | | 93,940,364 | |
Redeemed | | | (67,101,029 | ) | | | (1,075,601,545 | ) | | | (44,336,735 | ) | | | (744,451,969 | ) |
| | | | | | | | | | | | | | | | |
Net change | | | (29,727,527 | ) | | $ | (466,630,309 | ) | | | 13,376,288 | | | $ | 225,001,095 | |
| | | | | | | | | | | | | | | | |
| Class N | | | | | | | | | | | | | | | | |
Issued from the sale of shares | | | 3,222,100 | | | $ | 51,850,092 | | | | 2,745,644 | | | $ | 45,891,917 | |
Issued in connection with the reinvestment of distributions | | | 254,881 | | | | 4,061,246 | | | | 85,441 | | | | 1,433,052 | |
Redeemed | | | (1,251,091 | ) | | | (19,905,109 | ) | | | (191,196 | ) | | | (3,219,311 | ) |
| | | | | | | | | | | | | | | | |
Net change | | | 2,225,890 | | | $ | 36,006,229 | | | | 2,639,889 | | | $ | 44,105,658 | |
| | | | | | | | | | | | | | | | |
| Class Y | | | | | | | | | | | | | | | | |
Issued from the sale of shares | | | 147,913,821 | | | $ | 2,394,839,842 | | | | 288,746,772 | | | $ | 4,865,529,460 | |
Issued in connection with the reinvestment of distributions | | | 23,049,791 | | | | 368,639,532 | | | | 9,613,689 | | | | 160,340,745 | |
Redeemed | | | (215,997,923 | ) | | | (3,425,312,747 | ) | | | (76,423,525 | ) | | | (1,273,844,644 | ) |
| | | | | | | | | | | | | | | | |
Net change | | | (45,034,311 | ) | | $ | (661,833,373 | ) | | | 221,936,936 | | | $ | 3,752,025,561 | |
| | | | | | | | | | | | | | | | |
| Admin Class | | | | | | | | | | | | | | | | |
Issued from the sale of shares | | | 2,751,269 | | | $ | 44,257,130 | | | | 3,718,005 | | | $ | 61,793,225 | |
Issued in connection with the reinvestment of distributions | | | 426,236 | | | | 6,794,161 | | | | 217,039 | | | | 3,607,944 | |
Redeemed | | | (1,850,865 | ) | | | (29,378,191 | ) | | | (661,926 | ) | | | (11,026,683 | ) |
| | | | | | | | | | | | | | | | |
Net change | | | 1,326,640 | | | $ | 21,673,100 | | | | 3,273,118 | | | $ | 54,374,486 | |
| | | | | | | | | | | | | | | | |
Increase (decrease) from capital share transactions | | | (110,537,741 | ) | | $ | (1,677,689,547 | ) | | | 173,827,257 | | | $ | 2,898,606,286 | |
| | | | | | | | | | | | | | | | |
| 62
Notes to Financial Statements (continued)
September 30, 2015
10. Subsequent Event. On September 10, 2015, the Board of Trustees approved the following changes: (i) the early conversion of all of the Fund’s remaining Class B shares into Class A shares, effective at the close of business on January 11, 2016, (ii) a reduction of the maximum sales charge on purchases of Class A shares from 4.50% to 4.25%, effective November 2, 2015, and (iii) a broadening of eligibility requirements for Class N shares to include investors with an initial minimum investment of $1,000,000, effective November 2, 2015.
63 |
Report of Independent Registered Public Accounting Firm
To the Trustees of Loomis Sayles Funds II and Shareholders of Loomis Sayles Strategic Income Fund:
In our opinion, the accompanying statement of assets and liabilities, including the portfolio of investments, and the related statements of operations and of changes in net assets and the financial highlights present fairly, in all material respects, the financial position of the Loomis Sayles Strategic Income Fund, a series of Loomis Sayles Funds II (the “Fund”) at September 30, 2015, and the results of its operations, the changes in its net assets and the financial highlights for each of the periods indicated, in conformity with accounting principles generally accepted in the United States of America. These financial statements and financial highlights (hereafter referred to as “financial statements”) are the responsibility of the Fund’s management. Our responsibility is to express an opinion on these financial statements based on our audits. We conducted our audits of these financial statements in accordance with the standards of the Public Company Accounting Oversight Board (United States). Those standards require that we plan and perform the audit to obtain reasonable assurance about whether the financial statements are free of material misstatement. An audit includes examining, on a test basis, evidence supporting the amounts and disclosures in the financial statements, assessing the accounting principles used and significant estimates made by management, and evaluating the overall financial statement presentation. We believe that our audits, which included confirmation of securities at September 30, 2015 by correspondence with the custodian and agent banks, provide a reasonable basis for our opinion.
PricewaterhouseCoopers LLP
Boston, Massachusetts
November 20, 2015
| 64
2015 U.S. Tax Distribution Information to Shareholders (Unaudited)
Corporate Dividends Received Deduction. For the fiscal year ended September 30, 2015, 15.14% of dividends distributed by Strategic Income Fund qualify for the dividends received deduction for corporate shareholders.
Capital Gains Distributions. Pursuant to Internal Revenue Section 852(b), the Strategic Income Fund designated $389,270,392 as capital gains distributions for the fiscal year ended September 30, 2015, unless subsequently determined to be different.
Qualified Dividend Income. For the fiscal year ended September 30, 2015, the Strategic Income Fund will designate up to the maximum amount allowable pursuant to the Internal Revenue Code as qualified dividend income eligible for reduced tax rates. These lower rates range from 0% to 20% depending on an individual’s tax bracket. If the Fund pays a distribution during calendar year 2015, complete information will be reported in conjunction with Form 1099-DIV.
65 |
Trustee and Officer Information
The tables below provide certain information regarding the trustees and officers of Loomis Sayles Funds II (the “Trust”). Unless otherwise indicated, the address of all persons below is 399 Boylston Street, Boston, MA 02116. The Fund’s Statement of Additional Information include additional information about the trustees of the Trust and is available by calling Natixis Funds at 800-225-5478.
| | | | | | | | |
Name and Year of Birth | | Position(s) Held
with the Trust,
Length of Time
Served and Term of Office1 | | Principal
Occupation(s)
During Past 5 Years | | Number of
Portfolios in Fund Complex
Overseen2 and Other
Directorships Held
During Past 5 Years | | Experience,
Qualifications,
Attributes, Skills
for Board Membership |
| | | |
| INDEPENDENT TRUSTEES | | | | | | |
| | | | |
Kenneth A. Drucker (1945) | | Trustee since 2008 Chairperson of the Audit Committee and Governance Committee Member | | Retired | | 42 None | | Significant experience on the Board and on the boards of other business organizations (including at investment companies); executive experience (including as treasurer of an aerospace, automotive, and metal manufacturing corporation) |
| | | | |
Edmond J. English (1953) | | Trustee since 2013 Contract Review Committee Member | | Chief Executive Officer of Bob’s Discount Furniture (retail) | | 42 Formerly, Director, BJ’s Wholesale Club (retail); formerly, Director, Citizens Financial Group (bank) | | Experience on the Board and significant experience on the boards of other business organizations (including at a retail company and a bank); executive experience (including at a retail company) |
| 66
Trustee and Officer Information
| | | | | | | | |
Name and Year of Birth | | Position(s) Held
with the Trust,
Length of Time
Served and Term of Office1 | | Principal
Occupation(s)
During Past 5 Years | | Number of
Portfolios in Fund Complex
Overseen2 and Other
Directorships Held
During Past 5 Years | | Experience,
Qualifications,
Attributes, Skills
for Board Membership |
| | | |
INDEPENDENT TRUSTEES (continued) | | | | | | |
| | | | |
Richard A. Goglia (1951) | | Trustee since 2015 Audit Committee Member | | Retired; formerly Vice President and Treasurer of Raytheon Company (defense) | | 42 None | | Experience on the Board and executive experience (including his role as vice president and treasurer of a defense company and experience at a financial services company) |
| | | | |
Wendell J. Knox (1948) | | Trustee since 2009 Audit Committee Member and Governance Committee Member | | Director of Abt Associates Inc. (research and consulting) | | 42 Director, Eastern Bank (bank); Director, The Hanover Insurance Group (property and casualty insurance) | | Significant experience on the Board and on the boards of other business organizations (including at a bank and at a property and casualty insurance firm); executive experience (including roles as president and chief executive officer of a research and consulting company) |
67 |
Trustee and Officer Information
| | | | | | | | |
Name and Year of Birth | | Position(s) Held
with the Trust,
Length of Time
Served and Term of Office1 | | Principal
Occupation(s)
During Past 5 Years | | Number of
Portfolios in Fund Complex
Overseen2 and Other
Directorships Held
During Past 5 Years | | Experience,
Qualifications,
Attributes, Skills
for Board Membership |
| | | |
INDEPENDENT TRUSTEES (continued) | | | | | | |
| | | | |
Martin T. Meehan (1956) | | Trustee since 2012 Contract Review Committee Member | | President, University of Massachusetts (formerly, Chancellor and faculty member, University of Massachusetts Lowell) | | 42 None | | Experience on the Board and on the boards of other business organizations; experience as President of the University of Massachusetts; government experience (including as a member of the U.S. House of Representatives); academic experience |
| | | | |
Sandra O. Moose (1942) | | Chairperson of the Board of Trustees since November 2005 Trustee since 2003 Ex Officio member of the Audit Committee, the Contract Review Committee and the Governance Committee | | President, Strategic Advisory Services (management consulting) | | 42 Director, AES Corporation (international power company); formerly, Director, Verizon Communications (telecommunications company) | | Significant experience on the Board and on the boards of other business organizations (including at a telecommunications company, an international power company and a specialty chemicals corporation); executive experience (including at a management consulting company) |
| 68
Trustee and Officer Information
| | | | | | | | |
Name and Year of Birth | | Position(s) Held
with the Trust,
Length of Time
Served and Term of Office1 | | Principal
Occupation(s)
During Past 5 Years | | Number of
Portfolios in Fund Complex
Overseen2 and Other
Directorships Held
During Past 5 Years | | Experience,
Qualifications,
Attributes, Skills
for Board Membership |
| | | |
INDEPENDENT TRUSTEES (continued) | | | | | | |
| | | | |
Erik R. Sirri (1958) | | Trustee since 2009 Audit Committee Member | | Professor of Finance at Babson College | | 42 None | | Significant experience on the Board; experience as Director of the Division of Trading and Markets at the Securities and Exchange Commission; academic experience; training as an economist |
| | | | |
Peter J. Smail (1952) | | Trustee since 2009 Chairperson of the Contract Review Committee and Governance Committee Member | | Retired | | 42 None | | Significant experience on the Board; mutual fund industry and executive experience (including roles as president and chief executive officer for an investment adviser) |
| | | | |
Cynthia L. Walker (1956) | | Trustee since 2005 Chairperson of the Governance Committee and Contract Review Committee Member | | Deputy Dean for Finance and Administration, Yale University School of Medicine | | 42 None | | Significant experience on the Board; executive experience in a variety of academic organizations (including roles as dean for finance and administration) |
69 |
Trustee and Officer Information
| | | | | | | | |
Name and Year of Birth | | Position(s) Held
with the Trust,
Length of Time
Served and Term of Office1 | | Principal
Occupation(s)
During Past 5 Years | | Number of
Portfolios in Fund Complex
Overseen2 and Other
Directorships Held
During Past 5 Years | | Experience,
Qualifications,
Attributes, Skills
for Board Membership |
| | | |
| INTERESTED TRUSTEES | | | | | | |
| | | | |
Kevin P. Charleston3 (1965) One Financial Center Boston, MA 02111 | | Trustee since 2015 | | President, Chief Executive Officer and Director; formerly, Chief Financial Officer, Loomis, Sayles & Company, L.P. | | 42 None | | Continuing service as President, Chief Executive Officer and Director of Loomis, Sayles & Company, L.P. |
| | | | |
David L. Giunta4 (1965) | | Trustee since 2011 President since 2008 and Chief Executive Officer since 2015 | | President and Chief Executive Officer, NGAM Distribution Corporation, NGAM Advisors, L.P. and NGAM Distribution, L.P. | | 42 None | | Experience on the Board; continuing experience as President and Chief Executive Officer of NGAM Advisors, L.P. |
| | | | |
John T. Hailer5 (1960) | | Trustee since 2003 | | President and Chief Executive Officer – U.S. and Asia, Natixis Global Asset Management, L.P. | | 42 None | | Significant experience on the Board; continuing experience as President and Chief Executive Officer – U.S. and Asia, Natixis Global Asset Management, L.P. |
| 1 | Each trustee serves until retirement, resignation or removal from the Board. The current retirement age is 75. The position of Chairperson of the Board is appointed for a three-year term. Ms. Moose was appointed to serve an additional three-year term as the Chairperson of the Board on December 13, 2013. |
| 2 | The trustees of the Trust serve as trustees of a fund complex that includes all series of the Natixis Funds Trust I, Natixis Funds Trust II, Natixis Funds Trust IV and Gateway Trust (collectively, the “Natixis Funds Trusts”), Loomis Sayles Funds I and Loomis Sayles Funds II (collectively, the “Loomis Sayles Funds Trusts”) (collectively, the “Fund Complex”). |
| 3 | Mr. Charleston is deemed an “interested person” of the Trust because he holds the following positions with an affiliated person of the Trust: President, Chief Executive Officer and Director of Loomis, Sayles & Company, L.P. |
| 4 | Mr. Giunta is deemed an “interested person” of the Trust because he holds the following positions with an affiliated person of the Trust: President and Chief Executive Officer of NGAM Distribution Corporation, NGAM Advisors, L.P. and NGAM Distribution, L.P. |
| 5 | Mr. Hailer is deemed an “interested person” of the Trust because he holds the following positions with an affiliated person of the Trust: President and Chief Executive Officer – U.S. and Asia, Natixis Global Asset Management, L.P. |
| 70
Trustee and Officer Information
| | | | | | |
Name and Year of Birth | | Position(s) Held with the Trust(s) | | Term of Office1 and Length of Time Served | | Principal Occupation(s) During Past 5 Years2 |
| | |
| OFFICERS OF THE TRUST | | | | |
| | | |
Coleen Downs Dinneen (1960) | | Secretary, Clerk and Chief Legal Officer | | Since September 2004 | | Executive Vice President, General Counsel, Secretary and Clerk, NGAM Distribution Corporation, NGAM Advisors, L.P. and NGAM Distribution, L.P. |
| | | |
Daniel J. Fuss (1933) One Financial Center Boston, MA 02111 | | Executive Vice President | | Since June 2003 | | Vice Chairman and Director, Loomis, Sayles & Company, L.P. |
| | | |
Russell L. Kane (1969) | | Chief Compliance Officer, Assistant Secretary and Anti-Money Laundering Officer | | Chief Compliance Officer since May 2006; Assistant Secretary since June 2004; and Anti-Money Laundering Officer since April 2007 | | Chief Compliance Officer for Mutual Funds, Senior Vice President, Deputy General Counsel, Assistant Secretary and Assistant Clerk, NGAM Distribution Corporation, NGAM Advisors, L.P. and NGAM Distribution, L.P. |
| | | |
Michael C. Kardok (1959) | | Treasurer, Principal Financial and Accounting Officer | | Since October 2004 | | Senior Vice President, NGAM Advisors, L.P. and NGAM Distribution, L.P. |
| 1 | Each officer of the Trust serves for an indefinite term in accordance with the Trust’s current by-laws until the date his or her successor is elected and qualified, or until he or she sooner dies, retires, is removed or becomes disqualified. |
| 2 | Each person listed above, except as noted, holds the same position(s) with the Fund Complex. Mr. Fuss is not an officer of the Natixis Funds Trusts. Previous positions during the past five years with NGAM Distribution, L.P., NGAM Advisors, L.P. or Loomis, Sayles & Company, L.P. are omitted, if not materially different from a trustee’s or officer’s current position with such entity. |
71 |
Item 2. Code of Ethics.
The Registrant has adopted a code of ethics that applies to the Registrant’s principal executive officer, principal financial officer and persons performing similar functions. There have been no amendments or waivers of the Registrant’s code of ethics during the period.
Item 3. Audit Committee Financial Expert.
The Board of Trustees of the Registrant has established an audit committee. Mr. Kenneth A. Drucker, Mr Richard A. Goglia, Mr. Wendell J. Knox and Mr. Erik R. Sirri are members of the audit committee and have been designated as “audit committee financial experts” by the Board of Trustees. Each of these individuals is also an Independent Trustee of the Registrant.
Item 4. Principal Accountant Fees and Services.
Fees billed by the Principal Accountant for services rendered to the Registrant.
The table below sets forth fees billed by the principal accountant, PricewaterhouseCoopers LLP, for the past two fiscal years for professional services rendered in connection with a) the audit of the Registrant’s annual financial statements and services provided in connection with regulatory filings; b) audit-related services (including services that are reasonably related to the performance of the audit of the Registrant’s financial statements and but not reported under “Audit Fees”); c) tax compliance, tax advice and tax planning and d) all other fees billed for professional services rendered by the principal accountant to the Registrant, other than the services reported as a part of (a) through (c) of this Item.
| | | | | | | | | | | | | | | | | | | | | | | | | | | | | | | | |
| | | Audit fees | | | Audit-related fees1 | | | Tax fees2 | | | All other fees3 | |
| | | 10/1/13-
9/30/14 | | | 10/1/14-
9/30/15 | | | 10/1/13-
9/30/14 | | | 10/1/14-
9/30/15 | | | 10/1/13-
9/30/14 | | | 10/1/14-
9/30/15 | | | 10/1/13-
9/30/14 | | | 10/1/14-
9/30/15 | |
Loomis Sayles Funds II | | $ | 382,158 | | | $ | 364,796 | | | $ | 4,886 | | | $ | 4,574 | | | $ | 85,916 | | | $ | 130,087 | | | $ | — | | | $ | | |
| 1. | Audit-related fees consist of: |
2014 & 2015 – performance of agreed-upon procedures related to the Registrant’s deferred compensation plan.
2014 & 2015 – review of Registrant’s tax returns, tax consulting services and review of liquidating fund distributions.
Aggregate fees billed to the Registrant for non-audit services during 2014 and 2015 were $90,802 and $134,662, respectively.
Fees billed by the Principal Accountant for services rendered to the Adviser and Control Affiliates.
The following table sets forth the fees billed by the Registrant’s principal accountant for non-audit services rendered to Loomis, Sayles & Company, L.P. and entities controlling, controlled by or under common control with Loomis, Sayles & Company, L.P. Registrant (“Control Affiliates”) that provide ongoing services to the Registrant, for engagements that related directly to the operations and financial reporting of the Registrant for the last two fiscal years.
| | | | | | | | | | | | | | | | | | | | | | | | |
| | | Audit-related fees | | | Tax fees | | | All other fees | |
| | | 10/1/13-
9/30/14 | | | 10/1/14-
9/30/15 | | | 10/1/13-
9/30/14 | | | 10/1/14-
9/30/15 | | | 10/1/13-
9/30/14 | | | 10/1/14-
9/30/15 | |
Control Affiliates | | $ | — | | | $ | — | | | $ | — | | | $ | — | | | $ | — | | | $ | — | |
The following table sets forth the aggregate fees billed by the Registrant’s principal accountant for non-audit services rendered to Loomis, Sayles & Company, L.P. and Control Affiliates that provide ongoing services to the Registrant, for the last two fiscal years, including the fees disclosed in the table above.
| | | | | | | | |
| | | Aggregate Non-Audit Fees | |
| | | 10/1/13-
9/30/14 | | | 10/1/14-
9/30/15 | |
Control Affiliates | | $ | 228,621 | | | $ | 50,066 | |
None of the services described above were approved pursuant to (c)(7)(i)(C) of Regulation S-X.
Audit Committee Pre Approval Policies.
Annually, the Registrant’s Audit Committee reviews the audit, audit-related, tax and other non-audit services together with the projected fees, for services proposed to be rendered to the Trust and/or other entities for which pre-approval is required during the upcoming year. Any subsequent revisions to already pre-approved services or fees (including fee increases) and requests for pre-approval of new services would be presented for consideration quarterly as needed.
If, in the opinion of management, a proposed engagement by the Registrant’s independent accountants needs to commence before the next regularly scheduled Audit Committee meeting, any member of the Audit Committee who is an independent Board member is authorized to pre-approve the engagement, but only for engagements to provide audit, audit related and tax services. This approval is subject to review of the full Audit Committee at its next quarterly meeting. All other engagements require the approval of all the members of the Audit Committee.
Item 5. Audit Committee of Listed Registrants.
Not applicable.
Item 6. Schedule of Investments.
Included as part of the Report to Shareholders filed as Item 1 herewith.
Item 7. Disclosure of Proxy Voting Policies and Procedures for Closed-End Management Investment Companies.
Not applicable.
Item 8. Portfolio Managers of Closed-End Management Investment Companies
Not applicable.
Item 9. Purchases of Equity Securities by Closed-End Management Investment Companies and Affiliated Purchasers.
Not applicable.
Item 10. Submission of Matters to a Vote of Securities Holders.
There were no material changes to the procedures by which shareholders may recommend nominees to the Registrant’s Board of Trustees.
Item 11. Controls and Procedures.
The Registrant’s principal executive officer and principal financial officer have concluded that the Registrant’s disclosure controls and procedures are sufficient to ensure that information required to be disclosed by the Registrant in this Form N-CSR was recorded, processed, summarized and reported within the time periods specified in the Securities and Exchange Commission’s rules and forms, based upon such officers’ evaluation of these controls and procedures as of a date within 90 days of the filing date of the report.
There were no changes in the Registrant’s internal control over financial reporting that occurred during the Registrant’s last fiscal quarter of the period covered by the report that has materially affected, or is reasonably likely to materially affect, the Registrant’s internal control over financial reporting.
Item 12. Exhibits.
| | | | | | |
| | (a) | | (1) | | Code of Ethics required by Item 2 hereof, filed herewith as Exhibit (a)(1). |
| | | |
| | (a) | | (2) | | Certifications of Principal Executive Officer and Principal Financial Officer pursuant to Rule 30a-2(a) under the Investment Company Act of 1940 (17 CFR 270.30a-2(a)), filed herewith as Exhibits (a)(2)(1) and (a)(2)(2), respectively. |
| | | |
| | (a) | | (3) | | Not applicable. |
| | | |
| | (b) | | | | Certification of Principal Executive Officer and Principal Financial Officer pursuant to Section 906 of Sarbanes-Oxley Act of 2002 are filed herewith as Exhibit (b). |
SIGNATURES
Pursuant to the requirements of the Securities Exchange Act of 1934 and the Investment Company Act of 1940, the Registrant has duly caused this report to be signed on its behalf by the undersigned, thereunto duly authorized.
| | |
| Loomis Sayles Funds II |
| |
| By: | | /s/ David L. Giunta |
| Name: | | David L. Giunta |
| Title: | | President and Chief Executive Officer |
| Date: | | November 20, 2015 |
Pursuant to the requirements of the Securities Exchange Act of 1934 and the Investment Company Act of 1940, this report has been signed by the following persons on behalf of the Registrant and in the capacities and on the dates indicated.
| | |
| By: | | /s/ David L. Giunta |
| Name: | | David L. Giunta |
| Title: | | President and Chief Executive Officer |
| Date: | | November 20, 2015 |
| |
| By: | | /s/ Michael C. Kardok |
| Name: | | Michael C. Kardok |
| Title: | | Treasurer |
| Date: | | November 20, 2015 |