UNITED STATES
SECURITIES AND EXCHANGE COMMISSION
Washington, D.C. 20549
FORM N-CSR
CERTIFIED SHAREHOLDER REPORT OF REGISTERED
MANAGEMENT INVESTMENT COMPANIES
Investment Company Act file number: 811-06241
Loomis Sayles Funds II
(Exact name of Registrant as specified in charter)
399 Boylston Street, Boston, Massachusetts 02116
(Address of principal executive offices) (Zip code)
Coleen Downs Dinneen, Esq.
NGAM Distribution, L.P.
399 Boylston Street
Boston, Massachusetts 02116
(Name and address of agent for service)
Registrant’s telephone number, including area code: (617) 449-2810
Date of fiscal year end: September 30
Date of reporting period: September 30, 2013
| Item 1. | Reports to Stockholders. |
The Registrant’s annual report transmitted to shareholders pursuant to Rule 30e-1 under the Investment Company Act of 1940 is as follows:
ANNUAL REPORT
September 30, 2013

Loomis Sayles Global Equity and Income Fund
Loomis Sayles Growth Fund
Loomis Sayles Mid Cap Growth Fund
Loomis Sayles Value Fund
TABLE OF CONTENTS
Portfolio Review page 1
Portfolio of Investments page 27
Financial Statements page 55
Notes to Financial Statements page 69
LOOMIS SAYLES GLOBAL EQUITY AND INCOME FUND
| | |
| Managers | | Symbols |
| Daniel J. Fuss, CFA, CIC | | Class A LGMAX |
| Warren N. Koontz, CFA, CIC* | | Class C LGMCX |
| Eileen N. Riley, CFA** | | Class Y LSWWX |
| David Rolley, CFA | | |
| Lee M. Rosenbaum** | | |
| Loomis, Sayles & Company, L.P. |
| * | Effective April 11, 2013, Warren N. Koontz no longer serves as a portfolio manager of the Fund. |
| ** | Eileen N. Riley, CFA and Lee M. Rosenbaum became portfolio managers of the Fund effective April 11, 2013. |
Objective
Seeks high total investment return through a combination of capital appreciation and current income
Strategy
Under normal circumstances, invests 80% of its net assets in equity and fixed-income securities of U.S. and foreign issuers, including securities of issuers located in emerging markets
Market Conditions
Developed equity markets rallied during the 12-month period, while fears of rising interest rates hurt many fixed-income markets. In the United States, the S&P 500 Index® trended higher on the back of rising consumer sentiment. European markets responded well to improving economic conditions despite slowing forecasts for corporate earnings. Although emerging market stocks generally rallied strongly in September 2013, earlier setbacks kept the year-to-date return negative and the 12-month return barely positive as of September 30, 2013.
Comments from the U.S. Federal Reserve (the Fed) and speculation about Fed policy, particularly in the second half of the reporting period, generally drove fixed-income performance for the 12-month period. The Fed introduced volatility and caution into the global fixed-income markets by hinting at a potential winding down of its program of monthly mortgage and Treasury security purchases, known as quantitative easing (QE). The magnitude of the resulting selloff and the overall disruption to risk markets tightened financial conditions significantly. Based on the Fed’s announcement, investors anticipated the Fed would begin tapering QE following the central bank’s September policy meeting. However, the Fed surprised markets and decided to delay the taper while softening its forward guidance. This announcement led to a rally in equities, emerging currencies and fixed-income markets.
1 |
Performance Results
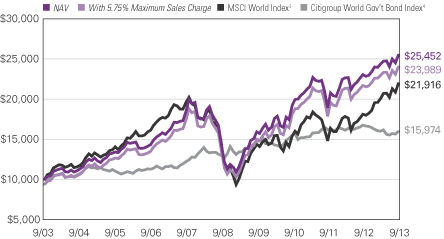
For the 12 months ended September 30, 2013, Class A shares of Loomis Sayles Global Equity and Income Fund returned 10.54% at net asset value. The fund underperformed its primary benchmark, the Morgan Stanley Capital International (MSCI) World Index, which returned 20.90%. The fund outpaced its secondary benchmark, the Citigroup World Government Bond Index, which returned -4.60%.
Explanation of Fund Performance
Weak performance from several out-of-benchmark emerging market equity holdings detracted from return. Although the fund’s fixed-income holdings posted positive results, the effect was not enough to offset the fund’s overall underperformance, as the fund maintains a larger overall weight in equities.
Within the fund’s equity component, an underweight position in the telecommunication sector and stock selection in the materials sector were the main detractors from results. Relative to the fund’s benchmark, stock selection in the energy, healthcare and utilities sectors was positive. However, these gains were largely offset by stock selection in consumer discretionary and financials stocks. We ended the period with overweight positions in the United States and United Kingdom and an underweight position in Japan. Throughout the period we increased exposure to North America and trimmed exposure to emerging markets — a result of our investment process, which continually looks for quality companies that trade at attractive valuations and have the ability to grow their intrinsic value.
In terms of individual stock holdings, Citigroup, a diversified financial services company, was the leading contributor, as positive industry data boosted many financial stocks during the first half of the year. We believe the company remains positioned for targeted growth and stability. In addition, a position in Priceline, an online travel service company, performed well due to rapid expansion in hotel listings and strong growth in its booking.com brand in the United States. A position in Roche, a Swiss pharmaceutical company, also was a top contributor. The company’s stock benefited from positive incremental data presented at the European Society for Medical Oncology (ESMO) as well as growing speculation about a deal with rival Novartis to sell its stake back to Roche.
Outperformance in the fund’s fixed-income component was due primarily to security selection in corporate bonds and favorable currency positioning. In particular, underweight positions in Australia’s dollar and Japan’s yen aided performance. Positioning in the industrials and financials sectors along with government securities also added to return.
Apple, the U.S.-based computer and electronic device maker, was the single largest individual performance detractor for the period. Throughout the summer, Apple faced product- and legal-related headwinds that muted returns overall. However, recent events have turned positive with the launch of the iPhone 5S and iPhone 5C and favorable resolutions to several legal issues. In addition, the fund’s holdings in Canada’s Potash Corporation of Saskatchewan, a producer of potash and other fertilizers, declined after OAO Uralkali, the world’s largest potash producer, ended its relationship with its distribution and trading organization. This change in market dynamics, and the heightened
| 2
LOOMIS SAYLES GLOBAL EQUITY AND INCOME FUND
risks to potash pricing, negatively influenced our downside view of the company, and we sold the stock. Elsewhere, U.K.-based mining company Antofagasta also detracted from performance, declining after the company warned copper and gold output would fall due to increased production costs. We sold the position.
In the fixed-income component, the fund’s bias toward U.S. local markets, combined with substantial underweight positions in European and Japanese local markets, detracted from performance. Issue selection within the utility sector and U.S. dollar yield curve (a curve that shows the relationship among bond yields across the maturity spectrum) positioning also detracted from relative performance.
Outlook
In the equity market, we continue to estimate earnings growth in the mid single-digit range this year and next. While margin expansion from recessionary lows has largely played out, the evidence tends to support our view that margins should remain healthy in an environment of moderate but steady gross domestic product growth. Dividends are expected to grow at a double-digit rate in 2013 and likely in 2014. The potential for dividend growth and moderately higher equity prices could provide equity investors with two opportunities over time. While the Fed has refrained from tapering QE for now, investors should prepare for an eventual return to a more normal interest rate environment with a federal funds rate above the zero lower bound. If yields gradually normalize on the basis of improved economic growth with contained inflation, equity investors should be able to adjust to the changing environment and use periodic average corrections as opportunities to add to favored positions.
We also believe the credit cycle is in the early stage of expansion. Bond yields should rise as the global economy continues to improve, but we expect the pace of growth to be inconsistent. Overall, this likely means corporate bonds will continue to outperform Treasuries. We remain comfortable with the fund’s overweight position in the corporate sector and will continue to look for companies with strong fundamentals and favorable risk/reward profiles. Among currencies, we continue to favor the U.S. dollar versus the euro or yen, as we see better relative growth opportunities in the United States. Due to our concerns about slow growth in China, we remain increasingly cautious toward non-Japan Asian currencies. Recent volatility in emerging markets has restored some value, but security selection remains critical in identifying promising long-term positions.
3 |
Growth of $10,000 Investment in Class A Shares1,5
September 30, 2003 through September 30, 2013
| 4
LOOMIS SAYLES GLOBAL EQUITY AND INCOME FUND
Average Annual Total Returns — September 30, 20135
| | | | | | | | | | | | |
| | | | |
| | | 1 Year | | | 5 Years | | | 10 Years | |
| | | | |
| Class A (Inception 2/1/06)1 | | | | | | | | | | | | |
| NAV | | | 10.54 | % | | | 11.97 | % | | | 9.79 | % |
| With 5.75% Maximum Sales Charge | | | 4.20 | | | | 10.65 | | | | 9.14 | |
| | | | |
| Class C (Inception 2/1/06)1 | | | | | | | | | | | | |
| NAV | | | 9.77 | | | | 11.15 | | | | 8.98 | |
| With CDSC2 | | | 8.77 | | | | 11.15 | | | | 8.98 | |
| | | | |
| Class Y (Inception 5/1/96) | | | | | | | | | | | | |
| NAV | | | 10.90 | | | | 12.26 | | | | 10.07 | |
| | | | |
| Comparative Performance | | | | | | | | | | | | |
| MSCI World Index3 | | | 20.90 | | | | 8.46 | | | | 8.16 | |
| Citigroup World Government Bond Index4 | | | -4.60 | | | | 4.25 | | | | 4.79 | |
Past performance does not guarantee future results. The table(s) do not reflect taxes shareholders might owe on any fund distributions or when they redeem their shares. Performance for periods less than one year is cumulative, not annualized. Returns reflect changes in share price and reinvestment of dividends and capital gains, if any. Unlike a fund, an index is not managed and does not reflect fees and expenses.
NOTES TO CHARTS
| 1 | Prior to the inception of Class A and C shares (2/1/06), performance is that of Institutional Class shares, which were redesignated as Class Y shares, and restated to reflect the higher net expenses and sales loads of Class A and C shares. |
| 2 | Performance for Class C shares assumes a 1% contingent deferred sales charge (“CDSC”) applied when you sell shares within one year of purchase. |
| 3 | MSCI World Index is an unmanaged index that is designed to measure the equity market performance of developed markets. |
| 4 | Citigroup World Government Bond Index is an unmanaged index that includes the most significant and liquid government bond markets globally that carry at least an investment-grade rating. |
| 5 | Fund performance has been increased by fee waivers and/or expense reimbursements, if any, without which performance would have been lower. |
5 |
LOOMIS SAYLES GROWTH FUND
| | |
| Manager | | Symbols |
| Aziz Hamzaogullari, CFA | | Class A LGRRX |
| Loomis, Sayles & Company, L.P. | | Class B LGRBX |
| | Class C LGRCX |
| | Class N LGRNX |
| | Class Y LSGRX |
Objective
Long-term growth of capital
Strategy
Under normal circumstances invests primarily in equity securities, including common stocks, convertible securities, and warrants; focuses on stocks of large-capitalization companies, but may invest in companies of any size
Market Conditions
Equities generally performed well across the board in the third quarter. The Russell 1000® Growth Index returned more than 19% through September, surpassing expectations at the start of the year. Slow but steady economic growth in the United States, support from the Federal Reserve and more recently, signs of potentially better growth in Europe and Asia have been important positive catalysts.
Performance Results
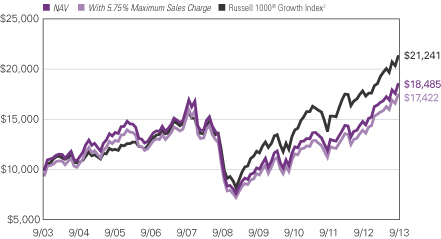
For the 12 months ended September 30, 2013, Class A shares of Loomis Sayles Growth Fund returned 25.23% at net asset value. The fund outperformed its benchmark, the Russell 1000® Growth Index, which returned 19.27%.
Explanation of Fund Performance
Stock selection in the information technology, financials and consumer staples sectors primarily accounted for the fund’s outperformance relative to its benchmark. Stock selection in the healthcare sector and our allocations to the industrials, consumer discretionary and energy sectors were the largest detractors from relative performance.
Facebook, a social networking provider and one of our top ten holdings, was the largest contributor to performance during the period. We first purchased Facebook in 2012 at the company’s initial public offering and have added to the fund’s position on price weakness. Facebook reported strong results, with all key metrics above consensus expectation. The company’s mobile platform was the primary driver of performance. Facebook also continued to show strong user growth, positive engagement trends, product innovation and good financials. In addition, a position in ARM Holdings, the leading supplier of semiconductor processor intellectual property, was a positive contributor to the fund’s return. ARM
| 6
LOOMIS SAYLES GROWTH FUND
Holdings has seen strong growth in its licensing business, which will drive future royalty revenue growth. Key product announcements from Apple and Samsung validated ARM’s next-generation products. Overall revenue increased with expansion in operating margins, driving even faster operating income growth. We believe ARM Holdings continues to trade at a discount to our estimate of intrinsic value based on our long-term fundamental analysis. The fund’s position in SEI Investments, a leading provider of investment management services and fully outsourced processing solutions to global financial institutions, also was a top performer. New sales were up 77% during the period, which is a positive indicator for revenue growth. All business segments reported growth, with new sales activity in the institutional investor category returning to pre-financial-crisis levels. SEI continues to offer an attractive reward-to-risk opportunity based on our estimate of intrinsic value.
A position in online jeweler Blue Nile was the largest performance detractor during the period. Blue Nile’s new management team has been shifting its strategic focus to the fashion-driven jewelry segment and away from its original core business, the diamond engagement market. We sold the fund’s position due to negative structural changes to our initial investment thesis, which resulted in a lower estimate of intrinsic value. A position in energy drink company Monster Beverage was an additional detractor. Monster, along with the entire energy drink industry, faced negative press regarding the safety of energy drinks, especially for children. This negative press spilled into European markets, softening consumption levels and weakening growth in international markets. We continue to believe Monster is well positioned in a fast-growing segment and in the long run should benefit from strong revenue growth and expanding profit margins. A position in Greenhill & Co., a boutique investment bank, also detracted from performance. Greenhill reported lower-than-expected earnings due to continued weakness in merger-and-acquisition activity and higher compensation due to new hires. We believe that Greenhill is thinking long term by taking advantage of ongoing industry weakness to add talent to its team. Although it compounded the company’s overall weak financial performance, we believe the hiring strategy should improve the company’s long-term opportunity.
Outlook
Our investment process is characterized by bottom-up, fundamental research and a long-term time horizon. The nature of the process creates a portfolio with lower turnover, in which sector positioning is derived from our fundamental research. This approach led to overweight positions in the financials, information technology and healthcare sectors and underweight positions in the industrials, consumer discretionary, energy and consumer staples sectors. We remain committed to our long-term investment approach.
7 |
Growth of $10,000 Investment in Class A Shares3
September 30, 2003 through September 30, 2013
| 8
LOOMIS SAYLES GROWTH FUND
Average Annual Total Returns — September 30, 20133
| | | | | | | | | | | | | | | | |
| | | | | |
| | | 1 Year | | | 5 Years | | | 10 Years | | | Since
Class N
Inception | |
| | | | | |
| Class A (Inception 12/31/96) | | | | | | | | | | | | | | | | |
| NAV | | | 25.23 | % | | | 10.27 | % | | | 6.34 | % | | | — | % |
| With 5.75% Maximum Sales Charge | | | 17.97 | | | | 8.95 | | | | 5.71 | | | | — | |
| | | | | |
| Class B (Inception 9/12/03) | | | | | | | | | | | | | | | | |
| NAV | | | 24.14 | | | | 9.47 | | | | 5.54 | | | | — | |
| With CDSC1 | | | 19.14 | | | | 9.19 | | | | 5.54 | | | | — | |
| | | | | |
| Class C (Inception 9/12/03) | | | | | | | | | | | | | | | | |
| NAV | | | 24.21 | | | | 9.48 | | | | 5.54 | | | | — | |
| With CDSC1 | | | 23.21 | | | | 9.48 | | | | 5.54 | | | | — | |
| | | | | |
| Class N (Inception 2/1/13) | | | | | | | | | | | | | | | | |
| NAV | | | — | | | | — | | | | — | | | | 12.93 | |
| | | | | |
| Class Y (Inception 5/16/91) | | | | | | | | | | | | | | | | |
| NAV | | | 25.49 | | | | 10.65 | | | | 6.69 | | | | — | |
| | | | | |
| Comparative Performance | | | | | | | | | | | | | | | | |
| Russell 1000® Growth Index2 | | | 19.27 | | | | 12.07 | | | | 7.82 | | | | 14.70 | |
Past performance does not guarantee future results. The table(s) do not reflect taxes shareholders might owe on any fund distributions or when they redeem their shares. Performance for periods less than one year is cumulative, not annualized. Returns reflect changes in share price and reinvestment of dividends and capital gains, if any. Unlike a fund, an index is not managed and does not reflect fees and expenses.
NOTES TO CHARTS
| 1 | Performance for Class B shares assumes a maximum of 5% contingent deferred sales charge (“CDSC”) applied when you sell shares, which declines annually between years 1-6 according to the following schedule: 5, 4, 3, 3, 2, 1, 0%. Class C shares performance assumes a 1% CDSC applied when you sell shares within one year of purchase. |
| 2 | Russell 1000® Growth Index is an unmanaged index that measures the performance of the large-cap growth segment of the U.S. equity universe. It includes those Russell 1000 companies with higher price-to-book ratios and higher forecasted growth values. |
| 3 | Fund performance has been increased by fee waivers and/or expense reimbursements, if any, without which performance would have been lower. |
9 |
LOOMIS SAYLES MID CAP GROWTH FUND
| | |
| Manager | | Symbols |
| Philip C. Fine, CFA | | Class A LAGRX |
| Loomis, Sayles & Company, L.P. | | Class C LSACX |
| | Class N LSANX |
| | Class Y LSAIX |
Objective
Long-term capital growth from investments in common stocks or similar securities
Strategy
Normally invests 80% of its net assets in common stocks or other equity securities; focuses on stocks of companies that fall within the capitalization range of the companies included in the Russell Midcap® Growth Index, but may invest the rest of its assets in companies of any size.
Market Conditions
Stocks started the period on a negative note, as equities sold off immediately following the November 2012 presidential election. Fears of the “fiscal cliff” — a combination of tax increases and spending cuts scheduled to take effect January 1, 2013 — drove the selloff. Ultimately, policymakers agreed to a deal to avert the worst of the fiscal cliff scenario, and stocks generally remained on an upswing for the remainder of the period.
Federal Reserve (Fed) Chairman Ben Bernanke rattled the financial markets in June 2013 by suggesting the Fed might begin to scale back its quantitative easing (QE) as early as September and perhaps terminate the program by mid 2014 should the economy and labor markets continue to improve. In response, investors rotated out of defensive stocks (utilities, healthcare, staples) that led the rally for much of the first half of 2013 and into more cyclical stocks (financials, technology). But, following its September policy meeting, the Fed shocked the financial markets when it said financial conditions were not strong enough to warrant a reduction in stimulus. Stocks rallied on the news the Fed would continue its $85 billion monthly bond purchases. In the final days of the quarter, the rally stalled, as failed federal budget negotiations gave way to an October 1 federal government shutdown.
Performance Results
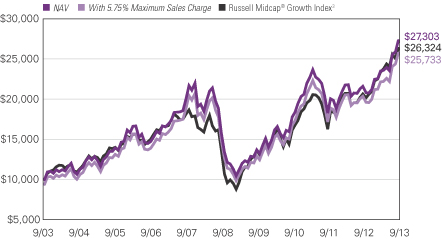
For the 12 months ended September 30, 2013, Class A shares of Loomis Sayles Mid Cap Growth Fund returned 26.39% at net asset value. The fund underperformed its benchmark, the Russell Midcap® Growth Index, which returned 27.54%.
Explanation of Fund Performance
The fund slightly lagged its benchmark during the 12-month period, primarily due to weakness from the overall allocation effect (sector weights, cash holdings, options hedges). By contrast, the fund benefited from strong stock selection, particularly within the information technology,
| 10
LOOMIS SAYLES MID CAP GROWTH FUND
energy and industrials sectors. Stock selection within healthcare, and to a lesser extent the consumer discretionary sector, created a drag on relative performance. The consumer discretionary sector made the largest contribution to the fund’s gains, led by positions in Lions Gate Entertainment, a leading independent film and television producer and distributor, and Melco Crown Entertainment (Melco), an operator of casinos in Macau. Lions Gate has posted several strong quarters, and expectations have been building for a strong fourth-quarter release schedule, paced by “Catching Fire,” the next installment of the “Hunger Games” franchise. For Melco, visitation to Macau has been robust, and the company has been gaining market share in the lucrative mass-market segment. It also entered into a joint venture to open a casino in the Philippines.
The technology and energy sectors made the greatest contributions to return relative to the benchmark. LinkedIn, the leading online professional network with more than 200 million members globally, was the largest contributor in technology. The company has increased user engagement by offering new features and functionality. It continued to report strong results, driven primarily by gains in its key talent solutions segment (licenses to corporate accounts). The fund’s strongest contributor in energy was Cabot Oil & Gas, a leading exploration and production company. The firm recently reported another strong quarter, split its stock for a second time, doubled its dividend and increased production guidance for 2013.
Corrections in the fund’s biotech holdings led to underperformance in the healthcare sector. In particular, several of 2012’s big winners, Alexion Pharmaceuticals and Medivation, began to sell off in late 2012. Alexion reported a disappointing third quarter 2012. While earnings modestly exceeded expectations, revenues were only in-line with expectations for the first time in several years. Medivation has transitioned from the clinical to commercial stage with the recent launch of a drug for metastatic prostate cancer that was approved for post-chemotherapy use. After a strong run-up prior to approval, the shares corrected as investors took profits ahead of the launch.
An overweight position in homebuilders triggered underperformance in the consumer discretionary sector. After a strong fourth quarter 2012, the fund’s homebuilders experienced a modest correction during the spring. A more severe selloff began in late June, when mortgage rates increased in response to the Fed’s potential tapering plans. In particular, D.R. Horton, the nation’s largest homebuilder, reported strong margins but disappointing orders. In the information technology sector, a position in Zillow, operator of a leading real estate information website, weighed on performance. The company has been the target of short sellers, who have questioned its business model and reticence to disclose key operating metrics. The firm issued disappointing fourth-quarter guidance with respect to revenues and margins.
The fund held several small derivatives positions for hedging purposes. In the fourth quarter of 2012, we held a Russell 2000 ETF put spread (a long position in an out-of-the-money put combined with a short position in a put with a lower strike price) to hedge against political and fiscal cliff risk during the post-election selloff and puts on the S&P Homebuilders sector ETF to hedge the fund’s large exposure to homebuilders. In the third quarter of 2013, we bought out-of-the-money puts on Medivation as a hedge against the risk of failure in a key clinical trial. We also bought calls on Cobalt International Energy to
11 |
gain investment exposure to several high impact exploratory drilling programs. While the fund’s derivative positions detracted modestly from return, all instruments behaved as expected, with the puts offering downside protection in a rising market. We continue to own the puts on Medivation and the calls on Cobalt.
Outlook
We continue to estimate earnings growth in the mid single-digit range this year and next. While margin expansion from recessionary lows has largely played out, the evidence tends to support our view that margins should remain healthy in an environment of moderate but steady gross domestic product growth. Dividends are expected to grow at a double-digit rate in 2013 and likely in 2014 as well. The potential for dividend growth and moderately higher equity prices could provide equity investors with two opportunities over time. While the Fed has refrained from tapering its monthly bond-buying purchases, known as QE for now, investors should prepare for an eventual return to a more normal interest rate environment with a federal funds rate above the zero lower bound. If yields normalize gradually, on the basis of improved economic growth with contained inflation, equity investors should be able to adjust to the changing environment and use periodic average corrections as opportunities to add to favored positions.
| 12
LOOMIS SAYLES MID CAP GROWTH FUND
Growth of $10,000 Investment in Class A Shares1,4
September 30, 2003 through September 30, 2013
13 |
Average Annual Total Returns — September 30, 20134
| | | | | | | | | | | | | | | | |
| | | | | |
| | | 1 Year | | | 5 Years | | | 10 Years | | | Since Class N
Inception | |
| | | | | |
| Class A (Inception 12/31/96)1 | | | | | | | | | | | | | | | | |
| NAV | | | 26.39 | % | | | 11.52 | % | | | 10.56 | % | | | — | % |
| With 5.75% Maximum Sales Charge | | | 19.12 | | | | 10.21 | | | | 9.91 | | | | — | |
| | | | | |
| Class C (Inception 2/2/09)1 | | | | | | | | | | | | | | | | |
| NAV | | | 25.46 | | | | 10.70 | | | | 9.71 | | | | — | |
| With CDSC2 | | | 24.46 | | | | 10.70 | | | | 9.71 | | | | — | |
| | | | | |
| Class N (Inception 2/1/13) | | | | | | | | | | | | | | | | |
| NAV | | | — | | | | — | | | | — | | | | 20.51 | |
| | | | | |
| Class Y (Inception 12/31/96) | | | | | | | | | | | | | | | | |
| NAV | | | 26.72 | | | | 11.82 | | | | 10.84 | | | | — | |
| | | | | |
| Comparative Performance | | | | | | | | | | | | | | | | |
| Russell Midcap® Growth Index3 | | | 27.54 | | | | 13.92 | | | | 10.16 | | | | 16.97 | |
Past performance does not guarantee future results. The table(s) do not reflect taxes shareholders might owe on any fund distributions or when they redeem their shares. Performance for periods less than one year is cumulative, not annualized. Returns reflect changes in share price and reinvestment of dividends and capital gains, if any. Unlike a fund, an index is not managed and does not reflect fees and expenses.
NOTES TO CHARTS
| 1 | Prior to 2/1/09, performance of Class A shares is that of Retail Class shares, which were redesignated as Class A shares, restated to reflect the sales load of Class A shares. Prior to the inception of Class C shares (2/2/09), performance is that of Retail Class shares, restated to reflect the higher net expenses and sales loads of Class C shares. The fund revised its investment strategies on 2/1/07; performance may have been different had the current strategies been in place for all periods shown. |
| 2 | Class C shares performance assumes a 1% CDSC applied when you sell shares within one year of purchase. |
| 3 | Russell Midcap® Growth Index is an unmanaged index that measures the performance of the mid-cap growth segment of the U.S. equity universe. It includes those Russell Midcap Index companies with higher price-to-book ratios and higher forecasted growth values. |
| 4 | Fund performance has been increased by fee waivers and/or expense reimbursements, if any, without which performance would have been lower. |
| 14
LOOMIS SAYLES VALUE FUND
| | | | |
| Managers | | Symbols | | |
| Arthur Barry, CFA | | Class A | | LSVRX |
| James L. Carroll, CFA* | | Class B | | LSVBX |
| Warren N. Koontz, CFA, CIC | | Class C | | LSCVX |
| Loomis, Sayles & Company, L.P. | | Class N | | LSVNX |
| | Class Y | | LSGIX |
| | Admin Class | | LSAVX |
| * | Effective September 30, 2013, James L. Carroll no longer serves as a portfolio manager of the Fund. |
Objective
Long-term growth of capital and income
Strategy
Under normal conditions invests primarily in equity securities, including common stocks, convertible securities, and warrants.
Market Conditions
The U.S. stock market generated strong performance during the 12-month period. All major stock indexes continued to trend higher, while consumer sentiment improved worldwide. The U.S. equity market has returned to price-to-earnings valuation levels comparable to its 50-year average. Profit margins were healthy, and market consensus expects them to remain so going forward. As the period progressed, U.S. investors returned to equity mutual funds following a long stretch of net redemptions.
Performance Results
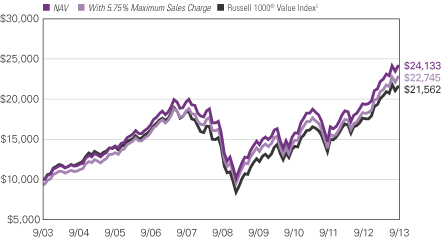
For the 12 months ended September 30, 2013, Class A shares of Loomis Sayles Value Fund returned 24.35% at net asset value. The fund outperformed its benchmark, the Russell 1000® Value Index, which returned 22.30% for the period.
Explanation of Fund Performance
The most significant driver of the fund’s outperformance was stock selection, particularly in the energy, financials, materials, industrials and telecommunication services sectors. An underweight in the utilities sector also boosted performance. Stock selection in the information technology sector was the primary detractor from relative performance, mostly due to owning Apple, the computer and electronic device maker.
State Street and JPMorgan were two of the top three performers for the fund. Strong fee revenues, robust share buybacks and market appreciation inflows have led to solid earnings for State Street Corporation. JPMorgan also recently reported better-than-expected earnings on the back of a larger reserve release and slightly better-than-expected investment
15 |
banking and trading revenue. Ameriprise was a solid performer throughout the period, primarily due to net new inflows and increased client activity. The company also continued to return capital to shareholders through share repurchases and dividends while maintaining a strong financial foundation. All three stocks were overweights relative to the index.
Although this past 12-month period was not Apple’s strongest, the company countered the skeptics with the arrival of the iPhone 5S and as a lower-end model, the 5C, in September. We think sales of these products, plus other potential catalysts, such as additional share buybacks, a dividend commitment and an agreement with China Mobile to sell iPhones, make the stock attractive at this level. In addition, an overweight position in FirstEnergy, a public utility company, weighed on fund performance. Data released in the summer indicated weak demand and excess generation supply will keep power prices low in certain areas for a long time. This led to weak stock performance for large electricity generators, including FirstEnergy. The fund’s exposure to Verizon, a telecommunication company, also detracted from performance. Concerns about discounting and increased competition from wireless peers pressured Verizon stock. Nevertheless, we believe the company remains attractive from a long-term perspective.
Outlook
As always, we will look for individual securities we believe offer attractive return potential by selling below our estimates of intrinsic value. We will seek to enter these stock positions when the downside risk seems limited or manageable.
| 16
LOOMIS SAYLES VALUE FUND
Growth of $10,000 Investment in Class A Shares1,4
September 30, 2003 through September 30, 2013
17 |
Average Annual Total Returns — September 30, 20134
| | | | | | | | | | | | | | | | |
| | | | | |
| | | 1 Year | | | 5 Years | | | 10 Years | | | Since
Class N Inception | |
| | | | | |
| Class A (Inception 6/30/06)1 | | | | | | | | | | | | | | | | |
| NAV | | | 24.35 | % | | | 8.71 | % | | | 9.21 | % | | | — | % |
| With 5.75% Maximum Sales Charge | | | 17.21 | | | | 7.44 | | | | 8.57 | | | | — | |
| | | | | |
| Class B (Inception 6/1/07)1 | | | | | | | | | | | | | | | | |
| NAV | | | 23.42 | | | | 7.91 | | | | 8.33 | | | | — | |
| With CDSC2 | | | 18.42 | | | | 7.61 | | | | 8.33 | | | | — | |
| | | | | |
| Class C (Inception 6/1/07)1 | | | | | | | | | | | | | | | | |
| NAV | | | 23.41 | | | | 7.91 | | | | 8.34 | | | | — | |
| With CDSC2 | | | 22.41 | | | | 7.91 | | | | 8.34 | | | | — | |
| | | | | |
| Class N (Inception 2/1/13) | | | | | | | | | | | | | | | | |
| NAV | | | — | | | | — | | | | — | | | | 13.55 | |
| | | | | |
| Class Y (Inception 5/13/91) | | | | | | | | | | | | | | | | |
| NAV | | | 24.65 | | | | 9.00 | | | | 9.52 | | | | — | |
| | | | | |
| Admin Class (Inception 2/1/10)1 | | | | | | | | | | | | | | | | |
| NAV | | | 24.08 | | | | 8.45 | | | | 8.92 | | | | — | |
| | | | | |
| Comparative Performance | | | | | | | | | | | | | | | | |
| Russell 1000® Value Index3 | | | 22.30 | | | | 8.86 | | | | 7.99 | | | | 12.07 | |
Past performance does not guarantee future results. The table(s) do not reflect taxes shareholders might owe on any fund distributions or when they redeem their shares. Performance for periods less than one year is cumulative, not annualized. Returns reflect changes in share price and reinvestment of dividends and capital gains, if any. Unlike a fund, an index is not managed and does not reflect fees and expenses.
NOTES TO CHARTS
| 1 | Prior to 6/1/07, performance of Class A shares is that of Retail Class shares, which were redesignated as Class A shares, restated to reflect the sales load of Class A shares. Prior to the inception of Retail Class shares (6/30/06), performance is that of Institutional Class shares, which were redesignated as Class Y shares, restated to reflect the higher net expenses and sales loads of Class A shares. Prior to the inception of Class B and C shares (6/1/07), performance is that of Institutional Class shares, restated to reflect the higher net expenses and sales loads of Class B and C shares. Prior to the inception of Admin Class shares (2/1/10), performance is that of Class A shares, restated to reflect the higher net expenses of Admin Class shares. |
| 2 | Performance for Class B shares assumes a maximum of 5% contingent deferred sales charge (“CDSC”) applied when you sell shares, which declines annually between years 1-6 according to the following schedule: 5, 4, 3, 3, 2, 1, 0%. Class C shares performance assumes a 1% CDSC applied when you sell shares within one year of purchase. |
| 3 | Russell 1000® Value Index is an unmanaged index that measures the performance of the large-cap value segment of the U.S. equity universe. It includes those Russell 1000 companies with lower price-to-book ratios and higher forecasted growth values. |
| 4 | Fund performance has been increased by fee waivers and/or expense reimbursements, if any, without which performance would have been lower. |
| 18
ADDITIONAL INFORMATION
The views expressed in this report reflect those of the portfolio managers as of the dates indicated. The managers’ views are subject to change at any time without notice based on changes in market or other conditions. References to specific securities or industries should not be regarded as investment advice. Because these funds are actively managed, there is no assurance that they will continue to invest in the securities or industries mentioned.
ADDITIONAL INDEX INFORMATION
This document may contain references to third party copyrights, indexes, and trademarks, each of which is the property of its respective owner. Such owner is not affiliated with Natixis Global Asset Management or any of its related or affiliated companies (collectively “NGAM”) and does not sponsor, endorse or participate in the provision of any NGAM services, funds or other financial products.
The index information contained herein is derived from third parties and is provided on an “as is” basis. The user of this information assumes the entire risk of use of this information. Each of the third party entities involved in compiling, computing or creating index information disclaims all warranties (including, without limitation, any warranties of originality, accuracy, completeness, timeliness, non-infringement, merchantability and fitness for a particular purpose) with respect to such information.
PROXY VOTING INFORMATION
A description of the funds’ proxy voting policies and procedures is available without charge, upon request, by calling Natixis Funds at 800-225-5478; on the funds’ website at ngam.natixis.com; and on the Securities and Exchange Commission’s website at www.sec.gov. Information regarding how the funds voted proxies relating to portfolio securities during the 12-month period ended June 30, 2013 is available from the funds’ website and the SEC’s website.
QUARTERLY PORTFOLIO SCHEDULES
The funds will file a complete schedule of portfolio holdings with the SEC for the first and third quarters of each fiscal year on Form N-Q. The funds’ Forms N-Q are available on the SEC’s website at www.sec.gov and may be reviewed and copied at the SEC’s Public Reference Room in Washington, DC. Information on the operation of the Public Reference Room may be obtained by calling
800-SEC-0330.
19 |
UNDERSTANDING FUND EXPENSES
As a mutual fund shareholder, you incur different types of costs: transaction costs, including sales charges (loads) on purchases and contingent deferred sales charges on redemptions, and ongoing costs, including management fees, distribution and/or service fees (12b-1 fees), and other fund expenses. These costs are described in more detail in the funds’ prospectus. The examples below are intended to help you understand the ongoing costs of investing in the funds and help you compare these with the ongoing costs of investing in other mutual funds.
The first line in the table for each class shows the actual amount of fund expenses you would have paid on a $1,000 investment in the fund from April 1, 2013 through September 30, 2013. It also shows how much a $1,000 investment would be worth at the close of the period, assuming actual fund returns and expenses. To estimate the expenses you paid over the period, simply divide your account value by $1,000 (for example, $8,600 account value divided by $1,000 = 8.6) and multiply the result by the number in the Expenses Paid During Period row as shown below for your class.
The second line in the table for each class provides information about hypothetical account values and hypothetical expenses based on the fund’s actual expense ratios and an assumed rate of return of 5% per year before expenses, which is not the fund’s actual return. The hypothetical account values and expenses may not be used to estimate the actual ending account balance or expenses you paid on your investment for the period. You may use this information to compare the ongoing costs of investing in the fund and other funds. To do so, compare this 5% hypothetical example with the 5% hypothetical examples that appear in the shareholder reports of the other funds.
Please note that the expenses shown reflect ongoing costs only, and do not include any transaction costs, such as sales charges. Therefore, the second line in the table of each fund is useful in comparing ongoing costs only, and will not help you determine the relative costs of owning different funds. If transaction costs were included, total costs would be higher.
| | | | | | | | | | | | |
LOOMIS SAYLES GLOBAL EQUITY AND
INCOME FUND | | BEGINNING
ACCOUNT VALUE
4/1/2013 | | | ENDING
ACCOUNT VALUE
9/30/2013 | | | EXPENSES PAID
DURING PERIOD*
4/1/2013 – 9/30/2013 | |
| Class A | | | | | | | | | | | | |
| Actual | | $ | 1,000.00 | | | $ | 1,045.00 | | | $ | 6.05 | |
| Hypothetical (5% return before expenses) | | $ | 1,000.00 | | | $ | 1,019.15 | | | $ | 5.97 | |
| Class C | | | | | | | | | | | | |
| Actual | | $ | 1,000.00 | | | $ | 1,041.40 | | | $ | 9.88 | |
| Hypothetical (5% return before expenses) | | $ | 1,000.00 | | | $ | 1,015.39 | | | $ | 9.75 | |
| Class Y | | | | | | | | | | | | |
| Actual | | $ | 1,000.00 | | | $ | 1,046.50 | | | $ | 4.77 | |
| Hypothetical (5% return before expenses) | | $ | 1,000.00 | | | $ | 1,020.41 | | | $ | 4.71 | |
| * | Expenses are equal to the Fund’s annualized expense ratio: 1.18%, 1.93% and 0.93% for Class A, C and Y, respectively, multiplied by the average account value over the period, multiplied by the number of days in the most recent fiscal half-year (183), divided by 365 (to reflect the half-year period). |
| 20
| | | | | | | | | | | | |
| LOOMIS SAYLES GROWTH FUND | | BEGINNING
ACCOUNT VALUE
4/1/2013 | | | ENDING
ACCOUNT VALUE
9/30/2013 | | | EXPENSES PAID
DURING PERIOD*
4/1/2013 – 9/30/2013 | |
| Class A | | | | | | | | | | | | |
| Actual | | | $1,000.00 | | | | $1,108.50 | | | | $5.34 | |
| Hypothetical (5% return before expenses) | | | $1,000.00 | | | | $1,020.00 | | | | $5.11 | |
| Class B | | | | | | | | | | | | |
| Actual | | | $1,000.00 | | | | $1,103.60 | | | | $9.28 | |
| Hypothetical (5% return before expenses) | | | $1,000.00 | | | | $1,016.24 | | | | $8.90 | |
| Class C | | | | | | | | | | | | |
| Actual | | | $1,000.00 | | | | $1,103.80 | | | | $9.28 | |
| Hypothetical (5% return before expenses) | | | $1,000.00 | | | | $1,016.24 | | | | $8.90 | |
| Class N | | | | | | | | | | | | |
| Actual | | | $1,000.00 | | | | $1,108.80 | | | | $5.02 | |
| Hypothetical (5% return before expenses) | | | $1,000.00 | | | | $1,020.31 | | | | $4.81 | |
| Class Y | | | | | | | | | | | | |
| Actual | | | $1,000.00 | | | | $1,110.10 | | | | $4.02 | |
| Hypothetical (5% return before expenses) | | | $1,000.00 | | | | $1,021.26 | | | | $3.85 | |
| * | Expenses are equal to the Fund’s annualized expense ratio (after waiver/reimbursement): 1.01%, 1.76%, 1.76%, 0.95% and 0.76% for Class A, B, C, N and Y, respectively, multiplied by the average account value over the period, multiplied by the number of days in the most recent fiscal half-year (183), divided by 365 (to reflect the half-year period). |
| | | | | | | | | | | | |
| LOOMIS SAYLES MID CAP GROWTH FUND | | BEGINNING
ACCOUNT VALUE
4/1/2013 | | | ENDING
ACCOUNT VALUE
9/30/2013 | | | EXPENSES PAID
DURING PERIOD*
4/1/2013 – 9/30/2013 | |
| Class A | | | | | | | | | | | | |
| Actual | | | $1,000.00 | | | | $1,161.90 | | | | $6.77 | |
| Hypothetical (5% return before expenses) | | | $1,000.00 | | | | $1,018.80 | | | | $6.33 | |
| Class C | | | | | | | | | | | | |
| Actual | | | $1,000.00 | | | | $1,157.70 | | | | $10.82 | |
| Hypothetical (5% return before expenses) | | | $1,000.00 | | | | $1,015.04 | | | | $10.10 | |
| Class N | | | | | | | | | | | | |
| Actual | | | $1,000.00 | | | | $1,163.80 | | | | $5.15 | |
| Hypothetical (5% return before expenses) | | | $1,000.00 | | | | $1,020.31 | | | | $4.81 | |
| Class Y | | | | | | | | | | | | |
| Actual | | | $1,000.00 | | | | $1,163.40 | | | | $5.42 | |
| Hypothetical (5% return before expenses) | | | $1,000.00 | | | | $1,020.05 | | | | $5.06 | |
| * | Expenses are equal to the Fund’s annualized expense ratio (after waiver/reimbursement): 1.25%, 2.00%, 0.95% and 1.00% for Class A, C, N and Y, respectively, multiplied by the average account value over the period, multiplied by the number of days in the most recent fiscal half-year (183), divided by 365 (to reflect the half-year period). |
21 |
| | | | | | | | | | | | |
| LOOMIS SAYLES VALUE FUND | | BEGINNING
ACCOUNT VALUE
4/1/2013 | | | ENDING
ACCOUNT VALUE
9/30/2013 | | | EXPENSES PAID
DURING PERIOD*
4/1/2013 – 9/30/2013 | |
| Class A | | | | | | | | | | | | |
| Actual | | $ | 1,000.00 | | | $ | 1,087.50 | | | $ | 5.02 | |
| Hypothetical (5% return before expenses) | | $ | 1,000.00 | | | $ | 1,020.26 | | | $ | 4.86 | |
| Class B | | | | | | | | | | | | |
| Actual | | $ | 1,000.00 | | | $ | 1,083.20 | | | $ | 8.93 | |
| Hypothetical (5% return before expenses) | | $ | 1,000.00 | | | $ | 1,016.50 | | | $ | 8.64 | |
| Class C | | | | | | | | | | | | |
| Actual | | $ | 1,000.00 | | | $ | 1,083.40 | | | $ | 8.93 | |
| Hypothetical (5% return before expenses) | | $ | 1,000.00 | | | $ | 1,016.50 | | | $ | 8.64 | |
| Class N | | | | | | | | | | | | |
| Actual | | $ | 1,000.00 | | | $ | 1,088.70 | | | $ | 2.98 | |
| Hypothetical (5% return before expenses) | | $ | 1,000.00 | | | $ | 1,022.21 | | | $ | 2.89 | |
| Class Y | | | | | | | | | | | | |
| Actual | | $ | 1,000.00 | | | $ | 1,088.70 | | | $ | 3.72 | |
| Hypothetical (5% return before expenses) | | $ | 1,000.00 | | | $ | 1,021.51 | | | $ | 3.60 | |
| Admin Class | | | | | | | | | | | | |
| Actual | | $ | 1,000.00 | | | $ | 1,086.50 | | | $ | 6.17 | |
| Hypothetical (5% return before expenses) | | $ | 1,000.00 | | | $ | 1,019.15 | | | $ | 5.97 | |
| * | Expenses are equal to the Fund’s annualized expense ratio: 0.96%, 1.71%, 1.71%, 0.57%, 0.71% and 1.18% for Class A, B, C, N, Y and Admin Class, respectively, multiplied by the average account value over the period, multiplied by the number of days in the most recent fiscal half-year (183), divided by 365 (to reflect the half-year period). |
| 22
BOARD APPROVAL OF THE EXISTING ADVISORY AGREEMENTS
The Board of Trustees of the Trust (the “Board”), including the Independent Trustees, considers matters bearing on each Fund’s advisory agreement (collectively, the “Agreements”) at most of its meetings throughout the year. Each year, usually in the spring, the Contract Review and Governance Committee of the Board meets to review the Agreements to determine whether to recommend that the full Board approve the continuation of the Agreements, typically for an additional one-year period. After the Committee has made its recommendation, the full Board, including the Independent Trustees, determines whether to approve the continuation of the Agreements.
In connection with these meetings, the Trustees receive materials that the Funds’ investment adviser (the “Adviser”) believes to be reasonably necessary for the Trustees to evaluate the Agreements. These materials generally include, among other items, (i) information on the investment performance of the Funds and the performance of peer groups of funds and the Funds’ performance benchmarks, (ii) information on the Funds’ advisory fees and other expenses, including information comparing the Funds’ expenses to the fees charged to institutional accounts with similar strategies managed by the Adviser, if any, and to those of peer groups of funds and information about any applicable expense caps and fee “breakpoints,” (iii) sales and redemption data in respect of the Funds, (iv) information about the profitability of the Agreements to the Adviser and (v) information obtained through the completion by the Adviser of a questionnaire distributed on behalf of the Trustees. The Board, including the Independent Trustees, also consider other matters such as (i) the Adviser’s financial results and financial condition, (ii) each Fund’s investment objective and strategies and the size, education and experience of the Adviser’s investment staff and its use of technology, external research and trading cost measurement tools, (iii) arrangements in respect of the distribution of the Funds’ shares and the related costs, (iv) the procedures employed to determine the value of the Funds’ assets, (v) the allocation of the Funds’ brokerage, if any, including, if applicable, allocations to brokers affiliated with the Adviser and the use of “soft” commission dollars to pay Fund expenses and to pay for research and other similar services, (vi) the resources devoted to, and the record of compliance with, the Funds’ investment policies and restrictions, policies on personal securities transactions and other compliance policies, (vii) information about amounts invested by the Funds’ portfolio managers in the Funds or in similar accounts that they manage and (viii) the general economic outlook with particular emphasis on the mutual fund industry. Throughout the process, the Trustees are afforded the opportunity to ask questions of and request additional materials from the Adviser.
In addition to the materials requested by the Trustees in connection with their annual consideration of the continuation of the Agreements, the Trustees receive materials in advance of each regular quarterly meeting of the Board that provide detailed information about the Funds’ investment performance and the fees charged to the Funds for advisory and other services. This information generally includes, among other things, an internal performance rating for each Fund based on agreed-upon criteria, graphs showing each Fund’s performance and fee differentials against each Fund’s peer group/category, performance ratings provided by a third-party, total return information for various periods, and third-party performance rankings for various periods comparing a Fund against
23 |
similarly categorized funds. The portfolio management team for each Fund or other representatives of the Adviser make periodic presentations to the Contract Review and Governance Committee and/or the full Board, and Funds identified as presenting possible performance concerns may be subject to more frequent board presentations and reviews. In addition, each quarter the Trustees are provided with detailed statistical information about each Fund’s portfolio. The Trustees also receive periodic updates between meetings.
The Board most recently approved the continuation of the Agreements at their meeting held in June 2013. The Agreements were continued for a one-year period for the Funds. In considering whether to approve the continuation of the Agreements, the Board, including the Independent Trustees, did not identify any single factor as determinative. Individual Trustees may have evaluated the information presented differently from one another, giving different weights to various factors. Matters considered by the Trustees, including the Independent Trustees, in connection with their approval of the Agreements included, but were not limited to, the factors listed below.
The nature, extent and quality of the services provided to the Funds under the Agreements. The Trustees considered the nature, extent and quality of the services provided by the Adviser and its affiliates to the Funds and the resources dedicated to the Funds by the Adviser and its affiliates.
The Trustees considered not only the advisory services provided by the Adviser to the Funds, but also the administrative services provided by NGAM Advisors, L.P. (“NGAM Advisors”) and its affiliates to the Funds. For each Fund, the Trustees also considered the benefits to shareholders of investing in a mutual fund that is part of a family of funds that offers shareholders the right to exchange shares of one type of fund for shares of another type of fund, and provides a variety of fund and shareholder services.
After reviewing these and related factors, the Trustees concluded, within the context of their overall conclusions regarding each of the Agreements, that the nature, extent and quality of services provided supported the renewal of the Agreements.
Investment performance of the Funds and the Adviser. As noted above, the Trustees received information about the performance of the Funds over various time periods, including information that compared the performance of the Funds to the performance of peer groups and categories of funds and the Funds’ respective performance benchmarks. In addition, the Trustees also reviewed data prepared by an independent third party that analyzed the performance of the Funds using a variety of performance metrics, including metrics that also measured the performance of the Funds on a risk adjusted basis.
With respect to each Fund, the Board concluded that the Fund’s performance or other relevant factors supported the renewal of the Agreement relating to that Fund. In the case of each Fund that had performance that lagged that of a relevant peer group median and/or category median for certain (although not necessarily all) periods, the Board concluded that other factors relevant to performance supported renewal of the Agreements. These factors included one or more of the following: (1) that the underperformance was attributable, to a significant extent, to investment decisions (such as security selection or sector allocation) by the Adviser that were reasonable and consistent with the Fund’s investment objective and policies; (2) that the Fund’s more recent performance was competitive when compared to its relevant performance benchmarks and peer group category; and (3) that the Fund’s performance, although lagging in certain recent periods, was stronger over the long term.
| 24
The Trustees also considered the Adviser’s performance and reputation generally, the performance of the fund family generally, and the historical responsiveness of the Adviser to Trustee concerns about performance and the willingness of the Adviser to take steps intended to improve performance.
After reviewing these and related factors, the Trustees concluded, within the context of their overall conclusions regarding each of the Agreements, that the performance of the Funds and the Adviser supported the renewal of the Agreements.
The costs of the services to be provided and profits to be realized by the Adviser and its affiliates from their respective relationships with the Funds. The Trustees considered the fees charged to the Funds for advisory services as well as the total expense levels of the Funds. This information included comparisons (provided both by management and also by an independent third party) of the Funds’ advisory fees and total expense levels to those of their peer groups and information about the advisory fees charged by the Adviser to comparable accounts (such as institutional separate accounts), as well as information about differences in such fees and the reasons for any such differences. In considering the fees charged to comparable accounts, the Trustees considered, among other things, management’s representations about the differences between managing mutual funds as compared to other types of accounts, including the additional resources required to effectively manage and the greater regulatory costs associated with the management of mutual fund assets. In evaluating each Fund’s advisory fee, the Trustees also took into account the demands, complexity and quality of the investment management of such Fund and the need for the Adviser to offer competitive compensation. The Trustees considered that over the past several years, management had made recommendations regarding reductions in advisory fee rates, implementation of advisory fee breakpoints and the institution of advisory fee waivers and expense caps for various funds in the fund family. They noted that all four of the Funds included in this report have expense caps in place, and the Trustees considered the amounts waived or reimbursed by the Adviser under these caps for each Fund whose current expenses are above the cap.
The Trustees also considered the compensation directly or indirectly received by the Adviser and its affiliates from their relationships with the Funds. The Trustees reviewed information provided by management as to the profitability of the Adviser’s and its affiliates’ relationships with the Funds, and information about the allocation of expenses used to calculate profitability. They also reviewed information provided by management about the effect of distribution costs and changes in asset levels on Adviser profitability, including information regarding resources spent on distribution activities. When reviewing profitability, the Trustees also considered information about court cases in which adviser compensation or profitability were issues, the performance of the relevant Funds, the expense levels of the Funds, and whether the Adviser had implemented breakpoints and/or expense caps with respect to such Funds.
After reviewing these and related factors, the Trustees concluded, within the context of their overall conclusions regarding each of the Agreements, that the advisory fee charged to each of the Funds was fair and reasonable, and that the costs of these services generally and the related profitability of the Adviser and its affiliates in respect of their relationships with the Funds supported the renewal of the Agreements.
25 |
Economies of Scale. The Trustees considered the existence of any economies of scale in the provision of services by the Adviser and whether those economies are shared with the Funds through breakpoints in their investment advisory fees or other means, such as expense waivers or caps. The Trustees also discussed with management the factors considered with respect to the implementation of breakpoints in investment advisory fees or expense waivers or caps for certain funds. Management explained that a number of factors are taken into account in considering the possible implementation of breakpoints or an expense cap for a fund, including, among other things, factors such as a fund’s assets, the projected growth of a fund, projected profitability and a fund’s fees and performance. With respect to economies of scale, the Trustees noted that each of the Funds was subject to an expense cap or waiver. In considering these issues, the Trustees also took note of the costs of the services provided (both on an absolute and a relative basis) and the profitability to the Adviser and its affiliates of their relationships with the Funds, as discussed above.
After reviewing these and related factors, the Trustees concluded, within the context of their overall conclusions regarding each of the Agreements, that the extent to which economies of scale were shared with the Funds supported the renewal of the Agreements.
The Trustees also considered other factors, which included but were not limited to the following:
| · | | The effect of recent market and economic events on the performance, asset levels and expense ratios of each Fund. |
| · | | Whether each Fund has operated in accordance with its investment objective and the Fund’s record of compliance with its investment restrictions, and the compliance programs of the Funds and the Adviser. They also considered the compliance-related resources the Adviser and its affiliates were providing to the Funds. |
| · | | The nature, quality, cost and extent of administrative and shareholder services performed by the Adviser and its affiliates, both under the Agreements and under separate agreements covering administrative services. |
| · | | So-called “fallout benefits” to the Adviser, such as the engagement of affiliates of the Adviser to provide distribution, administrative and brokerage services to the Funds, and the benefits of research made available to the Adviser by reason of brokerage commissions (if any) generated by the Funds’ securities transactions. The Trustees also considered the fact that NGAM Advisors’ parent company benefits from the retention of an affiliated Adviser. The Trustees considered the possible conflicts of interest associated with these fallout and other benefits, and the reporting, disclosure and other processes in place to disclose and monitor such possible conflicts of interest. |
| · | | The Trustees’ review and discussion of the Funds’ advisory arrangements in prior years, and management’s record of responding to Trustee concerns raised during the year and in prior years. |
Based on their evaluation of all factors that they deemed to be material, including those factors described above, and assisted by the advice of independent counsel, the Trustees, including the Independent Trustees, concluded that each of the existing Agreements should be continued through June 30, 2014.
| 26
Portfolio of Investments – as of September 30, 2013
Loomis Sayles Global Equity and Income Fund
| | | | | | | | |
| Shares | | | Description | | Value (†) | |
| | Common Stocks — 67.9% of Net Assets | | | | |
| | | | Belgium — 1.5% | | | | |
| | 177,107 | | | Anheuser-Busch InBev NV | | $ | 17,568,611 | |
| | | | | | | | |
| | | | Brazil — 0.6% | | | | |
| | 527,700 | | | Mills Estruturas e Servicos de Engenharia S.A. | | | 7,228,702 | |
| | | | | | | | |
| | | | Canada — 1.1% | | | | |
| | 348,600 | | | CGI Group, Inc., Class A(b) | | | 12,234,251 | |
| | | | | | | | |
| | | | Chile — 0.6% | | | | |
| | 759,310 | | | S.A.C.I. Falabella | | | 7,242,066 | |
| | | | | | | | |
| | | | China — 1.3% | | | | |
| | 1,300,000 | | | Hengan International Group Co. Ltd. | | | 15,212,973 | |
| | | | | | | | |
| | | | Germany — 3.9% | | | | |
| | 183,099 | | | Adidas AG | | | 19,861,052 | |
| | 109,467 | | | Bayer AG, (Registered) | | | 12,909,535 | |
| | 77,643 | | | Brenntag AG | | | 12,925,663 | |
| | | | | | | | |
| | | | | | | 45,696,250 | |
| | | | | | | | |
| | | | Japan — 1.2% | | | | |
| | 530,700 | | | Asahi Group Holdings Ltd. | | | 13,971,015 | |
| | | | | | | | |
| | | | Mexico — 1.3% | | | | |
| | 6,550,700 | | | Genomma Lab Internacional S.A. de CV, Class B(b) | | | 14,953,582 | |
| | | | | | | | |
| | | | Russia — 0.8% | | | | |
| | 240,740 | | | Mail.ru Group Ltd., GDR(c) | | | 9,184,231 | |
| | | | | | | | |
| | | | Sweden — 1.3% | | | | |
| | 527,029 | | | Atlas Copco AB, Class A | | | 15,439,069 | |
| | | | | | | | |
| | | | Switzerland — 2.1% | | | | |
| | 90,501 | | | Roche Holding AG | | | 24,423,811 | |
| | | | | | | | |
| | | | Thailand — 1.0% | | | | |
| | 900,400 | | | Bangkok Bank PCL | | | 5,674,613 | |
| | 413,700 | | | Siam Cement PCL | | | 5,694,338 | |
| | | | | | | | |
| | | | | | | 11,368,951 | |
| | | | | | | | |
| | | | Turkey — 0.6% | | | | |
| | 1,918,691 | | | Turkiye Garanti Bankasi AS | | | 7,568,843 | |
| | | | | | | | |
| | | | United Kingdom — 11.1% | | | | |
| | 1,887,092 | | | Aberdeen Asset Management PLC | | | 11,557,299 | |
| | 221,349 | | | British American Tobacco PLC | | | 11,649,440 | |
| | 347,695 | | | Burberry Group PLC | | | 9,200,427 | |
| | 732,984 | | | Diageo PLC | | | 23,299,668 | |
| | 388,891 | | | Hikma Pharmaceuticals PLC | | | 6,543,315 | |
| | 1,265,491 | | | HSBC Holdings PLC | | | 13,696,859 | |
| | 5,747,596 | | | Legal & General Group PLC | | | 18,238,010 | |
| | 438,776 | | | Shire PLC | | | 17,553,094 | |
| | 721,999 | | | Standard Chartered PLC | | | 17,297,454 | |
| | | | | | | | |
| | | | 129,035,566 | |
| | | | | | | | |
See accompanying notes to financial statements.
27 |
Portfolio of Investments – as of September 30, 2013
Loomis Sayles Global Equity and Income Fund – (continued)
| | | | | | | | |
| Shares | | | Description | | Value (†) | |
| | | | United States — 39.5% | |
| | 182,362 | | | ACE Ltd. | | $ | 17,061,789 | |
| | 228,828 | | | American Express Co. | | | 17,281,091 | |
| | 39,095 | | | Apple, Inc. | | | 18,638,541 | |
| | 30,319 | | | AutoZone, Inc.(b) | | | 12,816,751 | |
| | 350,360 | | | Cabot Oil & Gas Corp. | | | 13,075,435 | |
| | 466,159 | | | Citigroup, Inc. | | | 22,613,373 | |
| | 46,194 | | | Core Laboratories NV | | | 7,816,487 | |
| | 136,771 | | | CVS Caremark Corp. | | | 7,761,754 | |
| | 177,583 | | | Deere & Co. | | | 14,453,480 | |
| | 87,118 | | | EOG Resources, Inc. | | | 14,747,335 | |
| | 180,180 | | | Genesee & Wyoming, Inc., Class A(b) | | | 16,751,335 | |
| | 103,803 | | | Gilead Sciences, Inc.(b) | | | 6,522,980 | |
| | 70,542 | | | Goldman Sachs Group, Inc. (The) | | | 11,160,450 | |
| | 25,701 | | | Google, Inc., Class A(b) | | | 22,511,763 | |
| | 146,257 | | | Gulfport Energy Corp.(b) | | | 9,410,175 | |
| | 955 | | | Hawaiian Telcom Holdco, Inc.(b) | | | 25,403 | |
| | 94,427 | | | Jones Lang LaSalle, Inc. | | | 8,243,477 | |
| | 358,557 | | | Lowe’s Cos., Inc. | | | 17,070,899 | |
| | 96,181 | | | M&T Bank Corp. | | | 10,764,577 | |
| | 119,826 | | | National Fuel Gas Co. | | | 8,239,236 | |
| | 129,071 | | | National Oilwell Varco, Inc. | | | 10,081,736 | |
| | 28,883 | | | NewMarket Corp. | | | 8,315,705 | |
| | 255,842 | | | Noble Energy, Inc. | | | 17,143,972 | |
| | 140,006 | | | Praxair, Inc. | | | 16,830,121 | |
| | 73,365 | | | Precision Castparts Corp. | | | 16,671,463 | |
| | 21,972 | | | priceline.com, Inc.(b) | | | 22,212,593 | |
| | 120,459 | | | QUALCOMM, Inc. | | | 8,114,118 | |
| | 181,009 | | | Schlumberger Ltd. | | | 15,993,955 | |
| | 166,200 | | | Signet Jewelers Ltd. | | | 11,908,230 | |
| | 402,196 | | | Texas Instruments, Inc. | | | 16,196,433 | |
| | 122,826 | | | TransDigm Group, Inc. | | | 17,035,966 | |
| | 152,180 | | | UnitedHealth Group, Inc. | | | 10,897,610 | |
| | 129,860 | | | Valspar Corp. (The) | | | 8,237,020 | |
| | 26,818 | | | Vertex Pharmaceuticals, Inc.(b) | | | 2,033,341 | |
| | 327,736 | | | Wyndham Worldwide Corp. | | | 19,982,064 | |
| | | | | | | | |
| | | | 458,620,658 | |
| | | | | | | | |
| | | | Total Common Stocks (Identified Cost $678,736,713) | | | 789,748,579 | |
| | | | | | | | |
Principal Amount (‡) | | | | | | |
| | Bonds and Notes — 27.8% | | | | |
| | Non-Convertible Bonds — 27.0% | | | | |
| | | | Argentina — 0.1% | |
| $ | 170,000 | | | Pan American Energy LLC/Argentine Branch, 7.875%, 5/07/2021, 144A | | | 170,000 | |
| | 500,000 | | | Transportadora de Gas del Sur S.A., 7.875%, 5/14/2017, 144A | | | 452,500 | |
| | | | | | | | |
| | | | 622,500 | |
| | | | | | | | |
See accompanying notes to financial statements.
| 28
Portfolio of Investments – as of September 30, 2013
Loomis Sayles Global Equity and Income Fund – (continued)
| | | | | | | | |
Principal Amount (‡) | | | Description | | Value (†) | |
| | | | Australia — 0.4% | | | | |
| $ | 1,200,000 | | | Macquarie Bank Ltd., 5.000%, 2/22/2017, 144A | | $ | 1,308,720 | |
| | 500,000 | | | Macquarie Bank Ltd., 6.625%, 4/07/2021, 144A | | | 545,150 | |
| | 2,185,000 | | | New South Wales Treasury Corp., 6.000%, 2/01/2018, (AUD)(d) | | | 2,241,176 | |
| | 155,000 | | | Sydney Airport Finance Co., 5.125%, 2/22/2021, 144A | | | 162,930 | |
| | | | | | | | |
| | | | | | | 4,257,976 | |
| | | | | | | | |
| | | | Belgium — 0.1% | | | | |
| | 350,000 | | | Anheuser-Busch InBev NV, EMTN, 6.500%, 6/23/2017, (GBP) | | | 661,563 | |
| | | | | | | | |
| | | | Brazil — 1.8% | | | | |
| | 800,000 | | | Banco do Brasil S.A., 3.875%, 10/10/2022 | | | 692,000 | |
| | 1,100,000 | | | Banco Nacional de Desenvolvimento Economico e Social, 5.750%, 9/26/2023, 144A | | | 1,100,000 | |
| | 400,000 | | | Banco Santander Brasil S.A., 4.500%, 4/06/2015, 144A | | | 409,000 | |
| | 600,000 | | | Banco Santander Brasil S.A., 4.625%, 2/13/2017, 144A | | | 618,000 | |
| | 1,919,970 | | | Banco Votorantim S.A., 6.250%, 5/16/2016, 144A, (BRL) | | | 846,351 | |
| | 800,000 | | | Braskem Finance Ltd., 5.750%, 4/15/2021, 144A | | | 784,000 | |
| | 6,600,000 | | | Brazil Letras do Tesouro Nacional, Zero Coupon, 7/01/2016, (BRL) | | | 2,207,345 | |
| | 693,410(††) | | | Brazil Notas do Tesouro Nacional, Series B, 6.000%, 8/15/2014, (BRL) | | | 319,518 | |
| | 554,728(††) | | | Brazil Notas do Tesouro Nacional, Series B, 6.000%, 5/15/2015, (BRL) | | | 258,184 | |
| | 1,115(†††) | | | Brazil Notas do Tesouro Nacional, Series F, 10.000%, 1/01/2021, (BRL) | | | 464,847 | |
| | 2,250(†††) | | | Brazil Notas do Tesouro Nacional, Series F, 10.000%, 1/01/2019, (BRL) | | | 953,683 | |
| | 2,250,000 | | | Brazilian Government International Bond, 10.250%, 1/10/2028, (BRL) | | | 1,012,668 | |
| | 1,700,000 | | | BRF S.A., 3.950%, 5/22/2023, 144A | | | 1,462,000 | |
| | 600,000 | | | BRF S.A., 5.875%, 6/06/2022, 144A | | | 597,000 | |
| | 2,300,000 | | | BRF S.A., 7.750%, 5/22/2018, 144A, (BRL) | | | 822,429 | |
| | 1,075,000 | | | Caixa Economica Federal, 4.500%, 10/03/2018, 144A | | | 1,065,325 | |
| | 1,255,000 | | | Cielo S.A./Cielo USA, Inc., 3.750%, 11/16/2022, 144A | | | 1,079,300 | |
| | 400,000 | | | CSN Resources S.A., 6.500%, 7/21/2020, 144A | | | 399,000 | |
| | 450,000 | | | Fibria Overseas Finance Ltd., 6.750%, 3/03/2021, 144A | | | 480,150 | |
| | 800,000 | | | Gerdau Trade, Inc., 5.750%, 1/30/2021, 144A | | | 784,000 | |
| | 300,000 | | | Itau Unibanco Holding S.A., 6.200%, 12/21/2021, 144A | | | 300,000 | |
| | 100,000 | | | LPG International, Inc., 7.250%, 12/20/2015 | | | 109,970 | |
| | 185,000 | | | Odebrecht Drilling Norbe VIII/IX Ltd., 6.350%, 6/30/2021, 144A | | | 188,238 | |
| | 900,000 | | | Odebrecht Offshore Drilling Finance Ltd., 6.750%, 10/01/2022, 144A | | | 922,500 | |
| | 2,400,000 | | | Oi S.A., 9.750%, 9/15/2016, 144A, (BRL) | | | 948,391 | |
| | 320,000 | | | Petrobras International Finance Co., 5.375%, 1/27/2021 | | | 321,467 | |
| | 300,000 | | | Petrobras International Finance Co., 6.875%, 1/20/2040 | | | 294,703 | |
| | 800,000 | | | Samarco Mineracao S.A., 4.125%, 11/01/2022, 144A | | | 696,000 | |
| | 129,000 | | | Telemar Norte Leste S.A., 5.500%, 10/23/2020, 144A | | | 113,520 | |
| | 536,000 | | | Vale Overseas Ltd., 6.875%, 11/21/2036 | | | 543,608 | |
| | | | | | | | |
| | | | | | | 20,793,197 | |
| | | | | | | | |
| | | | Canada — 0.9% | | | | |
| | 1,085,000 | | | Air Canada, 7.625%, 10/01/2019, 144A, (CAD) | | | 1,055,980 | |
| | 1,570,000 | | | Bank of Nova Scotia, 1.375%, 12/18/2017 | | | 1,541,205 | |
| | 650,000 | | | Canadian Government, 1.000%, 8/01/2016, (CAD) | | | 623,995 | |
| | 2,880,000 | | | Canadian Government, 3.000%, 12/01/2015, (CAD)(d) | | | 2,901,193 | |
| | 2,695,000 | | | Canadian Government, 4.250%, 6/01/2018, (CAD)(d) | | | 2,900,569 | |
See accompanying notes to financial statements.
29 |
Portfolio of Investments – as of September 30, 2013
Loomis Sayles Global Equity and Income Fund – (continued)
| | | | | | | | |
Principal Amount (‡) | | | Description | | Value (†) | |
| | | | Canada — continued | | | | |
| $ | 875,000 | | | Pacific Rubiales Energy Corp., 5.125%, 3/28/2023, 144A | | $ | 784,219 | |
| | 100,000 | | | Shaw Communications, Inc., 5.650%, 10/01/2019, (CAD) | | | 106,734 | |
| | 600,000 | | | Telus Corp., Series CG, 5.050%, 12/04/2019, (CAD) | | | 636,942 | |
| | | | | | | | |
| | | | | | | 10,550,837 | |
| | | | | | | | |
| | | | Chile — 0.4% | | | | |
| | 1,450,000 | | | Banco de Credito e Inversiones, 3.000%, 9/13/2017, 144A | | | 1,439,869 | |
| | 850,000,000 | | | Banco Santander Chile, 6.500%, 9/22/2020, 144A, (CLP) | | | 1,662,952 | |
| | 200,000 | | | Celulosa Arauco y Constitucion S.A., 4.750%, 1/11/2022 | | | 194,294 | |
| | 1,000,000 | | | Corp Nacional del Cobre de Chile, 4.500%, 8/13/2023, 144A | | | 1,008,103 | |
| | 250,000 | | | E.CL S.A., 5.625%, 1/15/2021, 144A | | | 255,482 | |
| | 800,000 | | | Inversiones CMPC S.A., 4.375%, 5/15/2023, 144A | | | 743,778 | |
| | | | | | | | |
| | | | | | | 5,304,478 | |
| | | | | | | | |
| | | | China — 0.3% | | | | |
| | 800,000 | | | Baidu, Inc., 2.250%, 11/28/2017 | | | 786,874 | |
| | 700,000 | | | Baidu, Inc., 3.250%, 8/06/2018 | | | 699,681 | |
| | 400,000 | | | China Resources Gas Group Ltd., 4.500%, 4/05/2022, 144A | | | 396,276 | |
| | 1,200,000 | | | CNOOC Finance 2013 Ltd., 3.000%, 5/09/2023 | | | 1,078,568 | |
| | 1,000,000 | | | Parkson Retail Group Ltd., 4.500%, 5/03/2018 | | | 920,000 | |
| | | | | | | | |
| | | | | | | 3,881,399 | |
| | | | | | | | |
| | | | Colombia — 0.4% | | | | |
| | 400,000 | | | Banco Davivienda S.A., 5.875%, 7/09/2022, 144A | | | 380,000 | |
| | 555,000 | | | Colombia Telecomunicaciones S.A., E.S.P., 5.375%, 9/27/2022, 144A | | | 510,600 | |
| | 1,180,000 | | | Ecopetrol S.A., 5.875%, 9/18/2023 | | | 1,227,200 | |
| | 1,265,000,000 | | | Emgesa S.A. E.S.P., 8.750%, 1/25/2021, 144A, (COP) | | | 704,669 | |
| | 2,140,000,000 | | | Empresas Publicas de Medellin E.S.P., 8.375%, 2/01/2021, 144A, (COP) | | | 1,169,299 | |
| | 200,000,000 | | | Republic of Colombia, 7.750%, 4/14/2021, (COP) | | | 118,576 | |
| | 40,000 | | | Republic of Colombia, 8.125%, 5/21/2024 | | | 51,650 | |
| | | | | | | | |
| | | | | | | 4,161,994 | |
| | | | | | | | |
| | | | Costa Rica — 0.1% | | | | |
| | 600,000 | | | Costa Rica Government International Bond, 4.250%, 1/26/2023, 144A | | | 537,000 | |
| | 800,000 | | | Costa Rica Government International Bond, 4.375%, 4/30/2025, 144A | | | 696,000 | |
| | | | | | | | |
| | | | | | | 1,233,000 | |
| | | | | | | | |
| | | | Czech Republic — 0.0% | | | | |
| | 400,000 | | | CEZ AS, 4.250%, 4/03/2022, 144A | | | 399,600 | |
| | | | | | | | |
| | | | Finland — 0.2% | | | | |
| | 1,435,000 | | | Finland Government Bond, 1.500%, 4/15/2023, 144A, (EUR) | | | 1,855,922 | |
| | | | | | | | |
| | | | France — 0.0% | | | | |
| | 200,000 | | | AXA S.A., 7.125%, 12/15/2020, (GBP) | | | 382,348 | |
| | | | | | | | |
| | | | Hong Kong — 0.1% | | | | |
| | 400,000 | | | Hutchison Whampoa International 11 Ltd., 3.500%, 1/13/2017, 144A | | | 417,774 | |
| | 400,000 | | | Noble Group Ltd., 6.750%, 1/29/2020, 144A | | | 412,000 | |
| | | | | | | | |
| | | | | | | 829,774 | |
| | | | | | | | |
See accompanying notes to financial statements.
| 30
Portfolio of Investments – as of September 30, 2013
Loomis Sayles Global Equity and Income Fund – (continued)
| | | | | | | | |
Principal Amount (‡) | | | Description | | Value (†) | |
| | | | Hungary — 0.0% | | | | |
| $ | 200,000 | | | Hungary Government International Bond, 6.375%, 3/29/2021 | | $ | 212,750 | |
| | | | | | | | |
| | | | Iceland — 0.1% | | | | |
| | 1,000,000 | | | Republic of Iceland, 5.875%, 5/11/2022, 144A | | | 1,027,500 | |
| | | | | | | | |
| | | | India — 0.2% | | | | |
| | 200,000 | | | Canara Bank Ltd., (fixed rate to 11/28/2016, variable rate thereafter), 6.365%, 11/28/2021 | | | 186,600 | |
| | 1,400,000 | | | ICICI Bank Ltd., (fixed rate to 4/30/2017, variable rate thereafter), 6.375%, 4/30/2022, 144A | | | 1,295,000 | |
| | 700,000 | | | State Bank of India/London, 4.125%, 8/01/2017, 144A | | | 694,719 | |
| | | | | | | | |
| | | | | | | 2,176,319 | |
| | | | | | | | |
| | | | Indonesia — 0.4% | | | | |
| | 200,000 | | | Adaro Indonesia PT, 7.625%, 10/22/2019, 144A | | | 208,400 | |
| | 800,000 | | | Gajah Tunggal Tbk PT, 7.750%, 2/06/2018, 144A | | | 772,000 | |
| | 3,500,000,000 | | | Indonesia Government International Bond, 9.500%, 7/15/2023, (IDR) | | | 317,326 | |
| | 781,000,000 | | | Indonesia Government International Bond, 11.500%, 9/15/2019, (IDR) | | | 77,572 | |
| | 12,100,000,000 | | | Indonesia Treasury Bond, 6.125%, 5/15/2028, (IDR) | | | 821,329 | |
| | 2,800,000 | | | Pertamina Persero PT, 4.300%, 5/20/2023, 144A(d) | | | 2,394,000 | |
| | | | | | | | |
| | | | | | | 4,590,627 | |
| | | | | | | | |
| | | | Ireland — 0.0% | | | | |
| | 100,000 | | | WPP PLC, 6.000%, 4/04/2017, (GBP) | | | 182,600 | |
| | | | | | | | |
| | | | Israel — 0.1% | | | | |
| | 1,580,000 | | | Teva Pharmaceutical Finance Co. BV, 2.950%, 12/18/2022 | | | 1,463,916 | |
| | | | | | | | |
| | | | Italy — 0.5% | | | | |
| | 500,000 | | | Italy Buoni Poliennali Del Tesoro, 4.000%, 2/01/2037, (EUR) | | | 598,271 | |
| | 2,860,000 | | | Italy Buoni Poliennali Del Tesoro, 4.500%, 8/01/2018, (EUR)(d) | | | 4,076,539 | |
| | 400,000 | | | Italy Buoni Poliennali Del Tesoro, 5.000%, 3/01/2022, (EUR) | | | 571,606 | |
| | 125,000 | | | Telecom Italia Capital S.A., 6.000%, 9/30/2034 | | | 102,807 | |
| | 10,000 | | | Telecom Italia Capital S.A., 6.375%, 11/15/2033 | | | 8,589 | |
| | 100,000 | | | Telecom Italia SpA, EMTN, 5.375%, 1/29/2019, (EUR) | | | 137,416 | |
| | | | | | | | |
| | | | | | | 5,495,228 | |
| | | | | | | | |
| | | | Japan — 0.1% | | | | |
| | 1,700,000 | | | Softbank Corp., 4.500%, 4/15/2020, 144A | | | 1,633,700 | |
| | | | | | | | |
| | | | Korea — 0.8% | | | | |
| | 3,700,000 | | | Export-Import Bank of Korea, 3.000%, 5/22/2018, 144A, (NOK) | | | 596,664 | |
| | 8,000,000 | | | Export-Import Bank of Korea, 4.000%, 11/26/2015, 144A, (PHP) | | | 189,343 | |
| | 400,000 | | | Hana Bank, 4.000%, 11/03/2016, 144A | | | 424,237 | |
| | 600,000 | | | Hyundai Capital Services, Inc., 3.500%, 9/13/2017, 144A | | | 623,797 | |
| | 600,000 | | | Hyundai Steel Co., 4.625%, 4/21/2016, 144A | | | 631,535 | |
| | 600,000 | | | Industrial Bank of Korea, 2.375%, 7/17/2017, 144A | | | 601,406 | |
| | 400,000 | | | Kia Motors Corp., 3.625%, 6/14/2016, 144A | | | 418,009 | |
| | 400,000 | | | Korea Finance Corp., 4.625%, 11/16/2021 | | | 422,361 | |
| | 400,000 | | | Korea National Oil Corp., 3.125%, 4/03/2017, 144A | | | 411,178 | |
| | 3,784,140,000 | | | Korea Treasury Bond, 2.750%, 9/10/2017, (KRW)(d) | | | 3,483,731 | |
| | 970,000,000 | | | Korea Treasury Bond, 4.000%, 3/10/2016, (KRW) | | | 926,779 | |
See accompanying notes to financial statements.
31 |
Portfolio of Investments – as of September 30, 2013
Loomis Sayles Global Equity and Income Fund – (continued)
| | | | | | | | |
Principal Amount (‡) | | | Description | | Value (†) | |
| | | | Korea — continued | | | | |
| $ | 250,000 | | | Lotte Shopping Co. Ltd., 3.375%, 5/09/2017, 144A | | $ | 257,138 | |
| | 140,000 | | | SK Telecom Co. Ltd., 6.625%, 7/20/2027, 144A | | | 167,165 | |
| | 200,000 | | | Woori Bank, 5.875%, 4/13/2021, 144A | | | 220,109 | |
| | | | | | | | |
| | | | | | | 9,373,452 | |
| | | | | | | | |
| | | | Luxembourg — 0.2% | | | | |
| | 400,000 | | | Altice Financing S.A., 7.875%, 12/15/2019, 144A | | | 422,000 | |
| | 400,000 | | | ArcelorMittal, 7.250%, 3/01/2041 | | | 366,000 | |
| | 400,000 | | | Cosan Luxembourg S.A., 5.000%, 3/14/2023, 144A | | | 360,000 | |
| | 500,000 | | | INEOS Group Holdings S.A., 6.125%, 8/15/2018, 144A | | | 488,750 | |
| | 500,000 | | | Millicom International Cellular S.A., 4.750%, 5/22/2020, 144A | | | 465,000 | |
| | 400,000 | | | VTB Bank OJSC, 6.000%, 4/12/2017, 144A | | | 421,856 | |
| | | | | | | | |
| | | | | | | 2,523,606 | |
| | | | | | | | |
| | | | Malaysia — 0.2% | | | | |
| | 1,750,000 | | | Malaysia Government Bond, 3.434%, 8/15/2014, (MYR) | | | 539,264 | |
| | 6,540,000 | | | Malaysia Government Bond, 4.012%, 9/15/2017, (MYR) | | | 2,038,610 | |
| | | | | | | | |
| | | | | | | 2,577,874 | |
| | | | | | | | |
| | | | Mexico — 1.3% | | | | |
| | 7,000,000 | | | America Movil SAB de CV, 3.500%, 2/08/2015, (CNY) | | | 1,144,902 | |
| | 10,000,000 | | | America Movil SAB de CV, 6.450%, 12/05/2022, (MXN) | | | 715,192 | |
| | 300,000 | | | Banco Santander Mexico S.A. Institucion de Banca Multiple Grupo Financiero Santander, 4.125%, 11/09/2022, 144A | | | 275,250 | |
| | 600,000 | | | BBVA Bancomer S.A., 6.750%, 9/30/2022, 144A | | | 621,000 | |
| | 10,000,000 | | | Grupo Televisa SAB, EMTN, 7.250%, 5/14/2043, (MXN) | | | 644,662 | |
| | 264,500(††††) | | | Mexican Fixed Rate Bonds, Series M, 6.500%, 6/10/2021, (MXN) | | | 2,113,529 | |
| | 186,200(††††) | | | Mexican Fixed Rate Bonds, Series M, 6.500%, 6/09/2022, (MXN) | | | 1,472,847 | |
| | 424,200(††††) | | | Mexican Fixed Rate Bonds, Series M-10, 7.750%, 12/14/2017, (MXN)(d) | | | 3,617,757 | |
| | 520,000(††††) | | | Mexican Fixed Rate Bonds, Series M-10, 8.500%, 12/13/2018, (MXN)(d) | | | 4,602,752 | |
| | 480,000 | | | Petroleos Mexicanos, 3.500%, 7/18/2018 | | | 486,000 | |
| | | | | | | | |
| | | | | | | 15,693,891 | |
| | | | | | | | |
| | | | Netherlands — 0.4% | | | | |
| | 1,155,000 | | | Bharti Airtel International Netherlands BV, 5.125%, 3/11/2023, 144A | | | 1,033,725 | |
| | 200,000 | | | Indosat Palapa Co. BV, 7.375%, 7/29/2020, 144A | | | 209,000 | |
| | 400,000 | | | Listrindo Capital BV, 6.950%, 2/21/2019, 144A | | | 408,000 | |
| | 500,000 | | | Myriad International Holdings BV, 6.000%, 7/18/2020, 144A | | | 525,000 | |
| | 850,000 | | | Petrobras Global Finance BV, 3.000%, 1/15/2019 | | | 799,357 | |
| | 1,750,000 | | | Petrobras Global Finance BV, 4.375%, 5/20/2023 | | | 1,600,876 | |
| | | | | | | | |
| | | | | | | 4,575,958 | |
| | | | | | | | |
| | | | New Zealand — 0.2% | | | | |
| | 2,340,000 | | | New Zealand Government Bond, 5.000%, 3/15/2019, (NZD) | | | 2,022,432 | |
| | | | | | | | |
| | | | Norway — 0.4% | | | | |
| | 225,000 | | | Eksportfinans ASA, 2.000%, 9/15/2015 | | | 219,375 | |
| | 14,109,000 | | | Norway Government Bond, 2.000%, 5/24/2023, (NOK) | | | 2,184,671 | |
| | 13,760,000 | | | Norway Government Bond, 4.500%, 5/22/2019, (NOK)(d) | | | 2,542,755 | |
| | | | | | | | |
| | | | | | | 4,946,801 | |
| | | | | | | | |
See accompanying notes to financial statements.
| 32
Portfolio of Investments – as of September 30, 2013
Loomis Sayles Global Equity and Income Fund – (continued)
| | | | | | | | |
Principal Amount (‡) | | | Description | | Value (†) | |
| | | | Panama — 0.0% | | | | |
| $ | 300,000 | | | Banco Latinoamericano de Comercio Exterior S.A., 3.750%, 4/04/2017, 144A | | $ | 301,500 | |
| | | | | | | | |
| | | | Peru — 0.1% | | | | |
| | 1,050,000 | | | Transportadora de Gas del Peru S.A., 4.250%, 4/30/2028, 144A | | | 908,250 | |
| | | | | | | | |
| | | | Philippines — 0.2% | | | | |
| | 40,000,000 | | | Philippine Government International Bond, 3.900%, 11/26/2022, (PHP) | | | 920,992 | |
| | 30,000,000 | | | Philippine Government International Bond, 4.950%, 1/15/2021, (PHP) | | | 745,838 | |
| | 175,000 | | | Philippine Long Distance Telephone Co., EMTN, 8.350%, 3/06/2017 | | | 199,938 | |
| | | | | | | | |
| | | | | | | 1,866,768 | |
| | | | | | | | |
| | | | Poland — 0.3% | | | | |
| | 6,965,000 | | | Poland Government Bond, 4.000%, 10/25/2023, (PLN) | | | 2,144,690 | |
| | 2,200,000 | | | Poland Government Bond, 4.750%, 4/25/2017, (PLN) | | | 731,431 | |
| | 95,000 | | | Poland Government International Bond, 3.000%, 9/23/2014, (CHF) | | | 107,768 | |
| | 800,000 | | | Poland Government International Bond, 3.000%, 3/17/2023 | | | 732,800 | |
| | | | | | | | |
| | | | | | | 3,716,689 | |
| | | | | | | | |
| | | | Romania — 0.1% | | | | |
| | 2,650,000 | | | Romania Government Bond, 5.850%, 4/26/2023, (RON) | | | 841,311 | |
| | | | | | | | |
| | | | Russia — 0.0% | | | | |
| | 200,000 | | | Gazprom OAO Via Gaz Capital S.A., 4.950%, 5/23/2016, 144A | | | 211,000 | |
| | | | | | | | |
| | | | Singapore — 0.7% | | | | |
| | 2,000,000 | | | DBS Bank Ltd., (fixed rate to 9/21/2017, variable rate thereafter),
3.625%, 9/21/2022, 144A | | | 2,044,958 | |
| | 950,000 | | | Singapore Government Bond, 2.250%, 6/01/2021, (SGD) | | | 765,713 | |
| | 2,470,000 | | | Singapore Government Bond, 2.500%, 6/01/2019, (SGD) | | | 2,073,944 | |
| | 3,100,000 | | | Singapore Government Bond, 3.250%, 9/01/2020, (SGD)(d) | | | 2,677,802 | |
| | 500,000 | | | TBG Global Pte Ltd., 4.625%, 4/03/2018, 144A | | | 472,500 | |
| | | | | | | | |
| | | | | | | 8,034,917 | |
| | | | | | | | |
| | | | South Africa — 0.2% | | | | |
| | 650,000 | | | AngloGold Ashanti Holdings PLC, 5.125%, 8/01/2022 | | | 547,928 | |
| | 285,000 | | | Republic of South Africa, EMTN, 4.500%, 4/05/2016, (EUR) | | | 410,161 | |
| | 600,000 | | | South Africa Government International Bond, 5.875%, 9/16/2025 | | | 630,750 | |
| | 700,000 | | | Transnet SOC Ltd., 4.000%, 7/26/2022, 144A | | | 617,750 | |
| | | | | | | | |
| | | | | | | 2,206,589 | |
| | | | | | | | |
| | | | Spain — 0.5% | | | | |
| | 820,000 | | | Autonomous Community of Madrid Spain, 4.300%, 9/15/2026, 144A, (EUR) | | | 978,561 | |
| | 1,270,000 | | | Spain Government Bond, 4.200%, 1/31/2037, (EUR) | | | 1,521,612 | |
| | 645,000 | | | Spain Government Bond, 4.300%, 10/31/2019, (EUR) | | | 910,633 | |
| | 1,250,000 | | | Spain Government Bond, 5.850%, 1/31/2022, (EUR) | | | 1,896,730 | |
| | | | | | | | |
| | | | | | | 5,307,536 | |
| | | | | | | | |
| | | | Supranationals — 0.5% | | | | |
| | 840,000 | | | Central American Bank for Economic Integration, 3.875%, 2/09/2017, 144A | | | 863,516 | |
| | 1,115,000 | | | Corp Andina de Fomento, 4.375%, 6/15/2022 | | | 1,110,768 | |
| | 3,225,000 | | | European Financial Stability Facility, 1.625%, 7/17/2020, (EUR) | | | 4,303,738 | |
| | | | | | | | |
| | | | | | | 6,278,022 | |
| | | | | | | | |
See accompanying notes to financial statements.
33 |
Portfolio of Investments – as of September 30, 2013
Loomis Sayles Global Equity and Income Fund – (continued)
| | | | | | | | |
Principal Amount (‡) | | | Description | | Value (†) | |
| | | | Sweden — 0.3% | | | | |
| $ | 400,000 | | | Eileme 2 AB, 11.625%, 1/31/2020 | | $ | 464,000 | |
| | 1,000,000 | | | PKO Finance AB, 4.630%, 9/26/2022, 144A | | | 981,750 | |
| | 9,195,000 | | | Sweden Government Bond, 4.500%, 8/12/2015, 144A, (SEK) | | | 1,518,552 | |
| | 2,450,000 | | | Sweden Government Bond, 5.000%, 12/01/2020, 144A, (SEK) | | | 453,574 | |
| | | | | | | | |
| | | | | | | 3,417,876 | |
| | | | | | | | |
| | | | Thailand — 0.2% | | | | |
| | 950,000 | | | Thai Oil PCL, 3.625%, 1/23/2023, 144A | | | 852,563 | |
| | 62,435,000 | | | Thailand Government Bond, 3.250%, 6/16/2017, (THB) | | | 1,995,697 | |
| | | | | | | | |
| | | | | | | 2,848,260 | |
| | | | | | | | |
| | | | Turkey — 0.5% | | | | |
| | 800,000 | | | Arcelik AS, 5.000%, 4/03/2023, 144A | | | 687,000 | |
| | 600,000 | | | Export Credit Bank of Turkey, 5.375%, 11/04/2016, 144A | | | 618,000 | |
| | 1,600,000 | | | Turkey Government International Bond, 3.250%, 3/23/2023 | | | 1,380,000 | |
| | 1,200,000 | | | Turkey Government International Bond, 5.125%, 3/25/2022 | | | 1,192,500 | |
| | 600,000 | | | Turkiye Garanti Bankasi A.S., 4.000%, 9/13/2017, 144A | | | 585,000 | |
| | 800,000 | | | Turkiye Is Bankasi, 3.875%, 11/07/2017, 144A | | | 767,000 | |
| | 600,000 | | | Yapi ve Kredi Bankasi Via Unicredit Luxembourg S.A.,
5.188%, 10/13/2015, 144A | | | 609,750 | |
| | | | | | | | |
| | | | | | | 5,839,250 | |
| | | | | | | | |
| | | | United Arab Emirates — 0.1% | | | | |
| | 600,000 | | | Dubai Electricity & Water Authority, 6.375%, 10/21/2016, 144A | | | 675,750 | |
| | 200,000 | | | Dubai Electricity & Water Authority, 8.500%, 4/22/2015, 144A | | | 219,500 | |
| | | | | | | | |
| | | | | | | 895,250 | |
| | | | | | | | |
| | | | United Kingdom — 0.5% | | | | |
| | 600,000 | | | Anglo American Capital PLC, 2.625%, 9/27/2017, 144A | | | 589,183 | |
| | 410,000,000 | | | Barclays Bank PLC, EMTN, 3.680%, 8/20/2015, (KRW) | | | 391,705 | |
| | 250,000 | | | BAT International Finance PLC, 3.250%, 6/07/2022, 144A | | | 244,118 | |
| | 150,000 | | | British Telecommunications PLC, 5.750%, 12/07/2028, (GBP) | | | 277,915 | |
| | 60,000 | | | BSKYB Finance UK PLC, 5.750%, 10/20/2017, (GBP) | | | 110,678 | |
| | 150,000 | | | Imperial Tobacco Finance PLC, EMTN, 6.250%, 12/04/2018, (GBP) | | | 283,035 | |
| | 400,000 | | | Old Mutual PLC, EMTN, 8.000%, 6/03/2021, (GBP) | | | 688,674 | |
| | 250,000 | | | Standard Chartered Bank, Series 17, EMTN, 5.875%, 9/26/2017, (EUR) | | | 379,751 | |
| | 705,000 | | | United Kingdom Treasury, 1.750%, 1/22/2017, (GBP) | | | 1,170,189 | |
| | 250,000 | | | United Kingdom Treasury, 4.250%, 3/07/2036, (GBP) | | | 459,415 | |
| | 1,150,000 | | | Vedanta Resources PLC, 6.000%, 1/31/2019, 144A | | | 1,092,500 | |
| | | | | | | | |
| | | | | | | 5,687,163 | |
| | | | | | | | |
| | | | United States — 13.1% | | | | |
| | 240,000 | | | AES Corp., 4.875%, 5/15/2023 | | | 224,400 | |
| | 425,000 | | | Alcatel-Lucent USA, Inc., 6.450%, 3/15/2029 | | | 359,125 | |
| | 15,000 | | | Alcatel-Lucent USA, Inc., 6.500%, 1/15/2028 | | | 12,525 | |
| | 975,000 | | | Alcoa, Inc., 5.900%, 2/01/2027 | | | 942,870 | |
| | 1,325,000 | | | Ally Financial, Inc., 5.500%, 2/15/2017 | | | 1,390,541 | |
| | 257,000 | | | Ally Financial, Inc., 6.750%, 12/01/2014 | | | 269,850 | |
| | 55,000 | | | Ally Financial, Inc., 7.500%, 12/31/2013 | | | 55,756 | |
See accompanying notes to financial statements.
| 34
Portfolio of Investments – as of September 30, 2013
Loomis Sayles Global Equity and Income Fund – (continued)
| | | | | | | | |
Principal Amount (‡) | | | Description | | Value (†) | |
| | | | United States — continued | | | | |
| $ | 129,000 | | | Ally Financial, Inc., 8.000%, 12/31/2018 | | $ | 145,125 | |
| | 1,728,000 | | | Ally Financial, Inc., 8.000%, 11/01/2031 | | | 1,944,000 | |
| | 200,000 | | | American Airlines Pass Through Trust, Series 2013-1, Class A, 4.000%, 1/15/2027, 144A | | | 187,500 | |
| | 720,000 | | | American International Group, Inc., (fixed rate to 5/15/2038, variable rate thereafter), 8.175%, 5/15/2068 | | | 842,760 | |
| | 14,875 | | | Atlas Air Pass Through Trust, Series 1998-1, Class B, 7.680%, 7/02/2015(c) | | | 15,135 | |
| | 925,000 | | | Aviation Capital Group Corp., 6.750%, 4/06/2021, 144A | | | 976,396 | |
| | 145,000 | | | Avnet, Inc., 6.000%, 9/01/2015 | | | 157,175 | |
| | 1,820,000 | | | Ball Corp., 5.000%, 3/15/2022 | | | 1,765,400 | |
| | 200,000 | | | Bank of America Corp., 5.490%, 3/15/2019 | | | 218,245 | |
| | 500,000 | | | Bank of America Corp., EMTN, 4.625%, 8/07/2017, (EUR) | | | 749,010 | |
| | 115,000 | | | Bank of America Corp., MTN, 5.000%, 5/13/2021 | | | 123,514 | |
| | 50,000 | | | Beazer Homes USA, Inc., 7.250%, 2/01/2023 | | | 48,000 | |
| | 15,000 | | | Boston Scientific Corp., 5.125%, 1/12/2017 | | | 16,225 | |
| | 15,000 | | | Boston Scientific Corp., 6.400%, 6/15/2016 | | | 16,842 | |
| | 1,415,000 | | | Cantor Fitzgerald LP, 6.375%, 6/26/2015, 144A | | | 1,464,525 | |
| | 1,995,000 | | | CenturyLink, Inc., 6.450%, 6/15/2021 | | | 1,985,025 | |
| | 510,000 | | | CenturyLink, Inc., 7.650%, 3/15/2042 | | | 453,900 | |
| | 55,000 | | | CenturyLink, Inc., Series G, 6.875%, 1/15/2028 | | | 50,050 | |
| | 605,000 | | | CenturyLink, Inc., Series P, 7.600%, 9/15/2039 | | | 539,962 | |
| | 20,000 | | | Chesapeake Energy Corp., 6.625%, 8/15/2020 | | | 21,500 | |
| | 95,000 | | | Chesapeake Energy Corp., 6.875%, 11/15/2020 | | | 102,600 | |
| | 380,000 | | | Chrysler Group LLC/CG Co-Issuer, Inc., 8.250%, 6/15/2021 | | | 425,600 | |
| | 1,470,000 | | | Clear Channel Worldwide Holdings, Inc., 7.625%, 3/15/2020 | | | 1,517,775 | |
| | 155,000 | | | Cleaver-Brooks, Inc., 8.750%, 12/15/2019, 144A | | | 167,400 | |
| | 1,005,000 | | | Continental Airlines Pass Through Certificates, Series 2012-3, Class C, 6.125%, 4/29/2018 | | | 1,022,587 | |
| | 391,247 | | | Continental Airlines Pass Through Trust, Series 1999-1, Class B, 6.795%, 2/02/2020 | | | 406,408 | |
| | 235,000 | | | Crestview DS Merger Sub II, Inc., 10.000%, 9/01/2021, 144A | | | 242,050 | |
| | 235,000 | | | Cummins, Inc., 5.650%, 3/01/2098 | | | 226,172 | |
| | 222,770 | | | Delta Air Lines Pass Through Trust, Series 2007-1, Class B,
8.021%, 2/10/2024 | | | 241,706 | |
| | 201,409 | | | Delta Air Lines Pass Through Trust, Series 2007-1, Class C,
8.954%, 8/10/2014 | | | 204,430 | |
| | 42,000 | | | Dillard’s, Inc., 6.625%, 1/15/2018 | | | 45,885 | |
| | 50,000 | | | Dillard’s, Inc., 7.000%, 12/01/2028 | | | 50,500 | |
| | 8,000 | | | Dillard’s, Inc., 7.750%, 7/15/2026 | | | 8,680 | |
| | 310,000 | | | DR Horton, Inc., 4.375%, 9/15/2022 | | | 282,100 | |
| | 4,214,118 | | | Energy Future Intermediate Holding Co. LLC/EFIH Finance, Inc.,
11.250% (12.250% PIK), 12/01/2018, 144A(e) | | | 2,781,318 | |
| | 1,725,000 | | | First Data Corp., 10.625%, 6/15/2021, 144A | | | 1,750,875 | |
| | 150,000 | | | Foot Locker, Inc., 8.500%, 1/15/2022(c) | | | 164,699 | |
| | 25,000 | | | Ford Motor Co., 6.375%, 2/01/2029 | | | 27,265 | |
| | 50,000 | | | Ford Motor Co., 6.625%, 2/15/2028 | | | 54,044 | |
| | 2,105,000 | | | Ford Motor Co., 6.625%, 10/01/2028 | | | 2,375,337 | |
| | 40,000 | | | Ford Motor Co., 7.125%, 11/15/2025 | | | 46,591 | |
See accompanying notes to financial statements.
35 |
Portfolio of Investments – as of September 30, 2013
Loomis Sayles Global Equity and Income Fund – (continued)
| | | | | | | | |
Principal Amount (‡) | | | Description | | Value (†) | |
| | | | United States — continued | | | | |
| $ | 835,000 | | | Ford Motor Co., 7.400%, 11/01/2046 | | $ | 999,176 | |
| | 5,000 | | | Ford Motor Co., 7.500%, 8/01/2026 | | | 6,031 | |
| | 1,000,000 | | | Ford Motor Credit Co. LLC, 5.000%, 5/15/2018 | | | 1,095,551 | |
| | 905,000 | | | Forethought Financial Group, Inc., 8.625%, 4/15/2021, 144A | | | 1,002,920 | |
| | 28,000 | | | Freescale Semiconductor, Inc., 10.125%, 12/15/2016 | | | 28,700 | |
| | 50,000 | | | General Electric Capital Corp., GMTN, 3.100%, 1/09/2023 | | | 46,774 | |
| | 600,000 | | | General Electric Capital Corp., Series A, (fixed rate to 6/15/2022,
variable rate thereafter), 7.125%(j) | | | 652,500 | |
| | 3,435,000 | | | Georgia-Pacific LLC, 7.250%, 6/01/2028 | | | 4,191,806 | |
| | 105,000 | | | Georgia-Pacific LLC, 7.375%, 12/01/2025 | | | 131,931 | |
| | 180,000 | | | Georgia-Pacific LLC, 7.750%, 11/15/2029 | | | 227,790 | |
| | 315,000 | | | Georgia-Pacific LLC, 8.875%, 5/15/2031 | | | 435,183 | |
| | 200,000 | | | Gerdau Holdings, Inc., 7.000%, 1/20/2020, 144A | | | 213,000 | |
| | 800,000 | | | Goldman Sachs Group, Inc. (The), 3.375%, 2/01/2018, (CAD) | | | 776,234 | |
| | 2,295,000 | | | Goldman Sachs Group, Inc. (The), 6.750%, 10/01/2037 | | | 2,395,145 | |
| | 100,000 | | | Goldman Sachs Group, Inc. (The), 7.250%, 4/10/2028, (GBP) | | | 207,822 | |
| | 3,045,000 | | | Goodyear Tire & Rubber Co. (The), 7.000%, 5/15/2022 | | | 3,166,800 | |
| | 165,000 | | | Goodyear Tire & Rubber Co. (The), 7.000%, 3/15/2028 | | | 163,350 | |
| | 70,000 | | | GS Mortgage Securities Corp. II, Series 2007-GG10, Class AM,
5.993%, 8/10/2045(f) | | | 68,429 | |
| | 425,000 | | | Halcon Resources Corp., 8.875%, 5/15/2021 | | | 435,625 | |
| | 410,000 | | | Hanover Insurance Group, Inc. (The), 6.375%, 6/15/2021 | | | 449,267 | |
| | 1,000,000 | | | HCA Holdings, Inc., 6.250%, 2/15/2021 | | | 1,016,250 | |
| | 20,000 | | | HCA, Inc., 5.750%, 3/15/2014 | | | 20,375 | |
| | 90,000 | | | HCA, Inc., 6.375%, 1/15/2015 | | | 94,950 | |
| | 225,000 | | | HCA, Inc., 7.050%, 12/01/2027 | | | 215,437 | |
| | 245,000 | | | HCA, Inc., 7.190%, 11/15/2015 | | | 267,662 | |
| | 90,000 | | | HCA, Inc., 7.500%, 12/15/2023 | | | 91,800 | |
| | 820,000 | | | HCA, Inc., 7.500%, 11/06/2033 | | | 813,850 | |
| | 1,500,000 | | | HCA, Inc., 7.690%, 6/15/2025 | | | 1,535,625 | |
| | 395,000 | | | HCA, Inc., 8.360%, 4/15/2024 | | | 424,625 | |
| | 195,000 | | | HCA, Inc., MTN, 7.580%, 9/15/2025 | | | 197,925 | |
| | 75,000 | | | HCA, Inc., MTN, 7.750%, 7/15/2036 | | | 73,500 | |
| | 855,000 | | | Hecla Mining Co., 6.875%, 5/01/2021, 144A | | | 807,975 | |
| | 585,000 | | | Hercules, Inc., 6.500%, 6/30/2029 | | | 520,650 | |
| | 470,000 | | | Highwoods Properties, Inc., 5.850%, 3/15/2017 | | | 517,316 | |
| | 110,000 | | | Incitec Pivot Finance LLC, 6.000%, 12/10/2019, 144A | | | 120,746 | |
| | 80,000 | | | International Lease Finance Corp., 5.875%, 4/01/2019 | | | 83,289 | |
| | 1,620,000 | | | International Lease Finance Corp., 6.250%, 5/15/2019 | | | 1,701,000 | |
| | 45,000 | | | iStar Financial, Inc., 3.875%, 7/01/2016 | | | 45,113 | |
| | 145,000 | | | iStar Financial, Inc., 4.875%, 7/01/2018 | | | 140,650 | |
| | 70,000 | | | iStar Financial, Inc., 5.850%, 3/15/2017 | | | 72,625 | |
| | 145,000 | | | iStar Financial, Inc., 6.050%, 4/15/2015 | | | 151,163 | |
| | 200,000 | | | iStar Financial, Inc., 7.125%, 2/15/2018 | | | 214,500 | |
| | 35,000 | | | iStar Financial, Inc., Series B, 5.700%, 3/01/2014 | | | 35,525 | |
| | 5,000 | | | J.C. Penney Corp., Inc., 5.750%, 2/15/2018 | | | 3,925 | |
| | 48,000 | | | J.C. Penney Corp., Inc., 6.375%, 10/15/2036 | | | 33,480 | |
| | 5,000 | | | J.C. Penney Corp., Inc., 7.625%, 3/01/2097 | | | 3,350 | |
See accompanying notes to financial statements.
| 36
Portfolio of Investments – as of September 30, 2013
Loomis Sayles Global Equity and Income Fund – (continued)
| | | | | | | | |
Principal Amount (‡) | | | Description | | Value (†) | |
| | | | United States — continued | | | | |
| $ | 2,995,000 | | | Jack Cooper Holdings Corp., 9.250%, 6/01/2020, 144A | | $ | 3,204,650 | |
| | 665,000 | | | Jefferies Group LLC, 5.125%, 4/13/2018 | | | 713,706 | |
| | 30,000 | | | Jefferies Group LLC, 5.125%, 1/20/2023 | | | 30,236 | |
| | 1,070,000 | | | Jefferies Group LLC, 6.250%, 1/15/2036 | | | 1,026,765 | |
| | 685,000 | | | Jefferies Group LLC, 6.450%, 6/08/2027 | | | 698,700 | |
| | 1,410,000 | | | Jefferies Group LLC, 6.875%, 4/15/2021 | | | 1,563,930 | |
| | 15,000 | | | K. Hovnanian Enterprises, Inc., 5.000%, 11/01/2021 | | | 13,200 | |
| | 260,000 | | | K. Hovnanian Enterprises, Inc., 6.250%, 1/15/2016 | | | 268,450 | |
| | 1,665,000 | | | KB Home, 8.000%, 3/15/2020 | | | 1,798,200 | |
| | 190,000 | | | Ladder Capital Finance Holdings LLLP/Ladder Capital Finance Corp., 7.375%, 10/01/2017 | | | 198,788 | |
| | 15,000 | | | Lennar Corp., Series B, 5.500%, 9/01/2014 | | | 15,488 | |
| | 55,000 | | | Lennar Corp., Series B, 6.500%, 4/15/2016 | | | 59,400 | |
| | 135,000 | | | Level 3 Financing, Inc., 7.000%, 6/01/2020 | | | 136,350 | |
| | 1,435,000 | | | Level 3 Financing, Inc., 8.625%, 7/15/2020 | | | 1,567,737 | |
| | 30,000 | | | Level 3 Financing, Inc., 9.375%, 4/01/2019 | | | 33,075 | |
| | 165,000 | | | Masco Corp., 6.500%, 8/15/2032 | | | 163,763 | |
| | 865,000 | | | Masco Corp., 7.750%, 8/01/2029 | | | 955,399 | |
| | 2,700,000 | | | Merrill Lynch & Co., Inc., 6.110%, 1/29/2037 | | | 2,780,814 | |
| | 310,000 | | | Momentive Specialty Chemicals, Inc., 7.875%, 2/15/2023(g) | | | 254,200 | |
| | 398,000 | | | Momentive Specialty Chemicals, Inc., 8.375%, 4/15/2016(g) | | | 358,200 | |
| | 1,270,000 | | | Morgan Stanley, 2.125%, 4/25/2018 | | | 1,237,803 | |
| | 230,000 | | | Morgan Stanley, 5.375%, 11/14/2013, (GBP) | | | 373,966 | |
| | 1,725,000 | | | Morgan Stanley, 5.750%, 1/25/2021 | | | 1,914,938 | |
| | 500,000 | | | Morgan Stanley, GMTN, 7.625%, 3/03/2016, (AUD) | | | 500,200 | |
| | 2,375,000 | | | Morgan Stanley, MTN, 4.100%, 5/22/2023 | | | 2,215,205 | |
| | 600,000 | | | Morgan Stanley, MTN, 6.250%, 8/09/2026 | | | 671,203 | |
| | 100,000 | | | Morgan Stanley, Series F, MTN, 0.716%, 10/18/2016(f) | | | 98,362 | |
| | 1,552,000 | | | New Albertson’s, Inc., 7.450%, 8/01/2029 | | | 1,245,480 | |
| | 245,000 | | | New Albertson’s, Inc., 7.750%, 6/15/2026 | | | 199,675 | |
| | 3,605,000 | | | New Albertson’s, Inc., 8.000%, 5/01/2031 | | | 2,965,112 | |
| | 2,110,000 | | | New Albertson’s, Inc., 8.700%, 5/01/2030 | | | 1,796,137 | |
| | 315,000 | | | New Albertson’s, Inc., Series C, MTN, 6.625%, 6/01/2028 | | | 226,800 | |
| | 15,000 | | | News America, Inc., 6.400%, 12/15/2035 | | | 16,549 | |
| | 155,000 | | | NGPL PipeCo LLC, 7.768%, 12/15/2037, 144A | | | 126,325 | |
| | 115,000 | | | Owens Corning, Inc., 6.500%, 12/01/2016 | | | 128,359 | |
| | 535,000 | | | Owens Corning, Inc., 7.000%, 12/01/2036 | | | 586,809 | |
| | 540,000 | | | Pulte Group, Inc., 6.000%, 2/15/2035 | | | 464,400 | |
| | 785,000 | | | Pulte Group, Inc., 6.375%, 5/15/2033 | | | 700,612 | |
| | 220,000 | | | Pulte Group, Inc., 7.875%, 6/15/2032 | | | 222,200 | |
| | 1,335,000 | | | Qwest Capital Funding, Inc., 6.500%, 11/15/2018 | | | 1,441,800 | |
| | 650,000 | | | Qwest Capital Funding, Inc., 6.875%, 7/15/2028 | | | 578,500 | |
| | 400,000 | | | Qwest Capital Funding, Inc., 7.625%, 8/03/2021 | | | 406,000 | |
| | 60,000 | | | Qwest Capital Funding, Inc., 7.750%, 2/15/2031 | | | 56,700 | |
| | 560,000 | | | Qwest Corp., 6.875%, 9/15/2033 | | | 542,470 | |
| | 115,000 | | | Qwest Corp., 7.250%, 9/15/2025 | | | 128,623 | |
| | 480,000 | | | R.R. Donnelley & Sons Co., 7.000%, 2/15/2022 | | | 482,400 | |
| | 1,155,000 | | | R.R. Donnelley & Sons Co., 8.250%, 3/15/2019 | | | 1,282,050 | |
See accompanying notes to financial statements.
37 |
Portfolio of Investments – as of September 30, 2013
Loomis Sayles Global Equity and Income Fund – (continued)
| | | | | | | | |
Principal Amount (‡) | | | Description | | Value (†) | |
| | | | United States — continued | | | | |
| $ | 200,000 | | | Rain CII Carbon LLC/CII Carbon Corp., 8.250%, 1/15/2021, 144A | | $ | 201,000 | |
| | 500,000 | | | Range Resources Corp., 5.000%, 8/15/2022 | | | 483,750 | |
| | 750,000 | | | Reliance Holdings USA, Inc., 5.400%, 2/14/2022, 144A | | | 751,585 | |
| | 80,000 | | | Reynolds American, Inc., 6.750%, 6/15/2017 | | | 92,432 | |
| | 400,000 | | | Reynolds Group Issuer, Inc./Reynolds Group Issuer LLC/Reynolds Group Issuer (Luxembourg) S.A., 9.875%, 8/15/2019 | | | 434,000 | |
| | 655,000 | | | Rockies Express Pipeline LLC, 3.900%, 4/15/2015, 144A | | | 651,725 | |
| | 855,000 | | | Rockies Express Pipeline LLC, 6.875%, 4/15/2040, 144A | | | 636,924 | |
| | 1,970,000 | | | Rosetta Resources, Inc., 5.625%, 5/01/2021 | | | 1,871,500 | |
| | 760,000 | | | Shearer’s Foods LLC/Chip Finance Corp., 9.000%, 11/01/2019, 144A | | | 794,200 | |
| | 915,000 | | | SLM Corp., 5.500%, 1/25/2023 | | | 837,761 | |
| | 1,600(†††††) | | | SLM Corp., 6.000%, 12/15/2043 | | | 32,939 | |
| | 141,000 | | | SLM Corp., MTN, 3.875%, 9/10/2015 | | | 143,820 | |
| | 40,000 | | | SLM Corp., MTN, 4.625%, 9/25/2017 | | | 40,500 | |
| | 1,130,000 | | | SLM Corp., MTN, 7.250%, 1/25/2022 | | | 1,149,775 | |
| | 10,000 | | | SLM Corp., Series A, MTN, 0.566%, 1/27/2014(f) | | | 9,951 | |
| | 10,000 | | | SLM Corp., Series A, MTN, 5.000%, 6/15/2018 | | | 9,843 | |
| | 2,560,000 | | | SLM Corp., Series A, MTN, 5.625%, 8/01/2033 | | | 1,996,800 | |
| | 595,000 | | | SLM Corp., Series A, MTN, 8.450%, 6/15/2018 | | | 670,862 | |
| | 330,000 | | | Springleaf Finance Corp., 7.750%, 10/01/2021, 144A | | | 342,375 | |
| | 130,000 | | | Springleaf Finance Corp., 8.250%, 10/01/2023, 144A | | | 135,200 | |
| | 400,000 | | | Springleaf Finance Corp., MTN, 5.750%, 9/15/2016 | | | 413,000 | |
| | 300,000 | | | Springleaf Finance Corp., Series I, MTN, 5.400%, 12/01/2015 | | | 310,500 | |
| | 135,000 | | | Springleaf Finance Corp., Series J, MTN, 6.900%, 12/15/2017 | | | 141,075 | |
| | 294,000 | | | Sprint Capital Corp., 6.875%, 11/15/2028 | | | 262,395 | |
| | 420,000 | | | Sprint Capital Corp., 6.900%, 5/01/2019 | | | 431,550 | |
| | 110,000 | | | Sprint Capital Corp., 8.750%, 3/15/2032 | | | 111,788 | |
| | 26,000 | | | Sprint Communications, Inc., 6.000%, 12/01/2016 | | | 27,560 | |
| | 2,910,000 | | | SUPERVALU, Inc., 6.750%, 6/01/2021, 144A | | | 2,764,500 | |
| | 1,360,000 | | | Tenet Healthcare Corp., 6.875%, 11/15/2031 | | | 1,152,600 | |
| | 820,000 | | | Textron, Inc., 5.950%, 9/21/2021 | | | 901,466 | |
| | 1,431,000 | | | Toys R Us, Inc., 7.375%, 10/15/2018 | | | 1,234,237 | |
| | 1,645,000 | | | U.S. Treasury Note, 0.125%, 12/31/2014 | | | 1,644,164 | |
| | 20,500,000 | | | U.S. Treasury Note, 0.250%, 5/31/2014(d) | | | 20,522,427 | |
| | 1,995,000 | | | U.S. Treasury Note, 0.250%, 10/31/2014 | | | 1,997,338 | |
| | 6,595,000 | | | U.S. Treasury Note, 0.250%, 2/15/2015(d) | | | 6,599,893 | |
| | 6,740,000 | | | U.S. Treasury Note, 0.250%, 12/15/2015 | | | 6,720,515 | |
| | 33,418 | | | UAL Pass Through Trust, Series 2009-1, 10.400%, 5/01/2018 | | | 37,448 | |
| | 630,000 | | | United Continental Holdings, Inc., 6.375%, 6/01/2018 | | | 641,025 | |
| | 295,000 | | | United Rentals North America, Inc., 7.625%, 4/15/2022 | | | 320,812 | |
| | 1,735,000 | | | United States Steel Corp., 6.650%, 6/01/2037 | | | 1,418,362 | |
| | 770,000 | | | United States Steel Corp., 7.500%, 3/15/2022 | | | 787,325 | |
| | 139,748 | | | US Airways Pass Through Trust, Series 2012-1A, Class A, 5.900%, 4/01/2026 | | | 146,036 | |
| | 74,946 | | | US Airways Pass Through Trust, Series 2012-1B, Class B, 8.000%, 4/01/2021 | | | 81,691 | |
| | 530,000 | | | US Airways Pass Through Trust, Series 2012-2A, Class A, 4.625%, 12/03/2026 | | | 511,450 | |
| | 50,000 | | | USG Corp., 6.300%, 11/15/2016 | | | 52,875 | |
| | 230,000 | | | USG Corp., 9.750%, 1/15/2018 | | | 266,225 | |
See accompanying notes to financial statements.
| 38
Portfolio of Investments – as of September 30, 2013
Loomis Sayles Global Equity and Income Fund – (continued)
| | | | | | | | |
Principal Amount (‡) | | | Description | | Value (†) | |
| | | | United States — continued | | | | |
| $ | 525,000 | | | Valeant Pharmaceuticals International, 6.375%, 10/15/2020, 144A | | $ | 546,000 | |
| | 110,000 | | | Verizon Pennsylvania, Inc., 6.000%, 12/01/2028 | | | 107,034 | |
| | 260,000 | | | Visant Corp., 10.000%, 10/01/2017 | | | 241,800 | |
| | 85,000 | | | Wells Fargo & Co., 4.625%, 11/02/2035, (GBP) | | | 141,966 | |
| | 100,000 | | | Wells Fargo & Co., EMTN, 3.500%, 9/12/2029, (GBP) | | | 150,288 | |
| | 60,000 | | | Weyerhaeuser Co., 6.950%, 10/01/2027 | | | 69,262 | |
| | 315,000 | | | Weyerhaeuser Co., 7.375%, 3/15/2032 | | | 383,660 | |
| | 125,000 | | | Xerox Corp., 6.750%, 2/01/2017 | | | 142,848 | |
| | 20,000 | | | Xerox Corp., MTN, 7.200%, 4/01/2016 | | | 22,663 | |
| | 250,000 | | | Zurich Finance USA, Inc., EMTN, (fixed rate to 6/15/2015, variable rate thereafter), 4.500%, 6/15/2025, (EUR) | | | 351,741 | |
| | | | | | | | |
| | | | | | | 152,408,908 | |
| | | | | | | | |
| | | | Total Non-Convertible Bonds
(Identified Cost $310,943,075) | | | 314,200,531 | |
| | | | | | | | |
| | | | | | | | |
| | Convertible Bonds — 0.7% | | | | |
| | | | United States — 0.7% | | | | |
| | 350,000 | | | ArvinMeritor, Inc., (Step to Zero Coupon on 2/15/2019),
4.000%, 2/15/2027(h) | | | 319,812 | |
| | 390,000 | | | Chesapeake Energy Corp., 2.500%, 5/15/2037 | | | 383,175 | |
| | 175,000 | | | Chesapeake Energy Corp., 2.750%, 11/15/2035 | | | 180,688 | |
| | 185,000 | | | Ciena Corp., 3.750%, 10/15/2018, 144A | | | 272,528 | |
| | 125,000 | | | Ford Motor Co., 4.250%, 11/15/2016 | | | 246,953 | |
| | 280,000 | | | Hologic, Inc., (accretes to principal after 12/15/2013),
2.000%, 12/15/2037(h) | | | 280,350 | |
| | 465,000 | | | Hologic, Inc., (accretes to principal after 3/01/2018), 2.000%, 3/01/2042(h) | | | 467,325 | |
| | 1,125,000 | | | Intel Corp., 3.250%, 8/01/2039 | | | 1,392,891 | |
| | 215,000 | | | Level 3 Communications, Inc., 7.000%, 3/15/2015, 144A(g) | | | 260,956 | |
| | 2,200,000 | | | Old Republic International Corp., 3.750%, 3/15/2018 | | | 2,600,125 | |
| | 375,000 | | | Omnicare, Inc., 3.750%, 12/15/2025 | | | 796,641 | |
| | 610,000 | | | Owens-Brockway Glass Container, Inc., 3.000%, 6/01/2015, 144A | | | 630,969 | |
| | 90,000 | | | Trinity Industries, Inc., 3.875%, 6/01/2036 | | | 109,181 | |
| | 265,000 | | | United States Steel Corp., 2.750%, 4/01/2019 | | | 293,322 | |
| | | | | | | | |
| | | | Total Convertible Bonds
(Identified Cost $6,650,672) | | | 8,234,916 | |
| | | | | | | | |
| | | | | | | | |
| | Municipals — 0.1% | | | | |
| | | | United States — 0.1% | | | | |
| | 415,000 | | | State of Illinois, 5.100%, 6/01/2033 | | | 367,952 | |
| | 130,000 | | | Virginia Tobacco Settlement Financing Corp., Series A-1,
6.706%, 6/01/2046 | | | 90,004 | |
| | | | | | | | |
| | | | Total Municipals (Identified Cost $447,642) | | | 457,956 | |
| | | | | | | | |
| | | | Total Bonds and Notes
(Identified Cost $318,041,389) | | | 322,893,403 | |
| | | | | | | | |
See accompanying notes to financial statements.
39 |
Portfolio of Investments – as of September 30, 2013
Loomis Sayles Global Equity and Income Fund – (continued)
| | | | | | | | |
Principal Amount (‡) | | | Description | | Value (†) | |
| | Senior Loans — 0.5% | | | | |
| | | | United States — 0.5% | | | | |
| $ | 309,225 | | | Apria Healthcare Group I, Term Loan, 6.750%, 4/05/2020(f) | | $ | 311,281 | |
| | 1,865,625 | | | Fairpoint Communications, Inc., Refi Term Loan, 7.500%, 2/14/2019(f) | | | 1,877,546 | |
| | 1,065,000 | | | Flying Fortress, Inc., New Term Loan, 3.500%, 6/30/2017(f) | | | 1,062,785 | |
| | 55,000 | | | Power Team Services LLC, Delayed Draw Term Loan, 3.250%, 5/06/2020(i) | | | 54,106 | |
| | 433,913 | | | Power Team Services LLC, 1st Lien Term Loan, 4.250%, 5/06/2020(f) | | | 426,862 | |
| | 120,000 | | | Power Team Services LLC, 2nd Lien Term Loan, 8.250%, 11/06/2020(f) | | | 119,700 | |
| | 43,093 | | | SuperMedia, Inc., Exit Term Loan, 11.600%, 12/30/2016(f) | | | 33,354 | |
| | 920,065 | | | Supervalu, Inc., Refi Term Loan B, 5.000%, 3/21/2019(f) | | | 916,615 | |
| | 343,275 | | | TI Group Automotive Systems LLC, Term Loan B, 5.500%, 3/27/2019(f) | | | 346,495 | |
| | 814,000 | | | US Airways Group, Inc., Term Loan B1, 4.250%, 5/23/2019(f) | | | 808,188 | |
| | | | | | | | |
| | | | Total Senior Loans
(Identified Cost $5,951,604) | | | 5,956,932 | |
| | | | | | | | |
| | | | | | | | |
| Shares | | | | | | |
| | Preferred Stocks — 0.5% | | | | |
| | Convertible Preferred Stocks — 0.4% | | | | |
| | | | United States — 0.4% | | | | |
| | 460 | | | Chesapeake Energy Corp., 5.000% | | | 42,734 | |
| | 100 | | | Chesapeake Energy Corp., Series A, 5.750% 144A | | | 110,312 | |
| | 71,820 | | | General Motors Co., Series B, 4.750% | | | 3,601,773 | |
| | 820 | | | Lucent Technologies Capital Trust I, 7.750% | | | 830,660 | |
| | | | | | | | |
| | | | Total Convertible Preferred Stocks
(Identified Cost $4,105,300) | | | 4,585,479 | |
| | | | | | | | |
| | | | | | | | |
| | Non-Convertible Preferred Stock — 0.1% | | | | |
| | | | United States — 0.1% | | | | |
| | 682 | | | Ally Financial, Inc., Series G, 7.000% 144A
(Identified Cost $145,366) | | | 651,651 | |
| | | | | | | | |
| | | | Total Preferred Stocks
(Identified Cost $4,250,666) | | | 5,237,130 | |
| | | | | | | | |
| | | | | | | | |
Principal Amount (‡) | | | | | | |
| | Short-Term Investments — 3.0% | | | | |
| $ | 47,529 | | | Repurchase Agreement with State Street Bank and Trust Company, dated 9/30/2013 at 0.000%, to be repurchased at $47,529 on 10/01/2013 collateralized by $55,000 Federal National Mortgage Association, 2.080% due 11/02/2022 valued at $51,105 including accrued interest (Note 2 of Notes to Financial Statements) | | | 47,529 | |
| | 34,768,851 | | | Tri-Party Repurchase Agreement with Fixed Income Clearing Corporation, dated 9/30/2013 at 0.000% to be repurchased at $34,768,851 on 10/01/2013 collateralized by $34,450,000 U.S. Treasury Note, 2.625% due 7/31/2014 valued at $35,311,250; $155,000 U.S. Treasury Note, 0.250% due 9/30/2015 valued at $154,806 including accrued interest (Note 2 of Notes to Financial Statements) | | | 34,768,851 | |
| | | | | | | | |
See accompanying notes to financial statements.
| 40
Portfolio of Investments – as of September 30, 2013
Loomis Sayles Global Equity and Income Fund – (continued)
| | | | | | | | |
| | | | Description | | Value (†) | |
| | Short-Term Investments — continued | | | | |
| | | | Total Short-Term Investments
(Identified Cost $34,816,380) | | $ | 34,816,380 | |
| | | | | | | | |
| | | | | | | | |
| | | | Total Investments — 99.7%
(Identified Cost $1,041,796,752)(a) | | | 1,158,652,424 | |
| | | | Other assets less liabilities — 0.3% | | | 3,813,580 | |
| | | | | | | | |
| | | | Net Assets — 100.0% | | $ | 1,162,466,004 | |
| | | | | | | | |
| | | | | | | | |
| | (‡) | | | Principal Amount stated in U.S. dollars unless otherwise noted. | | | | |
| | (†) | | | See Note 2 of Notes to Financial Statements. | | | | |
| | (††) | | | Security held in units. One unit represents a principal amount of 1,000. Amount shown represents principal amount including inflation adjustments. | |
| | (†††) | | | Amount shown represents units. One unit represents a principal amount of 1,000. | |
| | (††††) | | | Amount shown represents units. One unit represents a principal amount of 100. | |
| | (†††††) | | | Amount shown represents units. One unit represents a principal amount of 25. | |
| | (a) | | | Federal Tax Information: | | | | |
| | | | At September 30, 2013, the net unrealized appreciation on investments based on a cost of $1,043,459,906 for federal income tax purposes was as follows: | |
| | | | Aggregate gross unrealized appreciation for all investments in which there is an excess of value over tax cost | | $ | 131,403,072 | |
| | | | Aggregate gross unrealized depreciation for all investments in which there is an excess of tax cost over value | | | (16,210,554 | ) |
| | | | | | | | |
| | | | Net unrealized appreciation | | $ | 115,192,518 | |
| | | | | | | | |
| | | | | | | | |
| | (b) | | | Non-income producing security. | | | | |
| | (c) | | | Fair valued by the Fund’s investment adviser. At September 30, 2013, the value of these securities amounted to $9,364,065 or 0.8% of net assets. | |
| | (d) | | | All or a portion of this security has been designated to cover the Fund’s obligations under open forward foreign currency contracts. | |
| | (e) | | | Payment-in-kind security for which the issuer has the option at each interest payment date of making interest payments in cash or additional debt securities. For the period ended September 30, 2013, the issuer has paid out 100% of the interest payments in-kind. | |
| | (f) | | | Variable rate security. Rate as of September 30, 2013 is disclosed. | |
| | (g) | | | Illiquid security. At September 30, 2013, the value of these securities amounted to $873,356 or 0.1% of net assets. | |
| | (h) | | | Coupon rate is a fixed rate for an initial period then resets at a specified date and rate. | |
| | (i) | | | Unfunded loan commitment. Represents a contractual obligation for future funding at the option of the Borrower. The Fund receives a stated coupon rate until the borrower draws on the loan commitment, at which time the rate will become the stated rate in the loan agreement. | |
| | (j) | | | Perpetual bond with no specified maturity date. | | | | |
| | | | | |
| | 144A | | | All or a portion of these securities are exempt from registration under Rule 144A of the Securities Act of 1933. These securities may be resold in transactions exempt from registration, normally to qualified institutional buyers. At September 30, 2013, the value of Rule 144A holdings amounted to $86,567,388 or 7.4% of net assets. | |
See accompanying notes to financial statements.
41 |
Portfolio of Investments – as of September 30, 2013
Loomis Sayles Global Equity and Income Fund – (continued)
| | | | | | |
| | GDR | | | A Global Depositary Receipt is a certificate issued by a custodian bank representing the right to receive securities of the foreign issuer described. The values of GDRs may be significantly influenced by trading on exchanges not located in the United States. |
| | EMTN | | | Euro Medium Term Note | | |
| | GMTN | | | Global Medium Term Note | | |
| | MTN | | | Medium Term Note | | |
| | OJSC | | | Open Joint-Stock Company | | |
| | PIK | | | Payment-in-Kind |
| | AUD | | | Australian Dollar | | |
| | BRL | | | Brazilian Real | | |
| | CAD | | | Canadian Dollar | | |
| | CHF | | | Swiss Franc | | |
| | CLP | | | Chilean Peso | | |
| | CNY | | | Chinese Yuan Renminbi | | |
| | COP | | | Colombian Peso | | |
| | EUR | | | Euro | | |
| | GBP | | | British Pound | | |
| | IDR | | | Indonesian Rupiah | | |
| | KRW | | | South Korean Won | | |
| | MXN | | | Mexican Peso | | |
| | MYR | | | Malaysian Ringgit | | |
| | NOK | | | Norwegian Krone | | |
| | NZD | | | New Zealand Dollar | | |
| | PHP | | | Philippine Peso | | |
| | PLN | | | Polish Zloty | | |
| | RON | | | Romanian Leu | | |
| | SEK | | | Swedish Krona | | |
| | SGD | | | Singapore Dollar | | |
| | THB | | | Thailand Baht | | |
At September 30, 2013, the Fund had the following open forward foreign currency contracts:
| | | | | | | | | | | | | | | | | | |
Contract
to
Buy/Sell | | Delivery
Date | | | Currency | | Units of
Currency | | | Notional
Value | | | Unrealized
Appreciation
(Depreciation) | |
| Sell1 | | | 12/18/2013 | | | Australian Dollar | | | 2,870,000 | | | $ | 2,664,091 | | | $ | (13,359 | ) |
| Sell1 | | | 10/08/2013 | | | Brazilian Real | | | 1,610,000 | | | | 725,401 | | | | (23,355 | ) |
| Sell1 | | | 12/05/2013 | | | Canadian Dollar | | | 6,610,000 | | | | 6,406,861 | | | | (131,704 | ) |
| Buy2 | | | 12/18/2013 | | | Euro | | | 8,050,000 | | | | 10,892,633 | | | | 4,203 | |
| Buy1 | | | 12/18/2013 | | | Japanese Yen | | | 2,150,000,000 | | | | 21,883,806 | | | | (21,441 | ) |
| Buy3 | | | 12/20/2013 | | | Malaysian Ringgit | | | 1,250,000 | | | | 381,582 | | | | 3,196 | |
| Sell2 | | | 10/31/2013 | | | New Zealand Dollar | | | 2,505,000 | | | | 2,076,433 | | | | (97,257 | ) |
| Buy2 | | | 12/16/2013 | | | Philippine Peso | | | 187,000,000 | | | | 4,294,615 | | | | 14,459 | |
| Buy1 | | | 12/11/2013 | | | South Korean Won | | | 1,488,000,000 | | | | 1,378,518 | | | | 32,277 | |
| Buy2 | | | 12/11/2013 | | | South Korean Won | | | 780,000,000 | | | | 722,610 | | | | 16,088 | |
| Sell2 | | | 12/11/2013 | | | South Korean Won | | | 780,000,000 | | | | 722,610 | | | | (7,604 | ) |
| Sell1 | | | 12/11/2013 | | | South Korean Won | | | 1,488,000,000 | | | | 1,378,518 | | | | (14,507 | ) |
| | | | | | | | | | | | | | | | | | |
| Total | | | | | | | | | | | | | | | | $ | (239,004 | ) |
| | | | | | | | | | | | | | | | | | |
See accompanying notes to financial statements.
| 42
Portfolio of Investments – as of September 30, 2013
Loomis Sayles Global Equity and Income Fund – (continued)
At September 30, 2013, the Fund had the following open forward foreign cross currency contracts:
| | | | | | | | | | | | | | |
| Settlement Date | | Deliver/Units of Currency | | | Receive4/Units of Currency | | Unrealized
Appreciation
(Depreciation) | |
| 12/12/2013 | | Norwegian Krone | | | 5,600,000 | | | Euro | | 694,948 | | $ | 11,512 | |
| | | | | | | | | | | | | | |
1 Counterparty is Credit Suisse International.
2 Counterparty is Barclays Bank PLC.
3 Counterparty is JP Morgan Chase Bank, N.A.
4 Counterparty is Deutsche Bank AG.
Industry Summary at September 30, 2013 (Unaudited)
| | | | |
Treasuries | | | 8.6 | % |
Pharmaceuticals | | | 6.7 | |
Commercial Banks | | | 4.7 | |
Beverages | | | 4.7 | |
Oil, Gas & Consumable Fuels | | | 4.7 | |
Specialty Retail | | | 3.6 | |
Chemicals | | | 3.2 | |
Banking | | | 3.1 | |
Insurance | | | 3.1 | |
Aerospace & Defense | | | 3.0 | |
Energy Equipment & Services | | | 3.0 | |
Internet Software & Services | | | 2.7 | |
Machinery | | | 2.5 | |
Textiles, Apparel & Luxury Goods | | | 2.5 | |
Capital Markets | | | 2.0 | |
Other Investments, less than 2% each | | | 38.6 | |
Short-Term Investments | | | 3.0 | |
| | | | |
Total Investments | | | 99.7 | |
Other assets less liabilities (including open forward foreign currency contracts) | | | 0.3 | |
| | | | |
Net Assets | | | 100.0 | % |
| | | | |
Currency Exposure Summary at September 30, 2013 (Unaudited)
| | | | |
United States Dollar | | | 64.2 | % |
British Pound | | | 11.5 | |
Euro | | | 7.0 | |
Mexican Peso | | | 2.4 | |
Swiss Franc | | | 2.1 | |
Other, less than 2% each | | | 12.5 | |
| | | | |
Total Investments | | | 99.7 | |
Other assets less liabilities (including open forward foreign currency contracts) | | | 0.3 | |
| | | | |
Net Assets | | | 100.0 | % |
| | | | |
See accompanying notes to financial statements.
43 |
Portfolio of Investments – as of September 30, 2013
Loomis Sayles Growth Fund
| | | | | | | | |
| Shares | | | Description | | Value (†) | |
| | Common Stocks — 98.0% of Net Assets | | | | |
| | | | Air Freight & Logistics — 6.5% | | | | |
| | 438,861 | | | Expeditors International of Washington, Inc. | | $ | 19,336,216 | |
| | 225,558 | | | United Parcel Service, Inc., Class B | | | 20,609,234 | |
| | | | | | | | |
| | | | | | | 39,945,450 | |
| | | | | | | | |
| | | | Beverages — 6.4% | | | | |
| | 312,953 | | | Coca-Cola Co. (The) | | | 11,854,660 | |
| | 18,070 | | | Diageo PLC, Sponsored ADR | | | 2,296,336 | |
| | 217,941 | | | Monster Beverage Corp.(b) | | | 11,387,417 | |
| | 276,259 | | | SABMiller PLC, Sponsored ADR | | | 14,011,856 | |
| | | | | | | | |
| | | | | | | 39,550,269 | |
| | | | | | | | |
| | | | Biotechnology — 2.5% | | | | |
| | 137,776 | | | Amgen, Inc. | | | 15,422,645 | |
| | | | | | | | |
| | | | Capital Markets — 6.6% | | | | |
| | 168,267 | | | Franklin Resources, Inc. | | | 8,505,897 | |
| | 109,853 | | | Greenhill & Co., Inc. | | | 5,479,468 | |
| | 273,972 | | | Legg Mason, Inc. | | | 9,161,624 | |
| | 553,584 | | | SEI Investments Co. | | | 17,111,281 | |
| | | | | | | | |
| | | | | | | 40,258,270 | |
| | | | | | | | |
| | | | Communications Equipment — 9.2% | | | | |
| | 1,355,339 | | | Cisco Systems, Inc. | | | 31,742,039 | |
| | 368,554 | | | QUALCOMM, Inc. | | | 24,825,798 | |
| | | | | | | | |
| | | | | | | 56,567,837 | |
| | | | | | | | |
| | | | Consumer Finance — 2.8% | | | | |
| | 229,508 | | | American Express Co. | | | 17,332,444 | |
| | | | | | | | |
| | | | Energy Equipment & Services — 3.3% | | | | |
| | 229,950 | | | Schlumberger Ltd. | | | 20,318,382 | |
| | | | | | | | |
| | | | Food Products — 3.5% | | | | |
| | 1,435,460 | | | Danone S.A., Sponsored ADR | | | 21,589,318 | |
| | | | | | | | |
| | | | Health Care Equipment & Supplies — 6.3% | | | | |
| | 191,281 | | | Varian Medical Systems, Inc.(b) | | | 14,294,429 | |
| | 293,097 | | | Zimmer Holdings, Inc. | | | 24,074,988 | |
| | | | | | | | |
| | | | | | | 38,369,417 | |
| | | | | | | | |
| | | | Household Products — 3.9% | | | | |
| | 91,135 | | | Clorox Co. (The) | | | 7,447,552 | |
| | 220,125 | | | Procter & Gamble Co. (The) | | | 16,639,249 | |
| | | | | | | | |
| | | | | | | 24,086,801 | |
| | | | | | | | |
| | | | Internet & Catalog Retail — 5.9% | | | | |
| | 115,370 | | | Amazon.com, Inc.(b) | | | 36,069,277 | |
| | | | | | | | |
| | | | Internet Software & Services — 11.0% | | | | |
| | 604,804 | | | Facebook, Inc., Class A(b) | | | 30,385,353 | |
| | 42,278 | | | Google, Inc., Class A(b) | | | 37,031,723 | |
| | | | | | | | |
| | | | | | | 67,417,076 | |
| | | | | | | | |
See accompanying notes to financial statements.
| 44
Portfolio of Investments – as of September 30, 2013
Loomis Sayles Growth Fund – (continued)
| | | | | | | | |
| Shares | | | Description | | Value (†) | |
| | | | IT Services — 6.4% | | | | |
| | 124,041 | | | Automatic Data Processing, Inc. | | $ | 8,978,087 | |
| | 157,268 | | | Visa, Inc., Class A | | | 30,053,915 | |
| | | | | | | | |
| | | | | | | 39,032,002 | |
| | | | | | | | |
| | | | Pharmaceuticals — 4.8% | | | | |
| | 207,780 | | | Merck & Co., Inc. | | | 9,892,406 | |
| | 257,718 | | | Novartis AG, ADR | | | 19,769,548 | |
| | | | | | | | |
| | | | | | | 29,661,954 | |
| | | | | | | | |
| | | | Semiconductors & Semiconductor Equipment — 3.8% | | | | |
| | 49,646 | | | Altera Corp. | | | 1,844,845 | |
| | 59,370 | | | Analog Devices, Inc. | | | 2,793,359 | |
| | 387,018 | | | ARM Holdings PLC, Sponsored ADR | | | 18,623,306 | |
| | | | | | | | |
| | | | | | | 23,261,510 | |
| | | | | | | | |
| | | | Software — 11.2% | | | | |
| | 385,724 | | | Autodesk, Inc.(b) | | | 15,880,257 | |
| | 122,651 | | | FactSet Research Systems, Inc. | | | 13,381,224 | |
| | 402,167 | | | Microsoft Corp. | | | 13,396,183 | |
| | 786,095 | | | Oracle Corp. | | | 26,074,771 | |
| | | | | | | | |
| | | | | | | 68,732,435 | |
| | | | | | | | |
| | | | Specialty Retail — 3.9% | | | | |
| | 501,623 | | | Lowe’s Cos., Inc. | | | 23,882,271 | |
| | | | | | | | |
| | | | Total Common Stocks
(Identified Cost $525,337,833) | | | 601,497,358 | |
| | | | | | | | |
| | | | | | | | |
Principal
Amount | | | | | | |
| | Short-Term Investments — 2.4% | | | | |
| $ | 14,440,090 | | | Tri-Party Repurchase Agreement with Fixed Income Clearing Corporation, dated 9/30/2013 at 0.000% to be repurchased at $14,440,090 on 10/01/2013 collateralized by $14,955,000 U.S. Treasury Note, 0.625% due 8/31/2017
valued at $14,730,675 including accrued interest (Note 2 of Notes to Financial Statements)
(Identified Cost $14,440,090) | | | 14,440,090 | |
| | | | | | | | |
| | | | | | | | |
| | | | Total Investments — 100.4% (Identified Cost $539,777,923)(a) | | | 615,937,448 | |
| | | | Other assets less liabilities — (0.4)% | | | (2,223,032 | ) |
| | | | | | | | |
| | | | Net Assets — 100.0% | | $ | 613,714,416 | |
| | | | | | | | |
| | (†) | | | See Note 2 of Notes to Financial Statements. | |
| | (a) | | | Federal Tax Information: | |
| | | | At September 30, 2013, the net unrealized appreciation on investments based on a cost of $540,255,943 for federal income tax purposes was as follows: | |
| | | | Aggregate gross unrealized appreciation for all investments in which there is an excess of value over tax cost | | $ | 77,666,183 | |
| | | | Aggregate gross unrealized depreciation for all investments in which there is an excess of tax cost over value | | | (1,984,678 | ) |
| | | | | | | | |
| | | | Net unrealized appreciation | | $ | 75,681,505 | |
| | | | | | | | |
See accompanying notes to financial statements.
45 |
Portfolio of Investments – as of September 30, 2013
Loomis Sayles Growth Fund – (continued)
| | | | | | |
| | | | | | |
| | (b) | | | Non-income producing security. |
| | | | | | |
| | ADR | | | An American Depositary Receipt is a certificate issued by a custodian bank representing the right to receive securities of the foreign issuer described. The values of ADRs may be significantly influenced by trading on exchanges not located in the United States. |
Industry Summary at September 30, 2013 (Unaudited)
| | | | |
Software | | | 11.2 | % |
Internet Software & Services | | | 11.0 | |
Communications Equipment | | | 9.2 | |
Capital Markets | | | 6.6 | |
Air Freight & Logistics | | | 6.5 | |
Beverages | | | 6.4 | |
IT Services | | | 6.4 | |
Health Care Equipment & Supplies | | | 6.3 | |
Internet & Catalog Retail | | | 5.9 | |
Pharmaceuticals | | | 4.8 | |
Household Products | | | 3.9 | |
Specialty Retail | | | 3.9 | |
Semiconductors & Semiconductor Equipment | | | 3.8 | |
Food Products | | | 3.5 | |
Energy Equipment & Services | | | 3.3 | |
Consumer Finance | | | 2.8 | |
Biotechnology | | | 2.5 | |
Short-Term Investments | | | 2.4 | |
| | | | |
Total Investments | | | 100.4 | |
Other assets less liabilities | | | (0.4 | ) |
| | | | |
Net Assets | | | 100.0 | % |
| | | | |
See accompanying notes to financial statements.
| 46
Portfolio of Investments – as of September 30, 2013
Loomis Sayles Mid Cap Growth Fund
| | | | | | | | |
| Shares | | | Description | | Value (†) | |
| | Common Stocks — 98.0% of Net Assets | | | | |
| | | | Aerospace & Defense — 1.3% | | | | |
| | 9,827 | | | TransDigm Group, Inc. | | $ | 1,363,005 | |
| | | | | | | | |
| | | | Automobiles — 2.4% | | | | |
| | 12,930 | | | Tesla Motors, Inc.(b) | | | 2,500,921 | |
| | | | | | | | |
| | | | Biotechnology — 7.3% | | | | |
| | 33,997 | | | ACADIA Pharmaceuticals, Inc.(b) | | | 933,898 | |
| | 12,371 | | | Aegerion Pharmaceuticals, Inc.(b) | | | 1,060,318 | |
| | 17,087 | | | Medivation, Inc.(b) | | | 1,024,195 | |
| | 11,316 | | | Pharmacyclics, Inc.(b) | | | 1,566,361 | |
| | 17,926 | | | Puma Biotechnology, Inc.(b) | | | 961,909 | |
| | 4,323 | | | Regeneron Pharmaceuticals, Inc.(b) | | | 1,352,537 | |
| | 22,861 | | | TESARO, Inc.(b) | | | 885,635 | |
| | | | | | | | |
| | | | | | | 7,784,853 | |
| | | | | | | | |
| | | | Building Products — 1.6% | | | | |
| | 40,347 | | | Fortune Brands Home & Security, Inc. | | | 1,679,646 | |
| | | | | | | | |
| | | | Capital Markets — 2.2% | | | | |
| | 12,692 | | | Affiliated Managers Group, Inc.(b) | | | 2,318,067 | |
| | | | | | | | |
| | | | Chemicals — 2.0% | | | | |
| | 19,890 | | | Westlake Chemical Corp. | | | 2,081,687 | |
| | | | | | | | |
| | | | Commercial Services & Supplies — 1.5% | | | | |
| | 14,134 | | | Stericycle, Inc.(b) | | | 1,631,064 | |
| | | | | | | | |
| | | | Diversified Financial Services — 2.8% | | | | |
| | 42,316 | | | CBOE Holdings, Inc. | | | 1,913,953 | |
| | 18,130 | | | MarketAxess Holdings, Inc. | | | 1,088,525 | |
| | | | | | | | |
| | | | | | | 3,002,478 | |
| | | | | | | | |
| | | | Energy Equipment & Services — 2.0% | | | | |
| | 25,599 | | | Oceaneering International, Inc. | | | 2,079,663 | |
| | | | | | | | |
| | | | Food Products — 3.6% | | | | |
| | 30,597 | | | Green Mountain Coffee Roasters, Inc.(b) | | | 2,304,872 | |
| | 16,268 | | | Hershey Co. (The) | | | 1,504,790 | |
| | | | | | | | |
| | | | | | | 3,809,662 | |
| | | | | | | | |
| | | | Health Care Equipment & Supplies — 2.1% | | | | |
| | 37,428 | | | DexCom, Inc.(b) | | | 1,056,592 | |
| | 32,657 | | | Insulet Corp.(b) | | | 1,183,490 | |
| | | | | | | | |
| | | | | | | 2,240,082 | |
| | | | | | | | |
| | | | Health Care Technology — 1.0% | | | | |
| | 9,772 | | | athenahealth, Inc.(b) | | | 1,060,848 | |
| | | | | | | | |
| | | | Hotels, Restaurants & Leisure — 5.9% | | | | |
| | 3,790 | | | Chipotle Mexican Grill, Inc.(b) | | | 1,624,773 | |
| | 36,263 | | | Dunkin’ Brands Group, Inc. | | | 1,641,263 | |
| | 93,396 | | | Melco Crown Entertainment Ltd., Sponsored ADR(b) | | | 2,972,795 | |
| | | | | | | | |
| | | | | | | 6,238,831 | |
| | | | | | | | |
See accompanying notes to financial statements.
47 |
Portfolio of Investments – as of September 30, 2013
Loomis Sayles Mid Cap Growth Fund – (continued)
| | | | | | | | |
| Shares | | | Description | | Value (†) | |
| | | | Household Durables — 1.4% | | | | |
| | 22,344 | | | Harman International Industries, Inc. | | $ | 1,479,843 | |
| | | | | | | | |
| | | | Internet & Catalog Retail — 4.2% | | | | |
| | 8,785 | | | Netflix, Inc.(b) | | | 2,716,410 | |
| | 22,464 | | | TripAdvisor, Inc.(b) | | | 1,703,670 | |
| | | | | | | | |
| | | | | | | 4,420,080 | |
| | | | | | | | |
| | | | Internet Software & Services — 10.1% | | | | |
| | 44,809 | | | Cornerstone OnDemand, Inc.(b) | | | 2,304,975 | |
| | 12,924 | | | LinkedIn Corp., Class A(b) | | | 3,180,079 | |
| | 7,999 | | | MercadoLibre, Inc. | | | 1,079,145 | |
| | 37,044 | | | Pandora Media, Inc.(b) | | | 930,916 | |
| | 23,946 | | | Trulia, Inc.(b) | | | 1,126,180 | |
| | 16,612 | | | Yelp, Inc.(b) | | | 1,099,382 | |
| | 11,340 | | | Zillow, Inc., Class A(b) | | | 956,756 | |
| | | | | | | | |
| | | | | | | 10,677,433 | |
| | | | | | | | |
| | | | Life Sciences Tools & Services — 1.7% | | | | |
| | 7,484 | | | Mettler-Toledo International, Inc.(b) | | | 1,796,833 | |
| | | | | | | | |
| | | | Machinery — 3.1% | | | | |
| | 17,219 | | | Chart Industries, Inc.(b) | | | 2,118,626 | |
| | 15,819 | | | Proto Labs, Inc.(b) | | | 1,208,413 | |
| | | | | | | | |
| | | | | | | 3,327,039 | |
| | | | | | | | |
| | | | Media — 9.6% | | | | |
| | 18,992 | | | Discovery Communications, Inc., Class A(b) | | | 1,603,304 | |
| | 11,073 | | | Liberty Media Corp., Class A(b) | | | 1,629,392 | |
| | 114,395 | | | Lions Gate Entertainment Corp.(b) | | | 4,009,545 | |
| | 33,288 | | | Sinclair Broadcast Group, Inc., Class A | | | 1,115,814 | |
| | 63,939 | | | Starz, Class A(b) | | | 1,798,604 | |
| | | | | | | | |
| | | | | | | 10,156,659 | |
| | | | | | | | |
| | | | Multiline Retail — 1.7% | | | | |
| | 32,538 | | | Dollar Tree, Inc.(b) | | | 1,859,872 | |
| | | | | | | | |
| | | | Oil, Gas & Consumable Fuels — 4.5% | | | | |
| | 59,334 | | | Cabot Oil & Gas Corp. | | | 2,214,345 | |
| | 27,024 | | | Diamondback Energy, Inc.(b) | | | 1,152,303 | |
| | 21,713 | | | Gulfport Energy Corp.(b) | | | 1,397,015 | |
| | | | | | | | |
| | | | | | | 4,763,663 | |
| | | | | | | | |
| | | | Pharmaceuticals — 4.3% | | | | |
| | 16,570 | | | Actavis, Inc.(b) | | | 2,386,080 | |
| | 23,910 | | | Jazz Pharmaceuticals PLC(b) | | | 2,199,003 | |
| | | | | | | | |
| | | | | | | 4,585,083 | |
| | | | | | | | |
| | | | Road & Rail — 1.9% | | | | |
| | 18,803 | | | Kansas City Southern | | | 2,056,296 | |
| | | | | | | | |
See accompanying notes to financial statements.
| 48
Portfolio of Investments – as of September 30, 2013
Loomis Sayles Mid Cap Growth Fund – (continued)
| | | | | | | | |
| Shares | | | Description | | Value (†) | |
| | | | Semiconductors & Semiconductor Equipment — 4.4% | | | | |
| | 82,363 | | | NXP Semiconductors NV(b) | | $ | 3,064,727 | |
| | 34,786 | | | Xilinx, Inc. | | | 1,630,072 | |
| | | | | | | | |
| | | | | | | 4,694,799 | |
| | | | | | | | |
| | | | Software — 7.7% | | | | |
| | 18,089 | | | CommVault Systems, Inc.(b) | | | 1,588,757 | |
| | 8,074 | | | FireEye, Inc.(b) | | | 335,313 | |
| | 21,320 | | | NetSuite, Inc.(b) | | | 2,301,281 | |
| | 35,961 | | | ServiceNow, Inc.(b) | | | 1,868,174 | |
| | 35,348 | | | Splunk, Inc.(b) | | | 2,122,294 | |
| | | | | | | | |
| | | | | | | 8,215,819 | |
| | | | | | | | |
| | | | Specialty Retail — 5.7% | | | | |
| | 20,480 | | | Lumber Liquidators Holdings, Inc.(b) | | | 2,184,192 | |
| | 17,234 | | | O’Reilly Automotive, Inc.(b) | | | 2,198,886 | |
| | 25,118 | | | Tractor Supply Co. | | | 1,687,176 | |
| | | | | | | | |
| | | | | | | 6,070,254 | |
| | | | | | | | |
| | | | Textiles, Apparel & Luxury Goods — 2.0% | | | | |
| | 28,122 | | | Michael Kors Holdings Ltd.(b) | | | 2,095,651 | |
| | | | | | | | |
| | | | Total Common Stocks
(Identified Cost $78,256,664) | | | 103,990,131 | |
| | | | | | | | |
| | | | | | | | |
| | Purchased Options — 0.2% | | | | |
| | | | Options on Securities — 0.2% | | | | |
| | 153,300 | | | Cobalt International Energy, Inc., Call expiring January 18, 2014 at 32.50 | | | 157,133 | |
| | 17,000 | | | Medivation, Inc., Put expiring December 21, 2013 at 40 | | | 26,435 | |
| | | | | | | | |
| | | | Total Purchased Options
(Identified Cost $389,587) | | | 183,568 | |
| | | | | | | | |
| | | | | | | | |
Principal
Amount | | | | | | |
| | Short-Term Investments — 3.0% | | | | |
| $ | 3,238,036 | | | Tri-Party Repurchase Agreement with Fixed Income Clearing Corporation, dated 9/30/2013 at 0.000% to be repurchased at $3,238,036 on 10/01/2013 collateralized by $3,355,000 U.S. Treasury Note, 0.625% due 8/31/2017 valued at $3,304,675 including accrued interest (Note 2 of Notes to Financial Statements)
(Identified Cost $3,238,036) | | | 3,238,036 | |
| | | | | | | | |
| | | | | | | | |
| | | | Total Investments — 101.2%
(Identified Cost $81,884,287)(a) | | | 107,411,735 | |
| | | | Other assets less liabilities — (1.2)% | | | (1,258,198 | ) |
| | | | | | | | |
| | | | Net Assets — 100.0% | | $ | 106,153,537 | |
| | | | | | | | |
See accompanying notes to financial statements.
49 |
Portfolio of Investments – as of September 30, 2013
Loomis Sayles Mid Cap Growth Fund – (continued)
| | | | | | | | |
| | | | | | | | |
| | (†) | | | See Note 2 of Notes to Financial Statements. | |
| | (a) | | | Federal Tax Information: | |
| | | | At September 30, 2013, the net unrealized appreciation on investments based on a cost of $81,889,244 for federal income tax purposes was as follows: | |
| | | | Aggregate gross unrealized appreciation for all investments in which there is an excess of value over tax cost | | $ | 25,905,938 | |
| | | | Aggregate gross unrealized depreciation for all investments in which there is an excess of tax cost over value | | | (383,447 | ) |
| | | | | | | | |
| | | | Net unrealized appreciation | | $ | 25,522,491 | |
| | | | | | | | |
| | | | | | | | |
| | (b) | | | Non-income producing security. | |
| | | | | | | | |
| | ADR | | | An American Depositary Receipt is a certificate issued by a custodian bank representing the right to receive securities of the foreign issuer described. The values of ADRs may be significantly influenced by trading on exchanges not located in the United States. | |
Industry Summary at September 30, 2013 (Unaudited)
| | | | |
Internet Software & Services | | | 10.1 | % |
Media | | | 9.6 | |
Software | | | 7.7 | |
Biotechnology | | | 7.3 | |
Hotels, Restaurants & Leisure | | | 5.9 | |
Specialty Retail | | | 5.7 | |
Oil, Gas & Consumable Fuels | | | 4.5 | |
Semiconductors & Semiconductor Equipment | | | 4.4 | |
Pharmaceuticals | | | 4.3 | |
Internet & Catalog Retail | | | 4.2 | |
Food Products | | | 3.6 | |
Machinery | | | 3.1 | |
Diversified Financial Services | | | 2.8 | |
Automobiles | | | 2.4 | |
Capital Markets | | | 2.2 | |
Health Care Equipment & Supplies | | | 2.1 | |
Textiles, Apparel & Luxury Goods | | | 2.0 | |
Chemicals | | | 2.0 | |
Energy Equipment & Services | | | 2.0 | |
Other Investments, less than 2% each | | | 12.3 | |
Short-Term Investments | | | 3.0 | |
| | | | |
Total Investments | | | 101.2 | |
Other assets less liabilities | | | (1.2 | ) |
| | | | |
Net Assets | | | 100.0 | % |
| | | | |
See accompanying notes to financial statements.
| 50
Portfolio of Investments – as of September 30, 2013
Loomis Sayles Value Fund
| | | | | | | | |
| Shares | | | Description | | Value (†) | |
| | Common Stocks — 96.4% of Net Assets | | | | |
| | | | Aerospace & Defense — 2.6% | | | | |
| | 270,799 | | | Honeywell International, Inc. | | $ | 22,487,149 | |
| | 305,907 | | | Northrop Grumman Corp. | | | 29,140,701 | |
| | | | | | | | |
| | | | | | | 51,627,850 | |
| | | | | | | | |
| | | | Automobiles — 1.3% | | | | |
| | 706,637 | | | General Motors Co.(b) | | | 25,417,733 | |
| | | | | | | | |
| | | | Beverages — 1.4% | | | | |
| | 352,331 | | | PepsiCo, Inc. | | | 28,010,314 | |
| | | | | | | | |
| | | | Capital Markets — 4.5% | | | | |
| | 389,767 | | | Ameriprise Financial, Inc. | | | 35,499,978 | |
| | 529,447 | | | Legg Mason, Inc. | | | 17,704,708 | |
| | 540,938 | | | State Street Corp. | | | 35,566,673 | |
| | | | | | | | |
| | | | | | | 88,771,359 | |
| | | | | | | | |
| | | | Chemicals — 1.4% | | | | |
| | 456,295 | | | E.I. du Pont de Nemours & Co. | | | 26,720,635 | |
| | | | | | | | |
| | | | Commercial Banks — 5.7% | | | | |
| | 1,147,455 | | | Fifth Third Bancorp | | | 20,700,088 | |
| | 399,831 | | | PNC Financial Services Group, Inc. (The) | | | 28,967,756 | |
| | 496,512 | | | US Bancorp | | | 18,162,409 | |
| | 1,060,286 | | | Wells Fargo & Co. | | | 43,811,018 | |
| | | | | | | | |
| | | | | | | 111,641,271 | |
| | | | | | | | |
| | | | Communications Equipment — 2.6% | | | | |
| | 924,374 | | | Cisco Systems, Inc. | | | 21,648,839 | |
| | 482,460 | | | Motorola Solutions, Inc. | | | 28,648,475 | |
| | | | | | | | |
| | | | | | | 50,297,314 | |
| | | | | | | | |
| | | | Computers & Peripherals — 2.2% | | | | |
| | 43,292 | | | Apple, Inc. | | | 20,639,461 | |
| | 890,406 | | | EMC Corp. | | | 22,758,777 | |
| | | | | | | | |
| | | | | | | 43,398,238 | |
| | | | | | | | |
| | | | Construction Materials — 1.1% | | | | |
| | 409,162 | | | Vulcan Materials Co. | | | 21,198,683 | |
| | | | | | | | |
| | | | Consumer Finance — 1.4% | | | | |
| | 545,000 | | | Discover Financial Services | | | 27,544,300 | |
| | | | | | | | |
| | | | Containers & Packaging — 1.4% | | | | |
| | 979,302 | | | Sealed Air Corp. | | | 26,627,221 | |
| | | | | | | | |
| | | | Diversified Financial Services — 5.5% | | | | |
| | 2,035,272 | | | Bank of America Corp. | | | 28,086,754 | |
| | 631,545 | | | Citigroup, Inc. | | | 30,636,248 | |
| | 966,750 | | | JPMorgan Chase & Co. | | | 49,971,307 | |
| | | | | | | | |
| | | | | | | 108,694,309 | |
| | | | | | | | |
| | | | Diversified Telecommunication Services — 1.3% | | | | |
| | 528,056 | | | Verizon Communications, Inc. | | | 24,639,093 | |
| | | | | | | | |
See accompanying notes to financial statements.
51 |
Portfolio of Investments – as of September 30, 2013
Loomis Sayles Value Fund – (continued)
| | | | | | | | |
| Shares | | | Description | | Value (†) | |
| | | | Electric Utilities — 2.1% | | | | |
| | 531,643 | | | FirstEnergy Corp. | | $ | 19,378,387 | |
| | 272,774 | | | NextEra Energy, Inc. | | | 21,865,564 | |
| | | | | | | | |
| | | | | | | 41,243,951 | |
| | | | | | | | |
| | | | Electrical Equipment — 1.4% | | | | |
| | 397,232 | | | Eaton Corp. PLC | | | 27,345,451 | |
| | | | | | | | |
| | | | Energy Equipment & Services — 2.3% | | | | |
| | 334,436 | | | Schlumberger Ltd. | | | 29,550,765 | |
| | 351,928 | | | Transocean Ltd. | | | 15,660,796 | |
| | | | | | | | |
| | | | | | | 45,211,561 | |
| | | | | | | | |
| | | | Food & Staples Retailing — 0.9% | | | | |
| | 317,932 | | | CVS Caremark Corp. | | | 18,042,641 | |
| | | | | | | | |
| | | | Food Products — 1.2% | | | | |
| | 756,187 | | | Mondelez International, Inc., Class A | | | 23,759,395 | |
| | | | | | | | |
| | | | Health Care Equipment & Supplies — 2.4% | | | | |
| | 370,958 | | | Baxter International, Inc. | | | 24,368,231 | |
| | 387,754 | | | Covidien PLC | | | 23,629,729 | |
| | | | | | | | |
| | | | | | | 47,997,960 | |
| | | | | | | | |
| | | | Health Care Providers & Services — 2.4% | | | | |
| | 435,949 | | | HCA Holdings, Inc. | | | 18,636,820 | |
| | 404,807 | | | UnitedHealth Group, Inc. | | | 28,988,229 | |
| | | | | | | | |
| | | | | | | 47,625,049 | |
| | | | | | | | |
| | | | Household Products — 1.1% | | | | |
| | 275,190 | | | Procter & Gamble Co. (The) | | | 20,801,612 | |
| | | | | | | | |
| | | | Independent Power Producers & Energy Traders — 1.0% | | | | |
| | 995,623 | | | Calpine Corp.(b) | | | 19,344,955 | |
| | | | | | | | |
| | | | Industrial Conglomerates — 1.6% | | | | |
| | 1,345,685 | | | General Electric Co. | | | 32,148,415 | |
| | | | | | | | |
| | | | Insurance — 5.6% | | | | |
| | 503,538 | | | American International Group, Inc. | | | 24,487,053 | |
| | 698,696 | | | MetLife, Inc. | | | 32,803,777 | |
| | 272,006 | | | Travelers Cos., Inc. (The) | | | 23,057,949 | |
| | 949,075 | | | Unum Group | | | 28,889,843 | |
| | | | | | | | |
| | | | | | | 109,238,622 | |
| | | | | | | | |
| | | | Internet & Catalog Retail — 1.3% | | | | |
| | 1,083,851 | | | Liberty Interactive Corp., Class A(b) | | | 25,437,983 | |
| | | | | | | | |
| | | | Internet Software & Services — 1.0% | | | | |
| | 548,147 | | | AOL, Inc.(b) | | | 18,954,923 | |
| | | | | | | | |
| | | | Machinery — 3.5% | | | | |
| | 207,820 | | | Deere & Co. | | | 16,914,470 | |
| | 236,253 | | | Dover Corp. | | | 21,222,607 | |
| | 402,978 | | | Illinois Tool Works, Inc. | | | 30,735,132 | |
| | | | | | | | |
| | | | | | | 68,872,209 | |
| | | | | | | | |
See accompanying notes to financial statements.
| 52
Portfolio of Investments – as of September 30, 2013
Loomis Sayles Value Fund – (continued)
| | | | | | | | |
Shares | | | Description | | Value (†) | |
| | | | Media — 6.1% | | | | |
| | 333,302 | | | CBS Corp., Class B | | $ | 18,384,938 | |
| | 629,387 | | | Comcast Corp., Class A | | | 28,416,823 | |
| | 302,050 | | | DIRECTV(b) | | | 18,047,488 | |
| | 413,298 | | | Omnicom Group, Inc. | | | 26,219,625 | |
| | 332,203 | �� | | Viacom, Inc., Class B | | | 27,765,527 | |
| | | | | | | | |
| | | | | | | 118,834,401 | |
| | | | | | | | |
| | | | Multiline Retail — 1.5% | | | | |
| | 411,723 | | | Family Dollar Stores, Inc. | | | 29,652,290 | |
| | | | | | | | |
| | | | Oil, Gas & Consumable Fuels — 9.9% | | | | |
| | 440,998 | | | Chevron Corp. | | | 53,581,257 | |
| | 425,739 | | | CONSOL Energy, Inc. | | | 14,326,118 | |
| | 200,135 | | | EOG Resources, Inc. | | | 33,878,853 | |
| | 392,108 | | | ExxonMobil Corp. | | | 33,736,972 | |
| | 350,501 | | | Hess Corp. | | | 27,107,747 | |
| | 464,383 | | | Noble Energy, Inc. | | | 31,118,305 | |
| | | | | | | | |
| | | | | | | 193,749,252 | |
| | | | | | | | |
| | | | Pharmaceuticals — 8.2% | | | | |
| | 510,601 | | | Bristol-Myers Squibb Co. | | | 23,630,614 | |
| | 559,674 | | | Forest Laboratories, Inc.(b) | | | 23,948,451 | |
| | 877,863 | | | Merck & Co., Inc. | | | 41,795,057 | |
| | 1,479,658 | | | Pfizer, Inc. | | | 42,480,981 | |
| | 588,584 | | | Sanofi, ADR | | | 29,800,008 | |
| | | | | | | | |
| | | | | | | 161,655,111 | |
| | | | | | | | |
| | | | REITs – Diversified — 1.3% | | | | |
| | 908,017 | | | Weyerhaeuser Co. | | | 25,996,527 | |
| | | | | | | | |
| | | | Road & Rail — 1.3% | | | | |
| | 325,069 | | | Norfolk Southern Corp. | | | 25,144,087 | |
| | | | | | | | |
| | | | Semiconductors & Semiconductor Equipment — 1.5% | | | | |
| | 717,762 | | | Texas Instruments, Inc. | | | 28,904,276 | |
| | | | | | | | |
| | | | Software — 1.7% | | | | |
| | 708,357 | | | Microsoft Corp. | | | 23,595,372 | |
| | 302,965 | | | Oracle Corp. | | | 10,049,349 | |
| | | | | | | | |
| | | | | | | 33,644,721 | |
| | | | | | | | |
| | | | Specialty Retail — 1.9% | | | | |
| | 130,947 | | | AutoNation, Inc.(b) | | | 6,831,505 | |
| | 635,278 | | | Lowe’s Cos., Inc. | | | 30,245,586 | |
| | | | | | | | |
| | | | | | | 37,077,091 | |
| | | | | | | | |
| | | | Tobacco — 1.4% | | | | |
| | 328,325 | | | Philip Morris International, Inc. | | | 28,429,662 | |
| | | | | | | | |
| | | | Wireless Telecommunication Services — 1.4% | | | | |
| | 786,926 | | | Vodafone Group PLC, Sponsored ADR | | | 27,684,057 | |
| | | | | | | | |
| | | | Total Common Stocks (Identified Cost $1,439,469,471) | | | 1,891,384,522 | |
| | | | | | | | |
See accompanying notes to financial statements.
53 |
Portfolio of Investments – as of September 30, 2013
Loomis Sayles Value Fund – (continued)
| | | | | | | | |
Principal
Amount | | | Description | | Value (†) | |
| | Short-Term Investments — 3.1% | | | | |
| $ | 61,049,074 | | | Tri-Party Repurchase Agreement with Fixed Income Clearing Corporation, dated 9/30/2013 at 0.000% to be repurchased at $61,049,074 on 10/01/2013 collateralized by $63,220,000 U.S. Treasury Note, 0.625% due 8/31/2017 valued at $62,271,700 including accrued interest (Note 2 of Notes to Financial Statements) (Identified Cost $61,049,074) | | $ | 61,049,074 | |
| | | | | | | | |
| | | | | | | | |
| | | | Total Investments — 99.5% (Identified Cost $1,500,518,545)(a) | | | 1,952,433,596 | |
| | | | Other assets less liabilities — 0.5% | | | 9,655,885 | |
| | | | | | | | |
| | | | Net Assets — 100.0% | | $ | 1,962,089,481 | |
| | | | | | | | |
| | | | | | | | |
| | (†) | | | See Note 2 of Notes to Financial Statements. | | | | |
| | (a) | | | Federal Tax Information: | | | | |
| | | | At September 30, 2013, the net unrealized appreciation on investments based on a cost of $1,503,422,210 for federal income tax purposes was as follows: | |
| | | | Aggregate gross unrealized appreciation for all investments in which there is an excess of value over tax cost | | $ | 460,948,868 | |
| | | | Aggregate gross unrealized depreciation for all investments in which there is an excess of tax cost over value | | | (11,937,482 | ) |
| | | | | | | | |
| | | | Net unrealized appreciation | | $ | 449,011,386 | |
| | | | | | | | |
| | | | | | | | |
| | (b) | | | Non-income producing security. | | | | |
| | | | | | | | |
| | ADR | | | An American Depositary Receipt is a certificate issued by a custodian bank representing the right to receive securities of the foreign issuer described. The values of ADRs may be significantly influenced by trading on exchanges not located in the United States. | |
| | REITs | | | Real Estate Investment Trusts | | | | |
Industry Summary at September 30, 2013 (Unaudited)
| | | | |
Oil, Gas & Consumable Fuels | | | 9.9 | % |
Pharmaceuticals | | | 8.2 | |
Media | | | 6.1 | |
Commercial Banks | | | 5.7 | |
Insurance | | | 5.6 | |
Diversified Financial Services | | | 5.5 | |
Capital Markets | | | 4.5 | |
Machinery | | | 3.5 | |
Aerospace & Defense | | | 2.6 | |
Communications Equipment | | | 2.6 | |
Health Care Equipment & Supplies | | | 2.4 | |
Health Care Providers & Services | | | 2.4 | |
Energy Equipment & Services | | | 2.3 | |
Computers & Peripherals | | | 2.2 | |
Electric Utilities | | | 2.1 | |
Other Investments, less than 2% each | | | 30.8 | |
Short-Term Investments | | | 3.1 | |
| | | | |
Total Investments | | | 99.5 | |
Other Assets and Liabilities | | | 0.5 | |
| | | | |
Net Assets | | | 100.0 | % |
| | | | |
See accompanying notes to financial statements.
| 54
Statements of Assets and Liabilities
September 30, 2013
| | | | | | | | | | | | | | | | |
| | | Global Equity
and Income
Fund | | | Growth
Fund | | | Mid Cap
Growth
Fund | | | Value
Fund | |
ASSETS | | | | | | | | | | | | | | | | |
Investments at cost | | $ | 1,041,796,752 | | | $ | 539,777,923 | | | $ | 81,884,287 | | | $ | 1,500,518,545 | |
Net unrealized appreciation | | | 116,855,672 | | | | 76,159,525 | | | | 25,527,448 | | | | 451,915,051 | |
| | | | | | | | | | | | | | | | |
Investments at value | | | 1,158,652,424 | | | | 615,937,448 | | | | 107,411,735 | | | | 1,952,433,596 | |
Foreign currency at value (identified cost $7,495,616, $0, $0 and $0) | | | 7,633,692 | | | | — | | | | — | | | | — | |
Receivable for Fund shares sold | | | 2,850,354 | | | | 1,864,757 | | | | 218,793 | | | | 14,087,282 | |
Receivable for securities sold | | | 3,175,254 | | | | — | | | | — | | | | — | |
Dividends and interest receivable | | | 5,783,071 | | | | 436,959 | | | | 5,187 | | | | 2,765,782 | |
Unrealized appreciation on forward foreign currency contracts (Note 2) | | | 81,735 | | | | — | | | | — | | | | — | |
Tax reclaims receivable | | | 240,217 | | | | 27,539 | | | | — | | | | — | |
| | | | | | | | | | | | | | | | |
TOTAL ASSETS | | | 1,178,416,747 | | | | 618,266,703 | | | | 107,635,715 | | | | 1,969,286,660 | |
| | | | | | | | | | | | | | | | |
LIABILITIES | | | | | | | | | | | | | | | | |
Payable for securities purchased | | | 13,171,047 | | | | 3,841,057 | | | | 1,122,931 | | | | — | |
Payable for Fund shares redeemed | | | 1,475,966 | | | | 170,908 | | | | 159,243 | | | | 5,848,200 | |
Unrealized depreciation on forward foreign currency contracts (Note 2) | | | 309,227 | | | | — | | | | — | | | | — | |
Foreign taxes payable (Note 2) | | | 775 | | | | — | | | | — | | | | — | |
Management fees payable (Note 6) | | | 708,740 | | | | 244,885 | | | | 41,677 | | | | 798,945 | |
Deferred Trustees’ fees (Note 6) | | | 107,551 | | | | 134,403 | | | | 92,143 | | | | 331,407 | |
Administrative fees payable (Note 6) | | | 41,840 | | | | 21,677 | | | | 3,822 | | | | 70,747 | |
Payable to distributor (Note 6d) | | | 11,747 | | | | 52,697 | | | | 3,748 | | | | 44,170 | |
Other accounts payable and accrued expenses | | | 123,850 | | | | 86,660 | | | | 58,614 | | | | 103,710 | |
| | | | | | | | | | | | | | | | |
TOTAL LIABILITIES | | | 15,950,743 | | | | 4,552,287 | | | | 1,482,178 | | | | 7,197,179 | |
| | | | | | | | | | | | | | | | |
NET ASSETS | | $ | 1,162,466,004 | | | $ | 613,714,416 | | | $ | 106,153,537 | | | $ | 1,962,089,481 | |
| | | | | | | | | | | | | | | | |
NET ASSETS CONSIST OF: | | | | | | | | | | | | | | | | |
Paid-in capital | | $ | 1,025,718,513 | | | $ | 620,896,470 | | | $ | 110,369,805 | | | $ | 1,404,982,697 | |
Accumulated net investment (loss)/Undistributed net investment income | | | 16,224,238 | | | | 938,277 | | | | (497,558 | ) | | | 16,777,729 | |
Accumulated net realized gain (loss) on investments, options written and foreign currency transactions | | | 3,724,698 | | | | (84,279,856 | ) | | | (29,246,158 | ) | | | 88,414,004 | |
Net unrealized appreciation on investments and foreign currency translations | | | 116,798,555 | | | | 76,159,525 | | | | 25,527,448 | | | | 451,915,051 | |
| | | | | | | | | | | | | | | | |
NET ASSETS | | $ | 1,162,466,004 | | | $ | 613,714,416 | | | $ | 106,153,537 | | | $ | 1,962,089,481 | |
| | | | | | | | | | | | | | | | |
See accompanying notes to financial statements.
55 |
Statements of Assets and Liabilities (continued)
September 30, 2013
| | | | | | | | | | | | | | | | |
| | | Global Equity
and Income
Fund | | | Growth
Fund | | | Mid Cap
Growth
Fund | | | Value
Fund | |
COMPUTATION OF NET ASSET VALUE AND OFFERING PRICE: | | | | | | | | | | | | | | | | |
Class A shares: | | | | | | | | | | | | | | | | |
Net assets | | $ | 251,210,925 | | | $ | 50,248,050 | | | $ | 36,125,308 | | | $ | 171,327,222 | |
| | | | | | | | | | | | | | | | |
Shares of beneficial interest | | | 13,524,374 | | | | 6,226,888 | | | | 991,059 | | | | 6,694,559 | |
| | | | | | | | | | | | | | | | |
Net asset value and redemption price per share | | $ | 18.57 | | | $ | 8.07 | | | $ | 36.45 | | | $ | 25.59 | |
| | | | | | | | | | | | | | | | |
Offering price per share (100/94.25 of net asset value) (Note 1) | | $ | 19.70 | | | $ | 8.56 | | | $ | 38.67 | | | $ | 27.15 | |
| | | | | | | | | | | | | | | | |
Class B shares: (redemption price per share is equal to net asset value less any applicable contingent deferred sales charge) (Note 1) | | | | | | | | | | | | | | | | |
Net assets | | $ | — | | | $ | 1,421,612 | | | $ | — | | | $ | 1,143,115 | |
| | | | | | | | | | | | | | | | |
Shares of beneficial interest | | | — | | | | 188,042 | | | | — | | | | 44,355 | |
| | | | | | | | | | | | | | | | |
Net asset value and offering price per share | | $ | — | | | $ | 7.56 | | | | — | | | $ | 25.77 | |
| | | | | | | | | | | | | | | | |
Class C shares: (redemption price per share is equal to net asset value less any applicable contingent deferred sales charge) (Note 1) | | | | | | | | | | | | | | | | |
Net assets | | $ | 340,560,739 | | | $ | 20,798,400 | | | $ | 2,535,832 | | | $ | 15,157,707 | |
| | | | | | | | | | | | | | | | |
Shares of beneficial interest | | | 18,553,936 | | | | 2,754,778 | | | | 71,982 | | | | 598,403 | |
| | | | | | | | | | | | | | | | |
Net asset value and offering price per share | | $ | 18.36 | | | $ | 7.55 | | | $ | 35.23 | | | $ | 25.33 | |
| | | | | | | | | | | | | | | | |
Class N shares: | | | | | | | | | | | | | | | | |
Net assets | | $ | — | | | $ | 1,129 | | | $ | 1,205 | | | $ | 260,642,666 | |
| | | | | | | | | | | | | | | | |
Shares of beneficial interest | | | — | | | | 132 | | | | 32 | | | | 10,159,612 | |
| | | | | | | | | | | | | | | | |
Net asset value, offering and redemption price per share | | $ | — | | | $ | 8.56 | * | | $ | 37.95 | * | | $ | 25.65 | |
| | | | | | | | | | | | | | | | |
Class Y shares: | | | | | | | | | | | | | | | | |
Net assets | | $ | 570,694,340 | | | $ | 541,245,225 | | | $ | 67,491,192 | | | $ | 1,513,807,016 | |
| | | | | | | | | | | | | | | | |
Shares of beneficial interest | | | 30,555,107 | | | | 63,169,688 | | | | 1,779,117 | | | | 59,011,435 | |
| | | | | | | | | | | | | | | | |
Net asset value, offering and redemption price per share | | $ | 18.68 | | | $ | 8.57 | | | $ | 37.94 | | | $ | 25.65 | |
| | | | | | | | | | | | | | | | |
Admin Class shares: | | | | | | | | | | | | | | | | |
Net assets | | $ | — | | | $ | — | | | $ | — | | | $ | 11,755 | |
| | | | | | | | | | | | | | | | |
Shares of beneficial interest | | | — | | | | — | | | | — | | | | 461 | |
| | | | | | | | | | | | | | | | |
Net asset value, offering and redemption price per share | | $ | — | | | $ | — | | | $ | — | | | $ | 25.51 | * |
| | | | | | | | | | | | | | | | |
| * | Net asset value calculations reflect fractional share and dollar amounts. |
See accompanying notes to financial statements.
| 56
Statements of Operations
For the Year Ended September 30, 2013
| | | | | | | | | | | | | | | | |
| | | Global Equity
and Income
Fund | | | Growth
Fund | | | Mid Cap
Growth
Fund | | | Value
Fund | |
INVESTMENT INCOME | | | | | | | | | | | | | | | | |
Dividends | | $ | 17,930,650 | (a) | | $ | 3,749,025 | | | $ | 976,826 | (a) | | $ | 37,615,891 | |
Interest | | | 15,479,353 | | | | 114 | | | | 188 | | | | 2,304 | |
Less net foreign taxes withheld | | | (693,293 | ) | | | (36,033 | ) | | | (376 | ) | | | (205,517 | ) |
| | | | | | | | | | | | | | | | |
| | | 32,716,710 | | | | 3,713,106 | | | | 976,638 | | | | 37,412,678 | |
| | | | | | | | | | | | | | | | |
Expenses | | | | | | | | | | | | | | | | |
Management fees (Note 6) | | | 8,172,113 | | | | 1,257,080 | | | | 744,404 | | | | 8,233,449 | |
Service and distribution fees (Note 6) | | | 3,652,543 | | | | 246,918 | | | | 112,958 | | | | 501,424 | |
Administrative fees (Note 6) | | | 481,960 | | | | 111,232 | | | | 43,909 | | | | 728,356 | |
Trustees’ fees and expenses (Note 6) | | | 45,354 | | | | 34,538 | | | | 27,198 | | | | 78,554 | |
Transfer agent fees and expenses (Note 6) | | | 867,352 | | | | 315,079 | | | | 214,151 | | | | 2,282,835 | |
Audit and tax services fees | | | 55,720 | | | | 43,021 | | | | 47,712 | | | | 36,069 | |
Custodian fees and expenses | | | 311,525 | | | | 24,664 | | | | 20,494 | | | | 48,200 | |
Legal fees | | | 14,473 | | | | 3,170 | | | | 1,329 | | | | 21,662 | |
Registration fees | | | 94,577 | | | | 101,564 | | | | 67,475 | | | | 118,172 | |
Shareholder reporting expenses | | | 103,127 | | | | 31,401 | | | | 11,503 | | | | 142,281 | |
Miscellaneous expenses | | | 35,062 | | | | 13,625 | | | | 8,840 | | | | 41,932 | |
| | | | | | | | | | | | | | | | |
Total expenses | | | 13,833,806 | | | | 2,182,292 | | | | 1,299,973 | | | | 12,232,934 | |
Less waiver and/or expense reimbursement (Note 6) | | | — | | | | (18 | ) | | | (194,356 | ) | | | — | |
| | | | | | | | | | | | | | | | |
Net expenses | | | 13,833,806 | | | | 2,182,274 | | | | 1,105,617 | | | | 12,232,934 | |
| | | | | | | | | | | | | | | | |
Net investment income (loss) | | | 18,882,904 | | | | 1,530,832 | | | | (128,979 | ) | | | 25,179,744 | |
| | | | | | | | | | | | | | | | |
NET REALIZED AND UNREALIZED GAIN (LOSS) ON INVESTMENTS, OPTIONS WRITTEN AND FOREIGN CURRENCY TRANSACTIONS | | | | | | | | | | | | | | | | |
Net realized gain on: | | | | | | | | | | | | | | | | |
Investments | | | 31,600,770 | | | | 4,017,895 | | | | 12,876,579 | | | | 103,312,153 | |
Options written | | | — | | | | — | | | | 137,983 | | | | — | |
Foreign currency transactions | | | 41,625 | | | | — | | | | — | | | | — | |
Net change in unrealized appreciation (depreciation) on: | | | | | | | | | | | | | | | | |
Investments | | | 58,033,005 | | | | 49,693,475 | | | | 10,743,661 | | | | 226,865,373 | |
Foreign currency translations | | | (29,115 | ) | | | — | | | | — | | | | — | |
| | | | | | | | | | | | | | | | |
Net realized and unrealized gain on investments, options written and foreign currency transactions | | | 89,646,285 | | | | 53,711,370 | | | | 23,758,223 | | | | 330,177,526 | |
| | | | | | | | | | | | | | | | |
NET INCREASE IN NET ASSETS RESULTING FROM OPERATIONS | | $ | 108,529,189 | | | $ | 55,242,202 | | | $ | 23,629,244 | | | $ | 355,357,270 | |
| | | | | | | | | | | | | | | | |
| (a) | Includes non-recurring dividends of $3,319,798 and $592,377 for Global Equity and Income Fund and Mid Cap Growth Fund, respectively. |
See accompanying notes to financial statements.
57 |
This Page Intentionally Left Blank
| 58
Statements of Changes In Net Assets
| | | | | | | | | | | | | | | | |
| | | Global Equity and Income Fund | | | Growth Fund | |
| | | Year Ended
September 30,
2013 | | | Year Ended
September 30,
2012 | | | Year Ended
September 30,
2013 | | | Year Ended
September 30,
2012 | |
FROM OPERATIONS: | | | | | | | | | | | | | | | | |
Net investment income | | $ | 18,882,904 | | | $ | 14,455,622 | | | $ | 1,530,832 | | | $ | 920,515 | |
Net realized gain on investments and foreign currency transactions | | | 31,642,395 | | | | 26,532,775 | | | | 4,017,895 | | | | 4,329,020 | |
Net change in unrealized appreciation (depreciation) on investments and foreign currency translations | | | 58,003,890 | | | | 77,106,896 | | | | 49,693,475 | | | | 22,338,515 | |
| | | | | | | | | | | | | | | | |
Net increase in net assets resulting from operations | | | 108,529,189 | | | | 118,095,293 | | | | 55,242,202 | | | | 27,588,050 | |
| | | | | | | | | | | | | | | | |
FROM DISTRIBUTIONS TO SHAREHOLDERS: | | | | | | | | | | | | | | | | |
Net investment income | | | | | | | | | | | | | | | | |
Class A | | | (3,564,600 | ) | | | (2,072,301 | ) | | | (294,078 | ) | | | (40,999 | ) |
Class C | | | (2,862,934 | ) | | | (1,277,382 | ) | | | (20,215 | ) | | | — | |
Class Y | | | (9,012,867 | ) | | | (4,073,326 | ) | | | (1,088,093 | ) | | | (290,006 | ) |
| | | | | | | | | | | | | | | | |
Total distributions | | | (15,440,401 | ) | | | (7,423,009 | ) | | | (1,402,386 | ) | | | (331,005 | ) |
| | | | | | | | | | | | | | | | |
NET INCREASE IN NET ASSETS
FROM CAPITAL SHARE
TRANSACTIONS (NOTE 12) | | | 141,699,087 | | | | 343,913,074 | | | | 411,126,304 | | | | 11,726,064 | |
| | | | | | | | | | | | | | | | |
Net increase in net assets | | | 234,787,875 | | | | 454,585,358 | | | | 464,966,120 | | | | 38,983,109 | |
NET ASSETS | | | | | | | | | | | | | | | | |
Beginning of the year | | | 927,678,129 | | | | 473,092,771 | | | | 148,748,296 | | | | 109,765,187 | |
| | | | | | | | | | | | | | | | |
End of the year | | $ | 1,162,466,004 | | | $ | 927,678,129 | | | $ | 613,714,416 | | | $ | 148,748,296 | |
| | | | | | | | | | | | | | | | |
UNDISTRIBUTED NET
INVESTMENT INCOME | | $ | 16,224,238 | | | $ | 11,769,372 | | | $ | 938,277 | | | $ | 809,831 | |
| | | | | | | | | | | | | | | | |
See accompanying notes to financial statements.
59 |
Statements of Changes In Net Assets (continued)
| | | | | | | | | | | | | | | | |
| | | Mid Cap Growth Fund | | | Value Fund | |
| | | Year Ended
September 30,
2013 | | | Year Ended
September 30,
2012 | | | Year Ended
September 30,
2013 | | | Year Ended
September 30,
2012 | |
FROM OPERATIONS: | | | | | | | | | | | | | | | | |
Net investment income (loss) | | $ | (128,979 | ) | | $ | (655,071 | ) | | $ | 25,179,744 | | | $ | 21,146,564 | |
Net realized gain on investments and options written | | | 13,014,562 | | | | 3,171,141 | | | | 103,312,153 | | | | 44,413,605 | |
Net change in unrealized appreciation (depreciation) on investments | | | 10,743,661 | | | | 15,354,072 | | | | 226,865,373 | | | | 278,326,235 | |
| | | | | | | | | | | | | | | | |
Net increase in net assets resulting from operations | | | 23,629,244 | | | | 17,870,142 | | | | 355,357,270 | | | | 343,886,404 | |
| | | | | | | | | | | | | | | | |
FROM DISTRIBUTIONS TO SHAREHOLDERS: | | | | | | | | | | | | | | | | |
Net investment income | | | | | | | | | | | | | | | | |
Class A | | | — | | | | — | | | | (1,732,857 | ) | | | (1,701,635 | ) |
Class B | | | — | | | | — | | | | (4,549 | ) | | | (4,098 | ) |
Class C | | | — | | | | — | | | | (55,400 | ) | | | (35,308 | ) |
Class Y | | | — | | | | — | | | | (20,425,746 | ) | | | (16,240,641 | ) |
Admin Class | | | — | | | | — | | | | (23 | ) | | | (19 | ) |
| | | | | | | | | | | | | | | | |
Total distributions | | | — | | | | — | | | | (22,218,575 | ) | | | (17,981,701 | ) |
| | | | | | | | | | | | | | | | |
NET INCREASE (DECREASE) IN NET ASSETS FROM CAPITAL SHARE TRANSACTIONS (NOTE 12) | | | (20,292,180 | ) | | | (16,818,326 | ) | | | 248,645,802 | | | | (41,007,267 | ) |
| | | | | | | | | | | | | | | | |
Net increase in net assets | | | 3,337,064 | | | | 1,051,816 | | | | 581,784,497 | | | | 284,897,436 | |
NET ASSETS | | | | | | | | | | | | | | | | |
Beginning of the year | | | 102,816,473 | | | | 101,764,657 | | | | 1,380,304,984 | | | | 1,095,407,548 | |
| | | | | | | | | | | | | | | | |
End of the year | | $ | 106,153,537 | | | $ | 102,816,473 | | | $ | 1,962,089,481 | | | $ | 1,380,304,984 | |
| | | | | | | | | | | | | | | | |
ACCUMULATED NET INVESTMENT (LOSS)/UNDISTRIBUTED NET INVESTMENT INCOME | | $ | (497,558 | ) | | $ | (660,102 | ) | | $ | 16,777,729 | | | $ | 14,397,277 | |
| | | | | | | | | | | | | | | | |
See accompanying notes to financial statements.
| 60
Financial Highlights
For a share outstanding throughout each period.
| | | | | | | | | | | | | | | | | | | | | | | | | | | | |
| | | | | | Income (Loss) From Investment
Operations: | | | Less Distributions: | |
| | | Net asset
value,
beginning
of the
period | | | Net
investment
income (a) | | | Net realized
and
unrealized
gain (loss) | | | Total from
investment
operations | | | Dividends
from net
investment
income | | | Distributions
from net
realized
capital
gains (b) | | | Total
distributions | |
| GLOBAL EQUITYAND INCOME FUND | | | | | | | | | | | | | | | | |
Class A | | | | | | | | | | | | | | | | | | | | | | | | | | | | |
9/30/2013 | | $ | 17.07 | | | $ | 0.32 | (g) | | $ | 1.45 | | | $ | 1.77 | | | $ | (0.27 | ) | | $ | — | | | $ | (0.27 | ) |
9/30/2012 | | | 14.24 | | | | 0.35 | (h) | | | 2.71 | | | | 3.06 | | | | (0.23 | ) | | | — | | | | (0.23 | ) |
9/30/2011 | | | 14.72 | | | | 0.22 | | | | (0.45 | ) | | | (0.23 | ) | | | (0.25 | ) | | | — | | | | (0.25 | ) |
9/30/2010 | | | 12.50 | | | | 0.26 | | | | 2.26 | | | | 2.52 | | | | (0.30 | ) | | | — | | | | (0.30 | ) |
9/30/2009 | | | 11.65 | | | | 0.36 | | | | 0.74 | (j) | | | 1.10 | | | | (0.25 | ) | | | (0.00 | ) | | | (0.25 | ) |
Class C | | | | | | | | | | | | | | | | | | | | | | | | | | | | |
9/30/2013 | | | 16.90 | | | | 0.19 | (g) | | | 1.45 | | | | 1.64 | | | | (0.18 | ) | | | — | | | | (0.18 | ) |
9/30/2012 | | | 14.10 | | | | 0.22 | (h) | | | 2.70 | | | | 2.92 | | | | (0.12 | ) | | | — | | | | (0.12 | ) |
9/30/2011 | | | 14.59 | | | | 0.10 | | | | (0.44 | ) | | | (0.34 | ) | | | (0.15 | ) | | | — | | | | (0.15 | ) |
9/30/2010 | | | 12.39 | | | | 0.16 | | | | 2.26 | | | | 2.42 | | | | (0.22 | ) | | | — | | | | (0.22 | ) |
9/30/2009 | | | 11.51 | | | | 0.28 | | | | 0.75 | (j) | | | 1.03 | | | | (0.15 | ) | | | (0.00 | ) | | | (0.15 | ) |
Class Y | | | | | | | | | | | | | | | | | | | | | | | | | | | | |
9/30/2013 | | | 17.15 | | | | 0.37 | (g) | | | 1.47 | | | | 1.84 | | | | (0.31 | ) | | | — | | | | (0.31 | ) |
9/30/2012 | | | 14.31 | | | | 0.40 | (h) | | | 2.71 | | | | 3.11 | | | | (0.27 | ) | | | — | | | | (0.27 | ) |
9/30/2011 | | | 14.78 | | | | 0.26 | | | | (0.45 | ) | | | (0.19 | ) | | | (0.28 | ) | | | — | | | | (0.28 | ) |
9/30/2010 | | | 12.54 | | | | 0.29 | | | | 2.28 | | | | 2.57 | | | | (0.33 | ) | | | — | | | | (0.33 | ) |
9/30/2009 | | | 11.70 | | | | 0.38 | | | | 0.75 | (j) | | | 1.13 | | | | (0.29 | ) | | | (0.00 | ) | | | (0.29 | ) |
| (a) | Per share net investment income has been calculated using the average shares outstanding during the period. |
| (b) | Amount rounds to less than $0.01 per share, if applicable. |
| (c) | Had certain expenses not been waived/reimbursed during the period, if applicable, total returns would have been lower. |
| (d) | A sales charge for Class A shares and a contingent deferred sales charge for Class C shares are not reflected in total return calculations. Periods less than one year, if applicable, are not annualized. |
| (e) | The investment adviser and/or administrator agreed to waive its fees and/or reimburse a portion of the Fund’s expenses during the period, if applicable. Without this waiver/reimbursement, expenses would have been higher. |
| (f) | Computed on an annualized basis for periods less than one year, if applicable. |
| (g) | Includes non-recurring dividends. Without these dividends, net investment income per share would have been $0.27, $0.13 and $0.31 for Class A, Class C and Class Y shares, respectively, total return would have been 10.25%, 9.41% and 10.60% for Class A, Class C and Class Y shares, respectively, and the ratio of net investment income to average net assets would have been 1.51%, 0.76% and 1.76% for Class A, Class C and Class Y shares, respectively. |
See accompanying notes to financial statements.
61 |
| | | | | | | | | | | | | | | | | | | | | | | | | | |
| | | | | | | | | | Ratios to Average Net Assets: | | | | |
Net asset
value,
end of
the period | | | Total
return
(%) (c)(d) | | | Net assets,
end of
the period
(000’s) | | | Net
expenses
(%) (e)(f) | | | Gross
expenses
(%) (f) | | | Net investment
income
(%) (f) | | | Portfolio
turnover
rate (%) | |
| | | | | | | | | | | | | | | | | | | | | | | | | | |
| | | | | | | | | | | | | | | | | | | | | | | | | | |
| $ | 18.57 | | | | 10.54 | (g) | | $ | 251,211 | | | | 1.18 | | | | 1.18 | | | | 1.82 | (g) | | | 58 | |
| | 17.07 | | | | 21.75 | (h) | | | 216,209 | | | | 1.21 | | | | 1.21 | | | | 2.16 | (h) | | | 29 | |
| | 14.24 | | | | (1.67 | ) | | | 111,589 | | | | 1.24 | (i) | | | 1.24 | (i) | | | 1.41 | | | | 65 | |
| | 14.72 | | | | 20.61 | | | | 64,367 | | | | 1.25 | | | | 1.29 | | | | 1.96 | | | | 99 | |
| | 12.50 | | | | 10.27 | | | | 44,669 | | | | 1.25 | | | | 1.34 | | | | 3.56 | | | | 114 | |
| | | | | | | | | | | | | | | | | | | | | | | | | | |
| | 18.36 | | | | 9.77 | (g) | | | 340,561 | | | | 1.93 | | | | 1.93 | | | | 1.07 | (g) | | | 58 | |
| | 16.90 | | | | 20.83 | (h) | | | 251,366 | | | | 1.96 | | | | 1.96 | | | | 1.40 | (h) | | | 29 | |
| | 14.10 | | | | (2.42 | ) | | | 145,369 | | | | 1.99 | (i) | | | 1.99 | (i) | | | 0.64 | | | | 65 | |
| | 14.59 | | | | 19.79 | | | | 109,455 | | | | 2.00 | | | | 2.04 | | | | 1.21 | | | | 99 | |
| | 12.39 | | | | 9.40 | | | | 96,208 | | | | 2.00 | | | | 2.09 | | | | 2.82 | | | | 114 | |
| | | | | | | | | | | | | | | | | | | | | | | | | | |
| | 18.68 | | | | 10.90 | (g) | | | 570,694 | | | | 0.93 | | | | 0.93 | | | | 2.07 | (g) | | | 58 | |
| | 17.15 | | | | 21.96 | (h) | | | 460,103 | | | | 0.96 | | | | 0.96 | | | | 2.44 | (h) | | | 29 | |
| | 14.31 | | | | (1.42 | ) | | | 216,136 | | | | 0.99 | (i) | | | 0.99 | (i) | | | 1.65 | | | | 65 | |
| | 14.78 | | | | 21.02 | | | | 144,780 | | | | 1.00 | | | | 1.04 | | | | 2.20 | | | | 99 | |
| | 12.54 | | | | 10.49 | | | | 108,728 | | | | 1.00 | | | | 1.01 | | | | 3.79 | | | | 114 | |
| (h) | Includes a non-recurring dividend. Without this dividend, net investment income per share would have been $0.31, $0.19 and $0.36 for Class A, Class C and Class Y shares, respectively, total return would have been 21.46%, 20.55% and 21.75% for Class A, Class C and Class Y shares, respectively, and the ratio of net investment income to average net assets would have been 1.93%, 1.18% and 2.20% for Class A, Class C and Class Y shares, respectively. |
| (i) | Includes fee/expense recovery of 0.02%. |
| (j) | The amount shown for a share outstanding does not correspond with the aggregate realized and unrealized gain (loss) on investments for the period due to the timing of sales and redemptions of fund shares in relation to fluctuating market values of investments of the Fund. |
See accompanying notes to financial statements.
| 62
Financial Highlights (continued)
For a share outstanding throughout each period.
| | | | | | | | | | | | | | | | | | | | | | | | | | | | |
| | | | | | Income (Loss) from Investment
Operations: | | | Less Distributions: | |
| | | Net asset
value,
beginning
of the
period | | | Net
investment
income
(loss) (a)(b) | | | Net realized
and
unrealized
gain (loss) | | | Total from
investment
operations | | | Dividends
from net
investment
income | | | Distributions
from net
realized
capital
gains | | | Total
distributions | |
| GROWTH FUND | | | | | | | | | | | | | | | | | | | |
Class A | | | | | | | | | | | | | | | | | | | | | | | | | | | | |
9/30/2013 | | $ | 6.50 | | | $ | 0.04 | | | $ | 1.59 | | | $ | 1.63 | | | $ | (0.06 | ) | | $ | — | | | $ | (0.06 | ) |
9/30/2012 | | | 5.24 | | | | 0.04 | | | | 1.23 | | | | 1.27 | | | | (0.01 | ) | | | — | | | | (0.01 | ) |
9/30/2011 | | | 5.14 | | | | 0.01 | | | | 0.09 | | | | 0.10 | | | | — | | | | — | | | | — | |
9/30/2010 | | | 4.48 | | | | (0.01 | ) | | | 0.67 | | | | 0.66 | | | | — | | | | — | | | | — | |
9/30/2009 | | | 4.99 | | | | (0.01 | ) | | | (0.50 | ) | | | (0.51 | ) | | | — | | | | — | | | | — | |
Class B | | | | | | | | | | | | | | | | | | | | | | | | | | | | |
9/30/2013 | | | 6.09 | | | | (0.01 | ) | | | 1.48 | | | | 1.47 | | | | — | | | | — | | | | — | |
9/30/2012 | | | 4.94 | | | | (0.01 | ) | | | 1.16 | | | | 1.15 | | | | — | | | | — | | | | — | |
9/30/2011 | | | 4.87 | | | | (0.03 | ) | | | 0.10 | | | | 0.07 | | | | — | | | | — | | | | — | |
9/30/2010 | | | 4.28 | | | | (0.05 | ) | | | 0.64 | | | | 0.59 | | | | — | | | | — | | | | — | |
9/30/2009 | | | 4.81 | | | | (0.04 | ) | | | (0.49 | ) | | | (0.53 | ) | | | — | | | | — | | | | — | |
Class C | | | | | | | | | | | | | | | | | | | | | | | | | | | | |
9/30/2013 | | | 6.09 | | | | (0.01 | ) | | | 1.48 | | | | 1.47 | | | | (0.01 | ) | | | — | | | | (0.01 | ) |
9/30/2012 | | | 4.94 | | | | (0.01 | ) | | | 1.16 | | | | 1.15 | | | | — | | | | — | | | | — | |
9/30/2011 | | | 4.87 | | | | (0.03 | ) | | | 0.10 | | | | 0.07 | | | | — | | | | — | | | | — | |
9/30/2010 | | | 4.28 | | | | (0.05 | ) | | | 0.64 | | | | 0.59 | | | | — | | | | — | | | | — | |
9/30/2009 | | | 4.81 | | | | (0.04 | ) | | | (0.49 | ) | | | (0.53 | ) | | | — | | | | — | | | | — | |
Class N | | | | | | | | | | | | | | | | | | | | | | | | | | | | |
9/30/2013* | | | 7.58 | | | | 0.03 | | | | 0.95 | | | | 0.98 | | | | — | | | | — | | | | — | |
Class Y | | | | | | | | | | | | | | | | | | | | | | | | | | | | |
9/30/2013 | | | 6.90 | | | | 0.05 | | | | 1.69 | | | | 1.74 | | | | (0.07 | ) | | | — | | | | (0.07 | ) |
9/30/2012 | | | 5.56 | | | | 0.06 | | | | 1.30 | | | | 1.36 | | | | (0.02 | ) | | | — | | | | (0.02 | ) |
9/30/2011 | | | 5.43 | | | | 0.03 | | | | 0.10 | | | | 0.13 | | | | — | | | | — | | | | — | |
9/30/2010 | | | 4.73 | | | | (0.00 | ) | | | 0.70 | | | | 0.70 | | | | — | | | | — | | | | — | |
9/30/2009 | | | 5.24 | | | | 0.01 | | | | (0.52 | ) | | | (0.51 | ) | | | — | | | | — | | | | — | |
| * | From commencement of Class operations on February 1, 2013 through September 30, 2013. |
| (a) | Per share net investment income (loss) has been calculated using the average shares outstanding during the period. |
| (b) | Amount rounds to less than $0.01 per share, if applicable. |
| (c) | Had certain expenses not been waived/reimbursed during the period, if applicable, total returns would have been lower. |
| (d) | A sales charge for Class A shares and a contingent deferred sales charge for Class B and Class C shares are not reflected in total return calculations. Periods less than one year, if applicable, are not annualized. |
| (e) | The investment adviser and/or administrator agreed to waive its fees and/or reimburse a portion of the Fund’s expenses during the period, if applicable. Without this waiver/reimbursement, expenses would have been higher. |
| (f) | Computed on an annualized basis for periods less than one year, if applicable. |
| (g) | Effective February 1, 2010, the expense limit increased from 0.85% to 1.00% for Class Y shares. |
See accompanying notes to financial statements.
63 |
| | | | | | | | | | | | | | | | | | | | | | | | | | |
| | | | | | | | | |
Ratios to Average Net Assets: | | | | |
Net asset
value,
end of
the period | | | Total
return
(%) (c)(d) | | |
Net assets,
end of
the period
(000’s) | | | Net
expenses
(%) (e)(f) | | | Gross
expenses
(%) (f) | | | Net investment
income (loss)
(%) (f) | | | Portfolio
turnover
rate (%) | |
| | | | | | | | | | | | | | | | | | | | | | | | | | |
| | | | | | | | | | | | | | | | | | | | | | | | | | |
| $ | 8.07 | | | | 25.23 | | | $ | 50,248 | | | | 1.03 | | | | 1.03 | | | | 0.57 | | | | 6 | |
| | 6.50 | | | | 24.22 | | | | 33,663 | | | | 1.07 | | | | 1.07 | | | | 0.61 | | | | 16 | |
| | 5.24 | | | | 1.95 | | | | 26,716 | | | | 1.14 | | | | 1.14 | | | | 0.23 | | | | 16 | |
| | 5.14 | | | | 14.73 | | | | 29,901 | | | | 1.19 | | | | 1.20 | | | | (0.30 | ) | | | 163 | |
| | 4.48 | | | | (10.40 | ) | | | 33,207 | | | | 1.25 | | | | 1.31 | | | | (0.25 | ) | | | 191 | |
| | | | | | | | | | | | | | | | | | | | | | | | | | |
| | 7.56 | | | | 24.14 | | | | 1,422 | | | | 1.78 | | | | 1.78 | | | | (0.14 | ) | | | 6 | |
| | 6.09 | | | | 23.28 | | | | 1,908 | | | | 1.82 | | | | 1.82 | | | | (0.12 | ) | | | 16 | |
| | 4.94 | | | | 1.44 | | | | 2,609 | | | | 1.89 | | | | 1.89 | | | | (0.54 | ) | | | 16 | |
| | 4.87 | | | | 13.79 | | | | 4,086 | | | | 1.93 | | | | 1.95 | | | | (1.06 | ) | | | 163 | |
| | 4.28 | | | | (11.02 | ) | | | 5,397 | | | | 2.00 | | | | 2.12 | | | | (1.06 | ) | | | 191 | |
| | | | | | | | | | | | | | | | | | | | | | | | | | |
| | 7.55 | | | | 24.21 | | | | 20,798 | | | | 1.78 | | | | 1.78 | | | | (0.20 | ) | | | 6 | |
| | 6.09 | | | | 23.28 | | | | 10,489 | | | | 1.82 | | | | 1.82 | | | | (0.13 | ) | | | 16 | |
| | 4.94 | | | | 1.44 | | | | 10,262 | | | | 1.89 | | | | 1.89 | | | | (0.53 | ) | | | 16 | |
| | 4.87 | | | | 13.79 | | | | 12,493 | | | | 1.93 | | | | 1.95 | | | | (1.06 | ) | | | 163 | |
| | 4.28 | | | | (11.02 | ) | | | 16,336 | | | | 2.00 | | | | 2.12 | | | | (1.06 | ) | | | 191 | |
| | | | | | | | | | | | | | | | | | | | | | | | | | |
| | 8.56 | | | | 12.93 | | | | 1 | | | | 0.95 | | | | 3.50 | | | | 0.60 | | | | 6 | |
| | | | | | | | | | | | | | | | | | | | | | | | | | |
| | 8.57 | | | | 25.49 | | | | 541,245 | | | | 0.77 | | | | 0.77 | | | | 0.68 | | | | 6 | |
| | 6.90 | | | | 24.57 | | | | 102,688 | | | | 0.82 | | | | 0.82 | | | | 0.87 | | | | 16 | |
| | 5.56 | | | | 2.21 | | | | 70,177 | | | | 0.89 | | | | 0.89 | | | | 0.49 | | | | 16 | |
| | 5.43 | | | | 15.01 | | | | 53,299 | | | | 0.93 | (g) | | | 0.95 | | | | (0.05 | ) | | | 163 | |
| | 4.73 | | | | (9.73 | ) | | | 57,033 | | | | 0.75 | | | | 0.75 | | | | 0.18 | | | | 191 | |
See accompanying notes to financial statements.
| 64
Financial Highlights (continued)
For a share outstanding throughout each period.
| | | | | | | | | | | | | | | | | | | | | | | | | | | | |
| | | | | | Income (Loss) from Investment
Operations: | | | Less Distributions: | |
| | | Net asset
value,
beginning
of the
period | | | Net
investment
income
(loss) (a) | | | Net realized
and
unrealized
gain (loss) | | | Total from
investment
operations | | | Dividends
from net
investment
income | | | Distributions
from net
realized
capital
gains | | | Total
distributions | |
| MID CAP GROWTH FUND | | | | | | | | | | | | | | | | | | | |
Class A* | | | | | | | | | | | | | | | | | | | | | | | | | | | | |
9/30/2013 | | $ | 28.84 | | | $ | (0.07 | )(f) | | $ | 7.68 | | | $ | 7.61 | | | $ | — | | | $ | — | | | $ | — | |
9/30/2012 | | | 24.40 | | | | (0.20 | ) | | | 4.64 | | | | 4.44 | | | | — | | | | — | | | | — | |
9/30/2011 | | | 23.76 | | | | (0.23 | )(g) | | | 0.87 | | | | 0.64 | | | | — | | | | — | | | | — | |
9/30/2010 | | | 18.29 | | | | (0.09 | )(i) | | | 5.56 | | | | 5.47 | | | | — | | | | — | | | | — | |
9/30/2009 | | | 21.12 | | | | (0.07 | )(j) | | | (2.76 | ) | | | (2.83 | ) | | | — | | | | — | | | | — | |
Class C | | | | | | | | | | | | | | | | | | | | | | | | | | | | |
9/30/2013 | | | 28.08 | | | | (0.31 | )(f) | | | 7.46 | | | | 7.15 | | | | — | | | | — | | | | — | |
9/30/2012 | | | 23.93 | | | | (0.39 | ) | | | 4.54 | | | | 4.15 | | | | — | | | | — | | | | — | |
9/30/2011 | | | 23.47 | | | | (0.45 | )(g) | | | 0.91 | | | | 0.46 | | | | — | | | | — | | | | — | |
9/30/2010 | | | 18.20 | | | | (0.18 | )(i) | | | 5.45 | | | | 5.27 | | | | — | | | | — | | | | — | |
9/30/2009** | | | 15.13 | | | | (0.16 | ) | | | 3.23 | | | | 3.07 | | | | — | | | | — | | | | — | |
Class N | | | | | | | | | | | | | | | | | | | | | | | | | | | | |
9/30/2013*** | | | 31.49 | | | | (0.07 | )(f) | | | 6.53 | | | | 6.46 | | | | — | | | | — | | | | — | |
Class Y* | | | | | | | | | | | | | | | | | | | | | | | | | | | | |
9/30/2013 | | | 29.94 | | | | (0.01 | )(f) | | | 8.01 | | | | 8.00 | | | | — | | | | — | | | | — | |
9/30/2012 | | | 25.27 | | | | (0.14 | ) | | | 4.81 | | | | 4.67 | | | | — | | | | — | | | | — | |
9/30/2011 | | | 24.53 | | | | (0.17 | )(g) | | | 0.91 | | | | 0.74 | | | | — | | | | — | | | | — | |
9/30/2010 | | | 18.84 | | | | (0.07 | )(i) | | | 5.76 | | | | 5.69 | | | | — | | | | — | | | | — | |
9/30/2009 | | | 21.70 | | | | (0.05 | )(j) | | | (2.81 | ) | | | (2.86 | ) | | | — | | | | — | | | | — | |
| * | Prior to the close of business on February 2, 2009, the Fund offered Retail and Institutional Class shares, which were redesignated as Class A and Class Y shares, respectively, on that date. |
| ** | From commencement of Class operations on February 2, 2009 through September 30, 2009. |
| *** | From commencement of Class operations on February 1, 2013 through September 30, 2013. |
| (a) | Per share net investment income (loss) has been calculated using the average shares outstanding during the period. |
| (b) | Had certain expenses not been waived/reimbursed during the period, if applicable, total returns would have been lower. |
| (c) | A sales charge for Class A shares and a contingent deferred sales charge for Class C shares are not reflected in total return calculations. Periods less than one year, if applicable, are not annualized. |
| (d) | The investment adviser and/or administrator agreed to waive its fees and/or reimburse a portion of the Fund’s expenses during the period, if applicable. Without this waiver/reimbursement, expenses would have been higher. |
| (e) | Computed on an annualized basis for periods less than one year, if applicable. |
| (f) | Includes non-recurring dividends. Without these dividends, net investment income (loss) per share would have been $(0.26), $(0.50), $(0.14) and $(0.20) for Class A, Class C, Class N and Class Y shares, respectively, total return would have been 25.76%, 24.82%, 20.29% and 26.09% for Class A, Class C, Class N and Class Y shares, respectively and the ratio of net investment income (loss) to average net assets would have been (0.85)%, (1.64)%, (0.65)% and (0.62)% for Class A, Class C, Class N and Class Y shares, respectively. |
See accompanying notes to financial statements.
65 |
| | | | | | | | | | | | | | | | | | | | | | | | | | |
| | | | |
| | | | | | | | | | Ratios to Average Net Assets: | | | | |
| | | | | | |
Net asset
value,
end of
the period | | | Total
return
(%) (b)(c) | | | Net assets,
end of
the period
(000’s) | | | Net
expenses
(%) (d)(e) | | | Gross
expenses
(%) (e) | | | Net investment
income (loss)
(%) (e) | | | Portfolio
turnover
rate (%) | |
| | | | | | | | | | | | | | | | | | | | | | | | | | |
| | | | | | | | | | | | | | | | | | | | | | | | | | |
| $ | 36.45 | | | | 26.39 | (f) | | $ | 36,125 | | | | 1.25 | | | | 1.44 | | | | (0.23 | )(f) | | | 159 | |
| | 28.84 | | | | 18.25 | | | | 43,223 | | | | 1.25 | | | | 1.38 | | | | (0.72 | ) | | | 191 | |
| | 24.40 | | | | 2.65 | (g) | | | 49,177 | | | | 1.25 | (h) | | | 1.32 | | | | (0.81 | )(g) | | | 204 | |
| | 23.76 | | | | 29.91 | | | | 67,639 | | | | 1.25 | | | | 1.46 | | | | (0.45 | )(i) | | | 191 | |
| | 18.29 | | | | (13.44 | ) | | | 54,951 | | | | 1.25 | | | | 1.52 | | | | (0.45 | )(j) | | | 292 | |
| | | | | | | | | | | | | | | | | | | | | | | | | | |
| | 35.23 | | | | 25.46 | (f) | | | 2,536 | | | | 2.00 | | | | 2.20 | | | | (1.01 | )(f) | | | 159 | |
| | 28.08 | | | | 17.34 | | | | 2,491 | | | | 2.00 | | | | 2.13 | | | | (1.47 | ) | | | 191 | |
| | 23.93 | | | | 1.96 | (g) | | | 2,182 | | | | 2.01 | (h) | | | 2.08 | | | | (1.63 | )(g) | | | 204 | |
| | 23.47 | | | | 28.96 | | | | 34 | | | | 2.00 | | | | 2.24 | | | | (0.89 | )(i) | | | 191 | |
| | 18.20 | | | | 20.29 | | | | 1 | | | | 2.00 | | | | 2.24 | | | | (1.54 | ) | | | 292 | |
| | | | | | | | | | | | | | | | | | | | | | | | | | |
| | 37.95 | | | | 20.51 | (f) | | | 1 | | | | 0.95 | | | | 3.50 | | | | (0.31 | )(f) | | | 159 | |
| | | | | | | | | | | | | | | | | | | | | | | | | | |
| | 37.94 | | | | 26.72 | (f) | | | 67,491 | | | | 1.00 | | | | 1.20 | | | | (0.04 | )(f) | | | 159 | |
| | 29.94 | | | | 18.53 | | | | 57,103 | | | | 1.00 | | | | 1.13 | | | | (0.49 | ) | | | 191 | |
| | 25.27 | | | | 2.98 | (g) | | | 50,406 | | | | 1.00 | (h) | | | 1.07 | | | | (0.58 | )(g) | | | 204 | |
| | 24.53 | | | | 30.20 | | | | 33,757 | | | | 1.00 | | | | 1.22 | | | | (0.34 | )(i) | | | 191 | |
| | 18.84 | | | | (13.18 | ) | | | 27,057 | | | | 1.00 | | | | 1.12 | | | | (0.27 | )(j) | | | 292 | |
| (g) | Includes a non-recurring dividend. Without this dividend, net investment loss per share would have been $(0.27), $(0.47) and $(0.20) for Class A, Class C and Class Y shares, respectively, total return would have been 2.53%, 1.79% and 2.81% for Class A, Class C and Class Y shares, respectively, and the ratio of net investment loss to average net assets would have been (0.96)%, (1.68)% and (0.70)% for Class A, Class C and Class Y shares, respectively. |
| (h) | Includes interest expense from bank overdraft charges of 0.01% for Class C and less than 0.01% for Classes A and Y. Without this expense, the ratio of net expenses for Class C would have been 2.00%. |
| (i) | Includes a non-recurring dividend. Without this dividend, net investment loss per share would have been $(0.21), $(0.36) and $(0.16) for Class A, Class C and Class Y shares, respectively, and the ratio of net investment loss to average net assets would have been (1.02)%, (1.74)% and (0.76)% for Class A, Class C and Class Y shares, respectively. |
| (j) | Includes a non-recurring dividend of $0.03 per share. Without this dividend, net investment loss per share would have been $(0.10) and $(0.08) for Class A and Class Y shares, respectively, and the ratio of net investment loss to average net assets would have been (0.63)% and (0.46)% for Class A and Class Y shares, respectively. |
See accompanying notes to financial statements.
| 66
Financial Highlights (continued)
For a share outstanding throughout each period.
| | | | | | | | | | | | | | | | | | | | | | | | | | | | |
| | | | | | Income (Loss) From Investment
Operations: | | | Less Distributions: | |
| | | Net asset
value,
beginning
of the
period | | | Net
investment
income
(loss) (a) | | | Net realized
and
unrealized
gain (loss) | | | Total from
investment
operations | | | Dividends
from net
investment
income | | | Distributions
from net
realized
capital
gains | | | Total
distributions | |
VALUE FUND | | | | | | | | | | | | | | | | | | | | | | | | | | | | |
Class A | | | | | | | | | | | | | | | | | | | | | | | | | | | | |
9/30/2013 | | $ | 20.86 | | | $ | 0.31 | | | $ | 4.70 | | | $ | 5.01 | | | $ | (0.28 | ) | | $ | — | | | $ | (0.28 | ) |
9/30/2012 | | | 16.04 | | | | 0.27 | | | | 4.78 | | | | 5.05 | | | | (0.23 | ) | | | — | | | | (0.23 | ) |
9/30/2011 | | | 16.78 | | | | 0.20 | | | | (0.72 | ) | | | (0.52 | ) | | | (0.22 | ) | | | — | | | | (0.22 | ) |
9/30/2010 | | | 16.42 | | | | 0.27 | (f) | | | 0.23 | | | | 0.50 | | | | (0.14 | ) | | | — | | | | (0.14 | ) |
9/30/2009 | | | 17.93 | | | | 0.23 | | | | (1.53 | ) | | | (1.30 | ) | | | (0.21 | ) | | | — | | | | (0.21 | ) |
Class B | | | | | | | | | | | | | | | | | | | | | | | | | | | | |
9/30/2013 | | | 20.95 | | | | 0.14 | | | | 4.75 | | | | 4.89 | | | | (0.07 | ) | | | — | | | | (0.07 | ) |
9/30/2012 | | | 16.05 | | | | 0.13 | | | | 4.81 | | | | 4.94 | | | | (0.04 | ) | | | — | | | | (0.04 | ) |
9/30/2011 | | | 16.77 | | | | 0.06 | | | | (0.73 | ) | | | (0.67 | ) | | | (0.05 | ) | | | — | | | | (0.05 | ) |
9/30/2010 | | | 16.40 | | | | 0.12 | (f) | | | 0.25 | | | | 0.37 | | | | — | | | | — | | | | — | |
9/30/2009 | | | 17.80 | | | | 0.14 | | | | (1.51 | ) | | | (1.37 | ) | | | (0.03 | ) | | | — | | | | (0.03 | ) |
Class C | | | | | | | | | | | | | | | | | | | | | | | | | | | | |
9/30/2013 | | | 20.65 | | | | 0.13 | | | | 4.68 | | | | 4.81 | | | | (0.13 | ) | | | — | | | | (0.13 | ) |
9/30/2012 | | | 15.85 | | | | 0.13 | | | | 4.74 | | | | 4.87 | | | | (0.07 | ) | | | — | | | | (0.07 | ) |
9/30/2011 | | | 16.58 | | | | 0.06 | | | | (0.71 | ) | | | (0.65 | ) | | | (0.08 | ) | | | — | | | | (0.08 | ) |
9/30/2010 | | | 16.26 | | | | 0.14 | (f) | | | 0.22 | | | | 0.36 | | | | (0.04 | ) | | | — | | | | (0.04 | ) |
9/30/2009 | | | 17.79 | | | | 0.12 | | | | (1.51 | ) | | | (1.39 | ) | | | (0.14 | ) | | | — | | | | (0.14 | ) |
Class N | | | | | | | | | | | | | | | | | | | | | | | | | | | | |
9/30/2013* | | | 22.59 | | | | 0.25 | | | | 2.81 | | | | 3.06 | | | | — | | | | — | | | | — | |
Class Y | | | | | | | | | | | | | | | | | | | | | | | | | | | | |
9/30/2013 | | | 20.91 | | | | 0.36 | | | | 4.72 | | | | 5.08 | | | | (0.34 | ) | | | — | | | | (0.34 | ) |
9/30/2012 | | | 16.08 | | | | 0.32 | | | | 4.78 | | | | 5.10 | | | | (0.27 | ) | | | — | | | | (0.27 | ) |
9/30/2011 | | | 16.82 | | | | 0.25 | | | | (0.73 | ) | | | (0.48 | ) | | | (0.26 | ) | | | — | | | | (0.26 | ) |
9/30/2010 | | | 16.47 | | | | 0.31 | (f) | | | 0.23 | | | | 0.54 | | | | (0.19 | ) | | | — | | | | (0.19 | ) |
9/30/2009 | | | 18.01 | | | | 0.28 | | | | (1.54 | ) | | | (1.26 | ) | | | (0.28 | ) | | | — | | | | (0.28 | ) |
Admin Class | | | | | | | | | | | | | | | | | | | | | | | | | | | | |
9/30/2013 | | | 20.79 | | | | 0.24 | | | | 4.71 | | | | 4.95 | | | | (0.23 | ) | | | — | | | | (0.23 | ) |
9/30/2012 | | | 16.00 | | | | 0.22 | | | | 4.77 | | | | 4.99 | | | | (0.20 | ) | | | — | | | | (0.20 | ) |
9/30/2011 | | | 16.74 | | | | 0.17 | | | | (0.73 | ) | | | (0.56 | ) | | | (0.18 | ) | | | — | | | | (0.18 | ) |
9/30/2010** | | | 16.72 | | | | 0.18 | (f) | | | (0.16 | ) | | | 0.02 | | | | — | | | | — | | | | — | |
| * | From commencement of Class operations on February 1, 2013 through September 30, 2013. |
| ** | From commencement of Class operations on February 1, 2010 through September 30, 2010. |
| (a) | Per share net investment income (loss) has been calculated using the average shares outstanding during the period. |
| (b) | Had certain expenses not been waived/reimbursed during the period, if applicable, total returns would have been lower. |
| (c) | A sales charge for Class A shares and a contingent deferred sales charge for Class B and Class C shares are not reflected in total return calculations. Periods less than one year, if applicable, are not annualized. |
See accompanying notes to financial statements.
67 |
| | | | | | | | | | | | | | | | | | | | | | | | |
| | | | |
| | | | | | | | | Ratios to Average Net Assets: | | | | |
Net asset
value,
end of
the period | | Total
return
(%) (b)(c) | | | Net assets,
end of
the period
(000’s) | | | Net
expenses
(%) (d)(e) | | | Gross
expenses
(%) (e) | | | Net investment
income
(%) (e) | | | Portfolio
turnover
rate (%) | |
| | | | | | | | | | | | | | | | | | | | | | | | |
| | | | | | | | | | | | | | | | | | | | | | | | |
| $25.59 | | | 24.35 | | | $ | 171,327 | | | | 0.97 | | | | 0.97 | | | | 1.31 | | | | 24 | |
| 20.86 | | | 31.71 | | | | 129,572 | | | | 0.98 | | | | 0.98 | | | | 1.45 | | | | 25 | |
| 16.04 | | | (3.28 | ) | | | 126,789 | | | | 0.98 | | | | 0.98 | | | | 1.09 | | | | 29 | |
| 16.78 | | | 3.03 | | | | 130,922 | | | | 0.96 | | | | 0.96 | | | | 1.58 | (f) | | | 54 | |
| 16.42 | | | (6.97 | ) | | | 120,915 | | | | 1.06 | | | | 1.06 | | | | 1.67 | | | | 47 | |
| | | | | | | | | | | | | | | | | | | | | | | | |
| 25.77 | | | 23.42 | | | | 1,143 | | | | 1.72 | | | | 1.72 | | | | 0.59 | | | | 24 | |
| 20.95 | | | 30.79 | | | | 1,534 | | | | 1.73 | | | | 1.73 | | | | 0.71 | | | | 25 | |
| 16.05 | | | (4.05 | ) | | | 2,037 | | | | 1.73 | | | | 1.73 | | | | 0.32 | | | | 29 | |
| 16.77 | | | 2.26 | | | | 3,299 | | | | 1.70 | | | | 1.70 | | | | 0.72 | (f) | | | 54 | |
| 16.40 | | | (7.62 | ) | | | 5,167 | | | | 1.81 | | | | 1.81 | | | | 1.03 | | | | 47 | |
| | | | | | | | | | | | | | | | | | | | | | | | |
| 25.33 | | | 23.41 | | | | 15,158 | | | | 1.72 | | | | 1.72 | | | | 0.55 | | | | 24 | |
| 20.65 | | | 30.78 | | | | 9,104 | | | | 1.73 | | | | 1.73 | | | | 0.70 | | | | 25 | |
| 15.85 | | | (4.00 | ) | | | 8,996 | | | | 1.73 | | | | 1.73 | | | | 0.33 | | | | 29 | |
| 16.58 | | | 2.20 | | | | 10,226 | | | | 1.71 | | | | 1.71 | | | | 0.81 | (f) | | | 54 | |
| 16.26 | | | (7.60 | ) | | | 10,011 | | | | 1.81 | | | | 1.81 | | | | 0.89 | | | | 47 | |
| | | | | | | | | | | | | | | | | | | | | | | | |
| 25.65 | | | 13.55 | | | | 260,643 | | | | 0.57 | | | | 0.57 | | | | 1.50 | | | | 24 | |
| | | | | | | | | | | | | | | | | | | | | | | | |
| 25.65 | | | 24.65 | | | | 1,513,807 | | | | 0.72 | | | | 0.72 | | | | 1.56 | | | | 24 | |
| 20.91 | | | 32.05 | | | | 1,240,093 | | | | 0.73 | | | | 0.73 | | | | 1.68 | | | | 25 | |
| 16.08 | | | (3.05 | ) | | | 957,584 | | | | 0.74 | | | | 0.74 | | | | 1.34 | | | | 29 | |
| 16.82 | | | 3.28 | | | | 788,937 | | | | 0.71 | | | | 0.71 | | | | 1.86 | (f) | | | 54 | |
| 16.47 | | | (6.66 | ) | | | 574,439 | | | | 0.66 | | | | 0.66 | | | | 1.97 | | | | 47 | |
| | | | | | | | | | | | | | | | | | | | | | | | |
| 25.51 | | | 24.08 | | | | 12 | | | | 1.19 | | | | 1.19 | | | | 1.01 | | | | 24 | |
| 20.79 | | | 31.43 | | | | 2 | | | | 1.24 | | | | 1.24 | | | | 1.17 | | | | 25 | |
| 16.00 | | | (3.48 | ) | | | 1 | | | | 1.17 | | | | 1.17 | | | | 0.90 | | | | 29 | |
| 16.74 | | | 0.12 | | | | 1 | | | | 1.29 | | | | 1.29 | | | | 1.59 | (f) | | | 54 | |
| (d) | The investment adviser and/or administrator agreed to waive its fees and/or reimburse a portion of the Fund’s expenses during the period, if applicable. Without this waiver/reimbursement, expenses would have been higher. |
| (e) | Computed on an annualized basis for periods less than one year, if applicable. |
| (f) | Includes a non-recurring dividend. Without this dividend, net investment income per share would have been $0.14, $0.02, $0.01, $0.18 and $0.05 for Class A, Class B, Class C, Class Y and Admin Class shares, respectively, and the ratio of net investment income to average net assets would have been 0.84%, 0.10%, 0.09%, 1.08% and 0.50% for Class A, Class B, Class C, Class Y and Admin Class shares, respectively. |
See accompanying notes to financial statements.
| 68
Notes to Financial Statements
September 30, 2013
1. Organization. Loomis Sayles Funds II (the “Trust”) is organized as a Massachusetts business trust. The Trust is registered under the Investment Company Act of 1940, as amended (the “1940 Act”), as an open-end management investment company. The Declaration of Trust permits the Board of Trustees to authorize the issuance of an unlimited number of shares of the Trust in multiple series. The financial statements for certain funds of the Trust are presented in separate reports. The following funds (individually, a “Fund” and collectively, the “Funds”) are included in this report:
Loomis Sayles Global Equity and Income Fund (the “Global Equity and Income Fund”)
Loomis Sayles Growth Fund (the “Growth Fund”)
Loomis Sayles Mid Cap Growth Fund (the “Mid Cap Growth Fund”)
Loomis Sayles Value Fund (the “Value Fund”)
Each Fund is a diversified investment company.
Each Fund offers Class A, Class C and Class Y shares. Effective February 1, 2013, Growth Fund, Mid Cap Growth Fund and Value Fund began offering Class N shares. In addition, Value Fund offers Admin Class shares. Effective October 12, 2007, Class B shares are no longer offered. Existing Class B shareholders of Growth Fund and Value Fund may continue to reinvest dividends into Class B shares and exchange their Class B shares for Class B shares of other Natixis Funds subject to existing exchange privileges as described in the prospectus.
Class A shares are sold with a maximum front-end sales charge of 5.75%. Class B shares do not pay a front-end sales charge; however, they are charged higher Rule 12b-1 fees, and are subject to a contingent deferred sales charge (“CDSC”) if such shares are redeemed within six years of purchase. After eight years of ownership, Class B shares convert to Class A shares. Class C shares do not pay a front-end sales charge, do not convert to any other class of shares, pay higher Rule 12b-1 fees than Class A shares and may be subject to a CDSC of 1.00% if those shares are redeemed within one year of acquisition, except for reinvested distributions. Class N and Class Y shares do not pay a front-end sales charge, a CDSC or Rule 12b-1 fees. Class N shares are primarily intended for employer-sponsored retirement plans. Class Y shares are intended for institutional investors with a minimum initial investment of $100,000, though some categories of investors are exempted from the minimum investment amount as outlined in the Funds’ prospectus. Admin Class shares do not pay a front-end sales charge or a CDSC, but do pay a Rule 12b-1 fee. Class N and Admin Class shares are offered exclusively through intermediaries.
Most expenses of the Trust can be directly attributed to a fund. Expenses which cannot be directly attributed to a fund are generally apportioned based on the relative net assets of each of the funds in the Trust. Expenses of a Fund are borne pro rata by the holders of each class of shares, except that each class bears expenses unique to that
69 |
Notes to Financial Statements (continued)
September 30, 2013
class (including the Rule 12b-1 service and distribution fees and transfer agent fees for Class N). In addition, each class votes as a class only with respect to its own Rule 12b-1 Plan. Shares of each class would receive their pro rata share of the net assets of a Fund if the Fund were liquidated. The Trustees approve separate distributions from net investment income on each class of shares.
2. Significant Accounting Policies. The following is a summary of significant accounting policies consistently followed by each Fund in the preparation of its financial statements. The Funds’ financial statements are prepared in accordance with accounting principles generally accepted in the United States of America which require the use of management estimates that affect the reported amounts and disclosures in the financial statements. Actual results could differ from those estimates. Management has evaluated the events and transactions subsequent to year-end through the date the financial statements were issued and has determined that there were no material events that would require disclosure in the Funds’ financial statements.
a. Valuation. Equity securities, including shares of closed-end investment companies and exchange-traded funds, for which market quotations are readily available are valued at market value, as reported by independent pricing services recommended by the investment adviser and approved by the Board of Trustees. Such independent pricing services generally use the security’s last sale price on the exchange or market where the security is primarily traded or, if there is no reported sale during the day, the closing bid price. Securities traded on the NASDAQ Global Select Market, NASDAQ Global Market and NASDAQ Capital Market are valued at the NASDAQ Official Closing Price (“NOCP”), or if lacking a NOCP, at the most recent bid quotation on the applicable NASDAQ Market. Debt securities (other than short-term obligations purchased with an original or remaining maturity of sixty days or less) and unlisted equity securities are generally valued on the basis of evaluated bids furnished to the Fund by an independent pricing service, recommended by the investment adviser and approved by the Board of Trustees, which determines valuations for normal, institutional-size trading units of such securities using market information, transactions for comparable securities and various relationships between securities which are generally recognized by institutional traders. Senior loans are priced at bid prices supplied by an independent pricing service, if available. Broker-dealer bid prices may also be used to value debt and equity securities and senior loans where an independent pricing service is unable to price a security or where an independent pricing service does not provide a reliable price for the security. Forward foreign currency contracts are valued utilizing interpolated prices determined from information provided by an independent pricing service. Domestic exchange-traded single equity option contracts are valued at the mean of the National Best Bid and Offer quotations. Investments in other open-end investment companies are valued at their net asset value each day. Short-term obligations purchased with an original or remaining maturity of sixty days or less are valued at amortized cost, which approximates market value. Securities for which market quotations are not readily
| 70
Notes to Financial Statements (continued)
September 30, 2013
available are valued at fair value as determined in good faith by the Funds’ investment adviser under the general supervision of the Board of Trustees.
The Funds may hold securities traded in foreign markets. Foreign securities are valued at the closing market price in the foreign market. However, if events occurring after the close of the foreign market (but before the close of regular trading on the New York Stock Exchange) are believed to materially affect the value of those securities, such securities are fair valued pursuant to procedures approved by the Board of Trustees. When fair valuing securities, the Funds may, among other things, use modeling tools or other processes that may take into account factors such as securities market activity and/or significant events that occur after the close of the foreign market and before the Funds calculate their net asset values. As of September 30, 2013, approximately 25% of the market value of Global Equity and Income Fund’s investments was fair valued pursuant to procedures approved by the Board of Trustees as events occurring after the close of the foreign market were believed to materially affect the value of those securities. Additionally, multiple securities held by the Fund for which market quotations were not readily available as of September 30, 2013, were fair valued pursuant to procedures approved by the Board of Trustees, amounting to 0.8% of net assets.
b. Investment Transactions and Related Investment Income. Investment transactions are accounted for on a trade date plus one day basis for daily net asset value calculation. However, for financial reporting purposes, investment transactions are reported on trade date. Dividend income is recorded on ex-dividend date, or in the case of certain foreign securities, as soon as a Fund is notified, and interest income is recorded on an accrual basis. Interest income is increased by the accretion of discount and decreased by the amortization of premium. Periodic principal adjustments for inflation-protected securities are recorded to interest income. In determining net gain or loss on securities sold, the cost of securities has been determined on an identified cost basis. Investment income, non-class specific expenses and realized and unrealized gains and losses are allocated on a pro rata basis to each class based on the relative net assets of each class to the total net assets of the Fund.
c. Foreign Currency Translation. The books and records of the Funds are maintained in U.S. dollars. The values of securities, currencies and other assets and liabilities denominated in currencies other than U.S. dollars are translated into U.S. dollars based upon foreign exchange rates prevailing at the end of the period. Purchases and sales of investment securities, income and expenses are translated on the respective dates of such transactions.
Since the values of investment securities are presented at the foreign exchange rates prevailing at the end of the period, it is not practical to isolate that portion of the results of operations arising from changes in exchange rates from fluctuations which arise due to changes in market prices of investment securities. Such changes are included with the net realized and unrealized gain or loss on investments.
71 |
Notes to Financial Statements (continued)
September 30, 2013
Net realized foreign exchange gains or losses arise from sales of foreign currency, currency gains or losses realized between the trade and settlement dates on securities transactions and the difference between the amounts of dividends, interest and foreign withholding taxes recorded on the Funds’ books and the U.S. dollar equivalent of the amounts actually received or paid. Net unrealized foreign exchange gains and losses arise from changes in the value of assets and liabilities, other than investment securities, at the end of the fiscal period, resulting from changes in exchange rates.
Each Fund may use foreign currency exchange contracts to facilitate transactions in foreign-denominated investments. Losses may arise from changes in the value of the foreign currency or if the counterparties do not perform under the contracts’ terms.
d. Forward Foreign Currency Contracts. The Funds may enter into forward foreign currency contracts, including forward foreign cross currency contracts, to acquire exposure to foreign currencies or to hedge the Funds’ investments against currency fluctuation. A contract can also be used to offset a previous contract. These contracts involve market risk in excess of the unrealized gain or loss reflected in the Funds’ Statements of Assets and Liabilities. The U.S. dollar value of the currencies a Fund has committed to buy or sell represents the aggregate exposure to each currency the Fund has acquired or hedged through currency contracts outstanding at period end. Gains or losses are recorded for financial statement purposes as unrealized until settlement date. Contracts are traded over-the-counter directly with a counterparty. Risks may arise upon entering into these contracts from the potential inability of counterparties to meet the terms of their contracts and from unanticipated movements in the value of a foreign currency relative to the U.S. dollar. Certain contracts may require the movement of cash and/or securities as collateral for the Funds’ or counterparty’s net obligations under the contracts.
e. Option Contracts. The Funds may enter into option contracts. When a Fund purchases an option, it pays a premium and the option is subsequently marked to market to reflect current value. Premiums paid for purchasing options which expire are treated as realized losses. Premiums paid for purchasing options which are exercised are added to the cost or deducted from the proceeds on the underlying instrument to determine the realized gain or loss. If the Fund enters into a closing sale transaction, the difference between the premium paid and the proceeds of the closing sale transaction is treated as a realized gain or loss. The risk associated with purchasing options is limited to the premium paid.
When a Fund writes an option, an amount equal to the net premium received (the premium less commission) is recorded as a liability and is subsequently adjusted to the current value. Net premiums received for written options which expire are treated as realized gains. Net premiums received for written options which are exercised are deducted from the cost or added to the proceeds on the underlying instrument to determine the realized gain or loss. If the Fund enters into a closing purchase
| 72
Notes to Financial Statements (continued)
September 30, 2013
transaction, the difference between the net premium received and any amount paid on effecting a closing purchase transaction, including commissions, is treated as a realized gain or, if the net premium received is less than the amount paid, as a realized loss. The Fund, as writer of a written option, bears the risk of an unfavorable change in the market value of the instrument underlying the written option.
Exchange-traded options contracts are standardized and are settled through a clearing house with fulfillment supported by the credit of the exchange. Therefore, counterparty credit risks to the Funds are reduced. Over-the-counter options are subject to the risk that the counterparty is unable or unwilling to meet its obligations under the option. For the year ended September 30, 2013, the Funds were not party to any over-the-counter options.
f. Federal and Foreign Income Taxes. The Trust treats each fund as a separate entity for federal income tax purposes. Each Fund intends to meet the requirements of the Internal Revenue Code of 1986, as amended, applicable to regulated investment companies, and to distribute to its shareholders substantially all of its net investment income and any net realized capital gains at least annually. Management has performed an analysis of each Fund’s tax positions for the open tax years as of September 30, 2013 and has concluded that no provisions for income tax are required. The Funds’ federal tax returns for the prior three fiscal years remain subject to examination by the Internal Revenue Service. Management is not aware of any events that are reasonably possible to occur in the next twelve months that would result in the amounts of any unrecognized tax benefits significantly increasing or decreasing for the Funds. However, management’s conclusions regarding tax positions taken may be subject to review and adjustment at a later date based on factors including, but not limited to, new tax laws and accounting regulations and interpretations thereof.
A Fund may be subject to foreign withholding taxes on investment income and taxes on capital gains on investments that are accrued and paid based upon the Fund’s understanding of the tax rules and regulations that exist in the countries in which the Fund invests. Foreign withholding taxes on dividend and interest income are reflected on the Statements of Operations as a reduction of investment income, net of amounts eligible to be reclaimed. Dividends and interest receivable on the Statements of Assets and Liabilities are net of foreign withholding taxes. Foreign withholding taxes eligible to be reclaimed are reflected on the Statements of Assets and Liabilities as tax reclaims receivable. Capital gains taxes paid are included in net realized gain (loss) on investments in the Statements of Operations. Accrued but unpaid capital gains taxes are reflected as foreign taxes payable on the Statements of Assets and Liabilities, if applicable, and reduce unrealized gains on investments. In the event that realized gains on investments are subsequently offset by realized losses, taxes paid on realized gains may be returned to a Fund. Such amounts, if applicable, are reflected as foreign tax rebates receivable on the Statements of Assets and Liabilities and are recorded as a realized gain when received.
73 |
Notes to Financial Statements (continued)
September 30, 2013
g. Dividends and Distributions to Shareholders. Dividends and distributions are recorded on ex-dividend date. The timing and characterization of certain income and capital gain distributions are determined annually in accordance with federal tax regulations, which may differ from accounting principles generally accepted in the United States of America. Permanent differences are primarily due to differing treatments for book and tax purposes of items such as net operating losses, foreign currency transactions, paydown gains and losses, contingent payment debt instruments, return of capital and capital gain distributions received, defaulted bonds and premium amortization. Permanent book and tax basis differences relating to shareholder distributions will result in reclassifications to capital accounts. Temporary differences between book and tax distributable earnings are primarily due to deferred Trustees’ fees, forward foreign currency contract mark to market, wash sales, premium amortization, contingent payment debt instruments, trust preferred securities and return of capital distributions received. Distributions from net investment income and short-term capital gains are considered to be distributed from ordinary income for tax purposes.
The tax characterization of distributions is determined on an annual basis. The tax character of distributions paid to shareholders during the years ended September 30, 2013 and 2012 was as follows:
| | | | | | | | | | | | | | | | | | | | | | | | |
| | | 2013 Distributions Paid From: | | | 2012 Distributions Paid From: | |
Fund | | Ordinary Income | | | Long-Term Capital Gains | | | Total | | | Ordinary Income | | | Long-Term Capital Gains | | | Total | |
Global Equity and Income Fund | | $ | 15,440,401 | | | $ | — | | | $ | 15,440,401 | | | $ | 7,423,009 | | | $ | — | | | $ | 7,423,009 | |
Growth Fund | | | 1,402,386 | | | | — | | | | 1,402,386 | | | | 331,005 | | | | — | | | | 331,005 | |
Value Fund | | | 22,218,575 | | | | — | | | | 22,218,575 | | | | 17,981,701 | | | | — | | | | 17,981,701 | |
| 74
Notes to Financial Statements (continued)
September 30, 2013
As of September 30, 2013, the components of distributable earnings on a tax basis were as follows:
| | | | | | | | | | | | | | | | |
| | | Global Equity and Income Fund | | | Growth
Fund | | | Mid Cap
Growth Fund | | | Value
Fund | |
Undistributed ordinary income | | $ | 16,675,677 | | | $ | 1,072,680 | | | $ | — | | | $ | 17,109,134 | |
Undistributed long-term capital gains | | | 4,793,810 | | | | — | | | | — | | | | 91,317,669 | |
| | | | | | | | | | | | | | | | |
Total undistributed earnings | | | 21,469,487 | | | | 1,072,680 | | | | — | | | | 108,426,803 | |
| | | | | | | | | | | | | | | | |
Capital loss carryforward: | | | | | | | | | | | | | | | | |
Expires | | | | | | | | | | | | | | | | |
September 30, 2017 | | | — | | | | (49,121,891 | ) | | | (10,671,408 | ) | | | — | |
September 30, 2018 | | | — | | | | (34,679,944 | ) | | | (18,569,793 | ) | | | — | |
| | | | | | | | | | | | | | | | |
Total capital loss carryforward | | | — | | | | (83,801,835 | ) | | | (29,241,201 | ) | | | — | |
Late-year ordinary and post-October capital loss deferrals* | | | — | | | | — | | | | (405,415 | ) | | | — | |
Unrealized appreciation | | | 115,385,555 | | | | 75,681,505 | | | | 25,522,491 | | | | 449,011,386 | |
| | | | | | | | | | | | | | | | |
Total accumulated earnings (losses) | | $ | 136,855,042 | | | $ | (7,047,650 | ) | | $ | (4,124,125 | ) | | $ | 557,438,189 | |
| | | | | | | | | | | | | | | | |
Capital loss carryforward utilized in the current year | | $ | 25,714,481 | | | $ | 3,658,274 | | | $ | 9,930,674 | | | $ | 6,350,604 | |
| | | | | | | | | | | | | | | | |
| * | Under current tax law, capital losses, foreign currency losses, and losses on passive foreign investment companies and contingent payment debt instruments after October 31 or December 31, as applicable, may be deferred and treated as occurring on the first day of the following taxable year. |
h. Repurchase Agreements. It is each Fund’s policy that the market value of the collateral for repurchase agreements be at least equal to 102% of the repurchase price, including interest. Certain repurchase agreements are tri-party arrangements whereby the collateral is held in a segregated account for the benefit of the Fund and on behalf of the counterparty. Repurchase agreements could involve certain risks in the event of default or insolvency of the counterparty, including possible delays or restrictions upon a Fund’s ability to dispose of the underlying securities.
i. Securities Lending. The Funds have entered into an agreement with State Street Bank and Trust Company (“State Street Bank”), as agent of the Funds, to lend securities to certain designated borrowers. The loans are collateralized with cash or securities in an amount equal to at least 105% or 102% of the market value (including accrued
75 |
Notes to Financial Statements (continued)
September 30, 2013
interest) of the loaned international or domestic securities, respectively, when the loan is initiated. Thereafter, the value of the collateral must remain at least 102% of the market value (including accrued interest) of loaned securities for U.S. equities and U.S. corporate debt; at least 105% of the market value (including accrued interest) of loaned securities for non-U.S. equities; and at least 100% of the market value (including accrued interest) of loaned securities for U.S. Government securities, sovereign debt issued by non-U.S. Governments and non-U.S. corporate debt. In the event that the market value of the collateral falls below the required percentages described above, the borrower will deliver additional collateral on the next business day. As with other extensions of credit, the Funds may bear the risk of loss with respect to the investment of the collateral. The Funds invest cash collateral in short-term investments, a portion of the income from which is remitted to the borrowers and the remainder allocated between the Funds and State Street Bank as lending agent.
For the year ended September 30, 2013, none of the Funds had loaned securities under this agreement.
j. Indemnifications. Under the Trust’s organizational documents, its officers and Trustees are indemnified against certain liabilities arising out of the performance of their duties to the Funds. Additionally, in the normal course of business, the Funds enter into contracts with service providers that contain general indemnification clauses. The Funds’ maximum exposure under these arrangements is unknown as this would involve future claims that may be made against the Funds that have not yet occurred. However, based on experience, the Funds expect the risk of loss to be remote.
k. New Accounting Pronouncement. In December 2011, Accounting Standards Update (“ASU”) No. 2011-11, “Disclosures about Offsetting Assets and Liabilities” was issued and is effective for interim and annual periods beginning after January 1, 2013. The ASU creates new disclosure requirements with respect to an entity’s rights of setoff and related arrangements associated with its financial and derivative instruments. Management has evaluated the impact the adoption of ASU 2011-11 and will incorporate the new disclosures required in the March 31, 2014 report.
| 76
Notes to Financial Statements (continued)
September 30, 2013
3. Fair Value Measurements. In accordance with accounting standards related to fair value measurements and disclosures, the Funds have categorized the inputs utilized in determining the value of each Fund’s assets or liabilities. These inputs are summarized in the three broad levels listed below:
| | • | | Level 1 – quoted prices in active markets for identical assets or liabilities; |
| | • | | Level 2 – prices determined using other significant inputs that are observable either directly, or indirectly through corroboration with observable market data (which could include quoted prices for similar assets or liabilities, interest rates, credit risk, etc.); and |
| | • | | Level 3 – prices determined using significant unobservable inputs when quoted prices or observable inputs are unavailable such as when there is little or no market activity for an asset or liability (unobservable inputs reflect each Fund’s own assumptions in determining the fair value of assets or liabilities and would be based on the best information available). |
The inputs or methodology used for valuing securities are not necessarily an indication of the risk associated with investing in those securities.
The following is a summary of the inputs used to value the Funds’ investments as of September 30, 2013, at value:
Global Equity and Income Fund
Asset Valuation Inputs
| | | | | | | | | | | | | | | | |
Description | | Level 1 | | | Level 2 | | | Level 3 | | | Total | |
Common Stocks | | | | | | | | | | | | | | | | |
Belgium | | $ | — | | | $ | 17,568,611 | | | $ | — | | | $ | 17,568,611 | |
Chile | | | — | | | | 7,242,066 | | | | — | | | | 7,242,066 | |
China | | | — | | | | 15,212,973 | | | | — | | | | 15,212,973 | |
Germany | | | — | | | | 45,696,250 | | | | — | | | | 45,696,250 | |
Japan | | | — | | | | 13,971,015 | | | | — | | | | 13,971,015 | |
Russia | | | — | | | | 9,184,231 | | | | — | | | | 9,184,231 | |
Sweden | | | — | | | | 15,439,069 | | | | — | | | | 15,439,069 | |
Switzerland | | | — | | | | 24,423,811 | | | | — | | | | 24,423,811 | |
Thailand | | | — | | | | 11,368,951 | | | | — | | | | 11,368,951 | |
Turkey | | | — | | | | 7,568,843 | | | | — | | | | 7,568,843 | |
United Kingdom | | | — | | | | 129,035,566 | | | | — | | | | 129,035,566 | |
All Other Common Stocks(a) | | | 493,037,193 | | | | — | | | | — | | | | 493,037,193 | |
| | | | | | | | | | | | | | | | |
Total Common Stocks | | | 493,037,193 | | | | 296,711,386 | | | | — | | | | 789,748,579 | |
| | | | | | | | | | | | | | | | |
77 |
Notes to Financial Statements (continued)
September 30, 2013
Global Equity and Income Fund (continued)
Asset Valuation Inputs (continued)
| | | | | | | | | | | | | | | | |
Description | | Level 1 | | | Level 2 | | | Level 3 | | | Total | |
Bonds and Notes | | | | | | | | | | | | | | | | |
Non-Convertible Bonds | | | | | | | | | | | | | | | | |
Brazil | | $ | — | | | $ | 19,727,872 | | | $ | 1,065,325 | | | $ | 20,793,197 | |
Korea | | | — | | | | 4,962,942 | | | | 4,410,510 | | | | 9,373,452 | |
United States | | | 32,939 | | | | 149,356,879 | | | | 3,019,090 | | | | 152,408,908 | |
All Other Non-Convertible Bonds(a) | | | — | | | | 131,624,974 | | | | — | | | | 131,624,974 | |
| | | | | | | | | | | | | | | | |
Total Non-Convertible Bonds | | | 32,939 | | | | 305,672,667 | | | | 8,494,925 | | | | 314,200,531 | |
| | | | | | | | | | | | | | | | |
Convertible Bonds(a) | | | — | | | | 8,234,916 | | | | — | | | | 8,234,916 | |
Municipals(a) | | | — | | | | 457,956 | | | | — | | | | 457,956 | |
| | | | | | | | | | | | | | | | |
Total Bonds and Notes | | | 32,939 | | | | 314,365,539 | | | | 8,494,925 | | | | 322,893,403 | |
| | | | | | | | | | | | | | | | |
Senior Loans(a) | | | — | | | | 5,956,932 | | | | — | | | | 5,956,932 | |
Preferred Stocks(a) | | | 5,237,130 | | | | — | | | | — | | | | 5,237,130 | |
Short-Term Investments | | | — | | | | 34,816,380 | | | | — | | | | 34,816,380 | |
| | | | | | | | | | | | | | | | |
Total Investments | | | 497,476,602 | | | | 652,680,897 | | | | 8,494,925 | | | | 1,158,652,424 | |
| | | | | | | | | | | | | | | | |
Forward Foreign Currency Contracts (unrealized appreciation) | | | | | | | 81,735 | | | | — | | | | 81,735 | |
| | | | | | | | | | | | | | | | |
Total | | $ | 497,476,602 | | | $ | 652,762,632 | | | $ | 8,494,925 | | | $ | 1,158,734,159 | |
| | | | | | | | | | | | | | | | |
| | | | |
| Liability Valuation Inputs | | | | | | | | | | | | | | | | |
Description | | Level 1 | | | Level 2 | | | Level 3 | | | Total | |
Forward Foreign Currency Contracts (unrealized depreciation) | | $ | — | | | $ | (309,227 | ) | | $ | — | | | $ | (309,227 | ) |
| | | | | | | | | | | | | | | | |
| (a) | Details of the major categories of the Fund’s investments are reflected within the Portfolio of Investments. |
A common stock valued at $12,029,094 was transferred from Level 1 to Level 2 during the period ended September 30, 2013. At September 30, 2013, this security was fair valued pursuant to procedures approved by the Board of Trustees as events occurring after the close of the foreign market were believed to materially affect the value of the security.
A preferred stock valued at $637,990 was transferred from Level 2 to Level 1 during the period ended September 30, 2013. At September 30, 2013, this security was valued at the last sale price in accordance with the Fund’s valuation policies.
All transfers are recognized as of the beginning of the reporting period.
| 78
Notes to Financial Statements (continued)
September 30, 2013
Growth Fund
Asset Valuation Inputs
| | | | | | | | | | | | | | | | |
Description | | Level 1 | | | Level 2 | | | Level 3 | | | Total | |
Common Stocks(a) | | $ | 601,497,358 | | | $ | — | | | $ | — | | | $ | 601,497,358 | |
Short-Term Investments | | | — | | | | 14,440,090 | | | | — | | | | 14,440,090 | |
| | | | | | | | | | | | | | | | |
Total | | $ | 601,497,358 | | | $ | 14,440,090 | | | $ | — | | | $ | 615,937,448 | |
| | | | | | | | | | | | | | | | |
| (a) | Details of the major categories of the Fund’s investments are reflected within the Portfolio of Investments. |
For the year ended September 30, 2013, there were no transfers among Levels 1, 2 and 3.
Mid Cap Growth Fund
Asset Valuation Inputs
| | | | | | | | | | | | | | | | |
Description | | Level 1 | | | Level 2 | | | Level 3 | | | Total | |
Common Stocks(a) | | $ | 103,990,131 | | | $ | — | | | $ | — | | | $ | 103,990,131 | |
Purchased Options | | | 183,568 | | | | — | | | | — | | | | 183,568 | |
Short-Term Investments | | | — | | | | 3,238,036 | | | | — | | | | 3,238,036 | |
| | | | | | | | | | | | | | | | |
Total | | $ | 104,173,699 | | | $ | 3,238,036 | | | $ | — | | | $ | 107,411,735 | |
| | | | | | | | | | | | | | | | |
| (a) | Details of the major categories of the Fund’s investments are reflected within the Portfolio of Investments. |
For the year ended September 30, 2013, there were no transfers among Levels 1, 2 and 3.
Value Fund
Asset Valuation Inputs
| | | | | | | | | | | | | | | | |
Description | | Level 1 | | | Level 2 | | | Level 3 | | | Total | |
Common Stocks(a) | | $ | 1,891,384,522 | | | $ | — | | | $ | — | | | $ | 1,891,384,522 | |
Short-Term Investments | | | — | | | | 61,049,074 | | | | — | | | | 61,049,074 | |
| | | | | | | | | | | | | | | | |
Total | | $ | 1,891,384,522 | | | $ | 61,049,074 | | | $ | — | | | $ | 1,952,433,596 | |
| | | | | | | | | | | | | | | | |
| (a) | Details of the major categories of the Fund’s investments are reflected within the Portfolio of Investments. |
For the year ended September 30, 2013, there were no transfers among Levels 1, 2 and 3.
79 |
Notes to Financial Statements (continued)
September 30, 2013
The following is a reconciliation of Level 3 investments for which significant unobservable inputs were used to determine fair values as of September 30, 2012 and/or September 30, 2013:
Global Equity and Income Fund
Asset Valuation Inputs
| | | | | | | | | | | | | | | | | | | | |
Investments in Securities | | Balance as of September 30, 2012 | | | Accrued Discounts (Premiums) | | | Realized Gain (Loss) | | | Change in Unrealized Appreciation (Depreciation) | | | Purchases | |
Bonds and Notes | | | | | | | | | | | | | | | | | | | | |
Non-Convertible Bonds | | | | | | | | | | | | | | | | | | | | |
Brazil | | $ | — | | | $ | — | | | $ | — | | | $ | (2,505 | ) | | $ | 1,067,830 | |
Korea | | | 2,528,229 | | | | 592 | | | | 154,205 | | | | (104,977 | ) | | | 4,372,943 | |
United States | | | 638,272 | | | | 1,587 | | | | 70,035 | | | | (145,298 | ) | | | 1,735,000 | |
| | | | | | | | | | | | | | | | | | | | |
Total | | $ | 3,166,501 | | | $ | 2,179 | | | $ | 224,240 | | | $ | (252,780 | ) | | $ | 7,175,773 | |
| | | | | | | | | | | | | | | | | | | | |
| | | | | |
Investments in Securities | | Sales | | | Transfers into Level 3 | | | Transfers out of Level 3 | | | Balance as of September 30, 2013 | | | Change in Unrealized Appreciation (Depreciation) from Investments Still Held at September 30, 2013 | |
Bonds and Notes | | | | | | | | | | | | | | | | | | | | |
Non-Convertible Bonds | | | | | | | | | | | | | | | | | | | | |
Brazil | | $ | — | | | $ | — | | | $ | — | | | $ | 1,065,325 | | | $ | (2,505 | ) |
Korea | | | (2,540,482 | ) | | | — | | | | — | | | | 4,410,510 | | | | 43,686 | |
United States | | | (1,205,838 | ) | | | 1,925,332 | | | | — | | | | 3,019,090 | | | | (97,575 | ) |
| | | | | | | | | | | | | | | | | | | | |
Total | | $ | (3,746,320 | ) | | $ | 1,925,332 | | | $ | — | | | $ | 8,494,925 | | | $ | (56,394 | ) |
| | | | | | | | | | | | | | | | | | | | |
Debt securities valued at $1,925,332 were transferred from Level 2 to Level 3 during the period ended September 30, 2013. At September 30, 2013, these securities were valued using broker-dealer bid prices based on inputs unobservable to the Fund as an independent pricing service was unable to price the securities.
All transfers are recognized as of the beginning of the reporting period.
| 80
Notes to Financial Statements (continued)
September 30, 2013
4. Derivatives. Derivative instruments are defined as financial instruments whose value and performance are based on the value and performance of another security or financial instrument. Derivative instruments that Global Equity and Income Fund and Mid Cap Growth Fund used during the period include forward foreign currency contracts and option contracts.
Global Equity and Income Fund is subject to the risk that changes in foreign currency exchange rates will have an unfavorable effect on the value of Fund assets denominated in foreign currencies. The Fund may enter into forward foreign currency contracts for hedging purposes to protect the value of the Fund’s holdings of foreign securities. The Fund may also use forward foreign currency contracts to gain exposure to foreign currencies, regardless of whether securities denominated in such currencies are held in the Fund. During the year ended September 30, 2013, Global Equity and Income Fund engaged in forward foreign currency transactions for hedging purposes and to gain exposure to foreign currencies.
Mid Cap Growth Fund is subject to the risk of unpredictable declines in the value of individual equity securities and periods of below-average performance in individual securities or in the equity market as a whole. The Fund may use purchased put options and written call options to hedge against a decline in value of an equity security that it owns, and may use written put options to offset the cost of options used for hedging purposes. The Fund may also use purchased call options to gain exposure to an equity security without committing the capital required to buy it, while also limiting the downside risk associated with owning it. During the year ended September 30, 2013, Mid Cap Growth Fund engaged in purchased put options for hedging purposes, written put options to offset the cost of options used for hedging purposes, and purchased call options to gain exposure.
The following is a summary of derivative instruments for Global Equity and Income Fund as of September 30, 2013, as reflected within the Statement of Assets and Liabilities:
| | | | |
Assets | | Unrealized
appreciation on
forward foreign
currency contracts | |
Over-the-counter asset derivatives | | | | |
Foreign exchange contracts | | $ | 81,735 | |
| |
Liabilities | | Unrealized
depreciation on
forward foreign
currency contracts | |
Over-the-counter liability derivatives | | | | |
Foreign exchange contracts | | $ | (309,227 | ) |
81 |
Notes to Financial Statements (continued)
September 30, 2013
Transactions in derivative instruments for Global Equity and Income Fund during the year ended September 30, 2013, as reflected within the Statement of Operations were as follows:
| | | | |
Net Realized Gain (Loss) on: | | Foreign
Currency
Transactions1 | |
Foreign exchange contracts | | $ | 481,563 | |
| | | | |
Net Change in Unrealized Appreciation (Depreciation) on: | | Foreign
Currency
Transactions1 | |
Foreign exchange contracts | | $ | (157,093 | ) |
| 1 | Represents realized gain and change in unrealized appreciation (depreciation), respectively, for forward foreign currency contracts during the period. Does not include other foreign currency gains or losses included in the Statement of Operations. |
The following is a summary of derivative instruments for Mid Cap Growth Fund as of September 30, 2013, as reflected within the Statement of Assets and Liabilities:
| | | | |
Assets | | Investments at Value1 | |
Exchange traded/cleared asset derivatives | | | | |
Equity contracts | | $ | 183,568 | |
| 1 | Represents purchased options, at value. |
Transactions in derivative instruments for Mid Cap Growth Fund during the year ended September 30, 2013, as reflected within the Statement of Operations were as follows:
| | | | | | | | |
Net Realized Gain (Loss) on: | | Investments2 | | | Options
Written | |
Equity contracts | | $ | (551,800 | ) | | $ | 137,983 | |
| | | | |
Net Change in Unrealized Appreciation (Depreciation) on: | | Investments2 | |
Equity contracts | | $ | (206,019 | ) |
| 2 | Represents realized loss and change in unrealized appreciation (depreciation), respectively, for purchased options during the period. |
As the Funds value their derivatives at fair value and recognize changes in fair value through the Statements of Operations, they do not qualify for hedge accounting under authoritative guidance for derivative instruments. The Funds’ investments in derivatives may represent an economic hedge; however, they are considered to be non-hedge transactions for the purpose of these disclosures.
Over-the-counter derivatives, including forward foreign currency contracts, are entered into pursuant to International Swaps and Derivatives Association, Inc. (“ISDA”)
| 82
Notes to Financial Statements (continued)
September 30, 2013
agreements negotiated between the Funds and their counterparties. ISDA agreements typically contain, among other things, terms for posting of collateral and master netting provisions in the event of a default or other termination event. Collateral is posted by a Fund or the counterparty to the extent of the net mark-to-market exposure to the other party of all open contracts under the agreement, subject to minimum transfer requirements. Master netting provisions allow the Funds and the counterparty, in the event of a default or other termination event, to offset amounts owed by each related to derivative contracts, including any posted collateral, to one net amount payable by either the Funds or the counterparty. The Funds’ ISDA agreements typically contain provisions that allow a counterparty to terminate open contracts early if the net asset value of a Fund declines beyond a certain threshold. As of September 30, 2013, the fair value of derivative positions subject to these provisions that are in a net liability position by counterparty, and the value of collateral pledged to counterparties for such contracts is as follows:
| | | | | | | | | | |
Fund | | Counterparty | | Derivatives | | | Collateral
Pledged | |
Global Equity and Income Fund | | Barclays Bank PLC | | $ | (70,111 | ) | | $ | — | |
| | Credit Suisse International | | | (172,089 | ) | | | — | |
Timing differences may exist between when contracts under the ISDA agreement are marked-to-market and when collateral moves. The ISDA agreements include tri-party control agreements under which collateral is held for the benefit of the secured party at a third party custodian, State Street Bank.
Counterparty risk is managed based on policies and procedures established by each Fund’s adviser. Such policies and procedures include, but are not limited to, minimum counterparty credit rating requirements, monitoring of counterparty credit default swap spreads and posting of collateral. The risk of loss to a Fund from counterparty default should be limited to the extent a Fund is under collateralized for over-the-counter derivatives; however, final settlement of a Funds’ claim against any collateral received may be subject to bankruptcy court proceedings. Additionally, cash or securities held at or pledged to counterparties for initial/variation margin or as collateral may be subject to bankruptcy court proceedings. Based on balances on Global Equity and Income Fund’s Statement of Assets and Liabilities, the maximum amount of loss the Fund would incur if counterparties failed to meet their obligations is $81,735 and the amount of loss that the Fund would incur after taking into account master netting arrangements is $14,708.
83 |
Notes to Financial Statements (continued)
September 30, 2013
The volume of forward foreign currency contract activity, as a percentage of net assets, for Global Equity and Income Fund based on gross month-end notional amounts outstanding during the period, including long and short positions at absolute value, was as follows for the year ended September 30, 2013:
| | | | |
Global Equity and Income Fund | | Forwards | |
Average Notional Amount Outstanding | | | 1.52 | % |
Highest Notional Amount Outstanding | | | 3.83 | % |
Lowest Notional Amount Outstanding | | | 0.81 | % |
Notional Amount Outstanding as of September 30, 2013 | | | 3.83 | % |
Notional amounts outstanding at the end of the prior period are included in the average notional amount outstanding.
Unrealized gain and/or loss on open forwards is recorded in the Statements of Assets and Liabilities. The aggregate notional values of forwards are not recorded in the Statements of Assets and Liabilities, and therefore are not included in Global Equity and Income Fund’s net assets.
The volume of option contracts activity, as a percentage of net assets, for Mid Cap Growth Fund based on month-end and/or daily market values of equity securities underlying purchased and written options, at absolute value, was as follows for the year ended September 30, 2013:
| | | | | | | | | | | | |
Mid Cap Growth Fund* | | Call Options Purchased | | | Put Options
Purchased | | | Put Options
Written | |
Average Market Value of Underlying Securities | | | 0.96 | % | | | 0.16 | % | | | 0.00 | %** |
Highest Market Value of Underlying Securities | | | 3.79 | % | | | 0.96 | % | | | 0.16 | % |
Lowest Market Value of Underlying Securities | | | 0.00 | % | | | 0.00 | % | | | 0.00 | % |
Market Value of Underlying Securities as of September 30, 2013 | | | 3.68 | % | | | 0.90 | % | | | 0.00 | % |
| * | Market value of underlying securities is determined by multiplying option shares by the price of the option’s underlying security, as determined by the Fund’s Pricing Policies and Procedures. |
The following is a summary of Mid Cap Growth Fund’s written option activity:
| | | | | | | | |
| | | Number of Contracts | | | Premiums | |
Outstanding at September 30, 2012 | | | — | | | $ | — | |
Options written | | | 1,844 | | | | 225,046 | |
Options terminated in closing purchase transactions | | | (1,844 | ) | | | (225,046 | ) |
| | | | | | | | |
Outstanding at September 30, 2013 | | | — | | | $ | — | |
| | | | | | | | |
| 84
Notes to Financial Statements (continued)
September 30, 2013
5. Purchases and Sales of Securities. For the year ended September 30, 2013, purchases and sales of securities (excluding short-term investments and U.S. Government/Agency securities and including paydowns) were as follows:
| | | | | | | | |
Fund | | Purchases | | | Sales | |
Global Equity and Income Fund | | $ | 717,646,997 | | | $ | 552,795,105 | |
Growth Fund | | | 417,386,343 | | | | 16,054,477 | |
Mid Cap Growth Fund | | | 153,482,226 | | | | 173,761,778 | |
Value Fund | | | 591,985,537 | | | | 382,288,190 | |
For the year ended September 30, 2013, purchases and sales of U.S. Government/Agency securities by the Global Equity and Income Fund were $48,568,725 and $41,479,193, respectively.
6. Management Fees and Other Transactions with Affiliates.
a. Management Fees. Loomis, Sayles & Company, L.P. (“Loomis Sayles”) serves as investment adviser to each Fund. Separate management agreements for each Fund in effect for the year ended September 30, 2013, provided for fees at the following annual percentage rates of each Fund’s average daily net assets:
| | | | |
Fund | | Percentage of
Average
Daily Net Assets | |
Global Equity and Income Fund | | | 0.75 | % |
Growth Fund | | | 0.50 | % |
Mid Cap Growth Fund | | | 0.75 | % |
Value Fund | | | 0.50 | % |
Loomis Sayles has given binding undertakings to the Funds to waive management fees and/or reimburse certain expenses to limit the Funds’ operating expenses, exclusive of acquired fund fees and expenses, brokerage expenses, interest expense, taxes and extraordinary expenses. These undertakings are in effect until January 31, 2014 and are reevaluated on an annual basis. Management fees payable, as reflected on the Statements of Assets and Liabilities, is net of waivers and/or expense reimbursements, if any, pursuant to these undertakings.
85 |
Notes to Financial Statements (continued)
September 30, 2013
For the year ended September 30, 2013, the expense limits as a percentage of average daily net assets under the expense limitation agreements were as follows:
| | | | | | | | | | | | | | | | | | | | | | | | |
| | | Expense Limit as a Percentage of
Average Daily Net Assets | |
Fund | | Class A | | | Class B | | | Class C | | | Class N | | | Class Y | | | Admin
Class | |
Global Equity and Income Fund | | | 1.25 | % | | | — | | | | 2.00 | % | | | — | | | | 1.00 | % | | | — | |
Growth Fund | | | 1.25 | % | | | 2.00 | % | | | 2.00 | % | | | 0.95 | % | | | 1.00 | % | | | — | |
Mid Cap Growth Fund | | | 1.25 | % | | | — | | | | 2.00 | % | | | 0.95 | % | | | 1.00 | % | | | — | |
Value Fund | | | 1.10 | % | | | 1.85 | % | | | 1.85 | % | | | 0.80 | % | | | 0.85 | % | | | 1.35 | % |
Loomis Sayles shall be permitted to recover expenses it has borne under the expense limitation agreements (whether through waiver of its management fees or otherwise) on a class by class basis in later periods to the extent the annual operating expenses of a class fall below a class’ expense limits, provided, however, that a class is not obligated to pay such waived/reimbursed fees or expenses more than one year after the end of the fiscal year in which the fees or expenses were waived/reimbursed.
For the year ended September 30, 2013, the management fees and waivers of management fees for each Fund were as follows:
| | | | | | | | | | | | | | | | | | | | |
| | | Gross Management Fees | | | Waivers of Management Fees1 | | | Net Management Fees | | | Percentage of Average Daily Net Assets | |
Fund | | | | | Gross | | | Net | |
Global Equity and Income Fund | | $ | 8,172,113 | | | $ | — | | | $ | 8,172,113 | | | | 0.75 | % | | | 0.75 | % |
Growth Fund | | | 1,257,080 | | | | — | | | | 1,257,080 | | | | 0.50 | % | | | 0.50 | % |
Mid Cap Growth Fund | | | 744,404 | | | | 47,151 | | | | 697,253 | | | | 0.75 | % | | | 0.70 | % |
Value Fund | | | 8,233,449 | | | | — | | | | 8,233,449 | | | | 0.50 | % | | | 0.50 | % |
| 1 | Management fee waivers are subject to possible recovery until September 30, 2014. |
For the period ended September 30, 2013 class specific expenses have been reimbursed as follows:
| | | | | | | | | | | | | | | | | | | | | | | | |
| | | Reimbursement2 | |
Fund | | Class A | | | Class B | | | Class C | | | Class N | | | Class Y | | | Admin Class | |
Growth Fund | | $ | — | | | $ | — | | | $ | — | | | $ | 18 | | | $ | — | | | $ | — | |
Mid Cap Growth Fund | | | 51,868 | | | | — | | | | 3,203 | | | | 18 | | | | 92,116 | | | | — | |
| 2 | Expense reimbursements are subject to possible recovery until September 2014. |
| 86
Notes to Financial Statements (continued)
September 30, 2013
No expenses were recovered for any of the Funds during the year ended September 30, 2013 under the terms of the expense agreements.
Certain officers and employees of Loomis Sayles are also officers or Trustees of the Trust. Loomis Sayles’ general partner is indirectly owned by Natixis Global Asset Management, L.P. (“Natixis US”), which is part of Natixis Global Asset Management, an international asset management group based in Paris, France.
b. Service and Distribution Fees. NGAM Distribution, L.P. (“NGAM Distribution”), which is a wholly-owned subsidiary of Natixis US, has entered into a distribution agreement with the Trust. Pursuant to this agreement, NGAM Distribution serves as principal underwriter of the Funds of the Trust.
Pursuant to Rule 12b-1 under the 1940 Act, the Trust has adopted a Service Plan relating to each Fund’s Class A shares (the “Class A Plans”), a Distribution and Service Plan relating to each Fund’s Class B (if applicable) and Class C shares (the “Class B and Class C Plans”), and Value Fund has adopted a Distribution Plan relating to its Admin Class shares (the “Admin Class Plan”).
Under the Class A Plans, each Fund pays NGAM Distribution a monthly service fee at an annual rate not to exceed 0.25% of the average daily net assets attributable to the Fund’s Class A shares, as reimbursement for expenses incurred by NGAM Distribution in providing personal services to investors in Class A shares and/or the maintenance of shareholder accounts.
Under the Class B (if applicable) and Class C Plans, each Fund pays NGAM Distribution a monthly service fee at an annual rate not to exceed 0.25% of the average daily net assets attributable to the Fund’s Class B (if applicable) and Class C shares, as compensation for services provided by NGAM Distribution in providing personal services to investors in Class B (if applicable) and Class C shares and/or the maintenance of shareholder accounts.
Also under the Class B (if applicable) and Class C Plans, each Fund pays NGAM Distribution a monthly distribution fee at an annual rate of 0.75% of the average daily net assets attributable to the Funds’ Class B (if applicable) and Class C shares, as compensation for services provided by NGAM Distribution in connection with the marketing or sale of Class B (if applicable) and Class C shares.
Under the Admin Class Plan, Value Fund pays NGAM Distribution a monthly distribution fee at an annual rate not to exceed 0.25% of the average daily net assets attributable to the Fund’s Admin Class shares, as compensation for services provided by NGAM Distribution in connection with the marketing or sale of Admin Class shares or for payments made by NGAM Distribution to securities dealers or other financial intermediaries as commissions, asset-based sales charges or other compensation with respect to the sale of Admin Class shares, or for providing personal services to investors and/or the maintenance of shareholder accounts.
87 |
Notes to Financial Statements (continued)
September 30, 2013
In addition, the Admin Class shares of Value Fund may pay NGAM Distribution an administrative service fee, at an annual rate not to exceed 0.25% of the average daily net assets attributable to Admin Class shares. These fees are subsequently paid to securities dealers or financial intermediaries for providing personal services and/or account maintenance for their customers who hold such shares.
For the year ended September 30, 2013, the service and distribution fees for each Fund were as follows:
| | | | | | | | | | | | | | | | | | | | | | | | | | | | |
| | | Service Fees | | | Distribution Fees | |
Fund | | Class A | | | Class B | | | Class C | | | Admin
Class | | | Class B | | | Class C | | | Admin
Class | |
Global Equity and Income Fund | | $ | 607,416 | | | $ | — | | | $ | 761,282 | | | $ | — | | | $ | — | | | $ | 2,283,845 | | | $ | — | |
Growth Fund | | | 98,102 | | | | 4,036 | | | | 33,168 | | | | — | | | | 12,107 | | | | 99,505 | | | | — | |
Mid Cap Growth Fund | | | 92,810 | | | | — | | | | 5,037 | | | | — | | | | — | | | | 15,111 | | | | — | |
Value Fund | | | 375,174 | | | | 3,276 | | | | 28,281 | | | | 12 | | | | 9,827 | | | | 84,842 | | | | 12 | |
c. Administrative Fees. NGAM Advisors, L.P. (“NGAM Advisors”), provides certain administrative services for the Funds and contracts with State Street Bank to serve as sub-administrator. NGAM Advisors is a wholly-owned subsidiary of Natixis US. Pursuant to an agreement among Natixis Funds Trust I, Natixis Funds Trust II, Natixis Funds Trust IV, Gateway Trust (“Natixis Funds Trusts”), Loomis Sayles Funds I, Loomis Sayles Funds II (“Loomis Sayles Funds Trusts”), Hansberger International Series and NGAM Advisors, each Fund pays NGAM Advisors monthly its pro rata portion of fees equal to an annual rate of 0.0575% of the first $15 billion of the average daily net assets of the Natixis Funds Trusts, Loomis Sayles Funds Trusts and Hansberger International Series, 0.0500% of the next $15 billion, 0.0400% of the next $30 billion and 0.0350% of such assets in excess of $60 billion, subject to an annual aggregate minimum fee for the Natixis Funds Trusts, Loomis Sayles Funds Trusts and Hansberger International Series of $10 million, which is reevaluated on an annual basis.
For the year ended September 30, 2013, the administrative fees for each Fund were as follows:
| | | | |
Fund | | Administrative
Fees | |
Global Equity and Income Fund | | $ | 481,960 | |
Growth Fund | | | 111,232 | |
Mid Cap Growth Fund | | | 43,909 | |
Value Fund | | | 728,356 | |
| 88
Notes to Financial Statements (continued)
September 30, 2013
d. Sub-Transfer Agent Fees. NGAM Distribution has entered into agreements, which include servicing agreements, with financial intermediaries that provide recordkeeping, processing, shareholder communications and other services to customers of the intermediaries that hold positions in the Funds and has agreed to compensate the intermediaries for providing those services. Intermediaries transact with the Funds primarily through the use of omnibus accounts on behalf of their customers who hold positions in the Funds. These services would have been provided by the Funds’ transfer agent and other service providers if the shareholders’ accounts were maintained directly at the Funds’ transfer agent. Accordingly, the Funds have agreed to reimburse NGAM Distribution for all or a portion of the servicing fees paid to these intermediaries. The reimbursement amounts (sub-transfer agent fees) paid to NGAM Distribution are subject to a current per-account equivalent fee limit approved by the Funds’ Board, which is based on fees for similar services paid to the Funds’ transfer agent and other service providers. Class N shares do not bear such expenses.
For the year ended September 30, 2013, the sub-transfer agent fees (which are reflected in transfer agent fees and expenses in the Statements of Operations) for each Fund were as follows:
| | | | |
Fund | | Sub-Transfer
Agent Fees | |
Global Equity and Income Fund | | $ | 794,889 | |
Growth Fund | | | 214,309 | |
Mid Cap Growth Fund | | | 196,800 | |
Value Fund | | | 2,171,654 | |
As of September 30, 2013, the Funds owe NGAM Distribution the following reimbursements for sub-transfer agent fees:
| | | | |
Fund | | Reimbursements
of Sub-Transfer
Agent Fees | |
Global Equity and Income Fund | | $ | 11,747 | |
Growth Fund | | | 52,697 | |
Mid Cap Growth Fund | | | 3,748 | |
Value Fund | | | 44,170 | |
Sub-transfer agent fees attributable to Class A, Class B, Class C, Class Y, and Admin Class are allocated on a pro rata basis to each class based on the relative net assets of each class to the total net assets of those classes.
89 |
Notes to Financial Statements (continued)
September 30, 2013
e. Commissions. Commissions (including CDSCs) on Fund shares retained by NGAM Distribution during the year ended September 30, 2013, were as follows:
| | | | |
Fund | | Commissions | |
Global Equity and Income Fund | | $ | 639,220 | |
Growth Fund | | | 112,695 | |
Mid Cap Growth Fund | | | 28,237 | |
Value Fund | | | 67,496 | |
f. Trustees Fees and Expenses. The Trust does not pay any compensation directly to its officers or Trustees who are directors, officers or employees of NGAM Advisors, NGAM Distribution, Natixis US or their affiliates. Effective January 1, 2013, the Chairperson of the Board receives a retainer fee at the annual rate of $285,000. The Chairperson does not receive any meeting attendance fees for Board of Trustees meetings or committee meetings that she attends. Each Independent Trustee (other than the Chairperson) receives, in the aggregate, a retainer fee at the annual rate of $115,000. Each Independent Trustee also receives a meeting attendance fee of $10,000 for each meeting of the Board of Trustees that he or she attends in person and $5,000 for each meeting of the Board of Trustees that he or she attends telephonically. In addition, each committee chairman receives an additional retainer fee at an annual rate of $17,500. Each Contract Review and Governance Committee member is compensated $6,000 for each Committee meeting that he or she attends in person and $3,000 for each meeting that he or she attends telephonically. Each Audit Committee member is compensated $6,000 for each Committee meeting that he or she attends in person and $3,000 for each meeting that he or she attends telephonically. These fees are allocated among the funds in the Natixis Funds Trusts, Loomis Sayles Funds Trusts and Hansberger International Series based on a formula that takes into account, among other factors, the relative net assets of each fund. Trustees are reimbursed for travel expenses in connection with attendance at meetings.
Prior to January 1, 2013, the Chairperson of the Board received a retainer fee at the annual rate of $265,000 and each Independent Trustee (other than the Chairperson) received, in aggregate, a retainer fee at the annual rate of $95,000. In addition, each committee chairman received an additional retainer fee at an annual rate of $15,000, and each Audit Committee member was compensated $7,500 for each Committee meeting that he or she attended in person and $3,750 for each meeting that he or she attended telephonically.
A deferred compensation plan (the “Plan”) is available to the Trustees on a voluntary basis. Deferred amounts remain in the Funds until distributed in accordance with the provisions of the Plan. The value of a participating Trustee’s deferral account is based on theoretical investments of deferred amounts, on the normal payment dates, in certain funds of the Natixis Funds Trusts, Loomis Sayles Funds Trusts and Hansberger International Series as designated by the participating Trustees. Changes in the value
| 90
Notes to Financial Statements (continued)
September 30, 2013
of participants’ deferral accounts are allocated pro rata among the funds in the Natixis Funds Trusts, Loomis Sayles Funds Trusts, and Hansberger International Series, and are normally reflected as Trustees’ fees and expenses in the Statements of Operations. The portions of the accrued obligations allocated to the Funds under the Plan are reflected as Deferred Trustees’ fees on the Statements of Assets and Liabilities.
g. Payments by Affiliates. For the year ended September 30, 2013, Loomis Sayles reimbursed Growth Fund $811 for losses incurred in connection with a trading error.
h. Affiliated Ownership. At September 30, 2013, Loomis Sayles Funded Pension Plan and Trust (“Pension Plan”) and Loomis Sayles Employees’ Profit Sharing Retirement Plan (“Retirement Plan”) held shares of the Funds representing the following percentages of the Funds’ net assets:
| | | | | | | | | | | | |
Fund | | Pension
Plan | | | Retirement
Plan | | | Total Affiliated Ownership | |
Global Equity and Income Fund | | | 1.48 | % | | | 1.07 | % | | | 2.55 | % |
Growth Fund | | | 1.35 | % | | | 3.31 | % | | | 4.66 | % |
Mid Cap Growth Fund | | | 9.56 | % | | | 11.87 | % | | | 21.43 | % |
Value Fund | | | 0.52 | % | | | 1.07 | % | | | 1.59 | % |
Additionally, as of September 30, 2013, Natixis US held shares of Growth Fund, Mid Cap Growth Fund and Value Fund representing less than 1% of each Fund’s net assets.
Investment activities of affiliated shareholders could have material impacts on the Funds.
7. Class-Specific Transfer Agent Fees and Expenses. For the period from February 1, 2013 through September 30, 2013, each Fund incurred the following class-specific expenses:
| | | | |
| | | Transfer Agent Fees and Expenses | |
Fund | | Class N | |
Growth Fund | | $ | 19 | |
Mid Cap Growth Fund | | | 18 | |
Value Fund | | | 32 | |
Transfer agent fees and expenses attributable to Class A, Class B, Class C, Class Y and Admin Class are allocated on a pro rata basis to each class based on the relative net assets of each class to the total net assets of those classes.
8. Line of Credit. Each Fund, together with certain other funds of Natixis Funds Trusts, Loomis Sayles Funds Trusts and Hansberger International Series, participates in a $200,000,000 committed unsecured line of credit provided by State Street Bank, with an individual limit of $125,000,000 for each fund that participates in the line of credit. Interest is charged to each participating fund based on its borrowings at a rate per
91 |
Notes to Financial Statements (continued)
September 30, 2013
annum equal to the greater of the Federal Funds rate or overnight LIBOR, plus 1.25%. In addition, a commitment fee of 0.10% per annum, payable at the end of each calendar quarter, is accrued and apportioned among the participating funds based on their average daily unused portion of the line of credit.
For the year ended September 30, 2013, none of the Funds had borrowings under these agreements.
9. Brokerage Commission Recapture. Each Fund has entered into agreements with certain brokers whereby the brokers will rebate a portion of brokerage commissions. All amounts rebated by the brokers are returned to the Funds under such agreements and are included in realized gains on investments on the Statements of Operations. For the year ended September 30, 2013, amounts rebated under these agreements were as follows:
| | | | |
Fund | | Rebates | |
Global Equity and Income Fund | | $ | 51,303 | |
Growth Fund | | | 3,334 | |
Mid Cap Growth Fund | | | 17,815 | |
Value Fund | | | 61,036 | |
10. Concentration of Risk. Each Fund’s investments in foreign securities are subject to foreign currency fluctuations, higher volatility than U.S. securities, varying degrees of regulation and limited liquidity. Greater political, economic, credit and information risks are also associated with foreign securities.
11. Concentration of Ownership. From time to time, a Fund may have a concentration of one or more accounts constituting a significant percentage of shares outstanding. Investment activities by holders of such accounts could have material impacts on the Funds. As of September 30, 2013, based on management’s evaluation of the shareholder account base, the Growth Fund had accounts representing controlling ownership of more than 5% of the Fund’s total outstanding shares. The number of such accounts, based on accounts that represent more than 5% of an individual class of shares, and the aggregate percentage of net assets represented by such holdings was as follows:
| | | | | | | | | | | | | | | | |
Fund | | Number of >5%
Non-Affiliated
Account
Holders | | | Percentage of
Non-Affiliated
Ownership | | | Percentage of
Affiliated
Ownership
(Note 6) | | | Total
Percentage of
Ownership | |
Global Equity and Income Fund | | | — | | | | — | | | | 2.55 | % | | | 2.55 | % |
Growth Fund | | | 1 | | | | 51.00 | % | | | 4.66 | % | | | 55.66 | % |
Mid Cap Growth Fund | | | — | | | | — | | | | 21.43 | % | | | 21.43 | % |
Value Fund | | | — | | | | — | | | | 1.59 | % | | | 1.59 | % |
| 92
Notes to Financial Statements (continued)
September 30, 2013
Omnibus shareholder accounts for which NGAM Advisors understands that the intermediary has discretion over the underlying shareholder accounts are included in the table above. For other omnibus accounts, the Fund does not have information on the individual shareholder accounts underlying omnibus accounts; therefore, there could be other 5% shareholders in addition to those disclosed in the table above.
12. Capital Shares. Each Fund may issue an unlimited number of shares of beneficial interest, without par value. Transactions in capital shares were as follows:
| | | | | | | | | | | | | | | | |
| |
| Year Ended
September 30, 2013 |
| |
| Year Ended
September 30, 2012 |
|
Global Equity and Income Fund | | | Shares | | | | Amount | | | | Shares | | | | Amount | |
| Class A | | | | | | | | | | | | | | | | |
Issued from the sale of shares | | | 6,403,257 | | | $ | 112,444,744 | | | | 8,720,812 | | | $ | 141,220,300 | |
Issued in connection with the reinvestment of distributions | | | 158,735 | | | | 2,698,497 | | | | 110,750 | | | | 1,656,822 | |
Redeemed | | | (5,705,750 | ) | | | (101,062,656 | ) | | | (3,998,699 | ) | | | (64,584,778 | ) |
| | | | | | | | | | | | | | | | |
Net change | | | 856,242 | | | $ | 14,080,585 | | | | 4,832,863 | | | $ | 78,292,344 | |
| | | | | | | | | | | | | | | | |
| Class C | | | | | | | | | | | | | | | | |
Issued from the sale of shares | | | 6,477,950 | | | $ | 112,781,235 | | | | 6,618,891 | | | $ | 107,450,527 | |
Issued in connection with the reinvestment of distributions | | | 79,749 | | | | 1,347,760 | | | | 37,940 | | | | 564,931 | |
Redeemed | | | (2,880,607 | ) | | | (50,645,807 | ) | | | (2,089,254 | ) | | | (32,993,910 | ) |
| | | | | | | | | | | | | | | | |
Net change | | | 3,677,092 | | | $ | 63,483,188 | | | | 4,567,577 | | | $ | 75,021,548 | |
| | | | | | | | | | | | | | | | |
| Class Y | | | | | | | | | | | | | | | | |
Issued from the sale of shares | | | 13,693,457 | | | $ | 242,081,042 | | | | 16,942,461 | | | $ | 274,580,271 | |
Issued in connection with the reinvestment of distributions | | | 372,584 | | | | 6,360,002 | | | | 185,653 | | | | 2,784,787 | |
Redeemed | | | (10,334,286 | ) | | | (184,305,730 | ) | | | (5,411,226 | ) | | | (86,765,876 | ) |
| | | | | | | | | | | | | | | | |
Net change | | | 3,731,755 | | | $ | 64,135,314 | | | | 11,716,888 | | | $ | 190,599,182 | |
| | | | | | | | | | | | | | | | |
Increase (decrease) from capital share transactions | | | 8,265,089 | | | $ | 141,699,087 | | | | 21,117,328 | | | $ | 343,913,074 | |
| | | | | | | | | | | | | | | | |
93 |
Notes to Financial Statements (continued)
September 30, 2013
12. Capital Shares (continued).
| | | | | | | | | | | | | | | | |
| |
| Year Ended
September 30, 2013 |
| |
| Year Ended
September 30, 2012 |
|
Growth Fund | | | Shares | | | | Amount | | | | Shares | | | | Amount | |
| Class A | | | | | | | | | | | | | | | | |
Issued from the sale of shares | | | 2,079,530 | | | $ | 15,522,796 | | | | 1,936,271 | | | $ | 11,163,676 | |
Issued in connection with the reinvestment of distributions | | | 42,088 | | | | 279,039 | | | | 6,836 | | | | 38,350 | |
Redeemed | | | (1,072,705 | ) | | | (7,766,746 | ) | | | (1,860,105 | ) | | | (10,830,069 | ) |
| | | | | | | | | | | | | | | | |
Net change | | | 1,048,913 | | | $ | 8,035,089 | | | | 83,002 | | | $ | 371,957 | |
| | | | | | | | | | | | | | | | |
| Class B | | | | | | | | | | | | | | | | |
Issued from the sale of shares | | | 5,381 | | | $ | 35,874 | | | | 12,916 | | | $ | 73,151 | |
Issued in connection with the reinvestment of distributions | | | — | | | | — | | | | — | | | | — | |
Redeemed | | | (130,908 | ) | | | (871,942 | ) | | | (227,838 | ) | | | (1,269,777 | ) |
| | | | | | | | | | | | | | | | |
Net change | | | (125,527 | ) | | $ | (836,068 | ) | | | (214,922 | ) | | $ | (1,196,626 | ) |
| | | | | | | | | | | | | | | | |
| Class C | | | | | | | | | | | | | | | | |
Issued from the sale of shares | | | 1,396,477 | | | $ | 9,907,201 | | | | 245,606 | | | $ | 1,431,273 | |
Issued in connection with the reinvestment of distributions | | | 1,981 | | | | 12,359 | | | | — | | | | — | |
Redeemed | | | (366,836 | ) | | | (2,445,099 | ) | | | (600,111 | ) | | | (3,380,312 | ) |
| | | | | | | | | | | | | | | | |
Net change | | | 1,031,622 | | | $ | 7,474,461 | | | | (354,505 | ) | | $ | (1,949,039 | ) |
| | | | | | | | | | | | | | | | |
| Class N* | | | | | | | | | | | | | | | | |
Issued from the sale of shares | | | 132 | | | $ | 1,000 | | | | — | | | $ | — | |
Issued in connection with the reinvestment of distributions | | | — | | | | — | | | | — | | | | — | |
Redeemed | | | — | | | | — | | | | — | | | | — | |
| | | | | | | | | | | | | | | | |
Net change | | | 132 | | | $ | 1,000 | | | | — | | | $ | — | |
| | | | | | | | | | | | | | | | |
| Class Y | | | | | | | | | | | | | | | | |
Issued from the sale of shares | | | 51,555,859 | | | $ | 422,574,020 | | | | 3,663,289 | | | $ | 23,444,311 | |
Issued in connection with the reinvestment of distributions | | | 142,021 | | | | 998,409 | | | | 46,359 | | | | 275,371 | |
Redeemed | | | (3,414,873 | ) | | | (27,120,607 | ) | | | (1,438,726 | ) | | | (9,219,910 | ) |
| | | | | | | | | | | | | | | | |
Net change | | | 48,283,007 | | | $ | 396,451,822 | | | | 2,270,922 | | | $ | 14,499,772 | |
| | | | | | | | | | | | | | | | |
Increase (decrease) from capital share transactions | | | 50,238,147 | | | $ | 411,126,304 | | | | 1,784,497 | | | $ | 11,726,064 | |
| | | | | | | | | | | | | | | | |
| * | From commencement of Class operations on February 1, 2013 through September 30, 2013. |
| 94
Notes to Financial Statements (continued)
September 30, 2013
12. Capital Shares (continued).
| | | | | | | | | | | | | | | | |
| |
| Year Ended
September 30, 2013 |
| |
| Year Ended
September 30, 2012 |
|
Mid Cap Growth Fund | | | Shares | | | | Amount | | | | Shares | | | | Amount | |
| Class A | | | | | | | | | | | | | | | | |
Issued from the sale of shares | | | 282,282 | | | $ | 8,735,102 | | | | 382,245 | | | $ | 10,336,274 | |
Issued in connection with the reinvestment of distributions | | | — | | | | — | | | | — | | | | — | |
Redeemed | | | (789,967 | ) | | | (24,463,927 | ) | | | (898,702 | ) | | | (24,081,488 | ) |
| | | | | | | | | | | | | | | | |
Net change | | | (507,685 | ) | | $ | (15,728,825 | ) | | | (516,457 | ) | | $ | (13,745,214 | ) |
| | | | | | | | | | | | | | | | |
| Class C | | | | | | | | | | | | | | | | |
Issued from the sale of shares | | | 49,505 | | | $ | 1,519,811 | | | | 39,669 | | | $ | 1,032,950 | |
Issued in connection with the reinvestment of distributions | | | — | | | | — | | | | — | | | | — | |
Redeemed | | | (66,245 | ) | | | (1,918,756 | ) | | | (42,106 | ) | | | (1,135,742 | ) |
| | | | | | | | | | | | | | | | |
Net change | | | (16,740 | ) | | $ | (398,945 | ) | | | (2,437 | ) | | $ | (102,792 | ) |
| | | | | | | | | | | | | | | | |
| Class N* | | | | | | | | | | | | |
Issued from the sale of shares | | | 32 | | | $ | 1,000 | | | | — | | | $ | — | |
Issued in connection with the reinvestment of distributions | | | — | | | | — | | | | — | | | | — | |
Redeemed | | | — | | | | — | | | | — | | | | — | |
| | | | | | | | | | | | | | | | |
Net change | | | 32 | | | $ | 1,000 | | | | — | | | $ | — | |
| | | | | | | | | | | | | | | | |
| Class Y | | | | | | | | | | | | | | | | |
Issued from the sale of shares | | | 382,988 | | | $ | 12,402,097 | | | | 547,417 | | | $ | 15,078,148 | |
Issued in connection with the reinvestment of distributions | | | — | | | | — | | | | — | | | | — | |
Redeemed | | | (511,353 | ) | | | (16,567,507 | ) | | | (634,861 | ) | | | (18,048,468 | ) |
| | | | | | | | | | | | | | | | |
Net change | | | (128,365 | ) | | $ | (4,165,410 | ) | | | (87,444 | ) | | $ | (2,970,320 | ) |
| | | | | | | | | | | | | | | | |
Increase (decrease) from capital share transactions | | | (652,758 | ) | | $ | (20,292,180 | ) | | | (606,338 | ) | | $ | (16,818,326 | ) |
| | | | | | | | | | | | | | | | |
| * | From commencement of Class operations on February 1, 2013 through September 30, 2013. |
95 |
Notes to Financial Statements (continued)
September 30, 2013
12. Capital Shares (continued).
| | | | | | | | | | | | | | | | |
| |
| Year Ended
September 30, 2013 |
| |
| Year Ended
September 30, 2012 |
|
Value Fund | | | Shares | | | | Amount | | | | Shares | | | | Amount | |
| Class A | | | | | | | | | | | | | | | | |
Issued from the sale of shares | | | 1,852,296 | | | $ | 43,861,390 | | | | 989,772 | | | $ | 18,793,820 | |
Issued in connection with the reinvestment of distributions | | | 80,241 | | | | 1,677,029 | | | | 87,182 | | | | 1,538,775 | |
Redeemed | | | (1,449,094 | ) | | | (33,882,046 | ) | | | (2,772,225 | ) | | | (51,186,817 | ) |
| | | | | | | | | | | | | | | | |
Net change | | | 483,443 | | | $ | 11,656,373 | | | | (1,695,271 | ) | | $ | (30,854,222 | ) |
| | | | | | | | | | | | | | | | |
| Class B | | | | | | | | | | | | | | | | |
Issued from the sale of shares | | | 5,265 | | | $ | 129,542 | | | | 1,714 | | | $ | 31,648 | |
Issued in connection with the reinvestment of distributions | | | 192 | | | | 4,059 | | | | 211 | | | | 3,758 | |
Redeemed | | | (34,307 | ) | | | (800,771 | ) | | | (55,615 | ) | | | (1,054,644 | ) |
| | | | | | | | | | | | | | | | |
Net change | | | (28,850 | ) | | $ | (667,170 | ) | | | (53,690 | ) | | $ | (1,019,238 | ) |
| | | | | | | | | | | | | | | | |
| Class C | | | | | | | | | | | | | | | | |
Issued from the sale of shares | | | 247,166 | | | $ | 5,937,119 | | | | 54,410 | | | $ | 1,016,926 | |
Issued in connection with the reinvestment of distributions | | | 1,685 | | | | 35,039 | | | | 1,337 | | | | 23,495 | |
Redeemed | | | (91,366 | ) | | | (2,113,440 | ) | | | (182,376 | ) | | | (3,372,547 | ) |
| | | | | | | | | | | | | | | | |
Net change | | | 157,485 | | | $ | 3,858,718 | | | | (126,629 | ) | | $ | (2,332,126 | ) |
| | | | | | | | | | | | | | | | |
| Class N* | | | | | | | | | | | | | | | | |
Issued from the sale of shares | | | 10,454,022 | | | $ | 258,496,210 | | | | — | | | $ | — | |
Issued in connection with the reinvestment of distributions | | | — | | | | — | | | | — | | | | — | |
Redeemed | | | (294,410 | ) | | | (7,559,202 | ) | | | — | | | | — | |
| | | �� | | | | | | | | | | | | | |
Net change | | | 10,159,612 | | | $ | 250,937,008 | | | | — | | | $ | — | |
| | | | | | | | | | | | | | | | |
| Class Y | | | | | | | | | | | | | | | | |
Issued from the sale of shares | | | 19,403,642 | | | $ | 451,188,543 | | | | 12,644,597 | | | $ | 238,607,810 | |
Issued in connection with the reinvestment of distributions | | | 927,685 | | | | 19,397,907 | | | | 871,612 | | | | 15,392,660 | |
Redeemed | | | (20,622,336 | ) | | | (487,734,421 | ) | | | (13,771,730 | ) | | | (260,802,172 | ) |
| | | | | | | | | | | | | | | | |
Net change | | | (291,009 | ) | | $ | (17,147,971 | ) | | | (255,521 | ) | | $ | (6,801,702 | ) |
| | | | | | | | | | | | | | | | |
| Admin Class | | | | | | | | | | | | | | | | |
Issued from the sale of shares | | | 420 | | | $ | 10,224 | | | | 98 | | | $ | 1,835 | |
Issued in connection with the reinvestment of distributions | | | 1 | | | | 14 | | | | 1 | | | | 12 | |
Redeemed | | | (51 | ) | | | (1,394 | ) | | | (93 | ) | | | (1,826 | ) |
| | | | | | | | | | | | | | | | |
Net change | | | 370 | | | $ | 8,844 | | | | 6 | | | $ | 21 | |
| | | | | | | | | | | | | | | | |
Increase (decrease) from capital share transactions | | | 10,481,051 | | | $ | 248,645,802 | | | | (2,131,105 | ) | | $ | (41,007,267 | ) |
| | | | | | | | | | | | | | | | |
| * | From commencement of Class operations on February 1, 2013 through September 30, 2013. |
| 96
Report of Independent Registered Public Accounting Firm
To the Trustees of Loomis Sayles Funds II and Shareholders of Loomis Sayles Global Equity and Income Fund, Loomis Sayles Growth Fund, Loomis Sayles Mid Cap Growth Fund and Loomis Sayles Value Fund:
In our opinion, the accompanying statements of assets and liabilities, including the portfolios of investments, and the related statements of operations and of changes in net assets and the financial highlights present fairly, in all material respects, the financial position of the Loomis Sayles Global Equity and Income Fund, Loomis Sayles Growth Fund, Loomis Sayles Mid Cap Growth Fund and Loomis Sayles Value Fund, each a series of Loomis Sayles Funds II (collectively, the “Funds”), at September 30, 2013, and the results of each of their operations, the changes in each of their net assets and the financial highlights for each of the periods indicated, in conformity with accounting principles generally accepted in the United States of America. These financial statements and financial highlights (hereafter referred to as “financial statements”) are the responsibility of the Funds’ management; our responsibility is to express an opinion on these financial statements based on our audits. We conducted our audits of these financial statements in accordance with the standards of the Public Company Accounting Oversight Board (United States). Those standards require that we plan and perform the audits to obtain reasonable assurance about whether the financial statements are free of material misstatement. An audit includes examining, on a test basis, evidence supporting the amounts and disclosures in the financial statements, assessing the accounting principles used and significant estimates made by management, and evaluating the overall financial statement presentation. We believe that our audits, which included confirmation of securities at September 30, 2013 by correspondence with the custodian and brokers, provide a reasonable basis for our opinion.
PricewaterhouseCoopers LLP
Boston, Massachusetts
November 21, 2013
97 |
2013 U.S. Tax Distribution Information to Shareholders (Unaudited)
Corporate Dividends Received Deduction. For the fiscal year ended September 30, 2013 a percentage of dividends distributed by the Funds listed below qualify for the dividends received deduction for corporate shareholders. These percentages are as follows:
| | | | |
Fund | | Qualifying
Percentage | |
Global Equity and Income | | | 34.02 | % |
Growth | | | 100.00 | % |
Value | | | 100.00 | % |
Qualified Dividend Income. For the fiscal year ended September 30, 2013 the Funds below will designate up to the maximum amount allowable pursuant to the Internal Revenue Code as qualified dividend income eligible for reduced tax rates. These lower rates range from 0% to 20% depending on an individual’s tax bracket. If the Funds pay a distribution during calendar year 2013, complete information will be reported in conjunction with Form 1099-DIV.
| | |
Fund | | |
Global Equity and Income | | |
Growth | | |
Value | | |
| 98
Trustee and Officer Information
The tables below provide certain information regarding the trustees and officers of Loomis Sayles Funds II (the “Trust”). Unless otherwise indicated, the address of all persons below is 399 Boylston Street, Boston, MA 02116. The Funds’ Statement of Additional Information includes additional information about the trustees of the Trust and is available by calling Natixis Funds at 800-225-5478.
| | | | | | | | |
Name and Year of Birth | | Position(s) Held with the Trust, Length of Time Served and Term of Office1 | | Principal Occupation(s) During Past 5 Years | | Number of Portfolios in Fund Complex Overseen2 and Other Directorships Held During Past 5 Years | | Experience, Qualifications, Attributes, Skills for Board Membership |
| | | |
| INDEPENDENT TRUSTEES | | | | | | |
| | | | |
| Charles D. Baker (1956) | | Trustee From 2005 to 2009 and since 2011 Contract Review and Governance Committee Member | | Executive in Residence at General Catalyst Partners (venture capital and growth equity firm); formerly, President and Chief Executive Officer, Harvard Pilgrim Health Care (health care organization) | | 42 Director, Athenahealth, Inc. (software company) | | Significant experience on the Board; executive experience (including president and chief executive officer of a health care organization and executive officer of a venture capital and growth equity firm) |
| | | | |
Daniel M. Cain (1945) | | Trustee Since 2003 Chairman of the Contract Review and Governance Committee | | Chairman (formerly, President and Chief Executive Officer) of Cain Brothers & Company, Incorporated (investment banking) | | 42 Director, Sheridan Healthcare Inc. (physician practice management) | | Significant experience on the Board and on the board of other business organizations (including at a health care organization); experience in the financial industry (including roles as chairman and former chief executive officer of an investment banking firm) |
99 |
Trustee and Officer Information
| | | | | | | | |
Name and Year of Birth | | Position(s) Held with the Trust, Length of Time Served and Term of Office1 | | Principal Occupation(s) During Past 5 Years | | Number of Portfolios in Fund Complex Overseen2 and Other Directorships Held During Past 5 Years | | Experience, Qualifications, Attributes, Skills for Board Membership |
| | | |
INDEPENDENT TRUSTEES continued | | | | | | |
| | | | |
Kenneth A. Drucker (1945) | | Trustee Since 2008 Chairman of the Audit Committee | | Retired | | 42 Formerly, Director, M Fund, Inc. (investment company); Director, Gateway Trust (investment company) | | Significant experience on the Board and on the board of other business organizations (including at investment companies); executive experience (including as treasurer of an aerospace, automotive, and metal manufacturing corporation) |
| | | | |
Edmond J. English (1953) | | Trustee Since 2013 Contract Review and Governance Committee Member | | Chief Executive Officer of Bob’s Discount Furniture (retail) | | 42 Formerly, Director, BJ’s Wholesale Club (retail); formerly, Director, Citizens Financial Group (bank) | | Significant experience on the board of other business organizations (including at a retail company and a bank); executive experience (including at a retail company) |
| 100
Trustee and Officer Information
| | | | | | | | |
Name and Year of Birth | | Position(s) Held with the Trust, Length of Time Served and Term of Office1 | | Principal Occupation(s) During Past 5 Years | | Number of Portfolios in Fund Complex Overseen2 and Other Directorships Held During Past 5 Years | | Experience, Qualifications, Attributes, Skills for Board Membership |
| | | |
INDEPENDENT TRUSTEES continued | | | | | | |
| | | | |
Wendell J. Knox (1948) | | Trustee Since 2009 Audit Committee Member | | Director (formerly, President and Chief Executive Officer) of Abt Associates Inc. (research and consulting) | | 42 Director, Eastern Bank (bank); Director, The Hanover Insurance Group (property and casualty insurance) | | Significant experience on the Board and on the board of other business organizations (including at a bank and at a property and casualty insurance firm); executive experience (including roles as president and chief executive officer of a consulting company) |
| | | | |
Martin T. Meehan (1956) | | Trustee Since 2012 Contract Review and Governance Committee Member | | Chancellor and faculty member, University of Massachusetts Lowell | | 42 None | | Experience on the Board and on the board of other business organizations; experience as Chancellor of the University of Massachusetts Lowell; government experience (including as a member of the U.S. House of Representatives); academic experience |
101 |
Trustee and Officer Information
| | | | | | | | |
Name and Year of Birth | | Position(s) Held with the Trust, Length of Time Served and Term of Office1 | | Principal Occupation(s) During Past 5 Years | | Number of Portfolios in Fund Complex Overseen2 and Other Directorships Held During Past 5 Years | | Experience, Qualifications, Attributes, Skills for Board Membership |
| | | |
INDEPENDENT TRUSTEES continued | | | | | | |
| | | | |
Sandra O. Moose (1942) | | Chairperson of the Board of Trustees since November 2005 Trustee Since 2003 Ex officio member of the Audit Committee and Contract Review and Governance Committee | | President, Strategic Advisory Services (management consulting) | | 42 Director, Verizon Communications (telecommunications company); Director, AES Corporation (international power company); formerly, Director, Rohm and Haas Company (specialty chemicals) | | Significant experience on the Board and on the board of other business organizations (including at a telecommunications company, an international power company and a specialty chemicals corporation); executive experience (including at a management consulting company) |
| | | | |
Erik R. Sirri (1958) | | Trustee Since 2009 Audit Committee Member | | Professor of Finance at Babson College; formerly, Director of the Division of Trading and Markets at the Securities and Exchange Commission | | 42 None | | Significant experience on the Board; experience as Director of the Division of Trading and Markets at the Securities and Exchange Commission; academic experience; training as an economist |
| | | | |
Peter J. Smail (1952) | | Trustee Since 2009 Contract Review and Governance Committee Member | | Retired; formerly, President and Chief Executive Officer of Pyramis Global Advisors (investment management) | | 42 None | | Significant experience on the Board; mutual fund industry and executive experience (including roles as president and chief executive officer for an investment adviser) |
| 102
Trustee and Officer Information
| | | | | | | | |
Name and Year of Birth | | Position(s) Held with the Trust, Length of Time Served and Term of Office1 | | Principal Occupation(s) During Past 5 Years | | Number of Portfolios in Fund Complex Overseen2 and Other Directorships Held During Past 5 Years | | Experience, Qualifications, Attributes, Skills for Board Membership |
| | | |
INDEPENDENT TRUSTEES continued | | | | | | |
| | | | |
Cynthia L. Walker (1956) | | Trustee Since 2005 Audit Committee Member | | Deputy Dean for Finance and Administration, Yale University School of Medicine; formerly, Executive Dean for Administration, Harvard Medical School | | 42 None | | Significant experience on the Board; executive experience in a variety of academic organizations (including roles as dean for finance and administration) |
| | | |
| INTERESTED TRUSTEES | | | | | | |
| | | | |
Robert J. Blanding3 (1947) 555 California Street San Francisco, CA 94104 | | Trustee and Chief Executive Officer Since 2002 | | President, Chairman, Director and Chief Executive Officer, Loomis, Sayles & Company, L.P. | | 42 None | | Significant experience on the Board; continuing service as President, Chairman, and Chief Executive Officer of Loomis, Sayles & Company, L.P. |
| | | | |
David L. Giunta4 (1965) | | Trustee Since 2011 President Since 2008 | | President and Chief Executive Officer, NGAM Distribution Corporation, NGAM Advisors, L.P. and NGAM Distribution, L.P. | | 42 None | | Experience on the Board; continuing experience as President and Chief Executive Officer of NGAM Advisors, L.P. |
103 |
Trustee and Officer Information
| | | | | | | | |
Name and Year of Birth | | Position(s) Held with the Trust, Length of Time Served and Term of Office1 | | Principal Occupation(s) During Past 5 Years | | Number of Portfolios in Fund Complex Overseen2 and Other Directorships Held During Past 5 Years | | Experience, Qualifications, Attributes, Skills for Board Membership |
| | | |
INTERESTED TRUSTEES continued | | | | | | |
| | | | |
John T. Hailer5 (1960) | | Trustee Since 2003 | | President and Chief Executive Officer – U.S. and Asia, Natixis Global Asset Management, L.P. | | 42 None | | Significant experience on the Board; continuing experience as President and Chief Executive Officer – U.S. and Asia, Natixis Global Asset Management, L.P. |
| 1 | Each trustee serves until retirement, resignation or removal from the Board. The current retirement age is 72. The position of Chairperson of the Board is appointed for a two-year term. Ms. Moose was appointed to serve an additional two-year term as the Chairperson of the Board on November 18, 2011. |
| 2 | The trustees of the Trust serve as trustees of a fund complex that includes all series of the Natixis Funds Trust I, Natixis Funds Trust II, Natixis Funds Trust IV and Gateway Trust (collectively, the “Natixis Funds Trusts”), Loomis Sayles Funds I and the Trust (collectively, the “Loomis Sayles Funds Trusts”), and Hansberger International Series (collectively, the “Fund Complex”). |
| 3 | Mr. Blanding is deemed an “interested person” of the Trust because he holds the following positions with an affiliated person of the Trust: President, Chairman, Director and Chief Executive Officer of Loomis, Sayles & Company, L.P. and Director of Loomis Sayles Investment Asia Pte., Ltd. |
| 4 | Mr. Giunta is deemed an “interested person” of the Trust because he holds the following positions with an affiliated person of the Trust: President and Chief Executive Officer of NGAM Distribution Corporation, NGAM Advisors, L.P. and NGAM Distribution, L.P. |
| 5 | Mr. Hailer is deemed an “interested person” of the Trust because he holds the following positions with an affiliated person of the Trust: President and Chief Executive Officer – U.S. and Asia, Natixis Global Asset Management, L.P. |
| 104
Trustee and Officer Information
| | | | | | |
Name and Year of Birth | | Position(s) Held with the Trust(s) | | Term of Office1 and Length of Time Served | | Principal Occupation(s) During Past 5 Years2 |
| | |
| OFFICERS OF THE TRUST | | | | |
| | | |
Coleen Downs Dinneen (1960) | | Secretary, Clerk and Chief Legal Officer | | Since September 2004 | | Executive Vice President, General Counsel, Secretary and Clerk, NGAM Distribution Corporation, NGAM Advisors, L.P. and NGAM Distribution, L.P. |
| | | |
Daniel J. Fuss (1933) One Financial Center Boston, MA 02111 | | Executive Vice President | | Since June 2003 | | Vice Chairman and Director, Loomis, Sayles & Company, L.P. |
| | | |
Russell L. Kane (1969) | | Chief Compliance Officer, Assistant Secretary and Anti-Money Laundering Officer | | Chief Compliance Officer since May 2006; Assistant Secretary since June 2004; and Anti-Money Laundering Officer since April 2007 | | Chief Compliance Officer for Mutual Funds, Senior Vice President, Deputy General Counsel, Assistant Secretary and Assistant Clerk, NGAM Distribution Corporation, NGAM Advisors, L.P. and NGAM Distribution, L.P. |
| | | |
Michael C. Kardok (1959) | | Treasurer, Principal Financial and Accounting Officer | | Since October 2004 | | Senior Vice President, NGAM Advisors, L.P. and NGAM Distribution, L.P. |
| 1 | Each officer of the Trust serves for an indefinite term in accordance with the Trust’s current by-laws until the date his or her successor is elected and qualified, or until he or she sooner dies, retires, is removed or becomes disqualified. |
| 2 | Each person listed above, except as noted, holds the same position(s) with the Fund Complex. Mr. Fuss is not an officer of the Natixis Funds Trusts or the Hansberger International Series. Previous positions during the past five years with NGAM Distribution, L.P., NGAM Advisors, L.P. or Loomis, Sayles & Company, L.P. are omitted, if not materially different from a trustee’s or officer’s current position with such entity. |
105 |

Loomis Sayles Small Cap Growth Fund
Loomis Sayles Small Cap Value Fund
Annual Report
September 30, 2013
LOOMIS SAYLES SMALL CAP GROWTH FUND
| | | | |
| Managers | | Symbols | | |
| Mark F. Burns, CFA | | Institutional Class | | LSSIX |
| John J. Slavik, CFA | | Retail Class | | LCGRX |
| | Class N | | LSSNX |
Objective
Long-term capital growth from investments in common stocks or other equity securities
Strategy
The fund normally will invest at least 80% of its net assets in equity securities of companies with market capitalizations that fall within the capitalization range of the Russell 2000® Index or is $3 billion or less at the time of investment. Unlike the Index, the fund may invest in companies of any size.
The fund may invest any portion of its assets in Canadian securities and up to 20% of assets in other foreign securities, including emerging markets securities.
Market Conditions
Despite rising interest rate concerns, conflict in Syria and disappointing economic growth, equity markets were strong during the 12-month period. Small-cap companies posted particularly robust results, generally outperforming their mid- and large-cap counterparts. As a result of the strong returns in the small cap universe, stock valuations have trended much higher.
Performance Results
For the 12 months ended September 30, 2013, Institutional Class shares of Loomis Sayles Small Cap Growth Fund returned 37.45%. The fund outperformed its benchmark, the Russell 2000® Growth Index, which returned 33.07%.
Explanation of Fund Performance
Almost all of the fund’s outperformance was due to stock selection, particularly in the financials, energy and healthcare sectors. The consumer staples and information technology sectors detracted slightly from performance.
A position in Financial Engines, a provider of investment advice to 401(k) plan participants using a quantitative model developed by Nobel Laureate Bill Sharpe, was the top contributor to fund performance. The company reported steadily increasing adoption rates during the year. In addition, Aegerion Pharmaceuticals, a biotech company focused on therapies for cardiovascular and metabolic diseases, was a top-performing stock. The company launched its cholesterol drug during the period, and patient usage continued to accelerate with low discontinuation rates. The drug’s price also increased, eliminating
1 |
tiered pricing. Another top contributor to performance was Wageworks, a leading on-demand provider of tax-advantaged programs for consumer-directed health, commuter and other employee spending account benefits in the United States. The company reported strong results, raised its organic growth target for the year and continued to execute strategic acquisitions that further augment growth. The Affordable Care Act, which has increased the role of consumer- and employee-driven benefits, also helped the stock’s performance.
An out-of-index position in Allot Communications, which designs and develops broadband service optimization solutions to help carriers track and bill usage, was the largest individual detractor from relative performance, lagging on near-term business trend concerns. Specifically, carriers have been hesitant to spend in the face of macroeconomic uncertainty. Given the customer concentration that comes with doing business in this industry, these spending hesitations quickly and significantly affected orders. This triggered our stop loss, and we sold the position. In addition, NuVasive, maker of a minimally invasive spine surgery device, detracted from performance. Due to weak procedure growth and pricing pressure, the company reported disappointing earnings and poor forward guidance. The market’s negative reaction triggered our stop loss, and we sold the position. A position in Nektar Therapeutics, a drug delivery technology company, also detracted from results. Mixed phase-three trial results for an important pipeline drug caused a selloff in the stock, which triggered our stop loss. We exited the position.
Outlook
We continue to estimate earnings growth in the mid single-digit range this year and next. While margin expansion from recessionary lows has largely played out, the evidence tends to support our view that margins should remain healthy in an environment of moderate but steady gross domestic product (GDP) growth. Dividends are expected to grow at a double-digit rate in 2013 and likely in 2014 as well. The potential for dividend growth and moderately higher equity prices could provide equity investors with two opportunities over time. While the Fed has refrained from tapering its monthly bond-buying purchases, known as quantitative easing (QE) for now, investors should prepare for an eventual return to a more normal interest rate environment with a federal funds rate above the zero lower bound. If yields normalize gradually, on the basis of improved economic growth with contained inflation, equity investors should be able to adjust to the changing environment and use periodic average corrections as opportunities to add to favored positions.
| 2
LOOMIS SAYLES SMALL CAP GROWTH FUND
Cumulative Performance — September 30, 2003 through September 30, 2013(b)(c)
Average Annual Total Returns — September 30, 2013(b)
| | | | | | | | | | | | | | | | | | |
| | | | | | |
| | | | | 1 year | | | 5 years | | | 10 years | | | Since Class N
Inception | |
| | | | | | |
| Institutional Class (Inception 12/31/96) | | | | | 37.45 | % | | | 15.05 | % | | | 11.86 | % | | | — | % |
| Retail Class (Inception 12/31/96) | | | | | 37.05 | | | | 14.73 | | | | 11.56 | | | | — | |
| Class N (Inception 2/1/13) | | | | | — | | | | — | | | | — | | | | 30.37 | |
| Comparative Performance | | | | | | | | | | | | | |
| Russell 2000® Growth Index(a) | | | | | 33.07 | | | | 13.17 | | | | 9.85 | | | | 23.08 | |
Past performance does not guarantee future results. The table(s) do not reflect taxes shareholders might owe on any fund distributions or when they redeem their shares. Performance for periods less than one year is cumulative, not annualized. Returns reflect changes in share price and reinvestment of dividends and capital gains, if any. Unlike a fund, an index is not managed and does not reflect fees and expenses.
NOTES TO CHARTS
| (a) | | See page 7 for a description of the index. |
| (b) | | Fund performance has been increased by fee waivers and/or expense reimbursements, if any, without which performance would have been lower. |
| (c) | | The mountain chart is based on the initial minimum of $100,000 for the Institutional Class. |
3 |
LOOMIS SAYLES SMALL CAP VALUE FUND
| | | | |
| Managers | | Symbols | | |
| Joseph R. Gatz, CFA | | Institutional Class | | LSSCX |
| Jeffrey Schwartz, CFA | | Retail Class | | LSCRX |
| | Admin Class | | LSVAX |
| | Class N | | LSCNX |
Objective
Long-term capital growth from investments in common stocks or other equity securities
Strategy
The fund normally will invest at least 80% of its net assets in equity securities of companies with market capitalizations that fall within the capitalization range of the Russell 2000® Index or is $3 billion or less at the time of investment. Unlike the Index, the fund may invest in companies of any size.
The fund may invest up to 20% of its assets in securities of foreign issuers, including emerging market securities.
Market Conditions
Large- and small-cap U.S. equities in the growth and value styles delivered strong returns for the 12-month period. Overall, small-cap stocks outpaced large-cap stocks, and growth styles measurably exceeded value. Economically sensitive sectors, including consumer discretionary, industrials and information technology, were the performance leaders in the small-cap universe. Slower-growing, high-dividend-yielding sectors and industries, including utilities and real estate investment trusts, generally lagged. Higher valuations and a return of equity fund inflows helped drive market returns higher. In addition, monetary policy remained accommodative, which encouraged investors to hold stocks and other riskier assets, as yields on U.S. Treasuries and other fixed-income securities remained low.
Performance Results
For the 12 months ended September 30, 2013, Institutional Class shares of Loomis Sayles Small Cap Value Fund returned 29.82%. The fund outperformed its benchmark, the Russell 2000® Value Index, which returned 27.04%.
Explanation of Fund Performance
Both sector allocation and stock selection were important drivers of performance. Sector allocation was positive, primarily due to an overweight position in the industrials sector, which was the benchmark’s second-best performing sector for the period. The fund also had underweight positions in financials and utilities, two of the weakest performing sectors in the index. Stock selection was also positive, with significant outperformance in the energy, utilities and financials sectors offsetting weaker results in consumer discretionary. The utilities sector posted a strong showing due to favorable stock selection in the gas and electric utilities industries and lack of exposure to the poor-performing independent power producers industry.
Within the industrials sector, which was the fund’s top-contributing sector, an emphasis on energy infrastructure-related investments contributed to results. Specifically, positions in Primoris, a provider of engineering and pipeline construction services; H&E Equipment
| 4
LOOMIS SAYLES SMALL CAP VALUE FUND
Services, a distributor of heavy construction and industrial equipment in the Gulf Coast region and DXP Enterprises, a distributor of industrial equipment and parts and service in the Gulf Coast region, aided performance. In addition, a position in Euronet Worldwide, a provider of electronic transaction processing solutions to financial institutions and mobile telephone operators, was the fund’s top contributor for the period. The company reported strong earnings growth throughout the 12 months, primarily due to solid growth in ATMs from European banks seeking outsourcing solutions, improved money transfer volumes and new electronic payment applications outside the core mobile telephone offering.
A position in EPL Oil & Gas, an independent oil and gas exploration and production company, also contributed to results. Recent acquisitions that led to higher oil production and expanded inventory reserves allowed the company to experience strong cash flow and earnings growth. The fund also benefited from owning shares of MarketAxess Holdings, a provider of electronic trading platforms for U.S. and international corporate bonds, which outperformed due to higher trading volumes associated with rising long-term interest rates. In addition, the company’s strategic alliance with BlackRock, an acquisition in Europe and opportunities in the high-yield, emerging markets and credit default swap businesses all improved the outlook and supported a higher valuation.
Consumer discretionary was the benchmark’s top-performing sector, but our stock selection did not keep pace with the benchmark’s strong sector return for the year. Laggards included several retailers, such as Genesco, which was an overweight relative to the index, and an out-of-index position in Sally Beauty, where sales trends moderated due to diminished consumer spending patterns. Outside the consumer discretionary sector, a position in Impax Labs, a developer of branded and generic pharmaceuticals, detracted from performance. Shares declined following an adverse FDA inspection of a manufacturing facility, and we eliminated the position. In addition, DFC Global, a provider of consumer loans and check cashing services in North America and Europe, weighed on results. Mounting regulatory pressures in the company’s U.K. payday lending business led to declining earnings and reduced forecasts. However, our experience with management’s ability to navigate through similar regulatory issues in the past led us to believe that DFC will recover and gain significant market share, as we expect the number of competitors to diminish materially. A position in Titan Machinery, an operator of agriculture and construction equipment dealerships and stores, detracted from results. The company reported disappointing earnings and below consensus guidance for the April and July fiscal quarters. With underlying trends in the agriculture equipment market deteriorating, we eliminated the position.
Outlook
We continue to estimate earnings growth in the mid single-digit range this year and next. While margin expansion from recessionary lows has largely played out, the evidence tends to support our view that margins should remain healthy in an environment of moderate but steady gross domestic product growth. Dividends are expected to grow at a double-digit rate in 2013 and likely in 2014 as well. The potential for dividend growth and moderately higher equity prices could provide equity investors with two opportunities over time. While the Fed has refrained from tapering its monthly bond-buying purchases, known as quantitative easing (QE) for now, investors should prepare for an eventual return to a more normal interest rate environment with a federal funds rate above the zero lower bound. If yields normalize gradually, on the basis of improved economic growth with contained inflation, equity investors should be able to adjust to the changing environment and use periodic average corrections as opportunities to add to favored positions.
5 |
Cumulative Performance — September 30, 2003 through September 30, 2013(b)(c)
Average Annual Total Returns — September 30, 2013(b)
| | | | | | | | | | | | | | | | | | |
| | | | | | |
| | | | | 1 year | | | 5 years | | | 10 years | | | Since Class N
Inception | |
| | | | | | |
| Institutional Class (Inception 5/13/91) | | | | | 29.82 | % | | | 11.87 | % | | | 10.97 | % | | | — | % |
| Retail Class (Inception 12/31/96) | | | | | 29.48 | | | | 11.59 | | | | 10.69 | | | | — | |
| Admin Class (Inception 1/2/98) | | | | | 29.17 | | | | 11.31 | | | | 10.41 | | | | — | |
| Class N (Inception 2/1/13) | | | | | — | | | | — | | | | — | | | | 16.71 | |
| | | | |
| Comparative Performance | | | | | | | | | | | | | |
| Russell 2000® Value Index(a) | | | | | 27.04 | | | | 9.13 | | | | 9.29 | | | | 14.96 | |
| Russell 2000® Index(a) | | | | | 30.06 | | | | 11.15 | | | | 9.64 | | | | 18.96 | |
Past performance does not guarantee future results. The table(s) do not reflect taxes shareholders might owe on any fund distributions or when they redeem their shares. Performance for periods less than one year is cumulative, not annualized. Returns reflect changes in share price and reinvestment of dividends and capital gains, if any. Unlike a fund, an index is not managed and does not reflect fees and expenses.
NOTES TO CHARTS
| (a) | | See page 7 for a description of the index. |
| (b) | | Fund performance has been increased by fee waivers and/or expense reimbursements, if any, without which performance would have been lower. |
| (c) | | The mountain chart is based on the initial minimum of $100,000 for the Institutional Class. |
| 6
ADDITIONAL INFORMATION
The views expressed in this report reflect those of the portfolio managers as of the dates indicated. The managers’ views are subject to change at any time without notice based on changes in market or other conditions. References to specific securities or industries should not be regarded as investment advice. Because the fund is actively managed, there is no assurance that it will continue to invest in the securities or industries mentioned.
Index Definitions
Indices are unmanaged and do not have expenses that affect results, unlike mutual funds. Index returns are adjusted for the reinvestment of capital gain distributions and income dividends. It is not possible to invest directly in an index.
Russell 2000® Index is an unmanaged index that measures the performance of the small-cap segment of the U.S. equity universe.
Russell 2000® Growth Index is an unmanaged index that measures the performance of the small-cap growth segment of the U.S. equity universe. It includes those Russell 2000 companies with higher price-to-book ratios and higher forecasted growth values.
Russell 2000® Value Index is an unmanaged index that measures the performance of the small-cap value segment of the U.S. equity universe. It includes those Russell 2000 companies with lower price-to-book ratios and lower forecasted growth values.
Additional Index Information
This document may contain references to third party copyrights, indexes, and trademarks, each of which is the property of its respective owner. Such owner is not affiliated with Natixis Global Asset Management or any of its related or affiliated companies (collectively “NGAM”) and does not sponsor, endorse or participate in the provision of any NGAM services, funds or other financial products.
The index information contained herein is derived from third parties and is provided on an “as is” basis. The user of this information assumes the entire risk of use of this information. Each of the third party entities involved in compiling, computing or creating index information disclaims all warranties (including, without limitation, any warranties of originality, accuracy, completeness, timeliness, non-infringement, merchantability and fitness for a particular purpose) with respect to such information.
Proxy Voting Information
A description of the funds’ proxy voting policies and procedures is available without charge, upon request, (i) by calling Loomis Sayles at 800-633-3330; (ii) on the funds’ website, www.loomissayles.com, and (iii) on the SEC’s website, www.sec.gov. Information about how the funds voted proxies relating to portfolio securities during the 12 months ended June 30, 2013 is available on (i) the funds’ website and (ii) the SEC’s website.
Quarterly Portfolio Schedules
The funds file a complete schedule of portfolio holdings with the SEC for the first and third quarters of each fiscal year on Form N-Q. The funds’ Forms N-Q are available on the SEC’s website at www.sec.gov and may be reviewed and copied at the SEC’s Public Reference Room in Washington, DC. Information on the operation of the Public Reference Room may be obtained by calling 800-SEC-0330.
7 |
UNDERSTANDING YOUR FUND’S EXPENSES
As a mutual fund shareholder you incur two types of costs: (1) transaction costs and (2) ongoing costs, including management fees, distribution and/or service fees (12b-1 fees), and other fund expenses. These costs are described in more detail in the funds’ prospectus. The following examples are intended to help you understand the ongoing costs of investing in the funds and help you compare these with the ongoing costs of investing in other mutual funds.
The first line in the table of each fund shows the actual amount of fund expenses you would have paid on a $1,000 investment in the fund from April 1, 2013 through September 30, 2013. It also shows how much a $1,000 investment would be worth at the close of the period, assuming actual fund returns and expenses. To estimate the expenses you paid over the period, simply divide your account value by $1,000 (for example $8,600 account value divided by $1,000 = 8.6) and multiply the result by the number in the Expenses Paid During Period column as shown below for your class.
The second line in the table of each fund provides information about hypothetical account values and hypothetical expenses based on the fund’s actual expense ratios and an assumed rate of return of 5% per year before expenses, which is not the fund’s actual return. The hypothetical account values and expenses may not be used to estimate the actual ending account balance or expenses you paid on your investment for the period. You may use this information to compare the ongoing costs of investing in the funds to other funds. To do so, compare this 5% hypothetical example with the 5% hypothetical examples that appear in the shareholder reports of other funds.
Please note that the expenses shown reflect ongoing costs only, and do not include any transaction costs. Therefore, the second line in the table is useful in comparing ongoing costs only, and will not help you determine the relative costs of owning different funds. If transaction costs were included, total costs would be higher.
| 8
Loomis Sayles Small Cap Growth Fund
| | | | | | | | | | | | |
Institutional Class | | Beginning
Account Value
4/1/2013 | | | Ending
Account Value
9/30/2013 | | | Expenses Paid
During Period*
4/1/2013 – 9/30/2013 | |
Actual | | | $1,000.00 | | | | $1,226.70 | | | | $5.14 | |
Hypothetical
(5% return before expenses) | | | $1,000.00 | | | | $1,020.46 | | | | $4.66 | |
| | | |
Retail Class | | | | | | | | | |
Actual | | | $1,000.00 | | | | $1,224.80 | | | | $6.97 | |
Hypothetical
(5% return before expenses) | | | $1,000.00 | | | | $1,018.80 | | | | $6.33 | |
| | | |
Class N | | | | | | | | | |
Actual | | | $1,000.00 | | | | $1,227.20 | | | | $4.63 | |
Hypothetical
(5% return before expenses) | | | $1,000.00 | | | | $1,020.91 | | | | $4.20 | |
* Expenses are equal to the Fund’s annualized expense ratio: 0.92%, 1.25% and 0.83% for Institutional Class, Retail Class and Class N, respectively, multiplied by the average account value over the period, multiplied by the number of days in the most recent fiscal half-year (183), divided by 365 (to reflect the half-year period). | |
Loomis Sayles Small Cap Value Fund
| | | | | | | | | | | | |
Institutional Class | | Beginning
Account Value
4/1/2013 | | | Ending
Account Value
9/30/2013 | | | Expenses Paid
During Period*
4/1/2013 – 9/30/2013 | |
Actual | | | $1,000.00 | | | | $1,112.00 | | | | $4.77 | |
Hypothetical
(5% return before expenses) | | | $1,000.00 | | �� | | $1,020.56 | | | | $4.56 | |
| | | |
Retail Class | | | | | | | | | |
Actual | | | $1,000.00 | | | | $1,110.70 | | | | $6.08 | |
Hypothetical
(5% return before expenses) | | | $1,000.00 | | | | $1,019.30 | | | | $5.82 | |
| | | |
Admin Class | | | | | | | | | |
Actual | | | $1,000.00 | | | | $1,109.30 | | | | $7.40 | |
Hypothetical
(5% return before expenses) | | | $1,000.00 | | | | $1,018.05 | | | | $7.08 | |
| | | |
Class N | | | | | | | | | |
Actual | | | $1,000.00 | | | | $1,112.30 | | | | $4.50 | |
Hypothetical
(5% return before expenses) | | | $1,000.00 | | | | $1,020.81 | | | | $4.31 | |
* Expenses are equal to the Fund’s annualized expense ratio (after waiver/reimbursement): 0.90%, 1.15%, 1.40% and 0.85% for Institutional Class, Retail Class, Admin Class and Class N, respectively, multiplied by the average account value over the period, multiplied by the number of days in the most recent fiscal half-year (183), divided by 365 (to reflect the half-year period). | |
9 |
BOARD APPROVAL OF THE EXISTING ADVISORY AGREEMENTS
The Board of Trustees of the Trusts (the “Board”), including the Independent Trustees, considers matters bearing on each Fund’s advisory agreement (collectively, the “Agreements”) at most of its meetings throughout the year. Each year, usually in the spring, the Contract Review and Governance Committee of the Board meets to review the Agreements to determine whether to recommend that the full Board approve the continuation of the Agreements, typically for an additional one-year period. After the Committee has made its recommendation, the full Board, including the Independent Trustees, determines whether to approve the continuation of the Agreements.
In connection with these meetings, the Trustees receive materials that the Funds’ investment adviser (the “Adviser”) believes to be reasonably necessary for the Trustees to evaluate the Agreements. These materials generally include, among other items, (i) information on the investment performance of the Funds and the performance of peer groups and categories of funds and the Funds’ performance benchmarks, (ii) information on the Funds’ advisory fees and other expenses, including information comparing the Funds’ expenses to the fees charged to institutional accounts with similar strategies managed by the Adviser, if any, and to those of peer groups of funds and information about applicable expense caps and fee “breakpoints,” (iii) sales and redemption data in respect of the Funds, (iv) information about the profitability of the Agreements to the Adviser and (v) information obtained through the completion by the Adviser of a questionnaire distributed on behalf of the Trustees. The Board, including the Independent Trustees, also consider other matters such as (i) the Adviser’s financial results and/or financial condition, (ii) each Fund’s investment objective and strategies and the size, education and experience of the Adviser’s investment staff and its use of technology, external research and trading cost measurement tools, (iii) arrangements in respect of the distribution of the Funds’ shares and the related costs, (iv) the procedures employed to determine the value of the Funds’ assets, (v) the allocation of the Funds’ brokerage, if any, including, if applicable, allocations to brokers affiliated with the Adviser and the use of “soft” commission dollars to pay Fund expenses and to pay for research and other similar services, (vi) the resources devoted to, and the record of compliance with, the Funds’ investment policies and restrictions, policies on personal securities transactions and other compliance policies, (vii) information about amounts invested by the Funds’ portfolio managers in the Funds or in similar accounts that they manage and (viii) the general economic outlook with particular emphasis on the mutual fund industry. Throughout the process, the Trustees are afforded the opportunity to ask questions of and request additional materials from the Adviser.
In addition to the materials requested by the Trustees in connection with their annual consideration of the continuation of the Agreements, the Trustees receive materials in advance of each regular quarterly meeting of the Board that provide detailed information about the Funds’ investment performance and the fees charged to the Funds for advisory and other services. This information generally includes, among other things, an internal performance rating for each Fund based on agreed-upon criteria, graphs showing each Fund’s performance and fee differentials against each Fund’s peer group/category,
| 10
performance ratings provided by a third-party, total return information for various periods, and third-party performance rankings for various periods comparing a Fund against similarly categorized funds. The portfolio management team for each Fund or other representatives of the Adviser make periodic presentations to the Contract Review and Governance Committee and/or the full Board, and Funds identified as presenting possible performance concerns may be subject to more frequent board presentations and reviews. In addition, each quarter the Trustees are provided with detailed statistical information about each Fund’s portfolio. The Trustees also receive periodic updates between meetings.
The Board most recently approved the continuation of the Agreements at their meeting held in June 2013. The Agreements were continued for a one-year period for the Funds. In considering whether to approve the continuation of the Agreements, the Board, including the Independent Trustees, did not identify any single factor as determinative. Individual Trustees may have evaluated the information presented differently from one another, giving different weights to various factors. Matters considered by the Trustees, including the Independent Trustees, in connection with their approval of the Agreements included, but were not limited to, the factors listed below.
The nature, extent and quality of the services provided to the Funds under the Agreements. The Trustees considered the nature, extent and quality of the services provided by the Adviser and its affiliates to the Funds and the resources dedicated to the Funds by the Adviser and its affiliates.
The Trustees considered not only the advisory services provided by the Adviser to the Funds, but also the administrative services provided by NGAM Advisors, L.P. (“NGAM Advisors”) and its affiliates to the Funds. For each Fund, the Trustees also considered the benefits to shareholders of investing in a mutual fund that is part of a family of funds that offers shareholders the right to exchange shares of one type of fund for shares of another type of fund, and provides a variety of fund and shareholder services.
After reviewing these and related factors, the Trustees concluded, within the context of their overall conclusions regarding each of the Agreements, that the nature, extent and quality of services provided supported the renewal of the Agreements.
Investment performance of the Funds and the Adviser. As noted above, the Trustees received information about the performance of the Funds over various time periods, including information that compared the performance of the Funds to the performance of peer groups and categories of funds and the Funds’ respective performance benchmarks. In addition, the Trustees also reviewed data prepared by an independent third party that analyzed the performance of the Funds using a variety of performance metrics, including metrics that also measured the performance of the Funds on a risk adjusted basis. With respect to each Fund, the Board concluded that the Fund’s performance or other relevant factors supported the renewal of the Agreement relating to that Fund. In the case of the Loomis Sayles Small Cap Growth Fund, the performance of which lagged that of a relevant peer group median and/or category median of funds for certain (although not necessarily all) periods, the Board concluded that other factors relevant to performance supported renewal of the relevant Agreement, including (1) that the underperformance
11 |
was attributable, to a significant extent, to investment decisions (such as security selection or sector allocation) by the Adviser that were reasonable and consistent with the Fund’s investment objective and policies; (2) that the Fund’s performance was stronger over the long term; and (3) that the Fund’s more recent performance, although lagging in certain periods, had recently shown improvement relative to its category and benchmark.
The Trustees also considered the Adviser’s performance and reputation generally, the performance of the fund family generally, and the historical responsiveness of the Adviser to Trustee concerns about performance and the willingness of the Adviser to take steps intended to improve performance.
After reviewing these and related factors, the Trustees concluded, within the context of their overall conclusions regarding each of the Agreements, that the performance of the Funds and the Adviser supported the renewal of the Agreements.
The costs of the services to be provided and profits to be realized by the Adviser and its affiliates from their respective relationships with the Funds. The Trustees considered the fees charged to the Funds for advisory services as well as the total expense levels of the Funds. This information included comparisons (provided both by management and also by an independent third party) of the Funds’ advisory fees and total expense levels to those of their peer groups and information about the advisory fees charged by the Adviser to comparable accounts (such as institutional separate accounts), as well as information about differences in such fees and the reasons for any such differences. In considering the fees charged to comparable accounts, the Trustees considered, among other things, management’s representations about the differences between managing mutual funds as compared to other types of accounts, including the additional resources required to effectively manage and the greater regulatory costs associated with the management of mutual fund assets. In evaluating each Fund’s advisory fee, the Trustees also took into account the demands, complexity and quality of the investment management of such Fund and the need for the Adviser to offer competitive compensation. The Trustees considered that over the past several years, management had made recommendations regarding reductions in advisory fee rates, implementation of advisory fee breakpoints and the institution of advisory fee waivers and expense caps for various funds in the fund family. They noted that both of the Funds in this report have expense caps in place, and they considered the amounts waived or reimbursed by the Adviser for the Loomis Sayles Small Cap Value Fund. The Loomis Sayles Small Cap Growth Fund’s current expenses are below the cap.
The Trustees also considered the compensation directly or indirectly received by the Adviser and its affiliates from their relationships with the Funds. The Trustees reviewed information provided by management as to the profitability of the Adviser and its affiliates’ relationships with the Funds, and information about the allocation of expenses used to calculate profitability. They also reviewed information provided by management about the effect of distribution costs and changes in asset levels on Adviser profitability, including information regarding resources spent on distribution activities. When reviewing profitability, the Trustees also considered information about court cases in which adviser compensation or profitability were issues, the performance of the relevant Funds, the
| 12
expense levels of the Funds, and whether the Adviser had implemented breakpoints and/or expense caps with respect to such Funds.
After reviewing these and related factors, the Trustees concluded, within the context of their overall conclusions regarding each of the Agreements, that the advisory fee charged to each of the Funds was fair and reasonable, and that the costs of these services generally and the related profitability of the Adviser and its affiliates in respect of their relationships with the Funds supported the renewal of the Agreements.
Economies of Scale. The Trustees considered the existence of any economies of scale in the provision of services by the Adviser and whether those economies are shared with the Funds through breakpoints in their investment advisory fees or other means, such as expense waivers or caps. The Trustees also discussed with management the factors considered with respect to the implementation of breakpoints in investment advisory fees or expense waivers or caps for certain funds. Management explained that a number of factors are taken into account in considering the implementation of breakpoints or an expense cap for a fund, including, among other things, factors such as a fund’s assets, the projected growth of a fund, projected profitability and a fund’s fees and performance. With respect to economies of scale, the Trustees noted that although neither Fund’s management fee was subject to breakpoints, each Fund’s management fee and each Fund’s overall net expense ratio was at or below the median for a peer group of funds and that each Fund was subject to an expense cap. In considering these issues, the Trustees also took note of the costs of the services provided (both on an absolute and a relative basis) and the profitability to the Adviser and its affiliates of their relationships with the Funds, as discussed above.
After reviewing these and related factors, the Trustees concluded, within the context of their overall conclusions regarding each of the Agreements, that the extent to which economies of scale were shared with the Funds supported the renewal of the Agreements.
The Trustees also considered other factors, which included but were not limited to the following:
| • | | the effect of recent market and economic events on the performance, asset levels and expense ratios of each Fund. |
| • | | whether each Fund has operated in accordance with its investment objective and the Fund’s record of compliance with its investment restrictions, and the compliance programs of the Funds and the Adviser. They also considered the compliance-related resources the Adviser and its affiliates were providing to the Funds. |
| • | | the nature, quality, cost and extent of administrative and shareholder services performed by the Adviser and its affiliates, both under the Agreements and under separate agreements covering administrative services. |
| • | | so-called “fallout benefits” to the Adviser, such as the engagement of affiliates of the Adviser to provide distribution, administrative and brokerage services to the Funds, and the benefits of research made available to the Adviser by reason of brokerage commissions (if any) generated by the Funds’ securities transactions. The Trustees also |
13 |
| | considered the fact that NGAM Advisors’ parent company benefits from the retention of an affiliated Adviser. The Trustees considered the possible conflicts of interest associated with these fallout and other benefits, and the reporting, disclosure and other processes in place to disclose and monitor such possible conflicts of interest. |
| • | | the Trustees’ review and discussion of the Funds’ advisory arrangements in prior years, and management’s record of responding to Trustee concerns raised during the year and in prior years. |
Based on their evaluation of all factors that they deemed to be material, including those factors described above, and assisted by the advice of independent counsel, the Trustees, including the Independent Trustees, concluded that each of the existing Agreements should be continued through June 30, 2014.
| 14
Portfolio of Investments – as of September 30, 2013
Loomis Sayles Small Cap Growth Fund
| | | | | | | | |
| Shares | | | Description | | Value (†) | |
|
| | Common Stocks – 95.6% of Net Assets | |
| | |
| | | | Aerospace & Defense – 2.1% | | | | |
| | 354,359 | | | Hexcel Corp.(b) | | $ | 13,749,129 | |
| | 140,813 | | | Triumph Group, Inc. | | | 9,887,889 | |
| | | | | | | | |
| | | | | | | 23,637,018 | |
| | | | | | | | |
| | | | Air Freight & Logistics – 1.0% | | | | |
| | 501,780 | | | XPO Logistics, Inc.(b) | | | 10,873,573 | |
| | | | | | | | |
| | | | Airlines – 1.0% | | | | |
| | 319,735 | | | Spirit Airlines, Inc.(b) | | | 10,957,318 | |
| | | | | | | | |
| | | | Auto Components – 1.0% | | | | |
| | 211,184 | | | Dorman Products, Inc. | | | 10,464,167 | |
| | 25,904 | | | Drew Industries, Inc. | | | 1,179,668 | |
| | | | | | | | |
| | | | | | | 11,643,835 | |
| | | | | | | | |
| | | | Biotechnology – 6.2% | | | | |
| | 72,079 | | | Aegerion Pharmaceuticals, Inc.(b) | | | 6,177,891 | |
| | 428,159 | | | Alkermes PLC(b) | | | 14,394,705 | |
| | 83,597 | | | Clovis Oncology, Inc.(b) | | | 5,081,026 | |
| | 196,970 | | | Cubist Pharmaceuticals, Inc.(b) | | | 12,517,443 | |
| | 426,434 | | | Emergent Biosolutions, Inc.(b) | | | 8,123,568 | |
| | 662,304 | | | Exact Sciences Corp.(b) | | | 7,821,810 | |
| | 269,988 | | | Myriad Genetics, Inc.(b) | | | 6,344,718 | |
| | 316,181 | | | NPS Pharmaceuticals, Inc.(b) | | | 10,057,718 | |
| | | | | | | | |
| | | | | | | 70,518,879 | |
| | | | | | | | |
| | | | Capital Markets – 2.0% | | | | |
| | 194,719 | | | Artisan Partners Asset Management, Inc. | | | 10,195,487 | |
| | 211,389 | | | Financial Engines, Inc. | | | 12,564,962 | |
| | | | | | | | |
| | | | | | | 22,760,449 | |
| | | | | | | | |
| | | | Chemicals – 1.2% | | | | |
| | 584,264 | | | Flotek Industries, Inc.(b) | | | 13,438,072 | |
| | | | | | | | |
| | | | Commercial Banks – 3.5% | | | | |
| | 232,351 | | | Bank of the Ozarks, Inc. | | | 11,150,524 | |
| | 691,641 | | | Boston Private Financial Holdings, Inc. | | | 7,677,215 | |
| | 113,909 | | | Signature Bank(b) | | | 10,424,952 | |
| | 114,994 | | | SVB Financial Group(b) | | | 9,932,032 | |
| | | | | | | | |
| | | | | | | 39,184,723 | |
| | | | | | | | |
| | | | Communications Equipment – 1.1% | | | | |
| | 511,876 | | | Ciena Corp.(b) | | | 12,786,663 | |
| | | | | | | | |
| | | | Construction & Engineering – 0.8% | | | | |
| | 297,345 | | | MasTec, Inc.(b) | | | 9,009,554 | |
| | | | | | | | |
| | | | Consumer Finance – 1.0% | | | | |
| | 246,412 | | | Encore Capital Group, Inc.(b) | | | 11,300,454 | |
| | | | | | | | |
See accompanying notes to financial statements.
15 |
Portfolio of Investments – as of September 30, 2013
Loomis Sayles Small Cap Growth Fund – continued
| | | | | | | | |
| Shares | | | Description | | Value (†) | |
|
| | Common Stocks – continued | |
| | |
| | | | Distributors – 0.8% | | | | |
| | 167,986 | | | Pool Corp. | | $ | 9,429,054 | |
| | | | | | | | |
| | | | Diversified Consumer Services – 3.6% | | | | |
| | 253,682 | | | Bright Horizons Family Solutions, Inc.(b) | | | 9,089,426 | |
| | 482,944 | | | Grand Canyon Education, Inc.(b) | | | 19,452,984 | |
| | 794,188 | | | LifeLock, Inc.(b) | | | 11,777,808 | |
| | | | | | | | |
| | | | | | | 40,320,218 | |
| | | | | | | | |
| | | | Diversified Financial Services – 1.1% | | | | |
| | 206,738 | | | MarketAxess Holdings, Inc. | | | 12,412,550 | |
| | | | | | | | |
| | | | Electrical Equipment – 1.6% | | | | |
| | 234,262 | | | Polypore International, Inc.(b) | | | 9,597,714 | |
| | 348,032 | | | Thermon Group Holdings, Inc.(b) | | | 8,043,020 | |
| | | | | | | | |
| | | | | | | 17,640,734 | |
| | | | | | | | |
| | | | Electronic Equipment, Instruments & Components – 2.8% | | | | |
| | 137,284 | | | FEI Co. | | | 12,053,535 | |
| | 146,825 | | | IPG Photonics Corp. | | | 8,267,716 | |
| | 211,443 | | | Measurement Specialties, Inc.(b) | | | 11,468,668 | |
| | | | | | | | |
| | | | | | | 31,789,919 | |
| | | | | | | | |
| | | | Energy Equipment & Services – 2.9% | | | | |
| | 104,823 | | | Dril-Quip, Inc.(b) | | | 12,028,439 | |
| | 348,155 | | | Forum Energy Technologies, Inc.(b) | | | 9,403,667 | |
| | 461,624 | | | Helix Energy Solutions Group, Inc.(b) | | | 11,711,401 | |
| | | | | | | | |
| | | | | | | 33,143,507 | |
| | | | | | | | |
| | | | Food & Staples Retailing – 1.0% | | | | |
| | 206,335 | | | Susser Holdings Corp.(b) | | | 10,966,705 | |
| | | | | | | | |
| | | | Health Care Equipment & Supplies – 6.6% | | | | |
| | 216,984 | | | Abaxis, Inc. | | | 9,135,026 | |
| | 108,148 | | | Analogic Corp. | | | 8,937,351 | |
| | 532,804 | | | Endologix, Inc.(b) | | | 8,594,129 | |
| | 299,992 | | | Insulet Corp.(b) | | | 10,871,710 | |
| | 208,728 | | | MAKO Surgical Corp.(b) | | | 6,159,563 | |
| | 450,018 | | | Novadaq Technologies, Inc.(b) | | | 7,461,298 | |
| | 310,496 | | | Quidel Corp.(b) | | | 8,818,086 | |
| | 557,988 | | | Spectranetics Corp.(b) | | | 9,363,039 | |
| | 284,387 | | | Tornier NV(b) | | | 5,497,201 | |
| | | | | | | | |
| | | | | | | 74,837,403 | |
| | | | | | | | |
| | | | Health Care Providers & Services – 1.9% | | | | |
| | 285,641 | | | Acadia Healthcare Co., Inc.(b) | | | 11,262,825 | |
| | 258,831 | | | Team Health Holdings, Inc.(b) | | | 9,820,048 | |
| | | | | | | | |
| | | | | | | 21,082,873 | |
| | | | | | | | |
See accompanying notes to financial statements.
| 16
Portfolio of Investments – as of September 30, 2013
Loomis Sayles Small Cap Growth Fund – continued
| | | | | | | | |
| Shares | | | Description | | Value (†) | |
|
| | Common Stocks – continued | |
| | |
| | | | Health Care Technology – 2.1% | | | | |
| | 569,483 | | | MedAssets, Inc.(b) | | $ | 14,476,258 | |
| | 91,462 | | | Medidata Solutions, Inc.(b) | | | 9,048,336 | |
| | | | | | | | |
| | | | | | | 23,524,594 | |
| | | | | | | | |
| | | | Hotels, Restaurants & Leisure – 2.8% | | | | |
| | 249,776 | | | AFC Enterprises, Inc.(b) | | | 10,887,736 | |
| | 393,067 | | | Texas Roadhouse, Inc. | | | 10,329,801 | |
| | 153,465 | | | Vail Resorts, Inc. | | | 10,647,401 | |
| | | | | | | | |
| | | | | | | 31,864,938 | |
| | | | | | | | |
| | | | Insurance – 1.1% | | | | |
| | 304,536 | | | Amtrust Financial Services, Inc. | | | 11,895,176 | |
| | | | | | | | |
| | | | Internet & Catalog Retail – 1.0% | | | | |
| | 385,897 | | | HomeAway, Inc.(b) | | | 10,805,116 | |
| | | | | | | | |
| | | | Internet Software & Services – 6.8% | | | | |
| | 293,762 | | | Angie’s List, Inc.(b) | | | 6,609,645 | |
| | 49,225 | | | Benefitfocus, Inc.(b) | | | 2,419,901 | |
| | 183,189 | | | Cornerstone OnDemand, Inc.(b) | | | 9,423,242 | |
| | 79,066 | | | CoStar Group, Inc.(b) | | | 13,275,181 | |
| | 416,913 | | | Dealertrack Technologies, Inc.(b) | | | 17,860,553 | |
| | 235,972 | | | Envestnet, Inc.(b) | | | 7,315,132 | |
| | 140,478 | | | OpenTable, Inc.(b) | | | 9,830,651 | |
| | 37,722 | | | Shutterstock, Inc.(b) | | | 2,743,144 | |
| | 169,802 | | | Trulia, Inc.(b) | | | 7,985,788 | |
| | | | | | | | |
| | | | | | | 77,463,237 | |
| | | | | | | | |
| | | | IT Services – 1.6% | | | | |
| | 239,141 | | | EPAM Systems, Inc.(b) | | | 8,250,365 | |
| | 449,052 | | | InterXion Holding NV(b) | | | 9,986,916 | |
| | | | | | | | |
| | | | | | | 18,237,281 | |
| | | | | | | | |
| | | | Life Sciences Tools & Services – 0.9% | | | | |
| | 203,908 | | | PAREXEL International Corp.(b) | | | 10,242,299 | |
| | | | | | | | |
| | | | Machinery – 5.1% | | | | |
| | 117,964 | | | Chart Industries, Inc.(b) | | | 14,514,290 | |
| | 510,126 | | | Manitowoc Co., Inc. (The) | | | 9,988,267 | |
| | 51,354 | | | Middleby Corp. (The)(b) | | | 10,728,364 | |
| | 146,399 | | | Proto Labs, Inc.(b) | | | 11,183,420 | |
| | 177,685 | | | RBC Bearings, Inc.(b) | | | 11,707,665 | |
| | | | | | | | |
| | | | | | | 58,122,006 | |
| | | | | | | | |
| | | | Oil, Gas & Consumable Fuels – 3.9% | | | | |
| | 191,103 | | | Diamondback Energy, Inc.(b) | | | 8,148,632 | |
| | 195,546 | | | Gulfport Energy Corp.(b) | | | 12,581,430 | |
| | 260,889 | | | Oasis Petroleum, Inc.(b) | | | 12,817,477 | |
See accompanying notes to financial statements.
17 |
Portfolio of Investments – as of September 30, 2013
Loomis Sayles Small Cap Growth Fund – continued
| | | | | | | | |
| Shares | | | Description | | Value (†) | |
|
| | Common Stocks – continued | |
| | |
| | | | Oil, Gas & Consumable Fuels – continued | | | | |
| | 201,014 | | | Rosetta Resources, Inc.(b) | | $ | 10,947,222 | |
| | | | | | | | |
| | | | | | | 44,494,761 | |
| | | | | | | | |
| | | | Pharmaceuticals – 0.8% | | | | |
| | 198,304 | | | Pacira Pharmaceuticals, Inc.(b) | | | 9,536,439 | |
| | | | | | | | |
| | | | Professional Services – 6.3% | | | | |
| | 272,576 | | | Advisory Board Co. (The)(b) | | | 16,212,821 | |
| | 224,374 | | | Corporate Executive Board Co. (The) | | | 16,294,040 | |
| | 211,986 | | | Huron Consulting Group, Inc.(b) | | | 11,152,583 | |
| | 330,052 | | | On Assignment, Inc.(b) | | | 10,891,716 | |
| | 332,889 | | | WageWorks, Inc.(b) | | | 16,794,250 | |
| | | | | | | | |
| | | | | | | 71,345,410 | |
| | | | | | | | |
| | | | Road & Rail – 1.2% | | | | |
| | 151,826 | | | Genesee & Wyoming, Inc., Class A(b) | | | 14,115,263 | |
| | | | | | | | |
| | | | Semiconductors & Semiconductor Equipment – 3.9% | | | | |
| | 235,983 | | | Cavium, Inc.(b) | | | 9,722,500 | |
| | 183,700 | | | Hittite Microwave Corp.(b) | | | 12,004,795 | |
| | 286,362 | | | Semtech Corp.(b) | | | 8,587,996 | |
| | 229,711 | | | Silicon Laboratories, Inc.(b) | | | 9,810,957 | |
| | 149,294 | | | Ultratech, Inc.(b) | | | 4,523,608 | |
| | | | | | | | |
| | | | | | | 44,649,856 | |
| | | | | | | | |
| | | | Software – 7.4% | | | | |
| | 373,411 | | | Aspen Technology, Inc.(b) | | | 12,901,350 | |
| | 131,939 | | | CommVault Systems, Inc.(b) | | | 11,588,203 | |
| | 203,305 | | | FleetMatics Group PLC(b) | | | 7,634,103 | |
| | 322,274 | | | Guidewire Software, Inc.(b) | | | 15,182,328 | |
| | 234,301 | | | Imperva, Inc.(b) | | | 9,845,328 | |
| | 350,671 | | | QLIK Technologies, Inc.(b) | | | 12,006,975 | |
| | 102,568 | | | Ultimate Software Group, Inc. (The)(b) | | | 15,118,523 | |
| | | | | | | | |
| | | | | | | 84,276,810 | |
| | | | | | | | |
| | | | Specialty Retail – 5.2% | | | | |
| | 208,633 | | | Asbury Automotive Group, Inc.(b) | | | 11,099,276 | |
| | 136,601 | | | Cabela’s, Inc.(b) | | | 8,609,961 | |
| | 465,065 | | | Chico’s FAS, Inc. | | | 7,747,983 | |
| | 183,768 | | | Hibbett Sports, Inc.(b) | | | 10,318,573 | |
| | 76,302 | | | Lumber Liquidators Holdings, Inc.(b) | | | 8,137,608 | |
| | 442,140 | | | Tile Shop Holdings, Inc.(b) | | | 13,038,709 | |
| | | | | | | | |
| | | | | | | 58,952,110 | |
| | | | | | | | |
| | | | Textiles, Apparel & Luxury Goods – 2.3% | | | | |
| | 88,363 | | | Deckers Outdoor Corp.(b) | | | 5,824,889 | |
| | 175,007 | | | Oxford Industries, Inc. | | | 11,896,976 | |
See accompanying notes to financial statements.
| 18
Portfolio of Investments – as of September 30, 2013
Loomis Sayles Small Cap Growth Fund – continued
| | | | | | | | |
| Shares | | | Description | | Value (†) | |
|
| | Common Stocks – continued | |
| | |
| | | | Textiles, Apparel & Luxury Goods – continued | | | | |
| | 432,171 | | | Tumi Holdings, Inc.(b) | | $ | 8,708,245 | |
| | | | | | | | |
| | | | | | | 26,430,110 | |
| | | | | | | | |
| | | | Total Common Stocks
(Identified Cost $763,703,479) | | | 1,083,688,907 | |
| | | | | | | | |
| | |
| Principal
Amount |
| | | | | | |
|
| | Short-Term Investments – 5.3% | |
| $ | 59,677,799 | | | Tri-Party Repurchase Agreement with Fixed Income Clearing Corporation, dated 9/30/2013 at 0.000% to be repurchased at $59,677,799 on 10/01/2013 collateralized by $59,390,000 U.S. Treasury Note, 2.625% due 7/31/2014 valued at $60,874,750 including accrued interest (Note 2 of Notes to Financial Statements) (Identified Cost $59,677,799) | | | 59,677,799 | |
| | | | | | | | |
| | | | Total Investments – 100.9%
(Identified Cost $823,381,278)(a) | | | 1,143,366,706 | |
| | | | Other Assets Less Liabilities—(0.9)% | | | (10,062,941 | ) |
| | | | | | | | |
| | | | Net Assets – 100.0% | | $ | 1,133,303,765 | |
| | | | | | | | |
| | (†) | | | See Note 2 of Notes to Financial Statements. | | | | |
| | (a) | | | Federal Tax Information: | | | | |
| | | | At September 30, 2013, the net unrealized appreciation on investments based on a cost of $823,526,294 for federal income tax purposes was as follows: | |
| | | | Aggregate gross unrealized appreciation for all investments in which there is an excess of value over tax cost | | $ | 324,898,686 | |
| | | | Aggregate gross unrealized depreciation for all investments in which there is an excess of tax cost over value | | | (5,058,274 | ) |
| | | | | | | | |
| | | | Net unrealized appreciation | | $ | 319,840,412 | |
| | | | | | | | |
| | (b) | | | Non-income producing security. | | | | |
See accompanying notes to financial statements.
19 |
Portfolio of Investments – as of September 30, 2013
Loomis Sayles Small Cap Growth Fund – continued
Industry Summary at September 30, 2013 (Unaudited)
| | | | |
Software | | | 7.4 | % |
Internet Software & Services | | | 6.8 | |
Health Care Equipment & Supplies | | | 6.6 | |
Professional Services | | | 6.3 | |
Biotechnology | | | 6.2 | |
Specialty Retail | | | 5.2 | |
Machinery | | | 5.1 | |
Semiconductors & Semiconductor Equipment | | | 3.9 | |
Oil, Gas & Consumable Fuels | | | 3.9 | |
Diversified Consumer Services | | | 3.6 | |
Commercial Banks | | | 3.5 | |
Energy Equipment & Services | | | 2.9 | |
Hotels, Restaurants & Leisure | | | 2.8 | |
Electronic Equipment, Instruments & Components | | | 2.8 | |
Textiles, Apparel & Luxury Goods | | | 2.3 | |
Aerospace & Defense | | | 2.1 | |
Health Care Technology | | | 2.1 | |
Capital Markets | | | 2.0 | |
Other Investments, less than 2% each | | | 20.1 | |
Short-Term Investments | | | 5.3 | |
| | | | |
Total Investments | | | 100.9 | |
Other assets less liabilities | | | (0.9 | ) |
| | | | |
Net Assets | | | 100.0 | % |
| | | | |
See accompanying notes to financial statements.
| 20
Portfolio of Investments – as of September 30, 2013
Loomis Sayles Small Cap Value Fund
| | | | | | | | |
| Shares | | | Description | | Value (†) | |
|
| | Common Stocks – 95.6% of Net Assets | |
| | |
| | | | Auto Components – 1.7% | | | | |
| | 472,300 | | | Dana Holding Corp. | | $ | 10,787,332 | |
| | 204,378 | | | Remy International, Inc. | | | 4,136,611 | |
| | 123,821 | | | Tenneco, Inc.(b) | | | 6,252,960 | |
| | | | | | | | |
| | | | | | | 21,176,903 | |
| | | | | | | | |
| | | | Building Products – 0.7% | | | | |
| | 146,078 | | | Armstrong World Industries, Inc.(b) | | | 8,028,447 | |
| | | | | | | | |
| | | | Capital Markets – 1.2% | | | | |
| | 313,442 | | | Safeguard Scientifics, Inc.(b) | | | 4,917,905 | |
| | 238,176 | | | Stifel Financial Corp.(b) | | | 9,817,615 | |
| | | | | | | | |
| | | | | | | 14,735,520 | |
| | | | | | | | |
| | | | Chemicals – 3.1% | | | | |
| | 235,502 | | | Cabot Corp. | | | 10,058,290 | |
| | 113,012 | | | Minerals Technologies, Inc. | | | 5,579,402 | |
| | 256,669 | | | Olin Corp. | | | 5,921,354 | |
| | 331,159 | | | Tronox Ltd., Class A | | | 8,103,461 | |
| | 56,578 | | | WR Grace & Co.(b) | | | 4,944,917 | |
| | 182,083 | | | Zep, Inc. | | | 2,960,670 | |
| | | | | | | | |
| | | | | | | 37,568,094 | |
| | | | | | | | |
| | | | Commercial Banks – 11.3% | | | | |
| | 587,102 | | | BancorpSouth, Inc. | | | 11,706,814 | |
| | 618,248 | | | Cathay General Bancorp | | | 14,448,456 | |
| | 159,134 | | | City National Corp. | | | 10,607,872 | |
| | 495,700 | | | CVB Financial Corp. | | | 6,701,864 | |
| | 482,130 | | | First Financial Bancorp | | | 7,313,912 | |
| | 138,673 | | | First Financial Bankshares, Inc. | | | 8,156,746 | |
| | 160,056 | | | IBERIABANK Corp. | | | 8,302,105 | |
| | 268,620 | | | PacWest Bancorp | | | 9,229,783 | |
| | 249,560 | | | Pinnacle Financial Partners, Inc.(b) | | | 7,439,384 | |
| | 226,020 | | | Popular, Inc.(b) | | | 5,928,505 | |
| | 183,036 | | | Prosperity Bancshares, Inc. | | | 11,318,946 | |
| | 133,352 | | | Signature Bank(b) | | | 12,204,375 | |
| | 163,937 | | | Texas Capital Bancshares, Inc.(b) | | | 7,536,184 | |
| | 426,402 | | | Tristate Capital Holdings, Inc.(b) | | | 5,496,322 | |
| | 264,608 | | | Wintrust Financial Corp. | | | 10,867,450 | |
| | | | | | | | |
| | | | | | | 137,258,718 | |
| | | | | | | | |
| | | | Commercial Services & Supplies – 4.3% | | | | |
| | 683,448 | | | ACCO Brands Corp.(b) | | | 4,538,095 | |
| | 452,349 | | | KAR Auction Services, Inc. | | | 12,760,765 | |
| | 144,766 | | | McGrath Rentcorp | | | 5,168,146 | |
| | 241,139 | | | Performant Financial Corp.(b) | | | 2,633,238 | |
| | 292,380 | | | Rollins, Inc. | | | 7,750,994 | |
| | 174,790 | | | Viad Corp. | | | 4,361,010 | |
See accompanying notes to financial statements.
21 |
Portfolio of Investments – as of September 30, 2013
Loomis Sayles Small Cap Value Fund – continued
| | | | | | | | |
| Shares | | | Description | | Value (†) | |
|
| | Common Stocks – continued | |
| | |
| | | | Commercial Services & Supplies – continued | | | | |
| | 182,077 | | | Waste Connections, Inc. | | $ | 8,268,117 | |
| | 309,847 | | | West Corp. | | | 6,869,308 | |
| | | | | | | | |
| | | | | | | 52,349,673 | |
| | | | | | | | |
| | | | Communications Equipment – 0.8% | | | | |
| | 496,640 | | | Harmonic, Inc.(b) | | | 3,819,162 | |
| | 181,462 | | | NETGEAR, Inc.(b) | | | 5,599,917 | |
| | | | | | | | |
| | | | | | | 9,419,079 | |
| | | | | | | | |
| | | | Computers & Peripherals – 0.5% | | | | |
| | 526,686 | | | QLogic Corp.(b) | | | 5,761,945 | |
| | | | | | | | |
| | | | Construction & Engineering – 1.3% | | | | |
| | 318,096 | | | MYR Group, Inc.(b) | | | 7,729,733 | |
| | 327,074 | | | Primoris Services Corp. | | | 8,330,574 | |
| | | | | | | | |
| | | | | | | 16,060,307 | |
| | | | | | | | |
| | | | Consumer Finance – 0.9% | | | | |
| | 45,299 | | | Credit Acceptance Corp.(b) | | | 5,019,582 | |
| | 503,699 | | | DFC Global Corp.(b) | | | 5,535,652 | |
| | | | | | | | |
| | | | | | | 10,555,234 | |
| | | | | | | | |
| | | | Distributors – 0.5% | | | | |
| | 89,097 | | | Core-Mark Holding Co., Inc. | | | 5,919,605 | |
| | | | | | | | |
| | | | Diversified Financial Services – 1.1% | | | | |
| | 222,094 | | | MarketAxess Holdings, Inc. | | | 13,334,524 | |
| | | | | | | | |
| | | | Electric Utilities – 2.4% | | | | |
| | 273,388 | | | ALLETE, Inc. | | | 13,204,640 | |
| | 60,113 | | | ITC Holdings Corp. | | | 5,642,206 | |
| | 261,847 | | | UIL Holdings Corp. | | | 9,735,472 | |
| | | | | | | | |
| | | | | | | 28,582,318 | |
| | | | | | | | |
| | | | Electrical Equipment – 2.5% | | | | |
| | 250,413 | | | AZZ, Inc. | | | 10,482,288 | |
| | 146,460 | | | EnerSys | | | 8,879,870 | |
| | 258,156 | | | General Cable Corp. | | | 8,196,453 | |
| | 148,139 | | | Global Power Equipment Group, Inc. | | | 2,979,075 | |
| | | | | | | | |
| | | | | | | 30,537,686 | |
| | | | | | | | |
| | | | Electronic Equipment, Instruments & Components – 4.6% | | | | |
| | 181,646 | | | Belden, Inc. | | | 11,634,426 | |
| | 125,677 | | | Checkpoint Systems, Inc.(b) | | | 2,098,806 | |
| | 129,858 | | | Cognex Corp. | | | 4,072,347 | |
| | 153,412 | | | Littelfuse, Inc. | | | 11,999,887 | |
| | 262,595 | | | Methode Electronics, Inc. | | | 7,352,660 | |
| | 166,474 | | | Rogers Corp.(b) | | | 9,901,873 | |
See accompanying notes to financial statements.
| 22
Portfolio of Investments – as of September 30, 2013
Loomis Sayles Small Cap Value Fund – continued
| | | | | | | | |
| Shares | | | Description | | Value (†) | |
|
| | Common Stocks – continued | |
| | |
| | | | Electronic Equipment, Instruments & Components – continued | | | | |
| | 696,707 | | | Vishay Intertechnology, Inc.(b) | | $ | 8,980,553 | |
| | | | | | | | |
| | | | | | | 56,040,552 | |
| | | | | | | | |
| | | | Energy Equipment & Services – 2.5% | | | | |
| | 147,478 | | | Bristow Group, Inc. | | | 10,730,499 | |
| | 469,230 | | | Helix Energy Solutions Group, Inc.(b) | | | 11,904,365 | |
| | 1,447,550 | | | Parker Drilling Co.(b) | | | 8,251,035 | |
| | | | | | | | |
| | | | | | | 30,885,899 | |
| | | | | | | | |
| | | | Food & Staples Retailing – 1.1% | | | | |
| | 93,950 | | | Casey’s General Stores, Inc. | | | 6,905,325 | |
| | 312,584 | | | Spartan Stores, Inc. | | | 6,895,603 | |
| | | | | | | | |
| | | | | | | 13,800,928 | |
| | | | | | | | |
| | | | Food Products – 1.2% | | | | |
| | 260,206 | | | Darling International, Inc.(b) | | | 5,505,959 | |
| | 75,683 | | | Ingredion, Inc. | | | 5,007,944 | |
| | 52,080 | | | J & J Snack Foods Corp. | | | 4,203,898 | |
| | | | | | | | |
| | | | | | | 14,717,801 | |
| | | | | | | | |
| | | | Gas Utilities – 0.5% | | | | |
| | 71,432 | | | New Jersey Resources Corp. | | | 3,146,580 | |
| | 73,877 | | | UGI Corp. | | | 2,890,807 | |
| | | | | | | | |
| | | | | | | 6,037,387 | |
| | | | | | | | |
| | | | Health Care Equipment & Supplies – 1.0% | | | | |
| | 111,089 | | | SurModics, Inc.(b) | | | 2,641,697 | |
| | 112,062 | | | Teleflex, Inc. | | | 9,220,461 | |
| | | | | | | | |
| | | | | | | 11,862,158 | |
| | | | | | | | |
| | | | Health Care Providers & Services – 2.5% | | | | |
| | 303,234 | | | Bio-Reference Labs, Inc.(b) | | | 9,060,632 | |
| | 157,482 | | | Hanger Orthopedic Group, Inc.(b) | | | 5,316,592 | |
| | 69,094 | | | MEDNAX, Inc.(b) | | | 6,937,038 | |
| | 136,766 | | | WellCare Health Plans, Inc.(b) | | | 9,538,061 | |
| | | | | | | | |
| | | | | | | 30,852,323 | |
| | | | | | | | |
| | | | Health Care Technology – 0.8% | | | | |
| | 379,203 | | | MedAssets, Inc.(b) | | | 9,639,340 | |
| | | | | | | | |
| | | | Hotels, Restaurants & Leisure – 3.7% | | | | |
| | 139,446 | | | Churchill Downs, Inc. | | | 12,064,868 | |
| | 58,331 | | | Cracker Barrel Old Country Store, Inc. | | | 6,022,093 | |
| | 482,098 | | | Diamond Resorts International, Inc.(b) | | | 9,068,263 | |
| | 233,793 | | | Marriott Vacations Worldwide Corp.(b) | | | 10,286,892 | |
| | 233,047 | | | Six Flags Entertainment Corp. | | | 7,874,658 | |
| | | | | | | | |
| | | | | | | 45,316,774 | |
| | | | | | | | |
See accompanying notes to financial statements.
23 |
Portfolio of Investments – as of September 30, 2013
Loomis Sayles Small Cap Value Fund – continued
| | | | | | | | |
| Shares | | | Description | | Value (†) | |
|
| | Common Stocks – continued | |
| | |
| | | | Household Durables – 1.3% | | | | |
| | 249,633 | | | Jarden Corp.(b) | | $ | 12,082,237 | |
| | 160,487 | | | La-Z-Boy, Inc. | | | 3,644,660 | |
| | | | | | | | |
| | | | | | | 15,726,897 | |
| | | | | | | | |
| | | | Industrial Conglomerates – 0.8% | | | | |
| | 314,611 | | | Raven Industries, Inc. | | | 10,290,926 | |
| | | | | | | | |
| | | | Insurance – 3.8% | | | | |
| | 446,540 | | | Employers Holdings, Inc. | | | 13,280,100 | |
| | 326,467 | | | HCC Insurance Holdings, Inc. | | | 14,305,784 | |
| | 216,618 | | | ProAssurance Corp. | | | 9,760,807 | |
| | 133,959 | | | Reinsurance Group of America, Inc., Class A | | | 8,973,913 | |
| | | | | | | | |
| | | | | | | 46,320,604 | |
| | | | | | | | |
| | | | Internet & Catalog Retail – 1.3% | | | | |
| | 153,101 | | | HSN, Inc. | | | 8,209,276 | |
| | 87,030 | | | Liberty Ventures, Series A(b) | | | 7,673,435 | |
| | | | | | | | |
| | | | | | | 15,882,711 | |
| | | | | | | | |
| | | | Internet Software & Services – 0.9% | | | | |
| | 341,227 | | | Perficient, Inc.(b) | | | 6,264,927 | |
| | 515,461 | | | United Online, Inc. | | | 4,113,379 | |
| | | | | | | | |
| | | | | | | 10,378,306 | |
| | | | | | | | |
| | | | IT Services – 2.9% | | | | |
| | 459,809 | | | Convergys Corp. | | | 8,621,419 | |
| | 354,406 | | | Euronet Worldwide, Inc.(b) | | | 14,105,359 | |
| | 142,959 | | | WEX, Inc.(b) | | | 12,544,652 | |
| | | | | | | | |
| | | | | | | 35,271,430 | |
| | | | | | | | |
| | | | Machinery – 5.6% | | | | |
| | 156,182 | | | Actuant Corp., Class A | | | 6,066,109 | |
| | 79,516 | | | Alamo Group, Inc. | | | 3,889,128 | |
| | 225,097 | | | Albany International Corp., Class A | | | 8,074,229 | |
| | 369,810 | | | Altra Holdings, Inc. | | | 9,951,587 | |
| | 254,862 | | | John Bean Technologies Corp. | | | 6,340,967 | |
| | 179,900 | | | RBC Bearings, Inc.(b) | | | 11,853,611 | |
| | 214,905 | | | TriMas Corp.(b) | | | 8,015,956 | |
| | 214,071 | | | Wabtec Corp. | | | 13,458,644 | |
| | | | | | | | |
| | | | | | | 67,650,231 | |
| | | | | | | | |
| | | | Marine – 0.9% | | | | |
| | 121,016 | | | Kirby Corp.(b) | | | 10,473,935 | |
| | | | | | | | |
| | | | Media – 2.8% | | | | |
| | 345,302 | | | Carmike Cinemas, Inc.(b) | | | 7,624,268 | |
| | 267,658 | | | E.W. Scripps Co. (The), Class A(b) | | | 4,911,524 | |
See accompanying notes to financial statements.
| 24
Portfolio of Investments – as of September 30, 2013
Loomis Sayles Small Cap Value Fund – continued
| | | | | | | | |
| Shares | | | Description | | Value (†) | |
|
| | Common Stocks – continued | |
| | |
| | | | Media – continued | | | | |
| | 186,322 | | | John Wiley & Sons, Inc., Class A | | $ | 8,885,696 | |
| | 360,616 | | | Live Nation Entertainment, Inc.(b) | | | 6,689,427 | |
| | 333,537 | | | National CineMedia, Inc. | | | 6,290,508 | |
| | | | | | | | |
| | | | | | | 34,401,423 | |
| | | | | | | | |
| | | | Metals & Mining – 2.2% | | | | |
| | 199,275 | | | Globe Specialty Metals, Inc. | | | 3,070,828 | |
| | 149,911 | | | Haynes International, Inc. | | | 6,795,465 | |
| | 459,624 | | | Horsehead Holding Corp.(b) | | | 5,726,915 | |
| | 40,984 | | | Reliance Steel & Aluminum Co. | | | 3,002,898 | |
| | 440,342 | | | SunCoke Energy, Inc.(b) | | | 7,485,814 | |
| | | | | | | | |
| | | | | | | 26,081,920 | |
| | | | | | | | |
| | | | Multi Utilities – 0.7% | | | | |
| | 184,776 | | | NorthWestern Corp. | | | 8,300,138 | |
| | | | | | | | |
| | | | Multiline Retail – 0.4% | | | | |
| | 293,168 | | | Fred’s, Inc. Class A | | | 4,588,079 | |
| | | | | | | | |
| | | | Oil, Gas & Consumable Fuels – 1.2% | | | | |
| | 389,935 | | | EPL Oil & Gas, Inc.(b) | | | 14,470,488 | |
| | | | | | | | |
| | | | Pharmaceuticals – 0.4% | | | | |
| | 122,062 | | | Mallinckrodt PLC(b) | | | 5,381,713 | |
| | | | | | | | |
| | | | REITs – Apartments – 1.9% | | | | |
| | 213,247 | | | American Campus Communities, Inc. | | | 7,282,385 | |
| | 124,279 | | | Home Properties, Inc. | | | 7,177,112 | |
| | 133,984 | | | Mid-America Apartment Communities, Inc. | | | 8,374,000 | |
| | | | | | | | |
| | | | | | | 22,833,497 | |
| | | | | | | | |
| | | | REITs – Diversified – 1.0% | | | | |
| | 224,639 | | | DuPont Fabros Technology, Inc. | | | 5,788,947 | |
| | 157,581 | | | Potlatch Corp. | | | 6,252,814 | |
| | | | | | | | |
| | | | | | | 12,041,761 | |
| | | | | | | | |
| | | | REITs – Healthcare – 0.8% | | | | |
| | 324,457 | | | Omega Healthcare Investors, Inc. | | | 9,691,531 | |
| | | | | | | | |
| | | | REITs – Hotels – 0.8% | | | | |
| | 1,629,443 | | | Hersha Hospitality Trust | | | 9,108,586 | |
| | | | | | | | |
| | | | REITs – Office Property – 0.8% | | | | |
| | 532,268 | | | BioMed Realty Trust, Inc. | | | 9,894,862 | |
| | | | | | | | |
| | | | REITs – Single Tenant – 0.5% | | | | |
| | 195,910 | | | National Retail Properties, Inc. | | | 6,233,856 | |
| | | | | | | | |
See accompanying notes to financial statements.
25 |
Portfolio of Investments – as of September 30, 2013
Loomis Sayles Small Cap Value Fund – continued
| | | | | | | | |
| Shares | | | Description | | Value (†) | |
|
| | Common Stocks – continued | |
| | |
| | | | REITs – Storage – 2.2% | | | | |
| | 701,228 | | | CubeSmart | | $ | 12,509,907 | |
| | 180,366 | | | Sovran Self Storage, Inc. | | | 13,650,099 | |
| | | | | | | | |
| | | | | | | 26,160,006 | |
| | | | | | | | |
| | | | Road & Rail – 2.2% | | | | |
| | 267,431 | | | Avis Budget Group, Inc.(b) | | | 7,710,036 | |
| | 62,675 | | | Genesee & Wyoming, Inc., Class A(b) | | | 5,826,895 | |
| | 293,871 | | | Old Dominion Freight Line, Inc.(b) | | | 13,515,127 | |
| | | | | | | | |
| | | | | | | 27,052,058 | |
| | | | | | | | |
| | | | Semiconductors & Semiconductor Equipment – 2.3% | | | | |
| | 352,473 | | | Magnachip Semiconductor Corp.(b) | | | 7,588,744 | |
| | 315,850 | | | Semtech Corp.(b) | | | 9,472,341 | |
| | 637,778 | | | Teradyne, Inc.(b) | | | 10,536,093 | |
| | | | | | | | |
| | | | | | | 27,597,178 | |
| | | | | | | | |
| | | | Software – 1.9% | | | | |
| | 234,935 | | | Monotype Imaging Holdings, Inc. | | | 6,733,237 | |
| | 234,725 | | | SS&C Technologies Holdings, Inc.(b) | | | 8,943,022 | |
| | 201,746 | | | Synchronoss Technologies, Inc.(b) | | | 7,678,453 | |
| | | | | | | | |
| | | | | | | 23,354,712 | |
| | | | | | | | |
| | | | Specialty Retail – 2.7% | | | | |
| | 282,867 | | | Barnes & Noble, Inc.(b) | | | 3,660,299 | |
| | 170,258 | | | Genesco, Inc.(b) | | | 11,165,520 | |
| | 49,036 | | | Jos. A. Bank Clothiers, Inc.(b) | | | 2,155,622 | |
| | 175,920 | | | Rent-A-Center, Inc. | | | 6,702,552 | |
| | 363,798 | | | Sally Beauty Holdings, Inc.(b) | | | 9,516,956 | |
| | | | | | | | |
| | | | | | | 33,200,949 | |
| | | | | | | | |
| | | | Thrifts & Mortgage Finance – 0.5% | | | | |
| | 485,003 | | | Capitol Federal Financial, Inc. | | | 6,028,587 | |
| | | | | | | | |
| | | | Trading Companies & Distributors – 1.6% | | | | |
| | 98,104 | | | DXP Enterprises, Inc.(b) | | | 7,747,273 | |
| | 156,263 | | | H&E Equipment Services, Inc.(b) | | | 4,150,345 | |
| | 267,058 | | | Rush Enterprises, Inc., Class A(b) | | | 7,079,708 | |
| | | | | | | | |
| | | | | | | 18,977,326 | |
| | | | | | | | |
| | | | Transportation Infrastructure – 0.7% | | | | |
| | 147,211 | | | Macquarie Infrastructure Co. LLC | | | 7,881,677 | |
| | | | | | | | |
| | | | Water Utilities – 0.3% | | | | |
| | 150,135 | | | Middlesex Water Co. | | | 3,211,388 | |
| | | | | | | | |
| | | | Total Common Stocks
(Identified Cost $756,315,294) | | | 1,158,927,990 | |
| | | | | | | | |
See accompanying notes to financial statements.
| 26
Portfolio of Investments – as of September 30, 2013
Loomis Sayles Small Cap Value Fund – continued
| | | | | | | | |
| Shares | | | Description | | Value (†) | |
| |
| | Closed End Investment Companies – 2.1% | | | | |
| | 468,764 | | | Ares Capital Corp. | | $ | 8,104,929 | |
| | 899,272 | | | Fifth Street Finance Corp. | | | 9,253,509 | |
| | 475,547 | | | Hercules Technology Growth Capital, Inc. | | | 7,252,092 | |
| | | | | | | | |
| | | | Total Closed End Investment Companies
(Identified Cost $22,036,891) | | | 24,610,530 | |
| | | | | | | | |
| |
| | Warrants – 0.0% | | | | |
| | 67,892 | | | Magnum Hunter Resources Corp., Expiration on 10/14/2013 at $10.50(b)(c)(d)
(Identified Cost $0) | | | — | |
| | | | | | | | |
| | |
| Principal
Amount |
| | | | | | |
|
| | Short-Term Investments – 2.2% | |
| $ | 26,590,292 | | | Tri-Party Repurchase Agreement with Fixed Income Clearing Corporation, dated 9/30/2013 at 0.000% to be repurchased at $26,590,292 on 10/01/2013 collateralized by $27,540,000 U.S. Treasury Note, 0.625% due 8/31/2017 valued at $27,126,900 including accrued interest (Note 2 of Notes to Financial Statements) (Identified Cost $26,590,292) | | | 26,590,292 | |
| | | | | | | | |
| | | | Total Investments – 99.9%
(Identified Cost $804,942,477)(a) | | | 1,210,128,812 | |
| | | | Other assets less liabilities – 0.1% | | | 1,752,314 | |
| | | | | | | | |
| | | | Net Assets – 100.0% | | $ | 1,211,881,126 | |
| | | | | | | | |
| | (†) | | | See Note 2 of Notes to Financial Statements. | |
| | (a) | | | Federal Tax Information: | |
| | | | At September 30, 2013, the net unrealized appreciation on investments based on a cost of $804,927,604 for federal income tax purposes was as follows: | |
| | | | Aggregate gross unrealized appreciation for all investments in which there is an excess of value over tax cost | | $ | 416,234,871 | |
| | | | Aggregate gross unrealized depreciation for all investments in which there is an excess of tax cost over value | | | (11,033,663 | ) |
| | | | | | | | |
| | | | Net unrealized appreciation | | $ | 405,201,208 | |
| | | | | | | | |
| | (b) | | | Non-income producing security. | |
| | (c) | | | Fair valued by the Fund’s investment adviser. | |
| | (d) | | | Illiquid security. | |
| | | | | |
| | REITs | | | Real Estate Investment Trusts | |
See accompanying notes to financial statements.
27 |
Portfolio of Investments – as of September 30, 2013
Loomis Sayles Small Cap Value Fund – continued
Industry Summary at September 30, 2013 (Unaudited)
| | | | |
Commercial Banks | | | 11.3 | % |
Machinery | | | 5.6 | |
Electronic Equipment, Instruments & Components | | | 4.6 | |
Commercial Services & Supplies | | | 4.3 | |
Insurance | | | 3.8 | |
Hotels, Restaurants & Leisure | | | 3.7 | |
Chemicals | | | 3.1 | |
IT Services | | | 2.9 | |
Media | | | 2.8 | |
Specialty Retail | | | 2.7 | |
Energy Equipment & Services | | | 2.5 | |
Health Care Providers & Services | | | 2.5 | |
Electrical Equipment | | | 2.5 | |
Electric Utilities | | | 2.4 | |
Semiconductors & Semiconductor Equipment | | | 2.3 | |
Road & Rail | | | 2.2 | |
REITs – Storage | | | 2.2 | |
Metals & Mining | | | 2.2 | |
Closed End Investment Companies | | | 2.1 | |
Other Investments, less than 2% each | | | 32.0 | |
Short-Term Investments | | | 2.2 | |
| | | | |
Total Investments | | | 99.9 | |
Other assets less liabilities | | | 0.1 | |
| | | | |
Net Assets | | | 100.0 | % |
| | | | |
See accompanying notes to financial statements.
| 28
Statements of Assets and Liabilities
September 30, 2013
| | | | | | | | |
| | | Small Cap
Growth Fund | | | Small Cap Value Fund | |
ASSETS | | | | | | | | |
Investments at cost | | $ | 823,381,278 | | | $ | 804,942,477 | |
Net unrealized appreciation | | | 319,985,428 | | | | 405,186,335 | |
| | | | | | | | |
Investments at value | | | 1,143,366,706 | | | | 1,210,128,812 | |
Cash | | | — | | | | 264,281 | |
Receivable for Fund shares sold | | | 5,248,378 | | | | 731,263 | |
Receivable for securities sold | | | 1,301,626 | | | | 3,399,342 | |
Dividends receivable | | | 66,572 | | | | 1,298,165 | |
| | | | | | | | |
TOTAL ASSETS | | | 1,149,983,282 | | | | 1,215,821,863 | |
| | | | | | | | |
LIABILITIES | | | | | | | | |
Payable for securities purchased | | | 14,269,972 | | | | 1,841,328 | |
Payable for Fund shares redeemed | | | 1,486,433 | | | | 1,086,230 | |
Management fees payable (Note 5) | | | 698,032 | | | | 701,507 | |
Deferred Trustees’ fees (Note 5) | | | 98,499 | | | | 173,171 | |
Administrative fees payable (Note 5) | | | 40,229 | | | | 43,393 | |
Payable to distributor (Note 5d) | | | 14,086 | | | | 15,202 | |
Other accounts payable and accrued expenses | | | 72,266 | | | | 79,906 | |
| | | | | | | | |
TOTAL LIABILITIES | | | 16,679,517 | | | | 3,940,737 | |
| | | | | | | | |
NET ASSETS | | $ | 1,133,303,765 | | | $ | 1,211,881,126 | |
| | | | | | | | |
NET ASSETS CONSIST OF: | | | | | | | | |
Paid-in capital | | $ | 747,231,982 | | | $ | 711,714,328 | |
Accumulated net investment (loss)/Undistributed net investment income | | | (6,100,899 | ) | | | 192,931 | |
Accumulated net realized gain on investments | | | 72,187,254 | | | | 94,787,532 | |
Net unrealized appreciation on investments | | | 319,985,428 | | | | 405,186,335 | |
| | | | | | | | |
NET ASSETS | | $ | 1,133,303,765 | | | $ | 1,211,881,126 | |
| | | | | | | | |
| | |
COMPUTATION OF NET ASSET VALUE AND OFFERING PRICE: | | | | | | | | |
Institutional Class: | | | | | | | | |
Net assets | | $ | 913,999,555 | | | $ | 733,512,166 | |
| | | | | | | | |
Shares of beneficial interest | | | 34,690,689 | | | | 19,602,640 | |
| | | | | | | | |
Net asset value, offering and redemption price per share | | $ | 26.35 | | | $ | 37.42 | |
| | | | | | | | |
Retail Class: | | | | | | | | |
Net assets | | $ | 211,724,362 | | | $ | 403,475,317 | |
| | | | | | | | |
Shares of beneficial interest | | | 8,390,981 | | | | 10,897,229 | |
| | | | | | | | |
Net asset value, offering and redemption price per share | | $ | 25.23 | | | $ | 37.03 | |
| | | | | | | | |
Admin Class: | | | | | | | | |
Net assets | | $ | — | | | $ | 74,892,476 | |
| | | | | | | | |
Shares of beneficial interest | | | — | | | | 2,066,675 | |
| | | | | | | | |
Net asset value, offering and redemption price per share | | $ | — | | | $ | 36.24 | |
| | | | | | | | |
Class N: | | | | | | | | |
Net assets | | $ | 7,579,848 | | | $ | 1,167 | |
| | | | | | | | |
Shares of beneficial interest | | | 287,596 | | | | 31 | |
| | | | | | | | |
Net asset value, offering and redemption price per share | | $ | 26.36 | | | $ | 37.44 | * |
| | | | | | | | |
| * | Net asset value calculations reflect fractional share and dollar amounts. |
See accompanying notes to financial statements.
29 |
Statements of Operations
For the Year Ended September 30, 2013
| | | | | | | | |
| | | Small Cap
Growth Fund | | | Small Cap
Value Fund | |
INVESTMENT INCOME | | | | | | | | |
Dividends | | $ | 2,260,117 | (a) | | $ | 16,398,441 | |
Interest | | | 1,404 | | | | 862 | |
| | | | | | | | |
| | | 2,261,521 | | | | 16,399,303 | |
| | | | | | | | |
Expenses | | | | | | | | |
Management fees (Note 5) | | | 6,846,564 | | | | 8,140,092 | |
Service and distribution fees (Note 5) | | | 518,764 | | | | 1,274,711 | |
Administrative fees (Note 5) | | | 403,822 | | | | 480,091 | |
Trustees’ fees and expenses (Note 5) | | | 41,543 | | | | 52,032 | |
Transfer agent fees and expenses (Notes 5 and 6) | | | 1,106,885 | | | | 1,135,571 | |
Audit and tax services fees | | | 38,671 | | | | 43,895 | |
Custodian fees and expenses | | | 39,716 | | | | 38,788 | |
Legal fees | | | 11,919 | | | | 14,383 | |
Registration fees | | | 76,082 | | | | 85,654 | |
Shareholder reporting expenses | | | 93,250 | | | | 119,862 | |
Miscellaneous expenses | | | 28,069 | | | | 31,662 | |
| | | | | | | | |
Total expenses | | | 9,205,285 | | | | 11,416,741 | |
Fee/expense recovery (Note 5) | | | 16,604 | | | | — | |
Less waiver and/or expense reimbursement (Note 5) | | | — | | | | (373,920 | ) |
| | | | | | | | |
Net expenses | | | 9,221,889 | | | | 11,042,821 | |
| | | | | | | | |
Net investment income (loss) | | | (6,960,368 | ) | | | 5,356,482 | |
| | | | | | | | |
| | |
NET REALIZED AND UNREALIZED GAIN ON INVESTMENTS | | | | | | | | |
Net realized gain on: | | | | | | | | |
Investments | | | 87,223,584 | | | | 101,532,511 | |
Net change in unrealized appreciation (depreciation) on: | | | | | | | | |
Investments | | | 222,061,214 | | | | 174,751,306 | |
| | | | | | | | |
Net realized and unrealized gain on investments | | | 309,284,798 | | | | 276,283,817 | |
| | | | | | | | |
| | |
NET INCREASE IN NET ASSETS RESULTING FROM OPERATIONS | | $ | 302,324,430 | | | $ | 281,640,299 | |
| | | | | | | | |
| (a) | Includes non-recurring dividends of $505,661. |
See accompanying notes to financial statements.
| 30
Statements of Changes in Net Assets
| | | | | | | | | | | | | | | | |
| | | Small Cap Growth Fund | | | Small Cap Value Fund | |
| | | Year Ended
September 30,
2013 | | | Year Ended
September 30,
2012 | | | Year Ended
September 30,
2013 | | | Year Ended
September 30,
2012 | |
FROM OPERATIONS: | | | | | | | | | | | | | | | | |
Net investment income (loss) | | $ | (6,960,368 | ) | | $ | (4,991,954 | ) | | $ | 5,356,482 | | | $ | 6,076,844 | |
Net realized gain on investments | | | 87,223,584 | | | | 14,608,048 | | | | 101,532,511 | | | | 49,521,017 | |
Net change in unrealized appreciation (depreciation) on investments | | | 222,061,214 | | | | 100,644,997 | | | | 174,751,306 | | | | 195,787,207 | |
| | | | | | | | | | | | | | | | |
Net increase in net assets resulting from operations | | | 302,324,430 | | | | 110,261,091 | | | | 281,640,299 | | | | 251,385,068 | |
| | | | | | | | | | | | | | | | |
FROM DISTRIBUTIONS TO SHAREHOLDERS: | | | | | | | | | | | | | | | | |
Net investment income | | | | | | | | | | | | | | | | |
Institutional Class | | | — | | | | — | | | | (5,790,803 | ) | | | (1,033,252 | ) |
Retail Class | | | — | | | | — | | | | (2,562,409 | ) | | | — | |
Admin Class | | | — | | | | — | | | | (317,577 | ) | | | — | |
Net realized capital gains | | | | | | | | | | | | | | | | |
Institutional Class | | | — | | | | — | | | | (501,108 | ) | | | — | |
Retail Class | | | — | | | | — | | | | (299,758 | ) | | | — | |
Admin Class | | | — | | | | — | | | | (57,681 | ) | | | — | |
| | | | | | | | | | | | | | | | |
Total distributions | | | — | | | | — | | | | (9,529,336 | ) | | | (1,033,252 | ) |
| | | | | | | | | | | | | | | | |
NET INCREASE (DECREASE) IN NET ASSETS FROM CAPITAL SHARE TRANSACTIONS (NOTE 9) | | | 1,689,164 | | | | 451,606,631 | | | | (44,339,129 | ) | | | (111,263,616 | ) |
| | | | | | | | | | | | | | | | |
Net increase in net assets | | | 304,013,594 | | | | 561,867,722 | | | | 227,771,834 | | | | 139,088,200 | |
NET ASSETS | | | | | | | | | | | | | | | | |
Beginning of the year | | | 829,290,171 | | | | 267,422,449 | | | | 984,109,292 | | | | 845,021,092 | |
| | | | | | | | | | | | | | | | |
End of the year | | $ | 1,133,303,765 | | | $ | 829,290,171 | | | $ | 1,211,881,126 | | | $ | 984,109,292 | |
| | | | | | | | | | | | | | | | |
ACCUMULATED NET INVESTMENT (LOSS)/UNDISTRIBUTED NET INVESTMENT INCOME | | $ | (6,100,899 | ) | | $ | (4,261,711 | ) | | $ | 192,931 | | | $ | 4,639,670 | |
| | | | | | | | | | | | | | | | |
See accompanying notes to financial statements.
31 |
This Page Intentionally Left Blank
| 32
Financial Highlights
For a share outstanding throughout each period.
| | | | | | | | | | | | | | | | | | | | | | | | | | | | | | |
| | | | | | Income (Loss) from
Investment Operations: | | | | | Less Distributions: | |
| | | Net asset
value,
beginning
of the
period | | | Net
investment
loss (a) | | | Net
realized
and
unrealized
gain (loss) | | | Total
from
investment
operations | | | | | Dividends
from net
investment
income | | | Distributions
from net
realized
capital gains | | | Total
distributions | |
SMALL CAP GROWTH FUND | | | | | | | | | | | | | | | | | | | | | | | |
| | | | | | | |
| Institutional Class | | | | | | | | | | | | | | | | | | | | | | | | | | | |
9/30/2013 | | $ | 19.17 | | | $ | (0.15 | )(e) | | $ | 7.33 | | | $ | 7.18 | | | | | $ | — | | | $ | — | | | $ | — | |
9/30/2012 | | | 15.06 | | | | (0.14 | ) | | | 4.25 | | | | 4.11 | | | | | | — | | | | — | | | | — | |
9/30/2011 | | | 14.03 | | | | (0.13 | ) | | | 1.16 | (f) | | | 1.03 | | | | | | — | | | | — | | | | — | |
9/30/2010 | | | 11.58 | | | | (0.11 | )(h) | | | 2.56 | | | | 2.45 | | | | | | — | | | | — | | | | — | |
9/30/2009 | | | 13.07 | | | | (0.07 | ) | | | (1.42 | ) | | | (1.49 | ) | | | | | — | | | | — | | | | — | |
| | | | | | | | |
| Retail Class | | | | | | | | | | | | | | | | | | | | | | | | | | | | | | |
9/30/2013 | | | 18.41 | | | | (0.20 | )(e) | | | 7.02 | | | | 6.82 | | | | | | — | | | | — | | | | — | |
9/30/2012 | | | 14.52 | | | | (0.19 | ) | | | 4.08 | | | | 3.89 | | | | | | — | | | | — | | | | — | |
9/30/2011 | | | 13.55 | | | | (0.18 | ) | | | 1.15 | (f) | | | 0.97 | | | | | | — | | | | — | | | | — | |
9/30/2010 | | | 11.21 | | | | (0.13 | )(h) | | | 2.47 | | | | 2.34 | | | | | | — | | | | — | | | | — | |
9/30/2009 | | | 12.69 | | | | (0.09 | ) | | | (1.39 | ) | | | (1.48 | ) | | | | | — | | | | — | | | | — | |
| | | | | | | | |
| Class N | | | | | | | | | | | | | | | | | | | | | | | | | | | | | | |
9/30/2013* | | | 20.22 | | | | (0.11 | ) | | | 6.25 | | | | 6.14 | | | | | | — | | | | — | | | | — | |
| * | From commencement of Class operations on February 1, 2013 through September 30, 2013. | |
| (a) | Per share net investment loss has been calculated using the average shares outstanding during the period. | |
| (b) | Had certain expenses not been waived/reimbursed during the period, if applicable, total returns would have been lower. Periods less than one year, if applicable, are not annualized. | |
| (c) | The investment adviser and/or administrator agreed to waive its fees and/or reimburse a portion of the Fund’s expenses during the period, if applicable. Without this waiver/reimbursement, expenses would have been higher. | |
| (d) | Computed on an annualized basis for periods less than one year, if applicable. | |
| (e) | Includes non-recurring dividends. Without these dividends, net investment loss per share would have been $(0.16) and $(0.21) for Institutional Class and Retail Class, respectively, total return would have been 37.40% and 36.99% for Institutional Class and Retail Class, respectively, and the ratio of net investment loss to average net assets would have been (0.75)% and (1.05)% for Institutional Class and Retail Class, respectively. | |
| (f) | The amount shown for a share outstanding does not correspond with the aggregate realized and unrealized gain (loss) on investments for the period due to the timing of sales and redemptions of fund shares in relation to fluctuating market values of investments of the Fund. | |
| (g) | Includes fee/expense recovery of 0.03%. | |
| (h) | Includes a non-recurring dividend. Without this dividend, net investment loss per share would have been $(0.12) and $(0.14) for Institutional Class and Retail Class, respectively, and the ratio of net investment loss to average net assets would have been (0.92)% and (1.17)% for Institutional Class and Retail Class, respectively. | |
| (i) | Includes fee/expense recovery of 0.01%. | |
See accompanying notes to financial statements.
33 |
| | | | | | | | | | | | | | | | | | | | | | | | | | |
| | | | | | | | | | Ratios to Average Net Assets: | | | | |
Net asset
value,
end of
the
period | | | Total
return
(%) (b) | | | Net assets,
end of the period
(000’s) | | | Net
expenses
(%) (c)(d) | | | Gross
expenses
(%) (d) | | | Net
investment
loss (%) (d) | | | Portfolio
turnover
rate (%) | |
| | | | | | | | | | | | | | | | | | | | | | | | | | |
| | | | | | |
| | | | | | | | | | | | | | | | | | | | | | | | | | |
| $ | 26.35 | | | | 37.45 | (e) | | $ | 914,000 | | | | 0.94 | | | | 0.94 | | | | (0.70 | )(e) | | | 56 | |
| | 19.17 | | | | 27.29 | | | | 599,469 | | | | 0.95 | | | | 0.95 | | | | (0.79 | ) | | | 77 | |
| | 15.06 | | | | 7.34 | | | | 154,313 | | | | 0.98 | (g) | | | 0.98 | (g) | | | (0.78 | ) | | | 76 | |
| | 14.03 | | | | 21.16 | | | | 52,501 | | | | 1.00 | | | | 1.06 | | | | (0.85 | )(h) | | | 69 | |
| | 11.58 | | | | (11.40 | ) | | | 45,557 | | | | 1.00 | | | | 1.01 | | | | (0.68 | ) | | | 107 | |
| | | | | | |
| | | | | | | | | | | | | | | | | | | | | | | | | | |
| | 25.23 | | | | 37.05 | (e) | | | 211,724 | | | | 1.25 | (i) | | | 1.25 | (i) | | | (0.99 | )(e) | | | 56 | |
| | 18.41 | | | | 26.79 | | | | 229,822 | | | | 1.25 | | | | 1.28 | | | | (1.09 | ) | | | 77 | |
| | 14.52 | | | | 7.16 | | | | 113,110 | | | | 1.25 | | | | 1.27 | | | | (1.07 | ) | | | 76 | |
| | 13.55 | | | | 20.87 | | | | 75,344 | | | | 1.25 | | | | 1.39 | | | | (1.10 | )(h) | | | 69 | |
| | 11.21 | | | | (11.66 | ) | | | 75,478 | | | | 1.25 | | | | 1.43 | | | | (0.93 | ) | | | 107 | |
| | | | | | |
| | | | | | | | | | | | | | | | | | | | | | | | | | |
| | 26.36 | | | | 30.37 | | | | 7,580 | | | | 0.83 | | | | 0.83 | | | | (0.63 | ) | | | 56 | |
See accompanying notes to financial statements.
| 34
Financial Highlights — continued
For a share outstanding throughout each period.
| | | | | | | | | | | | | | | | | | | | | | | | | | | | | | |
| | | | | | Income (Loss) from
Investment Operations: | | | | | Less Distributions: | |
| | | Net asset
value,
beginning
of the
period | | | Net
investment
income
(loss) (a)(b) | | | Net
realized
and
unrealized
gain (loss) | | | Total
from
investment
operations | | | | | Dividends
from net
investment
income (b) | | | Distributions
from net
realized
capital gains | | | Total
distributions | |
SMALL CAP VALUE FUND | | | | | | | | | | | | | | | | | | | | | | | |
| | | | | | | |
| Institutional Class | | | | | | | | | | | | | | | | | | | | | | | | | | | |
9/30/2013 | | $ | 29.14 | | | $ | 0.20 | | | $ | 8.41 | | | $ | 8.61 | | | | | $ | (0.30 | ) | | $ | (0.03 | ) | | $ | (0.33 | ) |
9/30/2012 | | | 22.36 | | | | 0.21 | | | | 6.62 | | | | 6.83 | | | | | | (0.05 | ) | | | — | | | | (0.05 | ) |
9/30/2011 | | | 22.93 | | | | 0.09 | (h) | | | (0.50 | ) | | | (0.41 | ) | | | | | (0.16 | ) | | | — | | | | (0.16 | ) |
9/30/2010 | | | 20.66 | | | | 0.11 | | | | 2.23 | | | | 2.34 | | | | | | (0.07 | ) | | | — | | | | (0.07 | ) |
9/30/2009 | | | 22.01 | | | | 0.09 | | | | (1.32 | ) | | | (1.23 | ) | | | | | (0.11 | ) | | | (0.01 | ) | | | (0.12 | ) |
| | | | | | | | |
| Retail Class | | | | | | | | | | | | | | | | | | | | | | | | | | | | | | |
9/30/2013 | | | 28.84 | | | | 0.12 | | | | 8.32 | | | | 8.44 | | | | | | (0.22 | ) | | | (0.03 | ) | | | (0.25 | ) |
9/30/2012 | | | 22.14 | | | | 0.13 | | | | 6.57 | | | | 6.70 | | | | | | — | | | | — | | | | — | |
9/30/2011 | | | 22.71 | | | | 0.02 | (h) | | | (0.48 | ) | | | (0.46 | ) | | | | | (0.11 | ) | | | — | | | | (0.11 | ) |
9/30/2010 | | | 20.47 | | | | 0.06 | | | | 2.21 | | | | 2.27 | | | | | | (0.03 | ) | | | — | | | | (0.03 | ) |
9/30/2009 | | | 21.79 | | | | 0.04 | | | | (1.30 | ) | | | (1.26 | ) | | | | | (0.05 | ) | | | (0.01 | ) | | | (0.06 | ) |
| | | | | | | | |
| Admin Class | | | | | | | | | | | | | | | | | | | | | | | | | | | | | | |
9/30/2013 | | | 28.22 | | | | 0.04 | | | | 8.15 | | | | 8.19 | | | | | | (0.14 | ) | | | (0.03 | ) | | | (0.17 | ) |
9/30/2012 | | | 21.72 | | | | 0.06 | | | | 6.44 | | | | 6.50 | | | | | | — | | | | — | | | | — | |
9/30/2011 | | | 22.30 | | | | (0.04 | )(h) | | | (0.49 | ) | | | (0.53 | ) | | | | | (0.05 | ) | | | — | | | | (0.05 | ) |
9/30/2010 | | | 20.11 | | | | 0.00 | | | | 2.19 | | | | 2.19 | | | | | | — | | | | — | | | | — | |
9/30/2009 | | | 21.40 | | | | 0.00 | | | | (1.28 | ) | | | (1.28 | ) | | | | | (0.00 | ) | | | (0.01 | ) | | | (0.01 | ) |
| | | | | | | | |
| Class N | | | | | | | | | | | | | | | | | | | | | | | | | | | | | | |
9/30/2013* | | | 32.08 | | | | 0.06 | | | | 5.30 | | | | 5.36 | | | | | | — | | | | — | | | | — | |
| * | From commencement of Class operations on February 1, 2013 through September 30, 2013. | |
| (a) | Per share net investment income (loss) has been calculated using the average shares outstanding during the period. | |
| (b) | Amount rounds to less than $0.01 per share, if applicable. | |
| (c) | Effective June 1, 2009, redemption fees were eliminated. | |
| (d) | Had certain expenses not been waived/reimbursed during the period, if applicable, total returns would have been lower. Periods less than one year, if applicable, are not annualized. | |
| (e) | The investment adviser and/or administrator agreed to waive its fees and/or reimburse a portion of the Fund’s expenses during the period, if applicable. Without this waiver/reimbursement, expenses would have been higher. | |
| (f) | Computed on an annualized basis for periods less than one year, if applicable. | |
| (g) | Includes fee/expense recovery of less than 0.01%. | |
| (h) | Includes a non-recurring dividend. Without this dividend, net investment income (loss) per share would have been $0.07, $0.01 and $(0.06) for Institutional Class, Retail Class and Admin Class, respectively, total return would have been (1.93)%, (2.16)% and (2.44)% for Institutional Class, Retail Class and Admin Class, respectively and the ratio of net investment income (loss) to average net assets would have been 0.28%, 0.03% and (0.22)% for Institutional Class, Retail Class and Admin Class, respectively. | |
See accompanying notes to financial statements.
35 |
| | | | | | | | | | | | | | | | | | | | | | | | | | | | | | |
| | | | | | | | | | | | | Ratios to Average Net Assets: | | | | |
Redemption
fees (b)(c) | | | Net asset
value,
end of
the
period | | | Total
return
(%) (d) | | | Net assets,
end of the period
(000’s) | | | Net
expenses
(%) (e)(f) | | | Gross
expenses
(%) (f) | | | Net
investment
income
(loss) (%) (f) | | | Portfolio
turnover
rate (%) | |
| | | | | | | | | | | | | | | | | | | | | | | | | | | | | | |
| | | | | | | |
| | | | | | | | | | | | | | | | | | | | | | | | | | | | | | |
| $ | — | | | $ | 37.42 | | | | 29.82 | | | $ | 733,512 | | | | 0.90 | | | | 0.91 | | | | 0.61 | | | | 22 | |
| | — | | | | 29.14 | | | | 30.59 | | | | 572,776 | | | | 0.90 | (g) | | | 0.90 | (g) | | | 0.76 | | | | 19 | |
| | — | | | | 22.36 | | | | (1.88 | )(h) | | | 431,761 | | | | 0.90 | | | | 0.93 | | | | 0.33 | (h) | | | 42 | |
| | — | | | | 22.93 | | | | 11.39 | | | | 454,853 | | | | 0.90 | | | | 0.94 | | | | 0.50 | | | | 52 | |
| | 0.00 | | | | 20.66 | | | | (5.42 | ) | | | 506,324 | | | | 0.90 | | | | 0.94 | | | | 0.52 | | | | 55 | |
| | | | | | | |
| | | | | | | | | | | | | | | | | | | | | | | | | | | | | | |
| | — | | | | 37.03 | | | | 29.48 | | | | 403,475 | | | | 1.15 | | | | 1.22 | | | | 0.37 | | | | 22 | |
| | — | | | | 28.84 | | | | 30.26 | | | | 343,480 | | | | 1.15 | | | | 1.22 | | | | 0.49 | | | | 19 | |
| | — | | | | 22.14 | | | | (2.12 | )(h) | | | 347,759 | | | | 1.15 | | | | 1.22 | | | | 0.08 | (h) | | | 42 | |
| | — | | | | 22.71 | | | | 11.10 | | | | 383,934 | | | | 1.15 | | | | 1.24 | | | | 0.26 | | | | 52 | |
| | 0.00 | | | | 20.47 | | | | (5.66 | ) | | | 387,383 | | | | 1.15 | | | | 1.31 | | | | 0.26 | | | | 55 | |
| | | | | | | |
| | | | | | | | | | | | | | | | | | | | | | | | | | | | | | |
| | — | | | | 36.24 | | | | 29.17 | | | | 74,892 | | | | 1.40 | | | | 1.52 | | | | 0.11 | | | | 22 | |
| | — | | | | 28.22 | | | | 29.93 | | | | 67,853 | | | | 1.40 | | | | 1.52 | | | | 0.24 | | | | 19 | |
| | — | | | | 21.72 | | | | (2.40 | )(h) | | | 65,500 | | | | 1.40 | | | | 1.52 | | | | (0.17 | )(h) | | | 42 | |
| | — | | | | 22.30 | | | | 10.89 | | | | 73,443 | | | | 1.40 | | | | 1.56 | | | | 0.02 | | | | 52 | |
| | 0.00 | | | | 20.11 | | | | (5.93 | ) | | | 74,195 | | | | 1.40 | | | | 1.77 | | | | 0.02 | | | | 55 | |
| | | | | | | |
| | | | | | | | | | | | | | | | | | | | | | | | | | | | | | |
| | — | | | | 37.44 | | | | 16.71 | | | | 1 | | | | 0.85 | | | | 14.45 | | | | 0.27 | | | | 22 | |
See accompanying notes to financial statements.
| 36
Notes to Financial Statements
September 30, 2013
1. Organization. Loomis Sayles Funds I and Loomis Sayles Funds II (the “Trusts” and each a “Trust”) are each organized as a Massachusetts business trust. Each Trust is registered under the Investment Company Act of 1940, as amended (the “1940 Act”), as an open-end management investment company. Each Declaration of Trust permits the Board of Trustees to authorize the issuance of an unlimited number of shares of the Trust in multiple series. The financial statements for certain funds of the Trusts are presented in separate reports. The following funds (individually, a “Fund” and collectively, the “Funds”) are included in this report:
Loomis Sayles Funds I:
Loomis Sayles Small Cap Value Fund (the “Small Cap Value Fund”)
Loomis Sayles Funds II:
Loomis Sayles Small Cap Growth Fund (the “Small Cap Growth Fund”)
Each Fund is a diversified investment company.
Small Cap Growth Fund and Small Cap Value Fund were closed to new investors effective September 14, 2012 and September 15, 2008, respectively. The Funds continue to offer Institutional Class and Retail Class shares to existing investors and Small Cap Value Fund continues to offer Admin Class shares to existing investors. Effective February 1, 2013, each Fund began offering Class N shares to existing investors.
Most expenses of the Trusts can be directly attributed to a fund. Expenses which cannot be directly attributed to a fund are generally apportioned based on the relative net assets of each of the funds in the Trusts. Expenses of a Fund are borne pro rata by the holders of each class of shares, except that each class bears expenses unique to that class (including the Rule 12b-1 service and distribution fees and transfer agent fees). In addition, each class votes as a class only with respect to its own Rule 12b-1 Plan. Shares of each class would receive their pro rata share of the net assets of a Fund if the Fund were liquidated. The Trustees approve separate distributions from net investment income on each class of shares.
2. Significant Accounting Policies. The following is a summary of significant accounting policies consistently followed by each Fund in the preparation of its financial statements. The Funds’ financial statements are prepared in accordance with accounting principles generally accepted in the United States of America which require the use of management estimates that affect the reported amounts and disclosures in the financial statements. Actual results could differ from those estimates. Management has evaluated the events and transactions subsequent to year-end through the date the financial statements were issued and has determined that there were no material events that would require disclosure in the Funds’ financial statements.
a. Valuation. Equity securities, including shares of closed-end investment companies and exchange-traded funds, for which market quotations are readily available are valued at market value, as reported by independent pricing services recommended by the investment adviser and approved by the Board of Trustees. Such independent pricing services
37 |
Notes to Financial Statements – (continued)
September 30, 2013
generally use the security’s last sale price on the exchange or market where the security is primarily traded or, if there is no reported sale during the day, the closing bid price. Securities traded on the NASDAQ Global Select Market, NASDAQ Global Market and NASDAQ Capital Market are valued at the NASDAQ Official Closing Price (“NOCP”), or if lacking a NOCP, at the most recent bid quotation on the applicable NASDAQ Market. Debt securities (other than short-term obligations purchased with an original or remaining maturity of sixty days or less) and unlisted equity securities are generally valued on the basis of evaluated bids furnished to the Funds by an independent pricing service, recommended by the investment adviser and approved by the Board of Trustees, which determines valuations for normal, institutional-size trading units of such securities using market information, transactions for comparable securities and various relationships between securities which are generally recognized by institutional traders. Broker-dealer bid prices may also be used to value debt and equity securities where an independent pricing service is unable to price a security or where an independent pricing service does not provide a reliable price for the security. Investments in other open-end investment companies are valued at their net asset value each day. Short-term obligations purchased with an original or remaining maturity of sixty days or less are valued at amortized cost, which approximates market value. Securities for which market quotations are not readily available are valued at fair value as determined in good faith by the Funds’ investment adviser under the general supervision of the Board of Trustees.
The Funds may hold securities traded in foreign markets. Foreign securities are valued at the closing market price in the foreign market. However, if events occurring after the close of the foreign market (but before the close of regular trading on the New York Stock Exchange) are believed to materially affect the value of those securities, such securities are fair valued on a daily basis pursuant to procedures approved by the Board of Trustees. When fair valuing securities, the Funds may, among other things, use modeling tools or other processes that may take into account factors such as securities market activity and/or significant events that occur after the close of the foreign market and before the Funds calculate their net asset values.
b. Investment Transactions and Related Investment Income. Investment transactions are accounted for on a trade date plus one day basis for daily net asset value calculation. However, for financial reporting purposes, investment transactions are reported on trade date. Dividend income is recorded on ex-dividend date, or in the case of certain foreign securities, as soon as a Fund is notified, and interest income is recorded on an accrual basis. Interest income is increased by the accretion of discount and decreased by the amortization of premium. Distributions received from investments in securities that represent a return of capital or capital gain are recorded as a reduction of cost of the investments or as a realized gain, respectively. The calendar year-end amounts of ordinary income, capital gains, and return of capital included in distributions received from the Funds’ investments in real estate investment trusts (“REITs”) are reported to the Funds after the end of the fiscal year; accordingly, the Funds estimate these amounts for
| 38
Notes to Financial Statements – (continued)
September 30, 2013
accounting purposes until the characterization of REIT distributions is reported to the Funds after the end of the fiscal year. Estimates are based on the most recent REIT distribution information available. In determining net gain or loss on securities sold, the cost of securities has been determined on an identified cost basis. Investment income, non-class specific expenses and realized and unrealized gains and losses are allocated on a pro rata basis to each class based on the relative net assets of each class to the total net assets of the Fund.
c. Foreign Currency Translation. The books and records of the Funds are maintained in U.S. dollars. The values of securities, currencies and other assets and liabilities denominated in currencies other than U.S. dollars are translated into U.S. dollars based upon foreign exchange rates prevailing at the end of the period. Purchases and sales of investment securities, income and expenses are translated on the respective dates of such transactions.
Since the values of investment securities are presented at the foreign exchange rates prevailing at the end of the period, it is not practical to isolate that portion of the results of operations arising from changes in exchange rates from fluctuations which arise due to changes in market prices of investment securities. Such changes are included with the net realized and unrealized gain or loss on investments.
Net realized foreign exchange gains or losses arise from sales of foreign currency, currency gains or losses realized between the trade and settlement dates on securities transactions and the difference between the amounts of dividends, interest and foreign withholding taxes recorded on the Funds’ books and the U.S. dollar equivalent of the amounts actually received or paid. Net unrealized foreign exchange gains and losses arise from changes in the value of assets and liabilities, other than investment securities, at the end of the fiscal period, resulting from changes in exchange rates.
Each Fund may use foreign currency exchange contracts to facilitate transactions in foreign-denominated investments. Losses may arise from changes in the value of the foreign currency or if the counterparties do not perform under the contracts’ terms.
d. Federal and Foreign Income Taxes. Each Trust treats each fund as a separate entity for federal income tax purposes. Each Fund intends to meet the requirements of the Internal Revenue Code of 1986, as amended, applicable to regulated investment companies, and to distribute to its shareholders substantially all of its net investment income and any net realized capital gains at least annually. Management has performed an analysis of each Fund’s tax positions for the open tax years as of September 30, 2013 and has concluded that no provisions for income tax are required. The Funds’ federal tax returns for the prior three fiscal years remain subject to examination by the Internal Revenue Service. Management is not aware of any events that are reasonably possible to occur in the next twelve months that would result in the amounts of any unrecognized tax benefits significantly increasing or decreasing for the Funds. However, management’s conclusions regarding tax positions taken may be subject to review and adjustment at a later date based
39 |
Notes to Financial Statements – (continued)
September 30, 2013
on factors including, but not limited to, new tax laws and accounting regulations and interpretations thereof.
A Fund may be subject to foreign withholding taxes on investment income and taxes on capital gains on investments that are accrued and paid based upon the Fund’s understanding of the tax rules and regulations that exist in the countries in which the Fund invests. Foreign withholding taxes on dividend and interest income are reflected on the Statements of Operations as a reduction of investment income, net of amounts eligible to be reclaimed. Dividends and interest receivable on the Statements of Assets and Liabilities are net of foreign withholding taxes. Foreign withholding taxes eligible to be reclaimed are reflected on the Statements of Assets and Liabilities as tax reclaims receivable. Capital gains taxes paid are included in net realized gain (loss) on investments in the Statements of Operations. Accrued but unpaid capital gains taxes are reflected as foreign taxes payable on the Statements of Assets and Liabilities, if applicable, and reduce unrealized gains on investments. In the event that realized gains on investments are subsequently offset by realized losses, taxes paid on realized gains may be returned to a Fund. Such amounts, if applicable, are reflected as foreign tax rebates receivable on the Statements of Assets and Liabilities and are recorded as a realized gain when received.
e. Dividends and Distributions to Shareholders. Dividends and distributions are recorded on ex-dividend date. The timing and characterization of certain income and capital gain distributions are determined annually in accordance with federal tax regulations, which may differ from accounting principles generally accepted in the United States of America. Permanent differences are primarily due to differing treatments for book and tax purposes of items such as return of capital distributions received and net operating losses. Permanent book and tax basis differences relating to shareholder distributions will result in reclassifications to capital accounts. Temporary differences between book and tax distributable earnings are primarily due to return of capital distributions received, deferred Trustees’ fees and wash sales. Distributions from net investment income and short-term capital gains are considered to be distributed from ordinary income for tax purposes.
The tax characterization of distributions is determined on an annual basis. The tax character of distributions paid to shareholders during the years ended September 30, 2013 and 2012 was as follows:
| | | | | | | | | | | | | | | | | | | | | | | | |
| | | 2013 Distributions Paid From: | | | 2012 Distributions Paid From: | |
Fund | | Ordinary
Income | | | Long-Term
Capital Gains | | | Total | | | Ordinary
Income | | | Long-Term
Capital Gains | | | Total | |
| Small Cap Value Fund | | $ | 8,670,789 | | | $ | 858,547 | | | $ | 9,529,336 | | | $ | 1,033,252 | | | $ | — | | | $ | 1,033,252 | |
| 40
Notes to Financial Statements – (continued)
September 30, 2013
As of September 30, 2013, the components of distributable earnings on a tax basis were as follows:
| | | | | | | | |
| | | Small Cap
Growth Fund | | | Small Cap
Value Fund | |
Undistributed ordinary income | | $ | — | | | $ | 366,102 | |
Undistributed long-term capital gains | | | 72,332,270 | | | | 94,772,659 | |
| | | | | | | | |
Total undistributed earnings | | | 72,332,270 | | | | 95,138,761 | |
| | | | | | | | |
Late-year ordinary and post-October capital loss deferrals* | | | (6,002,400 | ) | | | — | |
Unrealized appreciation | | | 319,840,412 | | | | 405,201,208 | |
| | | | | | | | |
Total accumulated earnings | | $ | 386,170,282 | | | $ | 500,339,969 | |
| | | | | | | | |
* Under current tax law, capital losses, foreign currency losses, and losses on passive foreign investment companies and contingent payment debt instruments after October 31 or December 31, as applicable, may be deferred and treated as occurring on the first day of the following taxable year.
f. Repurchase Agreements. It is each Fund’s policy that the market value of the collateral for repurchase agreements be at least equal to 102% of the repurchase price, including interest. Certain repurchase agreements are tri-party arrangements whereby the collateral is held in a segregated account for the benefit of the Fund and on behalf of the counterparty. Repurchase agreements could involve certain risks in the event of default or insolvency of the counterparty, including possible delays or restrictions upon a Fund’s ability to dispose of the underlying securities.
g. Securities Lending. The Funds have entered into an agreement with State Street Bank and Trust Company (“State Street Bank”), as agent of the Funds, to lend securities to certain designated borrowers. The loans are collateralized with cash or securities in an amount equal to at least 105% or 102% of the market value (including accrued interest) of the loaned international or domestic securities, respectively, when the loan is initiated. Thereafter, the value of the collateral must remain at least 102% of the market value (including accrued interest) of loaned securities for U.S. equities and U.S. corporate debt; at least 105% of the market value (including accrued interest) of loaned securities for non-U.S. equities; and at least 100% of the market value (including accrued interest) of loaned securities for U.S. Government securities, sovereign debt issued by non-U.S. Governments and non-U.S. corporate debt. In the event that the market value of the collateral falls below the required percentages described above, the borrower will deliver additional collateral on the next business day. As with other extensions of credit, the Funds may bear the risk of loss with respect to the investment of the collateral. The Funds invest cash collateral in short-term investments, a portion of the income from which is remitted to the borrowers and the remainder allocated between the Funds and State Street Bank as lending agent.
For the year ended September 30, 2013, neither Fund had loaned securities under this agreement.
41 |
Notes to Financial Statements – (continued)
September 30, 2013
h. Indemnifications. Under the Trusts’ organizational documents, their officers and Trustees are indemnified against certain liabilities arising out of the performance of their duties to the Funds. Additionally, in the normal course of business, the Funds enter into contracts with service providers that contain general indemnification clauses. The Funds’ maximum exposure under these arrangements is unknown as this would involve future claims that may be made against the Funds that have not yet occurred. However, based on experience, the Funds expect the risk of loss to be remote.
i. New Accounting Pronouncement. In December 2011, Accounting Standards Update (“ASU”) No. 2011-11, “Disclosures about Offsetting Assets and Liabilities” was issued and is effective for interim and annual periods beginning after January 1, 2013. The ASU creates new disclosure requirements with respect to an entity’s rights of setoff and related arrangements associated with its financial instruments. Management has evaluated the impact the adoption of ASU 2011-11 and will incorporate the new disclosures required in the March 31, 2014 report.
3. Fair Value Measurements. In accordance with accounting standards related to fair value measurements and disclosures, the Funds have categorized the inputs utilized in determining the value of each Fund’s assets or liabilities. These inputs are summarized in the three broad levels listed below:
| | • | | Level 1—quoted prices in active markets for identical assets or liabilities; |
| | • | | Level 2—prices determined using other significant inputs that are observable either directly, or indirectly through corroboration with observable market data (which could include quoted prices for similar assets or liabilities, interest rates, credit risk, etc.); and |
| | • | | Level 3—prices determined using significant unobservable inputs when quoted prices or observable inputs are unavailable such as when there is little or no market activity for an asset or liability (unobservable inputs reflect each Fund’s own assumptions in determining the fair value of assets or liabilities and would be based on the best information available). |
The inputs or methodology used for valuing securities are not necessarily an indication of the risk associated with investing in those securities.
| 42
Notes to Financial Statements – (continued)
September 30, 2013
The following is a summary of the inputs used to value the Funds’ investments as of September 30, 2013, at value:
Small Cap Growth Fund
Asset Valuation Inputs
| | | | | | | | | | | | | | | | |
Description | | Level 1 | | | Level 2 | | | Level 3 | | | Total | |
Common Stocks(a) | | $ | 1,083,688,907 | | | $ | — | | | $ | — | | | $ | 1,083,688,907 | |
Short-Term Investments | | | — | | | | 59,677,799 | | | | — | | | | 59,677,799 | |
| | | | | | | | | | | | | | | | |
Total | | $ | 1,083,688,907 | | | $ | 59,677,799 | | | $ | — | | | $ | 1,143,366,706 | |
| | | | | | | | | | | | | | | | |
(a) Details of the major categories of the Fund’s investments are reflected within the Portfolio of Investments.
For the year ended September 30, 2013, there were no transfers among Levels 1, 2 and 3.
Small Cap Value Fund
Asset Valuation Inputs
| | | | | | | | | | | | | | | | |
Description | | Level 1 | | | Level 2 | | | Level 3 | | | Total | |
Common Stocks(a) | | $ | 1,158,927,990 | | | $ | — | | | $ | — | | | $ | 1,158,927,990 | |
Closed End Investment Companies | | | 24,610,530 | | | | — | | | | — | | | | 24,610,530 | |
Warrants(b) | | | — | | | | — | | | | — | | | | — | |
Short-Term Investments | | | — | | | | 26,590,292 | | | | — | | | | 26,590,292 | |
| | | | | | | | | | | | | | | | |
Total | | $ | 1,183,538,520 | | | $ | 26,590,292 | | | $ | — | | | $ | 1,210,128,812 | |
| | | | | | | | | | | | | | | | |
(a) Details of the major categories of the Fund’s investments are reflected within the Portfolio of Investments.
(b) Fair valued at zero using Level 2 inputs.
For the year ended September 30, 2013, there were no transfers among Levels 1, 2 and 3.
4. Purchases and Sales of Securities. For the year ended September 30, 2013, purchases and sales of securities (excluding short-term investments) were as follows:
| | | | | | | | |
Fund | | Purchases | | | Sales | |
Small Cap Growth Fund | | $ | 492,161,921 | | | $ | 518,118,918 | |
Small Cap Value Fund | | | 237,353,441 | | | | 300,903,268 | |
5. Management Fees and Other Transactions with Affiliates.
a. Management Fees. Loomis, Sayles & Company, L.P. (“Loomis Sayles”) serves as investment adviser to each Fund. Under the terms of the management agreements, each Fund pays a management fee at the following annual rates, calculated daily and payable monthly, based on each Fund’s average daily net assets:
| | | | |
Fund | | Percentage of
Average Daily Net Assets | |
Small Cap Growth Fund | | | 0.75% | |
Small Cap Value Fund | | | 0.75% | |
43 |
Notes to Financial Statements – (continued)
September 30, 2013
Loomis Sayles has given binding undertakings to the Funds to waive management fees and/or reimburse certain expenses to limit the Funds’ operating expenses, exclusive of acquired fund fees and expenses, brokerage expenses, interest expense, taxes and extraordinary expenses. These undertakings are in effect until January 31, 2014 and are reevaluated on an annual basis. Management fees payable, as reflected on the Statements of Assets and Liabilities, is net of waivers and/or expense reimbursements, if any, pursuant to these undertakings.
For the year ended September 30, 2013, the expense limits as a percentage of average daily net assets under the expense limitation agreements were as follows:
| | | | | | | | | | | | | | | | |
| | | Expense Limit as a Percentage of
Average Daily Net Assets | |
Fund | | Institutional Class | | | Retail Class | | | Admin Class | | | Class N | |
Small Cap Growth Fund | | | 1.00% | | | | 1.25% | | | | — | | | | 0.95% | |
Small Cap Value Fund | | | 0.90% | | | | 1.15% | | | | 1.40% | | | | 0.85% | |
Loomis Sayles shall be permitted to recover expenses it has borne under the expense limitation agreements (whether through waiver of its management fees or otherwise) on a class by class basis in later periods to the extent the annual operating expenses of a class fall below a class’ expense limits, provided, however, that a class is not obligated to pay such waived/reimbursed fees or expenses more than one year after the end of the fiscal year in which the fees or expenses were waived/reimbursed.
For the year ended September 30, 2013, the management fees for each Fund were as follows:
| | | | | | | | |
Fund | | Management
Fees | | | Percentage of
Average Daily Net Assets | |
Small Cap Growth Fund | | $ | 6,846,564 | | | | 0.75% | |
Small Cap Value Fund | | $ | 8,140,092 | | | | 0.75% | |
For the year ended September 30, 2013, class-specific expenses have been reimbursed as follows:
| | | | | | | | | | | | | | | | | | | | |
| | | Reimbursement1 | |
Fund | | Institutional
Class | | | Retail
Class | | | Admin
Class | | | Class N | | | Total | |
Small Cap Value Fund | | $ | 42,284 | | | $ | 246,272 | | | $ | 85,267 | | | $ | 97 | | | $ | 373,920 | |
| 1 | Expense reimbursements are subject to possible recovery until September 30, 2014. |
For the year ended September 30, 2013, expense reimbursements related to the prior fiscal year were recovered as follows:
| | | | | | | | | | | | |
| | | Recovered Expenses | |
Fund | | Institutional
Class | | | Retail
Class | | | Total | |
Small Cap Growth Fund | | $ | — | | | $ | 16,604 | | | $ | 16,604 | |
Certain officers and employees of Loomis Sayles are also officers or Trustees of the Trusts. Loomis Sayles’ general partner is indirectly owned by Natixis Global Asset Management,
| 44
Notes to Financial Statements – (continued)
September 30, 2013
L.P. (“Natixis US”), which is part of Natixis Global Asset Management, an international asset management group based in Paris, France.
b. Service and Distribution Fees. NGAM Distribution, L.P. (“NGAM Distribution”), which is a wholly-owned subsidiary of Natixis US, has entered into a distribution agreement with the Trusts. Pursuant to this agreement, NGAM Distribution serves as principal underwriter of the Funds of the Trusts.
Pursuant to Rule 12b-1 under the 1940 Act, Small Cap Growth Fund and Small Cap Value Fund have adopted a Distribution Plan relating to each Fund’s Retail Class shares (the “Retail Class Plans”) and Small Cap Value Fund has adopted a Distribution Plan relating to its Admin Class shares (the “Admin Class Plan”).
Under the Retail Class Plans, each Fund pays NGAM Distribution a monthly distribution fee at an annual rate not to exceed 0.25% of the average daily net assets attributable to the Funds’ Retail Class shares, as compensation for services provided by NGAM Distribution in connection with the marketing or sale of Retail Class shares or for payments made by NGAM Distribution to securities dealers or other financial intermediaries as commissions, asset-based sales charges or other compensation with respect to the sale of Retail Class shares, or for providing personal services to investors and/or maintenance of shareholder accounts.
Under the Admin Class Plan, Small Cap Value Fund pays NGAM Distribution a monthly distribution fee at an annual rate not to exceed 0.25% of the average daily net assets attributable to the Fund’s Admin Class shares, as compensation for services provided by NGAM Distribution in connection with the marketing or sale of Admin Class shares or for payments made by NGAM Distribution to securities dealers or other financial intermediaries as commissions, asset-based sales charges or other compensation with respect to the sale of Admin Class shares, or for providing personal services to investors and/or the maintenance of shareholder accounts.
In addition, the Admin Class shares of Small Cap Value Fund may pay NGAM Distribution an administrative service fee, at an annual rate not to exceed 0.25% of the average daily net assets attributable to Admin Class shares. These fees are subsequently paid to securities dealers or financial intermediaries for providing personal services and/or account maintenance for their customers who hold such shares.
For the year ended September 30, 2013, the service and distribution fees for each Fund were as follows:
| | | | | | | | | | | | |
| | | Service Fees | | | Distribution Fees | |
Fund | | Admin
Class | | | Retail
Class | | | Admin
Class | |
Small Cap Growth Fund | | $ | — | | | $ | 518,764 | | | $ | — | |
Small Cap Value Fund | | | 174,592 | | | | 925,527 | | | | 174,592 | |
45 |
Notes to Financial Statements – (continued)
September 30, 2013
c. Administrative Fees. NGAM Advisors, L.P. (“NGAM Advisors”) provides certain administrative services for the Funds and contracts with State Street Bank to serve as sub-administrator. NGAM Advisors is a wholly-owned subsidiary of Natixis US. Pursuant to an agreement among Natixis Funds Trust I, Natixis Funds Trust II, Natixis Funds Trust IV, Gateway Trust (“Natixis Funds Trusts”), Loomis Sayles Funds I, Loomis Sayles Funds II (“Loomis Sayles Funds Trusts”), Hansberger International Series and NGAM Advisors, each Fund pays NGAM Advisors monthly its pro rata portion of fees equal to an annual rate of 0.0575% of the first $15 billion of the average daily net assets of the Natixis Funds Trusts, Loomis Sayles Funds Trusts and Hansberger International Series, 0.0500% of the next $15 billion, 0.0400% of the next $30 billion and 0.0350% of such assets in excess of $60 billion, subject to an annual aggregate minimum fee for the Natixis Funds Trusts, Loomis Sayles Funds Trusts and Hansberger International Series of $10 million, which is reevaluated on an annual basis.
For the year ended September 30, 2013, the administrative fees for each Fund were as follows:
| | | | |
Fund | | Administrative
Fees | |
Small Cap Growth Fund | | $ | 403,822 | |
Small Cap Value Fund | | | 480,091 | |
d. Sub-Transfer Agent Fees. NGAM Distribution has entered into agreements, which include servicing agreements, with financial intermediaries that provide recordkeeping, processing, shareholder communications and other services to customers of the intermediaries that hold positions in the Funds and has agreed to compensate the intermediaries for providing those services. Intermediaries transact with the Funds primarily through the use of omnibus accounts on behalf of their customers who hold positions in the Funds. These services would have been provided by the Funds’ transfer agent and other service providers if the shareholders’ accounts were maintained directly at the Funds’ transfer agent. Accordingly, the Funds have agreed to reimburse NGAM Distribution for all or a portion of the servicing fees paid to these intermediaries. The reimbursement amounts (sub-transfer agent fees) paid to NGAM Distribution are subject to a current per-account equivalent fee limit approved by the Funds’ Board, which is based on fees for similar services paid to the Funds’ transfer agent and other service providers. Class N shares do not bear such expenses.
For the year ended September 30, 2013, the sub-transfer agent fees (which are reflected in transfer agent fees and expenses in the Statements of Operations) for each Fund were as follows:
| | | | | | | | | | | | |
| | | Sub-Transfer Agent Fees | |
Fund | | Institutional
Class | | | Retail
Class | | | Admin
Class | |
Small Cap Growth Fund | | $ | 754,805 | | | $ | 274,338 | | | $ | — | |
Small Cap Value Fund | | | 472,189 | | | | 488,381 | | | | 129,855 | |
| 46
Notes to Financial Statements – (continued)
September 30, 2013
As of September 30, 2013, the Funds owe NGAM Distribution the following reimbursements for sub-transfer agent fees:
| | | | | | | | | | | | |
| | | Reimbursements of Sub-Transfer
Agent Fees | |
Fund | | Institutional
Class | | | Retail
Class | | | Admin
Class | |
Small Cap Growth Fund | | $ | 10,127 | | | $ | 3,959 | | | $ | — | |
Small Cap Value Fund | | | 6,297 | | | | 6,986 | | | | 1,919 | |
e. Trustees Fees and Expenses. The Trusts do not pay any compensation directly to their officers or Trustees who are directors, officers or employees of NGAM Advisors, NGAM Distribution, Natixis US or their affiliates. Effective January 1, 2013, the Chairperson of the Board receives a retainer fee at the annual rate of $285,000. The Chairperson does not receive any meeting attendance fees for Board of Trustees meetings or committee meetings that she attends. Each Independent Trustee (other than the Chairperson) receives, in the aggregate, a retainer fee at the annual rate of $115,000. Each Independent Trustee also receives a meeting attendance fee of $10,000 for each meeting of the Board of Trustees that he or she attends in person and $5,000 for each meeting of the Board of Trustees that he or she attends telephonically. In addition, each committee chairman receives an additional retainer fee at an annual rate of $17,500. Each Contract Review and Governance Committee member is compensated $6,000 for each Committee meeting that he or she attends in person and $3,000 for each meeting that he or she attends telephonically. Each Audit Committee member is compensated $6,000 for each Committee meeting that he or she attends in person and $3,000 for each meeting that he or she attends telephonically. These fees are allocated among the funds in the Natixis Funds Trusts, Loomis Sayles Funds Trusts and Hansberger International Series based on a formula that takes into account, among other factors, the relative net assets of each fund. Trustees are reimbursed for travel expenses in connection with attendance at meetings.
Prior to January 1, 2013, the Chairperson of the Board received a retainer fee at the annual rate of $265,000 and each Independent Trustee (other than the Chairperson) received, in aggregate, a retainer fee at the annual rate of $95,000. In addition, each committee chairman received an additional retainer fee at an annual rate of $15,000, and each Audit Committee member was compensated $7,500 for each Committee meeting that he or she attended in person and $3,750 for each meeting that he or she attended telephonically.
A deferred compensation plan (the “Plan”) is available to the Trustees on a voluntary basis. Deferred amounts remain in the Funds until distributed in accordance with the provisions of the Plan. The value of a participating Trustee’s deferral account is based on theoretical investments of deferred amounts, on the normal payment dates, in certain funds of the Natixis Funds Trusts, Loomis Sayles Funds Trusts and Hansberger International Series as designated by the participating Trustees. Changes in the value of participants’ deferral accounts are allocated pro rata among the funds in the Natixis Funds Trusts, Loomis Sayles Funds Trusts, and Hansberger International Series, and are normally reflected as
47 |
Notes to Financial Statements – (continued)
September 30, 2013
Trustees’ fees and expenses in the Statements of Operations. The portions of the accrued obligations allocated to the Funds under the Plan are reflected as Deferred Trustees’ fees in the Statements of Assets and Liabilities.
f. Affiliated Ownership. At September 30, 2013, Loomis Sayles Funded Pension Plan and Trust (“Pension Plan”) and Loomis Sayles Employees’ Profit Sharing Retirement Plan (“Retirement Plan”) held shares of the Funds representing the following percentages of net assets:
| | | | | | | | | | | | |
Fund | | Pension Plan | | | Retirement Plan | | | Total
Affiliated
Ownership | |
Small Cap Growth Fund | | | 0.75% | | | | 1.18% | | | | 1.93% | |
Small Cap Value Fund | | | 1.11% | | | | 2.00% | | | | 3.11% | |
Additionally, as of September 30, 2013, NGAM Advisors held shares of Small Cap Value Fund representing less than 0.01% of the Funds’ net assets.
Investment activities of affiliated shareholders could have material impacts on the Funds.
6. Class-Specific Transfer Agent Fees and Expenses. For the year ended September 30, 2013, the class-specific transfer agent fees and expenses (including sub-transfer agent fees, where applicable) for each Fund were as follows:
| | | | | | | | | | | | | | | | |
| | | Transfer Agent Fees and Expenses | |
Fund | | Institutional
Class | | | Retail Class | | | Admin
Class | | | Class N | |
Small Cap Growth Fund | | $ | 770,843 | | | $ | 335,932 | | | $ | — | | | $ | 110 | |
Small Cap Value Fund | | | 494,773 | | | | 506,287 | | | | 134,414 | | | | 97 | |
7. Line of Credit. Each Fund, together with certain other funds of Natixis Funds Trusts, Loomis Sayles Funds Trusts and Hansberger International Series, participates in a $200,000,000 committed unsecured line of credit provided by State Street Bank, with an individual limit of $125,000,000 for each fund that participates in the line of credit. Interest is charged to each participating fund based on its borrowings at a rate per annum equal to the greater of the Federal Funds rate or overnight LIBOR, plus 1.25%. In addition, a commitment fee of 0.10% per annum, payable at the end of each calendar quarter, is accrued and apportioned among the participating funds based on their average daily unused portion of the line of credit.
For the year ended September 30, 2013, neither Fund had borrowings under these agreements.
| 48
Notes to Financial Statements – continued
September 30, 2013
8. Brokerage Commission Recapture. Each Fund has entered into agreements with certain brokers whereby the brokers will rebate a portion of brokerage commissions. All amounts rebated by the brokers are returned to the Funds under such agreements and are included in realized gains on investments in the Statements of Operations. For the year ended September 30, 2013, amounts rebated under these agreements were as follows:
| | | | |
Fund | | Rebates | |
Small Cap Growth Fund | | $ | 57,189 | |
Small Cap Value Fund | | | 45,409 | |
9. Capital Shares. Each Fund may issue an unlimited number of shares of beneficial interest, without par value. Transactions in capital shares were as follows:
| | | | | | | | | | | | | | | | |
| | | Small Cap Growth Fund | |
| | | Year Ended
September 30, 2013 | | | Year Ended
September 30, 2012 | |
| Institutional Class | | Shares | | | Amount | | | Shares | | | Amount | |
Issued from the sale of shares | | | 11,813,357 | | | $ | 252,532,051 | | | | 25,012,829 | | | $ | 444,379,599 | |
Issued in connection with the reinvestment of distributions | | | — | | | | — | | | | — | | | | — | |
Redeemed | | | (8,396,592 | ) | | | (176,478,451 | ) | | | (3,982,168 | ) | | | (71,766,116 | ) |
| | | | | | | | | | | | | | | | |
Net change | | | 3,416,765 | | | $ | 76,053,600 | | | | 21,030,661 | | | $ | 372,613,483 | |
| | | | | | | | | | | | | | | | |
| Retail Class | | | | | | | | | | | | |
Issued from the sale of shares | | | 2,620,258 | | | $ | 53,469,074 | | | | 8,772,957 | | | $ | 149,204,216 | |
Issued in connection with the reinvestment of distributions | | | — | | | | — | | | | — | | | | — | |
Redeemed | | | (6,709,873 | ) | | | (135,077,555 | ) | | | (4,084,044 | ) | | | (70,211,068 | ) |
| | | | | | | | | | | | | | | | |
Net change | | | (4,089,615 | ) | | $ | (81,608,481 | ) | | | 4,688,913 | | | $ | 78,993,148 | |
| | | | | | | | | | | | | | | | |
| Class N* | | | | | | | | | | | | |
Issued from the sale of shares | | | 291,609 | | | $ | 7,346,195 | | | | — | | | $ | — | |
Issued in connection with the reinvestment of distributions | | | — | | | | — | | | | — | | | | — | |
Redeemed | | | (4,013 | ) | | | (102,150 | ) | | | — | | | | — | |
| | | | | | | | | | | | | | | | |
Net change | | | 287,596 | | | $ | 7,244,045 | | | | — | | | $ | — | |
| | | | | | | | | | | | | | | | |
Increase (decrease) from capital share transactions | | | (385,254 | ) | | $ | 1,689,164 | | | | 25,719,574 | | | $ | 451,606,631 | |
| | | | | | | | | | | | | | | | |
* From commencement of Class operations on February 1, 2013 through September 30, 2013.
49 |
Notes to Financial Statements – continued
September 30, 2013
9. Capital Shares – continued.
| | | | | | | | | | | | | | | | |
| | | Small Cap Value Fund | |
| | | Year Ended
September 30, 2013 | | | Year Ended
September 30, 2012 | |
| Institutional Class | | Shares | | | Amount | | | Shares | | | Amount | |
Issued from the sale of shares | | | 3,209,013 | | | $ | 105,799,055 | | | | 4,160,980 | | | $ | 112,254,002 | |
Issued in connection with the reinvestment of distributions | | | 204,464 | | | | 6,072,591 | | | | 37,002 | | | | 980,177 | |
Redeemed | | | (3,464,461 | ) | | | (112,934,799 | ) | | | (3,852,812 | ) | | | (105,017,313 | ) |
| | | | | | | | | | | | | | | | |
Net change | | | (50,984 | ) | | $ | (1,063,153 | ) | | | 345,170 | | | $ | 8,216,866 | |
| | | | | | | | | | | | | | | | |
| Retail Class | | | | | | | | | | | | |
Issued from the sale of shares | | | 1,284,622 | | | $ | 42,022,941 | | | | 1,188,522 | | | $ | 32,260,155 | |
Issued in connection with the reinvestment of distributions | | | 96,978 | | | | 2,855,026 | | | | — | | | | — | |
Redeemed | | | (2,396,051 | ) | | | (77,723,740 | ) | | | (4,987,227 | ) | | | (135,496,848 | ) |
| | | | | | | | | | | | | | | | |
Net change | | | (1,014,451 | ) | | $ | (32,845,773 | ) | | | (3,798,705 | ) | | $ | (103,236,693 | ) |
| | | | | | | | | | | | | | | | |
| Admin Class | | | | | | | | | | | | |
Issued from the sale of shares | | | 474,991 | | | $ | 15,185,040 | | | | 593,951 | | | $ | 15,631,061 | |
Issued in connection with the reinvestment of distributions | | | 9,613 | | | | 277,512 | | | | — | | | | — | |
Redeemed | | | (822,273 | ) | | | (25,893,755 | ) | | | (1,205,509 | ) | | | (31,874,850 | ) |
| | | | | | | | | | | | | | | | |
Net change | | | (337,669 | ) | | $ | (10,431,203 | ) | | | (611,558 | ) | | $ | (16,243,789 | ) |
| | | | | | | | | | | | | | | | |
| Class N* | | | | | | | | | | | | |
Issued from the sale of shares | | | 31 | | | $ | 1,000 | | | | — | | | $ | — | |
Issued in connection with the reinvestment of distributions | | | — | | | | — | | | | — | | | | — | |
Redeemed | | | — | | | | — | | | | — | | | | — | |
| | | | | | | | | | | | | | | | |
Net change | | | 31 | | | $ | 1,000 | | | | — | | | $ | — | |
| | | | | | | | | | | | | | | | |
Increase (decrease) from capital share transactions | | | (1,403,073 | ) | | $ | (44,339,129 | ) | | | (4,065,093 | ) | | $ | (111,263,616 | ) |
| | | | | | | | | | | | | | | | |
* From commencement of Class operations on February 1, 2013 through September 30, 2013.
| 50
Report Of Independent Registered Public Accounting Firm
To the Trustees of Loomis Sayles Funds I and Loomis Sayles Funds II and Shareholders of Loomis Sayles Small Cap Value Fund and Loomis Sayles Small Cap Growth Fund:
In our opinion, the accompanying statements of assets and liabilities, including the portfolios of investments, and the related statements of operations and of changes in net assets and the financial highlights present fairly, in all material respects, the financial position of the Loomis Sayles Small Cap Value Fund, a series of Loomis Sayles Funds I, and the Loomis Sayles Small Cap Growth Fund, a series of Loomis Sayles Funds II (collectively, the “Funds”), at September 30, 2013, and the results of each of their operations, the changes in each of their net assets and the financial highlights for each of the periods indicated, in conformity with accounting principles generally accepted in the United States of America. These financial statements and financial highlights (hereafter referred to as “financial statements”) are the responsibility of the Funds’ management; our responsibility is to express an opinion on these financial statements based on our audits. We conducted our audits of these financial statements in accordance with the standards of the Public Company Accounting Oversight Board (United States). Those standards require that we plan and perform the audits to obtain reasonable assurance about whether the financial statements are free of material misstatement. An audit includes examining, on a test basis, evidence supporting the amounts and disclosures in the financial statements, assessing the accounting principles used and significant estimates made by management, and evaluating the overall financial statement presentation. We believe that our audits, which included confirmation of securities at September 30, 2013 by correspondence with the custodian and brokers, provide a reasonable basis for our opinion.
PricewaterhouseCoopers LLP
Boston, Massachusetts
November 21, 2013
51 |
2013 U.S. Tax Distribution Information to Shareholders (Unaudited)
Corporate Dividends Received Deduction. For the fiscal year ended September 30, 2013, a percentage of dividends distributed by the Funds listed below qualify for the dividends received deduction for corporate shareholders. These percentages are as follows:
| | | | |
Fund | | Qualifying Percentage | |
Small Cap Value | | | 100.00% | |
Capital Gains Distributions. Pursuant to Internal Revenue Section 852(b), the following Funds paid distributions, which have been designated as capital gains distributions for the fiscal year ended September 30, 2013, unless subsequently determined to be different.
| | | | |
Fund | | Amount | |
Small Cap Value | | $ | 858,547 | |
Qualified Dividend Income. For the fiscal year ended September 30, 2013, the Funds below will designate up to the maximum amount allowable pursuant to the Internal Revenue Code as qualified dividend income eligible for reduced tax rates. These lower rates range from 0% to 20% depending on an individual’s tax bracket. If the Funds pay a distribution during calendar year 2013, complete information will be reported in conjunction with Form 1099-DIV.
| 52
Trustee and Officer Information
As of 9/30/13
The tables below provide certain information regarding the trustees and officers of Loomis Sayles Funds I and Loomis Sayles Funds II (the “Trusts”). Unless otherwise indicated, the address of all persons below is 399 Boylston Street, Boston, MA 02116. The Funds’ Statement of Additional Information includes additional information about the trustees of the Trusts and is available by calling Natixis Funds at 800-225-5478.
| | | | | | | | |
| Name and Year of Birth | | Position(s) Held
with the Trusts,
Length of Time
Served and
Term of Office1 | | Principal
Occupation(s)
During Past 5 Years | | Number of
Portfolios in
Fund Complex
Overseen2 and
Other
Directorships Held
During Past 5 Years | | Experience,
Qualifications,
Attributes, Skills
for Board
Membership |
| | |
| INDEPENDENT TRUSTEES | | | | |
| | | | |
Charles D. Baker
(1956) | | Trustee From 2005 to 2009 and since 2011 Contract Review and Governance Committee Member | | Executive in Residence at General Catalyst Partners (venture capital and growth equity firm); formerly, President and Chief Executive Officer, Harvard Pilgrim Health Care (health care organization) | | 42 Director, Athenahealth, Inc. (software company) | | Significant experience on the Board; executive experience (including president and chief executive officer of a health care organization and executive officer of a venture capital and growth equity firm) |
| | | | |
Daniel M. Cain
(1945) | | Trustee Since 2003 Chairman of the Contract Review and Governance Committee | | Chairman (formerly, President and Chief Executive Officer) of Cain Brothers & Company, Incorporated (investment banking) | | 42 Director, Sheridan Healthcare Inc. (physician practice management) | | Significant experience on the Board and on the board of other business organizations (including at a health care organization); experience in the financial industry (including roles as chairman and former chief executive officer of an investment banking firm) |
| | | | |
Kenneth A. Drucker
(1945) | | Trustee Since 2008 Chairman of the Audit Committee | | Retired | | 42 Formerly, Director, M Fund, Inc. (investment company); Director, Gateway Trust (investment company) | | Significant experience on the Board and on the board of other business organizations (including at investment companies); executive experience (including as treasurer of an aerospace, automotive, and metal manufacturing corporation) |
53 |
Trustee and Officer Information – continued
| | | | | | | | |
| Name and Year of Birth | | Position(s) Held
with the Trusts,
Length of Time
Served and
Term of Office1 | | Principal
Occupation(s)
During Past 5 Years | | Number of
Portfolios in
Fund Complex
Overseen2 and
Other
Directorships Held
During Past 5 Years | | Experience,
Qualifications,
Attributes, Skills
for Board
Membership |
| | |
| INDEPENDENT TRUSTEES – continued | | | | |
| | | | |
Edmond J. English
(1953) | | Trustee Since 2013 Contract Review and Governance Committee Member | | Chief Executive Officer of Bob’s Discount Furniture (retail) | | 42 Formerly, Director, BJ’s Wholesale Club (retail); formerly, Director, Citizens Financial Group (bank) | | Significant experience on the board of other business organizations (including at a retail company and a bank); executive experience (including at a retail company) |
| | | | |
Wendell J. Knox
(1948) | | Trustee Since 2009 Audit Committee Member | | Director (formerly, President and Chief Executive Officer) of Abt Associates Inc. (research and consulting) | | 42 Director, Eastern Bank (bank); Director, The Hanover Insurance Group (property and casualty insurance) | | Significant experience on the Board and on the board of other business organizations (including at a bank and at a property and casualty insurance firm); executive experience (including roles as president and chief executive officer of a research and consulting company) |
| | | | |
Martin T. Meehan
(1956) | | Trustee Since 2012 Contract Review and Governance Committee Member | | Chancellor and faculty member, University of Massachusetts Lowell | | 42 None | | Experience on the Board and on the board of other business organizations; experience as Chancellor of the University of Massachusetts Lowell; government experience (including as a member of the U.S. House of Representatives); academic experience |
| 54
Trustee and Officer Information – continued
| | | | | | | | |
| Name and Year of Birth | | Position(s) Held
with the Trusts,
Length of Time
Served and
Term of Office1 | | Principal
Occupation(s)
During Past 5 Years | | Number of
Portfolios in
Fund Complex
Overseen2 and
Other
Directorships Held
During Past 5 Years | | Experience,
Qualifications,
Attributes, Skills
for Board
Membership |
| | |
| INDEPENDENT TRUSTEES – continued | | | | |
| | | | |
Sandra O. Moose
(1942) | | Chairperson of the Board of Trustees since November 2005 Trustee Since 2003 Ex officio member of the Audit Committee and Contract Review and Governance Committee | | President, Strategic Advisory Services (management consulting) | | 42 Director, Verizon Communications (telecommunications company); Director, AES Corporation (international power company); formerly, Director, Rohm and Haas Company (specialty chemicals) | | Significant experience on the Board and on the board of other business organizations (including at a telecommunications company, an international power company and a specialty chemicals corporation); executive experience (including at a management consulting company) |
| | | | |
Erik R. Sirri
(1958) | | Trustee Since 2009 Audit Committee Member | | Professor of Finance at Babson College; formerly, Director of the Division of Trading and Markets at the Securities and Exchange Commission | | 42 None | | Significant experience on the Board; experience as Director of the Division of Trading and Markets at the Securities and Exchange Commission; academic experience; training as an economist |
| | | | |
Peter J. Smail
(1952) | | Trustee Since 2009 Contract Review and Governance Committee Member | | Retired; formerly, President and Chief Executive Officer of Pyramis Global Advisors (investment management) | | 42 None | | Significant experience on the Board; mutual fund industry and executive experience (including roles as president and chief executive officer for an investment adviser) |
| | | | |
Cynthia L. Walker
(1956) | | Trustee Since 2005 Audit Committee Member | | Deputy Dean for Finance and Administration, Yale University School of Medicine; formerly, Executive Dean for Administration, Harvard Medical School | | 42 None | | Significant experience on the Board; executive experience in a variety of academic organizations (including roles as dean for finance and administration) |
55 |
Trustee and Officer Information – continued
| | | | | | | | |
| Name and Year of Birth | | Position(s) Held
with the Trusts,
Length of Time
Served and
Term of Office1 | | Principal
Occupation(s)
During Past 5 Years | | Number of
Portfolios in
Fund Complex
Overseen2 and
Other
Directorships Held
During Past 5 Years | | Experience,
Qualifications,
Attributes, Skills
for Board
Membership |
| | |
| INTERESTED TRUSTEES | | | | |
| | | | |
Robert J. Blanding3
(1947) 555 California Street San Francisco, CA 94104 | | Trustee Since 2003 President and Chief Executive Officer of Loomis Sayles Funds I since 2002 Chief Executive Officer of Loomis Sayles Funds II since 2002 | | President, Chairman, Director and Chief Executive Officer, Loomis, Sayles & Company, L.P. | | 42 None | | Significant experience on the Board; continuing service as President, Chairman, and Chief Executive Officer of Loomis, Sayles & Company, L.P. |
| | | | |
David L. Giunta4
(1965) | | Trustee Since 2011 President of Loomis Sayles Funds II and Executive Vice President of Loomis Sayles Funds I since 2008 | | President and Chief Executive Officer, NGAM Distribution Corporation, NGAM Advisors, L.P. and NGAM Distribution, L.P. | | 42 None | | Experience on the Board; continuing experience as President and Chief Executive Officer of NGAM Advisors, L.P. |
| | | | |
John T. Hailer5
(1960) | | Trustee Since 2003 | | President and Chief Executive Officer – U.S. and Asia, Natixis Global Asset Management, L.P. | | 42 None | | Significant experience on the Board; continuing experience as President and Chief Executive Officer – U.S. and Asia, Natixis Global Asset Management, L.P. |
| 1 | Each trustee serves until retirement, resignation or removal from the Board. The current retirement age is 72. The position of Chairperson of the Board is appointed for a two-year term. Ms. Moose was appointed to serve an additional two-year term as the Chairperson of the Board on November 18, 2011. |
| 2 | The trustees of the Trusts serve as trustees of a fund complex that includes all series of the Natixis Funds Trust I, Natixis Funds Trust II, Natixis Funds Trust IV and Gateway Trust (collectively, the “Natixis Funds Trusts”), Loomis Sayles Funds I and Loomis Sayles Funds II (collectively, the “Loomis Sayles Funds Trusts”), and Hansberger International Series (collectively, the “Fund Complex”). |
| 3 | Mr. Blanding is deemed an “interested person” of the Trusts because he holds the following positions with an affiliated person of the Trusts: President, Chairman, Director and Chief Executive Officer of Loomis, Sayles & Company, L.P. and Director of Loomis Sayles Investment Asia Pte., Ltd. |
| 4 | Mr. Giunta is deemed an “interested person” of the Trusts because he holds the following positions with an affiliated person of the Trusts: President and Chief Executive Officer of NGAM Distribution Corporation, NGAM Advisors, L.P. and NGAM Distribution, L.P. |
| 5 | Mr. Hailer is deemed an “interested person” of the Trusts because he holds the following positions with an affiliated person of the Trusts: President and Chief Executive Officer – U.S. and Asia, Natixis Global Asset Management, L.P. |
| 56
Trustee and Officer Information – continued
| | | | | | |
| Name and Year of Birth | | Position(s) Held with
the Trusts | | Term of Office1 and
Length of Time Served | | Principal Occupation(s)
During Past 5 Years2 |
|
| OFFICERS OF THE TRUSTS |
| | | |
Coleen Downs Dinneen
(1960) | | Secretary, Clerk and Chief Legal Officer | | Since September 2004 | | Executive Vice President, General Counsel, Secretary and Clerk, NGAM Distribution Corporation, NGAM Advisors, L.P. and NGAM Distribution, L.P. |
| | | |
Daniel J. Fuss
(1933) One Financial Center Boston, MA 02111 | | Executive Vice President | | Since June 2003 | | Vice Chairman and Director, Loomis, Sayles & Company, L.P. |
| | | |
Russell L. Kane
(1969) | | Chief Compliance Officer, Assistant Secretary and Anti-Money Laundering Officer | | Chief Compliance Officer since May 2006; Assistant Secretary since June 2004; and Anti-Money Laundering Officer since April 2007 | | Chief Compliance Officer for Mutual Funds, Senior Vice President, Deputy General Counsel, Assistant Secretary and Assistant Clerk, NGAM Distribution Corporation, NGAM Advisors, L.P. and NGAM Distribution, L.P. |
| | | |
Michael C. Kardok
(1959) | | Treasurer, Principal Financial and Accounting Officer | | Since October 2004 | | Senior Vice President, NGAM Advisors, L.P. and NGAM Distribution, L.P. |
| 1 | Each officer of the Trusts serves for an indefinite term in accordance with the Trusts’ current by-laws until the date his or her successor is elected and qualified, or until he or she sooner dies, retires, is removed or becomes disqualified. |
| 2 | Each person listed above, except as noted, holds the same position(s) with the Fund Complex. Mr. Fuss is not an officer of the Natixis Funds Trusts or the Hansberger International Series. Previous positions during the past five years with NGAM Distribution, L.P., NGAM Advisors, L.P. or Loomis, Sayles & Company, L.P. are omitted, if not materially different from a trustee’s or officer’s current position with such entity. |
57 |
ANNUAL REPORT
September 30, 2013

Loomis Sayles Core Plus Bond Fund
Loomis Sayles High Income Fund
Loomis Sayles International Bond Fund
Loomis Sayles Limited Term Government
and Agency Fund
TABLE OF CONTENTS
Portfolio Review page 1
Portfolio of Investments page 27
Financial Statements page 67
Notes to Financial Statements page 81
LOOMIS SAYLES CORE PLUS BOND FUND
| | | | |
| Managers | | Symbols | | |
| Peter W. Palfrey, CFA | | Class A | | NEFRX |
| Richard G. Raczkowski | | Class B | | NERBX |
| Loomis, Sayles & Company, L.P. | | Class C | | NECRX |
| | Class N | | NERNX |
| | Class Y | | NERYX |
Objective
Seeks high total investment return through a combination of current income and capital appreciation
Strategy
Under normal market conditions, the Fund will invest at least 80% of its net assets in bonds, which include debt securities of any maturity. In addition, the Fund normally will invest primarily in investment-grade securities. The Fund may also invest up to 20% of its assets, at the time of purchase, in bonds rated below investment-grade.
Market Conditions
The 12-month period began with investor attention focused on the November 2012 U.S. presidential election. Soon afterward, fears that the U.S. economy would fall off the “fiscal cliff” took center stage, and investors sought to position themselves for the automatic tax hikes and spending cuts scheduled for January 1, 2013. Ultimately, Congress and the president struck an 11th-hour deal, which helped buoy the markets through the first quarter of 2013. During the second quarter of 2013, the Federal Reserve (the Fed) introduced volatility into the fixed-income markets by indicating a potential winding down of its monthly program of mortgage and U.S. Treasury bond purchases, known as quantitative easing (QE). The magnitude of the resulting selloff and the overall disruption to markets tightened financial conditions significantly. Based on the Fed’s announcement, investors anticipated the Fed would begin tapering QE following the central bank’s September policy meeting. However, the Fed surprised the financial markets and decided to delay action while softening its forward guidance. This announcement led to a rally in equities, emerging market currencies and fixed-income markets. The 12-month period ended September 30, 2013 concluded with renewed uncertainty surrounding Congressional budget and debt-ceiling discussions.
Performance Results
For the 12 months ended September 30, 2013, Class A shares of Loomis Sayles Core Plus Bond Fund returned -0.61%. The fund held up better than its benchmark, the Barclays U.S. Aggregate Bond Index, which returned -1.68%.
1 |
Explanation of Fund Performance
Security selection among investment grade corporate credits, particularly within the industrials sector, proved beneficial to fund return. Also, an overweight position in investment-grade credit, with a bias toward lower-rated investment grade securities and a focus on strong relative value, aided performance. Additionally, out-of-benchmark exposure to high-yield corporates and non-U.S.-dollar-denominated securities contributed strongly to performance. In particular, exposure to higher-rated high-yield credits was the largest contributor to relative performance. Within these quality categories, security selection among financials and industrials provided the bulk of the outperformance. Throughout the period, we opportunistically added to the fund’s non-U.S.-dollar holdings, rotating out of Spain and Italy and added to Portugal. These positions contributed positively to relative performance. In addition, an out-of-benchmark allocation to bank loans aided return. Within the commercial mortgage-backed securities sector, the fund focused on older-production, higher-rated, super-senior structures. These selections, coupled with an overweight allocation versus the benchmark, aided relative performance. Also within the securitized sector, the fund’s overweight allocation to front-end and high-quality asset-backed securities helped performance.
Meanwhile, a longer duration (price sensitivity to interest rate changes) position in U.S. Treasuries and agencies detracted from performance, as rates rose during the period. However, underweight allocations to these sectors slightly offset losses. Within the government sector, the fund continued to have a significant overweight in the long end of the yield curve (a curve that shows the relationship among bonds yields across the maturity spectrum). In addition, the fund had a significant underweight position in mortgage-backed securities relative to the benchmark. Overall, the fund had a bias toward higher-coupon issues in order to capture incremental yield. Nevertheless, this sector detracted from relative performance during the period. The fund’s small allocation to emerging market Yankee corporate bonds (U.S.-dollar-denominated bonds issued by a non-U.S. entity) detracted from relative performance, particularly those issued by Mexican homebuilders.
Outlook
We believe the fund is well positioned to benefit from the ongoing recovery in higher-risk markets in a more range-bound interest rate environment. Going forward, we expect continued slow improvement from peripheral European countries as the European Central Bank and European Union focus on economic recovery, fiscal stabilization and banking reform. We believe Portugal is positioned to benefit the most as investors move back into the higher-yielding markets. While nominal duration remains long versus the market, we have been managing empirical duration (a duration calculation using historical market-based bond prices and Treasury yields) to be slightly short versus the market.
| 2
LOOMIS SAYLES CORE PLUS BOND FUND
Growth of $10,000 Investment in Class A Shares3
September 30, 2003 through September 30, 2013
3 |
Average Annual Total Returns — September 30, 20133
| | | | | | | | | | | | | | | | |
| | | | | |
| | | 1 Year | | | 5 Years | | | 10 Years | | | Since
Class N
Inception | |
| | | | | |
| Class A (Inception 11/7/73) | | | | | | | | | | | | | | | | |
| NAV | | | -0.61 | % | | | 9.49 | % | | | 6.26 | % | | | — | % |
| With 4.50% Maximum Sales Charge | | | -5.10 | | | | 8.48 | | | | 5.77 | | | | — | |
| | | | | |
| Class B (Inception 9/13/93) | | | | | | | | | | | | | | | | |
| NAV | | | -1.32 | | | | 8.67 | | | | 5.48 | | | | — | |
| With CDSC1 | | | -6.03 | | | | 8.38 | | | | 5.48 | | | | — | |
| | | | | |
| Class C (Inception 12/30/94) | | | | | | | | | | | | | | | | |
| NAV | | | -1.36 | | | | 8.68 | | | | 5.48 | | | | — | |
| With CDSC1 | | | -2.30 | | | | 8.68 | | | | 5.48 | | | | | |
| | | | | |
| Class N (Inception 2/1/13) | | | | | | | | | | | | | | | | |
| NAV | | | — | | | | — | | | | — | | | | -2.02 | |
| | | | | |
| Class Y (Inception 12/30/94) | | | | | | | | | | | | | | | | |
| NAV | | | -0.35 | | | | 9.78 | | | | 6.54 | | | | — | |
| | | | | |
| Comparative Performance | | | | | | | | | | | | | | | | |
| Barclays U.S. Aggregate Bond Index2 | | | -1.68 | | | | 5.41 | | | | 4.59 | | | | -1.12 | |
Past performance does not guarantee future results. The table(s) do not reflect taxes shareholders might owe on any fund distributions or when they redeem their shares. Performance for periods less than one year is cumulative, not annualized. Returns reflect changes in share price and reinvestment of dividends and capital gains, if any. Unlike a fund, an index is not managed and does not reflect fees and expenses.
| 1 | Performance for Class B shares assumes a maximum 5% contingent deferred sales charge (“CDSC”) applied when you sell shares, which declines annually between years 1-6 according to the following schedule: 5, 4, 3, 3, 2, 1, 0%. Class C shares performance assumes a 1% CDSC applied when you sell shares within one year of purchase. |
| 2 | Barclays U.S. Aggregate Bond Index is an unmanaged index that covers the U.S.-dollar denominated, investment-grade, fixed-rate, taxable bond market of SEC-registered securities. The index includes bonds from the Treasury, government-related, corporate, mortgage-backed securities, asset-backed securities, and collateralized mortgage-backed securities sectors. |
| 3 | Fund performance has been increased by fee waivers and/or expense reimbursements, if any, without which performance would have been lower. |
| 4
LOOMIS SAYLES HIGH INCOME FUND
| | | | |
| Managers | | Symbols | | |
| Matthew J. Eagan, CFA | | Class A | | NEFHX |
Elaine M. Stokes | | Class B | | NEHBX |
| Loomis, Sayles & Company, L.P. | | Class C | | NEHCX |
| | Class Y | | NEHYX |
Objective
Seeks high current income plus the opportunity for capital appreciation to produce a high total return
Strategy
Under normal market conditions, the Fund will invest at least 65% of its assets in below investment-grade fixed-income securities. The Fund will normally invest at least 65% of its assets in U.S. corporate or U.S. dollar denominated foreign fixed-income securities. The Fund may also invest up to 20% of its assets in foreign currency-denominated fixed-income securities, including those in emerging markets and related currency hedging transactions.
Market Conditions
Central bank policy was the primary force driving markets during the 12-month period ended September 30, 2013. Fiscal issues took center stage early in the period, as investors worried about the “fiscal cliff” of federal tax hikes and spending cuts scheduled to commence on January 1, 2013. Following a last-minute deal that prevented the worst of the fiscal cliff, investor optimism surged at the beginning of 2013. But for much of 2013’s second quarter, the credit markets struggled as the Federal Reserve (the Fed) indicated it might begin tapering its monthly asset purchase program. This led to increased market volatility and declining market liquidity, as investors feared interest rates would rise sooner rather than later. However, the Fed surprised the financial markets by announcing in September it would continue its current pace of bond buying. In response, markets rallied and liquidity improved late in the period. Elsewhere, 2013 opened with the collapse of Cyprus’s two largest banks. By the second quarter, the challenges in Europe, where the economic downturn appeared to stabilize, were overshadowed by an economic slowdown in China. Toward the end of the period, Fed announcements, coupled with weak global growth expectations, triggered foreign market volatility.
Performance Results
For the 12 months ended September 30, 2013, Class A shares of Loomis Sayles High Income Fund returned 6.27%. The fund underperformed its benchmark, Barclays U.S. Corporate High-Yield Bond Index, which returned 7.14% for the period.
5 |
Explanation of Fund Performance
An underweight position in high-yield industrials weighed on the fund’s relative performance. Weaker-than-expected production and rumors of restructuring at a Brazilian oil and gas company led the sector’s declines. Poor performance in the consumer cyclical and communication sectors, as well as positioning along the yield curve (a curve that shows the relationship among bond yields across the maturity spectrum), also detracted from relative return. In addition, a slight overweight position in emerging markets dragged down performance. Positions in Mexico’s homebuilding industry declined due to uncertainty surrounding government policies on housing construction and development. An out-of-benchmark allocation to non-U.S.-dollar-denominated securities detracted from relative performance. Currency exposure to the Brazilian real, Mexican peso and Philippine peso also weighed on results. The fund’s forward contracts, used to hedge currency, performed poorly during the period.
The fund’s position in convertible securities was the strongest contributor to return. Selections within the technology, American automotive and homebuilding sectors generally bolstered results. Underweight positions in high yield also aided relative return. Security selection in the financial and utilities industries contributed modestly to results. In addition, an out-of-benchmark allocation to residential mortgage-backed securities (RMBS) aided portfolio performance. Out-of-benchmark positions in both preferred and common stock also generally increased return as the equity markets surged throughout much of the quarter.
Outlook
Our outlook for the U.S. and global economies remains largely consistent despite political and policy uncertainty. We believe U.S. gross domestic product (GDP) growth will move toward 3.0% next year, based on acceleration in the housing sector as well as momentum in autos and energy. However, deflationary pressures remain a concern in the short run as wage growth is slow, unemployment is still high (though slowly improving), and the output gap remains decidedly negative. Due primarily to weak economic growth, we expect the Fed to maintain accommodative monetary policy and to employ a slow, cautious approach to rate increases. Our forecast for the 10-year U.S. Treasury yield is approximately 2.75% at year-end, moving to 3.25% a year from now.
Several key risks may affect our outlook. We expect to see steady, perhaps even increased, volatility during the final quarter of 2013. Investor anxiety regarding upcoming economic releases and their impact on future Fed policy will likely contribute to market turbulence. The U.S. government shutdown and debt ceiling debates will likely occupy the headlines, adding another source of volatility. Europe remains an ongoing concern; however, economic and fiscal conditions appear stable for now.
Based on our long-term views, we have not made material asset allocation changes. Our strategy centers on research-based security selection, with a focus on sectors that can be uncorrelated with U.S. interest rates, and we continue to build diversification into the fund. We intend to maintain reduced term structure risk and continue to decrease nominal
| 6
LOOMIS SAYLES HIGH INCOME FUND
duration through sector and security selection. The fund’s ability to invest in what we view as the best risk-adjusted opportunities across a full range of global markets, sectors and securities may be an advantage as the economic recovery unfolds and the investment landscape evolves.
Growth of $10,000 Investment in Class A Shares3
September 30, 2003 through September 30 2013
7 |
Average Annual Total Returns — September 30, 20133
| | | | | | | | | | | | | | | | |
| | | | | |
| | | 1 Year | | | 5 Years | | | 10 Years | | | Since
Class Y
Inception | |
| | | | | |
| Class A (Inception 2/22/84) | | | | | | | | | | | | | | | | |
| NAV | | | 6.27 | % | | | 11.02 | % | | | 8.09 | % | | | — | % |
| With 4.50% Maximum Sales Charge | | | 1.42 | | | | 10.00 | | | | 7.59 | | | | — | |
| | | | | |
| Class B (Inception 9/20/93) | | | | | | | | | | | | | | | | |
| NAV | | | 5.66 | | | | 10.19 | | | | 7.30 | | | | — | |
| With CDSC1 | | | 0.66 | | | | 9.92 | | | | 7.30 | | | | — | |
| | | | | |
| Class C (Inception 3/2/98) | | | | | | | | | | | | | | | | |
| NAV | | | 5.46 | | | | 10.23 | | | | 7.30 | | | | — | |
| With CDSC1 | | | 4.46 | | | | 10.23 | | | | 7.30 | | | | — | |
| | | | | |
| Class Y (Inception 2/29/08) | | | | | | | | | | | | | | | | |
| NAV | | | 6.56 | | | | 11.26 | | | | — | | | | 8.16 | |
| | | | | |
| Comparative Performance | | | | | | | | | | | | | | | | |
| Barclays U.S. Corporate High-Yield Bond Index2 | | | 7.14 | | | | 13.53 | | | | 8.86 | | | | 10.47 | |
Past performance does not guarantee future results. The table(s) do not reflect taxes shareholders might owe on any fund distributions or when they redeem their shares. Performance for periods less than one year is cumulative, not annualized. Returns reflect changes in share price and reinvestment of dividends and capital gains, if any. Unlike a fund, an index is not managed and does not reflect fees and expenses.
| 1 | Performance for Class B shares assumes a maximum 5% contingent deferred sales charge (“CDSC”) applied when you sell shares, which declines annually between years 1-6 according to the following schedule: 5, 4, 3, 3, 2, 1, 0%. Class C shares performance assumes a 1% CDSC applied when you sell shares within one year of purchase. |
| 2 | Barclays U.S. Corporate High-Yield Bond Index is an unmanaged index that covers the U.S. dollar-denominated, non-investment grade, fixed-rate, taxable corporate bond market. |
| 3 | Fund performance has been increased by fee waivers and/or expense reimbursements, if any, without which performance would have been lower. |
| 8
LOOMIS SAYLES INTERNATIONAL BOND FUND
| | | | |
| Managers | | Symbols | | |
| Kenneth M. Buntrock, CFA, CIC | | Class A | | LSIAX |
| David W. Rolley, CFA | | Class C | | LSICX |
| Lynda L. Schweitzer, CFA | | Class Y | | LSIYX |
| Loomis, Sayles & Company, L.P. | | |
Objective
Seeks high total return through a combination of high current income and capital appreciation
Strategy
Under normal market conditions, the Fund expects to invest at least 80% of its net assets in fixed income securities. The Fund is non-diversified, which means that it may invest a greater percentage of its assets in a particular issuer and may invest in fewer issuers than a diversified fund. The Fund invests primarily (at least 65% of its net assets) in fixed-income securities of issuers located outside the United States, including issuers located in emerging market countries. The Fund invests primarily in investment-grade fixed-income securities. The Fund may invest up to 35% of its assets in below investment-grade fixed-income securities.
Market Conditions
Central bank policy was the primary force driving financial markets during the 12-month period ended September 30, 2013. Bond purchasing programs by the Federal Reserve (the Fed) and the European Central Bank (ECB) drove down yields in most markets during 2012 and the first few months of 2013. This caused investors to search for returns in the corporate credit markets, where balance sheets were improving despite slow aggregate macroeconomic growth. As a result, investment-grade corporates finished 2012 and began 2013 performing quite well as spreads tightened in the United States, the UK and the euro zone. This “risk-on” environment favored lower quality issues and emerging markets. The tide began to change during 2013’s second quarter, when the Fed indicated it might begin tapering its asset purchase program, causing credit markets to reverse course. The Fed’s announcement increased market volatility and reduced market liquidity, affecting emerging markets in particular, which gave back substantial portions of recent gains. However, the Fed surprised financial markets by announcing in September it would continue its current pace of bond buying. The Fed’s “dovish” surprise provided relief to some riskier currencies and bonds through the end of the period.
European economic indicators generally remained soft but improved late in the period, as the euro zone slowly started climbing out of its second recession since 2008. Disinflationary pressures from the peripheral countries remained, with headline inflation below the European Central Bank’s 2.0% target. The ECB has stuck to its forward guidance that rates would stay low for an “extended period.”
9 |
Overall, global economic data continued to improve. Although China’s economic slowdown stabilized, we believe China will be held back by its efforts to deleverage. China remains saddled with too much bad credit, monetary policy has been restrained and market reforms have been complex.
Performance Results
For the 12 months ended September 30, 2013, Class A shares of Loomis Sayles International Bond Fund returned -2.62%. The fund held up better than its benchmark, the Barclays Global Aggregate ex-US Dollar Bond Index, which returned -3.39%.
Explanation of Fund Performance
Security selection, sector allocation decisions and active currency exposures generally accounted for the fund’s performance advantage over its benchmark. From a currency perspective, underweight allocations to the Australian dollar and the Japanese yen aided performance. Overweight exposure to South Korea’s won and an out-of-benchmark position in Uruguay’s peso also contributed positively. In addition, our preference for corporates over government issues proved beneficial, as did security selection within the corporate sector. Specifically, holdings in the U.S. banking and basic industry areas and in the European banking and communication sectors helped performance. Positioning along the yield curve (a curve that shows the relationship among bond yields across the maturity spectrum) was an additional source of return. Notably, euro-denominated Treasuries, which had an overall longer-than-benchmark duration (price sensitivity to interest rate changes), were particularly helpful.
Country allocation detracted from relative performance, largely due to underweight positions in euro markets and overweight positions in Norway and Singapore. Additionally, overweight currency exposures to the British pound and the Malaysian ringgit, along with an underweight allocation to the euro, weighed on performance. Selections among U.K. corporates also dragged down relative performance.
Outlook
We believe the credit cycle is in the early stage of expansion. Credit fundamentals appear strong, but they may be peaking as profit margins come under modest pressure. Bond yields should rise as the global economy improves, but this may come in fits and starts. We also expect the pace of growth to be inconsistent. We recognize the credit cycle may not advance exactly as we expect, but we do expect corporate bonds will continue to outperform Treasuries. We therefore remain comfortable continuing to overweight the corporate sector, seeking companies with strong fundamentals and favorable risk/reward profiles Concerns surrounding slow growth in China have made us increasingly cautious of non-Japan Asian currencies, and we have decreased the fund’s overweight. Recent volatility in emerging markets is restoring value, but careful security selection remains critical, as softer growth prospects, higher inflation and weaker terms of trade have challenged the asset class. Overall, we expect countries with the ability to implement major structural reforms to continue to outperform.
| 10
LOOMIS SAYLES INTERNATIONAL BOND FUND
Growth of $10,000 Investment in Class A Shares3
February 1, 2008 (inception) through September 30, 2013
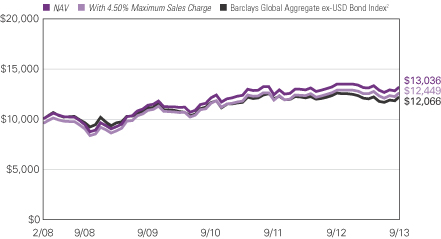
11 |
Average Annual Total Returns — September 30, 20133
| | | | | | | | | | | | |
| | | | |
| | | 1 Year | | | 5 Years | | | Since Inception | |
| | | | |
| Class A (Inception 2/1/08) | | | | | | | | | | | | |
| NAV | | | -2.62 | % | | | 6.85 | % | | | 4.80 | % |
| With 4.50% Maximum Sales Charge | | | -6.99 | | | | 5.87 | | | | 3.95 | |
| | | | |
| Class C (Inception 2/1/08) | | | | | | | | | | | | |
| NAV | | | -3.27 | | | | 6.07 | | | | 4.01 | |
| With CDSC1 | | | -4.21 | | | | 6.07 | | | | 4.01 | |
| | | | |
| Class Y (Inception 2/1/08) | | | | | | | | | | | | |
| NAV | | | -2.34 | | | | 7.14 | | | | 5.05 | |
| | | | |
| Comparative Performance | | | | | | | | | | | | |
| Barclays Global Aggregate ex-USD Bond Index2 | | | -3.39 | | | | 4.80 | | | | 3.38 | |
Past performance does not guarantee future results. The table(s) do not reflect taxes shareholders might owe on any fund distributions or when they redeem their shares. Performance for periods less than one year is cumulative, not annualized. Returns reflect changes in share price and reinvestment of dividends and capital gains, if any. Unlike a fund, an index is not managed and does not reflect fees and expenses.
| 1 | Class C shares performance assumes a 1% CDSC applied when you sell shares within one year of purchase. |
| 2 | Barclays Global Aggregate ex-USD Bond Index is an unmanaged index that provides a broad-based measure of the international investment-grade fixed-rate debt markets. |
| 3 | Fund performance has been increased by fee waivers and/or expense reimbursements, if any, without which performance would have been lower. |
| 12
LOOMIS SAYLES LIMITED TERM GOVERNMENT AND AGENCY FUND
| | | | |
| Managers | | Symbols | | |
| Christopher T. Harms | | Class A | | NEFLX |
| Clifton V. Rowe, CFA | | Class B | | NELBX |
| Kurt Wagner, CFA, CIC | | Class C | | NECLX |
| Loomis, Sayles & Company, L.P. | | Class Y | | NELYX |
Objective
Seeks a high current return consistent with preservation of capital
Strategy
Invests at least 80% of its net assets in securities issued or guaranteed by the U.S. government, its agencies or instrumentalities
Market Conditions
Mounting concerns about the timing of the Federal Reserve’s (the Fed’s) exit strategy from its program of monthly mortgage and U.S. Treasury securities purchases, known as quantitative-easing (QE), put downward pressure on agency mortgage-backed securities (MBS). Agency MBS outperformed Treasuries in spite of widening spreads (the yield difference between non-Treasury and Treasury securities) that occurred in the sector.
Despite bouts of volatility throughout the year, credit-sensitive assets, including commercial mortgage-backed securities (CMBS) and asset-backed securities (ABS), generally outperformed Treasuries with similar durations (price sensitivity to interest rate changes). After approaching 12-month highs in early July, CMBS spreads narrowed in the third quarter of 2013 and ended the period tighter than they were at the end of September 2012.
Since hitting record lows in May 2013, intermediate- and long-term U.S. Treasury yields increased on growing expectations that the Fed would scale back QE in September. Overall, the yield on the 10-year Treasury note increased nearly one percentage point during the 12-month period ended September 30, 2013. However, following its September policy meeting, the Fed surprised the financial markets by announcing it was taking no immediate action, which led to a rally in the fixed-income markets at the end of the period.
Performance Results
For the 12 months ended September 30, 2013, Class A shares of Loomis Sayles Limited Term Government and Agency Fund returned -0.81%. The fund underperformed its benchmark, the Barclays U.S. 1-5 Year Government Bond Index, which was flat, with a 0.00% return for the same period.
13 |
Explanation of Fund Performance
Positioning along the yield curve (a curve that shows the relationship among bond yields across the maturity spectrum) was the primary detractor from relative performance. Given the rise in rates during the period, longer-duration bonds experienced greater price depreciation relative to shorter-duration bonds. The bulk of the negative performance due to yield curve positioning came from the fund’s agency MBS allocation.
The fund’s CMBS holdings provided the largest positive contribution to relative performance during the period, as the sector outperformed U.S. government securities on a duration-adjusted basis (which considers a security’s return relative to similar-duration Treasuries). In addition, agency MBS, including mortgage pass-through securities and other structured bonds, performed well and contributed positively to performance. Similar to CMBS, ABS performed well during the period, outperforming Treasury and agency bonds. As a result, the fund’s modest allocation had a positive effect on relative performance.
Outlook
We believe the tight credit restrictions currently prevalent in the mortgage refinance market have the potential to provide agency MBS some relief during periods of declining interest rates. But, rising rates likely will have a negative effect on the agency MBS universe. We also expect ABS to benefit from solid underlying credit fundamentals, and we believe the sector offers attractive yield advantages. We believe CMBS spreads remain attractive, given the high quality of the bonds. As the commercial real estate market recovers, this sector should continue to offer attractive opportunities.
| 14
LOOMIS SAYLES LIMITED TERM GOVERNMENT AND AGENCY FUND
Growth of $10,000 Investment in Class A Shares3
September 30, 2003 through September 30, 2013
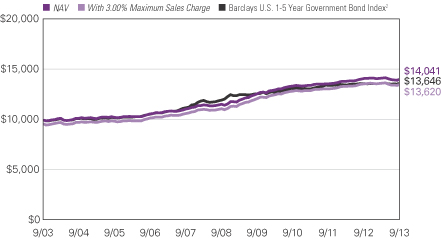
15 |
Average Annual Total Returns — September 30, 20133
| | | | | | | | | | | | |
| | | | |
| | | 1 Year | | | 5 Years | | | 10 Years | |
| | | | |
| Class A (Inception 1/3/89) | | | | | | | | | | | | |
| NAV | | | -0.81 | % | | | 3.93 | % | | | 3.45 | % |
| With 3.00% Maximum Sales Charge | | | -3.77 | | | | 3.30 | | | | 3.13 | |
| | | | |
| Class B (Inception 9/27/93) | | | | | | | | | | | | |
| NAV | | | -1.56 | | | | 3.16 | | | | 2.68 | |
| With CDSC1 | | | -6.41 | | | | 2.80 | | | | 2.68 | |
| | | | |
| Class C (Inception 12/30/94) | | | | | | | | | | | | |
| NAV | | | -1.55 | | | | 3.16 | | | | 2.69 | |
| With CDSC1 | | | -2.52 | | | | 3.16 | | | | 2.69 | |
| | | | |
| Class Y (Inception 3/31/94) | | | | | | | | | | | | |
| NAV | | | -0.56 | | | | 4.20 | | | | 3.70 | |
| | | | |
| Comparative Performance | | | | | | | | | | | | |
| Barclays U.S. 1-5 Year Government Bond Index2 | | | 0.00 | | | | 2.60 | | | | 3.16 | |
Past performance does not guarantee future results. The table(s) do not reflect taxes shareholders might owe on any fund distributions or when they redeem their shares. Performance for periods less than one year is cumulative, not annualized. Returns reflect changes in share price and reinvestment of dividends and capital gains, if any. Unlike a fund, an index is not managed and does not reflect fees and expenses.
| 1 | Performance for Class B shares assumes a maximum 5% contingent deferred sales charge (“CDSC”) applied when you sell shares, which declines annually between years 1-6 according to the following schedule: 5, 4, 3, 3, 2, 1, 0%. Class C shares performance assumes a 1% CDSC applied when you sell shares within one year of purchase. |
| 2 | Barclays U.S. 1-5 Year Government Bond Index is an unmanaged index that includes U.S. Treasury and agency securities with remaining maturities of one to five years. |
| 3 | Fund performance has been increased by fee waivers and/or expense reimbursements, if any, without which performance would have been lower. |
| 16
ADDITIONAL INFORMATION
The views expressed in this report reflect those of the portfolio managers as of the dates indicated. The managers’ views are subject to change at any time without notice based on changes in market or other conditions. References to specific securities or industries should not be regarded as investment advice. Because the(se) fund(s) is/are actively managed, there is no assurance that they will continue to invest in the securities or industries mentioned.
ADDITIONAL INDEX INFORMATION
This document may contain references to third party copyrights, indexes, and trademarks, each of which is the property of its respective owner. Such owner is not affiliated with Natixis Global Asset Management or any of its related or affiliated companies (collectively “NGAM”) and does not sponsor, endorse or participate in the provision of any NGAM services, funds or other financial products.
The index information contained herein is derived from third parties and is provided on an “as is” basis. The user of this information assumes the entire risk of use of this information. Each of the third party entities involved in compiling, computing or creating index information disclaims all warranties (including, without limitation, any warranties of originality, accuracy, completeness, timeliness, non-infringement, merchantability and fitness for a particular purpose) with respect to such information.
PROXY VOTING INFORMATION
A description of the funds’ proxy voting policies and procedures is available without charge, upon request, by calling Natixis Funds at 800-225-5478; on the funds’ website at ngam.natixis.com; and on the Securities and Exchange Commission’s (SEC’s) website at www.sec.gov. Information regarding how the funds voted proxies relating to portfolio securities during the 12-month period ended June 30, 2013 is available from the funds’ website and the SEC’s website.
QUARTERLY PORTFOLIO SCHEDULES
The funds file a complete schedule of portfolio holdings with the SEC for the first and third quarters of each fiscal year on Form N-Q. The funds’ Forms N-Q are available on the SEC’s website at www.sec.gov and may be reviewed and copied at the SEC’s Public Reference Room in Washington, DC. Information on the operation of the Public Reference Room may be obtained by calling 800-SEC-0330.
17 |
UNDERSTANDING FUND EXPENSES
As a mutual fund shareholder, you incur different costs: transaction costs, including sales charges (loads) on purchases and contingent deferred sales charges on redemptions, and ongoing costs, including management fees, distribution and/or service fees (12b-1 fees), and other fund expenses. Certain exemptions may apply. These costs are described in more detail in the funds’ prospectuses. The following examples are intended to help you understand the ongoing costs of investing in the funds and help you compare these with the ongoing costs of investing in other mutual funds.
The first line in the table of each class of fund shares shows the actual account values and actual fund expenses you would have paid on a $1,000 investment in the fund from April 1, 2013 through September 30, 2013. To estimate the expenses you paid over the period, simply divide your account value by $1,000 (for example $8,600 account value divided by $1,000 = 8.60) and multiply the result by the number in the Expenses Paid During Period column as shown below for your class.
The second line in the table of each class of fund shares provides information about hypothetical account values and hypothetical expenses based on the fund’s actual expense ratios and an assumed rate of return of 5% per year before expenses, which is not the fund’s actual return. The hypothetical account values and expenses may not be used to estimate the actual ending account balance or expenses you paid on your investment for the period. You may use this information to compare the ongoing costs of investing in the fund and other funds. To do so, compare this 5% hypothetical example with the 5% hypothetical examples that appear in the shareholder reports of the other funds.
Please note that the expenses shown reflect ongoing costs only, and do not include any transaction costs such as sales charges. Therefore, the second line in the table of each fund is useful in comparing ongoing costs only, and will not help you determine the relative costs of owning different funds. If transaction costs were included, total costs would be higher.
| 18
| | | | | | | | | | | | |
| LOOMIS SAYLES CORE PLUS BOND FUND | | BEGINNING
ACCOUNT VALUE
4/1/2013 | | | ENDING
ACCOUNT VALUE
9/30/2013 | | | EXPENSES PAID
DURING PERIOD*
4/1/2013 – 9/30/2013 | |
| Class A | | | | | | | | | | | | |
| Actual | | | $1,000.00 | | | | $972.90 | | | | $3.91 | |
| Hypothetical (5% return before expenses) | | | $1,000.00 | | | | $1,021.11 | | | | $4.00 | |
| Class B | | | | | | | | | | | | |
| Actual | | | $1,000.00 | | | | $969.10 | | | | $7.60 | |
| Hypothetical (5% return before expenses) | | | $1,000.00 | | | | $1,017.35 | | | | $7.79 | |
| Class C | | | | | | | | | | | | |
| Actual | | | $1,000.00 | | | | $969.90 | | | | $7.60 | |
| Hypothetical (5% return before expenses) | | | $1,000.00 | | | | $1,017.35 | | | | $7.79 | |
| Class N | | | | | | | | | | | | |
| Actual | | | $1,000.00 | | | | $974.40 | | | | $2.18 | |
| Hypothetical (5% return before expenses) | | | $1,000.00 | | | | $1,022.86 | | | | $2.23 | |
| Class Y | | | | | | | | | | | | |
| Actual | | | $1,000.00 | | | | $974.30 | | | | $2.67 | |
| Hypothetical (5% return before expenses) | | | $1,000.00 | | | | $1,022.36 | | | | $2.74 | |
| * | Expenses are equal to the Fund’s annualized expense ratio (after waiver/reimbursement): 0.79%, 1.54%, 1.54%, 0.44% and 0.54% for Class A, B, C, N and Y, respectively, multiplied by the average account value over the period, multiplied by the number of days in the most recent fiscal half-year (183), divided by 365 (to reflect the half-year period). |
19 |
| | | | | | | | | | | | |
| LOOMIS SAYLES HIGH INCOME FUND | | BEGINNING
ACCOUNT VALUE
4/1/2013 | | | ENDING
ACCOUNT VALUE
9/30/2013 | | | EXPENSES PAID
DURING PERIOD*
4/1/2013 – 9/30/2013 | |
| Class A | | | | | | | | | | | | |
| Actual | | | $1,000.00 | | | | $983.10 | | | | $5.72 | |
| Hypothetical (5% return before expenses) | | | $1,000.00 | | | | $1,019.30 | | | | $5.82 | |
| Class B | | | | | | | | | | | | |
| Actual | | | $1,000.00 | | | | $979.30 | | | | $9.43 | |
| Hypothetical (5% return before expenses) | | | $1,000.00 | | | | $1,015.54 | | | | $9.60 | |
| Class C | | | | | | | | | | | | |
| Actual | | | $1,000.00 | | | | $979.40 | | | | $9.43 | |
| Hypothetical (5% return before expenses) | | | $1,000.00 | | | | $1,015.54 | | | | $9.60 | |
| Class Y | | | | | | | | | | | | |
| Actual | | | $1,000.00 | | | | $982.30 | | | | $4.47 | |
| Hypothetical (5% return before expenses) | | | $1,000.00 | | | | $1,020.56 | | | | $4.56 | |
| * | Expenses are equal to the Fund’s annualized expense ratio: 1.15%, 1.90%, 1.90% and 0.90% for Class A, B, C and Y, respectively, multiplied by the average account value over the period, multiplied by the number of days in the most recent fiscal half-year (183), divided by 365 (to reflect the half-year period). |
| | | | | | | | | | | | |
LOOMIS SAYLES INTERNATIONAL
BOND FUND | | BEGINNING
ACCOUNT VALUE
4/1/2013 | | | ENDING
ACCOUNT VALUE
9/30/2013 | | | EXPENSES PAID
DURING PERIOD*
4/1/2013 – 9/30/2013 | |
| Class A | | | | | | | | | | | | |
| Actual | | | $1,000.00 | | | | $1,002.20 | | | | $5.27 | |
| Hypothetical (5% return before expenses) | | | $1,000.00 | | | | $1,019.80 | | | | $5.32 | |
| Class C | | | | | | | | | | | | |
| Actual | | | $1,000.00 | | | | $999.50 | | | | $9.02 | |
| Hypothetical (5% return before expenses) | | | $1,000.00 | | | | $1,016.04 | | | | $9.10 | |
| Class Y | | | | | | | | | | | | |
| Actual | | | $1,000.00 | | | | $1,003.80 | | | | $4.02 | |
| Hypothetical (5% return before expenses) | | | $1,000.00 | | | | $1,021.06 | | | | $4.05 | |
| * | Expenses are equal to the Fund's annualized expense ratio (after waiver/reimbursement): 1.05%, 1.80% and 0.80% for Class A, C and Y, respectively, multiplied by the average account value over the period, multiplied by the number of days in the most recent fiscal half-year (183), divided by 365 (to reflect the half-year period). |
| 20
| | | | | | | | | | | | |
LOOMIS SAYLES LIMITED TERM
GOVERNMENT AND AGENCY FUND | | BEGINNING
ACCOUNT VALUE
4/1/2013 | | | ENDING
ACCOUNT VALUE
9/30/2013 | | | EXPENSES PAID
DURING PERIOD*
4/1/2013 – 9/30/2013 | |
| Class A | | | | | | | | | | | | |
| Actual | | | $1,000.00 | | | | $989.10 | | | | $4.14 | |
| Hypothetical (5% return before expenses) | | | $1,000.00 | | | | $1,020.91 | | | | $4.20 | |
| Class B | | | | | | | | | | | | |
| Actual | | | $1,000.00 | | | | $986.20 | | | | $7.87 | |
| Hypothetical (5% return before expenses) | | | $1,000.00 | | | | $1,017.15 | | | | $7.99 | |
| Class C | | | | | | | | | | | | |
| Actual | | | $1,000.00 | | | | $985.40 | | | | $7.86 | |
| Hypothetical (5% return before expenses) | | | $1,000.00 | | | | $1,017.15 | | | | $7.99 | |
| Class Y | | | | | | | | | | | | |
| Actual | | | $1,000.00 | | | | $991.20 | | | | $2.85 | |
| Hypothetical (5% return before expenses) | | | $1,000.00 | | | | $1,022.21 | | | | $2.89 | |
| * | Expenses are equal to the Fund’s annualized expense ratio (after waiver/reimbursement): 0.83%, 1.58%, 1.58% and 0.57% for Class A, B, C and Y, respectively, multiplied by the average account value over the period, multiplied by the number of days in the most recent fiscal half-year (183), divided by 365 (to reflect the half-year period). |
21 |
BOARD APPROVAL OF THE EXISTING ADVISORY AGREEMENTS
The Board of Trustees of the Trusts (the “Board”), including the Independent Trustees, considers matters bearing on each Fund’s advisory agreement and, with respect to the Loomis Sayles Core Plus Bond Fund, its Advisory Administration Agreement (collectively, the “Agreements”) at most of its meetings throughout the year. Each year, usually in the spring, the Contract Review and Governance Committee of the Board meets to review the Agreements to determine whether to recommend that the full Board approve the continuation of the Agreements, typically for an additional one-year period. After the Committee has made its recommendation, the full Board, including the Independent Trustees, determines whether to approve the continuation of the Agreements.
In connection with these meetings, the Trustees receive materials that the Funds’ investment adviser (the “Adviser”) believes to be reasonably necessary for the Trustees to evaluate the Agreements. These materials generally include, among other items, (i) information on the investment performance of the Funds and the performance of peer groups of funds and the Funds’ performance benchmarks, (ii) information on the Funds’ advisory fees and other expenses, including information comparing the Funds’ expenses to the fees charged to institutional accounts with similar strategies managed by the Adviser, if any, and to those of peer groups of funds and information about any applicable expense caps and fee “breakpoints,” (iii) sales and redemption data in respect of the Funds, (iv) information about the profitability of the Agreements to the Adviser and (v) information obtained through the completion by the Adviser of a questionnaire distributed on behalf of the Trustees. The Board, including the Independent Trustees, also consider other matters such as (i) the Adviser’s financial results and financial condition, (ii) each Fund’s investment objective and strategies and the size, education and experience of the Adviser’s investment staff and its use of technology, external research and trading cost measurement tools, (iii) arrangements in respect of the distribution of the Funds’ shares and the related costs, (iv) the procedures employed to determine the value of the Funds’ assets, (v) the allocation of the Funds’ brokerage, if any, including, if applicable, allocations to brokers affiliated with the Adviser and the use of “soft” commission dollars to pay Fund expenses and to pay for research and other similar services, (vi) the resources devoted to, and the record of compliance with, the Funds’ investment policies and restrictions, policies on personal securities transactions and other compliance policies, (vii) information about amounts invested by the Funds’ portfolio managers in the Funds or in similar accounts that they manage and (viii) the general economic outlook with particular emphasis on the mutual fund industry. Throughout the process, the Trustees are afforded the opportunity to ask questions of and request additional materials from the Adviser.
In addition to the materials requested by the Trustees in connection with their annual consideration of the continuation of the Agreements, the Trustees receive materials in advance of each regular quarterly meeting of the Board that provide detailed information about the Funds’ investment performance and the fees charged to the Funds for advisory and other services. This information generally includes, among other things, an internal performance rating for each Fund based on agreed-upon criteria, graphs showing each Fund’s performance and fee differentials against each Fund’s peer group/category,
| 22
performance ratings provided by a third-party, total return information for various periods, and third-party performance rankings for various periods comparing a Fund against similarly categorized funds. The portfolio management team for each Fund or other representatives of the Adviser make periodic presentations to the Contract Review and Governance Committee and/or the full Board, and Funds identified as presenting possible performance concerns may be subject to more frequent board presentations and reviews. In addition, each quarter the Trustees are provided with detailed statistical information about each Fund’s portfolio. The Trustees also receive periodic updates between meetings.
The Board most recently approved the continuation of the Agreements at their meeting held in June 2013. The Agreements were continued for a one-year period for the Funds. In considering whether to approve the continuation of the Agreements, the Board, including the Independent Trustees, did not identify any single factor as determinative. Individual Trustees may have evaluated the information presented differently from one another, giving different weights to various factors. Matters considered by the Trustees, including the Independent Trustees, in connection with their approval of the Agreements included, but were not limited to, the factors listed below.
The nature, extent and quality of the services provided to the Funds under the Agreements. The Trustees considered the nature, extent and quality of the services provided by the Adviser and its affiliates to the Funds and the resources dedicated to the Funds by the Adviser and its affiliates.
The Trustees considered not only the advisory services provided by the Adviser to the Funds, but also the administrative services provided by NGAM Advisors, L.P. (“NGAM Advisors”) and its affiliates to the Funds.
For each Fund, the Trustees also considered the benefits to shareholders of investing in a mutual fund that is part of a family of funds that offers shareholders the right to exchange shares of one type of fund for shares of another type of fund, and provides a variety of fund and shareholder services.
After reviewing these and related factors, the Trustees concluded, within the context of their overall conclusions regarding each of the Agreements, that the nature, extent and quality of services provided supported the renewal of the Agreements.
Investment performance of the Funds and the Adviser. As noted above, the Trustees received information about the performance of the Funds over various time periods, including information that compared the performance of the Funds to the performance of peer groups and categories of funds and the Funds’ respective performance benchmarks. In addition, the Trustees also reviewed data prepared by an independent third party that analyzed the performance of the Funds using a variety of performance metrics, including metrics that also measured the performance of the Funds on a risk adjusted basis.
With respect to each Fund, the Board concluded that the Fund’s performance or other relevant factors supported the renewal of the Agreement relating to that Fund. In the case of the Loomis Sayles High Income Fund, the performance of which lagged that of a relevant peer group median and/or category median for certain (although not necessarily all) periods, the Board concluded that other factors relevant to performance supported renewal of the Agreements. These factors included the following: (1) that the underperformance
23 |
was attributable, to a significant extent, to investment decisions (such as security selection or sector allocation) by the Adviser that was reasonable and consistent with the Fund’s investment objective and policies and (2) that the Fund’s performance, although lagging in certain periods, was competitive when compared to its relevant performance benchmark and peer group.
The Trustees also considered the Adviser’s performance and reputation generally, the performance of the fund family generally, and the historical responsiveness of the Adviser to Trustee concerns about performance and the willingness of the Adviser to take steps intended to improve performance.
After reviewing these and related factors, the Trustees concluded, within the context of their overall conclusions regarding each of the Agreements, that the performance of the Funds and the Adviser and/or other relevant factors supported the renewal of the Agreements.
The costs of the services to be provided and profits to be realized by the Adviser and its affiliates from their respective relationships with the Funds. The Trustees considered the fees charged to the Funds for advisory services as well as the total expense levels of the Funds. This information included comparisons (provided both by management and also by an independent third party) of the Funds’ advisory fees and total expense levels to those of their peer groups and information about the advisory fees charged by the Adviser to comparable accounts (such as institutional separate accounts), as well as information about differences in such fees and the reasons for any such differences. In considering the fees charged to comparable accounts, the Trustees considered, among other things, management’s representations about the differences between managing mutual funds as compared to other types of accounts, including the additional resources required to effectively manage and the greater regulatory costs associated with the management of mutual fund assets. In evaluating each fund’s advisory fee, the Trustees also took into account the demands, complexity and quality of the investment management of such Fund, as well as the need for the Adviser to offer competitive compensation and to expend additional resources as the Funds grow in size. The Trustees considered that over the past several years, management had made recommendations regarding reductions in advisory fee rates, implementation of advisory fee breakpoints and the institution of advisory fee waivers and expense caps for various funds in the fund family. They noted that all of the Funds in this report have expense caps in place, and the Trustees considered the amounts waived or reimbursed by the Adviser under these caps for each Fund whose current expenses are above the cap. The Trustees noted that certain Funds had advisory fee rates that were above the median of a peer group of funds. The Trustees considered the factors which management believed justified such relatively higher fees. These factors varied from Fund to Fund, but included one or more of the following: (1) the Fund’s advisory fee rate was not significantly above its peer group median; and (2) the Fund’s net expense ratio was near or at the peer group median. The Trustees considered management’s proposals to institute lower expense caps and revised management fee schedules for the Loomis Sayles Core Plus Bond Fund and the Loomis Sayles Limited Term Government and Agency Fund that will reduce their advisory fees and add an additional breakpoint to each of these Fund’s advisory fees.
| 24
The Trustees also considered the compensation directly or indirectly received or to be received by the Adviser and its affiliates from their relationships with the Funds. The Trustees reviewed information provided by management as to the profitability of the Adviser’s and its affiliates’ relationships with the Funds, and information about the allocation of expenses used to calculate profitability. They also reviewed information provided by management about the effect of distribution costs and changes in asset levels on Adviser profitability, including information regarding resources spent on distribution activities. When reviewing profitability, the Trustees also considered information about court cases in which adviser compensation or profitability were issues and the performance of the relevant Funds, the expense levels of the Funds, whether the Adviser had implemented breakpoints and/or expense caps with respect to such Funds.
After reviewing these and related factors, the Trustees concluded, within the context of their overall conclusions regarding each of the Agreements, that the advisory fee charged to each of the Funds was fair and reasonable, and that the costs of these services generally and the related profitability of the Adviser and its affiliates in respect of their relationships with the Funds supported the renewal of the Agreements.
Economies of Scale. The Trustees considered the existence of any economies of scale in the provision of services by the Adviser and whether those economies are shared with the Funds through breakpoints in their investment advisory fees or other means, such as expense waivers or caps. The Trustees also discussed with management the factors considered with respect to the implementation of breakpoints in investment advisory fees or expense waivers or caps for certain funds. Management explained that a number of factors are taken into account in considering the possible implementation of breakpoints or an expense cap for a fund, including, among other things, factors such as a fund’s assets, the projected growth of a fund, projected profitability and a fund’s fees and performance. With respect to economies of scale, the Trustees noted that the Loomis Sayles Core Plus Bond Fund and the Loomis Sayles Limited Term Government and Agency Fund are subject to breakpoints in their respective advisory fees. The Trustees further noted that each of the Funds was subject to an expense cap or waiver, and that management had proposed to reduce the expense caps of the Loomis Sayles Core Plus Bond Fund and the Loomis Sayles Limited Term Government and Agency Fund and to add an additional breakpoint to each of these Fund’s advisory fees. In considering these issues, the Trustees also took note of the costs of the services provided (both on an absolute and a relative basis) and the profitability to the Adviser and its affiliates of their relationships with the Funds, as discussed above.
After reviewing these and related factors, the Trustees concluded, within the context of their overall conclusions regarding each of the Agreements, that the extent to which economies of scale were shared with the Funds supported the renewal of the Agreements.
The Trustees also considered other factors, which included but were not limited to the following:
| · | | The effect of recent market and economic events on the performance, asset levels and expense ratios of each Fund. |
| · | | Whether each Fund has operated in accordance with its investment objective and the Fund’s record of compliance with its investment restrictions, and the compliance |
25 |
| | programs of the Funds and the Adviser. They also considered the compliance-related resources the Adviser and its affiliates were providing to the Funds. |
| · | | The nature, quality, cost and extent of administrative and shareholder services performed by the Adviser and its affiliates, both under the Agreements and under separate agreements covering administrative services. |
| · | | So-called “fallout benefits” to the Adviser, such as the engagement of affiliates of the Adviser to provide distribution, administrative and brokerage services to the Funds, and the benefits of research made available to the Adviser by reason of brokerage commissions (if any) generated by the Funds’ securities transactions. The Trustees also considered the fact that NGAM Advisors’ parent company benefits from the retention of an affiliated Adviser. The Trustees considered the possible conflicts of interest associated with these fallout and other benefits, and the reporting, disclosure and other processes in place to disclose and monitor such possible conflicts of interest. |
| · | | The Trustees’ review and discussion of the Funds’ advisory arrangements in prior years, and management’s record of responding to Trustee concerns raised during the year and in prior years. |
Based on their evaluation of all factors that they deemed to be material, including those factors described above, and assisted by the advice of independent counsel, the Trustees, including the Independent Trustees, concluded that each of the existing Agreements should be continued through June 30, 2014.
| 26
Portfolio of Investments – as of September 30, 2013
Loomis Sayles Core Plus Bond Fund
| | | | | | | | |
Principal
Amount (‡) | | | Description | | Value (†) | |
| | Bonds and Notes — 94.2% of Net Assets | | | | |
| | Non-Convertible Bonds — 94.1% | | | | |
| | | | ABS Car Loan — 1.2% | | | | |
| $ | 2,355,000 | | | AmeriCredit Automobile Receivables Trust, Series 2013-2, Class B,
1.190%, 5/08/2018 | | $ | 2,338,628 | |
| | 1,860,000 | | | AmeriCredit Automobile Receivables Trust, Series 2013-2, Class C,
1.790%, 3/08/2019 | | | 1,830,647 | |
| | 1,950,000 | | | Avis Budget Rental Car Funding AESOP LLC, Series 2012-3A, Class A,
2.100%, 3/20/2019, 144A | | | 1,944,725 | |
| | 1,535,000 | | | Avis Budget Rental Car Funding AESOP LLC, Series 2013-1A, Class B,
2.620%, 9/20/2019, 144A | | | 1,501,904 | |
| | 211,139 | | | Centre Point Funding LLC, Series 2010-1A, Class 1,
5.430%, 7/20/2016, 144A | | | 219,166 | |
| | 3,385,000 | | | Santander Drive Auto Receivables Trust, Series 2012-4, Class C,
2.940%, 12/15/2017 | | | 3,451,485 | |
| | 2,090,000 | | | Santander Drive Auto Receivables Trust, Series 2012-5, Class C,
2.700%, 8/15/2018 | | | 2,103,163 | |
| | 2,875,000 | | | Santander Drive Auto Receivables Trust, Series 2012-6, Class C,
1.940%, 3/15/2018 | | | 2,854,196 | |
| | | | | | | | |
| | | | | | | 16,243,914 | |
| | | | | | | | |
| | | | ABS Home Equity — 0.5% | | | | |
| | 474,020 | | | Chase Mortgage Finance Corp., Series 2007-A1, Class 2A3,
2.719%, 2/25/2037(b) | | | 461,825 | |
| | 368,005 | | | Countrywide Asset-Backed Certificates, Series 2004-S1, Class A3,
5.115%, 2/25/2035(b) | | | 375,998 | |
| | 6,662,126 | | | Sequoia Mortgage Trust, Series 2013-5, Class A1,
2.500%, 5/25/2043, 144A | | | 5,955,294 | |
| | | | | | | | |
| | | | | | | 6,793,117 | |
| | | | | | | | |
| | | | ABS Other — 0.8% | | | | |
| | 1,775,000 | | | DSC Floorplan Master Owner Trust, Series 2011-1, Class A,
3.910%, 3/15/2016, 144A | | | 1,787,489 | |
| | 8,615,000 | | | Springleaf Funding Trust, Series 2013-BA, Class A,
3.920%, 1/16/2023, 144A | | | 8,485,775 | |
| | | | | | | | |
| | | | | | | 10,273,264 | |
| | | | | | | | |
| | | | Aerospace & Defense — 0.3% | | | | |
| | 2,370,000 | | | Bombardier, Inc., 5.750%, 3/15/2022, 144A | | | 2,352,225 | |
| | 1,480,000 | | | Bombardier, Inc., 7.500%, 3/15/2018, 144A | | | 1,661,300 | |
| | | | | | | | |
| | | | | | | 4,013,525 | |
| | | | | | | | |
| | | | Airlines — 0.3% | | | | |
| | 3,285,000 | | | Continental Airlines Pass Through Certificates, Series 2012-2, Class A,
4.000%, 4/29/2026 | | | 3,178,238 | |
| | 1,101,737 | | | Continental Airlines Pass Through Trust, Series 2010-1, Class A,
4.750%, 7/12/2022 | | | 1,165,087 | |
| | | | | | | | |
| | | | | | | 4,343,325 | |
| | | | | | | | |
See accompanying notes to financial statements.
27 |
Portfolio of Investments – as of September 30, 2013
Loomis Sayles Core Plus Bond Fund – (continued)
| | | | | | | | |
Principal
Amount (‡) | | | Description | | Value (†) | |
| | | | Automotive — 2.1% | | | | |
| $ | 1,300,000 | | | Ford Motor Credit Co. LLC, 2.875%, 10/01/2018 | | $ | 1,299,722 | |
| | 7,885,000 | | | Ford Motor Credit Co. LLC, 5.000%, 5/15/2018 | | | 8,638,419 | |
| | 8,420,000 | | | Ford Motor Credit Co. LLC, 6.625%, 8/15/2017(c) | | | 9,702,433 | |
| | 4,900,000 | | | General Motors Financial Co., Inc., 6.750%, 6/01/2018 | | | 5,426,750 | |
| | 2,290,000 | | | Hyundai Capital Services, Inc., 3.500%, 9/13/2017, 144A | | | 2,380,824 | |
| | | | | | | | |
| | | | | | | 27,448,148 | |
| | | | | | | | |
| | | | Banking — 5.9% | | | | |
| | 6,000,000 | | | Ally Financial, Inc., 6.250%, 12/01/2017 | | | 6,416,088 | |
| | 8,150,000 | | | Banco Santander Brasil S.A., 4.625%, 2/13/2017, 144A | | | 8,394,500 | |
| | 3,950,000 | | | Banco Santander Chile, 3.875%, 9/20/2022, 144A | | | 3,651,672 | |
| | 12,345,000 | | | Bangkok Bank PCL, 3.300%, 10/03/2018, 144A | | | 12,370,431 | |
| | 5,015,000 | | | Bank of America Corp., MTN, 5.000%, 5/13/2021(c) | | | 5,386,266 | |
| | 6,665,000 | | | BBVA Banco Continental S.A., 3.250%, 4/08/2018, 144A | | | 6,515,038 | |
| | 3,795,000 | | | Citigroup, Inc., 4.050%, 7/30/2022 | | | 3,685,761 | |
| | 1,405,000 | | | Goldman Sachs Group, Inc. (The), 5.750%, 1/24/2022 | | | 1,557,643 | |
| | 1,355,000 | | | Goldman Sachs Group, Inc. (The), 6.000%, 6/15/2020 | | | 1,538,594 | |
| | 3,555,000 | | | Goldman Sachs Group, Inc. (The), 6.750%, 10/01/2037 | | | 3,710,126 | |
| | 3,035,000 | | | Goldman Sachs Group, Inc. (The), 7.500%, 2/15/2019 | | | 3,667,096 | |
| | 2,890,000 | | | Merrill Lynch & Co., Inc., MTN, 6.875%, 4/25/2018 | | | 3,405,880 | |
| | 6,090,000 | | | Morgan Stanley, 5.750%, 1/25/2021 | | | 6,760,564 | |
| | 630,000 | | | Morgan Stanley, GMTN, 5.500%, 1/26/2020 | | | 697,135 | |
| | 660,000 | | | Morgan Stanley, GMTN, 5.500%, 7/28/2021 | | | 721,831 | |
| | 2,530,000 | | | Morgan Stanley, Series F, GMTN, 6.625%, 4/01/2018 | | | 2,937,221 | |
| | 6,220,000 | | | PKO Finance AB, 4.630%, 9/26/2022, 144A | | | 6,106,485 | |
| | | | | | | | |
| | | | | | | 77,522,331 | |
| | | | | | | | |
| | | | Chemicals — 2.0% | | | | |
| | 7,355,000 | | | Braskem America Finance Co., 7.125%, 7/22/2041, 144A | | | 6,693,050 | |
| | 4,375,000 | | | Methanex Corp., 3.250%, 12/15/2019 | | | 4,300,082 | |
| | 575,000 | | | Methanex Corp., 5.250%, 3/01/2022 | | | 596,446 | |
| | 5,360,000 | | | Mexichem SAB de CV, 6.750%, 9/19/2042, 144A | | | 4,984,800 | |
| | 1,380,000 | | | Olin Corp., 5.500%, 8/15/2022 | | | 1,373,100 | |
| | 4,190,000 | | | PolyOne Corp., 5.250%, 3/15/2023, 144A | | | 3,959,550 | |
| | 840,000 | | | RPM International, Inc., 3.450%, 11/15/2022 | | | 785,549 | |
| | 3,685,000 | | | RPM International, Inc., 6.125%, 10/15/2019 | | | 4,196,301 | |
| | | | | | | | |
| | | | | | | 26,888,878 | |
| | | | | | | | |
| | | | Collateralized Mortgage Obligations — 0.3% | | | | |
| | 3,530,000 | | | FHLMC Multifamily Structured Pass Through Certificates, Series K704,
Class A2, 2.412%, 8/25/2018 | | | 3,603,230 | |
| | | | | | | | |
| | | | Commercial Mortgage-Backed Securities — 4.1% | | | | |
| | 108,119 | | | Banc of America Merrill Lynch Commercial Mortgage, Inc., Series 2007-2,
Class A2, 5.634%, 4/10/2049(b) | | | 109,391 | |
| | 1,670,000 | | | Banc of America Merrill Lynch Commercial Mortgage, Inc., Series 2007-2,
Class A4, 5.793%, 4/10/2049(b) | | | 1,869,238 | |
| | 292,880 | | | Bear Stearns Commercial Mortgage Securities, Series 2007-PW16,
Class A2, 5.846%, 6/11/2040(b) | | | 297,325 | |
See accompanying notes to financial statements.
| 28
Portfolio of Investments – as of September 30, 2013
Loomis Sayles Core Plus Bond Fund – (continued)
| | | | | | | | |
Principal
Amount (‡) | | | Description | | Value (†) | |
| | | | Commercial Mortgage-Backed Securities — continued | | | | |
| $ | 1,000,000 | | | Citigroup Commercial Mortgage Trust, Series 2008-C7, Class A4,
6.336%, 12/10/2049(b) | | $ | 1,139,571 | |
| | 100,333 | | | Citigroup/Deutsche Bank Commercial Mortgage Trust, Series 2006-CD2,
Class A2, 5.408%, 1/15/2046 | | | 100,459 | |
| | 2,500,000 | | | Credit Suisse Mortgage Capital Certificates, Series 2007-C2, Class A3,
5.542%, 1/15/2049 | | | 2,769,635 | |
| | 3,500,000 | | | Credit Suisse Mortgage Capital Certificates, Series 2007-C4, Class A4,
5.953%, 9/15/2039(b) | | | 3,892,165 | |
| | 1,865,000 | | | Credit Suisse Mortgage Capital Certificates, Series 2007-C5, Class A4,
5.695%, 9/15/2040 | | | 2,082,851 | |
| | 5,790,000 | | | Credit Suisse Mortgage Capital Certificates, Series 2008-C1, Class A3,
6.252%, 2/15/2041(b) | | | 6,559,068 | |
| | 424,923 | | | Greenwich Capital Commercial Funding Corp., Series 2006-GG7, Class A4,
6.056%, 7/10/2038(b) | | | 467,175 | |
| | 705,000 | | | Greenwich Capital Commercial Funding Corp., Series 2007-GG11,
Class A4, 5.736%, 12/10/2049 | | | 791,855 | |
| | 8,235,000 | | | Greenwich Capital Commercial Funding Corp., Series 2007-GG9, Class A4,
5.444%, 3/10/2039 | | | 9,111,698 | |
| | 9,285,000 | | | GS Mortgage Securities Corp. II, Series 2007-GG10, Class A4,
5.993%, 8/10/2045(b) | | | 10,298,968 | |
| | 3,000,000 | | | JPMorgan Chase Commercial Mortgage Securities Trust,
Series 2006-LDP9, Class A3, 5.336%, 5/15/2047 | | | 3,298,632 | |
| | 2,300,000 | | | JPMorgan Chase Commercial Mortgage Securities Trust, Series 2007-C1,
Class A4, 5.716%, 2/15/2051 | | | 2,556,130 | |
| | 365,000 | | | Morgan Stanley Capital I, Series 2007-HQ12, Class A5,
5.760%, 4/12/2049(b) | | | 394,959 | |
| | 1,900,000 | | | Morgan Stanley Capital I, Series 2007-HQ13, Class A3, 5.569%, 12/15/2044 | | | 2,053,575 | |
| | 2,930,000 | | | Morgan Stanley Capital I, Series 2007-IQ14, Class A4, 5.692%, 4/15/2049 | | | 3,255,312 | |
| | 305,000 | | | Morgan Stanley Capital I, Series 2007-T27, Class A4, 5.816%, 6/11/2042(b) | | | 344,584 | |
| | 1,175,000 | | | Morgan Stanley Capital I, Series 2008-T29, Class A4, 6.459%, 1/11/2043(b) | | | 1,366,119 | |
| | 1,000,000 | | | Wachovia Bank Commercial Mortgage Trust, Series 2006-C28, Class A4,
5.572%, 10/15/2048 | | | 1,097,868 | |
| | | | | | | | |
| | | | | | | 53,856,578 | |
| | | | | | | | |
| | | | Consumer Cyclical Services — 0.2% | | | | |
| | 2,165,000 | | | Service Corp International, 5.375%, 1/15/2022, 144A | | | 2,064,869 | |
| | | | | | | | |
| | | | Consumer Products — 0.4% | | | | |
| | 1,110,000 | | | Avon Products, Inc., 4.600%, 3/15/2020 | | | 1,151,063 | |
| | 3,620,000 | | | Whirlpool Corp., MTN, 4.850%, 6/15/2021 | | | 3,842,384 | |
| | | | | | | | |
| | | | | | | 4,993,447 | |
| | | | | | | | |
| | | | Diversified Manufacturing — 0.8% | | | | |
| | 1,200,000 | | | Crane Co., 6.550%, 11/15/2036 | | | 1,294,145 | |
| | 2,075,000 | | | Fibria Overseas Finance Ltd., 6.750%, 3/03/2021, 144A | | | 2,214,025 | |
| | 7,710,000 | | | Votorantim Cimentos S.A., 7.250%, 4/05/2041, 144A | | | 7,064,287 | |
| | | | | | | | |
| | | | | | | 10,572,457 | |
| | | | | | | | |
See accompanying notes to financial statements.
29 |
Portfolio of Investments – as of September 30, 2013
Loomis Sayles Core Plus Bond Fund – (continued)
| | | | | | | | |
Principal
Amount (‡) | | | Description | | Value (†) | |
| | | | Electric — 1.0% | | | | |
| $ | 1,460,000 | | | AES Corp. (The), 7.375%, 7/01/2021 | | $ | 1,606,000 | |
| | 3,395,000 | | | FirstEnergy Corp., 2.750%, 3/15/2018 | | | 3,301,858 | |
| | 1,010,000 | | | Ipalco Enterprises, Inc., 5.000%, 5/01/2018 | | | 1,047,875 | |
| | 4,435,000 | | | National Rural Utilities Cooperative Finance Corp.,
(fixed rate to 4/30/2023, variable rate thereafter), 4.750%, 4/30/2043 | | | 4,102,375 | |
| | 3,740,000 | | | Transelec S.A., 4.625%, 7/26/2023, 144A | | | 3,557,496 | |
| | | | | | | | |
| | | | | | | 13,615,604 | |
| | | | | | | | |
| | | | Entertainment — 0.1% | | | | |
| | 650,000 | | | DreamWorks Animation SKG, Inc., 6.875%, 8/15/2020, 144A | | | 674,375 | |
| | | | | | | | |
| | | | Financial Other — 0.5% | | | | |
| | 7,920,000 | | | Cielo S.A./Cielo USA, Inc., 3.750%, 11/16/2022, 144A | | | 6,811,200 | |
| | | | | | | | |
| | | | Food & Beverage — 1.1% | | | | |
| | 4,920,000 | | | Alicorp SAA, 3.875%, 3/20/2023, 144A | | | 4,354,200 | |
| | 1,340,000 | | | Cosan Luxembourg S.A., 5.000%, 3/14/2023, 144A | | | 1,206,000 | |
| | 4,050,000 | | | Post Holdings, Inc., 7.375%, 2/15/2022 | | | 4,257,562 | |
| | 1,070,000 | | | Post Holdings, Inc., 7.375%, 2/15/2022, 144A | | | 1,124,838 | |
| | 3,555,000 | | | Sigma Alimentos S.A. de CV, 5.625%, 4/14/2018, 144A | | | 3,812,738 | |
| | | | | | | | |
| | | | | | | 14,755,338 | |
| | | | | | | | |
| | | | Government Owned – No Guarantee — 7.0% | | | | |
| | 2,355,000 | | | Abu Dhabi National Energy Co., 2.500%, 1/12/2018, 144A | | | 2,307,900 | |
| | 6,745,000 | | | CEZ AS, 5.625%, 4/03/2042, 144A | | | 6,819,532 | |
| | 3,690,000 | | | China Resources Gas Group Ltd., 4.500%, 4/05/2022, 144A | | | 3,655,646 | |
| | 3,560,000 | | | CNOOC Finance 2013 Ltd., 4.250%, 5/09/2043 | | | 3,046,082 | |
| | 3,255,000 | | | CNPC General Capital Ltd., 3.950%, 4/19/2022, 144A | | | 3,170,282 | |
| | 4,945,000 | | | Dolphin Energy Ltd., 5.500%, 12/15/2021, 144A | | | 5,420,956 | |
| | 665,000 | | | Dubai Electricity & Water Authority, 6.375%, 10/21/2016, 144A | | | 748,956 | |
| | 1,395,000 | | | Ecopetrol S.A., 5.875%, 9/18/2023 | | | 1,450,800 | |
| | 1,600,000 | | | Federal Home Loan Mortgage Corp., 6.250%, 7/15/2032 | | | 2,085,011 | |
| | 13,680,000 | | | Federal National Mortgage Association, 6.625%, 11/15/2030 | | | 18,285,441 | |
| | 4,370,000 | | | IPIC GMTN Ltd., 6.875%, 11/01/2041, 144A | | | 5,265,850 | |
| | 13,790,000 | | | Pertamina Persero PT, 5.625%, 5/20/2043, 144A | | | 10,756,200 | |
| | 3,675,000 | | | Petrobras Global Finance BV, 5.625%, 5/20/2043 | | | 3,077,776 | |
| | 7,260,000 | | | Petrobras International Finance Co., 6.750%, 1/27/2041 | | | 7,020,558 | |
| | 1,210,000 | | | Petroleos Mexicanos, 3.500%, 7/18/2018 | | | 1,225,125 | |
| | 1,290,000 | | | Qtel International Finance Ltd., 3.875%, 1/31/2028, 144A | | | 1,128,750 | |
| | 2,895,000 | | | Qtel International Finance Ltd., 4.750%, 2/16/2021, 144A | | | 3,046,988 | |
| | 2,965,000 | | | Qtel International Finance Ltd., 7.875%, 6/10/2019, 144A | | | 3,617,300 | |
| | 11,825,000 | | | Tennessee Valley Authority, 3.500%, 12/15/2042 | | | 9,633,023 | |
| | | | | | | | |
| | | | | | | 91,762,176 | |
| | | | | | | | |
| | | | Healthcare — 1.1% | | | | |
| | 1,580,000 | | | HCA Holdings, Inc., 6.250%, 2/15/2021 | | | 1,605,675 | |
| | 7,830,000 | | | HCA, Inc., 7.500%, 2/15/2022 | | | 8,593,425 | |
| | 575,000 | | | HCA, Inc., 7.500%, 12/15/2023 | | | 586,500 | |
| | 3,200,000 | | | PerkinElmer, Inc., 5.000%, 11/15/2021 | | | 3,303,469 | |
| | | | | | | | |
| | | | | | | 14,089,069 | |
| | | | | | | | |
See accompanying notes to financial statements.
| 30
Portfolio of Investments – as of September 30, 2013
Loomis Sayles Core Plus Bond Fund – (continued)
| | | | | | | | |
Principal
Amount (‡) | | | Description | | Value (†) | |
| | | | Hybrid ARMs — 0.0% | | | | |
| $ | 142,664 | | | FHLMC, 5.926%, 11/01/2036(b) | | $ | 153,000 | |
| | 129,794 | | | FNMA, 1.909%, 2/01/2037(b) | | | 137,556 | |
| | | | | | | | |
| | | | | | | 290,556 | |
| | | | | | | | |
| | | | Independent Energy — 1.3% | | | | |
| | 4,036,000 | | | Denbury Resources, Inc., 6.375%, 8/15/2021 | | | 4,288,250 | |
| | 5,035,000 | | | Newfield Exploration Co., 5.750%, 1/30/2022 | | | 5,022,412 | |
| | 2,925,000 | | | QEP Resources, Inc., 5.250%, 5/01/2023 | | | 2,727,563 | |
| | 2,410,000 | | | Range Resources Corp., 5.000%, 8/15/2022 | | | 2,331,675 | |
| | 2,605,000 | | | SM Energy Co., 6.500%, 1/01/2023 | | | 2,657,100 | |
| | | | | | | | |
| | | | | | | 17,027,000 | |
| | | | | | | | |
| | | | Industrial Other — 2.0% | | | | |
| | 1,360,000 | | | Briggs & Stratton Corp., 6.875%, 12/15/2020 | | | 1,472,200 | |
| | 3,620,000 | | | CBRE Services, Inc., 5.000%, 3/15/2023 | | | 3,393,750 | |
| | 9,170,000 | | | Deluxe Corp., 6.000%, 11/15/2020 | | | 9,445,100 | |
| | 4,525,000 | | | Ferreycorp SAA, 4.875%, 4/26/2020, 144A | | | 4,163,000 | |
| | 8,290,000 | | | Hutchison Whampoa International 11 Ltd., 4.625%, 1/13/2022, 144A | | | 8,436,600 | |
| | | | | | | | |
| | | | | | | 26,910,650 | |
| | | | | | | | |
| | | | Media Cable — 0.7% | | | | |
| | 3,935,000 | | | CCO Holdings LLC/CCO Holdings Capital Corp., 5.250%, 3/15/2021, 144A | | | 3,777,600 | |
| | 2,965,000 | | | CCO Holdings LLC/CCO Holdings Capital Corp., 6.500%, 4/30/2021 | | | 3,009,475 | |
| | 499,000 | | | Cox Communications, Inc., 5.450%, 12/15/2014 | | | 527,116 | |
| | 2,825,000 | | | Virgin Media Finance PLC, 6.375%, 4/15/2023, 144A | | | 2,810,875 | |
| | | | | | | | |
| | | | | | | 10,125,066 | |
| | | | | | | | |
| | | | Media Non-Cable — 0.8% | | | | |
| | 66,000,000 | | | Grupo Televisa SAB, EMTN, 7.250%, 5/14/2043, (MXN) | | | 4,254,773 | |
| | 1,835,000 | | | Myriad International Holdings BV, 6.000%, 7/18/2020, 144A | | | 1,926,750 | |
| | 4,284,000 | | | Myriad International Holdings BV, 6.375%, 7/28/2017, 144A | | | 4,648,140 | |
| | | | | | | | |
| | | | | | | 10,829,663 | |
| | | | | | | | |
| | | | Metals & Mining — 2.5% | | | | |
| | 3,650,000 | | | Alcoa, Inc., 6.150%, 8/15/2020 | | | 3,807,757 | |
| | 1,335,000 | | | APERAM, 7.375%, 4/01/2016, 144A | | | 1,339,405 | |
| | 1,280,000 | | | APERAM, 7.750%, 4/01/2018, 144A | | | 1,260,800 | |
| | 6,535,000 | | | ArcelorMittal, 7.250%, 3/01/2041 | | | 5,979,525 | |
| | 485,000 | | | ArcelorMittal, 7.500%, 10/15/2039 | | | 459,538 | |
| | 4,110,000 | | | Freeport-McMoRan Copper & Gold, Inc., 2.375%, 3/15/2018, 144A | | | 3,972,089 | |
| | 3,075,000 | | | Goldcorp, Inc., 2.125%, 3/15/2018 | | | 2,996,308 | |
| | 7,030,000 | | | Plains Exploration & Production Co., 6.875%, 2/15/2023 | | | 7,539,675 | |
| | 1,445,000 | | | Steel Dynamics, Inc., 5.250%, 4/15/2023, 144A | | | 1,361,912 | |
| | 3,440,000 | | | United States Steel Corp., 7.375%, 4/01/2020 | | | 3,526,000 | |
| | | | | | | | |
| | | | | | | 32,243,009 | |
| | | | | | | | |
| | | | Mortgage Related — 10.3% | | | | |
| | 6,850,718 | | | FHLMC, 3.000%, with various maturities from 2026 to 2043(d) | | | 6,777,537 | |
| | 26,207,953 | | | FHLMC, 3.500%, with various maturities from 2042 to 2043(c)(d) | | | 26,620,986 | |
| | 9,652,148 | | | FHLMC, 4.000%, with various maturities from 2041 to 2043(d) | | | 10,094,415 | |
See accompanying notes to financial statements.
31 |
Portfolio of Investments – as of September 30, 2013
Loomis Sayles Core Plus Bond Fund – (continued)
| | | | | | | | |
Principal
Amount (‡) | | | Description | | Value (†) | |
| | | | Mortgage Related — continued | | | | |
| $ | 2,308,151 | | | FHLMC, 4.500%, with various maturities from 2034 to 2039(d) | | $ | 2,456,042 | |
| | 348,959 | | | FHLMC, 5.000%, 8/01/2035 | | | 377,038 | |
| | 4,978,673 | | | FHLMC, 5.500%, with various maturities from 2018 to 2040(d) | | | 5,376,526 | |
| | 39,277 | | | FHLMC, 6.000%, 6/01/2035 | | | 43,367 | |
| | 9,684,103 | | | FNMA, 3.000%, with various maturities from 2027 to 2042(d) | | | 9,511,963 | |
| | 8,849,530 | | | FNMA, 3.500%, with various maturities from 2026 to 2042(d) | | | 9,030,464 | |
| | 15,813,237 | | | FNMA, 4.000%, with various maturities from 2040 to 2043(d) | | | 16,593,626 | |
| | 10,710,072 | | | FNMA, 4.500%, with various maturities from 2039 to 2041(d) | | | 11,455,742 | |
| | 8,493,108 | | | FNMA, 5.000%, with various maturities from 2033 to 2037(d) | | | 9,229,279 | |
| | 3,294,316 | | | FNMA, 5.500%, with various maturities from 2036 to 2038(d) | | | 3,586,959 | |
| | 1,610,207 | | | FNMA, 6.000%, with various maturities from 2016 to 2039(d) | | | 1,767,777 | |
| | 67,726 | | | FNMA, 6.500%, with various maturities from 2029 to 2036(d) | | | 75,970 | |
| | 67,337 | | | FNMA, 7.000%, with various maturities in 2030(d) | | | 75,359 | |
| | 81,523 | | | FNMA, 7.500%, with various maturities from 2024 to 2032(d) | | | 95,454 | |
| | 7,130,000 | | | FNMA (TBA), 2.500%, 10/01/2028(e) | | | 7,170,106 | |
| | 13,340,000 | | | FNMA (TBA), 3.500%, 11/01/2043(e) | | | 13,535,932 | |
| | 1,419,016 | | | GNMA, 5.500%, with various maturities from 2038 to 2039(d) | | | 1,554,794 | |
| | 233,763 | | | GNMA, 6.000%, with various maturities from 2029 to 2038(d) | | | 258,313 | |
| | 168,321 | | | GNMA, 6.500%, with various maturities from 2028 to 2032(d) | | | 188,768 | |
| | 151,386 | | | GNMA, 7.000%, with various maturities from 2025 to 2029(d) | | | 169,703 | |
| | 45,689 | | | GNMA, 7.500%, with various maturities from 2025 to 2030(d) | | | 51,861 | |
| | 12,316 | | | GNMA, 8.000%, 11/15/2029 | | | 12,594 | |
| | 54,129 | | | GNMA, 8.500%, with various maturities from 2017 to 2023(d) | | | 55,132 | |
| | 3,593 | | | GNMA, 9.000%, with various maturities in 2016(d) | | | 3,641 | |
| | 6,062 | | | GNMA, 11.500%, with various maturities in 2015(d) | | | 6,100 | |
| | | | | | | | |
| | | | | | | 136,175,448 | |
| | | | | | | | |
| | | | Non-Captive Consumer — 1.5% | | | | |
| | 1,100,000 | | | SLM Corp., MTN, 6.000%, 1/25/2017 | | | 1,166,000 | |
| | 15,785,000 | | | SLM Corp., MTN, 6.250%, 1/25/2016 | | | 16,811,025 | |
| | 30,000 | | | SLM Corp., Series A, MTN, 5.000%, 4/15/2015 | | | 31,200 | |
| | 120,000 | | | SLM Corp., Series A, MTN, 5.000%, 6/15/2018 | | | 118,119 | |
| | 1,135,000 | | | SLM Corp., Series A, MTN, 8.450%, 6/15/2018 | | | 1,279,712 | |
| | | | | | | | |
| | | | | | | 19,406,056 | |
| | | | | | | | |
| | | | Non-Captive Diversified — 2.0% | | | | |
| | 6,290,000 | | | General Electric Capital Corp., 5.300%, 2/11/2021 | | | 6,840,866 | |
| | 7,290,000 | | | International Lease Finance Corp., 3.875%, 4/15/2018 | | | 7,043,962 | |
| | 3,950,000 | | | International Lease Finance Corp., 5.750%, 5/15/2016 | | | 4,188,110 | |
| | 7,215,000 | | | International Lease Finance Corp., 6.250%, 5/15/2019 | | | 7,575,750 | |
| | | | | | | | |
| | | | | | | 25,648,688 | |
| | | | | | | | |
| | | | Oil Field Services — 2.6% | | | | |
| | 3,165,000 | | | Nabors Industries, Inc., 4.625%, 9/15/2021 | | | 3,181,196 | |
| | 3,557,000 | | | Nabors Industries, Inc., 5.000%, 9/15/2020 | | | 3,716,606 | |
| | 5,895,000 | | | Nabors Industries, Inc., 5.100%, 9/15/2023, 144A | | | 5,988,041 | |
| | 6,950,000 | | | Pan American Energy LLC/Argentine Branch, 7.875%, 5/07/2021, 144A | | | 6,950,000 | |
| | 1,330,000 | | | Rowan Cos., Inc., 7.875%, 8/01/2019 | | | 1,603,146 | |
| | 2,430,000 | | | Sidewinder Drilling, Inc., 9.750%, 11/15/2019, 144A | | | 2,357,100 | |
See accompanying notes to financial statements.
| 32
Portfolio of Investments – as of September 30, 2013
Loomis Sayles Core Plus Bond Fund – (continued)
| | | | | | | | |
Principal
Amount (‡) | | | Description | | Value (†) | |
| | | | Oil Field Services — continued | | | | |
| $ | 9,245,000 | | | Transocean, Inc., 6.500%, 11/15/2020 | | $ | 10,319,694 | |
| | | | | | | | |
| | | | | | | 34,115,783 | |
| | | | | | | | |
| | | | Packaging — 0.4% | | | | |
| | 3,275,000 | | | Sealed Air Corp., 5.250%, 4/01/2023, 144A | | | 3,103,062 | |
| | 2,515,000 | | | Sealed Air Corp., 6.500%, 12/01/2020, 144A | | | 2,634,463 | |
| | | | | | | | |
| | | | | | | 5,737,525 | |
| | | | | | | | |
| | | | Paper — 1.9% | | | | |
| | 1,785,000 | | | Celulosa Arauco y Constitucion S.A., 4.750%, 1/11/2022 | | | 1,734,076 | |
| | 3,045,000 | | | Celulosa Arauco y Constitucion S.A., 5.000%, 1/21/2021 | | | 3,023,249 | |
| | 1,111,000 | | | Georgia-Pacific LLC, 7.250%, 6/01/2028 | | | 1,355,778 | |
| | 3,535,000 | | | Georgia-Pacific LLC, 7.375%, 12/01/2025 | | | 4,441,664 | |
| | 5,441,000 | | | Georgia-Pacific LLC, 7.750%, 11/15/2029 | | | 6,885,580 | |
| | 2,850,000 | | | Georgia-Pacific LLC, 8.000%, 1/15/2024 | | | 3,664,430 | |
| | 4,015,000 | | | Rock Tenn Co., 4.000%, 3/01/2023 | | | 3,890,025 | |
| | | | | | | | |
| | | | | | | 24,994,802 | |
| | | | | | | | |
| | | | Pharmaceuticals — 1.2% | | | | |
| | 11,450,000 | | | Valeant Pharmaceuticals International, 6.375%, 10/15/2020, 144A | | | 11,908,000 | |
| | 130,000 | | | Valeant Pharmaceuticals International, 6.750%, 8/15/2021, 144A | | | 135,200 | |
| | 3,170,000 | | | Valeant Pharmaceuticals International, 6.875%, 12/01/2018, 144A | | | 3,352,275 | |
| | | | | | | | |
| | | | | | | 15,395,475 | |
| | | | | | | | |
| | | | Pipelines — 1.7% | | | | |
| | 8,665,000 | | | Energy Transfer Partners LP, 6.050%, 6/01/2041 | | | 8,696,723 | |
| | 1,030,000 | | | Energy Transfer Partners LP, 6.500%, 2/01/2042 | | | 1,087,326 | |
| | 4,960,000 | | | Kinder Morgan Finance Co. LLC, 6.000%, 1/15/2018, 144A | | | 5,379,184 | |
| | 8,510,000 | | | Transportadora de Gas del Peru S.A., 4.250%, 4/30/2028, 144A | | | 7,361,150 | |
| | | | | | | | |
| | | | | | | 22,524,383 | |
| | | | | | | | |
| | | | Property & Casualty Insurance — 0.3% | | | | |
| | 3,285,000 | | | Willis Group Holdings PLC, 5.750%, 3/15/2021 | | | 3,547,304 | |
| | | | | | | | |
| | | | Refining — 1.2% | | | | |
| | 5,620,000 | | | Ecopetrol S.A., 7.375%, 9/18/2043 | | | 6,083,650 | |
| | 3,110,000 | | | Phillips 66, 5.875%, 5/01/2042 | | | 3,266,766 | |
| | 7,975,000 | | | Thai Oil PCL, 4.875%, 1/23/2043, 144A | | | 6,516,165 | |
| | | | | | | | |
| | | | | | | 15,866,581 | |
| | | | | | | | |
| | | | Retailers — 0.9% | | | | |
| | 8,475,000 | | | Lotte Shopping Co. Ltd., 3.375%, 5/09/2017, 144A | | | 8,716,961 | |
| | 4,205,000 | | | SACI Falabella, 3.750%, 4/30/2023, 144A | | | 3,731,938 | |
| | | | | | | | |
| | | | | | | 12,448,899 | |
| | | | | | | | |
| | | | Sovereigns — 2.3% | | | | |
| | 5,598,000 | | | Mexico Government International Bond, Series A, MTN,
6.050%, 1/11/2040 | | | 6,121,413 | |
| | 5,160,000 | | | South Africa Government International Bond, 5.875%, 9/16/2025 | | | 5,424,450 | |
| | 18,775,000 | | | Spain Government International Bond, 4.000%, 3/06/2018, 144A | | | 19,081,032 | |
| | | | | | | | |
| | | | | | | 30,626,895 | |
| | | | | | | | |
See accompanying notes to financial statements.
33 |
Portfolio of Investments – as of September 30, 2013
Loomis Sayles Core Plus Bond Fund – (continued)
| | | | | | | | |
Principal
Amount (‡) | | | Description | | Value (†) | |
| | | | Supermarket — 0.5% | | | | |
| $ | 6,685,000 | | | Delhaize Group S.A., 4.125%, 4/10/2019 | | $ | 6,971,606 | |
| | | | | | | | |
| | | | Technology — 1.5% | | | | |
| | 5,939,000 | | | Audatex North America, Inc., 6.000%, 6/15/2021, 144A | | | 6,057,780 | |
| | 5,220,000 | | | Baidu, Inc., 3.500%, 11/28/2022 | | | 4,773,768 | |
| | 1,160,000 | | | Brocade Communications Systems, Inc., 6.875%, 1/15/2020 | | | 1,252,800 | |
| | 3,145,000 | | | Dun & Bradstreet Corp. (The), 3.250%, 12/01/2017 | | | 3,171,824 | |
| | 3,156,000 | | | Equifax, Inc., 7.000%, 7/01/2037 | | | 3,590,821 | |
| | 69,000 | | | Motorola Solutions, Inc., 6.625%, 11/15/2037 | | | 70,190 | |
| | 340,000 | | | Motorola Solutions, Inc., 7.500%, 5/15/2025 | | | 411,930 | |
| | | | | | | | |
| | | | | | | 19,329,113 | |
| | | | | | | | |
| | | | Textile — 0.1% | | | | |
| | 1,125,000 | | | Wolverine World Wide, Inc., 6.125%, 10/15/2020 | | | 1,167,188 | |
| | | | | | | | |
| | | | Tobacco — 0.7% | | | | |
| | 8,005,000 | | | Reynolds American, Inc., 7.250%, 6/15/2037 | | | 9,258,719 | |
| | | | | | | | |
| | | | Treasuries — 19.0% | | | | |
| | 8,770,000 | | | Italy Buoni Poliennali Del Tesoro, 5.500%, 11/01/2022, (EUR) | | | 12,813,658 | |
| | 6,495,000(††) | | | Mexican Fixed Rate Bonds, Series M, 6.500%, 6/10/2021, (MXN) | | | 51,899,315 | |
| | 224,000,000 | | | Philippine Government International Bond, 3.900%, 11/26/2022, (PHP) | | | 5,157,556 | |
| | 300,000,000 | | | Philippine Government International Bond, 6.250%, 1/14/2036, (PHP) | | | 7,751,493 | |
| | 5,540,000 | | | Portugal Obrigacoes do Tesouro OT, 4.950%, 10/25/2023, 144A, (EUR) | | | 6,505,479 | |
| | 19,285,000 | | | Portugal Obrigacoes do Tesouro OT, 5.650%, 2/15/2024, 144A, (EUR) | | | 23,506,839 | |
| | 1,720,000 | | | Spain Government Bond, 5.500%, 4/30/2021, (EUR) | | | 2,577,627 | |
| | 8,910,000 | | | Spain Government Bond, 5.850%, 1/31/2022, (EUR) | | | 13,519,893 | |
| | 8,265,000 | | | U.S. Treasury Bond, 2.750%, 8/15/2042 | | | 6,850,908 | |
| | 4,360,000 | | | U.S. Treasury Bond, 3.125%, 2/15/2043 | | | 3,906,290 | |
| | 7,135,000 | | | U.S. Treasury Bond, 3.625%, 8/15/2043 | | | 7,052,505 | |
| | 21,435,000 | | | U.S. Treasury Bond, 3.750%, 8/15/2041 | | | 21,790,006 | |
| | 3,875,000 | | | U.S. Treasury Bond, 3.875%, 8/15/2040 | | | 4,037,870 | |
| | 77,000,000 | | | U.S. Treasury Note, 0.375%, 6/30/2015 | | | 77,129,360 | |
| | 5,260,000 | | | U.S. Treasury Note, 1.625%, 8/15/2022 | | | 4,900,016 | |
| | | | | | | | |
| | | | | | | 249,398,815 | |
| | | | | | | | |
| | | | Wireless — 4.2% | | | | |
| | 1,475,000 | | | American Tower Corp., 4.700%, 3/15/2022 | | | 1,433,167 | |
| | 6,225,000 | | | eAccess Ltd., 8.250%, 4/01/2018, 144A | | | 6,816,375 | |
| | 7,205,000 | | | SK Telecom Co. Ltd., 2.125%, 5/01/2018, 144A | | | 7,036,900 | |
| | 3,165,000 | | | SK Telecom Co. Ltd., 6.625%, 7/20/2027, 144A | | | 3,779,130 | |
| | 3,780,000 | | | Softbank Corp., 4.500%, 4/15/2020, 144A | | | 3,632,580 | |
| | 13,110,000 | | | Sprint Capital Corp., 6.875%, 11/15/2028 | | | 11,700,675 | |
| | 4,825,000 | | | Verizon Communications, Inc., 3.650%, 9/14/2018 | | | 5,084,069 | |
| | 13,845,000 | | | Verizon Communications, Inc., 6.550%, 9/15/2043 | | | 15,630,133 | |
| | | | | | | | |
| | | | | | | 55,113,029 | |
| | | | | | | | |
| | | | Wirelines — 4.8% | | | | |
| | 5,757,000 | | | Axtel SAB de CV, (Step to 8.000% on 1/31/2014),
7.000%, 1/31/2020, 144A(f) | | | 5,382,795 | |
| | 6,810,000 | | | Bharti Airtel International Netherlands BV, 5.125%, 3/11/2023, 144A | | | 6,094,950 | |
See accompanying notes to financial statements.
| 34
Portfolio of Investments – as of September 30, 2013
Loomis Sayles Core Plus Bond Fund – (continued)
| | | | | | | | |
Principal
Amount (‡) | | | Description | | Value (†) | |
| | | | Wirelines — continued | | | | |
| $ | 2,065,000 | | | CenturyLink, Inc., 5.625%, 4/01/2020 | | $ | 2,015,956 | |
| | 4,275,000 | | | Colombia Telecomunicaciones S.A., E.S.P., 5.375%, 9/27/2022, 144A | | | 3,933,000 | |
| | 11,153,000 | | | Embarq Corp., 7.995%, 6/01/2036 | | | 11,354,546 | |
| | 1,575,000 | | | Frontier Communications Corp., 7.875%, 1/15/2027 | | | 1,496,250 | |
| | 5,050,000 | | | Frontier Communications Corp., 8.500%, 4/15/2020 | | | 5,580,250 | |
| | 2,420,000 | | | Frontier Communications Corp., 8.750%, 4/15/2022 | | | 2,643,850 | |
| | 415,000 | | | Frontier Communications Corp., 9.000%, 8/15/2031 | | | 406,700 | |
| | 1,975,000 | | | Qwest Corp., 6.750%, 12/01/2021 | | | 2,120,994 | |
| | 5,000,000 | | | Telefonica Celular del Paraguay S.A., 6.750%, 12/13/2022, 144A | | | 4,950,000 | |
| | 4,029,000 | | | Telefonica Emisiones SAU, 5.134%, 4/27/2020 | | | 4,125,027 | |
| | 986,000 | | | Telefonica Emisiones SAU, 5.462%, 2/16/2021 | | | 1,009,627 | |
| | 6,344,000 | | | Telemar Norte Leste S.A., 5.500%, 10/23/2020, 144A | | | 5,582,720 | |
| | 5,910,000 | | | Windstream Corp., 7.500%, 4/01/2023 | | | 5,836,125 | |
| | | | | | | | |
| | | | | | | 62,532,790 | |
| | | | | | | | |
| | | | Total Non-Convertible Bonds
(Identified Cost $1,252,095,435) | | | 1,238,009,888 | |
| | | | | | | | |
| | | | | | | | |
| | Convertible Bonds — 0.1% | | | | |
| | | | Wirelines — 0.1% | | | | |
| | 13,238,400 | | | Axtel SAB de CV, (Step to 8.000% on 1/31/2014),
7.000%, 1/31/2020, 144A (MXN)(f)(g)(h)(i)
(Identified Cost $1,325,671) | | | 1,513,625 | |
| | | | | | | | |
| | | | Total Bonds and Notes
(Identified Cost $1,253,421,106) | | | 1,239,523,513 | |
| | | | | | | | |
| | | | | | | | |
| | Senior Loans — 3.4% | | | | |
| | | | Automotive — 0.5% | | | | |
| | 1,163,947 | | | Affinia Group Intermediate Holdings, Inc., Term Loan B2,
4.750%, 4/27/2020(b) | | | 1,163,947 | |
| | 4,840,675 | | | TI Group Automotive Systems LLC, Term Loan B, 5.500%, 3/27/2019(b) | | | 4,886,081 | |
| | | | | | | | |
| | | | | | | 6,050,028 | |
| | | | | | | | |
| | | | Building Materials — 0.2% | | | | |
| | 3,000,000 | | | ABC Supply Co., Inc., Term Loan, 3.500%, 4/16/2020(b) | | | 2,974,500 | |
| | | | | | | | |
| | | | Chemicals — 0.3% | | | | |
| | 4,178,005 | | | Axalta Coating Systems US Holdings, Inc., Term Loan,
4.750%, 2/03/2020(b) | | | 4,189,745 | |
| | | | | | | | |
| | | | Diversified Manufacturing — 0.2% | | | | |
| | 3,033,080 | | | Ameriforge Group, Inc., 1st Lien Term Loan, 5.000%, 12/19/2019(b) | | | 3,033,080 | |
| | | | | | | | |
| | | | Electric — 0.4% | | | | |
| | 5,469,981 | | | NRG Energy, Inc., Refi Term Loan B, 2.750%, 7/02/2018(b) | | | 5,429,394 | |
| | | | | | | | |
| | | | Entertainment — 0.1% | | | | |
| | 1,816,000 | | | WMG Acquisition Corp., New Term Loan, 3.750%, 7/01/2020(b) | | | 1,806,357 | |
| | | | | | | | |
| | | | Food & Beverage — 0.2% | | | | |
| | 2,789,980 | | | Dole Food Company, Inc., New Term Loan, 3.753%, 4/01/2020(j) | | | 2,785,990 | |
| | | | | | | | |
See accompanying notes to financial statements.
35 |
Portfolio of Investments – as of September 30, 2013
Loomis Sayles Core Plus Bond Fund – (continued)
| | | | | | | | |
Principal
Amount (‡) | | | Description | | Value (†) | |
| | | | Media Cable — 0.3% | | | | |
| $ | 3,667,808 | | | Charter Communications Operating LLC, Term Loan E,
3.000%, 7/01/2020(b) | | $ | 3,623,941 | |
| | | | | | | | |
| | | | Media Non-Cable — 0.4% | | | | |
| | 4,740,000 | | | Activision Blizzard, Inc., Term Loan B, 9/11/2020(k) | | | 4,732,084 | |
| | | | | | | | |
| | | | Metals & Mining — 0.3% | | | | |
| | 3,650,052 | | | Arch Coal, Inc., Term Loan B, 5.750%, 5/16/2018(b) | | | 3,538,287 | |
| | | | | | | | |
| | | | Packaging — 0.3% | | | | |
| | 3,797,483 | | | Pact Group (USA), Inc., USD Term Loan B, 3.750%, 5/29/2020(b) | | | 3,731,027 | |
| | | | | | | | |
| | | | Technology — 0.2% | | | | |
| | 3,047,324 | | | Alcatel-Lucent USA, Inc., USD Term Loan C, 5.750%, 1/30/2019(b) | | | 3,067,132 | |
| | | | | | | | |
| | | | Total Senior Loans
(Identified Cost $44,977,179) | | | 44,961,565 | |
| | | | | | | | |
| | | | | | | | |
| Shares | | | | | | |
| | Preferred Stocks — 0.9% | | | | |
| | | | Banking — 0.2% | | | | |
| | 68,182 | | | Ally Financial, Inc., Series A, (fixed rate to 5/15/2016, variable rate thereafter), 8.500% | | | 1,825,914 | |
| | 532 | | | Ally Financial, Inc., Series G, 7.000%, 144A | | | 508,326 | |
| | | | | | | | |
| | | | | | | 2,334,240 | |
| | | | | | | | |
| | | | Media Cable — 0.7% | | | | |
| | 8,945,000 | | | NBCUniversal Enterprise, Inc., 5.250%, 144A | | | 8,855,550 | |
| | | | | | | | |
| | | | Non-Captive Consumer — 0.0% | | | | |
| | 5,510 | | | SLM Corp., Series A, 6.970% | | | 256,766 | |
| | | | | | | | |
| | | | Total Preferred Stocks
(Identified Cost $11,013,801) | | | 11,446,556 | |
| | | | | | | | |
| | | | | | | | |
Principal
Amount (‡) | | | | | | |
| | Short-Term Investments — 3.5% | | | | |
| $ | 391,159 | | | Repurchase Agreement with State Street Bank and Trust Company, dated 9/30/2013 at 0.000% to be repurchased at $391,159 on 10/01/2013 collateralized by $445,000 Federal National Mortgage Association,
2.080% due 11/02/2022 valued at $413,483 including accrued interest (Note 2 of Notes to Financial Statements) | | | 391,159 | |
| | 45,923,204 | | | Tri-Party Repurchase Agreement with Fixed Income Clearing Corporation, dated 9/30/2013 at 0.000% to be repurchased at $45,923,204 on 10/01/2013 collateralized by $47,555,000 U.S. Treasury Note,
0.625% due 8/31/2017 valued at $46,841,675 including accrued interest (Note 2 of Notes to Financial Statements) | | | 45,923,204 | |
| | | | | | | | |
| | | | Total Short-Term Investments
(Identified Cost $46,314,363) | | | 46,314,363 | |
| | | | | | | | |
| | | | | | | | |
| | | | Total Investments — 102.0%
(Identified Cost $1,355,726,449)(a) | | | 1,342,245,997 | |
| | | | Other assets less liabilities — (2.0)% | | | (25,968,780 | ) |
| | | | | | | | |
| | | | Net Assets — 100.0% | | $ | 1,316,277,217 | |
| | | | | | | | |
See accompanying notes to financial statements.
| 36
Portfolio of Investments – as of September 30, 2013
Loomis Sayles Core Plus Bond Fund – (continued)
| | | | | | | | |
| | | | | | | | |
| | (‡) | | | Principal Amount stated in U.S. dollars unless otherwise noted. | |
| | (†) | | | See Note 2 of Notes to Financial Statements. | |
| | (††) | | | Amount shown represents units. One unit represents a principal amount of 100. | |
| | (a) | | | Federal Tax Information: | |
| | | | At September 30, 2013, the net unrealized depreciation on investments based on a cost of $1,359,273,876 for federal income tax purposes was as follows: | |
| | | | Aggregate gross unrealized appreciation for all investments in which there is an excess of value over tax cost | | $ | 25,588,039 | |
| | | | Aggregate gross unrealized depreciation for all investments in which there is an excess of tax cost over value | | | (42,615,918 | ) |
| | | | | | | | |
| | | | Net unrealized depreciation | | $ | (17,027,879 | ) |
| | | | | | | | |
| | | | | | | | |
| | (b) | | | Variable rate security. Rate as of September 30, 2013 is disclosed. | |
| | (c) | | | All or a portion of this security has been designated to cover the Fund’s obligations under open TBA transactions. | |
| | (d) | | | The Fund’s investment in mortgage related securities of Federal Home Loan Mortgage Corporation, Federal National Mortgage Association and Government National Mortgage Association are interests in separate pools of mortgages. All separate investments in securities of each issuer which have the same coupon rate have been aggregated for the purpose of presentation in the Portfolio of Investments. | |
| | (e) | | | Delayed delivery. See Note 2 of Notes to Financial Statements. | |
| | (f) | | | Coupon rate is a fixed rate for an initial period then resets at a specified date and rate. | |
| | (g) | | | Illiquid security. At September 30, 2013, the value of this security amounted to $1,513,625 or 0.1% of net assets. | |
| | (h) | | | Fair valued by the Fund’s investment adviser. At September 30, 2013, the value of this security amounted to $1,513,625 or 0.1% of net assets. | |
| | (i) | | | Convertible dollar-indexed note. Coupon rate is based on MXN denominated par value and is payable in USD. | |
| | (j) | | | Variable rate security. Rate shown represents the weighted average rate of underlying contracts at September 30, 2013. | |
| | (k) | | | Position is unsettled. Contract rate was not determined at September 30, 2013 and does not take effect until settlement date. | |
| | | | | | | | |
| | 144A | | | All or a portion of these securities are exempt from registration under Rule 144A of the Securities Act of 1933. These securities may be resold in transactions exempt from registration, normally to qualified institutional buyers. At September 30, 2013, the value of Rule 144A holdings amounted to $372,854,407 or 28.3% of net assets. | |
| | ABS | | | Asset-Backed Securities | | | | |
| | ARMs | | | Adjustable Rate Mortgages | | | | |
| | EMTN | | | Euro Medium Term Note | | | | |
| | FHLMC | | | Federal Home Loan Mortgage Corp. | | | | |
| | FNMA | | | Federal National Mortgage Association | | | | |
| | GMTN | | | Global Medium Term Note | | | | |
| | GNMA | | | Government National Mortgage Association | | | | |
| | MTN | | | Medium Term Note | | | | |
| | TBA | | | To Be Announced | | | | |
| | | | | | | | |
| | EUR | | | Euro | | | | |
| | MXN | | | Mexican Peso | | | | |
| | PHP | | | Philippine Peso | | | | |
| | USD | | | U.S. Dollar | | | | |
See accompanying notes to financial statements.
37 |
Portfolio of Investments – as of September 30, 2013
Loomis Sayles Core Plus Bond Fund – (continued)
Industry Summary at September 30, 2013 (Unaudited)
| | | | |
Treasuries | | | 19.0 | % |
Mortgage Related | | | 10.3 | |
Government Owned – No Guarantee | | | 7.0 | |
Banking | | | 6.1 | |
Wirelines | | | 4.9 | |
Wireless | | | 4.2 | |
Commercial Mortgage-Backed Securities | | | 4.1 | |
Metals & Mining | | | 2.8 | |
Oil Field Services | | | 2.6 | |
Automotive | | | 2.6 | |
Chemicals | | | 2.3 | |
Sovereigns | | | 2.3 | |
Industrial Other | | | 2.0 | |
Non-Captive Diversified | | | 2.0 | |
Other Investments, less than 2% each | | | 26.3 | |
Short-Term Investments | | | 3.5 | |
| | | | |
Total Investments | | | 102.0 | |
Other assets less liabilities | | | (2.0 | ) |
| | | | |
Net Assets | | | 100.0 | % |
| | | | |
See accompanying notes to financial statements.
| 38
Portfolio of Investments – as of September 30, 2013
Loomis Sayles High Income Fund
| | | | | | | | |
Principal
Amount (‡) | | | Description | | Value (†) | |
| | Bonds and Notes — 84.2% of Net Assets | | | | |
| | Non-Convertible Bonds — 72.5% | | | | |
| | | | ABS Home Equity — 5.9% | | | | |
| $ | 305,578 | | | American Home Mortgage Investment Trust, Series 2005-2, Class 4A1,
1.897%, 9/25/2045(b) | | $ | 282,761 | |
| | 325,034 | | | Banc of America Alternative Loan Trust, Series 2003-10, Class 3A1,
5.500%, 12/25/2033 | | | 329,821 | |
| | 272,237 | | | Banc of America Funding Trust, Series 2005-7, Class 3A1, 5.750%, 11/25/2035 | | | 272,910 | |
| | 333,664 | | | Banc of America Funding Corp., Series 2008-R4, Class 1A4,
0.634%, 7/25/2037, 144A(b) | | | 204,451 | |
| | 58,067 | | | Banc of America Mortgage Securities, Inc., Series 2005-A, Class 2A1,
2.986%, 2/25/2035(b) | | | 56,995 | |
| | 190,454 | | | Banc of America Mortgage Securities, Inc., Series 2006-B, Class 4A1,
6.420%, 11/20/2046(b) | | | 169,602 | |
| | 157,823 | | | Citicorp Mortgage Securities Trust, Series 2006-4, Class 1A2, 6.000%, 8/25/2036 | | | 159,755 | |
| | 101,657 | | | CitiMortgage Alternative Loan Trust, Series 2006-A3, Class 1A7,
6.000%, 7/25/2036 | | | 89,464 | |
| | 625,417 | | | Countrywide Alternative Loan Trust, Series 2004-27CB, Class A1,
6.000%, 12/25/2034 | | | 602,803 | |
| | 318,278 | | | Countrywide Alternative Loan Trust, Series 2006-J4, Class 1A3,
6.250%, 7/25/2036 | | | 211,723 | |
| | 824,741 | | | Countrywide Home Loan Mortgage Pass Through Trust, Series 2005-11,
Class 3A3, 2.678%, 4/25/2035(b) | | | 572,093 | |
| | 349,304 | | | Countrywide Home Loan Mortgage Pass Through Trust, Series 2005-11,
Class 4A1, 0.454%, 4/25/2035(b) | | | 275,785 | |
| | 161,330 | | | Countrywide Home Loan Mortgage Pass Through Trust, Series 2005-13,
Class A3, 5.500%, 6/25/2035 | | | 159,226 | |
| | 519,975 | | | Countrywide Home Loan Mortgage Pass Through Trust, Series 2005-HYB7, Class 2A, 2.639%, 11/20/2035(b) | | | 483,352 | |
| | 411,878 | | | Countrywide Home Loan Mortgage Pass Through Trust, Series 2006-20,
Class 1A35, 6.000%, 2/25/2037 | | | 362,095 | |
| | 97,590 | | | GMAC Mortgage Corp. Loan Trust, Series 2003-J7, Class A7,
5.000%, 11/25/2033 | | | 99,311 | |
| | 431,378 | | | GMAC Mortgage Corp. Loan Trust, Series 2005-AR3, Class 2A1,
3.165%, 6/19/2035(b) | | | 423,872 | |
| | 376,232 | | | GMAC Mortgage Corp. Loan Trust, Series 2005-AR4, Class 3A1,
3.410%, 7/19/2035(b) | | | 340,591 | |
| | 485,565 | | | GSAA Home Equity Trust, Series 2006-20, Class 1A1, 0.254%, 12/25/2046(b) | | | 239,389 | |
| | 86,681 | | | GSR Mortgage Loan Trust, Series 2004-14, Class 3A1, 3.133%, 12/25/2034(b) | | | 74,531 | |
| | 575,000 | | | GSR Mortgage Loan Trust, Series 2005-AR6, Class 4A5, 2.656%, 9/25/2035(b) | | | 559,999 | |
| | 200,721 | | | GSR Mortgage Loan Trust, Series 2006-8F, Class 4A17, 6.000%, 9/25/2036 | | | 168,940 | |
| | 112,271 | | | JP Morgan Alternative Loan Trust, Series 2006-A1, Class 5A1,
4.687%, 3/25/2036(b) | | | 92,920 | |
| | 431,636 | | | JP Morgan Mortgage Trust, Series 2005-S3, Class 1A11, 6.000%, 1/25/2036 | | | 375,304 | |
| | 451,908 | | | Lehman Mortgage Trust, Series 2005-3, Class 1A6, 0.684%, 1/25/2036(b)(c) | | | 310,019 | |
| | 188,872 | | | Lehman Mortgage Trust, Series 2006-1, Class 3A5, 5.500%, 2/25/2036 | | | 185,594 | |
| | 313,050 | | | MASTR Adjustable Rate Mortgages Trust, Series 2005-2, Class 3A1,
2.692%, 3/25/2035(b) | | | 254,003 | |
See accompanying notes to financial statements.
39 |
Portfolio of Investments – as of September 30, 2013
Loomis Sayles High Income Fund – (continued)
| | | | | | | | |
Principal
Amount (‡) | | | Description | | Value (†) | |
| | | | ABS Home Equity — continued | | | | |
| $ | 580,243 | | | MASTR Adjustable Rate Mortgages Trust, Series 2007-1, Class I2A1,
0.339%, 1/25/2047(b) | | $ | 417,503 | |
| | 539,552 | | | Merrill Lynch Alternative Note Asset Trust, Series 2007-F1, Class 2A7,
6.000%, 3/25/2037 | | | 381,998 | |
| | 118,419 | | | New York Mortgage Trust, Series 2006-1, Class 2A2, 2.852%, 5/25/2036(b) | | | 102,180 | |
| | 477,823 | | | Residential Accredit Loans, Inc., Series 2006-QS6, Class 1A16,
6.000%, 6/25/2036 | | | 372,403 | |
| | 387,622 | | | Residential Funding Mortgage Securities, Series 2006-S1, Class 1A3,
5.750%, 1/25/2036 | | | 390,431 | |
| | 638,328 | | | WaMu Mortgage Pass Through Certificates, Series 2006-AR19, Class 2A, 2.204%, 1/25/2047(b) | | | 563,615 | |
| | 120,511 | | | WaMu Mortgage Pass Through Certificates, Series 2007-OA3, Class 2A1A, 0.919%, 4/25/2047(b) | | | 107,429 | |
| | 436,336 | | | Washington Mutual Mortgage Pass-Through Certificates, Series 2006-AR6, Class 2A, 1.123%, 8/25/2046(b) | | | 271,871 | |
| | | | | | | | |
| | | | | | | 9,964,739 | |
| | | | | | | | |
| | | | ABS Other — 0.4% | | | | |
| | 350,000 | | | DSC Floorplan Master Owner Trust, Series 2011-1, Class B,
8.110%, 3/15/2016, 144A | | | 349,665 | |
| | 260,819 | | | Sierra Receivables Funding Co. LLC, Series 2011-3A, Class C,
9.310%, 7/20/2028, 144A | | | 281,764 | |
| | | | | | | | |
| | | | | | | 631,429 | |
| | | | | | | | |
| | | | Aerospace & Defense — 1.2% | | | | |
| | 1,500,000 | | | Meccanica Holdings USA, Inc., 6.250%, 1/15/2040, 144A | | | 1,252,500 | |
| | 900,000 | | | Meccanica Holdings USA, Inc., 7.375%, 7/15/2039, 144A | | | 827,697 | |
| | | | | | | | |
| | | | | | | 2,080,197 | |
| | | | | | | | |
| | | | Airlines — 0.4% | | | | |
| | 345,000 | | | Continental Airlines Pass Through Certificates, Series 2012-3, Class C,
6.125%, 4/29/2018 | | | 351,038 | |
| | 6,613 | | | Continental Airlines Pass Through Trust, Series 1997-4, Class B,
6.900%, 7/02/2018 | | | 6,844 | |
| | 198,446 | | | Continental Airlines Pass Through Trust, Series 2001-1, Class B,
7.373%, 6/15/2017 | | | 210,849 | |
| | 168,101 | | | Continental Airlines Pass Through Trust, Series 2007-1, Class B,
6.903%, 10/19/2023 | | | 172,085 | |
| | | | | | | | |
| | | | | | | 740,816 | |
| | | | | | | | |
| | | | Automotive — 1.4% | | | | |
| | 1,805,000 | | | General Motors Co., 4.875%, 10/02/2023, 144A | | | 1,764,387 | |
| | 635,000 | | | General Motors Co., 6.250%, 10/02/2043, 144A | | | 625,475 | |
| | | | | | | | |
| | | | | | | 2,389,862 | |
| | | | | | | | |
| | | | Banking — 2.7% | | | | |
| | 2,100,000 | | | Banco Santander Brasil S.A./Cayman Islands, 8.000%, 3/18/2016, 144A, (BRL) | | | 876,461 | |
| | 375,000,000 | | | Banco Santander Chile, 6.500%, 9/22/2020, 144A, (CLP) | | | 733,655 | |
| | 820,000 | | | HBOS PLC, 6.000%, 11/01/2033, 144A | | | 771,702 | |
| | 900,000 | | | Morgan Stanley, GMTN, 7.625%, 3/03/2016, (AUD) | | | 900,359 | |
See accompanying notes to financial statements.
| 40
Portfolio of Investments – as of September 30, 2013
Loomis Sayles High Income Fund – (continued)
| | | | | | | | |
Principal
Amount (‡) | | | Description | | Value (†) | |
| | | | Banking — continued | | | | |
| | 65,000 | | | Royal Bank of Scotland Group PLC, 5.250%, (EUR)(n) | | $ | 67,051 | |
| | 740,000 | | | Royal Bank of Scotland Group PLC, 5.500%, (EUR)(n) | | | 781,166 | |
| | 250,000 | | | Societe General S.A., (fixed rate to 9/04/2019, variable rate thereafter),
9.375%, (EUR)(n) | | | 388,099 | |
| | | | | | | | |
| | | | | | | 4,518,493 | |
| | | | | | | | |
| | | | Building Materials — 1.9% | | | | |
| | 296,000 | | | CPG Merger Sub LLC, 8.000%, 10/01/2021, 144A | | | 300,810 | |
| | 1,280,000 | | | HD Supply, Inc., 7.500%, 7/15/2020, 144A | | | 1,326,400 | |
| | 50,000 | | | Masco Corp., 6.500%, 8/15/2032 | | | 49,625 | |
| | 345,000 | | | Masco Corp., 7.750%, 8/01/2029 | | | 381,055 | |
| | 1,000,000 | | | Odebrecht Finance Ltd., 4.375%, 4/25/2025, 144A | | | 867,500 | |
| | 900,000 | | | Odebrecht Finance Ltd., 8.250%, 4/25/2018, 144A, (BRL) | | | 336,947 | |
| | | | | | | | |
| | | | | | | 3,262,337 | |
| | | | | | | | |
| | | | Chemicals — 3.3% | | | | |
| | 1,510,000 | | | Hercules, Inc., 6.500%, 6/30/2029 | | | 1,343,900 | |
| | 850,000 | | | Hexion US Finance Corp./Hexion Nova Scotia Finance ULC, 8.875%, 2/01/2018 | | | 879,750 | |
| | 601,350 | | | Reichhold Industries, Inc., 9.000% (11.000% PIK), 5/08/2017, 144A(d)(e) | | | 463,040 | |
| | 635,000 | | | TPC Group, Inc., 8.750%, 12/15/2020, 144A | | | 649,287 | |
| | 1,600,000 | | | Tronox Finance LLC, 6.375%, 8/15/2020 | | | 1,584,000 | |
| | 600,000 | | | U.S. Coatings Acquisition, Inc./Flash Dutch 2 BV, 7.375%, 5/01/2021, 144A | | | 627,000 | |
| | | | | | | | |
| | | | | | | 5,546,977 | |
| | | | | | | | |
| | | | Collateralized Mortgage Obligations — 0.0% | | | | |
| | 78,305 | | | MASTR Adjustable Rate Mortgages Trust, Series 2006-2, Class 3A1,
2.875%, 1/25/2036(b) | | | 73,614 | |
| | | | | | | | |
| | | | Commercial Mortgage-Backed Securities — 1.4% | | | | |
| | 1,690,000 | | | GS Mortgage Securities Corp. II, Series 2007-GG10, Class AM,
5.993%, 8/10/2045(b) | | | 1,652,075 | |
| | 125,000 | | | JPMorgan Chase Commercial Mortgage Securities Trust, Series 2007-LDPX, Class AM, 5.464%, 1/15/2049 | | | 125,637 | |
| | 525,000 | | | Morgan Stanley Capital I Trust, Series 2007-HQ12, Class AM,
5.760%, 4/12/2049(b) | | | 557,389 | |
| | | | | | | | |
| | | | | | | 2,335,101 | |
| | | | | | | | |
| | | | Consumer Cyclical Services — 0.9% | | | | |
| | 615,000 | | | ServiceMaster Co. (The), 7.000%, 8/15/2020 | | | 581,175 | |
| | 1,095,000 | | | ServiceMaster Co. (The), 7.450%, 8/15/2027 | | | 876,000 | |
| | | | | | | | |
| | | | | | | 1,457,175 | |
| | | | | | | | |
| | | | Consumer Products — 1.1% | | | | |
| | 2,040,000 | | | Visant Corp., 10.000%, 10/01/2017 | | | 1,897,200 | |
| | | | | | | | |
| | | | Electric — 1.0% | | | | |
| | 15,993 | | | AES Red Oak LLC, Series A, 8.540%, 11/30/2019 | | | 16,872 | |
| | 617,000 | | | Enel SpA, (fixed rate to 9/24/2023, variable rate thereafter),
8.750%, 9/24/2073, 144A | | | 624,289 | |
| | 819,294 | | | Energy Future Intermediate Holding Co. LLC/EFIH Finance, Inc.,
11.250% (12.250% PIK), 12/01/2018, 144A(d) | | | 540,734 | |
See accompanying notes to financial statements.
41 |
Portfolio of Investments – as of September 30, 2013
Loomis Sayles High Income Fund – (continued)
| | | | | | | | |
Principal
Amount (‡) | | | Description | | Value (†) | |
| | | | Electric — continued | | | | |
| $ | 455,000 | | | Energy Future Intermediate Holding Co. LLC/EFIH Finance, Inc.,
10.000%, 12/01/2020 | | $ | 479,457 | |
| | | | | | | | |
| | | | | | | 1,661,352 | |
| | | | | | | | |
| | | | Entertainment — 0.1% | | | | |
| | 151,000 | | | DreamWorks Animation SKG, Inc., 6.875%, 8/15/2020, 144A | | | 156,663 | |
| | | | | | | | |
| | | | Environmental — 0.2% | | | | |
| | 255,000 | | | ADS Waste Holdings, Inc., 8.250%, 10/01/2020, 144A | | | 269,025 | |
| | | | | | | | |
| | | | Food & Beverage — 0.5% | | | | |
| | 1,800,000 | | | BRF S.A., 7.750%, 5/22/2018, 144A, (BRL) | | | 643,640 | |
| | 600,000 | | | Cosan Luxembourg S.A., 9.500%, 3/14/2018, 144A, (BRL) | | | 237,558 | |
| | | | | | | | |
| | | | | | | 881,198 | |
| | | | | | | | |
| | | | Gaming — 0.5% | | | | |
| | 740,000 | | | MGM Resorts International, 6.750%, 10/01/2020 | | | 777,000 | |
| | | | | | | | |
| | | | Healthcare — 2.4% | | | | |
| | 465,000 | | | DaVita HealthCare Partners, Inc., 5.750%, 8/15/2022 | | | 459,769 | |
| | 170,000 | | | HCA, Inc., 7.050%, 12/01/2027 | | | 162,775 | |
| | 640,000 | | | HCA, Inc., 7.500%, 12/15/2023 | | | 652,800 | |
| | 470,000 | | | HCA, Inc., 7.690%, 6/15/2025 | | | 481,163 | |
| | 480,000 | | | HCA, Inc., 8.360%, 4/15/2024 | | | 516,000 | |
| | 820,000 | | | HCA, Inc., MTN, 7.580%, 9/15/2025 | | | 832,300 | |
| | 515,000 | | | HCA, Inc., MTN, 7.750%, 7/15/2036 | | | 504,700 | |
| | 635,000 | | | Tenet Healthcare Corp., 6.875%, 11/15/2031 | | | 538,162 | |
| | | | | | | | |
| | | | | | | 4,147,669 | |
| | | | | | | | |
| | | | Home Construction — 4.4% | | | | |
| | 845,000 | | | Beazer Homes USA, Inc., 9.125%, 6/15/2018 | | | 887,250 | |
| | 1,200,000 | | | Corp GEO SAB de CV, 8.875%, 3/27/2022, 144A(f) | | | 168,000 | |
| | 1,625,000 | | | Desarrolladora Homex SAB de CV, 9.750%, 3/25/2020, 144A(g) | | | 390,000 | |
| | 750,000 | | | K. Hovnanian Enterprises, Inc., 5.000%, 11/01/2021 | | | 660,000 | |
| | 500,000 | | | K. Hovnanian Enterprises, Inc., 9.125%, 11/15/2020, 144A | | | 541,250 | |
| | 1,210,000 | | | KB Home, 7.250%, 6/15/2018 | | | 1,302,262 | |
| | 3,135,000 | | | Pulte Group, Inc., 6.000%, 2/15/2035(h) | | | 2,696,100 | |
| | 495,000 | | | Pulte Group, Inc., 6.375%, 5/15/2033 | | | 441,788 | |
| | 70,000 | | | Standard Pacific Corp., 8.375%, 1/15/2021 | | | 78,750 | |
| | 200,000 | | | Urbi Desarrollos Urbanos SAB de CV, 9.500%, 1/21/2020, 144A(g) | | | 34,000 | |
| | 1,100,000 | | | Urbi Desarrollos Urbanos SAB de CV, 9.750%, 2/03/2022, 144A(g) | | | 187,000 | |
| | | | | | | | |
| | | | | | | 7,386,400 | |
| | | | | | | | |
| | | | Independent Energy — 2.6% | | | | |
| | 1,140,000 | | | Connacher Oil and Gas Ltd., 8.500%, 8/01/2019, 144A | | | 815,100 | |
| | 115,000 | | | Halcon Resources Corp., 8.875%, 5/15/2021 | | | 117,875 | |
| | 10,000 | | | Halcon Resources Corp., 9.250%, 2/15/2022, 144A | | | 10,400 | |
| | 685,000 | | | Halcon Resources Corp., 9.750%, 7/15/2020 | | | 724,387 | |
| | 220,000 | | | MEG Energy Corp., 6.375%, 1/30/2023, 144A | | | 215,600 | |
| | 4,400,000 | | | OGX Austria GmbH, 8.375%, 4/01/2022, 144A(f) | | | 704,000 | |
| | 1,000,000 | | | OGX Austria GmbH, 8.500%, 6/01/2018, 144A | | | 160,000 | |
| | 810,000 | | | SandRidge Energy, Inc., 7.500%, 3/15/2021 | | | 818,100 | |
See accompanying notes to financial statements.
| 42
Portfolio of Investments – as of September 30, 2013
Loomis Sayles High Income Fund – (continued)
| | | | | | | | |
Principal
Amount (‡) | | | Description | | Value (†) | |
| | | | Independent Energy — continued | | | | |
| $ | 200,000 | | | SandRidge Energy, Inc., 7.500%, 2/15/2023 | | $ | 198,000 | |
| | 675,000 | | | SandRidge Energy, Inc., 8.125%, 10/15/2022 | | | 681,750 | |
| | | | | | | | |
| | | | | | | 4,445,212 | |
| | | | | | | | |
| | | | Local Authorities — 0.8% | | | | |
| | 1,085,000 | | | Autonomous Community of Madrid Spain, 4.300%, 9/15/2026, 144A, (EUR) | | | 1,294,803 | |
| | | | | | | | |
| | | | Lodging — 0.1% | | | | |
| | 180,000 | | | Royal Caribbean Cruises Ltd., 7.500%, 10/15/2027 | | | 189,900 | |
| | | | | | | | |
| | | | Media Cable — 0.8% | | | | |
| | 685,000 | | | Nara Cable Funding II Ltd., 8.500%, 3/01/2020, 144A, (EUR) | | | 1,051,808 | |
| | 200,000 | | | Numericable Finance & Co. SCA, 8.750%, 2/15/2019, 144A, (EUR) | | | 305,744 | |
| | | | | | | | |
| | | | | | | 1,357,552 | |
| | | | | | | | |
| | | | Media Non-Cable — 1.3% | | | | |
| | 335,000 | | | Clear Channel Communications, Inc., 4.900%, 5/15/2015 | | | 314,062 | |
| | 1,230,000 | | | Clear Channel Communications, Inc., 5.500%, 9/15/2014 | | | 1,208,475 | |
| | 50,000 | | | Intelsat Luxembourg S.A., 6.750%, 6/01/2018, 144A | | | 51,875 | |
| | 335,000 | | | Intelsat Luxembourg S.A., 7.750%, 6/01/2021, 144A | | | 346,725 | |
| | 230,000 | | | Intelsat Luxembourg S.A., 8.125%, 6/01/2023, 144A | | | 242,650 | |
| | | | | | | | |
| | | | | | | 2,163,787 | |
| | | | | | | | |
| | | | Metals & Mining — 4.4% | | | | |
| | 2,395,000 | | | ArcelorMittal, 7.250%, 3/01/2041 | | | 2,191,425 | |
| | 985,000 | | | Barminco Finance Pty Ltd., 9.000%, 6/01/2018, 144A | | | 898,813 | |
| | 495,000 | | | Barrick Gold Corp., 3.850%, 4/01/2022 | | | 437,774 | |
| | 515,000 | | | Essar Steel Algoma, Inc., 9.375%, 3/15/2015, 144A | | | 486,675 | |
| | 780,000 | | | Essar Steel Algoma, Inc., 9.875%, 6/15/2015, 144A | | | 612,300 | |
| | 660,000 | | | Inmet Mining Corp., 7.500%, 6/01/2021, 144A | | | 676,500 | |
| | 200,000 | | | Murray Energy Corp., 8.625%, 6/15/2021, 144A | | | 200,500 | |
| | 2,375,000 | | | United States Steel Corp., 6.650%, 6/01/2037 | | | 1,941,562 | |
| | | | | | | | |
| | | | | | | 7,445,549 | |
| | | | | | | | |
| | | | Non-Captive Consumer — 2.2% | | | | |
| | 540,000 | | | Provident Funding Associates LP/PFG Finance Corp., 6.750%, 6/15/2021, 144A | | | 542,700 | |
| | 1,230,000 | | | SLM Corp., 5.500%, 1/25/2023 | | | 1,126,171 | |
| | 1,110,000 | | | Springleaf Finance Corp., 7.750%, 10/01/2021, 144A | | | 1,151,625 | |
| | 445,000 | | | Springleaf Finance Corp., 8.250%, 10/01/2023, 144A | | | 462,800 | |
| | 445,000 | | | Springleaf Finance Corp., Series J, MTN, 6.900%, 12/15/2017 | | | 465,025 | |
| | | | | | | | |
| | | | | | | 3,748,321 | |
| | | | | | | | |
| | | | Non-Captive Diversified — 0.7% | | | | |
| | 65,000 | | | CIT Group, Inc., 5.000%, 8/15/2022 | | | 63,538 | |
| | 70,000 | | | CIT Group, Inc., 5.000%, 8/01/2023 | | | 67,772 | |
| | 585,000 | | | Ladder Capital Finance Holdings LLLP/Ladder Capital Finance Corp.,
7.375%, 10/01/2017 | | | 612,056 | |
| | 435,000 | | | Oxford Finance LLC/Oxford Finance Co-Issuer, Inc., 7.250%, 1/15/2018, 144A | | | 444,787 | |
| | | | | | | | |
| | | | | | | 1,188,153 | |
| | | | | | | | |
| | | | Oil Field Services — 1.9% | | | | |
| | 730,000 | | | Basic Energy Services, Inc., 7.750%, 10/15/2022 | | | 706,275 | |
See accompanying notes to financial statements.
43 |
Portfolio of Investments – as of September 30, 2013
Loomis Sayles High Income Fund – (continued)
| | | | | | | | |
Principal
Amount (‡) | | | Description | | Value (†) | |
| | | | Oil Field Services — continued | | | | |
| $ | 1,745,000 | | | Edgen Murray Corp., 8.750%, 11/01/2020, 144A | | $ | 1,771,175 | |
| | 113,000 | | | Hercules Offshore, Inc., 7.500%, 10/01/2021, 144A | | | 113,000 | |
| | 655,000 | | | Hercules Offshore, Inc., 8.750%, 7/15/2021, 144A | | | 694,300 | |
| | | | | | | | |
| | | | | | | 3,284,750 | |
| | | | | | | | |
| | | | Packaging — 0.4% | | | | |
| | 755,000 | | | Sealed Air Corp., 6.875%, 7/15/2033, 144A | | | 698,375 | |
| | | | | | | | |
| | | | Pharmaceuticals — 1.4% | | | | |
| | 1,540,000 | | | Valeant Pharmaceuticals International, 6.375%, 10/15/2020, 144A | | | 1,601,600 | |
| | 530,000 | | | Valeant Pharmaceuticals International, 7.250%, 7/15/2022, 144A | | | 564,450 | |
| | 145,000 | | | VPII Escrow Corp., 6.750%, 8/15/2018, 144A | | | 155,150 | |
| | 70,000 | | | VPII Escrow Corp., 7.500%, 7/15/2021, 144A | | | 75,425 | |
| | | | | | | | |
| | | | | | | 2,396,625 | |
| | | | | | | | |
| | | | Property & Casualty Insurance — 0.5% | | | | |
| | 786,000 | | | Hockey Merger Sub 2, Inc., 7.875%, 10/01/2021, 144A | | | 786,983 | |
| | | | | | | | |
| | | | Retailers — 1.2% | | | | |
| | 40,000 | | | Dillard’s, Inc., 7.000%, 12/01/2028 | | | 40,400 | |
| | 435,000 | | | Dillard’s, Inc., 7.750%, 7/15/2026 | | | 471,975 | |
| | 205,000 | | | Dillard’s, Inc., 7.750%, 5/15/2027 | | | 219,350 | |
| | 35,000 | | | Dillard’s, Inc., 7.875%, 1/01/2023 | | | 38,850 | |
| | 1,440,000 | | | Toys R Us, Inc., 7.375%, 10/15/2018 | | | 1,242,000 | |
| | | | | | | | |
| | | | | | | 2,012,575 | |
| | | | | | | | |
| | | | Sovereigns — 0.8% | | | | |
| | 1,050,000 | | | Republic of Brazil, 8.500%, 1/05/2024, (BRL) | | | 428,044 | |
| | 2,250,000 | | | Republic of Brazil, 10.250%, 1/10/2028, (BRL) | | | 1,012,668 | |
| | | | | | | | |
| | | | | | | 1,440,712 | |
| | | | | | | | |
| | | | Supermarkets — 1.0% | | | | |
| | 205,000 | | | New Albertson’s, Inc., 7.450%, 8/01/2029 | | | 164,513 | |
| | 1,135,000 | | | New Albertson’s, Inc., 7.750%, 6/15/2026 | | | 925,025 | |
| | 935,000 | | | New Albertson’s, Inc., Series C, MTN, 6.625%, 6/01/2028 | | | 673,200 | |
| | | | | | | | |
| | | | | | | 1,762,738 | |
| | | | | | | | |
| | | | Supranational — 0.5% | | | | |
| | 2,000,000 | | | European Bank for Reconstruction & Development, EMTN,
9.000%, 4/28/2014, (BRL) | | | 901,412 | |
| | | | | | | | |
| | | | Technology — 3.1% | | | | |
| | 2,500,000 | | | Alcatel-Lucent USA, Inc., 6.450%, 3/15/2029 | | | 2,112,500 | |
| | 1,930,000 | | | Alcatel-Lucent USA, Inc., 6.500%, 1/15/2028 | | | 1,611,550 | |
| | 450,000 | | | First Data Corp., 10.625%, 6/15/2021, 144A | | | 456,750 | |
| | 960,000 | | | Freescale Semiconductor, Inc., 8.050%, 2/01/2020 | | | 1,010,400 | |
| | | | | | | | |
| | | | | | | 5,191,200 | |
| | | | | | | | |
| | | | Textile — 1.3% | | | | |
| | 2,605,000 | | | Jones Group, Inc. (The), 6.125%, 11/15/2034 | | | 2,018,875 | |
| | 175,000 | | | Jones Group, Inc./Apparel Group Holdings/Apparel Group USA/Footwear Accessories Retail, 6.875%, 3/15/2019 | | | 178,937 | |
| | | | | | | | |
| | | | | | | 2,197,812 | |
| | | | | | | | |
See accompanying notes to financial statements.
| 44
Portfolio of Investments – as of September 30, 2013
Loomis Sayles High Income Fund – (continued)
| | | | | | | | |
Principal
Amount (‡) | | | Description | | Value (†) | |
| | | | Transportation Services — 0.1% | | | | |
| $ | 275,000 | | | APL Ltd., 8.000%, 1/15/2024(e) | | $ | 257,180 | |
| | | | | | | | |
| | | | Treasuries — 9.3% | | | | |
| | 65,000 | | | Italy Buoni Poliennali Del Tesoro, 5.000%, 8/01/2034, (EUR) | | | 87,874 | |
| | 60,000 | | | Italy Buoni Poliennali Del Tesoro, 5.250%, 11/01/2029, (EUR) | | | 84,225 | |
| | 395,000 | | | Italy Buoni Poliennali Del Tesoro, 5.500%, 11/01/2022, (EUR) | | | 577,126 | |
| | 55,000 | | | Italy Buoni Poliennali Del Tesoro, 5.750%, 2/01/2033, (EUR) | | | 81,162 | |
| | 56,500(††) | | | Mexican Fixed Rate Bonds, Series M-20, 8.000%, 12/07/2023, (MXN) | | | 493,422 | |
| | 184,000(††) | | | Mexican Fixed Rate Bonds, Series M-20, 10.000%, 12/05/2024, (MXN) | | | 1,848,821 | |
| | 229,000(††) | | | Mexican Fixed Rate Bonds, Series M-30, 8.500%, 11/18/2038, (MXN) | | | 2,018,468 | |
| | 10,000,000 | | | Philippine Government International Bond, 4.950%, 1/15/2021, (PHP) | | | 247,474 | |
| | 120,000,000 | | | Philippine Government International Bond, 6.250%, 1/14/2036, (PHP)(h) | | | 3,100,597 | |
| | 850,000 | | | Portugal Obrigacoes do Tesouro OT, 3.850%, 4/15/2021, 144A, (EUR) | | | 958,198 | |
| | 1,525,000 | | | Portugal Obrigacoes do Tesouro OT, 4.950%, 10/25/2023, 144A, (EUR) | | | 1,790,768 | |
| | 2,525,000 | | | Spain Government Bond, 4.650%, 7/30/2025, (EUR)(h) | | | 3,469,677 | |
| | 20,391,050 | | | Uruguay Government International Bond, 4.375%, 12/15/2028, (UYU) | | | 994,354 | |
| | | | | | | | |
| | | | | | | 15,752,166 | |
| | | | | | | | |
| | | | Wireless — 2.8% | | | | |
| | 6,000,000 | | | America Movil SAB de CV, 6.450%, 12/05/2022, (MXN) | | | 429,115 | |
| | 900,000 | | | Bakrie Telecom Pte Ltd., 11.500%, 5/07/2015, 144A | | | 252,000 | |
| | 4,501,000 | | | Sprint Capital Corp., 6.875%, 11/15/2028(h) | | | 4,017,142 | |
| | 70,000 | | | Sprint Capital Corp., 8.750%, 3/15/2032 | | | 71,138 | |
| | | | | | | | |
| | | | | | | 4,769,395 | |
| | | | | | | | |
| | | | Wirelines — 5.6% | | | | |
| | 332,000 | | | Axtel SAB de CV, (Step to 8.000% on 1/31/2014), 7.000%, 1/31/2020, 144A(i) | | | 310,420 | |
| | 2,590,000 | | | CenturyLink, Inc., 7.650%, 3/15/2042 | | | 2,305,100 | |
| | 1,145,000 | | | CenturyLink, Inc., Series P, 7.600%, 9/15/2039 | | | 1,021,912 | |
| | 130,000 | | | Cincinnati Bell Telephone Co. LLC, 6.300%, 12/01/2028 | | | 118,300 | |
| | 650,000 | | | Cincinnati Bell, Inc., 8.750%, 3/15/2018 | | | 686,562 | |
| | 300,000 | | | Eircom Finance Ltd., 9.250%, 5/15/2020, 144A, (EUR) | | | 405,855 | |
| | 60,000,000 | | | Empresa de Telecomunicaniones de Bogota, 7.000%, 1/17/2023, 144A, (COP) | | | 26,754 | |
| | 735,000 | | | Frontier Communications Corp., 9.000%, 8/15/2031 | | | 720,300 | |
| | 605,000 | | | Level 3 Communications, Inc., 8.875%, 6/01/2019 | | | 647,350 | |
| | 1,090,000 | | | Level 3 Financing, Inc., 7.000%, 6/01/2020 | | | 1,100,900 | |
| | 350,000 | | | Portugal Telecom International Finance BV, EMTN, 4.500%, 6/16/2025, (EUR) | | | 417,625 | |
| | 420,000 | | | Telecom Italia Capital S.A., 6.000%, 9/30/2034 | | | 345,430 | |
| | 85,000 | | | Telecom Italia Capital S.A., 6.375%, 11/15/2033 | | | 73,008 | |
| | 35,000 | | | Telecom Italia Capital S.A., 7.200%, 7/18/2036 | | | 32,521 | |
| | 85,000 | | | Telecom Italia Capital S.A., 7.721%, 6/04/2038 | | | 81,815 | |
| | 1,125,000 | | | Telefonica Emisiones SAU, 7.045%, 6/20/2036 | | | 1,194,072 | |
| | | | | | | | |
| | | | | | | 9,487,924 | |
| | | | | | | | |
| | | | Total Non-Convertible Bonds
(Identified Cost $126,497,719) | | | 122,950,371 | |
| | | | | | | | |
| | | | | |
| | Convertible Bonds — 11.7% | | | | |
| | | | Automotive — 0.6% | | | | |
| | 530,000 | | | Ford Motor Co., 4.250%, 11/15/2016 | | | 1,047,081 | |
| | | | | | | | |
See accompanying notes to financial statements.
45 |
Portfolio of Investments – as of September 30, 2013
Loomis Sayles High Income Fund – (continued)
| | | | | | | | |
Principal
Amount (‡) | | | Description | | Value (†) | |
| | | | Construction Machinery — 1.5% | | | | |
| $ | 640,000 | | | Ryland Group, Inc. (The), 1.625%, 5/15/2018 | | $ | 930,000 | |
| | 1,325,000 | | | Trinity Industries, Inc., 3.875%, 6/01/2036 | | | 1,607,390 | |
| | | | | | | | |
| | | | | | | 2,537,390 | |
| | | | | | | | |
| | | | Healthcare — 0.2% | | | | |
| | 255,000 | | | Hologic, Inc., Series 2010, (accretes to principal after 12/15/2016),
2.000%, 12/15/2037(i) | | | 286,875 | |
| | | | | | | | |
| | | | Home Construction — 2.1% | | | | |
| | 565,000 | | | KB Home, 1.375%, 2/01/2019 | | | 573,828 | |
| | 70,000 | | | Lennar Corp., 2.000%, 12/01/2020, 144A | | | 90,300 | |
| | 530,000 | | | Lennar Corp., 2.750%, 12/15/2020, 144A | | | 898,350 | |
| | 530,000 | | | Lennar Corp., 3.250%, 11/15/2021, 144A | | | 879,800 | |
| | 925,000 | | | Standard Pacific Corp., 1.250%, 8/01/2032 | | | 1,141,219 | |
| | | | | | | | |
| | | | | | | 3,583,497 | |
| | | | | | | | |
| | | | Independent Energy — 0.8% | | | | |
| | 800,000 | | | Chesapeake Energy Corp., 2.500%, 5/15/2037 | | | 786,000 | |
| | 550,000 | | | Cobalt International Energy, Inc., 2.625%, 12/01/2019 | | | 581,625 | |
| | | | | | | | |
| | | | | | | 1,367,625 | |
| | | | | | | | |
| | | | Metals & Mining — 1.0% | | | | |
| | 1,235,000 | | | Peabody Energy Corp., 4.750%, 12/15/2066 | | | 991,088 | |
| | 165,000 | | | Steel Dynamics, Inc., 5.125%, 6/15/2014 | | | 180,056 | |
| | 440,000 | | | United States Steel Corp., 2.750%, 4/01/2019 | | | 487,025 | |
| | | | | | | | |
| | | | | | | 1,658,169 | |
| | | | | | | | |
| | | | Non-Captive Diversified — 0.1% | | | | |
| | 155,000 | | | Jefferies Group LLC, 3.875%, 11/01/2029 | | | 162,459 | |
| | | | | | | | |
| | | | Oil Field Services — 0.2% | | | | |
| | 200,000 | | | Hornbeck Offshore Services, Inc., 1.500%, 9/01/2019 | | | 258,500 | |
| | | | | | | | |
| | | | Pharmaceuticals — 1.0% | | | | |
| | 315,000 | | | Gilead Sciences, Inc., Series D, 1.625%, 5/01/2016 | | | 872,156 | |
| | 285,000 | | | Mylan, Inc., 3.750%, 9/15/2015 | | | 825,966 | |
| | | | | | | | |
| | | | | | | 1,698,122 | |
| | | | | | | | |
| | | | REITs – Mortgage — 0.6% | | | | |
| | 310,000 | | | iStar Financial, Inc., 3.000%, 11/15/2016 | | | 386,531 | |
| | 630,000 | | | Redwood Trust, Inc., 4.625%, 4/15/2018 | | | 663,863 | |
| | | | | | | | |
| | | | | | | 1,050,394 | |
| | | | | | | | |
| | | | Retailers — 0.5% | | | | |
| | 658,000 | | | priceline.com, Inc., 0.350%, 6/15/2020, 144A | | | 688,844 | |
| | 85,000 | | | priceline.com, Inc., 1.000%, 3/15/2018 | | | 109,225 | |
| | | | | | | | |
| | | | | | | 798,069 | |
| | | | | | | | |
| | | | Technology — 3.1% | | | | |
| | 1,355,000 | | | Ciena Corp., 0.875%, 6/15/2017 | | | 1,379,559 | |
| | 145,000 | | | Ciena Corp., 3.750%, 10/15/2018, 144A | | | 213,603 | |
| | 390,000 | | | Micron Technology, Inc., Series B, 1.875%, 8/01/2031 | | | 731,006 | |
| | 1,185,000 | | | Micron Technology, Inc., Series C, 2.375%, 5/01/2032 | | | 2,266,313 | |
| | 80,000 | | | SanDisk Corp., 1.500%, 8/15/2017 | | | 105,800 | |
See accompanying notes to financial statements.
| 46
Portfolio of Investments – as of September 30, 2013
Loomis Sayles High Income Fund – (continued)
| | | | | | | | |
Principal
Amount (‡) | | | Description | | Value (†) | |
| | | | Technology — continued | | | | |
| $ | 355,000 | | | Xilinx, Inc., 2.625%, 6/15/2017 | | $ | 575,988 | |
| | | | | | | | |
| | | | | | | 5,272,269 | |
| | | | | | | | |
| | | | Wirelines — 0.0% | | | | |
| | 379,000 | | | Axtel SAB de CV, (Step to 8.000% on 1/31/2014), 7.000%, 1/31/2020,
144A, (MXN)(e)(i)(j)(k) | | | 43,333 | |
| | | | | | | | |
| | | | Total Convertible Bonds
(Identified Cost $15,905,075) | | | 19,763,783 | |
| | | | | | | | |
| | | | Total Bonds and Notes
(Identified Cost $142,402,794) | | | 142,714,154 | |
| | | | | | | | |
| | | | | | | | |
| | Senior Loans — 1.9% | | | | |
| | | | Automotive — 0.3% | | | | |
| | 472,625 | | | TI Group Automotive Systems LLC, Term Loan B,
5.500%, 3/27/2019(b) | | | 477,058 | |
| | | | | | | | |
| | | | Consumer Products — 0.0% | | | | |
| | 9,896 | | | Visant Holding Corp., Term Loan B, 5.250%, 12/22/2016(b) | | | 9,580 | |
| | | | | | | | |
| | | | Healthcare — 0.3% | | | | |
| | 428,925 | | | Apria Healthcare Group I, Term Loan, 6.750%, 4/05/2020(b) | | | 431,777 | |
| | | | | | | | |
| | | | Media Non-Cable — 0.1% | | | | |
| | 264,392 | | | SuperMedia, Inc., Exit Term Loan, 11.600%, 12/30/2016(b) | | | 204,639 | |
| | | | | | | | |
| | | | Oil Field Services — 0.3% | | | | |
| | 568,257 | | | Frac Tech International LLC, Term Loan B, 8.500%, 5/06/2016(b) | | | 556,608 | |
| | | | | | | | |
| | | | Other Utility — 0.2% | | | | |
| | 30,000 | | | Power Team Services LLC, Delayed Draw Term Loan, 3.250%, 5/06/2020(m) | | | 29,512 | |
| | 234,413 | | | Power Team Services LLC, 1st Lien Term Loan, 4.250%, 5/06/2020(b) | | | 230,603 | |
| | 95,000 | | | Power Team Services LLC, 2nd Lien Term Loan, 8.250%, 11/06/2020(b) | | | 94,763 | |
| | | | | | | | |
| | | | | | | 354,878 | |
| | | | | | | | |
| | | | Wirelines — 0.7% | | | | |
| | 1,243,750 | | | Fairpoint Communications, Inc., Refi Term Loan, 7.500%, 2/14/2019(b) | | | 1,251,698 | |
| | 25,000 | | | Integra Telecom, Inc., 2nd Lien Term Loan, 9.750%, 2/21/2020(b) | | | 25,605 | |
| | | | | | | | |
| | | | | | | 1,277,303 | |
| | | | | | | | |
| | | | Total Senior Loans
(Identified Cost $3,351,594) | | | 3,311,843 | |
| | | | | | | | |
| | | | | |
| Shares | | | | | | |
| | Preferred Stocks — 5.7% | | | | |
| | Convertible Preferred Stocks — 3.6% | | | | |
| | | | Automotive — 1.2% | | | | |
| | 39,522 | | | General Motors Co., Series B, 4.750%(h) | | | 1,982,028 | |
| | | | | | | | |
| | | | Independent Energy — 0.3% | | | | |
| | 390 | | | Chesapeake Energy Corp., 5.000% | | | 36,231 | |
| | 245 | | | Chesapeake Energy Corp., Series A, 5.750%, 144A | | | 270,265 | |
See accompanying notes to financial statements.
47 |
Portfolio of Investments – as of September 30, 2013
Loomis Sayles High Income Fund – (continued)
| | | | | | | | |
Shares | | | Description | | Value (†) | |
| | | | Independent Energy — continued | | | | |
| | 2,521 | | | SandRidge Energy, Inc., 7.000% | | $ | 251,470 | |
| | | | | | | | |
| | | | | | | 557,966 | |
| | | | | | | | |
| | | | Metals & Mining — 0.9% | | | | |
| | 21,500 | | | ArcelorMittal, 6.000% | | | 462,035 | |
| | 54,082 | | | Cliffs Natural Resources, Inc., 7.000% | | | 1,069,201 | |
| | | | | | | | |
| | | | | | | 1,531,236 | |
| | | | | | | | |
| | | | Non-Captive Diversified — 0.1% | | | | |
| | 94 | | | Bank of America Corp., Series L, 7.250% | | | 101,520 | |
| | | | | | | | |
| | | | Pipelines — 0.7% | | | | |
| | 20,675 | | | El Paso Energy Capital Trust I, 4.750% | | | 1,160,488 | |
| | | | | | | | |
| | | | REITs – Diversified — 0.2% | | | | |
| | 6,611 | | | Weyerhaeuser Co., Series A, 6.375% | | | 350,251 | |
| | | | | | | | |
| | | | REITs – Mortgage — 0.2% | | | | |
| | 8,025 | | | iStar Financial, Inc., Series J, 4.500% | | | 444,425 | |
| | | | | | | | |
| | | | Total Convertible Preferred Stocks
(Identified Cost $5,757,904) | | | 6,127,914 | |
| | | | | | | | |
| | | | | | | | |
| | Non-Convertible Preferred Stocks — 2.1% | | | | |
| | | | Banking — 1.8% | | | | |
| | 78,785 | | | Ally Financial, Inc., Series A, (fixed rate to 5/15/2016, variable rate thereafter), 8.500% | | | 2,109,862 | |
| | 965 | | | Ally Financial, Inc., Series G, 7.000%, 144A | | | 922,058 | |
| | | | | | | | |
| | | | | | | 3,031,920 | |
| | | | | | | | |
| | | | Non-Captive Diversified — 0.3% | | | | |
| | 12,925 | | | iStar Financial, Inc., Series E, 7.875% | | | 305,288 | |
| | 7,500 | | | iStar Financial, Inc., Series F, 7.800% | | | 175,725 | |
| | 550 | | | iStar Financial, Inc., Series G, 7.650% | | | 12,650 | |
| | | | | | | | |
| | | | | | | 493,663 | |
| | | | | | | | |
| | | | Total Non-Convertible Preferred Stocks
(Identified Cost $3,279,861) | | | 3,525,583 | |
| | | | | | | | |
| | | | Total Preferred Stocks
(Identified Cost $9,037,765) | | | 9,653,497 | |
| | | | | | | | |
| | | | | | | | |
| | Common Stocks — 2.4% | | | | |
| | | | Automobiles — 0.5% | | | | |
| | 53,720 | | | Ford Motor Co. | | | 906,256 | |
| | | | | | | | |
| | | | Chemicals — 0.1% | | | | |
| | 1,087 | | | Ashland, Inc. | | | 100,526 | |
| | | | | | | | |
| | | | Diversified Telecommunication Services — 0.0% | | | | |
| | 68 | | | FairPoint Communications, Inc.(f) | | | 649 | |
| | 593 | | | Hawaiian Telcom Holdco, Inc.(f) | | | 15,774 | |
| | | | | | | | |
| | | | | | | 16,423 | |
| | | | | | | | |
See accompanying notes to financial statements.
| 48
Portfolio of Investments – as of September 30, 2013
Loomis Sayles High Income Fund – (continued)
| | | | | | | | |
Shares | | | Description | | Value (†) | |
| | | | Gas Utilities — 0.7% | | | | |
| | 17,600 | | | National Fuel Gas Co. | | $ | 1,210,176 | |
| | | | | | | | |
| | | | Household Durables — 0.5% | | | | |
| | 46,500 | | | KB Home | | | 837,930 | |
| | | | | | | | |
| | | | Oil, Gas & Consumable Fuels — 0.3% | | | | |
| | 14,882 | | | Kinder Morgan, Inc. | | | 529,353 | |
| | | | | | | | |
| | | | Pharmaceuticals — 0.2% | | | | |
| | 6,875 | | | Merck & Co., Inc. | | | 327,319 | |
| | | | | | | | |
| | | | Trading Companies & Distributors — 0.1% | | | | |
| | 2,696 | | | United Rentals, Inc.(f) | | | 157,150 | |
| | | | | | | | |
| | | | Total Common Stocks
(Identified Cost $2,778,432) | | | 4,085,133 | |
| | | | | | | | |
| | | | | | | | |
| | Warrants — 0.1% | | | | |
| | 10,360 | | | FairPoint Communications, Inc., Expiration on 1/24/2018 at $48.81(e)(f)(j) | | | — | |
| | 22,512 | | | Kinder Morgan, Inc., Expiration on 5/25/2017 at $40.00(f) | | | 111,885 | |
| | | | | | | | |
| | | | Total Warrants
(Identified Cost $29,892) | | | 111,885 | |
| | | | | | | | |
| | | | | | | | |
Principal
Amount (‡) | | | | | | |
| | Short-Term Investments — 4.4% | | | | |
| $ | 14,071 | | | Repurchase Agreement with State Street Bank and Trust Company, dated 9/30/2013 at 0.000% to be repurchased at $14,071 on 10/01/2013 collateralized by $20,000 Federal National Mortgage Association, 2.080% due 11/02/2022 valued at $18,584 including accrued interest (Note 2 of Notes to Financial Statements) | | | 14,071 | |
| | 7,123,593 | | | Tri-Party Repurchase Agreement with Fixed Income Clearing Corporation, dated 9/30/2013 at 0.000% to be repurchased at $7,123,593 on 10/01/2013 collateralized by $7,090,000 U.S. Treasury Note, 2.625% due 7/31/2014 valued at $7,267,250 including accrued interest (Note 2 of Notes to Financial Statements) | | | 7,123,593 | |
| | 420,000 | | | U.S. Treasury Bill, 0.071%, 01/30/2014(l) | | | 419,989 | |
| | | | | | | | |
| | | | Total Short-Term Investments
(Identified Cost $7,557,564) | | | 7,557,653 | |
| | | | | | | | |
| | | | | |
| | | | Total Investments — 98.7%
(Identified Cost $165,158,041)(a) | | | 167,434,165 | |
| | | | Other assets less liabilities — 1.3% | | | 2,144,991 | |
| | | | | | | | |
| | | | Net Assets — 100.0% | | $ | 169,579,156 | |
| | | | | | | | |
| | | | | |
| | (‡) | | | Principal Amount stated in U.S. dollars unless otherwise noted. | |
| | (†) | | | See Note 2 of Notes to Financial Statements. | |
| | (††) | | | Amount shown represents units. One unit represents a principal amount of 100. | |
See accompanying notes to financial statements.
49 |
Portfolio of Investments – as of September 30, 2013
Loomis Sayles High Income Fund – (continued)
| | | | | | | | |
| | | | | | | | |
| | (a) | | | Federal Tax Information: | |
| | | | At September 30, 2013, the net unrealized appreciation on investments based on a cost of $165,964,509 for federal income tax purposes was as follows: | |
| | | | Aggregate gross unrealized appreciation for all investments in which there is an excess of value over tax cost | | $ | 13,648,394 | |
| | | | Aggregate gross unrealized depreciation for all investments in which there is an excess of tax cost over value | | | (12,178,738 | ) |
| | | | | | | | |
| | | | Net unrealized appreciation | | $ | 1,469,656 | |
| | | | | | | | |
| | | | | | | | |
| | (b) | | | Variable rate security. Rate as of September 30, 2013 is disclosed. | |
| | (c) | | | The issuer is making partial payments with respect to principal. | |
| | (d) | | | Payment-in-kind security for which the issuer has the option at each interest payment date of making interest payments in cash or additional debt securities. For the period ended September 30, 2013, the issuer paid out 100% of the interest payments in-kind. | |
| | (e) | | | Illiquid security. At September 30, 2013, the value of these securities amounted to $763,553 or 0.5% of net assets. | |
| | (f) | | | Non-income producing security. | |
| | (g) | | | The issuer is in default with respect to interest and/or principal payments. Income is not being accrued. | |
| | (h) | | | All of this security has been designated to cover the Fund’s obligations under open forward foreign currency and futures contracts. | |
| | (i) | | | Coupon rate is a fixed rate for an initial period then resets at a specified date and rate. | |
| | (j) | | | Fair valued by the Fund’s investment adviser. At September 30, 2013, the value of these securities amounted to $43,333 or less than 0.1% of net assets. | |
| | (k) | | | Convertible dollar-indexed note. Coupon rate is based on MXN denominated par value and is payable in USD. | |
| | (l) | | | A portion of this security has been pledged as initial margin for open futures contracts. | |
| | (m) | | | Unfunded loan commitment. Represents a contractual obligation for future funding at the option of the Borrower. The fund receives a stated coupon rate until the borrower draws on the loan commitment, at which time the rate will become the stated rate in the loan agreement. | |
| | (n) | | | Perpetual bond with no specified maturity date. | |
| | | | | | | | |
| | 144A | | | All or a portion of these securities are exempt from registration under Rule 144A of the Securities Act of 1933. These securities may be resold in transactions exempt from registration, normally to qualified institutional buyers. At September 30, 2013, the value of Rule 144A holdings amounted to $41,394,061 or 24.4% of net assets. | |
| | ABS | | | Asset-Backed Securities | | | | |
| | EMTN | | | Euro Medium Term Note | | | | |
| | GMTN | | | Global Medium Term Note | | | | |
| | MTN | | | Medium Term Note | | | | |
| | PIK | | | Payment-in-Kind | | | | |
| | REITs | | | Real Estate Investment Trusts | | | | |
| | | | | | | | |
| | AUD | | | Australian Dollar | | | | |
| | BRL | | | Brazilian Real | | | | |
| | CLP | | | Chilean Peso | | | | |
| | COP | | | Colombian Peso | | | | |
| | EUR | | | Euro | | | | |
| | MXN | | | Mexican Peso | | | | |
| | PHP | | | Philippine Peso | | | | |
| | USD | | | U.S. Dollar | | | | |
| | UYU | | | Uruguayan Peso | | | | |
See accompanying notes to financial statements.
| 50
Portfolio of Investments – as of September 30, 2013
Loomis Sayles High Income Fund – (continued)
At September 30, 2013, the Fund had the following open forward foreign currency contracts:
| | | | | | | | | | | | | | | | | | |
Contract
to
Buy/Sell1 | | Delivery
Date | | | Currency | | Units
of
Currency | | | Notional
Value | | | Unrealized
Appreciation
(Depreciation) | |
| Buy | | | 10/31/2013 | | | Euro | | | 1,530,000 | | | $ | 2,070,009 | | | $ | 42,038 | |
| Sell | | | 10/31/2013 | | | Euro | | | 10,230,000 | | | | 13,840,649 | | | | (314,769 | ) |
| | | | | | | | | | | | | | | | | | |
| Total | | | $ | (272,731 | ) |
| | | | | | | | | | | | | | | | | | |
1 Counterparty is Barclays Bank PLC.
At September 30, 2013, open short futures contracts were as follows:
| | | | | | | | | | | | | | | | |
| Financial Futures | | Expiration
Date | | | Contracts | | | Notional
Value | | | Unrealized
Appreciation
(Depreciation) | |
30 Year U.S. Treasury Bond | | | 12/19/2013 | | | | 7 | | | $ | 933,625 | | | $ | (11,224 | ) |
| | | | | | | | | | | | | | | | |
Industry Summary at September 30, 2013 (Unaudited)
| | | | |
Treasuries | | | 9.3 | % |
Home Construction | | | 6.5 | |
Wirelines | | | 6.3 | |
Metals & Mining | | | 6.3 | |
Technology | | | 6.2 | |
ABS Home Equity | | | 5.9 | |
Banking | | | 4.5 | |
Independent Energy | | | 3.7 | |
Automotive | | | 3.5 | |
Chemicals | | | 3.4 | |
Healthcare | | | 2.9 | |
Wireless | | | 2.8 | |
Pharmaceuticals | | | 2.6 | |
Oil Field Services | | | 2.4 | |
Non-Captive Consumer | | | 2.2 | |
Other Investments, less than 2% each | | | 25.8 | |
Short-Term Investments | | | 4.4 | |
| | | | |
Total Investments | | | 98.7 | |
Other assets less liabilities (including open forward foreign currency contracts and futures contracts) | | | 1.3 | |
| | | | |
Net Assets | | | 100.0 | % |
| | | | |
See accompanying notes to financial statements.
51 |
Portfolio of Investments – as of September 30, 2013
Loomis Sayles International Bond Fund
| | | | | | | | |
Principal Amount (‡) | | | Description | | Value (†) | |
| | Bonds and Notes — 97.1% of Net Assets | | | | |
| | Non-Convertible Bonds — 96.9% | | | | |
| | | | Australia — 1.3% | | | | |
| | 185,000 | | | New South Wales Treasury Corp., 6.000%, 5/01/2020, (AUD) | | $ | 192,212 | |
| | | | | | | | |
| | | | Belgium — 3.3% | | | | |
| | 100,000 | | | Anheuser-Busch InBev NV, EMTN, 1.250%, 3/24/2017, (EUR) | | | 136,330 | |
| | 130,000 | | | Belgium Government Bond, 2.250%, 6/22/2023, (EUR) | | | 170,967 | |
| | 120,000 | | | Belgium Government Bond, 8.000%, 3/28/2015, (EUR) | | | 180,817 | |
| | | | | | | | |
| | | | | | | 488,114 | |
| | | | | | | | |
| | | | Brazil — 1.0% | | | | |
| | 350,000 | | | Republic of Brazil, 8.500%, 1/05/2024, (BRL) | | | 142,681 | |
| | | | | | | | |
| | | | Canada — 2.2% | | | | |
| | 100,000 | | | Ford Auto Securitization Trust, Series 2013-R1A, Class A2,
1.676%, 9/15/2016, 144A, (CAD) | | | 97,242 | |
| | 90,000 | | | Province of Quebec Canada, EMTN, 3.375%, 6/20/2016, (EUR)(b) | | | 130,741 | |
| | 95,000 | | | Shaw Communications, Inc., 5.650%, 10/01/2019, (CAD) | | | 101,397 | |
| | | | | | | | |
| | | | | | | 329,380 | |
| | | | | | | | |
| | | | Finland — 3.4% | | | | |
| | 120,000 | | | Finland Government Bond, 1.500%, 4/15/2023, 144A, (EUR) | | | 155,199 | |
| | 220,000 | | | Finland Government Bond, 4.000%, 7/04/2025, 144A, (EUR)(b) | | | 349,590 | |
| | | | | | | | |
| | | | | | | 504,789 | |
| | | | | | | | |
| | | | France — 4.5% | | | | |
| | 50,000 | | | AXA S.A., EMTN, (fixed rate to 4/16/2020, variable rate thereafter),
5.250%, 4/16/2040, (EUR) | | | 71,187 | |
| | 100,000 | | | Bouygues S.A., 3.641%, 10/29/2019, (EUR) | | | 146,310 | |
| | 320,000 | | | French Treasury Note BTAN, 1.750%, 2/25/2017, (EUR) | | | 447,761 | |
| | | | | | | | |
| | | | | | | 665,258 | |
| | | | | | | | |
| | | | Germany — 7.5% | | | | |
| | 275,000 | | | Bundesrepublik Deutschland, 1.750%, 7/04/2022, (EUR)(b) | | | 378,358 | |
| | 30,000 | | | Bundesrepublik Deutschland, 3.250%, 1/04/2020, (EUR) | | | 46,177 | |
| | 450,000 | | | Bundesrepublik Deutschland, 4.250%, 7/04/2017, (EUR)(b) | | | 694,743 | |
| | | | | | | | |
| | | | | | | 1,119,278 | |
| | | | | | | | |
| | | | Ireland — 1.2% | | | | |
| | 100,000 | | | WPP PLC, 6.000%, 4/04/2017, (GBP) | | | 182,600 | |
| | | | | | | | |
| | | | Italy — 7.1% | | | | |
| | 50,000 | | | Enel Finance International S.A., EMTN, 5.625%, 8/14/2024, (GBP) | | | 81,052 | |
| | 290,000 | | | Italy Buoni Poliennali Del Tesoro, 4.000%, 2/01/2037, (EUR)(b) | | | 346,997 | |
| | 400,000 | | | Italy Buoni Poliennali Del Tesoro, 5.000%, 3/01/2022, (EUR) | | | 571,606 | |
| | 45,000 | | | Telecom Italia Finance S.A., EMTN, 7.750%, 1/24/2033, (EUR) | | | 66,025 | |
| | | | | | | | |
| | | | | | | 1,065,680 | |
| | | | | | | | |
| | | | Japan — 25.0% | | | | |
| | 80,000,000 | | | Japan Finance Organization for Municipalities, 1.900%, 6/22/2018, (JPY) | | | 879,007 | |
| | 43,000,000 | | | Japan Government Five Year Bond, 0.700%, 6/20/2014, (JPY) | | | 439,431 | |
See accompanying notes to financial statements.
| 52
Portfolio of Investments – as of September 30, 2013
Loomis Sayles International Bond Fund – (continued)
| | | | | | | | |
Principal Amount (‡) | | | Description | | Value (†) | |
| | | | Japan — continued | | | | |
| | 78,900,000 | | | Japan Government Ten Year Bond, 1.700%, 12/20/2016, (JPY) | | $ | 842,618 | |
| | 40,500,000 | | | Japan Government Ten Year Bond, 1.700%, 9/20/2017, (JPY)(b) | | | 436,715 | |
| | 26,000,000 | | | Japan Government Thirty Year Bond, 2.000%, 9/20/2040, (JPY) | | | 282,582 | |
| | 76,000,000 | | | Japan Government Twenty Year Bond, 1.900%, 12/20/2028, (JPY) | | | 850,986 | |
| | | | | | | | |
| | | | | | | 3,731,339 | |
| | | | | | | | |
| | | | Jersey — 1.0% | | | | |
| | 100,000 | | | Heathrow Funding Ltd., 4.375%, 1/25/2019, (EUR) | | | 148,437 | |
| | | | | | | | |
| | | | Korea — 1.4% | | | | |
| | 1,000,000 | | | Export-Import Bank of Korea, 3.000%, 5/22/2018, 144A, (NOK) | | | 161,261 | |
| | 2,300,000 | | | Export-Import Bank of Korea, 4.000%, 11/26/2015, 144A, (PHP) | | | 54,436 | |
| | | | | | | | |
| | | | | | | 215,697 | |
| | | | | | | | |
| | | | Luxembourg — 0.3% | | | | |
| | 50,000 | | | ArcelorMittal, 6.000%, 3/01/2021 | | | 51,250 | |
| | | | | | | | |
| | | | Malaysia — 1.2% | | | | |
| | 580,000 | | | Malaysia Government Bond, 3.314%, 10/31/2017, (MYR) | | | 176,588 | |
| | | | | | | | |
| | | | Mexico — 3.5% | | | | |
| | 65,500(††) | | | Mexican Fixed Rate Bonds, Series M, 6.500%, 6/10/2021, (MXN) | | | 523,388 | |
| | | | | | | | |
| | | | Netherlands — 3.1% | | | | |
| | 50,000 | | | BMW Finance NV, 2.375%, 1/24/2023, (EUR) | | | 67,434 | |
| | 55,000 | | | Netherlands Government Bond, 2.250%, 7/15/2022, 144A, (EUR) | | | 76,068 | |
| | 135,000 | | | Netherlands Government Bond, 4.500%, 7/15/2017, 144A, (EUR) | | | 207,828 | |
| | 75,000 | | | Volkswagen International Finance NV, EMTN, 1.875%, 5/15/2017, (EUR) | | | 104,061 | |
| | | | | | | | |
| | | | | | | 455,391 | |
| | | | | | | | |
| | | | New Zealand — 0.9% | | | | |
| | 155,000 | | | New Zealand Government Bond, 6.000%, 4/15/2015, (NZD) | | | 134,437 | |
| | | | | | | | |
| | | | Norway — 2.0% | | | | |
| | 10,000 | | | Eksportfinans ASA, 2.000%, 9/15/2015 | | | 9,750 | |
| | 1,590,000 | | | Norway Government Bond, 4.250%, 5/19/2017, (NOK) | | | 285,464 | |
| | | | | | | | |
| | | | | | | 295,214 | |
| | | | | | | | |
| | | | Philippines — 0.8% | | | | |
| | 5,000,000 | | | Philippine Government International Bond, 4.950%, 1/15/2021, (PHP) | | | 123,737 | |
| | | | | | | | |
| | | | Poland — 2.0% | | | | |
| | 400,000 | | | Poland Government Bond, 4.750%, 4/25/2017, (PLN) | | | 132,987 | |
| | 150,000 | | | Poland Government International Bond, EMTN, 2.625%, 5/12/2015, (CHF)(b) | | | 171,438 | |
| | | | | | | | |
| | | | | | | 304,425 | |
| | | | | | | | |
| | | | Spain — 2.6% | | | | |
| | 50,000 | | | Iberdrola Finanzas SAU, EMTN, 6.000%, 7/01/2022, (GBP) | | | 88,130 | |
| | 35,000 | | | Spain Government Bond, 4.200%, 1/31/2037, (EUR) | | | 41,934 | |
| | 125,000 | | | Spain Government Bond, 4.300%, 10/31/2019, (EUR) | | | 176,480 | |
| | 75,000 | | | Telefonica Emisiones SAU, 5.462%, 2/16/2021 | | | 76,797 | |
| | | | | | | | |
| | | | | | | 383,341 | |
| | | | | | | | |
See accompanying notes to financial statements.
53 |
Portfolio of Investments – as of September 30, 2013
Loomis Sayles International Bond Fund – (continued)
| | | | | | | | |
Principal Amount (‡) | | | Description | | Value (†) | |
| | | | United Kingdom — 7.1% | | | | |
| | 90,000 | | | Barclays Bank PLC, EMTN, 5.750%, 9/14/2026, (GBP) | | $ | 154,113 | |
| | 50,000 | | | British Sky Broadcasting Group PLC, EMTN, 6.000%, 5/21/2027, (GBP) | | | 94,331 | |
| | 105,000 | | | British Telecommunications PLC, 5.750%, 12/07/2028, (GBP) | | | 194,540 | |
| | 50,000 | | | BSKYB Finance UK PLC, 5.750%, 10/20/2017, (GBP) | | | 92,232 | |
| | 100,000 | | | FCE Bank PLC, EMTN, 4.825%, 2/15/2017, (GBP) | | | 175,088 | |
| | 40,000 | | | United Kingdom Treasury, 1.750%, 1/22/2017, (GBP)(b) | | | 66,394 | |
| | 70,000 | | | United Kingdom Treasury, 4.250%, 3/07/2036, (GBP)(b) | | | 128,636 | |
| | 40,000 | | | United Kingdom Treasury, 4.750%, 12/07/2038, (GBP) | | | 79,399 | |
| | 40,000 | | | United Kingdom Treasury, 5.000%, 3/07/2025, (GBP)(b) | | | 78,506 | |
| | | | | | | | |
| | | | | | | 1,063,239 | |
| | | | | | | | |
| | | | United States — 14.5% | | | | |
| | 25,000 | | | Ally Financial, Inc., 3.500%, 7/18/2016 | | | 25,250 | |
| | 35,000 | | | Ally Financial, Inc., 4.750%, 9/10/2018 | | | 34,844 | |
| | 130,000 | | | AmeriCredit Automobile Receivables Trust, Series 2013-3, Class C,
2.380%, 6/10/2019 | | | 129,199 | |
| | 100,000 | | | BA Credit Card Trust, Series 04A1, 4.500%, 6/17/2016, (EUR) | | | 137,082 | |
| | 50,000 | | | Capital One Multi-Asset Execution Trust, Series 2004-B7, Class B7,
0.710%, 8/17/2017, (EUR)(c) | | | 67,313 | |
| | 50,000 | | | Cargill, Inc., EMTN, 5.375%, 3/02/2037, (GBP) | | | 90,834 | |
| | 45,000 | | | Continental Resources, Inc., 4.500%, 4/15/2023 | | | 44,156 | |
| | 45,000 | | | HCA, Inc., 8.360%, 4/15/2024 | | | 48,375 | |
| | 150,000 | | | HSBC Finance Corp., EMTN, 4.500%, 6/14/2016, (EUR)(b) | | | 220,783 | |
| | 50,000 | | | International Lease Finance Corp., 5.875%, 8/15/2022 | | | 49,250 | |
| | 45,000 | | | iStar Financial, Inc., 3.875%, 7/01/2016 | | | 45,113 | |
| | 50,000 | | | JPMorgan Chase & Co., EMTN, REGS, 3.875%, 9/23/2020, (EUR) | | | 74,470 | |
| | 50,000 | | | JPMorgan Chase & Co., EMTN, 4.375%, 1/30/2014, (EUR) | | | 68,525 | |
| | 50,000 | | | Merrill Lynch & Co., Inc., EMTN, 4.625%, 9/14/2018, (EUR) | | | 72,378 | |
| | 15,000 | | | Morgan Stanley, 5.375%, 11/14/2013, (GBP) | | | 24,389 | |
| | 50,000 | | | Pfizer, Inc., 4.550%, 5/15/2017, (EUR) | | | 76,071 | |
| | 75,000 | | | Sprint Communications, Inc., 6.000%, 11/15/2022 | | | 69,000 | |
| | 450,000 | | | U.S. Treasury Note, 0.125%, 7/31/2014 | | | 450,105 | |
| | 25,000 | | | U.S. Treasury Note, 0.250%, 11/30/2013(d) | | | 25,008 | |
| | 45,000 | | | United Continental Holdings, Inc., 6.375%, 6/01/2018 | | | 45,788 | |
| | 45,000 | | | US Airways Pass Through Trust, Series 2013-1, Class 1A, 3.950%, 5/15/2027 | | | 41,625 | |
| | 17,000 | | | Verizon Communications, Inc., 2.500%, 9/15/2016 | | | 17,522 | |
| | 24,000 | | | Verizon Communications, Inc., 6.400%, 9/15/2033 | | | 26,652 | |
| | 25,000 | | | Verizon Communications, Inc., 6.550%, 9/15/2043 | | | 28,223 | |
| | 100,000 | | | Wells Fargo & Co., 4.125%, 11/03/2016, (EUR) | | | 147,640 | |
| | 30,000 | | | Whiting Petroleum Corp., 5.000%, 3/15/2019 | | | 30,075 | |
| | 50,000 | | | Zurich Finance USA, Inc., EMTN, (fixed rate to 6/15/2015,
variable rate thereafter), 4.500%, 6/15/2025, (EUR) | | | 70,348 | |
| | | | | | | | |
| | | | | | | 2,160,018 | |
| | | | | | | | |
| | | | Total Non-Convertible Bonds
(Identified Cost $15,150,432) | | | 14,456,493 | |
| | | | | | | | |
| | | | | | | | |
See accompanying notes to financial statements.
| 54
Portfolio of Investments – as of September 30, 2013
Loomis Sayles International Bond Fund – (continued)
| | | | | | | | |
Principal Amount (‡) | | | Description | | Value (†) | |
| | Convertible Bonds — 0.2% | | | | |
| | | | United States — 0.2% | | | | |
| $ | 20,000 | | | Intel Corp., 2.950%, 12/15/2035
(Identified Cost $20,907) | | $ | 21,650 | |
| | | | | | | | |
| | | | Total Bonds and Notes
(Identified Cost $15,171,339) | | | 14,478,143 | |
| | | | | | | | |
| | | | | | | | |
| Shares | | | | | | |
| | Preferred Stocks — 0.4% | | | | |
| | | | United States — 0.4% | | | | |
| | 449 | | | Dominion Resources, Inc., Series A, 6.125% | | | 23,950 | |
| | 305 | | | Dominion Resources, Inc., Series B, 6.000% | | | 16,302 | |
| | 326 | | | iStar Financial, Inc., Series J, 4.500% | | | 18,054 | |
| | | | | | | | |
| | | | Total Preferred Stocks
(Identified Cost $54,870) | | | 58,306 | |
| | | | | | | | |
| | | | | | | | |
Principal
Amount (‡) | | | | | | |
| | Short-Term Investments — 1.7% | | | | |
| $ | 259,970 | | | Tri-Party Repurchase Agreement with Fixed Income Clearing Corporation, dated 9/30/2013 at 0.000% to be repurchased at $ 259,970 on 10/01/2013 collateralized by $265,000 U.S. Treasury Note, 0.375% due 11/15/2015 valued at $265,373 including accrued interest (Note 2 of Notes to Financial Statements)
(Identified Cost $259,970) | | | 259,970 | |
| | | | | | | | |
| | | | | | | | |
| | | | Total Investments — 99.2%
(Identified Cost $15,486,179)(a) | | | 14,796,419 | |
| | | | Other assets less liabilities — 0.8% | | | 116,150 | |
| | | | | | | | |
| | | | Net Assets — 100.0% | | $ | 14,912,569 | |
| | | | | | | | |
| | | | | | | | |
| | (‡) | | | Principal Amount stated in U.S. dollars unless otherwise noted. | | | | |
| | (†) | | | See Note 2 of Notes to Financial Statements. | | | | |
| | (††) | | | Amount shown represents units. One unit represents a principal amount of 100. | | | | |
| | (a) | | | Federal Tax Information: | | | | |
| | | | At September 30, 2013, the net unrealized depreciation on investments based on a cost of $15,680,469 for federal income tax purposes was as follows: | |
| | | | Aggregate gross unrealized appreciation for all investments in which there is an excess of value over tax cost | | $ | 259,187 | |
| | | | Aggregate gross unrealized depreciation for all investments in which there is an excess of tax cost over value | | | (1,143,237 | ) |
| | | | | | | | |
| | | | Net unrealized depreciation | | $ | (884,050 | ) |
| | | | | | | | |
See accompanying notes to financial statements.
55 |
Portfolio of Investments – as of September 30, 2013
Loomis Sayles International Bond Fund – (continued)
| | | | | | |
| | | | | | |
| | (b) | | | All or a portion of this security has been designated to cover the Fund’s obligations under open forward foreign currency and futures contracts. |
| | (c) | | | Variable rate security. Rate as of September 30, 2013 is disclosed. | | |
| | (d) | | | All of this security has been pledged as initial margin for open futures contracts. |
| | | | | | |
| | 144A | | | All or a portion of these securities are exempt from registration under Rule 144A of the Securities Act of 1933. These securities may be resold in transactions exempt from registration, normally to qualified institutional buyers. At September 30, 2013, the value of Rule 144A holdings amounted to $1,101,624 or 7.4% of net assets. |
| | EMTN | | | Euro Medium Term Note | | |
| | REITs | | | Real Estate Investment Trusts | | |
| | | | | | |
| | AUD | | | Australian Dollar | | |
| | BRL | | | Brazilian Real | | |
| | CAD | | | Canadian Dollar | | |
| | CHF | | | Swiss Franc | | |
| | EUR | | | Euro | | |
| | GBP | | | British Pound | | |
| | JPY | | | Japanese Yen | | |
| | MXN | | | Mexican Peso | | |
| | MYR | | | Malaysian Ringgit | | |
| | NOK | | | Norwegian Krone | | |
| | NZD | | | New Zealand Dollar | | |
| | PHP | | | Philippine Peso | | |
| | PLN | | | Polish Zloty | | |
At September 30, 2013, the Fund had the following open forward foreign currency contracts:
| | | | | | | | | | | | | | | | | | |
Contract
to
Buy/Sell | | Delivery
Date | | | Currency | | Units
of
Currency | | | Notional
Value | | | Unrealized
Appreciation
(Depreciation) | |
| Buy1 | | | 10/02/2013 | | | Brazilian Real | | | 330,000 | | | $ | 148,897 | | | $ | 1,312 | |
| Sell1 | | | 10/02/2013 | | | Brazilian Real | | | 330,000 | | | | 148,897 | | | | (9,312 | ) |
| Sell1 | | | 11/04/2013 | | | Brazilian Real | | | 330,000 | | | | 147,737 | | | | (1,233 | ) |
| Buy3 | | | 12/18/2013 | | | Canadian Dollar | | | 515,694 | | | | 499,685 | | | | 4,348 | |
| Buy1 | | | 12/18/2013 | | | Euro | | | 215,000 | | | | 290,921 | | | | 5,670 | |
| Sell1 | | | 12/23/2013 | | | Philippine Peso | | | 900,000 | | | | 20,667 | | | | 181 | |
| Buy2 | | | 12/11/2013 | | | South Korean Won | | | 104,700,000 | | | | 96,997 | | | | 2,271 | |
| Buy1 | | | 12/11/2013 | | | South Korean Won | | | 575,000,000 | | | | 532,693 | | | | 11,860 | |
| Sell2 | | | 12/11/2013 | | | South Korean Won | | | 104,700,000 | | | | 96,996 | | | | (1,021 | ) |
| Buy1 | | | 12/24/2013 | | | Thai Baht | | | 4,300,000 | | | | 136,793 | | | | (1,169 | ) |
| Sell1 | | | 12/24/2013 | | | Thai Baht | | | 4,300,000 | | | | 136,793 | | | | (1,743 | ) |
| Buy2 | | | 12/17/2013 | | | Turkish Lira | | | 224,000 | | | | 109,394 | | | | (2,149 | ) |
| Sell2 | | | 12/17/2013 | | | Turkish Lira | | | 224,000 | | | | 109,394 | | | | 190 | |
| | | | | | | | | | | | | | | | | | |
| Total | | | $ | 9,205 | |
| | | | | | | | | | | | | | | | | | |
See accompanying notes to financial statements.
| 56
Portfolio of Investments – as of September 30, 2013
Loomis Sayles International Bond Fund – (continued)
At September 30, 2013, the Fund had the following open forward cross currency contracts:
| | | | | | | | | | | | | | | | |
| Settlement Date | | Deliver/Units of Currency | | | Receive/Units of Currency | | | Unrealized
Appreciation
(Depreciation) | |
| 10/03/2013 | | Japanese Yen | | | 11,104,440 | | | Thai Baht2 | | | 3,700,000 | | | $ | 5,308 | |
| 10/03/2013 | | Japanese Yen | | | 4,813,984 | | | Singapore Dollar1 | | | 62,000 | | | | 445 | |
| 12/04/2013 | | Japanese Yen | | | 8,430,870 | | | Malaysian Ringgit2 | | | 285,000 | | | | 1,281 | |
| 12/04/2013 | | Malaysian Ringgit | | | 905,000 | | | Japanese Yen2 | | | 26,432,063 | | | | (7,525 | ) |
| 10/03/2013 | | Singapore Dollar | | | 62,000 | | | Japanese Yen1 | | | 4,874,260 | | | | 168 | |
| 12/24/2013 | | South Korean Won | | | 187,000,000 | | | Japanese Yen2 | | | 16,958,682 | | | | (479 | ) |
| 12/24/2013 | | South Korean Won | | | 32,000,000 | | | Japanese Yen2 | | | 2,938,745 | | | | 292 | |
| 10/03/2013 | | Thai Baht | | | 3,700,000 | | | Japanese Yen2 | | | 11,877,370 | | | | 2,556 | |
| | | | | | | | | | | | | | | | |
| Total | | | $ | 2,046 | |
| | | | | | | | | | | | | | | | |
1 Counterparty is Barclays Bank PLC.
2 Counterparty is Credit Suisse International.
3 Counterparty is UBS AG.
At September 30, 2013, open long futures contracts were as follows:
| | | | | | | | | | | | | | |
| Financial Futures | | Expiration
Date | | | Contracts | | Notional
Value | | | Unrealized
Appreciation
(Depreciation) | |
| German Euro BOBL | | | 12/06/2013 | | | 5 | | $ | 841,744 | | | $ | 13,655 | |
| | | | | | | | | | | | | | |
Industry Summary at September 30, 2013 (Unaudited)
| | | | |
Treasuries | | | 59.7 | % |
Government Guaranteed | | | 5.9 | |
Banking | | | 4.0 | |
Media Non-Cable | | | 2.4 | |
Automotive | | | 2.4 | |
Wirelines | | | 2.3 | |
Local Authorities | | | 2.2 | |
Sovereigns | | | 2.1 | |
Other Investments, less than 2% each | | | 16.5 | |
Short-Term Investments | | | 1.7 | |
| | | | |
Total Investments | | | 99.2 | |
Other assets less liabilities (including open forward foreign currency contracts and futures contracts) | | | 0.8 | |
| | | | |
Net Assets | | | 100.0 | % |
| | | | |
See accompanying notes to financial statements.
57 |
Portfolio of Investments – as of September 30, 2013
Loomis Sayles International Bond Fund – (continued)
Currency Exposure Summary at September 30, 2013 (Unaudited)
| | | | |
Euro | | | 37.9 | % |
Japanese Yen | | | 25.0 | |
United States Dollar | | | 10.7 | |
British Pound | | | 10.3 | |
Mexican Peso | | | 3.5 | |
Other, less than 2% each | | | 11.8 | |
| | | | |
Total Investments | | | 99.2 | |
Other assets less liabilities (including open forward foreign currency contracts and futures contracts) | | | 0.8 | |
| | | | |
Net Assets | | | 100.0 | % |
| | | | |
See accompanying notes to financial statements.
| 58
Portfolio of Investments – as of September 30, 2013
Loomis Sayles Limited Term Government and Agency Fund
| | | | | | | | |
Principal
Amount | | | Description | | Value (†) | |
| | Bonds and Notes — 98.7% of Net Assets | | | | |
| | | | ABS Car Loan — 2.4% | | | | |
| $ | 2,200,000 | | | Avis Budget Rental Car Funding AESOP LLC, Series 2012-3A, Class A, 2.100%, 3/20/2019, 144A | | $ | 2,194,049 | |
| | 910,000 | | | Credit Acceptance Auto Loan Trust, Series 2012-2A, Class A,
1.520%, 3/16/2020, 144A | | | 912,724 | |
| | 1,275,000 | | | Credit Acceptance Auto Loan Trust, Series 2013-1A, Class A,
1.210%, 10/15/2020, 144A | | | 1,274,634 | |
| | 1,653,436 | | | First Investors Auto Owner Trust, Series 2012-2A, Class A2,
1.470%, 5/15/2018, 144A | | | 1,663,311 | |
| | 787,370 | | | First Investors Auto Owner Trust, Series 2013-1A, Class A2,
0.900%, 10/15/2018, 144A | | | 784,372 | |
| | 1,526,885 | | | Prestige Auto Receivables Trust, Series 2013-1A, Class A2,
1.090%, 2/15/2018, 144A | | | 1,529,136 | |
| | 2,000,000 | | | Santander Drive Auto Receivables Trust, Series 2013-4,
Class A3, 1.110%, 12/15/2017 | | | 2,003,204 | |
| | 392,110 | | | SNAAC Auto Receivables Trust, Series 2012-1A, Class A,
1.780%, 6/15/2016, 144A | | | 393,171 | |
| | 2,697,462 | | | Tidewater Auto Receivables Trust, Series 2012-AA, Class A2,
1.210%, 8/15/2015, 144A | | | 2,696,992 | |
| | 3,000,000 | | | Tidewater Auto Receivables Trust, Series 2012-AA, Class A3,
1.990%, 4/15/2019, 144A | | | 3,009,462 | |
| | | | | | | | |
| | | | | | | 16,461,055 | |
| | | | | | | | |
| | | | ABS Credit Card — 1.0% | | | | |
| | 3,220,000 | | | GE Capital Credit Card Master Note Trust, Series 2012-7, Class A,
1.760%, 9/15/2022 | | | 3,082,397 | |
| | 3,400,000 | | | World Financial Network Credit Card Master Trust, Series 2012-A, Class A,
3.140%, 1/17/2023 | | | 3,504,842 | |
| | | | | | | | |
| | | | | | | 6,587,239 | |
| | | | | | | | |
| | | | ABS Home Equity — 0.1% | | | | |
| | 347,840 | | | Countrywide Asset-Backed Certificates, Series 2004-S1, Class A3,
5.115%, 2/25/2035(b) | | | 355,395 | |
| | 230,755 | | | Residential Funding Mortgage Securities II, Series 2002-HI5, Class A7,
6.200%, 1/25/2028(b) | | | 236,703 | |
| | | | | | | | |
| | | | | | | 592,098 | |
| | | | | | | | |
| | | | ABS Other — 0.6% | | | | |
| | 3,000,000 | | | Ally Master Owner Trust, Series 2012-5, Class A, 1.540%, 9/15/2019 | | | 2,963,874 | |
| | 1,250,000 | | | CCG Receivables Trust, Series 2013-1, Class A2, 1.050%, 8/14/2020, 144A | | | 1,250,029 | |
| | | | | | | | |
| | | | | | | 4,213,903 | |
| | | | | | | | |
| | | | ABS Student Loan — 0.2% | | | | |
| | 1,332,312 | | | Montana Higher Education Student Assistance Corp., Series 2012-1, Class A1,
0.780%, 9/20/2022(b) | | | 1,336,443 | |
| | | | | | | | |
| | | | Collateralized Mortgage Obligations — 34.3% | | | | |
| | 209,414 | | | Federal Home Loan Mortgage Corp., REMIC, Series 1500, Class FD,
1.740%, 5/15/2023(b) | | | 217,037 | |
| | 138,447 | | | Federal Home Loan Mortgage Corp., REMIC, Series 1552, Class I,
1.890%, 8/15/2023(b) | | | 144,069 | |
See accompanying notes to financial statements.
59 |
Portfolio of Investments – as of September 30, 2013
Loomis Sayles Limited Term Government and Agency Fund – (continued)
| | | | | | | | |
Principal
Amount | | | Description | | Value (†) | |
| | | | Collateralized Mortgage Obligations — continued | | | | |
| $ | 494,681 | | | Federal Home Loan Mortgage Corp., REMIC, Series 2131, Class ZB,
6.000%, 3/15/2029 | | $ | 554,394 | |
| | 847,785 | | | Federal Home Loan Mortgage Corp., REMIC, Series 2646, Class FM,
0.582%, 11/15/2032(b) | | | 848,426 | |
| | 3,804,878 | | | Federal Home Loan Mortgage Corp., REMIC, Series 2874, Class BC,
5.000%, 10/15/2019 | | | 4,074,587 | |
| | 5,851,004 | | | Federal Home Loan Mortgage Corp., REMIC, Series 2931, Class DE,
4.000%, 2/15/2020 | | | 6,174,348 | |
| | 3,631,000 | | | Federal Home Loan Mortgage Corp., REMIC, Series 2978, Class JG,
5.500%, 5/15/2035 | | | 4,025,000 | |
| | 3,510,000 | | | Federal Home Loan Mortgage Corp., REMIC, Series 3036, Class NE,
5.000%, 9/15/2035 | | | 3,829,835 | |
| | 6,238,638 | | | Federal Home Loan Mortgage Corp., REMIC, Series 3057, Class PE,
5.500%, 11/15/2034 | | | 6,522,383 | |
| | 9,502,333 | | | Federal Home Loan Mortgage Corp., REMIC, Series 3412, Class AY,
5.500%, 2/15/2038 | | | 10,416,913 | |
| | 4,014,850 | | | Federal Home Loan Mortgage Corp., REMIC, Series 3561, Class W,
4.733%, 6/15/2048(b) | | | 4,304,376 | |
| | 5,019,863 | | | Federal Home Loan Mortgage Corp., REMIC, Series 3620, Class AT,
4.642%, 12/15/2036(b) | | | 5,352,746 | |
| | 390,100 | | | Federal Home Loan Mortgage Corp., REMIC, Series 3802, Class BA,
4.500%, 11/15/2028 | | | 406,708 | |
| | 157,734 | | | Federal National Mortgage Association, REMIC, Series 1992-162,
Class FB, 2.120%, 9/25/2022(b) | | | 165,061 | |
| | 131,424 | | | Federal National Mortgage Association, REMIC, Series 1994-42,
Class FD, 2.070%, 4/25/2024(b) | | | 137,385 | |
| | 3,110,293 | | | Federal National Mortgage Association, REMIC, Series 2005-33,
Class QD, 5.000%, 1/25/2034 | | | 3,263,182 | |
| | 2,323,070 | | | Federal National Mortgage Association, REMIC, Series 2005-100, Class BQ,
5.500%, 11/25/2025 | | | 2,576,842 | |
| | 5,491,175 | | | Federal National Mortgage Association, REMIC, Series 2008-86, Class LA,
4.057%, 8/25/2038(b) | | | 5,449,348 | |
| | 116,870 | | | Federal National Mortgage Association, REMIC, Series G93-19, Class FD,
2.140%, 4/25/2023(b) | | | 121,889 | |
| | 2,057,636 | | | FHLMC, 2.715%, 3/01/2038(b) | | | 2,194,478 | |
| | 1,183,924 | | | FHLMC, 2.823%, 12/01/2034(b) | | | 1,261,889 | |
| | 1,628,906 | | | FHLMC, 5.181%, 11/01/2038(b) | | | 1,729,023 | |
| | 6,000,000 | | | FHLMC Multifamily Structured Pass Through Certificates, Series K006, Class A2,
4.251%, 1/25/2020 | | | 6,541,164 | |
| | 4,305,000 | | | FHLMC Multifamily Structured Pass Through Certificates, Series K014, Class A2,
3.871%, 4/25/2021 | | | 4,567,226 | |
| | 3,535,000 | | | FHLMC Multifamily Structured Pass Through Certificates, Series K703, Class A2,
2.699%, 5/25/2018 | | | 3,658,135 | |
| | 700,000 | | | FHLMC Multifamily Structured Pass Through Certificates, Series K704, Class A2,
2.412%, 8/25/2018 | | | 714,522 | |
| | 2,590,000 | | | FHLMC Multifamily Structured Pass Through Certificates, Series K706, Class A2,
2.323%, 10/25/2018 | | | 2,624,115 | |
See accompanying notes to financial statements.
| 60
Portfolio of Investments – as of September 30, 2013
Loomis Sayles Limited Term Government and Agency Fund – (continued)
| | | | | | | | |
Principal
Amount | | | Description | | Value (†) | |
| | | | Collateralized Mortgage Obligations — continued | | | | |
| $ | 7,910,000 | | | FHLMC Multifamily Structured Pass Through Certificates, Series K708, Class A2,
2.130%, 1/25/2019 | | $ | 7,913,251 | |
| | 34,370,000 | | | FHLMC Multifamily Structured Pass Through Certificates, Series K711, Class A2,
1.730%, 7/25/2019 | | | 33,444,141 | |
| | 16,343,859 | | | FHLMC Multifamily Structured Pass Through Certificates, Series KF01, Class A,
0.529%, 4/25/2019(b) | | | 16,349,089 | |
| | 7,192,381 | | | FNMA, 2.217%, 9/01/2037(b) | | | 7,613,879 | |
| | 1,903,508 | | | FNMA, 2.270%, 9/01/2036(b) | | | 2,017,989 | |
| | 5,222,685 | | | FNMA, 2.314%, 11/01/2033(b) | | | 5,488,912 | |
| | 599,924 | | | FNMA, 2.424%, 8/01/2035(b) | | | 639,230 | |
| | 2,533,024 | | | FNMA, 2.530%, 4/01/2037(b) | | | 2,687,981 | |
| | 5,804,229 | | | FNMA, 2.587%, 7/01/2037(b) | | | 6,200,562 | |
| | 1,141,332 | | | FNMA, 2.596%, 10/01/2033(b) | | | 1,211,082 | |
| | 2,727,553 | | | FNMA, 4.738%, 8/01/2038(b) | | | 2,931,376 | |
| | 857,804 | | | Government National Mortgage Association, Series 1998-19, Class ZB,
6.500%, 7/20/2028 | | | 984,356 | |
| | 3,772,942 | | | Government National Mortgage Association, Series 2012-124, Class HT,
7.214%, 7/20/2032(b) | | | 4,354,639 | |
| | 8,322,427 | | | Government National Mortgage Association, Series 2012-H29, Class HF,
0.686%, 10/20/2062(b) | | | 8,264,836 | |
| | 13,260,000 | | | Government National Mortgage Association, Series 2013-52, Class KX,
4.914%, 8/16/2051(b) | | | 15,008,145 | |
| | 7,988,727 | | | Government National Mortgage Association, Series 2013-H02, Class GF,
0.686%, 12/20/2062(b) | | | 7,939,500 | |
| | 5,108,432 | | | Government National Mortgage Association, Series 2013-H10, Class FA,
0.586%, 3/20/2063(b) | | | 5,044,300 | |
| | 15,330,000 | | | Government National Mortgage Association, Series 2013-H22, Class FT,
0.770%, 4/20/2063(b) | | | 15,279,698 | |
| | 781,103 | | | NCUA Guaranteed Notes, Series 2010-A1, Class A, 0.524%, 12/07/2020(b) | | | 781,931 | |
| | 1,603,000 | | | NCUA Guaranteed Notes, Series 2010-C1, Class A2, 2.900%, 10/29/2020 | | | 1,665,052 | |
| | 1,481,910 | | | NCUA Guaranteed Notes, Series 2010-R1, Class 1A, 0.624%, 10/07/2020(b) | | | 1,490,401 | |
| | 5,625,654 | | | NCUA Guaranteed Notes, Series 2010-R3, Class 1A, 0.734%, 12/08/2020(b) | | | 5,653,782 | |
| | 124,116 | | | NCUA Guaranteed Notes, Series 2010-R3, Class 2A, 0.734%, 12/08/2020(b) | | | 125,280 | |
| | | | | | | | |
| | | | | | | 234,964,493 | |
| | | | | | | | |
| | | | Commercial Mortgage-Backed Securities — 15.1% | | | | |
| | 1,780,000 | | | Banc of America Merrill Lynch Commercial Mortgage, Inc., Series 2007-2,
Class A4, 5.793%, 4/10/2049(b) | | | 1,992,361 | |
| | 375,000 | | | Banc of America Merrill Lynch Commercial Mortgage, Inc., Series 2007-5,
Class A4, 5.492%, 2/10/2051 | | | 410,837 | |
| | 1,445,000 | | | Bear Stearns Commercial Mortgage Securities, Series 2007-PW15, Class A4,
5.331%, 2/11/2044 | | | 1,584,165 | |
| | 3,490,000 | | | CGBAM Commercial Mortgage Trust, Series 2013-BREH, Class A2,
1.282%, 5/15/2030, 144A(b) | | | 3,488,178 | |
| | 1,470,000 | | | Citigroup Commercial Mortgage Trust, Series 2008-C7, Class A4,
6.336%, 12/10/2049(b) | | | 1,675,169 | |
| | 3,200,500 | | | Citigroup/Deutsche Bank Commercial Mortgage Trust, Series 2007-CD4,
Class A4, 5.322%, 12/11/2049 | | | 3,537,980 | |
See accompanying notes to financial statements.
61 |
Portfolio of Investments – as of September 30, 2013
Loomis Sayles Limited Term Government and Agency Fund – (continued)
| | | | | | | | |
Principal
Amount | | | Description | | Value (†) | |
| | | | Commercial Mortgage-Backed Securities — continued | | | | |
| $ | 1,139,501 | | | COBALT CMBS Commercial Mortgage Trust, Series 2007-C2, Class A3,
5.484%, 4/15/2047 | | $ | 1,267,811 | |
| | 1,135,000 | | | Commercial Mortgage Pass Through Certificates, Series 2012-CR2, Class A4,
3.147%, 8/15/2045 | | | 1,104,554 | |
| | 2,625,000 | | | Credit Suisse Mortgage Capital Certificates, Series 2007-C2, Class A3,
5.542%, 1/15/2049 | | | 2,908,117 | |
| | 5,270,000 | | | Credit Suisse Mortgage Capital Certificates, Series 2007-C5, Class A4,
5.695%, 9/15/2040 | | | 5,885,589 | |
| | 3,000,000 | | | Credit Suisse Mortgage Capital Certificates, Series 2008-C1, Class A3,
6.252%, 2/15/2041(b) | | | 3,398,481 | |
| | 1,000,000 | | | Del Coronado Trust, Series 2013-HDC, Class A, 0.983%, 3/15/2026, 144A(b) | | | 998,187 | |
| | 1,200,000 | | | Extended Stay America Trust, Series 2013-ESFL, Class A2FL,
0.882%, 12/05/2031, 144A(b) | | | 1,193,591 | |
| | 5,000,000 | | | Greenwich Capital Commercial Funding Corp., Series 2007-GG9, Class A4,
5.444%, 3/10/2039 | | | 5,532,300 | |
| | 7,778,000 | | | Greenwich Capital Commercial Funding Corp., Series 2007-GG11, Class A4,
5.736%, 12/10/2049 | | | 8,736,242 | |
| | 6,840,000 | | | GS Mortgage Securities Corp. II, Series 2013-KYO, Class A,
1.032%, 11/08/2029, 144A(b) | | | 6,776,894 | |
| | 295,000 | | | JPMorgan Chase Commercial Mortgage Securities Trust, Series 2006-CB15,
Class A4, 5.814%, 6/12/2043 | | | 322,368 | |
| | 2,785,000 | | | JPMorgan Chase Commercial Mortgage Securities Trust, Series 2007-CB18,
Class A4, 5.440%, 6/12/2047 | | | 3,076,645 | |
| | 5,000,000 | | | JPMorgan Chase Commercial Mortgage Securities Trust, Series 2007-LDPX,
Class A3, 5.420%, 1/15/2049 | | | 5,525,930 | |
| | 3,500,000 | | | JPMorgan Chase Commercial Mortgage Securities Trust, Series 2013-JWRZ,
Class A, 0.962%, 4/15/2030, 144A(b) | | | 3,464,394 | |
| | 1,659,972 | | | LB-UBS Commercial Mortgage Trust, Series 2007-C2, Class A3,
5.430%, 2/15/2040 | | | 1,826,034 | |
| | 3,039,101 | | | LB-UBS Commercial Mortgage Trust, Series 2007-C7, Class A3,
5.866%, 9/15/2045 | | | 3,400,298 | |
| | 1,173,000 | | | Merrill Lynch/Countrywide Commercial Mortgage Trust, Series 2007-5,
Class A4, 5.378%, 8/12/2048 | | | 1,286,259 | |
| | 5,364,000 | | | Merrill Lynch/Countrywide Commercial Mortgage Trust, Series 2007-6,
Class A4, 5.485%, 3/12/2051 | | | 5,925,949 | |
| | 5,000,000 | | | Merrill Lynch/Countrywide Commercial Mortgage Trust, Series 2007-9,
Class A4, 5.700%, 9/12/2049 | | | 5,596,010 | |
| | 3,620,000 | | | Morgan Stanley Bank of America Merrill Lynch Trust, Series 2013-C11,
Class A2, 3.085%, 8/15/2046 | | | 3,758,418 | |
| | 3,485,000 | | | Morgan Stanley Capital I, Series 2007-HQ12, Class A5, 5.760%, 4/12/2049(b) | | | 3,771,042 | |
| | 1,500,000 | | | Morgan Stanley Capital I, Series 2007-IQ15, Class A4, 6.107%, 6/11/2049(b) | | | 1,680,294 | |
| | 2,622,562 | | | Motel 6 Trust, Series 2012-MTL6, Class A1, 1.500%, 10/05/2025, 144A | | | 2,602,339 | |
| | 4,410,000 | | | Wachovia Bank Commercial Mortgage Trust, Series 2006-C28, Class A4,
5.572%, 10/15/2048 | | | 4,841,598 | |
| | 3,775,000 | | | Wachovia Bank Commercial Mortgage Trust, Series 2007-C30, Class A5,
5.342%, 12/15/2043 | | | 4,176,426 | |
| | 1,450,000 | | | WFRBS Commercial Mortgage Trust, Series 2013-C15, Class A2,
2.900%, 8/15/2046 | | | 1,489,701 | |
| | | | | | | | |
| | | | | | | 103,234,161 | |
| | | | | | | | |
See accompanying notes to financial statements.
| 62
Portfolio of Investments – as of September 30, 2013
Loomis Sayles Limited Term Government and Agency Fund – (continued)
| | | | | | | | |
Principal
Amount | | | Description | | Value (†) | |
| | | | Hybrid ARMs — 19.3% | | | | |
| $ | 2,166,788 | | | FHLMC, 2.204%, 6/01/2037(b) | | $ | 2,287,391 | |
| | 6,948,454 | | | FHLMC, 2.211%, 5/01/2037(b) | | | 7,359,092 | |
| | 2,422,734 | | | FHLMC, 2.295%, 4/01/2036(b) | | | 2,566,223 | |
| | 3,960,038 | | | FHLMC, 2.345%, 7/01/2033(b) | | | 4,198,899 | |
| | 2,987,614 | | | FHLMC, 2.378%, 3/01/2036(b) | | | 3,160,814 | |
| | 989,313 | | | FHLMC, 2.385%, 2/01/2035(b) | | | 1,052,005 | |
| | 6,586,699 | | | FHLMC, 2.409%, 2/01/2036(b) | | | 6,989,788 | |
| | 2,087,445 | | | FHLMC, 2.412%, 4/01/2035(b) | | | 2,228,306 | |
| | 3,082,265 | | | FHLMC, 2.424%, 2/01/2036(b) | | | 3,255,138 | |
| | 3,392,060 | | | FHLMC, 2.476%, 11/01/2036(b) | | | 3,613,038 | |
| | 1,125,904 | | | FHLMC, 2.725%, 4/01/2037(b) | | | 1,202,765 | |
| | 3,475,926 | | | FHLMC, 2.741%, 4/01/2037(b) | | | 3,698,677 | |
| | 4,694,932 | | | FHLMC, 2.899%, 9/01/2035(b) | | | 4,955,620 | |
| | 1,414,000 | | | FHLMC, 3.158%, 11/01/2038(b) | | | 1,506,440 | |
| | 545,148 | | | FHLMC, 4.072%, 9/01/2038(b) | | | 574,790 | |
| | 3,357,931 | | | FHLMC, 4.897%, 9/01/2038(b) | | | 3,541,797 | |
| | 308,001 | | | FHLMC, 5.251%, 12/01/2037(b) | | | 331,415 | |
| | 877,930 | | | FHLMC, 5.412%, 3/01/2037(b) | | | 930,964 | |
| | 296,079 | | | FNMA, 1.909%, 2/01/2037(b) | | | 313,787 | |
| | 3,726,162 | | | FNMA, 1.997%, 7/01/2035(b) | | | 3,946,603 | |
| | 1,150,811 | | | FNMA, 2.306%, 9/01/2034(b) | | | 1,222,610 | |
| | 850,818 | | | FNMA, 2.310%, 12/01/2034(b) | | | 899,244 | |
| | 722,330 | | | FNMA, 2.314%, 4/01/2033(b) | | | 765,761 | |
| | 2,633,772 | | | FNMA, 2.330%, 4/01/2034(b) | | | 2,788,703 | |
| | 2,999,421 | | | FNMA, 2.341%, 6/01/2036(b) | | | 3,178,000 | |
| | 4,398,853 | | | FNMA, 2.347%, 8/01/2035(b) | | | 4,619,111 | |
| | 10,073,532 | | | FNMA, 2.356%, 10/01/2034(b) | | | 10,713,673 | |
| | 1,935,981 | | | FNMA, 2.356%, 1/01/2036(b) | | | 2,044,132 | |
| | 7,857,127 | | | FNMA, 2.384%, 4/01/2034(b) | | | 8,348,535 | |
| | 5,401,407 | | | FNMA, 2.405%, 6/01/2037(b) | | | 5,748,506 | |
| | 2,445,719 | | | FNMA, 2.412%, 6/01/2033(b) | | | 2,560,453 | |
| | 1,505,028 | | | FNMA, 2.419%, 8/01/2034(b) | | | 1,619,423 | |
| | 3,435,869 | | | FNMA, 2.492%, 10/01/2033(b) | | | 3,650,779 | |
| | 729,015 | | | FNMA, 2.552%, 8/01/2033(b) | | | 776,990 | |
| | 3,008,531 | | | FNMA, 2.557%, 4/01/2037(b) | | | 3,189,999 | |
| | 685,486 | | | FNMA, 2.647%, 8/01/2036(b) | | | 733,149 | |
| | 6,492,040 | | | FNMA, 2.673%, 3/01/2037(b) | | | 6,895,166 | |
| | 2,080,440 | | | FNMA, 2.679%, 5/01/2035(b) | | | 2,231,455 | |
| | 2,041,883 | | | FNMA, 2.695%, 2/01/2047(b) | | | 2,173,840 | |
| | 3,511,442 | | | FNMA, 3.223%, 6/01/2035(b) | | | 3,725,837 | |
| | 6,587,814 | | | FNMA, 5.754%, 9/01/2037(b) | | | 7,055,779 | |
| | | | | | | | |
| | | | | | | 132,654,697 | |
| | | | | | | | |
| | | | Mortgage Related — 25.5% | | | | |
| | 9,796,632 | | | FHLMC, 2.388%, 3/01/2037(b) | | | 10,383,060 | |
| | 2,652,998 | | | FHLMC, 2.409%, 9/01/2038(b) | | | 2,813,376 | |
| | 17,269,252 | | | FHLMC, 3.000%, with various maturities from 2026 to 2027(c) | | | 17,862,834 | |
| | 1,637,653 | | | FHLMC, 4.000%, with various maturities from 2024 to 2042(c) | | | 1,721,881 | |
See accompanying notes to financial statements.
63 |
Portfolio of Investments – as of September 30, 2013
Loomis Sayles Limited Term Government and Agency Fund – (continued)
| | | | | | | | |
Principal
Amount | | | Description | | Value (†) | |
| | | | Mortgage Related — continued | | | | |
| $ | 1,470,458 | | | FHLMC, 4.500%, with various maturities from 2025 to 2034(c) | | $ | 1,555,710 | |
| | 692,079 | | | FHLMC, 5.500%, 10/01/2023 | | | 746,847 | |
| | 57,207 | | | FHLMC, 6.000%, 11/01/2019 | | | 62,483 | |
| | 1,858,391 | | | FHLMC, 6.500%, with various maturities from 2014 to 2034(c) | | | 2,076,776 | |
| | 27,574 | | | FHLMC, 7.000%, 2/01/2016 | | | 28,648 | |
| | 1,428 | | | FHLMC, 7.500%, with various maturities from 2014 to 2026(c) | | | 1,553 | |
| | 2,460 | | | FHLMC, 8.000%, 9/01/2015 | | | 2,568 | |
| | 2,546 | | | FHLMC, 10.000%, 7/01/2019 | | | 2,887 | |
| | 40,100 | | | FHLMC, 11.500%, with various maturities from 2015 to 2020(c) | | | 44,404 | |
| | 6,923,485 | | | FNMA, 2.343%, 4/01/2037(b) | | | 7,306,213 | |
| | 5,663,088 | | | FNMA, 2.406%, 7/01/2035(b) | | | 5,972,738 | |
| | 9,006,655 | | | FNMA, 3.000%, with various maturities from 2027 to 2042(c) | | | 9,319,943 | |
| | 1,454,195 | | | FNMA, 4.000%, with various maturities in 2019(c) | | | 1,543,031 | |
| | 3,179,126 | | | FNMA, 4.500%, 1/01/2025 | | | 3,378,757 | |
| | 4,888,529 | | | FNMA, 5.000%, with various maturities from 2037 to 2038(c) | | | 5,311,842 | |
| | 2,285,579 | | | FNMA, 5.500%, with various maturities from 2018 to 2033(c) | | | 2,478,633 | |
| | 4,256,965 | | | FNMA, 6.000%, with various maturities from 2017 to 2022(c) | | | 4,662,057 | |
| | 679,932 | | | FNMA, 6.500%, with various maturities from 2017 to 2037(c) | | | 759,614 | |
| | 29,447 | | | FNMA, 7.000%, 12/01/2022 | | | 29,537 | |
| | 166,863 | | | FNMA, 7.500%, with various maturities from 2015 to 2032(c) | | | 190,894 | |
| | 10,024 | | | FNMA, 8.000%, with various maturities from 2015 to 2016(c) | | | 10,475 | |
| | 5,712,717 | | | GNMA, 1.963%, 2/20/2061(b) | | | 5,936,158 | |
| | 4,801,226 | | | GNMA, 2.085%, 2/20/2063(b) | | | 5,025,577 | |
| | 5,379,142 | | | GNMA, 2.355%, 3/20/2063(b) | | | 5,719,959 | |
| | 3,490,776 | | | GNMA, 2.578%, 2/20/2063(b) | | | 3,725,524 | |
| | 4,856,384 | | | GNMA, 4.479%, 2/20/2062 | | | 5,225,867 | |
| | 4,930,852 | | | GNMA, 4.521%, 12/20/2061 | | | 5,401,995 | |
| | 2,459,153 | | | GNMA, 4.528%, 3/20/2062 | | | 2,700,287 | |
| | 7,368,617 | | | GNMA, 4.532%, 12/20/2062 | | | 8,139,972 | |
| | 2,580,427 | | | GNMA, 4.560%, 3/20/2062 | | | 2,831,103 | |
| | 12,850,769 | | | GNMA, 4.583%, 11/20/2062 | | | 14,184,975 | |
| | 1,522,464 | | | GNMA, 4.599%, 4/20/2063 | | | 1,688,607 | |
| | 4,429,947 | | | GNMA, 4.604%, 6/20/2062 | | | 4,882,418 | |
| | 1,536,899 | | | GNMA, 4.616%, 8/20/2061 | | | 1,686,647 | |
| | 1,993,984 | | | GNMA, 4.639%, 3/20/2062 | | | 2,195,476 | |
| | 8,945,554 | | | GNMA, 4.659%, 2/20/2062 | | | 9,851,918 | |
| | 2,036,241 | | | GNMA, 4.698%, 7/20/2061 | | | 2,235,061 | |
| | 8,817,323 | | | GNMA, 4.700%, with various maturities in 2061(c) | | | 9,685,315 | |
| | 2,000,447 | | | GNMA, 4.717%, 3/20/2061 | | | 2,190,039 | |
| | 1,699,625 | | | GNMA, 4.808%, 8/20/2062 | | | 1,875,456 | |
| | 969,892 | | | GNMA, 5.167%, 4/20/2061 | | | 1,066,326 | |
| | 32,934 | | | GNMA, 6.000%, 12/15/2031 | | | 36,848 | |
| | 140,592 | | | GNMA, 6.500%, 5/15/2031 | | | 163,942 | |
| | 116,824 | | | GNMA, 7.000%, 10/15/2028 | | | 133,130 | |
| | | | | | | | |
| | | | | | | 174,849,361 | |
| | | | | | | | |
See accompanying notes to financial statements.
| 64
Portfolio of Investments – as of September 30, 2013
Loomis Sayles Limited Term Government and Agency Fund – (continued)
| | | | | | | | |
Principal
Amount | | | Description | | Value (†) | |
| | | | Treasuries — 0.2% | | | | |
| $ | 1,245,000 | | | U.S. Treasury Note, 1.875%, 4/30/2014 | | $ | 1,257,985 | |
| | | | | | | | |
| | | | Total Bonds and Notes
(Identified Cost $672,076,077) | | | 676,151,435 | |
| | | | | | | | |
| | | | | | | | |
| | Short-Term Investments — 1.7% | | | | |
| | 11,602,796 | | | Tri-Party Repurchase Agreement with Fixed Income Clearing Corporation, dated 9/30/2013 at 0.000% to be repurchased at $11,602,796 on 10/01/2013 collateralized by $12,020,000 U.S. Treasury Note, 0.625% due 8/31/2017 valued at $11,839,700 including accrued interest (Note 2 of Notes to Financial Statements) (Identified Cost $11,602,796) | | | 11,602,796 | |
| | | | | | | | |
| | | | Total Investments — 100.4%
(Identified Cost $683,678,873)(a) | | | 687,754,231 | |
| | | | Other assets less liabilities — (0.4)% | | | (2,522,236 | ) |
| | | | | | | | |
| | | | Net Assets — 100.0% | | $ | 685,231,995 | |
| | | | | | | | |
| | | | | | | | |
| | (†) | | | See Note 2 of Notes to Financial Statements. | | | | |
| | (a) | | | Federal Tax Information: | | | | |
| | | | At September 30, 2013, the net unrealized appreciation on investments based on a cost of $683,694,920 for federal income tax purposes was as follows: | |
| | | | Aggregate gross unrealized appreciation for all investments in which there is an excess of value over tax cost | | $ | 11,636,690 | |
| | | | Aggregate gross unrealized depreciation for all investments in which there is an excess of tax cost over value | | | (7,577,379 | ) |
| | | | | | | | |
| | | | Net unrealized appreciation | | $ | 4,059,311 | |
| | | | | | | | |
| | (b) | | | Variable rate security. Rate as of September 30, 2013 is disclosed. | | | | |
| | (c) | | | The Fund’s investment in mortgage related securities of Federal Home Loan Mortgage Corporation, Federal National Mortgage Association and Government National Mortgage Association are interests in separate pools of mortgages. All separate investments in securities of each issuer which have the same coupon rate have been aggregated for the purpose of presentation in the Portfolio of Investments. | |
| | | | | | | | |
| | 144A | | | All or a portion of these securities are exempt from registration under Rule 144A of the Securities Act of 1933. These securities may be resold in transactions exempt from registration, normally to qualified institutional buyers. At September 30, 2013, the value of Rule 144A holdings amounted to $34,231,463 or 5.0% of net assets. | |
| | ABS | | | Asset-Backed Securities | | | | |
| | ARMs | | | Adjustable Rate Mortgages | | | | |
| | FHLMC | | | Federal Home Loan Mortgage Corp. | | | | |
| | FNMA | | | Federal National Mortgage Association | | | | |
| | GNMA | | | Government National Mortgage Association | | | | |
| | REMIC | | | Real Estate Mortgage Investment Conduit | | | | |
See accompanying notes to financial statements.
65 |
Portfolio of Investments – as of September 30, 2013
Loomis Sayles Limited Term Government and Agency Fund – (continued)
Industry Summary at September 30, 2013 (Unaudited)
| | | | |
Collateralized Mortgage Obligations | | | 34.3 | % |
Mortgage Related | | | 25.5 | |
Hybrid ARMs | | | 19.3 | |
Commercial Mortgage-Backed Securities | | | 15.1 | |
ABS Car Loan | | | 2.4 | |
Other Investments, less than 2% each | | | 2.1 | |
Short-Term Investments | | | 1.7 | |
| | | | |
Total Investments | | | 100.4 | |
Other assets less liabilities | | | (0.4 | ) |
| | | | |
Net Assets | | | 100.0 | % |
| | | | |
See accompanying notes to financial statements.
| 66
Statements of Assets and Liabilities
September 30, 2013
| | | | | | | | | | | | | | | | |
| | | Core Plus
Bond Fund | | | High Income
Fund | | | International
Bond Fund | | | Limited Term
Government
and Agency
Fund | |
ASSETS | | | | | | | | | | | | | | | | |
Investments at cost | | $ | 1,355,726,449 | | | $ | 165,158,041 | | | $ | 15,486,179 | | | $ | 683,678,873 | |
Net unrealized appreciation (depreciation) | | | (13,480,452 | ) | | | 2,276,124 | | | | (689,760 | ) | | | 4,075,358 | |
| | | | | | | | | | | | | | | | |
Investments at value | | | 1,342,245,997 | | | | 167,434,165 | | | | 14,796,419 | | | | 687,754,231 | |
Due from brokers (Note 2) | | | — | | | | 280,000 | | | | — | | | | — | |
Foreign currency at value (identified cost $0, $0, $137,430 and $0) | | | — | | | | — | | | | 136,546 | | | | — | |
Receivable for Fund shares sold | | | 4,448,067 | | | | 1,051,012 | | | | 2,544 | | | | 1,388,652 | |
Receivable from investment adviser (Note 6) | | | — | | | | — | | | | 1,565 | | | | — | |
Receivable for securities sold | | | 12,163 | | | | 1,095,413 | | | | 365,175 | | | | — | |
Receivable for delayed delivery securities sold (Note 2) | | | 13,592,669 | | | | — | | | | — | | | | — | |
Dividends and interest receivable | | | 15,672,800 | | | | 2,404,800 | | | | 166,886 | | | | 3,304,959 | |
Unrealized appreciation on forward foreign currency contracts (Note 2) | | | — | | | | 42,038 | | | | 35,882 | | | | — | |
Tax reclaims receivable | | | 227,999 | | | | 5,230 | | | | — | | | | — | |
Receivable for variation margin on futures contracts (Note 2) | | | — | | | | 438 | | | | 1,823 | | | | — | |
| | | | | | | | | | | | | | | | |
TOTAL ASSETS | | | 1,376,199,695 | | | | 172,313,096 | | | | 15,506,840 | | | | 692,447,842 | |
| | | | | | | | | | | | | | | | |
LIABILITIES | | | | | | | | | | | | | | | | |
Payable for securities purchased | | | 18,347,857 | | | | 1,531,727 | | | | 374,452 | | | | 5,114,484 | |
Payable for delayed delivery securities purchased (Note 2) | | | 33,726,500 | | | | — | | | | — | | | | — | |
Payable for Fund shares redeemed | | | 6,903,081 | | | | 143,535 | | | | 84,251 | | | | 1,125,382 | |
Unrealized depreciation on forward foreign currency contracts (Note 2) | | | — | | | | 314,769 | | | | 24,631 | | | | — | |
Distributions payable | | | — | | | | — | | | | — | | | | 312,285 | |
Management fees payable (Note 6) | | | 432,911 | | | | 107,001 | | | | — | | | | 231,413 | |
Deferred Trustees’ fees (Note 6) | | | 305,053 | | | | 131,631 | | | | 54,700 | | | | 282,234 | |
Administrative fees payable (Note 6) | | | 47,467 | | | | 6,058 | | | | 552 | | | | 24,811 | |
Payable to distributor (Note 6d) | | | 14,206 | | | | 2,510 | | | | 158 | | | | 3,740 | |
Other accounts payable and accrued expenses | | | 145,403 | | | | 496,709 | | | | 55,527 | | | | 121,498 | |
| | | | | | | | | | | | | | | | |
TOTAL LIABILITIES | | | 59,922,478 | | | | 2,733,940 | | | | 594,271 | | | | 7,215,847 | |
| | | | | | | | | | | | | | | | |
NET ASSETS | | $ | 1,316,277,217 | | | $ | 169,579,156 | | | $ | 14,912,569 | | | $ | 685,231,995 | |
| | | | | | | | | | | | | | | | |
NET ASSETS CONSIST OF: | | | | | | | | | | | | | | | | |
Paid-in capital | | $ | 1,332,158,662 | | | $ | 158,973,265 | | | $ | 15,467,205 | | | $ | 689,513,173 | |
Undistributed (Distributions in excess of) net investment income | | | 2,382,095 | | | | (316,940 | ) | | | (67,205 | ) | | | (594,519 | ) |
Accumulated net realized gain (loss) on investments, futures contracts and foreign currency transactions | | | (4,810,603 | ) | | | 8,926,236 | | | | 174,800 | | | | (7,762,017 | ) |
Net unrealized appreciation (depreciation) on investments, futures contracts and foreign currency translations | | | (13,452,937 | ) | | | 1,996,595 | | | | (662,231 | ) | | | 4,075,358 | |
| | | | | | | | | | | | | | | | |
NET ASSETS | | $ | 1,316,277,217 | | | $ | 169,579,156 | | | $ | 14,912,569 | | | $ | 685,231,995 | |
| | | | | | | | | | | | | | | | |
See accompanying notes to financial statements.
67 |
Statements of Assets and Liabilities (continued)
September 30, 2013
| | | | | | | | | | | | | | | | |
| | | Core Plus
Bond Fund | | | High Income
Fund | | | International
Bond Fund | | | Limited Term
Government
and Agency
Fund | |
COMPUTATION OF NET ASSET VALUE AND OFFERING PRICE: | | | | | | | | | | | | | | | | |
Class A shares: | | | | | | | | | | | | | | | | |
Net assets | | $ | 436,199,023 | | | $ | 45,790,748 | | | $ | 8,982,779 | | | $ | 355,212,046 | |
| | | | | | | | | | | | | | | | |
Shares of beneficial interest | | | 34,310,010 | | | | 9,965,403 | | | | 915,338 | | | | 30,402,246 | |
| | | | | | | | | | | | | | | | |
Net asset value and redemption price per share | | $ | 12.71 | | | $ | 4.59 | | | $ | 9.81 | | | $ | 11.68 | |
| | | | | | | | | | | | | | | | |
Offering price per share (100/[100-maximum sales charge] of net asset value) (Note 1) | | $ | 13.31 | | | $ | 4.81 | | | $ | 10.27 | | | $ | 12.04 | |
| | | | | | | | | | | | | | | | |
Class B shares: (redemption price per share is equal to net asset value less any applicable contingent deferred sales charge) (Note 1) | | | | | | | | | | | | | | | | |
Net assets | | $ | 1,180,466 | | | $ | 385,262 | | | $ | — | | | $ | 5,930,124 | |
| | | | | | | | | | | | | | | | |
Shares of beneficial interest | | | 92,419 | | | | 83,513 | | | | — | | | | 508,103 | |
| | | | | | | | | | | | | | | | |
Net asset value and offering price per share | | $ | 12.77 | | | $ | 4.61 | | | $ | — | | | $ | 11.67 | |
| | | | | | | | | | | | | | | | |
Class C shares: (redemption price per share is equal to net asset value less any applicable contingent deferred sales charge) (Note 1) | | | | | | | | | | | | | | | | |
Net assets | | $ | 232,033,764 | | | $ | 15,232,940 | | | $ | 3,328,363 | | | $ | 71,962,992 | |
| | | | | | | | | | | | | | | | |
Shares of beneficial interest | | | 18,243,181 | | | | 3,307,859 | | | | 342,240 | | | | 6,154,090 | |
| | | | | | | | | | | | | | | | |
Net asset value and offering price per share | | $ | 12.72 | | | $ | 4.61 | | | $ | 9.73 | | | $ | 11.69 | |
| | | | | | | | | | | | | | | | |
Class N shares: | | | | | | | | | | | | | | | | |
Net assets | | $ | 19,247,368 | | | $ | — | | | $ | — | | | $ | — | |
| | | | | | | | | | | | | | | | |
Shares of beneficial interest | | | 1,503,208 | | | | — | | | | — | | | | — | |
| | | | | | | | | | | | | | | | |
Net asset value, offering and redemption price per share | | $ | 12.80 | | | $ | — | | | $ | — | | | $ | — | |
| | | | | | | | | | | | | | | | |
Class Y shares: | | | | | | | | | | | | | | | | |
Net assets | | $ | 627,616,596 | | | $ | 108,170,206 | | | $ | 2,601,427 | | | $ | 252,126,833 | |
| | | | | | | | | | | | | | | | |
Shares of beneficial interest | | | 49,031,902 | | | | 23,571,512 | | | | 264,909 | | | | 21,512,608 | |
| | | | | | | | | | | | | | | | |
Net asset value, offering and redemption price per share | | $ | 12.80 | | | $ | 4.59 | | | $ | 9.82 | | | $ | 11.72 | |
| | | | | | | | | | | | | | | | |
See accompanying notes to financial statements.
| 68
Statements of Operations
For the Year Ended September 30, 2013
| | | | | | | | | | | | | | | | |
| | | Core Plus
Bond Fund | | | High Income
Fund | | | International
Bond Fund | | | Limited Term
Government
and Agency
Fund | |
INVESTMENT INCOME | | | | | | | | | | | | | | | | |
Interest | | $ | 64,023,129 | | | $ | 12,810,818 | | | $ | 440,076 | | | $ | 13,737,988 | |
Dividends | | | 201,329 | | | | 667,117 | | | | 1,088 | | | | — | |
| | | | | | | | | | | | | | | | |
| | | 64,224,458 | | | | 13,477,935 | | | | 441,164 | | | | 13,737,988 | |
| | | | | | | | | | | | | | | | |
Expenses | | | | | | | | | | | | | | | | |
Management fees (Note 6) | | | 5,998,038 | | | | 1,291,330 | | | | 108,272 | | | | 2,916,904 | |
Service and distribution fees (Note 6) | | | 4,252,851 | | | | 346,163 | | | | 67,566 | | | | 1,771,210 | |
Administrative fees (Note 6) | | | 695,722 | | | | 95,200 | | | | 7,984 | | | | 307,970 | |
Trustees’ fees and expenses (Note 6) | | | 75,651 | | | | 33,311 | | | | 21,856 | | | | 57,294 | |
Transfer agent fees and expenses (Note 6) | | | 1,242,995 | | | | 241,445 | | | | 19,964 | | | | 476,024 | |
Audit and tax services fees | | | 50,111 | | | | 49,644 | | | | 50,363 | | | | 70,543 | |
Custodian fees and expenses | | | 102,913 | | | | 53,526 | | | | 34,815 | | | | 39,180 | |
Corporate tax expenses (Note 10) | | | — | | | | — | | | | — | | | | 224,327 | |
Legal fees | | | 21,261 | | | | 2,950 | | | | 248 | | | | 29,626 | |
Registration fees | | | 163,740 | | | | 91,391 | | | | 46,889 | | | | 102,867 | |
Shareholder reporting expenses | | | 162,253 | | | | 36,578 | | | | 3,566 | | | | 52,396 | |
Miscellaneous expenses | | | 43,144 | | | | 16,988 | | | | 9,838 | | | | 23,559 | |
| | | | | | | | | | | | | | | | |
Total expenses | | | 12,808,679 | | | | 2,258,526 | | | | 371,361 | | | | 6,071,900 | |
Fee/expense recovery (Note 6) | | | — | | | | 24,894 | | | | — | | | | 14,643 | |
Less waiver and/or expense reimbursement (Note 6) | | | (8,278 | ) | | | — | | | | (159,428 | ) | | | (19 | ) |
| | | | | | | | | | | | | | | | |
Net expenses | | | 12,800,401 | | | | 2,283,420 | | | | 211,933 | | | | 6,086,524 | |
| | | | | | | | | | | | | | | | |
Net investment income | | | 51,424,057 | | | | 11,194,515 | | | | 229,231 | | | | 7,651,464 | |
| | | | | | | | | | | | | | | | |
NET REALIZED AND UNREALIZED GAIN (LOSS) ON INVESTMENTS, FUTURES CONTRACTS AND FOREIGN CURRENCY TRANSACTIONS | | | | | | | | | | | | | | | | |
Net realized gain (loss) on: | | | | | | | | | | | | | | | | |
Investments | | | 10,029,173 | | | | 10,158,421 | | | | 235,643 | | | | 960,423 | |
Futures contracts | | | — | | | | (1,775 | ) | | | (5,412 | ) | | | — | |
Foreign currency transactions | | | (24,182 | ) | | | (435,456 | ) | | | 54,309 | | | | — | |
Net change in unrealized appreciation (depreciation) on: | | | | | | | | | | | | | | | | |
Investments | | | (79,720,230 | ) | | | (6,157,229 | ) | | | (1,126,244 | ) | | | (14,157,642 | ) |
Futures contracts | | | — | | | | (11,224 | ) | | | 13,655 | | | | — | |
Foreign currency translations | | | (12,231 | ) | | | (28,484 | ) | | | (10,290 | ) | | | — | |
| | | | | | | | | | | | | | | | |
Net realized and unrealized gain (loss) on investments, futures contracts and foreign currency transactions | | | (69,727,470 | ) | | | 3,524,253 | | | | (838,339 | ) | | | (13,197,219 | ) |
| | | | | | | | | | | | | | | | |
NET INCREASE (DECREASE) IN NET ASSETS RESULTING FROM OPERATIONS | | $ | (18,303,413 | ) | | $ | 14,718,768 | | | $ | (609,108 | ) | | $ | (5,545,755 | ) |
| | | | | | | | | | | | | | | | |
See accompanying notes to financial statements.
69 |
This Page Intentionally Left Blank
| 70
Statements of Changes in Net Assets
| | | | | | | | | | | | | | | | |
| | |
Core Plus Bond Fund | | | High Income Fund | |
| | | Year Ended
September 30,
2013 | | | Year Ended
September 30,
2012 | | | Year Ended
September 30,
2013 | | | Year Ended
September 30,
2012 | |
FROM OPERATIONS: | | | | | | | | | | | | | | | | |
Net investment income | | $ | 51,424,057 | | | $ | 30,039,229 | | | $ | 11,194,515 | | | $ | 8,987,512 | |
Net realized gain on investments, futures contracts and foreign currency transactions | | | 10,004,991 | | | | 27,486,451 | | | | 9,721,190 | | | | 1,577,793 | |
Net change in unrealized appreciation (depreciation) on investments, futures contracts and foreign currency translations | | | (79,732,461 | ) | | | 52,784,145 | | | | (6,196,937 | ) | | | 17,666,689 | |
| | | | | | | | | | | | | | | | |
Net increase (decrease) in net assets resulting from operations | | | (18,303,413 | ) | | | 110,309,825 | | | | 14,718,768 | | | | 28,231,994 | |
| | | | | | | | | | | | | | | | |
FROM DISTRIBUTIONS TO SHAREHOLDERS: | | | | | | | | | | | | | | | | |
Net investment income | | | | | | | | | | | | | | | | |
Class A | | | (22,049,388 | ) | | | (13,530,505 | ) | | | (4,012,237 | ) | | | (4,924,736 | ) |
Class B | | | (57,416 | ) | | | (83,437 | ) | | | (24,416 | ) | | | (37,943 | ) |
Class C | | | (9,800,300 | ) | | | (6,193,213 | ) | | | (826,420 | ) | | | (960,754 | ) |
Class N | | | (139,775 | ) | | | — | | | | — | | | | — | |
Class Y | | | (32,556,568 | ) | | | (14,560,785 | ) | | | (7,718,674 | ) | | | (4,576,130 | ) |
Net realized capital gains | | | | | | | | | | | | | | | | |
Class A | | | (7,656,569 | ) | | | (4,420,850 | ) | | | (224,929 | ) | | | (5,086,896 | ) |
Class B | | | (28,613 | ) | | | (45,406 | ) | | | (1,686 | ) | | | (56,566 | ) |
Class C | | | (4,172,024 | ) | | | (2,475,931 | ) | | | (52,693 | ) | | | (1,334,655 | ) |
Class Y | | | (10,215,543 | ) | | | (2,888,997 | ) | | | (409,949 | ) | | | (4,826,965 | ) |
| | | | | | | | | | | | | | | | |
Total distributions | | | (86,676,196 | ) | | | (44,199,124 | ) | | | (13,271,004 | ) | | | (21,804,645 | ) |
| | | | | | | | | | | | | | | | |
NET INCREASE (DECREASE) IN NET ASSETS FROM CAPITAL SHARE TRANSACTIONS (NOTE 12) | | | 28,754,694 | | | | 804,488,815 | | | | (56,084,432 | ) | | | 103,343,166 | |
| | | | | | | | | | | | | | | | |
Net increase (decrease) in net assets | | | (76,224,915 | ) | | | 870,599,516 | | | | (54,636,668 | ) | | | 109,770,515 | |
NET ASSETS | | | | | | | | | | | | | | | | |
Beginning of the year | | | 1,392,502,132 | | | | 521,902,616 | | | | 224,215,824 | | | | 114,445,309 | |
| | | | | | | | | | | | | | | | |
End of the year | | $ | 1,316,277,217 | | | $ | 1,392,502,132 | | | $ | 169,579,156 | | | $ | 224,215,824 | |
| | | | | | | | | | | | | | | | |
UNDISTRIBUTED (DISTRIBUTIONS IN EXCESS OF) NET INVESTMENT INCOME | | $ | 2,382,095 | | | $ | 5,332,135 | | | $ | (316,940 | ) | | $ | 437,961 | |
| | | | | | | | | | | | | | | | |
See accompanying notes to financial statements.
71 |
Statements of Changes in Net Assets (continued)
See accompanying notes to financial statements.
| | | | | | | | | | | | | | | | |
| | | International Bond Fund | | | Limited Term Government and
Agency Fund | |
| | | Year Ended
September 30,
2013 | | | Year Ended
September 30,
2012 | | | Year Ended
September 30,
2013 | | | Year Ended
September 30,
2012 | |
FROM OPERATIONS: | | | | | | | | | | | | | | | | |
Net investment income | | $ | 229,231 | | | $ | 360,175 | | | $ | 7,651,464 | | | $ | 8,290,284 | |
Net realized gain on investments, futures contracts and foreign currency transactions | | | 284,540 | | | | 453,943 | | | | 960,423 | | | | 4,423,642 | |
Net change in unrealized appreciation (depreciation) on investments, futures contracts and foreign currency translations | | | (1,122,879 | ) | | | 688,866 | | | | (14,157,642 | ) | | | 8,386,594 | |
| | | | | | | | | | | | | | | | |
Net increase (decrease) in net assets resulting from operations | | | (609,108 | ) | | | 1,502,984 | | | | (5,545,755 | ) | | | 21,100,520 | |
| | | | | | | | | | | | | | | | |
FROM DISTRIBUTIONS TO SHAREHOLDERS: | | | | | | | | | | | | | | | | |
Net investment income | | | | | | | | | | | | | | | | |
Class A | | | (206,411 | ) | | | (793,528 | ) | | | (8,021,271 | ) | | | (7,335,704 | ) |
Class B | | | — | | | | — | | | | (103,744 | ) | | | (161,039 | ) |
Class C | | | (54,617 | ) | | | (546,527 | ) | | | (1,101,044 | ) | | | (1,216,984 | ) |
Class Y | | | (65,554 | ) | | | (354,205 | ) | | | (5,835,575 | ) | | | (4,276,382 | ) |
Net realized capital gains | | | | | | | | | | | | | | | | |
Class A | | | (216,225 | ) | | | (306,969 | ) | | | (122,270 | ) | | | (98,584 | ) |
Class B | | | — | | | | — | | | | (2,674 | ) | | | (3,508 | ) |
Class C | | | (81,575 | ) | | | (237,383 | ) | | | (26,374 | ) | | | (24,502 | ) |
Class Y | | | (62,926 | ) | | | (116,763 | ) | | | (83,455 | ) | | | (43,423 | ) |
Paid-in capital | | | | | | | | | | | | | | | | |
Class A | | | — | | | | — | | | | (57,173 | ) | | | — | |
Class B | | | — | | | | — | | | | (955 | ) | | | — | |
Class C | | | — | | | | — | | | | (11,573 | ) | | | — | |
Class Y | | | — | | | | — | | | | (40,475 | ) | | | — | |
| | | | | | | | | | | | | | | | |
Total distributions | | | (687,308 | ) | | | (2,355,375 | ) | | | (15,406,583 | ) | | | (13,160,126 | ) |
| | | | | | | | | | | | | | | | |
NET INCREASE (DECREASE) IN NET ASSETS FROM CAPITAL SHARE TRANSACTIONS (NOTE 12) | | | (3,307,652 | ) | | | (3,913,509 | ) | | | 43,978,695 | | | | 149,965,713 | |
| | | | | | | | | | | | | | | | |
Net increase (decrease) in net assets | | | (4,604,068 | ) | | | (4,765,900 | ) | | | 23,026,357 | | | | 157,906,107 | |
NET ASSETS | | | | | | | | | | | | | | | | |
Beginning of the year | | | 19,516,637 | | | | 24,282,537 | | | | 662,205,638 | | | | 504,299,531 | |
| | | | | | | | | | | | | | | | |
End of the year | | $ | 14,912,569 | | | $ | 19,516,637 | | | $ | 685,231,995 | | | $ | 662,205,638 | |
| | | | | | | | | | | | | | | | |
UNDISTRIBUTED (DISTRIBUTIONS IN EXCESS OF) NET INVESTMENT INCOME | | $ | (67,205 | ) | | $ | 12,535 | | | $ | (594,519 | ) | | $ | (549,210 | ) |
| | | | | | | | | | | | | | | | |
| 72
Financial Highlights
For a share outstanding throughout each period.
| | | | | | | | | | | | | | | | | | | | | | | | | | | | |
| | | | | | Income (Loss) from Investment
Operations: | | | Less Distributions: | |
| | | Net asset
value,
beginning
of the
period | | | Net
investment
income (a) | | | Net realized
and
unrealized
gain (loss) | | | Total from
investment
operations | | | Dividends
from net
investment
income | | | Distributions
from net
realized
capital
gains | | | Total
distributions | |
| CORE PLUS BOND FUND | | | | | | | | | | | | | |
Class A | | | | | | | | | | | | | | | | | | | | | | | | | | | | |
9/30/2013 | | $ | 13.52 | | | $ | 0.44 | | | $ | (0.51 | ) | | $ | (0.07 | ) | | $ | (0.55 | ) | | $ | (0.19 | ) | | $ | (0.74 | ) |
9/30/2012 | | | 12.71 | | | | 0.43 | | | | 1.07 | | | | 1.50 | | | | (0.50 | ) | | | (0.19 | ) | | | (0.69 | ) |
9/30/2011 | | | 12.75 | | | | 0.52 | | | | 0.03 | (f) | | | 0.55 | | | | (0.59 | ) | | | — | | | | (0.59 | ) |
9/30/2010 | | | 11.91 | | | | 0.54 | | | | 0.91 | | | | 1.45 | | | | (0.61 | ) | | | — | | | | (0.61 | ) |
9/30/2009 | | | 10.54 | | | | 0.59 | | | | 1.44 | | | | 2.03 | | | | (0.66 | ) | | | — | | | | (0.66 | ) |
Class B | | | | | | | | | | | | | | | | | | | | | | | | | | | | |
9/30/2013 | | | 13.57 | | | | 0.33 | | | | (0.50 | ) | | | (0.17 | ) | | | (0.44 | ) | | | (0.19 | ) | | | (0.63 | ) |
9/30/2012 | | | 12.75 | | | | 0.34 | | | | 1.07 | | | | 1.41 | | | | (0.40 | ) | | | (0.19 | ) | | | (0.59 | ) |
9/30/2011 | | | 12.79 | | | | 0.42 | | | | 0.03 | (f) | | | 0.45 | | | | (0.49 | ) | | | — | | | | (0.49 | ) |
9/30/2010 | | | 11.95 | | | | 0.44 | | | | 0.92 | | | | 1.36 | | | | (0.52 | ) | | | — | | | | (0.52 | ) |
9/30/2009 | | | 10.57 | | | | 0.50 | | | | 1.45 | | | | 1.95 | | | | (0.57 | ) | | | — | | | | (0.57 | ) |
Class C | | | | | | | | | | | | | | | | | | | | | | | | | | | | |
9/30/2013 | | | 13.53 | | | | 0.34 | | | | (0.51 | ) | | | (0.17 | ) | | | (0.45 | ) | | | (0.19 | ) | | | (0.64 | ) |
9/30/2012 | | | 12.71 | | | | 0.33 | | | | 1.08 | | | | 1.41 | | | | (0.40 | ) | | | (0.19 | ) | | | (0.59 | ) |
9/30/2011 | | | 12.76 | | | | 0.42 | | | | 0.02 | (f) | | | 0.44 | | | | (0.49 | ) | | | — | | | | (0.49 | ) |
9/30/2010 | | | 11.92 | | | | 0.45 | | | | 0.91 | | | | 1.36 | | | | (0.52 | ) | | | — | | | | (0.52 | ) |
9/30/2009 | | | 10.55 | | | | 0.51 | | | | 1.44 | | | | 1.95 | | | | (0.58 | ) | | | — | | | | (0.58 | ) |
Class N | | | | | | | | | | | | | | | | | | | | | | | | | | | | |
9/30/2013* | | | 13.43 | | | | 0.32 | | | | (0.59 | ) | | | (0.27 | ) | | | (0.36 | ) | | | — | | | | (0.36 | ) |
Class Y | | | | | | | | | | | | | | | | | | | | | | | | | | | | |
9/30/2013 | | | 13.61 | | | | 0.47 | | | | (0.51 | ) | | | (0.04 | ) | | | (0.58 | ) | | | (0.19 | ) | | | (0.77 | ) |
9/30/2012 | | | 12.78 | | | | 0.46 | | | | 1.09 | | | | 1.55 | | | | (0.53 | ) | | | (0.19 | ) | | | (0.72 | ) |
9/30/2011 | | | 12.82 | | | | 0.55 | | | | 0.03 | (f) | | | 0.58 | | | | (0.62 | ) | | | — | | | | (0.62 | ) |
9/30/2010 | | | 11.97 | | | | 0.57 | | | | 0.92 | | | | 1.49 | | | | (0.64 | ) | | | — | | | | (0.64 | ) |
9/30/2009 | | | 10.60 | | | | 0.62 | | | | 1.44 | | | | 2.06 | | | | (0.69 | ) | | | — | | | | (0.69 | ) |
| * | From commencement of Class operations on February 1, 2013 through September 30, 2013. |
| (a) | Per share net investment income has been calculated using the average shares outstanding during the period. |
| (b) | A sales charge for Class A shares and a contingent deferred sales charge for Class B and Class C shares are not reflected in total return calculations. Periods less than one year, if applicable, are not annualized. |
| (c) | Had certain expenses not been waived/reimbursed during the period, if applicable, total returns would have been lower. |
| (d) | The investment adviser and/or administrator agreed to waive its fees and/or reimburse a portion of the Fund’s expenses during the period, if applicable. Without this waiver/reimbursement, expenses would have been higher. |
| (e) | Computed on an annualized basis for periods less than one year, if applicable. |
| (f) | The amount shown for a share outstanding does not correspond with the aggregate realized and unrealized gain (loss) on investments for the period due to the timing of sales and redemptions of fund shares in relation to fluctuating market values of investments of the Fund. |
See accompanying notes to financial statements.
73 |
| | | | | | | | | | | | | | | | | | | | | | | | | | |
| | | | |
| | | | | | | | | | Ratios to Average Net Assets: | | | | |
| | | | | | |
Net asset
value,
end of
the period | | | Total
return
(%) (b)(c) | | | Net assets,
end of
the period
(000’s) | | | Net
expenses
(%) (d)(e) | | | Gross
expenses
(%) (e) | | | Net investment
income
(%) (e) | | | Portfolio
turnover
rate (%) | |
| | | | | | | | | | | | | | | | | | | | | | | | | | |
| | | | | | | | | | | | | | | | | | | | | | | | | | |
| | $12.71 | | | | (0.61 | ) | | $ | 436,199 | | | | 0.79 | | | | 0.79 | | | | 3.29 | | | | 107 | |
| | 13.52 | | | | 12.18 | | | | 479,823 | | | | 0.82 | | | | 0.82 | | | | 3.31 | | | | 78 | |
| | 12.71 | | | | 4.42 | | | | 237,759 | | | | 0.87 | | | | 0.87 | | | | 4.07 | | | | 86 | |
| | 12.75 | | | | 12.55 | | | | 214,723 | | | | 0.90 | | | | 0.90 | | | | 4.41 | | | | 87 | |
| | 11.91 | | | | 20.07 | | | | 140,779 | | | | 0.90 | | | | 0.97 | | | | 5.43 | | | | 102 | |
| | | | | | | | | | | | | | | | | | | | | | | | | | |
| | 12.77 | | | | (1.32 | ) | | | 1,180 | | | | 1.54 | | | | 1.54 | | | | 2.50 | | | | 107 | |
| | 13.57 | | | | 11.38 | | | | 2,386 | | | | 1.57 | | | | 1.57 | | | | 2.61 | | | | 78 | |
| | 12.75 | | | | 3.60 | | | | 3,092 | | | | 1.62 | | | | 1.62 | | | | 3.32 | | | | 86 | |
| | 12.79 | | | | 11.64 | | | | 4,490 | | | | 1.65 | | | | 1.65 | | | | 3.64 | | | | 87 | |
| | 11.95 | | | | 19.19 | | | | 7,028 | | | | 1.65 | | | | 1.72 | | | | 4.66 | | | | 102 | |
| | | | | | | | | | | | | | | | | | | | | | | | | | |
| | 12.72 | | | | (1.36 | ) | | | 232,034 | | | | 1.54 | | | | 1.54 | | | | 2.54 | | | | 107 | |
| | 13.53 | | | | 11.46 | | | | 275,346 | | | | 1.57 | | | | 1.57 | | | | 2.55 | | | | 78 | |
| | 12.71 | | | | 3.56 | | | | 137,836 | | | | 1.62 | | | | 1.62 | | | | 3.32 | | | | 86 | |
| | 12.76 | | | | 11.71 | | | | 123,123 | | | | 1.65 | | | | 1.65 | | | | 3.66 | | | | 87 | |
| | 11.92 | | | | 19.20 | | | | 77,081 | | | | 1.65 | | | | 1.72 | | | | 4.69 | | | | 102 | |
| | | | | | | | | | | | | | | | | | | | | | | | | | |
| | 12.80 | | | | (2.02 | ) | | | 19,247 | | | | 0.44 | | | | 0.44 | | | | 3.81 | | | | 107 | |
| | | | | | | | | | | | | | | | | | | | | | | | | | |
| | 12.80 | | | | (0.35 | ) | | | 627,617 | | | | 0.54 | | | | 0.54 | | | | 3.54 | | | | 107 | |
| | 13.61 | | | | 12.54 | | | | 634,946 | | | | 0.58 | | | | 0.58 | | | | 3.50 | | | | 78 | |
| | 12.78 | | | | 4.65 | | | | 143,215 | | | | 0.62 | | | | 0.62 | | | | 4.31 | | | | 86 | |
| | 12.82 | | | | 12.85 | | | | 69,322 | | | | 0.65 | | | | 0.65 | | | | 4.66 | | | | 87 | |
| | 11.97 | | | | 20.37 | | | | 34,394 | | | | 0.65 | | | | 0.68 | | | | 5.67 | | | | 102 | |
See accompanying notes to financial statements.
| 74
Financial Highlights (continued)
For a share outstanding throughout each period.
| | | | | | | | | | | | | | | | | | | | | | | | | | | | |
| | | | | | Income (Loss) from Investment
Operations: | | | Less Distributions: | |
| | | Net asset
value,
beginning
of the
period | | | Net
investment
income(a) | | | Net realized
and
unrealized
gain (loss) | | | Total from
investment
operations | | | Dividends
from net
investment
income | | | Distributions
from net
realized
capital
gains | | | Total
distributions | |
| HIGH INCOME FUND | | | | | | | | | | | | | | | | | | | |
Class A | | | | | | | | | | | | | | | | | | | | | | | | | | | | |
9/30/2013 | | $ | 4.60 | | | $ | 0.24 | | | $ | 0.03 | | | $ | 0.27 | | | $ | (0.27 | ) | | $ | (0.01 | ) | | $ | (0.28 | ) |
9/30/2012 | | | 4.46 | | | | 0.24 | | | | 0.59 | | | | 0.83 | | | | (0.30 | ) | | | (0.39 | ) | | | (0.69 | ) |
9/30/2011 | | | 4.91 | | | | 0.28 | | | | (0.42 | ) | | | (0.14 | ) | | | (0.31 | ) | | | — | | | | (0.31 | ) |
9/30/2010 | | | 4.49 | | | | 0.32 | | | | 0.42 | | | | 0.74 | | | | (0.32 | ) | | | — | | | | (0.32 | ) |
9/30/2009 | | | 4.24 | | | | 0.34 | | | | 0.24 | | | | 0.58 | | | | (0.33 | ) | | | — | | | | (0.33 | ) |
Class B | | | | | | | | | | | | | | | | | | | | | | | | | | | | |
9/30/2013 | | | 4.61 | | | | 0.21 | | | | 0.03 | | | | 0.24 | | | | (0.23 | ) | | | (0.01 | ) | | | (0.24 | ) |
9/30/2012 | | | 4.47 | | | | 0.21 | | | | 0.58 | | | | 0.79 | | | | (0.26 | ) | | | (0.39 | ) | | | (0.65 | ) |
9/30/2011 | | | 4.92 | | | | 0.25 | | | | (0.43 | ) | | | (0.18 | ) | | | (0.27 | ) | | | — | | | | (0.27 | ) |
9/30/2010 | | | 4.50 | | | | 0.28 | | | | 0.42 | | | | 0.70 | | | | (0.28 | ) | | | — | | | | (0.28 | ) |
9/30/2009 | | | 4.25 | | | | 0.31 | | | | 0.25 | | | | 0.56 | | | | (0.31 | ) | | | — | | | | (0.31 | ) |
Class C | | | | | | | | | | | | | | | | | | | | | | | | | | | | |
9/30/2013 | | | 4.61 | | | | 0.21 | | | | 0.04 | | | | 0.25 | | | | (0.24 | ) | | | (0.01 | ) | | | (0.25 | ) |
9/30/2012 | | | 4.47 | | | | 0.21 | | | | 0.59 | | | | 0.80 | | | | (0.27 | ) | | | (0.39 | ) | | | (0.66 | ) |
9/30/2011 | | | 4.92 | | | | 0.25 | | | | (0.43 | ) | | | (0.18 | ) | | | (0.27 | ) | | | — | | | | (0.27 | ) |
9/30/2010 | | | 4.50 | | | | 0.28 | | | | 0.43 | | | | 0.71 | | | | (0.29 | ) | | | — | | | | (0.29 | ) |
9/30/2009 | | | 4.24 | | | | 0.31 | | | | 0.26 | | | | 0.57 | | | | (0.31 | ) | | | — | | | | (0.31 | ) |
Class Y | | | | | | | | | | | | | | | | | | | | | | | | | | | | |
9/30/2013 | | | 4.59 | | | | 0.25 | | | | 0.04 | | | | 0.29 | | | | (0.28 | ) | | | (0.01 | ) | | | (0.29 | ) |
9/30/2012 | | | 4.46 | | | | 0.26 | | | | 0.57 | | | | 0.83 | | | | (0.31 | ) | | | (0.39 | ) | | | (0.70 | ) |
9/30/2011 | | | 4.90 | | | | 0.29 | | | | (0.41 | ) | | | (0.12 | ) | | | (0.32 | ) | | | — | | | | (0.32 | ) |
9/30/2010 | | | 4.49 | | | | 0.33 | | | | 0.41 | | | | 0.74 | | | | (0.33 | ) | | | — | | | | (0.33 | ) |
9/30/2009 | | | 4.24 | | | | 0.34 | | | | 0.25 | | | | 0.59 | | | | (0.34 | ) | | | — | | | | (0.34 | ) |
| (a) | Per share net investment income has been calculated using the average shares outstanding during the period. |
| (b) | Amount rounds to less than $0.01 per share, if applicable. |
| (c) | Had certain expenses not been waived/reimbursed during the period, if applicable, total returns would have been lower. |
| (d) | A sales charge for Class A shares and a contingent deferred sales charge for Class B and Class C shares are not reflected in total return calculations. Periods less than one year, if applicable, are not annualized. |
| (e) | The investment adviser and/or administrator agreed to waive its fees and/or reimburse a portion of the Fund’s expenses during the period, if applicable. Without this waiver/reimbursement, expenses would have been higher. |
| (f) | Computed on an annualized basis for periods less than one year, if applicable. |
| (g) | Includes fee/expense recovery of 0.02%, 0.01%, 0.01% and 0.01% for Class A, B, C and Y, respectively. |
| (h) | Includes fee/expense recovery of 0.01%. |
| (i) | Effective June 1, 2009, redemption fees were eliminated. |
See accompanying notes to financial statements.
75 |
| | | | | | | | | | | | | | | | | | | | | | | | | | | | | | |
| | | | | | | | | | | | |
Ratios to Average Net Assets: | | | | |
Redemption
fees (b) | | | Net asset
value, end
of the period | | | Total
return
(%) (c)(d) | | |
Net assets,
end of
the period
(000’s) | | | Net
expenses
(%) (e)(f) | | | Gross
expenses
(%) (f) | | | Net investment
income
(%) (f) | | | Portfolio
turnover
rate (%) | |
| | | | | | | | | | | | | | | | | | | | | | | | | | | | | | |
| | | | | | | | | | | | | | | | | | | | | | | | | | | | | | |
| | $ — | | | $ | 4.59 | | | | 6.27 | | | $ | 45,791 | | | | 1.15 | (g) | | | 1.15 | (g) | | | 5.11 | | | | 47 | |
| | — | | | | 4.60 | | | | 20.90 | | | | 95,876 | | | | 1.15 | | | | 1.19 | | | | 5.50 | | | | 34 | |
| | — | | | | 4.46 | | | | (3.30 | ) | | | 59,907 | | | | 1.15 | (h) | | | 1.15 | (h) | | | 5.60 | | | | 67 | |
| | — | | | | 4.91 | | | | 17.05 | | | | 68,011 | | | | 1.15 | | | | 1.20 | | | | 6.72 | | | | 56 | |
| | 0.00 | (i) | | | 4.49 | | | | 15.97 | | | | 59,944 | | | | 1.15 | | | | 1.28 | | | | 8.82 | | | | 30 | |
| | | | | | | | | | | | | | | | | | | | | | | | | | | | | | |
| | — | | | | 4.61 | | | | 5.66 | | | | 385 | | | | 1.90 | (g) | | | 1.90 | (g) | | | 4.37 | | | | 47 | |
| | — | | | | 4.61 | | | | 19.93 | | | | 560 | | | | 1.90 | | | | 1.94 | | | | 4.79 | | | | 34 | |
| | — | | | | 4.47 | | | | (4.04 | ) | | | 738 | | | | 1.90 | (h) | | | 1.90 | (h) | | | 4.90 | | | | 67 | |
| | — | | | | 4.92 | | | | 16.13 | | | | 1,209 | | | | 1.90 | | | | 1.94 | | | | 6.00 | | | | 56 | |
| | 0.00 | (i) | | | 4.50 | | | | 15.06 | | | | 1,569 | | | | 1.90 | | | | 2.06 | | | | 8.32 | | | | 30 | |
| | | | | | | | | | | | | | | | | | | | | | | | | | | | | | |
| | — | | | | 4.61 | | | | 5.46 | | | | 15,233 | | | | 1.90 | (g) | | | 1.90 | (g) | | | 4.36 | | | | 47 | |
| | — | | | | 4.61 | | | | 19.96 | | | | 16,863 | | | | 1.90 | | | | 1.94 | | | | 4.78 | | | | 34 | |
| | — | | | | 4.47 | | | | (4.02 | ) | | | 15,790 | | | | 1.90 | (h) | | | 1.90 | (h) | | | 4.89 | | | | 67 | |
| | — | | | | 4.92 | | | | 16.15 | | | | 19,312 | | | | 1.90 | | | | 1.95 | | | | 5.97 | | | | 56 | |
| | 0.00 | (i) | | | 4.50 | | | | 15.37 | | | | 17,827 | | | | 1.90 | | | | 2.03 | | | | 8.09 | | | | 30 | |
| | | | | | | | | | | | | | | | | | | | | | | | | | | | | | |
| | — | | | | 4.59 | | | | 6.56 | | | | 108,170 | | | | 0.90 | (g) | | | 0.90 | (g) | | | 5.37 | | | | 47 | |
| | — | | | | 4.59 | | | | 20.93 | | | | 110,917 | | | | 0.90 | | | | 0.95 | | | | 5.78 | | | | 34 | |
| | — | | | | 4.46 | | | | (2.86 | ) | | | 38,011 | | | | 0.90 | (h) | | | 0.90 | (h) | | | 5.86 | | | | 67 | |
| | — | | | | 4.90 | | | | 17.11 | | | | 69,887 | | | | 0.90 | | | | 0.93 | | | | 7.02 | | | | 56 | |
| | 0.00 | (i) | | | 4.49 | | | | 16.29 | | | | 105,713 | | | | 0.90 | | | | 0.92 | | | | 8.32 | | | | 30 | |
See accompanying notes to financial statements.
| 76
Financial Highlights (continued)
For a share outstanding throughout each period.
| | | | | | | | | | | | | | | | | | | | | | | | | | | | |
| | | | | | Income (Loss) from Investment
Operations: | | | Less Distributions: | |
| | | Net asset
value,
beginning
of the
period | | | Net
investment
income(a) | | | Net realized
and
unrealized
gain (loss) | | | Total from
investment
operations | | | Dividends
from net
investment
income | | | Distributions
from net
realized
capital
gains | | | Total
distributions | |
| INTERNATIONAL BOND FUND | | | | | | | | | | | | | | | | | | | |
Class A | | | | | | | | | | | | | | | | | | | | | | | | | | | | |
9/30/2013 | | $ | 10.44 | | | $ | 0.14 | | | $ | (0.41 | ) | | $ | (0.27 | ) | | $ | (0.18 | ) | | $ | (0.18 | ) | | $ | (0.36 | ) |
9/30/2012 | | | 10.94 | | | | 0.19 | | | | 0.62 | | | | 0.81 | | | | (0.94 | ) | | | (0.37 | ) | | | (1.31 | ) |
9/30/2011 | | | 11.17 | | | | 0.25 | | | | 0.06 | (h) | | | 0.31 | | | | (0.40 | ) | | | (0.14 | ) | | | (0.54 | ) |
9/30/2010 | | | 10.84 | | | | 0.22 | | | | 0.48 | | | | 0.70 | | | | (0.29 | ) | | | (0.08 | ) | | | (0.37 | ) |
9/30/2009 | | | 9.19 | | | | 0.32 | | | | 1.53 | | | | 1.85 | | | | (0.20 | ) | | | — | | | | (0.20 | ) |
Class C | | | | | | | | | | | | | | | | | | | | | | | | | | | | |
9/30/2013 | | | 10.37 | | | | 0.06 | | | | (0.39 | ) | | | (0.33 | ) | | | (0.13 | ) | | | (0.18 | ) | | | (0.31 | ) |
9/30/2012 | | | 10.87 | | | | 0.12 | | | | 0.61 | | | | 0.73 | | | | (0.86 | ) | | | (0.37 | ) | | | (1.23 | ) |
9/30/2011 | | | 11.11 | | | | 0.17 | | | | 0.05 | (h) | | | 0.22 | | | | (0.32 | ) | | | (0.14 | ) | | | (0.46 | ) |
9/30/2010 | | | 10.82 | | | | 0.15 | | | | 0.46 | | | | 0.61 | | | | (0.24 | ) | | | (0.08 | ) | | | (0.32 | ) |
9/30/2009 | | | 9.18 | | | | 0.24 | | | | 1.53 | | | | 1.77 | | | | (0.13 | ) | | | — | | | | (0.13 | ) |
Class Y | | | | | | | | | | | | | | | | | | | | | | | | | | | | |
9/30/2013 | | | 10.44 | | | | 0.16 | | | | (0.40 | ) | | | (0.24 | ) | | | (0.20 | ) | | | (0.18 | ) | | | (0.38 | ) |
9/30/2012 | | | 10.93 | | | | 0.21 | | | | 0.63 | | | | 0.84 | | | | (0.96 | ) | | | (0.37 | ) | | | (1.33 | ) |
9/30/2011 | | | 11.16 | | | | 0.28 | | | | 0.06 | (h) | | | 0.34 | | | | (0.43 | ) | | | (0.14 | ) | | | (0.57 | ) |
9/30/2010 | | | 10.82 | | | | 0.25 | | | | 0.47 | | | | 0.72 | | | | (0.30 | ) | | | (0.08 | ) | | | (0.38 | ) |
9/30/2009 | | | 9.18 | | | | 0.33 | | | | 1.53 | | | | 1.86 | | | | (0.22 | ) | | | — | | | | (0.22 | ) |
| (a) | Per share net investment income has been calculated using the average shares outstanding during the period. |
| (b) | Had certain expenses not been waived/reimbursed during the period, if applicable, total returns would have been lower. |
| (c) | A sales charge for Class A shares and a contingent deferred sales charge for Class C shares are not reflected in total return calculations. Periods less than one year, if applicable, are not annualized. |
| (d) | The investment adviser and/or administrator agreed to waive its fees and/or reimburse a portion of the Fund’s expenses during the period, if applicable. Without this waiver/reimbursement, expenses would have been higher. |
| (e) | Computed on an annualized basis for periods less than one year, if applicable. |
| (f) | Effective July 1, 2012, the expense limit decreased from 1.10%, 1.85% and 0.85% to 1.05%, 1.80% and 0.80% for Class A, Class C and Class Y shares, respectively. |
| (g) | Includes interest expense from bank overdraft charges of less than 0.01%. Without this expense the ratio of net expenses would have been 1.09%, 1.84% and 0.84% for Class A, Class C and Class Y shares, respectively. |
| (h) | The amount shown for a share outstanding does not correspond with the aggregate realized and unrealized gain (loss) on investments for the period due to the timing of sales and redemptions of fund shares in relation to fluctuating market values of investments of the Fund. |
See accompanying notes to financial statements.
77 |
| | | | | | | | | | | | | | | | | | | | | | | | | | |
| | | | | | | | | |
Ratios to Average Net Assets: | | | | |
Net asset
value,
end of
the period | | | Total
return
(%) (b)(c) | | | Net assets,
end of
the period
(000’s) | | | Net
expenses
(%) (d)(e) | | | Gross
expenses
(%) (e) | | | Net investment
income (%) (e) | | | Portfolio
turnover
rate (%) | |
| | | | | | | | | | | | | | | | | | | | | | | | | | |
| | | | | | | | | | | | | | | | | | | | | | | | | | |
| | $ 9.81 | | | | (2.62 | ) | | | $8,983 | | | | 1.05 | | | | 1.93 | | | | 1.39 | | | | 107 | |
| | 10.44 | | | | 8.42 | | | | 11,898 | | | | 1.09 | (f)(g) | | | 1.85 | | | | 1.83 | | | | 169 | |
| | 10.94 | | | | 2.70 | | | | 10,927 | | | | 1.10 | | | | 1.64 | | | | 2.26 | | | | 136 | |
| | 11.17 | | | | 6.66 | | | | 18,758 | | | | 1.10 | | | | 1.49 | | | | 2.14 | | | | 128 | |
| | 10.84 | | | | 20.41 | | | | 8,479 | | | | 1.10 | | | | 2.11 | | | | 3.29 | | | | 91 | |
| | | | | | | | | | | | | | | | | | | | | | | | | | |
| | 9.73 | | | | (3.27 | ) | | | 3,328 | | | | 1.80 | | | | 2.68 | | | | 0.65 | | | | 107 | |
| | 10.37 | | | | 7.64 | | | | 4,355 | | | | 1.84 | (f)(g) | | | 2.61 | | | | 1.13 | | | | 169 | |
| | 10.87 | | | | 1.87 | | | | 7,503 | | | | 1.85 | | | | 2.40 | | | | 1.52 | | | | 136 | |
| | 11.11 | | | | 5.86 | | | | 6,145 | | | | 1.85 | | | | 2.24 | | | | 1.40 | | | | 128 | |
| | 10.82 | | | | 19.58 | | | | 2,955 | | | | 1.85 | | | | 2.93 | | | | 2.56 | | | | 91 | |
| | | | | | | | | | | | | | | | | | | | | | | | | | |
| | 9.82 | | | | (2.34 | ) | | | 2,601 | | | | 0.80 | | | | 1.68 | | | | 1.64 | | | | 107 | |
| | 10.44 | | | | 8.68 | | | | 3,264 | | | | 0.85 | (f)(g) | | | 1.60 | | | | 2.05 | | | | 169 | |
| | 10.93 | | | | 3.06 | | | | 5,852 | | | | 0.85 | | | | 1.36 | | | | 2.47 | | | | 136 | |
| | 11.16 | | | | 6.92 | | | | 8,908 | | | | 0.85 | | | | 1.23 | | | | 2.41 | | | | 128 | |
| | 10.82 | | | | 20.73 | | | | 13,049 | | | | 0.85 | | | | 1.92 | | | | 3.53 | | | | 91 | |
See accompanying notes to financial statements.
| 78
Financial Highlights (continued)
For a share outstanding throughout each period.
| | | | | | | | | | | | | | | | | | | | | | | | | | | | | | | | |
| | | | | | Income (Loss) from Investment
Operations: | | | Less Distributions: | |
| | | Net asset
value,
beginning
of the
period | | | Net
investment
income (a) | | | Net realized
and
unrealized
gain (loss) | | | Total from
investment
operations | | | Dividends
from net
investment
income | | | Distributions
from net
realized
capital
gains (b) | | | Distributions
from paid-in
capital (b) | | | Total
distributions | |
| LIMITED TERM GOVERNMENTAND AGENCY FUND | | | | | | | | | | | | | | | | |
Class A | | | | | | | | | | | | | | | | | | | | | | | | | | | | | | | | |
9/30/2013 | | $ | 12.04 | | | $ | 0.13 | | | $ | (0.23 | ) | | $ | (0.10 | ) | | $ | (0.26 | ) | | $ | (0.00 | ) | | $ | (0.00 | ) | | $ | (0.26 | ) |
9/30/2012 | | | 11.87 | | | | 0.18 | | | | 0.28 | | | | 0.46 | | | | (0.29 | ) | | | (0.00 | ) | | | — | | | | (0.29 | ) |
9/30/2011 | | | 12.02 | | | | 0.17 | | | | 0.03 | | | | 0.20 | | | | (0.26 | ) | | | (0.09 | ) | | | — | | | | (0.35 | ) |
9/30/2010 | | | 11.60 | | | | 0.20 | | | | 0.49 | | | | 0.69 | | | | (0.27 | ) | | | — | | | | — | | | | (0.27 | ) |
9/30/2009 | | | 10.98 | | | | 0.35 | | | | 0.63 | | | | 0.98 | | | | (0.36 | ) | | | — | | | | — | | | | (0.36 | ) |
Class B | | | | | | | | | | | | | | | | | | | | | | | | | | | | | | | | |
9/30/2013 | | | 12.03 | | | | 0.04 | | | | (0.23 | ) | | | (0.19 | ) | | | (0.17 | ) | | | (0.00 | ) | | | (0.00 | ) | | | (0.17 | ) |
9/30/2012 | | | 11.86 | | | | 0.10 | | | | 0.27 | | | | 0.37 | | | | (0.20 | ) | | | (0.00 | ) | | | — | | | | (0.20 | ) |
9/30/2011 | | | 12.00 | | | | 0.09 | | | | 0.03 | | | | 0.12 | | | | (0.17 | ) | | | (0.09 | ) | | | — | | | | (0.26 | ) |
9/30/2010 | | | 11.59 | | | | 0.12 | | | | 0.47 | | | | 0.59 | | | | (0.18 | ) | | | — | | | | — | | | | (0.18 | ) |
9/30/2009 | | | 10.97 | | | | 0.26 | | | | 0.63 | | | | 0.89 | | | | (0.27 | ) | | | — | | | | — | | | | (0.27 | ) |
Class C | | | | | | | | | | | | | | | | | | | | | | | | | | | | | | | | |
9/30/2013 | | | 12.05 | | | | 0.04 | | | | (0.23 | ) | | | (0.19 | ) | | | (0.17 | ) | | | (0.00 | ) | | | (0.00 | ) | | | (0.17 | ) |
9/30/2012 | | | 11.88 | | | | 0.10 | | | | 0.27 | | | | 0.37 | | | | (0.20 | ) | | | (0.00 | ) | | | — | | | | (0.20 | ) |
9/30/2011 | | | 12.03 | | | | 0.08 | | | | 0.03 | | | | 0.11 | | | | (0.17 | ) | | | (0.09 | ) | | | — | | | | (0.26 | ) |
9/30/2010 | | | 11.61 | | | | 0.12 | | | | 0.48 | | | | 0.60 | | | | (0.18 | ) | | | — | | | | — | | | | (0.18 | ) |
9/30/2009 | | | 10.99 | | | | 0.26 | | | | 0.63 | | | | 0.89 | | | | (0.27 | ) | | | — | | | | — | | | | (0.27 | ) |
Class Y | | | | | | | | | | | | | | | | | | | | | | | | | | | | | | | | |
9/30/2013 | | | 12.08 | | | | 0.16 | | | | (0.23 | ) | | | (0.07 | ) | | | (0.29 | ) | | | (0.00 | ) | | | (0.00 | ) | | | (0.29 | ) |
9/30/2012 | | | 11.91 | | | | 0.21 | | | | 0.28 | | | | 0.49 | | | | (0.32 | ) | | | (0.00 | ) | | | — | | | | (0.32 | ) |
9/30/2011 | | | 12.05 | | | | 0.20 | | | | 0.04 | | | | 0.24 | | | | (0.29 | ) | | | (0.09 | ) | | | — | | | | (0.38 | ) |
9/30/2010 | | | 11.64 | | | | 0.23 | | | | 0.48 | | | | 0.71 | | | | (0.30 | ) | | | — | | | | — | | | | (0.30 | ) |
9/30/2009 | | | 11.01 | | | | 0.39 | | | | 0.63 | | | | 1.02 | | | | (0.39 | ) | | | — | | | | — | | | | (0.39 | ) |
| (a) | Per share net investment income has been calculated using the average shares outstanding during the period. |
| (b) | Amount rounds to less than $0.01 per share, if applicable. |
| (c) | A sales charge for Class A shares and a contingent deferred sales charge for Class B and Class C shares are not reflected in total return calculations. Periods less than one year, if applicable, are not annualized. |
| (d) | Had certain expenses not been waived/reimbursed during the period, if applicable, total returns would have been lower. |
| (e) | The investment adviser and/or administrator agreed to waive its fees and/or reimburse a portion of the Fund’s expenses during the period, if applicable. Without this waiver/reimbursement, expenses would have been higher. |
| (f) | Computed on an annualized basis for periods less than one year, if applicable. |
| (g) | Includes corporate tax expenses of 0.03% for Class A, B, C and Y shares. Without this expense the ratio of net expenses for Class A, B, C and Y shares would have been 0.84%, 1.59%, 1.59% and 0.59%, respectively. |
See accompanying notes to financial statements.
79 |
| | | | | | | | | | | | | | | | | | | | | | | | | | |
| | | | |
| | | | | | | | | | Ratios to Average Net Assets: | | | | |
| | | | | | |
Net asset
value,
end of
the period | | | Total
return
(%) (c)(d) | | | Net assets,
end of
the period
(000’s) | | | Net
expenses
(%) (e)(f) | | | Gross
expenses
(%) (f) | | | Net investment
income (%) (f) | | | Portfolio
turnover
rate (%) | |
| | | | | | | | | | | | | | | | | | | | | | | | | | |
| | | | | | | | | | | | | | | | | | | | | | | | | | |
| | $11.68 | | | | (0.81 | ) | | | $355,212 | | | | 0.87 | (g) | | | 0.87 | (g) | | | 1.11 | | | | 39 | |
| | 12.04 | | | | 3.94 | | | | 357,870 | | | | 0.85 | | | | 0.90 | | | | 1.54 | | | | 56 | |
| | 11.87 | | | | 1.71 | | | | 293,675 | | | | 0.85 | | | | 0.92 | | | | 1.44 | | | | 66 | |
| | 12.02 | | | | 6.03 | | | | 164,265 | | | | 0.89 | | | | 0.97 | | | | 1.73 | | | | 89 | |
| | 11.60 | | | | 9.05 | | | | 118,619 | | | | 0.90 | | | | 0.99 | | | | 3.10 | | | | 77 | |
| | | | | | | | | | | | | | | | | | | | | | | | | | |
| | 11.67 | | | | (1.56 | ) | | | 5,930 | | | | 1.62 | (g) | | | 1.62 | (g) | | | 0.34 | | | | 39 | |
| | 12.03 | | | | 3.17 | | | | 8,370 | | | | 1.60 | | | | 1.65 | | | | 0.81 | | | | 56 | |
| | 11.86 | | | | 1.04 | | | | 10,976 | | | | 1.60 | | | | 1.68 | | | | 0.72 | | | | 66 | |
| | 12.00 | | | | 5.16 | | | | 4,049 | | | | 1.64 | | | | 1.72 | | | | 1.00 | | | | 89 | |
| | 11.59 | | | | 8.24 | | | | 4,442 | | | | 1.65 | | | | 1.74 | | | | 2.32 | | | | 77 | |
| | | | | | | | | | | | | | | | | | | | | | | | | | |
| | 11.69 | | | | (1.55 | ) | | | 71,963 | | | | 1.62 | (g) | | | 1.62 | (g) | | | 0.36 | | | | 39 | |
| | 12.05 | | | | 3.17 | | | | 75,522 | | | | 1.60 | | | | 1.65 | | | | 0.80 | | | | 56 | |
| | 11.88 | | | | 0.96 | | | | 68,776 | | | | 1.60 | | | | 1.67 | | | | 0.68 | | | | 66 | |
| | 12.03 | | | | 5.24 | | | | 75,984 | | | | 1.64 | | | | 1.72 | | | | 0.98 | | | | 89 | |
| | 11.61 | | | | 8.24 | | | | 50,973 | | | | 1.65 | | | | 1.74 | | | | 2.32 | | | | 77 | |
| | | | | | | | | | | | | | | | | | | | | | | | | | |
| | 11.72 | | | | (0.56 | ) | | | 252,127 | | | | 0.62 | (g) | | | 0.62 | (g) | | | 1.35 | | | | 39 | |
| | 12.08 | | | | 4.19 | | | | 220,444 | | | | 0.60 | | | | 0.65 | | | | 1.77 | | | | 56 | |
| | 11.91 | | | | 2.05 | | | | 130,874 | | | | 0.60 | | | | 0.67 | | | | 1.68 | | | | 66 | |
| | 12.05 | | | | 6.20 | | | | 95,847 | | | | 0.63 | | | | 0.71 | | | | 1.94 | | | | 89 | |
| | 11.64 | | | | 9.40 | | | | 28,004 | | | | 0.65 | | | | 0.72 | | | | 3.42 | | | | 77 | |
See accompanying notes to financial statements.
| 80
Notes to Financial Statements
September 30, 2013
1. Organization. Natixis Funds Trust I and Loomis Sayles Funds II (the “Trusts” and each a “Trust”) are each organized as a Massachusetts business trust. Each Trust is registered under the Investment Company Act of 1940, as amended (the “1940 Act”), as an open-end management investment company. Each Declaration of Trust permits the Board of Trustees to authorize the issuance of an unlimited number of shares of the Trust in multiple series. The financial statements for certain funds of the Trusts are presented in separate reports. The following funds (individually, a “Fund” and collectively, the “Funds”) are included in this report:
Natixis Funds Trust I:
Loomis Sayles Core Plus Bond Fund (the “Core Plus Bond Fund”)
Loomis Sayles Funds II:
Loomis Sayles High Income Fund (the “High Income Fund”)
Loomis Sayles International Bond Fund (the “International Bond Fund”)
Loomis Sayles Limited Term Government and Agency Fund (the “Limited Term Government and Agency Fund”)
Each Fund is a diversified investment company, except for International Bond Fund, which is a non-diversified investment company.
The Funds each offer Class A, Class C and Class Y shares. Effective February 1, 2013, Core Plus Bond Fund began offering Class N Shares. Effective October 12, 2007, Class B shares are no longer offered. Existing Class B shareholders may continue to reinvest dividends into Class B shares and exchange their Class B shares for Class B shares of other Natixis Funds subject to existing exchange privileges as described in the prospectus.
Class A shares of all Funds except Limited Term Government and Agency Fund are sold with a maximum front-end sales charge of 4.50%. Class A shares of Limited Term Government and Agency Fund are sold with a maximum front-end sales charge of 3.00%. Class B shares do not pay a front-end sales charge; however, they are charged higher Rule 12b-1 fees, and are subject to a contingent deferred sales charge (“CDSC”) if such shares are redeemed within six years of purchase. After eight years of ownership, Class B shares convert to Class A shares. Class C shares do not pay a front-end sales charge, do not convert to any other class of shares, pay higher Rule 12b-1 fees than Class A shares and may be subject to a CDSC of 1.00% if those shares are redeemed within one year of acquisition, except for reinvested distributions. Class N and Class Y shares do not pay a front-end sales charge, a CDSC or Rule 12b-1 fees. Class N shares are offered exclusively through intermediaries and are primarily intended for employer-sponsored retirement plans. Class Y shares are intended for institutional investors with a minimum initial investment of $100,000, though some categories of investors are exempted from the minimum investment amount as outlined in the Funds’ prospectus.
81 |
Notes to Financial Statements (continued)
September 30, 2013
Most expenses of the Trusts can be directly attributed to a fund. Expenses which cannot be directly attributed to a fund are generally apportioned based on the relative net assets of each of the funds in the Trusts. Expenses of a Fund are borne pro rata by the holders of each class of shares, except that each class bears expenses unique to that class (including the Rule 12b-1 service and distribution fees and transfer agent fees for Class N). In addition, each class votes as a class only with respect to its own Rule 12b-1 Plan. Shares of each class would receive their pro rata share of the net assets of a Fund if the Fund were liquidated. The Trustees approve separate distributions from net investment income on each class of shares.
2. Significant Accounting Policies. The following is a summary of significant accounting policies consistently followed by each Fund in the preparation of its financial statements. The Funds’ financial statements are prepared in accordance with accounting principles generally accepted in the United States of America which require the use of management estimates that affect the reported amounts and disclosures in the financial statements. Actual results could differ from those estimates. Management has evaluated the events and transactions subsequent to year-end through the date the financial statements were issued and has determined that there were no material events that would require disclosure in the Funds’ financial statements.
a. Valuation. Debt securities (other than short-term obligations purchased with an original or remaining maturity of sixty days or less) and unlisted equity securities are generally valued on the basis of evaluated bids furnished to the Funds by an independent pricing service, recommended by the investment adviser and approved by the Board of Trustees, which determines valuations for normal, institutional-size trading units of such securities using market information, transactions for comparable securities and various relationships between securities which are generally recognized by institutional traders. Senior loans are priced at bid prices supplied by an independent pricing service, if available. Equity securities, including shares of closed-end investment companies and exchange-traded funds, for which market quotations are readily available are valued at market value, as reported by independent pricing services recommended by the investment adviser and approved by the Board of Trustees. Such independent pricing services generally use the security’s last sale price on the exchange or market where the security is primarily traded or, if there is no reported sale during the day, the closing bid price. Securities traded on the NASDAQ Global Select Market, NASDAQ Global Market and NASDAQ Capital Market are valued at the NASDAQ Official Closing Price (“NOCP”), or if lacking a NOCP, at the most recent bid quotation on the applicable NASDAQ Market. Broker-dealer bid prices may also be used to value debt and equity securities and senior loans where an independent pricing service is unable to price a security or where an independent pricing service does not provide a reliable price for the security. Forward foreign currency contracts are valued utilizing interpolated prices determined from information provided by an independent pricing service. Futures contracts are valued at their most recent settlement price.
| 82
Notes to Financial Statements (continued)
September 30, 2013
Credit default swap agreements are valued at mid prices (between the bid and the ask price) supplied by an independent pricing service, if available, or prices obtained from broker-dealers. Investments in other open-end investment companies are valued at their net asset value each day. Short-term obligations purchased with an original or remaining maturity of sixty days or less are valued at amortized cost, which approximates market value. Securities for which market quotations are not readily available are valued at fair value as determined in good faith by the Funds’ investment adviser under the general supervision of the Board of Trustees.
Certain Funds may hold securities traded in foreign markets. Foreign securities are valued at the closing market price in the foreign market. However, if events occurring after the close of the foreign market (but before the close of regular trading on the New York Stock Exchange) are believed to materially affect the value of those securities, such securities are fair valued pursuant to procedures approved by the Board of Trustees. When fair valuing securities, the Funds may, among other things, use modeling tools or other processes that may take into account factors such as securities market activity and/or significant events that occur after the close of the foreign market and before the Funds calculate their net asset values.
b. Investment Transactions and Related Investment Income. Investment transactions are accounted for on a trade date plus one day basis for daily net asset value calculation. However, for financial reporting purposes, investment transactions are reported on trade date. Dividend income is recorded on ex-dividend date, or in the case of certain foreign securities, as soon as a Fund is notified, and interest income is recorded on an accrual basis. Interest income is increased by the accretion of discount and decreased by the amortization of premium. Periodic principal adjustments for inflation-protected securities are recorded to interest income. Negative principal adjustments (in the event of deflation) are recorded as reductions of interest income to the extent of interest income earned, not to exceed the amount of positive principal adjustments on a cumulative basis. In determining net gain or loss on securities sold, the cost of securities has been determined on an identified cost basis. Investment income, non-class specific expenses and realized and unrealized gains and losses are allocated on a pro rata basis to each class based on the relative net assets of each class to the total net assets of the Fund.
c. Foreign Currency Translation. The books and records of the Funds are maintained in U.S. dollars. The values of securities, currencies and other assets and liabilities denominated in currencies other than U.S. dollars are translated into U.S. dollars based upon foreign exchange rates prevailing at the end of the period. Purchases and sales of investment securities, income and expenses are translated on the respective dates of such transactions.
Since the values of investment securities are presented at the foreign exchange rates prevailing at the end of the period, it is not practical to isolate that portion of the results
83 |
Notes to Financial Statements (continued)
September 30, 2013
of operations arising from changes in exchange rates from fluctuations which arise due to changes in market prices of investment securities. Such changes are included with the net realized and unrealized gain or loss on investments.
Net realized foreign exchange gains or losses arise from sales of foreign currency, currency gains or losses realized between the trade and settlement dates on securities transactions, and the difference between the amounts of dividends, interest and foreign withholding taxes recorded on the Funds’ books and the U.S. dollar equivalent of the amounts actually received or paid. Net unrealized foreign exchange gains and losses arise from changes in the value of assets and liabilities, other than investment securities, at the end of the fiscal period, resulting from changes in exchange rates.
Each Fund may use foreign currency exchange contracts to facilitate transactions in foreign-denominated investments. Losses may arise from changes in the value of the foreign currency or if the counterparties do not perform under the contracts’ terms.
d. Forward Foreign Currency Contracts. The Funds may enter into forward foreign currency contracts, including forward foreign cross currency contracts, to acquire exposure to foreign currencies or to hedge the Funds’ investments against currency fluctuation. A contract can also be used to offset a previous contract. These contracts involve market risk in excess of the unrealized gain or loss reflected in the Funds’ Statements of Assets and Liabilities. The U.S. dollar value of the currencies a Fund has committed to buy or sell represents the aggregate exposure to each currency a Fund has acquired or hedged through currency contracts outstanding at period end. Gains or losses are recorded for financial statement purposes as unrealized until settlement date. Contracts are traded over-the-counter directly with a counterparty. Risks may arise upon entering into these contracts from the potential inability of counterparties to meet the terms of their contracts and from unanticipated movements in the value of a foreign currency relative to the U.S. dollar. Certain contracts may require the movement of cash and/or securities as collateral for the Funds’ or counterparty’s net obligations under the contracts.
e. Futures Contracts. The Funds may enter into futures contracts. Futures contracts are agreements between two parties to buy and sell a particular commodity, instrument or index for a specified price on a specified future date.
When a Fund enters into a futures contract, it is required to deposit with (or for the benefit of) its broker an amount of cash or short-term high-quality securities as “initial margin.” As the value of the contract changes, the value of the futures contract position increases or declines. Subsequent payments, known as “variation margin,” are made or received by a Fund, depending on the price fluctuations in the fair value of the contract and the value of cash or securities on deposit with the broker. The aggregate principal amounts of the contracts are not recorded in the financial statements. Fluctuations in the value of the contracts are recorded in the Statements of Assets and Liabilities as an asset (liability) and in the Statements of Operations as unrealized appreciation (depreciation) until the
| 84
Notes to Financial Statements (continued)
September 30, 2013
contracts are closed, when they are recorded as realized gains (losses). Realized gain or loss on a futures position is equal to the difference between the value of the contract at the time it was opened and the value at the time it was closed, minus brokerage commissions. When a Fund enters into a futures contract certain risks may arise, such as illiquidity in the futures market, which may limit a Fund’s ability to close out a futures contract prior to settlement date, and unanticipated movements in the value of securities or interest rates.
Futures contracts are exchange-traded. Exchange-traded futures contracts are standardized and are settled through a clearing house with fulfillment supported by the credit of the exchange. Therefore, counterparty credit risks to the Funds are reduced; however, in the event that a counterparty enters into bankruptcy, the Fund’s claim against initial/variation margin on deposit with the counterparty may be subject to terms of a final settlement in bankruptcy court.
f. Swap Agreements. Each Fund may enter into credit default swaps. A credit default swap is an agreement between two parties (the “protection buyer” and “protection seller”) to exchange the credit risk of an issuer (“reference obligation”) for a specified time period. The reference obligation may be one or more debt securities or an index of such securities. The Funds may be either the protection buyer or the protection seller. As a protection buyer, the Funds have the ability to hedge the downside risk of an issuer or group of issuers. As a protection seller, the Funds have the ability to gain exposure to an issuer or group of issuers whose bonds are unavailable or in short supply in the cash bond market, as well as realize additional income in the form of fees paid by the protection buyer. The protection buyer is obligated to pay the protection seller a stream of payments (“fees”) over the term of the contract, provided that no credit event, such as a default or a downgrade in credit rating, occurs on the reference obligation. The Funds may also pay or receive upfront premiums. If a credit event occurs, the protection seller must pay the protection buyer the difference between the agreed upon notional value and market value of the reference obligation. Market value in this case is determined by a facilitated auction whereby a minimum number of allowable broker bids, together with a specified valuation method, are used to calculate the value. The maximum potential amount of undiscounted future payments that a Fund as the protection seller could be required to make under a credit default swap agreement would be an amount equal to the notional amount of the agreement.
The notional amounts of credit default swaps are not recorded in the financial statements. Credit default swaps are valued daily, and fluctuations in the value are recorded in the Statements of Operations as change in unrealized appreciation (depreciation) on swap agreements. Fees are accrued in accordance with the terms of the agreement and are recorded in the Statements of Operations as realized gain or loss when received or paid. Upfront premiums paid or received by the Funds are recorded on the Statements of Assets and Liabilities as an asset or liability, respectively, and are amortized or accreted over the term of the agreement and recorded as realized gain or loss. Payments made or
85 |
Notes to Financial Statements (continued)
September 30, 2013
received by the Funds as a result of a credit event or termination of the agreement are recorded as realized gain or loss.
Credit default swaps are privately negotiated and traded between counterparties and, as such, are subject to the risk that a party to the agreement will not be able to meet its obligations. The Funds cover their net obligations under outstanding credit default swaps by segregating or earmarking liquid assets or cash.
No credit default swaps were held by the Funds during the year ended September 30, 2013.
g. Due from Brokers. Transactions and positions in certain futures and forward foreign currency contracts are maintained and cleared by registered U.S. broker/dealers pursuant to customer agreements between the Fund and the various broker/dealers. Due from brokers’ balances in the Statements of Asset and Liabilities for High Income Fund represent cash pledged as collateral for forward foreign currency contracts. In certain circumstances the Fund’s use of cash and/or securities held at brokers is restricted by regulation or broker mandated limits. Cash pledged as collateral for forward foreign currency contracts is held for the benefit of the counterparty at a third party custodian.
h. Federal and Foreign Income Taxes. Each Trust treats each fund as a separate entity for federal income tax purposes. Each Fund intends to meet the requirements of the Internal Revenue Code of 1986, as amended, applicable to regulated investment companies, and to distribute to its shareholders substantially all of its net investment income and any net realized capital gains at least annually. Management has performed an analysis of each Fund’s tax positions for the open tax years as of September 30, 2013 and has concluded that no provisions for income tax are required. The Funds’ federal tax returns for the prior three fiscal years remain subject to examination by the Internal Revenue Service. Management is not aware of any events that are reasonably possible to occur in the next twelve months that would result in the amounts of any unrecognized tax benefits significantly increasing or decreasing for the Funds. However, management’s conclusions regarding tax positions taken may be subject to review and adjustment at a later date based on factors including, but not limited to, new tax laws and accounting regulations and interpretations thereof.
A Fund may be subject to foreign withholding taxes on investment income and taxes on capital gains on investments that are accrued and paid based upon the Fund’s understanding of the tax rules and regulations that exist in the countries in which the Fund invests. Foreign withholding taxes on dividend and interest income are reflected on the Statements of Operations as a reduction of investment income, net of amounts eligible to be reclaimed. Dividends and interest receivable on the Statements of Assets and Liabilities are net of foreign withholding taxes. Foreign withholding taxes eligible to be reclaimed are reflected on the Statements of Assets and Liabilities as tax reclaims receivable. Capital gains taxes paid are included in net realized gain (loss) on investments in the Statements of Operations. Accrued but unpaid capital gains taxes are reflected as foreign taxes payable on the Statements of Assets and Liabilities, if
| 86
Notes to Financial Statements (continued)
September 30, 2013
applicable, and reduce unrealized gains on investments. In the event that realized gains on investments are subsequently offset by realized losses, taxes paid on realized gains may be returned to a Fund. Such amounts, if applicable, are reflected as foreign tax rebates receivable on the Statements of Assets and Liabilities and are recorded as a realized gain when received.
i. Dividends and Distributions to Shareholders. Dividends and distributions are recorded on ex-dividend date. The timing and characterization of certain income and capital gain distributions are determined annually in accordance with federal tax regulations, which may differ from accounting principles generally accepted in the United States of America. Permanent differences are primarily due to differing treatments for book and tax purposes of items such as foreign currency transactions, contingent payment debt instruments, preferred securities adjustments, premium amortization, defaulted bond adjustments, paydown gains and losses, return of capital and capital gain distributions received, taxable overdistribution and distribution redesignations. Permanent book and tax basis differences relating to shareholder distributions will result in reclassifications to capital accounts. Temporary differences between book and tax distributable earnings are primarily due to deferred Trustees’ fees, wash sales, premium amortization, forward foreign currency and futures contracts mark to market, dividends payable, trust preferred securities adjustments, contingent payment debt instruments, return of capital distributions received and defaulted bond interest. Distributions from net investment income and short-term capital gains are considered to be distributed from ordinary income for tax purposes.
The tax characterization of distributions is determined on an annual basis. The tax character of distributions paid to shareholders during the years ended September 30, 2013 and 2012 were as follows:
| | | | | | | | | | | | | | | | |
| | | 2013 Distributions Paid From: | |
Fund | | Ordinary Income | | | Long-Term Capital Gains | | | Return of Capital | | | Total | |
Core Plus Bond Fund | | $ | 78,998,718 | | | $ | 7,677,478 | | | $ | — | | | $ | 86,676,196 | |
High Income Fund | | | 12,581,747 | | | | 689,257 | | | | — | | | | 13,271,004 | |
International Bond Fund | | | 523,768 | | | | 163,540 | | | | — | | | | 687,308 | |
Limited Term Government and Agency Fund | | | 15,061,634 | | | | 234,773 | | | | 110,176 | | | | 15,406,583 | |
| | | | | | | | | | | | |
| |
| | | 2012 Distributions Paid From: | |
Fund | | Ordinary Income | | | Long-Term Capital Gains | | | Total | |
Core Plus Bond Fund | | $ | 38,311,608 | | | $ | 5,887,516 | | | $ | 44,199,124 | |
High Income Fund | | | 12,336,748 | | | | 9,467,897 | | | | 21,804,645 | |
International Bond Fund | | | 2,051,571 | | | | 303,804 | | | | 2,355,375 | |
Limited Term Government and Agency Fund | | | 12,349,174 | | | | 810,952 | | | | 13,160,126 | |
87 |
Notes to Financial Statements (continued)
September 30, 2013
Differences between these amounts and those reported in the Statements of Changes in Net Assets are primarily attributable to different book and tax treatment for short-term capital gains.
As of September 30, 2013, the components of distributable earnings on a tax basis were as follows:
| | | | | | | | | | | | | | | | |
| | | Core Plus
Bond Fund | | | High Income
Fund | | | International
Bond Fund | | | Limited Term
Government and
Agency Fund | |
Undistributed ordinary income | | $ | 2,687,149 | | | $ | 1,913,587 | | | $ | 96,805 | | | $ | — | |
Undistributed long-term capital gains | | | 8,484,736 | | | | 7,747,131 | | | | 284,970 | | | | — | |
| | | | | | | | | | | | | | | | |
Total undistributed earnings | | | 11,171,885 | | | | 9,660,718 | | | | 381,775 | | | | — | |
| | | | | | | | | | | | | | | | |
Capital loss carryforward: | | | | | | | | | | | | | | | | |
Short-term: | | | | | | | | | | | | | | | | |
No expiration date | | | — | | | | — | | | | — | | | | (107,452 | ) |
Long-term: | | | | | | | | | | | | | | | | |
No expiration date | | | — | | | | — | | | | — | | | | (82,408 | ) |
Late year ordinary and post-October capital loss deferrals* | | | (9,747,912 | ) | | | — | | | | — | | | | (7,556,110 | ) |
Unrealized appreciation (depreciation) | | | (17,000,364 | ) | | | 1,474,081 | | | | (881,711 | ) | | | 4,059,311 | |
| | | | | | | | | | | | | | | | |
Total accumulated earnings (losses) | | $ | (15,576,391 | ) | | $ | 11,134,799 | | | $ | (499,936 | ) | | $ | (3,686,659 | ) |
| | | | | | | | | | | | | | | | |
| * | Under current tax law, capital losses, foreign currency losses, and losses on contingent payment debt instruments after October 31 or December 31, as applicable, may be deferred and treated as occurring on the first day of the following taxable year. |
j. Repurchase Agreements. It is each Fund’s policy that the market value of the collateral for repurchase agreements be at least equal to 102% of the repurchase price, including interest. Certain repurchase agreements are tri-party arrangements whereby the collateral is held in a segregated account for the benefit of the Fund and on behalf of the counterparty. Repurchase agreements could involve certain risks in the event of default or insolvency of the counterparty, including possible delays or restrictions upon a Fund’s ability to dispose of the underlying securities.
k. Delayed Delivery Commitments. The Funds may purchase securities, including those designated as TBAs in the Portfolio of Investments, for which delivery or payment will occur at a later date, beyond the normal settlement period. The price of the security and the date when the security will be delivered and paid for are fixed at the time the transaction is negotiated. The security and the obligation to pay for it are
| 88
Notes to Financial Statements (continued)
September 30, 2013
recorded by the Funds at the time the commitment is entered into. The actual security that will be delivered to fulfill a TBA trade is not designated at the time of the trade. The security is “to be announced” 48 hours prior to the established trade settlement date. The value of the security may vary with market fluctuations during the time before the Funds take delivery of the security. When the Funds enter into such a transaction, collateral consisting of liquid securities or cash and cash equivalents is required to be segregated or earmarked at the custodian in an amount at least equal to the amount of the Funds’ commitment. No interest accrues to each Fund until the transaction settles.
Purchases of delayed delivery securities may have a similar effect on the Funds’ net asset value as if the Funds had created a degree of leverage in the portfolio. Risks may arise upon entering into such transactions from the potential inability of counterparties to meet their obligations under the transactions. Additionally, losses may arise due to changes in the value of the underlying securities.
l. Securities Lending. The Funds have entered into an agreement with State Street Bank and Trust Company (“State Street Bank”), as agent of the Funds, to lend securities to certain designated borrowers. The loans are collateralized with cash or securities in an amount equal to at least 105% or 102% of the market value (including accrued interest) of the loaned international or domestic securities, respectively, when the loan is initiated. Thereafter, the value of the collateral must remain at least 102% of the market value (including accrued interest) of loaned securities for U.S. equities and U.S. corporate debt; at least 105% of the market value (including accrued interest) of loaned securities for non-U.S. equities; and at least 100% of the market value (including accrued interest) of loaned securities for U.S. Government securities, sovereign debt issued by non-U.S. Governments and non-U.S. corporate debt. In the event that the market value of the collateral falls below the required percentages described above, the borrower will deliver additional collateral on the next business day. As with other extensions of credit, the Funds may bear the risk of loss with respect to the investment of the collateral. The Funds invest cash collateral in short-term investments, a portion of the income from which is remitted to the borrowers and the remainder allocated between the Funds and State Street Bank as lending agent.
For the year ended September 30, 2013, none of the Funds had loaned securities under this agreement.
m. Indemnifications. Under the Trusts’ organizational documents, their officers and Trustees are indemnified against certain liabilities arising out of the performance of their duties to the Funds. Additionally, in the normal course of business, the Funds enter into contracts with service providers that contain general indemnification clauses. The Funds’ maximum exposure under these arrangements is unknown as this would involve future claims that may be made against the Funds that have not yet occurred. However, based on experience, the Funds expect the risk of loss to be remote.
89 |
Notes to Financial Statements (continued)
September 30, 2013
n. New Accounting Pronouncement. In December 2011, Accounting Standards Update (“ASU”) No. 2011-11, “Disclosures about Offsetting Assets and Liabilities” was issued and is effective for interim and annual periods beginning after January 1, 2013. The ASU creates new disclosure requirements with respect to an entity’s rights of setoff and related arrangements associated with its financial and derivative instruments. Management has evaluated the impact of the adoption of ASU 2011-11 and will incorporate the new disclosures required in the March 31, 2014 report.
3. Fair Value Measurements. In accordance with accounting standards related to fair value measurements and disclosures, the Funds have categorized the inputs utilized in determining the value of each Fund’s assets or liabilities. These inputs are summarized in the three broad levels listed below:
| | • | | Level 1 – quoted prices in active markets for identical assets or liabilities; |
| | • | | Level 2 – prices determined using other significant inputs that are observable either directly, or indirectly through corroboration with observable market data (which could include quoted prices for similar assets or liabilities, interest rates, credit risk, etc.); and |
| | • | | Level 3 – prices determined using significant unobservable inputs when quoted prices or observable inputs are unavailable such as when there is little or no market activity for an asset or liability (unobservable inputs reflect each Fund’s own assumptions in determining the fair value of assets or liabilities and would be based on the best information available). |
The inputs or methodology used for valuing securities are not necessarily an indication of the risk associated with investing in those securities.
The Funds’ pricing policies and procedures are recommended by the investment adviser and approved by the Board of Trustees. Debt securities are generally valued on the basis of evaluated bids furnished to the Funds by an independent pricing service. Broker-dealer bid prices may be used if an independent pricing service either is unable to price a security or does not provide a reliable price for a security. Broker-dealer bid prices for which the Funds do not have knowledge of the inputs used by the broker-dealer are categorized in Level 3. All security prices, including those obtained from an independent pricing service and broker-dealer bid prices, are reviewed on a daily basis by the investment adviser, subject to oversight by Fund management and the Board of Trustees. If the investment adviser, in good faith, believes that the price provided by an independent pricing service is unreliable, broker-dealer bid prices may be used until the price provided by the independent pricing service is considered to be reliable. Reliability of all security prices, including those obtained from an independent pricing service and broker-dealer bid prices, is tested in a variety of ways, including comparison to recent transaction prices and daily fluctuations, amongst other validation procedures in place. Securities for which market quotations are not readily available are valued at fair value as determined in
| 90
Notes to Financial Statements (continued)
September 30, 2013
good faith by the Funds’ investment adviser under the general supervision of the Board of Trustees. Fair valued securities may be categorized in Level 3.
The following is a summary of the inputs used to value the Funds’ investments as of September 30, 2013, at value:
Core Plus Bond Fund
Asset Valuation Inputs
| | | | | | | | | | | | | | | | |
Description | | Level 1 | | | Level 2 | | | Level 3 | | | Total | |
Bonds and Notes | | | | | | | | | | | | | | | | |
Non-Convertible Bonds | | | | | | | | | | | | | | | | |
ABS Other | | $ | — | | | $ | 1,787,489 | | | $ | 8,485,775 | (b) | | $ | 10,273,264 | |
Airlines | | | — | | | | — | | | | 4,343,325 | (b) | | | 4,343,325 | |
All Other Non-Convertible Bonds(a) | | | — | | | | 1,223,393,299 | | | | — | | | | 1,223,393,299 | |
| | | | | | | | | | | | | | | | |
Total Non-Convertible Bonds | | | — | | | | 1,225,180,788 | | | | 12,829,100 | | | | 1,238,009,888 | |
| | | | | | | | | | | | | | | | |
Convertible Bonds(a) | | | — | | | | — | | | | 1,513,625 | (c) | | | 1,513,625 | |
| | | | | | | | | | | | | | | | |
Total Bonds and Notes | | | — | | | | 1,225,180,788 | | | | 14,342,725 | | | | 1,239,523,513 | |
| | | | | | | | | | | | | | | | |
Senior Loans(a) | | | — | | | | 44,961,565 | | | | — | | | | 44,961,565 | |
Preferred Stocks | | | | | | | | | | | | | | | | |
Media Cable | | | — | | | | 8,855,550 | | | | — | | | | 8,855,550 | |
All Other Preferred Stocks(a) | | | 2,591,006 | | | | — | | | | — | | | | 2,591,006 | |
| | | | | | | | | | | | | | | | |
Total Preferred Stocks | | | 2,591,006 | | | | 8,855,550 | | | | — | | | | 11,446,556 | |
| | | | | | | | | | | | | | | | |
Short-Term Investments | | | — | | | | 46,314,363 | | | | — | | | | 46,314,363 | |
| | | | | | | | | | | | | | | | |
Total | | $ | 2,591,006 | | | $ | 1,325,312,266 | | | $ | 14,342,725 | | | $ | 1,342,245,997 | |
| | | | | | | | | | | | | | | | |
| (a) | Details of the major categories of the Fund’s investments are reflected within the Portfolio of Investments. |
| (b) | Valued using broker-dealer bid prices. |
| (c) | Fair valued by the Fund’s investment adviser. |
A preferred stock valued at $497,669 was transferred from Level 2 to Level 1 during the period ended September 30, 2013. At September 30, 2013, this security was valued at the last sale price in accordance with the Fund’s valuation policies.
All transfers are recognized as of the beginning of the reporting period.
91 |
Notes to Financial Statements (continued)
September 30, 2013
High Income Fund
Asset Valuation Inputs
| | | | | | | | | | | | | | | | |
Description | | Level 1 | | | Level 2 | | | Level 3 | | | Total | |
Bonds and Notes | | | | | | | | | | | | | | | | |
Non-Convertible Bonds | | | | | | | | | | | | | | | | |
Airlines | | $ | — | | | $ | — | | | $ | 740,816 | (b) | | $ | 740,816 | |
All Other Non-Convertible Bonds(a) | | | — | | | | 122,209,555 | | | | — | | | | 122,209,555 | |
| | | | | | | | | | | | | | | | |
Total Non-Convertible Bonds | | | — | | | | 122,209,555 | | | | 740,816 | | | | 122,950,371 | |
| | | | | | | | | | | | | | | | |
Convertible Bonds | | | | | | | | | | | | | | | | |
Wirelines | | | — | | | | — | | | | 43,333 | (c) | | | 43,333 | |
All Other Convertible Bonds(a) | | | — | | | | 19,720,450 | | | | — | | | | 19,720,450 | |
| | | | | | | | | | | | | | | | |
Total Convertible Bonds | | | — | | | | 19,720,450 | | | | 43,333 | | | | 19,763,783 | |
| | | | | | | | | | | | | | | | |
Total Bonds and Notes | | | — | | | | 141,930,005 | | | | 784,149 | | | | 142,714,154 | |
| | | | | | | | | | | | | | | | |
Senior Loans(a) | | | — | | | | 3,311,843 | | | | — | | | | 3,311,843 | |
Preferred Stocks(a) | | | 9,653,497 | | | | — | | | | — | | | | 9,653,497 | |
Common Stocks(a) | | | 4,085,133 | | | | — | | | | — | | | | 4,085,133 | |
Warrants(d) | | | 111,885 | | | | — | | | | — | | | | 111,885 | |
Short-Term Investments | | | — | | | | 7,557,653 | | | | — | | | | 7,557,653 | |
| | | | | | | | | | | | | | | | |
Total Investments | | | 13,850,515 | | | | 152,799,501 | | | | 784,149 | | | | 167,434,165 | |
| | | | | | | | | | | | | | | | |
Forward Foreign Currency Contracts (unrealized appreciation) | | | — | | | | 42,038 | | | | — | | | | 42,038 | |
| | | | | | | | | | | | | | | | |
Total | | $ | 13,850,515 | | | $ | 152,841,539 | | | $ | 784,149 | | | $ | 167,476,203 | |
| | | | | | | | | | | | | | | | |
Liability Valuation Inputs | | | | | | | | | | | | | | | | |
Description | | Level 1 | | | Level 2 | | | Level 3 | | | Total | |
Forward Foreign Currency Contracts (unrealized depreciation) | | $ | — | | | $ | (314,769 | ) | | $ | — | | | $ | (314,769 | ) |
Futures Contracts (unrealized depreciation) | | | (11,224 | ) | | | — | | | | — | | | | (11,224 | ) |
| | | | | | | | | | | | | | | | |
Total | | $ | (11,224 | ) | | $ | (314,769 | ) | | $ | — | | | $ | (325,993 | ) |
| | | | | | | | | | | | | | | | |
| (a) | Details of the major categories of the Fund’s investments are reflected within the Portfolio of Investments. |
| (b) | Valued using broker-dealer bid prices. |
| (c) | Fair valued by the Fund’s investment adviser. |
| (d) | Includes a security fair valued at zero using Level 2 inputs. |
| 92
Notes to Financial Statements (continued)
September 30, 2013
A preferred stock valued at $902,727 was transferred from Level 2 to Level 1 during the period ended September 30, 2013. At September 30, 2013, this security was valued at the last sale price in accordance with the Fund’s valuation policies.
All transfers are recognized as of the beginning of the reporting period.
International Bond Fund
Asset Valuation Inputs
| | | | | | | | | | | | | | | | |
Description | | Level 1 | | | Level 2 | | | Level 3 | | | Total | |
Bonds and Notes | | | | | | | | | | | | | | | | |
Non-Convertible Bonds | | | | | | | | | | | | | | | | |
United States | | $ | — | | | $ | 2,118,393 | | | $ | 41,625 | (b) | | $ | 2,160,018 | |
All Other Non-Convertible Bonds(a) | | | — | | | | 12,296,475 | | | | — | | | | 12,296,475 | |
| | | | | | | | | | | | | | | | |
Total Non-Convertible Bonds | | | — | | | | 14,414,868 | | | | 41,625 | | | | 14,456,493 | |
| | | | | | | | | | | | | | | | |
Convertible Bonds(a) | | | — | | | | 21,650 | | | | — | | | | 21,650 | |
| | | | | | | | | | | | | | | | |
Total Bonds and Notes | | | — | | | | 14,436,518 | | | | 41,625 | | | | 14,478,143 | |
| | | | | | | | | | | | | | | | |
Preferred Stocks(a) | | | 58,306 | | | | — | | | | — | | | | 58,306 | |
Short-Term Investments | | | — | | | | 259,970 | | | | — | | | | 259,970 | |
| | | | | | | | | | | | | | | | |
Total Investments | | | 58,306 | | | | 14,696,488 | | | | 41,625 | | | | 14,796,419 | |
| | | | | | | | | | | | | | | | |
Forward Foreign Currency Contracts (unrealized appreciation) | | | — | | | | 35,882 | | | | — | | | | 35,882 | |
Futures Contracts (unrealized appreciation) | | | 13,655 | | | | — | | | | — | | | | 13,655 | |
| | | | | | | | | | | | | | | | |
Total | | $ | 71,961 | | | $ | 14,732,370 | | | $ | 41,625 | | | $ | 14,845,956 | |
| | | | | | | | | | | | | | | | |
Liability Valuation Inputs | | | | | | | | | | | | | | | | |
Description | | Level 1 | | | Level 2 | | | Level 3 | | | Total | |
Forward Foreign Currency Contracts (unrealized depreciation) | | $ | — | | | $ | (24,631 | ) | | $ | — | | | $ | (24,631 | ) |
| | | | | | | | | | | | | | | | |
| (a) | Details of the major categories of the Fund’s investments are reflected within the Portfolio of Investments. |
| (b) | Valued using broker-dealer bid prices. |
For the year ended September 30, 2013, there were no transfers among Levels 1, 2 and 3.
93 |
Notes to Financial Statements (continued)
September 30, 2013
Limited Term Government and Agency Fund
Asset Valuation Inputs
| | | | | | | | | | | | | | | | |
Description | | Level 1 | | | Level 2 | | | Level 3 | | | Total | |
Bonds and Notes | | | | | | | | | | | | | | | | |
ABS Student Loan | | $ | — | | | $ | — | | | $ | 1,336,443 | (b) | | $ | 1,336,443 | |
Collateralized Mortgage Obligations | | | — | | | | 196,625,256 | | | | 38,339,237 | (b) | | | 234,964,493 | |
All Other Non-Convertible Bonds(a) | | | — | | | | 439,850,499 | | | | — | | | | 439,850,499 | |
| | | | | | | | | | | | | | | | |
Total Bonds and Notes | | | — | | | | 636,475,755 | | | | 39,675,680 | | | | 676,151,435 | |
| | | | | | | | | | | | | | | | |
Short-Term Investments | | | — | | | | 11,602,796 | | | | — | | | | 11,602,796 | |
| | | | | | | | | | | | | | | | |
Total | | $ | — | | | $ | 648,078,551 | | �� | $ | 39,675,680 | | | $ | 687,754,231 | |
| | | | | | | | | | | | | | | | |
| (a) | Details of the major categories of the Fund’s investments are reflected within the Portfolio of Investments. |
| (b) | Valued using broker-dealer bid prices. |
The following is a reconciliation of Level 3 investments for which significant unobservable inputs were used to determine fair value as of September 30, 2012 and/or September 30, 2013:
Core Plus Bond Fund
Asset Valuation Inputs
| | | | | | | | | | | | | | | | | | | | |
Investments in Securities | | Balance as of
September 30,
2012 | | | Accrued
Discounts
(Premiums) | | | Realized
Gain
(Loss) | | | Change in
Unrealized
Appreciation
(Depreciation) | | | Purchases | |
Bonds and Notes | | | | | | | | | | | | | | | | | | | | |
Non-Convertible Bonds | | | | | | | | | | | | | | | | | | | | |
ABS Other | | $ | — | | | $ | — | | | $ | — | | | $ | (115,948 | ) | | $ | 8,601,723 | |
Airlines | | | — | | | | 601 | | | | 476 | | | | (210,277 | ) | | | — | |
Convertible Bonds | | | | | | | | | | | | | | | | | | | | |
Wirelines | | | — | | | | 3,354 | | | | (18 | ) | | | 187,954 | | | | 2,644,671 | |
| | | | | | | | | | | | | | | | | | | | |
Total | | $ | — | | | $ | 3,955 | | | $ | 458 | | | $ | (138,271 | ) | | $ | 11,246,394 | |
| | | | | | | | | | | | | | | | | | | | |
| 94
Notes to Financial Statements (continued)
September 30, 2013
Core Plus Bond Fund (continued)
Asset Valuation Inputs (continued)
| | | | | | | | | | | | | | | | | | | | |
Investments in Securities | | Sales | | | Transfers into Level 3 | | | Transfers
out of
Level 3 | | | Balance as of
September 30,
2013 | | | Change in
Unrealized
Appreciation
(Depreciation)
from
Investments
Still Held at
September 30,
2013 | |
Bonds and Notes | | | | | | | | | | | | | | | | | | | | |
Non-Convertible Bonds | | | | | | | | | | | | | | | | | | | | |
ABS Other | | $ | — | | | $ | — | | | $ | — | | | $ | 8,485,775 | | | $ | (115,948 | ) |
Airlines | | | (76,878 | ) | | | 4,629,403 | | | | — | | | | 4,343,325 | | | | (210,277 | ) |
Convertible Bonds | | | | | | | | | | | | | | | | | | | | |
Wirelines | | | (1,322,336 | ) | | | — | | | | — | | | | 1,513,625 | | | | 187,954 | |
| | | | | | | | | | | | | | | | | | | | |
Total | | $ | (1,399,214 | ) | | $ | 4,629,403 | | | $ | — | | | $ | 14,342,725 | | | $ | (138,271 | ) |
| | | | | | | | | | | | | | | | | | | | |
Debt securities valued at $4,629,403 were transferred from Level 2 to Level 3 during the period ended September 30, 2013. At September 30, 2013, these securities were valued using broker-dealer bid prices based on inputs unobservable to the Fund as an independent pricing service was unable to price the securities.
All transfers are recognized as of the beginning of the reporting period.
High Income Fund
Asset Valuation Inputs
| | | | | | | | | | | | | | | | | | | | |
Investments in Securities | | Balance as of
September 30,
2012 | | | Accrued
Discounts
(Premiums) | | | Realized
Gain
(Loss) | | | Change in
Unrealized
Appreciation
(Depreciation) | | | Purchases | |
Bonds and Notes | | | | | | | | | | | | | | | | | | | | |
Non-Convertible Bonds | | | | | | | | | | | | | | | | | | | | |
Airlines | | $ | — | | | $ | 8,946 | | | $ | 3,517 | | | $ | (13,324 | ) | | $ | 345,000 | |
Transportation Services | | | 234,438 | | | | — | | | | — | | | | — | | | | — | |
Convertible Bonds | | | | | | | | | | | | | | | | | | | | |
Wirelines | | | — | | | | — | | | | (8 | ) | | | (6,852 | ) | | | 100,386 | |
| | | | | | | | | | | | | | | | | | | | |
Total | | $ | 234,438 | | | $ | 8,946 | | | $ | 3,509 | | | $ | (20,176 | ) | | $ | 445,386 | |
| | | | | | | | | | | | | | | | | | | | |
95 |
Notes to Financial Statements (continued)
September 30, 2013
High Income Fund (continued)
Asset Valuation Inputs (continued)
| | | | | | | | | | | | | | | | | | | | |
| | | | | |
Investments in Securities | | Sales | | | Transfers into Level 3 | | | Transfers
out of
Level 3 | | | Balance as of
September 30,
2013 | | | Change in
Unrealized
Appreciation
(Depreciation)
from
Investments
Still Held at
September 30,
2013 | |
Bonds and Notes | | | | | | | | | | | | | | | | | | | | |
Non-Convertible Bonds | | | | | | | | | | | | | | | | | | | | |
Airlines | | $ | (16,827 | ) | | $ | 413,504 | | | $ | — | | | $ | 740,816 | | | $ | (13,324 | ) |
Transportation Services | | | — | | | | — | | | | (234,438 | ) | | | — | | | | — | |
Convertible Bonds | | | | | | | | | | | | | | | | | | | | |
Wirelines | | | (50,193 | ) | | | — | | | | — | | | | 43,333 | | | | (6,852 | ) |
| | | | | | | | | | | | | | | | | | | | |
Total | | $ | (67,020 | ) | | $ | 413,504 | | | $ | (234,438 | ) | | $ | 784,149 | | | $ | (20,176 | ) |
| | | | | | | | | | | | | | | | | | | | |
Debt securities valued at $413,504 were transferred from Level 2 to Level 3 during the period ended September 30, 2013. At September 30, 2013, these securities were valued using broker-dealer bid prices based on inputs unobservable to the Fund as an independent pricing service was unable to price the securities.
A debt security valued at $234,438 was transferred from Level 3 to Level 2 during the period ended September 30, 2013. At September 30, 2013, this security was valued on the basis of evaluated bids furnished to the Fund by an independent pricing service in accordance with the Fund’s valuation policies.
All transfers are recognized as of the beginning of the reporting period.
International Bond Fund
Asset Valuation Inputs
| | | | | | | | | | | | | | | | | | | | |
Investments in Securities | | Balance as of
September 30,
2012 | | | Accrued
Discounts
(Premiums) | | | Realized
Gain
(Loss) | | | Change in
Unrealized
Appreciation
(Depreciation) | | | Purchases | |
Bonds and Notes | | | | | | | | | | | | | | | | | | | | |
Non-Convertible Bonds | | | | | | | | | | | | | | | | | | | | |
United States | | $ | — | | | $ | — | | | $ | — | | | $ | (3,375 | ) | | $ | 45,000 | |
| | | | | | | | | | | | | | | | | | | | |
| 96
Notes to Financial Statements (continued)
September 30, 2013
International Bond Fund (continued)
Asset Valuation Inputs (continued)
| | | | | | | | | | | | | | | | | | | | |
| | | | | |
Investments in Securities | | Sales | | | Transfers
into Level 3 | | | Transfers
out of
Level 3 | | | Balance as of
September 30,
2013 | | | Change in
Unrealized
Appreciation
(Depreciation)
from
Investments
Still Held at
September 30,
2013 | |
Bonds and Notes | | | | | | | | | | | | | | | | | | | | |
Non-Convertible Bonds | | | | | | | | | | | | | | | | | | | | |
United States | | $ | — | | | $ | — | | | $ | — | | | $ | 41,625 | | | $ | (3,375 | ) |
| | | | | | | | | | | | | | | | | | | | |
Limited Term Government and Agency Fund
Asset Valuation Inputs
| | | | | | | | | | | | | | | | | | | | |
Investments in Securities | | Balance as of
September 30,
2012 | | | Accrued
Discounts
(Premiums) | | | Realized
Gain
(Loss) | | | Change in
Unrealized
Appreciation
(Depreciation) | | | Purchases | |
Bonds and Notes | | | | | | | | | | | | | | | | | | | | |
ABS Car Loan | | $ | 910,501 | | | $ | — | | | $ | — | | | $ | — | | | $ | — | |
ABS Student Loan | | | — | | | | — | | | | — | | | | 4,130 | | | | — | |
Collateralized Mortgage Obligations | | | — | | | | — | | | | (65 | ) | | | (656,484 | ) | | | 31,068,310 | |
Mortgage Related | | | 1,982,780 | | | | — | | | | — | | | | — | | | | — | |
| | | | | | | | | | | | | | | | | | | | |
Total | | $ | 2,893,281 | | | $ | — | | | $ | (65 | ) | | $ | (652,354 | ) | | $ | 31,068,310 | |
| | | | | | | | | | | | | | | | | | | | |
97 |
Notes to Financial Statements (continued)
September 30, 2013
Limited Term Government and Agency Fund (continued)
Asset Valuation Inputs (continued)
| | | | | | | | | | | | | | | | | | | | |
| | | | | |
Investments in Securities | | Sales | | | Transfers
into Level 3 | | | Transfers
out of
Level 3 | | | Balance as of
September 30,
2013 | | | Change in
Unrealized
Appreciation
(Depreciation)
from
Investments
Still Held at
September 30,
2013 | |
Bonds and Notes | | | | | | | | | | | | | | | | | | | | |
ABS Car Loan | | $ | — | | | $ | — | | | $ | (910,501 | ) | | $ | — | | | $ | — | |
ABS Student Loan | | | (2,413,414 | ) | | | 3,745,727 | | | | — | | | | 1,336,443 | | | | 4,130 | |
Collateralized Mortgage Obligations | | | (1,241,557 | ) | | | 9,169,033 | | | | — | | | | 38,339,237 | | | | (656,484 | ) |
Mortgage Related | | | — | | | | — | | | | (1,982,780 | ) | | | — | | | | — | |
| | | | | | | | | | | | | | | | | | | | |
Total | | $ | (3,654,971 | ) | | $ | 12,914,760 | | | $ | (2,893,281 | ) | | $ | 39,675,680 | | | $ | (652,354 | ) |
| | | | | | | | | | | | | | | | | | | | |
Debt securities valued at $12,914,760 were transferred from Level 2 to Level 3 during the period ended September 30, 2013. At September 30, 2013, these securities were valued using broker-dealer bid prices based on inputs unobservable to the Fund as an independent pricing service was unable to price the securities.
Debt securities valued at $2,893,281 were transferred from Level 3 to Level 2 during the period ended September 30, 2013. At September 30, 2013, these securities were valued on the basis of evaluated bids furnished to the Fund by an independent pricing service in accordance with the Fund’s valuation policies.
All transfers are recognized as of the beginning of the reporting period.
4. Derivatives. Derivative instruments are defined as financial instruments whose value and performance are based on the value and performance of another security or financial instrument. Derivative instruments that High Income Fund and International Bond Fund used during the period include forward foreign currency contracts and futures contracts.
High Income Fund and International Bond Fund are subject to the risk that changes in foreign currency exchange rates will have an unfavorable effect on the value of Fund assets denominated in foreign currencies. The Funds may enter into forward foreign currency contracts for hedging purposes to protect the value of the Funds’ holdings of foreign securities. The Funds may also use forward foreign currency contracts to gain
| 98
Notes to Financial Statements (continued)
September 30, 2013
exposure to foreign currencies, regardless of whether securities denominated in such currencies are held in the Funds. During the year ended September 30, 2013, High Income Fund engaged in forward foreign currency transactions for hedging purposes. During the same period, International Bond Fund engaged in forward foreign currency transactions for hedging purposes and to gain exposure to foreign currencies.
High Income Fund and International Bond Fund are subject to the risk that changes in interest rates will affect the value of the Funds’ investments in fixed income securities. A Fund will be subject to increased interest rate risk to the extent that it invests in fixed-income securities with longer maturities or durations, as compared to investing in fixed-income securities with shorter maturities or durations. The Funds may use futures contracts to hedge against changes in interest rates and to manage duration without having to buy or sell portfolio securities. During the year ended September 30, 2013, High Income Fund used futures contracts for hedging purposes and International Bond Fund used futures contracts to manage duration.
The following is a summary of derivative instruments for High Income Fund as of September 30, 2013, as reflected within the Statement of Assets and Liabilities:
| | | | | | | | | | | | |
Assets | | Unrealized
appreciation on
forward foreign
currency contracts | | | Unrealized
appreciation on
futures contracts1 | | | Total | |
Over-the-counter asset derivatives | | | | | | | | | | | | |
Foreign exchange contracts | | $ | 42,038 | | | $ | — | | | $ | 42,038 | |
| | | | | | | | | | | | |
| | | |
Liabilities | | Unrealized
depreciation on
forward foreign
currency contracts | | | Unrealized
depreciation on
futures contracts1 | | | Total | |
Over-the-counter liability derivatives | | | | | | | | | | | | |
Foreign exchange contracts | | $ | (314,769 | ) | | $ | — | | | $ | (314,769 | ) |
Exchange traded/cleared liability derivatives | | | | | | | | | | | | |
Interest rate contracts | | | — | | | | (11,224 | ) | | | (11,224 | ) |
| | | | | | | | | | | | |
Total liability derivatives | | $ | (314,769 | ) | | $ | (11,224 | ) | | $ | (325,993 | ) |
| | | | | | | | | | | | |
| 1 | Represents cumulative unrealized appreciation (depreciation) on futures contracts. Only the current day’s variation margin on futures contracts is reported within the Statement of Assets and Liabilities as receivable or payable for variation margin, as applicable. |
99 |
Notes to Financial Statements (continued)
September 30, 2013
Transactions in derivative instruments for High Income Fund during the year ended September 30, 2013, as reflected within the Statement of Operations, were as follows:
| | | | | | | | |
Net Realized Gain (Loss) on: | | Futures contracts | | | Foreign
currency transactions2 | |
Interest rate contracts | | $ | (1,775 | ) | | $ | — | |
Foreign exchange contracts | | | — | | | | (1,753,937 | ) |
| | | | | | | | |
Total | | $ | (1,775 | ) | | $ | (1,753,937 | ) |
| | | | | | | | |
| | | | | | | | |
Net Change in Unrealized Appreciation
(Depreciation) on: | | Futures contracts | | | Foreign
currency translations2 | |
Interest rate contracts | | $ | (11,224 | ) | | $ | — | |
Foreign exchange contracts | | | — | | | | (29,497 | ) |
| | | | | | | | |
Total | | $ | (11,224 | ) | | $ | (29,497 | ) |
| | | | | | | | |
| 2 | Represents realized loss and change in unrealized appreciation (depreciation), respectively, for forward foreign currency contracts during the period. Does not include other foreign currency gains or losses included in the Statement of Operations. |
The following is a summary of derivative instruments for International Bond Fund as of September 30, 2013, as reflected within the Statement of Assets and Liabilities:
| | | | | | | | | | | | |
Assets | | Unrealized
appreciation on
forward foreign
currency contracts | | | Unrealized
appreciation on
futures contracts1 | | | Total | |
Over-the-counter asset derivatives | | | | | | | | | | | | |
Foreign exchange contracts | | $ | 35,882 | | | $ | — | | | $ | 35,882 | |
Exchange traded/cleared asset derivatives | | | | | | | | | | | | |
Interest rate contracts | | | — | | | | 13,655 | | | | 13,655 | |
| | | | | | | | | | | | |
Total asset derivatives | | $ | 35,882 | | | $ | 13,655 | | | $ | 49,537 | |
| | | | | | | | | | | | |
| | | | | | | | | | | | |
Liabilities | | Unrealized
depreciation on
forward foreign
currency contracts | | | Unrealized
depreciation on
futures contracts1 | | | Total | |
Over-the-counter liability derivatives | | | | | | | | | | | | |
Foreign exchange contracts | | $ | (24,631 | ) | | $ | — | | | $ | (24,631 | ) |
| | | | | | | | | | | | |
| 1 | Represents cumulative unrealized appreciation (depreciation) on futures contracts. Only the current day’s variation margin on futures contracts is reported within the Statement of Assets and Liabilities as receivable or payable for variation margin, as applicable. |
| 100
Notes to Financial Statements (continued)
September 30, 2013
Transactions in derivative instruments for International Bond Fund during the year ended September 30, 2013, as reflected within the Statement of Operations, were as follows:
| | | | | | | | |
Net Realized Gain (Loss) on: | | Futures contracts | | | Foreign
currency transactions2 | |
Interest rate contracts | | $ | (5,412 | ) | | $ | — | |
Foreign exchange contracts | | | — | | | | 56,806 | |
| | | | | | | | |
Total | | $ | (5,412 | ) | | $ | 56,806 | |
| | | | | | | | |
| | | | | | | | |
Net Change in Unrealized Appreciation (Depreciation) on: | | Futures contracts | | | Foreign
currency translations2 | |
Interest rate contracts | | $ | 13,655 | | | $ | — | |
Foreign exchange contracts | | | — | | | | (5,153 | ) |
| | | | | | | | |
Total | | $ | 13,655 | | | $ | (5,153 | ) |
| | | | | | | | |
| 2 | Represents realized gain and change in unrealized appreciation (depreciation), respectively, for forward foreign currency contracts during the period. Does not include other foreign currency gains or losses included in the Statement of Operations. |
As the Funds value their derivatives at fair value and recognize changes in fair value through the Statements of Operations, they do not qualify for hedge accounting under authoritative guidance for derivative instruments. The Funds’ investments in derivatives may represent an economic hedge; however, they are considered to be non-hedge transactions for the purpose of these disclosures.
Over-the-counter derivatives, including forward foreign currency contracts, are entered into pursuant to International Swaps and Derivatives Association, Inc. (“ISDA”) agreements negotiated between the Funds and their counterparties. ISDA agreements typically contain, among other things, terms for posting of collateral and master netting provisions in the event of a default or other termination event. Collateral is posted by a Fund or the counterparty to the extent of the net mark-to-market exposure to the other party of all open contracts under the agreement, subject to minimum transfer requirements. Master netting provisions allow the Funds and the counterparty, in the event of a default or other termination event, to offset amounts owed by each related to derivative contracts, including any posted collateral, to one net amount payable by either the Funds or the counterparty. For financial reporting purposes, the Funds do not offset derivative assets and liabilities, and any related collateral received or pledged, on the Statements of Assets and Liabilities. The Funds’ ISDA agreements typically contain provisions that allow a counterparty to terminate open contracts early if the net asset value of a Fund declines beyond a certain threshold. As of September 30, 2013, the fair
101 |
Notes to Financial Statements (continued)
September 30, 2013
value of derivative positions subject to these provisions that are in a net liability position by counterparty, and the value of collateral pledged to counterparties for such contracts is as follows:
| | | | | | | | | | |
Fund | | Counterparty | | Derivatives | | | Collateral
Pledged | |
High Income Fund | | Barclays Bank PLC | | $ | (272,731 | ) | | $ | 280,000 | |
Timing differences may exist between when contracts under the ISDA agreement are marked-to-market and when collateral moves. The ISDA agreements include tri-party control agreements under which collateral is held for the benefit of the secured party at a third party custodian, State Street Bank.
Counterparty risk is managed based on policies and procedures established by each Fund’s adviser. Such policies and procedures may include, but are not limited to, minimum counterparty credit rating requirements, monitoring of counterparty credit default swap spreads and posting of collateral. The risk of loss to a Fund from counterparty default should be limited to the extent a Fund is under collateralized for over-the-counter derivatives; however, final settlement of a Fund’s claim against any collateral received may be subject to bankruptcy court proceedings. Additionally, cash or securities held at or pledged to counterparties for initial/variation margin or as collateral may be subject to bankruptcy court proceedings. Based on balances reflected on each Fund’s Statements of Assets and Liabilities, including cash and/or securities held at or pledged to counterparties for initial/variation margin or as collateral that could be subject to the terms of a final settlement in a bankruptcy court proceeding, the maximum amount of loss that the Funds would incur if counterparties failed to meet their obligations, and the amount of loss that the Funds would incur after taking into account master netting arrangements are as follows as of September 30, 2013:
| | | | | | | | |
Fund | | Maximum Amount of Loss - Gross | | | Maximum Amount of Loss - Net | |
High Income Fund | | $ | 342,476 | | | $ | 300,438 | |
International Bond Fund | | | 62,713 | | | | 38,082 | |
| 102
Notes to Financial Statements (continued)
September 30, 2013
The volume of forwards foreign currency contract and futures contract activity, as a percentage of net assets, based on gross month-end notional amounts outstanding during the period, including long and short positions at absolute value, was as follows for the year ended September 30, 2013:
| | | | | | | | |
High Income Bond Fund | | Forwards | | | Futures | |
Average Notional Amount Outstanding | | | 6.55 | % | | | 0.07 | % |
Highest Notional Amount Outstanding | | | 11.53 | % | | | 0.57 | % |
Lowest Notional Amount Outstanding | | | 2.76 | % | | | 0.00 | % |
Notional Amount Outstanding as of September 30, 2013 | | | 9.38 | % | | | 0.55 | % |
| | | | | | | | |
International Bond Fund | | Forwards | | | Futures | |
Average Notional Amount Outstanding | | | 21.07 | % | | | 3.19 | % |
Highest Notional Amount Outstanding | | | 40.96 | % | | | 5.64 | % |
Lowest Notional Amount Outstanding | | | 12.10 | % | | | 0.00 | % |
Notional Amount Outstanding as of September 30, 2013 | | | 28.62 | % | | | 5.64 | % |
Notional amounts outstanding at the end of the prior period are included in the average notional amount outstanding.
Unrealized gain and/or loss on open forwards and futures is recorded in the Statements of Assets and Liabilities. The aggregate notional values of forwards and futures contracts are not recorded in the Statements of Assets and Liabilities, and therefore are not included in the Funds’ net assets.
5. Purchases and Sales of Securities. For the year ended September 30, 2013, purchases and sales of securities (excluding short-term investments and including paydowns) were as follows:
| | | | | | | | | | | | | | | | |
| | | U.S. Government/
Agency Securities | | | Other Securities | |
Fund | | Purchases | | | Sales | | | Purchases | | | Sales | |
Core Plus Bond Fund | | $ | 774,038,966 | | | $ | 904,148,417 | | | $ | 900,757,676 | | | $ | 736,531,783 | |
High Income Fund | | | 2,248,929 | | | | 8,271,472 | | | | 91,838,487 | | | | 127,974,815 | |
International Bond Fund | | | 2,061,085 | | | | 2,076,468 | | | | 16,368,287 | | | | 19,566,636 | |
Limited Term Government and Agency Fund | | | 141,528,552 | | | | 160,040,072 | | | | 209,196,017 | | | | 96,777,820 | |
103 |
Notes to Financial Statements (continued)
September 30, 2013
6. Management Fees and Other Transactions with Affiliates.
a. Management Fees. Loomis, Sayles & Company, L.P. (“Loomis Sayles”) serves as investment adviser to each Fund. Under the terms of the management agreements, each Fund pays a management fee at the following annual rates, calculated daily and payable monthly, based on each Fund’s average daily net assets:
| | | | | | | | | | | | | | | | |
| | | Percentage of Average Daily Net Assets | |
Fund | | First $100 million | | | Next $400 million | | | Next $1.5 billion | | | Over $2 billion | |
Core Plus Bond Fund | | | 0.2000 | % | | | 0.1875 | % | | | 0.1875 | % | | | 0.1500 | % |
High Income Fund | | | 0.6000 | % | | | 0.6000 | % | | | 0.6000 | % | | | 0.6000 | % |
International Bond Fund | | | 0.6000 | % | | | 0.6000 | % | | | 0.6000 | % | | | 0.6000 | % |
Limited Term Government and Agency Fund | | | 0.3750 | % | | | 0.3750 | % | | | 0.3500 | % | | | 0.3000 | % |
NGAM Advisors, L.P. (“NGAM Advisors”) serves as the advisory administrator to Core Plus Bond Fund. Under the terms of the advisory administration agreement, the Fund pays an advisory administration fee at the following annual rates, calculated daily and payable monthly, based on its average daily net assets:
| | | | | | | | | | | | |
| | | Percentage of Average Daily Net Assets | |
Fund | | First
$100 million | | | Next
$1.9 billion | | | Over
$2 billion | |
Core Plus Bond Fund | | | 0.2000 | % | | | 0.1875 | % | | | 0.1500 | % |
Prior to July 1, 2013, Core Plus Bond Fund and Limited Term Government and Agency Fund paid a management fee at the following annual rates, calculated daily and payable monthly, based on each Fund’s average daily net assets:
| | | | | | | | | | | | |
| | | Percentage of Average Daily Net Assets | |
Fund | | First
$100 million | | | Next
$150 million | | | Over
$250 million | |
Core Plus Bond Fund | | | 0.2500 | % | | | 0.1875 | % | | | 0.1875 | % |
Limited Term Government and Agency Fund | | | 0.5000 | % | | | 0.5000 | % | | | 0.4000 | % |
Prior to July 1, 2013, Core Plus Bond Fund paid an advisory administration fee at the following annual rates calculated daily and payable monthly, based on its average daily net assets:
| | | | | | | | |
| | | Percentage of Average Daily Net Assets | |
Fund | | First
$100 million | | | Over
$100 million | |
Core Plus Bond Fund | | | 0.2500 | % | | | 0.1875 | % |
| 104
Notes to Financial Statements (continued)
September 30, 2013
Management and advisory administration fees are presented in the Statements of Operations as management fees.
Loomis Sayles has given binding undertakings to the Funds to waive management fees and/or reimburse certain expenses to limit the Funds’ operating expenses, exclusive of acquired fund fees and expenses, brokerage expenses, interest expense, taxes and extraordinary expenses. These undertakings are in effect until January 31, 2014 and are reevaluated on an annual basis. Management fees payable, as reflected on the Statements of Assets and Liabilities, is net of waivers and/or expense reimbursements, if any, pursuant to these undertakings. Waivers/reimbursements that exceed management fees payable are reflected on the Statements of Assets and Liabilities as receivable from investment adviser.
For the period from July 1, 2013 to September 30, 2013, the expense limits as a percentage of average daily net assets under the expense limitation agreements were as follows:
| | | | | | | | | | | | | | | | | | | | |
| | | Expense Limit as a Percentage of
Average Daily Net Assets | |
Fund | | Class A | | | Class B | | | Class C | | | Class N | | | Class Y | |
Core Plus Bond Fund | | | 0.80 | % | | | 1.55 | % | | | 1.55 | % | | | 0.50 | % | | | 0.55 | % |
High Income Fund | | | 1.15 | % | | | 1.90 | % | | | 1.90 | % | | | — | | | | 0.90 | % |
International Bond Fund | | | 1.05 | % | | | — | | | | 1.80 | % | | | — | | | | 0.80 | % |
Limited Term Government and Agency Fund | | | 0.80 | % | | | 1.55 | % | | | 1.55 | % | | | — | | | | 0.55 | % |
Prior to July 1, 2013, the expense limits as a percentage of average daily net assets under the expense limitation agreements were as follows:
| | | | | | | | | | | | | | | | | | | | |
| | | Expense Limit as a Percentage of
Average Daily Net Assets | |
Fund | | Class A | | | Class B | | | Class C | | | Class N | | | Class Y | |
Core Plus Bond Fund | | | 0.90 | % | | | 1.65 | % | | | 1.65 | % | | | 0.60 | % | | | 0.65 | % |
Limited Term Government and Agency Fund | | | 0.85 | % | | | 1.60 | % | | | 1.60 | % | | | — | | | | 0.60 | % |
Loomis Sayles and NGAM Advisors have agreed to equally bear the waivers and/or expense reimbursements for Core Plus Bond Fund.
Loomis Sayles (and NGAM Advisors for Core Plus Bond Fund) shall be permitted to recover expenses borne under the expense limitation agreements (whether through waiver of its management fees or otherwise) on a class by class basis in later periods to the extent the annual operating expenses of a class fall below a class’ expense limits, provided, however, that a class is not obligated to pay such waived/reimbursed
105 |
Notes to Financial Statements (continued)
September 30, 2013
fees or expenses more than one year after the end of the fiscal year in which the fees or expenses were waived/reimbursed.
For the year ended September 30, 2013, the management fees and waivers of management fees for each Fund were as follows:
| | | | | | | | | | | | | | | | | | | | |
| | | Gross
Management
Fees | | | Waivers of
Management
Fees1 | | | Net
Management
Fees | | | Percentage of
Average
Daily Net Assets | |
Fund | | | | | Gross | | | Net | |
Core Plus Bond Fund | | $ | 2,999,019 | | | $ | — | | | $ | 2,999,019 | | | | 0.191 | % | | | 0.191 | % |
High Income Fund | | | 1,291,330 | | | | — | | | | 1,291,330 | | | | 0.600 | % | | | 0.600 | % |
International Bond Fund | | | 108,272 | | | | 108,272 | | | | — | | | | 0.600 | % | | | — | |
Limited Term Government and Agency Fund | | | 2,916,904 | | | | 19 | | | | 2,916,885 | | | | 0.419 | % | | | 0.419 | % |
| 1 | Management fee waivers are subject to possible recovery until September 30, 2014. |
For the year ended September 30, 2013, the advisory administration fees for Core Plus Bond Fund were as follows:
| | | | |
Advisory Administration Fee | | Percentage of Average
Daily Net Assets | |
$ 2,999,019 | | | 0.191 | % |
For the year ended September 30, 2013, expenses have been reimbursed as follows:
| | | | |
Fund | | Reimbursement2 | |
Core Plus Bond Fund | | $ | 8,278 | |
International Bond Fund | | | 51,156 | |
| 2 | Expense reimbursements are subject to possible recovery until September 30, 2014. |
For the year ended September 30, 2013, expense reimbursements related to the prior fiscal year were recovered as follows:
| | | | |
Fund | | Recovered
Expenses | |
High Income Fund | | $ | 24,894 | |
Limited Term Government and Agency Fund | | | 14,643 | |
| 106
Notes to Financial Statements (continued)
September 30, 2013
Certain officers and employees of Loomis Sayles are also officers or Trustees of the Trust. Loomis Sayles’ general partner is indirectly owned by Natixis Global Asset Management, L.P. (“Natixis US”), which is part of Natixis Global Asset Management, an international asset management group based in Paris, France.
b. Service and Distribution Fees. NGAM Distribution, L.P. (“NGAM Distribution”), which is a wholly-owned subsidiary of Natixis US, has entered into a distribution agreement with the Trusts. Pursuant to this agreement, NGAM Distribution serves as principal underwriter of the Funds of the Trusts.
Pursuant to Rule 12b-1 under the 1940 Act, the Trusts have adopted a Service Plan relating to each Fund’s Class A shares (the “Class A Plans”), and a Distribution and Service Plan relating to each Fund’s Class B (if applicable) and Class C shares (the “Class B and Class C Plans”).
Under the Class A Plans, each Fund pays NGAM Distribution a monthly service fee at an annual rate not to exceed 0.25% of the average daily net assets attributable to the Funds’ Class A shares, as reimbursement for expenses incurred by NGAM Distribution in providing personal services to investors in Class A shares and/or the maintenance of shareholder accounts.
Under the Class B (if applicable) and Class C Plans, each Fund pays NGAM Distribution a monthly service fee at an annual rate not to exceed 0.25% of the average daily net assets attributable to the Funds’ Class B (if applicable) and Class C shares, as compensation for services provided by NGAM Distribution in providing personal services to investors in Class B (if applicable) and Class C shares and/or the maintenance of shareholder accounts.
Also under the Class B (if applicable) and Class C Plans, each Fund pays NGAM Distribution a monthly distribution fee at the annual rate of 0.75% of the average daily net assets attributable to the Funds’ Class B (if applicable) and Class C shares, as compensation for services provided by NGAM Distribution in connection with the marketing or sale of Class B (if applicable) and Class C shares.
For the year ended September 30, 2013, the service and distribution fees for each Fund were as follows:
| | | | | | | | | | | | | | | | | | | | |
| | | Service Fees | | | Distribution Fees | |
Fund | | Class A | | | Class B | | | Class C | | | Class B | | | Class C | |
Core Plus Bond Fund | | $ | 1,332,309 | | | $ | 4,382 | | | $ | 725,754 | | | $ | 13,144 | | | $ | 2,177,262 | |
High Income Fund | | | 175,735 | | | | 1,238 | | | | 41,369 | | | | 3,713 | | | | 124,108 | |
International Bond Fund | | | 27,324 | | | | — | | | | 10,060 | | | | — | | | | 30,182 | |
Limited Term Government and Agency Fund | | | 924,843 | | | | 18,265 | | | | 193,327 | | | | 54,795 | | | | 579,980 | |
107 |
Notes to Financial Statements (continued)
September 30, 2013
c. Administrative Fees. NGAM Advisors provides certain administrative services for the Funds and contracts with State Street Bank to serve as sub-administrator. NGAM Advisors is a wholly-owned subsidiary of Natixis US. Pursuant to an agreement among Natixis Funds Trust I, Natixis Funds Trust II, Natixis Funds Trust IV, Gateway Trust (“Natixis Funds Trusts”), Loomis Sayles Funds I, Loomis Sayles Funds II (“Loomis Sayles Funds Trusts”), Hansberger International Series and NGAM Advisors, each Fund pays NGAM Advisors monthly its pro rata portion of fees equal to an annual rate of 0.0575% of the first $15 billion of the average daily net assets of the Natixis Funds Trusts, Loomis Sayles Funds Trusts and Hansberger International Series, 0.0500% of the next $15 billion, 0.0400% of the next $30 billion and 0.0350% of such assets in excess of $60 billion, subject to an annual aggregate minimum fee for the Natixis Funds Trusts, Loomis Sayles Funds Trusts and Hansberger International Series of $10 million, which is reevaluated on an annual basis.
For the year ended September 30, 2013, the administrative fees for each Fund were as follows:
| | | | |
Fund | | Administrative
Fees | |
Core Plus Bond Fund | | $ | 695,722 | |
High Income Fund | | | 95,200 | |
International Bond Fund | | | 7,984 | |
Limited Term Government and Agency Fund | | | 307,970 | |
d. Sub-Transfer Agent Fees. NGAM Distribution has entered into agreements, which include servicing agreements, with financial intermediaries that provide recordkeeping, processing, shareholder communications and other services to customers of the intermediaries that hold positions in the Funds and has agreed to compensate the intermediaries for providing those services. Intermediaries transact with the Funds primarily through the use of omnibus accounts on behalf of their customers who hold positions in the Funds. These services would have been provided by the Funds’ transfer agent and other service providers if the shareholders’ accounts were maintained directly at the Funds’ transfer agent. Accordingly, the Funds have agreed to reimburse NGAM Distribution for all or a portion of the servicing fees paid to these intermediaries. The reimbursement amounts (sub-transfer agent fees) paid to NGAM Distribution are subject to a current per-account equivalent fee limit approved by the Funds’ Board, which is based on fees for similar services paid to the Funds’ transfer agent and other service providers. Class N shares do not bear such expenses.
| 108
Notes to Financial Statements (continued)
September 30, 2013
For the year ended September 30, 2013, the sub-transfer agent fees (which are reflected in transfer agent fees and expenses in the Statements of Operations) for each Fund were as follows:
| | | | |
Fund | | Sub-Transfer
Agent Fees | |
Core Plus Bond Fund | | $ | 1,111,873 | |
High Income Fund | | | 184,093 | |
International Bond Fund | | | 14,349 | |
Limited Term Government and Agency Fund | | | 265,038 | |
As of September 30, 2013, the Funds owe NGAM Distribution the following reimbursements for sub-transfer agent fees:
| | | | |
Fund | | Reimbursements
of Sub-Transfer
Agent Fees | |
Core Plus Bond Fund | | $ | 14,206 | |
High Income Fund | | | 2,510 | |
International Bond Fund | | | 158 | |
Limited Term Government and Agency Fund | | | 3,740 | |
Sub-transfer agent fees attributable to Class A, Class B, Class C and Class Y are allocated on a pro rata basis to each class based on the relative net assets of each class to the total net assets of those classes.
e. Commissions. Commissions (including CDSCs) on Fund shares retained by NGAM Distribution during the year ended September 30, 2013 were as follows:
| | | | |
Fund | | Commissions | |
Core Plus Bond Fund | | $ | 818,877 | |
High Income Fund | | | 154,433 | |
International Bond Fund | | | 5,540 | |
Limited Term Government and Agency Fund | | | 307,788 | |
f. Trustees Fees and Expenses. The Trusts do not pay any compensation directly to their officers or Trustees who are directors, officers or employees of NGAM Advisors, NGAM Distribution, Natixis US or their affiliates. Effective January 1, 2013, the Chairperson of the Board receives a retainer fee at the annual rate of $285,000. The Chairperson does not receive any meeting attendance fees for Board of Trustees meetings or committee meetings that she attends. Each Independent Trustee (other than the Chairperson) receives, in the aggregate, a retainer fee at the annual rate of $115,000. Each Independent Trustee also receives a meeting attendance fee of $10,000 for each meeting of the Board of Trustees that he or she attends in person and $5,000
109 |
Notes to Financial Statements (continued)
September 30, 2013
for each meeting of the Board of Trustees that he or she attends telephonically. In addition, each committee chairman receives an additional retainer fee at an annual rate of $17,500. Each Contract Review and Governance Committee member is compensated $6,000 for each Committee meeting that he or she attends in person and $3,000 for each meeting that he or she attends telephonically. Each Audit Committee member is compensated $6,000 for each Committee meeting that he or she attends in person and $3,000 for each meeting that he or she attends telephonically. These fees are allocated among the funds in the Natixis Funds Trusts, Loomis Sayles Funds Trusts and Hansberger International Series based on a formula that takes into account, among other factors, the relative net assets of each fund. Trustees are reimbursed for travel expenses in connection with attendance at meetings.
Prior to January 1, 2013, the Chairperson of the Board received a retainer fee at the annual rate of $265,000 and each Independent Trustee (other than the Chairperson) received, in aggregate, a retainer fee at the annual rate of $95,000. In addition, each committee chairman received an additional retainer fee at an annual rate of $15,000, and each Audit Committee member was compensated $7,500 for each Committee meeting that he or she attended in person and $3,750 for each meeting that he or she attended telephonically.
A deferred compensation plan (the “Plan”) is available to the Trustees on a voluntary basis. Deferred amounts remain in the Funds until distributed in accordance with the provisions of the Plan. The value of a participating Trustee’s deferral account is based on theoretical investments of deferred amounts, on the normal payment dates, in certain funds of the Natixis Funds Trusts, Loomis Sayles Funds Trusts and Hansberger International Series as designated by the participating Trustees. Changes in the value of participants’ deferral accounts are allocated pro rata among the funds in the Natixis Funds Trusts, Loomis Sayles Funds Trusts, and Hansberger International Series, and are normally reflected as Trustees’ fees and expenses in the Statements of Operations. The portions of the accrued obligations allocated to the Funds under the Plan are reflected as Deferred Trustees’ fees in the Statements of Assets and Liabilities.
g. Affiliated Ownership. At September 30, 2013, Loomis Sayles Employees’ Profit Sharing Retirement Plan (“Retirement Plan”) held shares of the Funds representing the following percentages of net assets:
| | | | |
Fund | | Retirement
Plan | |
Core Plus Bond Fund | | | 0.14 | % |
International Bond Fund | | | 1.45 | % |
Limited Term Government and Agency Fund | | | 0.10 | % |
Investment activities of affiliated shareholders could have material impacts on the Funds.
| 110
Notes to Financial Statements (continued)
September 30, 2013
7. Class-Specific Transfer Agent Fees and Expenses. For the period from February 1, 2013 through September 30, 2013, Core Plus Bond Fund incurred the following class-specific transfer agent fees and expenses:
| | | | |
| | | Class N | |
Transfer Agent Fees and Expenses | | $ | 29 | |
Transfer agent fees and expenses attributable to Class A, Class B, Class C and Class Y are allocated on a pro rata basis to each class based on the relative net assets of each class to the total net assets of those classes.
8. Line of Credit. Each Fund, together with certain other funds of Natixis Funds Trusts, Loomis Sayles Funds Trusts and Hansberger International Series, participates in a $200,000,000 committed unsecured line of credit provided by State Street Bank, with an individual limit of $125,000,000 for each fund that participates in the line of credit. Interest is charged to each participating fund based on its borrowings at a rate per annum equal to the greater of the Federal Funds rate or overnight LIBOR, plus 1.25%. In addition, a commitment fee of 0.10% per annum, payable at the end of each calendar quarter, is accrued and apportioned among the participating funds based on their average daily unused portion of the line of credit.
For the year ended September 30, 2013, none of the Funds had borrowings under these agreements.
9. Concentration of Risk. International Bond Fund is a non-diversified fund. Compared with diversified mutual funds, International Bond Fund may invest a greater percentage of its assets in a particular country. Therefore, International Bond Fund’s returns could be significantly affected by the performance of any one of the small number of countries in its portfolio.
Limited Term Government and Agency Fund’s investments in mortgage-related and asset-backed securities are subject to certain risks not associated with investments in other securities. Mortgage-related and asset-backed securities are subject to the risk that unexpected changes in interest rates will have a direct effect on expected maturity. A shortened maturity may result in the reinvestment of prepaid amounts in securities with lower yields than the original obligations. An extended maturity may result in a reduction of a security’s value.
Each Fund’s investments in foreign securities are subject to foreign currency fluctuations, higher volatility than U.S. securities, varying degrees of regulation and limited liquidity. Greater political, economic, credit and information risks are also associated with foreign securities.
10. Corporate Tax Expense. Loomis Sayles Limited Term Government and Agency Fund paid federal corporate income taxes in the amount of $224,327 on undistributed net long-term capital gains as of September 30, 2012.
111 |
Notes to Financial Statements (continued)
September 30, 2013
11. Concentration of Ownership. From time to time, a Fund may have a concentration of one or more accounts constituting a significant percentage of shares outstanding. Investment activities by holders of such accounts could have material impacts on the Funds. As of September 30, 2013, based on management’s evaluation of the shareholder account base, the Funds had accounts representing controlling ownership of more than 5% of the Fund’s total outstanding shares. The number of such accounts, based on accounts that represent more than 5% of an individual class of shares, and the aggregate percentage of net assets represented by such holdings was as follows:
| | | | | | | | | | | | | | | | |
Fund | | Number of >5%
Non-Affiliated
Account
Holders | | | Percentage of
Non-Affiliated
Ownership | | | Percentage of
Affiliated
Ownership
(Note 6) | | | Total
Percentage of
Ownership | |
Core Plus Bond Fund | | | — | | | | — | | | | 0.14 | % | | | 0.14 | % |
High Income Fund | | | 1 | | | | 8.53 | % | | | 0.00 | % | | | 8.53 | % |
International Bond Fund | | | 1 | | | | 12.71 | % | | | 1.45 | % | | | 14.16 | % |
Limited Term Government and Agency Fund | | | 1 | | | | 6.20 | % | | | 0.10 | % | | | 6.30 | % |
Omnibus shareholder accounts for which NGAM Advisors understands that the intermediary has discretion over the underlying shareholder accounts are included in the table above. For other omnibus accounts, the Fund does not have information on the individual shareholder accounts underlying omnibus accounts; therefore, there could be other 5% shareholders in addition to those disclosed in the table above.
| 112
Notes to Financial Statements (continued)
September 30, 2013
12. Capital Shares. Each Fund may issue an unlimited number of shares of beneficial interest, without par value. Transactions in capital shares were as follows:
| | | | | | | | | | | | | | | | |
| |
| Year Ended
September 30, 2013 |
| |
| Year Ended
September 30, 2012 |
|
Core Plus Bond Fund | | | Shares | | | | Amount | | | | Shares | | | | Amount | |
| Class A | | | | | | | | | | | | | | | | |
Issued from the sale of shares | | | 23,400,679 | | | $ | 312,055,029 | | | | 27,370,858 | | | $ | 355,172,674 | |
Issued in connection with the reinvestment of distributions | | | 1,815,759 | | | | 23,994,065 | | | | 1,087,023 | | | | 14,031,796 | |
Redeemed | | | (26,393,734 | ) | | | (344,871,782 | ) | | | (11,683,801 | ) | | | (151,134,746 | ) |
| | | | | | | | | | | | | | | | |
Net change | | | (1,177,296 | ) | | $ | (8,822,688 | ) | | | 16,774,080 | | | $ | 218,069,724 | |
| | | | | | | | | | | | | | | | |
| Class B | | | | | | | | | | | | | | | | |
Issued from the sale of shares | | | 3,363 | | | $ | 45,726 | | | | 18,163 | | | $ | 232,753 | |
Issued in connection with the reinvestment of distributions | | | 5,269 | | | | 70,185 | | | | 8,025 | | | | 103,306 | |
Redeemed | | | (92,007 | ) | | | (1,231,008 | ) | | | (92,873 | ) | | | (1,209,379 | ) |
| | | | | | | | | | | | | | | | |
Net change | | | (83,375 | ) | | $ | (1,115,097 | ) | | | (66,685 | ) | | $ | (873,320 | ) |
| | | | | | | | | | | | | | | | |
| Class C | | | | | | | | | | | | | | | | |
Issued from the sale of shares | | | 8,354,865 | | | $ | 111,674,557 | | | | 11,681,836 | | | $ | 152,094,275 | |
Issued in connection with the reinvestment of distributions | | | 591,854 | | | | 7,828,050 | | | | 326,978 | | | | 4,220,534 | |
Redeemed | | | (11,061,448 | ) | | | (144,010,707 | ) | | | (2,493,106 | ) | | | (32,473,101 | ) |
| | | | | | | | | | | | | | | | |
Net change | | | (2,114,729 | ) | | $ | (24,508,100 | ) | | | 9,515,708 | | | $ | 123,841,708 | |
| | | | | | | | | | | | | | | | |
| Class N* | | | | | | | | | | | | | | | | |
Issued from the sale of shares | | | 1,567,247 | | | $ | 19,814,495 | | | | — | | | $ | — | |
Issued in connection with the reinvestment of distributions | | | 10,969 | | | | 139,775 | | | | — | | | | — | |
Redeemed | | | (75,008 | ) | | | (954,522 | ) | | | — | | | | — | |
| | | | | | | | | | | | | | | | |
Net change | | | 1,503,208 | | | $ | 18,999,748 | | | | — | | | $ | — | |
| | | | | | | | | | | | | | | | |
| Class Y | | | | | | | | | | | | | | | | |
Issued from the sale of shares | | | 45,112,822 | | | $ | 603,948,919 | | | | 44,233,390 | | | $ | 579,833,966 | |
Issued in connection with the reinvestment of distributions | | | 2,320,259 | | | | 30,841,104 | | | | 884,004 | | | | 11,568,457 | |
Redeemed | | | (45,057,119 | ) | | | (590,589,192 | ) | | | (9,666,030 | ) | | | (127,951,720 | ) |
| | | | | | | | | | | | | | | | |
Net change | | | 2,375,962 | | | $ | 44,200,831 | | | | 35,451,364 | | | $ | 463,450,703 | |
| | | | | | | | | | | | | | | | |
Increase (decrease) from capital share transactions | | | 503,770 | | | $ | 28,754,694 | | | | 61,674,467 | | | $ | 804,488,815 | |
| | | | | | | | | | | | | | | | |
| * | From commencement of Class operations on February 1, 2013 through September 30, 2013. |
113 |
Notes to Financial Statements (continued)
September 30, 2013
12. Capital Shares (continued).
| | | | | | | | | | | | | | | | |
| |
| Year Ended
September 30, 2013 |
| |
| Year Ended
September 30, 2012 |
|
High Income Fund | | | Shares | | | | Amount | | | | Shares | | | | Amount | |
| Class A | | | | | | | | | | | | | | | | |
Issued from the sale of shares | | | 4,989,606 | | | $ | 23,721,653 | | | | 21,107,989 | | | $ | 93,628,788 | |
Issued in connection with the reinvestment of distributions | | | 812,256 | | | | 3,817,055 | | | | 2,189,836 | | | | 9,162,829 | |
Redeemed | | | (16,692,970 | ) | | | (78,579,586 | ) | | | (15,882,475 | ) | | | (70,067,314 | ) |
| | | | | | | | | | | | | | | | |
Net change | | | (10,891,108 | ) | | $ | (51,040,878 | ) | | | 7,415,350 | | | $ | 32,724,303 | |
| | | | | | | | | | | | | | | | |
| Class B | | | | | | | | | | | | | | | | |
Issued from the sale of shares | | | 11,352 | | | $ | 52,895 | | | | 5,673 | | | $ | 24,777 | |
Issued in connection with the reinvestment of distributions | | | 4,586 | | | | 21,581 | | | | 19,672 | | | | 81,687 | |
Redeemed | | | (53,925 | ) | | | (252,094 | ) | | | (68,910 | ) | | | (305,756 | ) |
| | | | | | | | | | | | | | | | |
Net change | | | (37,987 | ) | | $ | (177,618 | ) | | | (43,565 | ) | | $ | (199,292 | ) |
| | | | | | | | | | | | | | | | |
| Class C | | | | | | | | | | | | | | | | |
Issued from the sale of shares | | | 702,239 | | | $ | 3,347,581 | | | | 805,879 | | | $ | 3,533,514 | |
Issued in connection with the reinvestment of distributions | | | 150,549 | | | | 707,094 | | | | 421,300 | | | | 1,752,724 | |
Redeemed | | | (1,205,196 | ) | | | (5,689,434 | ) | | | (1,101,851 | ) | | | (4,859,465 | ) |
| | | | | | | | | | | | | | | | |
Net change | | | (352,408 | ) | | $ | (1,634,759 | ) | | | 125,328 | | | $ | 426,773 | |
| | | | | | | | | | | | | | | | |
| Class Y | | | | | | | | | | | | | | | | |
Issued from the sale of shares | | | 17,170,028 | | | $ | 80,940,800 | | | | 27,436,571 | | | $ | 123,173,948 | |
Issued in connection with the reinvestment of distributions | | | 1,311,917 | | | | 6,160,472 | | | | 1,416,350 | | | | 5,940,281 | |
Redeemed | | | (19,061,214 | ) | | | (90,332,449 | ) | | | (13,232,329 | ) | | | (58,722,847 | ) |
| | | | | | | | | | | | | | | | |
Net change | | | (579,269 | ) | | $ | (3,231,177 | ) | | | 15,620,592 | | | $ | 70,391,382 | |
| | | | | | | | | | | | | | | | |
Increase (decrease) from capital share transactions | | | (11,860,772 | ) | | $ | (56,084,432 | ) | | | 23,117,705 | | | $ | 103,343,166 | |
| | | | | | | | | | | | | | | | |
| 114
Notes to Financial Statements (continued)
September 30, 2013
12. Capital Shares (continued).
| | | | | | | | | | | | | | | | |
| |
| Year Ended
September 30, 2013 |
| |
| Year Ended
September 30, 2012 |
|
International Bond Fund | | | Shares | | | | Amount | | | | Shares | | | | Amount | |
| Class A | | | | | | | | | | | | | | | | |
Issued from the sale of shares | | | 418,554 | | | $ | 4,190,166 | | | | 550,775 | | | $ | 5,589,441 | |
Issued in connection with the reinvestment of distributions | | | 31,172 | | | | 316,920 | | | | 89,124 | | | | 883,291 | |
Redeemed | | | (673,797 | ) | | | (6,649,849 | ) | | | (499,605 | ) | | | (5,230,159 | ) |
| | | | | | | | | | | | | | | | |
Net change | | | (224,071 | ) | | $ | (2,142,763 | ) | | | 140,294 | | | $ | 1,242,573 | |
| | | | | | | | | | | | | | | | |
| Class C | | | | | | | | | | | | | | | | |
Issued from the sale of shares | | | 108,173 | | | $ | 1,088,309 | | | | 119,315 | | | $ | 1,209,211 | |
Issued in connection with the reinvestment of distributions | | | 9,072 | | | | 91,839 | | | | 46,134 | | | | 453,165 | |
Redeemed | | | (194,937 | ) | | | (1,913,707 | ) | | | (435,796 | ) | | | (4,443,773 | ) |
| | | | | | | | | | | | | | | | |
Net change | | | (77,692 | ) | | $ | (733,559 | ) | | | (270,347 | ) | | $ | (2,781,397 | ) |
| | | | | | | | | | | | | | | | |
| Class Y | | | | | | | | | | | | | | | | |
Issued from the sale of shares | | | 152,390 | | | $ | 1,539,901 | | | | 611,695 | | | $ | 6,195,469 | |
Issued in connection with the reinvestment of distributions | | | 5,073 | | | | 51,430 | | | | 19,724 | | | | 195,522 | |
Redeemed | | | (205,113 | ) | | | (2,022,661 | ) | | | (854,117 | ) | | | (8,765,676 | ) |
| | | | | | | | | | | | | | | | |
Net change | | | (47,650 | ) | | $ | (431,330 | ) | | | (222,698 | ) | | $ | (2,374,685 | ) |
| | | | | | | | | | | | | | | | |
Increase (decrease) from capital share transactions | | | (349,413 | ) | | $ | (3,307,652 | ) | | | (352,751 | ) | | $ | (3,913,509 | ) |
| | | | | | | | | | | | | | | | |
115 |
Notes to Financial Statements (continued)
September 30, 2013
12. Capital Shares (continued).
| | | | | | | | | | | | | | | | |
| |
| Year Ended
September 30, 2013 |
| |
| Year Ended
September 30, 2012 |
|
Limited Term Government and Agency Fund | | | Shares | | | | Amount | | | | Shares | | | | Amount | |
| Class A | | | | | | | | | | | | | | | | |
Issued from the sale of shares | | | 12,850,713 | | | $ | 153,126,484 | | | | 15,612,122 | | | $ | 186,297,906 | |
Issued in connection with the reinvestment of distributions | | | 561,467 | | | | 6,662,144 | | | | 513,246 | | | | 6,128,335 | |
Redeemed | | | (12,732,399 | ) | | | (151,248,094 | ) | | | (11,137,817 | ) | | | (132,584,098 | ) |
| | | | | | | | | | | | | | | | |
Net change | | | 679,781 | | | $ | 8,540,534 | | | | 4,987,551 | | | $ | 59,842,143 | |
| | | | | | | | | | | | | | | | |
| Class B | | | | | | | | | | | | | | | | |
Issued from the sale of shares | | | 57,224 | | | $ | 682,522 | | | | 67,643 | | | $ | 803,090 | |
Issued in connection with the reinvestment of distributions | | | 8,642 | | | | 102,565 | | | | 12,997 | | | | 154,932 | |
Redeemed | | | (253,623 | ) | | | (3,009,576 | ) | | | (310,167 | ) | | | (3,693,689 | ) |
| | | | | | | | | | | | | | | | |
Net change | | | (187,757 | ) | | $ | (2,224,489 | ) | | | (229,527 | ) | | $ | (2,735,667 | ) |
| | | | | | | | | | | | | | | | |
| Class C | | | | | | | | | | | | | | | | |
Issued from the sale of shares | | | 2,982,402 | | | $ | 35,505,345 | | | | 2,463,981 | | | $ | 29,387,942 | |
Issued in connection with the reinvestment of distributions | | | 58,167 | | | | 690,850 | | | | 59,828 | | | | 714,780 | |
Redeemed | | | (3,153,586 | ) | | | (37,432,038 | ) | | | (2,044,375 | ) | | | (24,403,572 | ) |
| | | | | | | | | | | | | | | | |
Net change | | | (113,017 | ) | | $ | (1,235,843 | ) | | | 479,434 | | | $ | 5,699,150 | |
| | | | | | | | | | | | | | | | |
| Class Y | | | | | | | | | | | | | | | | |
Issued from the sale of shares | | | 19,772,954 | | | $ | 235,387,316 | | | | 19,006,051 | | | $ | 227,577,207 | |
Issued in connection with the reinvestment of distributions | | | 321,692 | | | | 3,829,024 | | | | 205,462 | | | | 2,463,226 | |
Redeemed | | | (16,833,635 | ) | | | (200,317,847 | ) | | | (11,948,359 | ) | | | (142,880,346 | ) |
| | | | | | | | | | | | | | | | |
Net change | | | 3,261,011 | | | $ | 38,898,493 | | | | 7,263,154 | | | $ | 87,160,087 | |
| | | | | | | | | | | | | | | | |
Increase (decrease) from capital share transactions | | | 3,640,018 | | | $ | 43,978,695 | | | | 12,500,612 | | | $ | 149,965,713 | |
| | | | | | | | | | | | | | | | |
| 116
Report of Independent Registered Public Accounting Firm
To the Trustees of Natixis Funds Trust I and Loomis Sayles Funds II and Shareholders of Loomis Sayles Core Plus Bond Fund, Loomis Sayles High Income Fund, Loomis Sayles International Bond Fund, and Loomis Sayles Limited Term Government and Agency Fund:
In our opinion, the accompanying statements of assets and liabilities, including the portfolios of investments, and the related statements of operations and of changes in net assets and the financial highlights present fairly, in all material respects, the financial position of Loomis Sayles Core Plus Bond Fund, a series of Natixis Funds Trust I, and Loomis Sayles High Income Fund, Loomis Sayles International Bond Fund and Loomis Sayles Limited Term Government and Agency Fund, each a series of Loomis Sayles Funds II (collectively, the “Funds”), at September 30, 2013 and the results of each of their operations, the changes in each of their net assets and the financial highlights for each of the periods indicated, in conformity with accounting principles generally accepted in the United States of America. These financial statements and financial highlights (hereafter referred to as “financial statements”) are the responsibility of the Funds’ management; our responsibility is to express an opinion on these financial statements based on our audits. We conducted our audits of these financial statements in accordance with the standards of the Public Company Accounting Oversight Board (United States). Those standards require that we plan and perform the audits to obtain reasonable assurance about whether the financial statements are free of material misstatement. An audit includes examining, on a test basis, evidence supporting the amounts and disclosures in the financial statements, assessing the accounting principles used and significant estimates made by management, and evaluating the overall financial statement presentation. We believe that our audits, which included confirmation of securities at September 30, 2013 by correspondence with the custodian and brokers, provide a reasonable basis for our opinion.
PricewaterhouseCoopers LLP
Boston, Massachusetts
November 21, 2013
117 |
2013 U.S. Tax Distribution Information to Shareholders (Unaudited)
Corporate Dividends Received Deduction. For the fiscal year ended September 30, 2013, a percentage of dividends distributed by the Funds listed below qualify for the dividends received deduction for corporate shareholders. These percentages are as follows:
| | | | |
Fund | | Qualifying
Percentage | |
Core Plus Bond | | | 0.28 | % |
High income | | | 3.48 | % |
International Bond | | | 0.10 | % |
Capital Gains Distributions. Pursuant to Internal Revenue Section 852(b), the following Funds paid distributions, which have been designated as capital gains distributions for the fiscal year ended September 30, 2013, unless subsequently determined to be different.
| | | | |
Fund | | Amount | |
Core Plus Bond | | $ | 7,677,478 | |
High Income | | | 689,257 | |
International Bond | | | 163,540 | |
Limited Term Government and Agency | | | 234,773 | |
Qualified Dividend Income. For the fiscal year ended September 30, 2013 the Funds below will designate up to the maximum amount allowable pursuant to the Internal Revenue Code as qualified dividend income eligible for reduced tax rates. These lower rates range from 0% to 20% depending on an individual’s tax bracket. If the Funds pay a distribution during calendar year 2013, complete information will be reported in conjunction with Form 1099-DIV.
| | |
Fund | | |
Core Plus Bond | | |
High Income | | |
International Bond | | |
| 118
Trustee and Officer Information
The tables below provide certain information regarding the trustees and officers of Natixis Funds Trust I and Loomis Sayles Funds II (the “Trusts”). Unless otherwise indicated, the address of all persons below is 399 Boylston Street, Boston, MA 02116. The Funds’ Statements of Additional Information include additional information about the trustees of the Trusts and are available by calling Natixis Funds at 800-225-5478.
| | | | | | | | |
Name and Year of
Birth | | Position(s) Held
with the Trusts,
Length of Time
Served and Term
of Office1 | | Principal
Occupation(s)
During Past
5 Years | | Number of
Portfolios in
Fund Complex
Overseen2
and Other
Directorships Held
During Past
5 Years | | Experience,
Qualifications,
Attributes, Skills
for Board
Membership |
| | | |
| INDEPENDENT TRUSTEES | | | | | | |
| | | | |
| Charles D. Baker (1956) | | Trustee From 2005 to 2009 and since 2011 for Natixis Funds Trust I and Loomis Sayles Funds II Contract Review and Governance Committee Member | | Executive in Residence at General Catalyst Partners (venture capital and growth equity firm); formerly, President and Chief Executive Officer, Harvard Pilgrim Health Care (health care organization) | | 42 Director, Athenahealth, Inc. (software company) | | Significant experience on the Board; executive experience (including president and chief executive officer of a health care organization and executive officer of a venture capital and growth equity firm) |
| | | | |
Daniel M. Cain (1945) | | Trustee Since 1996 for Natixis Funds Trust I and since 2003 for Loomis Sayles Funds II Chairman of the Contract Review and Governance Committee | | Chairman (formerly, President and Chief Executive Officer) of Cain Brothers & Company, Incorporated (investment banking) | | 42 Director, Sheridan Healthcare Inc. (physician practice management) | | Significant experience on the Board and on the board of other business organizations (including at a health care organization); experience in the financial industry (including roles as chairman and former chief executive officer of an investment banking firm) |
119 |
Trustee and Officer Information
| | | | | | | | |
Name and Year of
Birth | | Position(s) Held
with the Trusts,
Length of Time
Served and Term
of Office1 | | Principal
Occupation(s)
During Past
5 Years | | Number of
Portfolios in
Fund Complex
Overseen2
and Other
Directorships Held
During Past
5 Years | | Experience,
Qualifications,
Attributes, Skills
for Board
Membership |
| | | |
INDEPENDENT TRUSTEES
continued | | | | | | |
| | | | |
Kenneth A. Drucker (1945) | | Trustee Since 2008 for Natixis Funds Trust I and Loomis Sayles Funds II Chairman of the Audit Committee | | Retired | | 42 Formerly, Director, M Fund, Inc. (investment company); Director, Gateway Trust (investment company) | | Significant experience on the Board and on the board of other business organizations (including at investment companies); executive experience (including as treasurer of an aerospace, automotive, and metal manufacturing corporation) |
| | | | |
| Edmond J. English (1953) | | Trustee Since 2013 for Natixis Funds Trust I and Loomis Sayles Funds II Contract Review and Governance Committee Member | | Chief Executive Officer of Bob’s Discount Furniture (retail) | | 42 Formerly, Director, BJ’s Wholesale Club (retail); formerly, Director, Citizens Financial Group (bank) | | Significant experience on the board of other business organizations (including at a retail company and a bank); executive experience (including at a retail company) |
| 120
Trustee and Officer Information
| | | | | | | | |
Name and Year of
Birth | | Position(s) Held
with the Trusts,
Length of Time
Served and Term
of Office1 | | Principal
Occupation(s)
During Past
5 Years | | Number of
Portfolios in
Fund Complex
Overseen2
and Other
Directorships Held
During Past
5 Years | | Experience,
Qualifications,
Attributes, Skills
for Board
Membership |
| | | |
INDEPENDENT TRUSTEES
continued | | | | | | |
| | | | |
Wendell J. Knox (1948) | | Trustee Since 2009 for Natixis Funds Trust I and Loomis Sayles Funds II Audit Committee Member | | Director (formerly, President and Chief Executive Officer) of Abt Associates Inc. (research and consulting) | | 42 Director, Eastern Bank (bank); Director, The Hanover Insurance Group (property and casualty insurance) | | Significant experience on the Board and on the board of other business organizations (including at a bank and at a property and casualty insurance firm); executive experience (including roles as president and chief executive officer of a research and consulting company) |
| | | | |
| Martin T. Meehan (1956) | | Trustee Since 2012 for Natixis Funds Trust I and Loomis Sayles Funds II Contract Review and Governance Committee Member | | Chancellor and faculty member, University of Massachusetts Lowell | | 42 None | | Experience on the Board and on the board of other business organizations; experience as Chancellor of the University of Massachusetts Lowell; government experience (including as a member of the U.S. House of Representatives); academic experience |
121 |
Trustee and Officer Information
| | | | | | | | |
Name and Year of
Birth | | Position(s) Held
with the Trusts,
Length of Time
Served and Term
of Office1 | | Principal
Occupation(s)
During Past
5 Years | | Number of
Portfolios in
Fund Complex
Overseen2
and Other
Directorships Held
During Past
5 Years | | Experience,
Qualifications,
Attributes, Skills
for Board
Membership |
| | | |
INDEPENDENT TRUSTEES
continued | | | | | | |
| | | | |
Sandra O. Moose (1942) | | Chairperson of the Board of Trustees since November 2005 Trustee Since 1982 for Natixis Funds Trust I (including its predecessors) and since 2003 for Loomis Sayles Funds II Ex officio member of the Audit Committee and Contract Review and Governance Committee | | President, Strategic Advisory Services (management consulting) | | 42 Director, Verizon Communications (telecommunications company); Director, AES Corporation (international power company); formerly, Director, Rohm and Haas Company (specialty chemicals) | | Significant experience on the Board and on the board of other business organizations (including at a telecommunications company, an international power company and a specialty chemicals corporation); executive experience (including at a management consulting company) |
| | | | |
Erik R. Sirri (1958) | | Trustee Since 2009 for Natixis Funds Trust I and Loomis Sayles Funds II Audit Committee Member | | Professor of Finance at Babson College; formerly, Director of the Division of Trading and Markets at the Securities and Exchange Commission | | 42 None | | Significant experience on the Board; experience as Director of the Division of Trading and Markets at the Securities and Exchange Commission; academic experience; training as an economist |
| 122
Trustee and Officer Information
| | | | | | | | |
Name and Year of
Birth | | Position(s) Held
with the Trusts,
Length of Time
Served and Term
of Office1 | | Principal
Occupation(s)
During Past
5 Years | | Number of
Portfolios in
Fund Complex
Overseen2
and Other
Directorships Held
During Past
5 Years | | Experience,
Qualifications,
Attributes, Skills
for Board
Membership |
| | | |
INDEPENDENT TRUSTEES
continued | | | | | | |
| | | | |
Peter J. Smail (1952) | | Trustee Since 2009 for Natixis Funds Trust I and Loomis Sayles Funds II Contract Review and Governance Committee Member | | Retired; formerly, President and Chief Executive Officer of Pyramis Global Advisors (investment management) | | 42 None | | Significant experience on the Board; mutual fund industry and executive experience (including roles as president and chief executive officer for an investment adviser) |
| | | | |
Cynthia L. Walker (1956) | | Trustee Since 2005 for Natixis Funds Trust I and Loomis Sayles Funds II Audit Committee Member | | Deputy Dean for Finance and Administration, Yale University School of Medicine; formerly, Executive Dean for Administration, Harvard Medical School | | 42 None | | Significant experience on the Board; executive experience in a variety of academic organizations (including roles as dean for finance and administration) |
| | | |
| INTERESTED TRUSTEES | | | | | | |
| | | | |
Robert J. Blanding3 (1947) 555 California Street San Francisco, CA 94104 | | Trustee Since 2003 for Natixis Funds Trust I and since 2002 for Loomis Sayles Funds II Chief Executive Officer of Loomis Sayles Funds II since 2002 | | President, Chairman, Director and Chief Executive Officer, Loomis, Sayles & Company, L.P. | | 42 None | | Significant experience on the Board; continuing service as President, Chairman, and Chief Executive Officer of Loomis, Sayles & Company, L.P. |
123 |
Trustee and Officer Information
| | | | | | | | |
Name and Year of
Birth | | Position(s) Held
with the Trusts,
Length of Time
Served and Term
of Office1 | | Principal
Occupation(s)
During Past
5 Years | | Number of
Portfolios in
Fund Complex
Overseen2
and Other
Directorships Held
During Past
5 Years | | Experience,
Qualifications,
Attributes, Skills
for Board
Membership |
| | | |
INTERESTED TRUSTEES
continued | | | | | | |
| | | | |
| David L. Giunta4 (1965) | | Trustee Since 2011 for Natixis Funds Trust I and Loomis Sayles Funds II President and Chief Executive Officer of Natixis Funds Trust I and President of Loomis Sayles Funds II since 2008 | | President and Chief Executive Officer, NGAM Distribution Corporation, NGAM Advisors, L.P. and NGAM Distribution, L.P. | | 42 None | | Experience on the Board; continuing experience as President and Chief Executive Officer of NGAM Advisors, L.P. |
| | | | |
John T. Hailer5 (1960) | | Trustee Since 2000 for Natixis Funds Trust I and since 2003 for Loomis Sayles Funds II | | President and Chief Executive Officer – U.S. and Asia, Natixis Global Asset Management, L.P. | | 42 None | | Significant experience on the Board; continuing experience as President and Chief Executive Officer – U.S. and Asia, Natixis Global Asset Management, L.P. |
| 1 | Each trustee serves until retirement, resignation or removal from the Board. The current retirement age is 72. The position of Chairperson of the Board is appointed for a two-year term. Ms. Moose was appointed to serve an additional two-year term as the Chairperson of the Board on November 18, 2011. |
| 2 | The trustees of the Trusts serve as trustees of a fund complex that includes all series of the Natixis Funds Trust I, Natixis Funds Trust II, Natixis Funds Trust IV and Gateway Trust (collectively, the “Natixis Funds Trusts”), Loomis Sayles Funds I and Loomis Sayles Funds II (collectively, the “Loomis Sayles Funds Trusts”), and Hansberger International Series (collectively, the “Fund Complex”). |
| 3 | Mr. Blanding is deemed an “interested person” of the Trusts because he holds the following positions with an affiliated person of the Trusts: President, Chairman, Director and Chief Executive Officer of Loomis, Sayles & Company, L.P. and Director of Loomis Sayles Investment Asia Pte., Ltd. |
| 4 | Mr. Giunta is deemed an “interested person” of the Trusts because he holds the following positions with an affiliated person of the Trusts: President and Chief Executive Officer of NGAM Distribution Corporation, NGAM Advisors, L.P. and NGAM Distribution, L.P. |
| 5 | Mr. Hailer is deemed an “interested person” of the Trusts because he holds the following positions with an affiliated person of the Trusts: President and Chief Executive Officer – U.S. and Asia, Natixis Global Asset Management, L.P. |
| 124
Trustee and Officer Information
| | | | | | |
Name and Year of Birth | | Position(s) Held
with the Trusts | | Term of Office1 and
Length of Time Served | | Principal Occupation(s)
During Past 5 Years2 |
| | |
| OFFICERS OF THE TRUST | | | | |
| | | |
Coleen Downs Dinneen (1960) | | Secretary, Clerk and Chief Legal Officer | | Since September 2004 | | Executive Vice President, General Counsel, Secretary and Clerk, NGAM Distribution Corporation, NGAM Advisors, L.P. and NGAM Distribution, L.P. |
| | | |
Daniel J. Fuss (1933) One Financial Center Boston, MA 02111 | | Executive Vice President of Loomis Sayles Funds II | | Since June 2003 | | Vice Chairman and Director, Loomis, Sayles & Company, L.P. |
| | | |
Russell L. Kane (1969) | | Chief Compliance Officer, Assistant Secretary and Anti-Money Laundering Officer | | Chief Compliance Officer since May 2006; Assistant Secretary since June 2004; and Anti-Money Laundering Officer since April 2007 | | Chief Compliance Officer for Mutual Funds, Senior Vice President, Deputy General Counsel, Assistant Secretary and Assistant Clerk, NGAM Distribution Corporation, NGAM Advisors, L.P. and NGAM Distribution, L.P. |
| | | |
Michael C. Kardok (1959) | | Treasurer, Principal Financial and Accounting Officer | | Since October 2004 | | Senior Vice President, NGAM Advisors, L.P. and NGAM Distribution, L.P. |
| 1 | Each officer of the Trusts serves for an indefinite term in accordance with the Trusts’ current by-laws until the date his or her successor is elected and qualified, or until he or she sooner dies, retires, is removed or becomes disqualified. |
| 2 | Each person listed above, except as noted, holds the same position(s) with the Fund Complex. Mr. Fuss is not an officer of the Natixis Funds Trusts or the Hansberger International Series. Previous positions during the past five years with NGAM Distribution, L.P., NGAM Advisors, L.P. or Loomis, Sayles & Company, L.P. are omitted, if not materially different from a trustee’s or officer’s current position with such entity. |
125 |
ANNUAL REPORT
September 30, 2013

Loomis Sayles Investment Grade Bond Fund
TABLE OF CONTENTS
Portfolio Review page 1
Portfolio of Investments page 12
Financial Statements page 31
Notes to Financial Statements page 37
LOOMIS SAYLES INVESTMENT GRADE BOND FUND
| | | | |
| Managers | | Symbols | | |
| Matthew J. Eagan, CFA | | Class A | | LIGRX |
| Daniel J. Fuss, CFA, CIC | | Class B | | LGBBX |
Brian P. Kennedy | | Class C | | LGBCX |
Elaine M. Stokes | | Class N | | LGBNX |
Loomis, Sayles & Company, L.P. | | Class Y | | LSIIX |
| | Admin Class | | LIGAX |
Objective
High total investment return through a combination of current income and capital appreciation.
Strategy
Under normal market conditions, the Fund will invest at least 80% of its net assets in investment-grade, fixed-income securities, although it may invest up to 10% of its assets in below investment-grade fixed-income securities and up to 10% of its assets in equity securities (including up to 5% in common stocks). The Fund may also invest any portion of its assets in securities of Canadian issuers and up to 20% of its assets in securities of other foreign issuers, including emerging markets securities.
Market Conditions
The 12-month period ended September 30, 2013 began with investor attention focused on the November 2012 U.S. presidential election. Soon afterward, fears that the U.S. economy would fall off the “fiscal cliff” took center stage, and investors sought to position themselves for the scheduled automatic tax hikes and spending cuts. Ultimately, Congress and the president struck an 11th-hour deal, which helped buoy the markets through the first quarter of 2013. During the second quarter of 2013, the Federal Reserve (the Fed) introduced volatility in the fixed-income markets and tempered investor enthusiasm by indicating a potential winding down of its monthly mortgage and Treasury security purchase program, known as quantitative easing (QE). The magnitude of the resulting selloff and the overall disruption to markets tightened financial conditions significantly. Based on the Fed’s announcement, investors anticipated the Fed would begin tapering QE following the central bank’s September policy meeting. However, the Fed surprised markets and decided to delay the taper while softening its forward guidance. This announcement led to a rally in equities, emerging market currencies and fixed income markets. The 12-month period concluded with renewed uncertainty surrounding Congressional budget and debt ceiling discussions.
1 |
Performance Review
For the 12 months ended September 30, 2013, Class A shares of Loomis Sayles Investment Grade Bond Fund returned 1.34%. The fund outperformed its benchmark, the Barclays U.S. Government/Credit Bond Index, which returned -1.96%.
Explanation of Fund Performance
Security selection among investment-grade corporate credits, particularly within the financials, industrials and utilities areas, and an overweight position in the sector contributed strongly to fund performance. Similarly, an out-of-benchmark allocation to the high-yield sector lifted results, with security selection among financials and industrials leading the way. In addition, the fund’s out-of-benchmark exposure to non-U.S.-dollar-denominated issues, including those issued in the euro, New Zealand dollar, British pound, Icelandic krona and South Korean won, contributed positively to relative performance. The fund’s position in convertible securities, another out-of-benchmark sector, also posted strong returns for the period. Tracking the performance in the equity markets, the fund’s modest preferred/equity allocation posted strong relative results. Additionally, overweight allocations to commercial mortgage-backed securities (CMBS) and asset-backed securities (ABS) aided performance.
Conversely, out-of-benchmark positions denominated in the Canadian dollar, Brazilian real, Indonesian rupiah, Australian dollar, Mexican peso and Norwegian krone weighed on relative performance. The fund’s longer yield curve (a curve that shows the relationship among bond yields across the maturity spectrum) positioning in U.S. Treasuries and agencies detracted as interest rates rose during the period.
Outlook
Our outlook for the U.S. and global economies remains largely consistent despite political and policy uncertainty. We believe U.S. gross domestic product (GDP) growth will move toward 3.0% next year, based on acceleration in the housing sector as well as momentum in autos and energy. However, deflationary pressures remain a concern in the short run as wage growth is slow, unemployment is still high (though slowly improving), and the output gap remains decidedly negative. Due primarily to weak economic growth, we expect the Fed to maintain accommodative monetary policy and to employ a slow, cautious approach to rate increases. Our forecast for the 10-year U.S. Treasury yield is approximately 2.75% at year-end, moving to 3.25% a year from now.
Several key risks may affect our outlook. We expect to see steady, perhaps even increased, volatility during the final quarter of 2013. Investor anxiety regarding upcoming economic releases and their impact on future Fed policy will likely contribute to market turbulence. The U.S. government shutdown and debt ceiling debates will likely occupy the headlines, adding another source of volatility. Europe remains an ongoing concern; however, economic and fiscal conditions appear stable for now.
Based on our long-term views, we have not made material asset allocation changes. Our strategy centers on research-based security selection, with a focus on sectors that can be
| 2
LOOMIS SAYLES INVESTMENT GRADE BOND FUND
uncorrelated with U.S. interest rates, and we continue to build diversification into the fund. We intend to maintain reduced term structure risk and continue to decrease nominal duration through sector and security selection. The fund’s ability to invest in what we view as the best risk-adjusted opportunities across a full range of global markets, sectors and securities may be an advantage as the economic recovery unfolds and the investment landscape evolves.
Growth of $10,000 Investment in Class A Shares4
September 30, 2003 through September 30, 2013
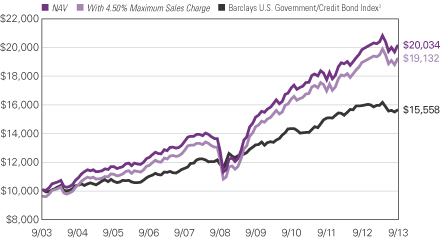
3 |
Average Annual Total Returns — September 30, 20134
| | | | | | | | | | | | | | | | |
| | | | | |
| | | 1 Year | | | 5 Years | | | 10 Years | | | Since
Class N
Inception | |
| | | | | |
| Class A (Inception 12/31/96) | | | | | | | | | | | | | | | | |
| NAV | | | 1.34 | % | | | 9.53 | % | | | 7.20 | % | | | — | % |
| With 4.50% Maximum Sales Charge | | | -3.21 | | | | 8.52 | | | | 6.71 | | | | — | |
| | | | | |
| Class B (Inception 9/12/03) | | | | | | | | | | | | | | | | |
| NAV | | | 0.57 | | | | 8.67 | | | | 6.33 | | | | — | |
| With CDSC2 | | | -4.22 | | | | 8.38 | | | | 6.33 | | | | — | |
| | | | | |
| Class C (Inception 9/12/03) | | | | | | | | | | | | | | | | |
| NAV | | | 0.50 | | | | 8.71 | | | | 6.38 | | | | — | |
| With CDSC2 | | | -0.45 | | | | 8.71 | | | | 6.38 | | | | — | |
| | | | | |
| Class N (Inception 2/1/13) | | | | | | | | | | | | | | | | |
| NAV | | | — | | | | — | | | | — | | | | -0.95 | |
| | | | | |
| Class Y (Inception 12/31/96) | | | | | | | | | | | | | | | | |
| NAV | | | 1.60 | | | | 9.81 | | | | 7.50 | | | | — | |
| | | | | |
| Admin Class (Inception 2/1/10)1 | | | | | | | | | | | | | | | | |
| NAV | | | 1.10 | | | | 9.22 | | | | 6.75 | | | | — | |
| | | | | |
| Comparative Performance | | | | | | | | | | | | | | | | |
| Barclays U.S. Government/Credit Bond Index3 | | | -1.96 | | | | 5.71 | | | | 4.52 | | | | -1.40 | |
Past performance does not guarantee future results. The table(s) do not reflect taxes shareholders might owe on any fund distributions or when they redeem their shares. Performance for periods less than one year is cumulative, not annualized. Returns reflect changes in share price and reinvestment of dividends and capital gains, if any. Unlike a fund, an index is not managed and does not reflect fees and expenses.
NOTES TO CHART
| 1 | Prior to the inception of Admin Class shares (2/1/10), performance is that of Class A shares, restated to reflect the higher net expenses of Admin Class shares. |
| 2 | Performance for Class B shares assumes a maximum 5% contingent deferred sales charge (“CDSC”) applied when you sell shares, which declines annually between years 1-6 according to the following schedule: 5, 4, 3, 3, 2, 1, 0%. Class C shares performance assumes a 1% CDSC applied when you sell shares within one year of purchase. |
| 3 | Barclays U.S. Government/Credit Bond Index is an unmanaged index that includes U.S. Treasuries, government-related issues, and investment grade U.S. corporate securities. |
| 4 | Fund performance has been increased by fee waivers and/or expense reimbursements, if any, without which performance would have been lower. |
| 4
ADDITIONAL INFORMATION
The views expressed in this report reflect those of the portfolio managers as of the dates indicated. The managers’ views are subject to change at any time without notice based on changes in market or other conditions. References to specific securities or industries should not be regarded as investment advice. Because the fund is actively managed, there is no assurance that it will continue to invest in the securities or industries mentioned.
ADDITIONAL INDEX INFORMATION
This document may contain references to third party copyrights, indexes, and trademarks, each of which is the property of its respective owner. Such owner is not affiliated with Natixis Global Asset Management or any of its related or affiliated companies (collectively “NGAM”) and does not sponsor, endorse or participate in the provision of any NGAM services, funds or other financial products.
The index information contained herein is derived from third parties and is provided on an “as is” basis. The user of this information assumes the entire risk of use of this information. Each of the third party entities involved in compiling, computing or creating index information disclaims all warranties (including, without limitation, any warranties of originality, accuracy, completeness, timeliness, non-infringement, merchantability and fitness for a particular purpose) with respect to such information.
PROXY VOTING INFORMATION
A description of the fund’s proxy voting policies and procedures is available without charge, upon request, by calling Natixis Funds at 800-225-5478; on the fund’s website at ngam.natixis.com; and on the Securities and Exchange Commission’s (SEC’s) website at www.sec.gov. Information regarding how the fund voted proxies relating to portfolio securities during the 12-month period ended June 30, 2013 is available from the fund’s website and the SEC’s website.
QUARTERLY PORTFOLIO SCHEDULES
The fund files a complete schedule of portfolio holdings with the SEC for the first and third quarters of each fiscal year on Form N-Q. The fund’s Forms N-Q are available on the SEC’s website at www.sec.gov and may be reviewed and copied at the SEC’s Public Reference Room in Washington, DC. Information on the operation of the Public Reference Room may be obtained by calling 800-SEC-0330.
5 |
UNDERSTANDING YOUR FUND’S EXPENSES
As a mutual fund shareholder, you incur different types of costs: transaction costs, including sales charges (loads) on purchases and contingent deferred sales charges on redemptions; and ongoing costs, including management fees, distribution fees (12b-1 fees) and/or service fees, and other fund expenses. These costs are described in more detail in the fund’s prospectus. The following examples are intended to help you understand the ongoing costs of investing in the fund and help you compare these with the ongoing costs of investing in other mutual funds.
The first line in the table for each class shows the actual amount of fund expenses you would have paid on a $1,000 investment in the fund from April 1, 2013 through September 30, 2013. It also shows how much a $1,000 investment would be worth at the close of the period, assuming actual fund returns and expenses. To estimate the expenses you paid over the period, simply divide your account value by $1,000 (for example $8,600 account value divided by $1,000 = 8.60) and multiply the result by the number in the Expenses Paid During Period row as shown below for your class.
The second line in the table for each class provides information about hypothetical account values and hypothetical expenses based on the fund’s actual expense ratios and an assumed rate of return of 5% per year before expenses, which is not the fund’s actual return. The hypothetical account values and expenses may not be used to estimate the actual ending account balance or expenses you paid on your investment for the period. You may use this information to compare the ongoing costs of investing in the fund and other funds. To do so, compare this 5% hypothetical example with the 5% hypothetical examples that appear in the shareholder reports of the other funds.
Please note that the expenses shown reflect ongoing costs only, and do not include any transaction costs. Therefore, the second line in the table of the fund is useful in comparing ongoing costs only, and will not help you determine the relative costs of owning different funds. If transaction costs were included, total costs would be higher.
| 6
| | | | | | | | | | | | |
LOOMIS SAYLES INVESTMENT GRADE
BOND FUND | | BEGINNING
ACCOUNT VALUE
4/1/2013 | | | ENDING
ACCOUNT VALUE
9/30/2013 | | | EXPENSES PAID
DURING PERIOD*
4/1/2013 – 9/30/2013 | |
| Class A | | | | | | | | | | | | |
| Actual | | | $1,000.00 | | | | $985.70 | | | | $4.13 | |
| Hypothetical (5% return before expenses) | | | $1,000.00 | | | | $1,020.91 | | | | $4.20 | |
| Class B | | | | | | | | | | | | |
| Actual | | | $1,000.00 | | | | $982.60 | | | | $7.85 | |
| Hypothetical (5% return before expenses) | | | $1,000.00 | | | | $1,017.15 | | | | $7.99 | |
| Class C | | | | | | | | | | | | |
| Actual | | | $1,000.00 | | | | $981.80 | | | | $7.85 | |
| Hypothetical (5% return before expenses) | | | $1,000.00 | | | | $1,017.15 | | | | $7.99 | |
| Class N | | | | | | | | | | | | |
| Actual | | | $1,000.00 | | | | $986.10 | | | | $3.24 | |
| Hypothetical (5% return before expenses) | | | $1,000.00 | | | | $1,021.81 | | | | $3.29 | |
| Class Y | | | | | | | | | | | | |
| Actual | | | $1,000.00 | | | | $987.00 | | | | $2.89 | |
| Hypothetical (5% return before expenses) | | | $1,000.00 | | | | $1,022.16 | | | | $2.94 | |
| Admin Class | | | | | | | | | | | | |
| Actual | | | $1,000.00 | | | | $984.50 | | | | $5.37 | |
| Hypothetical (5% return before expenses) | | | $1,000.00 | | | | $1,019.65 | | | | $5.47 | |
| * | Expenses are equal to the Fund's annualized expense ratio (after waiver/reimbursement): 0.83%, 1.58%, 1.58%, 0.65%, 0.58% and 1.08% for Class A, B, C, N, Y and Admin Class, respectively, multiplied by the average account value over the period, multiplied by the number of days in the most recent fiscal half-year (183), divided by 365 (to reflect the half-year period). |
7 |
BOARD APPROVAL OF THE EXISTING ADVISORY AGREEMENT
The Board of Trustees of the Trust (the “Board”), including the Independent Trustees, considers matters bearing on the Fund’s advisory agreement (the “Agreement”) at most of its meetings throughout the year. Each year, usually in the spring, the Contract Review and Governance Committee of the Board meets to review the Agreement to determine whether to recommend that the full Board approve the continuation of the Agreement, typically for an additional one-year period. After the Committee has made its recommendation, the full Board, including the Independent Trustees, determines whether to approve the continuation of the Agreement.
In connection with these meetings, the Trustees receive materials that the Fund’s investment adviser (the “Adviser”) believes to be reasonably necessary for the Trustees to evaluate the Agreement. These materials generally include, among other items, (i) information on the investment performance of the Fund and the performance of a peer group and category of funds and the Fund’s performance benchmarks, (ii) information on the Fund’s advisory fee and other expenses, including information comparing the Fund’s expenses to the fees charged to institutional accounts with similar strategies managed by the Adviser, if any, and to those of a peer group of funds and information about any applicable expense caps and fee “breakpoints,” (iii) sales and redemption data in respect of the Fund, (iv) information about the profitability of the Agreement to the Adviser and (v) information obtained through the completion by the Adviser of a questionnaire distributed on behalf of the Trustees. The Board, including the Independent Trustees, also consider other matters such as (i) the Adviser’s financial results and/or financial condition, (ii) the Fund’s investment objective and strategies and the size, education and experience of the Adviser’s investment staff and its use of technology, external research and trading cost measurement tools, (iii) arrangements in respect of the distribution of the Fund’s shares and the related costs, (iv) the procedures employed to determine the value of the Fund’s assets, (v) the allocation of the Fund’s brokerage, if any, including, if applicable, allocations to brokers affiliated with the Adviser and the use of “soft” commission dollars to pay Fund expenses and to pay for research and other similar services, (vi) the resources devoted to, and the record of compliance with, the Fund’s investment policies and restrictions, policies on personal securities transactions and other compliance policies, (vii) information about amounts invested by the Fund’s portfolio managers in the Fund or in similar accounts that they manage and (viii) the general economic outlook with particular emphasis on the mutual fund industry. Throughout the process, the Trustees are afforded the opportunity to ask questions of and request additional materials from the Adviser.
In addition to the materials requested by the Trustees in connection with their annual consideration of the continuation of the Agreement, the Trustees receive materials in advance of each regular quarterly meeting of the Board that provide detailed information about the Fund’s investment performance and the fees charged to the Fund for advisory and other services. This information generally includes, among other things, an internal performance rating for the Fund based on agreed-upon criteria, graphs showing the Fund’s performance and fee differentials against the Fund’s peer group/category, performance ratings provided by a third-party, total return information for various periods, and third-party performance rankings for various periods comparing the Fund against similarly
| 8
categorized funds. The portfolio management team for the Fund or other representatives of the Adviser make periodic presentations to the Contract Review and Governance Committee and/or the full Board, and if the Fund is identified as presenting possible performance concerns it may be subject to more frequent board presentations and reviews. In addition, each quarter the Trustees are provided with detailed statistical information about the Fund’s portfolio. The Trustees also receive periodic updates between meetings.
The Board most recently approved the continuation of the Agreement at their meeting held in June 2013. The Agreement was continued for a one-year period. In considering whether to approve the continuation of the Agreement, the Board, including the Independent Trustees, did not identify any single factor as determinative. Individual Trustees may have evaluated the information presented differently from one another, giving different weights to various factors. Matters considered by the Trustees, including the Independent Trustees, in connection with their approval of the Agreement included, but were not limited to, the factors listed below.
The nature, extent and quality of the services provided to the Fund under the Agreement. The Trustees considered the nature, extent and quality of the services provided by the Adviser and its affiliates to the Fund and the resources dedicated to the Fund by the Adviser and its affiliates.
The Trustees considered not only the advisory services provided by the Adviser to the Fund, but also the administrative services provided by NGAM Advisors, L.P. (“NGAM Advisors”) and its affiliates to the Fund. The Trustees also considered the benefits to shareholders of investing in a mutual fund that is part of a family of funds that offers shareholders the right to exchange shares of one type of fund for shares of another type of fund, and provides a variety of fund and shareholder services.
After reviewing these and related factors, the Trustees concluded, within the context of their overall conclusions regarding the Agreement, that the nature, extent and quality of services provided supported the renewal of the Agreement.
Investment performance of the Fund and the Adviser. As noted above, the Trustees received information about the performance of the Fund over various time periods, including information that compared the performance of the Fund to the performance of a peer group and category of funds and the Fund’s performance benchmark. In addition, the Trustees also reviewed data prepared by an independent third party that analyzed the performance of the Fund using a variety of performance metrics, including metrics that also measured the performance of the Fund on a risk adjusted basis. The Board concluded that the Fund’s performance or other relevant factors supported the renewal of the Fund’s Agreement.
The Trustees also considered the Adviser’s performance and reputation generally, the performance of the fund family generally, and the historical responsiveness of the Adviser to Trustee concerns about performance and the willingness of the Adviser to take steps intended to improve performance.
After reviewing these and related factors, the Trustees concluded, within the context of their overall conclusions regarding the Agreement, that the performance of the Fund and the Adviser supported the renewal of the Agreement.
9 |
The costs of the services to be provided and profits to be realized by the Adviser and its affiliates from their respective relationships with the Fund. The Trustees considered the fees charged to the Fund for advisory services as well as the total expense level of the Fund. This information included comparisons (provided both by management and also by an independent third party) of the Fund’s advisory fee and total expense level to those of its peer group and information about the advisory fees charged by the Adviser to comparable accounts (such as institutional separate accounts), as well as information about differences in such fees and the reasons for any such differences. In considering the fees charged to comparable accounts, the Trustees considered, among other things, management’s representations about the differences between managing mutual funds as compared to other types of accounts, including the additional resources required to effectively manage and the greater regulatory costs associated with the management of mutual fund assets. In evaluating the Fund’s advisory fee, the Trustees also took into account the demands, complexity and quality of the investment management of the Fund, as well as the need for the Adviser to offer competitive compensation in order to attract and retain capable personnel and the need for the Adviser to expend additional resources as the Fund grows in size. The Trustees considered that over the past several years, management had made recommendations regarding reductions in advisory fee rates, implementation of advisory fee breakpoints and the institution of advisory fee waivers and expense caps for various funds in the fund family. They noted that the Fund currently has an expense cap in place, although the current expenses of the Fund are below the cap.
The Trustees also considered the compensation directly or indirectly received by the Adviser and its affiliates from their relationships with the Fund. The Trustees reviewed information provided by management as to the profitability of the Adviser’s and its affiliates’ relationships with the Fund, and information about the allocation of expenses used to calculate profitability. They also reviewed information provided by management about the effect of distribution costs and changes in asset levels on Adviser profitability, including information regarding resources spent on distribution activities. When reviewing profitability, the Trustees also considered information about court cases in which adviser compensation or profitability were issues, the performance of the Fund, the expense levels of the Fund and whether the Adviser had implemented breakpoints and/or expense caps with respect to the Fund. After reviewing these and related factors, the Trustees concluded, within the context of their overall conclusions regarding the Agreement, that the advisory fee charged to the Fund was fair and reasonable, and that the costs of these services generally and the related profitability of the Adviser and its affiliates in respect of their relationships with the Fund supported the renewal of the Agreement.
Economies of Scale. The Trustees considered the existence of any economies of scale in the provision of services by the Adviser and whether those economies are shared with the Fund through breakpoints in its investment advisory fee or other means, such as expense waivers or caps. The Trustees also discussed with management the factors considered with respect to the implementation of breakpoints in investment advisory fees or expense waivers or caps for certain funds. Management explained that a number of factors are taken into account in considering the possible implementation of breakpoints or an expense cap for a fund, including, among other things, factors such as a fund’s assets, the projected growth of a fund, projected profitability and a fund’s fees and performance. With respect to economies of scale, the Trustees noted that the Fund was subject to an expense cap and the Fund’s
| 10
overall net expense ratio was below the median compared to a peer group of funds. The Trustees further noted that management had proposed to add a breakpoint to the Fund’s advisory fee given the size of the Fund and the prospect for further growth. In considering these issues, the Trustees also took note of the costs of the services provided (both on an absolute and a relative basis) and the profitability to the Adviser and its affiliates of their relationships with the Fund, as discussed above.
After reviewing these and related factors, the Trustees concluded, within the context of their overall conclusions regarding the Agreement, that the extent to which economies of scale were shared with the Fund supported the renewal of the Agreement.
The Trustees also considered other factors, which included but were not limited to the following:
| · | | The effect of recent market and economic events on the performance, asset levels and expense ratios of the Fund. |
| · | | Whether the Fund has operated in accordance with its investment objective and the Fund’s record of compliance with its investment restrictions, and the compliance programs of the Fund and the Adviser. They also considered the compliance-related resources the Adviser and its affiliates were providing to the Fund. |
| · | | The nature, quality, cost and extent of administrative and shareholder services performed by the Adviser and its affiliates, both under the Agreement and under a separate agreement covering administrative services. |
| · | | So-called “fallout benefits” to the Adviser, such as the engagement of affiliates of the Adviser to provide distribution, administrative and brokerage services to the Fund, and the benefits of research made available to the Adviser by reason of brokerage commissions (if any) generated by the Fund’s securities transactions. The Trustees also considered the fact that NGAM Advisors’ parent company benefits from the retention of an affiliated Adviser. The Trustees considered the possible conflicts of interest associated with these fallout and other benefits, and the reporting, disclosure and other processes in place to disclose and monitor such possible conflicts of interest. |
| · | | The Trustees’ review and discussion of the Fund’s advisory arrangements in prior years, and management’s record of responding to Trustee concerns raised during the year and in prior years. |
Based on their evaluation of all factors that they deemed to be material, including those factors described above, and assisted by the advice of independent counsel, the Trustees, including the Independent Trustees, concluded that the existing Agreement should be continued through June 30, 2014.
11 |
Portfolio of Investments – as of September 30, 2013
Loomis Sayles Investment Grade Bond Fund
| | | | | | | | |
Principal
Amount (‡) | | | Description | | Value (†) | |
| | Bonds and Notes — 92.7% of Net Assets | | | | |
| | Non-Convertible Bonds — 87.3% | | | | |
| | | | ABS Car Loan — 0.5% | | | | |
| $ | 21,683,000 | | | Avis Budget Rental Car Funding AESOP LLC, Series 2010-3A, Class B,
6.740%, 5/20/2016, 144A | | $ | 23,193,069 | |
| | 20,999,250 | | | Avis Budget Rental Car Funding AESOP LLC, Series 2010-5A, Class B,
5.110%, 3/20/2017, 144A | | | 22,599,876 | |
| | 5,481,000 | | | Ford Auto Securitization Trust, Series 2010-R3A, Class D,
4.526%, 3/15/2017, 144A, (CAD) | | | 5,479,670 | |
| | | | | | | | |
| | | | | | | 51,272,615 | |
| | | | | | | | |
| | | | ABS Credit Card — 0.0% | | | | |
| | 2,324,000 | | | World Financial Network Credit Card Master Trust, Series 2010-A, Class B,
6.750%, 4/15/2019 | | | 2,525,635 | |
| | | | | | | | |
| | | | ABS Other — 0.9% | | | | |
| | 1,272,468 | | | Community Program Loan Trust, Series 1987-A, Class A5, 4.500%, 4/01/2029 | | | 1,284,762 | |
| | 4,462,199 | | | Diamond Resorts Owner Trust, Series 2011-1, Class A,
4.000%, 3/20/2023, 144A | | | 4,551,470 | |
| | 17,279,230 | | | SVO VOI Mortgage Corp., Series 2009-BA, Class NT,
5.810%, 12/20/2028, 144A | | | 17,548,596 | |
| | 38,198,563 | | | Trinity Rail Leasing LP, Series 2009-1A, Class A, 6.657%, 11/16/2039, 144A | | | 43,153,375 | |
| | 15,063,930 | | | Trinity Rail Leasing LP, Series 2010-1A, Class A, 5.194%, 10/16/2040, 144A | | | 15,224,737 | |
| | 4,157,911 | | | Trinity Rail Leasing LP, Series 2012-1A, Class A1, 2.266%, 1/15/2043, 144A | | | 4,086,507 | |
| | 9,857,026 | | | Trip Rail Master Funding LLC, Series 2011-1A, Class A1A,
4.370%, 7/15/2041, 144A | | | 10,414,481 | |
| | | | | | | | |
| | | | | | | 96,263,928 | |
| | | | | | | | |
| | | | Aerospace & Defense — 1.1% | | | | |
| | 2,100,000 | | | Bombardier, Inc., 7.450%, 5/01/2034, 144A | | | 2,089,500 | |
| | 1,181,000 | | | Textron Financial Corp., Series E, MTN, 5.125%, 8/15/2014 | | | 1,219,315 | |
| | 78,795,000 | | | Textron, Inc., 5.950%, 9/21/2021 | | | 86,623,204 | |
| | 11,040,000 | | | Textron, Inc., EMTN, 6.625%, 4/07/2020, (GBP) | | | 19,835,086 | |
| | | | | | | | |
| | | | | | | 109,767,105 | |
| | | | | | | | |
| | | | Airlines — 2.9% | | | | |
| | 5,215,000 | | | Air Canada Pass Through Trust, Series 2013-1, Class B,
5.375%, 11/15/2022, 144A | | | 5,032,475 | |
| | 12,000,000 | | | American Airlines Pass Through Trust, Series 2013-1, Class A,
4.000%, 1/15/2027, 144A | | | 11,250,000 | |
| | 18,340,000 | | | Continental Airlines Pass Through Certificates, Series 2012-3, Class C,
6.125%, 4/29/2018 | | | 18,660,950 | |
| | 57,977 | | | Continental Airlines Pass Through Trust, Series 1997-1, Class A,
7.461%, 10/01/2016 | | | 58,046 | |
| | 579,638 | | | Continental Airlines Pass Through Trust, Series 1998-1, Class A,
6.648%, 3/15/2019 | | | 610,069 | |
| | 794,940 | | | Continental Airlines Pass Through Trust, Series 1999-1, Class A,
6.545%, 8/02/2020 | | | 864,497 | |
| | 8,369,500 | | | Continental Airlines Pass Through Trust, Series 2000-1, Class A-1,
8.048%, 5/01/2022 | | | 9,499,383 | |
See accompanying notes to financial statements.
| 12
Portfolio of Investments – as of September 30, 2013
Loomis Sayles Investment Grade Bond Fund – (continued)
| | | | | | | | |
Principal
Amount (‡) | | | Description | | Value (†) | |
| | | | Airlines — continued | | | | |
| $ | 1,699,087 | | | Continental Airlines Pass Through Trust, Series 2000-2, Class A-1,
7.707%, 10/02/2022 | | $ | 1,907,225 | |
| | 3,095,792 | | | Continental Airlines Pass Through Trust, Series 2001-1, Class A-1,
6.703%, 12/15/2022 | | | 3,312,497 | |
| | 52,594,416 | | | Continental Airlines Pass Through Trust, Series 2007-1, Class A,
5.983%, 10/19/2023 | | | 56,276,025 | |
| | 11,158,179 | | | Continental Airlines Pass Through Trust, Series 2007-1, Class B,
6.903%, 10/19/2023 | | | 11,422,627 | |
| | 23,571,356 | | | Continental Airlines Pass Through Trust, Series 2009-1,
9.000%, 1/08/2018 | | | 26,930,274 | |
| | 18,418,281 | | | Continental Airlines Pass Through Trust, Series 2009-2, Class A,
7.250%, 5/10/2021 | | | 20,812,658 | |
| | 3,065,000 | | | Continental Airlines Pass Through Trust, Series 2012-1, Class B,
6.250%, 10/11/2021 | | | 3,164,613 | |
| | 1,696,675 | | | Delta Air Lines Pass Through Trust, Series 2007-1, Class A,
6.821%, 2/10/2024 | | | 1,887,551 | |
| | 11,718,882 | | | Delta Air Lines Pass Through Trust, Series 2007-1, Class B,
8.021%, 2/10/2024 | | | 12,714,987 | |
| | 29,029,607 | | | Delta Air Lines Pass Through Trust, Series 2009-1, Class A,
7.750%, 6/17/2021 | | | 33,710,632 | |
| | 2,420,207 | | | Delta Air Lines Pass Through Trust, Series 2009-1, Series B,
9.750%, 6/17/2018 | | | 2,671,304 | |
| | 17,033,040 | | | Delta Air Lines Pass Through Trust, Series 2010-1, Class A,
6.200%, 1/02/2020 | | | 18,651,178 | |
| | 5,499,714 | | | Northwest Airlines, Inc., Series 2007-1, Class B, 8.028%, 5/01/2019 | | | 5,681,204 | |
| | 22,121,441 | | | UAL Pass Through Trust, Series 2007-1, Class A, 6.636%, 1/02/2024 | | | 23,006,299 | |
| | 546,191 | | | UAL Pass Through Trust, Series 2009-1, 10.400%, 5/01/2018 | | | 612,062 | |
| | 15,830,279 | | | US Airways Pass Through Trust, Series 2011-1A, Class A,
7.125%, 4/22/2025 | | | 17,373,731 | |
| | 9,930,000 | | | US Airways Pass Through Trust, Series 2012-2A, Class A,
4.625%, 12/03/2026 | | | 9,582,450 | |
| | | | | | | | |
| | | | | | | 295,692,737 | |
| | | | | | | | |
| | | | Automotive — 1.1% | | | | |
| | 36,651,000 | | | Cummins, Inc., 5.650%, 3/01/2098 | | | 35,274,132 | |
| | 5,274,000 | | | Cummins, Inc., 6.750%, 2/15/2027 | | | 6,144,585 | |
| | 2,426,000 | | | Ford Motor Co., 6.375%, 2/01/2029 | | | 2,645,832 | |
| | 125,000 | | | Ford Motor Co., 6.500%, 8/01/2018 | | | 144,037 | |
| | 255,000 | | | Ford Motor Co., 6.625%, 2/15/2028 | | | 275,626 | |
| | 5,074,000 | | | Ford Motor Co., 6.625%, 10/01/2028 | | | 5,725,634 | |
| | 3,243,000 | | | Ford Motor Co., 7.400%, 11/01/2046 | | | 3,880,632 | |
| | 4,823,000 | | | Ford Motor Co., 7.450%, 7/16/2031 | | | 5,885,955 | |
| | 240,000 | | | Ford Motor Co., 7.500%, 8/01/2026 | | | 289,490 | |
| | 5,000,000 | | | Ford Motor Credit Co. LLC, 5.000%, 5/15/2018 | | | 5,477,755 | |
| | 40,126,000 | | | Ford Motor Credit Co. LLC, 6.625%, 8/15/2017 | | | 46,237,511 | |
| | 2,370,000 | | | Goodyear Tire & Rubber Co. (The), 7.000%, 3/15/2028 | | | 2,346,300 | |
| | | | | | | | |
| | | | | | | 114,327,489 | |
| | | | | | | | |
See accompanying notes to financial statements.
13 |
Portfolio of Investments – as of September 30, 2013
Loomis Sayles Investment Grade Bond Fund – (continued)
| | | | | | | | |
Principal
Amount (‡) | | | Description | | Value (†) | |
| | | | Banking — 15.4% | | | | |
| $ | 22,547,000 | | | AgriBank FCB, 9.125%, 7/15/2019, 144A | | $ | 29,284,697 | |
| | 1,634,000 | | | Ally Financial, Inc., 6.750%, 12/01/2014 | | | 1,713,657 | |
| | 2,285,000 | | | Ally Financial, Inc., 8.000%, 11/01/2031 | | | 2,542,062 | |
| | 7,200,000 | | | American Express Centurion Bank, Series BKN1, 6.000%, 9/13/2017 | | | 8,349,473 | |
| | 35,878,000 | | | Associates Corp. of North America, 6.950%, 11/01/2018 | | | 42,618,005 | |
| | 11,400,000 | | | Banco Santander Brasil S.A./Cayman Islands,
8.000%, 3/18/2016, 144A, (BRL) | | | 4,757,930 | |
| | 3,590,000 | | | Bank of America Corp., 5.420%, 3/15/2017 | | | 3,939,425 | |
| | 9,805,000 | | | Bank of America Corp., 6.000%, 9/01/2017 | | | 11,103,388 | |
| | 11,100,000 | | | Bank of America Corp., MTN, 5.000%, 5/13/2021 | | | 11,921,744 | |
| | 2,393,000 | | | Bank of America Corp., Series L, MTN, 7.625%, 6/01/2019 | | | 2,934,447 | |
| | 17,249,000 | | | Bank of America NA, 5.300%, 3/15/2017 | | | 19,010,140 | |
| | 1,056,000 | | | Barclays Bank PLC, 6.050%, 12/04/2017, 144A | | | 1,172,998 | |
| | 7,110,000,000 | | | Barclays Bank PLC, EMTN, 3.680%, 8/20/2015, (KRW) | | | 6,792,732 | |
| | 337,230,000,000 | | | Barclays Financial LLC, EMTN, 8.250%, 10/27/2014, (IDR) | | | 27,389,017 | |
| | 2,173,000 | | | Bear Stearns Cos., Inc. (The), 4.650%, 7/02/2018 | | | 2,381,893 | |
| | 370,000 | | | BNP Paribas/Australia, 7.000%, 5/24/2016, (AUD) | | | 371,151 | |
| | 8,994,000 | | | Capital One Financial Corp., 6.150%, 9/01/2016 | | | 10,016,186 | |
| | 2,770,000 | | | Citigroup, Inc., 3.375%, 3/01/2023 | | | 2,635,843 | |
| | 17,000,000 | | | Citigroup, Inc., 3.500%, 5/15/2023 | | | 15,340,749 | |
| | 51,425,000 | | | Citigroup, Inc., 4.450%, 1/10/2017 | | | 55,681,344 | |
| | 1,660,000 | | | Citigroup, Inc., 4.500%, 1/14/2022 | | | 1,739,733 | |
| | 2,700,000 | | | Citigroup, Inc., 5.365%, 3/06/2036, (CAD)(b) | | | 2,410,328 | |
| | 10,000,000 | | | Citigroup, Inc., 5.375%, 8/09/2020 | | | 11,186,230 | |
| | 2,740,000 | | | Citigroup, Inc., 5.875%, 2/22/2033 | | | 2,728,213 | |
| | 5,445,000 | | | Citigroup, Inc., 6.125%, 5/15/2018 | | | 6,297,932 | |
| | 8,705,000 | | | Citigroup, Inc., 6.125%, 8/25/2036 | | | 8,761,086 | |
| | 44,910,000 | | | Citigroup, Inc., 6.250%, 6/29/2017, (NZD) | | | 38,472,540 | |
| | 2,398,000 | | | Citigroup, Inc., EMTN, 1.495%, 11/30/2017, (EUR)(c) | | | 3,150,055 | |
| | 4,625,000 | | | Cooperatieve Centrale Raiffeisen-Boerenleenbank BA/Utrecht,
3.375%, 1/19/2017 | | | 4,921,166 | |
| | 27,045,000 | | | Cooperatieve Centrale Raiffeisen-Boerenleenbank BA/Utrecht,
3.875%, 2/08/2022 | | | 27,077,968 | |
| | 86,800,000 | | | Goldman Sachs Group, Inc. (The), 3.375%, 2/01/2018, (CAD) | | | 84,221,407 | |
| | 1,174,000 | | | Goldman Sachs Group, Inc. (The), 6.450%, 5/01/2036 | | | 1,191,873 | |
| | 112,330,000 | | | Goldman Sachs Group, Inc. (The), 6.750%, 10/01/2037 | | | 117,231,632 | |
| | 6,645,000 | | | Goldman Sachs Group, Inc. (The), GMTN, 5.375%, 3/15/2020 | | | 7,319,501 | |
| | 4,467,000 | | | HBOS PLC, 6.000%, 11/01/2033, 144A | | | 4,203,894 | |
| | 1,000,000 | | | HBOS PLC, GMTN, 6.750%, 5/21/2018, 144A | | | 1,111,194 | |
| | 700,000 | | | ICICI Bank Ltd., (fixed rate to 4/30/2017, variable rate thereafter),
6.375%, 4/30/2022, 144A | | | 647,500 | |
| | 36,745,000 | | | JPMorgan Chase & Co., 4.250%, 11/02/2018, (NZD) | | | 28,852,013 | |
| | 2,950,000 | | | JPMorgan Chase & Co., EMTN, 1.051%, 5/30/2017, (GBP)(c) | | | 4,548,909 | |
| | 12,000,000,000 | | | JPMorgan Chase & Co., EMTN, 7.070%, 3/22/2014, (IDR) | | | 991,088 | |
| | 16,000,000,000 | | | JPMorgan Chase Bank NA, 7.700%, 6/01/2016, 144A, (IDR) | | | 1,328,636 | |
| | 100,000 | | | Keybank NA, 6.950%, 2/01/2028 | | | 120,374 | |
| | 9,787,000 | | | Lloyds Bank PLC, EMTN, 4.570%, 10/13/2015, (CAD) | | | 9,887,906 | |
| | 81,622,000 | | | Lloyds Bank PLC, MTN, 6.500%, 9/14/2020, 144A | | | 90,103,260 | |
See accompanying notes to financial statements.
| 14
Portfolio of Investments – as of September 30, 2013
Loomis Sayles Investment Grade Bond Fund – (continued)
| | | | | | | | |
Principal
Amount (‡) | | | Description | | Value (†) | |
| | | | Banking — continued | | | | |
| $ | 6,479,000 | | | Merrill Lynch & Co., Inc., 5.700%, 5/02/2017 | | $ | 7,152,051 | |
| | 4,300,000 | | | Merrill Lynch & Co., Inc., 6.050%, 5/16/2016 | | | 4,735,921 | |
| | 103,309,000 | | | Merrill Lynch & Co., Inc., 6.110%, 1/29/2037 | | | 106,401,142 | |
| | 3,132,000 | | | Merrill Lynch & Co., Inc., EMTN, 4.625%, 9/14/2018, (EUR) | | | 4,533,727 | |
| | 11,641,000 | | | Merrill Lynch & Co., Inc., MTN, 6.875%, 4/25/2018 | | | 13,718,977 | |
| | 2,652,000 | | | Merrill Lynch & Co., Inc., Series C, GMTN, 6.400%, 8/28/2017 | | | 3,049,641 | |
| | 40,126,000 | | | Merrill Lynch & Co., Inc., Series C, MTN, 6.050%, 6/01/2034 | | | 41,954,823 | |
| | 78,200,000 | | | Morgan Stanley, 2.125%, 4/25/2018 | | | 76,217,474 | |
| | 4,250,000 | | | Morgan Stanley, 3.450%, 11/02/2015 | | | 4,405,380 | |
| | 53,869,000 | | | Morgan Stanley, 3.750%, 2/25/2023 | | | 51,931,548 | |
| | 14,023,000 | | | Morgan Stanley, 3.800%, 4/29/2016 | | | 14,759,558 | |
| | 30,000,000 | | | Morgan Stanley, 4.750%, 11/16/2018, (AUD) | | | 27,847,967 | |
| | 4,585,000 | | | Morgan Stanley, 4.875%, 11/01/2022 | | | 4,587,412 | |
| | 56,867,000 | | | Morgan Stanley, 5.500%, 7/24/2020 | | | 62,768,600 | |
| | 5,900,000 | | | Morgan Stanley, 5.750%, 1/25/2021 | | | 6,549,643 | |
| | 151,076,000 | | | Morgan Stanley, 7.600%, 8/08/2017, (NZD) | | | 133,106,927 | |
| | 60,800,000 | | | Morgan Stanley, 8.000%, 5/09/2017, (AUD) | | | 62,696,615 | |
| | 550,000 | | | Morgan Stanley, EMTN, 5.750%, 2/14/2017, (GBP) | | | 985,374 | |
| | 5,400,000 | | | Morgan Stanley, GMTN, 5.500%, 1/26/2020 | | | 5,975,446 | |
| | 24,100,000 | | | Morgan Stanley, GMTN, 7.625%, 3/03/2016, (AUD) | | | 24,109,623 | |
| | 9,410,000 | | | Morgan Stanley, MTN, 4.100%, 5/22/2023 | | | 8,776,876 | |
| | 3,800,000 | | | Morgan Stanley, MTN, 7.250%, 5/26/2015, (AUD) | | | 3,738,721 | |
| | 38,206,000 | | | Morgan Stanley, Series F, GMTN, 5.625%, 9/23/2019 | | | 42,634,992 | |
| | 5,187,000 | | | Morgan Stanley, Series F, GMTN, 6.625%, 4/01/2018 | | | 6,021,884 | |
| | 9,400,000 | | | Morgan Stanley, Series F, MTN, 0.716%, 10/18/2016(c) | | | 9,246,047 | |
| | 9,044,000 | | | Morgan Stanley, Series F, MTN, 5.950%, 12/28/2017 | | | 10,232,183 | |
| | 2,239,000 | | | Morgan Stanley, Series G & H, GMTN, 5.125%, 11/30/2015, (GBP) | | | 3,873,042 | |
| | 2,875,000 | | | National City Bank of Indiana, 4.250%, 7/01/2018 | | | 3,065,607 | |
| | 8,638,000 | | | National City Corp., 6.875%, 5/15/2019 | | | 10,306,896 | |
| | 35,900,000 | | | Royal Bank of Scotland Group PLC, 6.125%, 12/15/2022 | | | 36,166,378 | |
| | 5,250,000 | | | Royal Bank of Scotland PLC (The), EMTN, 4.350%, 1/23/2017, (EUR) | | | 7,200,124 | |
| | 6,150,000 | | | Royal Bank of Scotland PLC (The), EMTN, 6.934%, 4/09/2018, (EUR) | | | 9,119,302 | |
| | 1,650,000 | | | Royal Bank of Scotland PLC (The), EMTN, (fixed rate to 9/22/2016, variable rate thereafter), 4.625%, 9/22/2021, (EUR) | | | 2,120,593 | |
| | 700,000 | | | Santander Financial Issuances Ltd., 7.250%, 11/01/2015 | | | 747,506 | |
| | 16,175,000 | | | Santander Holdings USA, Inc., 4.625%, 4/19/2016 | | | 17,138,723 | |
| | 1,000,000 | | | Santander International Debt SAU, EMTN, 4.000%, 3/27/2017, (EUR) | | | 1,423,848 | |
| | 1,800,000 | | | Santander Issuances SAU, 5.911%, 6/20/2016, 144A | | | 1,898,231 | |
| | 1,400,000 | | | Santander Issuances SAU, (fixed rate to 8/11/2014, variable rate thereafter),
6.500%, 8/11/2019, 144A | | | 1,421,500 | |
| | 5,600,000 | | | Santander US Debt SAU, 3.724%, 1/20/2015, 144A | | | 5,679,290 | |
| | 30,886,000 | | | Societe Generale S.A., MTN, 5.200%, 4/15/2021, 144A | | | 33,595,598 | |
| | 3,300,000 | | | Standard Chartered Bank, 6.400%, 9/26/2017, 144A | | | 3,762,429 | |
| | | | | | | | |
| | | | | | | 1,594,118,938 | |
| | | | | | | | |
| | | | Brokerage — 1.7% | | | | |
| | 55,355,000 | | | Cantor Fitzgerald LP, 6.375%, 6/26/2015, 144A | | | 57,292,425 | |
| | 13,100,000 | | | Cantor Fitzgerald LP, 7.875%, 10/15/2019, 144A(b) | | | 13,565,063 | |
See accompanying notes to financial statements.
15 |
Portfolio of Investments – as of September 30, 2013
Loomis Sayles Investment Grade Bond Fund – (continued)
| | | | | | | | |
Principal
Amount (‡) | | | Description | | Value (†) | |
| | | | Brokerage — continued | | | | |
| $ | 43,310,000 | | | Jefferies Group LLC, 5.125%, 1/20/2023 | | $ | 43,650,114 | |
| | 19,498,000 | | | Jefferies Group LLC, 6.250%, 1/15/2036 | | | 18,710,144 | |
| | 8,760,000 | | | Jefferies Group LLC, 6.450%, 6/08/2027 | | | 8,935,200 | |
| | 1,693,000 | | | Jefferies Group LLC, 6.875%, 4/15/2021 | | | 1,877,825 | |
| | 23,835,000 | | | Jefferies Group LLC, 8.500%, 7/15/2019 | | | 28,860,300 | |
| | | | | | | | |
| | | | | | | 172,891,071 | |
| | | | | | | | |
| | | | Building Materials — 1.2% | | | | |
| | 6,640,000 | | | Masco Corp., 4.800%, 6/15/2015 | | | 6,938,800 | |
| | 10,942,000 | | | Masco Corp., 5.850%, 3/15/2017 | | | 11,844,715 | |
| | 6,616,000 | | | Masco Corp., 6.125%, 10/03/2016 | | | 7,318,950 | |
| | 6,058,000 | | | Masco Corp., 6.500%, 8/15/2032 | | | 6,012,565 | |
| | 28,539,000 | | | Masco Corp., 7.125%, 3/15/2020 | | | 32,177,722 | |
| | 5,725,000 | | | Masco Corp., 7.750%, 8/01/2029 | | | 6,323,303 | |
| | 9,300,000 | | | Odebrecht Finance Ltd., 8.250%, 4/25/2018, 144A, (BRL) | | | 3,481,783 | |
| | 4,949,000 | | | Owens Corning, Inc., 6.500%, 12/01/2016 | | | 5,523,881 | |
| | 41,379,000 | | | Owens Corning, Inc., 7.000%, 12/01/2036 | | | 45,386,142 | |
| | 1,037,000 | | | USG Corp., 6.300%, 11/15/2016 | | | 1,096,627 | |
| | | | | | | | |
| | | | | | | 126,104,488 | |
| | | | | | | | |
| | | | Chemicals — 0.0% | | | | |
| | 1,700,000 | | | Methanex Corp., 5.250%, 3/01/2022 | | | 1,763,405 | |
| | | | | | | | |
| | | | Commercial Mortgage-Backed Securities — 2.5% | | | | |
| | 50,990,525 | | | Credit Suisse Mortgage Capital Certificates, Series 2007-C3, Class A4,
5.872%, 6/15/2039(c) | | | 56,101,713 | |
| | 34,381,273 | | | Credit Suisse Mortgage Capital Certificates, Series 2007-C4, Class A4,
5.953%, 9/15/2039(c) | | | 38,233,591 | |
| | 6,711,090 | | | Credit Suisse Mortgage Capital Certificates, Series 2007-C5, Class A4,
5.695%, 9/15/2040 | | | 7,495,012 | |
| | 57,694,000 | | | Crown Castle Towers LLC, 6.113%, 1/15/2040, 144A | | | 65,255,549 | |
| | 69,500,000 | | | Extended Stay America Trust, Series 2013, Class 7-ESH7,
3.902%, 12/05/2031, 144A | | | 67,262,169 | |
| | 9,786,870 | | | Morgan Stanley Re-REMIC Trust, Series 2009-GG10, Class A4B,
5.993%, 8/12/2045, 144A(c) | | | 10,736,236 | |
| | 6,851,000 | | | Vornado DP LLC, Series 2010-VNO, Class D, 6.356%, 9/13/2028, 144A | | | 7,579,145 | |
| | 4,250,000 | | | WF-RBS Commercial Mortgage Trust, Series 2011-C3, Class D,
5.721%, 3/15/2044, 144A(c) | | | 4,099,695 | |
| | | | | | | | |
| | | | | | | 256,763,110 | |
| | | | | | | | |
| | | | Construction Machinery — 0.1% | | | | |
| | 6,787,000 | | | Toro Co., 6.625%, 5/01/2037(b) | | | 6,709,241 | |
| | 400,000 | | | United Rentals North America, Inc., 8.375%, 9/15/2020 | | | 443,000 | |
| | | | | | | | |
| | | | | | | 7,152,241 | |
| | | | | | | | |
| | | | Consumer Products — 0.2% | | | | |
| | 7,458,000 | | | Hasbro, Inc., 6.600%, 7/15/2028 | | | 8,027,165 | |
| | 11,754,000 | | | Snap-on, Inc., 6.700%, 3/01/2019 | | | 13,662,497 | |
| | | | | | | | |
| | | | | | | 21,689,662 | |
| | | | | | | | |
See accompanying notes to financial statements.
| 16
Portfolio of Investments – as of September 30, 2013
Loomis Sayles Investment Grade Bond Fund – (continued)
| | | | | | | | |
Principal
Amount (‡) | | | Description | | Value (†) | |
| | | | Diversified Manufacturing — 0.0% | | | | |
| $ | 1,395,000 | | | Ingersoll-Rand Global Holding Co. Ltd., 6.875%, 8/15/2018 | | $ | 1,653,314 | |
| | | | | | | | |
| | | | Electric — 2.0% | | | | |
| | 33,118,493 | | | Alta Wind Holdings LLC, 7.000%, 6/30/2035, 144A | | | 35,135,939 | |
| | 10,331,144 | | | Bruce Mansfield Unit, 6.850%, 6/01/2034 | | | 10,937,789 | |
| | 9,066,000 | | | Cleveland Electric Illuminating Co. (The), 5.700%, 4/01/2017 | | | 9,970,460 | |
| | 12,285,000 | | | EDP Finance BV, 4.900%, 10/01/2019, 144A | | | 12,131,438 | |
| | 3,200,000 | | | EDP Finance BV, 6.000%, 2/02/2018, 144A | | | 3,312,000 | |
| | 900,000 | | | EDP Finance BV, EMTN, 5.875%, 2/01/2016, (EUR) | | | 1,281,488 | |
| | 4,491,000 | | | Endesa S.A./Cayman Islands, 7.875%, 2/01/2027 | | | 5,339,260 | |
| | 40,453,000 | | | Enel Finance International NV, 6.000%, 10/07/2039, 144A | | | 36,836,906 | |
| | 9,007,000 | | | Enel Finance International NV, 6.800%, 9/15/2037, 144A | | | 8,984,843 | |
| | 7,921,000 | | | Enel Finance International NV, EMTN, 5.750%, 9/14/2040, (GBP) | | | 11,332,527 | |
| | 3,600,000 | | | Iberdrola Finance Ireland Ltd., 3.800%, 9/11/2014, 144A | | | 3,685,817 | |
| | 6,964,234 | | | Mackinaw Power LLC, 6.296%, 10/31/2023, 144A(b) | | | 7,249,294 | |
| | 50,026,000 | | | Southwestern Electric Power Co., 6.450%, 1/15/2019 | | | 58,159,877 | |
| | | | | | | | |
| | | | | | | 204,357,638 | |
| | | | | | | | |
| | | | Entertainment — 0.0% | | | | |
| | 3,616,000 | | | Viacom, Inc., 6.125%, 10/05/2017 | | | 4,136,469 | |
| | | | | | | | |
| | | | Financial Other — 1.0% | | | | |
| | 66,384,000 | | | Aviation Capital Group Corp., 6.750%, 4/06/2021, 144A | | | 70,072,494 | |
| | 26,914,000 | | | National Life Insurance Co., 10.500%, 9/15/2039, 144A | | | 37,809,137 | |
| | | | | | | | |
| | | | | | | 107,881,631 | |
| | | | | | | | |
| | | | Food & Beverage — 0.0% | | | | |
| | 2,450,000 | | | Cargill, Inc., EMTN, 5.375%, 3/02/2037, (GBP) | | | 4,450,887 | |
| | | | | | | | |
| | | | Government Guaranteed — 0.5% | | | | |
| | 12,910,000 | | | Instituto de Credito Oficial, EMTN, 4.530%, 3/17/2016, (CAD) | | | 12,741,301 | |
| | 11,311,000 | | | Instituto de Credito Oficial, MTN, 6.125%, 2/27/2014, (AUD) | | | 10,496,742 | |
| | 4,000,000 | | | Japan Bank for International Cooperation (Japan),
2.300%, 3/19/2018, (CAD) | | | 3,832,474 | |
| | 31,142,000 | | | Queensland Treasury Corp., 7.125%, 9/18/2017, 144A, (NZD) | | | 28,359,288 | |
| | | | | | | | |
| | | | | | | 55,429,805 | |
| | | | | | | | |
| | | | Government Owned – No Guarantee — 1.1% | | | | |
| | 3,720,000 | | | Abu Dhabi National Energy Co., 6.500%, 10/27/2036, 144A | | | 4,212,900 | |
| | 36,975,000 | | | Abu Dhabi National Energy Co., 7.250%, 8/01/2018, 144A | | | 43,722,938 | |
| | 58,060,000 | | | DP World Ltd., 6.850%, 7/02/2037, 144A | | | 58,350,300 | |
| | 26,030,000,000 | | | Export-Import Bank of Korea, 6.600%, 11/04/2013, 144A, (IDR) | | | 2,223,115 | |
| | 27,800,000,000 | | | Export-Import Bank of Korea, 8.300%, 3/15/2014, 144A, (IDR) | | | 2,343,674 | |
| | 1,000,000 | | | Telekom Malaysia Berhad, 7.875%, 8/01/2025, 144A | | | 1,264,850 | |
| | | | | | | | |
| | | | | | | 112,117,777 | |
| | | | | | | | |
| | | | Health Insurance — 0.0% | | | | |
| | 1,569,000 | | | CIGNA Corp., 7.875%, 5/15/2027 | | | 1,949,009 | |
| | 1,174,000 | | | CIGNA Corp., (Step to 8.080% on 1/15/2023), 8.300%, 1/15/2033(d) | | | 1,576,670 | |
| | | | | | | | |
| | | | | | | 3,525,679 | |
| | | | | | | | |
See accompanying notes to financial statements.
17 |
Portfolio of Investments – as of September 30, 2013
Loomis Sayles Investment Grade Bond Fund – (continued)
| | | | | | | | |
Principal
Amount (‡) | | | Description | | Value (†) | |
| | | | Healthcare — 1.1% | | | | |
| $ | 7,692,000 | | | Boston Scientific Corp., 6.000%, 1/15/2020 | | $ | 8,797,033 | |
| | 7,374,000 | | | Covidien International Finance S.A., 6.000%, 10/15/2017 | | | 8,527,050 | |
| | 9,459,000 | | | Express Scripts, Inc., 7.250%, 6/15/2019 | | | 11,572,699 | |
| | 9,278,000 | | | HCA, Inc., 5.750%, 3/15/2014 | | | 9,451,963 | |
| | 802,000 | | | HCA, Inc., 5.875%, 3/15/2022 | | | 824,055 | |
| | 52,905,000 | | | HCA, Inc., 5.875%, 5/01/2023 | | | 51,979,162 | |
| | 2,936,000 | | | HCA, Inc., 7.050%, 12/01/2027 | | | 2,811,220 | |
| | 4,119,000 | | | HCA, Inc., 7.500%, 12/15/2023 | | | 4,201,380 | |
| | 1,282,000 | | | HCA, Inc., 7.500%, 11/06/2033 | | | 1,272,385 | |
| | 3,807,000 | | | HCA, Inc., 7.690%, 6/15/2025 | | | 3,897,416 | |
| | 4,164,000 | | | HCA, Inc., 8.360%, 4/15/2024 | | | 4,476,300 | |
| | 1,199,000 | | | HCA, Inc., MTN, 7.580%, 9/15/2025 | | | 1,216,985 | |
| | 3,068,000 | | | HCA, Inc., MTN, 7.750%, 7/15/2036 | | | 3,006,640 | |
| | 2,256,000 | | | Owens & Minor, Inc., 6.350%, 4/15/2016 | | | 2,443,386 | |
| | 2,200,000 | | | Tenet Healthcare Corp., 6.875%, 11/15/2031 | | | 1,864,500 | |
| | | | | | | | |
| | | | | | | 116,342,174 | |
| | | | | | | | |
| | | | Home Construction — 0.1% | | | | |
| | 2,006,000 | | | Desarrolladora Homex SAB de CV, 7.500%, 9/28/2015(e) | | | 481,440 | |
| | 9,200,000 | | | Pulte Group, Inc., 6.000%, 2/15/2035 | | | 7,912,000 | |
| | 3,567,000 | | | Pulte Group, Inc., 6.375%, 5/15/2033 | | | 3,183,547 | |
| | | | | | | | |
| | | | | | | 11,576,987 | |
| | | | | | | | |
| | | | Independent Energy — 0.8% | | | | |
| | 9,787,000 | | | EQT Corp., 8.125%, 6/01/2019 | | | 11,874,303 | |
| | 60,038,000 | | | Equitable Resources, Inc., 6.500%, 4/01/2018 | | | 68,029,838 | |
| | 7,240,000 | | | Newfield Exploration Co., 5.625%, 7/01/2024 | | | 7,004,700 | |
| | | | | | | | |
| | | | | | | 86,908,841 | |
| | | | | | | | |
| | | | Industrial Other — 0.1% | | | | |
| | 4,893,000 | | | Worthington Industries, Inc., 6.500%, 4/15/2020 | | | 5,264,623 | |
| | | | | | | | |
| | | | Life Insurance — 0.9% | | | | |
| | 7,100,000 | | | American International Group, Inc., EMTN, 5.000%, 4/26/2023, (GBP) | | | 12,501,146 | |
| | 6,910,000 | | | American International Group, Inc., Series G, MTN, 5.850%, 1/16/2018 | | | 7,857,202 | |
| | 2,036,000 | | | American International Group, Inc., Series MP, MTN, 5.450%, 5/18/2017 | | | 2,275,873 | |
| | 600,000 | | | AXA S.A., EMTN, (fixed rate to 10/16/2019, variable rate thereafter),
6.772%, (GBP)(g) | | | 988,339 | |
| | 5,900,000 | | | AXA S.A., EMTN, (fixed rate to 4/16/2020, variable rate thereafter),
5.250%, 4/16/2040, (EUR) | | | 8,400,097 | |
| | 15,000,000 | | | Forethought Financial Group, Inc., 8.625%, 4/15/2021, 144A | | | 16,622,985 | |
| | 9,063,000 | | | Mutual of Omaha Insurance Co., 6.800%, 6/15/2036, 144A | | | 10,109,314 | |
| | 6,440,000 | | | NLV Financial Corp., 7.500%, 8/15/2033, 144A | | | 6,524,480 | |
| | 2,872,000 | | | Penn Mutual Life Insurance Co. (The), 6.650%, 6/15/2034, 144A | | | 3,284,276 | |
| | 14,489,000 | | | Penn Mutual Life Insurance Co. (The), 7.625%, 6/15/2040, 144A | | | 18,692,288 | |
| | 4,732,000 | | | Unum Group, 7.125%, 9/30/2016 | | | 5,411,487 | |
| | | | | | | | |
| | | | | | | 92,667,487 | |
| | | | | | | | |
See accompanying notes to financial statements.
| 18
Portfolio of Investments – as of September 30, 2013
Loomis Sayles Investment Grade Bond Fund – (continued)
| | | | | | | | |
Principal
Amount (‡) | | | Description | | Value (†) | |
| | | | Local Authorities — 3.0% | | | | |
| | 59,530,000 | | | Autonomous Community of Madrid Spain, 4.300%, 9/15/2026, 144A, (EUR) | | $ | 71,041,136 | |
| | 800,000 | | | City of Madrid Spain, 4.550%, 6/16/2036, (EUR) | | | 798,203 | |
| | 7,448,000 | | | Manitoba (Province of), GMTN, 6.375%, 9/01/2015, (NZD) | | | 6,467,052 | |
| | 152,895,000 | | | New South Wales Treasury Corp., 6.000%, 2/01/2018, (AUD) | | | 156,825,899 | |
| | 17,930,000 | | | New South Wales Treasury Corp., Series 17RG, 5.500%, 3/01/2017, (AUD) | | | 17,948,651 | |
| | 11,815 | | | Province of Alberta, 5.930%, 9/16/2016, (CAD) | | | 12,467 | |
| | 489,000 | | | Province of Nova Scotia, 6.600%, 6/01/2027, (CAD) | | | 616,291 | |
| | 29,791,000 | | | Province of Quebec, Canada, Series QC, 6.750%, 11/09/2015, (NZD) | | | 26,135,530 | |
| | 26,518,000 | | | Queensland Treasury Corp., Series 14, 5.750%, 11/21/2014, (AUD) | | | 25,600,394 | |
| | | | | | | | |
| | | | | | | 305,445,623 | |
| | | | | | | | |
| | | | Lodging — 0.5% | | | | |
| | 52,516,000 | | | Choice Hotels International, Inc., 5.700%, 8/28/2020 | | | 54,616,640 | |
| | 100,000 | | | Wyndham Worldwide Corp., 6.000%, 12/01/2016 | | | 110,655 | |
| | | | | | | | |
| | | | | | | 54,727,295 | |
| | | | | | | | |
| | | | Media Cable — 1.1% | | | | |
| | 17,832,000 | | | Shaw Communications, Inc., 5.650%, 10/01/2019, (CAD) | | | 19,032,745 | |
| | 13,630,000 | | | Time Warner Cable, Inc., 4.125%, 2/15/2021 | | | 12,871,954 | |
| | 4,101,000 | | | Time Warner Cable, Inc., 5.850%, 5/01/2017 | | | 4,459,784 | |
| | 64,548,000 | | | Time Warner Cable, Inc., 6.750%, 7/01/2018 | | | 72,086,690 | |
| | | | | | | | |
| | | | | | | 108,451,173 | |
| | | | | | | | |
| | | | Media Non-Cable — 0.4% | | | | |
| | 5,000,000 | | | Clear Channel Communications, Inc., 9.000%, 3/01/2021 | | | 4,837,500 | |
| | 358,000,000 | | | Grupo Televisa SAB, EMTN, 7.250%, 5/14/2043, (MXN) | | | 23,078,918 | |
| | 4,482,000 | | | News America, Inc., 8.150%, 10/17/2036 | | | 5,642,211 | |
| | 6,250,000 | | | R.R. Donnelley & Sons Co., 7.875%, 3/15/2021 | | | 6,703,125 | |
| | | | | | | | |
| | | | | | | 40,261,754 | |
| | | | | | | | |
| | | | Metals & Mining — 2.3% | | | | |
| | 15,000,000 | | | Alcoa, Inc., 5.400%, 4/15/2021 | | | 14,828,880 | |
| | 15,060,000 | | | Alcoa, Inc., 5.870%, 2/23/2022 | | | 15,061,626 | |
| | 45,700,000 | | | Alcoa, Inc., 5.900%, 2/01/2027 | | | 44,194,002 | |
| | 5,505,000 | | | Alcoa, Inc., 5.950%, 2/01/2037 | | | 4,889,442 | |
| | 5,804,000 | | | Alcoa, Inc., 6.750%, 1/15/2028 | | | 5,873,718 | |
| | 430,000 | | | ArcelorMittal, 6.000%, 3/01/2021 | | | 440,750 | |
| | 4,085,000 | | | ArcelorMittal, 6.750%, 2/25/2022 | | | 4,299,463 | |
| | 47,920,000 | | | ArcelorMittal, 7.250%, 3/01/2041 | | | 43,846,800 | |
| | 19,365,000 | | | ArcelorMittal, 7.500%, 10/15/2039 | | | 18,348,338 | |
| | 20,625,000 | | | Barminco Finance Pty Ltd., 9.000%, 6/01/2018, 144A | | | 18,820,312 | |
| | 4,500,000 | | | Essar Steel Algoma, Inc., 9.875%, 6/15/2015, 144A | | | 3,532,500 | |
| | 24,155,000 | | | Plains Exploration & Production Co., 6.500%, 11/15/2020 | | | 25,916,455 | |
| | 4,612,000 | | | United States Steel Corp., 6.650%, 6/01/2037 | | | 3,770,310 | |
| | 31,210,000 | | | United States Steel Corp., 7.000%, 2/01/2018 | | | 33,082,600 | |
| | 3,655,000 | | | Vale Overseas Ltd., 6.875%, 11/21/2036 | | | 3,706,879 | |
| | | | | | | | |
| | | | | | | 240,612,075 | |
| | | | | | | | |
See accompanying notes to financial statements.
19 |
Portfolio of Investments – as of September 30, 2013
Loomis Sayles Investment Grade Bond Fund – (continued)
| | | | | | | | |
Principal
Amount (‡) | | | Description | | Value (†) | |
| | | | Mortgage Related — 0.0% | | | | |
| $ | 49,814 | | | FHLMC, 5.000%, 12/01/2031 | | $ | 53,850 | |
| | 7,312 | | | FNMA, 6.000%, 7/01/2029 | | | 8,102 | |
| | | | | | | | |
| | | | | | | 61,952 | |
| | | | | | | | |
| | | | Non-Captive Consumer — 2.2% | | | | |
| | 90,196,000 | | | SLM Corp., 5.500%, 1/25/2023 | | | 82,582,195 | |
| | 62,425 | (††) | | SLM Corp., 6.000%, 12/15/2043 | | | 1,285,123 | |
| | 2,270,000 | | | SLM Corp., MTN, 4.625%, 9/25/2017 | | | 2,298,375 | |
| | 8,895,000 | | | SLM Corp., MTN, 7.250%, 1/25/2022 | | | 9,050,662 | |
| | 641,000 | | | SLM Corp., MTN, 8.000%, 3/25/2020 | | | 692,280 | |
| | 5,616,000 | | | SLM Corp., Series A, MTN, 0.566%, 1/27/2014(c) | | | 5,588,302 | |
| | 15,792,000 | | | SLM Corp., Series A, MTN, 5.000%, 6/15/2018 | | | 15,544,445 | |
| | 19,496,000 | | | SLM Corp., Series A, MTN, 5.625%, 8/01/2033 | | | 15,206,880 | |
| | 48,535,000 | | | Springleaf Finance Corp., 7.750%, 10/01/2021, 144A | | | 50,355,062 | |
| | 19,414,000 | | | Springleaf Finance Corp., 8.250%, 10/01/2023, 144A | | | 20,190,560 | |
| | 19,727,000 | | | Springleaf Finance Corp., Series J, MTN, 6.900%, 12/15/2017 | | | 20,614,715 | |
| | | | | | | | |
| | | | | | | 223,408,599 | |
| | | | | | | | |
| | | | Non-Captive Diversified — 2.9% | | | | |
| | 3,500,000 | | | General Electric Capital Australia Funding Pty Ltd.,
7.000%, 10/08/2015, (AUD) | | | 3,483,083 | |
| | 10,350,000 | | | General Electric Capital Australia Funding Pty Ltd., MTN,
6.000%, 4/15/2015, (AUD) | | | 10,055,922 | |
| | 1,874,000 | | | General Electric Capital Australia Funding Pty Ltd., MTN,
6.000%, 3/15/2019, (AUD) | | | 1,850,594 | |
| | 1,365,000 | | | General Electric Capital Corp., GMTN, 3.100%, 1/09/2023 | | | 1,276,932 | |
| | 35,580,000 | | | General Electric Capital Corp., GMTN, 4.250%, 1/17/2018, (NZD) | | | 28,830,083 | |
| | 14,225,000 | | | General Electric Capital Corp., Series A, EMTN, 6.750%, 9/26/2016, (NZD) | | | 12,449,257 | |
| | 51,370,000 | | | General Electric Capital Corp., Series A, GMTN, 5.500%, 2/01/2017, (NZD) | | | 43,575,080 | |
| | 36,850,000 | | | General Electric Capital Corp., Series A, GMTN, 7.625%, 12/10/2014, (NZD) | | | 31,961,523 | |
| | 10,247,000 | | | General Electric Capital Corp., Series A, MTN, 0.568%, 5/13/2024(c) | | | 9,574,469 | |
| | 26,931,000 | | | General Electric Capital Corp., Series A, MTN, 6.500%, 9/28/2015, (NZD) | | | 23,343,558 | |
| | 210,000 | | | International Lease Finance Corp., 3.875%, 4/15/2018 | | | 202,913 | |
| | 35,005,000 | | | International Lease Finance Corp., 5.875%, 4/01/2019 | | | 36,444,266 | |
| | 548,000 | | | International Lease Finance Corp., 5.875%, 8/15/2022 | | | 539,780 | |
| | 26,200,000 | | | International Lease Finance Corp., 6.250%, 5/15/2019 | | | 27,510,000 | |
| | 60,419,000 | | | International Lease Finance Corp., 7.125%, 9/01/2018, 144A | | | 67,518,232 | |
| | | | | | | | |
| | | | | | | 298,615,692 | |
| | | | | | | | |
| | | | Oil Field Services — 0.3% | | | | |
| | 5,965,000 | | | Nabors Industries, Inc., 6.150%, 2/15/2018 | | | 6,707,702 | |
| | 23,338,000 | | | Rowan Cos., Inc., 7.875%, 8/01/2019 | | | 28,130,995 | |
| | 587,000 | | | Transocean Ltd., 7.375%, 4/15/2018 | | | 678,394 | |
| | | | | | | | |
| | | | | | | 35,517,091 | |
| | | | | | | | |
| | | | Paper — 1.1% | | | | |
| | 4,365,000 | | | Celulosa Arauco y Constitucion S.A., 7.250%, 7/29/2019 | | | 4,985,546 | |
| | 23,225,000 | | | Georgia-Pacific LLC, 5.400%, 11/01/2020, 144A | | | 25,989,356 | |
| | 715,000 | | | Georgia-Pacific LLC, 7.250%, 6/01/2028 | | | 872,530 | |
See accompanying notes to financial statements.
| 20
Portfolio of Investments – as of September 30, 2013
Loomis Sayles Investment Grade Bond Fund – (continued)
| | | | | | | | |
Principal
Amount (‡) | | | Description | | Value (†) | |
| | | | Paper — continued | | | | |
| $ | 2,672,000 | | | Georgia-Pacific LLC, 7.375%, 12/01/2025 | | $ | 3,357,320 | |
| | 644,000 | | | Georgia-Pacific LLC, 7.750%, 11/15/2029 | | | 814,981 | |
| | 1,031,000 | | | Georgia-Pacific LLC, 8.875%, 5/15/2031 | | | 1,424,362 | |
| | 7,049,000 | | | International Paper Co., 8.700%, 6/15/2038 | | | 9,572,422 | |
| | 5,270,000 | | | Mead Corp. (The), 7.550%, 3/01/2047(b) | | | 5,359,021 | |
| | 5,068,000 | | | Westvaco Corp., 8.200%, 1/15/2030 | | | 5,952,052 | |
| | 26,007,000 | | | Weyerhaeuser Co., 6.875%, 12/15/2033 | | | 30,047,395 | |
| | 7,374,000 | | | Weyerhaeuser Co., 7.375%, 10/01/2019 | | | 8,991,900 | |
| | 13,539,000 | | | Weyerhaeuser Co., 7.375%, 3/15/2032 | | | 16,490,055 | |
| | | | | | | | |
| | | | | | | 113,856,940 | |
| | | | | | | | |
| | | | Pipelines — 3.4% | | | | |
| | 650,000 | | | DCP Midstream LP, 6.450%, 11/03/2036, 144A | | | 676,131 | |
| | 528,000 | | | Energy Transfer Partners LP, 6.125%, 2/15/2017 | | | 597,273 | |
| | 3,328,000 | | | Florida Gas Transmission Co., 7.900%, 5/15/2019, 144A | | | 4,147,513 | |
| | 14,300,000 | | | IFM US Colonial Pipeline 2 LLC, 6.450%, 5/01/2021, 144A | | | 15,025,940 | |
| | 17,765,000 | | | Kinder Morgan Energy Partners LP, 5.300%, 9/15/2020 | | | 19,507,125 | |
| | 7,461,000 | | | Kinder Morgan Energy Partners LP, 5.800%, 3/01/2021 | | | 8,377,121 | |
| | 55,614,000 | | | Kinder Morgan Energy Partners LP, 5.950%, 2/15/2018 | | | 63,677,029 | |
| | 303,000 | | | Kinder Morgan Finance Co. LLC, 5.700%, 1/05/2016 | | | 326,382 | |
| | 27,207,950 | | | Maritimes & Northeast Pipeline LLC, 7.500%, 5/31/2014, 144A(b) | | | 28,149,944 | |
| | 26,165,000 | | | NGPL PipeCo LLC, 7.119%, 12/15/2017, 144A | | | 23,090,612 | |
| | 635,000 | | | NGPL PipeCo LLC, 7.768%, 12/15/2037, 144A | | | 517,525 | |
| | 13,790,000 | | | NiSource Finance Corp., 6.125%, 3/01/2022 | | | 15,532,091 | |
| | 24,110,000 | | | NiSource Finance Corp., 6.400%, 3/15/2018 | | | 27,903,612 | |
| | 21,614,000 | | | NiSource Finance Corp., 6.800%, 1/15/2019 | | | 25,471,299 | |
| | 9,899,000 | | | Panhandle Eastern Pipeline Co., 6.200%, 11/01/2017 | | | 11,356,024 | |
| | 47,594,000 | | | Panhandle Eastern Pipeline Co., 7.000%, 6/15/2018 | | | 55,629,438 | |
| | 1,404,000 | | | Panhandle Eastern Pipeline Co., 8.125%, 6/01/2019 | | | 1,703,435 | |
| | 1,880,000 | | | Plains All American Pipeline LP, 6.125%, 1/15/2017 | | | 2,135,860 | |
| | 15,683,000 | | | Plains All American Pipeline LP, 6.500%, 5/01/2018 | | | 18,499,526 | |
| | 4,125,000 | | | Southern Natural Gas Co., 5.900%, 4/01/2017, 144A | | | 4,689,358 | |
| | 19,574,000 | | | Texas Eastern Transmission LP, 6.000%, 9/15/2017, 144A | | | 22,180,865 | |
| | | | | | | | |
| | | | | | | 349,194,103 | |
| | | | | | | | |
| | | | Property & Casualty Insurance — 0.4% | | | | |
| | 2,740,000 | | | Fidelity National Financial, Inc., 5.500%, 9/01/2022 | | | 2,888,333 | |
| | 3,083,000 | | | Hanover Insurance Group, Inc. (The), 7.500%, 3/01/2020 | | | 3,489,006 | |
| | 9,038,000 | | | Liberty Mutual Group, Inc., 6.500%, 3/15/2035, 144A | | | 9,724,987 | |
| | 1,889,000 | | | MBIA Insurance Corp., 11.528%, 1/15/2033, 144A(c)(f) | | | 1,265,630 | |
| | 14,575,000 | | | Nationwide Mutual Insurance Co., 6.600%, 4/15/2034, 144A | | | 14,757,188 | |
| | 7,609,000 | | | White Mountains Re Group Ltd., 6.375%, 3/20/2017, 144A | | | 8,319,376 | |
| | 2,212,000 | | | XL Group PLC, 6.250%, 5/15/2027 | | | 2,487,887 | |
| | 1,463,000 | | | XL Group PLC, 6.375%, 11/15/2024 | | | 1,677,691 | |
| | | | | | | | |
| | | | | | | 44,610,098 | |
| | | | | | | | |
| | | | Property Trust — 0.4% | | | | |
| | 36,192,000 | | | WEA Finance LLC/WT Finance Australia Property Ltd.,
6.750%, 9/02/2019, 144A | | | 43,032,795 | |
| | | | | | | | |
See accompanying notes to financial statements.
21 |
Portfolio of Investments – as of September 30, 2013
Loomis Sayles Investment Grade Bond Fund – (continued)
| | | | | | | | |
Principal
Amount (‡) | | | Description | | Value (†) | |
| | | | Railroads — 0.1% | | | | |
| $ | 9,787,000 | | | Canadian Pacific Railway Co., 7.250%, 5/15/2019 | | $ | 12,001,553 | |
| | 237,000 | | | Missouri Pacific Railroad Co., 4.750%, 1/01/2030(b) | | | 213,300 | |
| | 1,701,000 | | | Missouri Pacific Railroad Co., 5.000%, 1/01/2045(b) | | | 1,411,830 | |
| | 191,000 | | | Missouri Pacific Railroad Co., Series A, 4.750%, 1/01/2020(b) | | | 177,630 | |
| | | | | | | | |
| | | | | | | 13,804,313 | |
| | | | | | | | |
| | | | Real Estate Operations/Development — 0.1% | | | | |
| | 10,276,000 | | | First Industrial LP, 5.950%, 5/15/2017 | | | 10,912,136 | |
| | | | | | | | |
| | | | Refining — 0.1% | | | | |
| | 7,700,000 | | | Reliance Holdings USA, Inc., 5.400%, 2/14/2022, 144A | | | 7,716,278 | |
| | | | | | | | |
| | | | REITs – Apartments — 0.3% | | | | |
| | 12,243,000 | | | Camden Property Trust, 5.000%, 6/15/2015 | | | 13,015,937 | |
| | 16,491,000 | | | Camden Property Trust, 5.700%, 5/15/2017 | | | 18,334,925 | |
| | | | | | | | |
| | | | | | | 31,350,862 | |
| | | | | | | | |
| | | | REITs – Diversified — 0.3% | | | | |
| | 4,140,000 | | | Duke Realty LP, 5.950%, 2/15/2017 | | | 4,618,075 | |
| | 19,574,000 | | | Duke Realty LP, 6.500%, 1/15/2018 | | | 22,520,180 | |
| | | | | | | | |
| | | | | | | 27,138,255 | |
| | | | | | | | |
| | | | REITs – Healthcare — 0.1% | | | | |
| | 5,972,000 | | | Health Care REIT, Inc., 6.500%, 3/15/2041 | | | 6,369,586 | |
| | | | | | | | |
| | | | REITs – Office Property — 0.4% | | | | |
| | 20,817,000 | | | Highwoods Properties, Inc., 5.850%, 3/15/2017 | | | 22,912,710 | |
| | 11,306,000 | | | Highwoods Properties, Inc., 7.500%, 4/15/2018 | | | 13,279,824 | |
| | | | | | | | |
| | | | | | | 36,192,534 | |
| | | | | | | | |
| | | | REITs – Shopping Centers — 0.1% | | | | |
| | 4,893,000 | | | Equity One, Inc., 6.000%, 9/15/2017 | | | 5,464,933 | |
| | | | | | | | |
| | | | REITs – Single Tenant — 0.4% | | | | |
| | 5,862,000 | | | Realty Income Corp., 5.750%, 1/15/2021 | | | 6,471,361 | |
| | 25,529,000 | | | Realty Income Corp., 6.750%, 8/15/2019 | | | 30,116,536 | |
| | | | | | | | |
| | | | | | | 36,587,897 | |
| | | | | | | | |
| | | | REITs – Warehouse/Industrials — 0.6% | | | | |
| | 3,873,000 | | | ProLogis LP, 5.625%, 11/15/2015 | | | 4,151,217 | |
| | 11,179,000 | | | ProLogis LP, 5.625%, 11/15/2016 | | | 12,370,871 | |
| | 10,889,000 | | | ProLogis LP, 5.750%, 4/01/2016 | | | 11,980,176 | |
| | 9,698,000 | | | ProLogis LP, 6.625%, 5/15/2018 | | | 11,339,668 | |
| | 18,869,000 | | | ProLogis LP, 7.375%, 10/30/2019 | | | 23,128,450 | |
| | | | | | | | |
| | | | | | | 62,970,382 | |
| | | | | | | | |
| | | | Restaurants — 0.1% | | | | |
| | 10,320,000 | | | Darden Restaurants, Inc., 6.000%, 8/15/2035 | | | 9,987,582 | |
| | | | | | | | |
| | | | Retailers — 0.3% | | | | |
| | 5,296,000 | | | J.C. Penney Corp., Inc., 5.750%, 2/15/2018 | | | 4,157,360 | |
| | 6,397,000 | | | J.C. Penney Corp., Inc., 6.375%, 10/15/2036 | | | 4,461,908 | |
| | 6,076,000 | | | J.C. Penney Corp., Inc., 7.625%, 3/01/2097 | | | 4,070,920 | |
See accompanying notes to financial statements.
| 22
Portfolio of Investments – as of September 30, 2013
Loomis Sayles Investment Grade Bond Fund – (continued)
| | | | | | | | |
Principal
Amount (‡) | | | Description | | Value (†) | |
| | | | Retailers — continued | | | | |
| $ | 10,467,000 | | | Macy’s Retail Holdings, Inc., 6.790%, 7/15/2027 | | $ | 11,794,163 | |
| | 8,064,000 | | | Marks & Spencer PLC, 7.125%, 12/01/2037, 144A | | | 8,221,393 | |
| | | | | | | | |
| | | | | | | 32,705,744 | |
| | | | | | | | |
| | | | Sovereigns — 1.3% | | | | |
| | 43,590,000 | | | Republic of Brazil, 8.500%, 1/05/2024, (BRL) | | | 17,769,961 | |
| | 23,848,000 | | | Republic of Brazil, 10.250%, 1/10/2028, (BRL) | | | 10,733,375 | |
| | 52,555,000 | | | Republic of Croatia, 6.750%, 11/05/2019, 144A | | | 56,036,769 | |
| | 33,600,000 | | | Republic of Iceland, 5.875%, 5/11/2022, 144A | | | 34,524,000 | |
| | 1,415,381,000 | | | Republic of Iceland, 6.000%, 10/13/2016, (ISK) | | | 8,219,568 | |
| | 391,985,000 | | | Republic of Iceland, 7.250%, 10/26/2022, (ISK) | | | 2,311,398 | |
| | 820,777,000 | | | Republic of Iceland, 8.750%, 2/26/2019, (ISK) | | | 5,204,827 | |
| | | | | | | | |
| | | | | | | 134,799,898 | |
| | | | | | | | |
| | | | Supermarkets — 0.4% | | | | |
| | 4,130,000 | | | American Stores Co., Series B, MTN, 7.100%, 3/20/2028 | | | 4,935,350 | |
| | 1,120,000 | | | Delhaize Group S.A., 5.700%, 10/01/2040 | | | 1,094,079 | |
| | 3,269,000 | | | Kroger Co. (The), 6.400%, 8/15/2017 | | | 3,767,336 | |
| | 6,595,000 | | | New Albertson’s, Inc., 7.450%, 8/01/2029 | | | 5,292,488 | |
| | 7,875,000 | | | New Albertson’s, Inc., 8.000%, 5/01/2031 | | | 6,477,187 | |
| | 979,000 | | | New Albertson’s, Inc., Series C, MTN, 6.625%, 6/01/2028 | | | 704,880 | |
| | 17,290,000 | | | SUPERVALU, Inc., 6.750%, 6/01/2021, 144A | | | 16,425,500 | |
| | | | | | | | |
| | | | | | | 38,696,820 | |
| | | | | | | | |
| | | | Supranational — 0.6% | | | | |
| | 11,745,000 | | | European Bank for Reconstruction & Development, EMTN,
9.000%, 4/28/2014, (BRL) | | | 5,293,543 | |
| | 9,640,000 | | | European Investment Bank, MTN, 6.000%, 8/06/2020, (AUD) | | | 9,641,880 | |
| | 12,982,000 | | | Inter-American Development Bank, EMTN, 6.000%, 12/15/2017, (NZD) | | | 11,372,896 | |
| | 15,070,000 | | | International Bank for Reconstruction & Development,
1.430%, 3/05/2014, (SGD) | | | 12,039,099 | |
| | 58,420,000 | | | International Finance Corp., GMTN, 5.000%, 12/21/2015, (BRL) | | | 24,208,333 | |
| | | | | | | | |
| | | | | | | 62,555,751 | |
| | | | | | | | |
| | | | Technology — 2.1% | | | | |
| | 4,600,000 | | | Alcatel-Lucent USA, Inc., 6.450%, 3/15/2029 | | | 3,887,000 | |
| | 1,028,000 | | | Arrow Electronics, Inc., 6.875%, 6/01/2018 | | | 1,174,078 | |
| | 1,507,000 | | | Avnet, Inc., 6.625%, 9/15/2016 | | | 1,704,574 | |
| | 56,271,000 | | | Corning, Inc., 7.000%, 5/15/2024 | | | 67,420,086 | |
| | 7,487,000 | | | Corning, Inc., 7.250%, 8/15/2036 | | | 8,977,984 | |
| | 7,051,000 | | | Equifax, Inc., 7.000%, 7/01/2037 | | | 8,022,459 | |
| | 112,000 | | | Freescale Semiconductor, Inc., 10.125%, 12/15/2016 | | | 114,800 | |
| | 70,969,000 | | | Ingram Micro, Inc., 5.250%, 9/01/2017 | | | 75,363,968 | |
| | 7,795,000 | | | Intuit, Inc., 5.750%, 3/15/2017 | | | 8,684,791 | |
| | 19,078,000 | | | KLA-Tencor Corp., 6.900%, 5/01/2018 | | | 22,470,507 | |
| | 1,502,000 | | | Motorola Solutions, Inc., 6.625%, 11/15/2037 | | | 1,527,893 | |
| | 2,115,000 | | | Samsung Electronics Co. Ltd., 7.700%, 10/01/2027, 144A | | | 2,563,289 | |
| | 5,603,000 | | | Tyco Electronics Group S.A., 6.550%, 10/01/2017 | | | 6,460,629 | |
See accompanying notes to financial statements.
23 |
Portfolio of Investments – as of September 30, 2013
Loomis Sayles Investment Grade Bond Fund – (continued)
| | | | | | | | |
Principal
Amount (‡) | | | Description | | Value (†) | |
| | | | Technology — continued | | | | |
| $ | 561,000 | | | Xerox Corp., 6.350%, 5/15/2018 | | $ | 644,317 | |
| | 7,110,000 | | | Xerox Corp., 6.750%, 2/01/2017 | | | 8,125,194 | |
| | | | | | | | |
| | | | | | | 217,141,569 | |
| | | | | | | | |
| | | | Textile — 0.0% | | | | |
| | 3,755,000 | | | Phillips-Van Heusen Corp., 7.750%, 11/15/2023 | | | 4,350,584 | |
| | | | | | | | |
| | | | Transportation Services — 0.7% | | | | |
| | 8,436,000 | | | Erac USA Finance Co., 6.375%, 10/15/2017, 144A | | | 9,791,834 | |
| | 2,824,000 | | | Erac USA Finance Co., 6.700%, 6/01/2034, 144A | | | 3,193,012 | |
| | 51,504,000 | | | Erac USA Finance Co., 7.000%, 10/15/2037, 144A | | | 61,025,905 | |
| | | | | | | | |
| | | | | | | 74,010,751 | |
| | | | | | | | |
| | | | Treasuries — 20.5% | | | | |
| | 106,195,000 | | | Canadian Government, 1.000%, 8/01/2016, (CAD) | | | 101,946,375 | |
| | 206,210,000 | | | Canadian Government, 2.250%, 8/01/2014, (CAD) | | | 202,168,080 | |
| | 372,145,000 | | | Canadian Government, 2.500%, 6/01/2015, (CAD) | | | 369,348,629 | |
| | 90,055,000 | | | Canadian Government, 2.750%, 9/01/2016, (CAD) | | | 90,729,943 | |
| | 156,655,000 | | | Canadian Government, 3.000%, 12/01/2015, (CAD) | | | 157,807,803 | |
| | 79,485,000 | | | Canadian Government, 3.750%, 6/01/2019, (CAD) | | | 84,326,405 | |
| | 4,159,000 | | | Canadian Government, 4.000%, 6/01/2016, (CAD) | | | 4,320,789 | |
| | 183,949,000 | | | Canadian Government, 4.250%, 6/01/2018, (CAD) | | | 197,980,234 | |
| | 1,130,000 | | | Italy Buoni Poliennali Del Tesoro, 5.000%, 8/01/2034, (EUR) | | | 1,527,663 | |
| | 1,130,000 | | | Italy Buoni Poliennali Del Tesoro, 5.250%, 11/01/2029, (EUR) | | | 1,586,232 | |
| | 1,120,000 | | | Italy Buoni Poliennali Del Tesoro, 5.750%, 2/01/2033, (EUR) | | | 1,652,745 | |
| | 2,105,000 | (†††) | | Mexican Fixed Rate Bonds, Series M-20, 8.000%, 12/07/2023, (MXN) | | | 18,383,254 | |
| | 109,763,000 | | | New Zealand Government Bond, 6.000%, 12/15/2017, (NZD) | | | 98,484,137 | |
| | 974,276,000 | | | Norwegian Government Bond, 4.250%, 5/19/2017, (NOK) | | | 174,918,450 | |
| | 802,302,000 | | | Norwegian Government Bond, 5.000%, 5/15/2015, (NOK) | | | 140,465,458 | |
| | 18,786,446 | | | Portugal Obrigacoes do Tesouro OT, 3.850%, 4/15/2021, 144A, (EUR) | | | 21,177,818 | |
| | 4,599,829 | | | Portugal Obrigacoes do Tesouro OT, 4.800%, 6/15/2020, 144A, (EUR) | | | 5,591,159 | |
| | 43,375,000 | | | Portugal Obrigacoes do Tesouro OT, 4.950%, 10/25/2023, 144A, (EUR) | | | 50,934,143 | |
| | 6,000,000 | | | Singapore Government Bond, 1.375%, 10/01/2014, (SGD) | | | 4,832,531 | |
| | 227,965,000 | | | U.S. Treasury Bond, 2.750%, 11/15/2042 | | | 188,676,600 | |
| | 235,390,000 | | | U.S. Treasury Bond, 2.875%, 5/15/2043 | | | 199,787,262 | |
| | | | | | | | |
| | | | | | | 2,116,645,710 | |
| | | | | | | | |
| | | | Wireless — 0.9% | | | | |
| | 559,910,000 | | | America Movil SAB de CV, 6.450%, 12/05/2022, (MXN) | | | 40,044,334 | |
| | 31,416,000 | | | Cellco Partnership/Verizon Wireless Capital LLC, 8.500%, 11/15/2018 | | | 40,259,164 | |
| | 6,373,000 | | | Sprint Capital Corp., 6.875%, 11/15/2028 | | | 5,687,902 | |
| | 2,594,000 | | | Sprint Capital Corp., 6.900%, 5/01/2019 | | | 2,665,335 | |
| | 612,000 | | | Sprint Capital Corp., 8.750%, 3/15/2032 | | | 621,945 | |
| | | | | | | | |
| | | | | | | 89,278,680 | |
| | | | | | | | |
| | | | Wirelines — 4.7% | | | | |
| | 406,000 | | | Bell Canada, MTN, 7.300%, 2/23/2032, (CAD) | | | 489,778 | |
| | 2,936,000 | | | BellSouth Telecommunications, Inc., 5.850%, 11/15/2045 | | | 2,727,350 | |
| | 62,040,000 | | | CenturyLink, Inc., 6.450%, 6/15/2021 | | | 61,729,800 | |
| | 4,990,000 | | | CenturyLink, Inc., Series G, 6.875%, 1/15/2028 | | | 4,540,900 | |
See accompanying notes to financial statements.
| 24
Portfolio of Investments – as of September 30, 2013
Loomis Sayles Investment Grade Bond Fund – (continued)
| | | | | | | | |
Principal
Amount (‡) | | | Description | | Value (†) | |
| | | | Wirelines — continued | | | | |
| $ | 2,708,000 | | | CenturyLink, Inc., Series P, 7.600%, 9/15/2039 | | $ | 2,416,890 | |
| | 103,506,000 | | | Deutsche Telekom International Finance BV, 6.000%, 7/08/2019 | | | 120,960,424 | |
| | 24,103,000 | | | Embarq Corp., 7.995%, 6/01/2036 | | | 24,538,565 | |
| | 825,000 | | | Level 3 Financing, Inc., 7.000%, 6/01/2020 | | | 833,250 | |
| | 200,000 | | | Level 3 Financing, Inc., 9.375%, 4/01/2019 | | | 220,500 | |
| | 5,200,000 | | | Oi S.A., 9.750%, 9/15/2016, 144A, (BRL) | | | 2,054,848 | |
| | 8,450,000 | | | Portugal Telecom International Finance BV, EMTN, 4.500%, 6/16/2025, (EUR) | | | 10,082,659 | |
| | 18,850,000 | | | Portugal Telecom International Finance BV, EMTN, 5.000%, 11/04/2019, (EUR) | | | 25,628,737 | |
| | 200,000 | | | Portugal Telecom International Finance BV, EMTN, 5.625%, 2/08/2016, (EUR) | | | 282,746 | |
| | 300,000 | | | Portugal Telecom International Finance BV, GMTN, 4.375%, 3/24/2017, (EUR) | | | 410,945 | |
| | 1,698,000 | | | Qwest Capital Funding, Inc., 6.500%, 11/15/2018 | | | 1,833,840 | |
| | 2,755,000 | | | Qwest Capital Funding, Inc., 6.875%, 7/15/2028 | | | 2,451,950 | |
| | 4,370,000 | | | Qwest Capital Funding, Inc., 7.625%, 8/03/2021 | | | 4,435,550 | |
| | 3,469,000 | | | Qwest Capital Funding, Inc., 7.750%, 2/15/2031 | | | 3,278,205 | |
| | 333,000 | | | Qwest Corp., 6.500%, 6/01/2017 | | | 375,332 | |
| | 14,480,000 | | | Qwest Corp., 6.875%, 9/15/2033 | | | 14,026,718 | |
| | 4,668,000 | | | Qwest Corp., 7.200%, 11/10/2026 | | | 4,670,451 | |
| | 9,077,000 | | | Qwest Corp., 7.250%, 9/15/2025 | | | 10,152,243 | |
| | 9,474,000 | | | Qwest Corp., 7.250%, 10/15/2035 | | | 9,298,210 | |
| | 46,411,000 | | | Telecom Italia Capital S.A., 6.000%, 9/30/2034 | | | 38,170,866 | |
| | 23,660,000 | | | Telecom Italia Capital S.A., 6.375%, 11/15/2033 | | | 20,322,094 | |
| | 4,200,000 | | | Telefonica Emisiones SAU, 4.570%, 4/27/2023 | | | 4,027,703 | |
| | 525,000 | | | Telefonica Emisiones SAU, 5.134%, 4/27/2020 | | | 537,513 | |
| | 975,000 | | | Telefonica Emisiones SAU, 5.462%, 2/16/2021 | | | 998,363 | |
| | 14,375,000 | | | Telefonica Emisiones SAU, 7.045%, 6/20/2036 | | | 15,257,582 | |
| | 1,700,000 | | | Telefonica Emisiones SAU, EMTN, 5.289%, 12/09/2022, (GBP) | | | 2,762,645 | |
| | 2,700,000 | | | Telefonica Emisiones SAU, EMTN, 5.375%, 2/02/2026, (GBP) | | | 4,250,532 | |
| | 2,100,000 | | | Telefonica Emisiones SAU, EMTN, 5.445%, 10/08/2029, (GBP) | | | 3,223,347 | |
| | 8,800,000 | | | Telefonica Emisiones SAU, EMTN, 5.597%, 3/12/2020, (GBP) | | | 14,947,989 | |
| | 14,137,000 | | | Telus Corp., 4.950%, 3/15/2017, (CAD) | | | 14,801,544 | |
| | 54,665,000 | | | Telus Corp., Series CG, 5.050%, 12/04/2019, (CAD) | | | 58,030,715 | |
| | 2,642,000 | | | Verizon New England, Inc., 7.875%, 11/15/2029 | | | 3,082,176 | |
| | 2,095,000 | | | Verizon Pennsylvania, Inc., 6.000%, 12/01/2028 | | | 2,038,512 | |
| | | | | | | | |
| | | | | | | 489,891,472 | |
| | | | | | | | |
| | | | Total Non-Convertible Bonds
(Identified Cost $8,358,005,814) | | | 9,023,012,663 | |
| | | | | | | | |
| | | | | | | | |
| | Convertible Bonds — 4.6% | | | | |
| | | | Automotive — 0.7% | | | | |
| | 34,827,000 | | | Ford Motor Co., 4.250%, 11/15/2016 | | | 68,805,092 | |
| | | | | | | | |
| | | | Independent Energy — 0.4% | | | | |
| | 34,700,000 | | | Chesapeake Energy Corp., 2.500%, 5/15/2037 | | | 34,092,750 | |
| | 11,225,000 | | | Chesapeake Energy Corp., 2.750%, 11/15/2035 | | | 11,589,812 | |
| | | | | | | | |
| | | | | | | 45,682,562 | |
| | | | | | | | |
| | | | Life Insurance — 0.8% | | | | |
| | 72,915,000 | | | Old Republic International Corp., 3.750%, 3/15/2018 | | | 86,176,416 | |
| | | | | | | | |
See accompanying notes to financial statements.
25 |
Portfolio of Investments – as of September 30, 2013
Loomis Sayles Investment Grade Bond Fund – (continued)
| | | | | | | | |
Principal
Amount (‡) | | | Description | | Value (†) | |
| | | | Metals & Mining — 0.2% | | | | |
| $ | 17,800,000 | | | United States Steel Corp., 2.750%, 4/01/2019 | | $ | 19,702,375 | |
| | | | | | | | |
| | | | REITs – Warehouse/Industrials — 0.3% | | | | |
| | 27,359,000 | | | ProLogis LP, 3.250%, 3/15/2015 | | | 30,966,968 | |
| | | | | | | | |
| | | | Technology — 2.2% | | | | |
| | 35,120,000 | | | Intel Corp., 2.950%, 12/15/2035 | | | 38,017,400 | |
| | 137,016,000 | | | Intel Corp., 3.250%, 8/01/2039 | | | 169,642,935 | |
| | 11,515,000 | | | Lam Research Corp., Series B, 1.250%, 5/15/2018 | | | 13,853,984 | |
| | 385,192 | | | Liberty Media LLC, 3.500%, 1/15/2031 | | | 198,374 | |
| | 30,000 | | | Micron Technology, Inc., Series B, 1.875%, 8/01/2031 | | | 56,231 | |
| | 85,000 | | | Micron Technology, Inc., Series C, 2.375%, 5/01/2032 | | | 162,563 | |
| | | | | | | | |
| | | | | | | 221,931,487 | |
| | | | | | | | |
| | | | Wirelines — 0.0% | | | | |
| | 2,926,000 | | | Level 3 Communications, Inc., 7.000%, 3/15/2015, 144A(b) | | | 3,551,433 | |
| | | | | | | | |
| | | | Total Convertible Bonds
(Identified Cost $379,234,419) | | | 476,816,333 | |
| | | | | | | | |
| | | | | | | | |
| | Municipals — 0.8% | | | | |
| | | | District of Columbia — 0.2% | | | | |
| | 14,680,000 | | | Metropolitan Washington Airports Authority, 7.462%, 10/01/2046 | | | 16,697,766 | |
| | | | | | | | |
| | | | Illinois — 0.5% | | | | |
| | 530,000 | | | Chicago O’Hare International Airport, Series A, (AGMC insured),
4.500%, 1/01/2038 | | | 490,165 | |
| | 24,640,000 | | | State of Illinois, 5.100%, 6/01/2033 | | | 21,846,564 | |
| | 33,395,000 | | | State of Illinois, Series B, 5.520%, 4/01/2038 | | | 27,745,234 | |
| | | | | | | | |
| | | | | | | 50,081,963 | |
| | | | | | | | |
| | | | Michigan — 0.0% | | | | |
| | 2,345,000 | | | Michigan Tobacco Settlement Finance Authority Taxable Turbo, Series A,
7.309%, 6/01/2034 | | | 1,848,188 | |
| | | | | | | | |
| | | | Ohio — 0.0% | | | | |
| | 5,075,000 | | | Buckeye Tobacco Settlement Financing Authority, Series A-2,
5.875%, 6/01/2047 | | | 3,794,831 | |
| | | | | | | | |
| | | | Virginia — 0.1% | | | | |
| | 13,845,000 | | | Virginia Tobacco Settlement Financing Corp., Series A-1, 6.706%, 6/01/2046 | | | 9,585,447 | |
| | | | | | | | |
| | | | Total Municipals
(Identified Cost $88,240,612) | | | 82,008,195 | |
| | | | | | | | |
| | | | Total Bonds and Notes
(Identified Cost $8,825,480,845) | | | 9,581,837,191 | |
| | | | | | | | |
| | | | | | | | |
| | Senior Loans — 0.5% | | | | |
| | | | Non-Captive Diversified — 0.4% | | | | |
| | 27,638,933 | | | AWAS Finance Luxembourg 2012 S.A., New Term Loan, 3.500%, 7/16/2018(c) | | | 27,638,933 | |
| | 17,078,112 | | | AWAS Finance Luxembourg S.A.R.L., Term Loan B, 3.500%, 6/10/2016(c) | | | 17,056,765 | |
| | | | | | | | |
| | | | | | | 44,695,698 | |
| | | | | | | | |
See accompanying notes to financial statements.
| 26
Portfolio of Investments – as of September 30, 2013
Loomis Sayles Investment Grade Bond Fund – (continued)
| | | | | | | | |
Principal
Amount (‡) | | | Description | | Value (†) | |
| | | | Supermarket — 0.1% | | | | |
| $ | 9,200,651 | | | Supervalu, Inc., Refi Term Loan B, 5.000%, 3/21/2019(c) | | $ | 9,166,149 | |
| | | | | | | | |
| | | | Total Senior Loans
(Identified Cost $53,917,697) | | | 53,861,847 | |
| | | | | | | | |
| | | | | | | | |
| Shares | | | | | | |
| | Common Stocks — 2.5% | | | | |
| | | | Electronic Equipment, Instruments & Components — 2.5% | | | | |
| | 17,550,000 | | | Corning, Inc.
(Identified Cost $226,654,590) | | | 256,054,500 | |
| | | | | | | | |
| | | | | | | | |
| | Preferred Stocks — 0.2% | | | | |
| | | | Independent Energy — 0.0% | | | | |
| | 43,031 | | | Chesapeake Energy Corp., 5.000% | | | 3,997,580 | |
| | | | | | | | |
| | | | Metals & Mining — 0.1% | | | | |
| | 340,285 | | | ArcelorMittal, 6.000% | | | 7,312,725 | |
| | | | | | | | |
| | | | REITs – Diversified — 0.1% | | | | |
| | 258,873 | | | Weyerhaeuser Co., Series A, 6.375% | | | 13,715,091 | |
| | | | | | | | |
| | | | Total Preferred Stocks
(Identified Cost $25,066,559) | | | 25,025,396 | |
| | | | | | | | |
| | | | | | | | |
Principal
Amount (‡) | | | | | | |
| | Short-Term Investments — 2.9% | | | | |
| $ | 147,553 | | | Repurchase Agreement with State Street Bank and Trust Company, dated 9/30/2013 at 0.000%, to be repurchased at $147,553 on 10/01/2013 collateralized by $170,000 Federal National Mortgage Association, 2.080% due 11/02/2022 valued at $157,960 including accrued interest (Note 2 of Notes to Financial Statements) | | | 147,553 | |
| | 296,199,438 | | | Tri-Party Repurchase Agreement with Fixed Income Clearing Corporation, dated 9/30/2013 at 0.000% to be repurchased at $296,199,438 on 10/01/2013 collateralized by $294,755,000 U.S. Treasury Note, 2.625% due 7/31/2014 valued at $302,123,875 including accrued interest (Note 2 of Notes to Financial Statements) | | | 296,199,438 | |
| | | | | | | | |
| | | | Total Short-Term Investments
(Identified Cost $296,346,991) | | | 296,346,991 | |
| | | | | | | | |
| | | | | | | | |
| | | | Total Investments — 98.8%
(Identified Cost $9,427,466,682)(a) | | | 10,213,125,925 | |
| | | | Other assets less liabilities — 1.2% | | | 125,684,550 | |
| | | | | | | | |
| | | | Net Assets — 100.0% | | $ | 10,338,810,475 | |
| | | | | | | | |
| | | | | | | | |
| | (‡) | | | Principal Amount stated in U.S. dollars unless otherwise noted. | | | | |
| | (†) | | | See Note 2 of Notes to Financial Statements. | | | | |
| | (††) | | | Amount shown represents units. One unit represents a principal amount of 25. | | | | |
| | (†††) | | | Amount shown represents units. One unit represents a principal amount of 100. | | | | |
See accompanying notes to financial statements.
27 |
Portfolio of Investments – as of September 30, 2013
Loomis Sayles Investment Grade Bond Fund – (continued)
| | | | | | | | |
| | | | | | | | |
| | (a) | | | Federal Tax Information: | | | | |
| | | | At September 30, 2013, the net unrealized appreciation on investments based on a cost of $9,504,169,521 for federal income tax purposes was as follows: | |
| | | | Aggregate gross unrealized appreciation for all investments in which there is an excess of value over tax cost | | $ | 892,918,119 | |
| | | | Aggregate gross unrealized depreciation for all investments in which there is an excess of tax cost over value | | | (183,961,715 | ) |
| | | | | | | | |
| | | | Net unrealized appreciation | | $ | 708,956,404 | |
| | | | | | | | |
| | (b) | | | Illiquid security. At September 30, 2013, the value of these securities amounted to $68,797,084 or 0.7% of net assets. | |
| | (c) | | | Variable rate security. Rate as of September 30, 2013 is disclosed. | |
| | (d) | | | Coupon rate is a fixed rate for an initial period then resets at a specified date and rate. | |
| | (e) | | | The issuer is in default with respect to interest and/or principal payments. Income is not being accrued. | |
| | (f) | | | Non-income producing security. | |
| | (g) | | | Perpetual bond with no specified maturity date. | | | | |
| | | | | | | | |
| | 144A | | | All or a portion of these securities are exempt from registration under Rule 144A of the Securities Act of 1933. These securities may be resold in transactions exempt from registration, normally to qualified institutional buyers. At September 30, 2013, the value of Rule 144A holdings amounted to $1,699,623,657 or 16.4% of net assets. | |
| | ABS | | | Asset-Backed Securities | | | | |
| | AGMC | | | Assured Guaranty Municipal Corp. | | | | |
| | EMTN | | | Euro Medium Term Note | | | | |
| | FHLMC | | | Federal Home Loan Mortgage Corp. | | | | |
| | FNMA | | | Federal National Mortgage Association | | | | |
| | GMTN | | | Global Medium Term Note | | | | |
| | MTN | | | Medium Term Note | | | | |
| | REITs | | | Real Estate Investment Trusts | | | | |
| | REMIC | | | Real Estate Mortgage Investment Conduit | | | | |
| | | | | | | | |
| | AUD | | | Australian Dollar | | | | |
| | BRL | | | Brazilian Real | | | | |
| | CAD | | | Canadian Dollar | | | | |
| | EUR | | | Euro | | | | |
| | GBP | | | British Pound | | | | |
| | IDR | | | Indonesian Rupiah | | | | |
| | ISK | | | Icelandic Krona | | | | |
| | KRW | | | South Korean Won | | | | |
| | MXN | | | Mexican Peso | | | | |
| | NOK | | | Norwegian Krone | | | | |
| | NZD | | | New Zealand Dollar | | | | |
| | SGD | | | Singapore Dollar | | | | |
See accompanying notes to financial statements.
| 28
Portfolio of Investments – as of September 30, 2013
Loomis Sayles Investment Grade Bond Fund – (continued)
Industry Summary at September 30, 2013 (Unaudited)
| | | | |
Treasuries | | | 20.5 | % |
Banking | | | 15.4 | |
Wirelines | | | 4.8 | |
Technology | | | 4.2 | |
Pipelines | | | 3.4 | |
Non-Captive Diversified | | | 3.3 | |
Local Authorities | | | 3.0 | |
Airlines | | | 2.9 | |
Metals & Mining | | | 2.6 | |
Commercial Mortgage-Backed Securities | | | 2.5 | |
Electronic Equipment, Instruments & Components | | | 2.5 | |
Non-Captive Consumer | | | 2.2 | |
Electric | | | 2.0 | |
Other Investments, less than 2% each | | | 26.6 | |
Short-Term Investments | | | 2.9 | |
| | | | |
Total Investments | | | 98.8 | |
Other assets less liabilities | | | 1.2 | |
| | | | |
Net Assets | | | 100.0 | % |
| | | | |
Currency Exposure Summary at September 30, 2013 (Unaudited)
| | | | |
United States Dollar | | | 68.4 | % |
Canadian Dollar | | | 13.8 | |
New Zealand Dollar | | | 5.1 | |
Australian Dollar | | | 3.3 | |
Norwegian Krone | | | 3.1 | |
Euro | | | 2.2 | |
Other, less than 2% each | | | 2.9 | |
| | | | |
Total Investments | | | 98.8 | |
Other assets less liabilities | | | 1.2 | |
| | | | |
Net Assets | | | 100.0 | % |
| | | | |
See accompanying notes to financial statements.
29 |
This Page Intentionally Left Blank
| 30
Statement of Assets and Liabilities
September 30, 2013
| | | | |
ASSETS | | | | |
Investments at cost | | $ | 9,427,466,682 | |
Net unrealized appreciation | | | 785,659,243 | |
| | | | |
Investments at value | | | 10,213,125,925 | |
Foreign currency at value (identified cost $1,679,739) | | | 1,724,764 | |
Receivable for Fund shares sold | | | 21,839,560 | |
Dividends and interest receivable | | | 130,471,616 | |
Tax reclaims receivable | | | 734,782 | |
| | | | |
TOTAL ASSETS | | | 10,367,896,647 | |
| | | | |
LIABILITIES | | | | |
Payable for Fund shares redeemed | | | 24,056,987 | |
Management fees payable (Note 5) | | | 3,404,117 | |
Deferred Trustees’ fees (Note 5) | | | 492,590 | |
Administrative fees payable (Note 5) | | | 376,817 | |
Payable to distributor (Note 5d) | | | 161,763 | |
Other accounts payable and accrued expenses | | | 593,898 | |
| | | | |
TOTAL LIABILITIES | | | 29,086,172 | |
| | | | |
NET ASSETS | | $ | 10,338,810,475 | |
| | | | |
NET ASSETS CONSIST OF: | | | | |
Paid-in capital | | $ | 9,346,058,338 | |
Undistributed net investment income | | | 15,275,810 | |
Accumulated net realized gain on investments and foreign currency transactions | | | 191,516,235 | |
Net unrealized appreciation on investments and foreign currency translations | | | 785,960,092 | |
| | | | |
NET ASSETS | | $ | 10,338,810,475 | |
| | | | |
See accompanying notes to financial statements.
31 |
Statement of Assets and Liabilities (continued)
September 30, 2013
| | | | |
COMPUTATION OF NET ASSET VALUE AND OFFERING PRICE: | | | | |
Class A shares: | | | | |
Net assets | | $ | 2,431,718,261 | |
| | | | |
Shares of beneficial interest | | | 199,014,246 | |
| | | | |
Net asset value and redemption price per share | �� | $ | 12.22 | |
| | | | |
Offering price per share (100/95.50 of net asset value) (Note 1) | | $ | 12.80 | |
| | | | |
Class B shares: (redemption price per share is equal to net asset value less any applicable contingent deferred sales charge) (Note 1) | | | | |
Net assets | | $ | 7,972,156 | |
| | | | |
Shares of beneficial interest | | | 655,817 | |
| | | | |
Net asset value and offering price per share | | $ | 12.16 | |
| | | | |
Class C shares: (redemption price per share is equal to net asset value less any applicable contingent deferred sales charge) (Note 1) | | | | |
Net assets | | $ | 1,746,822,151 | |
| | | | |
Shares of beneficial interest | | | 144,193,411 | |
| | | | |
Net asset value and offering price per share | | $ | 12.11 | |
| | | | |
Class N shares: | | | | |
Net assets | | $ | 40,883 | |
| | | | |
Shares of beneficial interest | | | 3,345 | |
| | | | |
Net asset value, offering and redemption price per share | | $ | 12.22 | |
| | | | |
Class Y shares: | | | | |
Net assets | | $ | 6,130,700,412 | |
| | | | |
Shares of beneficial interest | | | 501,383,381 | |
| | | | |
Net asset value, offering and redemption price per share | | $ | 12.23 | |
| | | | |
Admin Class shares: | | | | |
Net assets | | $ | 21,556,612 | |
| | | | |
Shares of beneficial interest | | | 1,767,279 | |
| | | | |
Net asset value, offering and redemption price per share | | $ | 12.20 | |
| | | | |
See accompanying notes to financial statements.
| 32
Statement of Operations
For the Year Ended September 30, 2013
| | | | |
INVESTMENT INCOME | | | | |
Interest | | $ | 547,242,625 | |
Dividends | | | 7,420,149 | |
| | | | |
| | | 554,662,774 | |
| | | | |
Expenses | | | | |
Management fees (Note 5) | | | 47,342,571 | |
Service and distribution fees (Note 5) | | | 28,567,568 | |
Administrative fees (Note 5) | | | 5,235,915 | |
Trustees’ fees and expenses (Note 5) | | | 264,476 | |
Transfer agent fees and expenses (Notes 5 and 6) | | | 13,449,033 | |
Audit and tax services fees | | | 57,997 | |
Custodian fees and expenses | | | 533,563 | |
Legal fees | | | 160,605 | |
Registration fees | | | 294,328 | |
Shareholder reporting expenses | | | 1,371,260 | |
Miscellaneous expenses | | | 280,964 | |
| | | | |
Total expenses | | | 97,558,280 | |
Less waiver and/or expense reimbursement (Note 5) | | | (11 | ) |
| | | | |
Net expenses | | | 97,558,269 | |
| | | | |
Net investment income | | | 457,104,505 | |
| | | | |
NET REALIZED AND UNREALIZED GAIN (LOSS) ON INVESTMENTS AND FOREIGN CURRENCY TRANSACTIONS | | | | |
Net realized gain (loss) on: | | | | |
Investments | | | 287,686,240 | |
Foreign currency transactions | | | (8,428,307 | ) |
Net change in unrealized appreciation (depreciation) on: | | | | |
Investments | | | (589,055,516 | ) |
Foreign currency translations | | | (372,050 | ) |
| | | | |
Net realized and unrealized loss on investments and foreign currency transactions | | | (310,169,633 | ) |
| | | | |
NET INCREASE IN NET ASSETS RESULTING FROM OPERATIONS | | $ | 146,934,872 | |
| | | | |
See accompanying notes to financial statements.
33 |
Statement of Changes in Net Assets
| | | | | | | | |
| | | Year Ended
September 30,
2013 | | | Year Ended
September 30,
2012 | |
FROM OPERATIONS: | | | | | | | | |
Net investment income | | $ | 457,104,505 | | | $ | 448,965,654 | |
Net realized gain on investments and foreign currency transactions | | | 279,257,933 | | | | 183,960,071 | |
Net change in unrealized appreciation (depreciation) on investments and foreign currency translations | | | (589,427,566 | ) | | | 573,143,807 | |
| | | | | | | | |
Net increase in net assets resulting from operations | | | 146,934,872 | | | | 1,206,069,532 | |
| | | | | | | | |
FROM DISTRIBUTIONS TO SHAREHOLDERS: | | | | | | | | |
Net investment income | | | | | | | | |
Class A | | | (137,547,979 | ) | | | (140,578,594 | ) |
Class B | | | (434,962 | ) | | | (558,660 | ) |
Class C | | | (86,375,065 | ) | | | (93,060,242 | ) |
Class N | | | (330 | ) | | | — | |
Class Y | | | (341,402,630 | ) | | | (295,684,484 | ) |
Admin Class | | | (914,415 | ) | | | (455,185 | ) |
Class J | | | — | | | | (1,366,652 | ) |
Net realized capital gains | | | | | | | | |
Class A | | | (27,197,220 | ) | | | (26,530,935 | ) |
Class B | | | (106,865 | ) | | | (123,858 | ) |
Class C | | | (20,576,316 | ) | | | (20,065,620 | ) |
Class Y | | | (63,063,034 | ) | | | (48,043,542 | ) |
Admin Class | | | (171,884 | ) | | | (72,361 | ) |
Class J | | | — | | | | (427,583 | ) |
| | | | | | | | |
Total distributions | | | (677,790,700 | ) | | | (626,967,716 | ) |
| | | | | | | | |
NET INCREASE (DECREASE) IN NET ASSETS FROM CAPITAL SHARE TRANSACTIONS (NOTE 10) | | | (1,217,980,423 | ) | | | 1,700,532,135 | |
| | | | | | | | |
Net increase (decrease) in net assets | | | (1,748,836,251 | ) | | | 2,279,633,951 | |
NET ASSETS | | | | | | | | |
Beginning of the year | | | 12,087,646,726 | | | | 9,808,012,775 | |
| | | | | | | | |
End of the year | | $ | 10,338,810,475 | | | $ | 12,087,646,726 | |
| | | | | | | | |
UNDISTRIBUTED NET INVESTMENT INCOME | | $ | 15,275,810 | | | $ | 95,851,767 | |
| | | | | | | | |
See accompanying notes to financial statements.
| 34
Financial Highlights
For a share outstanding throughout each period.
| | | | | | | | | | | | | | | | | | | | | | | | | | | | |
| | | | | | Income (Loss) from Investment
Operations: | | | Less Distributions: | |
| | | Net asset
value,
beginning
of the
period | | | Net
investment
income (a) | | | Net realized
and
unrealized
gain (loss) | | | Total from
investment
operations | | | Dividends
from net
investment
income | | | Distributions
from net
realized
capital
gains | | | Total
distributions | |
Class A | | | | | | | | | | | | | | | | | | | | | | | | | | | | |
9/30/2013 | | $ | 12.76 | | | $ | 0.48 | | | $ | (0.30 | ) | | $ | 0.18 | | | $ | (0.60 | ) | | $ | (0.12 | ) | | $ | (0.72 | ) |
9/30/2012 | | | 12.12 | | | | 0.51 | | | | 0.86 | | | | 1.37 | | | | (0.62 | ) | | | (0.11 | ) | | | (0.73 | ) |
9/30/2011 | | | 12.56 | | | | 0.57 | | | | (0.15 | ) | | | 0.42 | | | | (0.60 | ) | | | (0.26 | ) | | | (0.86 | ) |
9/30/2010 | | | 11.64 | | | | 0.55 | | | | 0.96 | | | | 1.51 | | | | (0.56 | ) | | | (0.03 | ) | | | (0.59 | ) |
9/30/2009 | | | 10.54 | | | | 0.60 | | | | 1.22 | | | | 1.82 | | | | (0.59 | ) | | | (0.13 | ) | | | (0.72 | ) |
Class B | | | | | | | | | | | | | | | | | | | | | | | | | | | | |
9/30/2013 | | | 12.70 | | | | 0.39 | | | | (0.31 | ) | | | 0.08 | | | | (0.50 | ) | | | (0.12 | ) | | | (0.62 | ) |
9/30/2012 | | | 12.06 | | | | 0.42 | | | | 0.86 | | | | 1.28 | | | | (0.53 | ) | | | (0.11 | ) | | | (0.64 | ) |
9/30/2011 | | | 12.50 | | | | 0.47 | | | | (0.14 | ) | | | 0.33 | | | | (0.51 | ) | | | (0.26 | ) | | | (0.77 | ) |
9/30/2010 | | | 11.59 | | | | 0.45 | | | | 0.95 | | | | 1.40 | | | | (0.46 | ) | | | (0.03 | ) | | | (0.49 | ) |
9/30/2009 | | | 10.50 | | | | 0.51 | | | | 1.21 | | | | 1.72 | | | | (0.50 | ) | | | (0.13 | ) | | | (0.63 | ) |
Class C | | | | | | | | | | | | | | | | | | | | | | | | | | | | |
9/30/2013 | | | 12.66 | | | | 0.39 | | | | (0.32 | ) | | | 0.07 | | | | (0.50 | ) | | | (0.12 | ) | | | (0.62 | ) |
9/30/2012 | | | 12.03 | | | | 0.42 | | | | 0.85 | | | | 1.27 | | | | (0.53 | ) | | | (0.11 | ) | | | (0.64 | ) |
9/30/2011 | | | 12.47 | | | | 0.47 | | | | (0.14 | ) | | | 0.33 | | | | (0.51 | ) | | | (0.26 | ) | | | (0.77 | ) |
9/30/2010 | | | 11.56 | | | | 0.46 | | | | 0.96 | | | | 1.42 | | | | (0.48 | ) | | | (0.03 | ) | | | (0.51 | ) |
9/30/2009 | | | 10.47 | | | | 0.52 | | | | 1.22 | | | | 1.74 | | | | (0.52 | ) | | | (0.13 | ) | | | (0.65 | ) |
Class N | | | | | | | | | | | | | | | | | | | | | | | | | | | | |
9/30/2013* | | | 12.66 | | | | 0.34 | | | | (0.46 | ) | | | (0.12 | ) | | | (0.32 | ) | | | — | | | | (0.32 | ) |
Class Y | | | | | | | | | | | | | | | | | | | | | | | | | | | | |
9/30/2013 | | | 12.77 | | | | 0.52 | | | | (0.31 | ) | | | 0.21 | | | | (0.63 | ) | | | (0.12 | ) | | | (0.75 | ) |
9/30/2012 | | | 12.13 | | | | 0.54 | | | | 0.86 | | | | 1.40 | | | | (0.65 | ) | | | (0.11 | ) | | | (0.76 | ) |
9/30/2011 | | | 12.56 | | | | 0.60 | | | | (0.14 | ) | | | 0.46 | | | | (0.63 | ) | | | (0.26 | ) | | | (0.89 | ) |
9/30/2010 | | | 11.65 | | | | 0.58 | | | | 0.95 | | | | 1.53 | | | | (0.59 | ) | | | (0.03 | ) | | | (0.62 | ) |
9/30/2009 | | | 10.55 | | | | 0.62 | | | | 1.23 | | | | 1.85 | | | | (0.62 | ) | | | (0.13 | ) | | | (0.75 | ) |
Admin Class | | | | | | | | | | | | | | | | | | | | | | | | | |
9/30/2013 | | | 12.74 | | | | 0.45 | | | | (0.30 | ) | | | 0.15 | | | | (0.57 | ) | | | (0.12 | ) | | | (0.69 | ) |
9/30/2012 | | | 12.11 | | | | 0.48 | | | | 0.85 | | | | 1.33 | | | | (0.59 | ) | | | (0.11 | ) | | | (0.70 | ) |
9/30/2011 | | | 12.55 | | | | 0.54 | | | | (0.15 | ) | | | 0.39 | | | | (0.57 | ) | | | (0.26 | ) | | | (0.83 | ) |
9/30/2010** | | | 11.80 | | | | 0.33 | | | | 0.73 | | | | 1.06 | | | | (0.31 | ) | | | — | | | | (0.31 | ) |
| * | From commencement of Class operations on February 1, 2013 through September 30, 2013. |
| ** | From commencement of Class operations on February 1, 2010 through September 30, 2010. |
| (a) | Per share net investment income has been calculated using the average shares outstanding during the period. |
| (b) | Had certain expenses not been waived/reimbursed during the period, if applicable, total returns would have been lower. |
| (c) | A sales charge for Class A shares and a contingent deferred sales charge for Class B and Class C shares are not reflected in total return calculations. Periods less than one year, if applicable, are not annualized. |
See accompanying notes to financial statements.
35 |
| | | | | | | | | | | | | | | | | | | | | | | | | | |
| | | | |
| | | | | | | | | | Ratios to Average Net Assets: | | | | |
Net asset
value,
end of
the period | | | Total
return
(%) (b)(c) | | | Net assets,
end of
the period
(000’s) | | | Net
expenses
(%) (d)(e) | | | Gross
expenses
(%) (e) | | | Net investment
income
(%) (e) | | | Portfolio
turnover
rate (%) | |
| | | | | | | | | | | | | | | | | | | | | | | | | | |
| $ | 12.22 | | | | 1.34 | | | $ | 2,431,718 | | | | 0.83 | | | | 0.83 | | | | 3.85 | | | | 30 | |
| | 12.76 | | | | 11.74 | | | | 2,960,119 | | | | 0.84 | | | | 0.84 | | | | 4.17 | | | | 19 | |
| | 12.12 | | | | 3.47 | | | | 2,705,810 | | | | 0.81 | | | | 0.81 | | | | 4.56 | | | | 19 | |
| | 12.56 | | | | 13.41 | | | | 3,092,956 | | | | 0.81 | | | | 0.81 | | | | 4.58 | | | | 25 | |
| | 11.64 | | | | 18.64 | | | | 2,946,489 | | | | 0.80 | | | | 0.80 | | | | 5.87 | | | | 30 | |
| | | | | | | | | | | | | | | | | | | | | | | | | | |
| | 12.16 | | | | 0.57 | | | | 7,972 | | | | 1.58 | | | | 1.58 | | | | 3.09 | | | | 30 | |
| | 12.70 | | | | 10.96 | | | | 12,507 | | | | 1.59 | | | | 1.59 | | | | 3.42 | | | | 19 | |
| | 12.06 | | | | 2.70 | | | | 13,549 | | | | 1.56 | | | | 1.56 | | | | 3.81 | | | | 19 | |
| | 12.50 | | | | 12.43 | | | | 17,113 | | | | 1.65 | | | | 1.65 | | | | 3.74 | | | | 25 | |
| | 11.59 | | | | 17.59 | | | | 17,489 | | | | 1.67 | | | | 1.67 | | | | 5.07 | | | | 30 | |
| | | | | | | | | | | | | | | | | | | | | | | | | | |
| | 12.11 | | | | 0.50 | | | | 1,746,822 | | | | 1.58 | | | | 1.58 | | | | 3.10 | | | | 30 | |
| | 12.66 | | | | 10.91 | | | | 2,281,142 | | | | 1.59 | | | | 1.59 | | | | 3.42 | | | | 19 | |
| | 12.03 | | | | 2.71 | | | | 2,091,834 | | | | 1.56 | | | | 1.56 | | | | 3.81 | | | | 19 | |
| | 12.47 | | | | 12.58 | | | | 2,593,324 | | | | 1.56 | | | | 1.56 | | | | 3.83 | | | | 25 | |
| | 11.56 | | | | 17.80 | | | | 2,495,305 | | | | 1.56 | | | | 1.56 | | | | 5.09 | | | | 30 | |
| | | | | | | | | | | | | | | | | | | | | | | | | | |
| | 12.22 | | | | (0.95 | ) | | | 41 | | | | 0.65 | | | | 0.78 | | | | 4.18 | | | | 30 | |
| | | | | | | | | | | | | | | | | | | | | | | | | | |
| | 12.23 | | | | 1.60 | | | | 6,130,700 | | | | 0.58 | | | | 0.58 | | | | 4.11 | | | | 30 | |
| | 12.77 | | | | 12.01 | | | | 6,817,911 | | | | 0.59 | | | | 0.59 | | | | 4.41 | | | | 19 | |
| | 12.13 | | | | 3.81 | | | | 4,887,742 | | | | 0.56 | | | | 0.56 | | | | 4.81 | | | | 19 | |
| | 12.56 | | | | 13.60 | | | | 4,473,001 | | | | 0.56 | | | | 0.56 | | | | 4.82 | | | | 25 | |
| | 11.65 | | | | 18.94 | | | | 3,531,187 | | | | 0.54 | | | | 0.54 | | | | 6.01 | | | | 30 | |
| | | | | | | | | | | | | | | | | | | | | | | | | | |
| | 12.20 | | | | 1.10 | | | | 21,557 | | | | 1.08 | | | | 1.08 | | | | 3.62 | | | | 30 | |
| | 12.74 | | | | 11.41 | | | | 15,968 | | | | 1.09 | | | | 1.09 | | | | 3.89 | | | | 19 | |
| | 12.11 | | | | 3.26 | | | | 5,967 | | | | 1.07 | | | | 1.07 | | | | 4.32 | | | | 19 | |
| | 12.55 | | | | 9.13 | | | | 879 | | | | 1.08 | | | | 7.68 | | | | 4.06 | | | | 25 | |
| (d) | The investment adviser and/or administrator agreed to waive its fees and/or reimburse a portion of the Fund’s expenses during the period, if applicable. Without this waiver/reimbursement, expenses would have been higher. |
| (e) | Computed on an annualized basis for periods less than one year, if applicable. |
See accompanying notes to financial statements.
| 36
Notes to Financial Statements
September 30, 2013
1. Organization. Loomis Sayles Funds II (the “Trust”) is organized as a Massachusetts business trust. The Trust is registered under the Investment Company Act of 1940, as amended (the “1940 Act”), as an open-end management investment company. The Declaration of Trust permits the Board of Trustees to authorize the issuance of an unlimited number of shares of the Trust in multiple series. The financial statements for certain funds of the Trust are presented in separate reports. Information presented in these financial statements pertains to Loomis Sayles Investment Grade Bond Fund (the “Fund”).
The Fund is a diversified investment company.
The Fund offers Class A, Class C, Class Y and Admin Class shares. Effective February 1, 2013, the Fund began offering Class N shares. Effective after the close of business on January 11, 2012, Class J shares were liquidated. Effective October 12, 2007, Class B shares are no longer offered. Existing Class B shareholders may continue to reinvest dividends into Class B shares and exchange their Class B shares for Class B shares of other Natixis Funds subject to existing exchange privileges as described in the prospectus.
Class A shares are sold with a maximum front-end sales charge of 4.50%. Class B shares do not pay a front-end sales charge; however, they are charged higher Rule 12b-1 fees, and are subject to a contingent deferred sales charge (“CDSC”) if such shares are redeemed within six years of purchase. After eight years of ownership, Class B shares convert to Class A shares. Class C shares do not pay a front-end sales charge, do not convert to any other class of shares, pay higher Rule 12b-1 fees than Class A shares and may be subject to a CDSC of 1.00% if those shares are redeemed within one year of acquisition, except for reinvested distributions. Class N and Class Y shares do not pay a front-end sales charge, a CDSC or Rule 12b-1 fees. Class N shares are primarily intended for employer-sponsored retirement plans. Class Y shares are intended for institutional investors with a minimum initial investment of $100,000, though some categories of investors are exempted from the minimum investment amount as outlined in the Fund’s prospectus. Admin Class shares do not pay a front-end sales charge or a CDSC, but do pay a Rule 12b-1 fee. Class N and Admin Class shares are offered exclusively through intermediaries.
Most expenses of the Trust can be directly attributed to a fund. Expenses which cannot be directly attributed to a fund are generally apportioned based on the relative net assets of each of the funds in the Trust. Expenses of the Fund are borne pro rata by the holders of each class of shares, except that each class bears expenses unique to that class (including the Rule 12b-1 service and distribution fees for Class A, Class B, Class C and Admin Class and transfer agent fees for Class N). In addition, each class votes as a class only with respect to its own Rule 12b-1 Plan. Shares of each class would receive their pro rata share of the net assets of the Fund if the Fund were liquidated. The Trustees approve separate distributions from net investment income on each class of shares.
37 |
Notes to Financial Statements (continued)
September 30, 2013
2. Significant Accounting Policies. The following is a summary of significant accounting policies consistently followed by the Fund in the preparation of its financial statements. The Fund’s financial statements are prepared in accordance with accounting principles generally accepted in the United States of America which require the use of management estimates that affect the reported amounts and disclosures in the financial statements. Actual results could differ from those estimates. Management has evaluated the events and transactions subsequent to year-end through the date the financial statements were issued and has determined that there were no material events that would require disclosure in the Fund’s financial statements.
a. Valuation. Debt securities (other than short-term obligations purchased with an original or remaining maturity of sixty days or less) and unlisted equity securities are generally valued on the basis of evaluated bids furnished to the Fund by an independent pricing service, recommended by the investment adviser and approved by the Board of Trustees, which determines valuations for normal, institutional-size trading units of such securities using market information, transactions for comparable securities and various relationships between securities which are generally recognized by institutional traders. Senior loans are priced at bid prices supplied by an independent pricing service, if available. Equity securities, including shares of closed-end investment companies and exchange-traded funds, for which market quotations are readily available are valued at market value, as reported by independent pricing services recommended by the investment adviser and approved by the Board of Trustees. Such independent pricing services generally use the security’s last sale price on the exchange or market where the security is primarily traded or, if there is no reported sale during the day, the closing bid price. Securities traded on the NASDAQ Global Select Market, NASDAQ Global Market and NASDAQ Capital Market are valued at the NASDAQ Official Closing Price (“NOCP”), or if lacking a NOCP, at the most recent bid quotation on the applicable NASDAQ Market. Broker-dealer bid prices may also be used to value debt and equity securities and senior loans where an independent pricing service is unable to price a security or where an independent pricing service does not provide a reliable price for the security. Forward foreign currency contracts are valued utilizing interpolated prices determined from information provided by an independent pricing service. Investments in other open-end investment companies are valued at their net asset value each day. Short-term obligations purchased with an original or remaining maturity of sixty days or less are valued at amortized cost, which approximates market value. Securities for which market quotations are not readily available are valued at fair value as determined in good faith by the Fund’s investment adviser under the general supervision of the Board of Trustees.
The Fund may hold securities traded in foreign markets. Foreign securities are valued at the closing market price in the foreign market. However, if events occurring after the close of the foreign market (but before the close of regular trading on the New York Stock Exchange) are believed to materially affect the value of those securities, such
| 38
Notes to Financial Statements (continued)
September 30, 2013
securities are fair valued on a daily basis pursuant to procedures approved by the Board of Trustees. When fair valuing securities, the Fund may, among other things, use modeling tools or other processes that may take into account factors such as securities market activity and/or significant events that occur after the close of the foreign market and before the Fund calculates its net asset value.
b. Investment Transactions and Related Investment Income. Investment transactions are accounted for on a trade date plus one day basis for daily net asset value calculation. However, for financial reporting purposes, investment transactions are reported on trade date. Interest income is recorded on an accrual basis. Interest income is increased by the accretion of discount and decreased by the amortization of premium. In determining net gain or loss on securities sold, the cost of securities has been determined on an identified cost basis. Investment income, non-class specific expenses and realized and unrealized gains and losses are allocated on a pro rata basis to each class based on the relative net assets of each class to the total net assets of the Fund.
c. Foreign Currency Translation. The books and records of the Fund are maintained in U.S. dollars. The values of securities, currencies and other assets and liabilities denominated in currencies other than U.S. dollars are translated into U.S. dollars based upon foreign exchange rates prevailing at the end of the period. Purchases and sales of investment securities, income and expenses are translated on the respective dates of such transactions.
Since the values of investment securities are presented at the foreign exchange rates prevailing at the end of the period, it is not practical to isolate that portion of the results of operations arising from changes in exchange rates from fluctuations which arise due to changes in market prices of investment securities. Such changes are included with the net realized and unrealized gain or loss on investments.
Net realized foreign exchange gains or losses arise from sales of foreign currency, currency gains or losses realized between the trade and settlement dates on securities transactions and the difference between the amounts of interest and foreign withholding taxes recorded on the Fund’s books and the U.S. dollar equivalent of the amounts actually received or paid. Net unrealized foreign exchange gains and losses arise from changes in the value of assets and liabilities, other than investment securities, at the end of the fiscal period, resulting from changes in exchange rates.
The Fund may use foreign currency exchange contracts to facilitate transactions in foreign-denominated investments. Losses may arise from changes in the value of the foreign currency or if the counterparties do not perform under the contracts’ terms.
d. Forward Foreign Currency Contracts. The Fund may enter into forward foreign currency contracts, including forward foreign cross currency contracts, to acquire exposure to foreign currencies or to hedge the Fund’s investments against currency
39 |
Notes to Financial Statements (continued)
September 30, 2013
fluctuation. A contract can also be used to offset a previous contract. These contracts involve market risk in excess of the unrealized gain or loss reflected in the Fund’s Statement of Assets and Liabilities. The U.S. dollar value of the currencies the Fund has committed to buy or sell represents the aggregate exposure to each currency the Fund has acquired or hedged through currency contracts outstanding at period end. Gains or losses are recorded for financial statement purposes as unrealized until settlement date. Contracts are traded over-the-counter directly with a counterparty. Risks may arise upon entering into these contracts from the potential inability of counterparties to meet the terms of their contracts and from unanticipated movements in the value of a foreign currency relative to the U.S. dollar. Certain contracts may require the movement of cash and/or securities as collateral for the Fund’s or counterparty’s net obligations under the contracts.
No forward foreign currency contracts were held by the Fund during the year ended September 30, 2013.
e. Federal and Foreign Income Taxes. The Trust treats each fund as a separate entity for federal income tax purposes. The Fund intends to meet the requirements of the Internal Revenue Code of 1986, as amended, applicable to regulated investment companies, and to distribute to its shareholders substantially all of its net investment income and any net realized capital gains at least annually. Management has performed an analysis of the Fund’s tax positions for the open tax years as of September 30, 2013 and has concluded that no provisions for income tax are required. The Fund’s federal tax returns for the prior three fiscal years remain subject to examination by the Internal Revenue Service. Management is not aware of any events that are reasonably possible to occur in the next twelve months that would result in the amounts of any unrecognized tax benefits significantly increasing or decreasing for the Fund. However, management’s conclusions regarding tax positions taken may be subject to review and adjustment at a later date based on factors including, but not limited to, new tax laws and accounting regulations and interpretations thereof.
The Fund may be subject to foreign withholding taxes on investment income and taxes on capital gains on investments that are accrued and paid based upon the Fund’s understanding of the tax rules and regulations that exist in the countries in which the Fund invests. Foreign withholding taxes on dividend and interest income are reflected on the Statement of Operations as a reduction of investment income, net of amounts eligible to be reclaimed. Dividends and interest receivable on the Statement of Assets and Liabilities are net of foreign withholding taxes. Foreign withholding taxes eligible to be reclaimed are reflected on the Statement of Assets and Liabilities as tax reclaims receivable. Capital gains taxes paid are included in net realized gain (loss) on investments in the Statement of Operations. Accrued but unpaid capital gains taxes are reflected as foreign taxes payable on the Statement of Assets and Liabilities, if applicable, and reduce unrealized gains on investments. In the event that realized gains
| 40
Notes to Financial Statements (continued)
September 30, 2013
on investments are subsequently offset by realized losses, taxes paid on realized gains may be returned to the Fund. Such amounts, if applicable, are reflected as foreign tax rebates receivable on the Statement of Assets and Liabilities and are recorded as a realized gain when received.
f. Dividends and Distributions to Shareholders. Dividends and distributions are recorded on ex-dividend date. The timing and characterization of certain income and capital gain distributions are determined annually in accordance with federal tax regulations, which may differ from accounting principles generally accepted in the United States of America. Permanent differences are primarily due to differing treatments for book and tax purposes of items such as foreign currency transactions, paydowns, contingent payment debt instruments and premium amortization. Permanent book and tax basis differences relating to shareholder distributions will result in reclassifications to capital accounts. Temporary differences between book and tax distributable earnings are primarily due to premium amortization, deferred Trustees’ fees, defaulted bond accruals, contingent payment debt instruments and wash sales. Distributions from net investment income and short-term capital gains are considered to be distributed from ordinary income for tax purposes.
The tax characterization of distributions is determined on an annual basis. The tax character of distributions paid to shareholders during the years ended September 30, 2013 and 2012 were as follows:
| | | | | | | | | | | | | | | | | | | | |
2013 Distributions Paid From: | | | 2012 Distributions Paid From: | |
Ordinary
Income | | Long-Term
Capital Gains | | | Total | | | Ordinary
Income | | | Long-Term
Capital Gains | | | Total | |
$575,333,718 | | $ | 102,456,982 | | | $ | 677,790,700 | | | $ | 556,649,900 | | | $ | 70,317,816 | | | $ | 626,967,716 | |
Differences between these amounts and those reported in the Statement of Changes in Net Assets are primarily attributable to different book and tax treatment for short-term capital gains.
As of September 30, 2013, the components of distributable earnings on a tax basis were as follows:
| | | | |
Undistributed ordinary income | | $ | 53,915,953 | |
Undistributed long-term capital gains | | | 230,446,858 | |
| | | | |
Total undistributed earnings | | | 284,362,811 | |
Unrealized appreciation | | | 709,257,253 | |
| | | | |
Total accumulated earnings | | $ | 993,620,064 | |
| | | | |
g. Repurchase Agreements. It is the Fund’s policy that the market value of the collateral for repurchase agreements be at least equal to 102% of the repurchase price, including interest. Certain repurchase agreements are tri-party arrangements whereby
41 |
Notes to Financial Statements (continued)
September 30, 2013
the collateral is held in a segregated account for the benefit of the Fund and on behalf of the counterparty. Repurchase agreements could involve certain risks in the event of default or insolvency of the counterparty including possible delays or restrictions upon the Fund’s ability to dispose of the underlying securities.
h. Securities Lending. The Fund has entered into an agreement with State Street Bank and Trust Company (“State Street Bank”), as agent of the Fund, to lend securities to certain designated borrowers. The loans are collateralized with cash or securities in an amount equal to at least 105% or 102% of the market value (including accrued interest) of the loaned international or domestic securities, respectively, when the loan is initiated. Thereafter, the value of the collateral must remain at least 102% of the market value (including accrued interest) of loaned securities for U.S. equities and U.S. corporate debt; at least 105% of the market value (including accrued interest) of loaned securities for non-U.S. equities; and at least 100% of the market value (including accrued interest) of loaned securities for U.S. Government securities, sovereign debt issued by non-U.S. Governments and non-U.S. corporate debt. In the event that the market value of the collateral falls below the required percentages described above, the borrower will deliver additional collateral on the next business day. As with other extensions of credit, the Fund may bear the risk of loss with respect to the investment of the collateral. The Fund invests cash collateral in short-term investments, a portion of the income from which is remitted to the borrowers and the remainder allocated between the Fund and State Street Bank as lending agent.
For the year ended September 30, 2013, the Fund did not loan securities under this agreement.
i. Indemnifications. Under the Trust’s organizational documents, its officers and Trustees are indemnified against certain liabilities arising out of the performance of their duties to the Fund. Additionally, in the normal course of business, the Fund enters into contracts with service providers that contain general indemnification clauses. The Fund’s maximum exposure under these arrangements is unknown as this would involve future claims that may be made against the Fund that have not yet occurred. However, based on experience, the Fund expects the risk of loss to be remote.
j. New Accounting Pronouncement. In December 2011, Accounting Standards Update (“ASU”) No. 2011-11, “Disclosures about Offsetting Assets and Liabilities” was issued and is effective for interim and annual periods beginning after January 1, 2013. The ASU creates new disclosure requirements with respect to an entity’s rights of setoff and related arrangements associated with its financial instruments. Management has evaluated the impact the adoption of ASU 2011-11 and will incorporate the new disclosures required in the March 31, 2014 report.
3. Fair Value Measurements. In accordance with accounting standards related to fair value measurements and disclosures, the Fund has categorized the inputs utilized in
| 42
Notes to Financial Statements (continued)
September 30, 2013
determining the value of the Fund’s assets or liabilities. These inputs are summarized in the three broad levels listed below:
| | • | | Level 1 – quoted prices in active markets for identical assets or liabilities; |
| | • | | Level 2 – prices determined using other significant inputs that are observable either directly, or indirectly through corroboration with observable market data (which could include quoted prices for similar assets or liabilities, interest rates, credit risk, etc.); and |
| | • | | Level 3 – prices determined using significant unobservable inputs when quoted prices or observable inputs are unavailable such as when there is little or no market activity for an asset or liability (unobservable inputs reflect the Fund’s own assumptions in determining the fair value of assets or liabilities and would be based on the best information available). |
The inputs or methodology used for valuing securities are not necessarily an indication of the risk associated with investing in those securities.
The following is a summary of the inputs used to value the Fund’s investments as of September 30, 2013, at value:
Asset Valuation Inputs
| | | | | | | | | | | | | | | | |
Description | | Level 1 | | | Level 2 | | | Level 3 | | | Total | |
Bonds and Notes | | | | | | | | | | | | | | | | |
Non-Convertible Bonds | | | | | | | | | | | | | | | | |
ABS Other | | $ | — | | | $ | 29,247,839 | | | $ | 67,016,089 | (b) | | $ | 96,263,928 | |
Airlines | | | — | | | | 3,164,613 | | | | 292,528,124 | (b) | | | 295,692,737 | |
Non-Captive Consumer | | | 1,285,123 | | | | 222,123,476 | | | | — | | | | 223,408,599 | |
All Other Non-Convertible Bonds(a) | | | — | | | | 8,407,647,399 | | | | — | | | | 8,407,647,399 | |
| | | | | | | | | | | | | | | | |
Total Non-Convertible Bonds | | | 1,285,123 | | | | 8,662,183,327 | | | | 359,544,213 | | | | 9,023,012,663 | |
| | | | | | | | | | | | | | | | |
Convertible Bonds(a) | | | — | | | | 476,816,333 | | | | — | | | | 476,816,333 | |
Municipals(a) | | | — | | | | 82,008,195 | | | | — | | | | 82,008,195 | |
| | | | | | | | | | | | | | | | |
Total Bonds and Notes | | | 1,285,123 | | | | 9,221,007,855 | | | | 359,544,213 | | | | 9,581,837,191 | |
| | | | | | | | | | | | | | | | |
Senior Loans(a) | | | — | | | | 53,861,847 | | | | — | | | | 53,861,847 | |
Common Stocks(a) | | | 256,054,500 | | | | — | | | | — | | | | 256,054,500 | |
Preferred Stocks(a) | | | 25,025,396 | | | | — | | | | — | | | | 25,025,396 | |
Short-Term Investments | | | — | | | | 296,346,991 | | | | — | | | | 296,346,991 | |
| | | | | | | | | | | | | | | | |
Total | | $ | 282,365,019 | | | $ | 9,571,216,693 | | | $ | 359,544,213 | | | $ | 10,213,125,925 | |
| | | | | | | | | | | | | | | | |
| (a) | Details of the major categories of the Fund’s investments are reflected within the Portfolio of Investments. |
| (b) | Valued using broker-dealer bid prices. |
43 |
Notes to Financial Statements (continued)
September 30, 2013
The Fund’s pricing policies and procedures are recommended by the investment adviser and approved by the Board of Trustees. Debt securities are generally valued on the basis of evaluated bids furnished to the Fund by an independent pricing service. Broker-dealer bid prices may be used if an independent pricing service either is unable to price a security or does not provide a reliable price for a security. Broker-dealer bid prices for which the Fund does not have knowledge of the inputs used by the broker-dealer are categorized in Level 3. All security prices, including those obtained from an independent pricing service and broker-dealer bid quotations, are reviewed on a daily basis by the investment adviser, subject to oversight by Fund management and the Board of Trustees. If the investment adviser, in good faith, believes that the price provided by an independent pricing service is unreliable, broker-dealer bid prices may be used until the price provided by the independent pricing service is considered to be reliable. Reliability of all security prices, including those obtained from an independent pricing service and broker-dealer bid prices, is tested in a variety of ways, including comparison to recent transaction prices and daily fluctuations, amongst other validation procedures in place.
The following is a reconciliation of Level 3 investments for which significant unobservable inputs were used to determine fair value as of September 30, 2012 and/or September 30, 2013:
Asset Valuation Inputs
| | | | | | | | | | | | | | | | | | | | |
Investments in Securities | | Balance as of
September 30,
2012 | | | Accrued
Discounts
(Premiums) | | | Realized
Gain
(Loss) | | | Change in
Unrealized
Appreciation
(Depreciation) | | | Purchases | |
Bonds and Notes | | | | | | | | | | | | | | | | | | | | |
Non-Convertible Bonds | | | | | | | | | | | | | | | | | |
ABS Car Loan | | $ | 5,642,124 | | | $ | — | | | $ | — | | | $ | — | | | $ | — | |
ABS Other | | | — | | | | — | | | | 689 | | | | (2,552,527 | ) | | | 4,500,000 | |
Airlines | | | — | | | | 396,004 | | | | 890,087 | | | | (7,113,928 | ) | | | 45,485,000 | |
Banking | | | 38,219,714 | | | | — | | | | — | | | | — | | | | — | |
Electric | | | 1,889,250 | | | | — | | | | — | | | | 785,750 | | | | — | |
| | | | | | | | | | | | | | | | | | | | |
Total | | $ | 45,751,088 | | | $ | 396,004 | | | $ | 890,776 | | | $ | (8,880,705 | ) | | $ | 49,985,000 | |
| | | | | | | | | | | | | | | | | | | | |
| 44
Notes to Financial Statements (continued)
September 30, 2013
Asset Valuation Inputs (continued)
| | | | | | | | | | | | | | | | | | | | |
Investments in Securities | | Sales | | | Transfers
into Level 3 | | | Transfers
out of
Level 3 | | | Balance as of
September 30,
2013 | | | Change in
Unrealized
Appreciation
(Depreciation)
from
Investments
Still Held at
September 30,
2013 | |
Bonds and Notes | | | | | | | | | | | | | | | | | | | | |
Non-Convertible Bonds | | | | | | | | | | | | | | | | | |
ABS Car Loan | | $ | — | | | $ | — | | | $ | (5,642,124 | ) | | $ | — | | | $ | — | |
ABS Other | | | (5,110,341 | ) | | | 70,178,268 | | | | — | | | | 67,016,089 | | | | (2,552,527 | ) |
Airlines | | | (22,678,843 | ) | | | 275,549,804 | | | | — | | | | 292,528,124 | | | | (7,113,928 | ) |
Banking | | | — | | | | — | | | | (38,219,714 | ) | | | — | | | | — | |
Electric | | | (2,675,000 | ) | | | — | | | | — | | | | — | | | | — | |
| | | | | | | | | | | | | | | | | | | | |
Total | | $ | (30,464,184 | ) | | $ | 345,728,072 | | | $ | (43,861,838 | ) | | $ | 359,544,213 | | | $ | (9,666,455 | ) |
| | | | | | | | | | | | | | | | | | | | |
Debt securities valued at $43,861,838 were transferred from Level 3 to Level 2 during the period ended September 30, 2013. At September 30, 2013, these securities were valued on the basis of evaluated bids furnished to the Fund by an independent pricing service in accordance with the Fund’s valuation policies.
Debt securities valued at $345,728,072 were transferred from Level 2 to Level 3 during the period ended September 30, 2013. At September 30, 2013, these securities were valued using broker-dealer bid prices based on inputs unobservable to the Fund as an independent pricing service was unable to price the securities.
All transfers are recognized as of the beginning of the reporting period.
4. Purchases and Sales of Securities. For the year ended September 30, 2013, purchases and sales of securities (excluding short-term investments and U.S. Government/Agency securities and including paydowns) were $2,134,441,592 and $3,171,282,334, respectively. Purchases and sales of U.S. Government/Agency securities (excluding short-term investments and including paydowns) were $1,188,157,420 and $854,961,247, respectively.
5. Management Fees and Other Transactions with Affiliates.
a. Management Fees. Loomis, Sayles & Company, L.P. (“Loomis Sayles”) serves as investment adviser to the Fund. Under the terms of the management agreement, the
45 |
Notes to Financial Statements (continued)
September 30, 2013
Fund pays a management fee at the annual rate, calculated daily and payable monthly, based on the Fund’s average daily net assets:
| | | | |
Percentage of Average Daily Net Assets | |
First
$15 billion | | Over
$15 billion | |
0.40% | | | 0.38% | |
Prior to July 1, 2013, the Fund paid a management fee at an annual rate of 0.40% of average daily net assets, calculated daily and payable monthly.
Loomis Sayles has given a binding undertaking to the Fund to waive management fees and/or reimburse certain expenses to limit the Fund’s operating expenses, exclusive of acquired fund fees and expenses, brokerage expenses, interest expense, taxes and extraordinary expenses. This undertaking is in effect until January 31, 2014 and is reevaluated on an annual basis. Management fees payable, as reflected on the Statement of Assets and Liabilities, is net of waivers and/or expense reimbursements, if any, pursuant to these undertakings.
For the year ended September 30, 2013, the expense limits as a percentage of average daily net assets under the expense limitation agreement were as follows:
| | | | | | | | | | | | | | | | | | | | |
Expense Limit as a Percentage of Average Daily Net Assets | |
Class A | | Class B | | | Class C | | | Class N | | | Class Y | | | Admin Class | |
0.95% | | | 1.70% | | | | 1.70% | | | | 0.65% | | | | 0.70% | | | | 1.20% | |
Loomis Sayles shall be permitted to recover expenses it has borne under the expense limitation agreement (whether through waiver of its management fees or otherwise) on a class by class basis in later periods to the extent the annual operating expenses of a class fall below a class’ expense limits, provided, however, that a class is not obligated to pay such waived/reimbursed fees or expenses more than one year after the end of the fiscal year in which the fees or expenses were waived/reimbursed.
For the year ended September 30, 2013, the management fees for the Fund were $47,342,571 (effective rate of 0.40% of average daily net assets).
For the year ended September 30, 2013, class-specific expenses of $11 have been reimbursed for Class N shares. Expense reimbursements are subject to possible recovery until September 30, 2014.
No expenses were recovered for the Fund during year ended September 30, 2013 under the terms of the expense limitation agreement.
Certain officers and employees of Loomis Sayles are also officers or Trustees of the Trust. Loomis Sayles’ general partner is indirectly owned by Natixis Global Asset
| 46
Notes to Financial Statements (continued)
September 30, 2013
Management, L.P. (“Natixis US”), which is part of Natixis Global Asset Management, an international asset management group based in Paris, France.
b. Service and Distribution Fees. NGAM Distribution, L.P. (“NGAM Distribution”), which is a wholly-owned subsidiary of Natixis US, has entered into a distribution agreement with the Trust. Pursuant to this agreement, NGAM Distribution serves as principal underwriter of the Funds of the Trust.
Pursuant to Rule 12b-1 under the 1940 Act, the Trust has adopted a Service Plan relating to the Fund’s Class A shares (the “Class A Plan”), a Distribution and Service Plan relating to the Fund’s Class B and Class C shares (the “Class B and Class C Plans”), and a Distribution Plan relating to its Admin Class shares (the “Admin Class Plan”).
Under the Class A Plan, the Fund pays NGAM Distribution a monthly service fee at an annual rate not to exceed 0.25% of the average daily net assets attributable to the Fund’s Class A shares, as reimbursement for expenses incurred by NGAM Distribution in providing personal services to investors in Class A shares and/or the maintenance of shareholder accounts.
Under the Class B and Class C Plans, the Fund pays NGAM Distribution a monthly service fee at an annual rate not to exceed 0.25% of the average daily net assets attributable to the Fund’s Class B and Class C shares, as compensation for services provided by NGAM Distribution in providing personal services to investors in Class B and Class C shares and/or the maintenance of shareholder accounts.
Also under the Class B and Class C Plans, the Fund pays NGAM Distribution a monthly distribution fee at an annual rate of 0.75% of the average daily net assets attributable to the Fund’s Class B and Class C shares, as compensation for services provided by NGAM Distribution in connection with the marketing or sale of Class B and Class C shares.
Under the Admin Class Plan, the Fund pays NGAM Distribution a monthly distribution fee at an annual rate not to exceed 0.25% of the average daily net assets attributable to the Fund’s Admin Class shares, as compensation for services provided by NGAM Distribution in connection with the marketing or sale of Admin Class shares or for payments made by NGAM Distribution to securities dealers or other financial intermediaries as commissions, asset-based sales charges or other compensation with respect to the sale of Admin Class shares, or for providing personal services to investors and/or the maintenance of shareholder accounts.
In addition, the Admin Class shares of the Fund may pay NGAM Distribution an administrative service fee, at an annual rate not to exceed 0.25% of the average daily net assets attributable to Admin Class shares. These fees are subsequently paid to securities dealers or financial intermediaries for providing personal services and/or account maintenance for their customers who hold such shares.
47 |
Notes to Financial Statements (continued)
September 30, 2013
For the year ended September 30, 2013, the service and distribution fees for the Fund were as follows:
| | | | | | | | | | | | | | | | | | | | | | | | |
| Service Fees | | | Distribution Fees | |
Class A | | Class B | | | Class C | | | Admin Class | | | Class B | | | Class C | | | Admin Class | |
| $7,193,867 | | $ | 26,502 | | | $ | 5,291,007 | | | $ | 51,833 | | | $ | 79,506 | | | $ | 15,873,020 | | | $ | 51,833 | |
c. Administrative Fees. NGAM Advisors, L.P. (“NGAM Advisors”) provides certain administrative services for the Fund and contracts with State Street Bank to serve as sub-administrator. NGAM Advisors is a wholly-owned subsidiary of Natixis US. Pursuant to an agreement among Natixis Funds Trust I, Natixis Funds Trust II, Natixis Funds Trust IV, Gateway Trust (“Natixis Funds Trusts”), Loomis Sayles Funds I, Loomis Sayles Funds II (“Loomis Sayles Funds Trusts”), Hansberger International Series and NGAM Advisors, the Fund pays NGAM Advisors monthly its pro rata portion of fees equal to an annual rate of 0.0575% of the first $15 billion of the average daily net assets of the Natixis Funds Trusts, Loomis Sayles Funds Trusts and Hansberger International Series, 0.0500% of the next $15 billion, 0.0400% of the next $30 billion and 0.0350% of such assets in excess of $60 billion, subject to an annual aggregate minimum fee for the Natixis Funds Trusts, Loomis Sayles Funds Trusts and Hansberger International Series of $10 million, which is reevaluated on an annual basis.
For the year ended September 30, 2013, the administrative fees for the Fund were $5,235,915.
d. Sub-Transfer Agent Fees. NGAM Distribution has entered into agreements, which include servicing agreements, with financial intermediaries that provide recordkeeping, processing, shareholder communications and other services to customers of the intermediaries that hold positions in the Fund and has agreed to compensate the intermediaries for providing those services. Intermediaries transact with the Fund primarily through the use of omnibus accounts on behalf of their customers who hold positions in the Fund. These services would have been provided by the Fund’s transfer agent and other service providers if the shareholders’ accounts were maintained directly at the Fund’s transfer agent. Accordingly, the Fund has agreed to reimburse NGAM Distribution for all or a portion of the servicing fees paid to these intermediaries. The reimbursement amounts (sub-transfer agent fees) paid to NGAM Distribution are subject to a current per-account equivalent fee limit approved by the Fund’s Board, which is based on fees for similar services paid to the Fund’s transfer agent and other service providers. Class N shares do not bear such expenses.
For the year ended September 30, 2013, the sub-transfer agent fees (which are reflected in transfer agent fees and expenses in the Statement of Operations) for the Fund were $12,707,230.
As of September 30, 2013, the Fund owes NGAM Distribution $161,763 in reimbursements for sub-transfer agent fees.
| 48
Notes to Financial Statements (continued)
September 30, 2013
Sub-transfer agent fees attributable to Class A, Class B, Class C, Class Y and Admin Class are allocated on a pro rata basis to each class based on the relative net assets of each class to the total net assets of those classes.
e. Commissions. Commissions (including CDSCs) on Fund shares retained by NGAM Distribution were $2,138,856 for the year ended September 30, 2013.
f. Trustees Fees and Expenses. The Trust does not pay any compensation directly to its officers or Trustees who are directors, officers or employees of NGAM Advisors, NGAM Distribution, Natixis US or their affiliates. Effective January 1, 2013, the Chairperson of the Board receives a retainer fee at the annual rate of $285,000. The Chairperson does not receive any meeting attendance fees for Board of Trustees meetings or committee meetings that she attends. Each Independent Trustee (other than the Chairperson) receives, in the aggregate, a retainer fee at the annual rate of $115,000. Each Independent Trustee also receives a meeting attendance fee of $10,000 for each meeting of the Board of Trustees that he or she attends in person and $5,000 for each meeting of the Board of Trustees that he or she attends telephonically. In addition, each committee chairman receives an additional retainer fee at an annual rate of $17,500. Each Contract Review and Governance Committee member is compensated $6,000 for each Committee meeting that he or she attends in person and $3,000 for each meeting that he or she attends telephonically. Each Audit Committee member is compensated $6,000 for each Committee meeting that he or she attends in person and $3,000 for each meeting that he or she attends telephonically. These fees are allocated among the funds in the Natixis Funds Trusts, Loomis Sayles Funds Trusts and Hansberger International Series based on a formula that takes into account, among other factors, the relative net assets of each fund. Trustees are reimbursed for travel expenses in connection with attendance at meetings.
Prior to January 1, 2013, the Chairperson of the Board received a retainer fee at the annual rate of $265,000 and each Independent Trustee (other than the Chairperson) received, in aggregate, a retainer fee at the annual rate of $95,000. In addition, each committee chairman received an additional retainer fee at an annual rate of $15,000, and each Audit Committee member was compensated $7,500 for each Committee meeting that he or she attended in person and $3,750 for each meeting that he or she attended telephonically.
A deferred compensation plan (the “Plan”) is available to the Trustees on a voluntary basis. Deferred amounts remain in the Fund until distributed in accordance with the provisions of the Plan. The value of a participating Trustee’s deferral account is based on theoretical investments of deferred amounts, on the normal payment dates, in certain funds of the Natixis Funds Trusts, Loomis Sayles Funds Trusts and Hansberger International Series as designated by the participating Trustees. Changes in the value of participants’ deferral accounts are allocated pro rata among the funds in the Natixis Funds Trusts, Loomis Sayles Funds Trusts, and Hansberger International Series, and are
49 |
Notes to Financial Statements (continued)
September 30, 2013
normally reflected as Trustees’ fees and expenses in the Statement of Operations. The portions of the accrued obligations allocated to the Fund under the Plan are reflected as Deferred Trustees’ fees in the Statement of Assets and Liabilities.
g. Affiliated Ownership. As of September 30, 2013, Loomis Sayles Employees’ Profit Sharing Retirement Plan held shares of the Fund representing 0.06% of the Fund’s net assets.
Investment activities of affiliated shareholders could have material impacts on the Fund.
6. Class-Specific Transfer Agent Fees and Expenses. For the period from February 1, 2013 through September 30, 2013, the Fund incurred the following class-specific transfer agent fees and expenses:
| | | | |
| | | Class N | |
Transfer Agent Fees and Expenses | | $ | 25 | |
Transfer agent fees and expenses attributable to Class A, Class B, Class C, Class Y and Admin Class are allocated on a pro rata basis to each class based on the relative net assets of each class to the total net assets of those classes.
7. Line of Credit. The Fund, together with certain other funds of Natixis Funds Trusts, Loomis Sayles Funds Trusts and Hansberger International Series, participates in a $200,000,000 committed unsecured line of credit provided by State Street Bank, with an individual limit of $125,000,000 for each fund that participates in the line of credit. Interest is charged to each participating fund based on its borrowings at a rate per annum equal to the greater of the Federal Funds rate or overnight LIBOR, plus 1.25%. In addition, a commitment fee of 0.10% per annum, payable at the end of each calendar quarter, is accrued and apportioned among the participating funds based on their average daily unused portion of the line of credit.
For the year ended September 30, 2013, the Fund had no borrowings under these agreements.
8. Concentration of Risk. The Fund’s investments in foreign securities are subject to foreign currency fluctuations, higher volatility than U.S. securities, varying degrees of regulation and limited liquidity. Greater political, economic, credit and information risks are also associated with foreign securities.
9. Concentration of Ownership. From time to time, the Fund may have a concentration of one or more accounts constituting a significant percentage of shares outstanding. Investment activities by holders of such accounts could have material impacts on the Fund. As of September 30, 2013, based on management’s evaluation of the shareholder account base, the Fund had accounts representing controlling ownership of more than 5% of the Fund’s total outstanding shares. The number of such accounts, based on
| 50
Notes to Financial Statements (continued)
September 30, 2013
accounts that represent more than 5% of an individual class of shares, and the aggregate percentage of net assets represented by such holdings was as follows:
| | | | | | | | | | | | |
Number of > 5%
Non-Affiliated
Account Holders | | Percentage of
Non-Affiliated
Ownership | | | Percentage of
Affiliated Ownership
(Note 5) | | | Total
Percentage of
Ownership | |
| 1 | | | 17.28 | % | | | 0.06 | % | | | 17.34 | % |
Omnibus shareholder accounts for which NGAM Advisors understands that the intermediary has discretion over the underlying shareholder accounts are included in the table above. For other omnibus accounts, the Fund does not have information on the individual shareholder accounts underlying omnibus accounts; therefore, there could be other 5% shareholders in addition to those disclosed in the table above.
10. Capital Shares. The Fund may issue an unlimited number of shares of beneficial interest, without par value. Transactions in capital shares were as follows:
| | | | | | | | | | | | | | | | |
| |
| Year Ended
September 30, 2013 |
| |
| Year Ended
September 30, 2012** |
|
| | | | Shares | | | | Amount | | | | Shares | | | | Amount | |
| Class A | | | | | | | | | | | | | | | | |
Issued from the sale of shares | | | 65,384,516 | | | $ | 824,657,215 | | | | 92,989,022 | | | $ | 1,143,550,708 | |
Issued in connection with the reinvestment of distributions | | | 11,205,711 | | | | 140,613,943 | | | | 11,834,759 | | | | 143,943,676 | |
Redeemed | | | (109,489,794 | ) | | | (1,363,484,888 | ) | | | (96,077,704 | ) | | | (1,182,083,038 | ) |
| | | | | | | | | | | | | | | | |
Net change | | | (32,899,567 | ) | | $ | (398,213,730 | ) | | | 8,746,077 | | | $ | 105,411,346 | |
| | | | | | | | | | | | | | | | |
| Class B | | | | | | | | | | | | | | | | |
Issued from the sale of shares | | | 19,932 | | | $ | 250,047 | | | | 63,429 | | | $ | 771,205 | |
Issued in connection with the reinvestment of distributions | | | 26,217 | | | | 327,849 | | | | 33,273 | | | | 402,324 | |
Redeemed | | | (375,212 | ) | | | (4,657,988 | ) | | | (234,825 | ) | | | (2,875,706 | ) |
| | | | | | | | | | | | | | | | |
Net change | | | (329,063 | ) | | $ | (4,080,092 | ) | | | (138,123 | ) | | $ | (1,702,177 | ) |
| | | | | | | | | | | | | | | | |
| Class C | | | | | | | | | | | | | | | | |
Issued from the sale of shares | | | 16,055,822 | | | $ | 201,222,605 | | | | 30,359,028 | | | $ | 369,971,044 | |
Issued in connection with the reinvestment of distributions | | | 5,110,753 | | | | 63,653,947 | | | | 5,302,985 | | | | 63,969,788 | |
Redeemed | | | (57,170,562 | ) | | | (705,694,940 | ) | | | (29,338,640 | ) | | | (358,469,801 | ) |
| | | | | | | | | | | | | | | | |
Net change | | | (36,003,987 | ) | | $ | (440,818,388 | ) | | | 6,323,373 | | | $ | 75,471,031 | |
| | | | | | | | | | | | | | | | |
| Class N* | | | | | | | | | | | | | | | | |
Issued from the sale of shares | | | 3,814 | | | $ | 46,815 | | | | — | | | $ | — | |
Issued in connection with the reinvestment of distributions | | | 28 | | | | 330 | | | | — | | | | — | |
Redeemed | | | (497 | ) | | | (6,093 | ) | | | — | | | | — | |
| | | | | | | | | | | | | | | | |
Net change | | | 3,345 | | | $ | 41,052 | | | | — | | | $ | — | |
| | | | | | | | | | | | | | | | |
51 |
Notes to Financial Statements (continued)
September 30, 2013
10. Capital Shares (continued).
| | | | | | | | | | | | | | | | |
| |
| Year Ended
September 30, 2013 |
| |
| Year Ended
September 30, 2012** |
|
| | | | Shares | | | | Amount | | | | Shares | | | | Amount | |
| Class Y | | | | | | | | | | | | | | | | |
Issued from the sale of shares | | | 159,420,265 | | | $ | 2,006,761,237 | | | | 213,919,333 | | | $ | 2,639,613,755 | |
Issued in connection with the reinvestment of distributions | | | 27,504,363 | | | | 345,126,073 | | | | 23,000,671 | | | | 280,416,666 | |
Redeemed | | | (219,327,621 | ) | | | (2,733,370,926 | ) | | | (105,994,304 | ) | | | (1,305,561,746 | ) |
| | | | | | | | | | | | | | | | |
Net change | | | (32,402,993 | ) | | $ | (381,483,616 | ) | | | 130,925,700 | | | $ | 1,614,468,675 | |
| | | | | | | | | | | | | | | | |
| Admin Class | | | | | | | | | | | | | | | | |
Issued from the sale of shares | | | 1,283,717 | | | $ | 16,138,159 | | | | 986,859 | | | $ | 12,078,567 | |
Issued in connection with the reinvestment of distributions | | | 39,685 | | | | 496,698 | | | | 25,251 | | | | 307,704 | |
Redeemed | | | (809,135 | ) | | | (10,060,506 | ) | | | (251,880 | ) | | | (3,084,159 | ) |
| | | | | | | | | | | | | | | | |
Net change | | | 514,267 | | | $ | 6,574,351 | | | | 760,230 | | | $ | 9,302,112 | |
| | | | | | | | | | | | | | | | |
| Class J | | | | | | | | | | | | | | | | |
Issued from the sale of shares | | | — | | | $ | — | | | | — | | | $ | — | |
Issued in connection with the reinvestment of distributions | | | — | | | | — | | | | — | | | | — | |
Redeemed | | | — | | | | — | | | | (8,514,614 | ) | | | (102,418,852 | ) |
| | | | | | | | | | | | | | | | |
Net change | | | — | | | $ | — | | | | (8,514,614 | ) | | $ | (102,418,852 | ) |
| | | | | | | | | | | | | | | | |
Increase (decrease) from capital share transactions | | | (101,117,998 | ) | | $ | (1,217,980,423 | ) | | | 138,102,643 | | | $ | 1,700,532,135 | |
| | | | | | | | | | | | | | | | |
| * From | commencement of Class operations on February 1, 2013 through September 30, 2013. |
| ** For | the period from October 1, 2011 through January 11, 2012 for Class J shares. |
| 52
Report of Independent Registered Public Accounting Firm
To the Trustees of Loomis Sayles Funds II and Shareholders of Loomis Sayles Investment Grade Bond Fund:
In our opinion, the accompanying statement of assets and liabilities, including the portfolio of investments, and the related statements of operations and of changes in net assets and the financial highlights present fairly, in all material respects, the financial position of the Loomis Sayles Investment Grade Bond Fund, a series of Loomis Sayles Funds II (the “Fund”), at September 30, 2013, and the results of its operations, the changes in its net assets and the financial highlights for each of the periods indicated, in conformity with accounting principles generally accepted in the United States of America. These financial statements and financial highlights (hereafter referred to as “financial statements”) are the responsibility of the Fund’s management; our responsibility is to express an opinion on these financial statements based on our audits. We conducted our audits of these financial statements in accordance with the standards of the Public Company Accounting Oversight Board (United States). Those standards require that we plan and perform the audits to obtain reasonable assurance about whether the financial statements are free of material misstatement. An audit includes examining, on a test basis, evidence supporting the amounts and disclosures in the financial statements, assessing the accounting principles used and significant estimates made by management, and evaluating the overall financial statement presentation. We believe that our audits, which included confirmation of securities at September 30, 2013 by correspondence with the custodian and brokers, provide a reasonable basis for our opinion.
PricewaterhouseCoopers LLP
Boston, Massachusetts
November 21, 2013
53 |
2013 U.S. Tax Distribution Information to Shareholders (Unaudited)
Corporate Dividends Received Deduction. For the fiscal year ended September 30, 2013, 1.16% of dividends distributed by Investment Grade Bond Fund qualify for the dividends received deduction for corporate shareholders.
Capital Gains Distributions. Pursuant to Internal Revenue Section 852(b), the Investment Grade Bond Fund designated $102,456,982 as capital gains distributions for the fiscal year ended September 30, 2013, unless subsequently determined to be different.
Qualified Dividend Income. For the fiscal year ended September 30, 2013, the Investment Grade Bond Fund will designate up to the maximum amount allowable pursuant to the Internal Revenue Code as qualified dividend income eligible for reduced tax rates. These lower rates range from 0% to 20% depending on an individual’s tax bracket. If the Fund pays a distribution during calendar year 2013 complete information will be reported in conjunction with Form 1099-DIV.
| 54
Trustee and Officer Information
The tables below provide certain information regarding the trustees and officers of Loomis Sayles Funds II (the “Trust”). Unless otherwise indicated, the address of all persons below is 399 Boylston Street, Boston, MA 02116. The Fund’s Statement of Additional Information includes additional information about the trustees of the Trust and is available by calling Natixis Funds at 800-225-5478.
| | | | | | | | |
Name and Year of Birth | | Position(s) Held with the Trust, Length of Time Served and Term of Office1 | | Principal
Occupation(s)
During Past 5 Years | | Number of
Portfolios in Fund Complex
Overseen2 and Other
Directorships Held
During Past 5 Years | | Experience, Qualifications, Attributes, Skills for Board Membership |
| | | |
| INDEPENDENT TRUSTEES | | | | | | |
| | | | |
Charles D. Baker (1956) | | Trustee From 2005 to 2009 and since 2011 Contract Review and Governance Committee Member | | Executive in Residence at General Catalyst Partners (venture capital and growth equity firm); formerly, President and Chief Executive Officer, Harvard Pilgrim Health Care (health care organization) | | 42 Director, Athenahealth, Inc. (software company) | | Significant experience on the Board; executive experience (including president and chief executive officer of a health care organization and executive officer of a venture capital and growth equity firm) |
| | | | |
Daniel M. Cain (1945) | | Trustee Since 2003 Chairman of the Contract Review and Governance Committee | | Chairman (formerly, President and Chief Executive Officer) of Cain Brothers & Company, Incorporated (investment banking) | | 42 Director, Sheridan Healthcare Inc. (physician practice management) | | Significant experience on the Board and on the board of other business organizations (including at a health care organization); experience in the financial industry (including roles as chairman and former chief executive officer of an investment banking firm) |
55 |
Trustee and Officer Information
| | | | | | | | |
Name and Year of Birth | | Position(s) Held with the Trust, Length of Time Served and Term of Office1 | | Principal
Occupation(s)
During Past 5 Years | | Number of
Portfolios in Fund Complex
Overseen2 and Other
Directorships Held
During Past 5 Years | | Experience, Qualifications, Attributes, Skills for Board Membership |
| | | |
INDEPENDENT TRUSTEES continued | | | | | | |
| | | | |
Kenneth A. Drucker (1945) | | Trustee Since 2008 Chairman of the Audit Committee | | Retired | | 42 Formerly, Director, M Fund, Inc. (investment company); Director, Gateway Trust (investment company) | | Significant experience on the Board and on the board of other business organizations (including at investment companies); executive experience (including as treasurer of an aerospace, automotive, and metal manufacturing corporation) |
| | | | |
Edmond J. English (1953) | | Trustee Since 2013 Contract Review and Governance Committee Member | | Chief Executive Officer of Bob’s Discount Furniture (retail) | | 42 Formerly, Director, BJ’s Wholesale Club (retail); formerly, Director, Citizens Financial Group (bank) | | Significant experience on the board of other business organizations (including at a retail company and a bank); executive experience (including at a retail company) |
| 56
Trustee and Officer Information
| | | | | | | | |
Name and Year of Birth | | Position(s) Held with the Trust, Length of Time Served and Term of Office1 | | Principal
Occupation(s)
During Past 5 Years | | Number of
Portfolios in Fund Complex
Overseen2 and Other
Directorships Held
During Past 5 Years | | Experience, Qualifications, Attributes, Skills for Board Membership |
| | | |
INDEPENDENT TRUSTEES continued | | | | | | |
| | | | |
Wendell J. Knox (1948) | | Trustee Since 2009 Audit Committee Member | | Director (formerly, President and Chief Executive Officer) of Abt Associates Inc. (research and consulting) | | 42 Director, Eastern Bank (bank); Director, The Hanover Insurance Group (property and casualty insurance) | | Significant experience on the Board and on the board of other business organizations (including at a bank and at a property and casualty insurance firm); executive experience (including roles as president and chief executive officer of a research and consulting company) |
| | | | |
Martin T. Meehan (1956) | | Trustee Since 2012 Contract Review and Governance Committee Member | | Chancellor and faculty member, University of Massachusetts Lowell | | 42 None | | Experience on the Board and on the board of other business organizations; experience as Chancellor of the University of Massachusetts Lowell; government experience (including as a member of the U.S. House of Representatives); academic experience |
57 |
Trustee and Officer Information
| | | | | | | | |
Name and Year of Birth | | Position(s) Held with the Trust, Length of Time Served and Term of Office1 | | Principal
Occupation(s)
During Past 5 Years | | Number of
Portfolios in Fund Complex
Overseen2 and Other
Directorships Held
During Past 5 Years | | Experience, Qualifications, Attributes, Skills for Board Membership |
| | | |
INDEPENDENT TRUSTEES continued | | | | | | |
| | | | |
Sandra O. Moose (1942) | | Chairperson of the Board of Trustees since November 2005 Trustee Since 2003 Ex officio member of the Audit Committee and Contract Review and Governance Committee | | President, Strategic Advisory Services (management consulting) | | 42 Director, Verizon Communications (telecommunications company); Director, AES Corporation (international power company); formerly, Director, Rohm and Haas Company (specialty chemicals) | | Significant experience on the Board and on the board of other business organizations (including at a telecommunications company, an international power company and a specialty chemicals corporation); executive experience (including at a management consulting company) |
| | | | |
Erik R. Sirri (1958) | | Trustee Since 2009 Audit Committee Member | | Professor of Finance at Babson College; formerly, Director of the Division of Trading and Markets at the Securities and Exchange Commission | | 42 None | | Significant experience on the Board; experience as Director of the Division of Trading and Markets at the Securities and Exchange Commission; academic experience; training as an economist |
| 58
Trustee and Officer Information
| | | | | | | | |
Name and Year of Birth | | Position(s) Held with the Trust, Length of Time Served and Term of Office1 | | Principal
Occupation(s)
During Past 5 Years | | Number of
Portfolios in Fund Complex
Overseen2 and Other
Directorships Held
During Past 5 Years | | Experience, Qualifications, Attributes, Skills for Board Membership |
| | | |
INDEPENDENT TRUSTEES continued | | | | | | |
| | | | |
Peter J. Smail (1952) | | Trustee Since 2009 Contract Review and Governance Committee Member | | Retired; formerly, President and Chief Executive Officer of Pyramis Global Advisors (investment management) | | 42 None | | Significant experience on the Board; mutual fund industry and executive experience (including roles as president and chief executive officer for an investment adviser) |
| | | | |
Cynthia L. Walker (1956) | | Trustee Since 2005 Audit Committee Member | | Deputy Dean for Finance and Administration, Yale University School of Medicine; formerly, Executive Dean for Administration, Harvard Medical School | | 42 None | | Significant experience on the Board; executive experience in a variety of academic organizations (including roles as dean for finance and administration) |
| | | |
| INTERESTED TRUSTEES | | | | | | |
| | | | |
Robert J. Blanding3 (1947) 555 California Street San Francisco, CA 94104 | | Trustee Since 2002 Chief Executive Officer since 2002 | | President, Chairman, Director and Chief Executive Officer, Loomis, Sayles & Company, L.P. | | 42 None | | Significant experience on the Board; continuing service as President, Chairman, and Chief Executive Officer of Loomis, Sayles & Company, L.P. |
59 |
Trustee and Officer Information
| | | | | | | | |
Name and Year of Birth | | Position(s) Held with the Trust, Length of Time Served and Term of Office1 | | Principal
Occupation(s)
During Past 5 Years | | Number of
Portfolios in Fund Complex
Overseen2 and Other
Directorships Held
During Past 5 Years | | Experience, Qualifications, Attributes, Skills for Board Membership |
| | | |
INTERESTED TRUSTEES continued | | | | | | |
| | | | |
David L. Giunta4 (1965) | | Trustee Since 2011 President since 2008 | | President and Chief Executive Officer, NGAM Distribution Corporation, NGAM Advisors, L.P. and NGAM Distribution, L.P. | | 42 None | | Experience on the Board; continuing experience as President and Chief Executive Officer of NGAM Advisors, L.P. |
| | | | |
John T. Hailer5 (1960) | | Trustee Since 2003 | | President and Chief Executive Officer – U.S. and Asia, Natixis Global Asset Management, L.P. | | 42 None | | Significant experience on the Board; continuing experience as President and Chief Executive Officer – U.S. and Asia, Natixis Global Asset Management, L.P. |
| 1 | Each trustee serves until retirement, resignation or removal from the Board. The current retirement age is 72. The position of Chairperson of the Board is appointed for a two-year term. Ms. Moose was appointed to serve an additional two-year term as the Chairperson of the Board on November 18, 2011. |
| 2 | The trustees of the Trust serve as trustees of a fund complex that includes all series of the Natixis Funds Trust I, Natixis Funds Trust II, Natixis Funds Trust IV and Gateway Trust (collectively, the “Natixis Funds Trusts”), Loomis Sayles Funds I and Loomis Sayles Funds II (collectively, the “Loomis Sayles Funds Trusts”), and Hansberger International Series (collectively, the “Fund Complex”). |
| 3 | Mr. Blanding is deemed an “interested person” of the Trust because he holds the following positions with an affiliated person of the Trust: President, Chairman, Director and Chief Executive Officer of Loomis, Sayles & Company, L.P. and Director of Loomis Sayles Investment Asia Pte., Ltd. |
| 4 | Mr. Giunta is deemed an “interested person” of the Trust because he holds the following positions with an affiliated person of the Trust: President and Chief Executive Officer of NGAM Distribution Corporation, NGAM Advisors, L.P. and NGAM Distribution, L.P. |
| 5 | Mr. Hailer is deemed an “interested person” of the Trust because he holds the following positions with an affiliated person of the Trust: President and Chief Executive Officer – U.S. and Asia, Natixis Global Asset Management, L.P. |
| 60
Trustee and Officer Information
| | | | | | |
Name and Year of Birth | | Position(s) Held with the Trust | | Term of Office1 and Length of Time Served | | Principal Occupation(s) During Past 5 Years2 |
| | |
| OFFICERS OF THE TRUST | | | | |
| | | |
Coleen Downs Dinneen (1960) | | Secretary, Clerk and Chief Legal Officer | | Since September 2004 | | Executive Vice President, General Counsel, Secretary and Clerk, NGAM Distribution Corporation, NGAM Advisors, L.P. and NGAM Distribution, L.P. |
| | | |
Daniel J. Fuss (1933) One Financial Center Boston, MA 02111 | | Executive Vice President | | Since June 2003 | | Vice Chairman and Director, Loomis, Sayles & Company, L.P. |
| | | |
Russell L. Kane (1969) | | Chief Compliance Officer, Assistant Secretary and Anti-Money Laundering Officer | | Chief Compliance Officer since May 2006; Assistant Secretary since June 2004; and Anti-Money Laundering Officer since April 2007 | | Chief Compliance Officer for Mutual Funds, Senior Vice President, Deputy General Counsel, Assistant Secretary and Assistant Clerk, NGAM Distribution Corporation, NGAM Advisors, L.P. and NGAM Distribution, L.P. |
| | | |
Michael C. Kardok (1959) | | Treasurer, Principal Financial and Accounting Officer | | Since October 2004 | | Senior Vice President, NGAM Advisors, L.P. and NGAM Distribution, L.P. |
| 1 | Each officer of the Trust serves for an indefinite term in accordance with the Trust’s current by-laws until the date his or her successor is elected and qualified, or until he or she sooner dies, retires, is removed or becomes disqualified. |
| 2 | Each person listed above, except as noted, holds the same position(s) with the Fund Complex. Mr. Fuss is not an officer of the Natixis Funds Trusts or the Hansberger International Series. Previous positions during the past five years with NGAM Distribution, L.P., NGAM Advisors, L.P. or Loomis, Sayles & Company, L.P. are omitted, if not materially different from a trustee’s or officer’s current position with such entity. |
61 |
ANNUAL REPORT
September 30, 2013

Loomis Sayles Strategic Income Fund
TABLE OF CONTENTS
Portfolio Review page 1
Portfolio of Investments page 12
Financial Statements page 35
Notes to Financial Statements page 41
LOOMIS SAYLES STRATEGIC INCOME FUND
| | | | |
| Managers | | Symbols | | |
| Matthew J. Eagan, CFA | | Class A | | NEFZX |
| Daniel J. Fuss, CFA, CIC | | Class B | | NEZBX |
Elaine M. Stokes | | Class C | | NECZX |
| Loomis, Sayles & Company, L.P. | | Class N | | NEZNX |
| | Class Y | | NEZYX |
| | Admin Class | | NEZAX |
Objective
High current income with a secondary objective of capital growth.
Strategy
Under normal market conditions, the Fund will invest substantially all of its assets in income producing securities (including below investment-grade securities, or “junk bonds”) with a focus on U.S. corporate bonds, convertible securities, foreign debt instruments, including those in emerging markets and related foreign currency transactions, and U.S. government securities. The Fund may invest up to 35% of its assets in preferred stocks and dividend-paying common stocks.
Market Conditions
Following an event-driven fourth quarter of 2012, investor optimism surged in early 2013 following a last-minute deal that prevented the U.S. from plummeting over the “fiscal cliff” of scheduled tax increases and spending cuts. However, the credit markets struggled for much of the second quarter, as speculation concerning the potential winding down of the Federal Reserve’s (the Fed’s) asset purchase program prompted fears that interest rates would rise sooner rather than later. These fears receded in September, when the Fed surprised the markets by delaying any action to begin tapering its bond purchases.
Macroeconomic indicators, led by domestic housing market data, were largely positive during the period, underscoring the potential for a strengthening U.S. recovery. Pressure on European sovereign bonds mounted as instability in Italy, in the wake of a contentious parliamentary election, was quickly followed by the early-2013 banking crisis in Cyprus. These fears faded over the course of the summer, and the euro zone emerged from recession.
Performance Results
For the 12 months ended September 30, 2013, Class A shares of Loomis Sayles Strategic Income Fund returned 9.43%. The fund outperformed its benchmark, the Barclays U.S. Aggregate Bond Index, which returned -1.68%.
1 |
Explanation of Fund Performance
Investment grade corporate holdings and out-of-benchmark allocations, including positions in high-yield bonds, convertible securities and specific non-U.S.-dollar-denominated credits, primarily accounted for the fund’s outperformance relative to its benchmark.
Allocations to common stocks bolstered return, as the equity markets generally trended upward during the period. In addition, strong performance from individual convertible securities led to positive returns for the sector. Significant stock market gains during much of the 12-month period also buoyed equity-sensitive issues. Investment grade and high yield corporate securities generated positive results and attractive relative returns, as resurgent investor optimism and high levels of new issuance bolstered both segments of the credit market at various points during the period. Higher-beta (higher risk/reward potential) industrial names generally led the way within the high-yield and investment-grade segments, while financial issues also aided results. Non-U.S.-dollar-denominated holdings benefited from intermittent bouts of optimism and contributed to return. Issues denominated in the euro, Swiss franc, New Zealand dollar and Icelandic krona were the largest contributors within the allocation.
Emerging market debt rallied during the first six months of the period but sold off sharply in the latter half, as fresh concerns about China’s slowing economic growth dampened prospects for the sector. The downturn weighed heavily on the fund’s supranational holdings. Similarly, certain U.S. dollar-deonominated holdings detracted from performance in the second half of the period. Specifically, the Brazilian real, Canadian dollar and Indonesian rupiah suffered the brunt of fiscal reform and diminished growth expectations in China.
Outlook
Our outlook for the U.S. and global economies remains largely consistent despite political and policy uncertainty. We believe U.S. gross domestic product (GDP) growth will move toward 3.0% next year, based on acceleration in the housing sector as well as momentum in autos and energy. However, deflationary pressures remain a concern in the short run as wage growth is slow, unemployment is still high (though slowly improving), and the output gap remains decidedly negative. Due primarily to weak economic growth, we expect the Fed to maintain accommodative monetary policy and to employ a slow, cautious approach to rate increases. Our forecast for the 10-year U.S. Treasury yield is approximately 2.75% at year-end, moving to 3.25% a year from now.
Several key risks may affect our outlook. We expect to see steady, perhaps even increased, volatility during the final quarter of 2013. Investor anxiety regarding upcoming economic releases and their impact on future Fed policy will likely contribute to market turbulence. The U.S. government shutdown and debt ceiling debates will likely occupy the headlines, adding another source of volatility. Europe remains an ongoing concern; however, economic and fiscal conditions appear stable for now.
Based on our long-term views, we have not made material asset allocation changes. Our strategy centers on research-based security selection, with a focus on sectors that can be
| 2
LOOMIS SAYLES STRATEGIC INCOME FUND
uncorrelated with U.S. interest rates, and we continue to build diversification into the fund. We intend to maintain reduced term structure risk and continue to decrease nominal duration through sector and security selection. The fund’s ability to invest in what we view as the best risk-adjusted opportunities across a full range of global markets, sectors and securities may be an advantage as the economic recovery unfolds and the investment landscape evolves.
Growth of a $10,000 Investment in Class A Shares5
September 30, 2003 through September 30, 2013
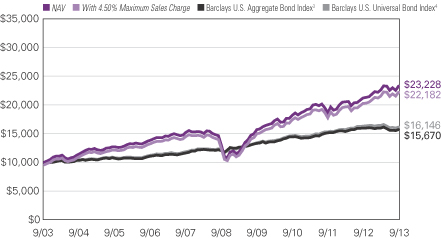
3 |
Average Annual Total Returns — September 30, 20135
| | | | | | | | | | | | | | | | |
| | | | | |
| | | 1 Year | | | 5 Years | | | 10 Years | | | Since
Class N
Inception | |
| | | | | |
| Class A (Inception 5/1/95) | | | | | | | | | | | | | | | | |
| NAV | | | 9.43 | % | | | 12.30 | % | | | 8.79 | % | | | — | % |
| With 4.50% Maximum Sales Charge | | | 4.51 | | | | 11.28 | | | | 8.29 | | | | — | |
| | | | | |
| Class B (Inception 5/1/95) | | | | | | | | | | | | | | | | |
| NAV | | | 8.58 | | | | 11.47 | | | | 7.97 | | | | — | |
| With CDSC2 | | | 3.58 | | | | 11.21 | | | | 7.97 | | | | — | |
| | | | | |
| Class C (Inception 5/1/95) | | | | | | | | | | | | | | | | |
| NAV | | | 8.61 | | | | 11.48 | | | | 7.98 | | | | — | |
| With CDSC2 | | | 7.61 | | | | 11.48 | | | | 7.98 | | | | — | |
| | | | | |
| Class N (Inception 2/1/13) | | | | | | | | | | | | | | | | |
| NAV | | | — | | | | — | | | | — | | | | 4.01 | |
| | | | | |
| Class Y (Inception 12/1/99) | | | | | | | | | | | | | | | | |
| NAV | | | 9.72 | | | | 12.60 | | | | 9.07 | | | | — | |
| | | | | |
| Admin Class (Inception 2/1/10)1 | | | | | | | | | | | | | | | | |
| NAV | | | 9.12 | | | | 12.01 | | | | 8.47 | | | | — | |
| | | | | |
| Comparative Performance | | | | | | | | | | | | | | | | |
| Barclays U.S. Aggregate Bond Index3 | | | -1.68 | | | | 5.41 | | | | 4.59 | | | | -1.12 | |
| Barclays U.S. Universal Bond Index4 | | | -1.00 | | | | 5.93 | | | | 4.91 | | | | -0.97 | |
Past performance does not guarantee future results. The table(s) do not reflect taxes shareholders might owe on any fund distributions or when they redeem their shares. Performance for periods less than one year is cumulative, not annualized. Returns reflect changes in share price and reinvestment of dividends and capital gains, if any. Unlike a fund, an index is not managed and does not reflect fees and expenses.
| 1 | Prior to the inception of Admin Class shares (2/1/10), performance is that of Class A shares, restated to reflect the higher net expenses of Admin Class shares. |
| 2 | Performance for Class B shares assumes a maximum 5% contingent deferred sales charge (“CDSC”) applied when you sell shares, which declines annually between years 1-6 according to the following schedule: 5, 4, 3, 3, 2, 1, 0%. Class C share performance assumes a 1% CDSC applied when you sell shares within one year of purchase. |
| 3 | Barclays U.S. Aggregate Bond Index is an unmanaged index that covers the U.S.-dollar denominated, investment-grade, fixed-rate, taxable bond market of SEC-registered securities. The index includes bonds from the Treasury, government-related, corporate, mortgage-backed securities, asset-backed securities, and collateralized mortgage-backed securities sectors. |
| 4 | Barclays U.S. Universal Bond Index is an unmanaged index that covers U.S. dollar-denominated taxable bonds, including U.S. government and investment grade debt, non-investment grade debt, asset-backed and mortgage-backed securities, Eurobonds, 144A securities and emerging market debt. |
| 5 | Fund performance has been increased by fee waivers and/or expense reimbursements, if any, without which performance would have been lower. |
| 4
ADDITIONAL INFORMATION
The views expressed in this report reflect those of the portfolio managers as of the dates indicated. The managers’ views are subject to change at any time without notice based on changes in market or other conditions. References to specific securities or industries should not be regarded as investment advice. Because this fund is actively managed, there is no assurance that it will continue to invest in the securities or industries mentioned.
ADDITIONAL INDEX INFORMATION
This document may contain references to third party copyrights, indexes, and trademarks, each of which is the property of its respective owner. Such owner is not affiliated with Natixis Global Asset Management or any of its related or affiliated companies (collectively “NGAM”) and does not sponsor, endorse or participate in the provision of any NGAM services, funds or other financial products.
The index information contained herein is derived from third parties and is provided on an “as is” basis. The user of this information assumes the entire risk of use of this information. Each of the third party entities involved in compiling, computing or creating index information disclaims all warranties (including, without limitation, any warranties of originality, accuracy, completeness, timeliness, non-infringement, merchantability and fitness for a particular purpose) with respect to such information.
PROXY VOTING INFORMATION
A description of the fund’s proxy voting policies and procedures is available without charge, upon request, by calling Natixis Funds at 800-225-5478; on the fund’s website at ngam.natixis.com; and on the Securities and Exchange Commission’s (SEC’s) website at www.sec.gov. Information regarding how the fund voted proxies relating to portfolio securities during the 12-month period ended June 30, 2013 is available from the fund’s website and the SEC’s website.
QUARTERLY PORTFOLIO SCHEDULES
The fund files a complete schedule of portfolio holdings with the SEC for the first and third quarters of each fiscal year on Form N-Q. The fund’s Forms N-Q are available on the SEC’s website at www.sec.gov and may be reviewed and copied at the SEC’s Public Reference Room in Washington, DC. Information on the operation of the Public Reference Room may be obtained by calling 800-SEC-0330.
5 |
UNDERSTANDING YOUR FUND’S EXPENSES
As a mutual fund shareholder, you incur different types of costs: transaction costs, including sales charges (loads) on purchases and contingent deferred sales charges on redemptions; and ongoing costs, including management fees, distribution fees (12b-1 fees) and/or service fees, and other fund expenses. These costs are described in more detail in the fund’s prospectus. The following examples are intended to help you understand the ongoing costs of investing in the fund and help you compare these with the ongoing costs of investing in other mutual funds.
The first line in the table for each class shows the actual amount of fund expenses you would have paid on a $1,000 investment in the fund from April 1, 2013 through September 30, 2013. It also shows how much a $1,000 investment would be worth at the close of the period, assuming actual fund returns and expenses. To estimate the expenses you paid over the period, simply divide your account value by $1,000 (for example $8,600 account value divided by $1,000 =8.60) and multiply the result by the number in Expenses Paid During Period column as shown below for your class.
The second line in the table for each class provides information about hypothetical account values and hypothetical expenses based on the fund’s actual expense ratios and an assumed rate of return of 5% per year before expenses, which is not the fund’s actual return. The hypothetical account values and expenses may not be used to estimate the actual ending account balance or expenses you paid on your investment for the period. You may use this information to compare the ongoing costs of investing in the fund and other funds. To do so, compare this 5% hypothetical example with the 5% hypothetical examples that appear in the shareholder reports of the other funds.
Please note that the expenses shown reflect ongoing costs only, and do not include any transaction costs. Therefore, the second line in the table of the fund is useful in comparing ongoing costs only, and will not help you determine the relative costs of owning different funds. If transaction costs were included, total costs would be higher.
| 6
| | | | | | | | | | | | |
| LOOMIS SAYLES STRATEGIC INCOME FUND | | BEGINNING
ACCOUNT VALUE
4/1/2013 | | | ENDING
ACCOUNT VALUE
9/30/2013 | | | EXPENSES PAID
DURING PERIOD*
4/1/2013 – 9/30/2013 | |
| Class A | | | | | | | | | | | | |
| Actual | | | $1,000.00 | | | | $1,029.40 | | | | $4.83 | |
| Hypothetical (5% return before expenses) | | | $1,000.00 | | | | $1,020.31 | | | | $4.81 | |
| Class B | | | | | | | | | | | | |
| Actual | | | $1,000.00 | | | | $1,025.80 | | | | $8.58 | |
| Hypothetical (5% return before expenses) | | | $1,000.00 | | | | $1,016.60 | | | | $8.54 | |
| Class C | | | | | | | | | | | | |
| Actual | | | $1,000.00 | | | | $1,025.90 | | | | $8.63 | |
| Hypothetical (5% return before expenses) | | | $1,000.00 | | | | $1,016.55 | | | | $8.59 | |
| Class N | | | | | | | | | | | | |
| Actual | | | $1,000.00 | | | | $1,031.00 | | | | $3.21 | |
| Hypothetical (5% return before expenses) | | | $1,000.00 | | | | $1,021.91 | | | | $3.19 | |
| Class Y | | | | | | | | | | | | |
| Actual | | | $1,000.00 | | | | $1,030.70 | | | | $3.56 | |
| Hypothetical (5% return before expenses) | | | $1,000.00 | | | | $1,021.56 | | | | $3.55 | |
| Admin Class | | | | | | | | | | | | |
| Actual | | | $1,000.00 | | | | $1,028.20 | | | | $6.10 | |
| Hypothetical (5% return before expenses) | | | $1,000.00 | | | | $1,019.05 | | | | $6.07 | |
| * | Expenses are equal to the Fund’s annualized expense ratio: 0.95%, 1.69%, 1.70%, 0.63%, 0.70% and 1.20% for Class A, B, C, N, Y and Admin Class respectively, multiplied by the average account value over the period, multiplied by the number of days in the most recent fiscal half-year (183), divided by 365 (to reflect the half-year period). |
7 |
BOARD APPROVAL OF THE EXISTING ADVISORY AGREEMENT
The Board of Trustees of the Trust (the “Board”), including the Independent Trustees, considers matters bearing on the Fund’s advisory agreement (the “Agreement”) at most of its meetings throughout the year. Each year, usually in the spring, the Contract Review and Governance Committee of the Board meets to review the Agreement to determine whether to recommend that the full Board approve the continuation of the Agreement, typically for an additional one-year period. After the Committee has made its recommendation, the full Board, including the Independent Trustees, determines whether to approve the continuation of the Agreement.
In connection with these meetings, the Trustees receive materials that the Fund’s investment adviser (the “Adviser”) believes to be reasonably necessary for the Trustees to evaluate the Agreement. These materials generally include, among other items, (i) information on the investment performance of the Fund and the performance of a peer group of funds and the Fund’s performance benchmarks, (ii) information on the Fund’s advisory fees and other expenses, including information comparing the Fund’s expenses to the fees charged to institutional accounts with similar strategies managed by the Adviser, if any, and to those of a peer group of funds and information about any applicable expense caps and fee “breakpoints,” (iii) sales and redemption data in respect of the Fund, (iv) information about the profitability of the Agreement to the Adviser and (v) information obtained through the completion by the Adviser of a questionnaire distributed on behalf of the Trustees. The Board, including the Independent Trustees, also consider other matters such as (i) the Adviser’s financial results and financial condition, (ii) the Fund’s investment objective and strategies and the size, education and experience of the Adviser’s investment staff and its use of technology, external research and trading cost measurement tools, (iii) arrangements in respect of the distribution of the Fund’s shares and the related costs, (iv) the procedures employed to determine the value of the Fund’s assets, (v) the allocation of the Fund’s brokerage, if any, including, if applicable, allocations to brokers affiliated with the Adviser and the use of “soft” commission dollars to pay Fund expenses and to pay for research and other similar services, (vi) the resources devoted to, and the record of compliance with, the Fund’s investment policies and restrictions, policies on personal securities transactions and other compliance policies, (vii) information about amounts invested by the Fund’s portfolio managers in the Fund or in similar accounts that they manage and (viii) the general economic outlook with particular emphasis on the mutual fund industry. Throughout the process, the Trustees are afforded the opportunity to ask questions of and request additional materials from the Adviser.
In addition to the materials requested by the Trustees in connection with their annual consideration of the continuation of the Agreement, the Trustees receive materials in advance of each regular quarterly meeting of the Board that provide detailed information about the Fund’s investment performance and the fees charged to the Fund for advisory and other services. This information generally includes, among other things, an internal performance rating for the Fund based on agreed-upon criteria, graphs showing the Fund’s performance and fee differentials against the Fund’s peer group/category, performance ratings provided by a third-party, total return information for various periods, and third-
| 8
party performance rankings for various periods comparing the Fund against similarly categorized funds. The portfolio management team for the Fund or other representatives of the Adviser make periodic presentations to the Contract Review and Governance Committee and/or the full Board, and if the Fund is identified as presenting possible performance concerns it may be subject to more frequent board presentations and reviews. In addition, each quarter the Trustees are provided with detailed statistical information about the Fund’s portfolio. The Trustees also receive periodic updates between meetings.
The Board most recently approved the continuation of the Agreement at their meeting held in June 2013. The Agreement was continued for a one-year period for the Fund. In considering whether to approve the continuation of the Agreement, the Board, including the Independent Trustees, did not identify any single factor as determinative. Individual Trustees may have evaluated the information presented differently from one another, giving different weights to various factors. Matters considered by the Trustees, including the Independent Trustees, in connection with their approval of the Agreement included, but were not limited to, the factors listed below.
The nature, extent and quality of the services provided to the Fund under the Agreement. The Trustees considered the nature, extent and quality of the services provided by the Adviser and its affiliates to the Fund and the resources dedicated to the Fund by the Adviser and its affiliates.
The Trustees considered not only the advisory services provided by the Adviser to the Fund, but also the administrative services provided by NGAM Advisors, L.P. (“NGAM Advisors”) and its affiliates to the Fund.
The Trustees also considered the benefits to shareholders of investing in a mutual fund that is part of a family of funds that offers shareholders the right to exchange shares of one type of fund for shares of another type of fund, and provides a variety of fund and shareholder services.
After reviewing these and related factors, the Trustees concluded, within the context of their overall conclusions regarding the Agreement, that the nature, extent and quality of services provided supported the renewal of the Agreement.
Investment performance of the Fund and the Adviser. As noted above, the Trustees received information about the performance of the Fund over various time periods, including information that compared the performance of the Fund to the performance of a peer group and category of funds and the Fund’s performance benchmarks. In addition, the Trustees also reviewed data prepared by an independent third party that analyzed the performance of the Fund using a variety of performance metrics, including metrics that also measured the performance of the Fund on a risk adjusted basis. The Board concluded that the Fund’s performance or other relevant factors supported the renewal of the Agreement.
The Trustees also considered the Adviser’s performance and reputation generally, the performance of the fund family generally, and the historical responsiveness of the Adviser to Trustee concerns about performance and the willingness of the Adviser to take steps intended to improve performance.
After reviewing these and related factors, the Trustees concluded, within the context of their overall conclusions regarding each of the Agreement, that the performance of the
9 |
Fund and the Adviser and/or other relevant factors supported the renewal of the Agreement.
The costs of the services to be provided and profits to be realized by the Adviser and its affiliates from their respective relationships with the Fund. The Trustees considered the fees charged to the Fund for advisory services as well as the total expense levels of the Fund. This information included comparisons (provided both by management and also by an independent third party) of the Fund’s advisory fees and total expense levels to those of its peer group and information about the advisory fees charged by the Adviser to comparable accounts (such as institutional separate accounts), as well as information about differences in such fees and the reasons for any such differences. In considering the fees charged to comparable accounts, the Trustees considered, among other things, management’s representations about the differences between managing mutual funds as compared to other types of accounts, including the additional resources required to effectively manage and the greater regulatory costs associated with the management of mutual fund assets. In evaluating the Fund’s advisory fee, the Trustees also took into account the demands, complexity and quality of the investment management of the Fund, as well as the need for the Adviser to offer competitive compensation and to expend additional resources as the Fund grows in size. The Trustees considered that over the past several years, management had made recommendations regarding reductions in advisory fee rates, implementation of advisory fee breakpoints and the institution of advisory fee waivers and expense caps for various funds in the fund family. They noted that, as of December 31, 2012, the Fund has an expense cap in place, and the Trustees considered that the current expenses are below the cap. The Trustees noted that the Fund had an advisory fee rate that was above the median of a peer group of funds. The Trustees considered the factors which management believed justified such relatively higher fees, including that: (1) the Fund’s advisory fee rate was not significantly above its peer group median; (2) the Fund had not yet reached asset levels at which the advisory fee breakpoints would have an impact on fees; and (3) the Fund’s net expense ratio was below the median of a peer group of funds.
The Trustees also considered the compensation directly or indirectly received by the Adviser and its affiliates from their relationships with the Fund. The Trustees reviewed information provided by management as to the profitability of the Adviser’s and its affiliates’ relationships with the Fund, and information about the allocation of expenses used to calculate profitability. They also reviewed information provided by management about the effect of distribution costs and changes in asset levels on Adviser profitability, including information regarding resources spent on distribution activities. When reviewing profitability, the Trustees also considered information about court cases in which adviser compensation or profitability were issues, the performance of the Fund, the expense levels of the Fund, whether the Adviser had implemented breakpoints and/or expense caps with respect to the Fund and the overall profit margin of the Adviser compared to other investment managers.
After reviewing these and related factors, the Trustees concluded, within the context of their overall conclusions regarding the Agreement, that the advisory fee charged to the Fund was fair and reasonable, and that the costs of these services generally and the related profitability of the Adviser and its affiliates in respect of their relationships with the Fund supported the renewal of the Agreement.
| 10
Economies of Scale. The Trustees considered the existence of any economies of scale in the provision of services by the Adviser and whether those economies are shared with the Fund through breakpoints in its investment advisory fees or other means, such as expense waivers or caps. The Trustees also discussed with management the factors considered with respect to the implementation of breakpoints in investment advisory fees or expense waivers or caps for certain funds. Management explained that a number of factors are taken into account in considering the possible implementation of breakpoints or an expense cap for a fund, including, among other things, factors such as a fund’s assets, the projected growth of a fund, projected profitability and a fund’s fees and performance. With respect to economies of scale, the Trustees noted the Fund is subject to breakpoints in its advisory fees. The Trustees further noted that the Fund was subject to an expense cap or waiver. In considering these issues, the Trustees also took note of the costs of the services provided (both on an absolute and a relative basis) and the profitability to the Adviser and its affiliates of their relationships with the Fund, as discussed above.
After reviewing these and related factors, the Trustees concluded, within the context of their overall conclusions regarding the Agreement, that the extent to which economies of scale were shared with the Fund supported the renewal of the Agreement.
The Trustees also considered other factors, which included but were not limited to the following:
| · | | The effect of recent market and economic events on the performance, asset levels and expense ratios of the Fund. |
| · | | Whether the Fund has operated in accordance with its investment objective and the Fund’s record of compliance with its investment restrictions, and the compliance programs of the Fund and the Adviser. They also considered the compliance-related resources the Adviser and its affiliates were providing to the Fund. |
| · | | The nature, quality, cost and extent of administrative and shareholder services performed by the Adviser and its affiliates, both under the Agreement and under a separate agreement covering administrative services. |
| · | | So-called “fallout benefits” to the Adviser, such as the engagement of affiliates of the Adviser to provide distribution, administrative and brokerage services to the Fund, and the benefits of research made available to the Adviser by reason of brokerage commissions (if any) generated by the Fund’s securities transactions. The Trustees also considered the fact that NGAM Advisors’ parent company benefits from the retention of an affiliated Adviser. The Trustees considered the possible conflicts of interest associated with these fallout and other benefits, and the reporting, disclosure and other processes in place to disclose and monitor such possible conflicts of interest. |
| · | | The Trustees’ review and discussion of the Fund’s advisory arrangements in prior years, and management’s record of responding to Trustee concerns raised during the year and in prior years. |
Based on their evaluation of all factors that they deemed to be material, including those factors described above, and assisted by the advice of independent counsel, the Trustees, including the Independent Trustees, concluded that the existing Agreement should be continued through June 30, 2014.
11 |
Portfolio of Investments — as of September 30, 2013
Loomis Sayles Strategic Income Fund
| | | | | | | | |
Principal
Amount (‡) | | | Description | | Value (†) | |
| | Bonds and Notes — 68.1% of Net Assets | | | | |
| | Non-Convertible Bonds — 58.8% | | | | |
| | | | ABS Car Loan — 0.0% | | | | |
| $ | 4,093,750 | | | Avis Budget Rental Car Funding AESOP LLC, Series 2010-5A, Class B,
5.110%, 3/20/2017, 144A | | $ | 4,405,788 | |
| | | | | | | | |
| | | | ABS Home Equity — 0.0% | | | | |
| | 3,841,885 | | | Wells Fargo Mortgage Backed Securities Trust, Series 2005-AR4, Class 2A2,
2.719%, 4/25/2035(b) | | | 3,861,805 | |
| | | | | | | | |
| | | | Aerospace & Defense — 0.4% | | | | |
| | 620,000 | | | Bombardier, Inc., 7.350%, 12/22/2026, 144A, (CAD) | | | 638,882 | |
| | 11,800,000 | | | Bombardier, Inc., 7.450%, 5/01/2034, 144A | | | 11,741,000 | |
| | 2,425,000 | | | Ducommun, Inc., 9.750%, 7/15/2018 | | | 2,691,750 | |
| | 8,236,000 | | | Meccanica Holdings USA, Inc., 6.250%, 7/15/2019, 144A | | | 8,483,080 | |
| | 8,636,000 | | | Meccanica Holdings USA, Inc., 6.250%, 1/15/2040, 144A | | | 7,211,060 | |
| | 20,755,000 | | | Meccanica Holdings USA, Inc., 7.375%, 7/15/2039, 144A | | | 19,087,606 | |
| | 5,310,000 | | | Textron Financial Corp., (fixed rate to 2/15/2017, variable rate thereafter),
6.000%, 2/15/2067, 144A | | | 4,692,712 | |
| | | | | | | | |
| | | | | | | 54,546,090 | |
| | | | | | | | |
| | | | Airlines — 2.3% | | | | |
| | 13,620,000 | | | Air Canada, 7.625%, 10/01/2019, 144A, (CAD) | | | 13,255,716 | |
| | 5,215,000 | | | Air Canada Pass Through Trust, Series 2013-1, Class B,
5.375%, 11/15/2022, 144A | | | 5,032,475 | |
| | 14,600,000 | | | American Airlines Pass Through Trust, Series 2013-1, Class A,
4.000%, 1/15/2027, 144A | | | 13,687,500 | |
| | 5,400,000 | | | American Airlines Pass Through Trust, Series 2013-1, Class B,
5.625%, 1/15/2021, 144A | | | 5,197,500 | |
| | 3,280,000 | | | Continental Airlines Pass Through Certificates, Series 2012-2, Class B,
5.500%, 4/29/2022 | | | 3,292,300 | |
| | 21,015,000 | | | Continental Airlines Pass Through Certificates, Series 2012-3, Class C,
6.125%, 4/29/2018 | | | 21,382,763 | |
| | 4,275 | | | Continental Airlines Pass Through Trust, Series 1996-1, Class A,
6.940%, 4/15/2015(c)(d) | | | 4,275 | |
| | 643,667 | | | Continental Airlines Pass Through Trust, Series 1997-1, Class A,
7.461%, 10/01/2016 | | | 644,440 | |
| | 592,492 | | | Continental Airlines Pass Through Trust, Series 1997-4, Class B,
6.900%, 7/02/2018 | | | 613,229 | |
| | 2,270,517 | | | Continental Airlines Pass Through Trust, Series 1999-1, Class B,
6.795%, 2/02/2020 | | | 2,358,499 | |
| | 1,240,443 | | | Continental Airlines Pass Through Trust, Series 1999-2, Class B,
7.566%, 9/15/2021 | | | 1,303,705 | |
| | 1,233,941 | | | Continental Airlines Pass Through Trust, Series 2000-1, Class A-1,
8.048%, 5/01/2022 | | | 1,400,524 | |
| | 1,437,966 | | | Continental Airlines Pass Through Trust, Series 2000-2, Class A-1,
7.707%, 10/02/2022 | | | 1,614,117 | |
| | 2,033,641 | | | Continental Airlines Pass Through Trust, Series 2000-2, Class B,
8.307%, 10/02/2019 | | | 2,097,192 | |
See accompanying notes to financial statements.
| 12
Portfolio of Investments — as of September 30, 2013
Loomis Sayles Strategic Income Fund — (continued)
| | | | | | | | |
Principal
Amount (‡) | | | Description | | Value (†) | |
| | | | Airlines — continued | | | | |
| $ | 1,844,668 | | | Continental Airlines Pass Through Trust, Series 2001-1, Class A-1,
6.703%, 12/15/2022 | | $ | 1,973,794 | |
| | 1,063,631 | | | Continental Airlines Pass Through Trust, Series 2001-1, Class B,
7.373%, 6/15/2017 | | | 1,130,108 | |
| | 10,452,388 | | | Continental Airlines Pass Through Trust, Series 2007-1, Class A,
5.983%, 10/19/2023 | | | 11,184,055 | |
| | 18,348,237 | | | Continental Airlines Pass Through Trust, Series 2007-1, Class B,
6.903%, 10/19/2023 | | | 18,783,090 | |
| | 16,056,235 | | | Continental Airlines Pass Through Trust, Series 2009-1,
9.000%, 1/08/2018 | | | 18,344,248 | |
| | 14,834,915 | | | Continental Airlines Pass Through Trust, Series 2009-2, Class A,
7.250%, 5/10/2021 | | | 16,763,454 | |
| | 3,980,000 | | | Continental Airlines Pass Through Trust, Series 2012-1, Class B,
6.250%, 10/11/2021 | | | 4,109,350 | |
| | 1,219,022 | | | Delta Air Lines Pass Through Trust, Series 2007-1, Class A,
6.821%, 2/10/2024 | | | 1,356,163 | |
| | 5,862,372 | | | Delta Air Lines Pass Through Trust, Series 2007-1, Class B,
8.021%, 2/10/2024 | | | 6,360,674 | |
| | 17,763,723 | | | Delta Air Lines Pass Through Trust, Series 2007-1, Class C,
8.954%, 8/10/2014 | | | 18,030,179 | |
| | 1,697,809 | | | Northwest Airlines, Inc., Series 2002-1, Class G2, (MBIA insured),
6.264%, 5/20/2023 | | | 1,751,121 | |
| | 16,687,590 | | | UAL Pass Through Trust, Series 2007-1, Class A,
6.636%, 1/02/2024 | | | 17,355,093 | |
| | 768,064 | | | UAL Pass Through Trust, Series 2009-1,
10.400%, 5/01/2018 | | | 860,693 | |
| | 14,522,729 | | | US Airways Pass Through Trust, Series 2010-1B, Class B,
8.500%, 10/22/2018 | | | 15,248,866 | |
| | 33,943,761 | | | US Airways Pass Through Trust, Series 2010-1C, Class C,
11.000%, 10/22/2014, 144A | | | 35,725,808 | |
| | 47,534,220 | | | US Airways Pass Through Trust, Series 2011-1B, Class B,
9.750%, 4/22/2020 | | | 53,475,997 | |
| | 14,822,754 | | | US Airways Pass Through Trust, Series 2011-1C, Class C,
10.875%, 10/22/2014 | | | 15,638,006 | |
| | 14,069,606 | | | US Airways Pass Through Trust, Series 2012-1A, Class A,
5.900%, 4/01/2026 | | | 14,702,738 | |
| | 7,274,752 | | | US Airways Pass Through Trust, Series 2012-1B, Class B,
8.000%, 4/01/2021 | | | 7,929,479 | |
| | 5,675,691 | | | US Airways Pass Through Trust, Series 2012-1C, Class C,
9.125%, 10/01/2015 | | | 5,845,962 | |
| | 7,200,000 | | | US Airways Pass Through Trust, Series 2013-1, Class B,
5.375%, 5/15/2023 | | | 6,840,000 | |
| | | | | | | | |
| | | | | | | 345,293,113 | |
| | | | | | | | |
| | | | Automotive — 0.8% | | | | |
| | 630,000 | | | Chrysler Group LLC/CG Co-Issuer, Inc., 8.250%, 6/15/2021 | | | 705,600 | |
| | 19,011,000 | | | Ford Motor Co., 6.375%, 2/01/2029 | | | 20,733,682 | |
| | 1,220,000 | | | Ford Motor Co., 6.625%, 2/15/2028 | | | 1,318,683 | |
See accompanying notes to financial statements.
13 |
Portfolio of Investments — as of September 30, 2013
Loomis Sayles Strategic Income Fund — (continued)
| | | | | | | | |
Principal
Amount (‡) | | | Description | | Value (†) | |
| | | | Automotive — continued | | | | |
| $ | 74,829,000 | | | Ford Motor Co., 6.625%, 10/01/2028 | | $ | 84,438,989 | |
| | 2,365,000 | | | Ford Motor Co., 7.125%, 11/15/2025 | | | 2,754,669 | |
| | 1,345,000 | | | Ford Motor Co., 7.500%, 8/01/2026 | | | 1,622,350 | |
| | 6,000,000 | | | Goodyear Tire & Rubber Co. (The), 7.000%, 5/15/2022 | | | 6,240,000 | |
| | 4,977,000 | | | Goodyear Tire & Rubber Co. (The), 7.000%, 3/15/2028 | | | 4,927,230 | |
| | | | | | | | |
| | | | | | | 122,741,203 | |
| | | | | | | | |
| | | | Banking — 7.4% | | | | |
| | 1,175,000 | | | AgriBank FCB, 9.125%, 7/15/2019, 144A | | | 1,526,124 | |
| | 30,607,000 | | | Ally Financial, Inc., 8.000%, 12/31/2018 | | | 34,432,875 | |
| | 29,332,000 | | | Ally Financial, Inc., 8.000%, 11/01/2031 | | | 32,998,500 | |
| | 20,565,000 | | | Associates Corp. of North America, 6.950%, 11/01/2018 | | | 24,428,320 | |
| | 63,900,000 | | | Banco Santander Brasil S.A./Cayman Islands,
8.000%, 3/18/2016, 144A, (BRL) | | | 26,669,449 | |
| | 900,000 | | | Bank of America Corp., 5.490%, 3/15/2019 | | | 982,102 | |
| | 265,000 | | | Bank of America Corp., MTN, 5.000%, 5/13/2021 | | | 284,618 | |
| | 1,500,000 | | | Bank of America Corp., Series K, (fixed rate to 1/30/2018, variable rate thereafter), 8.000%(l) | | | 1,631,250 | |
| | 1,130,000 | | | Barclays Bank PLC, (fixed rate to 12/15/2017, variable rate thereafter),
6.000%, (GBP)(l) | | | 1,641,849 | |
| | 39,890,000,000 | | | Barclays Bank PLC, EMTN, 3.680%, 8/20/2015, (KRW) | | | 38,109,997 | |
| | 7,320,000 | | | Barclays Bank PLC, EMTN, (fixed rate to 3/15/2020, variable rate thereafter), 4.750%, (EUR)(l) | | | 7,823,264 | |
| | 57,792,000,000 | | | Barclays Financial LLC, EMTN, 3.500%, 11/29/2016, (KRW) | | | 54,896,955 | |
| | 1,600,000 | | | BNP Paribas S.A., (fixed rate to 4/13/2017, variable rate thereafter),
5.019%, (EUR)(l) | | | 2,199,735 | |
| | 5,331,000 | | | BNP Paribas S.A., (fixed rate to 6/29/2015, variable rate thereafter),
5.186%, 144A(l) | | | 5,384,843 | |
| | 4,000,000 | | | Citigroup, Inc., 5.365%, 3/06/2036, (CAD)(d) | | | 3,570,856 | |
| | 24,610,000 | | | Citigroup, Inc., 5.875%, 2/22/2033 | | | 24,504,128 | |
| | 8,999,000 | | | Citigroup, Inc., 6.000%, 10/31/2033 | | | 9,069,831 | |
| | 6,060,000 | | | Citigroup, Inc., 6.125%, 8/25/2036 | | | 6,099,045 | |
| | 22,091,000 | | | Citigroup, Inc., 6.250%, 6/29/2017, (NZD) | | | 18,924,446 | |
| | 3,350,000 | | | Citigroup, Inc., EMTN, 1.495%, 11/30/2017, (EUR)(b) | | | 4,400,620 | |
| | 3,035,000 | | | Cooperatieve Centrale Raiffeisen-Boerenleenbank BA/Utrecht,
3.375%, 1/19/2017 | | | 3,229,349 | |
| | 17,730,000 | | | Cooperatieve Centrale Raiffeisen-Boerenleenbank BA/Utrecht,
3.875%, 2/08/2022 | | | 17,751,613 | |
| | 400,000 | | | Goldman Sachs Group, Inc. (The), 6.450%, 5/01/2036 | | | 406,090 | |
| | 34,060,000 | | | Goldman Sachs Group, Inc. (The), 6.750%, 10/01/2037 | | | 35,546,242 | |
| | 11,000,000 | | | HBOS Capital Funding LP, (fixed rate to 6/30/2014, variable rate thereafter), 6.071%, 144A(l) | | | 10,766,250 | |
| | 32,705,000 | | | HBOS PLC, 6.000%, 11/01/2033, 144A | | | 30,778,675 | |
| | 50,604,000 | | | HBOS PLC, GMTN, 6.750%, 5/21/2018, 144A | | | 56,230,861 | |
| | 9,090,000 | | | ICICI Bank Ltd., (fixed rate to 4/30/2017, variable rate thereafter),
6.375%, 4/30/2022, 144A | | | 8,408,250 | |
| | 45,620,000 | | | JPMorgan Chase & Co., 4.250%, 11/02/2018, (NZD) | | | 35,820,624 | |
| | 260,000,000,000 | | | JPMorgan Chase & Co., EMTN, 7.070%, 3/22/2014, (IDR) | | | 21,473,575 | |
See accompanying notes to financial statements.
| 14
Portfolio of Investments – as of September 30, 2013
Loomis Sayles Strategic Income Fund – (continued)
| | | | | | | | |
Principal
Amount (‡) | | | Description | | Value (†) | |
| | | | Banking — continued | | | | |
| | 227,000,000,000 | | | JPMorgan Chase Bank NA, 7.700%, 6/01/2016, 144A, (IDR) | | $ | 18,850,017 | |
| | 27,555,000 | | | Lloyds Bank PLC, MTN, 6.500%, 9/14/2020, 144A | | | 30,418,212 | |
| | 18,500,000 | | | Lloyds Banking Group PLC, (fixed rate to 10/01/2015, variable rate thereafter), 5.920%, 144A(l) | | | 16,650,000 | |
| | 3,010,000 | | | Merrill Lynch & Co., Inc., 5.700%, 5/02/2017 | | | 3,322,685 | |
| | 1,900,000 | | | Merrill Lynch & Co., Inc., 6.050%, 5/16/2016 | | | 2,092,616 | |
| | 6,700,000 | | | Merrill Lynch & Co., Inc., 6.110%, 1/29/2037 | | | 6,900,538 | |
| | 3,450,000 | | | Merrill Lynch & Co., Inc., EMTN, 4.625%, 9/14/2018, (EUR) | | | 4,994,047 | |
| | 1,235,000 | | | Merrill Lynch & Co., Inc., Series C, GMTN, 6.400%, 8/28/2017 | | | 1,420,176 | |
| | 800,000 | | | Merrill Lynch & Co., Inc., Series C, MTN, 6.050%, 6/01/2034 | | | 836,462 | |
| | 35,325,000 | | | Morgan Stanley, 4.750%, 11/16/2018, (AUD) | | | 32,790,981 | |
| | 55,795,000 | | | Morgan Stanley, 4.875%, 11/01/2022 | | | 55,824,348 | |
| | 74,310,000 | | | Morgan Stanley, 7.600%, 8/08/2017, (NZD) | | | 65,471,523 | |
| | 100,265,000 | | | Morgan Stanley, 8.000%, 5/09/2017, (AUD) | | | 103,392,698 | |
| | 950,000 | | | Morgan Stanley, EMTN, 5.750%, 2/14/2017, (GBP) | | | 1,702,010 | |
| | 1,000,000 | | | Morgan Stanley, GMTN, 4.500%, 2/23/2016, (EUR) | | | 1,446,944 | |
| | 79,700,000 | | | Morgan Stanley, GMTN, 7.625%, 3/03/2016, (AUD) | | | 79,731,823 | |
| | 17,175,000 | | | Morgan Stanley, MTN, 4.100%, 5/22/2023 | | | 16,019,432 | |
| | 10,000,000 | | | Morgan Stanley, MTN, 6.250%, 8/09/2026 | | | 11,186,710 | |
| | 6,600,000 | | | Morgan Stanley, Series F, GMTN, 5.625%, 9/23/2019 | | | 7,365,098 | |
| | 7,900,000 | | | Morgan Stanley, Series F, GMTN, 6.625%, 4/01/2018 | | | 9,171,560 | |
| | 12,100,000 | | | Morgan Stanley, Series F, MTN, 0.716%, 10/18/2016(b) | | | 11,901,826 | |
| | 5,210,000 | | | Morgan Stanley, Series F, MTN, 5.950%, 12/28/2017 | | | 5,894,479 | |
| | 2,850,000 | | | RBS Capital Trust A, 2.321%, (EUR)(b)(l) | | | 3,200,168 | |
| | 1,905,000 | | | RBS Capital Trust C, (fixed rate to 1/12/2016, variable rate thereafter),
4.243%, (EUR)(l) | | | 2,106,845 | |
| | 7,925,000 | | | RBS Capital Trust I, 2.113%(b)(l) | | | 6,914,563 | |
| | 4,050,000 | | | RBS Capital Trust II, (fixed rate to 1/03/2034, variable rate thereafter),
6.425%(l) | | | 3,665,250 | |
| | 2,085,000 | | | RBS Capital Trust III, (fixed rate to 9/30/2014, variable rate thereafter),
5.512%(l) | | | 1,912,988 | |
| | 930,000 | | | Royal Bank of Scotland Group PLC, 5.250%, (EUR)(l) | | | 959,340 | |
| | 15,100,000 | | | Royal Bank of Scotland Group PLC, 5.500%, (EUR)(l) | | | 15,940,001 | |
| | 17,700,000 | | | Royal Bank of Scotland Group PLC, 6.125%, 12/15/2022 | | | 17,831,334 | |
| | 9,990,000 | | | Royal Bank of Scotland Group PLC, (fixed rate to 9/29/2017, variable rate thereafter), 7.640%(l) | | | 9,490,500 | |
| | 850,000 | | | Royal Bank of Scotland PLC (The), EMTN, 4.350%, 1/23/2017, (EUR) | | | 1,165,734 | |
| | 7,750,000 | | | Royal Bank of Scotland PLC (The), EMTN, 6.934%, 4/09/2018, (EUR) | | | 11,491,804 | |
| | 2,150,000 | | | Royal Bank of Scotland PLC (The), EMTN, (fixed rate to 9/22/2016, variable rate thereafter), 4.625%, 9/22/2021, (EUR) | | | 2,763,197 | |
| | 700,000 | | | Santander Financial Issuances Ltd., 7.250%, 11/01/2015 | | | 747,506 | |
| | 1,300,000 | | | Santander International Debt SAU, EMTN, 4.000%, 3/27/2017, (EUR) | | | 1,851,002 | |
| | 1,800,000 | | | Santander Issuances SAU, 5.911%, 6/20/2016, 144A | | | 1,898,231 | |
| | 1,500,000 | | | Santander Issuances SAU, (fixed rate to 8/11/2014, variable rate thereafter), 6.500%, 8/11/2019, 144A | | | 1,523,036 | |
See accompanying notes to financial statements.
15 |
Portfolio of Investments – as of September 30, 2013
Loomis Sayles Strategic Income Fund – (continued)
| | | | | | | | |
Principal
Amount (‡) | | | Description | | Value (†) | |
| | | | Banking — continued | | | | |
| | 4,140,000 | | | SG Capital Trust III, (fixed rate to 11/10/2013, variable rate thereafter),
5.419%, (EUR)(l) | | $ | 5,617,603 | |
| | 18,054,000 | | | Societe Generale S.A., (fixed rate to 4/05/2017, variable rate thereafter),
5.922%, 144A(l) | | | 18,415,080 | |
| | | | | | | | |
| | | | | | | 1,114,868,703 | |
| | | | | | | | |
| | | | Brokerage — 0.8% | | | | |
| | 2,655,000 | | | Cantor Fitzgerald LP, 6.375%, 6/26/2015, 144A | | | 2,747,925 | |
| | 43,025,000 | | | Jefferies Group LLC, 5.125%, 1/20/2023 | | | 43,362,875 | |
| | 20,010,000 | | | Jefferies Group LLC, 6.250%, 1/15/2036 | | | 19,201,456 | |
| | 15,215,000 | | | Jefferies Group LLC, 6.450%, 6/08/2027 | | | 15,519,300 | |
| | 39,040,000 | | | Jefferies Group LLC, 6.875%, 4/15/2021 | | | 43,301,997 | |
| | | | | | | | |
| | | | | | | 124,133,553 | |
| | | | | | | | |
| | | | Building Materials — 0.9% | | | | |
| | 6,995,000 | | | Masco Corp., 6.500%, 8/15/2032 | | | 6,942,538 | |
| | 5,510,000 | | | Masco Corp., 7.125%, 3/15/2020 | | | 6,212,525 | |
| | 2,630,000 | | | Masco Corp., 7.750%, 8/01/2029 | | | 2,904,853 | |
| | 32,100,000 | | | Odebrecht Finance Ltd., 8.250%, 4/25/2018, 144A, (BRL) | | | 12,017,766 | |
| | 35,980,000 | | | Owens Corning, Inc., 7.000%, 12/01/2036 | | | 39,464,303 | |
| | 46,412,000 | | | USG Corp., 6.300%, 11/15/2016 | | | 49,080,690 | |
| | 14,155,000 | | | USG Corp., 9.750%, 1/15/2018 | | | 16,384,413 | |
| | | | | | | | |
| | | | | | | 133,007,088 | |
| | | | | | | | |
| | | | Chemicals — 0.4% | | | | |
| | 20,070,000 | | | Hercules, Inc., 6.500%, 6/30/2029 | | | 17,862,300 | |
| | 5,200,000 | | | Hexion US Finance Corp./Hexion Nova Scotia Finance ULC,
8.875%, 2/01/2018 | | | 5,382,000 | |
| | 4,555,000 | | | Hexion US Finance Corp./Hexion Nova Scotia Finance ULC,
9.000%, 11/15/2020 | | | 4,452,512 | |
| | 23,584,000 | | | Momentive Specialty Chemicals, Inc., 7.875%, 2/15/2023(d) | | | 19,338,880 | |
| | 7,789,000 | | | Momentive Specialty Chemicals, Inc., 8.375%, 4/15/2016(d) | | | 7,010,100 | |
| | 8,757,000 | | | Momentive Specialty Chemicals, Inc., 9.200%, 3/15/2021(d) | | | 7,443,450 | |
| | | | | | | | |
| | | | | | | 61,489,242 | |
| | | | | | | | |
| | | | Commercial Mortgage-Backed Securities — 0.2% | | | | |
| | 35,060,000 | | | GS Mortgage Securities Corp. II, Series 2007-GG10, Class AM,
5.993%, 8/10/2045(b) | | | 34,273,219 | |
| | | | | | | | |
| | | | Construction Machinery — 0.1% | | | | |
| | 1,425,000 | | | Joy Global, Inc., 6.625%, 11/15/2036 | | | 1,516,588 | |
| | 11,655,000 | | | United Rentals North America, Inc., 7.625%, 4/15/2022 | | | 12,674,812 | |
| | 525,000 | | | United Rentals North America, Inc., 8.375%, 9/15/2020 | | | 581,438 | |
| | | | | | | | |
| | | | | | | 14,772,838 | |
| | | | | | | | |
| | | | Consumer Cyclical Services — 0.0% | | | | |
| | 670,000 | | | ServiceMaster Co. (The), 7.100%, 3/01/2018 | | | 644,875 | |
| | 5,500,000 | | | ServiceMaster Co. (The), 7.450%, 8/15/2027 | | | 4,400,000 | |
| | | | | | | | |
| | | | | | | 5,044,875 | |
| | | | | | | | |
See accompanying notes to financial statements.
| 16
Portfolio of Investments – as of September 30, 2013
Loomis Sayles Strategic Income Fund – (continued)
| | | | | | | | |
Principal
Amount (‡) | | | Description | | Value (†) | |
| | | | Consumer Products — 0.0% | | | | |
| $ | 1,335,000 | | | Visant Corp., 10.000%, 10/01/2017 | | $ | 1,241,550 | |
| | | | | | | | |
| | | | Electric — 2.0% | | | | |
| | 1,540,000 | | | AES Corp., 4.875%, 5/15/2023 | | | 1,439,900 | |
| | 756,974 | | | AES Red Oak LLC, Series A, 8.540%, 11/30/2019 | | | 798,608 | |
| | 45,322,516 | | | Alta Wind Holdings LLC, 7.000%, 6/30/2035, 144A | | | 48,083,382 | |
| | 62,180,200 | | | Bruce Mansfield Unit, 6.850%, 6/01/2034 | | | 65,831,422 | |
| | 2,441,011 | | | CE Generation LLC, 7.416%, 12/15/2018 | | | 2,407,447 | |
| | 28,105,000 | | | Edison Mission Energy, 7.625%, 5/15/2027(e) | | | 18,619,562 | |
| | 42,200,000 | | | EDP Finance BV, 4.900%, 10/01/2019, 144A | | | 41,672,500 | |
| | 14,800,000 | | | EDP Finance BV, 6.000%, 2/02/2018, 144A | | | 15,318,000 | |
| | 500,000 | | | EDP Finance BV, EMTN, 4.750%, 9/26/2016, (EUR) | | | 693,376 | |
| | 100,000 | | | EDP Finance BV, EMTN, 5.875%, 2/01/2016, (EUR) | | | 142,387 | |
| | 3,570,000 | | | Endesa S.A./Cayman Islands, 7.875%, 2/01/2027 | | | 4,244,302 | |
| | 13,642,000 | | | Enel Finance International NV, 6.000%, 10/07/2039, 144A | | | 12,422,542 | |
| | 1,435,000 | | | Enel Finance International NV, 6.800%, 9/15/2037, 144A | | | 1,431,470 | |
| | 2,732,000 | | | Enel Finance International NV, EMTN, 5.750%, 9/14/2040, (GBP) | | | 3,908,656 | |
| | 108,541,101 | | | Energy Future Intermediate Holding Co. LLC/EFIH Finance, Inc.,
11.250% (12.250% PIK), 12/01/2018, 144A(f) | | | 71,637,127 | |
| | 5,940,000 | | | Energy Future Intermediate Holding Co. LLC/EFIH Finance, Inc.,
10.000%, 12/01/2020, 144A | | | 6,237,000 | |
| | 555,000 | | | Enersis S.A., Cayman Islands, 7.400%, 12/01/2016 | | | 642,371 | |
| | 2,755,000 | | | PPL Energy Supply LLC, 4.600%, 12/15/2021 | | | 2,718,339 | |
| | | | | | | | |
| | | | | | | 298,248,391 | |
| | | | | | | | |
| | | | Financial Other — 0.3% | | | | |
| | 19,005,000 | | | Aviation Capital Group Corp., 6.750%, 4/06/2021, 144A | | | 20,060,975 | |
| | 20,000,000 | | | National Life Insurance Co., 10.500%, 9/15/2039, 144A | | | 28,096,260 | |
| | | | | | | | |
| | | | | | | 48,157,235 | |
| | | | | | | | |
| | | | Food & Beverage — 0.2% | | | | |
| | 25,280,000 | | | Crestview DS Merger Sub II, Inc., 10.000%, 9/01/2021, 144A | | | 26,038,400 | |
| | 4,880,000 | | | Shearer’s Foods LLC/Chip Finance Corp., 9.000%, 11/01/2019, 144A | | | 5,099,600 | |
| | 4,370,000 | | | Viterra, Inc., 6.406%, 2/16/2021, 144A, (CAD) | | | 4,629,345 | |
| | | | | | | | |
| | | | | | | 35,767,345 | |
| | | | | | | | |
| | | | Government Guaranteed — 0.4% | | | | |
| | 72,695,000 | | | Queensland Treasury Corp., 7.125%, 9/18/2017, 144A, (NZD) | | | 66,199,296 | |
| | | | | | | | |
| | | | Government Owned – No Guarantee — 0.5% | | | | |
| | 19,500,000 | | | DP World Ltd., 6.850%, 7/02/2037, 144A | | | 19,597,500 | |
| | 70,300,000,000 | | | Export-Import Bank of Korea, 6.600%, 11/04/2013, 144A, (IDR) | | | 6,004,033 | |
| | 499,300,000,000 | | | Export-Import Bank of Korea, 8.300%, 3/15/2014, 144A, (IDR) | | | 42,093,404 | |
| | | | | | | | |
| | | | | | | 67,694,937 | |
| | | | | | | | |
| | | | Government Sponsored — 0.1% | | | | |
| | 1,000,000 | | | EDP Finance BV, EMTN, 2.250%, 2/11/2021, (CHF) | | | 943,661 | |
| | 10,807,000 | | | Eksportfinans ASA, 2.000%, 9/15/2015 | | | 10,536,825 | |
| | 9,005,000 | | | Eksportfinans ASA, 2.375%, 5/25/2016 | | | 8,712,338 | |
| | | | | | | | |
| | | | | | | 20,192,824 | |
| | | | | | | | |
See accompanying notes to financial statements.
17 |
Portfolio of Investments – as of September 30, 2013
Loomis Sayles Strategic Income Fund – (continued)
| | | | | | | | |
Principal
Amount (‡) | | | Description | | Value (†) | |
| | | | Healthcare — 2.1% | | | | |
| $ | 2,795,000 | | | HCA Holdings, Inc., 6.250%, 2/15/2021 | | $ | 2,840,419 | |
| | 9,960,000 | | | HCA, Inc., 5.875%, 3/15/2022 | | | 10,233,900 | |
| | 108,560,000 | | | HCA, Inc., 5.875%, 5/01/2023 | | | 106,660,200 | |
| | 14,620,000 | | | HCA, Inc., 7.050%, 12/01/2027 | | | 13,998,650 | |
| | 20,447,000 | | | HCA, Inc., 7.500%, 12/15/2023 | | | 20,855,940 | |
| | 24,215,000 | | | HCA, Inc., 7.500%, 11/06/2033 | | | 24,033,388 | |
| | 46,148,000 | | | HCA, Inc., 7.690%, 6/15/2025 | | | 47,244,015 | |
| | 32,745,000 | | | HCA, Inc., 8.360%, 4/15/2024 | | | 35,200,875 | |
| | 15,815,000 | | | HCA, Inc., MTN, 7.580%, 9/15/2025 | | | 16,052,225 | |
| | 9,492,000 | | | HCA, Inc., MTN, 7.750%, 7/15/2036 | | | 9,302,160 | |
| | 32,559,000 | | | Tenet Healthcare Corp., 6.875%, 11/15/2031 | | | 27,593,752 | |
| | | | | | | | |
| | | | | | | 314,015,524 | |
| | | | | | | | |
| | | | Home Construction — 0.7% | | | | |
| | 1,350,000 | | | Beazer Homes USA, Inc., 7.250%, 2/01/2023 | | | 1,296,000 | |
| | 11,265,000 | | | Desarrolladora Homex SAB de CV, 7.500%, 9/28/2015(e) | | | 2,703,600 | |
| | 13,360,000 | | | K. Hovnanian Enterprises, Inc., 5.000%, 11/01/2021 | | | 11,756,800 | |
| | 16,075,000 | | | K. Hovnanian Enterprises, Inc., 6.250%, 1/15/2016 | | | 16,597,437 | |
| | 6,290,000 | | | K. Hovnanian Enterprises, Inc., 7.500%, 5/15/2016 | | | 6,620,225 | |
| | 11,315,000 | | | KB Home, 7.250%, 6/15/2018 | | | 12,177,769 | |
| | 47,260,000 | | | Pulte Group, Inc., 6.000%, 2/15/2035 | | | 40,643,600 | |
| | 13,190,000 | | | Pulte Group, Inc., 6.375%, 5/15/2033 | | | 11,772,075 | |
| | | | | | | | |
| | | | | | | 103,567,506 | |
| | | | | | | | |
| | | | Independent Energy — 0.2% | | | | |
| | 55,000 | | | Chesapeake Energy Corp., 6.875%, 11/15/2020 | | | 59,400 | |
| | 17,935,000 | | | Connacher Oil and Gas Ltd., 8.500%, 8/01/2019, 144A | | | 12,823,525 | |
| | 2,990,000 | | | Halcon Resources Corp., 9.250%, 2/15/2022, 144A | | | 3,109,600 | |
| | 12,635,000 | | | QEP Resources, Inc., 6.875%, 3/01/2021 | | | 13,424,687 | |
| | 1,975,000 | | | Rosetta Resources, Inc., 5.625%, 5/01/2021 | | | 1,876,250 | |
| | 2,780,000 | | | SandRidge Energy, Inc., 7.500%, 2/15/2023 | | | 2,752,200 | |
| | | | | | | | |
| | | | | | | 34,045,662 | |
| | | | | | | | |
| | | | Industrial Other — 0.1% | | | | |
| | 7,475,000 | | | Permian Holdings, Inc., 10.500%, 1/15/2018, 144A | | | 7,288,125 | |
| | 10,000,000 | | | Worthington Industries, Inc., 6.500%, 4/15/2020 | | | 10,759,500 | |
| | | | | | | | |
| | | | | | | 18,047,625 | |
| | | | | | | | |
| | | | Life Insurance — 1.1% | | | | |
| | 34,562,000 | | | American International Group, Inc., 6.250%, 3/15/2087 | | | 33,870,760 | |
| | 27,655,000 | | | American International Group, Inc., (fixed rate to 5/15/2038, variable rate thereafter), 8.175%, 5/15/2068 | | | 32,370,177 | |
| | 19,625,000 | | | American International Group, Inc., Series G, MTN, 5.850%, 1/16/2018 | | | 22,315,136 | |
| | 2,855,000 | | | American International Group, Inc., Series MPLE, 4.900%, 6/02/2014, (CAD) | | | 2,826,590 | |
| | 23,200,000 | | | AXA S.A., (fixed rate to 12/14/2036, variable rate thereafter),
6.379%, 144A(l) | | | 22,301,000 | |
| | 1,000,000 | | | AXA S.A., EMTN, (fixed rate to 10/16/2019, variable rate thereafter),
6.772%, (GBP)(l) | | | 1,647,232 | |
See accompanying notes to financial statements.
| 18
Portfolio of Investments – as of September 30, 2013
Loomis Sayles Strategic Income Fund – (continued)
| | | | | | | | |
Principal
Amount (‡) | | | Description | | Value (†) | |
| | | | Life Insurance — continued | | | | |
| | 1,350,000 | | | AXA S.A., EMTN, (fixed rate to 4/16/2020, variable rate thereafter),
5.250%, 4/16/2040, (EUR) | | $ | 1,922,056 | |
| | 15,000,000 | | | Forethought Financial Group, Inc., 8.625%, 4/15/2021, 144A | | | 16,622,985 | |
| | 1,475,000 | | | MetLife Capital Trust X, 9.250%, 4/08/2068, 144A | | | 1,873,250 | |
| | 8,145,000 | | | MetLife, Inc., 10.750%, 8/01/2069 | | | 11,973,150 | |
| | 8,920,000 | | | NLV Financial Corp., 7.500%, 8/15/2033, 144A | | | 9,037,013 | |
| | 3,910,000 | | | Penn Mutual Life Insurance Co. (The), 6.650%, 6/15/2034, 144A | | | 4,471,280 | |
| | | | | | | | |
| | | | | | | 161,230,629 | |
| | | | | | | | |
| | | | Local Authorities — 2.0% | | | | |
| | 86,645,000 | | | Autonomous Community of Madrid Spain, 4.300%, 9/15/2026, 144A, (EUR) | | | 103,399,282 | |
| | 900,000 | | | City of Madrid, Spain, 4.550%, 6/16/2036, (EUR) | | | 897,979 | |
| | 8,095,000 | | | City of Rome, Italy, EMTN, 5.345%, 1/27/2048, (EUR) | | | 9,856,192 | |
| | 3,905,000 | | | Manitoba (Province of), GMTN, 6.375%, 9/01/2015, (NZD) | | | 3,390,687 | |
| | 82,840,000 | | | New South Wales Treasury Corp., 6.000%, 2/01/2018, (AUD) | | | 84,969,800 | |
| | 66,305,000 | | | New South Wales Treasury Corp., Series 17RG, 5.500%, 3/01/2017, (AUD) | | | 66,373,969 | |
| | 26,730,000 | | | Queensland Treasury Corp., Series 14, 5.750%, 11/21/2014, (AUD) | | | 25,805,058 | |
| | | | | | | | |
| | | | | | | 294,692,967 | |
| | | | | | | | |
| | | | Media Cable — 0.7% | | | | |
| | 3,315,000 | | | CCO Holdings LLC/CCO Holdings Capital Corp., 5.750%, 1/15/2024 | | | 3,132,675 | |
| | 25,270,000 | | | Shaw Communications, Inc., 5.650%, 10/01/2019, (CAD) | | | 26,971,594 | |
| | 540,000 | | | Time Warner Cable, Inc., 4.500%, 9/15/2042 | | | 394,828 | |
| | 44,800,000 | | | UPC Holding BV, 6.375%, 9/15/2022, 144A, (EUR) | | | 59,698,585 | |
| | 11,275,000 | | | Videotron Ltd., 5.625%, 6/15/2025, 144A, (CAD) | | | 10,428,431 | |
| | | | | | | | |
| | | | | | | 100,626,113 | |
| | | | | | | | |
| | | | Media Non-Cable — 1.2% | | | | |
| | 1,035,000 | | | Clear Channel Communications, Inc., 4.900%, 5/15/2015 | | | 970,313 | |
| | 3,760,000 | | | Clear Channel Communications, Inc., 5.500%, 9/15/2014 | | | 3,694,200 | |
| | 64,250,000 | | | Clear Channel Communications, Inc., 9.000%, 3/01/2021 | | | 62,161,875 | |
| | 90,000,000 | | | Grupo Televisa SAB, EMTN, 7.250%, 5/14/2043, (MXN) | | | 5,801,963 | |
| | 11,620,000 | | | Intelsat Jackson Holdings S.A., 5.500%, 8/01/2023, 144A | | | 10,864,700 | |
| | 3,995,000 | | | Intelsat Luxembourg S.A., 6.750%, 6/01/2018, 144A | | | 4,144,812 | |
| | 28,785,000 | | | Intelsat Luxembourg S.A., 7.750%, 6/01/2021, 144A | | | 29,792,475 | |
| | 16,000,000 | | | Intelsat Luxembourg S.A., 8.125%, 6/01/2023, 144A | | | 16,880,000 | |
| | 3,730,000 | | | R.R. Donnelley & Sons Co., 7.000%, 2/15/2022 | | | 3,748,650 | |
| | 8,335,000 | | | R.R. Donnelley & Sons Co., 7.875%, 3/15/2021 | | | 8,939,287 | |
| | 28,455,000 | | | R.R. Donnelley & Sons Co., 8.250%, 3/15/2019 | | | 31,585,050 | |
| | | | | | | | |
| | | | | | | 178,583,325 | |
| | | | | | | | |
| | | | Metals & Mining — 0.9% | | | | |
| | 3,949,000 | | | Alcoa, Inc., 5.870%, 2/23/2022 | | | 3,949,426 | |
| | 2,565,000 | | | Alcoa, Inc., 5.900%, 2/01/2027 | | | 2,480,473 | |
| | 1,405,000 | | | Alcoa, Inc., 5.950%, 2/01/2037 | | | 1,247,896 | |
| | 4,330,000 | | | Alcoa, Inc., 6.750%, 1/15/2028 | | | 4,382,012 | |
| | 25,271,000 | | | ArcelorMittal, 7.250%, 3/01/2041 | | | 23,122,965 | |
| | 29,695,000 | | | Barminco Finance Pty Ltd., 9.000%, 6/01/2018, 144A | | | 27,096,687 | |
| | 7,825,000 | | | Barrick North America Finance LLC, 5.750%, 5/01/2043 | | | 6,565,848 | |
See accompanying notes to financial statements.
19 |
Portfolio of Investments – as of September 30, 2013
Loomis Sayles Strategic Income Fund – (continued)
| | | | | | | | |
Principal
Amount (‡) | | | Description | | Value (†) | |
| | | | Metals & Mining — continued | | | | |
| $ | 21,905,000 | | | Essar Steel Algoma, Inc., 9.875%, 6/15/2015, 144A | | $ | 17,195,425 | |
| | 4,200,000 | | | Rain CII Carbon LLC/CII Carbon Corp., 8.250%, 1/15/2021, 144A | | | 4,221,000 | |
| | 16,135,000 | | | Russel Metals, Inc., 6.000%, 4/19/2022, 144A, (CAD) | | | 15,512,188 | |
| | 6,779,000 | | | United States Steel Corp., 6.650%, 6/01/2037 | | | 5,541,833 | |
| | 7,490,000 | | | United States Steel Corp., 6.875%, 4/01/2021 | | | 7,546,175 | |
| | 16,435,000 | | | United States Steel Corp., 7.000%, 2/01/2018 | | | 17,421,100 | |
| | | | | | | | |
| | | | | | | 136,283,028 | |
| | | | | | | | |
| | | | Non-Captive Consumer — 3.1% | | | | |
| | 22,945,000 | | | SLM Corp., 5.500%, 1/25/2023 | | | 21,008,121 | |
| | 109,950(††) | | | SLM Corp., 6.000%, 12/15/2043 | | | 2,263,504 | |
| | 7,515,000 | | | SLM Corp., MTN, 4.625%, 9/25/2017 | | | 7,608,937 | |
| | 17,600,000 | | | SLM Corp., MTN, 7.250%, 1/25/2022 | | | 17,908,000 | |
| | 2,160,000 | | | SLM Corp., MTN, 8.000%, 3/25/2020 | | | 2,332,800 | |
| | 3,750,000 | | | SLM Corp., Series A, MTN, 0.566%, 1/27/2014(b) | | | 3,731,505 | |
| | 14,465,000 | | | SLM Corp., Series A, MTN, 5.000%, 6/15/2018 | | | 14,238,247 | |
| | 50,910,000 | | | SLM Corp., Series A, MTN, 5.625%, 8/01/2033 | | | 39,709,800 | |
| | 81,320,000 | | | SLM Corp., Series A, MTN, 8.450%, 6/15/2018 | | | 91,688,300 | |
| | 137,545,000 | | | Springleaf Finance Corp., 7.750%, 10/01/2021, 144A | | | 142,702,937 | |
| | 55,015,000 | | | Springleaf Finance Corp., 8.250%, 10/01/2023, 144A | | | 57,215,600 | |
| | 10,120,000 | | | Springleaf Finance Corp., MTN, 5.750%, 9/15/2016 | | | 10,448,900 | |
| | 800,000 | | | Springleaf Finance Corp., Series J, MTN, 6.500%, 9/15/2017 | | | 824,000 | |
| | 55,730,000 | | | Springleaf Finance Corp., Series J, MTN, 6.900%, 12/15/2017 | | | 58,237,850 | |
| | | | | | | | |
| | | | | | | 469,918,501 | |
| | | | | | | | |
| | | | Non-Captive Diversified — 3.8% | | | | |
| | 7,855,000 | | | Aircastle Ltd., 7.625%, 4/15/2020 | | | 8,679,775 | |
| | 57,000,000 | | | General Electric Capital Corp., GMTN, 4.250%, 1/17/2018, (NZD) | | | 46,186,474 | |
| | 79,035,000 | | | General Electric Capital Corp., Series A, EMTN, 6.750%, 9/26/2016, (NZD) | | | 69,168,860 | |
| | 25,320,000 | | | General Electric Capital Corp., Series A, GMTN, 5.500%, 2/01/2017, (NZD) | | | 21,477,925 | |
| | 58,490,000 | | | General Electric Capital Corp., Series A, GMTN, 7.625%, 12/10/2014, (NZD) | | | 50,730,786 | |
| | 15,305,000 | | | General Electric Capital Corp., Series A, MTN, 0.568%, 5/13/2024(b) | | | 14,300,502 | |
| | 245,797,000 | | | General Electric Capital Corp., Series A, MTN, 6.500%, 9/28/2015, (NZD) | | | 213,054,716 | |
| | 325,000 | | | International Lease Finance Corp., 3.875%, 4/15/2018 | | | 314,031 | |
| | 2,665,000 | | | International Lease Finance Corp., 5.875%, 4/01/2019 | | | 2,774,574 | |
| | 24,750,000 | | | International Lease Finance Corp., 5.875%, 8/15/2022 | | | 24,378,750 | |
| | 1,995,000 | | | International Lease Finance Corp., 6.250%, 5/15/2019 | | | 2,094,750 | |
| | 20,610,000 | | | International Lease Finance Corp., 7.125%, 9/01/2018, 144A | | | 23,031,675 | |
| | 10,245,000 | | | International Lease Finance Corp., 8.250%, 12/15/2020 | | | 11,679,300 | |
| | 4,000,000 | | | iStar Financial, Inc., 3.875%, 7/01/2016 | | | 4,010,000 | |
| | 11,995,000 | | | iStar Financial, Inc., 4.875%, 7/01/2018 | | | 11,635,150 | |
| | 23,175,000 | | | iStar Financial, Inc., 5.850%, 3/15/2017 | | | 24,044,063 | |
| | 8,300,000 | | | iStar Financial, Inc., 6.050%, 4/15/2015 | | | 8,652,750 | |
| | 19,240,000 | | | iStar Financial, Inc., 7.125%, 2/15/2018 | | | 20,634,900 | |
| | 19,915,000 | | | Ladder Capital Finance Holdings LLLP/Ladder Capital Finance Corp.,
7.375%, 10/01/2017 | | | 20,836,069 | |
| | | | | | | | |
| | | | | | | 577,685,050 | |
| | | | | | | | |
See accompanying notes to financial statements.
| 20
Portfolio of Investments – as of September 30, 2013
Loomis Sayles Strategic Income Fund – (continued)
| | | | | | | | |
Principal
Amount (‡) | | | Description | | Value (†) | |
| | | | Oil Field Services — 0.3% | | | | |
| $ | 41,550,000 | | | Edgen Murray Corp., 8.750%, 11/01/2020, 144A | | $ | 42,173,250 | |
| | 7,170,000 | | | Pan American Energy LLC/Argentine Branch, 7.875%, 5/07/2021, 144A | | | 7,170,000 | |
| | | | | | | | |
| | | | | | | 49,343,250 | |
| | | | | | | | |
| | | | Paper — 0.8% | | | | |
| | 14,715,000 | | | Georgia-Pacific LLC, 7.250%, 6/01/2028 | | | 17,957,038 | |
| | 47,875,000 | | | Georgia-Pacific LLC, 7.750%, 11/15/2029 | | | 60,585,764 | |
| | 775,000 | | | Georgia-Pacific LLC, 8.875%, 5/15/2031 | | | 1,070,689 | |
| | 4,865,000 | | | Westvaco Corp., 7.950%, 2/15/2031 | | | 5,619,046 | |
| | 23,365,000 | | | Westvaco Corp., 8.200%, 1/15/2030 | | | 27,440,744 | |
| | 2,840,000 | | | Weyerhaeuser Co., 6.950%, 10/01/2027 | | | 3,278,388 | |
| | | | | | | | |
| | | | | | | 115,951,669 | |
| | | | | | | | |
| | | | Pharmaceuticals — 0.4% | | | | |
| | 52,735,000 | | | Valeant Pharmaceuticals International, 6.375%, 10/15/2020, 144A | | | 54,844,400 | |
| | | | | | | | |
| | | | Pipelines — 0.8% | | | | |
| | 750,000 | | | El Paso Corp., GMTN, 7.800%, 8/01/2031 | | | 762,782 | |
| | 8,935,000 | | | IFM US Colonial Pipeline 2 LLC, 6.450%, 5/01/2021, 144A | | | 9,388,585 | |
| | 39,759,324 | | | Maritimes & Northeast Pipeline LLC, 7.500%, 5/31/2014, 144A(d) | | | 41,135,871 | |
| | 69,505,000 | | | NGPL PipeCo LLC, 7.119%, 12/15/2017, 144A | | | 61,338,163 | |
| | 3,870,000 | | | NGPL PipeCo LLC, 7.768%, 12/15/2037, 144A | | | 3,154,050 | |
| | 3,065,000 | | | Rockies Express Pipeline LLC, 6.875%, 4/15/2040, 144A | | | 2,283,241 | |
| | 4,168,000 | | | Transportadora de Gas del Sur S.A., 7.875%, 5/14/2017, 144A | | | 3,772,040 | |
| | | | | | | | |
| | | | | | | 121,834,732 | |
| | | | | | | | |
| | | | Property & Casualty Insurance — 0.4% | | | | |
| | 14,855,000 | | | Hanover Insurance Group, Inc. (The), 6.375%, 6/15/2021 | | | 16,277,723 | |
| | 3,405,000 | | | Hanover Insurance Group, Inc. (The), 7.500%, 3/01/2020 | | | 3,853,411 | |
| | 12,510,000 | | | MBIA Insurance Corp., 11.528%, 1/15/2033, 144A(b)(g) | | | 8,381,700 | |
| | 11,200,000 | | | White Mountains Re Group Ltd., 6.375%, 3/20/2017, 144A | | | 12,245,632 | |
| | 3,000,000 | | | White Mountains Re Group Ltd., (fixed rate to 6/30/2017, variable rate thereafter), 7.506%, 144A(l) | | | 3,083,658 | |
| | 1,425,000 | | | XL Group PLC, 6.375%, 11/15/2024 | | | 1,634,115 | |
| | 17,870,000 | | | XL Group PLC, (fixed rate to 4/15/2017, variable rate thereafter),
6.500%(l) | | | 17,110,525 | |
| | | | | | | | |
| | | | | | | 62,586,764 | |
| | | | | | | | |
| | | | Railroads — 0.6% | | | | |
| | 90,000,000 | | | Hellenic Railways Organization S.A., EMTN, 0.560%, 5/24/2016, (EUR)(b)(d) | | | 91,317,406 | |
| | 1,153,000 | | | Missouri Pacific Railroad Co., 5.000%, 1/01/2045(d) | | | 956,990 | |
| | | | | | | | |
| | | | | | | 92,274,396 | |
| | | | | | | | |
| | | | Retailers — 0.7% | | | | |
| | 3,325,000 | | | Dillard’s, Inc., 7.000%, 12/01/2028 | | | 3,358,250 | |
| | 4,187,000 | | | Dillard’s, Inc., 7.130%, 8/01/2018 | | | 4,699,908 | |
| | 1,500,000 | | | Dillard’s, Inc., 7.750%, 7/15/2026 | | | 1,627,500 | |
| | 425,000 | | | Dillard’s, Inc., 7.875%, 1/01/2023 | | | 471,750 | |
| | 10,270,000 | | | Foot Locker, Inc., 8.500%, 1/15/2022(c) | | | 11,276,382 | |
| | 2,440,000 | | | J.C. Penney Corp., Inc., 5.750%, 2/15/2018 | | | 1,915,400 | |
See accompanying notes to financial statements.
21 |
Portfolio of Investments – as of September 30, 2013
Loomis Sayles Strategic Income Fund – (continued)
| | | | | | | | |
Principal
Amount (‡) | | | Description | | Value (†) | |
| | | | Retailers — continued | | | | |
| $ | 29,129,000 | | | J.C. Penney Corp., Inc., 6.375%, 10/15/2036 | | $ | 20,317,477 | |
| | 2,800,000 | | | J.C. Penney Corp., Inc., 7.625%, 3/01/2097 | | | 1,876,000 | |
| | 12,275,000 | | | Macy’s Retail Holdings, Inc., 6.790%, 7/15/2027 | | | 13,831,409 | |
| | 6,365,000 | | | Marks & Spencer PLC, 7.125%, 12/01/2037, 144A | | | 6,489,232 | |
| | 37,646,000 | | | Toys R Us, Inc., 7.375%, 10/15/2018 | | | 32,469,675 | |
| | | | | | | | |
| | | | | | | 98,332,983 | |
| | | | | | | | |
| | | | Sovereigns — 1.3% | | | | |
| | 64,132,000,000 | | | Indonesia Treasury Bond, Series FR43, 10.250%, 7/15/2022, (IDR) | | | 6,069,474 | |
| | 10,000,000,000 | | | Indonesia Treasury Bond, Series FR47, 10.000%, 2/15/2028, (IDR) | | | 936,978 | |
| | 162,850,000 | | | Republic of Brazil, 8.500%, 1/05/2024, (BRL) | | | 66,387,662 | |
| | 55,925,000 | | | Republic of Brazil, 10.250%, 1/10/2028, (BRL) | | | 25,170,413 | |
| | 49,120,000 | | | Republic of Brazil, 12.500%, 1/05/2016, (BRL) | | | 23,825,294 | |
| | 18,400,000 | | | Republic of Croatia, 6.750%, 11/05/2019, 144A | | | 19,619,000 | |
| | 5,226,139,000 | | | Republic of Iceland, 6.000%, 10/13/2016, (ISK) | | | 30,349,853 | |
| | 1,605,660,000 | | | Republic of Iceland, 7.250%, 10/26/2022, (ISK) | | | 9,468,012 | |
| | 3,112,923,000 | | | Republic of Iceland, 8.750%, 2/26/2019, (ISK) | | | 19,740,106 | |
| | | | | | | | |
| | | | | | | 201,566,792 | |
| | | | | | | | |
| | | | Supermarkets — 1.0% | | | | |
| | 5,871,000 | | | American Stores Co., 7.900%, 5/01/2017 | | | 6,516,810 | |
| | 79,276,000 | | | New Albertson’s, Inc., 7.450%, 8/01/2029 | | | 63,618,990 | |
| | 22,640,000 | | | New Albertson’s, Inc., 7.750%, 6/15/2026 | | | 18,451,600 | |
| | 17,140,000 | | | New Albertson’s, Inc., 8.000%, 5/01/2031 | | | 14,097,650 | |
| | 5,815,000 | | | New Albertson’s, Inc., 8.700%, 5/01/2030 | | | 4,950,019 | |
| | 16,342,000 | | | New Albertson’s, Inc., Series C, MTN, 6.625%, 6/01/2028 | | | 11,766,240 | |
| | 34,580,000 | | | SUPERVALU, Inc., 6.750%, 6/01/2021, 144A | | | 32,851,000 | |
| | | | | | | | |
| | | | | | | 152,252,309 | |
| | | | | | | | |
| | | | Supranational — 1.4% | | | | |
| | 16,375,000 | | | European Bank for Reconstruction & Development,
6.250%, 2/05/2016, (BRL) | | | 6,871,249 | |
| | 250,500,000,000 | | | European Bank for Reconstruction & Development,
7.200%, 6/08/2016, (IDR) | | | 21,082,669 | |
| | 128,560,000 | | | European Bank for Reconstruction & Development, EMTN,
9.000%, 4/28/2014, (BRL) | | | 57,942,780 | |
| | 60,665,000 | | | European Investment Bank, MTN, 6.250%, 4/15/2015, (AUD) | | | 59,498,929 | |
| | 24,450,000 | | | Inter-American Development Bank, EMTN, 6.000%, 12/15/2017, (NZD) | | | 21,419,451 | |
| | 8,300,000 | | | International Bank for Reconstruction & Development,
1.430%, 3/05/2014, (SGD) | | | 6,630,692 | |
| | 72,900,000 | | | International Finance Corp., GMTN, 5.000%, 12/21/2015, (BRL) | | | 30,208,618 | |
| | | | | | | | |
| | | | | | | 203,654,388 | |
| | | | | | | | |
| | | | Technology — 1.2% | |
| | 93,399,000 | | | Alcatel-Lucent USA, Inc., 6.450%, 3/15/2029 | | | 78,922,155 | |
| | 5,845,000 | | | Alcatel-Lucent USA, Inc., 6.500%, 1/15/2028 | | | 4,880,575 | |
| | 25,000,000 | | | Alcatel-Lucent USA, Inc., 8.875%, 1/01/2020, 144A | | | 26,375,000 | |
| | 34,955,000 | | | Amkor Technology, Inc., 6.375%, 10/01/2022 | | | 33,382,025 | |
| | 14,000,000 | | | First Data Corp., 10.625%, 6/15/2021, 144A | | | 14,210,000 | |
See accompanying notes to financial statements.
| 22
Portfolio of Investments – as of September 30, 2013
Loomis Sayles Strategic Income Fund – (continued)
| | | | | | | | |
Principal
Amount (‡) | | | Description | | Value (†) | |
| | | | Technology — continued | |
| $ | 8,015,000 | | | First Data Corp., 11.250%, 1/15/2021, 144A | | $ | 8,375,675 | |
| | 475,000 | | | Motorola Solutions, Inc., 6.000%, 11/15/2017 | | | 541,899 | |
| | 2,562,000 | | | Motorola Solutions, Inc., 6.625%, 11/15/2037 | | | 2,606,166 | |
| | 225,000 | | | Samsung Electronics Co. Ltd., 7.700%, 10/01/2027, 144A | | | 272,691 | |
| | 3,615,000 | | | SunGard Data Systems, Inc., 6.625%, 11/01/2019 | | | 3,687,300 | |
| | | | | | | | |
| | | | | | | 173,253,486 | |
| | | | | | | | |
| | | | Textile — 0.0% | |
| | 4,050,000 | | | Jones Group, Inc. (The), 6.125%, 11/15/2034 | | | 3,138,750 | |
| | 3,450,000 | | | Jones Group, Inc./Apparel Group Holdings/Apparel Group USA/Footwear Accessories Retail, 6.875%, 3/15/2019 | | | 3,527,625 | |
| | | | | | | | |
| | | | | | | 6,666,375 | |
| | | | | | | | |
| | | | Transportation Services — 0.4% | |
| | 10,503,000 | | | APL Ltd., 8.000%, 1/15/2024(d) | | | 9,822,406 | |
| | 6,098,586 | | | Atlas Air Pass Through Trust, Series 1998-1, Class B,
7.680%, 7/02/2015(c) | | | 6,205,311 | |
| | 6,862,758 | | | Atlas Air Pass Through Trust, Series 1998-1, Class C,
8.010%, 7/02/2011(c)(g)(h) | | | 8,990,213 | |
| | 5,254,119 | | | Atlas Air Pass Through Trust, Series 1999-1, Class A-1,
7.200%, 7/02/2020(c) | | | 5,385,472 | |
| | 4,650,730 | | | Atlas Air Pass Through Trust, Series 1999-1, Class B,
7.630%, 7/02/2016(c) | | | 4,680,029 | |
| | 4,744,556 | | | Atlas Air Pass Through Trust, Series 1999-1, Class C,
8.770%, 7/02/2012(c)(g)(h) | | | 6,215,368 | |
| | 2,349,241 | | | Atlas Air Pass Through Trust, Series 2000-1, Class B,
9.057%, 7/02/2017(c) | | | 2,490,196 | |
| | 3,970,000 | | | Erac USA Finance Co., 7.000%, 10/15/2037, 144A | | | 4,703,962 | |
| | 4,115,000 | | | Jack Cooper Holdings Corp., 9.250%, 6/01/2020, 144A | | | 4,403,050 | |
| | | | | | | | |
| | | | | | | 52,896,007 | |
| | | | | | | | |
| | | | Treasuries — 11.9% | |
| | 80,220,000 | | | Canadian Government, 1.000%, 8/01/2016, (CAD) | | | 77,010,577 | |
| | 272,755,000 | | | Canadian Government, 2.250%, 8/01/2014, (CAD) | | | 267,408,732 | |
| | 201,485,000 | | | Canadian Government, 2.500%, 6/01/2015, (CAD) | | | 199,971,002 | |
| | 89,045,000 | | | Canadian Government, 3.000%, 12/01/2015, (CAD) | | | 89,700,270 | |
| | 71,980,000 | | | Canadian Government, 3.750%, 6/01/2019, (CAD) | | | 76,364,278 | |
| | 25,445,000 | | | Canadian Government, 4.250%, 6/01/2018, (CAD) | | | 27,385,890 | |
| | 1,440,000 | | | Italy Buoni Poliennali Del Tesoro, 5.000%, 8/01/2034, (EUR) | | | 1,946,756 | |
| | 1,440,000 | | | Italy Buoni Poliennali Del Tesoro, 5.250%, 11/01/2029, (EUR) | | | 2,021,392 | |
| | 1,435,000 | | | Italy Buoni Poliennali Del Tesoro, 5.750%, 2/01/2033, (EUR) | | | 2,117,579 | |
| | 20,219,481(†††) | | | Mexican Fixed Rate Bonds, Series M-20, 8.000%, 12/07/2023, (MXN) | | | 176,579,503 | |
| | 75,670,000 | | | New Zealand Government Bond, 6.000%, 12/15/2017, (NZD) | | | 67,894,414 | |
| | 836,485,000 | | | Norwegian Government Bond, 4.250%, 5/19/2017, (NOK) | | | 150,179,887 | |
| | 1,266,835,000 | | | Norwegian Government Bond, 5.000%, 5/15/2015, (NOK) | | | 221,794,984 | |
| | 23,580,000 | | | Portugal Obrigacoes do Tesouro OT, 3.850%, 4/15/2021, 144A, (EUR) | | | 26,581,555 | |
| | 1,995,000 | | | Portugal Obrigacoes do Tesouro OT, 4.100%, 4/15/2037, 144A, (EUR) | | | 1,845,371 | |
| | 6,225,000 | | | Portugal Obrigacoes do Tesouro OT, 4.800%, 6/15/2020, 144A, (EUR) | | | 7,566,578 | |
| | 43,330,000 | | | Portugal Obrigacoes do Tesouro OT, 4.950%, 10/25/2023, 144A, (EUR) | | | 50,881,301 | |
See accompanying notes to financial statements.
23 |
Portfolio of Investments – as of September 30, 2013
Loomis Sayles Strategic Income Fund – (continued)
| | | | | | | | |
Principal
Amount (‡) | | | Description | | Value (†) | |
| | | | Treasuries — continued | |
| | 65,300,000 | | | Singapore Government Bond, 1.375%, 10/01/2014, (SGD) | | $ | 52,594,048 | |
| | 72,860,000 | | | U.S. Treasury Bond, 2.750%, 11/15/2042 | | | 60,303,016 | |
| | 81,630,000 | | | U.S. Treasury Bond, 2.875%, 5/15/2043 | | | 69,283,462 | |
| | 169,985,000 | | | U.S. Treasury Note, 0.250%, 6/30/2014 | | | 170,177,593 | |
| | | | | | | | |
| | | | | | | 1,799,608,188 | |
| | | | | | | | |
| | | | Wireless — 1.0% | | | | |
| | 293,000,000 | | | America Movil SAB de CV, 6.450%, 12/05/2022, (MXN) | | | 20,955,135 | |
| | 47,603,000 | | | NII Capital Corp., 10.000%, 8/15/2016 | | | 45,698,880 | |
| | 31,041,000 | | | Sprint Capital Corp., 6.875%, 11/15/2028 | | | 27,704,093 | |
| | 29,252,000 | | | Sprint Capital Corp., 6.900%, 5/01/2019 | | | 30,056,430 | |
| | 6,260,000 | | | Sprint Capital Corp., 8.750%, 3/15/2032 | | | 6,361,725 | |
| | 23,641,000 | | | Sprint Corp., 7.250%, 9/15/2021, 144A | | | 23,877,410 | |
| | | | | | | | |
| | | | | | | 154,653,673 | |
| | | | | | | | |
| | | | Wirelines — 3.9% | | | | |
| | 2,825,000 | | | Axtel SAB de CV, (Step to 8.000% on 1/31/2014), 7.000%, 1/31/2020, 144A(i) | | | 2,641,375 | |
| | 4,370,000 | | | Bell Canada, MTN, 6.550%, 5/01/2029, 144A, (CAD) | | | 4,949,654 | |
| | 21,480,000 | | | Bell Canada, Series M-17, 6.100%, 3/16/2035, (CAD) | | | 23,176,629 | |
| | 72,320,000 | | | CenturyLink, Inc., 6.450%, 6/15/2021 | | | 71,958,400 | |
| | 765,000 | | | CenturyLink, Inc., 7.650%, 3/15/2042 | | | 680,850 | |
| | 7,410,000 | | | CenturyLink, Inc., Series G, 6.875%, 1/15/2028 | | | 6,743,100 | |
| | 2,965,000 | | | CenturyLink, Inc., Series P, 7.600%, 9/15/2039 | | | 2,646,263 | |
| | 350,000 | | | Cincinnati Bell Telephone Co. LLC, 6.300%, 12/01/2028 | | | 318,500 | |
| | 17,900,000 | | | Eircom Finance Ltd., 9.250%, 5/15/2020, 144A, (EUR) | | | 24,216,023 | |
| | 5,330,000 | | | Embarq Corp., 7.995%, 6/01/2036 | | | 5,426,318 | |
| | 37,225,000 | | | FairPoint Communications, Inc., 8.750%, 8/15/2019, 144A | | | 37,876,437 | |
| | 38,336,000 | | | Frontier Communications Corp., 7.875%, 1/15/2027 | | | 36,419,200 | |
| | 1,120,000 | | | Koninklijke (Royal) KPN NV, EMTN, 5.750%, 3/18/2016, (GBP) | | | 1,981,783 | |
| | 1,800,000 | | | Koninklijke (Royal) KPN NV, GMTN, 4.000%, 6/22/2015, (EUR) | | | 2,560,881 | |
| | 28,505,000 | | | Level 3 Financing, Inc., 7.000%, 6/01/2020 | | | 28,790,050 | |
| | 5,965,000 | | | Level 3 Financing, Inc., 8.625%, 7/15/2020 | | | 6,516,762 | |
| | 2,555,000 | | | Level 3 Financing, Inc., 9.375%, 4/01/2019 | | | 2,816,888 | |
| | 4,667,000 | | | Oi S.A., 5.750%, 2/10/2022, 144A | | | 4,083,625 | |
| | 500,000 | | | OTE PLC, GMTN, 4.625%, 5/20/2016, (EUR) | | | 666,279 | |
| | 16,550,000 | | | Portugal Telecom International Finance BV, EMTN, 4.500%, 6/16/2025, (EUR) | | | 19,747,693 | |
| | 29,750,000 | | | Portugal Telecom International Finance BV, EMTN, 5.000%, 11/04/2019, (EUR) | | | 40,448,538 | |
| | 750,000 | | | Portugal Telecom International Finance BV, EMTN, 5.625%, 2/08/2016, (EUR) | | | 1,060,297 | |
| | 800,000 | | | Portugal Telecom International Finance BV, GMTN, 4.375%, 3/24/2017, (EUR) | | | 1,095,852 | |
| | 16,145,000 | | | Qwest Capital Funding, Inc., 6.500%, 11/15/2018 | | | 17,436,600 | |
| | 42,460,000 | | | Qwest Capital Funding, Inc., 6.875%, 7/15/2028 | | | 37,789,400 | |
| | 12,463,000 | | | Qwest Capital Funding, Inc., 7.625%, 8/03/2021 | | | 12,649,945 | |
| | 32,395,000 | | | Qwest Capital Funding, Inc., 7.750%, 2/15/2031 | | | 30,613,275 | |
| | 31,060,000 | | | Qwest Corp., 6.875%, 9/15/2033 | | | 30,087,698 | |
| | 3,075,000 | | | Qwest Corp., 7.200%, 11/10/2026 | | | 3,076,614 | |
| | 3,999,000 | | | Qwest Corp., 7.250%, 9/15/2025 | | | 4,472,714 | |
| | 36,551,000 | | | Telecom Italia Capital S.A., 6.000%, 9/30/2034 | | | 30,061,480 | |
| | 22,645,000 | | | Telecom Italia Capital S.A., 6.375%, 11/15/2033 | | | 19,450,289 | |
See accompanying notes to financial statements.
| 24
Portfolio of Investments – as of September 30, 2013
Loomis Sayles Strategic Income Fund – (continued)
| | | | | | | | |
Principal
Amount (‡) | | | Description | | Value (†) | |
| | | | Wirelines — continued | | | | |
| | 7,200,000 | | | Telecom Italia SpA, EMTN, 5.250%, 3/17/2055, (EUR) | | $ | 7,623,128 | |
| | 5,250,000 | | | Telefonica Emisiones SAU, 4.570%, 4/27/2023 | | | 5,034,629 | |
| | 4,350,000 | | | Telefonica Emisiones SAU, 7.045%, 6/20/2036 | | | 4,617,077 | |
| | 31,690,000 | | | Telus Corp., 4.950%, 3/15/2017, (CAD) | | | 33,179,665 | |
| | 18,600,000 | | | Telus Corp., Series CG, 5.050%, 12/04/2019, (CAD) | | | 19,745,199 | |
| | 3,346,000 | | | Verizon New England, Inc., 7.875%, 11/15/2029 | | | 3,903,467 | |
| | 2,080,000 | | | Verizon Pennsylvania, Inc., 6.000%, 12/01/2028 | | | 2,023,917 | |
| | | | | | | | |
| | | | | | | 588,586,494 | |
| | | | | | | | |
| | | | Total Non-Convertible Bonds
(Identified Cost $8,507,337,543) | | | 8,872,940,931 | |
| | | | | | | | |
| | | | | | | | |
| | Convertible Bonds — 8.3% | |
| | | | Airlines — 0.0% | | | | |
| | 1,255,000 | | | United Continental Holdings, Inc., 4.500%, 6/30/2021 | | | 1,362,227 | |
| | | | | | | | |
| | | | Automotive — 1.6% | | | | |
| | 125,580,000 | | | Ford Motor Co., 4.250%, 11/15/2016 | | | 248,098,987 | |
| | | | | | | | |
| | | | Construction Machinery — 0.2% | | | | |
| | 4,240,000 | | | ArvinMeritor, Inc., (Step to Zero Coupon on 2/15/2019), 4.000%, 2/15/2027(i) | | | 3,874,300 | |
| | 8,460,000 | | | Navistar International Corp., 3.000%, 10/15/2014 | | | 8,571,037 | |
| | 16,727,000 | | | Trinity Industries, Inc., 3.875%, 6/01/2036 | | | 20,291,942 | |
| | | | | | | | |
| | | | | | | 32,737,279 | |
| | | | | | | | |
| | | | Healthcare — 0.5% | | | | |
| | 7,105,000 | | | Hologic, Inc., (accretes to principal after 12/15/2013), 2.000%, 12/15/2037(i) | | | 7,113,881 | |
| | 13,415,000 | | | Hologic, Inc., (accretes to principal after 3/01/2018), 2.000%, 3/01/2042(i) | | | 13,482,075 | |
| | 2,380,000 | | | LifePoint Hospitals, Inc., 3.500%, 5/15/2014 | | | 2,504,950 | |
| | 3,780,000 | | | Omnicare, Inc., 3.250%, 12/15/2035 | | | 4,016,250 | |
| | 20,495,000 | | | Omnicare, Inc., 3.750%, 12/15/2025 | | | 43,539,066 | |
| | | | | | | | |
| | | | | | | 70,656,222 | |
| | | | | | | | |
| | | | Home Construction — 0.6% | | | | |
| | 52,005,000 | | | Lennar Corp., 3.250%, 11/15/2021, 144A | | | 86,328,300 | |
| | | | | | | | |
| | | | Independent Energy — 0.4% | | | | |
| | 20,440,000 | | | Chesapeake Energy Corp., 2.250%, 12/15/2038 | | | 18,651,500 | |
| | 24,655,000 | | | Chesapeake Energy Corp., 2.500%, 5/15/2037 | | | 24,223,538 | |
| | 9,196,000 | | | Chesapeake Energy Corp., 2.750%, 11/15/2035 | | | 9,494,870 | |
| | | | | | | | |
| | | | | | | 52,369,908 | |
| | | | | | | | |
| | | | Life Insurance — 0.6% | | | | |
| | 72,915,000 | | | Old Republic International Corp., 3.750%, 3/15/2018 | | | 86,176,416 | |
| | | | | | | | |
| | | | Metals & Mining — 0.2% | | | | |
| | 1,000,000 | | | Steel Dynamics, Inc., 5.125%, 6/15/2014 | | | 1,091,250 | |
| | 21,845,000 | | | United States Steel Corp., 2.750%, 4/01/2019 | | | 24,179,684 | |
| | | | | | | | |
| | | | | | | 25,270,934 | |
| | | | | | | | |
| | | | Non-Captive Diversified — 0.0% | | | | |
| | 5,025,000 | | | Jefferies Group LLC, 3.875%, 11/01/2029 | | | 5,266,828 | |
| | | | | | | | |
See accompanying notes to financial statements.
25 |
Portfolio of Investments – as of September 30, 2013
Loomis Sayles Strategic Income Fund – (continued)
| | | | | | | | |
Principal
Amount (‡) | | | Description | | Value (†) | |
| | | | Packaging — 0.2% | | | | |
| $ | 30,570,000 | | | Owens-Brockway Glass Container, Inc., 3.000%, 6/01/2015, 144A | | $ | 31,620,844 | |
| | | | | | | | |
| | | | Pharmaceuticals — 0.0% | | | | |
| | 1,810,000 | | | Illumina, Inc., 0.250%, 3/15/2016, 144A | | | 2,065,663 | |
| | | | | | | | |
| | | | REITs – Mortgage — 0.1% | | | | |
| | 10,660,000 | | | iStar Financial, Inc., 3.000%, 11/15/2016 | | | 13,291,688 | |
| | | | | | | | |
| | | | REITs – Warehouse/Industrials — 0.1% | | | | |
| | 19,445,000 | | | ProLogis LP, 3.250%, 3/15/2015 | | | 22,009,309 | |
| | | | | | | | |
| | | | Technology — 3.0% | | | | |
| | 49,215,000 | | | Ciena Corp., 0.875%, 6/15/2017 | | | 50,107,022 | |
| | 7,185,000 | | | Ciena Corp., 3.750%, 10/15/2018, 144A | | | 10,584,403 | |
| | 6,075,000 | | | Ciena Corp., 4.000%, 3/15/2015, 144A | | | 8,250,609 | |
| | 2,429,000 | | | Intel Corp., 2.950%, 12/15/2035 | | | 2,629,393 | |
| | 205,005,000 | | | Intel Corp., 3.250%, 8/01/2039 | | | 253,821,816 | |
| | 1,055,000 | | | Lam Research Corp., Series B, 1.250%, 5/15/2018 | | | 1,269,297 | |
| | 5,714,290 | | | Liberty Media LLC, 3.500%, 1/15/2031 | | | 2,942,859 | |
| | 52,965,000 | | | Micron Technology, Inc., Series B, 1.875%, 8/01/2031 | | | 99,276,272 | |
| | 8,550,000 | | | Micron Technology, Inc., Series C, 2.375%, 5/01/2032 | | | 16,351,875 | |
| | 6,000,000 | | | Micron Technology, Inc., Series D, 3.125%, 5/01/2032 | | | 11,377,500 | |
| | | | | | | | |
| | | | | | | 456,611,046 | |
| | | | | | | | |
| | | | Utility Other — 0.0% | | | | |
| | 1,800,000 | | | CMS Energy Corp., 5.500%, 6/15/2029 | | | 3,454,875 | |
| | | | | | | | |
| | | | Wirelines — 0.8% | | | | |
| | 3,220,500 | | | Axtel SAB de CV, (Step to 8.000% on 1/31/2014),
7.000%, 1/31/2020, 144A, (MXN)(c)(d)(i)(j) | | | 368,219 | |
| | 6,000,000 | | | Level 3 Communications, Inc., 6.500%, 10/01/2016 | | | 9,052,500 | |
| | 54,075,000 | | | Level 3 Communications, Inc., 7.000%, 3/15/2015, 144A(d) | | | 65,633,531 | |
| | 32,895,000 | | | Level 3 Communications, Inc., Series B, 7.000%, 3/15/2015(d) | | | 39,926,306 | |
| | 900,000 | | | Portugal Telecom International Finance BV, Series PTC,
4.125%, 8/28/2014, (EUR) | | | 1,235,829 | |
| | | | | | | | |
| | | | | | | 116,216,385 | |
| | | | | | | | |
| | | | Total Convertible Bonds
(Identified Cost $892,239,057) | | | 1,253,536,911 | |
| | | | | | | | |
| | | | | | | | |
| | Municipals — 1.0% | |
| | | | District of Columbia — 0.0% | | | | |
| | 3,850,000 | | | Metropolitan Washington DC Airports Authority, Series D,
8.000%, 10/01/2047 | | | 4,258,177 | |
| | | | | | | | |
| | | | Illinois — 0.3% | | | | |
| | 1,725,000 | | | Chicago O’Hare International Airport, Series A, (AGMC insured),
4.500%, 1/01/2038 | | | 1,595,349 | |
| | 47,285,000 | | | State of Illinois, 5.100%, 6/01/2033 | | | 41,924,300 | |
| | | | | | | | |
| | | | | | | 43,519,649 | |
| | | | | | | | |
See accompanying notes to financial statements.
| 26
Portfolio of Investments – as of September 30, 2013
Loomis Sayles Strategic Income Fund – (continued)
| | | | | | | | |
Principal
Amount (‡) | | | Description | | Value (†) | |
| | | | Michigan — 0.1% | | | | |
| $ | 12,580,000 | | | Michigan Tobacco Settlement Finance Authority Taxable Turbo, Series A,
7.309%, 6/01/2034 | | $ | 9,914,801 | |
| | | | | | | | |
| | | | Virginia — 0.6% | | | | |
| | 125,265,000 | | | Virginia Tobacco Settlement Financing Corp., Series A-1, 6.706%, 6/01/2046 | | | 86,725,970 | |
| | | | | | | | |
| | | | Total Municipals
(Identified Cost $179,330,492) | | | 144,418,597 | |
| | | | | | | | |
| | | | Total Bonds and Notes
(Identified Cost $9,578,907,092) | | | 10,270,896,439 | |
| | | | | | | | |
| | | | | | | | |
| | Senior Loans — 2.0% | |
| | | | Automotive — 0.1% | | | | |
| | 11,422,600 | | | TI Group Automotive Systems LLC, Term Loan B, 5.500%, 3/27/2019(b) | | | 11,529,744 | |
| | | | | | | | |
| | | | Chemicals — 0.3% | | | | |
| | 2,000,000 | | | Allnex USA, Inc., 2nd Lien Term Loan, 8.250%, 4/03/2020(b) | | | 2,045,000 | |
| | 4,850,737 | | | Ascend Performance Materials LLC, Term Loan B, 6.750%, 4/10/2018(b) | | | 4,590,010 | |
| | 31,355,000 | | | Houghton International, Inc., New 2nd Lien Term Loan, 9.500%, 12/18/2020(b) | | | 31,394,194 | |
| | | | | | | | |
| | | | | | | 38,029,204 | |
| | | | | | | | |
| | | | Consumer Products — 0.1% | | | | |
| | 8,589,669 | | | Visant Holding Corp., Term Loan B, 5.250%, 12/22/2016(b) | | | 8,315,144 | |
| | | | | | | | |
| | | | Diversified Manufacturing — 0.0% | | | | |
| | 6,385,000 | | | Ameriforge Group, Inc., 2nd Lien Term Loan, 8.750%, 12/18/2020(b) | | | 6,436,910 | |
| | | | | | | | |
| | | | Electric — 0.0% | | | | |
| | 4,788,467 | | | Texas Competitive Electric Holdings Company LLC, Non-Extended Term Loan, 3.710%, 10/10/2014(k) | | | 3,229,629 | |
| | | | | | | | |
| | | | Food & Beverage — 0.1% | | | | |
| | 11,501,000 | | | DS Waters of America, Inc., New Term Loan, 5.250%, 8/19/2020(b) | | | 11,580,127 | |
| | | | | | | | |
| | | | Healthcare — 0.1% | | | | |
| | 20,772,938 | | | Apria Healthcare Group I, Term Loan, 6.750%, 4/05/2020(b) | | | 20,911,078 | |
| | | | | | | | |
| | | | Media Non-Cable — 0.1% | | | | |
| | 19,475,891 | | | SuperMedia, Inc., Exit Term Loan, 11.600%, 12/30/2016(b) | | | 15,074,340 | |
| | | | | | | | |
| | | | Metals & Mining — 0.3% | | | | |
| | 11,503,800 | | | Essar Steel Algoma, Inc., ABL Term Loan, 8.750%, 9/19/2014(b) | | | 11,659,101 | |
| | 33,417,450 | | | FMG Resources (August 2006) Pty Ltd., Term Loan, 5.250%, 10/18/2017(b) | | | 33,494,979 | |
| | | | | | | | |
| | | | | | | 45,154,080 | |
| | | | | | | | |
| | | | Non-Captive Diversified — 0.5% | | | | |
| | 78,617,233 | | | iStar Financial, Inc., Add on Term Loan A2, 7.000%, 3/17/2017(b) | | | 80,425,429 | |
| | | | | | | | |
| | | | Oil Field Services — 0.2% | | | | |
| | 26,160,164 | | | Frac Tech International LLC, Term Loan B, 8.500%, 5/06/2016(b) | | | 25,623,881 | |
| | | | | | | | |
| | | | Other Utility — 0.0% | | | | |
| | 1,298,000 | | | Power Team Services LLC, 2nd Lien Term Loan, 8.250%, 11/06/2020(b) | | | 1,294,755 | |
| | | | | | | | |
| | | | Retailers — 0.0% | | | | |
| | 3,000,000 | | | Toys R Us Property Company I LLC, New Term Loan B, 6.000%, 8/21/2019(b) | | | 2,945,640 | |
| | | | | | | | |
See accompanying notes to financial statements.
27 |
Portfolio of Investments – as of September 30, 2013
Loomis Sayles Strategic Income Fund – (continued)
| | | | | | | | |
Principal
Amount (‡) | | | Description | | Value (†) | |
| | | | Supermarkets — 0.1% | | | | |
| $ | 13,800,977 | | | Supervalu, Inc., Refi Term Loan B, 5.000%, 3/21/2019(b) | | $ | 13,749,223 | |
| | | | | | | | |
| | | | Wirelines — 0.1% | | | | |
| | 17,702,607 | | | Hawaiian Telcom Communications, Inc., Term Loan B, 5.000%, 6/06/2019(b) | | | 17,720,309 | |
| | 1,495,000 | | | Integra Telecom, Inc., 2nd Lien Term Loan, 9.750%, 2/21/2020(b) | | | 1,531,209 | |
| | 2,645,000 | | | Light Tower Fiber LLC, 2nd Lien Term Loan, 8.000%, 4/12/2021(b) | | | 2,671,450 | |
| | | | | | | | |
| | | | | | | 21,922,968 | |
| | | | | | | | |
| | | | Total Senior Loans
(Identified Cost $306,903,703) | | | 306,222,152 | |
| | | | | | | | |
| | | | | | | | |
| Shares | | | | | | |
| | Common Stocks — 18.8% | |
| | | | Biotechnology — 0.5% | | | | |
| | 930,495 | | | Vertex Pharmaceuticals, Inc.(g) | | | 70,550,131 | |
| | | | | | | | |
| | | | Chemicals — 2.5% | | | | |
| | 1,364,851 | | | Dow Chemical Co. (The) | | | 52,410,278 | |
| | 2,000,000 | | | PPG Industries, Inc. | | | 334,120,000 | |
| | | | | | | | |
| | | | | | | 386,530,278 | |
| | | | | | | | |
| | | | Containers & Packaging — 0.1% | | | | |
| | 460,656 | | | Owens-Illinois, Inc.(g) | | | 13,828,893 | |
| | 2,304 | | | Rock-Tenn Co., Class A | | | 233,326 | |
| | | | | | | | |
| | | | | | | 14,062,219 | |
| | | | | | | | |
| | | | Diversified Financial Services — 0.4% | | | | |
| | 3,979,932 | | | Bank of America Corp. | | | 54,923,062 | |
| | | | | | | | |
| | | | Diversified Telecommunication Services — 2.2% | | | | |
| | 183,181 | | | FairPoint Communications, Inc.(g) | | | 1,749,379 | |
| | 283,397 | | | Hawaiian Telcom Holdco, Inc.(g) | | | 7,538,360 | |
| | 200,000 | | | Telecom Italia SpA, Sponsored ADR | | | 1,630,000 | |
| | 3,871,339 | | | Telecom Italia SpA, Sponsored ADR | | | 25,395,984 | |
| | 19,550,590 | | | Telefonica S.A., Sponsored ADR(g) | | | 302,643,133 | |
| | | | | | | | |
| | | | | | | 338,956,856 | |
| | | | | | | | |
| | | | Electric Utilities — 0.0% | | | | |
| | 94,166 | | | Duke Energy Corp. | | | 6,288,405 | |
| | | | | | | | |
| | | | Electronic Equipment, Instruments & Components — 3.1% | | | | |
| | 32,000,000 | | | Corning, Inc. | | | 466,880,000 | |
| | | | | | | | |
| | | | Food Products — 0.5% | | | | |
| | 2,309,175 | | | ConAgra Foods, Inc. | | | 70,060,370 | |
| | | | | | | | |
| | | | Household Durables — 0.2% | | | | |
| | 477,725 | | | KB Home | | | 8,608,605 | |
| | 549,450 | | | Lennar Corp., Class A | | | 19,450,530 | |
| | | | | | | | |
| | | | | | | 28,059,135 | |
| | | | | | | | |
| | | | Insurance — 0.8% | | | | |
| | 1,510,275 | | | Prudential Financial, Inc. | | | 117,771,244 | |
| | | | | | | | |
See accompanying notes to financial statements.
| 28
Portfolio of Investments – as of September 30, 2013
Loomis Sayles Strategic Income Fund – (continued)
| | | | | | | | |
| Shares | | | Description | | Value (†) | |
| | | | Oil, Gas & Consumable Fuels — 2.0% | | | | |
| | 846,398 | | | Chesapeake Energy Corp. | | $ | 21,904,780 | |
| | 5,351,804 | | | Repsol YPF S.A., Sponsored ADR | | | 132,243,077 | |
| | 2,134,173 | | | Royal Dutch Shell PLC, ADR | | | 140,172,483 | |
| | 141,249 | | | Spectra Energy Corp. | | | 4,834,953 | |
| | | | | | | | |
| | | | | | | 299,155,293 | |
| | | | | | | | |
| | | | Pharmaceuticals — 3.8% | | | | |
| | 8,514,190 | | | Bristol-Myers Squibb Co. | | | 394,036,713 | |
| | 2,288 | | | Teva Pharmaceutical Industries, Ltd., Sponsored ADR | | | 86,441 | |
| | 1,708,077 | | | Valeant Pharmaceuticals International, Inc.(g) | | | 178,203,673 | |
| | | | | | | | |
| | | | | | | 572,326,827 | |
| | | | | | | | |
| | | | REITs – Apartments — 0.3% | | | | |
| | 290,904 | | | Apartment Investment & Management Co., Class A | | | 8,127,858 | |
| | 889,730 | | | Associated Estates Realty Corp. | | | 13,265,874 | |
| | 460,000 | | | Equity Residential | | | 24,642,200 | |
| | | | | | | | |
| | | | | | | 46,035,932 | |
| | | | | | | | |
| | | | REITs – Regional Malls — 0.1% | | | | |
| | 123,159 | | | Simon Property Group, Inc. | | | 18,255,859 | |
| | | | | | | | |
| | | | REITs – Shopping Centers — 0.0% | | | | |
| | 201,557 | | | DDR Corp. | | | 3,166,460 | |
| | | | | | | | |
| | | | Semiconductors & Semiconductor Equipment — 2.2% | | | | |
| | 14,733,856 | | | Intel Corp. | | | 337,699,980 | |
| | | | | | | | |
| | | | Trading Companies & Distributors — 0.1% | | | | |
| | 176,859 | | | United Rentals, Inc.(g) | | | 10,309,111 | |
| | | | | | | | |
| | | | Total Common Stocks
(Identified Cost $2,169,767,383) | | | 2,841,031,162 | |
| | | | | | | | |
| | | | | | | | |
| | Preferred Stocks — 4.1% | |
| | Convertible Preferred Stocks — 3.4% | |
| | | | Automotive — 1.4% | | | | |
| | 3,398,365 | | | General Motors Co., Series B, 4.750% | | | 170,428,005 | |
| | 657,940 | | | Goodyear Tire & Rubber Co. (The), 5.875% | | | 41,897,619 | |
| | | | | | | | |
| | | | | | | 212,325,624 | |
| | | | | | | | |
| | | | Banking — 0.1% | | | | |
| | 8,533 | | | Wells Fargo & Co., Series L, Class A, 7.500% | | | 9,706,373 | |
| | | | | | | | |
| | | | Electric — 0.1% | | | | |
| | 380,577 | | | AES Trust III, 6.750% | | | 19,181,081 | |
| | | | | | | | |
| | | | Home Construction — 0.1% | | | | |
| | 355,000 | | | Hovnanian Enterprises, Inc., 7.250% | | | 9,425,250 | |
| | | | | | | | |
| | | | Independent Energy — 0.4% | | | | |
| | 52,020 | | | Chesapeake Energy Corp., 4.500% | | | 4,601,689 | |
| | 66,673 | | | Chesapeake Energy Corp., 5.000% | | | 6,193,922 | |
| | 24,658 | | | Chesapeake Energy Corp., Series A, 5.750%, 144A | | | 27,200,856 | |
See accompanying notes to financial statements.
29 |
Portfolio of Investments – as of September 30, 2013
Loomis Sayles Strategic Income Fund – (continued)
| | | | | | | | |
| Shares | | | Description | | Value (†) | |
| | | | Independent Energy — continued | | | | |
| | 61,053 | | | SandRidge Energy, Inc., 7.000% | | $ | 6,090,037 | |
| | 99,800 | | | SandRidge Energy, Inc., 8.500% | | | 9,999,960 | |
| | | | | | | | |
| | | | | | | 54,086,464 | |
| | | | | | | | |
| | | | Metals & Mining — 0.4% | | | | |
| | 2,837,383 | | | ArcelorMittal, 6.000% | | | 60,975,361 | |
| | 312,604 | | | Cliffs Natural Resources, Inc., 7.000% | | | 6,180,181 | |
| | | | | | | | |
| | | | | | | 67,155,542 | |
| | | | | | | | |
| | | | Non-Captive Diversified — 0.1% | | | | |
| | 19,062 | | | Bank of America Corp., Series L, 7.250% | | | 20,586,960 | |
| | | | | | | | |
| | | | Pipelines — 0.1% | | | | |
| | 242,297 | | | El Paso Energy Capital Trust I, 4.750% | | | 13,600,130 | |
| | | | | | | | |
| | | | REITs – Diversified — 0.1% | | | | |
| | 391,776 | | | Weyerhaeuser Co., Series A, 6.375% | | | 20,756,292 | |
| | | | | | | | |
| | | | REITs – Healthcare — 0.0% | | | | |
| | 116,700 | | | Health Care REIT, Inc., Series I, 6.500% | | | 6,716,085 | |
| | | | | | | | |
| | | | REITs – Mortgage — 0.2% | | | | |
| | 450,965 | | | iStar Financial, Inc., Series J, 4.500% | | | 24,974,442 | |
| | | | | | | | |
| | | | Technology — 0.4% | | | | |
| | 58,020 | | | Lucent Technologies Capital Trust I, 7.750% | | | 58,774,260 | |
| | | | | | | | |
| | | | Total Convertible Preferred Stocks
(Identified Cost $471,133,002) | | | 517,288,503 | |
| | | | | | | | |
| | | | | | | | |
| | Non-Convertible Preferred Stocks — 0.7% | |
| | | | Banking — 0.4% | | | | |
| | 45,861 | | | Ally Financial, Inc., Series G, 7.000%, 144A | | | 43,820,185 | |
| | 35,000 | | | Bank of America Corp., 6.375% | | | 835,450 | |
| | 389,800 | | | Countrywide Capital IV, 6.750% | | | 9,706,020 | |
| | | | | | | | |
| | | | | | | 54,361,655 | |
| | | | | | | | |
| | | | Electric — 0.0% | | | | |
| | 393 | | | Entergy New Orleans, Inc., 4.750% | | | 37,937 | |
| | | | | | | | |
| | | | Government Sponsored — 0.2% | | | | |
| | 26,000 | | | Falcons Funding Trust I, (Step to 10.875% on 3/15/2015, variable rate after 3/15/2020), 8.875%, 144A(i) | | | 27,007,500 | |
| | | | | | | | |
| | | | Home Construction — 0.0% | | | | |
| | 208,246 | | | Hovnanian Enterprises, Inc., 7.625%(g) | | | 3,011,237 | |
| | | | | | | | |
| | | | Non-Captive Consumer — 0.0% | | | | |
| | 101,175 | | | SLM Corp., Series A, 6.970% | | | 4,714,755 | |
| | | | | | | | |
| | | | Non-Captive Diversified — 0.0% | | | | |
| | 10,425 | | | iStar Financial, Inc., Series G, 7.650% | | | 239,775 | |
| | 39,300 | | | iStar Financial, Inc., Series F, 7.800% | | | 920,799 | |
| | 39,200 | | | iStar Financial, Inc., Series E, 7.875% | | | 925,904 | |
| | | | | | | | |
| | | | | | | 2,086,478 | |
| | | | | | | | |
See accompanying notes to financial statements.
| 30
Portfolio of Investments – as of September 30, 2013
Loomis Sayles Strategic Income Fund – (continued)
| | | | | | | | |
| Shares | | | Description | | Value (†) | |
| | | | REITs – Office Property — 0.0% | | | | |
| | 1,596 | | | Highwoods Properties, Inc., Series A, 8.625% | | $ | 1,879,290 | |
| | | | | | | | |
| | | | REITs – Warehouse/Industrials — 0.1% | | | | |
| | 116,192 | | | ProLogis, Inc., Series Q, 8.540% | | | 6,570,658 | |
| | | | | | | | |
| | | | Total Non-Convertible Preferred Stocks
(Identified Cost $63,496,051) | | | 99,669,510 | |
| | | | | | | | |
| | | | Total Preferred Stocks
(Identified Cost $534,629,053) | | | 616,958,013 | |
| | | | | | | | |
| | | | | | | | |
| | Closed End Investment Companies — 0.0% | |
| | 681,131 | | | NexPoint Credit Strategies Fund
(Identified Cost $10,230,353) | | | 5,210,652 | |
| | | | | | | | |
| | | | | | | | |
Principal
Amount (‡) | | | | | | |
| | Short-Term Investments — 5.4% | |
| $ | 393,355,166 | | | Repurchase Agreement with State Street Bank and Trust Company, dated 9/30/2013 at 0.000% to be repurchased at $393,355,166 on 10/01/2013 collateralized by $51,105,000 Federal Home Loan Mortgage Corp., 2.500% due 4/01/2028 valued at $49,226,638; $300,000,000 Government National Mortgage Association, 2.500% due 3/20/2028 valued at $290,716,608; $62,655,000 Government National Mortgage Association, 2.500% due 2/20/2028 valued at $60,203,864; $1,195,000 Federal National Mortgage Association, 2.080% due 11/02/2022 valued at $1,110,365 including accrued interest (Note 2 of Notes to Financial Statements) | | | 393,355,166 | |
| | 417,982,882 | | | Tri-Party Repurchase Agreement with Fixed Income Clearing Corporation, dated 9/30/2013 at 0.000% to be repurchased at $417,982,882 on 10/01/2013 collateralized by $155,000 U.S. Treasury Note, 1.750% due 1/31/2014 valued at $156,356; $10,965,000 U.S. Treasury Note, 1.375% due 12/31/2018 valued at $10,951,294; $60,875,000 U.S. Treasury Note, 2.000% due 2/15/2022 valued at $59,353,125; $143,030,000 U.S. Treasury Note, 1.750% due 5/15/2022 valued at $136,571,337; $23,990,000 U.S. Treasury Note, 0.250% due 6/30/2014 valued at $24,019,988; $55,425,000 U.S. Treasury Note, 0.875% due 7/31/2019 valued at $53,011,241; $82,895,000 U.S. Treasury Note, 0.625% due 8/31/2017 valued at $81,651,575; $53,855,000 U.S. Treasury Note, 0.375% due 11/15/2015 valued at $53,930,720; $7,005,000 U.S. Treasury Note, 1.125% due 4/30/2020 valued at $6,698,531 including accrued interest (Note 2 of Notes to Financial Statements) | | | 417,982,882 | |
| | | | | | | | |
| | | | Total Short-Term Investments
(Identified Cost $811,338,048) | | | 811,338,048 | |
| | | | | | | | |
| | | | | | | | |
| | | | Total Investments — 98.4%
(Identified Cost $13,411,775,632)(a) | | | 14,851,656,466 | |
| | | | Other assets less liabilities — 1.6% | | | 241,140,767 | |
| | | | | | | | |
| | | | Net Assets — 100.0% | | $ | 15,092,797,233 | |
| | | | | | | | |
See accompanying notes to financial statements.
31 |
Portfolio of Investments – as of September 30, 2013
Loomis Sayles Strategic Income Fund – (continued)
| | | | | | | | |
| | | | | | | | |
| | (‡) | | | Principal Amount stated in U.S. dollars unless otherwise noted. | | | | |
| | (†) | | | See Note 2 of Notes to Financial Statements. | | | | |
| | (††) | | | Amount shown represents units. One unit represents a principal amount of 25. | |
| | (†††) | | | Amount shown represents units. One unit represents a principal amount of 100. | |
| | (a) | | | Federal Tax Information: | | | | |
| | | | At September 30, 2013, the net unrealized appreciation on investments based on a cost of $13,514,566,951 for federal income tax purposes was as follows: | |
| | | | Aggregate gross unrealized appreciation for all investments in which there is an excess of value over tax cost | | $ | 1,909,527,193 | |
| | | | Aggregate gross unrealized depreciation for all investments in which there is an excess of tax cost over value | | | (572,437,678 | ) |
| | | | | | | | |
| | | | Net unrealized appreciation | | $ | 1,337,089,515 | |
| | | | | | | | |
| | | | | | | | |
| | (b) | | | Variable rate security. Rate as of September 30, 2013 is disclosed. | |
| | (c) | | | Fair valued by the Fund’s investment adviser. At September 30, 2013, the value of these securities amounted to $45,615,465 or 0.3% of net assets. | |
| | (d) | | | Illiquid security. At September 30, 2013, the value of these securities amounted to $286,528,290 or 1.9% of net assets. | |
| | (e) | | | The issuer is in default with respect to interest and/or principal payments. Income is not being accrued. | |
| | (f) | | | Payment-in-kind security for which the issuer has the option at each interest payment date of making interest payments in cash or additional debt securities. For the period ended September 30, 2013, the issuer has paid out 100% of the interest payments in-kind. | |
| | (g) | | | Non-income producing security. | |
| | (h) | | | Maturity has been extended under the terms of a plan of reorganization. | |
| | (i) | | | Coupon rate is a fixed rate for an initial period then resets at a specified date and rate. | |
| | (j) | | | Convertible dollar-indexed note. Coupon rate is based on MXN denominated par value and is payable in USD. | |
| | (k) | | | Variable rate security. Rate shown represents the weighted average rate of underlying contracts at September 30, 2013. | |
| | (l) | | | Perpetual bond with no specified maturity date. | | | | |
| | | | | | | | |
| | 144A | | | All or a portion of these securities are exempt from registration under Rule 144A of the Securities Act of 1933. These securities may be resold in transactions exempt from registration, normally to qualified institutional buyers. At September 30, 2013, the value of Rule 144A holdings amounted to $2,239,444,894 or 14.8% of net assets. | |
| | ADR | | | An American Depositary Receipt is a certificate issued by a custodian bank representing the right to receive securities of the foreign issuer described. The values of ADRs may be significantly influenced by trading on exchanges not located in the United States. | |
| | ABS | | | Asset-Backed Securities | |
| | AGMC | | | Assured Guaranty Municipal Corp. | |
| | EMTN | | | Euro Medium Term Note | |
| | GMTN | | | Global Medium Term Note | |
| | MBIA | | | Municipal Bond Investors Assurance Corp. | | | | |
| | MTN | | | Medium Term Note | | | | |
| | PIK | | | Payment-in-Kind | | | | |
| | REITs | | | Real Estate Investment Trusts | | | | |
See accompanying notes to financial statements.
| 32
Portfolio of Investments – as of September 30, 2013
Loomis Sayles Strategic Income Fund – (continued)
| | | | | | |
| | | | | | |
| | AUD | | | Australian Dollar | | |
| | BRL | | | Brazilian Real | | |
| | CAD | | | Canadian Dollar | | |
| | CHF | | | Swiss Franc | | |
| | EUR | | | Euro | | |
| | GBP | | | British Pound | | |
| | IDR | | | Indonesian Rupiah | | |
| | ISK | | | Icelandic Krona | | |
| | KRW | | | South Korean Won | | |
| | MXN | | | Mexican Peso | | |
| | NOK | | | Norwegian Krone | | |
| | NZD | | | New Zealand Dollar | | |
| | SGD | | | Singapore Dollar | | |
| | USD | | | U.S. Dollar | | |
Industry Summary at September 30, 2013 (Unaudited)
| | | | |
Treasuries | | | 11.9 | % |
Banking | | | 7.9 | |
Wirelines | | | 4.8 | |
Technology | | | 4.6 | |
Non-Captive Diversified | | | 4.4 | |
Pharmaceuticals | | | 4.2 | |
Automotive | | | 3.9 | |
Chemicals | | | 3.2 | |
Non-Captive Consumer | | | 3.1 | |
Electronic Equipment, Instruments & Components | | | 3.1 | |
Healthcare | | | 2.7 | |
Airlines | | | 2.3 | |
Diversified Telecommunication Services | | | 2.2 | |
Semiconductors & Semiconductor Equipment | | | 2.2 | |
Electric | | | 2.1 | |
Oil, Gas & Consumable Fuels | | | 2.0 | |
Local Authorities | | | 2.0 | |
Other Investments, less than 2% each | | | 26.4 | |
Short-Term Investments | | | 5.4 | |
| | | | |
Total Investments | | | 98.4 | |
Other assets less liabilities | | | 1.6 | |
| | | | |
Net Assets | | | 100.0 | % |
| | | | |
See accompanying notes to financial statements.
33 |
Portfolio of Investments – as of September 30, 2013
Loomis Sayles Strategic Income Fund – (continued)
Currency Exposure Summary at September 30, 2013 (Unaudited)
| | | | |
United States Dollar | | | 73.9 | % |
Canadian Dollar | | | 5.9 | |
New Zealand Dollar | | | 4.2 | |
Euro | | | 3.4 | |
Australian Dollar | | | 3.0 | |
Norwegian Krone | | | 2.5 | |
Other, less than 2% each | | | 5.5 | |
| | | | |
Total Investments | | | 98.4 | |
Other assets less liabilities | | | 1.6 | |
| | | | |
Net Assets | | | 100.0 | % |
| | | | |
See accompanying notes to financial statements.
| 34
Statement of Assets and Liabilities
September 30, 2013
| | | | |
ASSETS | |
Investments at cost | | $ | 13,411,775,632 | |
Net unrealized appreciation | | | 1,439,880,834 | |
| | | | |
Investments at value | | | 14,851,656,466 | |
Cash | | | 57,463 | |
Foreign currency at value (identified cost $43,898,433) | | | 44,047,639 | |
Receivable for Fund shares sold | | | 44,019,660 | |
Receivable for securities sold | | | 17,655,162 | |
Dividends and interest receivable | | | 167,229,616 | |
Tax reclaims receivable | | | 569,154 | |
| | | | |
TOTAL ASSETS | | | 15,125,235,160 | |
| | | | |
LIABILITIES | | | | |
Payable for securities purchased | | | 2,385,072 | |
Payable for Fund shares redeemed | | | 20,852,453 | |
Foreign taxes payable (Note 2) | | | 80,099 | |
Management fees payable (Note 5) | | | 6,834,449 | |
Deferred Trustees’ fees (Note 5) | | | 947,921 | |
Administrative fees payable (Note 5) | | | 542,955 | |
Payable to distributor (Note 5d) | | | 141,503 | |
Other accounts payable and accrued expenses | | | 653,475 | |
| | | | |
TOTAL LIABILITIES | | | 32,437,927 | |
| | | | |
NET ASSETS | | $ | 15,092,797,233 | |
| | | | |
NET ASSETS CONSIST OF: | | | | |
Paid-in capital | | $ | 13,687,473,125 | |
Distributions in excess of net investment income | | | (30,654,351 | ) |
Accumulated net realized loss on investments and foreign currency transactions | | | (3,731,751 | ) |
Net unrealized appreciation on investments and foreign currency translations | | | 1,439,710,210 | |
| | | | |
NET ASSETS | | $ | 15,092,797,233 | |
| | | | |
See accompanying notes to financial statements.
35 |
Statement of Assets and Liabilities (continued)
September 30, 2013
| | | | |
COMPUTATION OF NET ASSET VALUE AND OFFERING PRICE: | |
Class A shares: | |
Net assets | | $ | 5,239,885,221 | |
| | | | |
Shares of beneficial interest | | | 328,902,989 | |
| | | | |
Net asset value and redemption price per share | | $ | 15.93 | |
| | | | |
Offering price per share (100/95.50 of net asset value) (Note 1) | | $ | 16.68 | |
| | | | |
Class B shares: (redemption price per share is equal to net asset value less any applicable contingent deferred sales charge) (Note 1) | | | | |
Net assets | | $ | 57,275,860 | |
| | | | |
Shares of beneficial interest | | | 3,568,486 | |
| | | | |
Net asset value and offering price per share | | $ | 16.05 | |
| | | | |
Class C shares: (redemption price per share is equal to net asset value less any applicable contingent deferred sales charge) (Note 1) | | | | |
Net assets | | $ | 4,912,727,307 | |
| | | | |
Shares of beneficial interest | | | 306,486,670 | |
| | | | |
Net asset value and offering price per share | | $ | 16.03 | |
| | | | |
Class N shares: | | | | |
Net assets | | $ | 12,921,017 | |
| | | | |
Shares of beneficial interest | | | 811,624 | |
| | | | |
Net asset value, offering and redemption price per share | | $ | 15.92 | |
| | | | |
Class Y shares: | | | | |
Net assets | | $ | 4,789,321,725 | |
| | | | |
Shares of beneficial interest | | | 300,857,969 | |
| | | | |
Net asset value, offering and redemption price per share | | $ | 15.92 | |
| | | | |
Admin Class shares: | | | | |
Net assets | | $ | 80,666,103 | |
| | | | |
Shares of beneficial interest | | | 5,076,823 | |
| | | | |
Net asset value, offering and redemption price per share | | $ | 15.89 | |
| | | | |
See accompanying notes to financial statements.
| 36
Statement of Operations
For the Year Ended September 30, 2013
| | | | |
INVESTMENT INCOME | |
Interest | | $ | 653,593,604 | |
Dividends | | | 108,188,288 | |
Less net foreign taxes withheld | | | (2,349,214 | ) |
| | | | |
| | | 759,432,678 | |
| | | | |
Expenses | | | | |
Management fees (Note 5) | | | 83,160,819 | |
Service and distribution fees (Note 5) | | | 64,330,676 | |
Administrative fees (Note 5) | | | 6,600,818 | |
Trustees’ fees and expenses (Note 5) | | | 367,149 | |
Transfer agent fees and expenses (Note 5) | | | 10,837,860 | |
Audit and tax services fees | | | 55,710 | |
Custodian fees and expenses | | | 1,139,578 | |
Legal fees | | | 200,256 | |
Registration fees | | | 427,128 | |
Shareholder reporting expenses | | | 1,158,344 | |
Miscellaneous expenses | | | 336,512 | |
| | | | |
Total expenses | | | 168,614,850 | |
| | | | |
Net investment income | | | 590,817,828 | |
| | | | |
NET REALIZED AND UNREALIZED GAIN (LOSS) ON INVESTMENTS AND FOREIGN CURRENCY TRANSACTIONS | | | | |
Net realized gain (loss) on: | | | | |
Investments | | | 340,991,782 | |
Foreign currency transactions | | | (3,780,062 | ) |
Net change in unrealized appreciation (depreciation) on: | | | | |
Investments | | | 376,449,673 | |
Foreign currency translations | | | (683,725 | ) |
| | | | |
Net realized and unrealized gain on investments and foreign currency transactions | | | 712,977,668 | |
| | | | |
NET INCREASE IN NET ASSETS RESULTING FROM OPERATIONS | | $ | 1,303,795,496 | |
| | | | |
See accompanying notes to financial statements.
37 |
Statement of Changes in Net Assets
| | | | | | | | |
| | | Year Ended
September 30,
2013 | | | Year Ended
September 30,
2012 | |
FROM OPERATIONS: | | | | | | | | |
Net investment income | | $ | 590,817,828 | | | $ | 642,076,865 | |
Net realized gain on investments and foreign currency transactions | | | 337,211,720 | | | | 288,184,441 | |
Net change in unrealized appreciation (depreciation) on investments and foreign currency translations | | | 375,765,948 | | | | 835,269,437 | |
| | | | | | | | |
Net increase in net assets resulting from operations | | | 1,303,795,496 | | | | 1,765,530,743 | |
| | | | | | | | |
FROM DISTRIBUTIONS TO SHAREHOLDERS: | | | | | | | | |
Net investment income | | | | | | | | |
Class A | | | (257,191,132 | ) | | | (300,094,602 | ) |
Class B | | | (3,107,922 | ) | | | (4,942,822 | ) |
Class C | | | (209,818,508 | ) | | | (241,863,153 | ) |
Class N | | | (310,035 | ) | | | — | |
Class Y | | | (237,288,037 | ) | | | (208,703,036 | ) |
Admin Class | | | (3,078,138 | ) | | | (1,997,277 | ) |
| | | | | | | | |
Total distributions | | | (710,793,772 | ) | | | (757,600,890 | ) |
| | | | | | | | |
NET INCREASE (DECREASE) IN NET ASSETS FROM CAPITAL SHARE TRANSACTIONS (NOTE 9) | | | (197,955,273 | ) | | | 820,378,728 | |
| | | | | | | | |
Net increase in net assets | | | 395,046,451 | | | | 1,828,308,581 | |
NET ASSETS | | | | | | | | |
Beginning of the year | | | 14,697,750,782 | | | | 12,869,442,201 | |
| | | | | | | | |
End of the year | | $ | 15,092,797,233 | | | $ | 14,697,750,782 | |
| | | | | | | | |
UNDISTRIBUTED (DISTRIBUTIONS IN EXCESS OF) NET INVESTMENT INCOME | | $ | (30,654,351 | ) | | $ | 38,251,969 | |
| | | | | | | | |
See accompanying notes to financial statements.
| 38
Financial Highlights
For a share outstanding throughout each period.
| | | | | | | | | | | | | | | | | | | | | | | | | | | | |
| | | | | | Income (Loss) from Investment
Operations: | | | Less Distributions: | |
| | | Net asset
value,
beginning
of the
period | | | Net
investment
income (a) | | | Net realized
and
unrealized
gain (loss) | | | Total from
investment
operations | | | Dividends
from net
investment
income | | | Distributions
from net
realized
capital
gains | | | Total
distributions | |
Class A | | | | | | | | | | | | | | | | | | | | | | | | | | | | |
9/30/2013 | | $ | 15.30 | | | $ | 0.65 | | | $ | 0.76 | | | $ | 1.41 | | | $ | (0.78 | ) | | $ | — | | | $ | (0.78 | ) |
9/30/2012 | | | 14.21 | | | | 0.72 | | | | 1.21 | | | | 1.93 | | | | (0.84 | ) | | | — | | | | (0.84 | ) |
9/30/2011 | | | 14.69 | | | | 0.77 | | | | (0.42 | ) | | | 0.35 | | | | (0.83 | ) | | | — | | | | (0.83 | ) |
9/30/2010 | | | 13.39 | | | | 0.80 | | | | 1.31 | | | | 2.11 | | | | (0.81 | ) | | | — | | | | (0.81 | ) |
9/30/2009 | | | 12.10 | | | | 0.87 | | | | 1.36 | | | | 2.23 | | | | (0.86 | ) | | | (0.08 | ) | | | (0.94 | ) |
Class B | | | | | | | | | | | | | | | | | | | | | | | | | | | | |
9/30/2013 | | | 15.41 | | | | 0.54 | | | | 0.76 | | | | 1.30 | | | | (0.66 | ) | | | — | | | | (0.66 | ) |
9/30/2012 | | | 14.30 | | | | 0.61 | | | | 1.23 | | | | 1.84 | | | | (0.73 | ) | | | — | | | | (0.73 | ) |
9/30/2011 | | | 14.78 | | | | 0.66 | | | | (0.43 | ) | | | 0.23 | | | | (0.71 | ) | | | — | | | | (0.71 | ) |
9/30/2010 | | | 13.46 | | | | 0.69 | | | | 1.33 | | | | 2.02 | | | | (0.70 | ) | | | — | | | | (0.70 | ) |
9/30/2009 | | | 12.16 | | | | 0.79 | | | | 1.36 | | | | 2.15 | | | | (0.77 | ) | | | (0.08 | ) | | | (0.85 | ) |
Class C | | | | | | | | | | | | | | | | | | | | | | | | | | | | |
9/30/2013 | | | 15.39 | | | | 0.54 | | | | 0.76 | | | | 1.30 | | | | (0.66 | ) | | | — | | | | (0.66 | ) |
9/30/2012 | | | 14.29 | | | | 0.61 | | | | 1.23 | | | | 1.84 | | | | (0.74 | ) | | | — | | | | (0.74 | ) |
9/30/2011 | | | 14.77 | | | | 0.66 | | | | (0.43 | ) | | | 0.23 | | | | (0.71 | ) | | | — | | | | (0.71 | ) |
9/30/2010 | | | 13.45 | | | | 0.69 | | | | 1.33 | | | | 2.02 | | | | (0.70 | ) | | | — | | | | (0.70 | ) |
9/30/2009 | | | 12.15 | | | | 0.79 | | | | 1.37 | | | | 2.16 | | | | (0.78 | ) | | | (0.08 | ) | | | (0.86 | ) |
Class N* | | | | | | | | | | | | | | | | | | | | | | | | | | | | |
9/30/2013 | | | 15.78 | | | | 0.46 | | | | 0.16 | | | | 0.62 | | | | (0.48 | ) | | | — | | | | (0.48 | ) |
Class Y | | | | | | | | | | | | | | | | | | | | | | | | | | | | |
9/30/2013 | | | 15.29 | | | | 0.69 | | | | 0.76 | | | | 1.45 | | | | (0.82 | ) | | | — | | | | (0.82 | ) |
9/30/2012 | | | 14.20 | | | | 0.75 | | | | 1.22 | | | | 1.97 | | | | (0.88 | ) | | | — | | | | (0.88 | ) |
9/30/2011 | | | 14.68 | | | | 0.81 | | | | (0.43 | ) | | | 0.38 | | | | (0.86 | ) | | | — | | | | (0.86 | ) |
9/30/2010 | | | 13.38 | | | | 0.83 | | | | 1.31 | | | | 2.14 | | | | (0.84 | ) | | | — | | | | (0.84 | ) |
9/30/2009 | | | 12.09 | | | | 0.90 | | | | 1.36 | | | | 2.26 | | | | (0.89 | ) | | | (0.08 | ) | | | (0.97 | ) |
Admin Class | | | | | | | | | | | | | | | | | | | | | | | | | | | | |
9/30/2013 | | | 15.27 | | | | 0.61 | | | | 0.75 | | | | 1.36 | | | | (0.74 | ) | | | — | | | | (0.74 | ) |
9/30/2012 | | | 14.18 | | | | 0.67 | | | | 1.23 | | | | 1.90 | | | | (0.81 | ) | | | — | | | | (0.81 | ) |
9/30/2011 | | | 14.66 | | | | 0.73 | | | | (0.42 | ) | | | 0.31 | | | | (0.79 | ) | | | — | | | | (0.79 | ) |
9/30/2010** | | | 13.87 | | | | 0.52 | | | | 0.79 | | | | 1.31 | | | | (0.52 | ) | | | — | | | | (0.52 | ) |
| * | From commencement of Class operations on February 1, 2013 through September 30, 2013. |
| ** | From commencement of Class operations on February 1, 2010 through September 30, 2010. |
| (a) | Per share net investment income has been calculated using the average shares outstanding during the period. |
| (b) | Had certain expenses not been waived/reimbursed during the period, if applicable, total returns would have been lower. |
| (c) | A sales charge for Class A shares and a contingent deferred sales charge for Class B and Class C shares are not reflected in total return calculations. Periods less than one year, if applicable, are not annualized. |
| (d) | Computed on an annualized basis for periods less than one year, if applicable. |
See accompanying notes to financial statements.
39 |
| | | | | | | | | | | | | | | | | | | | | | | | | | |
| | | | | | | | | | Ratios to Average Net Assets: | | | | |
Net asset
value,
end of
the period | | | Total
return
(%) (b)(c) | | | Net assets,
end of
the period
(000’s) | | | Net
expenses
(%) (d) | | | Gross
expenses
(%) (d) | | | Net investment
income
(%) (d) | | | Portfolio
turnover
rate (%) | |
| | | | | | | | | | | | | | | | | | | | | | | | | | |
| | $15.93 | | | | 9.43 | | | $ | 5,239,885 | | | | 0.95 | | | | 0.95 | | | | 4.14 | | | | 22 | |
| | 15.30 | | | | 14.02 | | | | 5,155,287 | | | | 0.96 | | | | 0.96 | | | | 4.84 | | | | 30 | |
| | 14.21 | | | | 2.20 | | | | 5,262,765 | | | | 0.95 | | | | 0.95 | | | | 5.10 | | | | 25 | |
| | 14.69 | | | | 16.20 | | | | 5,758,070 | | | | 0.96 | | | | 0.96 | | | | 5.67 | | | | 27 | |
| | 13.39 | | | | 20.56 | | | | 5,544,029 | | | | 0.99 | | | | 0.99 | | | | 7.74 | | | | 39 | |
| | | | | | | | | | | | | | | | | | | | | | | | | | |
| | 16.05 | | | | 8.58 | | | | 57,276 | | | | 1.70 | | | | 1.70 | | | | 3.39 | | | | 22 | |
| | 15.41 | | | | 13.15 | | | | 89,552 | | | | 1.70 | | | | 1.70 | | | | 4.11 | | | | 30 | |
| | 14.30 | | | | 1.48 | | | | 107,400 | | | | 1.70 | | | | 1.70 | | | | 4.35 | | | | 25 | |
| | 14.78 | | | | 15.39 | | | | 137,268 | | | | 1.71 | | | | 1.71 | | | | 4.92 | | | | 27 | |
| | 13.46 | | | | 19.62 | | | | 148,887 | | | | 1.74 | | | | 1.74 | | | | 7.02 | | | | 39 | |
| | | | | | | | | | | | | | | | | | | | | | | | | | |
| | 16.03 | | | | 8.61 | | | | 4,912,727 | | | | 1.70 | | | | 1.70 | | | | 3.39 | | | | 22 | |
| | 15.39 | | | | 13.18 | | | | 5,064,186 | | | | 1.71 | | | | 1.71 | | | | 4.08 | | | | 30 | |
| | 14.29 | | | | 1.42 | | | | 4,666,077 | | | | 1.70 | | | | 1.70 | | | | 4.35 | | | | 25 | |
| | 14.77 | | | | 15.40 | | | | 5,146,164 | | | | 1.71 | | | | 1.71 | | | | 4.92 | | | | 27 | |
| | 13.45 | | | | 19.66 | | | | 4,894,546 | | | | 1.74 | | | | 1.74 | | | | 6.95 | | | | 39 | |
| | | | | | | | | | | | | | | | | | | | | | | | | | |
| | 15.92 | | | | 4.01 | | | | 12,921 | | | | 0.63 | | | | 0.63 | | | | 4.38 | | | | 22 | |
| | | | | | | | | | | | | | | | | | | | | | | | | | |
| | 15.92 | | | | 9.72 | | | | 4,789,322 | | | | 0.70 | | | | 0.70 | | | | 4.39 | | | | 22 | |
| | 15.29 | | | | 14.31 | | | | 4,339,240 | | | | 0.71 | | | | 0.71 | | | | 5.05 | | | | 30 | |
| | 14.20 | | | | 2.46 | | | | 2,807,777 | | | | 0.70 | | | | 0.70 | | | | 5.35 | | | | 25 | |
| | 14.68 | | | | 16.50 | | | | 2,521,337 | | | | 0.71 | | | | 0.71 | | | | 5.92 | | | | 27 | |
| | 13.38 | | | | 20.91 | | | | 2,057,888 | | | | 0.72 | | | | 0.72 | | | | 7.76 | | | | 39 | |
| | | | | | | | | | | | | | | | | | | | | | | | | | |
| | 15.89 | | | | 9.12 | | | | 80,666 | | | | 1.20 | | | | 1.20 | | | | 3.89 | | | | 22 | |
| | 15.27 | | | | 13.79 | | | | 49,486 | | | | 1.21 | | | | 1.21 | | | | 4.52 | | | | 30 | |
| | 14.18 | | | | 1.98 | | | | 25,424 | | | | 1.21 | | | | 1.21 | | | | 4.87 | | | | 25 | |
| | 14.66 | | | | 9.61 | | | | 4,379 | | | | 1.24 | | | | 1.24 | | | | 5.52 | | | | 27 | |
See accompanying notes to financial statements.
| 40
Notes to Financial Statements
September 30, 2013
1. Organization. Loomis Sayles Funds II (the “Trust”) is organized as a Massachusetts business trust. The Trust is registered under the Investment Company Act of 1940, as amended (the “1940 Act”), as an open-end management investment company. The Declaration of Trust permits the Board of Trustees to authorize the issuance of an unlimited number of shares of the Trust in multiple series. The financial statements for certain funds of the Trust are presented in separate reports. Information presented in these financial statements pertains to Loomis Sayles Strategic Income Fund (the “Fund”).
The Fund is a diversified investment company.
The Fund offers Class A, Class C, Class Y and Admin Class shares. Effective February 1, 2013, the Fund began offering Class N shares. Effective October 12, 2007, Class B shares are no longer offered. Existing Class B shareholders may continue to reinvest dividends into Class B shares and exchange their Class B shares for Class B shares of other Natixis Funds subject to existing exchange privileges as described in the prospectus.
Class A shares are sold with a maximum front-end sales charge of 4.50%. Class B shares do not pay a front-end sales charge; however, they are charged higher Rule 12b-1 fees, and are subject to a contingent deferred sales charge (“CDSC”) if such shares are redeemed within six years of purchase. After eight years of ownership, Class B shares convert to Class A shares. Class C shares do not pay a front-end sales charge, do not convert to any other class of shares, pay higher Rule 12b-1 fees than Class A shares and may be subject to a CDSC of 1.00% if those shares are redeemed within one year of acquisition, except for reinvested distributions. Class N and Class Y shares do not pay a front-end sales charge, a CDSC or Rule 12b-1 fees. Class N shares are primarily intended for employer-sponsored retirement plans. Class Y shares are intended for institutional investors with a minimum initial investment of $100,000, though some categories of investors are exempted from the minimum investment amount as outlined in the Fund’s prospectus. Admin Class shares do not pay a front-end sales charge or a CDSC, but do pay a Rule 12b-1 fee. Class N and Admin Class shares are offered exclusively through intermediaries.
Most expenses of the Trust can be directly attributed to a fund. Expenses which cannot be directly attributed to a fund are generally apportioned based on the relative net assets of each of the funds in the Trust. Expenses of the Fund are borne pro rata by the holders of each class of shares, except that each class bears expenses unique to that class (including the Rule 12b-1 service and distribution fees and transfer agent fees for Class N). In addition, each class votes as a class only with respect to its own Rule 12b-1 Plan. Shares of each class would receive their pro rata share of the net assets of the Fund if the Fund were liquidated. The Trustees approve separate distributions from net investment income on each class of shares.
2. Significant Accounting Policies. The following is a summary of significant accounting policies consistently followed by the Fund in the preparation of its financial
41 |
Notes to Financial Statements (continued)
September 30, 2013
statements. The Fund’s financial statements are prepared in accordance with accounting principles generally accepted in the United States of America which require the use of management estimates that affect the reported amounts and disclosures in the financial statements. Actual results could differ from those estimates. Management has evaluated the events and transactions subsequent to year-end through the date the financial statements were issued and has determined that there were no material events that would require disclosure in the Fund’s financial statements.
a. Valuation. Debt securities (other than short-term obligations purchased with an original or remaining maturity of sixty days or less) and unlisted equity securities are generally valued on the basis of evaluated bids furnished to the Fund by an independent pricing service, recommended by the investment adviser and approved by the Board of Trustees, which determines valuations for normal, institutional-size trading units of such securities using market information, transactions for comparable securities and various relationships between securities which are generally recognized by institutional traders. Senior loans are priced at bid prices supplied by an independent pricing service, if available. Equity securities, including shares of closed-end investment companies and exchange-traded funds, for which market quotations are readily available are valued at market value, as reported by independent pricing services recommended by the investment adviser and approved by the Board of Trustees. Such independent pricing services generally use the security’s last sale price on the exchange or market where the security is primarily traded or, if there is no reported sale during the day, the closing bid price. Securities traded on the NASDAQ Global Select Market, NASDAQ Global Market and NASDAQ Capital Market is valued at the NASDAQ Official Closing Price (“NOCP”), or if lacking a NOCP, at the most recent bid quotation on the applicable NASDAQ Market. Broker-dealer bid prices may also be used to value debt and equity securities and senior loans where an independent pricing service is unable to price a security or where an independent pricing service does not provide a reliable price for the security. Investments in other open-end investment companies are valued at their net asset value each day. Short-term obligations purchased with an original or remaining maturity of sixty days or less are valued at amortized cost, which approximates market value. Securities for which market quotations are not readily available are valued at fair value as determined in good faith by the Fund’s investment adviser under the general supervision of the Board of Trustees.
The Fund may hold securities traded in foreign markets. Foreign securities are valued at the closing market price in the foreign market. However, if events occurring after the close of the foreign market (but before the close of regular trading on the New York Stock Exchange) are believed to materially affect the value of those securities; such securities are fair valued on a daily basis pursuant to procedures approved by the Board of Trustees. When fair valuing securities, the Fund may, among other things, use modeling tools or other processes that may take into account factors such as securities
| 42
Notes to Financial Statements (continued)
September 30, 2013
market activity and/or significant events that occur after the close of the foreign market and before the Fund calculates its net asset value.
b. Investment Transactions and Related Investment Income. Investment transactions are accounted for on a trade date plus one day basis for daily net asset value calculation. However, for financial reporting purposes, investment transactions are reported on trade date. Dividend income is recorded on ex-dividend date, or in the case of certain foreign securities, as soon as the Fund is notified, and interest income is recorded on an accrual basis. Interest income is increased by the accretion of discount and decreased by the amortization of premium. Distributions received from investments in securities that represent a return of capital or capital gain are recorded as a reduction of the cost of investments or as a realized gain, respectively. In determining net gain or loss on securities sold, the cost of securities has been determined on an identified cost basis. Investment income, non-class specific expenses and realized and unrealized gains and losses are allocated on a pro rata basis to each class based on the relative net assets of each class to the total net assets of the Fund.
c. Foreign Currency Translation. The books and records of the Fund are maintained in U.S. dollars. The values of securities, currencies and other assets and liabilities denominated in currencies other than U.S. dollars are translated into U.S. dollars based upon foreign exchange rates prevailing at the end of the period. Purchases and sales of investment securities, income and expenses are translated on the respective dates of such transactions.
Since the values of investment securities are presented at the foreign exchange rates prevailing at the end of the period, it is not practical to isolate that portion of the results of operations arising from changes in exchange rates from fluctuations which arise due to changes in market prices of investment securities. Such changes are included with the net realized and unrealized gain or loss on investments.
Net realized foreign exchange gains or losses arise from sales of foreign currency, currency gains or losses realized between the trade and settlement dates on securities transactions, and the difference between the amounts of dividends, interest and foreign withholding taxes recorded on the Fund’s books and the U.S. dollar equivalent of the amounts actually received or paid. Net unrealized foreign exchange gains and losses arise from changes in the value of assets and liabilities, other than investment securities, at the end of the fiscal period, resulting from changes in exchange rates.
The Fund may use foreign currency exchange contracts to facilitate transactions in foreign-denominated investments. Losses may arise from changes in the value of the foreign currency or if the counterparties do not perform under the contracts’ terms.
d. Federal and Foreign Income Taxes. The Trust treats each fund as a separate entity for federal income tax purposes. The Fund intends to meet the requirements of the Internal Revenue Code of 1986, as amended, applicable to regulated investment
43 |
Notes to Financial Statements (continued)
September 30, 2013
companies, and to distribute to its shareholders substantially all of its net investment income and any net realized capital gains at least annually. Management has performed an analysis of the Fund’s tax positions for the open tax years as of September 30, 2013 and has concluded that no provisions for income tax are required. The Fund’s federal tax returns for the prior three fiscal years remain subject to examination by the Internal Revenue Service. Management is not aware of any events that are reasonably possible to occur in the next twelve months that would result in the amounts of any unrecognized tax benefits significantly increasing or decreasing for the Fund. However, management’s conclusions regarding tax positions taken may be subject to review and adjustment at a later date based on factors including, but not limited to, new tax laws and accounting regulations and interpretations thereof.
The Fund may be subject to foreign withholding taxes on investment income and taxes on capital gains on investments that are accrued and paid based upon the Fund’s understanding of the tax rules and regulations that exist in the countries in which the Fund invests. Foreign withholding taxes on dividend and interest income are reflected on the Statement of Operations as a reduction of investment income, net of amounts eligible to be reclaimed. Dividends and interest receivable on the Statement of Assets and Liabilities are net of foreign withholding taxes. Foreign withholding taxes eligible to be reclaimed are reflected on the Statement of Assets and Liabilities as tax reclaims receivable. Capital gains taxes paid are included in net realized gain (loss) on investments in the Statement of Operations. Accrued but unpaid capital gains taxes are reflected as foreign taxes payable on the Statement of Assets and Liabilities, if applicable, and reduce unrealized gains on investments. In the event that realized gains on investments are subsequently offset by realized losses, taxes paid on realized gains may be returned to the Fund. Such amounts, if applicable, are reflected as foreign tax rebates receivable on the Statement of Assets and Liabilities and are recorded as a realized gain when received.
e. Dividends and Distributions to Shareholders. Dividends and distributions are recorded on ex-dividend date. The timing and characterization of certain income and capital gain distributions are determined annually in accordance with federal tax regulations, which may differ from accounting principles generally accepted in the United States of America. Permanent differences are primarily due to differing treatments for book and tax purposes of items such as foreign currency transactions, premium amortization, defaulted bond adjustments, paydown gains and losses, preferred securities adjustments, capital gains tax, contingent payment debt instruments and return of capital and capital gain distributions received. Permanent book and tax basis differences relating to shareholder distributions will result in reclassifications to capital accounts. Temporary differences between book and tax distributable earnings are primarily due to wash sales, deferred Trustees’ fees, premium amortization, return of capital distributions received, preferred securities adjustments, contingent payment debt instruments and defaulted bond interest.
| 44
Notes to Financial Statements (continued)
September 30, 2013
Distributions from net investment income and short-term capital gains are considered to be distributed from ordinary income for tax purposes.
The tax characterization of distributions is determined on an annual basis. The tax character of distributions paid to shareholders during the years ended September 30, 2013 and 2012 was as follows:
| | | | | | | | | | |
2013 Distributions Paid From: | | 2012 Distributions Paid From: |
Ordinary
Income | | Long-Term
Capital Gains | | Total | | Ordinary
Income | | Long-Term
Capital Gains | | Total |
$710,793,772 | | $ — | | $710,793,772 | | $757,600,890 | | $ — | | $757,600,890 |
As of September 30, 2013, the components of distributable earnings on a tax basis were as follows:
| | | | |
Undistributed ordinary income | | $ | 42,481,716 | |
Undistributed long-term capital gains | | | 32,224,505 | |
| | | | |
Total undistributed earnings | | | 74,706,221 | |
| | | | |
Unrealized appreciation | | | 1,336,918,891 | |
| | | | |
Total accumulated earnings | | $ | 1,411,625,112 | |
| | | | |
Capital loss carryforward utilized in the current year | | $ | 243,155,719 | |
| | | | |
f. Repurchase Agreements. It is the Fund’s policy that the market value of the collateral for repurchase agreements be at least equal to 102% of the repurchase price, including interest. Certain repurchase agreements are tri-party arrangements whereby the collateral is held in a segregated account for the benefit of the Fund and on behalf of the counterparty. Repurchase agreements could involve certain risks in the event of default or insolvency of the counterparty including possible delays or restrictions upon the Fund’s ability to dispose of the underlying securities.
g. Securities Lending. The Fund has entered into an agreement with State Street Bank and Trust Company (“State Street Bank”), as agent of the Fund, to lend securities to certain designated borrowers. The loans are collateralized with cash or securities in an amount equal to at least 105% or 102% of the market value (including accrued interest) of the loaned international or domestic securities, respectively, when the loan is initiated. Thereafter, the value of the collateral must remain at least 102% of the market value (including accrued interest) of loaned securities for U.S. equities and U.S. corporate debt; at least 105% of the market value (including accrued interest) of loaned securities for non-U.S. equities; and at least 100% of the market value (including accrued interest) of loaned securities for U.S. Government securities, sovereign debt issued by non-U.S. Governments and non-U.S. corporate debt. In the event that the market value of the collateral falls below the required percentages described above, the borrower will deliver additional collateral on the next business day. As with other
45 |
Notes to Financial Statements (continued)
September 30, 2013
extensions of credit, the Fund may bear the risk of loss with respect to the investment of the collateral. The Fund invests cash collateral in short-term investments, a portion of the income from which is remitted to the borrowers and the remainder allocated between the Fund and State Street Bank as lending agent. Excess collateral in the amount of $2,997,679 related to terminated loans with a bankrupt borrower is held by State Street Bank on behalf of the Fund.
For the year ended September 30, 2013, the Fund did not loan securities under this agreement.
h. Indemnifications. Under the Trust’s organizational documents, its officers and Trustees are indemnified against certain liabilities arising out of the performance of their duties to the Fund. Additionally, in the normal course of business, the Fund enters into contracts with service providers that contain general indemnification clauses. The Fund’s maximum exposure under these arrangements is unknown as this would involve future claims that may be made against the Fund that have not yet occurred. However, based on experience, the Fund expects the risk of loss to be remote.
i. New Accounting Pronouncement. In December 2011, Accounting Standards Update (“ASU”) No. 2011-11, “Disclosures about Offsetting Assets and Liabilities” was issued and is effective for interim and annual periods beginning after January 1, 2013. The ASU creates new disclosure requirements with respect to an entity’s rights of setoff and related arrangements associated with its financial instruments. Management has evaluated the impact of the adoption of ASU 2011-11 and will incorporate the new disclosures required in the March 31, 2014 report.
3. Fair Value Measurements. In accordance with accounting standards related to fair value measurements and disclosures, the Fund has categorized the inputs utilized in determining the value of the Fund’s assets or liabilities. These inputs are summarized in the three broad levels listed below:
| | • | | Level 1 – quoted prices in active markets for identical assets or liabilities; |
| | • | | Level 2 – prices determined using other significant inputs that are observable either directly, or indirectly through corroboration with observable market data (which could include quoted prices for similar assets or liabilities, interest rates, credit risk, etc.); and |
| | • | | Level 3 – prices determined using significant unobservable inputs when quoted prices or observable inputs are unavailable such as when there is little or no market activity for an asset or liability (unobservable inputs reflect the Fund’s own assumptions in determining the fair value of assets or liabilities and would be based on the best information available). |
The inputs or methodology used for valuing securities are not necessarily an indication of the risk associated with investing in those securities.
| 46
Notes to Financial Statements (continued)
September 30, 2013
The following is a summary of the inputs used to value the Fund’s investments as of September 30, 2013, at value:
Asset Valuation Inputs
| | | | | | | | | | | | | | | | |
Description | | Level 1 | | | Level 2 | | | Level 3 | | | Total | |
Bonds and Notes | | | | | | | | | | | | | | | | |
Non-Convertible Bonds | | | | | | | | | | | | | | | | |
Airlines | | $ | — | | | $ | 20,657,366 | | | $ | 324,635,747 | (b) | | $ | 345,293,113 | |
Non-Captive Consumer | | | 2,263,504 | | | | 467,654,997 | | | | — | | | | 469,918,501 | |
Retailers | | | — | | | | 87,056,601 | | | | 11,276,382 | (c) | | | 98,332,983 | |
Transportation Services | | | — | | | | 18,929,418 | | | | 33,966,589 | (c) | | | 52,896,007 | |
All Other Non-
Convertible Bonds(a) | | | — | | | | 7,906,500,327 | | | | — | | | | 7,906,500,327 | |
| | | | | | | | | | | | | | | | |
Total Non-Convertible Bonds | | | 2,263,504 | | | | 8,500,798,709 | | | | 369,878,718 | | | | 8,872,940,931 | |
| | | | | | | | | | | | | | | | |
Convertible Bonds | | | | | | | | | | | | | | | | |
Wirelines | | | — | | | | 115,848,166 | | | | 368,219 | (c) | | | 116,216,385 | |
All Other Convertible Bonds(a) | | | — | | | | 1,137,320,526 | | | | — | | | | 1,137,320,526 | |
| | | | | | | | | | | | | | | | |
Total Convertible Bonds | | | — | | | | 1,253,168,692 | | | | 368,219 | | | | 1,253,536,911 | |
| | | | | | | | | | | | | | | | |
Municipals(a) | | | — | | | | 144,418,597 | | | | — | | | | 144,418,597 | |
| | | | | | | | | | | | | | | | |
Total Bonds and Notes | | | 2,263,504 | | | | 9,898,385,998 | | | | 370,246,937 | | | | 10,270,896,439 | |
| | | | | | | | | | | | | | | | |
Senior Loans(a) | | | — | | | | 306,222,152 | | | | — | | | | 306,222,152 | |
Common Stocks(a) | �� | | 2,841,031,162 | | | | — | | | | — | | | | 2,841,031,162 | |
Preferred Stocks | | | | | | | | | | | | | | | | |
Convertible Preferred Stocks | | | | | | | | | | | | | | | | |
Independent Energy | | | 44,086,504 | | | | 9,999,960 | | | | — | | | | 54,086,464 | |
All Other Convertible Preferred Stocks(a) | | | 463,202,039 | | | | — | | | | — | | | | 463,202,039 | |
| | | | | | | | | | | | | | | | |
Total Convertible Preferred Stocks | | | 507,288,543 | | | | 9,999,960 | | | | — | | | | 517,288,503 | |
| | | | | | | | | | | | | | | | |
47 |
Notes to Financial Statements (continued)
September 30, 2013
Asset Valuation Inputs (continued)
| | | | | | | | | | | | | | | | |
Description | | Level 1 | | | Level 2 | | | Level 3 | | | Total | |
Non-Convertible Preferred Stocks | | | | | | | | | | | | | | | | |
Electric | | $ | — | | | $ | 37,937 | | | $ | — | | | $ | 37,937 | |
Government Sponsored | | | — | | | | 27,007,500 | | | | — | | | | 27,007,500 | |
REITs – Office Property | | | — | | | | 1,879,290 | | | | — | | | | 1,879,290 | |
All Other Non-Convertible Preferred Stocks(a) | | | 70,744,783 | | | | — | | | | — | | | | 70,744,783 | |
| | | | | | | | | | | | | | | | |
Total Non-Convertible Preferred Stocks | | | 70,744,783 | | | | 28,924,727 | | | | — | | | | 99,669,510 | |
| | | | | | | | | | | | | | | | |
Total Preferred Stocks | | | 578,033,326 | | | | 38,924,687 | | | | — | | | | 616,958,013 | |
| | | | | | | | | | | | | | | | |
Closed End Investment Companies | | | 5,210,652 | | | | — | | | | — | | | | 5,210,652 | |
Short-Term Investments | | | — | | | | 811,338,048 | | | | — | | | | 811,338,048 | |
| | | | | | | | | | | | | | | | |
Total | | $ | 3,426,538,644 | | | $ | 11,054,870,885 | | | $ | 370,246,937 | | | $ | 14,851,656,466 | |
| | | | | | | | | | | | | | | | |
| (a) | Details of the major categories of the Fund’s investments are reflected within the Portfolio of Investments. |
| (b) | Valued using broker-dealer bid prices ($324,631,472) or fair valued by the Fund’s investment adviser ($4,275). |
| (c) | Fair valued by the Fund’s investment adviser. |
A preferred stock valued at $42,901,535 was transferred from Level 2 to Level 1 during the period ended September 30, 2013. At September 30, 2013, this security was valued at the last sale price in accordance with the Fund’s valuation policies.
All transfers are recognized as of the beginning of the reporting period.
The Fund’s pricing policies and procedures are recommended by the investment adviser and approved by the Board of Trustees. Debt securities are generally valued on the basis of evaluated bids furnished to the Fund by an independent pricing service. Broker-dealer bid prices may be used if an independent pricing service either is unable to price a security or does not provide a reliable price for a security. Broker-dealer bid prices for which the Fund does not have knowledge of the inputs used by the broker-dealer are categorized in Level 3. All security prices, including those obtained from an independent pricing service and broker-dealer bid prices are reviewed on a daily basis
| 48
Notes to Financial Statements (continued)
September 30, 2013
by the investment adviser, subject to oversight by Fund management and the Board of Trustees. If the investment adviser, in good faith, believes that the price provided by an independent pricing service is unreliable, broker-dealer bid prices may be used until the price provided by the independent pricing service is considered to be reliable. Reliability of all security prices, including those obtained from an independent pricing service and broker-dealer bid prices is tested in a variety of ways, including comparison to recent transaction prices and daily fluctuations, amongst other validation procedures in place. Securities for which market quotations are not readily available are valued at fair value as determined in good faith by the Funds’ investment adviser under the general supervision of the Board of Trustees. Fair valued securities may be categorized in Level 3.
The following is a reconciliation of Level 3 investments for which significant unobservable inputs were used to determine fair value as of September 30, 2012 and/or September 30, 2013:
Asset Valuation Inputs
| | | | | | | | | | | | | | | | | | | | |
Investments in
Securities | | Balance as of
September 30,
2012 | | | Accrued
Discounts
(Premiums) | | | Realized
Gain
(Loss) | | | Change in
Unrealized
Appreciation
(Depreciation) | | | Purchases | |
Bonds and Notes | | | | | | | | | | | | | | | | | | | | |
Non-Convertible Bonds | | | | | | | | | | | | | | | | | | | | |
Airlines | | $ | — | | | $ | 222,134 | | | $ | 1,639,432 | | | $ | (1,015,750 | ) | | $ | 53,430,000 | |
Banking | | | 18,800,082 | | | | — | | | | — | | | | — | | | | — | |
Electric | | | 12,874,750 | | | | — | | | | — | | | | 5,360,250 | | | | — | |
Retailers | | | — | | | | 31,176 | | | | — | | | | (103,144 | ) | | | — | |
Sovereigns | | | 21,173,458 | | | | 6,238,806 | | | | (5,733,038 | ) | | | 28,113,763 | | | | 4,435 | |
Transportation Services | | | 8,953,808 | | | | — | | | | 717,131 | | | | 6,372,092 | | | | — | |
Convertible Bonds | | | | | | | | | | | | | | | | | | | | |
Wirelines | | | — | | | | — | | | | (12 | ) | | | (132,809 | ) | | | 1,002,079 | |
| | | | | | | | | | | | | | | | | | | | |
Total | | $ | 61,802,098 | | | $ | 6,492,116 | | | $ | (3,376,487 | ) | | $ | 38,594,402 | | | $ | 54,436,514 | |
| | | | | | | | | | | | | | | | | | | | |
49 |
Notes to Financial Statements (continued)
September 30, 2013
Asset Valuation Inputs (continued)
| | | | | | | | | | | | | | | | | | | | |
Investments in
Securities | | Sales | | | Transfers
into
Level 3 | | | Transfers
out of
Level 3 | | | Balance as of
September 30,
2013 | | | Change in
Unrealized
Appreciation
(Depreciation)
from
Investments
Still Held at
September 30,
2013 | |
Bonds and Notes | | | | | | | | | | | | | | | | | | | | |
Non-Convertible Bonds | | | | | | | | | | | | | | | | | | | | |
Airlines | | $ | (39,805,433 | ) | | $ | 310,165,364 | | | $ | — | | | $ | 324,635,747 | | | $ | (1,015,750 | ) |
Banking | | | — | | | | — | | | | (18,800,082 | ) | | | — | | | | — | |
Electric | | | (18,235,000 | ) | | | — | | | | — | | | | — | | | | — | |
Retailers | | | — | | | | 11,348,350 | | | | — | | | | 11,276,382 | | | | (103,144 | ) |
Sovereigns | | | (49,797,424 | ) | | | — | | | | — | | | | — | | | | — | |
Transportation Services | | | (4,458,111 | ) | | | 31,335,477 | | | | (8,953,808 | ) | | | 33,966,589 | | | | 6,372,092 | |
Convertible Bonds | | | | | | | | | | | | | | | | | | | | |
Wirelines | | | (501,039 | ) | | | — | | | | — | | | | 368,219 | | | | (132,809 | ) |
| | | | | | | | | | | | | | | | | | | | |
Total | | $ | (112,797,007 | ) | | $ | 352,849,191 | | | $ | (27,753,890 | ) | | $ | 370,246,937 | | | $ | 5,120,389 | |
| | | | | | | | | | | | | | | | | | | | |
Debt securities valued at $352,849,191 were transferred from Level 2 to Level 3 during the period ended September 30, 2013. At September 30, 2013, these securities were valued using broker-dealer bid prices based on inputs unobservable to the Fund as an independent pricing service was unable to price the securities.
Debt securities valued at $27,753,890 were transferred from Level 3 to Level 2 during the period ended September 30, 2013. At September 30, 2013, these securities were valued on the basis of evaluated bids furnished to the Fund by an independent pricing service in accordance with the Fund’s valuation policies.
All transfers are recognized as of the beginning of the reporting period.
4. Purchases and Sales of Securities. For the year ended September 30, 2013, purchases and sales of securities (excluding short-term investments and U.S. Government/Agency securities and including paydowns) were $2,985,491,541 and $3,230,328,525, respectively. Purchases and sales of U.S. Government/Agency securities (excluding short-term investments and including paydowns) were $140,371,862 and $250,239,816, respectively.
| 50
Notes to Financial Statements (continued)
September 30, 2013
5. Management Fees and Other Transactions with Affiliates.
a. Management Fees. Loomis, Sayles & Company, L.P. (“Loomis Sayles”) serves as investment adviser to the Fund. Under the terms of the management agreement, the Fund pays a management fee at the following annual rates, calculated daily and payable monthly, based on the Fund’s average daily net assets:
| | | | | | | | | | | | |
| Percentage of Average Daily Net Assets | |
First $200 million | | Next $1.8 billion | | | Next
$13 billion | | | Over
$15 billion | |
| 0.65% | | | 0.60 | % | | | 0.55 | % | | | 0.54 | % |
Loomis Sayles has given a binding undertaking to the Fund to waive management fees and/or reimburse certain expenses to limit the Fund’s operating expenses, exclusive of acquired fund fees and expenses, brokerage expenses, interest expense, taxes and extraordinary expenses. This undertaking is in effect until January 31, 2014 and is reevaluated on an annual basis. Management fees payable, as reflected on the Statement of Assets and Liabilities, is net of waivers and/or expense reimbursements, if any, pursuant to this undertaking.
For the year ended September 30, 2013, the expense limits as a percentage of average daily net assets under the expense limitation agreement were as follows:
| | | | | | | | | | | | | | | | | | | | |
| Expense Limit as a Percentage of Average Daily Net Assets | |
Class A | | Class B | | | Class C | | | Class N | | | Class Y | | | Admin Class | |
| 1.25% | | | 2.00 | % | | | 2.00 | % | | | 0.95 | % | | | 1.00 | % | | | 1.50 | % |
Loomis Sayles shall be permitted to recover expenses it has borne under the expense limitation agreement (whether through waiver of its management fees or otherwise) on a class by class basis in later periods to the extent the annual operating expenses of a class fall below a class’ expense limits, provided, however, that a class is not obligated to pay such waived/reimbursed fees or expenses more than one year after the end of the fiscal year in which the fees or expenses were waived/reimbursed.
For the year ended September 30, 2013, the management fees for the Fund were $83,160,819 (effective rate of 0.56% of average daily net assets).
No expenses were recovered during the year ended September 30, 2013 under the terms of the expense limitation agreement.
Certain officers and employees of Loomis Sayles are also officers or Trustees of the Trust. Loomis Sayles’ general partner is indirectly owned by Natixis Global Asset Management, L.P. (“Natixis US”), which is part of Natixis Global Asset Management, an international asset management group based in Paris, France.
51 |
Notes to Financial Statements (continued)
September 30, 2013
b. Service and Distribution Fees. NGAM Distribution, L.P. (“NGAM Distribution”), which is a wholly-owned subsidiary of Natixis US, has entered into a distribution agreement with the Trust. Pursuant to this agreement, NGAM Distribution serves as principal underwriter of the Funds of the Trust.
Pursuant to Rule 12b-1 under the 1940 Act, the Trust has adopted a Service Plan relating to the Fund’s Class A shares (the “Class A Plan”), a Distribution and Service Plan relating to the Fund’s Class B and Class C shares (the “Class B and Class C Plans”), and a Distribution Plan relating to its Admin Class shares (the “Admin Class Plan”).
Under the Class A Plan, the Fund pays NGAM Distribution a monthly service fee at an annual rate not to exceed 0.25% of the average daily net assets attributable to the Fund’s Class A shares, as reimbursement for expenses incurred by NGAM Distribution in providing personal services to investors in Class A shares and/or the maintenance of shareholder accounts.
Under the Class B and Class C Plans, the Fund pays NGAM Distribution a monthly service fee at an annual rate not to exceed 0.25% of the average daily net assets attributable to the Fund’s Class B and Class C shares, as compensation for services provided by NGAM Distribution in providing personal services to investors in Class B and Class C shares and/or the maintenance of shareholder accounts.
Also under the Class B and Class C Plans, the Fund pays NGAM Distribution a monthly distribution fee at an annual rate of 0.75% of the average daily net assets attributable to the Fund’s Class B and Class C shares, as compensation for services provided by NGAM Distribution in connection with the marketing or sale of Class B and Class C shares.
Under the Admin Class Plan, the Fund pays NGAM Distribution a monthly distribution fee at an annual rate not to exceed 0.25% of the average daily net assets attributable to the Fund’s Admin Class shares, as compensation for services provided by NGAM Distribution in connection with the marketing or sale of Admin Class shares or for payments made by NGAM Distribution to securities dealers or other financial intermediaries as commissions, asset-based sales charges or other compensation with respect to the sale of Admin Class shares, or for providing personal services to investors and/or the maintenance of shareholder accounts.
In addition, the Admin Class shares of the Fund may pay NGAM Distribution an administrative service fee, at an annual rate not to exceed 0.25% of the average daily net assets attributable to Admin Class shares. These fees are subsequently paid to securities dealers or financial intermediaries for providing personal services and/or account maintenance for their customers who hold such shares.
| 52
Notes to Financial Statements (continued)
September 30, 2013
For the year ended September 30, 2013, the service and distribution fees for the Fund were as follows:
| | | | | | | | | | | | | | | | | | | | | | | | | | |
| Service Fees | | | Distribution Fees | |
Class A | | | Class B | | | Class C | | | Admin Class | | | Class B | | | Class C | | | Admin Class | |
| | $12,990,119 | | | $ | 185,878 | | | $ | 12,567,128 | | | $ | 164,266 | | | $ | 557,636 | | | $ | 37,701,383 | | | $ | 164,266 | |
c. Administrative Fees. NGAM Advisors, L.P. (“NGAM Advisors”) provides certain administrative services for the Fund and contracts with State Street Bank to serve as sub-administrator. NGAM Advisors is a wholly-owned subsidiary of Natixis US. Pursuant to an agreement among Natixis Funds Trust I, Natixis Funds Trust II, Natixis Funds Trust IV, Gateway Trust (“Natixis Funds Trusts”), Loomis Sayles Funds I, Loomis Sayles Funds II (“Loomis Sayles Funds Trusts”), Hansberger International Series and NGAM Advisors, the Fund pays NGAM Advisors monthly its pro rata portion of fees equal to an annual rate of 0.0575% of the first $15 billion of the average daily net assets of the Natixis Funds Trusts, Loomis Sayles Funds Trusts and Hansberger International Series, 0.0500% of the next $15 billion, 0.0400% of the next $30 billion and 0.0350% of such assets in excess of $60 billion, subject to an annual aggregate minimum fee for the Natixis Funds Trusts, Loomis Sayles Funds Trusts and Hansberger International Series of $10 million, which is reevaluated on an annual basis.
For the year ended September 30, 2013, the administrative fees for the Fund were $6,600,818.
d. Sub-Transfer Agent Fees. NGAM Distribution has entered into agreements, which include servicing agreements, with financial intermediaries that provide recordkeeping, processing, shareholder communications and other services to customers of the intermediaries that hold positions in the Fund and has agreed to compensate the intermediaries for providing those services. Intermediaries transact with the Fund primarily through the use of omnibus accounts on behalf of their customers who hold positions in the Fund. These services would have been provided by the Fund’s transfer agent and other service providers if the shareholders’ accounts were maintained directly at the Fund’s transfer agent. Accordingly, the Fund has agreed to reimburse NGAM Distribution for all or a portion of the servicing fees paid to these intermediaries. The reimbursement amounts (sub-transfer agent fees) paid to NGAM Distribution are subject to a current per-account equivalent fee limit approved by the Fund’s Board, which is based on fees for similar services paid to the Fund’s transfer agent and other service providers. Class N shares do not bear such expenses.
For the year ended September 30, 2013, the sub-transfer agent fees (which are reflected in transfer agent fees and expenses in the Statement of Operations) for the Fund were $10,129,455.
As of September 30, 2013, the Fund owes NGAM Distribution $141,503 in reimbursements for sub-transfer agent fees.
53 |
Notes to Financial Statements (continued)
September 30, 2013
Sub-transfer agent fees attributable to Class A, Class B, Class C, Class Y and Admin Class are allocated on a pro rata basis to each class based on the relative net assets of each class to the total net assets of those classes.
e. Commissions. Commissions (including CDSCs) on Fund shares retained by NGAM Distribution during the year ended September 30, 2013 amounted to $3,680,110.
f. Trustees Fees and Expenses. The Trust does not pay any compensation directly to its officers or Trustees who are directors, officers or employees of NGAM Advisors, NGAM Distribution, Natixis US or their affiliates. Effective January 1, 2013, the Chairperson of the Board receives a retainer fee at the annual rate of $285,000. The Chairperson does not receive any meeting attendance fees for Board of Trustees meetings or committee meetings that she attends. Each Independent Trustee (other than the Chairperson) receives, in the aggregate, a retainer fee at the annual rate of $115,000. Each Independent Trustee also receives a meeting attendance fee of $10,000 for each meeting of the Board of Trustees that he or she attends in person and $5,000 for each meeting of the Board of Trustees that he or she attends telephonically. In addition, each committee chairman receives an additional retainer fee at an annual rate of $17,500. Each Contract Review and Governance Committee member is compensated $6,000 for each Committee meeting that he or she attends in person and $3,000 for each meeting that he or she attends telephonically. Each Audit Committee member is compensated $6,000 for each Committee meeting that he or she attends in person and $3,000 for each meeting that he or she attends telephonically. These fees are allocated among the funds in the Natixis Funds Trusts, Loomis Sayles Funds Trusts and Hansberger International Series based on a formula that takes into account, among other factors, the relative net assets of each fund. Trustees are reimbursed for travel expenses in connection with attendance at meetings.
Prior to January 1, 2013, the Chairperson of the Board received a retainer fee at the annual rate of $265,000 and each Independent Trustee (other than the Chairperson) received, in aggregate, a retainer fee at the annual rate of $95,000. In addition, each committee chairman received an additional retainer fee at an annual rate of $15,000, and each Audit Committee member was compensated $7,500 for each Committee meeting that he or she attended in person and $3,750 for each meeting that he or she attended telephonically.
A deferred compensation plan (the “Plan”) is available to the Trustees on a voluntary basis. Deferred amounts remain in the Fund until distributed in accordance with the provisions of the Plan. The value of a participating Trustee’s deferral account is based on theoretical investments of deferred amounts, on the normal payment dates, in certain funds of the Natixis Funds Trusts, Loomis Sayles Funds Trusts and Hansberger International Series as designated by the participating Trustees. Changes in the value of participants’ deferral accounts are allocated pro rata among the funds in the Natixis Funds Trusts, Loomis Sayles Funds Trusts, and Hansberger International Series, and are
| 54
Notes to Financial Statements (continued)
September 30, 2013
normally reflected as Trustees’ fees and expenses in the Statement of Operations. The portions of the accrued obligations allocated to the Fund under the Plan are reflected as Deferred Trustees’ fees in the Statement of Assets and Liabilities.
6. Class-Specific Transfer Agent Fees and Expenses. For the period from February 1, 2013 through September 30, 2013, the Fund incurred the following class-specific transfer agent fees and expenses:
| | | | |
| | | Class N | |
Transfer Agent Fees and Expenses | | $ | 60 | |
Transfer agent fees and expenses attributable to Class A, Class B, Class C, Class Y and Admin Class are allocated on a pro rata basis to each class based on the relative net assets of each class to the total net assets of those classes.
7. Line of Credit. The Fund, together with certain other funds of Natixis Funds Trusts, Loomis Sayles Funds Trusts and Hansberger International Series, participates in a $200,000,000 committed unsecured line of credit provided by State Street Bank, with an individual limit of $125,000,000 for each fund that participates in the line of credit. Interest is charged to each participating fund based on its borrowings at a rate per annum equal to the greater of the Federal Funds rate or overnight LIBOR, plus 1.25%. In addition, a commitment fee of 0.10% per annum, payable at the end of each calendar quarter, is accrued and apportioned among the participating funds based on their average daily unused portion of the line of credit.
For the year ended September 30, 2013, the Fund had no borrowings under these agreements.
8. Concentration of Risk. The Fund’s investments in foreign securities are subject to foreign currency fluctuations, higher volatility than U.S. securities, varying degrees of regulation and limited liquidity. Greater political, economic, credit and information risks are also associated with foreign securities.
55 |
Notes to Financial Statements (continued)
September 30, 2013
9. Capital Shares. The Fund may issue an unlimited number of shares of beneficial interest, without par value. Transactions in capital shares were as follows:
| | | | | | | | | | | | | | | | |
| |
| Year Ended
September 30, 2013 |
| |
| Year Ended
September 30, 2012 |
|
| | | | Shares | | | | Amount | | | | Shares | | | | Amount | |
| Class A | | | | | | | | | | | | | | | | |
Issued from the sale of shares | | | 85,161,020 | | | $ | 1,344,652,662 | | | | 89,649,016 | | | $ | 1,329,714,799 | |
Issued in connection with the reinvestment of distributions | | | 13,495,375 | | | | 211,445,205 | | | | 17,112,282 | | | | 251,237,402 | |
Redeemed | | | (106,628,096 | ) | | | (1,673,657,377 | ) | | | (140,160,164 | ) | | | (2,089,858,590 | ) |
| | | | | | | | | | | | | | | | |
Net change | | | (7,971,701 | ) | | $ | (117,559,510 | ) | | | (33,398,866 | ) | | $ | (508,906,389 | ) |
| | | | | | | | | | | | | | | | |
| Class B | | | | | | | | | | | | | | | | |
Issued from the sale of shares | | | 84,938 | | | $ | 1,342,254 | | | | 142,281 | | | $ | 2,116,364 | |
Issued in connection with the reinvestment of distributions | | | 116,207 | | | | 1,831,113 | | | | 185,322 | | | | 2,735,333 | |
Redeemed | | | (2,445,061 | ) | | | (38,778,882 | ) | | | (2,023,077 | ) | | | (30,224,174 | ) |
| | | | | | | | | | | | | | | | |
Net change | | | (2,243,916 | ) | | $ | (35,605,515 | ) | | | (1,695,474 | ) | | $ | (25,372,477 | ) |
| | | | | | | | | | | | | | | | |
| Class C | | | | | | | | | | | | | | | | |
Issued from the sale of shares | | | 36,207,754 | | | $ | 574,188,840 | | | | 46,818,995 | | | $ | 698,131,858 | |
Issued in connection with the reinvestment of distributions | | | 7,359,016 | | | | 115,930,122 | | | | 8,706,591 | | | | 128,555,991 | |
Redeemed | | | (66,124,686 | ) | | | (1,046,914,424 | ) | | | (52,957,737 | ) | | | (789,494,609 | ) |
| | | | | | | | | | | | | | | | |
Net change | | | (22,557,916 | ) | | $ | (356,795,462 | ) | | | 2,567,849 | | | $ | 37,193,240 | |
| | | | | | | | | | | | | | | | |
| Class N* | | | | | | | | | | | | | | | | |
Issued from the sale of shares | | | 795,587 | | | $ | 12,674,081 | | | | — | | | $ | — | |
Issued in connection with the reinvestment of distributions | | | 19,538 | | | | 310,035 | | | | — | | | | — | |
Redeemed | | | (3,501 | ) | | | (57,560 | ) | | | — | | | | — | |
| | | | | | | | | | | | | | | | |
Net change | | | 811,624 | | | $ | 12,926,556 | | | | — | | | $ | — | |
| | | | | | | | | | | | | | | | |
| Class Y | | | | | | | | | | | | | | | | |
Issued from the sale of shares | | | 114,234,013 | | | $ | 1,799,718,390 | | | | 152,377,472 | | | $ | 2,276,301,803 | |
Issued in connection with the reinvestment of distributions | | | 8,900,319 | | | | 139,377,642 | | | | 7,426,725 | | | | 109,413,688 | |
Redeemed | | | (106,030,487 | ) | | | (1,668,831,214 | ) | | | (73,738,087 | ) | | | (1,089,758,132 | ) |
| | | | | | | | | | | | | | | | |
Net change | | | 17,103,845 | | | $ | 270,264,818 | | | | 86,066,110 | | | $ | 1,295,957,359 | |
| | | | | | | | | | | | | | | | |
| Admin Class | | | | | | | | | | | | | | | | |
Issued from the sale of shares | | | 2,237,182 | | | $ | 35,129,300 | | | | 1,594,030 | | | $ | 23,654,032 | |
Issued in connection with the reinvestment of distributions | | | 163,798 | | | | 2,563,820 | | | | 108,806 | | | | 1,599,070 | |
Redeemed | | | (565,879 | ) | | | (8,879,280 | ) | | | (253,748 | ) | | | (3,746,107 | ) |
| | | | | | | | | | | | | | | | |
Net change | | | 1,835,101 | | | $ | 28,813,840 | | | | 1,449,088 | | | $ | 21,506,995 | |
| | | | | | | | | | | | | | | | |
Increase (decrease) from capital share transactions | | | (13,022,963 | ) | | $ | (197,955,273 | ) | | | 54,988,707 | | | $ | 820,378,728 | |
| | | | | | | | | | | | | | | | |
| * | From commencement of Class operations on February 1, 2013 through September 30, 2013. |
| 56
Report of Independent Registered Public
Accounting Firm
To the Trustees of Loomis Sayles Funds II and Shareholders of Loomis Sayles Strategic Income Fund:
In our opinion, the accompanying statement of assets and liabilities, including the portfolio of investments, and the related statements of operations and of changes in net assets and the financial highlights present fairly, in all material respects, the financial position of the Loomis Sayles Strategic Income Fund, a series of Loomis Sayles Funds II (the “Fund”), at September 30, 2013, and the results of its operations, the changes in its net assets and the financial highlights for each of the periods indicated, in conformity with accounting principles generally accepted in the United States of America. These financial statements and financial highlights (hereafter referred to as “financial statements”) are the responsibility of the Fund’s management; our responsibility is to express an opinion on these financial statements based on our audits. We conducted our audits of these financial statements in accordance with the standards of the Public Company Accounting Oversight Board (United States). Those standards require that we plan and perform the audits to obtain reasonable assurance about whether the financial statements are free of material misstatement. An audit includes examining, on a test basis, evidence supporting the amounts and disclosures in the financial statements, assessing the accounting principles used and significant estimates made by management, and evaluating the overall financial statement presentation. We believe that our audits, which included confirmation of securities at September 30, 2013 by correspondence with the custodian and brokers, provide a reasonable basis for our opinion.
PricewaterhouseCoopers LLP
Boston, Massachusetts
November 21, 2013
57 |
2013 U.S. Tax Distribution Information to Shareholders (Unaudited)
Corporate Dividends Received Deduction. For the fiscal year ended September 30, 2013, 11.18% of dividends distributed by Strategic Income Fund qualify for the dividends received deduction for corporate shareholders.
Qualified Dividend Income. For the fiscal year ended September 30, 2013, the Strategic Income Fund will designate up to the maximum amount allowable pursuant to the Internal Revenue Code as qualified dividend income eligible for reduced tax rates. These lower rates range from 0% to 20% depending on an individual’s tax bracket. If the Fund pays a distribution during calendar year 2013, complete information will be reported in conjunction with Form 1099-DIV.
| 58
Trustee and Officer Information
The tables below provide certain information regarding the trustees and officers of Loomis Sayles Funds II (the “Trust”). Unless otherwise indicated, the address of all persons below is 399 Boylston Street, Boston, MA 02116. The Fund’s Statement of Additional Information includes additional information about the trustees of the Trust and is available by calling Natixis Funds at 800-225-5478.
| | | | | | | | |
Name and Year of
Birth | | Position(s) Held
with the Trust,
Length of Time
Served and Term
of Office1 | | Principal
Occupation(s)
During Past
5 Years | | Number of
Portfolios in
Fund Complex
Overseen2 and Other
Directorships Held
During Past
5 Years | | Experience,
Qualifications,
Attributes, Skills
for Board
Membership |
| | | |
| INDEPENDENT TRUSTEES | | | | | | |
| | | | |
| Charles D. Baker (1956) | | Trustee From 2005 to 2009 and since 2011 Contract Review and Governance Committee Member | | Executive in Residence at General Catalyst Partners (venture capital and growth equity firm); formerly, President and Chief Executive Officer, Harvard Pilgrim Health Care (health care organization) | | 42 Director, Athenahealth, Inc. (software company) | | Significant experience on the Board; executive experience (including president and chief executive officer of a health care organization and executive officer of a venture capital and growth equity firm) |
| | | | |
Daniel M. Cain (1945) | | Trustee Since 2003 Chairman of the Contract Review and Governance Committee | | Chairman (formerly, President and Chief Executive Officer) of Cain Brothers & Company, Incorporated (investment banking) | | 42 Director, Sheridan Healthcare Inc. (physician practice management) | | Significant experience on the Board and on the board of other business organizations (including at a health care organization); experience in the financial industry (including roles as chairman and former chief executive officer of an investment banking firm) |
59 |
Trustee and Officer Information
| | | | | | | | |
Name and Year of
Birth | | Position(s) Held
with the Trust,
Length of Time
Served and Term
of Office1 | | Principal
Occupation(s)
During Past
5 Years | | Number of
Portfolios in
Fund Complex
Overseen2 and Other
Directorships Held
During Past
5 Years | | Experience,
Qualifications,
Attributes, Skills
for Board
Membership |
| | | |
INDEPENDENT TRUSTEES
continued | | | | | | |
| | | | |
Kenneth A. Drucker (1945) | | Trustee Since 2008 Chairman of the Audit Committee | | Retired | | 42 Formerly, Director, M Fund, Inc. (investment company); Director, Gateway Trust (investment company) | | Significant experience on the Board and on the board of other business organizations (including at investment companies); executive experience (including as treasurer of an aerospace, automotive, and metal manufacturing corporation) |
| | | | |
| Edmond J. English (1953) | | Trustee Since 2013 Contract Review and Governance Committee Member | | Chief Executive Officer of Bob’s Discount Furniture (retail) | | 42 Formerly, Director, BJ’s Wholesale Club (retail); formerly, Director, Citizens Financial Group (bank) | | Significant experience on the board of other business organizations (including at a retail company and a bank); executive experience (including at a retail company) |
| 60
Trustee and Officer Information
| | | | | | | | |
Name and Year of
Birth | | Position(s) Held
with the Trust,
Length of Time
Served and Term
of Office1 | | Principal
Occupation(s)
During Past
5 Years | | Number of
Portfolios in
Fund Complex
Overseen2 and Other
Directorships Held
During Past
5 Years | | Experience,
Qualifications,
Attributes, Skills
for Board
Membership |
| | | |
INDEPENDENT TRUSTEES
continued | | | | | | |
| | | | |
Wendell J. Knox (1948) | | Trustee Since 2009 Audit Committee Member | | Director (formerly, President and Chief Executive Officer) of Abt Associates Inc. (research and consulting) | | 42 Director, Eastern Bank (bank); Director, The Hanover Insurance Group (property and casualty insurance) | | Significant experience on the Board and on the board of other business organizations (including at a bank and at a property and casualty insurance firm); executive experience (including roles as president and chief executive officer of a research and consulting company) |
| | | | |
| Martin T. Meehan (1956) | | Trustee Since 2012 Contract Review and Governance Committee Member | | Chancellor and faculty member, University of Massachusetts Lowell | | 42 None | | Experience on the Board and on the board of other business organizations; experience as Chancellor of the University of Massachusetts Lowell; government experience (including as a member of the U.S. House of Representatives); academic experience |
61 |
Trustee and Officer Information
| | | | | | | | |
Name and Year of
Birth | | Position(s) Held
with the Trust,
Length of Time
Served and Term
of Office1 | | Principal
Occupation(s)
During Past
5 Years | | Number of
Portfolios in
Fund Complex
Overseen2 and Other
Directorships Held
During Past
5 Years | | Experience,
Qualifications,
Attributes, Skills
for Board
Membership |
| | | |
INDEPENDENT TRUSTEES
continued | | | | | | |
| | | | |
Sandra O. Moose (1942) | | Chairperson of the Board of Trustees since November 2005 Trustee Since 2003 Ex officio member of the Audit Committee and Contract Review and Governance Committee | | President, Strategic Advisory Services (management consulting) | | 42 Director, Verizon Communications (telecommunications company); Director, AES Corporation (international power company); formerly, Director, Rohm and Haas Company (specialty chemicals) | | Significant experience on the Board and on the board of other business organizations (including at a telecommunications company, an international power company and a specialty chemicals corporation); executive experience (including at a management consulting company) |
| | | | |
Erik R. Sirri (1958) | | Trustee Since 2009 Audit Committee Member | | Professor of Finance at Babson College; formerly, Director of the Division of Trading and Markets at the Securities and Exchange Commission | | 42 None | | Significant experience on the Board; experience as Director of the Division of Trading and Markets at the Securities and Exchange Commission; academic experience; training as an economist |
| 62
Trustee and Officer Information
| | | | | | | | |
Name and Year of
Birth | | Position(s) Held
with the Trust,
Length of Time
Served and Term
of Office1 | | Principal
Occupation(s)
During Past
5 Years | | Number of
Portfolios in
Fund Complex
Overseen2 and Other
Directorships Held
During Past
5 Years | | Experience,
Qualifications,
Attributes, Skills
for Board
Membership |
| | | |
INDEPENDENT TRUSTEES
continued | | | | | | |
| | | | |
Peter J. Smail (1952) | | Trustee Since 2009 Contract Review and Governance Committee Member | | Retired; formerly, President and Chief Executive Officer of Pyramis Global Advisors (investment management) | | 42 None | | Significant experience on the Board; mutual fund industry and executive experience (including roles as president and chief executive officer for an investment adviser) |
| | | | |
Cynthia L. Walker (1956) | | Trustee Since 2005 Audit Committee Member | | Deputy Dean for Finance and Administration, Yale University School of Medicine; formerly, Executive Dean for Administration, Harvard Medical School | | 42 None | | Significant experience on the Board; executive experience in a variety of academic organizations (including roles as dean for finance and administration) |
| | |
| INTERESTED TRUSTEES | | | | |
| | | | |
Robert J. Blanding3 (1947) 555 California Street San Francisco, CA 94104 | | Trustee Since 2002 Chief Executive Officer since 2002 | | President, Chairman, Director and Chief Executive Officer, Loomis, Sayles & Company, L.P. | | 42 None | | Significant experience on the Board; continuing service as President, Chairman, and Chief Executive Officer of Loomis, Sayles & Company, L.P. |
63 |
Trustee and Officer Information
| | | | | | | | |
Name and Year of
Birth | | Position(s) Held
with the Trust,
Length of Time
Served and Term
of Office1 | | Principal
Occupation(s)
During Past
5 Years | | Number of
Portfolios in
Fund Complex
Overseen2 and Other
Directorships Held
During Past
5 Years | | Experience,
Qualifications,
Attributes, Skills
for Board
Membership |
| | | |
INTERESTED TRUSTEES
continued | | | | | | |
| | | | |
| David L. Giunta4 (1965) | | Trustee Since 2011 President since 2008 | | President and Chief Executive Officer, NGAM Distribution Corporation, NGAM Advisors, L.P. and NGAM Distribution, L.P. | | 42 None | | Experience on the Board; continuing experience as President and Chief Executive Officer of NGAM Advisors, L.P. |
| | | | |
John T. Hailer5 (1960) | | Trustee Since 2003 | | President and Chief Executive Officer – U.S. and Asia, Natixis Global Asset Management, L.P. | | 42 None | | Significant experience on the Board; continuing experience as President and Chief Executive Officer – U.S. and Asia, Natixis Global Asset Management, L.P. |
| 1 | Each trustee serves until retirement, resignation or removal from the Board. The current retirement age is 72. The position of Chairperson of the Board is appointed for a two-year term. Ms. Moose was appointed to serve an additional two-year term as the Chairperson of the Board on November 18, 2011. |
| 2 | The trustees of the Trust serve as trustees of a fund complex that includes all series of the Natixis Funds Trust I, Natixis Funds Trust II, Natixis Funds Trust IV and Gateway Trust (collectively, the “Natixis Funds Trusts”), Loomis Sayles Funds I and Loomis Sayles Funds II (collectively, the “Loomis Sayles Funds Trusts”), and Hansberger International Series (collectively, the “Fund Complex”). |
| 3 | Mr. Blanding is deemed an “interested person” of the Trust because he holds the following positions with an affiliated person of the Trust: President, Chairman, Director and Chief Executive Officer of Loomis, Sayles & Company, L.P. and Director of Loomis Sayles Investment Asia Pte., Ltd. |
| 4 | Mr. Giunta is deemed an “interested person” of the Trust because he holds the following positions with an affiliated person of the Trust: President and Chief Executive Officer of NGAM Distribution Corporation, NGAM Advisors, L.P. and NGAM Distribution, L.P. |
| 5 | Mr. Hailer is deemed an “interested person” of the Trust because he holds the following positions with an affiliated person of the Trust: President and Chief Executive Officer – U.S. and Asia, Natixis Global Asset Management, L.P. |
| 64
Trustee and Officer Information
| | | | | | |
Name and Year of Birth | | Position(s) Held
with the Trust | | Term of Office1 and
Length of Time Served | | Principal Occupation(s)
During Past 5 Years2 |
| | |
| OFFICERS OF THE TRUST | | | | |
| | | |
Coleen Downs Dinneen (1960) | | Secretary, Clerk and Chief Legal Officer | | Since September 2004 | | Executive Vice President, General Counsel, Secretary and Clerk, NGAM Distribution Corporation, NGAM Advisors, L.P. and NGAM Distribution, L.P. |
| | | |
Daniel J. Fuss (1933) One Financial Center Boston, MA 02111 | | Executive Vice President | | Since June 2003 | | Vice Chairman and Director, Loomis, Sayles & Company, L.P. |
| | | |
Russell L. Kane (1969) | | Chief Compliance Officer, Assistant Secretary and Anti-Money Laundering Officer | | Chief Compliance Officer since May 2006; Assistant Secretary since June 2004; and Anti-Money Laundering Officer since April 2007 | | Chief Compliance Officer for Mutual Funds, Senior Vice President, Deputy General Counsel, Assistant Secretary and Assistant Clerk, NGAM Distribution Corporation, NGAM Advisors, L.P. and NGAM Distribution, L.P. |
| | | |
Michael C. Kardok (1959) | | Treasurer, Principal Financial and Accounting Officer | | Since October 2004 | | Senior Vice President, NGAM Advisors, L.P. and NGAM Distribution, L.P. |
| 1 | Each officer of the Trust serves for an indefinite term in accordance with the Trust’s current by-laws until the date his or her successor is elected and qualified, or until he or she sooner dies, retires, is removed or becomes disqualified. |
| 2 | Each person listed above, except as noted, holds the same position(s) with the Fund Complex. Mr. Fuss is not an officer of the Natixis Funds Trusts or the Hansberger International Series. Previous positions during the past five years with NGAM Distribution, L.P., NGAM Advisors, L.P. or Loomis, Sayles & Company, L.P. are omitted, if not materially different from a trustee’s or officer’s current position with such entity. |
65 |
The Registrant has adopted a code of ethics that applies to the Registrant’s principal executive officer, principal financial officer and persons performing similar functions. There have been no amendments or waivers of the Registrant’s code of ethics during the period.
| Item 3. | Audit Committee Financial Expert. |
The Board of Trustees of the Registrant has established an audit committee. Mr. Kenneth A. Drucker, Mr. Wendell J. Knox, Mr. Erik R. Sirri and Ms. Cynthia L. Walker are members of the audit committee and have been designated as “audit committee financial experts” by the Board of Trustees. Each of these individuals is also an Independent Trustee of the Registrant.
| Item 4. | Principal Accountant Fees and Services. |
Fees billed by the Principal Accountant for services rendered to the Registrant.
The table below sets forth fees billed by the principal accountant, PricewaterhouseCoopers LLP, for the past two fiscal years for professional services rendered in connection with a) the audit of the Registrant’s annual financial statements and services provided in connection with regulatory filings; b) audit-related services (including services that are reasonably related to the performance of the audit of the Registrant’s financial statements and but not reported under “Audit Fees”); c) tax compliance, tax advice and tax planning and d) all other fees billed for professional services rendered by the principal accountant to the Registrant, other than the services reported as a part of (a) through (c) of this Item.
| | | | | | | | | | | | | | | | | | | | | | | | | | | | | | | | |
| | | Audit fees | | | Audit-related fees1 | | | Tax fees2 | | | All other fees3 | |
| | | 10/1/11-
9/30/12 | | | 10/1/12-
9/30/13 | | | 10/1/11-
9/30/12 | | | 10/1/12-
9/30/13 | | | 10/1/11-
9/30/12 | | | 10/1/12-
9/30/13 | | | 10/1/11-
9/30/12 | | | 10/1/12-
9/30/13 | |
Loomis Sayles Funds II | | $ | 384,464 | | | $ | 390,231 | | | $ | 4,846 | | | $ | 4,977 | | | $ | 83,360 | | | $ | 99,229 | | | $ | 18,578 | | | $ | — | |
| | 1. | Audit-related fees consist of: |
2012 & 2013 – performance of agreed-upon procedures related to the Registrant’s deferred compensation plan.
2012 & 2013 – review of Registrant’s tax returns, tax consulting services and review of liquidating fund distributions.
| | 3. | All other fees consist of: |
2012 – filing and translation services with respect to Japanese shareholders in Loomis Sayles Investment Grade Bond Fund.
Aggregate fees billed to the Registrant for non-audit services during 2012 and 2013 were $106,784 and $104,206, respectively.
Fees billed by the Principal Accountant for services rendered to the Adviser and Control Affiliates.
The following table sets forth the fees billed by the Registrant’s principal accountant for non-audit services rendered to Loomis, Sayles & Company, L.P. and entities controlling, controlled by or under common control with Loomis, Sayles & Company, L.P. Registrant (“Control Affiliates”) that provide ongoing services to the Registrant, for engagements that related directly to the operations and financial reporting of the Registrant for the last two fiscal years.
| | | | | | | | | | | | | | | | | | | | | | | | |
| | | Audit-related fees | | | Tax fees | | | All other fees | |
| | | 10/1/11-
9/30/12 | | | 10/1/12-
9/30/13 | | | 10/1/11-
9/30/12 | | | 10/1/12-
9/30/13 | | | 10/1/11-
9/30/12 | | | 10/1/12-
9/30/13 | |
Control Affiliates | | $ | — | | | $ | — | | | $ | 6,838 | | | $ | — | | | $ | — | | | $ | — | |
The following table sets forth the aggregate fees billed by the Registrant’s principal accountant for non-audit services rendered to Loomis, Sayles & Company, L.P. and Control Affiliates that provide ongoing services to the Registrant, for the last two fiscal years, including the fees disclosed in the table above.
| | | | | | | | |
| | | Aggregate Non-Audit Fees | |
| | | 10/1/11-
9/30/12 | | | 10/1/12-
9/30/13 | |
Control Affiliates | | $ | 87,658 | | | $ | 73,039 | |
None of the services described above were approved pursuant to (c)(7)(i)(C) of Regulation S-X.
Audit Committee Pre Approval Policies.
Annually, the Registrant’s Audit Committee reviews the audit, audit-related, tax and other non-audit services together with the projected fees, for services proposed to be rendered to the Trust and/or other entities for which pre-approval is required during the upcoming year. Any subsequent revisions to already pre-approved services or fees (including fee increases) and requests for pre-approval of new services would be presented for consideration quarterly as needed.
If, in the opinion of management, a proposed engagement by the Registrant’s independent accountants needs to commence before the next regularly scheduled Audit Committee meeting, any member of the Audit Committee who is an independent Board member is authorized to pre-approve the engagement, but only for engagements to provide audit, audit related and tax services. This approval is subject to review of the full Audit Committee at its next quarterly meeting. All other engagements require the approval of all the members of the Audit Committee.
| Item 5. | Audit Committee of Listed Registrants. |
Not applicable.
| Item 6. | Schedule of Investments. |
Included as part of the Report to Shareholders filed as Item 1 herewith.
| Item 7. | Disclosure of Proxy Voting Policies and Procedures for Closed-End Management Investment Companies. |
Not applicable.
| Item 8. | Portfolio Managers of Closed-End Management Investment Companies |
Not applicable.
| Item 9. | Purchases of Equity Securities by Closed-End Management Investment Companies and Affiliated Purchasers. |
Not applicable.
| Item 10. | Submission of Matters to a Vote of Securities Holders. |
There were no material changes to the procedures by which shareholders may recommend nominees to the Registrant’s Board of Trustees.
| Item 11. | Controls and Procedures. |
The Registrant’s principal executive officer and principal financial officer have concluded that the Registrant’s disclosure controls and procedures are sufficient to ensure that information required to be disclosed by the Registrant in this Form N-CSR was recorded, processed, summarized and reported within the time periods specified in the Securities and Exchange Commission’s rules and forms, based upon such officers’ evaluation of these controls and procedures as of a date within 90 days of the filing date of the report.
There were no changes in the Registrant’s internal control over financial reporting that occurred during the Registrant’s last fiscal quarter of the period covered by the report that has materially affected, or is reasonably likely to materially affect, the Registrant’s internal control over financial reporting.
| | |
| (a)(1) | | Code of Ethics required by Item 2 hereof, filed herewith as Exhibit (a)(1). |
| |
| (a)(2) | | Certifications of Principal Executive Officer and Principal Financial Officer pursuant to Rule 30a-2(a) under the Investment Company Act of 1940 (17 CFR 270.30a-2(a)), filed herewith as Exhibits (a)(2)(1) and (a)(2)(2), respectively. |
| |
| (a)(3) | | Not applicable. |
| |
| (b) | | Certification of Principal Executive Officer and Principal Financial Officer pursuant to Section 906 of Sarbanes-Oxley Act of 2002 are filed herewith as Exhibit (b). |
SIGNATURES
Pursuant to the requirements of the Securities Exchange Act of 1934 and the Investment Company Act of 1940, the Registrant has duly caused this report to be signed on its behalf by the undersigned, thereunto duly authorized.
| | |
| Loomis Sayles Funds II |
| |
| By: | | /s/ Robert J. Blanding |
| | Name: Robert J. Blanding |
| | Title: Chief Executive Officer |
| | Date: November 21, 2013 |
Pursuant to the requirements of the Securities Exchange Act of 1934 and the Investment Company Act of 1940, this report has been signed by the following persons on behalf of the Registrant and in the capacities and on the dates indicated.
| | |
| By: | | /s/ Robert J. Blanding |
| | Name: Robert J. Blanding |
| | Title: Chief Executive Officer |
| | Date: November 21, 2013 |
| | |
| By: | | /s/ Michael C. Kardok |
| | Name: Michael C. Kardok |
| | Title: Treasurer |
| | Date: November 21, 2013 |