UNITED STATES
SECURITIES AND EXCHANGE COMMISSION
Washington, D.C. 20549
FORM N-CSR
CERTIFIED SHAREHOLDER REPORT OF REGISTERED
MANAGEMENT INVESTMENT COMPANIES
Investment Company Act file number: 811-06241
Loomis Sayles Funds II
(Exact name of Registrant as specified in charter)
399 Boylston Street, Boston, Massachusetts 02116
(Address of principal executive offices) (Zip code)
Coleen Downs Dinneen, Esq.
NGAM Distribution, L.P.
399 Boylston Street
Boston, Massachusetts 02116
(Name and address of agent for service)
Registrant’s telephone number, including area code: (617) 449-2810
Date of fiscal year end: September 30
Date of reporting period: September 30, 2012
| Item 1. | Reports to Stockholders. |
The Registrant’s annual report transmitted to shareholders pursuant to Rule 30e-1 under the Investment Company Act of 1940 is as follows:
ANNUAL REPORT
September 30, 2012

Loomis Sayles Core Plus Bond Fund
Loomis Sayles High Income Fund
Loomis Sayles International Bond Fund
Loomis Sayles Limited Term Government
and Agency Fund
TABLE OF CONTENTS
Portfolio Review page 1
Portfolio of Investments page 26
Financial Statements page 63
Notes to Financial Statements page 77
LOOMIS SAYLES CORE PLUS BOND FUND
Management Discussion
Managers:
Peter W. Palfrey, CFA
Richard G. Raczkowski
Loomis, Sayles & Company, L.P.
Objective:
Seeks high total investment return through a combination of current income and capital appreciation
Strategy:
Invests at least 80% of its net assets in bonds
Symbols:
| | |
| Class A | | NEFRX |
| Class B | | NERBX |
| Class C | | NECRX |
| Class Y | | NERYX |
Market Conditions
U.S. economic data showed signs of improvement during the first half of the 12-month period ended September 30, 2012, but it began to deteriorate in the second half. The U.S. Commerce Department revised the second quarter 2012 economic growth rate lower, and employment numbers remained weak. U.S. Treasury yields fell to record lows, as volatility persisted during the period, reflecting concerns about the ongoing sovereign debt crisis in Europe and the global economic slowdown.
Quantitative easing, a central bank tool for buying long-term debt in an effort to keep borrowing rates low and a major theme during the period, helped buoy the financial markets intermittently. In December 2011, the European Central Bank (ECB) implemented its long term refinancing operation, a program to provide additional liquidity to the euro zone. Midway through 2012, the Federal Reserve (the Fed) extended Operation Twist, another buying program aimed at lowering rates to stimulate the economy, through the remainder of the year. Late in the period, the ECB launched an additional sovereign debt-buying program, and the Fed announced its third round of quantitative easing.
Performance Results
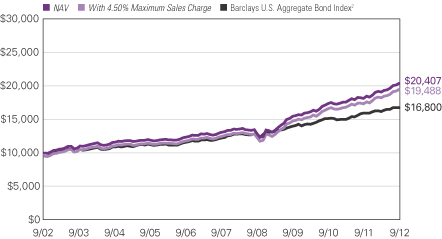
For the 12-months ended September 30, 2012, Class A shares of Loomis Sayles Core Plus Bond Fund returned 12.18% at net asset value. The fund outperformed its benchmark, the Barclays U.S. Aggregate Bond Index, which returned 5.16% for the period. The fund outperformed the 7.70% average return of funds in its peer group, the Morningstar Intermediate-Term Bond category.
Explanation of Fund Performance
An overweight in investment-grade credit, with a bias toward lower-quality securities, was the largest contributor to relative performance for the year. Certain out-of-benchmark allocations also benefited results. Specifically, positions in high-yield securities, with a
1 |
focus on higher-quality securities within the universe and short- and intermediate-maturity cyclical issues, performed well. Additionally, securities denominated in the Mexican peso and the euro contributed positively. We maintained an overweight position in commercial mortgage-backed securities (CMBS), with a focus on older, higher-quality super-senior securities, which proved additive to relative returns. We maintained an underweight position in mortgage-backed securities, focusing on higher-coupon issues to capture incremental yield. Strong security selection within this sector also contributed favorably to performance.
Despite an overall underweight position in Treasuries, the fund was overweight in 10- and 30-year Treasury bonds. This yield curve positioning (a curve that shows the relationship among bond yields across the maturity spectrum) and the fund’s longer duration (price sensitivity to interest rate changes) aided results relative to the benchmark, as rates generally fell and the yield curve flattened during the period.
A small allocation to emerging market Yankee corporate bonds (foreign bonds issued in U.S. dollars) modestly detracted from performance relative to the benchmark.
Outlook
Looking ahead, we expect slow growth and contained inflation in the U.S. and significant volatility, weak growth and a modest recession in Europe. Higher-growth economies in Asia and the Middle East should continue to expand but at a slower pace.
In this environment, we believe U.S. interest rates should remain at or near historical lows. As such, we expect to maintain a duration near or longer than that of the benchmark. We will seek to maintain our yield advantage through investments in credit and CMBS. Exposure to long-term U.S. Treasury securities should help offset volatility from riskier sectors.
| 2
LOOMIS SAYLES CORE PLUS BOND FUND
Investment Results through September 30, 2012
Growth of $10,000 Investment in Class A Shares4
September 30, 2002 through September 30, 2012
3 |
Average Annual Total Returns — September 30, 20124
| | | | | | | | | | | | |
| | | | |
| | | 1 Year | | | 5 Years | | | 10 Years | |
| | | | |
| Class A (Inception 11/7/73) | | | | | | | | | | | | |
| NAV | | | 12.18 | % | | | 9.27 | % | | | 7.39 | % |
| With 4.50% Maximum Sales Charge | | | 7.12 | | | | 8.27 | | | | 6.90 | |
| | | | |
| Class B (Inception 9/13/93) | | | | | | | | | | | | |
| NAV | | | 11.38 | | | | 8.47 | | | | 6.59 | |
| With CDSC1 | | | 6.38 | | | | 8.18 | | | | 6.59 | |
| | | | |
| Class C (Inception 12/30/94) | | | | | | | | | | | | |
| NAV | | | 11.46 | | | | 8.47 | | | | 6.60 | |
| With CDSC1 | | | 10.46 | | | | 8.47 | | | | 6.60 | |
| | | | |
| Class Y (Inception 12/30/94) | | | | | | | | | | | | |
| NAV | | | 12.54 | | | | 9.55 | | | | 7.70 | |
| | | | |
| Comparative Performance | | | | | | | | | | | | |
| Barclays U.S. Aggregate Bond Index2 | | | 5.16 | | | | 6.53 | | | | 5.32 | |
| Morningstar Intermediate-Term Bond Fund Average3 | | | 7.70 | | | | 6.30 | | | | 5.22 | |
Past performance does not guarantee future results. The chart and table do not reflect taxes shareholders might owe on any fund distributions or when they redeem their shares. Returns reflect changes in share price and reinvestment of dividends and capital gains, if any. Unlike a fund, an index is not managed and does not reflect fees and expenses.
NOTES TO CHARTS
| 1 | Performance for Class B shares assumes a maximum 5% contingent deferred sales charge (“CDSC”) applied when you sell shares, which declines annually between years 1-6 according to the following schedule: 5, 4, 3, 3, 2, 1, 0%. Class C shares performance assumes a 1% CDSC applied when you sell shares within one year of purchase. |
| 2 | Barclays U.S. Aggregate Bond Index is an unmanaged index that covers the U.S.-dollar denominated, investment-grade, fixed-rate, taxable bond market of SEC-registered securities. The index includes bonds from the Treasury, government-related, corporate, mortgage-backed securities, asset-backed securities, and collateralized mortgage-backed securities sectors. |
| 3 | Morningstar Intermediate-Term Bond Fund Average is the average performance without sales charges of funds with similar investment objectives, as calculated by Morningstar, Inc. |
| 4 | Fund performance has been increased by fee waivers and/or expense reimbursements, if any, without which performance would have been lower. |
| 4
LOOMIS SAYLES HIGH INCOME FUND
Management Discussion
Managers:
Matthew J. Eagan, CFA
Kathleen C. Gaffney, CFA*
Elaine M. Stokes
Loomis, Sayles & Company, L.P.
Objective:
Seeks high current income plus the opportunity for capital appreciation to produce a high total return
Strategy:
Invests at least 65% of its net assets in below investment-grade fixed-income securities
Symbols:
| | |
| Class A | | NEFHX |
| Class B | | NEHBX |
| Class C | | NEHCX |
| Class Y | | NEHYX |
| * | Effective October 22, 2012, Kathleen Gaffney no longer serves as a portfolio manager of the fund. |
Market Conditions
Central bank action was a primary driver of market performance during the 12-month period that ended September 30, 2012. Market conditions began to improve in the last month of 2011, and the rally continued into 2012. New programs from the Federal Reserve (the Fed) and the European Central Bank (ECB) indicated the institutions remain committed to supporting economic recovery. The Fed’s third round of quantitative easing, a program for buying long-term mortgage debt in an effort to keep borrowing rates low, and the ECB’s sovereign debt-purchase program, designed to stabilize the euro, helped encourage investors and drove most financial markets higher. Aside from the second quarter of 2012, investors were generally rewarded for taking risk during the period and lower-rated credits saw big gains.
Performance Results
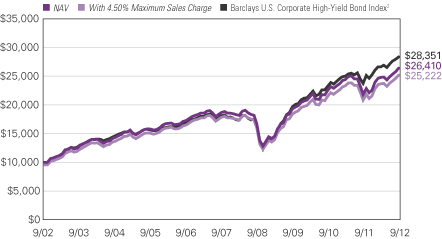
For the 12 months ended September 30, 2012, Class A shares of Loomis Sayles High Income Fund returned 20.90% at net asset value. The fund outperformed its benchmark, the Barclays U.S. Corporate High-Yield Bond Index, which returned 19.37% for the period. The fund outperformed the average return of funds in its peer group, the Morningstar High Yield Bond category, which was 17.59%.
Explanation of Fund Performance
Financial market performance was largely positive for the period. Traditionally riskier asset classes benefited from the central bank actions supporting the economic recovery. High-yield securities posted outsized gains as money poured into the sector and default rates stayed well under their long-term averages. Security selection was the primary driver of the fund’s outperformance for the period, particularly within the high-yield industrial sector. Securities in the home construction industry were also key outperformers, as historically low rates helped bring the housing market off its lows. Below-investment-grade utility and financial names added to returns, as investors were rewarded for taking on
5 |
additional risk. In addition, a small exposure to common and preferred stock was a large contributor to gains, while out-of-benchmark allocations to mortgage-backed securities and commercial mortgage-backed securities aided performance.
Non-U.S.-dollar-denominated holdings detracted from relative performance during the period, with positions in the Canadian dollar, euro and South Korean won weighing the most heavily on performance. In addition, poor performance from specific technology holdings hurt overall returns, while holding small positions in cash and cash equivalents lagged, as the market generally favored risk over perceived safety during the period.
Outlook
Unprecedented monetary support in both the United States and Europe continues to largely dictate market sentiment and flows, while preserving low interest rates. Investor desire for yield in this environment will most likely support sustained demand in the corporate arena. Fundamental credit quality in the corporate sector remains a source of confidence for investors. However, if economic conditions continue to deteriorate globally, the challenge of investing in stable to improving companies will become more challenging.
The upcoming U.S. elections, pending “fiscal cliff” and increasingly weakening economic conditions in Europe, China and the United States are all situations that could potentially provide market volatility and opportunities. We consider recent positive developments in the U.S. housing market along with the Federal Reserve’s latest purchase program in the mortgage market to be sources of good news on the economic front and view the sectors as continuing opportunities. Our strategy of populating the fund with individual specific-risks ideas remains an important theme, as do the concepts of yield advantage and investing with a long-term horizon in mind. Macroeconomic developments continue to dominate the headlines and market flows, but our belief that owning quality companies based on fundamentals continues to serve us well and will drive our investment process through the rest of this calendar year.
| 6
LOOMIS SAYLES HIGH INCOME FUND
Investment Results through September 30, 2012
Growth of a $10,000 Investment in Class A Shares4
September 30, 2002 through September 30, 2012
7 |
Average Annual Total Returns — September 30, 20124
| | | | | | | | | | | | | | | | |
| | | | | |
| | | 1 Year | | | 5 Years | | | 10 Years | | | Since Class Y
Inception | |
| | | | | |
| Class A (Inception 2/22/84) | | | | | | | | | | | | | | | | |
| NAV | | | 20.90 | % | | | 7.16 | % | | | 10.20 | % | | | — | |
| With 4.50% Maximum Sales Charge | | | 15.46 | | | | 6.18 | | | | 9.70 | | | | — | |
| | | | | |
| Class B (Inception 9/20/93) | | | | | | | | | | | | | | | | |
| NAV | | | 19.93 | | | | 6.32 | | | | 9.37 | | | | — | |
| With CDSC1 | | | 14.93 | | | | 6.04 | | | | 9.37 | | | | — | |
| | | | | |
| Class C (Inception 3/2/98) | | | | | | | | | | | | | | | | |
| NAV | | | 19.96 | | | | 6.40 | | | | 9.39 | | | | — | |
| With CDSC1 | | | 18.96 | | | | 6.40 | | | | 9.39 | | | | — | |
| | | | | |
| Class Y (Inception 2/29/08) | | | | | | | | | | | | | | | | |
| NAV | | | 20.93 | | | | — | | | | — | | | | 8.51 | |
| | | | | |
| Comparative Performance | | | | | | | | | | | | | | | | |
Barclays U.S. Corporate High-Yield
Bond Index2 | | | 19.37 | | | | 9.34 | | | | 10.98 | | | | 11.20 | |
| Morningstar High Yield Bond Fund Average3 | | | 17.59 | | | | 7.06 | | | | 9.21 | | | | 8.81 | |
Past performance does not guarantee future results. The chart and table do not reflect taxes shareholders might owe on any fund distributions or when they redeem their shares. Returns reflect changes in share price and reinvestment of dividends and capital gains, if any. Unlike a fund, an index is not managed and does not reflect fees and expenses.
NOTES TO CHARTS
| 1 | Performance for Class B shares assumes a maximum 5% contingent deferred sales charge (“CDSC”) applied when you sell shares, which declines annually between years 1-6 according to the following schedule: 5, 4, 3, 3, 2, 1, 0%. Class C shares performance assumes a 1% CDSC applied when you sell shares within one year of purchase. |
| 2 | Barclays U.S. Corporate High-Yield Bond Index is an unmanaged index that covers the U.S. dollar-denominated, non-investment grade, fixed-rate, taxable corporate bond market. |
| 3 | Morningstar High Yield Bond Fund Average is the average performance without sales charges of funds with similar investment objectives, as calculated by Morningstar, Inc. |
| 4 | Fund performance has been increased by fee waivers and/or expense reimbursements, if any, without which performance would have been lower. |
| 8
LOOMIS SAYLES INTERNATIONAL BOND FUND
Management Discussion
Managers:
Kenneth M. Buntrock, CFA, CIC
David W. Rolley, CFA
Lynda L. Schweitzer, CFA
Loomis, Sayles & Company, L.P.
Objective:
Seeks high total return through a combination of high current income and capital appreciation
Strategy:
Invests at least 80% of its net assets in fixed-income securities located outside the U.S.
Symbols:
| | |
| Class A | | LSIAX |
| Class C | | LSICX |
| Class Y | | LSIYX |
Market Conditions
U.S. economic data showed signs of improvement during the first half of the 12-month period ended September 30, 2012, but it began to deteriorate in the second half. U.S. Treasury yields fell to record lows, as volatility persisted during the period, reflecting concerns about the ongoing sovereign debt crisis in Europe and the global economic slowdown.
Against this backdrop, global bond markets delivered strong total returns during the period, supported by central bank measures aimed at promoting global economic growth. Quantitative easing, a central bank tool for buying long-term debt in an effort to keep borrowing rates low and a major theme during the 12-month period, helped buoy the financial markets intermittently. In December 2011, the European Central Bank (ECB) implemented a program to provide additional liquidity to the euro zone. Midway through 2012, the Federal Reserve (the Fed) extended Operation Twist, a stimulus plan in which the Fed is buying long-term securities and selling the same dollar amount of short-term securities, through the remainder of the year. Late in the period, the ECB launched an additional sovereign bond-buying program, and the Fed announced its third round of quantitative easing, in which it will purchase $40 billion per month of agency mortgage-backed securities with no specified end date.
Performance Results
For the 12 months ended September 30, 2012, Class A shares of Loomis Sayles International Bond Fund returned 8.42% at net asset value. The fund outperformed its benchmark, the Barclays Global Aggregate, ex-USD Bond Index, which returned 4.80% for the period. The fund outperformed the 7.44% average return of funds in its peer group, the Morningstar World Bond category.
Explanation of Fund Performance
An overweight position in corporate bonds and security selection within this sector helped drive the fund’s outperformance relative to the index. Our preference
9 |
for lower-quality corporate and emerging market bonds over euro-area corporates and government bonds proved favorable, as did selections in banking, basic industry, consumer goods and emerging market sovereign bonds. From a currency perspective, an underweight position in the euro and corresponding overweight positions in emerging market and peripheral currencies aided the fund’s relative outperformance. Specifically, the fund’s holdings in the Canadian dollar, Colombian peso, Mexican peso, New Zealand dollar, Norwegian krone, Singaporean dollar and South Korean won added to returns. Country allocation was an additional source of outperformance, as an underweight position in Japan and overweight positions in Mexico and the United Kingdom generated favorable results.
On the downside, an underweight in securitized bonds had a negative effect on relative performance, as the asset class delivered attractive returns during the period. Nevertheless, our preference for corporates more than made up for the negative relative results in securitized bonds.
To better align the currency exposure of specific holdings, forward foreign currency contracts were traded during the period. The foreign currency contracts are utilized as a part of the fixed income currency strategy including contracts to hedge certain currency exposure and others to obtain exposure to preferred currencies over the period. During this period, the use of foreign currency contracts had a positive impact on excess return.
Outlook
The euro zone remains in recession, growth in China has slowed and global manufacturing remains soft. U.S. growth has been the most stable, at approximately 2%, but the positive influences from housing and energy have been offset by renewed consumer and business caution tied to the election and looming “fiscal cliff” of federal tax hikes and spending cuts.
Against this backdrop, the fund remains somewhat more defensive than normal, as we have reduced corporate credit exposure. We see little value in extending maturities in Treasuries, but we expect Treasury yields to remain largely range-bound through the end of the year. In terms of the fund’s currency exposure, we favor growing economies with well-managed central government finances, including Canada, Singapore, South Korea, Mexico, Norway and Uruguay. Among the commodity-exposed currencies, we prefer Norway and Canada to others, because traditionally they have had less sensitivity to growth in China. Also, given the current global environment, we prefer commodity-linked currencies with correlation to oil rather than those with correlation to metals. Ultimately, we believe a recovery of risk appetites in corporate investment policy committees is key to self-sustaining global economic growth. This still seems some distance away, given the weak current macroeconomic trends and the significant political uncertainties facing investors during the remainder of this year.
| 10
LOOMIS SAYLES INTERNATIONAL BOND FUND
Investment Results through September 30, 2012
Growth of $10,000 Investment in Class A Shares4
February 1, 2008 (inception) through September 30, 2012

11 |
Average Annual Total Returns — September 30, 20124
| | | | | | | | |
| | | |
| | | 1 Year | | | Since
Inception | |
| | | |
| Class A (Inception 2/1/08) | | | | | | | | |
| NAV | | | 8.42 | % | | | 6.46 | % |
| With 4.50% Maximum Sales Charge | | | 3.58 | | | | 5.42 | |
| | | |
| Class C (Inception 2/1/08) | | | | | | | | |
| NAV | | | 7.64 | | | | 5.64 | |
| With CDSC1 | | | 6.69 | | | | 5.64 | |
| | | |
| Class Y (Inception 2/1/08) | | | | | | | | |
| NAV | | | 8.68 | | | | 6.71 | |
| | | |
| Comparative Performance | | | | | | | | |
| Barclays Global Aggregate ex-USD Bond Index2 | | | 4.80 | | | | 4.91 | |
| Morningstar World Bond Fund Average3 | | | 7.44 | | | | 5.50 | |
Past performance does not guarantee future results. The chart and table do not reflect taxes shareholders might owe on any fund distributions or when they redeem their shares. Returns reflect changes in share price and reinvestment of dividends and capital gains, if any. Unlike a fund, an index is not managed and does not reflect fees and expenses.
NOTES TO CHARTS
| 1 | Class C shares performance assumes a 1% CDSC applied when you sell shares within one year of purchase. |
| 2 | Barclays Global Aggregate ex-USD Bond Index is an unmanaged index that provides a broad-based measure of the international investment-grade fixed-rate debt markets. |
| 3 | Morningstar World Bond Fund Average is the average performance without sales charges of funds with similar investment objectives, as calculated by Morningstar, Inc. |
| 4 | Fund performance has been increased by fee waivers and/or expense reimbursements, if any, without which performance would have been lower. |
| 12
LOOMIS SAYLES LIMITED TERM GOVERNMENT AND AGENCY FUND
Management Discussion
Managers:*
Christopher T. Harms
Kurt Wagner
John Hyll
Clifton V. Rowe, CFA
Loomis, Sayles & Company, L.P.
Objective:
Seeks a high current return consistent with preservation of capital
Strategy:
Invests at least 80% of its net assets in securities issued or guaranteed by the U.S. government, its agencies or instrumentalities
Symbols:
| | |
| Class A | | NEFLX |
| Class B | | NELBX |
| Class C | | NECLX |
| Class Y | | NELYX |
| * | Effective April 23, 2012, John Hyll no longer serves as a portfolio manager of the fund. Christopher T. Harms and Kurt Wagner have joined Mr. Rowe as co-managers of the fund. |
Market Conditions
Market sentiment changed as investors shifted between having an appetite for risk and risk aversion during the 12-month period ended September 30, 2012. The shift was primarily driven by investor responses to mixed economic data and government responses to the ongoing global debt crises. Central banks around the world lowered borrowing rates and introduced policies intended to buoy sluggish economies. In the United States, the Federal Reserve (the Fed) extended its Operation Twist program, in which it sold shorter-maturity Treasuries and purchased longer-maturity Treasuries. The Fed announced a third round of quantitative easing in mid-September, which triggered a short-lived rally among riskier assets. The latest easing policy has the Fed purchasing agency mortgage-backed securities (MBS) at a pace of $40 billion per month, with no specified end date. MBS prices rallied following the announcement.
Performance Results
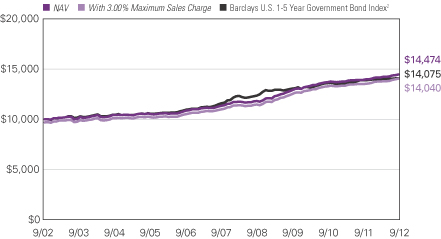
For the 12-months ended September 30, 2012, Class A shares of Loomis Sayles Limited Term Government and Agency Fund returned 3.94% at net asset value. The fund outperformed its benchmark, the Barclays U.S. 1-5 Year Government Bond Index, which returned 1.33% for the period. The fund outperformed the 1.37% average return of funds in its peer group, the Morningstar Short Government category.
Explanation of Fund Performance
Allocations to commercial mortgage-backed securities (CMBS) and MBS, along with strong relative sector weights, were the primary drivers of the fund’s outperformance. The fund’s CMBS positions produced superior returns relative to higher-quality assets such as Treasuries, as spreads (the yield difference between non-Treasury securities and comparable-maturity Treasuries) among CMBS tightened throughout the period. Agency MBS also provided a significant contribution to relative performance. Similar to CMBS,
13 |
MBS spreads tightened throughout the period. In addition, an underweight position in Treasuries aided relative performance, as Treasuries generally underperformed riskier assets during the period.
The fund maintained an underweight position in U.S. agency securities, which detracted from performance. Security selection among agency securities also weighed on the fund’s relative returns.
Outlook
The Fed recently committed to maintaining its current interest rate policy well into 2015 and potentially beyond. Therefore, we expect interest rate volatility to remain relatively low and think rates will be fairly stable before gradually rising. This type of environment should benefit mortgage securities. Our analysis continues to suggest attractive upside potential and solid credit protection for non-agency securitized assets.
| 14
LOOMIS SAYLES LIMITED TERM GOVERNMENT AND AGENCY FUND
Investment Results through September 30, 2012
Growth of a $10,000 Investment in Class A Shares4
September 30, 2002 through September 30, 2012
15 |
Average Annual Total Returns — September 30, 20124
| | | | | | | | | | | | |
| | | | |
| | | 1 Year | | | 5 Years | | | 10 Years | |
| | | | |
| Class A (Inception 1/3/89) | | | | | | | | | | | | |
| NAV | | | 3.94 | % | | | 4.98 | % | | | 3.76 | % |
| With 3.00% Maximum Sales Charge | | | 0.80 | | | | 4.34 | | | | 3.45 | |
| | | | |
| Class B (Inception 9/27/93) | | | | | | | | | | | | |
| NAV | | | 3.17 | | | | 4.20 | | | | 3.00 | |
| With CDSC1 | | | -1.83 | | | | 3.86 | | | | 3.00 | |
| | | | |
| Class C (Inception 12/30/94) | | | | | | | | | | | | |
| NAV | | | 3.17 | | | | 4.22 | | | | 3.01 | |
| With CDSC1 | | | 2.17 | | | | 4.22 | | | | 3.01 | |
| | | | |
| Class Y (Inception 3/31/94) | | | | | | | | | | | | |
| NAV | | | 4.19 | | | | 5.25 | | | | 4.02 | |
| | | | |
| Comparative Performance | | | | | | | | | | | | |
| Barclays U.S. 1-5 Year Government Bond Index2 | | | 1.33 | | | | 3.95 | | | | 3.48 | |
| Morningstar Short Government Fund Average3 | | | 1.37 | | | | 3.22 | | | | 2.81 | |
Past performance does not guarantee future results. The chart and table do not reflect taxes shareholders might owe on any fund distributions or when they redeem their shares. Returns reflect changes in share price and reinvestment of dividends and capital gains, if any. Unlike a fund, an index is not managed and does not reflect fees and expenses.
NOTES TO CHARTS
| 1 | Performance for Class B shares assumes a maximum 5% contingent deferred sales charge (“CDSC”) applied when you sell shares, which declines annually between years 1-6 according to the following schedule: 5, 4, 3, 3, 2, 1, 0%. Class C shares performance assumes a 1% CDSC applied when you sell shares within one year of purchase. |
| 2 | Barclays U.S. 1-5 Year Government Bond Index is an unmanaged index that includes U.S. Treasury and agency securities with remaining maturities of one to five years. |
| 3 | Morningstar Short Government Fund Average is the average performance without sales charges of funds with similar investment objectives, as calculated by Morningstar, Inc. |
| 4 | Fund performance has been increased by fee waivers and/or expense reimbursements, if any, without which performance would have been lower. |
| 16
ADDITIONAL INFORMATION
The views expressed in this report reflect those of the portfolio managers as of the dates indicated. The managers’ views are subject to change at any time without notice based on changes in market or other conditions. References to specific securities or industries should not be regarded as investment advice. Because the funds are actively managed, there is no assurance that they will continue to invest in the securities or industries mentioned.
PROXY VOTING INFORMATION
A description of the funds’ proxy voting policies and procedures is available without charge, upon request, by calling Natixis Funds at 800-225-5478; on the funds’ website at ngam.natixis.com; and on the Securities and Exchange Commission’s (SEC’s) website at www.sec.gov. Information regarding how the funds voted proxies relating to portfolio securities during the 12-month period ended June 30, 2012 is available from the funds’ website and the SEC’s website.
QUARTERLY PORTFOLIO SCHEDULES
The funds file a complete schedule of portfolio holdings with the SEC for the first and third quarters of each fiscal year on Form N-Q. The funds’ Forms N-Q are available on the SEC’s website at www.sec.gov and may be reviewed and copied at the SEC’s Public Reference Room in Washington, DC. Information on the operation of the Public Reference Room may be obtained by calling 800-SEC-0330.
17 |
UNDERSTANDING FUND EXPENSES
As a mutual fund shareholder, you incur different costs: transaction costs, including sales charges (loads) on purchases and contingent deferred sales charges on redemptions, and ongoing costs, including management fees, distribution and/or service fees (12b-1 fees), and other fund expenses. Certain exemptions may apply. These costs are described in more detail in the funds’ prospectuses. The examples below are intended to help you understand the ongoing costs of investing in the funds and help you compare these with the ongoing costs of investing in other mutual funds.
The first line in the table of each class of fund shares shows the actual account values and actual fund expenses you would have paid on a $1,000 investment in the fund from April 1, 2012 through September 30, 2012. To estimate the expenses you paid over the period, simply divide your account value by $1,000 (for example $8,600 account value divided by $1,000 = 8.60) and multiply the result by the number in the Expenses Paid During Period column as shown below for your class.
The second line in the table of each class of fund shares provides information about hypothetical account values and hypothetical expenses based on the fund’s actual expense ratios and an assumed rate of return of 5% per year before expenses, which is not the fund’s actual return. The hypothetical account values and expenses may not be used to estimate the actual ending account balance or expenses you paid on your investment for the period. You may use this information to compare the ongoing costs of investing in the fund and other funds. To do so, compare this 5% hypothetical example with the 5% hypothetical examples that appear in the shareholder reports of the other funds.
Please note that the expenses shown reflect ongoing costs only, and do not include any transaction costs such as sales charges. Therefore, the second line in the table of each fund is useful in comparing ongoing costs only, and will not help you determine the relative costs of owning different funds. If transaction costs were included, total costs would be higher.
| | | | | | | | | | | | |
LOOMIS SAYLES CORE PLUS BOND
FUND | | BEGINNING
ACCOUNT VALUE
4/1/2012 | | | ENDING
ACCOUNT VALUE
9/30/2012 | | | EXPENSES PAID
DURING PERIOD*
4/1/2012 – 9/30/2012 | |
Class A | | | | | | | | | | | | |
Actual | | | $1,000.00 | | | | $1,067.90 | | | | $4.29 | |
Hypothetical (5% return before expenses) | | | $1,000.00 | | | | $1,020.85 | | | | $4.19 | |
Class B | | | | | | | | | | | | |
Actual | | | $1,000.00 | | | | $1,063.50 | | | | $8.15 | |
Hypothetical (5% return before expenses) | | | $1,000.00 | | | | $1,017.10 | | | | $7.97 | |
Class C | | | | | | | | | | | | |
Actual | | | $1,000.00 | | | | $1,064.80 | | | | $8.16 | |
Hypothetical (5% return before expenses) | | | $1,000.00 | | | | $1,017.10 | | | | $7.97 | |
Class Y | | | | | | | | | | | | |
Actual | | | $1,000.00 | | | | $1,069.50 | | | | $3.00 | |
Hypothetical (5% return before expenses) | | | $1,000.00 | | | | $1,022.10 | | | | $2.93 | |
| * | Expenses are equal to the Fund’s annualized expense ratio: 0.83%, 1.58%, 1.58% and 0.58% for Class A, B, C and Y, respectively, multiplied by the average account value over the period, multiplied by the number of days in the most recent fiscal half-year, divided by 366 (to reflect the half-year period). |
| 18
| | | | | | | | | | | | |
| LOOMIS SAYLES HIGH INCOME FUND | | BEGINNING
ACCOUNT VALUE
4/1/2012 | | | ENDING
ACCOUNT VALUE
9/30/2012 | | | EXPENSES PAID
DURING PERIOD*
4/1/2012 – 9/30/2012 | |
Class A | | | | | | | | | | | | |
Actual | | | $1,000.00 | | | | $1,065.20 | | | | $5.94 | |
Hypothetical (5% return before expenses) | | | $1,000.00 | | | | $1,019.25 | | | | $5.81 | |
Class B | | | | | | | | | | | | |
Actual | | | $1,000.00 | | | | $1,058.50 | | | | $9.78 | |
Hypothetical (5% return before expenses) | | | $1,000.00 | | | | $1,015.50 | | | | $9.57 | |
Class C | | | | | | | | | | | | |
Actual | | | $1,000.00 | | | | $1,061.10 | | | | $9.79 | |
Hypothetical (5% return before expenses) | | | $1,000.00 | | | | $1,015.50 | | | | $9.57 | |
Class Y | | | | | | | | | | | | |
Actual | | | $1,000.00 | | | | $1,064.20 | | | | $4.64 | |
Hypothetical (5% return before expenses) | | | $1,000.00 | | | | $1,020.50 | | | | $4.55 | |
| * | Expenses are equal to the Fund’s annualized expense ratio (after waiver/reimbursement): 1.15%, 1.90%, 1.90% and 0.90% for Class A, B, C and Y, respectively, multiplied by the average account value over the period, multiplied by the number of days in the most recent fiscal half-year, divided by 366 (to reflect the half-year period). |
| | | | | | | | | | | | |
| LOOMIS SAYLES INTERNATIONAL BOND FUND | | BEGINNING
ACCOUNT VALUE
4/1/2012 | | | ENDING
ACCOUNT VALUE
9/30/2012 | | | EXPENSES PAID
DURING PERIOD*
4/1/2012 – 9/30/2012 | |
Class A | | | | | | | | | | | | |
Actual | | | $1,000.00 | | | | $1,044.80 | | | | $5.52 | |
Hypothetical (5% return before expenses) | | | $1,000.00 | | | | $1,019.60 | | | | $5.45 | |
Class C | | | | | | | | | | | | |
Actual | | | $1,000.00 | | | | $1,040.90 | | | | $9.34 | |
Hypothetical (5% return before expenses) | | | $1,000.00 | | | | $1,015.85 | | | | $9.22 | |
Class Y | | | | | | | | | | | | |
Actual | | | $1,000.00 | | | | $1,046.10 | | | | $4.25 | |
Hypothetical (5% return before expenses) | | | $1,000.00 | | | | $1,020.85 | | | | $4.19 | |
| * | Expenses are equal to the Fund’s annualized expense ratio (after waiver/reimbursement): 1.08%, 1.83% and 0.83% for Class A, C and Y, respectively, multiplied by the average account value over the period, multiplied by the number of days in the most recent fiscal half-year, divided by 366 (to reflect the half-year period). |
19 |
| | | | | | | | | | | | |
LOOMIS SAYLES LIMITED TERM
GOVERNMENT AND AGENCY FUND | | BEGINNING
ACCOUNT VALUE
4/1/2012 | | | ENDING
ACCOUNT VALUE
9/30/2012 | | | EXPENSES PAID
DURING PERIOD*
4/1/2012 – 9/30/2012 | |
Class A | | | | | | | | | | | | |
Actual | | | $1,000.00 | | | | $1,020.40 | | | | $4.29 | |
Hypothetical (5% return before expenses) | | | $1,000.00 | | | | $1,020.75 | | | | $4.29 | |
Class B | | | | | | | | | | | | |
Actual | | | $1,000.00 | | | | $1,017.40 | | | | $8.07 | |
Hypothetical (5% return before expenses) | | | $1,000.00 | | | | $1,017.00 | | | | $8.07 | |
Class C | | | | | | | | | | | | |
Actual | | | $1,000.00 | | | | $1,016.50 | | | | $8.07 | |
Hypothetical (5% return before expenses) | | | $1,000.00 | | | | $1,017.00 | | | | $8.07 | |
Class Y | | | | | | | | | | | | |
Actual | | | $1,000.00 | | | | $1,022.50 | | | | $3.03 | |
Hypothetical (5% return before expenses) | | | $1,000.00 | | | | $1,022.00 | | | | $3.03 | |
| * | Expenses are equal to the Fund’s annualized expense ratio (after waiver/reimbursement): 0.85%, 1.60%, 1.60% and 0.60% for Class A, B, C and Y, respectively, multiplied by the average account value over the period, multiplied by the number of days in the most recent fiscal half-year, divided by 366 (to reflect the half-year period). |
| 20
BOARD APPROVAL OF THE EXISTING ADVISORY AGREEMENTS
The Board of Trustees of the Trusts, including the Independent Trustees, considers matters bearing on each Fund’s advisory agreement and, with respect to the Loomis Sayles Core Plus Bond Fund, its Advisory Administration Agreement (collectively, the “Agreements”) at most of its meetings throughout the year. Each year, usually in the spring, the Contract Review and Governance Committee of the Board meets to review the Agreements to determine whether to recommend that the full Board approve the continuation of the Agreements, typically for an additional one-year period. After the Committee has made its recommendation, the full Board, including the Independent Trustees, determines whether to approve the continuation of the Agreements.
In connection with these meetings, the Trustees receive materials that the Funds’ investment adviser (the “Adviser”) believes to be reasonably necessary for the Trustees to evaluate the Agreements. These materials generally include, among other items, (i) information on the investment performance of the Funds and the performance of peer groups of funds and the Funds’ performance benchmarks, (ii) information on the Funds’ advisory fees and other expenses, including information comparing the Funds’ expenses to the fees charged to institutional accounts with similar strategies managed by the Adviser and to those of peer groups of funds and information about any applicable expense caps and fee “breakpoints,” (iii) sales and redemption data in respect of the Funds, (iv) information about the profitability of the Agreements to the Adviser and (v) information obtained through the completion by the Adviser of a questionnaire distributed on behalf of the Trustees. The Board of Trustees, including the Independent Trustees, also consider other matters such as (i) the Adviser’s financial results and financial condition, (ii) each Fund’s investment objective and strategies and the size, education and experience of the Adviser’s investment staff and its use of technology, external research and trading cost measurement tools, (iii) arrangements in respect of the distribution of the Funds’ shares and the related costs, (iv) the procedures employed to determine the value of the Funds’ assets, (v) the allocation of the Funds’ brokerage, if any, including, if applicable, allocations to brokers affiliated with the Adviser and the use of “soft” commission dollars to pay Fund expenses and to pay for research and other similar services, (vi) the resources devoted to, and the record of compliance with, the Funds’ investment policies and restrictions, policies on personal securities transactions and other compliance policies, (vii) information about amounts invested by the Funds’ portfolio managers in the Funds or in similar accounts that they manage and (viii) the general economic outlook with particular emphasis on the mutual fund industry. Throughout the process, the Trustees are afforded the opportunity to ask questions of and request additional materials from the Adviser.
In addition to the materials requested by the Trustees in connection with their annual consideration of the continuation of the Agreements, the Trustees receive materials in advance of each regular quarterly meeting of the Board of Trustees that provide detailed information about the Funds’ investment performance and the fees charged to the Funds for advisory and other services. This information generally includes, among other things, an internal performance rating for each Fund based on agreed-upon criteria, graphs
21 |
showing each Fund’s performance and fee differentials against each Fund’s peer group/category, performance ratings provided by a third-party, total return information for various periods, and third-party performance rankings for various periods comparing a Fund against similarly categorized funds. The portfolio management team for each Fund or other representatives of the Adviser make periodic presentations to the Contract Review and Governance Committee and/or the full Board of Trustees, and Funds identified as presenting possible performance concerns may be subject to more frequent board presentations and reviews. In addition, each quarter the Trustees are provided with detailed statistical information about each Fund’s portfolio. The Trustees also receive periodic updates between meetings.
The Board of Trustees most recently approved the continuation of the Agreements at their meeting held in June 2012. The Agreements were continued for a one-year period for the Funds. In considering whether to approve the continuation of the Agreements, the Board of Trustees, including the Independent Trustees, did not identify any single factor as determinative. Individual Trustees may have evaluated the information presented differently from one another, giving different weights to various factors. Matters considered by the Trustees, including the Independent Trustees, in connection with their approval of the Agreements included, but were not limited to, the factors listed below.
The nature, extent and quality of the services provided to the Funds under the Agreements. The Trustees considered the nature, extent and quality of the services provided by the Adviser and its affiliates to the Funds and the resources dedicated to the Funds by the Adviser and its affiliates.
The Trustees considered not only the advisory services provided by the Adviser to the Funds, but also the administrative services provided by NGAM Advisors, L.P. (“NGAM Advisors”) and its affiliates to the Funds.
For each Fund, the Trustees also considered the benefits to shareholders of investing in a mutual fund that is part of a family of funds that offers shareholders the right to exchange shares of one type of fund for shares of another type of fund, and provides a variety of fund and shareholder services.
After reviewing these and related factors, the Trustees concluded, within the context of their overall conclusions regarding each of the Agreements, that the nature, extent and quality of services provided supported the renewal of the Agreements.
Investment performance of the Funds and the Adviser. As noted above, the Trustees received information about the performance of the Funds over various time periods, including information which compared the performance of the Funds to the performance of peer groups and categories of funds and the Funds’ respective performance benchmarks. In addition, the Trustees also reviewed data prepared by an independent third party which analyzed the performance of the Funds using a variety of performance metrics, including metrics which also measured the performance of the Funds on a risk adjusted basis.
With respect to each Fund, the Board concluded that the Fund’s performance or other relevant factors supported the renewal of the Agreement relating to that Fund. In the case of the Loomis Sayles High Income Fund, the performance of which lagged that of a
| 22
relevant peer group median and/or category median for certain (although not necessarily all) periods, the Board concluded that other factors relevant to performance supported renewal of the Agreements. These factors included the following: (1) that the underperformance was attributable, to a significant extent, to investment decisions (such as security selection or sector allocation) by the Adviser that was reasonable and consistent with the Fund’s investment objective and policies and (2) that the Fund’s more recent performance, although lagging in certain periods, was competitive when compared to relevant performance benchmarks or peer groups.
The Trustees also considered the Adviser’s performance and reputation generally, the performance of the fund family generally (as noted by certain financial publications), and the historical responsiveness of the Adviser to Trustee concerns about performance and the willingness of the Adviser to take steps intended to improve performance.
After reviewing these and related factors, the Trustees concluded, within the context of their overall conclusions regarding each of the Agreements, that the performance of the Funds and the Adviser and/or other relevant factors supported the renewal of the Agreements.
The costs of the services to be provided and profits to be realized by the Adviser and its affiliates from their respective relationships with the Funds. The Trustees considered the fees charged to the Funds for advisory services as well as the total expense levels of the Funds. This information included comparisons (provided both by management and also by an independent third party) of the Funds’ advisory fees and total expense levels to those of their peer groups and information about the advisory fees charged by the Adviser to comparable accounts (such as institutional separate accounts), as well as information about differences in such fees and the reasons for any such differences. In considering the fees charged to comparable accounts, the Trustees considered, among other things, management’s representations about the differences between managing mutual funds as compared to other types of accounts, including the additional resources required to effectively manage and the greater regulatory costs associated with the management of mutual fund assets. In evaluating each fund’s advisory fee, the Trustees also took into account the demands, complexity and quality of the investment management of such Fund, as well as the need for the Adviser to offer competitive compensation and to expend additional resources as the Funds grow in size. The Trustees considered that over the past several years, management had made recommendations regarding reductions in advisory fee rates, implementation of advisory fee breakpoints and the institution of advisory fee waivers and expense caps for various funds in the fund family. They noted that, as of December 31, 2011, all of the Funds in this report have expense caps in place, and the Trustees considered the amounts waived or reimbursed by the Adviser under these caps for each Fund other than Funds for which current expenses are below the cap. The Trustees noted that certain Funds had advisory fee rates that were above the median of a peer group of funds. The Trustees considered the factors which management believed justified such relatively higher fees. These factors varied from Fund to Fund, but included one or more of the following: (1) the Fund’s advisory fee rate was only slightly above its peer group median and (2) although the Fund’s advisory fee rate was above its peer group median, it is subject to an expense cap which resulted in the reduction of the advisory fee.
23 |
The Trustees also considered the compensation directly or indirectly received or to be received by the Adviser and its affiliates from their relationships with the Funds. The Trustees reviewed information provided by management as to the profitability of the Adviser’s and its affiliates’ relationships with the Funds, and information about the allocation of expenses used to calculate profitability. They also reviewed information provided by management about the effect of distribution costs and changes in asset levels on Adviser profitability, including information regarding resources spent on distribution activities. When reviewing profitability, the Trustees also considered information about court cases in which adviser compensation or profitability were issues and the performance of the relevant Funds, the expense levels of the Funds, whether the Adviser had implemented breakpoints and/or expense caps with respect to such Funds.
After reviewing these and related factors, the Trustees concluded, within the context of their overall conclusions regarding each of the Agreements, that the advisory fee charged to each of the Funds was fair and reasonable, and that the costs of these services generally and the related profitability of the Adviser and its affiliates in respect of their relationships with the Funds supported the renewal of the Agreements.
Economies of Scale. The Trustees considered the existence of any economies of scale in the provision of services by the Adviser and whether those economies are shared with the Funds through breakpoints in their investment advisory fees or other means, such as expense waivers or caps. The Trustees also discussed with management the factors considered with respect to the implementation of breakpoints in investment advisory fees or expense waivers or caps for certain funds. Management explained that a number of factors are taken into account in considering the possible implementation of breakpoints or an expense cap for a fund, including, among other things, factors such as a fund’s assets, the projected growth of a fund, projected profitability and a fund’s fees and performance. With respect to economies of scale, the Trustees noted that the Loomis Sayles Core Plus Bond Fund and the Loomis Sayles Limited Term Government and Agency Fund are subject to breakpoints in their respective advisory fees. The Trustees further noted that each of the Funds was subject to an expense cap or waiver, and that management had proposed to reduce the expense cap of the Loomis Sayles International Bond Fund. In considering these issues, the Trustees also took note of the costs of the services provided (both on an absolute and a relative basis) and the profitability to the Adviser and its affiliates of their relationships with the Funds, as discussed above.
After reviewing these and related factors, the Trustees concluded, within the context of their overall conclusions regarding each of the Agreements, that the extent to which economies of scale were shared with the Funds supported the renewal of the Agreements.
The Trustees also considered other factors, which included but were not limited to the following:
| · | | The effect of recent market and economic events on the performance, asset levels and expense ratios of each Fund. |
| · | | Whether each Fund has operated in accordance with its investment objective and the Fund’s record of compliance with its investment restrictions, and the compliance programs of the Funds and the Adviser. They also considered the compliance-related resources the Adviser and its affiliates were providing to the Funds. |
| 24
| · | | The nature, quality, cost and extent of administrative and shareholder services performed by the Adviser and its affiliates, both under the Agreements and under separate agreements covering administrative services. |
| · | | So-called “fallout benefits” to the Adviser, such as the engagement of affiliates of the Adviser to provide distribution, administrative and brokerage services to the Funds, and the benefits of research made available to the Adviser by reason of brokerage commissions (if any) generated by the Funds’ securities transactions. The Trustees also considered the fact that NGAM Advisors’ parent company benefits from the retention of an affiliated Adviser. The Trustees considered the possible conflicts of interest associated with these fallout and other benefits, and the reporting, disclosure and other processes in place to disclose and monitor such possible conflicts of interest. |
| · | | The Trustees’ review and discussion of the Funds’ advisory arrangements in prior years, and management’s record of responding to Trustee concerns raised during the year and in prior years. |
Based on their evaluation of all factors that they deemed to be material, including those factors described above, and assisted by the advice of independent counsel, the Trustees, including the Independent Trustees, concluded that each of the existing Agreements should be continued through June 30, 2013.
25 |
Portfolio of Investments – as of September 30, 2012
Loomis Sayles Core Plus Bond Fund
| | | | | | | | |
Principal
Amount (‡) | | | Description | | Value (†) | |
| | Bonds and Notes — 95.2% of Net Assets | | | | |
| | | | ABS Car Loan — 2.1% | | | | |
| $ | 2,290,000 | | | Ally Master Owner Trust, Series 2011-1, Class A2, 2.150%, 1/15/2016 | | $ | 2,331,149 | |
| | 570,000 | | | AmeriCredit Automobile Receivables Trust, Series 2011-2, Class A3,
1.610%, 10/08/2015 | | | 574,738 | |
| | 780,000 | | | AmeriCredit Automobile Receivables Trust, Series 2011-3, Class A3,
1.170%, 1/08/2016 | | | 785,100 | |
| | 2,410,000 | | | AmeriCredit Automobile Receivables Trust, Series 2011-4, Class A3,
1.170%, 5/09/2016 | | | 2,430,613 | |
| | 1,240,000 | | | Avis Budget Rental Car Funding AESOP LLC, Series 2010-2A, Class A,
3.630%, 8/20/2014, 144A | | | 1,258,259 | |
| | 1,300,000 | | | Avis Budget Rental Car Funding AESOP LLC, Series 2011-2A, Class A,
2.370%, 11/20/2014, 144A | | | 1,335,395 | |
| | 272,058 | | | Centre Point Funding LLC, Series 2010-1A, Class 1,
5.430%, 7/20/2016, 144A | | | 285,183 | |
| | 1,775,000 | | | DSC Floorplan Master Owner Trust, Series 2011-1, Class A,
3.910%, 3/15/2016, 144A | | | 1,818,644 | |
| | 790,000 | | | Hertz Vehicle Financing LLC, Series 2009-2A, Class A1,
4.260%, 3/25/2014, 144A | | | 798,229 | |
| | 7,130,000 | | | Santander Drive Auto Receivables Trust, Series 2012-1, Class 1A3,
1.490%, 10/15/2015 | | | 7,214,084 | |
| | 4,195,000 | | | Santander Drive Auto Receivables Trust, Series 2012-3, Class B,
1.940%, 12/15/2016 | | | 4,213,727 | |
| | 3,385,000 | | | Santander Drive Auto Receivables Trust, Series 2012-4, Class C,
2.940%, 12/15/2017 | | | 3,458,779 | |
| | 2,090,000 | | | Santander Drive Auto Receivables Trust, Series 2012-5, Class C,
2.700%, 8/15/2018 | | | 2,121,787 | |
| | | | | | | | |
| | | | | | | 28,625,687 | |
| | | | | | | | |
| | | | ABS Credit Card — 0.9% | | | | |
| | 1,580,000 | | | World Financial Network Credit Card Master Trust, Series 2009-D, Class A, 4.660%, 5/15/2017 | | | 1,629,015 | |
| | 500,000 | | | World Financial Network Credit Card Master Trust, Series 2010-A, Class A, 3.960%, 4/15/2019 | | | 540,735 | |
| | 9,300,000 | | | World Financial Network Credit Card Master Trust, Series 2012-A, Class A, 3.140%, 1/17/2023(b) | | | 10,057,141 | |
| | | | | | | | |
| | | | | | | 12,226,891 | |
| | | | | | | | |
| | | | ABS Home Equity — 0.0% | | | | |
| | 482,043 | | | Countrywide Asset-Backed Certificates, Series 2004-S1, Class A3,
5.115%, 2/25/2035(c) | | | 459,339 | |
| | | | | | | | |
| | | | ABS Other — 0.1% | | | | |
| | 1,620,000 | | | Avis Budget Rental Car Funding AESOP LLC, Series 2011-1A, Class A, 1.850%, 11/20/2014, 144A | | | 1,631,445 | |
| | | | | | | | |
| | | | Aerospace & Defense — 0.4% | | | | |
| | 225,000 | | | Bombardier, Inc., 5.750%, 3/15/2022, 144A | | | 230,625 | |
| | 1,480,000 | | | Bombardier, Inc., 7.500%, 3/15/2018, 144A | | | 1,676,100 | |
See accompanying notes to financial statements.
| 26
Portfolio of Investments – as of September 30, 2012
Loomis Sayles Core Plus Bond Fund – (continued)
| | | | | | | | |
Principal
Amount (‡) | | | Description | | Value (†) | |
| | | | Aerospace & Defense — continued | | | | |
| $ | 3,060,000 | | | Oshkosh Corp., 8.250%, 3/01/2017 | | $ | 3,366,000 | |
| | | | | | | | |
| | | | | | | 5,272,725 | |
| | | | | | | | |
| | | | Airlines — 0.1% | | | | |
| | 1,178,615 | | | Continental Airlines Pass Through Trust, Series 2010-1, Class A,
4.750%, 7/12/2022 | | | 1,258,171 | |
| | | | | | | | |
| | | | Automotive — 3.4% | | | | |
| | 7,885,000 | | | Ford Motor Credit Co. LLC, 5.000%, 5/15/2018 | | | 8,608,236 | |
| | 510,000 | | | Ford Motor Credit Co. LLC, 5.625%, 9/15/2015 | | | 557,465 | |
| | 3,880,000 | | | Ford Motor Credit Co. LLC, 6.625%, 8/15/2017 | | | 4,500,474 | |
| | 880,000 | | | Ford Motor Credit Co. LLC, 7.000%, 10/01/2013 | | | 930,195 | |
| | 1,830,000 | | | Ford Motor Credit Co. LLC, 7.000%, 4/15/2015 | | | 2,049,600 | |
| | 5,900,000 | | | Ford Motor Credit Co. LLC, 8.000%, 12/15/2016 | | | 7,052,299 | |
| | 2,680,000 | | | General Motors Financial Co., Inc., 6.750%, 6/01/2018 | | | 2,982,492 | |
| | 1,575,000 | | | Hyundai Capital Services, Inc., 3.500%, 9/13/2017, 144A | | | 1,646,915 | |
| | 3,375,000 | | | Kia Motors Corp., 3.625%, 6/14/2016, 144A | | | 3,549,467 | |
| | 15,665,000 | | | Toyota Motor Credit Corp., MTN, 1.750%, 5/22/2017(b) | | | 16,093,798 | |
| | | | | | | | |
| | | | | | | 47,970,941 | |
| | | | | | | | |
| | | | Banking — 5.9% | | | | |
| | 7,600,000 | | | Banco Santander Brasil S.A., 4.625%, 2/13/2017, 144A | | | 7,828,000 | |
| | 3,345,000 | | | Banco Santander Chile, 3.875%, 9/20/2022, 144A | | | 3,355,403 | |
| | 10,700,000 | | | Bank of America Corp., MTN, 5.000%, 5/13/2021 | | | 11,761,237 | |
| | 1,365,000 | | | Bear Stearns Cos., Inc. (The), 6.400%, 10/02/2017 | | | 1,641,206 | |
| | 1,775,000 | | | Citigroup, Inc., 6.000%, 8/15/2017 | | | 2,067,506 | |
| | 1,115,000 | | | Citigroup, Inc., 6.125%, 5/15/2018 | | | 1,319,956 | |
| | 6,555,000 | | | Citigroup, Inc., 6.500%, 8/19/2013 | | | 6,880,770 | |
| | 465,000 | | | Goldman Sachs Group, Inc. (The), 6.000%, 6/15/2020 | | | 536,163 | |
| | 3,020,000 | | | Goldman Sachs Group, Inc. (The), 6.750%, 10/01/2037 | | | 3,235,272 | |
| | 5,615,000 | | | Goldman Sachs Group, Inc. (The), 7.500%, 2/15/2019 | | | 6,963,673 | |
| | 4,710,000 | | | Hana Bank, 4.250%, 6/14/2017, 144A | | | 5,146,895 | |
| | 7,255,000 | | | JPMorgan Chase & Co., 6.000%, 1/15/2018 | | | 8,649,875 | |
| | 3,650,000 | | | Merrill Lynch & Co., Inc., MTN, 6.875%, 4/25/2018 | | | 4,373,116 | |
| | 1,015,000 | | | Morgan Stanley, 5.375%, 10/15/2015 | | | 1,093,311 | |
| | 8,245,000 | | | Morgan Stanley, 5.750%, 1/25/2021 | | | 9,050,133 | |
| | 2,530,000 | | | Morgan Stanley, Series F, GMTN, 6.625%, 4/01/2018 | | | 2,906,818 | |
| | 4,970,000 | | | PKO Finance AB, 4.630%, 9/26/2022, 144A | | | 4,984,910 | |
| | | | | | | | |
| | | | | | | 81,794,244 | |
| | | | | | | | |
| | | | Building Materials — 0.5% | | | | |
| | 2,685,000 | | | Owens Corning, Inc., 7.000%, 12/01/2036 | | | 2,946,167 | |
| | 3,640,000 | | | USG Corp., 6.300%, 11/15/2016 | | | 3,676,400 | |
| | | | | | | | |
| | | | | | | 6,622,567 | |
| | | | | | | | |
| | | | Chemicals — 1.3% | | | | |
| | 5,800,000 | | | Braskem America Finance Co., 7.125%, 7/22/2041, 144A | | | 6,148,000 | |
| | 2,130,000 | | | Methanex Corp., 5.250%, 3/01/2022 | | | 2,275,483 | |
| | 5,310,000 | | | Mexichem SAB de CV, 6.750%, 9/19/2042, 144A | | | 5,510,187 | |
| | 1,380,000 | | | Olin Corp., 5.500%, 8/15/2022 | | | 1,421,400 | |
See accompanying notes to financial statements.
27 |
Portfolio of Investments – as of September 30, 2012
Loomis Sayles Core Plus Bond Fund – (continued)
| | | | | | | | |
Principal
Amount (‡) | | | Description | | Value (†) | |
| | | | Chemicals — continued | | | | |
| $ | 2,755,000 | | | RPM International, Inc., 6.125%, 10/15/2019 | | $ | 3,191,781 | |
| | | | | | | | |
| | | | | | | 18,546,851 | |
| | | | | | | | |
| | | | Collateralized Mortgage Obligations — 0.3% | | | | |
| | 643,096 | | | Chase Mortgage Finance Corp., Series 2007-A1, Class 2A3,
2.998%, 2/25/2037(c) | | | 650,451 | |
| | 3,530,000 | | | FHLMC Multifamily Structured Pass Through Certificates,
Series K704, Class A2, 2.412%, 8/25/2018 | | | 3,740,137 | |
| | | | | | | | |
| | | | | | | 4,390,588 | |
| | | | | | | | |
| | | | Commercial Mortgage-Backed Securities — 4.8% | | | | |
| | 452,073 | | | Banc of America Merrill Lynch Commercial Mortgage, Inc.,
Series 2007-2, Class A2, 5.634%, 4/10/2049 | | | 470,061 | |
| | 1,670,000 | | | Banc of America Merrill Lynch Commercial Mortgage, Inc.,
Series 2007-2, Class A4, 5.803%, 4/10/2049(c) | | | 1,943,735 | |
| | 658,524 | | | Bear Stearns Commercial Mortgage Securities, Series 2007-PW16, Class A2,
5.854%, 6/11/2040(c) | | | 678,837 | |
| | 1,000,000 | | | Citigroup Commercial Mortgage Trust, Series 2008-C7, Class A4,
6.263%, 12/10/2049(c) | | | 1,194,270 | |
| | 176,004 | | | Citigroup/Deutsche Bank Commercial Mortgage Trust,
Series 2006-CD2, Class A2, 5.408%, 1/15/2046 | | | 178,496 | |
| | 2,500,000 | | | Credit Suisse Mortgage Capital Certificates, Series 2007-C2, Class A3,
5.542%, 1/15/2049 | | | 2,802,310 | |
| | 3,500,000 | | | Credit Suisse Mortgage Capital Certificates, Series 2007-C4, Class A4,
5.955%, 9/15/2039(c) | | | 3,881,427 | |
| | 5,790,000 | | | Credit Suisse Mortgage Capital Certificates, Series 2008-C1, Class A3,
6.407%, 2/15/2041(c) | | | 6,743,740 | |
| | 124,260 | | | Greenwich Capital Commercial Funding Corp., Series 2005-GG5, Class A2,
5.117%, 4/10/2037 | | | 124,160 | |
| | 425,000 | | | Greenwich Capital Commercial Funding Corp., Series 2006-GG7, Class A4,
6.065%, 7/10/2038(c) | | | 492,634 | |
| | 705,000 | | | Greenwich Capital Commercial Funding Corp., Series 2007-GG11, Class A4,
5.736%, 12/10/2049 | | | 822,351 | |
| | 8,235,000 | | | Greenwich Capital Commercial Funding Corp., Series 2007-GG9, Class A4,
5.444%, 3/10/2039 | | | 9,402,904 | |
| | 4,730,000 | | | GS Mortgage Securities Corp. II, Series 2007-GG10, Class A4,
5.983%, 8/10/2045(c) | | | 5,416,843 | |
| | 3,000,000 | | | JPMorgan Chase Commercial Mortgage Securities Corp.,
Series 2006-LDP9, Class A3, 5.336%, 5/15/2047 | | | 3,425,187 | |
| | 2,650,000 | | | JPMorgan Chase Commercial Mortgage Securities Corp.,
Series 2007-CB18, Class A4, 5.440%, 6/12/2047 | | | 3,052,249 | |
| | 2,500,000 | | | Merrill Lynch/Countrywide Commercial Mortgage Trust,
Series 2007-5, Class A4, 5.378%, 8/12/2048 | | | 2,819,555 | |
| | 365,000 | | | Morgan Stanley Capital I, Series 2007-HQ12, Class A5, 5.759%, 4/12/2049(c) | | | 409,903 | |
| | 1,900,000 | | | Morgan Stanley Capital I, Series 2007-HQ13, Class A3, 5.569%, 12/15/2044 | | | 2,145,742 | |
| | 2,930,000 | | | Morgan Stanley Capital I, Series 2007-IQ14, Class A4, 5.692%, 4/15/2049 | | | 3,353,678 | |
| | 305,000 | | | Morgan Stanley Capital I, Series 2007-T27, Class A4, 5.823%, 6/11/2042(c) | | | 360,741 | |
| | 1,175,000 | | | Morgan Stanley Capital I, Series 2008-T29, Class A4, 6.455%, 1/11/2043(c) | | | 1,437,919 | |
See accompanying notes to financial statements.
| 28
Portfolio of Investments – as of September 30, 2012
Loomis Sayles Core Plus Bond Fund – (continued)
| | | | | | | | |
Principal
Amount (‡) | | | Description | | Value (†) | |
| | | | Commercial Mortgage-Backed Securities — continued | | | | |
| $ | 1,000,000 | | | Wachovia Bank Commercial Mortgage Trust, Series 2006-C28, Class A4,
5.572%, 10/15/2048 | | $ | 1,149,411 | |
| | 2,070,000 | | | Wachovia Bank Commercial Mortgage Trust, Series 2006-C29, Class A4, 5.308%, 11/15/2048 | | | 2,393,758 | |
| | 10,770,000 | | | Wachovia Bank Commercial Mortgage Trust, Series 2007-C30, Class A5, 5.342%, 12/15/2043 | | | 12,190,617 | |
| | | | | | | | |
| | | | | | | 66,890,528 | |
| | | | | | | | |
| | | | Construction Machinery — 0.1% | | | | |
| | 1,580,000 | | | Urbi Desarrollos Urbanos SAB de CV, 9.750%, 2/03/2022, 144A | | | 1,390,400 | |
| | | | | | | | |
| | | | Consumer Cyclical Services — 0.0% | | | | |
| | 360,000 | | | Service Corp. International, 7.000%, 5/15/2019 | | | 397,800 | |
| | | | | | | | |
| | | | Consumer Products — 0.4% | | | | |
| | 1,546,000 | | | Whirlpool Corp., 6.500%, 6/15/2016 | | | 1,747,855 | |
| | 3,185,000 | | | Whirlpool Corp., MTN, 4.850%, 6/15/2021 | | | 3,380,406 | |
| | | | | | | | |
| | | | | | | 5,128,261 | |
| | | | | | | | |
| | | | Distributors — 0.3% | | | | |
| | 3,300,000 | | | China Resources Gas Group Ltd., 4.500%, 4/05/2022, 144A | | | 3,578,388 | |
| | | | | | | | |
| | | | Diversified Manufacturing — 0.7% | | | | |
| | 1,200,000 | | | Crane Co., 6.550%, 11/15/2036 | | | 1,296,977 | |
| | 1,420,000 | | | Fibria Overseas Finance Ltd., 6.750%, 3/03/2021, 144A | | | 1,515,850 | |
| | 6,045,000 | | | Votorantim Cimentos S.A., 7.250%, 4/05/2041, 144A | | | 6,513,487 | |
| | | | | | | | |
| | | | | | | 9,326,314 | |
| | | | | | | | |
| | | | Electric — 1.2% | | | | |
| | 215,000 | | | Dubai Electricity & Water Authority, 6.375%, 10/21/2016, 144A | | | 234,672 | |
| | 2,905,000 | | | Dubai Electricity & Water Authority, 8.500%, 4/22/2015, 144A | | | 3,268,125 | |
| | 2,325,000 | | | Enersis S.A., 7.375%, 1/15/2014 | | | 2,479,689 | |
| | 4,270,000 | | | Florida Power & Light Co., 4.125%, 2/01/2042 | | | 4,644,488 | |
| | 1,010,000 | | | Ipalco Enterprises, Inc., 5.000%, 5/01/2018 | | | 1,057,975 | |
| | 4,500,000 | | | TransAlta Corp., 4.750%, 1/15/2015 | | | 4,742,181 | |
| | | | | | | | |
| | | | | | | 16,427,130 | |
| | | | | | | | |
| | | | Food & Beverage — 0.4% | | | | |
| | 1,445,000 | | | Bunge Ltd. Finance Corp., 4.100%, 3/15/2016 | | | 1,548,559 | |
| | 1,940,000 | | | Post Holdings, Inc., 7.375%, 2/15/2022, 144A | | | 2,061,250 | |
| | 2,055,000 | | | Sigma Alimentos S.A. de CV, 5.625%, 4/14/2018, 144A | | | 2,273,857 | |
| | | | | | | | |
| | | | | | | 5,883,666 | |
| | | | | | | | |
| | | | Government Owned — No Guarantee — 5.1% | | | | |
| | 6,745,000 | | | CEZ A.S., 5.625%, 4/03/2042, 144A | | | 7,512,986 | |
| | 2,725,000 | | | CNPC General Capital Ltd., 3.950%, 4/19/2022, 144A | | | 2,906,479 | |
| | 1,600,000 | | | Federal Home Loan Mortgage Corp., 6.250%, 7/15/2032 | | | 2,414,928 | |
| | 15,980,000 | | | Federal National Mortgage Association, 6.625%, 11/15/2030 | | | 24,521,470 | |
| | 4,370,000 | | | IPIC GMTN Ltd., 6.875%, 11/01/2041, 144A | | | 5,823,025 | |
| | 6,310,000 | | | Korea Development Bank, 4.000%, 9/09/2016 | | | 6,856,850 | |
| | 7,855,000 | | | Korea National Oil Corp., 3.125%, 4/03/2017, 144A | | | 8,253,562 | |
| | 5,145,000 | | | Petrobras International Finance Co., 6.750%, 1/27/2041 | | | 6,385,686 | |
See accompanying notes to financial statements.
29 |
Portfolio of Investments – as of September 30, 2012
Loomis Sayles Core Plus Bond Fund – (continued)
| | | | | | | | |
Principal
Amount (‡) | | | Description | | Value (†) | |
| | | | Government Owned — No Guarantee — continued | | | | |
| $ | 2,390,000 | | | Qtel International Finance Ltd., 4.750%, 2/16/2021, 144A | | $ | 2,650,510 | |
| | 2,965,000 | | | Qtel International Finance Ltd., 7.875%, 6/10/2019, 144A | | | 3,824,850 | |
| | | | | | | | |
| | | | | | | 71,150,346 | |
| | | | | | | | |
| | | | Healthcare — 1.0% | | | | |
| | 8,190,000 | | | HCA, Inc., 7.500%, 2/15/2022 | | | 9,275,175 | |
| | 575,000 | | | HCA, Inc., 7.500%, 12/15/2023 | | | 580,750 | |
| | 3,200,000 | | | PerkinElmer, Inc., 5.000%, 11/15/2021 | | | 3,561,389 | |
| | | | | | | | |
| | | | | | | 13,417,314 | |
| | | | | | | | |
| | | | Home Construction — 0.2% | | | | |
| | 3,350,000 | | | Desarrolladora Homex SAB de CV, 9.750%, 3/25/2020, 144A | | | 3,417,000 | |
| | | | | | | | |
| | | | Hybrid ARMs — 0.0% | | | | |
| | 260,756 | | | FHLMC, 6.050%, 11/01/2036(c) | | | 280,498 | |
| | 174,065 | | | FNMA, 2.261%, 2/01/2037(c) | | | 185,020 | |
| | | | | | | | |
| | | | | | | 465,518 | |
| | | | | | | | |
| | | | Independent Energy — 1.9% | | | | |
| | 1,560,000 | | | Anadarko Petroleum Corp., 5.950%, 9/15/2016 | | | 1,807,569 | |
| | 5,200,000 | | | Anadarko Petroleum Corp., 6.375%, 9/15/2017 | | | 6,269,214 | |
| | 2,806,000 | | | Denbury Resources, Inc., 6.375%, 8/15/2021 | | | 3,044,510 | |
| | 3,350,000 | | | Dolphin Energy Ltd., 5.500%, 12/15/2021, 144A | | | 3,874,275 | |
| | 4,080,000 | | | Newfield Exploration Co., 5.750%, 1/30/2022 | | | 4,559,400 | |
| | 3,785,000 | | | QEP Resources, Inc., 5.250%, 5/01/2023 | | | 3,870,162 | |
| | 1,670,000 | | | Range Resources Corp., 5.000%, 8/15/2022 | | | 1,761,850 | |
| | 1,295,000 | | | SM Energy Co., 6.500%, 1/01/2023, 144A | | | 1,359,750 | |
| | | | | | | | |
| | | | | | | 26,546,730 | |
| | | | | | | | |
| | | | Industrial Other — 0.9% | | | | |
| | 1,360,000 | | | Briggs & Stratton Corp., 6.875%, 12/15/2020 | | | 1,482,400 | |
| | 5,905,000 | | | Hutchison Whampoa International 11 Ltd., 4.625%, 1/13/2022, 144A | | | 6,457,968 | |
| | 2,650,000 | | | Hutchison Whampoa International Ltd., 5.750%, 9/11/2019, 144A | | | 3,133,066 | |
| | 1,570,000 | | | Timken Co. (The), 6.000%, 9/15/2014 | | | 1,692,948 | |
| | | | | | | | |
| | | | | | | 12,766,382 | |
| | | | | | | | |
| | | | Media Cable — 1.3% | | | | |
| | 2,585,000 | | | Cablevision Systems Corp., 7.750%, 4/15/2018 | | | 2,862,888 | |
| | 3,040,000 | | | Cablevision Systems Corp., 8.000%, 4/15/2020 | | | 3,389,600 | |
| | 1,560,000 | | | Cox Communications, Inc., 5.450%, 12/15/2014 | | | 1,715,694 | |
| | 7,400,000 | | | Time Warner Cable, Inc., 4.125%, 2/15/2021 | | | 8,180,715 | |
| | 1,330,000 | | | Time Warner Cable, Inc., 8.250%, 4/01/2019 | | | 1,785,155 | |
| | | | | | | | |
| | | | | | | 17,934,052 | |
| | | | | | | | |
| | | | Media Non-Cable — 0.6% | | | | |
| | 1,375,000 | | | Inmarsat Finance PLC, 7.375%, 12/01/2017, 144A | | | 1,485,000 | |
| | 2,185,000 | | | Myriad International Holding BV, 6.375%, 7/28/2017, 144A | | | 2,474,513 | |
| | 4,165,000 | | | R.R. Donnelley & Sons Co., 7.250%, 5/15/2018 | | | 4,133,762 | |
| | | | | | | | |
| | | | | | | 8,093,275 | |
| | | | | | | | |
See accompanying notes to financial statements.
| 30
Portfolio of Investments – as of September 30, 2012
Loomis Sayles Core Plus Bond Fund – (continued)
| | | | | | | | |
Principal
Amount (‡) | | | Description | | Value (†) | |
| | | | Metals & Mining — 0.9% | | | | |
| $ | 890,000 | | | Alcoa, Inc., 5.400%, 4/15/2021 | | $ | 934,194 | |
| | 2,490,000 | | | Alcoa, Inc., 6.150%, 8/15/2020 | | | 2,747,882 | |
| | 525,000 | | | APERAM, 7.375%, 4/01/2016, 144A | | | 448,045 | |
| | 5,850,000 | | | ArcelorMittal, 7.000%, 3/01/2041 | | | 5,259,132 | |
| | 485,000 | | | ArcelorMittal, 7.250%, 10/15/2039 | | | 443,674 | |
| | 400,000 | | | United States Steel Corp., 6.650%, 6/01/2037 | | | 336,000 | |
| | 2,080,000 | | | United States Steel Corp., 7.375%, 4/01/2020 | | | 2,069,600 | |
| | | | | | | | |
| | | | | | | 12,238,527 | |
| | | | | | | | |
| | | | Mortgage Related — 16.1% | | | | |
| | 21,234,062 | | | FHLMC, 4.000%, with various maturities in 2041(d) | | | 22,861,616 | |
| | 10,951,300 | | | FHLMC, 4.500%, with various maturities from 2034 to 2039(d) | | | 11,782,175 | |
| | 3,508,825 | | | FHLMC, 5.000%, with various maturities from 2035 to 2038(d) | | | 3,806,703 | |
| | 8,529,112 | | | FHLMC, 5.500%, with various maturities from 2018 to 2040(d) | | | 9,300,174 | |
| | 60,688 | | | FHLMC, 6.000%, 6/01/2035 | | | 68,004 | |
| | 39,787,960 | | | FNMA, 3.000%, with various maturities from 2027 to 2042(d) | | | 42,064,298 | |
| | 37,359,007 | | | FNMA, 3.500%, with various maturities in 2042(d) | | | 40,109,814 | |
| | 26,730,886 | | | FNMA, 4.000%, with various maturities from 2019 to 2041(d) | | | 28,895,932 | |
| | 15,539,079 | | | FNMA, 4.500%, with various maturities from 2039 to 2041(d) | | | 16,910,839 | |
| | 13,881,407 | | | FNMA, 5.000%, with various maturities from 2033 to 2037(d) | | | 15,255,221 | |
| | 5,701,788 | | | FNMA, 5.500%, with various maturities from 2036 to 2038(d) | | | 6,265,925 | |
| | 2,661,169 | | | FNMA, 6.000%, with various maturities from 2016 to 2039(d) | | | 2,981,049 | |
| | 114,682 | | | FNMA, 6.500%, with various maturities from 2029 to 2036(d) | | | 133,001 | |
| | 98,592 | | | FNMA, 7.000%, with various maturities in 2030(d) | | | 118,343 | |
| | 106,919 | | | FNMA, 7.500%, with various maturities from 2024 to 2032(d) | | | 130,782 | |
| | 18,550,000 | | | FNMA (TBA), 3.500%, 10/01/2042(e) | | | 19,894,875 | |
| | 1,965,068 | | | GNMA, 5.500%, with various maturities from 2038 to 2039(d) | | | 2,186,456 | |
| | 330,538 | | | GNMA, 6.000%, with various maturities from 2029 to 2038(d) | | | 374,250 | |
| | 238,056 | | | GNMA, 6.500%, with various maturities from 2028 to 2032(d) | | | 283,311 | |
| | 159,557 | | | GNMA, 7.000%, with various maturities from 2025 to 2029(d) | | | 189,319 | |
| | 54,206 | | | GNMA, 7.500%, with various maturities from 2025 to 2030(d) | | | 63,983 | |
| | 19,394 | | | GNMA, 8.000%, 11/15/2029 | | | 20,539 | |
| | 63,650 | | | GNMA, 8.500%, with various maturities from 2017 to 2023(d) | | | 64,969 | |
| | 5,726 | | | GNMA, 9.000%, with various maturities in 2016(d) | | | 5,812 | |
| | 12,127 | | | GNMA, 11.500%, with various maturities from 2013 to 2015(d) | | | 12,203 | |
| | | | | | | | |
| | | | | | | 223,779,593 | |
| | | | | | | | |
| | | | Non-Captive Consumer — 1.3% | | | | |
| | 325,000 | | | SLM Corp., MTN, 5.050%, 11/14/2014 | | | 343,041 | |
| | 1,100,000 | | | SLM Corp., MTN, 6.000%, 1/25/2017 | | | 1,197,625 | |
| | 13,715,000 | | | SLM Corp., MTN, 6.250%, 1/25/2016 | | | 14,880,775 | |
| | 350,000 | | | SLM Corp., Series A, MTN, 5.000%, 10/01/2013 | | | 362,687 | |
| | 30,000 | | | SLM Corp., Series A, MTN, 5.000%, 4/15/2015 | | | 31,689 | |
| | 120,000 | | | SLM Corp., Series A, MTN, 5.000%, 6/15/2018 | | | 120,188 | |
| | 55,000 | | | SLM Corp., Series A, MTN, 5.375%, 1/15/2013 | | | 55,697 | |
| | 35,000 | | | SLM Corp., Series A, MTN, 5.375%, 5/15/2014 | | | 36,865 | |
| | 1,135,000 | | | SLM Corp., Series A, MTN, 8.450%, 6/15/2018 | | | 1,329,331 | |
| | | | | | | | |
| | | | | | | 18,357,898 | |
| | | | | | | | |
See accompanying notes to financial statements.
31 |
Portfolio of Investments – as of September 30, 2012
Loomis Sayles Core Plus Bond Fund – (continued)
| | | | | | | | |
Principal
Amount (‡) | | | Description | | Value (†) | |
| | | | Non-Captive Diversified — 5.0% | | | | |
| $ | 5,525,000 | | | Ally Financial, Inc., 5.500%, 2/15/2017 | | $ | 5,775,189 | |
| | 7,800,000 | | | Ally Financial, Inc., 6.250%, 12/01/2017 | | | 8,436,363 | |
| | 1,211,000 | | | Ally Financial, Inc., 8.000%, 11/01/2031 | | | 1,412,026 | |
| | 2,480,000 | | | Ally Financial, Inc., 8.300%, 2/12/2015 | | | 2,746,600 | |
| | 9,530,000 | | | CIT Group, Inc., 5.000%, 5/15/2017 | | | 10,173,275 | |
| | 3,795,000 | | | CIT Group, Inc., 5.375%, 5/15/2020 | | | 4,108,087 | |
| | 2,070,000 | | | GATX Corp., 4.750%, 5/15/2015 | | | 2,216,678 | |
| | 7,810,000 | | | General Electric Capital Corp., 2.250%, 11/09/2015 | | | 8,088,286 | |
| | 6,005,000 | | | General Electric Capital Corp., 5.300%, 2/11/2021 | | | 6,891,140 | |
| | 1,035,000 | | | General Electric Capital Corp., 5.625%, 5/01/2018 | | | 1,220,576 | |
| | 4,265,000 | | | General Electric Capital Corp., MTN, 2.300%, 4/27/2017 | | | 4,384,164 | |
| | 7,835,000 | | | International Lease Finance Corp., 5.750%, 5/15/2016 | | | 8,306,996 | |
| | 3,805,000 | | | International Lease Finance Corp., 6.250%, 5/15/2019 | | | 4,090,375 | |
| | 205,000 | | | International Lease Finance Corp., 6.375%, 3/25/2013 | | | 209,100 | |
| | 200,000 | | | International Lease Finance Corp., Series R, MTN, 5.625%, 9/20/2013 | | | 206,250 | |
| | 830,000 | | | International Lease Finance Corp., Series R, MTN, 5.650%, 6/01/2014 | | | 869,508 | |
| | | | | | | | |
| | | | | | | 69,134,613 | |
| | | | | | | | |
| | | | Oil Field Services — 2.6% | | | | |
| | 2,400,000 | | | FMC Technologies, Inc., 3.450%, 10/01/2022 | | | 2,436,422 | |
| | 6,205,000 | | | Nabors Industries, Inc., 4.625%, 9/15/2021 | | | 6,669,649 | |
| | 6,485,000 | | | Pan American Energy LLC, 7.875%, 5/07/2021, 144A | | | 5,933,775 | |
| | 6,400,000 | | | Parker Drilling Co., 9.125%, 4/01/2018 | | | 6,896,000 | |
| | 3,340,000 | | | Rowan Cos., Inc., 5.000%, 9/01/2017 | | | 3,684,244 | |
| | 8,675,000 | | | Transocean, Inc., 6.500%, 11/15/2020 | | | 10,359,512 | |
| | | | | | | | |
| | | | | | | 35,979,602 | |
| | | | | | | | |
| | | | Paper — 1.4% | | | | |
| | 1,785,000 | | | Celulosa Arauco y Constitucion S.A., 4.750%, 1/11/2022 | | | 1,863,929 | |
| | 2,415,000 | | | Celulosa Arauco y Constitucion S.A., 5.000%, 1/21/2021 | | | 2,549,585 | |
| | 1,111,000 | | | Georgia-Pacific LLC, 7.250%, 6/01/2028 | | | 1,405,912 | |
| | 2,005,000 | | | Georgia-Pacific LLC, 7.375%, 12/01/2025 | | | 2,653,806 | |
| | 5,730,000 | | | Georgia-Pacific LLC, 7.750%, 11/15/2029 | | | 7,570,373 | |
| | 735,000 | | | Georgia-Pacific LLC, 8.000%, 1/15/2024 | | | 1,003,274 | |
| | 365,000 | | | Georgia-Pacific LLC, 8.875%, 5/15/2031 | | | 539,893 | |
| | 2,495,000 | | | Rock-Tenn Co., 4.000%, 3/01/2023, 144A | | | 2,535,317 | |
| | | | | | | | |
| | | | | | | 20,122,089 | |
| | | | | | | | |
| | | | Pharmaceuticals — 1.0% | | | | |
| | 1,845,000 | | | Valeant Pharmaceuticals International, 6.375%, 10/15/2020, 144A | | | 1,881,900 | |
| | 130,000 | | | Valeant Pharmaceuticals International, 6.750%, 8/15/2021, 144A | | | 134,875 | |
| | 4,130,000 | | | Valeant Pharmaceuticals International, 6.875%, 12/01/2018, 144A | | | 4,346,825 | |
| | 7,060,000 | | | VPI Escrow Corp., 6.375%, 10/15/2020, 144A | | | 7,201,200 | |
| | | | | | | | |
| | | | | | | 13,564,800 | |
| | | | | | | | |
| | | | Pipelines — 2.0% | | | | |
| | 9,055,000 | | | Energy Transfer Partners LP, 6.050%, 6/01/2041 | | | 9,983,771 | |
| | 825,000 | | | Energy Transfer Partners LP, 6.500%, 2/01/2042 | | | 951,992 | |
| | 2,050,000 | | | Kinder Morgan Finance Co. LLC, 5.700%, 1/05/2016 | | | 2,212,944 | |
See accompanying notes to financial statements.
| 32
Portfolio of Investments – as of September 30, 2012
Loomis Sayles Core Plus Bond Fund – (continued)
| | | | | | | | |
Principal
Amount (‡) | | | Description | | Value (†) | |
| | | | Pipelines — continued | | | | |
| $ | 7,455,000 | | | Kinder Morgan Finance Co. LLC, 6.000%, 1/15/2018, 144A | | $ | 8,079,953 | |
| | 6,725,000 | | | Rockies Express Pipeline LLC, 3.900%, 4/15/2015, 144A | | | 6,624,125 | |
| | | | | | | | |
| | | | | | | 27,852,785 | |
| | | | | | | | |
| | | | Property & Casualty Insurance — 0.6% | | | | |
| | 1,175,000 | | | Willis Group Holdings PLC, 4.125%, 3/15/2016 | | | 1,247,245 | |
| | 3,250,000 | | | Willis North America, Inc., 6.200%, 3/28/2017 | | | 3,703,674 | |
| | 3,170,000 | | | Willis North America, Inc., 7.000%, 9/29/2019 | | | 3,768,851 | |
| | | | | | | | |
| | | | | | | 8,719,770 | |
| | | | | | | | |
| | | | Refining — 0.2% | | | | |
| | 2,600,000 | | | Phillips 66, 5.875%, 5/01/2042, 144A | | | 3,087,188 | |
| | | | | | | | |
| | | | Retailers — 1.2% | | | | |
| | 2,610,000 | | | Dollar General Corp., 4.125%, 7/15/2017 | | | 2,727,450 | |
| | 12,055,000 | | | Lotte Shopping Co. Ltd., 3.375%, 5/09/2017, 144A | | | 12,560,707 | |
| | 1,125,000 | | | Wolverine World Wide, Inc., 6.125%, 10/15/2020, 144A | | | 1,158,750 | |
| | | | | | | | |
| | | | | | | 16,446,907 | |
| | | | | | | | |
| | | | Sovereigns — 0.6% | | | | |
| | 6,438,000 | | | Mexico Government International Bond, Series A, MTN, 6.050%, 1/11/2040 | | | 8,578,635 | |
| | | | | | | | |
| | | | Supermarket — 0.5% | | | | |
| | 7,370,000 | | | Delhaize Group S.A., 4.125%, 4/10/2019 | | | 7,119,472 | |
| | | | | | | | |
| | | | Supranational — 0.6% | | | | |
| | 18,970,000 | | | Inter-American Development Bank, EMTN, 8.000%, 1/26/2016, (MXN) | | | 1,650,770 | |
| | 87,705,000 | | | International Bank for Reconstruction & Development, 6.500%, 9/11/2013, (MXN) | | | 6,990,916 | |
| | | | | | | | |
| | | | | | | 8,641,686 | |
| | | | | | | | |
| | | | Technology — 2.2% | | | | |
| | 250,000 | | | Amphenol Corp., 4.000%, 2/01/2022 | | | 263,891 | |
| | 3,745,000 | | | Amphenol Corp., 4.750%, 11/15/2014 | | | 4,018,730 | |
| | 2,635,000 | | | Brocade Communications Systems, Inc., 6.625%, 1/15/2018 | | | 2,733,812 | |
| | 1,160,000 | | | Brocade Communications Systems, Inc., 6.875%, 1/15/2020 | | | 1,252,800 | |
| | 3,156,000 | | | Equifax, Inc., 7.000%, 7/01/2037 | | | 3,917,862 | |
| | 4,140,000 | | | Fiserv, Inc., 3.125%, 10/01/2015 | | | 4,316,708 | |
| | 5,635,000 | | | Fiserv, Inc., 3.500%, 10/01/2022 | | | 5,654,987 | |
| | 69,000 | | | Motorola Solutions, Inc., 6.625%, 11/15/2037 | | | 73,935 | |
| | 340,000 | | | Motorola Solutions, Inc., 7.500%, 5/15/2025 | | | 423,637 | |
| | 1,335,000 | | | National Semiconductor Corp., 3.950%, 4/15/2015 | | | 1,448,750 | |
| | 6,180,000 | | | Tencent Holdings Ltd., 4.625%, 12/12/2016, 144A | | | 6,582,083 | |
| | | | | | | | |
| | | | | | | 30,687,195 | |
| | | | | | | | |
| | | | Tobacco — 0.7% | | | | |
| | 7,605,000 | | | Reynolds American, Inc., 7.250%, 6/15/2037 | | | 9,613,762 | |
| | | | | | | | |
| | | | Transportation Services — 0.4% | | | | |
| | 3,285,000 | | | Continental Airlines Pass Thru Certificates, Series 2012-2, Class A,
4.000%, 4/29/2026 | | | 3,371,231 | |
See accompanying notes to financial statements.
33 |
Portfolio of Investments – as of September 30, 2012
Loomis Sayles Core Plus Bond Fund – (continued)
| | | | | | | | |
Principal
Amount (‡) | | | Description | | Value (†) | |
| | | | Transportation Services — continued | | | | |
| $ | 1,990,000 | | | Erac USA Finance Co., 5.250%, 10/01/2020, 144A | | $ | 2,262,672 | |
| | | | | | | | |
| | | | | | | 5,633,903 | |
| | | | | | | | |
| | | | Treasuries — 18.2% | | | | |
| | 2,202,500(††) | | | Mexican Fixed Rate Bonds, Series M, 6.250%, 6/16/2016, (MXN) | | | 17,906,748 | |
| | 1,783,000(††) | | | Mexican Fixed Rate Bonds, Series M-10, 7.750%, 12/14/2017, (MXN)(b) | | | 15,588,588 | |
| | 11,940,000 | | | Spain Government Bond, 5.500%, 4/30/2021, (EUR) | | | 14,906,511 | |
| | 10,225,000 | | | Spain Government Bond, 5.850%, 1/31/2022, (EUR) | | | 13,023,479 | |
| | 13,400,000 | | | U.S. Treasury Bond, 2.750%, 8/15/2042 | | | 13,178,069 | |
| | 26,440,000 | | | U.S. Treasury Bond, 3.000%, 5/15/2042 | | | 27,414,975 | |
| | 2,910,000 | | | U.S. Treasury Bond, 3.125%, 2/15/2042 | | | 3,095,513 | |
| | 21,435,000 | | | U.S. Treasury Bond, 3.750%, 8/15/2041 | | | 25,628,222 | |
| | 3,875,000 | | | U.S. Treasury Bond, 3.875%, 8/15/2040 | | | 4,734,161 | |
| | 1,655,000 | | | U.S. Treasury Note, 0.625%, 5/31/2017 | | | 1,659,138 | |
| | 2,445,000 | | | U.S. Treasury Note, 0.625%, 8/31/2017 | | | 2,446,528 | |
| | 980,000 | | | U.S. Treasury Note, 0.750%, 6/30/2017 | | | 987,426 | |
| | 33,122,000 | | | U.S. Treasury Note, 0.875%, 2/28/2017 | | | 33,631,781 | |
| | 8,825,000 | | | U.S. Treasury Note, 1.250%, 2/15/2014 | | | 8,949,097 | |
| | 19,335,000 | | | U.S. Treasury Note, 1.250%, 4/30/2019 | | | 19,697,531 | |
| | 3,585,000 | | | U.S. Treasury Note, 1.875%, 8/31/2017 | | | 3,805,420 | |
| | 1,320,000 | | | U.S. Treasury Note, 2.000%, 2/15/2022 | | | 1,372,903 | |
| | 1,155,000 | | | U.S. Treasury Note, 2.125%, 8/15/2021 | | | 1,221,773 | |
| | 13,550,000 | | | U.S. Treasury Note, 2.625%, 11/15/2020(b) | | | 14,960,040 | |
| | 560,000 | | | U.S. Treasury Note, 2.750%, 10/31/2013 | | | 575,378 | |
| | 13,005,000 | | | U.S. Treasury Note, 3.125%, 5/15/2021 | | | 14,866,341 | |
| | 11,505,000 | | | U.S. Treasury Note, 3.625%, 2/15/2021(b) | | | 13,619,941 | |
| | | | | | | | |
| | | | | | | 253,269,563 | |
| | | | | | | | |
| | | | Wireless — 1.9% | | | | |
| | 1,915,000 | | | American Tower Corp., 4.625%, 4/01/2015 | | | 2,063,033 | |
| | 2,890,000 | | | CC Holdings GS V LLC/Crown Castle GS III Corp., 7.750%, 5/01/2017, 144A | | | 3,085,075 | |
| | 15,000 | | | Nextel Communications, Inc., Series C, 5.950%, 3/15/2014 | | | 15,038 | |
| | 5,000 | | | Nextel Communications, Inc., Series D, 7.375%, 8/01/2015 | | | 5,019 | |
| | 895,000 | | | NII Capital Corp., 7.625%, 4/01/2021 | | | 711,525 | |
| | 3,165,000 | | | SK Telecom Co. Ltd., 6.625%, 7/20/2027, 144A | | | 3,910,177 | |
| | 12,400,000 | | | Sprint Capital Corp., 6.875%, 11/15/2028 | | | 11,408,000 | |
| | 5,004,000 | | | Telemar Norte Leste S.A., 5.500%, 10/23/2020, 144A | | | 5,254,200 | |
| | | | | | | | |
| | | | | | | 26,452,067 | |
| | | | | | | | |
| | | | Wirelines — 3.9% | | | | |
| | 505,000 | | | Axtel SAB de CV, 7.625%, 2/01/2017, 144A | | | 313,100 | |
| | 12,270,000 | | | Axtel SAB de CV, 9.000%, 9/22/2019, 144A | | | 7,607,400 | |
| | 4,605,000 | | | Colombia Telecomunicaciones S.A., E.S.P., 5.375%, 9/27/2022, 144A | | | 4,674,075 | |
| | 6,225,000 | | | eAccess Ltd., 8.250%, 4/01/2018, 144A | | | 5,664,750 | |
| | 9,363,000 | | | Embarq Corp., 7.995%, 6/01/2036 | | | 10,530,023 | |
| | 2,978,000 | | | Frontier Communications Corp., 7.875%, 4/15/2015 | | | 3,335,360 | |
| | 1,575,000 | | | Frontier Communications Corp., 7.875%, 1/15/2027 | | | 1,547,437 | |
| | 3,300,000 | | | Frontier Communications Corp., 8.250%, 4/15/2017 | | | 3,745,500 | |
| | 1,335,000 | | | Frontier Communications Corp., 8.500%, 4/15/2020 | | | 1,508,550 | |
See accompanying notes to financial statements.
| 34
Portfolio of Investments – as of September 30, 2012
Loomis Sayles Core Plus Bond Fund – (continued)
| | | | | | | | |
Principal
Amount (‡) | | | Description | | Value (†) | |
| | | | Wirelines — continued | | | | |
| $ | 415,000 | | | Frontier Communications Corp., 9.000%, 8/15/2031 | | $ | 443,013 | |
| | 1,975,000 | | | Qwest Corp., 6.750%, 12/01/2021 | | | 2,373,405 | |
| | 3,145,000 | | | Telefonica Emisiones SAU, 3.992%, 2/16/2016 | | | 3,129,275 | |
| | 4,029,000 | | | Telefonica Emisiones SAU, 5.134%, 4/27/2020 | | | 3,953,456 | |
| | 171,000 | | | Telefonica Emisiones SAU, 5.462%, 2/16/2021 | | | 167,580 | |
| | 5,030,000 | | | Windstream Corp., 7.500%, 4/01/2023 | | | 5,256,350 | |
| | | | | | | | |
| | | | | | | 54,249,274 | |
| | | | | | | | |
| | | | Total Bonds and Notes
(Identified Cost $1,259,357,331) | | | 1,325,141,882 | |
| | | | | | | | |
| | | | | | | | |
| | Senior Loans — 0.8% | | | | |
| | | | Healthcare — 0.1% | | | | |
| | 1,271,250 | | | Hologic, Inc., Term Loan B, 4.500%, 8/01/2019(c) | | | 1,286,086 | |
| | | | | | | | |
| | | | Independent Energy — 0.2% | | | | |
| | 2,204,000 | | | Chesapeake Energy Corporation, Unsecured Term Loan,
8.500%, 12/01/2017(c) | | | 2,209,620 | |
| | | | | | | | |
| | | | Wirelines — 0.5% | | | | |
| | 7,110,000 | | | Level 3 Financing, Inc., Term Loan, 8/01/2019(f) | | | 7,110,000 | |
| | | | | | | | |
| | | | Total Senior Loans
(Identified Cost $10,510,843) | | | 10,605,706 | |
| | | | | | | | |
| | | | | | | | |
| Shares | | | | | | |
| | Preferred Stocks — 0.2% | | | | |
| | | | Non-Captive Consumer — 0.0% | | | | |
| | 5,510 | | | SLM Corp., Series A, 6.970% | | | 263,764 | |
| | | | | | | | |
| | | | Non-Captive Diversified — 0.2% | | | | |
| | 68,182 | | | Ally Financial, Inc., Series A, (fixed rate to 5/15/2016, variable rate thereafter), 8.500% | | | 1,667,732 | |
| | 532 | | | Ally Financial, Inc., Series G, 7.000%, 144A | | | 497,669 | |
| | | | | | | | |
| | | | | | | 2,165,401 | |
| | | | | | | | |
| | | | Total Preferred Stocks
(Identified Cost $2,068,801) | | | 2,429,165 | |
| | | | | | | | |
| | | | | | | | |
See accompanying notes to financial statements.
35 |
Portfolio of Investments – as of September 30, 2012
Loomis Sayles Core Plus Bond Fund – (continued)
| | | | | | | | |
Principal
Amount (‡) | | | Description | | Value (†) | |
| | Short-Term Investments — 5.6% | | | | |
| $ | 78,821,191 | | | Tri-Party Repurchase Agreement with Fixed Income Clearing Corporation, dated 9/28/2012 at 0.010% to be repurchased at $78,821,257 on 10/01/2012 collateralized by $72,110,000 U.S. Treasury Note, 4.125% due 5/15/2015 valued at $80,397,747 including accrued interest (Note 2 of Notes to Financial Statements)
(Identified Cost $78,821,191) | | $ | 78,821,191 | |
| | | | | | | | |
| | | | | | | | |
| | | | Total Investments — 101.8%
(Identified Cost $1,350,758,166)(a) | | | 1,416,997,944 | |
| | | | Other assets less liabilities — (1.8)% | | | (24,495,812 | ) |
| | | | | | | | |
| | | | Net Assets — 100.0% | | $ | 1,392,502,132 | |
| | | | | | | | |
| | | | | | | | |
| | (‡) | | | Principal Amount stated in U.S. dollars unless otherwise noted. | | | | |
| | (†) | | | See Note 2 of Notes to Financial Statements. | | | | |
| | (††) | | | Amount shown represents units. One unit represents a principal amount of 100. | |
| | (a) | | | Federal Tax Information: | | | | |
| | | | At September 30, 2012, the net unrealized appreciation on investments based on a cost of $1,353,273,873 for federal income tax purposes was as follows: | |
| | | | Aggregate gross unrealized appreciation for all investments in which there is an excess of value over tax cost | | $ | 67,840,897 | |
| | | | Aggregate gross unrealized depreciation for all investments in which there is an excess of tax cost over value | | | (4,116,826 | ) |
| | | | | | | | |
| | | | Net unrealized appreciation | | $ | 63,724,071 | |
| | | | | | | | |
| | | | | | | | |
| | (b) | | | All or a portion of this security has been designated to cover the Fund’s obligations under open TBA transactions. | |
| | (c) | | | Variable rate security. Rate as of September 30, 2012 is disclosed. | |
| | (d) | | | The Fund’s investment in mortgage related securities of Federal Home Loan Mortgage Corporation, Federal National Mortgage Association and Government National Mortgage Association are interests in separate pools of mortgages. All separate investments in securities of each issuer which have the same coupon rate have been aggregated for the purpose of presentation in the Portfolio of Investments. | |
| | (e) | | | Delayed delivery. See Note 2 of Notes to Financial Statements. | |
| | (f) | | | Position is unsettled. Contract rate was not determined at September 30, 2012 and does not take effect until settlement date. | |
| | | | | | | | |
| | 144A | | | All or a portion of these securities are exempt from registration under Rule 144A of the Securities Act of 1933. These securities may be resold in transactions exempt from registration, normally to qualified institutional buyers. At September 30, 2012, the value of Rule 144A holdings amounted to $215,056,531 or 15.4% of net assets. | |
| | ABS | | | Asset-Backed Securities | | | | |
| | ARMs | | | Adjustable Rate Mortgages | | | | |
| | EMTN | | | Euro Medium Term Note | | | | |
| | FHLMC | | | Federal Home Loan Mortgage Corp. | | | | |
| | FNMA | | | Federal National Mortgage Association | | | | |
See accompanying notes to financial statements.
| 36
Portfolio of Investments – as of September 30, 2012
Loomis Sayles Core Plus Bond Fund – (continued)
| | | | | | |
| | GMTN | | | Global Medium Term Note | | |
| | GNMA | | | Government National Mortgage Association | | |
| | MTN | | | Medium Term Note | | |
| | TBA | | | To Be Announced | | |
| | | | | | |
| | EUR | | | Euro | | |
| | MXN | | | Mexican Peso | | |
Industry Summary at September 30, 2012 (Unaudited)
| | | | |
Treasuries | | | 18.2 | % |
Mortgage Related | | | 16.1 | |
Banking | | | 5.9 | |
Non-Captive Diversified | | | 5.2 | |
Government Owned — No Guarantee | | | 5.1 | |
Commercial Mortgage-Backed Securities | | | 4.8 | |
Wirelines | | | 4.4 | |
Automotive | | | 3.4 | |
Oil Field Services | | | 2.6 | |
Technology | | | 2.2 | |
Independent Energy | | | 2.1 | |
ABS Car Loan | | | 2.1 | |
Pipelines | | | 2.0 | |
Other Investments, less than 2% each | | | 22.1 | |
Short-Term Investments | | | 5.6 | |
| | | | |
Total Investments | | | 101.8 | |
Other assets less liabilities | | | (1.8 | ) |
| | | | |
Net Assets | | | 100.0 | % |
| | | | |
See accompanying notes to financial statements.
37 |
Portfolio of Investments – as of September 30, 2012
Loomis Sayles High Income Fund
| | | | | | | | |
Principal
Amount (‡) | | | Description | | Value (†) | |
| | Bonds and Notes — 83.2% of Net Assets | | | | |
| | Non-Convertible Bonds — 74.2% | | | | |
| | | | ABS Car Loan — 0.2% | | | | |
| $ | 350,000 | | | DSC Floorplan Master Owner Trust, Series 2011-1, Class B, 8.110%, 3/15/2016, 144A | | $ | 354,484 | |
| | | | | | | | |
| | | | ABS Home Equity — 1.3% | | | | |
| | 200,000 | | | Ameriquest Mortgage Securities, Inc., Series 2005-R11, Class M1, 0.667%, 1/25/2036(b) | | | 159,037 | |
| | 600,000 | | | Ameriquest Mortgage Securities, Inc., Series 2005-R7, Class M2, 0.717%, 9/25/2035(b) | | | 354,318 | |
| | 124,367 | | | Citimortgage Alternative Loan Trust, Series 2006-A3, Class 1A7, 6.000%, 7/25/2036 | | | 94,398 | |
| | 369,992 | | | Countrywide Alternative Loan Trust, Series 2006-J4, Class 1A3, 6.250%, 7/25/2036 | | | 251,306 | |
| | 218,897 | | | Countrywide Home Loan Mortgage Pass Through Trust,
Series 2005-11, Class 4A1, 0.487%, 4/25/2035(b) | | | 158,174 | |
| | 440,374 | | | GMAC Mortgage Corp. Loan Trust, Series 2005-AR4, Class 3A1, 3.586%, 7/19/2035(b) | | | 400,528 | |
| | 92,623 | | | GSR Mortgage Loan Trust, Series 2004-14, Class 3A1, 2.893%, 12/25/2034(b) | | | 79,116 | |
| | 134,335 | | | JP Morgan Alternative Loan Trust, Series 2006-A1, Class 5A1, 5.172%, 3/25/2036(b) | | | 104,345 | |
| | 205,695 | | | Lehman Mortgage Trust, Series 2006-1, Class 3A5, 5.500%, 2/25/2036 | | | 201,456 | |
| | 396,848 | | | MASTR Asset Securitization Trust, Series 2007-1, Class 1A4, 6.500%, 11/25/2037 | | | 362,094 | |
| | 141,781 | | | New York Mortgage Trust, Series 2006-1, Class 2A2, 2.951%, 5/25/2036(b) | | | 117,474 | |
| | 575,000 | | | Park Place Securities, Inc., Series 2005-WCW2, Class M1, 0.717%, 7/25/2035(b) | | | 486,537 | |
| | 137,739 | | | WaMu Mortgage Pass Through Certificates, Series 2007-OA3, Class 2A1A, 0.908%, 4/25/2047(b) | | | 113,354 | |
| | | | | | | | |
| | | | | | | 2,882,137 | |
| | | | | | | | |
| | | | ABS Other — 0.2% | | | | |
| | 402,726 | | | Sierra Receivables Funding Co. LLC, Series 2011-3A, Class C, 9.310%, 7/20/2028, 144A | | | 402,680 | |
| | | | | | | | |
| | | | Aerospace & Defense — 0.3% | | | | |
| | 800,000 | | | Meccanica Holdings USA, Inc., 6.250%, 1/15/2040, 144A | | | 655,555 | |
| | 100,000 | | | Meccanica Holdings USA, Inc., 7.375%, 7/15/2039, 144A | | | 88,493 | |
| | | | | | | | |
| | | | | | | 744,048 | |
| | | | | | | | |
| | | | Airlines — 1.1% | | | | |
| | 2,005,000 | | | Air Canada, 9.250%, 8/01/2015, 144A | | | 2,085,200 | |
| | 30,000 | | | Air Canada, 12.000%, 2/01/2016, 144A | | | 29,325 | |
| | 19,836 | | | Continental Airlines Pass Through Trust, Series 1997-4, Class B, 6.900%, 7/02/2018 | | | 20,630 | |
| | 198,446 | | | Continental Airlines Pass Through Trust, Series 2001-1, Class B, 7.373%, 6/15/2017 | | | 212,595 | |
| | 171,704 | | | Continental Airlines Pass Through Trust, Series 2007-1, Class B, 6.903%, 10/19/2023 | | | 180,279 | |
| | | | | | | | |
| | | | | | | 2,528,029 | |
| | | | | | | | |
See accompanying notes to financial statements.
| 38
Portfolio of Investments – as of September 30, 2012
Loomis Sayles High Income Fund – (continued)
| | | | | | | | |
Principal
Amount (‡) | | | Description | | Value (†) | |
| | | | Automotive — 1.0% | | | | |
| $ | 2,190,000 | | | Goodyear Tire & Rubber Co. (The), 7.000%, 5/15/2022 | | $ | 2,321,400 | |
| | | | | | | | |
| | | | Banking — 2.4% | | | | |
| | 820,000 | | | HBOS PLC, 6.000%, 11/01/2033, 144A | | | 695,893 | |
| | 1,400,000 | | | HBOS PLC, GMTN, 6.750%, 5/21/2018, 144A | | | 1,421,000 | |
| | 900,000 | | | Morgan Stanley, GMTN, 7.625%, 3/03/2016, (AUD) | | | 988,972 | |
| | 1,000,000 | | | Royal Bank of Scotland Group PLC, 4.700%, 7/03/2018 | | | 965,139 | |
| | 65,000 | | | Royal Bank of Scotland Group PLC, 5.250%, 6/29/2049, (EUR) | | | 52,205 | |
| | 740,000 | | | Royal Bank of Scotland Group PLC, 5.500%, 11/29/2049, (EUR) | | | 613,544 | |
| | 200,000 | | | Royal Bank of Scotland PLC (The), EMTN, 6.934%, 4/09/2018, (EUR) | | | 261,531 | |
| | 250,000 | | | Societe Generale, S.A., (fixed rate to 9/04/2019, variable rate thereafter), 9.375%, 9/29/2049, (EUR) | | | 328,491 | |
| | | | | | | | |
| | | | | | | 5,326,775 | |
| | | | | | | | |
| | | | Building Materials — 2.8% | | | | |
| | 50,000 | | | Masco Corp., 6.500%, 8/15/2032 | | | 51,776 | |
| | 360,000 | | | Masco Corp., 7.125%, 3/15/2020 | | | 409,794 | |
| | 345,000 | | | Masco Corp., 7.750%, 8/01/2029 | | | 364,465 | |
| | 845,000 | | | Masonite International Corp., 8.250%, 4/15/2021, 144A | | | 891,475 | |
| | 1,300,000 | | | Ply Gem Industries, Inc., 8.250%, 2/15/2018 | | | 1,356,875 | |
| | 2,955,000 | | | USG Corp., 6.300%, 11/15/2016 | | | 2,984,550 | |
| | 100,000 | | | USG Corp., 8.375%, 10/15/2018, 144A | | | 108,500 | |
| | 75,000 | | | USG Corp., 9.750%, 1/15/2018 | | | 81,000 | |
| | | | | | | | |
| | | | | | | 6,248,435 | |
| | | | | | | | |
| | | | Chemicals — 2.2% | | | | |
| | 1,490,000 | | | Hercules, Inc., 6.500%, 6/30/2029 | | | 1,363,350 | |
| | 850,000 | | | Hexion US Finance Corp./Hexion Nova Scotia Finance ULC, 8.875%, 2/01/2018 | | | 873,375 | |
| | 420,000 | | | JM Huber Corp., 9.875%, 11/01/2019, 144A | | | 471,450 | |
| | 778,754 | | | Reichhold Industries, Inc., 9.000%, 5/08/2017, 144A(c)(d) | | | 607,428 | |
| | 1,600,000 | | | Tronox Finance LLC, 6.375%, 8/15/2020, 144A | | | 1,616,000 | |
| | | | | | | | |
| | | | | | | 4,931,603 | |
| | | | | | | | |
| | | | Collateralized Mortgage Obligations — 1.9% | | | | |
| | 332,867 | | | Adjustable Rate Mortgage Trust, Series 2005-10, Class 5A1, 0.477%, 1/25/2036(b) | | | 250,005 | |
| | 146,982 | | | American Home Mortgage Investment Trust, Series 2004-3, Class 3A, 2.559%, 10/25/2034(b) | | | 123,583 | |
| | 348,752 | | | American Home Mortgage Investment Trust, Series 2005-2, Class 4A1, 2.155%, 9/25/2045(b) | | | 308,931 | |
| | 365,950 | | | American Home Mortgage Investment Trust, Series 2006-1, Class 11A1, 0.357%, 3/25/2046(b) | | | 273,306 | |
| | 73,561 | | | Banc of America Mortgage Securities, Inc., Series 2005-A, Class 2A1, 3.004%, 2/25/2035(b) | | | 70,375 | |
| | 562,764 | | | Countrywide Home Loan Mortgage Pass Through Trust,
Series 2005-11, Class 3A3, 2.836%, 4/25/2035(b) | | | 317,673 | |
| | 526,908 | | | GSAA Home Equity Trust, Series 2006-20, Class 1A1, 0.287%, 12/25/2046(b) | | | 241,713 | |
| | 533,501 | | | Lehman Mortgage Trust, Series 2005-3, Class 1A6, 0.717%, 1/25/2036(b) | | | 351,305 | |
| | 533,644 | | | Lehman XS Trust, Series 2007-10H, Class 1A11, 0.337%, 7/25/2037(b)(e) | | | 289,457 | |
See accompanying notes to financial statements.
39 |
Portfolio of Investments – as of September 30, 2012
Loomis Sayles High Income Fund – (continued)
| | | | | | | | |
Principal
Amount (‡) | | | Description | | Value (†) | |
| | | | Collateralized Mortgage Obligations — continued | | | | |
| $ | 347,083 | | | MASTR Adjustable Rate Mortgages Trust, Series 2005-2, Class 3A1, 2.878%, 3/25/2035(b) | | $ | 260,552 | |
| | 642,226 | | | MASTR Adjustable Rate Mortgages Trust, Series 2007-1, Class I2A1, 0.377%, 1/25/2047(b) | | | 410,533 | |
| | 606,349 | | | Merrill Lynch Alternative Note Asset, Series 2007-F1, Class 2A7, 6.000%, 3/25/2037 | | | 400,793 | |
| | 555,069 | | | Residential Accredit Loans, Inc., Series 2006-QS6, Class 1A16, 6.000%, 6/25/2036 | | | 406,728 | |
| | 462,145 | | | Washington Mutual Alternative Mortgage Pass-Through Certificates,
Series 2006-AR6, Class 2A, 1.108%, 8/25/2046(b) | | | 243,037 | |
| | 582,633 | | | Washington Mutual Alternative Mortgage Pass-Through Certificates,
Series 2007-OC1, Class A1, 0.457%, 1/25/2047(b) | | | 306,290 | |
| | | | | | | | |
| | | | | | | 4,254,281 | |
| | | | | | | | |
| | | | Commercial Mortgage-Backed Securities — 1.2% | | | | |
| | 494,758 | | | GMAC Mortgage Corp. Loan Trust, Series 2005-AR3, Class 2A1, 3.415%, 6/19/2035(b) | | | 492,922 | |
| | 1,690,000 | | | GS Mortgage Securities Corp. II, Series 2007-GG10, Class AM, 5.983%, 8/10/2045(b) | | | 1,574,019 | |
| | 125,000 | | | JPMorgan Chase Commercial Mortgage Securities Corp.,
Series 2007-LDPX, Class AM, 5.464%, 1/15/2049 | | | 127,228 | |
| | 525,000 | | | Morgan Stanley Capital I Trust, Series 2007-HQ12, Class AM, 5.759%, 4/12/2049(b) | | | 510,637 | |
| | | | | | | | |
| | | | | | | 2,704,806 | |
| | | | | | | | |
| | | | Construction Machinery — 0.6% | | | | |
| | 205,000 | | | UR Financing Escrow Corp., 7.625%, 4/15/2022, 144A | | | 224,475 | |
| | 200,000 | | | Urbi Desarrollos Urbanos SAB de CV, 9.500%, 1/21/2020, 144A | | | 176,000 | |
| | 1,100,000 | | | Urbi Desarrollos Urbanos SAB de CV, 9.750%, 2/03/2022, 144A | | | 968,000 | |
| | | | | | | | |
| | | | | | | 1,368,475 | |
| | | | | | | | |
| | | | Consumer Cyclical Services — 0.4% | | | | |
| | 1,035,000 | | | ServiceMaster Co. (The), 7.450%, 8/15/2027 | | | 861,638 | |
| | | | | | | | |
| | | | Consumer Products — 0.9% | | | | |
| | 2,040,000 | | | Visant Corp., 10.000%, 10/01/2017 | | | 2,019,600 | |
| | | | | | | | |
| | | | Diversified Manufacturing — 0.2% | | | | |
| | 400,000 | | | Votorantim Cimentos S.A., 7.250%, 4/05/2041, 144A | | | 431,000 | |
| | | | | | | | |
| | | | Electric — 1.8% | | | | |
| | 18,060 | | | AES Red Oak LLC, Series A, 8.540%, 11/30/2019 | | | 19,279 | |
| | 375,000 | | | Dynegy Holdings, Inc., 7.125%, 5/15/2018(f) | | | 212,813 | |
| | 180,000 | | | Dynegy Holdings, Inc., 7.625%, 10/15/2026(f) | | | 100,800 | |
| | 815,000 | | | Dynegy Holdings, Inc., 7.750%, 6/01/2019(f) | | | 460,475 | |
| | 1,395,000 | | | EDP Finance BV, 4.900%, 10/01/2019, 144A | | | 1,297,350 | |
| | 200,000 | | | EDP Finance BV, 6.000%, 2/02/2018, 144A | | | 199,644 | |
| | 455,000 | | | Energy Future Intermediate Holding Co. LLC/EFIH Finance, Inc., 11.750%, 3/01/2022, 144A | | | 483,437 | |
| | 140,000 | | | NGC Corp. Capital Trust I, Series B, 8.316%, 6/01/2027(d)(f) | | | 18,200 | |
See accompanying notes to financial statements.
| 40
Portfolio of Investments – as of September 30, 2012
Loomis Sayles High Income Fund – (continued)
| | | | | | | | |
Principal
Amount (‡) | | | Description | | Value (†) | |
| | | | Electric — continued | | | | |
| $ | 515,000 | | | Texas Competitive Electric Holdings Co. LLC/TCEH Finance, Inc., 11.500%, 10/01/2020, 144A | | $ | 402,987 | |
| | 1,015,000 | | | TXU Corp., Series Q, 6.500%, 11/15/2024 | | | 603,925 | |
| | 370,000 | | | TXU Corp., Series R, 6.550%, 11/15/2034 | | | 201,650 | |
| | | | | | | | |
| | | | | | | 4,000,560 | |
| | | | | | | | |
| | | | Environmental — 0.1% | | | | |
| | 255,000 | | | ADS Waste Holdings, Inc., 8.250%, 10/01/2020, 144A | | | 260,100 | |
| | | | | | | | |
| | | | Food & Beverage — 0.6% | | | | |
| | 1,020,000 | | | Del Monte Corp., 7.625%, 2/15/2019 | | | 1,049,325 | |
| | 400,000 | | | Marfrig Overseas Ltd., 9.500%, 5/04/2020, 144A | | | 330,600 | |
| | | | | | | | |
| | | | | | | 1,379,925 | |
| | | | | | | | |
| | | | Gaming — 1.6% | | | | |
| | 740,000 | | | MGM Resorts International, 6.750%, 10/01/2020, 144A | | | 740,000 | |
| | 1,360,000 | | | MGM Resorts International, 7.500%, 6/01/2016 | | | 1,455,200 | |
| | 1,250,000 | | | MGM Resorts International, 7.625%, 1/15/2017 | | | 1,325,000 | |
| | | | | | | | |
| | | | | | | 3,520,200 | |
| | | | | | | | |
| | | | Healthcare — 1.9% | | | | |
| | 555,000 | | | DJO Finance LLC/DJO Finance Corp., 9.875%, 4/15/2018, 144A | | | 548,062 | |
| | 165,000 | | | HCA, Inc., 7.050%, 12/01/2027 | | | 155,925 | |
| | 640,000 | | | HCA, Inc., 7.500%, 12/15/2023 | | | 646,400 | |
| | 470,000 | | | HCA, Inc., 7.690%, 6/15/2025 | | | 477,050 | |
| | 480,000 | | | HCA, Inc., 8.360%, 4/15/2024 | | | 502,800 | |
| | 800,000 | | | HCA, Inc., MTN, 7.580%, 9/15/2025 | | | 804,000 | |
| | 515,000 | | | HCA, Inc., MTN, 7.750%, 7/15/2036 | | | 511,138 | |
| | 635,000 | | | Tenet Healthcare Corp., 6.875%, 11/15/2031 | | | 568,325 | |
| | | | | | | | |
| | | | | | | 4,213,700 | |
| | | | | | | | |
| | | | Home Construction — 5.8% | | | | |
| | 845,000 | | | Beazer Homes USA, Inc., 9.125%, 6/15/2018 | | | 853,450 | |
| | 1,132,000 | | | Beazer Homes USA, Inc., 9.125%, 5/15/2019 | | | 1,137,660 | |
| | 600,000 | | | Corp GEO SAB de CV, 8.875%, 3/27/2022, 144A | | | 613,500 | |
| | 975,000 | | | Desarrolladora Homex SAB de CV, 9.750%, 3/25/2020, 144A | | | 994,500 | |
| | 500,000 | | | K. Hovnanian Enterprises, Inc., 9.125%, 11/15/2020, 144A | | | 503,125 | |
| | 305,000 | | | K. Hovnanian Enterprises, Inc., 10.625%, 10/15/2016 | | | 330,734 | |
| | 2,580,000 | | | KB Home, 7.250%, 6/15/2018 | | | 2,779,950 | |
| | 1,850,000 | | | Lennar Corp., 6.950%, 6/01/2018 | | | 2,044,250 | |
| | 3,135,000 | | | Pulte Group, Inc., 6.000%, 2/15/2035 | | | 2,837,175 | |
| | 495,000 | | | Pulte Group, Inc., 6.375%, 5/15/2033 | | | 460,350 | |
| | 380,000 | | | Pulte Group, Inc., 7.875%, 6/15/2032 | | | 395,200 | |
| | 70,000 | | | Standard Pacific Corp., 8.375%, 1/15/2021 | | | 79,888 | |
| | | | | | | | |
| | | | | | | 13,029,782 | |
| | | | | | | | |
| | | | Independent Energy — 3.2% | | | | |
| | 30,000 | | | Chesapeake Energy Corp., 6.625%, 8/15/2020 | | | 30,938 | |
| | 405,000 | | | Chesapeake Energy Corp., 6.875%, 11/15/2020 | | | 427,275 | |
| | 1,365,000 | | | Connacher Oil and Gas Ltd., 8.500%, 8/01/2019, 144A | | | 1,173,900 | |
See accompanying notes to financial statements.
41 |
Portfolio of Investments – as of September 30, 2012
Loomis Sayles High Income Fund – (continued)
| | | | | | | | |
Principal
Amount (‡) | | | Description | | Value (†) | |
| | | | Independent Energy — continued | | | | |
| $ | 685,000 | | | Halcon Resources Corp., 9.750%, 7/15/2020, 144A | | $ | 700,412 | |
| | 3,200,000 | | | OGX Austria GmbH, 8.375%, 4/01/2022, 144A | | | 2,784,000 | |
| | 200,000 | | | OGX Austria GmbH, 8.500%, 6/01/2018, 144A | | | 180,000 | |
| | 810,000 | | | SandRidge Energy, Inc., 7.500%, 3/15/2021 | | | 834,300 | |
| | 200,000 | | | SandRidge Energy, Inc., 7.500%, 2/15/2023, 144A | | | 206,000 | |
| | 675,000 | | | SandRidge Energy, Inc., 8.125%, 10/15/2022, 144A | | | 718,875 | |
| | | | | | | | |
| | | | | | | 7,055,700 | |
| | | | | | | | |
| | | | Life Insurance — 0.5% | | | | |
| | 860,000 | | | American International Group, Inc., (fixed rate to 5/15/2038, variable rate thereafter), 8.175%, 5/15/2068 | | | 1,052,425 | |
| | | | | | | | |
| | | | Lodging — 0.1% | | | | |
| | 180,000 | | | Royal Caribbean Cruises Ltd., 7.500%, 10/15/2027 | | | 190,350 | |
| | | | | | | | |
| | | | Media Non-Cable — 3.3% | | | | |
| | 1,565,000 | | | Clear Channel Communications, Inc., 5.500%, 9/15/2014 | | | 1,408,500 | |
| | 1,000,000 | | | Clear Channel Worldwide Holdings, Inc., 7.625%, 3/15/2020 | | | 975,000 | |
| | 2,905,000 | | | Intelsat Luxembourg S.A., 11.250%, 2/04/2017 | | | 3,072,037 | |
| | 1,100,000 | | | R.R. Donnelley & Sons Co., 7.250%, 5/15/2018 | | | 1,091,750 | |
| | 915,000 | | | R.R. Donnelley & Sons Co., 8.250%, 3/15/2019 | | | 928,725 | |
| | | | | | | | |
| | | | | | | 7,476,012 | |
| | | | | | | | |
| | | | Metals & Mining — 3.4% | | | | |
| | 2,340,000 | | | ArcelorMittal, 7.000%, 3/01/2041 | | | 2,103,653 | |
| | 2,100,000 | | | Arch Coal, Inc., 7.250%, 6/15/2021 | | | 1,753,500 | |
| | 35,000 | | | Essar Steel Algoma, Inc., 9.375%, 3/15/2015, 144A | | | 33,338 | |
| | 780,000 | | | Essar Steel Algoma, Inc., 9.875%, 6/15/2015, 144A | | | 618,150 | |
| | 330,000 | | | FMG Resources August 2006 Pty Ltd., 6.875%, 4/01/2022, 144A | | | 301,950 | |
| | 3,130,000 | | | United States Steel Corp., 6.650%, 6/01/2037 | | | 2,629,200 | |
| | 225,000 | | | United States Steel Corp., 7.500%, 3/15/2022 | | | 222,187 | |
| | | | | | | | |
| | | | | | | 7,661,978 | |
| | | | | | | | |
| | | | Mortgage Related — 2.7% | | | | |
| | 5,683,691 | | | FHLMC, 3.500%, 8/01/2042 | | | 6,105,972 | |
| | | | | | | | |
| | | | Non-Captive Consumer — 2.2% | | | | |
| | 1,605,000 | | | Residential Capital LLC, 9.625%, 5/15/2015(f) | | | 1,607,006 | |
| | 1,920,000 | | | Springleaf Finance Corp., MTN, 5.750%, 9/15/2016 | | | 1,657,191 | |
| | 2,000,000 | | | Springleaf Finance Corp., Series J, MTN, 6.900%, 12/15/2017 | | | 1,700,000 | |
| | | | | | | | |
| | | | | | | 4,964,197 | |
| | | | | | | | |
| | | | Non-Captive Diversified — 2.7% | | | | |
| | 1,825,000 | | | Air Lease Corp., 4.500%, 1/15/2016, 144A | | | 1,825,000 | |
| | 240,000 | | | Aircastle Ltd., 7.625%, 4/15/2020 | | | 265,800 | |
| | 1,620,000 | | | Ally Financial, Inc., 8.000%, 11/01/2031 | | | 1,888,920 | |
| | 1,045,000 | | | International Lease Finance Corp., 8.625%, 1/15/2022 | | | 1,261,837 | |
| | 100,000 | | | iStar Financial, Inc., 5.850%, 3/15/2017 | | | 95,000 | |
| | 135,000 | | | iStar Financial, Inc., 5.875%, 3/15/2016 | | | 130,275 | |
| | 15,000 | | | iStar Financial, Inc., Series B, 5.950%, 10/15/2013 | | | 15,000 | |
See accompanying notes to financial statements.
| 42
Portfolio of Investments – as of September 30, 2012
Loomis Sayles High Income Fund – (continued)
| | | | | | | | |
Principal
Amount (‡) | | | Description | | Value (†) | |
| | | | Non-Captive Diversified — continued | | | | |
| $ | 585,000 | | | Ladder Capital Finance Holdings LLLP/Ladder Capital Finance Corp., 7.375%, 10/01/2017, 144A | | $ | 596,700 | |
| | | | | | | | |
| | | | | | | 6,078,532 | |
| | | | | | | | |
| | | | Oil Field Services — 0.2% | | | | |
| | 515,000 | | | Global Geophysical Services, Inc., 10.500%, 5/01/2017 | | | 491,825 | |
| | | | | | | | |
| | | | Packaging — 1.6% | | | | |
| | 3,000,000 | | | Reynolds Group Issuer, Inc./Reynolds Group Issuer LLC/Reynolds Group Issuer (Luxembourg) S.A., 8.250%, 2/15/2021 | | | 2,977,500 | |
| | 755,000 | | | Sealed Air Corp., 6.875%, 7/15/2033, 144A | | | 709,700 | |
| | | | | | | | |
| | | | | | | 3,687,200 | |
| | | | | | | | |
| | | | Pharmaceuticals — 1.3% | | | | |
| | 450,000 | | | Valeant Pharmaceuticals International, 6.375%, 10/15/2020, 144A | | | 459,000 | |
| | 140,000 | | | Valeant Pharmaceuticals International, 6.750%, 8/15/2021, 144A | | | 145,250 | |
| | 530,000 | | | Valeant Pharmaceuticals International, 7.250%, 7/15/2022, 144A | | | 558,487 | |
| | 1,690,000 | | | VPI Escrow Corp., 6.375%, 10/15/2020, 144A | | | 1,723,800 | |
| | | | | | | | |
| | | | | | | 2,886,537 | |
| | | | | | | | |
| | | | Pipelines — 1.0% | | | | |
| | 615,000 | | | NGPL PipeCo LLC, 7.768%, 12/15/2037, 144A | | | 615,000 | |
| | 655,000 | | | NGPL PipeCo LLC, 9.625%, 6/01/2019, 144A | | | 746,700 | |
| | 215,000 | | | Rockies Express Pipeline LLC, 3.900%, 4/15/2015, 144A | | | 211,775 | |
| | 785,000 | | | Rockies Express Pipeline LLC, 6.875%, 4/15/2040, 144A | | | 686,875 | |
| | | | | | | | |
| | | | | | | 2,260,350 | |
| | | | | | | | |
| | | | Retailers — 2.3% | | | | |
| | 40,000 | | | Dillard’s, Inc., 7.000%, 12/01/2028 | | | 39,800 | |
| | 435,000 | | | Dillard’s, Inc., 7.750%, 7/15/2026 | | | 449,681 | |
| | 205,000 | | | Dillard’s, Inc., 7.750%, 5/15/2027 | | | 210,125 | |
| | 35,000 | | | Dillard’s, Inc., 7.875%, 1/01/2023 | | | 37,450 | |
| | 3,630,000 | | | J.C. Penney Corp., Inc., 6.375%, 10/15/2036 | | | 2,962,987 | |
| | 250,000 | | | J.C. Penney Corp., Inc., 7.400%, 4/01/2037 | | | 224,063 | |
| | 1,440,000 | | | Toys R Us, Inc., 7.375%, 10/15/2018 | | | 1,292,400 | |
| | | | | | | | |
| | | | | | | 5,216,506 | |
| | | | | | | | |
| | | | Sovereigns — 0.9% | | | | |
| | 1,050,000 | | | Republic of Brazil, 8.500%, 1/05/2024, (BRL) | | | 605,993 | |
| | 2,250,000 | | | Republic of Brazil, 10.250%, 1/10/2028, (BRL) | | | 1,451,166 | |
| | | | | | | | |
| | | | | | | 2,057,159 | |
| | | | | | | | |
| | | | Supermarkets — 0.6% | | | | |
| | 315,000 | | | American Stores Co., 8.000%, 6/01/2026 | | | 267,750 | |
| | 955,000 | | | New Albertson’s, Inc., 7.750%, 6/15/2026 | | | 584,938 | |
| | 735,000 | | | New Albertson’s, Inc., Series C, MTN, 6.625%, 6/01/2028 | | | 396,900 | |
| | | | | | | | |
| | | | | | | 1,249,588 | |
| | | | | | | | |
| | | | Supranational — 0.5% | �� | | | |
| | 2,000,000 | | | European Bank for Reconstruction & Development, EMTN, 9.000%, 4/28/2014, (BRL) | | | 1,036,656 | |
| | | | | | | | |
See accompanying notes to financial statements.
43 |
Portfolio of Investments – as of September 30, 2012
Loomis Sayles High Income Fund – (continued)
| | | | | | | | |
Principal
Amount (‡) | | | Description | | Value (†) | |
| | | | Technology — 2.0% | | | | |
| $ | 1,485,000 | | | Alcatel-Lucent USA, Inc., 6.450%, 3/15/2029 | | $ | 972,675 | |
| | 1,930,000 | | | Alcatel-Lucent USA, Inc., 6.500%, 1/15/2028 | | | 1,254,500 | |
| | 310,000 | | | Amkor Technology, Inc., 6.375%, 10/01/2022, 144A | | | 305,350 | |
| | 85,000 | | | Amkor Technology, Inc., 6.625%, 6/01/2021 | | | 86,275 | |
| | 1,460,000 | | | First Data Corp., 8.250%, 1/15/2021, 144A | | | 1,456,350 | |
| | 305,000 | | | Freescale Semiconductor, Inc., 8.050%, 2/01/2020 | | | 300,425 | |
| | | | | | | | |
| | | | | | | 4,375,575 | |
| | | | | | | | |
| | | | Textile — 2.0% | | | | |
| | 1,925,000 | | | Hanesbrands, Inc., 6.375%, 12/15/2020 | | | 2,088,625 | |
| | 2,605,000 | | | Jones Group, Inc. (The), 6.125%, 11/15/2034 | | | 2,136,100 | |
| | 175,000 | | | Jones Group, Inc./Apparel Group Holdings/Apparel Group USA/Footwear Accessories Retail, 6.875%, 3/15/2019 | | | 180,687 | |
| | | | | | | | |
| | | | | | | 4,405,412 | |
| | | | | | | | |
| | | | Transportation Services — 0.3% | | | | |
| | 275,000 | | | APL Ltd., 8.000%, 1/15/2024(d) | | | 234,438 | |
| | 640,000 | | | Overseas Shipholding Group, 7.500%, 2/15/2024 | | | 358,400 | |
| | | | | | | | |
| | | | | | | 592,838 | |
| | | | | | | | |
| | | | Treasuries — 8.1% | | | | |
| | 7,425,000 | | | Canadian Government, 3.000%, 12/01/2015, (CAD)(g) | | | 7,978,457 | |
| | 150,000 | | | Ireland Government Bond, 4.500%, 10/18/2018, (EUR) | | | 191,732 | |
| | 375,000 | | | Ireland Government Bond, 4.500%, 4/18/2020, (EUR) | | | 463,582 | |
| | 930,000 | | | Ireland Government Bond, 5.400%, 3/13/2025, (EUR) | | | 1,187,040 | |
| | 65,000 | | | Italy Buoni Poliennali Del Tesoro, 5.000%, 8/01/2034, (EUR) | | | 75,860 | |
| | 60,000 | | | Italy Buoni Poliennali Del Tesoro, 5.250%, 11/01/2029, (EUR) | | | 74,469 | |
| | 55,000 | | | Italy Buoni Poliennali Del Tesoro, 5.750%, 2/01/2033, (EUR) | | | 70,552 | |
| | 301,500(††) | | | Mexican Fixed Rate Bonds, Series M-20, 8.000%, 12/07/2023, (MXN) | | | 2,845,960 | |
| | 10,000,000 | | | Philippine Government International Bond, 4.950%, 1/15/2021, (PHP) | | | 252,901 | |
| | 120,000,000 | | | Philippine Government International Bond, 6.250%, 1/14/2036, (PHP) | | | 3,196,692 | |
| | 400,000 | | | Portugal Obrigacoes do Tesouro OT, 4.950%, 10/25/2023, (EUR) | | | 367,370 | |
| | 1,435,000 | | | Spain Government Bond, 4.650%, 7/30/2025, (EUR) | | | 1,557,519 | |
| | | | | | | | |
| | | | | | | 18,262,134 | |
| | | | | | | | |
| | | | Wireless — 2.8% | | | | |
| | 900,000 | | | Bakrie Telecom Pte Ltd., 11.500%, 5/07/2015, 144A | | | 405,000 | |
| | 955,000 | | | Clearwire Communications LLC/Clearwire Finance, Inc., 12.000%, 12/01/2015, 144A | | | 945,450 | |
| | 795,000 | | | SBA Communications Corp., 5.625%, 10/01/2019, 144A | | | 808,912 | |
| | 4,236,000 | | | Sprint Capital Corp., 6.875%, 11/15/2028 | | | 3,897,120 | |
| | 5,000 | | | Sprint Capital Corp., 6.900%, 5/01/2019 | | | 5,188 | |
| | 285,000 | | | Sprint Capital Corp., 8.750%, 3/15/2032 | | | 294,975 | |
| | | | | | | | |
| | | | | | | 6,356,645 | |
| | | | | | | | |
| | | | Wirelines — 4.0% | | | | |
| | 665,000 | | | Axtel SAB de CV, 9.000%, 9/22/2019, 144A | | | 412,300 | |
| | 130,000 | | | Cincinnati Bell Telephone Co. LLC, 6.300%, 12/01/2028 | | | 118,300 | |
| | 1,105,000 | | | Cincinnati Bell, Inc., 8.750%, 3/15/2018 | | | 1,121,575 | |
| | 735,000 | | | Frontier Communications Corp., 9.000%, 8/15/2031 | | | 784,612 | |
See accompanying notes to financial statements.
| 44
Portfolio of Investments – as of September 30, 2012
Loomis Sayles High Income Fund – (continued)
| | | | | | | | |
Principal
Amount (‡) | | | Description | | Value (†) | |
| | | | Wirelines — continued | | | | |
| $ | 605,000 | | | Level 3 Communications, Inc., 8.875%, 6/01/2019, 144A | | $ | 635,250 | |
| | 1,090,000 | | | Level 3 Financing, Inc., 7.000%, 6/01/2020, 144A | | | 1,100,900 | |
| | 940,000 | | | Level 3 Financing, Inc., 8.125%, 7/01/2019 | | | 998,750 | |
| | 350,000 | | | Portugal Telecom International Finance BV, EMTN, 4.500%, 6/16/2025, (EUR) | | | 359,814 | |
| | 250,000 | | | Portugal Telecom International Finance BV, EMTN, 5.000%, 11/04/2019, (EUR) | | | 296,397 | |
| | 300,000 | | | Portugal Telecom International Finance BV, EMTN, 5.625%, 2/08/2016, (EUR) | | | 383,587 | |
| | 25,000 | | | Telecom Italia Capital S.A., 6.000%, 9/30/2034 | | | 22,125 | |
| | 15,000 | | | Telecom Italia Capital S.A., 6.375%, 11/15/2033 | | | 13,688 | |
| | 1,575,000 | | | Telefonica Emisiones SAU, 5.134%, 4/27/2020 | | | 1,545,469 | |
| | 75,000 | | | Telefonica Emisiones SAU, 5.462%, 2/16/2021 | | | 73,500 | |
| | 1,125,000 | | | Telefonica Emisiones SAU, 7.045%, 6/20/2036 | | | 1,096,875 | |
| | | | | | | | |
| | | | | | | 8,963,142 | |
| | | | | | | | |
| | | | Total Non-Convertible Bonds
(Identified Cost $158,926,360) | | | 166,210,391 | |
| | | | | | | | |
| | | | | | | | |
| | Convertible Bonds — 9.0% | | | | |
| | | | Automotive — 1.6% | | | | |
| | 1,465,000 | | | ArvinMeritor, Inc., (Step to Zero Coupon on 2/15/2019), 4.000%, 2/15/2027(h) | | | 1,090,509 | |
| | 1,760,000 | | | Ford Motor Co., 4.250%, 11/15/2016 | | | 2,427,700 | |
| | | | | | | | |
| | | | | | | 3,518,209 | |
| | | | | | | | |
| | | | Brokerage — 0.7% | | | | |
| | 1,714,000 | | | Jefferies Group, Inc., 3.875%, 11/01/2029 | | | 1,651,867 | |
| | | | | | | | |
| | | | Construction Machinery — 0.3% | | | | |
| | 555,000 | | | Ryland Group, Inc. (The), 1.625%, 5/15/2018 | | | 663,225 | |
| | | | | | | | |
| | | | Diversified Manufacturing — 0.6% | | | | |
| | 1,325,000 | | | Trinity Industries, Inc., 3.875%, 6/01/2036 | | | 1,368,891 | |
| | | | | | | | |
| | | | Home Construction — 0.3% | | | | |
| | 70,000 | | | Lennar Corp., 2.000%, 12/01/2020, 144A | | | 94,412 | |
| | 575,000 | | | Standard Pacific Corp., 1.250%, 8/01/2032 | | | 632,500 | |
| | | | | | | | |
| | | | | | | 726,912 | |
| | | | | | | | |
| | | | Independent Energy — 0.3% | | | | |
| | 760,000 | | | Chesapeake Energy Corp., 2.500%, 5/15/2037 | | | 682,575 | |
| | 105,000 | | | Chesapeake Energy Corp., 2.750%, 11/15/2035 | | | 99,947 | |
| | | | | | | | |
| | | | | | | 782,522 | |
| | | | | | | | |
| | | | Metals & Mining — 0.5% | | | | |
| | 1,060,000 | | | Peabody Energy Corp., 4.750%, 12/15/2066 | | | 893,050 | |
| | 165,000 | | | Steel Dynamics, Inc., 5.125%, 6/15/2014 | | | 172,528 | |
| | | | | | | | |
| | | | | | | 1,065,578 | |
| | | | | | | | |
| | | | Pharmaceuticals — 0.8% | | | | |
| | 1,370,000 | | | Vertex Pharmaceuticals, Inc., 3.350%, 10/01/2015 | | | 1,759,594 | |
| | | | | | | | |
| | | | Technology — 3.6% | | | | |
| | 3,780,000 | | | Ciena Corp., 0.875%, 6/15/2017 | | | 3,253,162 | |
| | 145,000 | | | Ciena Corp., 3.750%, 10/15/2018, 144A | | | 152,250 | |
See accompanying notes to financial statements.
45 |
Portfolio of Investments – as of September 30, 2012
Loomis Sayles High Income Fund – (continued)
| | | | | | | | |
Principal
Amount (‡) | | | Description | | Value (†) | |
| | | | Technology — continued | | | | |
| $ | 40,000 | | | Ciena Corp., 4.000%, 3/15/2015, 144A | | $ | 43,050 | |
| | 2,700,000 | | | Intel Corp., 2.950%, 12/15/2035 | | | 2,936,250 | |
| | 620,000 | | | Micron Technology, Inc., Series B, 1.875%, 8/01/2031 | | | 545,988 | |
| | 1,185,000 | | | Micron Technology, Inc., Series C, 2.375%, 5/01/2032, 144A | | | 1,107,975 | |
| | 80,000 | | | SanDisk Corp., 1.500%, 8/15/2017 | | | 90,550 | |
| | | | | | | | |
| | | | | | | 8,129,225 | |
| | | | | | | | |
| | | | Textile — 0.3% | | | | |
| | 570,000 | | | Iconix Brand Group, Inc., 2.500%, 6/01/2016, 144A | | | 566,438 | |
| | | | | | | | |
| | | | Total Convertible Bonds
(Identified Cost $18,822,515) | | | 20,232,461 | |
| | | | | | | | |
| | | | Total Bonds and Notes
(Identified Cost $177,748,875) | | | 186,442,852 | |
| | | | | | | | |
| | | | | | | | |
| | Senior Loans — 0.3% | | | | |
| | | | Independent Energy — 0.1% | | | | |
| | 250,000 | | | Chesapeake Energy Corporation, Unsecured Term Loan, 8.500%, 12/01/2017(b) | | | 250,638 | |
| | | | | | | | |
| | | | Media Non-Cable — 0.1% | | | | |
| | 287,807 | | | SuperMedia, Inc., Exit Term Loan, 11.000%, 12/31/2015(b) | | | 188,033 | |
| | | | | | | | |
| | | | Wirelines — 0.1% | | | | |
| | 359,042 | | | FairPoint Communications, Inc., New Term Loan B, 6.501%, 1/22/2016(i) | | | 336,537 | |
| | | | | | | | |
| | | | Total Senior Loans
(Identified Cost $985,423) | | | 775,208 | |
| | | | | | | | |
| | | | | | | | |
| Shares | | | | | | |
| | Preferred Stocks — 3.1% | | | | |
| | Convertible Preferred Stocks — 1.9% | | | | |
| | | | Automotive — 1.3% | | | | |
| | 73,400 | | | General Motors Co., Series B, 4.750% | | | 2,736,352 | |
| | 2,500 | | | Goodyear Tire & Rubber Co. (The), 5.875% | | | 110,425 | |
| | | | | | | | |
| | | | | | | 2,846,777 | |
| | | | | | | | |
| | | | Banking — 0.0% | | | | |
| | 94 | | | Bank of America Corp., Series L, 7.250% | | | 102,460 | |
| | | | | | | | |
| | | | Construction Machinery — 0.1% | | | | |
| | 2,213 | | | United Rentals Trust I, 6.500% | | | 107,123 | |
| | | | | | | | |
| | | | Pipelines — 0.5% | | | | |
| | 20,675 | | | El Paso Energy Capital Trust I, 4.750% | | | 1,123,479 | |
| | | | | | | | |
| | | | Total Convertible Preferred Stocks
(Identified Cost $4,630,096) | | | 4,179,839 | |
| | | | | | | | |
See accompanying notes to financial statements.
| 46
Portfolio of Investments – as of September 30, 2012
Loomis Sayles High Income Fund – (continued)
| | | | | | | | |
Shares | | | Description | | Value (†) | |
| | Non-Convertible Preferred Stocks — 1.2% | | | | |
| | | | Non-Captive Diversified — 1.2% | | | | |
| | 965 | | | Ally Financial, Inc., Series G, 7.000%, 144A | | $ | 902,728 | |
| | 78,785 | | | Ally Financial, Inc., Series A, (fixed rate to 5/15/2016, variable rate thereafter), 8.500% | | | 1,927,081 | |
| | | | | | | | |
| | | | | | | 2,829,809 | |
| | | | | | | | |
| | | | Total Non-Convertible Preferred Stocks
(Identified Cost $2,862,039) | | | 2,829,809 | |
| | | | | | | | |
| | | | Total Preferred Stocks
(Identified Cost $7,492,135) | | | 7,009,648 | |
| | | | | | | | |
| | | | | | | | |
| | Common Stocks — 1.4% | | | | |
| | | | Automobiles — 0.3% | | | | |
| | 53,720 | | | Ford Motor Co. | | | 529,679 | |
| | | | | | | | |
| | | | Chemicals — 0.0% | | | | |
| | 1,087 | | | Ashland, Inc. | | | 77,829 | |
| | | | | | | | |
| | | | Diversified Telecommunication Services — 0.0% | | | | |
| | 593 | | | Hawaiian Telcom Holdco, Inc.(j) | | | 10,514 | |
| | | | | | | | |
| | | | Gas Utilities — 0.4% | | | | |
| | 17,600 | | | National Fuel Gas Co. | | | 951,104 | |
| | | | | | | | |
| | | | Household Durables — 0.3% | | | | |
| | 46,500 | | | KB Home | | | 667,275 | |
| | | | | | | | |
| | | | Oil, Gas & Consumable Fuels — 0.2% | | | | |
| | 14,882 | | | Kinder Morgan, Inc. | | | 528,609 | |
| | | | | | | | |
| | | | Pharmaceuticals — 0.2% | | | | |
| | 6,875 | | | Merck & Co., Inc. | | | 310,062 | |
| | | | | | | | |
| | | | Total Common Stocks
(Identified Cost $2,691,669) | | | 3,075,072 | |
| | | | | | | | |
| | | | | | | | |
| | Warrants — 0.0% | | | | |
| | 10,023 | | | FairPoint Communications, Inc., Expiration on 1/24/2018 at $48.81(d)(j)(k) | | | — | |
| | 22,512 | | | Kinder Morgan, Inc., Expiration on 5/25/2017 at $40.00(j) | | | 78,567 | |
| | | | | | | | |
| | | | Total Warrants
(Identified Cost $29,892) | | | 78,567 | |
| | | | | | | | |
| | | | | | | | |
See accompanying notes to financial statements.
47 |
Portfolio of Investments – as of September 30, 2012
Loomis Sayles High Income Fund – (continued)
| | | | | | | | |
Principal
Amount (‡) | | | Description | | Value (†) | |
| | Short-Term Investments — 12.5% | | | | |
| $ | 20,787 | | | Repurchase Agreement with State Street Bank and Trust Company, dated 9/28/2012 at 0.010% to be repurchased at $20,787 on 10/01/2012 collateralized by $20,000 U.S. Treasury Bond, 5.250%, due 2/15/2029 valued at $28,176 including accrued interest (Note 2 of Notes to Financial Statements) | | $ | 20,787 | |
| | 27,938,065 | | | Tri-Party Repurchase Agreement with Fixed Income Clearing Corporation, dated 9/28/2012 at 0.010% to be repurchased at $27,938,088 on 10/01/2012 collateralized by $27,140,000 Federal National Mortgage Association, 2.750% due 4/16/2019 valued at $28,497,000 including accrued interest (Note 2 of Notes to Financial Statements) | | | 27,938,065 | |
| | | | | | | | |
| | | | Total Short-Term Investments
(Identified Cost $27,958,852) | | | 27,958,852 | |
| | | | | | | | |
| | | | | | | | |
| | | | Total Investments — 100.5%
(Identified Cost $216,906,846)(a) | | | 225,340,199 | |
| | | | Other assets less liabilities — (0.5)% | | | (1,124,375 | ) |
| | | | | | | | |
| | | | Net Assets — 100.0% | | $ | 224,215,824 | |
| | | | | | | | |
| | | | | | | | |
| | (‡) | | | Principal Amount stated in U.S. dollars unless otherwise noted. | |
| | (†) | | | See Note 2 of Notes to Financial Statements. | |
| | (††) | | | Amount shown represents units. One unit represents a principal amount of 100. | |
| | (a) | | | Federal Tax Information: | |
| | | | At September 30, 2012, the net unrealized appreciation on investments based on a cost of $217,620,641 for federal income tax purposes was as follows: | |
| | | | Aggregate gross unrealized appreciation for all investments in which there is an excess of value over tax cost | | $ | 13,568,969 | |
| | | | Aggregate gross unrealized depreciation for all investments in which there is an excess of tax cost over value | | | (5,849,411 | ) |
| | | | | | | | |
| | | | Net unrealized appreciation | | $ | 7,719,558 | |
| | | | | | | | |
| | | | | | | | |
| | (b) | | | Variable rate security. Rate as of September 30, 2012 is disclosed. | |
| | (c) | | | All or a portion of interest payment is paid-in-kind. | |
| | (d) | | | Illiquid security. At September 30, 2012, the value of these securities amounted to $860,066 or 0.4% of net assets. | |
| | (e) | | | The issuer is making partial payments with respect to interest and/or principal. Income is not being accrued. | |
| | (f) | | | The issuer is in default with respect to interest and/or principal payments. Income is not being accrued. | |
| | (g) | | | All or a portion of this security has been designated to cover the Fund’s obligations under open forward foreign currency contracts. | |
| | (h) | | | Coupon rate is a fixed rate for an initial period then resets at a specified date and rate. | |
| | (i) | | | Variable rate security. Rate shown represents the weighted average rate of underlying contracts at September 30, 2012. | |
| | (j) | | | Non-income producing security. | |
| | (k) | | | Fair valued security by the Fund’s investment adviser. | |
See accompanying notes to financial statements.
| 48
Portfolio of Investments – as of September 30, 2012
Loomis Sayles High Income Fund – (continued)
| | | | | | |
| | 144A | | | All or a portion of these securities are exempt from registration under Rule 144A of the Securities Act of 1933. These securities may be resold in transactions exempt from registration, normally to qualified institutional buyers. At September 30, 2012, the value of Rule 144A holdings amounted to $41,531,540 or 18.5% of net assets. |
| | ABS | | | Asset-Backed Securities |
| | EMTN | | | Euro Medium Term Note |
| | FHLMC | | | Federal Home Loan Mortgage Corp. |
| | GMTN | | | Global Medium Term Note |
| | MTN | | | Medium Term Note |
| | | | | | |
| | AUD | | | Australian Dollar |
| | BRL | | | Brazilian Real |
| | CAD | | | Canadian Dollar |
| | EUR | | | Euro |
| | MXN | | | Mexican Peso |
| | PHP | | | Philippine Peso |
At September 30, 2012, the Fund had the following open forward foreign currency contracts:
| | | | | | | | | | | | | | | | | | |
Contract
to
Buy/Sell1 | | Delivery
Date | | | Currency | | Units | | | Notional
Value | | | Unrealized
Appreciation
(Depreciation) | |
| Sell | | | 10/31/2012 | | | Euro | | | 770,000 | | | | 989,769 | | | $ | 189 | |
| Sell | | | 10/31/2012 | | | Euro | | | 4,100,000 | | | | 5,270,200 | | | | (243,423 | ) |
| | | | | | | | | | | | | | | | | | |
| Total | | | | | | | | | | | | | | | | $ | (243,234 | ) |
| | | | | | | | | | | | | | | | | | |
1 Counterparty is Barclays Bank PLC.
See accompanying notes to financial statements.
49 |
Portfolio of Investments – as of September 30, 2012
Loomis Sayles High Income Fund – (continued)
Industry Summary at September 30, 2012 (Unaudited)
| | | | |
Treasuries | | | 8.1 | % |
Home Construction | | | 6.1 | |
Technology | | | 5.6 | |
Wirelines | | | 4.1 | |
Non-Captive Diversified | | | 3.9 | |
Metals & Mining | | | 3.9 | |
Automotive | | | 3.9 | |
Independent Energy | | | 3.6 | |
Media Non-Cable | | | 3.4 | |
Wireless | | | 2.8 | |
Building Materials | | | 2.8 | |
Mortgage Related | | | 2.7 | |
Banking | | | 2.4 | |
Retailers | | | 2.3 | |
Textile | | | 2.3 | |
Pharmaceuticals | | | 2.3 | |
Chemicals | | | 2.2 | |
Non-Captive Consumer | | | 2.2 | |
Other Investments, less than 2% each | | | 23.4 | |
Short-Term Investments | | | 12.5 | |
| | | | |
Total Investments | | | 100.5 | |
Other assets less liabilities (including open forward foreign currency contracts) | | | (0.5 | ) |
| | | | |
Net Assets | | | 100.0 | % |
| | | | |
See accompanying notes to financial statements.
| 50
Portfolio of Investments – as of September 30, 2012
Loomis Sayles International Bond Fund
| | | | | | | | |
Principal
Amount (‡) | | | Description | | Value (†) | |
| | Bonds and Notes — 96.1% of Net Assets | | | | |
| | | | Belgium — 1.9% | | | | |
| | 260,000 | | | Belgium Government Bond, 3.500%, 6/28/2017, (EUR) | | $ | 368,092 | |
| | | | | | | | |
| | | | Brazil — 2.8% | | | | |
| | 350,000 | | | Republic of Brazil, 8.500%, 1/05/2024, (BRL) | | | 201,998 | |
| | 100,000 | | | Telemar Norte Leste S.A., 5.125%, 12/15/2017, 144A, (EUR) | | | 134,239 | |
| | 200,000 | | | Votorantim Cimentos S.A., 7.250%, 4/05/2041, 144A | | | 215,500 | |
| | | | | | | | |
| | | | | | | 551,737 | |
| | | | | | | | |
| | | | Canada — 5.7% | | | | |
| | 75,000 | | | Canada Government International Bond, 3.500%, 1/13/2020, (EUR)(b) | | | 114,100 | |
| | 285,000 | | | Canadian Government, 3.000%, 12/01/2015, (CAD) | | | 306,244 | |
| | 85,000 | | | Methanex Corp., 5.250%, 3/01/2022 | | | 90,806 | |
| | 150,000 | | | Province of Quebec Canada, EMTN, 3.375%, 6/20/2016, (EUR) | | | 211,868 | |
| | 200,000 | | | Province of Quebec Canada, Series 169, EMTN, 3.625%, 2/10/2015, (EUR) | | | 276,625 | |
| | 95,000 | | | Shaw Communications, Inc., 5.650%, 10/01/2019, (CAD) | | | 108,844 | |
| | | | | | | | |
| | | | | | | 1,108,487 | |
| | | | | | | | |
| | | | Denmark — 0.6% | | | | |
| | 645,000 | | | Kingdom of Denmark, 4.000%, 11/15/2015, (DKK) | | | 124,699 | |
| | | | | | | | |
| | | | Finland — 2.7% | | | | |
| | 390,000 | | | Finland Government Bond, 1.875%, 4/15/2017, (EUR) | | | 529,799 | |
| | | | | | | | |
| | | | France — 6.8% | | | | |
| | 50,000 | | | AXA S.A., EMTN, (fixed rate to 4/16/2020, variable rate thereafter),
5.250%, 4/16/2040, (EUR) | | | 58,825 | |
| | 530,000 | | | France Government Bond OAT, 3.000%, 4/25/2022, (EUR)(b) | | | 728,956 | |
| | 325,000 | | | France Government Bond OAT, 3.750%, 4/25/2021, (EUR) | | | 476,500 | |
| | 50,000 | | | Lafarge S.A., EMTN, 5.375%, 6/26/2017, (EUR) | | | 67,771 | |
| | | | | | | | |
| | | | | | | 1,332,052 | |
| | | | | | | | |
| | | | Germany — 4.0% | | | | |
| | 340,000 | | | Bundesobligation, 1.250%, 10/14/2016, (EUR)(b) | | | 453,931 | |
| | 220,000 | | | Bundesrepublik Deutschland, 3.000%, 7/04/2020, (EUR) | | | 323,605 | |
| | | | | | | | |
| | | | | | | 777,536 | |
| | | | | | | | |
| | | | Ireland — 1.0% | | | | |
| | 100,000 | | | WPP 2008 Ltd., 6.000%, 4/04/2017, (GBP) | | | 186,576 | |
| | | | | | | | |
| | | | Italy — 6.5% | | | | |
| | 50,000 | | | Enel Finance International S.A., EMTN, 5.625%, 8/14/2024, (GBP) | | | 77,302 | |
| | 50,000 | | | Finmeccanica SpA, EMTN, 4.875%, 3/24/2025, (EUR) | | | 54,615 | |
| | 350,000 | | | Italy Buoni Poliennali Del Tesoro, 4.000%, 2/01/2037, (EUR) | | | 358,779 | |
| | 320,000 | | | Italy Buoni Poliennali Del Tesoro, 4.500%, 8/01/2018, (EUR)(b) | | | 418,026 | |
| | 150,000 | | | Italy Buoni Poliennali Del Tesoro, 4.750%, 5/01/2017, (EUR) | | | 199,222 | |
| | 60,000 | | | Republic of Italy, 6.875%, 9/27/2023 | | | 66,218 | |
| | 75,000 | | | Telecom Italia Finance S.A., EMTN, 7.750%, 1/24/2033, (EUR) | | | 102,391 | |
| | | | | | | | |
| | | | | | | 1,276,553 | |
| | | | | | | | |
| | | | Japan — 29.0% | | | | |
| | 90,000,000 | | | Japan Finance Organization for Municipalities, 1.900%, 6/22/2018, (JPY) | | | 1,261,615 | |
See accompanying notes to financial statements.
51 |
Portfolio of Investments – as of September 30, 2012
Loomis Sayles International Bond Fund – (continued)
| | | | | | | | |
Principal
Amount (‡) | | | Description | | Value (†) | |
| | | | Japan — continued | | | | |
| | 43,000,000 | | | Japan Government Five Year Bond, 0.700%, 6/20/2014, (JPY) | | $ | 556,609 | |
| | 100,000,000 | | | Japan Government Ten Year Bond, 1.700%, 12/20/2016, (JPY) | | | 1,364,549 | |
| | 72,400,000 | | | Japan Government Ten Year Bond, 1.700%, 9/20/2017, (JPY)(b) | | | 996,614 | |
| | 18,000,000 | | | Japan Government Thirty Year Bond, 2.000%, 9/20/2040, (JPY) | | | 237,733 | |
| | 90,000,000 | | | Japan Government Twenty Year Bond, 1.900%, 12/20/2028, (JPY) | | | 1,233,897 | |
| | | | | | | | |
| | | | | | | 5,651,017 | |
| | | | | | | | |
| | | | Korea — 0.5% | | | | |
| | 3,600,000 | | | Export-Import Bank of Korea, 4.000%, 11/26/2015, 144A, (PHP) | | | 89,225 | |
| | | | | | | | |
| | | | Luxembourg — 0.2% | | | | |
| | 30,000 | | | FMC Finance VIII, S.A., 6.500%, 9/15/2018, 144A, (EUR) | | | 44,141 | |
| | | | | | | | |
| | | | Malaysia — 0.6% | | | | |
| | 370,000 | | | Malaysia Government Bond, 4.262%, 9/15/2016, (MYR) | | | 125,588 | |
| | | | | | | | |
| | | | Mexico — 3.9% | | | | |
| | 100,000 | | | America Movil SAB de CV, EMTN, 4.125%, 10/25/2019, (EUR) | | | 144,028 | |
| | 45,000 | | | Axtel SAB de CV, 9.000%, 9/22/2019, 144A | | | 27,900 | |
| | 15,000(††) | | | Mexican Fixed Rate Bonds, Series M, 6.500%, 6/10/2021, (MXN) | | | 126,919 | |
| | 11,500(††) | | | Mexican Fixed Rate Bonds, Series M-10, 7.750%, 12/14/2017, (MXN) | | | 100,543 | |
| | 37,500(††) | | | Mexican Fixed Rate Bonds, Series M-30, 8.500%, 11/18/2038, (MXN) | | | 364,082 | |
| | | | | | | | |
| | | | | | | 763,472 | |
| | | | | | | | |
| | | | Netherlands — 0.8% | | | | |
| | 50,000 | | | EDP Finance BV, EMTN, 4.750%, 9/26/2016, (EUR) | | | 61,684 | |
| | 30,000 | | | Fresenius Finance BV, 4.250%, 4/15/2019, 144A, (EUR) | | | 40,286 | |
| | 50,000 | | | Portugal Telecom International Finance BV, EMTN, 5.000%, 11/04/2019, (EUR) | | | 59,279 | |
| | | | | | | | |
| | | | | | | 161,249 | |
| | | | | | | | |
| | | | Norway — 3.3% | | | | |
| | 30,000 | | | Eksportfinans ASA, 2.000%, 9/15/2015 | | | 28,050 | |
| | 2,205,000 | | | Norwegian Government Bond, 4.250%, 5/19/2017, (NOK)(b) | | | 432,024 | |
| | 595,000 | | | Norwegian Government Bond, 5.000%, 5/15/2015, (NOK) | | | 113,363 | |
| | 370,000 | | | Norwegian Government Bond, 6.500%, 5/15/2013, (NOK) | | | 66,459 | |
| | | | | | | | |
| | | | | | | 639,896 | |
| | | | | | | | |
| | | | Philippines — 0.6% | | | | |
| | 5,000,000 | | | Philippine Government International Bond, 4.950%, 1/15/2021, (PHP) | | | 126,450 | |
| | | | | | | | |
| | | | Poland — 2.3% | | | | |
| | 605,000 | | | Poland Government Bond, 4.750%, 4/25/2017, (PLN) | | | 193,190 | |
| | 225,000 | | | Poland Government International Bond, EMTN, 2.625%, 5/12/2015, (CHF) | | | 249,426 | |
| | | | | | | | |
| | | | | | | 442,616 | |
| | | | | | | | |
| | | | Singapore — 2.1% | | | | |
| | 135,000 | | | Singapore Government Bond, 1.625%, 4/01/2013, (SGD) | | | 110,722 | |
| | 360,000 | | | Singapore Government Bond, 2.250%, 7/01/2013, (SGD) | | | 297,657 | |
| | | | | | | | |
| | | | | | | 408,379 | |
| | | | | | | | |
| | | | South Africa — 0.6% | | | | |
| | 100,000 | | | Edcon Proprietary Ltd., 3.502%, 6/15/2014, 144A, (EUR)(c) | | | 119,510 | |
| | | | | | | | |
See accompanying notes to financial statements.
| 52
Portfolio of Investments – as of September 30, 2012
Loomis Sayles International Bond Fund – (continued)
| | | | | | | | |
Principal
Amount (‡) | | | Description | | Value (†) | |
| | | | United Kingdom — 10.2% | | | | |
| | 50,000 | | | British Sky Broadcasting Group PLC, EMTN, 6.000%, 5/21/2027, (GBP) | | $ | 98,026 | |
| | 105,000 | | | British Telecommunications PLC, 5.750%, 12/07/2028, (GBP) | | | 202,031 | |
| | 50,000 | | | BSKYB Finance UK PLC, 5.750%, 10/20/2017, (GBP) | | | 93,665 | |
| | 100,000 | | | Standard Chartered Bank, Series 17, EMTN, 5.875%, 9/26/2017, (EUR) | | | 141,430 | |
| | 370,000 | | | United Kingdom Treasury, 1.750%, 1/22/2017, (GBP) | | | 627,798 | |
| | 150,000 | | | United Kingdom Treasury, 4.250%, 3/07/2036, (GBP) | | | 299,157 | |
| | 40,000 | | | United Kingdom Treasury, 4.750%, 12/07/2038, (GBP) | | | 85,870 | |
| | 200,000 | | | United Kingdom Treasury, 5.000%, 3/07/2025, (GBP) | | | 433,432 | |
| | | | | | | | |
| | | | | | | 1,981,409 | |
| | | | | | | | |
| | | | United States — 8.7% | | | | |
| | 100,000 | | | BA Credit Card Trust, Series 04A1, 4.500%, 6/17/2016, (EUR) | | | 133,037 | |
| | 50,000 | | | Cargill, Inc., EMTN, 5.375%, 3/02/2037, (GBP) | | | 95,119 | |
| | 35,000 | | | Frontier Communications Corp., 7.125%, 1/15/2023 | | | 36,400 | |
| | 45,000 | | | HCA, Inc., 8.360%, 4/15/2024 | | | 47,137 | |
| | 150,000 | | | HSBC Finance Corp., EMTN, 4.500%, 6/14/2016, (EUR) | | | 211,033 | |
| | 50,000 | | | International Lease Finance Corp., 5.875%, 8/15/2022 | | | 51,652 | |
| | 100,000 | | | JPMorgan Chase & Co., EMTN, 4.375%, 1/30/2014, (EUR) | | | 134,497 | |
| | 150,000 | | | Merrill Lynch & Co., Inc., EMTN, 4.625%, 9/14/2018, (EUR) | | | 191,794 | |
| | 30,000 | | | NII Capital Corp., 7.625%, 4/01/2021 | | | 23,850 | |
| | 490,000 | | | U.S. Treasury Note, 0.250%, 11/30/2013 | | | 490,249 | |
| | 15,000 | | | Valeant Pharmaceuticals International, 6.750%, 8/15/2021, 144A | | | 15,562 | |
| | 100,000 | | | Wachovia Corp., EMTN, 4.375%, 11/27/2018, (EUR) | | | 138,601 | |
| | 100,000 | | | Zurich Finance USA, Inc., EMTN, (fixed rate to 6/15/2015, variable rate thereafter), 4.500%, 6/15/2025, (EUR) | | | 131,718 | |
| | | | | | | | |
| | | | | | | 1,700,649 | |
| | | | | | | | |
| | | | Uruguay — 1.3% | | | | |
| | 4,270,044 | | | Uruguay Government International Bond, 4.375%, 12/15/2028, (UYU) | | | 245,325 | |
| | | | | | | | |
| | | | Total Bonds and Notes
(Identified Cost $18,317,973) | | | 18,754,457 | |
| | | | | | | | |
| | | | | | | | |
| | Short-Term Investments — 2.7% | | | | |
| | 518,975 | | | Tri-Party Repurchase Agreement with Fixed Income Clearing Corporation, dated 9/28/2012 at 0.010% to be repurchased at $518,975 on 10/01/2012 collateralized by $505,000 Federal National Mortgage Association, 2.750% due 4/16/2019 valued at $530,250 including accrued interest (Note 2 of Notes to Financial Statements)
(Identified Cost $518,975) | | | 518,975 | |
| | | | | | | | |
| | | | | | | | |
| | | | Total Investments — 98.8%
(Identified Cost $18,836,948)(a) | | | 19,273,432 | |
| | | | Other assets less liabilities — 1.2% | | | 243,205 | |
| | | | | | | | |
| | | | Net Assets — 100.0% | | $ | 19,516,637 | |
| | | | | | | | |
| | (‡) | | | Principal Amount stated in U.S. dollars unless otherwise noted. | |
| | (†) | | | See Note 2 of Notes to Financial Statements. | |
| | (††) | | | Amount shown represents units. One unit represents a principal amount of 100. | |
See accompanying notes to financial statements.
53 |
Portfolio of Investments – as of September 30, 2012
Loomis Sayles International Bond Fund – (continued)
| | | | | | | | |
| | (a) | | | Federal Tax Information: | |
| | | | At September 30, 2012, the net unrealized appreciation on investments based on a cost of $18,914,867 for federal income tax purposes was as follows: | |
| | | | Aggregate gross unrealized appreciation for all investments in which there is an excess of value over tax cost | | $ | 506,235 | |
| | | | Aggregate gross unrealized depreciation for all investments in which there is an excess of tax cost over value | | | (147,670 | ) |
| | | | | | | | |
| | | | Net unrealized appreciation | | $ | 358,565 | |
| | | | | | | | |
| | | | | | | | |
| | (b) | | | All or a portion of this security has been designated to cover the Fund’s obligations under open forward foreign currency contracts. | |
| | (c) | | | Variable rate security. Rate as of September 30, 2012 is disclosed. | |
| | | | | | | | |
| | 144A | | | All or a portion of these securities are exempt from registration under Rule 144A of the Securities Act of 1933. These securities may be resold in transactions exempt from registration, normally to qualified institutional buyers. At September 30, 2012, the value of Rule 144A holdings amounted to $686,363 or 3.5% of net assets. | |
| | EMTN | | | Euro Medium Term Note | | | | |
| | | | | | | | |
| | BRL | | | Brazilian Real | | | | |
| | CAD | | | Canadian Dollar | | | | |
| | CHF | | | Swiss Franc | | | | |
| | DKK | | | Danish Krone | | | | |
| | EUR | | | Euro | | | | |
| | GBP | | | British Pound | | | | |
| | JPY | | | Japanese Yen | | | | |
| | MXN | | | Mexican Peso | | | | |
| | MYR | | | Malaysian Ringgit | | | | |
| | NOK | | | Norwegian Krone | | | | |
| | PHP | | | Philippine Peso | | | | |
| | PLN | | | Polish Zloty | | | | |
| | SGD | | | Singapore Dollar | | | | |
| | UYU | | | Uruguayan Peso | | | | |
At September 30, 2012, the Fund had the following open forward foreign currency contracts:
| | | | | | | | | | | | | | | | | | |
Contract
to
Buy/Sell | | Delivery
Date | | | Currency | | Units | | | Notional
Value | | | Unrealized
Appreciation
(Depreciation) | |
| Sell1 | | | 12/28/2012 | | | British Pound | | | 156,000 | | | | 251,849 | | | $ | 779 | |
| Buy2 | | | 12/19/2012 | | | Canadian Dollar | | | 650,000 | | | | 660,010 | | | | (50 | ) |
| Buy1 | | | 12/19/2012 | | | Euro | | | 215,000 | | | | 276,517 | | | | 406 | |
| Buy3 | | | 12/21/2012 | | | Malaysian Ringgit | | | 290,000 | | | | 94,341 | | | | 87 | |
| Buy1 | | | 12/10/2012 | | | South Korean Won | | | 630,000,000 | | | | 564,949 | | | | 12,657 | |
| Buy4 | | | 12/10/2012 | | | South Korean Won | | | 104,700,000 | | | | 93,889 | | | | 2,140 | |
| | | | | | | | | | | | | | | | | | |
| Total | | | $ | 16,019 | |
| | | | | | | | | | | | | | | | | | |
See accompanying notes to financial statements.
| 54
Portfolio of Investments – as of September 30, 2012
Loomis Sayles International Bond Fund – (continued)
At September 30, 2012, the Fund had the following open forward cross currency contracts:
| | | | | | | | | | | | | | |
| Settlement Date | | Deliver/Units of Currency | | Receive5/Units of Currency | | | Unrealized
Appreciation
(Depreciation) | |
| 12/12/2012 | | Norwegian Krone | | 1,255,000 | | Euro | | | 170,195 | | | $ | 385 | |
| | | | | | | | | | | | | | |
1 Counterparty is Barclays Bank PLC.
2 Counterparty is UBS AG.
3 Counterparty is JP Morgan Chase Bank, N.A.
4 Counterparty is Credit Suisse AG.
5 Counterparty is Deutsche Bank AG.
Industry Summary at September 30, 2012 (Unaudited)
| | | | |
Treasuries | | | 64.9 | % |
Government Guaranteed | | | 6.5 | |
Sovereigns | | | 4.5 | |
Banking | | | 3.1 | |
Local Authorities | | | 2.5 | |
Wirelines | | | 2.2 | |
Media Non-Cable | | | 2.0 | |
Other Investments, less than 2% each | | | 10.4 | |
Short-Term Investments | | | 2.7 | |
| | | | |
Total Investments | | | 98.8 | |
Other assets less liabilities (including open forward foreign currency contracts) | | | 1.2 | |
| | | | |
Net Assets | | | 100.0 | % |
| | | | |
Currency Exposure Summary at September 30, 2012 (Unaudited)
| | | | |
Euro | | | 32.9 | % |
Japanese Yen | | | 29.0 | |
British Pound | | | 11.3 | |
United States Dollar | | | 8.3 | |
Norwegian Krone | | | 3.1 | |
Mexican Peso | | | 3.0 | |
Canadian Dollar | | | 2.1 | |
Singapore Dollar | | | 2.1 | |
Other, less than 2% each | | | 7.0 | |
| | | | |
Total Investments | | | 98.8 | |
Other assets less liabilities (including open forward foreign currency contracts) | | | 1.2 | |
| | | | |
Net Assets | | | 100.0 | % |
| | | | |
See accompanying notes to financial statements.
55 |
Portfolio of Investments – as of September 30, 2012
Loomis Sayles Limited Term Government and Agency Fund
| | | | | | | | |
Principal
Amount | | | Description | | Value (†) | |
| | Bonds and Notes — 90.7% of Net Assets | | | | |
| | | | ABS Car Loan — 1.6% | | | | |
| $ | 1,380,000 | | | Ally Master Owner Trust, Series 2011-1, Class A2, 2.150%, 1/15/2016 | | $ | 1,404,797 | |
| | 2,200,000 | | | Avis Budget Rental Car Funding AESOP LLC, Series 2012-3A, Class A,
2.100%, 3/20/2019, 144A | | | 2,244,086 | |
| | 910,000 | | | Credit Acceptance Auto Loan Trust, Series 2012-2A, Class A,
1.520%, 3/16/2020, 144A | | | 910,501 | |
| | 2,500,000 | | | First Investors Auto Owner Trust, Series 2012-2A, Class A2,
1.470%, 5/15/2018, 144A | | | 2,505,607 | |
| | 1,429,593 | | | SNAAC Auto Receivables Trust, Series 2012-1A, Class A,
1.780%, 6/15/2016, 144A | | | 1,432,244 | |
| | 1,960,210 | | | World Omni Auto Receivables Trust, Series 2011-A, Class A3,
1.110%, 5/15/2015 | | | 1,969,474 | |
| | | | | | | | |
| | | | | | | 10,466,709 | |
| | | | | | | | |
| | | | ABS Credit Card — 0.5% | | | | |
| | 985,000 | | | American Express Credit Account Master, Series 2004-2, Class A,
0.391%, 12/15/2016(b) | | | 986,659 | |
| | 2,100,000 | | | World Financial Network Credit Card Master Trust, Series 2010-A, Class A,
3.960%, 4/15/2019 | | | 2,271,087 | |
| | | | | | | | |
| | | | | | | 3,257,746 | |
| | | | | | | | |
| | | | ABS Home Equity — 0.1% | | | | |
| | 455,630 | | | Countrywide Asset-Backed Certificates, Series 2004-S1, Class A3,
5.115%, 2/25/2035(b) | | | 434,170 | |
| | 318,488 | | | Residential Funding Mortgage Securities II, Series 2002-HI5, Class A7,
5.700%, 1/25/2028(b) | | | 304,598 | |
| | | | | | | | |
| | | | | | | 738,768 | |
| | | | | | | | |
| | | | ABS Student Loan — 0.6% | | | | |
| | 3,745,726 | | | Montana Higher Education Student Assistance Corp., Series 2012-1, Class A1, 0.819%, 9/20/2022(b) | | | 3,745,726 | |
| | | | | | | | |
| | | | Collateralized Mortgage Obligations — 14.9% | | | | |
| | 272,240 | | | Federal Home Loan Mortgage Corp., REMIC, Series 1500, Class FD,
0.990%, 5/15/2023(b) | | | 278,899 | |
| | 177,294 | | | Federal Home Loan Mortgage Corp., REMIC, Series 1552, Class I,
1.090%, 8/15/2023(b) | | | 181,920 | |
| | 1,288,522 | | | Federal Home Loan Mortgage Corp., REMIC, Series 2646, Class FM,
0.621%, 11/15/2032(b) | | | 1,291,905 | |
| | 3,825,000 | | | Federal Home Loan Mortgage Corp., REMIC, Series 2874, Class BC,
5.000%, 10/15/2019 | | | 4,222,674 | |
| | 6,280,000 | | | Federal Home Loan Mortgage Corp., REMIC, Series 2931, Class DE,
4.000%, 2/15/2020 | | | 6,797,805 | |
| | 5,707,252 | | | Federal Home Loan Mortgage Corp., REMIC, Series 3561, Class W,
5.091%, 6/15/2048(b) | | | 6,311,863 | |
| | 6,947,696 | | | Federal Home Loan Mortgage Corp., REMIC, Series 3620, Class AT,
4.995%, 12/15/2036(b) | | | 7,153,720 | |
| | 200,381 | | | Federal National Mortgage Association, REMIC, Series 1992-162, Class FB,
1.100%, 9/25/2022(b) | | | 205,096 | |
See accompanying notes to financial statements.
| 56
Portfolio of Investments – as of September 30, 2012
Loomis Sayles Limited Term Government and Agency Fund – (continued)
| | | | | | | | |
Principal
Amount | | | Description | | Value (†) | |
| | | | Collateralized Mortgage Obligations — continued | | | | |
| $ | 170,750 | | | Federal National Mortgage Association, REMIC, Series 1994-42, Class FD,
1.240%, 4/25/2024(b) | | $ | 175,085 | |
| | 8,500,131 | | | Federal National Mortgage Association, REMIC, Series 2008-86, Class LA,
4.729%, 8/25/2038(b) | | | 8,644,114 | |
| | 143,117 | | | Federal National Mortgage Association, REMIC, Series G93-19, Class FD,
1.110%, 4/25/2023(b) | | | 146,525 | |
| | 1,586,187 | | | FHLMC, 2.931%, 12/01/2034(b) | | | 1,707,090 | |
| | 2,361,863 | | | FHLMC, 3.347%, 3/01/2038(b) | | | 2,534,774 | |
| | 2,932,436 | | | FHLMC, 5.319%, 11/01/2038(b) | | | 3,176,978 | |
| | 6,000,000 | | | FHLMC Multifamily Structured Pass Through Certificates, Series K006, Class A2, 4.251%, 1/25/2020 | | | 6,976,824 | |
| | 4,305,000 | | | FHLMC Multifamily Structured Pass Through Certificates, Series K014, Class A2, 3.871%, 4/25/2021 | | | 4,932,833 | |
| | 3,535,000 | | | FHLMC Multifamily Structured Pass Through Certificates, Series K703, Class A2, 2.699%, 5/25/2018 | | | 3,826,903 | |
| | 700,000 | | | FHLMC Multifamily Structured Pass Through Certificates, Series K704, Class A2, 2.412%, 8/25/2018 | | | 741,670 | |
| | 2,590,000 | | | FHLMC Multifamily Structured Pass Through Certificates, Series K706, Class A2, 2.323%, 10/25/2018 | | | 2,744,556 | |
| | 7,910,000 | | | FHLMC Multifamily Structured Pass Through Certificates, Series K708, Class A2, 2.130%, 1/25/2019 | | | 8,304,812 | |
| | 2,075,322 | | | FNMA, 2.270%, 9/01/2036(b) | | | 2,214,994 | |
| | 7,683,013 | | | FNMA, 2.787%, 9/01/2037(b) | | | 8,252,861 | |
| | 6,963,322 | | | FNMA, 2.966%, 7/01/2037(b) | | | 7,440,400 | |
| | 1,041,328 | | | NCUA Guaranteed Notes, Series 2010-A1, Class A, 0.569%, 12/07/2020(b) | | | 1,044,806 | |
| | 1,280,000 | | | NCUA Guaranteed Notes, Series 2010-C1, Class A2, 2.900%, 10/29/2020 | | | 1,376,000 | |
| | 1,766,961 | | | NCUA Guaranteed Notes, Series 2010-R1, Class 1A, 0.678%, 10/07/2020(b) | | | 1,774,913 | |
| | 6,311,445 | | | NCUA Guaranteed Notes, Series 2010-R3, Class 1A, 0.779%, 12/08/2020(b) | | | 6,349,314 | |
| | | | | | | | |
| | | | | | | 98,809,334 | |
| | | | | | | | |
| | | | Commercial Mortgage-Backed Securities — 13.6% | | | | |
| | 1,780,000 | | | Banc of America Merrill Lynch Commercial Mortgage, Inc., Series 2007-2, Class A4, 5.631%, 4/10/2049(b) | | | 2,071,765 | |
| | 375,000 | | | Banc of America Merrill Lynch Commercial Mortgage, Inc., Series 2007-5, Class A4, 5.492%, 2/10/2051 | | | 437,990 | |
| | 1,445,000 | | | Bear Stearns Commercial Mortgage Securities, Series 2007-PW15, Class A4,
5.331%, 2/11/2044 | | | 1,582,548 | |
| | 360,000 | | | Citigroup Commercial Mortgage Trust, Series 2006-C5, Class A4,
5.431%, 10/15/2049 | | | 417,309 | |
| | 1,470,000 | | | Citigroup Commercial Mortgage Trust, Series 2008-C7, Class A4,
6.263%, 12/10/2049(b) | | | 1,755,577 | |
| | 3,200,500 | | | Citigroup/Deutsche Bank Commercial Mortgage Trust, Series 2007-CD4, Class A4, 5.322%, 12/11/2049 | | | 3,644,166 | |
| | 1,135,000 | | | Commercial Mortgage Pass Through Certificates, Series 2012-CR2, Class A4,
3.147%, 8/15/2045 | | | 1,198,970 | |
| | 2,625,000 | | | Credit Suisse Mortgage Capital Certificates, Series 2007-C2, Class A3,
5.542%, 1/15/2049 | | | 2,942,426 | |
See accompanying notes to financial statements.
57 |
Portfolio of Investments – as of September 30, 2012
Loomis Sayles Limited Term Government and Agency Fund – (continued)
| | | | | | | | |
Principal
Amount | | | Description | | Value (†) | |
| | | | Commercial Mortgage-Backed Securities — continued | | | | |
| $ | 5,270,000 | | | Credit Suisse Mortgage Capital Certificates, Series 2007-C5, Class A4,
5.695%, 9/15/2040 | | $ | 5,985,497 | |
| | 3,000,000 | | | Credit Suisse Mortgage Capital Certificates, Series 2008-C1, Class A3,
6.407%, 2/15/2041(b) | | | 3,494,166 | |
| | 1,140,000 | | | CW Capital Cobalt Ltd., Series 2007-C2, Class A3, 5.484%, 4/15/2047 | | | 1,305,010 | |
| | 7,778,000 | | | Greenwich Capital Commercial Funding Corp., Series 2007-GG11, Class A4,
5.736%, 12/10/2049 | | | 9,072,695 | |
| | 5,000,000 | | | Greenwich Capital Commercial Funding Corp., Series 2007-GG9, Class A4,
5.444%, 3/10/2039 | | | 5,709,110 | |
| | 295,000 | | | JPMorgan Chase Commercial Mortgage Securities Corp., Series 2006-CB15, Class A4, 5.814%, 6/12/2043 | | | 335,941 | |
| | 2,785,000 | | | JPMorgan Chase Commercial Mortgage Securities Corp., Series 2007-CB18, Class A4, 5.440%, 6/12/2047 | | | 3,207,741 | |
| | 5,000,000 | | | JPMorgan Chase Commercial Mortgage Securities Corp., Series 2007-LDPX, Class A3, 5.420%, 1/15/2049 | | | 5,752,725 | |
| | 2,000,000 | | | LB-UBS Commercial Mortgage Trust, Series 2007-C2, Class A3,
5.430%, 2/15/2040 | | | 2,287,916 | |
| | 4,000,000 | | | LB-UBS Commercial Mortgage Trust, Series 2007-C7, Class A3,
5.866%, 9/15/2045 | | | 4,764,600 | |
| | 1,173,000 | | | Merrill Lynch/Countrywide Commercial Mortgage Trust, Series 2007-5,
Class A4, 5.378%, 8/12/2048 | | | 1,322,935 | |
| | 5,364,000 | | | Merrill Lynch/Countrywide Commercial Mortgage Trust, Series 2007-6,
Class A4, 5.485%, 3/12/2051 | | | 6,095,693 | |
| | 2,670,000 | | | Merrill Lynch/Countrywide Commercial Mortgage Trust, Series 2007-8,
Class A3, 6.147%, 8/12/2049(b) | | | 3,057,777 | |
| | 5,000,000 | | | Merrill Lynch/Countrywide Commercial Mortgage Trust, Series 2007-9,
Class A4, 5.700%, 9/12/2049 | | | 5,674,295 | |
| | 3,135,000 | | | Morgan Stanley Capital I, Series 2007-HQ12, Class A5, 5.759%, 4/12/2049(b) | | | 3,520,674 | |
| | 3,000,000 | | | Morgan Stanley Capital I, Series 2007-HQ13, Class A3, 5.569%, 12/15/2044 | | | 3,388,014 | |
| | 1,500,000 | | | Morgan Stanley Capital I, Series 2007-IQ15, Class A4, 6.076%, 6/11/2049(b) | | | 1,762,229 | |
| | 4,410,000 | | | Wachovia Bank Commercial Mortgage Trust, Series 2006-C28, Class A4,
5.572%, 10/15/2048 | | | 5,068,903 | |
| | 3,775,000 | | | Wachovia Bank Commercial Mortgage Trust, Series 2007-C30, Class A5,
5.342%, 12/15/2043 | | | 4,272,941 | |
| | | | | | | | |
| | | | | | | 90,129,613 | |
| | | | | | | | |
| | | | Government Guaranteed — 0.3% | | | | |
| | 2,340,000 | | | US Central Federal Credit Union, (FDIC insured), 1.900%, 10/19/2012 | | | 2,341,848 | |
| | | | | | | | |
| | | | Government Owned - No Guarantee — 4.0% | | | | |
| | 17,970,000 | | | Federal National Mortgage Association, 3.625%, 2/12/2013 | | | 18,195,074 | |
| | 8,265,000 | | | Federal National Mortgage Association, 4.750%, 11/19/2012 | | | 8,315,541 | |
| | | | | | | | |
| | | | | | | 26,510,615 | |
| | | | | | | | |
| | | | Hybrid ARMs — 22.1% | | | | |
| | 3,094,234 | | | FHLMC, 2.290%, 4/01/2036(b) | | | 3,299,372 | |
| | 5,282,135 | | | FHLMC, 2.345%, 7/01/2033(b) | | | 5,637,631 | |
| | 2,570,652 | | | FHLMC, 2.370%, 4/01/2035(b) | | | 2,754,591 | |
| | 3,783,276 | | | FHLMC, 2.370%, 3/01/2036(b) | | | 4,039,591 | |
See accompanying notes to financial statements.
| 58
Portfolio of Investments – as of September 30, 2012
Loomis Sayles Limited Term Government and Agency Fund – (continued)
| | | | | | | | |
Principal
Amount | | | Description | | Value (†) | |
| | | | Hybrid ARMs — continued | | | | |
| $ | 1,218,575 | | | FHLMC, 2.375%, 2/01/2035(b) | | $ | 1,300,354 | |
| | 7,696,905 | | | FHLMC, 2.375%, 2/01/2036(b) | | | 8,151,425 | |
| | 3,421,920 | | | FHLMC, 2.415%, 2/01/2036(b) | | | 3,597,919 | |
| | 2,436,549 | | | FHLMC, 2.420%, 6/01/2037(b) | | | 2,597,943 | |
| | 7,746,584 | | | FHLMC, 2.479%, 5/01/2037(b) | | | 8,318,808 | |
| | 5,159,647 | | | FHLMC, 2.526%, 9/01/2035(b) | | | 5,546,985 | |
| | 1,394,754 | | | FHLMC, 2.739%, 4/01/2037(b) | | | 1,499,433 | |
| | 4,289,867 | | | FHLMC, 2.766%, 11/01/2036(b) | | | 4,591,271 | |
| | 4,176,516 | | | FHLMC, 2.994%, 4/01/2037(b) | | | 4,499,988 | |
| | 2,262,175 | | | FHLMC, 3.587%, 11/01/2038(b) | | | 2,434,855 | |
| | 4,987,887 | | | FHLMC, 5.073%, 9/01/2038(b) | | | 5,375,284 | |
| | 797,422 | | | FHLMC, 5.295%, 12/01/2037(b) | | | 860,804 | |
| | 1,027,470 | | | FHLMC, 5.659%, 9/01/2038(b) | | | 1,109,651 | |
| | 1,725,813 | | | FHLMC, 5.756%, 3/01/2037(b) | | | 1,871,436 | |
| | 397,068 | | | FNMA, 2.261%, 2/01/2037(b) | | | 422,058 | |
| | 1,467,707 | | | FNMA, 2.270%, 9/01/2034(b) | | | 1,564,275 | |
| | 4,035,241 | | | FNMA, 2.299%, 7/01/2035(b) | | | 4,309,212 | |
| | 882,299 | | | FNMA, 2.310%, 12/01/2034(b) | | | 938,531 | |
| | 2,415,568 | | | FNMA, 2.310%, 1/01/2036(b) | | | 2,536,579 | |
| | 853,518 | | | FNMA, 2.319%, 4/01/2033(b) | | | 910,743 | |
| | 3,103,438 | | | FNMA, 2.334%, 4/01/2034(b) | | | 3,309,174 | |
| | 12,227,432 | | | FNMA, 2.344%, 10/01/2034(b) | | | 13,026,328 | |
| | 3,538,690 | | | FNMA, 2.345%, 6/01/2036(b) | | | 3,791,365 | |
| | 4,745,570 | | | FNMA, 2.347%, 8/01/2035(b) | | | 5,060,216 | |
| | 2,955,281 | | | FNMA, 2.412%, 6/01/2033(b) | | | 3,115,642 | |
| | 4,616,317 | | | FNMA, 2.412%, 10/01/2033(b) | | | 4,924,375 | |
| | 817,788 | | | FNMA, 2.550%, 8/01/2033(b) | | | 876,716 | |
| | 806,079 | | | FNMA, 2.625%, 8/01/2036(b) | | | 867,037 | |
| | 2,237,129 | | | FNMA, 2.664%, 5/01/2035(b) | | | 2,416,601 | |
| | 1,918,399 | | | FNMA, 2.795%, 8/01/2034(b) | | | 2,064,702 | |
| | 3,466,505 | | | FNMA, 2.823%, 4/01/2037(b) | | | 3,719,612 | |
| | 2,228,911 | | | FNMA, 2.916%, 2/01/2047(b) | | | 2,396,327 | |
| | 5,691,302 | | | FNMA, 3.402%, 6/01/2037(b) | | | 6,063,725 | |
| | 4,931,180 | | | FNMA, 3.473%, 6/01/2035(b) | | | 5,275,861 | |
| | 10,381,216 | | | FNMA, 5.775%, 9/01/2037(b) | | | 11,256,480 | |
| | | | | | | | |
| | | | | | | 146,332,900 | |
| | | | | | | | |
| | | | Mortgage Related — 20.0% | | | | |
| | 11,880,762 | | | FHLMC, 2.382%, 3/01/2037(b) | | | 12,672,821 | |
| | 1,271,512 | | | FHLMC, 4.000%, 12/01/2024 | | | 1,353,649 | |
| | 3,586,671 | | | FHLMC, 4.500%, with various maturities from 2025 to 2034(c) | | | 3,849,281 | |
| | 1,094,310 | | | FHLMC, 5.500%, 10/01/2023 | | | 1,189,702 | |
| | 73,642 | | | FHLMC, 6.000%, 11/01/2019 | | | 81,737 | |
| | 2,729,802 | | | FHLMC, 6.500%, with various maturities from 2014 to 2034(c) | | | 3,097,567 | |
| | 86,620 | | | FHLMC, 7.000%, 2/01/2016 | | | 92,182 | |
| | 2,917 | | | FHLMC, 7.500%, with various maturities from 2014 to 2026(c) | | | 3,199 | |
| | 4,694 | | | FHLMC, 8.000%, 9/01/2015 | | | 5,041 | |
| | 2,947 | | | FHLMC, 10.000%, 7/01/2019 | | | 3,491 | |
See accompanying notes to financial statements.
59 |
Portfolio of Investments – as of September 30, 2012
Loomis Sayles Limited Term Government and Agency Fund – (continued)
| | | | | | | | |
Principal
Amount | | | Description | | Value (†) | |
| | | | Mortgage Related — continued | | | | |
| $ | 61,894 | | | FHLMC, 11.500%, with various maturities from 2015 to 2020(c) | | $ | 73,637 | |
| | 8,523,409 | | | FNMA, 2.571%, 4/01/2037(b) | | | 9,092,015 | |
| | 7,158,726 | | | FNMA, 2.606%, 7/01/2035(b) | | | 7,651,424 | |
| | 21,586,661 | | | FNMA, 3.000%, with various maturities from 2026 to 2042(c) | | | 22,918,802 | |
| | 2,006,353 | | | FNMA, 4.000%, with various maturities in 2019(c) | | | 2,153,515 | |
| | 4,635,893 | | | FNMA, 4.500%, 1/01/2025 | | | 5,005,626 | |
| | 8,157,830 | | | FNMA, 5.000%, with various maturities from 2037 to 2038(c) | | | 8,965,419 | |
| | 2,009,837 | | | FNMA, 5.500%, with various maturities from 2018 to 2033(c) | | | 2,212,798 | |
| | 6,709,159 | | | FNMA, 6.000%, with various maturities from 2017 to 2022(c) | | | 7,393,371 | |
| | 1,146,389 | | | FNMA, 6.500%, with various maturities from 2017 to 2037(c) | | | 1,303,869 | |
| | 34,048 | | | FNMA, 7.000%, 12/01/2022 | | | 37,574 | |
| | 240,904 | | | FNMA, 7.500%, with various maturities from 2015 to 2032(c) | | | 292,077 | |
| | 19,870 | | | FNMA, 8.000%, with various maturities from 2015 to 2016(c) | | | 21,345 | |
| | 6,084,605 | | | GNMA, 2.070%, 2/20/2061(b) | | | 6,511,336 | |
| | 4,883,623 | | | GNMA, 4.479%, 2/20/2062 | | | 5,495,653 | |
| | 4,964,554 | | | GNMA, 4.521%, 12/20/2061 | | | 5,642,617 | |
| | 2,551,474 | | | GNMA, 4.528%, 3/20/2062 | | | 2,911,344 | |
| | 2,556,512 | | | GNMA, 4.560%, 3/20/2062 | | | 2,913,592 | |
| | 4,470,873 | | | GNMA, 4.604%, 6/20/2062 | | | 5,138,857 | |
| | 1,540,076 | | | GNMA, 4.616%, 8/20/2061 | | | 1,748,206 | |
| | 8,816,836 | | | GNMA, 4.659%, 2/20/2062 | | | 10,088,004 | |
| | 1,735,000 | | | GNMA, 4.808%, 8/20/2062 | | | 1,982,780 | |
| | 46,865 | | | GNMA, 6.000%, 12/15/2031 | | | 53,770 | |
| | 176,300 | | | GNMA, 6.500%, 5/15/2031 | | | 204,478 | |
| | 185,050 | | | GNMA, 7.000%, 10/15/2028 | | | 222,300 | |
| | 456 | | | GNMA, 12.500%, 6/15/2014 | | | 459 | |
| | | | | | | | |
| | | | | | | 132,383,538 | |
| | | | | | | | |
| | | | Treasuries — 13.0% | | | | |
| | 24,600,000 | | | U.S. Treasury Note, 0.250%, 8/15/2015 | | | 24,561,575 | |
| | 13,260,000 | | | U.S. Treasury Note, 0.625%, 7/15/2014 | | | 13,350,128 | |
| | 7,480,000 | | | U.S. Treasury Note, 0.875%, 4/30/2017 | | | 7,585,775 | |
| | 40,005,000 | | | U.S. Treasury Note, 1.750%, 4/15/2013 | | | 40,345,682 | |
| | | | | | | | |
| | | | | | | 85,843,160 | |
| | | | | | | | |
| | | | Total Bonds and Notes
(Identified Cost $582,329,491) | | | 600,559,957 | |
| | | | | | | | |
| | | | | | | | |
| | Short-Term Investments — 9.2% | | | | |
| | 18,098,014 | | | Tri-Party Repurchase Agreement with Fixed Income Clearing Corporation, dated 9/28/2012 at 0.010% to be repurchased at $18,098,029 on 10/01/2012 collateralized by $17,970,000 Federal Home Loan Mortgage Corp., 3.000% due 7/10/2019 valued at $18,464,175 including accrued interest (Note 2 of Notes to Financial Statements) | | | 18,098,014 | |
| | 2,985,000 | | | U.S. Treasury Bill, 0.102%, 11/01/2012(d) | | | 2,984,851 | |
See accompanying notes to financial statements.
| 60
Portfolio of Investments – as of September 30, 2012
Loomis Sayles Limited Term Government and Agency Fund – (continued)
| | | | | | | | |
Principal
Amount | | | Description | | Value (†) | |
| | Short-Term Investments — (continued) | | | | |
| $ | 22,400,000 | | | U.S. Treasury Bills, 0.091%-0.100%, 12/13/2012(d)(e) | | $ | 22,396,259 | |
| | 17,800,000 | | | U.S. Treasury Bills, 0.098%-0.122%, 11/29/2012(d)(e) | | | 17,798,184 | |
| | | | | | | | |
| | | | Total Short-Term Investments
(Identified Cost $61,274,774) | | | 61,277,308 | |
| | | | | | | | |
| | | | | | | | |
| | | | Total Investments — 99.9%
(Identified Cost $643,604,265)(a) | | | 661,837,265 | |
| | | | Other assets less liabilities — 0.1% | | | 368,373 | |
| | | | | | | | |
| | | | Net Assets — 100.0% | | $ | 662,205,638 | |
| | | | | | | | |
| | | | | | | | |
| | (†) | | | See Note 2 of Notes to Financial Statements. | | | | |
| | (a) | | | Federal Tax Information: | | | | |
| | | | At September 30, 2012, the net unrealized appreciation on investments based on a cost of $645,538,314 for federal income tax purposes was as follows: | |
| | | | Aggregate gross unrealized appreciation for all investments in which there is an excess of value over tax cost | | $ | 18,346,716 | |
| | | | Aggregate gross unrealized depreciation for all investments in which there is an excess of tax cost over value | | | (2,047,765 | ) |
| | | | | | | | |
| | | | Net unrealized appreciation | | $ | 16,298,951 | |
| | | | | | | | |
| | | | | | | | |
| | (b) | | | Variable rate security. Rate as of September 30, 2012 is disclosed. | |
| | (c) | | | The Fund’s investment in mortgage related securities of Federal Home Loan Mortgage Corporation and Federal National Mortgage Association are interests in separate pools of mortgages. All separate investments in securities of each issuer which have the same coupon rate have been aggregated for the purpose of presentation in the Portfolio of Investments. | |
| | (d) | | | Interest rate represents discount rate at time of purchase; not a coupon rate. | |
| | (e) | | | The Fund’s investment in U.S. Treasury Bills is comprised of various lots with differing discount rates. These separate investments, which have the same maturity date, have been aggregated for the purpose of presentation in the Portfolio of Investments. | |
| | | | | | | | |
| | 144A | | | All or a portion of these securities are exempt from registration under Rule 144A of the Securities Act of 1933. These securities may be resold in transactions exempt from registration, normally to qualified institutional buyers. At September 30, 2012, the value of Rule 144A holdings amounted to $7,092,438 or 1.1% of net assets. | |
| | ABS | | | Asset-Backed Securities | |
| | ARMs | | | Adjustable Rate Mortgages | |
| | FDIC | | | Federal Deposit Insurance Corporation | |
| | FHLMC | | | Federal Home Loan Mortgage Corp. | |
| | FNMA | | | Federal National Mortgage Association | |
| | GNMA | | | Government National Mortgage Association | |
| | REMIC | | | Real Estate Mortgage Investment Conduit | |
See accompanying notes to financial statements.
61 |
Portfolio of Investments – as of September 30, 2012
Loomis Sayles Limited Term Government and Agency Fund – (continued)
Industry Summary at September 30, 2012 (Unaudited)
| | | | |
Hybrid ARMs | | | 22.1 | % |
Mortgage Related | | | 20.0 | |
Collateralized Mortgage Obligations | | | 14.9 | |
Commercial Mortgage-Backed Securities | | | 13.6 | |
Treasuries | | | 13.0 | |
Government Owned-No Guarantee | | | 4.0 | |
Other Investments, less than 2% each | | | 3.1 | |
Short-Term Investments | | | 9.2 | |
| | | | |
Total Investments | | | 99.9 | |
Other assets less liabilities | | | 0.1 | |
| | | | |
Net Assets | | | 100.0 | % |
| | | | |
See accompanying notes to financial statements.
| 62
Statements of Assets and Liabilities
September 30, 2012
| | | | | | | | | | | | | | | | |
| | | Core Plus Bond
Fund | | | High Income
Fund | | | International
Bond Fund | | | Limited Term
Government
and Agency
Fund | |
ASSETS | | | | | | | | | | | | | | | | |
Investments at cost | | $ | 1,271,936,975 | | | $ | 188,947,994 | | | $ | 18,317,973 | | | $ | 625,506,251 | |
Repurchase agreement(s) at cost | | | 78,821,191 | | | | 27,958,852 | | | | 518,975 | | | | 18,098,014 | |
Net unrealized appreciation | | | 66,239,778 | | | | 8,433,353 | | | | 436,484 | | | | 18,233,000 | |
| | | | | | | | | | | | | | | | |
Investments at value | | | 1,416,997,944 | | | | 225,340,199 | | | | 19,273,432 | | | | 661,837,265 | |
Cash | | | 4,449 | | | | — | | | | — | | | | — | |
Due from brokers (Note 2) | | | — | | | | 270,000 | | | | — | | | | — | |
Foreign currency at value (identified cost $0, $9, $327,028 and $0) | | | — | | | | 9 | | | | 331,895 | | | | — | |
Receivable for Fund shares sold | | | 14,657,480 | | | | 1,108,935 | | | | 3,267 | | | | 4,321,011 | |
Receivable from investment adviser (Note 6) | | | — | | | | — | | | | 4,202 | | | | — | |
Receivable for securities sold | | | 2,606,968 | | | | — | | | | 168,155 | | | | — | |
Dividends and interest receivable | | | 14,208,857 | | | | 3,213,144 | | | | 199,859 | | | | 3,388,405 | |
Unrealized appreciation on forward foreign currency contracts (Note 2) | | | — | | | | 189 | | | | 16,454 | | | | — | |
Tax reclaims receivable | | | — | | | | 99 | | | | — | | | | — | |
| | | | | | | | | | | | | | | | |
TOTAL ASSETS | | | 1,448,475,698 | | | | 229,932,575 | | | | 19,997,264 | | | | 669,546,681 | |
| | | | | | | | | | | | | | | | |
LIABILITIES | | | | | | | | | | | | | | | | |
Payable for securities purchased | | | 27,854,418 | | | | 4,880,721 | | | | 365,539 | | | | 5,417,968 | |
Payable for delayed delivery securities purchased (Note 2) | | | 19,646,253 | | | | — | | | | — | | | | — | |
Payable for Fund shares redeemed | | | 7,427,336 | | | | 238,675 | | | | 39 | | | | 991,572 | |
Unrealized depreciation on forward foreign currency contracts (Note 2) | | | — | | | | 243,423 | | | | 50 | | | | — | |
Distributions payable | | | — | | | | — | | | | — | | | | 281,584 | |
Management fees payable (Note 6) | | | 426,197 | | | | 102,923 | | | | — | | | | 181,822 | |
Deferred Trustees’ fees (Note 6) | | | 284,707 | | | | 121,449 | | | | 46,468 | | | | 267,626 | |
Administrative fees payable (Note 6) | | | 49,773 | | | | 7,757 | | | | 714 | | | | 23,284 | |
Payable to distributor (Note 6d) | | | 9,122 | | | | 1,868 | | | | 183 | | | | 2,576 | |
Other accounts payable and accrued expenses | | | 275,760 | | | | 119,935 | | | | 67,634 | | | | 174,611 | |
| | | | | | | | | | | | | | | | |
TOTAL LIABILITIES | | | 55,973,566 | | | | 5,716,751 | | | | 480,627 | | | | 7,341,043 | |
| | | | | | | | | | | | | | | | |
NET ASSETS | | $ | 1,392,502,132 | | | $ | 224,215,824 | | | $ | 19,516,637 | | | $ | 662,205,638 | |
| | | | | | | | | | | | | | | | |
NET ASSETS CONSIST OF: | | | | | | | | | | | | | | | | |
Paid-in capital | | $ | 1,303,405,393 | | | $ | 215,057,697 | | | $ | 18,774,857 | | | $ | 646,221,165 | |
Undistributed (Distributions in excess of) net investment income | | | 5,332,135 | | | | 437,961 | | | | 12,535 | | | | (549,210 | ) |
Accumulated net realized gain (loss) on investments and foreign currency transactions | | | 17,485,080 | | | | 526,634 | | | | 268,597 | | | | (1,699,317 | ) |
Net unrealized appreciation on investments and foreign currency translations | | | 66,279,524 | | | | 8,193,532 | | | | 460,648 | | | | 18,233,000 | |
| | | | | | | | | | | | | | | | |
NET ASSETS | | $ | 1,392,502,132 | | | $ | 224,215,824 | | | $ | 19,516,637 | | | $ | 662,205,638 | |
| | | | | | | | | | | | | | | | |
See accompanying notes to financial statements.
63 |
Statements of Assets and Liabilities (continued)
| | | | | | | | | | | | | | | | |
| | | Core Plus Bond
Fund | | | High Income
Fund | | | International
Bond Fund | | | Limited Term
Government
and Agency
Fund | |
COMPUTATION OF NET ASSET VALUE AND OFFERING PRICE: | | | | | | | | | | | | | | | | |
Class A shares: | | | | | | | | | | | | | | | | |
Net assets | | $ | 479,823,145 | | | $ | 95,875,734 | | | $ | 11,897,916 | | | $ | 357,870,100 | |
| | | | | | | | | | | | | | | | |
Shares of beneficial interest | | | 35,487,306 | | | | 20,856,511 | | | | 1,139,409 | | | | 29,722,465 | |
| | | | | | | | | | | | | | | | |
Net asset value and redemption price per share | | $ | 13.52 | | | $ | 4.60 | | | $ | 10.44 | | | $ | 12.04 | |
| | | | | | | | | | | | | | | | |
Offering price per share (100/[100-maximum sales charge] of net asset value) (Note 1) | | $ | 14.16 | | | $ | 4.82 | | | $ | 10.93 | | | $ | 12.41 | |
| | | | | | | | | | | | | | | | |
Class B shares: (redemption price per share is equal to net asset value less any applicable contingent deferred sales charge) (Note 1) | | | | | | | | | | | | | | | | |
Net assets | | $ | 2,386,283 | | | $ | 560,416 | | | $ | — | | | $ | 8,369,779 | |
| | | | | | | | | | | | | | | | |
Shares of beneficial interest | | | 175,794 | | | | 121,500 | | | | — | | | | 695,860 | |
| | | | | | | | | | | | | | | | |
Net asset value and offering price per share | | $ | 13.57 | | | $ | 4.61 | | | $ | — | | | $ | 12.03 | |
| | | | | | | | | | | | | | | | |
Class C shares: (redemption price per share is equal to net asset value less any applicable contingent deferred sales charge) (Note 1) | | | | | | | | | | | | | | | | |
Net assets | | $ | 275,346,460 | | | $ | 16,862,826 | | | $ | 4,355,078 | | | $ | 75,521,946 | |
| | | | | | | | | | | | | | | | |
Shares of beneficial interest | | | 20,357,910 | | | | 3,660,267 | | | | 419,932 | | | | 6,267,107 | |
| | | | | | | | | | | | | | | | |
Net asset value and offering price per share | | $ | 13.53 | | | $ | 4.61 | | | $ | 10.37 | | | $ | 12.05 | |
| | | | | | | | | | | | | | | | |
Class Y shares: | | | | | | | | | | | | | | | | |
Net assets | | $ | 634,946,244 | | | $ | 110,916,848 | | | $ | 3,263,643 | | | $ | 220,443,813 | |
| | | | | | | | | | | | | | | | |
Shares of beneficial interest | | | 46,655,940 | | | | 24,150,781 | | | | 312,559 | | | | 18,251,597 | |
| | | | | | | | | | | | | | | | |
Net asset value, offering and redemption price per share | | $ | 13.61 | | | $ | 4.59 | | | $ | 10.44 | | | $ | 12.08 | |
| | | | | | | | | | | | | | | | |
See accompanying notes to financial statements.
| 64
Statements Of Operations
For the Year Ended September 30, 2012
| | | | | | | | | | | | | | | | |
| | | Core Plus
Bond Fund | | | High Income
Fund | | | International
Bond Fund | | | Limited Term
Government
and Agency
Fund | |
INVESTMENT INCOME | | | | | | | | | | | | | |
Interest | | $ | 38,181,621 | | | $ | 10,257,426 | | | $ | 629,574 | | | $ | 13,203,377 | |
Dividends | | | 201,329 | | | | 566,047 | | | | — | | | | — | |
Less net foreign taxes withheld | | | (5,751 | ) | | | (12,220 | ) | | | (1,788 | ) | | | — | |
| | | | | | | | | | | | | | | | |
| | | 38,377,199 | | | | 10,811,253 | | | | 627,786 | | | | 13,203,377 | |
| | | | | | | | | | | | | | | | |
Expenses | | | | | | | | | | | | | | | | |
Management fees (Note 6) | | | 3,626,666 | | | | 973,470 | | | | 128,583 | | | | 2,463,264 | |
Service and distribution fees (Note 6) | | | 2,957,021 | | | | 363,310 | | | | 86,983 | | | | 1,593,173 | |
Administrative fees (Note 6) | | | 424,288 | | | | 73,840 | | | | 9,774 | | | | 252,012 | |
Trustees’ fees and expenses (Note 6) | | | 56,599 | | | | 28,525 | | | | 19,765 | | | | 47,362 | |
Transfer agent fees and expenses (Note 6) | | | 800,521 | | | | 225,964 | | | | 20,837 | | | | 483,790 | |
Audit and tax services fees | | | 48,475 | | | | 48,133 | | | | 48,850 | | | | 49,008 | |
Custodian fees and expenses | | | 51,144 | | | | 32,784 | | | | 42,272 | | | | 34,970 | |
Legal fees | | | 13,259 | | | | 2,286 | | | | 297 | | | | 7,896 | |
Registration fees | | | 279,141 | | | | 121,142 | | | | 64,174 | | | | 190,474 | |
Shareholder reporting expenses | | | 59,243 | | | | 17,152 | | | | 1,109 | | | | 45,007 | |
Miscellaneous expenses | | | 21,613 | | | | 9,788 | | | | 7,884 | | | | 18,889 | |
| | | | | | | | | | | | | | | | |
Total expenses | | | 8,337,970 | | | | 1,896,394 | | | | 430,528 | | | | 5,185,845 | |
Less waiver and/or expense reimbursement (Note 6) | | | — | | | | (72,653 | ) | | | (162,917 | ) | | | (272,752 | ) |
| | | | | | | | | | | | | | | | |
Net expenses | | | 8,337,970 | | | | 1,823,741 | | | | 267,611 | | | | 4,913,093 | |
| | | | | | | | | | | | | | | | |
Net investment income | | | 30,039,229 | | | | 8,987,512 | | | | 360,175 | | | | 8,290,284 | |
| | | | | | | | | | | | | | | | |
NET REALIZED AND UNREALIZED GAIN (LOSS) ON INVESTMENTS AND FOREIGN CURRENCY TRANSACTIONS | | | | | | | | | | | | | | | | |
Net realized gain (loss) on: | | | | | | | | | | | | | | | | |
Investments | | | 23,998,717 | | | | 1,005,891 | | | | 559,544 | | | | 4,423,642 | |
Foreign currency transactions | | | 3,487,734 | | | | 571,902 | | | | (105,601 | ) | | | — | |
Net change in unrealized appreciation (depreciation) on: | | | | | | | | | | | | | | | | |
Investments | | | 53,339,948 | | | | 18,109,297 | | | | 451,825 | | | | 8,386,594 | |
Foreign currency translations | | | (555,803 | ) | | | (442,608 | ) | | | 237,041 | | | | — | |
| | | | | | | | | | | | | | | | |
Net realized and unrealized gain on investments and foreign currency transactions | | | 80,270,596 | | | | 19,244,482 | | | | 1,142,809 | | | | 12,810,236 | |
| | | | | | | | | | | | | | | | |
NET INCREASE IN NET ASSETS RESULTING FROM OPERATIONS | | $ | 110,309,825 | | | $ | 28,231,994 | | | $ | 1,502,984 | | | $ | 21,100,520 | |
| | | | | | | | | | | | | | | | |
See accompanying notes to financial statements.
65 |
Statements of Changes in Net Assets
| | | | | | | | | | | | | | | | |
| | | Core Plus Bond Fund | | | High Income Fund | |
| | | Year Ended
September 30,
2012 | | | Year Ended
September 30,
2011 | | | Year Ended
September 30,
2012 | | | Year Ended
September 30,
2011 | |
FROM OPERATIONS: | | | | | | | | | | | | | | | | |
Net investment income | | $ | 30,039,229 | | | $ | 15,808,339 | | | $ | 8,987,512 | | | $ | 9,114,367 | |
Net realized gain on investments and foreign currency transactions | | | 27,486,451 | | | | 12,668,941 | | | | 1,577,793 | | | | 13,134,551 | |
Net change in unrealized appreciation (depreciation) on investments and foreign currency translations | | | 52,784,145 | | | | (13,172,679 | ) | | | 17,666,689 | | | | (24,069,928 | ) |
| | | | | | | | | | | | | | | | |
Net increase (decrease) in net assets resulting from operations | | | 110,309,825 | | | | 15,304,601 | | | | 28,231,994 | | | | (1,821,010 | ) |
| | | | | | | | | | | | | | | | |
FROM DISTRIBUTIONS TO SHAREHOLDERS: | | | | | | | | | | | | | | | | |
Net investment income | | | | | | | | | | | | | | | | |
Class A | | | (13,530,505 | ) | | | (9,722,337 | ) | | | (4,924,736 | ) | | | (4,818,304 | ) |
Class B | | | (83,437 | ) | | | (140,826 | ) | | | (37,943 | ) | | | (55,282 | ) |
Class C | | | (6,193,213 | ) | | | (4,743,579 | ) | | | (960,754 | ) | | | (1,092,134 | ) |
Class Y | | | (14,560,785 | ) | | | (3,422,261 | ) | | | (4,576,130 | ) | | | (4,173,442 | ) |
Net realized capital gains | | | | | | | | | | | | | | | | |
Class A | | | (4,420,850 | ) | | | — | | | | (5,086,896 | ) | | | — | |
Class B | | | (45,406 | ) | | | — | | | | (56,566 | ) | | | — | |
Class C | | | (2,475,931 | ) | | | — | | | | (1,334,655 | ) | | | — | |
Class Y | | | (2,888,997 | ) | | | — | | | | (4,826,965 | ) | | | — | |
| | | | | | | | | | | | | | | | |
Total distributions | | | (44,199,124 | ) | | | (18,029,003 | ) | | | (21,804,645 | ) | | | (10,139,162 | ) |
| | | | | | | | | | | | | | | | |
NET INCREASE (DECREASE) IN NET ASSETS FROM CAPITAL SHARE TRANSACTIONS (NOTE 10) | | | 804,488,815 | | | | 112,969,587 | | | | 103,343,166 | | | | (32,012,862 | ) |
| | | | | | | | | | | | | | | | |
Net increase (decrease) in net assets | | | 870,599,516 | | | | 110,245,185 | | | | 109,770,515 | | | | (43,973,034 | ) |
NET ASSETS | | | | | | | | | | | | | | | | |
Beginning of the year | | | 521,902,616 | | | | 411,657,431 | | | | 114,445,309 | | | | 158,418,343 | |
| | | | | | | | | | | | | | | | |
End of the year | | $ | 1,392,502,132 | | | $ | 521,902,616 | | | $ | 224,215,824 | | | $ | 114,445,309 | |
| | | | | | | | | | | | | | | | |
UNDISTRIBUTED NET INVESTMENT INCOME | | $ | 5,332,135 | | | $ | 1,152,730 | | | $ | 437,961 | | | $ | 932,138 | |
| | | | | | | | | | | | | | | | |
See accompanying notes to financial statements.
| 66
Statements of Changes in Net Assets (continued)
| | | | | | | | | | | | | | | | |
| | | International Bond Fund | | | Limited Term Government and
Agency Fund | |
| | | Year Ended
September 30,
2012 | | | Year Ended
September 30,
2011 | | | Year Ended
September 30,
2012 | | | Year Ended
September 30,
2011 | |
FROM OPERATIONS: | | | | | | | | | | | | | | | | |
Net investment income | | $ | 360,175 | | | $ | 554,267 | | | $ | 8,290,284 | | | $ | 5,442,750 | |
Net realized gain on investments and foreign currency transactions | | | 453,943 | | | | 2,521,734 | | | | 4,423,642 | | | | 3,687,939 | |
Net change in unrealized appreciation (depreciation) on investments and foreign currency translations | | | 688,866 | | | | (2,686,191 | ) | | | 8,386,594 | | | | (2,532,547 | ) |
| | | | | | | | | | | | | | | | |
Net increase in net assets resulting from operations | | | 1,502,984 | | | | 389,810 | | | | 21,100,520 | | | | 6,598,142 | |
| | | | | | | | | | | | | | | | |
FROM DISTRIBUTIONS TO SHAREHOLDERS: | | | | | | | | | | | | | | | | |
Net investment income | | | | | | | | | | | | | | | | |
Class A | | | (793,528 | ) | | | (571,142 | ) | | | (7,335,704 | ) | | | (5,000,378 | ) |
Class B | | | — | | | | — | | | | (161,039 | ) | | | (124,663 | ) |
Class C | | | (546,527 | ) | | | (182,583 | ) | | | (1,216,984 | ) | | | (990,378 | ) |
Class Y | | | (354,205 | ) | | | (143,686 | ) | | | (4,276,382 | ) | | | (2,328,759 | ) |
Net realized capital gains | | | | | | | | | | | | | | | | |
Class A | | | (306,969 | ) | | | (229,358 | ) | | | (98,584 | ) | | | (1,500,749 | ) |
Class B | | | — | | | | — | | | | (3,508 | ) | | | (29,955 | ) |
Class C | | | (237,383 | ) | | | (79,673 | ) | | | (24,502 | ) | | | (583,534 | ) |
Class Y | | | (116,763 | ) | | | (24,156 | ) | | | (43,423 | ) | | | (770,404 | ) |
| | | | | | | | | | | | | | | | |
Total distributions | | | (2,355,375 | ) | | | (1,230,598 | ) | | | (13,160,126 | ) | | | (11,328,820 | ) |
| | | | | | | | | | | | | | | | |
NET INCREASE (DECREASE) IN NET ASSETS FROM CAPITAL SHARE TRANSACTIONS (NOTE 10) | | | (3,913,509 | ) | | | (8,686,919 | ) | | | 149,965,713 | | | | 168,885,860 | |
| | | | | | | | | | | | | | | | |
Net increase (decrease) in net assets | | | (4,765,900 | ) | | | (9,527,707 | ) | | | 157,906,107 | | | | 164,155,182 | |
NET ASSETS | | | | | | | | | | | | | | | | |
Beginning of the year | | | 24,282,537 | | | | 33,810,244 | | | | 504,299,531 | | | | 340,144,349 | |
| | | | | | | | | | | | | | | | |
End of the year | | $ | 19,516,637 | | | $ | 24,282,537 | | | $ | 662,205,638 | | | $ | 504,299,531 | |
| | | | | | | | | | | | | | | | |
UNDISTRIBUTED (DISTRIBUTIONS IN EXCESS OF) NET INVESTMENT INCOME | | $ | 12,535 | | | $ | 1,252,531 | | | $ | (549,210 | ) | | $ | (504,228 | ) |
| | | | | | | | | | | | | | | | |
See accompanying notes to financial statements.
67 |
This Page Intentionally Left Blank
| 68
Financial Highlights
For a share outstanding throughout each period.
| | | | | | | | | | | | | | | | | | | | | | | | | | | | |
| | | | | | Income (Loss) from Investment Operations: | | | Less Distributions: | |
| | | Net asset
value,
beginning
of the
period | | | Net
investment
income (a) | | | Net realized
and
unrealized
gain (loss) | | | Total from
investment
operations | | | Dividends
from net
investment
income | | | Distributions
from net
realized
capital
gains | | | Total
distributions | |
CORE PLUS BOND FUND | | | | | | | | | | | | | | | | | | | | | |
Class A | | | | | | | | | | | | | | | | | | | | | | | | | | | | |
9/30/2012 | | $ | 12.71 | | | $ | 0.43 | | | $ | 1.07 | | | $ | 1.50 | | | $ | (0.50 | ) | | $ | (0.19 | ) | | $ | (0.69 | ) |
9/30/2011 | | | 12.75 | | | | 0.52 | | | | 0.03 | (h) | | | 0.55 | | | | (0.59 | ) | | | — | | | | (0.59 | ) |
9/30/2010 | | | 11.91 | | | | 0.54 | | | | 0.91 | | | | 1.45 | | | | (0.61 | ) | | | — | | | | (0.61 | ) |
9/30/2009 | | | 10.54 | | | | 0.59 | | | | 1.44 | | | | 2.03 | | | | (0.66 | ) | | | — | | | | (0.66 | ) |
9/30/2008 | | | 11.31 | | | | 0.55 | | | | (0.71 | ) | | | (0.16 | ) | | | (0.61 | ) | | | — | | | | (0.61 | ) |
Class B | | | | | | | | | | | | | | | | | | | | | | | | | | | | |
9/30/2012 | | | 12.75 | | | | 0.34 | | | | 1.07 | | | | 1.41 | | | | (0.40 | ) | | | (0.19 | ) | | | (0.59 | ) |
9/30/2011 | | | 12.79 | | | | 0.42 | | | | 0.03 | (h) | | | 0.45 | | | | (0.49 | ) | | | — | | | | (0.49 | ) |
9/30/2010 | | | 11.95 | | | | 0.44 | | | | 0.92 | | | | 1.36 | | | | (0.52 | ) | | | — | | | | (0.52 | ) |
9/30/2009 | | | 10.57 | | | | 0.50 | | | | 1.45 | | | | 1.95 | | | | (0.57 | ) | | | — | | | | (0.57 | ) |
9/30/2008 | | | 11.31 | | | | 0.44 | | | | (0.67 | ) | | | (0.23 | ) | | | (0.51 | ) | | | — | | | | (0.51 | ) |
Class C | | | | | | | | | | | | | | | | | | | | | | | | | | | | |
9/30/2012 | | | 12.71 | | | | 0.33 | | | | 1.08 | | | | 1.41 | | | | (0.40 | ) | | | (0.19 | ) | | | (0.59 | ) |
9/30/2011 | | | 12.76 | | | | 0.42 | | | | 0.02 | (h) | | | 0.44 | | | | (0.49 | ) | | | — | | | | (0.49 | ) |
9/30/2010 | | | 11.92 | | | | 0.45 | | | | 0.91 | | | | 1.36 | | | | (0.52 | ) | | | — | | | | (0.52 | ) |
9/30/2009 | | | 10.55 | | | | 0.51 | | | | 1.44 | | | | 1.95 | | | | (0.58 | ) | | | — | | | | (0.58 | ) |
9/30/2008 | | | 11.32 | | | | 0.47 | | | | (0.71 | ) | | | (0.24 | ) | | | (0.53 | ) | | | — | | | | (0.53 | ) |
Class Y | | | | | | | | | | | | | | | | | | | | | | | | | | | | |
9/30/2012 | | | 12.78 | | | | 0.46 | | | | 1.09 | | | | 1.55 | | | | (0.53 | ) | | | (0.19 | ) | | | (0.72 | ) |
9/30/2011 | | | 12.82 | | | | 0.55 | | | | 0.03 | (h) | | | 0.58 | | | | (0.62 | ) | | | — | | | | (0.62 | ) |
9/30/2010 | | | 11.97 | | | | 0.57 | | | | 0.92 | | | | 1.49 | | | | (0.64 | ) | | | — | | | | (0.64 | ) |
9/30/2009 | | | 10.60 | | | | 0.62 | | | | 1.44 | | | | 2.06 | | | | (0.69 | ) | | | — | | | | (0.69 | ) |
9/30/2008 | | | 11.36 | | | | 0.58 | | | | (0.70 | ) | | | (0.12 | ) | | | (0.64 | ) | | | — | | | | (0.64 | ) |
| (a) | Per share net investment income has been calculated using the average shares outstanding during the period. |
| (b) | Amount rounds to less than $0.01 per share, if applicable. |
| (c) | Effective June 2, 2008, redemption fees were eliminated. |
| (d) | A sales charge for Class A shares and a contingent deferred sales charge for Class B and Class C shares are not reflected in total return calculations. Periods less than one year, if applicable, are not annualized. |
| (e) | Had certain expenses not been waived/reimbursed during the period, if applicable, total returns would have been lower. |
| (f) | The investment adviser and/or administrator agreed to waive its fees and/or reimburse a portion of the Fund’s expenses during the period. Without this waiver/reimbursement, if applicable, expenses would have been higher. |
| (g) | Computed on an annualized basis for periods less than one year, if applicable. |
| (h) | The amount shown for a share outstanding does not correspond with the aggregate realized and unrealized gain (loss) on investments for the period due to the timing of sales and redemptions of fund shares in relation to fluctuating market values of investments of the Fund. |
See accompanying notes to financial statements.
69 |
| | | | | | | | | | | | | | | | | | | | | | | | | | | | | | |
| | | | | | | | | | | | | Ratios to Average Net Assets: | | | | |
Redemption
fees (b)(c) | | |
Net asset
value,
end of
the period | | | Total
return
(%) (d)(e) | | | Net assets,
end of
the period
(000’s) | | | Net
expenses
(%) (f)(g) | | | Gross
expenses
(%) (g) | | | Net investment
income
(%) (g) | | | Portfolio
turnover
rate (%) | |
| | | | | | | | | | | | | | | | | | | | | | | | | | | | | | |
| | | | | | | | | | | | | | | | | | | | | | | | | | | | | | |
| $ | — | | | $ | 13.52 | | | | 12.18 | | | $ | 479,823 | | | | 0.82 | | | | 0.82 | | | | 3.31 | | | | 78 | |
| | — | | | | 12.71 | | | | 4.42 | | | | 237,759 | | | | 0.87 | | | | 0.87 | | | | 4.07 | | | | 86 | |
| | — | | | | 12.75 | | | | 12.55 | | | | 214,723 | | | | 0.90 | | | | 0.90 | | | | 4.41 | | | | 87 | |
| | — | | | | 11.91 | | | | 20.07 | | | | 140,779 | | | | 0.90 | | | | 0.97 | | | | 5.43 | | | | 102 | |
| | 0.00 | | | | 10.54 | | | | (1.61 | ) | | | 115,873 | | | | 0.93 | | | | 1.04 | | | | 4.86 | | | | 82 | |
| | | | | | | | | | | | | | | | | | | | | | | | | | | | | | |
| | — | | | | 13.57 | | | | 11.38 | | | | 2,386 | | | | 1.57 | | | | 1.57 | | | | 2.61 | | | | 78 | |
| | — | | | | 12.75 | | | | 3.60 | | | | 3,092 | | | | 1.62 | | | | 1.62 | | | | 3.32 | | | | 86 | |
| | — | | | | 12.79 | | | | 11.64 | | | | 4,490 | | | | 1.65 | | | | 1.65 | | | | 3.64 | | | | 87 | |
| | — | | | | 11.95 | | | | 19.19 | | | | 7,028 | | | | 1.65 | | | | 1.72 | | | | 4.66 | | | | 102 | |
| | 0.00 | | | | 10.57 | | | | (2.21 | ) | | | 10,481 | | | | 1.70 | | | | 1.80 | | | | 3.92 | | | | 82 | |
| | | | | | | | | | | | | | | | | | | | | | | | | | | | | | |
| | — | | | | 13.53 | | | | 11.46 | | | | 275,346 | | | | 1.57 | | | | 1.57 | | | | 2.55 | | | | 78 | |
| | — | | | | 12.71 | | | | 3.56 | | | | 137,836 | | | | 1.62 | | | | 1.62 | | | | 3.32 | | | | 86 | |
| | — | | | | 12.76 | | | | 11.71 | | | | 123,123 | | | | 1.65 | | | | 1.65 | | | | 3.66 | | | | 87 | |
| | — | | | | 11.92 | | | | 19.20 | | | | 77,081 | | | | 1.65 | | | | 1.72 | | | | 4.69 | | | | 102 | |
| | 0.00 | | | | 10.55 | | | | (2.32 | ) | | | 26,698 | | | | 1.68 | | | | 1.79 | | | | 4.17 | | | | 82 | |
| | | | | | | | | | | | | | | | | | | | | | | | | | | | | | |
| | — | | | | 13.61 | | | | 12.54 | | | | 634,946 | | | | 0.58 | | | | 0.58 | | | | 3.50 | | | | 78 | |
| | — | | | | 12.78 | | | | 4.65 | | | | 143,215 | | | | 0.62 | | | | 0.62 | | | | 4.31 | | | | 86 | |
| | — | | | | 12.82 | | | | 12.85 | | | | 69,322 | | | | 0.65 | | | | 0.65 | | | | 4.66 | | | | 87 | |
| | — | | | | 11.97 | | | | 20.37 | | | | 34,394 | | | | 0.65 | | | | 0.68 | | | | 5.67 | | | | 102 | |
| | 0.00 | | | | 10.60 | | | | (1.36 | ) | | | 20,407 | | | | 0.68 | | | | 0.75 | | | | 5.14 | | | | 82 | |
See accompanying notes to financial statements.
| 70
Financial Highlights (continued)
For a share outstanding throughout each period.
| | | | | | | | | | | | | | | | | | | | | | | | | | | | |
| | | | | | Income (Loss) from Investment
Operations: | | | Less Distributions: | |
| | | Net asset
value,
beginning
of the
period | | | Net
investment
income (a) | | | Net realized
and
unrealized
gain (loss) | | | Total from
investment
operations | | | Dividends
from net
investment
income | | | Distributions
from net
realized
capital
gains | | | Total
distributions | |
HIGH INCOME FUND | | | | | | | | | | | | | | | | | | | | | | | | | |
Class A | | | | | | | | | | | | | | | | | | | | | | | | | | | | |
9/30/2012 | | $ | 4.46 | | | $ | 0.24 | | | $ | 0.59 | | | $ | 0.83 | | | $ | (0.30 | ) | | $ | (0.39 | ) | | $ | (0.69 | ) |
9/30/2011 | | | 4.91 | | | | 0.28 | | | | (0.42 | ) | | | (0.14 | ) | | | (0.31 | ) | | | — | | | | (0.31 | ) |
9/30/2010 | | | 4.49 | | | | 0.32 | | | | 0.42 | | | | 0.74 | | | | (0.32 | ) | | | — | | | | (0.32 | ) |
9/30/2009 | | | 4.24 | | | | 0.34 | | | | 0.24 | | | | 0.58 | | | | (0.33 | ) | | | — | | | | (0.33 | ) |
9/30/2008 | | | 5.12 | | | | 0.34 | | | | (0.87 | ) | | | (0.53 | ) | | | (0.35 | ) | | | — | | | | (0.35 | ) |
Class B | | | | | | | | | | | | | | | | | | | | | | | | | | | | |
9/30/2012 | | | 4.47 | | | | 0.21 | | | | 0.58 | | | | 0.79 | | | | (0.26 | ) | | | (0.39 | ) | | | (0.65 | ) |
9/30/2011 | | | 4.92 | | | | 0.25 | | | | (0.43 | ) | | | (0.18 | ) | | | (0.27 | ) | | | — | | | | (0.27 | ) |
9/30/2010 | | | 4.50 | | | | 0.28 | | | | 0.42 | | | | 0.70 | | | | (0.28 | ) | | | — | | | | (0.28 | ) |
9/30/2009 | | | 4.25 | | | | 0.31 | | | | 0.25 | | | | 0.56 | | | | (0.31 | ) | | | — | | | | (0.31 | ) |
9/30/2008 | | | 5.13 | | | | 0.30 | | | | (0.87 | ) | | | (0.57 | ) | | | (0.31 | ) | | | — | | | | (0.31 | ) |
Class C | | | | | | | | | | | | | | | | | | | | | | | | | | | | |
9/30/2012 | | | 4.47 | | | | 0.21 | | | | 0.59 | | | | 0.80 | | | | (0.27 | ) | | | (0.39 | ) | | | (0.66 | ) |
9/30/2011 | | | 4.92 | | | | 0.25 | | | | (0.43 | ) | | | (0.18 | ) | | | (0.27 | ) | | | — | | | | (0.27 | ) |
9/30/2010 | | | 4.50 | | | | 0.28 | | | | 0.43 | | | | 0.71 | | | | (0.29 | ) | | | — | | | | (0.29 | ) |
9/30/2009 | | | 4.24 | | | | 0.31 | | | | 0.26 | | | | 0.57 | | | | (0.31 | ) | | | — | | | | (0.31 | ) |
9/30/2008 | | | 5.12 | | | | 0.31 | | | | (0.87 | ) | | | (0.56 | ) | | | (0.32 | ) | | | — | | | | (0.32 | ) |
Class Y | | | | | | | | | | | | | | | | | | | | | | | | | | | | |
9/30/2012 | | | 4.46 | | | | 0.26 | | | | 0.57 | | | | 0.83 | | | | (0.31 | ) | | | (0.39 | ) | | | (0.70 | ) |
9/30/2011 | | | 4.90 | | | | 0.29 | | | | (0.41 | ) | | | (0.12 | ) | | | (0.32 | ) | | | — | | | | (0.32 | ) |
9/30/2010 | | | 4.49 | | | | 0.33 | | | | 0.41 | | | | 0.74 | | | | (0.33 | ) | | | — | | | | (0.33 | ) |
9/30/2009 | | | 4.24 | | | | 0.34 | | | | 0.25 | | | | 0.59 | | | | (0.34 | ) | | | — | | | | (0.34 | ) |
9/30/2008* | | | 4.87 | | | | 0.22 | | | | (0.65 | ) | | | (0.43 | ) | | | (0.21 | ) | | | — | | | | (0.21 | ) |
| * | From commencement of Class operations on February 29, 2008 through September 30, 2008. |
| (a) | Per share net investment income has been calculated using the average shares outstanding during the period. |
| (b) | Amount rounds to less than $0.01 per share, if applicable. |
| (c) | Had certain expenses not been waived/reimbursed during the period, if applicable, total returns would have been lower. |
| (d) | A sales charge for Class A shares and a contingent deferred sales charge for Class B and Class C shares are not reflected in total return calculations. Periods less than one year, if applicable, are not annualized. |
| (e) | The investment adviser and/or administrator agreed to waive its fees and/or reimburse a portion of the Fund’s expenses during the period. Without this waiver/reimbursement, if applicable, expenses would have been higher. |
| (f) | Computed on an annualized basis for periods less than one year, if applicable. |
| (g) | Includes fee/expense recovery of 0.01%. |
| (h) | Effective June 1, 2009, redemption fees were eliminated. |
See accompanying notes to financial statements.
71 |
| | | | | | | | | | | | | | | | | | | | | | | | | | | | | | |
| | | | | | | | | | | | | Ratios to Average Net Assets: | | | | |
Redemption
fees (b) | | | Net asset
value, end
of the period | | | Total
return
(%) (c)(d) | | | Net assets,
end of
the period
(000’s) | | | Net
expenses
(%) (e)(f) | | | Gross
expenses
(%) (f) | | | Net investment
income
(%) (f) | | | Portfolio
turnover
rate (%) | |
| | | | | | | | | | | | | | | | | | | | | | | | | | | | | | |
| | | | | | | | | | | | | | | | | | | | | | | | | | | | | | |
| $ | — | | | $ | 4.60 | | | | 20.90 | | | $ | 95,876 | | | | 1.15 | | | | 1.19 | | | | 5.50 | | | | 34 | |
| | — | | | | 4.46 | | | | (3.30 | ) | | | 59,907 | | | | 1.15 | (g) | | | 1.15 | (g) | | | 5.60 | | | | 67 | |
| | — | | | | 4.91 | | | | 17.05 | | | | 68,011 | | | | 1.15 | | | | 1.20 | | | | 6.72 | | | | 56 | |
| | 0.00 | (h) | | | 4.49 | | | | 15.97 | | | | 59,944 | | | | 1.15 | | | | 1.28 | | | | 8.82 | | | | 30 | |
| | 0.00 | | | | 4.24 | | | | (10.98 | ) | | | 38,577 | | | | 1.15 | | | | 1.40 | | | | 7.01 | | | | 27 | |
| | | | | | | | | | | | | | | | | | | | | | | | | | | | | | |
| | — | | | | 4.61 | | | | 19.93 | | | | 560 | | | | 1.90 | | | | 1.94 | | | | 4.79 | | | | 34 | |
| | — | | | | 4.47 | | | | (4.04 | ) | | | 738 | | | | 1.90 | (g) | | | 1.90 | (g) | | | 4.90 | | | | 67 | |
| | — | | | | 4.92 | | | | 16.13 | | | | 1,209 | | | | 1.90 | | | | 1.94 | | | | 6.00 | | | | 56 | |
| | 0.00 | (h) | | | 4.50 | | | | 15.06 | | | | 1,569 | | | | 1.90 | | | | 2.06 | | | | 8.32 | | | | 30 | |
| | 0.00 | | | | 4.25 | | | | (11.64 | ) | | | 2,267 | | | | 1.90 | | | | 2.15 | | | | 6.15 | | | | 27 | |
| | | | | | | | | | | | | | | | | | | | | | | | | | | | | | |
| | — | | | | 4.61 | | | | 19.96 | | | | 16,863 | | | | 1.90 | | | | 1.94 | | | | 4.78 | | | | 34 | |
| | — | | | | 4.47 | | | | (4.02 | ) | | | 15,790 | | | | 1.90 | (g) | | | 1.90 | (g) | | | 4.89 | | | | 67 | |
| | — | | | | 4.92 | | | | 16.15 | | | | 19,312 | | | | 1.90 | | | | 1.95 | | | | 5.97 | | | | 56 | |
| | 0.00 | (h) | | | 4.50 | | | | 15.37 | | | | 17,827 | | | | 1.90 | | | | 2.03 | | | | 8.09 | | | | 30 | |
| | 0.00 | | | | 4.24 | | | | (11.62 | ) | | | 9,945 | | | | 1.90 | | | | 2.15 | | | | 6.32 | | | | 27 | |
| | | | | | | | | | | | | | | | | | | | | | | | | | | | | | |
| | — | | | | 4.59 | | | | 20.93 | | | | 110,917 | | | | 0.90 | | | | 0.95 | | | | 5.78 | | | | 34 | |
| | — | | | | 4.46 | | | | (2.86 | ) | | | 38,011 | | | | 0.90 | (g) | | | 0.90 | (g) | | | 5.86 | | | | 67 | |
| | — | | | | 4.90 | | | | 17.11 | | | | 69,887 | | | | 0.90 | | | | 0.93 | | | | 7.02 | | | | 56 | |
| | 0.00 | (h) | | | 4.49 | | | | 16.29 | | | | 105,713 | | | | 0.90 | | | | 0.92 | | | | 8.32 | | | | 30 | |
| | 0.01 | | | | 4.24 | | | | (9.10 | ) | | | 3,833 | | | | 0.90 | | | | 1.15 | | | | 8.03 | | | | 27 | |
See accompanying notes to financial statements.
| 72
Financial Highlights (continued)
For a share outstanding throughout each period.
| | | | | | | | | | | | | | | | | | | | | | | | | | | | |
| | | | | | Income (Loss) from Investment
Operations: | | | Less Distributions: | |
| | | Net asset
value,
beginning
of the
period | | | Net
investment
income (a) | | | Net realized
and
unrealized
gain (loss) | | | Total from
investment
operations | | | Dividends
from net
investment
income | | | Distributions
from net
realized
capital
gains | | | Total
distributions | |
INTERNATIONAL BOND FUND | | | | | | | | | | | | | | | | | | | | | |
Class A | | | | | | | | | | | | | | | | | | | | | | | | | | | | |
9/30/2012 | | $ | 10.94 | | | $ | 0.19 | | | $ | 0.62 | | | $ | 0.81 | | | $ | (0.94 | ) | | $ | (0.37 | ) | | $ | (1.31 | ) |
9/30/2011 | | | 11.17 | | | | 0.25 | | | | 0.06 | (i) | | | 0.31 | | | | (0.40 | ) | | | (0.14 | ) | | | (0.54 | ) |
9/30/2010 | | | 10.84 | | | | 0.22 | | | | 0.48 | | | | 0.70 | | | | (0.29 | ) | | | (0.08 | ) | | | (0.37 | ) |
9/30/2009 | | | 9.19 | | | | 0.32 | | | | 1.53 | | | | 1.85 | | | | (0.20 | ) | | | — | | | | (0.20 | ) |
9/30/2008(j) | | | 10.00 | | | | 0.17 | | | | (0.79 | ) | | | (0.62 | ) | | | (0.19 | ) | | | — | | | | (0.19 | ) |
Class C | | | | | | | | | | | | | | | | | | | | | | | | | | | | |
9/30/2012 | | | 10.87 | | | | 0.12 | | | | 0.61 | | | | 0.73 | | | | (0.86 | ) | | | (0.37 | ) | | | (1.23 | ) |
9/30/2011 | | | 11.11 | | | | 0.17 | | | | 0.05 | (i) | | | 0.22 | | | | (0.32 | ) | | | (0.14 | ) | | | (0.46 | ) |
9/30/2010 | | | 10.82 | | | | 0.15 | | | | 0.46 | | | | 0.61 | | | | (0.24 | ) | | | (0.08 | ) | | | (0.32 | ) |
9/30/2009 | | | 9.18 | | | | 0.24 | | | | 1.53 | | | | 1.77 | | | | (0.13 | ) | | | — | | | | (0.13 | ) |
9/30/2008(j) | | | 10.00 | | | | 0.13 | | | | (0.81 | ) | | | (0.68 | ) | | | (0.15 | ) | | | — | | | | (0.15 | ) |
Class Y | | | | | | | | | | | | | | | | | | | | | | | | | | | | |
9/30/2012 | | | 10.93 | | | | 0.21 | | | | 0.63 | | | | 0.84 | | | | (0.96 | ) | | | (0.37 | ) | | | (1.33 | ) |
9/30/2011 | | | 11.16 | | | | 0.28 | | | | 0.06 | (i) | | | 0.34 | | | | (0.43 | ) | | | (0.14 | ) | | | (0.57 | ) |
9/30/2010 | | | 10.82 | | | | 0.25 | | | | 0.47 | | | | 0.72 | | | | (0.30 | ) | | | (0.08 | ) | | | (0.38 | ) |
9/30/2009 | | | 9.18 | | | | 0.33 | | | | 1.53 | | | | 1.86 | | | | (0.22 | ) | | | — | | | | (0.22 | ) |
9/30/2008(j) | | | 10.00 | | | | 0.18 | | | | (0.81 | ) | | | (0.63 | ) | | | (0.20 | ) | | | — | | | | (0.20 | ) |
| (a) | Per share net investment income has been calculated using the average shares outstanding during the period. |
| (b) | Amount rounds to less than $0.01 per share, if applicable. |
| (c) | Had certain expenses not been waived/reimbursed during the period, if applicable, total returns would have been lower. |
| (d) | A sales charge for Class A shares and a contingent deferred sales charge for Class C shares are not reflected in total return calculations. Periods less than one year, if applicable, are not annualized. |
| (e) | The investment adviser and/or administrator agreed to waive its fees and/or reimburse a portion of the Fund’s expenses during the period. Without this waiver/reimbursement, if applicable, expenses would have been higher. |
| (f) | Computed on an annualized basis for periods less than one year, if applicable. |
| (g) | Effective July 1, 2012, the expense limit decreased from 1.10%, 1.85% and 0.85% to 1.05%, 1.80% and 0.80% for Class A, Class C and Class Y shares, respectively. |
| (h) | Includes interest expense from bank overdraft charges of less than 0.01%. Without this expense the ratio of net expenses would have been 1.09%, 1.84% and 0.84% for Class A, Class C and Class Y shares, respectively. |
| (i) | The amount shown for a share outstanding does not correspond with the aggregate realized and unrealized gain (loss) on investments for the period due to the timing of sales and redemptions of fund shares in relation to fluctuating market values of investments of the Fund. |
| (j) | From commencement of operations on February 1, 2008 through September 30, 2008. |
| (k) | Effective June 2, 2008, redemption fees were eliminated. |
See accompanying notes to financial statements.
73 |
| | | | | | | | | | | | | | | | | | | | | | | | | | | | | | |
| | | | | | | | | | | | | Ratios to Average Net Assets: | | | | |
Redemption
fees (b) | | |
Net asset
value,
end of
the period | | | Total
return
(%) (c)(d) | | | Net assets,
end of
the period
(000’s) | | | Net
expenses
(%) (e)(f) | | | Gross
expenses
(%) (f) | | | Net investment
income
(%) (f) | | | Portfolio
turnover
rate (%) | |
| | | | | | | | | | | | | | | | | | | | | | | | | | | | | | |
| | | | | | | | | | | | | | | | | | | | | | | | | | | | | | |
| $ | — | | | $ | 10.44 | | | | 8.42 | | | $ | 11,898 | | | | 1.09 | (g)(h) | | | 1.85 | | | | 1.83 | | | | 169 | |
| | — | | | | 10.94 | | | | 2.70 | | | | 10,927 | | | | 1.10 | | | | 1.64 | | | | 2.26 | | | | 136 | |
| | — | | | | 11.17 | | | | 6.66 | | | | 18,758 | | | | 1.10 | | | | 1.49 | | | | 2.14 | | | | 128 | |
| | — | | | | 10.84 | | | | 20.41 | | | | 8,479 | | | | 1.10 | | | | 2.11 | | | | 3.29 | | | | 91 | |
| | 0.00(k) | | | | 9.19 | | | | (6.37 | ) | | | 1,953 | | | | 1.10 | | | | 2.95 | | | | 2.66 | | | | 60 | |
| | | | | | | | | | | | | | | | | | | | | | | | | | | | | | |
| | — | | | | 10.37 | | | | 7.64 | | | | 4,355 | | | | 1.84 | (g)(h) | | | 2.61 | | | | 1.13 | | | | 169 | |
| | — | | | | 10.87 | | | | 1.87 | | | | 7,503 | | | | 1.85 | | | | 2.40 | | | | 1.52 | | | | 136 | |
| | — | | | | 11.11 | | | | 5.86 | | | | 6,145 | | | | 1.85 | | | | 2.24 | | | | 1.40 | | | | 128 | |
| | — | | | | 10.82 | | | | 19.58 | | | | 2,955 | | | | 1.85 | | | | 2.93 | | | | 2.56 | | | | 91 | |
| | 0.01(k) | | | | 9.18 | | | | (6.95 | ) | | | 683 | | | | 1.85 | | | | 3.70 | | | | 1.92 | | | | 60 | |
| | | | | | | | | | | | | | | | | | | | | | | | | | | | | | |
| | — | | | | 10.44 | | | | 8.68 | | | | 3,264 | | | | 0.85 | (g)(h) | | | 1.60 | | | | 2.05 | | | | 169 | |
| | — | | | | 10.93 | | | | 3.06 | | | | 5,852 | | | | 0.85 | | | | 1.36 | | | | 2.47 | | | | 136 | |
| | — | | | | 11.16 | | | | 6.92 | | | | 8,908 | | | | 0.85 | | | | 1.23 | | | | 2.41 | | | | 128 | |
| | — | | | | 10.82 | | | | 20.73 | | | | 13,049 | | | | 0.85 | | | | 1.92 | | | | 3.53 | | | | 91 | |
| | 0.01(k) | | | | 9.18 | | | | (6.39 | ) | | | 9,981 | | | | 0.85 | | | | 2.48 | | | | 2.74 | | | | 60 | |
See accompanying notes to financial statements.
| 74
Financial Highlights (continued)
For a share outstanding throughout each period.
| | | | | | | | | | | | | | | | | | | | | | | | | | | | |
| | | | | | Income (Loss) from Investment
Operations: | | | Less Distributions: | |
| | | Net asset
value,
beginning
of the
period | | | Net
investment
income (a) | | | Net realized
and
unrealized
gain (loss) | | | Total from
investment
operations | | | Dividends
from net
investment
income | | | Distributions
from net
realized
capital
gains (b) | | | Total
distributions | |
LIMITED TERM GOVERNMENTAND AGENCY FUND | | | | | | | | | | | | | | | | | |
Class A | | | | | | | | | | | | | | | | | | | | | | | | | | | | |
9/30/2012 | | $ | 11.87 | | | $ | 0.18 | | | $ | 0.28 | | | $ | 0.46 | | | $ | (0.29 | ) | | $ | (0.00 | ) | | $ | (0.29 | ) |
9/30/2011 | | | 12.02 | | | | 0.17 | | | | 0.03 | | | | 0.20 | | | | (0.26 | ) | | | (0.09 | ) | | | (0.35 | ) |
9/30/2010 | | | 11.60 | | | | 0.20 | | | | 0.49 | | | | 0.69 | | | | (0.27 | ) | | | — | | | | (0.27 | ) |
9/30/2009 | | | 10.98 | | | | 0.35 | | | | 0.63 | | | | 0.98 | | | | (0.36 | ) | | | — | | | | (0.36 | ) |
9/30/2008 | | | 11.00 | | | | 0.45 | | | | 0.02 | | | | 0.47 | | | | (0.49 | ) | | | — | | | | (0.49 | ) |
Class B | | | | | | | | | | | | | | | | | | | | | | | | | | | | |
9/30/2012 | | | 11.86 | | | | 0.10 | | | | 0.27 | | | | 0.37 | | | | (0.20 | ) | | | (0.00 | ) | | | (0.20 | ) |
9/30/2011 | | | 12.00 | | | | 0.09 | | | | 0.03 | | | | 0.12 | | | | (0.17 | ) | | | (0.09 | ) | | | (0.26 | ) |
9/30/2010 | | | 11.59 | | | | 0.12 | | | | 0.47 | | | | 0.59 | | | | (0.18 | ) | | | — | | | | (0.18 | ) |
9/30/2009 | | | 10.97 | | | | 0.26 | | | | 0.63 | | | | 0.89 | | | | (0.27 | ) | | | — | | | | (0.27 | ) |
9/30/2008 | | | 10.99 | | | | 0.36 | | | | 0.02 | | | | 0.38 | | | | (0.40 | ) | | | — | | | | (0.40 | ) |
Class C | | | | | | | | | | | | | | | | | | | | | | | | | | | | |
9/30/2012 | | | 11.88 | | | | 0.10 | | | | 0.27 | | | | 0.37 | | | | (0.20 | ) | | | (0.00 | ) | | | (0.20 | ) |
9/30/2011 | | | 12.03 | | | | 0.08 | | | | 0.03 | | | | 0.11 | | | | (0.17 | ) | | | (0.09 | ) | | | (0.26 | ) |
9/30/2010 | | | 11.61 | | | | 0.12 | | | | 0.48 | | | | 0.60 | | | | (0.18 | ) | | | — | | | | (0.18 | ) |
9/30/2009 | | | 10.99 | | | | 0.26 | | | | 0.63 | | | | 0.89 | | | | (0.27 | ) | | | — | | | | (0.27 | ) |
9/30/2008 | | | 11.00 | | | | 0.36 | | | | 0.03 | | | | 0.39 | | | | (0.40 | ) | | | — | | | | (0.40 | ) |
Class Y | | | | | | | | | | | | | | | | | | | | | | | | | | | | |
9/30/2012 | | | 11.91 | | | | 0.21 | | | | 0.28 | | | | 0.49 | | | | (0.32 | ) | | | (0.00 | ) | | | (0.32 | ) |
9/30/2011 | | | 12.05 | | | | 0.20 | | | | 0.04 | | | | 0.24 | | | | (0.29 | ) | | | (0.09 | ) | | | (0.38 | ) |
9/30/2010 | | | 11.64 | | | | 0.23 | | | | 0.48 | | | | 0.71 | | | | (0.30 | ) | | | — | | | | (0.30 | ) |
9/30/2009 | | | 11.01 | | | | 0.39 | | | | 0.63 | | | | 1.02 | | | | (0.39 | ) | | | — | | | | (0.39 | ) |
9/30/2008 | | | 11.03 | | | | 0.47 | | | | 0.02 | | | | 0.49 | | | | (0.51 | ) | | | — | | | | (0.51 | ) |
| (a) | Per share net investment income has been calculated using the average shares outstanding during the period. |
| (b) | Amount rounds to less than $0.01 per share, if applicable. |
| (c) | A sales charge for Class A shares and a contingent deferred sales charge for Class B and Class C shares are not reflected in total return calculations. Periods less than one year, if applicable, are not annualized. |
| (d) | Had certain expenses not been waived/reimbursed during the period, if applicable, total returns would have been lower. |
| (e) | The investment adviser and/or administrator agreed to waive its fees and/or reimburse a portion of the Fund’s expenses during the period. Without this waiver/reimbursement, if applicable, expenses would have been higher. |
| (f) | Computed on an annualized basis for periods less than one year, if applicable. |
See accompanying notes to financial statements.
75 |
| | | | | | | | | | | | | | | | | | | | | | | | | | |
| | | | | | | | | | Ratios to Average Net Assets: | | | | |
Net asset
value, end
of the period | | | Total
return
(%) (c)(d) | | | Net assets,
end of
the period
(000’s) | | | Net
expenses
(%) (e)(f) | | | Gross
expenses
(%) (f) | | | Net investment
income
(%) (f) | | | Portfolio
turnover
rate (%) | |
| | | | | | | | | | | | | | | | | | | | | | | | | | |
| | | | | | | | | | | | | | | | | | | | | | | | | | |
| $ | 12.04 | | | | 3.94 | | | $ | 357,870 | | | | 0.85 | | | | 0.90 | | | | 1.54 | | | | 56 | |
| | 11.87 | | | | 1.71 | | | | 293,675 | | | | 0.85 | | | | 0.92 | | | | 1.44 | | | | 66 | |
| | 12.02 | | | | 6.03 | | | | 164,265 | | | | 0.89 | | | | 0.97 | | | | 1.73 | | | | 89 | |
| | 11.60 | | | | 9.05 | | | | 118,619 | | | | 0.90 | | | | 0.99 | | | | 3.10 | | | | 77 | |
| | 10.98 | | | | 4.29 | | | | 105,047 | | | | 0.92 | | | | 1.07 | | | | 4.04 | | | | 52 | |
| | | | | | | | | | | | | | | | | | | | | | | | | | |
| | 12.03 | | | | 3.17 | | | | 8,370 | | | | 1.60 | | | | 1.65 | | | | 0.81 | | | | 56 | |
| | 11.86 | | | | 1.04 | | | | 10,976 | | | | 1.60 | | | | 1.68 | | | | 0.72 | | | | 66 | |
| | 12.00 | | | | 5.16 | | | �� | 4,049 | | | | 1.64 | | | | 1.72 | | | | 1.00 | | | | 89 | |
| | 11.59 | | | | 8.24 | | | | 4,442 | | | | 1.65 | | | | 1.74 | | | | 2.32 | | | | 77 | |
| | 10.97 | | | | 3.52 | | | | 4,532 | | | | 1.67 | | | | 1.82 | | | | 3.29 | | | | 52 | |
| | | | | | | | | | | | | | | | | | | | | | | | | | |
| | 12.05 | | | | 3.17 | | | | 75,522 | | | | 1.60 | | | | 1.65 | | | | 0.80 | | | | 56 | |
| | 11.88 | | | | 0.96 | | | | 68,776 | | | | 1.60 | | | | 1.67 | | | | 0.68 | | | | 66 | |
| | 12.03 | | | | 5.24 | | | | 75,984 | | | | 1.64 | | | | 1.72 | | | | 0.98 | | | | 89 | |
| | 11.61 | | | | 8.24 | | | | 50,973 | | | | 1.65 | | | | 1.74 | | | | 2.32 | | | | 77 | |
| | 10.99 | | | | 3.62 | | | | 22,711 | | | | 1.66 | | | | 1.83 | | | | 3.29 | | | | 52 | |
| | | | | | | | | | | | | | | | | | | | | | | | | | |
| | 12.08 | | | | 4.19 | | | | 220,444 | | | | 0.60 | | | | 0.65 | | | | 1.77 | | | | 56 | |
| | 11.91 | | | | 2.05 | | | | 130,874 | | | | 0.60 | | | | 0.67 | | | | 1.68 | | | | 66 | |
| | 12.05 | | | | 6.20 | | | | 95,847 | | | | 0.63 | | | | 0.71 | | | | 1.94 | | | | 89 | |
| | 11.64 | | | | 9.40 | | | | 28,004 | | | | 0.65 | | | | 0.72 | | | | 3.42 | | | | 77 | |
| | 11.01 | | | | 4.55 | | | | 6,577 | | | | 0.67 | | | | 0.72 | | | | 4.28 | | | | 52 | |
See accompanying notes to financial statements.
| 76
Notes to Financial Statements
September 30, 2012
1. Organization. Natixis Funds Trust I and Loomis Sayles Funds II (the “Trusts” and each a “Trust”) are each organized as a Massachusetts business trust. Each Trust is registered under the Investment Company Act of 1940, as amended (the “1940 Act”), as an open-end management investment company. Each Declaration of Trust permits the Board of Trustees to authorize the issuance of an unlimited number of shares of the Trust in multiple series. The financial statements for certain funds of the Trusts are presented in separate reports. The following funds (individually, a “Fund” and collectively, the “Funds”) are included in this report:
Natixis Funds Trust I:
Loomis Sayles Core Plus Bond Fund (the “Core Plus Bond Fund”)
Loomis Sayles Funds II:
Loomis Sayles High Income Fund (the “High Income Fund”)
Loomis Sayles International Bond Fund (the “International Bond Fund”)
Loomis Sayles Limited Term Government and Agency Fund (the “Limited Term Government and Agency Fund”)
Each Fund is a diversified investment company, except for International Bond Fund, which is a non-diversified investment company.
The Funds each offer Class A, Class C and Class Y shares. Effective October 12, 2007, Class B shares are no longer offered. Existing Class B shareholders may continue to reinvest dividends into Class B shares and exchange their Class B shares for Class B shares of other Natixis Funds subject to existing exchange privileges as described in the prospectus.
Class A shares of all Funds except Limited Term Government and Agency Fund are sold with a maximum front-end sales charge of 4.50%. Class A shares of Limited Term Government and Agency Fund are sold with a maximum front-end sales charge of 3.00%. Class B shares do not pay a front-end sales charge; however, they are charged higher Rule 12b-1 fees, and are subject to a contingent deferred sales charge (“CDSC”) if such shares are redeemed within six years of purchase. After eight years of ownership, Class B shares convert to Class A shares. Class C shares do not pay a front-end sales charge, do not convert to any other class of shares, pay higher Rule 12b-1 fees than Class A shares and may be subject to a CDSC of 1.00% if those shares are redeemed within one year of acquisition, except for reinvested distributions. Class Y shares do not pay a front-end sales charge, a CDSC or Rule 12b-1 fees. Class Y shares are generally intended for institutional investors with a minimum initial investment of $100,000, though some categories of investors are exempted from the minimum investment amount as outlined in the Funds’ prospectus.
Most expenses of the Trusts can be directly attributed to a fund. Expenses which cannot be directly attributed to a fund are generally apportioned based on the relative net assets of each of the funds in the Trusts. Expenses of a Fund are borne pro rata by
77 |
Notes to Financial Statements (continued)
September 30, 2012
the holders of each class of shares, except that each class bears expenses unique to that class (including the Rule 12b-1 service and distribution fees). In addition, each class votes as a class only with respect to its own Rule 12b-1 Plan. Shares of each class would receive their pro rata share of the net assets of a Fund if the Fund were liquidated. The Trustees approve separate distributions from net investment income on each class of shares.
2. Significant Accounting Policies. The following is a summary of significant accounting policies consistently followed by each Fund in the preparation of its financial statements. The Funds’ financial statements are prepared in accordance with accounting principles generally accepted in the United States of America which require the use of management estimates that affect the reported amounts and disclosures in the financial statements. Actual results could differ from those estimates. Management has evaluated the events and transactions subsequent to year-end through the date the financial statements were issued and has determined that there were no material events that would require disclosure in the Funds’ financial statements.
a. Valuation. Debt securities (other than short-term obligations purchased with an original or remaining maturity of sixty days or less) and unlisted equity securities are generally valued on the basis of evaluated bids furnished to the Funds by an independent pricing service recommended by the investment adviser and approved by the Board of Trustees, which service determines valuations for normal, institutional-size trading units of such securities using market information, transactions for comparable securities and various relationships between securities which are generally recognized by institutional traders. Senior loans are priced at bid prices supplied by an independent pricing service, if available. Equity securities, including shares of closed-end investment companies and exchange-traded funds, for which market quotations are readily available are valued at market value, as reported by independent pricing services recommended by the investment adviser and approved by the Board of Trustees. Such independent pricing services generally use the security’s last sale price on the exchange or market where the security is primarily traded or, if there is no reported sale during the day, the closing bid price. Securities traded on the NASDAQ Global Select Market, NASDAQ Global Market and NASDAQ Capital Market are valued at the NASDAQ Official Closing Price (“NOCP”), or if lacking a NOCP, at the most recent bid quotation on the applicable NASDAQ Market. Broker-dealer bid quotations may also be used to value debt and equity securities and senior loans where an independent pricing service is unable to price a security or where an independent pricing service does not provide a reliable price for the security. Forward foreign currency contracts are valued utilizing interpolated prices determined from information provided by an independent pricing service. Credit default swap agreements are valued based on mid prices supplied by an independent pricing service, if available, or quotations obtained from broker-dealers. Investments in other open-end investment companies are valued at their net asset value each day. Short-term obligations purchased with an original or
| 78
Notes to Financial Statements (continued)
September 30, 2012
remaining maturity of sixty days or less are valued at amortized cost, which approximates market value. Securities for which market quotations are not readily available are valued at fair value as determined in good faith by the Funds’ investment adviser using consistently applied procedures under the general supervision of the Board of Trustees.
Certain Funds may hold securities traded in foreign markets. Foreign securities are valued at the closing market price in the foreign market. However, if events occurring after the close of the foreign market (but before the close of regular trading on the New York Stock Exchange) are believed to materially affect the value of those securities, such securities are fair valued pursuant to procedures approved by the Board of Trustees. When fair valuing securities, the Funds may, among other things, use modeling tools or other processes that may take into account factors such as securities market activity and/or significant events that occur after the close of the foreign market and before the Funds calculate their net asset values.
b. Investment Transactions and Related Investment Income. Investment transactions are accounted for on a trade date plus one basis for daily net asset value calculation. However, for financial reporting purposes, investment transactions are reported on trade date. Dividend income is recorded on ex-dividend date, or in the case of certain foreign securities, as soon as a Fund is notified, and interest income is recorded on an accrual basis. Interest income is increased by the accretion of discount and decreased by the amortization of premium. Periodic principal adjustments for inflation-protected securities are recorded to interest income. Negative principal adjustments (in the event of deflation) are recorded as reductions of interest income to the extent of interest income earned, not to exceed the amount of positive principal adjustments on a cumulative basis. In determining net gain or loss on securities sold, the cost of securities has been determined on an identified cost basis. Investment income, non-class specific expenses and realized and unrealized gains and losses are allocated on a pro rata basis to each class based on the relative net assets of each class to the total net assets of the Fund.
c. Foreign Currency Translation. The books and records of the Funds are maintained in U.S. dollars. The values of securities, currencies and other assets and liabilities denominated in currencies other than U.S. dollars are translated into U.S. dollars based upon foreign exchange rates prevailing at the end of the period. Purchases and sales of investment securities, income and expenses are translated on the respective dates of such transactions.
Since the values of investment securities are presented at the foreign exchange rates prevailing at the end of the period, it is not practical to isolate that portion of the results of operations arising from changes in exchange rates from fluctuations which arise due to changes in market prices of investment securities. Such changes are included with the net realized and unrealized gain or loss on investments.
79 |
Notes to Financial Statements (continued)
September 30, 2012
Net realized foreign exchange gains or losses arise from sales of foreign currency, currency gains or losses realized between the trade and settlement dates on securities transactions, and the difference between the amounts of dividends, interest and foreign withholding taxes recorded on the Funds’ books and the U.S. dollar equivalent of the amounts actually received or paid. Net unrealized foreign exchange gains and losses arise from changes in the value of assets and liabilities, other than investment securities, at the end of the fiscal period, resulting from changes in exchange rates.
Each Fund may use foreign currency exchange contracts to facilitate transactions in foreign-denominated investments. Losses may arise from changes in the value of the foreign currency or if the counterparties do not perform under the contracts’ terms.
d. Forward Foreign Currency Contracts. The Funds may enter into forward foreign currency contracts, including forward foreign cross currency contracts to acquire exposure to foreign currencies or to hedge the Funds’ investments against currency fluctuation. A contract can also be used to offset a previous contract. These contracts involve market risk in excess of the unrealized gain or loss reflected in the Funds’ Statements of Assets and Liabilities. The U.S. dollar value of the currencies a Fund has committed to buy or sell represents the aggregate exposure to each currency a Fund has acquired or hedged through currency contracts outstanding at period end. Gains or losses are recorded for financial statement purposes as unrealized until settlement date. Risks may arise upon entering into these contracts from the potential inability of counterparties to meet the terms of their contracts and from unanticipated movements in the value of a foreign currency relative to the U.S. dollar. Certain contracts may require the movement of cash and/or securities as collateral for the Funds’ or counterparty’s net obligations under the contracts.
e. Swap Agreements. Each Fund may enter into credit default swaps. A credit default swap is an agreement between two parties (the “protection buyer” and “protection seller”) to exchange the credit risk of an issuer (“reference obligation”) for a specified time period. The reference obligation may be one or more debt securities or an index of such securities. The Funds may be either the protection buyer or the protection seller. As a protection buyer, the Funds have the ability to hedge the downside risk of an issuer or group of issuers. As a protection seller, the Funds have the ability to gain exposure to an issuer or group of issuers whose bonds are unavailable or in short supply in the cash bond market, as well as realize additional income in the form of fees paid by the protection buyer. The protection buyer is obligated to pay the protection seller a stream of payments (“fees”) over the term of the contract, provided that no credit event, such as a default or a downgrade in credit rating, occurs on the reference obligation. The Funds may also pay or receive upfront premiums. If a credit event occurs, the protection seller must pay the protection buyer the difference between the agreed upon notional value and market value of the reference obligation. Market value in this case is determined by a facilitated auction whereby a minimum number of allowable broker
| 80
Notes to Financial Statements (continued)
September 30, 2012
bids, together with a specified valuation method, are used to calculate the value. The maximum potential amount of undiscounted future payments that a Fund as the protection seller could be required to make under a credit default swap agreement would be an amount equal to the notional amount of the agreement.
The notional amounts of credit default swaps are not recorded in the financial statements. Credit default swaps are marked-to-market daily, and fluctuations in the value are recorded in the Statements of Operations as change in unrealized appreciation (depreciation) on swap agreements. Fees are accrued in accordance with the terms of the agreement and are recorded in the Statements of Operations as realized gain or loss when received or paid. Upfront premiums paid or received by the Funds are recorded on the Statements of Assets and Liabilities as an asset or liability, respectively, and are amortized or accreted over the term of the agreement and recorded as realized gain or loss. Payments made or received by the Funds as a result of a credit event or termination of the agreement are recorded as realized gain or loss.
Credit default swaps are privately negotiated and traded between counterparties and, as such, are subject to the risk that a party to the agreement will not be able to meet its obligations. The Funds cover their net obligations under outstanding credit default swaps by segregating or earmarking liquid assets or cash.
No credit default swaps were held by the Funds during the year ended September 30, 2012.
f. Due from Brokers. Transactions and positions in certain forward foreign currency contracts are maintained and cleared by registered U.S. broker/dealers pursuant to customer agreements between the Fund and the various broker/dealers. Due from brokers’ balances in the Statements of Assets and Liabilities for High Income Fund represent cash pledged as collateral for forward foreign currency contracts. In certain circumstances the Fund’s use of cash and/or securities held at brokers is restricted by regulation or broker mandated limits.
g. Federal and Foreign Income Taxes. Each Trust treats each Fund as a separate entity for federal income tax purposes. Each Fund intends to meet the requirements of the Internal Revenue Code of 1986, as amended, applicable to regulated investment companies, and to distribute to its shareholders substantially all of its net investment income and any net realized capital gains at least annually. Management has performed an analysis of each Fund’s tax positions for the open tax years as of September 30, 2012 and has concluded that no provisions for income tax are required. The Funds’ federal tax returns for the prior three fiscal years remain subject to examination by the Internal Revenue Service. Management is not aware of any events that are reasonably possible to occur in the next twelve months that would result in the amounts of any unrecognized tax benefits significantly increasing or decreasing for the Funds. However, management’s conclusions regarding tax positions taken may be
81 |
Notes to Financial Statements (continued)
September 30, 2012
subject to review and adjustment at a later date based on factors including, but not limited to, new tax laws and accounting regulations and interpretations thereof.
A Fund may be subject to foreign withholding taxes on investment income and taxes on capital gains on investments that are accrued and paid based upon the Fund’s understanding of the tax rules and regulations that exist in the countries in which the Fund invests. Foreign withholding taxes on dividend and interest income are reflected on the Statements of Operations as a reduction of investment income, net of amounts eligible to be reclaimed. Dividends and interest receivable on the Statements of Assets and Liabilities are net of foreign withholding taxes. Foreign withholding taxes eligible to be reclaimed are reflected on the Statements of Assets and Liabilities as tax reclaims receivable. Capital gains taxes paid are included in net realized gain (loss) on investments in the Statements of Operations. Accrued but unpaid capital gains taxes are reflected as foreign taxes payable on the Statements of Assets and Liabilities, if applicable, and reduce unrealized gains on investments. In the event that realized gains on investments are subsequently offset by realized losses, taxes paid on realized gains may be returned to a Fund. Such amounts, if applicable, are reflected as foreign tax rebates receivable on the Statements of Assets and Liabilities and are recorded as a realized gain when received.
h. Dividends and Distributions to Shareholders. Dividends and distributions are recorded on ex-dividend date. The timing and characterization of certain income and capital gain distributions are determined annually in accordance with federal tax regulations, which may differ from accounting principles generally accepted in the United States of America. Permanent differences are primarily due to differing treatments for book and tax purposes of items such as foreign currency transactions, contingent payment debt instruments, preferred securities adjustments, premium amortization, defaulted bond adjustments, paydown gains and losses and distribution redesignations. Permanent book and tax basis differences relating to shareholder distributions will result in reclassifications to capital accounts. Temporary differences between book and tax distributable earnings are primarily due to deferred Trustees’ fees, wash sales, premium amortization, forward foreign currency contract mark to market, dividends payable, return of capital dividends received, preferred securities adjustments, contingent payment debt instruments and defaulted bond interest. Distributions from net investment income and short-term capital gains are considered to be distributed from ordinary income for tax purposes.
| 82
Notes to Financial Statements (continued)
September 30, 2012
The tax characterization of distributions is determined on an annual basis. The tax character of distributions paid to shareholders during the years ended September 30, 2012 and 2011 were as follows:
| | | | | | | | | | | | | | | | | | | | | | | | |
| | | 2012 Distributions Paid From: | | | 2011 Distributions Paid From: | |
Fund | | Ordinary Income | | | Long-Term Capital Gains | | | Total | | | Ordinary Income | | | Long-Term Capital Gains | | | Total | |
Core Plus Bond Fund | | $ | 38,311,608 | | | $ | 5,887,516 | | | $ | 44,199,124 | | | $ | 18,029,003 | | | $ | — | | | $ | 18,029,003 | |
High Income Fund | | | 12,336,748 | | | | 9,467,897 | | | | 21,804,645 | | | | 10,139,162 | | | | — | | | | 10,139,162 | |
International Bond Fund | | | 2,051,571 | | | | 303,804 | | | | 2,355,375 | | | | 1,028,434 | | | | 202,164 | | | | 1,230,598 | |
Limited Term Government and Agency Fund | | | 12,349,174 | | | | 810,952 | | | | 13,160,126 | | | | 10,215,010 | | | | 1,113,810 | | | | 11,328,820 | |
Differences between these amounts and those reported in the Statements of Changes in Net Assets are primarily attributable to different book and tax treatment for short-term capital gains.
As of September 30, 2012, the components of distributable earnings on a tax basis were as follows:
| | | | | | | | | | | | | | | | |
| | | Core Plus Bond
Fund | | | High Income
Fund | | | International
Bond Fund | | | Limited Term
Government and
Agency Fund | |
Undistributed ordinary income | | $ | 18,319,591 | | | $ | 1,048,519 | | | $ | 261,359 | | | $ | — | |
Undistributed long-term capital gains | | | 7,298,040 | | | | 636,686 | | | | 160,428 | | | | 234,732 | |
| | | | | | | | | | | | | | | | |
Total undistributed earnings | | | 25,617,631 | | | | 1,685,205 | | | | 421,787 | | | | 234,732 | |
| | | | | | | | | | | | | | | | |
Unrealized appreciation | | | 63,763,817 | | | | 7,723,024 | | | | 366,461 | | | | 16,298,951 | |
| | | | | | | | | | | | | | | | |
Total accumulated earnings | | $ | 89,381,448 | | | $ | 9,408,229 | | | $ | 788,248 | | | $ | 16,533,683 | |
| | | | | | | | | | | | | | | | |
On December 22, 2010, the Regulated Investment Company Modernization Act of 2010 (the “Act”) was enacted. Under the Act, for taxable years beginning after December 22, 2010, capital losses may be carried forward indefinitely. Rules in effect previously limited the carryforward period to eight years. Additionally, capital losses realized in taxable years beginning after the effective date of the Act are carried over in the character (short-term or long-term) realized. Rules in effect previously treated all capital loss carryforwards as short-term.
i. Repurchase Agreements. It is each Fund’s policy that the market value of the collateral for repurchase agreements be at least equal to 102% of the repurchase price, including interest. Certain repurchase agreements are tri-party arrangements whereby the collateral is held in a segregated account for the benefit of the Fund and on behalf
83 |
Notes to Financial Statements (continued)
September 30, 2012
of the counterparty. Repurchase agreements could involve certain risks in the event of default or insolvency of the counterparty, including possible delays or restrictions upon a Fund’s ability to dispose of the underlying securities.
j. Delayed Delivery Commitments. The Funds may purchase securities, including those designated as TBAs in the Portfolio of Investments, for which delivery or payment will occur at a later date, beyond the normal settlement period. The price of the security and the date when the security will be delivered and paid for are fixed at the time the transaction is negotiated. The security and the obligation to pay for it are recorded by the Funds at the time the commitment is entered into. The actual security that will be delivered to fulfill a TBA trade is not designated at the time of the trade. The security is “to be announced” 48 hours prior to the established trade settlement date. The value of the security may vary with market fluctuations during the time before the Funds take delivery of the security. When the Funds enter into such a transaction, collateral consisting of liquid securities or cash and cash equivalents is required to be segregated or earmarked at the custodian in an amount at least equal to the amount of the Funds’ commitment. No interest accrues to each Fund until the transaction settles.
Purchases of delayed delivery securities may have a similar effect on the Funds’ net asset value as if the Funds had created a degree of leverage in the portfolio. Risks may arise upon entering into such transactions from the potential inability of counterparties to meet their obligations under the transactions. Additionally, losses may arise due to changes in the value of the underlying securities.
k. Securities Lending. The Funds have entered into an agreement with State Street Bank and Trust Company (“State Street Bank”), as agent of the Funds, to lend securities to certain designated borrowers. The loans are collateralized with cash or securities in an amount equal to at least 105% or 102% of the market value (including accrued interest) of the loaned international or domestic securities, respectively, when the loan is initiated. Thereafter, the value of the collateral must remain at least 102% of the market value (including accrued interest) of loaned securities for U.S. equities and U.S. corporate debt; at least 105% of the market value (including accrued interest) of loaned securities for non-U.S. equities; and at least 100% of the market value (including accrued interest) of loaned securities for U.S. Government securities, sovereign debt issued by non-U.S. Governments and non-U.S. corporate debt. In the event that the market value of the collateral falls below the required percentages described above, the borrower will deliver additional collateral on the next business day. As with other extensions of credit, the Funds may bear the risk of loss with respect to the investment of the collateral. The Funds invest cash collateral in short-term investments, a portion of the income from which is remitted to the borrowers and the remainder allocated between the Funds and State Street Bank as lending agent.
For the year ended September 30, 2012, none of the Funds had loaned securities under this agreement.
| 84
Notes to Financial Statements (continued)
September 30, 2012
l. Indemnifications. Under the Trusts’ organizational documents, their officers and Trustees are indemnified against certain liabilities arising out of the performance of their duties to the Funds. Additionally, in the normal course of business, the Funds enter into contracts with service providers that contain general indemnification clauses. The Funds’ maximum exposure under these arrangements is unknown as this would involve future claims that may be made against the Funds that have not yet occurred. However, based on experience, the Funds expect the risk of loss to be remote.
m. New Accounting Pronouncement. In December 2011, Accounting Standards Update (“ASU”) No. 2011-11, “Disclosures about Offsetting Assets and Liabilities,” was issued and is effective for interim and annual periods beginning after January 1, 2013. The ASU enhances disclosure requirements with respect to an entity’s rights of setoff and related arrangements associated with its financial and derivative instruments. Management is currently evaluating the impact the adoption of ASU 2011-11 may have on the Funds’ financial statement disclosures.
3. Fair Value Measurements. In accordance with accounting standards related to fair value measurements and disclosures, the Funds have categorized the inputs utilized in determining the value of each Fund’s assets or liabilities. These inputs are summarized in the three broad levels listed below:
| | • | | Level 1 – quoted prices in active markets for identical assets or liabilities; |
| | • | | Level 2 – prices determined using other significant inputs that are observable either directly, or indirectly through corroboration with observable market data (which could include quoted prices for similar assets or liabilities, interest rates, credit risk, etc.); and |
| | • | | Level 3 – prices determined using significant unobservable inputs when quoted prices or observable inputs are unavailable such as when there is little or no market activity for an asset or liability (unobservable inputs reflect each Fund’s own assumptions in determining the fair value of assets or liabilities and would be based on the best information available). |
The inputs or methodology used for valuing securities are not necessarily an indication of the risk associated with investing in those securities.
85 |
Notes to Financial Statements (continued)
September 30, 2012
The following is a summary of the inputs used to value the Funds’ investments as of September 30, 2012, at value:
Core Plus Bond Fund
Asset Valuation Inputs
| | | | | | | | | | | | | | | | |
Description | | Level 1 | | | Level 2 | | | Level 3 | | | Total | |
Bonds and Notes(a) | | $ | — | | | $ | 1,325,141,882 | | | $ | — | | | $ | 1,325,141,882 | |
Senior Loans(a) | | | — | | | | 10,605,706 | | | | — | | | | 10,605,706 | |
Preferred Stocks(a) | | | 1,931,496 | | | | 497,669 | | | | — | | | | 2,429,165 | |
Short-Term Investments | | | — | | | | 78,821,191 | | | | — | | | | 78,821,191 | |
| | | | | | | | | | | | | | | | |
Total | | $ | 1,931,496 | | | $ | 1,415,066,448 | | | $ | — | | | $ | 1,416,997,944 | |
| | | | | | | | | | | | | | | | |
| (a) | Details of the major categories of the Fund’s investments are reflected within the Portfolio of Investments. |
High Income Fund
Asset Valuation Inputs
| | | | | | | | | | | | | | | | |
Description | | Level 1 | | | Level 2 | | | Level 3 | | | Total | |
Bonds and Notes | | | | | | | | | | | | | | | | |
Non-Convertible Bonds | | | | | | | | | | | | | | | | |
Transportation Services | | $ | — | | | $ | 358,400 | | | $ | 234,438 | | | $ | 592,838 | |
All Other Non-Convertible Bonds(a) | | | — | | | | 165,617,553 | | | | — | | | | 165,617,553 | |
| | | | | | | | | | | | | | | | |
Total Non-Convertible Bonds | | | — | | | | 165,975,953 | | | | 234,438 | | | | 166,210,391 | |
| | | | | | | | | | | | | | | | |
Convertible Bonds(a) | | | — | | | | 20,232,461 | | | | — | | | | 20,232,461 | |
| | | | | | | | | | | | | | | | |
Total Bonds and Notes | | | — | | | | 186,208,414 | | | | 234,438 | | | | 186,442,852 | |
| | | | | | | | | | | | | | | | |
Senior Loans(a) | | | — | | | | 775,208 | | | | — | | | | 775,208 | |
Preferred Stocks | | | | | | | | | | | | | | | | |
Convertible Preferred Stocks(a) | | | 4,072,716 | | | | 107,123 | | | | — | | | | 4,179,839 | |
| | | | | | | | | | | | | | | | |
Non-Convertible Preferred Stocks(a) | | | 1,927,081 | | | | 902,728 | | | | — | | | | 2,829,809 | |
| | | | | | | | | | | | | | | | |
Total Preferred Stocks | | | 5,999,797 | | | | 1,009,851 | | | | — | | | | 7,009,648 | |
| | | | | | | | | | | | | | | | |
Common Stocks(a) | | | 3,075,072 | | | | — | | | | — | | | | 3,075,072 | |
Warrants(b) | | | 78,567 | | | | — | | | | — | | | | 78,567 | |
Short-Term Investments | | | — | | | | 27,958,852 | | | | — | | | | 27,958,852 | |
Total Investments | | | 9,153,436 | | | | 215,952,325 | | | | 234,438 | | | | 225,340,199 | |
| | | | | | | | | | | | | | | | |
Forward Foreign Currency Contracts (unrealized appreciation) | | | — | | | | 189 | | | | — | | | | 189 | |
| | | | | | | | | | | | | | | | |
Total | | $ | 9,153,436 | | | $ | 215,952,514 | | | $ | 234,438 | | | $ | 225,340,388 | |
| | | | | | | | | | | | | | | | |
| 86
Notes to Financial Statements (continued)
September 30, 2012
| | | | | | | | | | | | | | | | |
| | | | |
| Liability Valuation Inputs | | | | | | | | | | | | | | | | |
Description | | Level 1 | | | Level 2 | | | Level 3 | | | Total | |
Forward Foreign Currency Contracts (unrealized depreciation) | | $ | — | | | $ | (243,423 | ) | | $ | — | | | $ | (243,423 | ) |
| | | | | | | | | | | | | | | | |
| (a) | Details of the major categories of the Fund’s investments are reflected within the Portfolio of Investments. |
| (b) | Includes a security fair valued at zero using Level 2 inputs. |
A preferred stock valued at $140,000 was transferred from Level 1 to Level 2 during the period ended September 30, 2012. At September 30, 2011, this security was valued at market price in accordance with the Fund’s valuation policies; at September 30, 2012, this security was valued on the basis of evaluated bids furnished to the Fund by an independent pricing service as a market price was not available.
All transfers are recognized as of the beginning of the reporting period.
International Bond Fund
Asset Valuation Inputs
| | | | | | | | | | | | | | | | |
Description | | Level 1 | | | Level 2 | | | Level 3 | | | Total | |
Bonds and Notes(a) | | $ | — | | | $ | 18,754,457 | | | $ | — | | | $ | 18,754,457 | |
Short-Term Investments | | | — | | | | 518,975 | | | | — | | | | 518,975 | |
| | | | | | | | | | | | | | | | |
Total Investments | | | — | | | | 19,273,432 | | | | — | | | | 19,273,432 | |
| | | | | | | | | | | | | | | | |
Forward Foreign Currency Contracts (unrealized appreciation) | | | — | | | | 16,454 | | | | — | | | | 16,454 | |
| | | | | | | | | | | | | | | | |
Total | | $ | — | | | $ | 19,289,886 | | | $ | — | | | $ | 19,289,886 | |
| | | | | | | | | | | | | | | | |
| | | | |
| Liability Valuation Inputs | | | | | | | | | | | | | | | | |
Description | | Level 1 | | | Level 2 | | | Level 3 | | | Total | |
Forward Foreign Currency Contracts (unrealized depreciation) | | $ | — | | | $ | (50 | ) | | $ | — | | | $ | (50 | ) |
| | | | | | | | | | | | | | | | |
| (a) | Details of the major categories of the Fund’s investments are reflected within the Portfolio of Investments. |
For the year ended September 30, 2012, there were no transfers between Levels 1, 2 and 3.
87 |
Notes to Financial Statements (continued)
September 30, 2012
Limited Term Government and Agency Fund
Asset Valuation Inputs
| | | | | | | | | | | | | | | | |
Description | | Level 1 | | | Level 2 | | | Level 3 | | | Total | |
Bonds and Notes | | | | | | | | | | | | | | | | |
ABS Car Loan | | $ | — | | | $ | 9,556,208 | | | $ | 910,501 | | | $ | 10,466,709 | |
Mortgage Related | | | — | | | | 130,400,758 | | | | 1,982,780 | | | | 132,383,538 | |
All Other Bond and Notes(a) | | | — | | | | 457,709,710 | | | | — | | | | 457,709,710 | |
| | | | | | | | | | | | | | | | |
Total Bonds and Notes | | | — | | | | 597,666,676 | | | | 2,893,281 | | | | 600,559,957 | |
| | | | | | | | | | | | | | | | |
Short-Term Investments | | | — | | | | 61,277,308 | | | | — | | | | 61,277,308 | |
| | | | | | | | | | | | | | | | |
Total | | $ | — | | | $ | 658,943,984 | | | $ | 2,893,281 | | | $ | 661,837,265 | |
| | | | | | | | | | | | | | | | |
| (a) | Details of the major categories of the Fund’s investments are reflected within the Portfolio of Investments. |
For the year ended September 30, 2012, there were no transfers between Levels 1, 2 and 3.
The following is a reconciliation of Level 3 investments for which significant unobservable inputs were used to determine fair value as of September 30, 2012:
Core Plus Bond Fund
Asset Valuation Inputs
| | | | | | | | | | | | | | | | | | | | |
Investments in Securities | | Balance as of
September 30,
2011 | | | Accrued
Discounts
(Premiums) | | | Realized
Gain
(Loss) | | | Change in
Unrealized
Appreciation
(Depreciation) | | | Purchases | |
Preferred Stocks | | | | | | | | | | | | | | | | | | | | |
Non-Captive Diversified | | $ | 319,200 | | | $ | — | | | $ | — | | | $ | — | | | $ | — | |
| | | | | | | | | | | | | | | | | | | | |
| | | | | |
Investments in Securities | | Sales | | | Transfers
into Level 3 | | | Transfers
out of
Level 3 | | | Balance as of
September 30,
2012 | | | Change in
Unrealized
Appreciation
(Depreciation)
from
Investments
Still Held at
September 30,
2012 | |
Preferred Stocks | | | | | | | | | | | | | | | | | | | | |
Non-Captive Diversified | | $ | — | | | $ | — | | | $ | (319,200 | ) | | $ | — | | | $ | — | |
| | | | | | | | | | | | | | | | | | | | |
A preferred stock valued at $319,200 was transferred from Level 3 to Level 2 during the period ended September 30, 2012. At September 30, 2011, this security was valued using
| 88
Notes to Financial Statements (continued)
September 30, 2012
broker-dealer bid quotations based on inputs unobservable to the Fund as an independent pricing service did not provide a reliable price for the security; at September 30, 2012, this security was valued on the basis of evaluated bids furnished to the Fund by an independent pricing service in accordance with the Fund’s valuation policies.
All transfers are recognized as of the beginning of the reporting period.
High Income Fund
Asset Valuation Inputs
| | | | | | | | | | | | | | | | | | | | |
Investments in Securities | | Balance as of
September 30,
2011 | | | Accrued
Discounts
(Premiums) | | | Realized
Gain
(Loss) | | | Change in
Unrealized
Appreciation
(Depreciation) | | | Purchases | |
Bonds and Notes | | | | | | | | | | | | | | | | | | | | |
Non-Convertible Bonds | | | | | | | | | | | | | | | | | | | | |
Consumer Cyclical Services | | $ | 843,525 | | | $ | — | | | $ | — | | | $ | — | | | $ | — | |
Transportation Services | | | — | | | | 751 | | | | — | | | | 57,687 | | | | — | |
Treasuries | | | 27,508 | | | | 715 | | | | (34,823 | ) | | | 22,081 | | | | — | |
| | | | | | | | | | | | | | | | | | | | |
Total | | $ | 871,033 | | | $ | 1,466 | | | $ | (34,823 | ) | | $ | 79,768 | | | $ | — | |
| | | | | | | | | | | | | | | | | | | | |
| | | | | |
Investments in Securities | | Sales | | | Transfers
into Level 3 | | | Transfers
out of Level 3 | | | Balance as of
September 30,
2012 | | | Change in
Unrealized
Appreciation
(Depreciation)
from
Investments
Still Held at
September 30,
2012 | |
Bonds and Notes | | | | | | | | | | | | | | | | | | | | |
Non-Convertible Bonds | | | | | | | | | | | | | | | | | | | | |
Consumer Cyclical Services | | $ | — | | | $ | — | | | $ | (843,525 | ) | | $ | — | | | $ | — | |
Transportation Services | | | — | | | | 176,000 | | | | — | | | | 234,438 | | | | 57,687 | |
Treasuries | | | (15,481 | ) | | | — | | | | — | | | | — | | | | — | |
| | | | | | | | | | | | | | | | | | | | |
Total | | $ | (15,481 | ) | | $ | 176,000 | | | $ | (843,525 | ) | | $ | 234,438 | | | $ | 57,687 | |
| | | | | | | | | | | | | | | | | | | | |
89 |
Notes to Financial Statements (continued)
September 30, 2012
A debt security valued at $176,000 was transferred from Level 2 to Level 3 during the period ended September 30, 2012. At September 30, 2011, this security was valued on the basis of evaluated bids furnished to the Fund by an independent pricing service in accordance with the Fund’s valuation policies; at September 30, 2012, this security was valued using broker-dealer bid quotations based on inputs unobservable to the Fund as an independent pricing service did not provide a reliable price for the security.
A debt security valued at $843,525 was transferred from Level 3 to Level 2 during the period ended September 30, 2012. At September 30, 2011, this security was valued using broker-dealer bid quotations based on inputs unobservable to the Fund as an independent pricing service did not provide a reliable price for the security; at September 30, 2012, this security was valued on the basis of evaluated bids furnished to the Fund by an independent pricing service in accordance with the Fund’s valuation policies.
All transfers are recognized as of the beginning of the reporting period.
International Bond Fund
Asset Valuation Inputs
| | | | | | | | | | | | | | | | | | | | |
Investments in Securities | | Balance as of
September 30,
2011 | | | Accrued
Discounts
(Premiums) | | | Realized
Gain (Loss) | | | Change in
Unrealized
Appreciation
(Depreciation) | | | Purchases | |
Bonds and Notes | | | | | | | | | | | | | | | | | | | | |
Non-Convertible Bonds | | | | | | | | | | | | | | | | | | | | |
Supranationals | | $ | 118,679 | | | $ | 67 | | | $ | (16,300 | ) | | $ | 7,247 | | | $ | — | |
| | | | | | | | | | | | | | | | | | | | |
| | | | | |
Investments in Securities | | Sales | | | Transfers
into Level 3 | | | Transfers
out of
Level 3 | | | Balance as of
September 30,
2012 | | | Change in
Unrealized
Appreciation
(Depreciation)
from
Investments
Still Held at
September 30,
2012 | |
Bonds and Notes | | | | | | | | | | | | | | | | | | | | |
Non-Convertible Bonds | | | | | | | | | | | | | | | | | | | | |
Supranationals | | $ | (109,693 | ) | | $ | — | | | $ | — | | | $ | — | | | $ | — | |
| | | | | | | | | | | | | | | | | | | | |
| 90
Notes to Financial Statements (continued)
September 30, 2012
Limited Term Government and Agency Fund
Asset Valuation Inputs
| | | | | | | | | | | | | | | | | | | | |
Investments in Securities | | Balance as of
September 30,
2011 | | | Accrued
Discounts
(Premiums) | | | Realized
Gain
(Loss) | | | Change in
Unrealized
Appreciation
(Depreciation) | | | Purchases | |
Bonds and Notes | | | | | | | | | | | | | | | | | | | | |
ABS Car Loan | | $ | — | | | $ | — | | | $ | — | | | $ | 659 | | | $ | 909,842 | |
Mortgage Related | | | — | | | | — | | | | — | | | | 12,020 | | | | 1,970,760 | |
| | | | | | | | | | | | | | | | | | | | |
Total | | $ | — | | | $ | — | | | $ | — | | | $ | 12,679 | | | $ | 2,880,602 | |
| | | | | | | | | | | | | | | | | | | | |
| | | | | |
Investments in Securities | | Sales | | | Transfers
into Level 3 | | | Transfers
out of Level 3 | | | Balance as of
September 30,
2012 | | | Change in
Unrealized
Appreciation
(Depreciation)
from
Investments
Still Held at
September 30,
2012 | |
Bonds and Notes | | | | | | | | | | | | | | | | | | | | |
ABS Car Loan | | $ | — | | | $ | — | | | $ | — | | | $ | 910,501 | | | $ | 659 | |
Mortgage Related | | | — | | | | — | | | | — | | | | 1,982,780 | | | | 12,020 | |
| | | | | | | | | | | | | | | | | | | | |
Total | | $ | — | | | $ | — | | | $ | — | | | $ | 2,893,281 | | | $ | 12,679 | |
| | | | | | | | | | | | | | | | | | | | |
4. Derivatives. Derivative instruments are defined as financial instruments whose value and performance are based on the value and performance of another security or financial instrument. Derivative instruments that Core Plus Bond Fund, High Income Fund and International Bond Fund used during the period include forward foreign currency contracts.
Core Plus Bond Fund, High Income Fund and International Bond Fund are subject to the risk that changes in foreign currency exchange rates will have an unfavorable effect on the value of Fund assets denominated in foreign currencies. The Funds may enter into forward foreign currency contracts for hedging purposes to protect the value of the Funds’ holdings of foreign securities. The Funds may also use forward foreign currency contracts to gain exposure to foreign currencies, regardless of whether securities denominated in such currencies are held in the Funds. During the year ended September 30, 2012, Core Plus Bond Fund and High Income Fund engaged in forward foreign currency transactions for hedging purposes. During the same period, International Bond Fund engaged in forward foreign currency transactions for hedging purposes and to gain exposure to foreign currencies.
91 |
Notes to Financial Statements (continued)
September 30, 2012
Core Plus Bond Fund, High Income Fund and International Bond Fund are party to agreements with counterparties that govern transactions in forward foreign currency contracts. These agreements contain credit-risk-related contingent features that allow the counterparties to terminate open contracts early if the net asset value of a Fund declines beyond a certain threshold. If such features were to be triggered, the counterparties could request immediate settlement of open contracts at current fair value. As of September 30, 2012, the fair value of derivative positions (including open trades) subject to credit-risk-related contingent features that are in a net liability position by counterparty, and the value of collateral pledged to counterparties for such contracts is as follows:
| | | | | | | | |
Fund | | Counterparty | | Derivatives | | | Collateral Pledged |
High Income Fund | | Barclays Bank PLC | | $ | (243,234 | ) | | $270,000 |
International Bond Fund | | UBS AG | | | (50 | ) | | — |
Forward foreign currency contracts are subject to the risk that the counterparty will be unwilling or unable to meet its obligations under the contracts. The Funds have mitigated this risk by entering into master netting agreements with counterparties that allow the Fund and the counterparty to offset amounts owed by each related to derivative contracts to one net amount payable by either the Fund or the counterparty. The maximum amount of loss that the Funds would incur if counterparties failed to meet their obligations and the amount of loss that the Funds would incur after taking into account master netting arrangements, are as follows as of September 30, 2012:
| | | | | | | | |
Fund | | Maximum Amount of
Loss – Gross | | | Maximum Amount of
Loss – Net | |
High Income Fund | | $ | 189 | | | $ | — | |
International Bond Fund | | | 16,454 | | | | 16,454 | |
Counterparty risk is managed based on policies and procedures established by each Fund’s adviser. Such policies and procedures may include, but are not limited to, minimum counterparty credit rating requirements, monitoring of counterparty credit default swap spreads and posting of collateral. Collateral is posted based on the requirements established under International Swaps and Derivatives Association (“ISDA”) agreements negotiated between each Fund and the derivative counterparties. The risk of loss to a Fund from counterparty default should be limited to the extent a Fund is undercollateralized; however, final settlement of a Fund’s claim against any collateral received may be subject to bankruptcy court proceedings.
| 92
Notes to Financial Statements (continued)
September 30, 2012
Transactions in derivative instruments for Core Plus Bond Fund during the year ended September 30, 2012, were as follows:
| | | | |
Statements of Operations Caption | | Foreign
Exchange
Contracts | |
Net Realized Gain (Loss) on: | | | | |
Foreign currency transactions* | | $ | 3,521,443 | |
Net Change in Unrealized Appreciation (Depreciation) on: | | | | |
Foreign currency translations* | | | (628,790 | ) |
| * | Represents realized gain and change in unrealized appreciation (depreciation), respectively, for forward foreign currency contracts during the period. |
The following is a summary of derivative instruments for High Income Fund as of September 30, 2012:
| | | | |
Statements of Assets and Liabilities Caption | | Foreign
Exchange
Contracts | |
Assets | | | | |
Unrealized appreciation on forward foreign currency contracts | | $ | 189 | |
Liabilities | | | | |
Unrealized depreciation on forward foreign currency contracts | | | (243,423 | ) |
Transactions in derivative instruments for High Income Fund during the year ended September 30, 2012, were as follows:
| | | | |
Statements of Operations Caption | | Foreign
Exchange
Contracts | |
Net Realized Gain (Loss) on: | | | | |
Foreign currency transactions* | | $ | 614,561 | |
Net Change in Unrealized Appreciation (Depreciation) on: | | | | |
Foreign currency translations* | | | (475,489 | ) |
| * | Represents realized gain and change in unrealized appreciation (depreciation), respectively, for forward foreign currency contracts during the period. |
93 |
Notes to Financial Statements (continued)
September 30, 2012
The following is a summary of derivative instruments for International Bond Fund as of September 30, 2012:
| | | | |
Statements of Assets and Liabilities Caption | | Foreign
Exchange
Contracts | |
Assets | | | | |
Unrealized appreciation on forward foreign currency contracts | | $ | 16,454 | |
Liabilities | | | | |
Unrealized depreciation on forward foreign currency contracts | | | (50 | ) |
Transactions in derivative instruments for International Bond Fund during the year ended September 30, 2012, were as follows:
| | | | |
Statements of Operations Caption | | Foreign
Exchange
Contracts | |
Net Realized Gain (Loss) on: | | | | |
Foreign currency transactions* | | $ | (75,401 | ) |
Net Change in Unrealized Appreciation (Depreciation) on: | | | | |
Foreign currency translations* | | | 208,009 | |
| * | Represents realized loss and change in unrealized appreciation (depreciation), respectively, for forward foreign currency contracts during the period. |
As the Funds value their derivatives at fair value and recognize changes in fair value through the Statements of Operations, they do not qualify for hedge accounting under authoritative guidance for derivative instruments. The Funds’ investments in derivatives may represent an economic hedge; however, they are considered to be non-hedge transactions for the purpose of these disclosures.
The volume of forward foreign currency contract activity, as a percentage of net assets, for Core Plus Bond Fund, High Income Fund and International Bond Fund, based on gross month-end notional amounts outstanding during the period, including long and short positions at absolute value, was as follows for the year ended September 30, 2012:
| | | | |
Core Plus Bond Fund | | Forwards | |
Average Notional Amount Outstanding | | | 3.43 | % |
Highest Notional Amount Outstanding | | | 5.78 | % |
Lowest Notional Amount Outstanding | | | 0.00 | % |
Notional Amount Outstanding as of September 30, 2012 | | | 0.00 | % |
| 94
Notes to Financial Statements (continued)
September 30, 2012
| | | | |
High Income Fund | | Forwards | |
Average Notional Amount Outstanding | | | 2.44 | % |
Highest Notional Amount Outstanding | | | 3.33 | % |
Lowest Notional Amount Outstanding | | | 1.84 | % |
Notional Amount Outstanding as of September 30, 2012 | | | 2.79 | % |
| |
International Bond Fund | | Forwards | |
Average Notional Amount Outstanding | | | 18.94 | % |
Highest Notional Amount Outstanding | | | 39.39 | % |
Lowest Notional Amount Outstanding | | | 9.99 | % |
Notional Amount Outstanding as of September 30, 2012 | | | 12.19 | % |
Notional amounts outstanding at the end of the prior period are included in the average notional amount outstanding.
5. Purchases and Sales of Securities. For the year ended September 30, 2012, purchases and sales of securities (excluding short-term investments and including paydowns) were as follows:
| | | | | | | | | | | | | | | | |
| | | U.S. Government/
Agency Securities | | | Other Securities | |
Fund | | Purchases | | | Sales | | | Purchases | | | Sales | |
Core Plus Bond Fund | | $ | 705,066,088 | | | $ | 440,840,183 | | | $ | 757,564,012 | | | $ | 263,873,184 | |
High Income Fund | | | 6,000,735 | | | | — | | | | 114,099,788 | | | | 49,775,666 | |
International Bond Fund | | | 5,179,979 | | | | 4,690,418 | | | | 29,932,254 | | | | 36,181,927 | |
Limited Term Government and Agency Fund | | | 359,934,684 | | | | 242,532,124 | | | | 43,829,187 | | | | 61,339,571 | |
6. Management Fees and Other Transactions with Affiliates.
a. Management Fees. Loomis, Sayles & Company, L.P. (“Loomis Sayles”) serves as investment adviser to each Fund. Under the terms of the management agreements, each Fund pays a management fee at the following annual rates, calculated daily and payable monthly, based on each Fund’s average daily net assets:
| | | | | | | | | | | | |
| | | Percentage of Average Daily Net Assets | |
Fund | | First $100 million | | | Next $150 million | | | Over $250 million | |
Core Plus Bond Fund | | | 0.2500 | % | | | 0.1875 | % | | | 0.1875 | % |
High Income Fund | | | 0.6000 | % | | | 0.6000 | % | | | 0.6000 | % |
International Bond Fund | | | 0.6000 | % | | | 0.6000 | % | | | 0.6000 | % |
Limited Term Government and Agency Fund | | | 0.5000 | % | | | 0.5000 | % | | | 0.4000 | % |
95 |
Notes to Financial Statements (continued)
September 30, 2012
NGAM Advisors, L.P. (“NGAM Advisors”) serves as the advisory administrator to Core Plus Bond Fund. Under the terms of the advisory administration agreement, the Fund pays an advisory administration fee at the following annual rates, calculated daily and payable monthly, based on its average daily net assets:
| | | | | | | | |
| | | Percentage of Average Daily Net Assets | |
Fund | | First $100 million | | | Over $100 million | |
Core Plus Bond Fund | | | 0.2500 | % | | | 0.1875 | % |
Management and advisory administration fees are presented in the Statements of Operations as management fees.
Loomis Sayles has given binding undertakings to the Funds to waive management fees and/or reimburse certain expenses to limit the Funds’ operating expenses, exclusive of acquired fund fees and expenses, brokerage expenses, interest expense, taxes and extraordinary expenses. These undertakings are in effect until January 31, 2013 and are reevaluated on an annual basis. Management fees payable, as reflected on the Statements of Assets and Liabilities, is net of waivers and/or expense reimbursements, if any, pursuant to these undertakings. Waivers/reimbursements that exceed management fees payable are reflected on the Statements of Assets and Liabilities as receivable from investment adviser.
For the period from July 1, 2012 to September 30, 2012, the expense limits as a percentage of average daily net assets under the expense limitation agreements were as follows:
| | | | | | | | | | | | | | | | |
| | | Expense Limit as a Percentage of
Average Daily Net Assets | |
Fund | | Class A | | | Class B | | | Class C | | | Class Y | |
Core Plus Bond Fund | | | 0.90 | % | | | 1.65 | % | | | 1.65 | % | | | 0.65 | % |
High Income Fund | | | 1.15 | % | | | 1.90 | % | | | 1.90 | % | | | 0.90 | % |
International Bond Fund | | | 1.05 | % | | | — | | | | 1.80 | % | | | 0.80 | % |
Limited Term Government and Agency Fund | | | 0.85 | % | | | 1.60 | % | | | 1.60 | % | | | 0.60 | % |
Prior to July 1, 2012 the expense limits as a percentage of average daily net assets under the expense limitation agreements were as follows:
| | | | | | | | | | | | | | | | |
| | | Expense Limit as a Percentage of
Average Daily Net Assets | |
Fund | | Class A | | | Class B | | | Class C | | | Class Y | |
Core Plus Bond Fund | | | 0.90 | % | | | 1.65 | % | | | 1.65 | % | | | 0.65 | % |
High Income Fund | | | 1.15 | % | | | 1.90 | % | | | 1.90 | % | | | 0.90 | % |
International Bond Fund | | | 1.10 | % | | | — | | | | 1.85 | % | | | 0.85 | % |
Limited Term Government and Agency Fund | | | 0.85 | % | | | 1.60 | % | | | 1.60 | % | | | 0.60 | % |
| 96
Notes to Financial Statements (continued)
September 30, 2012
Loomis Sayles and NGAM Advisors have agreed to equally bear the waivers and/or expense reimbursements for Core Plus Bond Fund.
Loomis Sayles (and NGAM Advisors for Core Plus Bond Fund) shall be permitted to recover expenses borne under the expense limitation agreements (whether through waiver of its management fees or otherwise) on a class by class basis in later periods to the extent the expenses of a class fall below a class’ expense limits, provided, however, that a class is not obligated to pay such waived/reimbursed fees or expenses more than one year after the end of the fiscal year in which the fees or expenses were waived/reimbursed.
For the year ended September 30, 2012, the management fees and waivers of management fees for each Fund were as follows:
| | | | | | | | | | | | | | | | | | | | |
| | | Gross
Management
Fees | | | Waivers of
Management
Fees(1) | | | Net
Management
Fees | | | Percentage of
Average
Daily Net Assets | |
Fund | | | | | Gross | | | Net | |
Core Plus Bond Fund | | $ | 1,813,333 | | | $ | — | | | $ | 1,813,333 | | | | 0.194 | % | | | 0.194 | % |
High Income Fund | | | 973,470 | | | | 72,653 | | | | 900,817 | | | | 0.600 | % | | | 0.555 | % |
International Bond Fund | | | 128,583 | | | | 128,583 | | | | — | | | | 0.600 | % | | | — | |
Limited Term Government and Agency Fund | | | 2,463,264 | | | | 272,752 | | | | 2,190,512 | | | | 0.445 | % | | | 0.396 | % |
| (1) | Management fee waivers are subject to possible recovery until September 30, 2013. |
For the year ended September 30, 2012, the advisory administration fees for Core Plus Bond Fund were as follows:
| | |
Advisory Administration Fee | | Percentage of Average
Daily Net Assets |
$1,813,333 | | 0.194% |
For the year ended September 30, 2012, expenses have been reimbursed as follows:
| | |
Fund | | Reimbursement(2) |
International Bond Fund | | $34,334 |
| (2) | Expense reimbursements are subject to possible recovery until September 30, 2013. |
No expenses were recovered for any of the Funds during the year ended September 30, 2012 under the terms of the expense limitation agreements.
Certain officers and employees of Loomis Sayles are also officers or Trustees of the Trust. Loomis Sayles’ general partner is indirectly owned by Natixis Global Asset Management, L.P. (“Natixis US”), which is part of Natixis Global Asset Management, an international asset management group based in Paris, France.
97 |
Notes to Financial Statements (continued)
September 30, 2012
b. Service and Distribution Fees. NGAM Distribution, L.P. (“NGAM Distribution”), which is a wholly-owned subsidiary of Natixis US, has entered into a distribution agreement with the Trusts. Pursuant to this agreement, NGAM Distribution serves as principal underwriter of the Funds of the Trusts.
Pursuant to Rule 12b-1 under the 1940 Act, the Trusts have adopted a Service Plan relating to each Fund’s Class A shares (the “Class A Plans”), and a Distribution and Service Plan relating to each Fund’s Class B (if applicable) and Class C shares (the “Class B and Class C Plans”).
Under the Class A Plans, each Fund pays NGAM Distribution a monthly service fee at an annual rate not to exceed 0.25% of the average daily net assets attributable to the Funds’ Class A shares, as reimbursement for expenses incurred by NGAM Distribution in providing personal services to investors in Class A shares and/or the maintenance of shareholder accounts.
Under the Class B (if applicable) and Class C Plans, each Fund pays NGAM Distribution a monthly service fee at an annual rate not to exceed 0.25% of the average daily net assets attributable to the Funds’ Class B (if applicable) and Class C shares, as compensation for services provided by NGAM Distribution in providing personal services to investors in Class B (if applicable) and Class C shares and/or the maintenance of shareholder accounts.
Also under the Class B (if applicable) and Class C Plans, each Fund pays NGAM Distribution a monthly distribution fee at the annual rate of 0.75% of the average daily net assets attributable to the Funds’ Class B (if applicable) and Class C shares, as compensation for services provided by NGAM Distribution in connection with the marketing or sale of Class B (if applicable) and Class C shares.
For the year ended September 30, 2012, the service and distribution fees for each Fund were as follows:
| | | | | | | | | | | | | | | | | | | | |
| | | Service Fees | | | Distribution Fees | |
Fund | | Class A | | | Class B | | | Class C | | | Class B | | | Class C | |
Core Plus Bond Fund | | $ | 897,310 | | | $ | 6,850 | | | $ | 508,078 | | | $ | 20,550 | | | $ | 1,524,233 | |
High Income Fund | | | 193,739 | | | | 1,600 | | | | 40,793 | | | | 4,800 | | | | 122,378 | |
International Bond Fund | | | 24,891 | | | | — | | | | 15,523 | | | | — | | | | 46,569 | |
Limited Term Government and Agency Fund | | | 766,606 | | | | 23,908 | | | | 182,733 | | | | 71,726 | | | | 548,200 | |
c. Administrative Fees. NGAM Advisors provides certain administrative services for the Funds and contracts with State Street Bank to serve as sub-administrator. NGAM Advisors is a wholly-owned subsidiary of Natixis US. Pursuant to an agreement among Natixis Funds Trust I, Natixis Funds Trust II, Natixis Funds Trust IV, Gateway Trust (“Natixis Funds Trusts”), Loomis Sayles Funds I, Loomis Sayles Funds II (“Loomis Sayles
| 98
Notes to Financial Statements (continued)
September 30, 2012
Funds Trusts”), Hansberger International Series and NGAM Advisors, each Fund pays NGAM Advisors monthly its pro rata portion of fees equal to an annual rate of 0.0575% of the first $15 billion of the average daily net assets of the Natixis Funds Trusts, Loomis Sayles Funds Trusts and Hansberger International Series, 0.0500% of the next $15 billion, 0.0400% of the next $30 billion and 0.0350% of such assets in excess of $60 billion, subject to an annual aggregate minimum fee for the Natixis Funds Trusts, Loomis Sayles Funds Trusts and Hansberger International Series of $10 million, which is reevaluated on an annual basis.
For the year ended September 30, 2012, the administrative fees for each Fund were as follows:
| | | | |
Fund | | Administrative
Fees | |
Core Plus Bond Fund | | $ | 424,288 | |
High Income Fund | | | 73,840 | |
International Bond Fund | | | 9,774 | |
Limited Term Government and Agency Fund | | | 252,012 | |
d. Sub-Transfer Agent Fees. NGAM distribution has entered into agreements, which include servicing agreements, with financial intermediaries that provide recordkeeping, processing, shareholder communications and other services to customers of the intermediaries that hold positions in the Funds and has agreed to compensate the intermediaries for providing those services. Intermediaries transact with the Funds primarily through the use of omnibus accounts on behalf of their customers who hold positions in the Funds. These services would have been provided by the Funds’ transfer agent and other service providers if the shareholders’ accounts were maintained directly at the Funds’ transfer agent. Accordingly, the Funds have agreed to reimburse NGAM Distribution for all or a portion of the servicing fees paid to these intermediaries. The reimbursement amounts (sub-transfer agent fees) paid to NGAM Distribution are subject to a current per-account equivalent fee limit approved by the Funds’ Board, which is based on fees for similar services paid to the Funds’ transfer agent and other service providers.
For the year ended September 30, 2012, the sub-transfer agent fees (which are reflected in transfer agent fees and expenses in the Statements of Operations) for each Fund were as follows:
| | | | |
Fund | | Sub-Transfer
Agent Fees | |
Core Plus Bond Fund | | $ | 618,682 | |
High Income Fund | | | 137,928 | |
International Bond Fund | | | 13,225 | |
Limited Term Government and Agency Fund | | | 197,755 | |
99 |
Notes to Financial Statements (continued)
September 30, 2012
As of September 30, 2012, the Funds owe NGAM Distribution the following reimbursements for sub-transfer agent fees:
| | | | |
Fund | | Reimbursements of
Sub-Transfer
Agent Fees | |
Core Plus Bond Fund | | $ | 9,122 | |
High Income Fund | | | 1,868 | |
International Bond Fund | | | 183 | |
Limited Term Government and Agency Fund | | | 2,576 | |
e. Commissions. Commissions (including CDSCs) on Fund shares retained by NGAM Distribution during the year ended September 30, 2012 were as follows:
| | | | |
Fund | | Commissions | |
Core Plus Bond Fund | | $ | 1,395,372 | |
High Income Fund | | | 85,271 | |
International Bond Fund | | | 35,054 | |
Limited Term Government and Agency Fund | | | 278,505 | |
f. Trustees Fees and Expenses. The Trusts do not pay any compensation directly to their officers or Trustees who are directors, officers or employees of NGAM Advisors, NGAM Distribution, Natixis US or their affiliates. Effective January 1, 2012, the Chairperson of the Board receives a retainer fee at the annual rate of $265,000. The Chairperson does not receive any meeting attendance fees for Board of Trustees meetings or committee meetings that she attends. Each Independent Trustee (other than the Chairperson) receives, in the aggregate, a retainer fee at the annual rate of $95,000. Each Independent Trustee also receives a meeting attendance fee of $10,000 for each meeting of the Board of Trustees that he or she attends in person and $5,000 for each meeting of the Board of Trustees that he or she attends telephonically. In addition, each committee chairman receives an additional retainer fee at an annual rate of $15,000. Each Contract Review and Governance Committee member is compensated $6,000 for each Committee meeting that he or she attends in person and $3,000 for each meeting that he or she attends telephonically. Each Audit Committee member is compensated $7,500 for each Committee meeting that he or she attends in person and $3,750 for each meeting that he or she attends telephonically. These fees are allocated among the funds in the Natixis Funds Trusts, Loomis Sayles Funds Trusts and Hansberger International Series based on a formula that takes into account, among other factors, the relative net assets of each fund. Trustees are reimbursed for travel expenses in connection with attendance at meetings.
Prior to January 1, 2012, the Chairperson of the Board received a retainer fee at the annual rate of $250,000 and each Independent Trustee (other than the Chairperson) received, in aggregate, a retainer fee at the annual rate of $80,000. All other Trustee fees remain unchanged.
| 100
Notes to Financial Statements (continued)
September 30, 2012
A deferred compensation plan (the “Plan”) is available to the Trustees on a voluntary basis. Deferred amounts remain in the Funds until distributed in accordance with the provisions of the Plan. The value of a participating Trustee’s deferral account is based on theoretical investments of deferred amounts, on the normal payment dates, in certain funds of the Natixis Funds Trusts, Loomis Sayles Funds Trusts and Hansberger International Series as designated by the participating Trustees. Changes in the value of participants’ deferral accounts are allocated pro rata among the funds in the Natixis Funds Trusts, Loomis Sayles Funds Trusts, and Hansberger International Series, and are normally reflected as Trustees’ fees and expenses in the Statements of Operations. The portions of the accrued obligations allocated to the Funds under the Plan are reflected as Deferred Trustees’ fees in the Statements of Assets and Liabilities.
g. Affiliated Ownership. At September 30, 2012, the Loomis Sayles Employees’ Profit Sharing Retirement Plan (“Retirement Plan”) held shares of the Funds representing the following percentage of net assets:
| | | | |
Fund | | Retirement Plan | |
Core Plus Bond Fund | | | 0.04 | % |
International Bond Fund | | | 0.96 | % |
Limited Term Government and Agency Fund | | | 0.17 | % |
Investment activities of affiliated shareholders could have material impacts on the Funds.
7. Line of Credit. Each Fund, together with certain other funds of Natixis Funds Trusts, Loomis Sayles Funds Trusts and Hansberger International Series, participates in a $200,000,000 committed unsecured line of credit provided by State Street Bank, with an individual limit of $125,000,000 for each fund that participates in the line of credit. Interest is charged to each participating fund based on its borrowings at a rate per annum equal to the greater of the Federal Funds rate or overnight LIBOR, plus 1.25%. In addition, a commitment fee of 0.10% per annum, payable at the end of each calendar quarter, is accrued and apportioned among the participating funds based on their average daily unused portion of the line of credit. Prior to April 19, 2012, the commitment fee was 0.125% per annum.
For the year ended September 30, 2012, none of the Funds had borrowings under these agreements.
8. Concentration of Risk. International Bond Fund is a non-diversified fund. Compared with diversified mutual funds, International Bond Fund may invest a greater percentage of its assets in a particular country. Therefore, International Bond Fund’s returns could be significantly affected by the performance of any one of the small number of countries in its portfolio.
Each Fund’s investments in foreign securities are subject to foreign currency fluctuations, higher volatility than U.S. securities, varying degrees of regulation and
101 |
Notes to Financial Statements (continued)
September 30, 2012
limited liquidity. Greater political, economic, credit and information risks are also associated with foreign securities.
9. Concentration of Ownership. From time to time, the Funds may have a concentration of one or more accounts constituting a significant percentage of shares outstanding. Investment activities by holders of such accounts could have material impacts on the Funds. As of September 30, 2012, based on management’s evaluation of the shareholder account base, the High Income Fund had accounts representing controlling ownership of more than 5% of the Fund’s total outstanding shares. The number of such accounts, including affiliated accounts, based on accounts that represent more than 5% of an individual class of shares, and the aggregate percentage of net assets represented by such holdings was as follows:
| | | | | | | | |
Fund | | Number of
> 5% Non-Affiliated
Shareholders | | | Percentage of Ownership | |
High Income Fund | | | 1 | | | | 8.54 | % |
Shareholder positions in the Funds may be held by intermediaries utilizing omnibus accounts. The Funds may not have information on the individual shareholder accounts underlying omnibus accounts; therefore, there could be other 5% shareholders in addition to those disclosed in the table above.
| 102
Notes to Financial Statements (continued)
September 30, 2012
10. Capital Shares. Each Fund may issue an unlimited number of shares of beneficial interest, without par value. Transactions in capital shares were as follows:
| | | | | | | | | | | | | | | | |
| |
| Year Ended
September 30, 2012 |
| |
| Year Ended
September 30, 2011 |
|
Core Plus Bond Fund | | | Shares | | | | Amount | | | | Shares | | | | Amount | |
| Class A | | | | | | | | | | | | | | | | |
Issued from the sale of shares | | | 27,370,858 | | | $ | 355,172,674 | | | | 7,870,741 | | | $ | 100,254,532 | |
Issued in connection with the reinvestment of distributions | | | 1,087,023 | | | | 14,031,796 | | | | 562,968 | | | | 7,131,144 | |
Redeemed | | | (11,683,801 | ) | | | (151,134,746 | ) | | | (6,563,842 | ) | | | (83,095,094 | ) |
| | | | | | | | | | | | | | | | |
Net change | | | 16,774,080 | | | $ | 218,069,724 | | | | 1,869,867 | | | $ | 24,290,582 | |
| | | | | | | | | | | | | | | | |
| Class B | | | | | | | | | | | | | | | | |
Issued from the sale of shares | | | 18,163 | | | $ | 232,753 | | | | 26,416 | | | $ | 338,841 | |
Issued in connection with the reinvestment of distributions | | | 8,025 | | | | 103,306 | | | | 8,589 | | | | 109,089 | |
Redeemed | | | (92,873 | ) | | | (1,209,379 | ) | | | (143,488 | ) | | | (1,828,591 | ) |
| | | | | | | | | | | | | | | | |
Net change | | | (66,685 | ) | | $ | (873,320 | ) | | | (108,483 | ) | | $ | (1,380,661 | ) |
| | | | | | | | | | | | | | | | |
| Class C | | | | | | | | | | | | | | | | |
Issued from the sale of shares | | | 11,681,836 | | | $ | 152,094,275 | | | | 3,812,615 | | | $ | 48,580,295 | |
Issued in connection with the reinvestment of distributions | | | 326,978 | | | | 4,220,534 | | | | 149,316 | | | | 1,892,845 | |
Redeemed | | | (2,493,106 | ) | | | (32,473,101 | ) | | | (2,772,280 | ) | | | (35,095,298 | ) |
| | | | | | | | | | | | | | | | |
Net change | | | 9,515,708 | | | $ | 123,841,708 | | | | 1,189,651 | | | $ | 15,377,842 | |
| | | | | | | | | | | | | | | | |
| Class Y | | | | | | | | | | | | | | | | |
Issued from the sale of shares | | | 44,233,390 | | | $ | 579,833,966 | | | | 9,029,915 | | | $ | 116,089,119 | |
Issued in connection with the reinvestment of distributions | | | 884,004 | | | | 11,568,457 | | | | 140,385 | | | | 1,792,593 | |
Redeemed | | | (9,666,030 | ) | | | (127,951,720 | ) | | | (3,372,809 | ) | | | (43,199,888 | ) |
| | | | | | | | | | | | | | | | |
Net change | | | 35,451,364 | | | $ | 463,450,703 | | | | 5,797,491 | | | $ | 74,681,824 | |
| | | | | | | | | | | | | | | | |
Increase (decrease) from capital share transactions | | | 61,674,467 | | | $ | 804,488,815 | | | | 8,748,526 | | | $ | 112,969,587 | |
| | | | | | | | | | | | | | | | |
103 |
Notes to Financial Statements (continued)
September 30, 2012
10. Capital Shares (continued).
| | | | | | | | | | | | | | | | |
| |
| Year Ended
September 30, 2012 |
| |
| Year Ended
September 30, 2011 |
|
High Income Fund | | | Shares | | | | Amount | | | | Shares | | | | Amount | |
| Class A | | | | | | | | | | | | | | | | |
Issued from the sale of shares | | | 21,107,989 | | | $ | 93,628,788 | | | | 18,914,773 | | | $ | 95,991,464 | |
Issued in connection with the reinvestment of distributions | | | 2,189,836 | | | | 9,162,829 | | | | 752,698 | | | | 3,747,490 | |
Redeemed | | | (15,882,475 | ) | | | (70,067,314 | ) | | | (20,080,912 | ) | | | (101,121,007 | ) |
| | | | | | | | | | | | | | | | |
Net change | | | 7,415,350 | | | $ | 32,724,303 | | | | (413,441 | ) | | $ | (1,382,053 | ) |
| | | | | | | | | | | | | | | | |
| Class B | | | | | | | | | | | | | | | | |
Issued from the sale of shares | | | 5,673 | | | $ | 24,777 | | | | 7,798 | | | $ | 39,272 | |
Issued in connection with the reinvestment of distributions | | | 19,672 | | | | 81,687 | | | | 8,794 | | | | 43,828 | |
Redeemed | | | (68,910 | ) | | | (305,756 | ) | | | (97,228 | ) | | | (487,971 | ) |
| | | | | | | | | | | | | | | | |
Net change | | | (43,565 | ) | | $ | (199,292 | ) | | | (80,636 | ) | | $ | (404,871 | ) |
| | | | | | | | | | | | | | | | |
| Class C | | | | | | | | | | | | | | | | |
Issued from the sale of shares | | | 805,879 | | | $ | 3,533,514 | | | | 1,268,510 | | | $ | 6,372,692 | |
Issued in connection with the reinvestment of distributions | | | 421,300 | | | | 1,752,724 | | | | 130,779 | | | | 650,658 | |
Redeemed | | | (1,101,851 | ) | | | (4,859,465 | ) | | | (1,792,125 | ) | | | (8,989,058 | ) |
| | | | | | | | | | | | | | | | |
Net change | | | 125,328 | | | $ | 426,773 | | | | (392,836 | ) | | $ | (1,965,708 | ) |
| | | | | | | | | | | | | | | | |
| Class Y | | | | | | | | | | | | | | | | |
Issued from the sale of shares | | | 27,436,571 | | | $ | 123,173,948 | | | | 15,208,663 | | | $ | 76,115,275 | |
Issued in connection with the reinvestment of distributions | | | 1,416,350 | | | | 5,940,281 | | | | 718,068 | | | | 3,585,069 | |
Redeemed | | | (13,232,329 | ) | | | (58,722,847 | ) | | | (21,646,978 | ) | | | (107,960,574 | ) |
| | | | | | | | | | | | | | | | |
Net change | | | 15,620,592 | | | $ | 70,391,382 | | | | (5,720,247 | ) | | $ | (28,260,230 | ) |
| | | | | | | | | | | | | | | | |
Increase (decrease) from capital share transactions | | | 23,117,705 | | | $ | 103,343,166 | | | | (6,607,160 | ) | | $ | (32,012,862 | ) |
| | | | | | | | | | | | | | | | |
| 104
Notes to Financial Statements (continued)
September 30, 2012
10. Capital Shares (continued).
| | | | | | | | | | | | | | | | |
| |
| Year Ended
September 30, 2012 |
| |
| Year Ended
September 30, 2011 |
|
International Bond Fund | | | Shares | | | | Amount | | | | Shares | | | | Amount | |
| Class A | | | | | | | | | | | | | | | | |
Issued from the sale of shares | | | 550,775 | | | $ | 5,589,441 | | | | 1,211,150 | | | $ | 13,782,950 | |
Issued in connection with the reinvestment of distributions | | | 89,124 | | | | 883,291 | | | | 59,092 | | | | 637,499 | |
Redeemed | | | (499,605 | ) | | | (5,230,159 | ) | | | (1,950,042 | ) | | | (21,739,657 | ) |
| | | | | | | | | | | | | | | | |
Net change | | | 140,294 | | | $ | 1,242,573 | | | | (679,800 | ) | | $ | (7,319,208 | ) |
| | | | | | | | | | | | | | | | |
| Class C | | | | | | | | | | | | | | | | |
Issued from the sale of shares | | | 119,315 | | | $ | 1,209,211 | | | | 309,408 | | | $ | 3,486,185 | |
Issued in connection with the reinvestment of distributions | | | 46,134 | | | | 453,165 | | | | 9,437 | | | | 102,127 | |
Redeemed | | | (435,796 | ) | | | (4,443,773 | ) | | | (181,598 | ) | | | (1,994,024 | ) |
| | | | | | | | | | | | | | | | |
Net change | | | (270,347 | ) | | $ | (2,781,397 | ) | | | 137,247 | | | $ | 1,594,288 | |
| | | | | | | | | | | | | | | | |
| Class Y | | | | | | | | | | | | | | | | |
Issued from the sale of shares | | | 611,695 | | | $ | 6,195,469 | | | | 505,134 | | | $ | 5,693,161 | |
Issued in connection with the reinvestment of distributions | | | 19,724 | | | | 195,522 | | | | 8,923 | | | | 97,881 | |
Redeemed | | | (854,117 | ) | | | (8,765,676 | ) | | | (776,615 | ) | | | (8,753,041 | ) |
| | | | | | | | | | | | | | | | |
Net change | | | (222,698 | ) | | $ | (2,374,685 | ) | | | (262,558 | ) | | $ | (2,961,999 | ) |
| | | | | | | | | | | | | | | | |
Increase (decrease) from capital share transactions | | | (352,751 | ) | | $ | (3,913,509 | ) | | | (805,111 | ) | | $ | (8,686,919 | ) |
| | | | | | | | | | | | | | | | |
105 |
Notes to Financial Statements (continued)
September 30, 2012
10. Capital Shares (continued).
| | | | | | | | | | | | | | | | |
| |
| Year Ended
September 30, 2012 |
| |
| Year Ended
September 30, 2011 |
|
Limited Term Government and Agency Fund | | | Shares | | | | Amount | | | | Shares | | | | Amount | |
| Class A | | | | | | | | | | | | | | | | |
Issued from the sale of shares | | | 15,612,122 | | | $ | 186,297,906 | | | | 20,840,756 | | | $ | 248,142,366 | |
Issued in connection with the reinvestment of distributions | | | 513,246 | | | | 6,128,335 | | | | 438,301 | | | | 5,215,842 | |
Redeemed | | | (11,137,817 | ) | | | (132,584,098 | ) | | | (10,214,288 | ) | | | (121,563,216 | ) |
| | | | | | | | | | | | | | | | |
Net change | | | 4,987,551 | | | $ | 59,842,143 | | | | 11,064,769 | | | $ | 131,794,992 | |
| | | | | | | | | | | | | | | | |
| Class B | | | | | | | | | | | | | | | | |
Issued from the sale of shares | | | 67,643 | | | $ | 803,090 | | | | 912,056 | | | $ | 10,801,235 | |
Issued in connection with the reinvestment of distributions | | | 12,997 | | | | 154,932 | | | | 11,626 | | | | 138,181 | |
Redeemed | | | (310,167 | ) | | | (3,693,689 | ) | | | (335,640 | ) | | | (3,991,576 | ) |
| | | | | | | | | | | | | | | | |
Net change | | | (229,527 | ) | | $ | (2,735,667 | ) | | | 588,042 | | | $ | 6,947,840 | |
| | | | | | | | | | | | | | | | |
| Class C | | | | | | | | | | | | | | | | |
Issued from the sale of shares | | | 2,463,981 | | | $ | 29,387,942 | | | | 2,478,244 | | | $ | 29,568,408 | |
Issued in connection with the reinvestment of distributions | | | 59,828 | | | | 714,780 | | | | 74,077 | | | | 882,261 | |
Redeemed | | | (2,044,375 | ) | | | (24,403,572 | ) | | | (3,083,387 | ) | | | (36,752,240 | ) |
| | | | | | | | | | | | | | | | |
Net change | | | 479,434 | | | $ | 5,699,150 | | | | (531,066 | ) | | $ | (6,301,571 | ) |
| | | | | | | | | | | | | | | | |
| Class Y | | | | | | | | | | | | | | | | |
Issued from the sale of shares | | | 19,006,051 | | | $ | 227,577,207 | | | | 11,014,945 | | | $ | 131,705,304 | |
Issued in connection with the reinvestment of distributions | | | 205,462 | | | | 2,463,226 | | | | 100,885 | | | | 1,204,459 | |
Redeemed | | | (11,948,359 | ) | | | (142,880,346 | ) | | | (8,080,128 | ) | | | (96,465,164 | ) |
| | | | | | | | | | | | | | | | |
Net change | | | 7,263,154 | | | $ | 87,160,087 | | | | 3,035,702 | | | $ | 36,444,599 | |
| | | | | | | | | | | | | | | | |
Increase (decrease) from capital share transactions | | | 12,500,612 | | | $ | 149,965,713 | | | | 14,157,447 | | | $ | 168,885,860 | |
| | | | | | | | | | | | | | | | |
| 106
Report of Independent Registered Public
Accounting Firm
To the Trustees of Natixis Funds Trust I and Loomis Sayles Funds II and Shareholders of Loomis Sayles Core Plus Bond Fund, Loomis Sayles High Income Fund, Loomis Sayles International Bond Fund, and Loomis Sayles Limited Term Government and Agency Fund:
In our opinion, the accompanying statements of assets and liabilities, including the portfolios of investments, and the related statements of operations and of changes in net assets and the financial highlights present fairly, in all material respects, the financial position of Loomis Sayles Core Plus Bond Fund, a series of Natixis Funds Trust I, and Loomis Sayles High Income Fund, Loomis Sayles International Bond Fund and Loomis Sayles Limited Term Government and Agency Fund, each a series of Loomis Sayles Funds II (collectively, the “Funds”), at September 30, 2012, and the results of each of their operations, the changes in each of their net assets and the financial highlights for each of the periods indicated, in conformity with accounting principles generally accepted in the United States of America. These financial statements and financial highlights (hereafter referred to as “financial statements”) are the responsibility of the Funds’ management; our responsibility is to express an opinion on these financial statements based on our audits. We conducted our audits of these financial statements in accordance with the standards of the Public Company Accounting Oversight Board (United States). Those standards require that we plan and perform the audits to obtain reasonable assurance about whether the financial statements are free of material misstatement. An audit includes examining, on a test basis, evidence supporting the amounts and disclosures in the financial statements, assessing the accounting principles used and significant estimates made by management, and evaluating the overall financial statement presentation. We believe that our audits, which included confirmation of securities at September 30, 2012 by correspondence with the custodian and brokers, provide a reasonable basis for our opinion.
PricewaterhouseCoopers LLP
Boston, Massachusetts
November 20, 2012
107 |
2012 U.S. Tax Distribution Information to Shareholders (Unaudited)
Corporate Dividends Received Deduction. For the fiscal year ended September 30, 2012, a percentage of dividends distributed by the Funds listed below qualify for the dividends received deduction for corporate shareholders. These percentages are as follows:
| | | | |
Fund | | Qualifying
Percentage | |
Core Plus Bond | | | 0.40 | % |
High Income | | | 3.20 | % |
Capital Gains Distributions. Pursuant to Internal Revenue Section 852(b), the following Funds paid distributions, which have been designated as capital gains distributions for the fiscal year ended September 30, 2012, unless subsequently determined to be different.
| | | | |
Fund | | Amount | |
Core Plus Bond | | $ | 5,887,516 | |
High Income | | | 9,467,897 | |
International Bond | | | 303,804 | |
Limited Term Government and Agency | | | 810,952 | |
Qualified Dividend Income. For the fiscal year ended September 30, 2012 the Funds below will designate up to the maximum amount allowable pursuant to the Internal Revenue Code as qualified dividend income eligible for reduced tax rates. These lower rates range from 0% to 15% depending on an individual’s tax bracket. If the Funds pay a distribution during calendar year 2012, complete information will be reported in conjunction with Form 1099-DIV.
| | |
Fund | | |
Core Plus Bond | | |
High Income | | |
| 108
Trustee and Officer Information
The tables below provide certain information regarding the trustees and officers of Natixis Funds Trust I and Loomis Sayles Funds II (the “Trusts”). Unless otherwise indicated, the address of all persons below is 399 Boylston Street, Boston, MA 02116. The Funds’ Statements of Additional Information include additional information about the trustees of the Trusts and are available by calling Natixis Funds at 800-225-5478.
| | | | | | | | |
Name and Year of Birth | | Position(s) Held with the Trusts, Length of Time Served and Term of Office1 | | Principal Occupation(s) During Past 5 Years | | Number of Portfolios in Fund Complex Overseen2 and Other Directorships Held During Past 5 Years | | Experience, Qualifications, Attributes, Skills for Board Membership |
|
| INDEPENDENT TRUSTEES |
| | | | |
Graham T. Allison, Jr. (1940) | | Trustee From 1984 to 1993 and since 1995 for Natixis Funds Trust I (including its predecessors); since 2003 for Loomis Sayles Funds II Contract Review and Governance Committee Member | | Douglas Dillon Professor and Director of the Belfer Center for Science and International Affairs, John F. Kennedy School of Government, Harvard University | | 44 Director, Taubman Centers, Inc. (real estate investment trust) | | Significant experience on the Board of Trustees of the Trusts and on the board of other business organizations (including a real estate investment trust); government experience (including as Assistant Secretary of Defense under President Clinton); academic experience |
| | | | |
Charles D. Baker (1956) | | Trustee From 2005 to 2009 and since 2011 for Natixis Funds Trust I and Loomis Sayles Funds II Contract Review and Governance Committee Member | | Executive in Residence at General Catalyst Partners (venture capital and growth equity firm); formerly, President and Chief Executive Officer, Harvard Pilgrim Health Care (health care organization) | | 44 None | | Significant experience on the Board of Trustees of the Trusts; executive experience (including president and chief executive officer of a health care organization and executive officer of a venture capital and growth equity firm) |
109 |
Trustee and Officer Information
| | | | | | | | |
Name and Year of Birth | | Position(s) Held with the Trusts, Length of Time Served and Term of Office1 | | Principal Occupation(s) During Past 5 Years | | Number of Portfolios in Fund Complex Overseen2 and Other Directorships Held During Past 5 Years | | Experience, Qualifications, Attributes, Skills for Board Membership |
|
INDEPENDENT TRUSTEES continued |
| | | | |
Daniel M. Cain (1945) | | Trustee Since 1996 for Natixis Funds Trust I and since 2003 for Loomis Sayles Funds II Chairman of the Contract Review and Governance Committee | | Chairman (formerly, President and Chief Executive Officer) of Cain Brothers & Company, Incorporated (investment banking) | | 44 Director, Sheridan Healthcare Inc. (physician practice management) | | Significant experience on the Board of Trustees of the Trusts and on the board of other business organizations (including at a health care organization); experience in the financial industry (including roles as chairman and former chief executive officer of an investment banking firm) |
| | | | |
Kenneth A. Drucker (1945) | | Trustee Since 2008 for Natixis Funds Trust I and Loomis Sayles Funds II Chairman of the Audit Committee | | Retired | | 44 Formerly, Director, M Fund, Inc. (investment company); Director, Gateway Trust (investment company) | | Significant experience on the Board of Trustees of the Trusts and on the board of other business organizations (including at investment companies); executive experience (including as treasurer of an aerospace, automotive, and metal manufacturing corporation) |
| 110
Trustee and Officer Information
| | | | | | | | |
Name and Year of Birth | | Position(s) Held with the Trusts, Length of Time Served and Term of Office1 | | Principal Occupation(s) During Past 5 Years | | Number of Portfolios in Fund Complex Overseen2 and Other Directorships Held During Past 5 Years | | Experience, Qualifications, Attributes, Skills for Board Membership |
|
INDEPENDENT TRUSTEES continued |
| | | | |
Wendell J. Knox (1948) | | Trustee Since 2009 for Natixis Funds Trust I and Loomis Sayles Funds II Audit Committee Member | | Director (formerly, President and Chief Executive Officer) of Abt Associates Inc. (research and consulting) | | 44 Director, Eastern Bank (commercial bank); Director, The Hanover Insurance Group (property and casualty insurance) | | Significant experience on the Board of Trustees of the Trusts and on the board of other business organizations (including at a commercial bank and at a property and casualty insurance firm); executive experience (including roles as president and chief executive officer of a consulting company) |
| | | | |
Martin T. Meehan3 (1956) | | Trustee Since 2012 for Natixis Funds Trust I and Loomis Sayles Funds II Contract Review and Governance Committee Member | | Chancellor and faculty member, University of Massachusetts Lowell | | 44 Director, Lowell Cooperative Bank (commercial bank); Director, Lowell General Hospital (healthcare); formerly, Director, Qteros, Inc. (biofuels); formerly, Trustee, Suffolk University (education); formerly, Director, D’Youville Foundation (senior care) | | Experience as Chancellor of the University of Massachusetts Lowell; experience on the board of other business organizations; government experience (including as a member of the U.S. House of Representatives); academic experience |
111 |
Trustee and Officer Information
| | | | | | | | |
Name and Year of Birth | | Position(s) Held with the Trusts, Length of Time Served and Term of Office1 | | Principal Occupation(s) During Past 5 Years | | Number of Portfolios in Fund Complex Overseen2 and Other Directorships Held During Past 5 Years | | Experience, Qualifications, Attributes, Skills for Board Membership |
|
INDEPENDENT TRUSTEES continued |
| | | | |
Sandra O. Moose (1942) | | Chairperson of the Board of Trustees since November 2005 Trustee since 1982 for Natixis Funds Trust I (including its predecessors); since 2003 for Loomis Sayles Funds II Ex officio member of the Audit Committee and Contract Review and Governance Committee | | President, Strategic Advisory Services (management consulting) | | 44 Director, Verizon Communications; Director, AES Corporation (international power company); formerly, Director, Rohm and Haas Company (specialty chemicals) | | Significant experience on the Board of Trustees of the Trusts and on the board of other business organizations (including at an international power company and a specialty chemicals corporation); executive experience (including at a management consulting company) |
| | | | |
Erik R. Sirri (1958) | | Trustee Since 2009 for Natixis Funds Trust I and Loomis Sayles Funds II Contract Review and Governance Committee Member | | Professor of Finance at Babson College; formerly, Director of the Division of Trading and Markets at the Securities and Exchange Commission | | 44 None | | Experience on the Board; experience as Director of the Division of Trading and Markets at the Securities and Exchange Commission; academic experience; training as an economist |
| | | | |
Peter J. Smail (1952) | | Trustee Since 2009 for Natixis Funds Trust I and Loomis Sayles Funds II Contract Review and Governance Committee Member | | Retired; formerly, President and Chief Executive Officer of Pyramis Global Advisors (investment management) | | 44 None | | Experience on the Board of Trustees of the Trusts; mutual fund industry and executive experience (including roles as president and chief executive officer for an investment adviser) |
| 112
Trustee and Officer Information
| | | | | | | | |
Name and Year of Birth | | Position(s) Held with the Trusts, Length of Time Served and Term of Office1 | | Principal Occupation(s) During Past 5 Years | | Number of Portfolios in Fund Complex Overseen2 and Other Directorships Held During Past 5 Years | | Experience, Qualifications, Attributes, Skills for Board Membership |
|
INDEPENDENT TRUSTEES continued |
| | | | |
Cynthia L. Walker (1956) | | Trustee Since 2005 for Natixis Funds Trust I and Loomis Sayles Funds II Audit Committee Member | | Deputy Dean for Finance and Administration, Yale University School of Medicine; formerly, Executive Dean for Administration, Harvard Medical School | | 44 None | | Significant experience on the Board of Trustees of the Trusts; executive experience in a variety of academic organizations (including roles as dean for finance and administration) |
|
| INTERESTED TRUSTEES |
| | | | |
Robert J. Blanding4 (1947) 555 California Street San Francisco, CA 94104 | | Trustee Since 2003 for Natixis Funds Trust I; since 2002 for Loomis Sayles Funds II Chief Executive Officer of Loomis Sayles Funds II since 2002 | | President, Chairman, Director and Chief Executive Officer, Loomis, Sayles & Company, L.P. | | 44 None | | Significant experience on the Board of Trustees of the Trusts; continuing service as President, Chairman, and Chief Executive Officer of Loomis, Sayles & Company, L.P. |
| | | | |
David L. Giunta5 (1965) | | Trustee Since 2011 for Natixis Funds Trust I and Loomis Sayles Funds II President and Chief Executive Officer of Natixis Funds Trust I and President of Loomis Sayles Funds II since 2008 | | President and Chief Executive Officer, NGAM Distribution Corporation, NGAM Advisors, L.P. and NGAM Distribution, L.P.; formerly President, Fidelity Charitable Gift Fund; and formerly, Senior Vice President, Fidelity Brokerage Company | | 44 None | | Experience on the Board of Trustees of the Trusts; continuing experience as President and Chief Executive Officer of NGAM Advisors, L.P. |
113 |
Trustee and Officer Information
| | | | | | | | |
Name and Year of Birth | | Position(s) Held with the Trusts, Length of Time Served and Term of Office1 | | Principal Occupation(s) During Past 5 Years | | Number of Portfolios in Fund Complex Overseen2 and Other Directorships Held During Past 5 Years | | Experience, Qualifications, Attributes, Skills for Board Membership |
|
INTERESTED TRUSTEES continued |
| | | | |
John T. Hailer6 (1960) | | Trustee Since 2000 for Natixis Funds Trust I; since 2003 for Loomis Sayles Funds II | | President and Chief Executive Officer – U.S. and Asia, Natixis Global Asset Management, L.P.; formerly, President and Chief Executive Officer, NGAM Distribution Corporation, NGAM Advisors L.P. and NGAM Distribution, L.P. | | 44 None | | Significant experience on the Board of Trustees of the Trusts; continuing experience as Chief Executive Officer-U.S. and Asia, Natixis Global Asset Management, L.P. |
| 1 | Each trustee serves until retirement, resignation or removal from the Board of the Trusts. The current retirement age is 72. The position of Chairperson of the Board is appointed for a two-year term. Ms. Moose was appointed to serve an additional two year term as the Chairperson of the Board on November 18, 2011. |
| 2 | The trustees of the Trusts serve as trustees of a fund complex that includes all series of the Natixis Funds Trust I, Natixis Funds Trust II, Natixis Funds Trust IV and Gateway Trust (collectively, the “Natixis Funds Trusts”), Loomis Sayles Funds I and Loomis Sayles Funds II (collectively, the “Loomis Sayles Funds Trusts”), and Hansberger International Series (collectively, the “Fund Complex”). |
| 3 | Mr. Meehan was appointed as a trustee effective July 1, 2012. |
| 4 | Mr. Blanding is deemed an “interested person” of the Trusts because he holds the following positions with an affiliated person of the Trusts: President, Chairman, Director and Chief Executive Officer of Loomis, Sayles & Company, L.P. |
| 5 | Mr. Giunta is deemed an “interested person” of the Trusts because he holds the following positions with an affiliated person of the Trusts: President and Chief Executive Officer of NGAM Distribution Corporation, NGAM Advisors, L.P. and NGAM Distribution, L.P. |
| 6 | Mr. Hailer is deemed an “interested person” of the Trusts because he holds the following positions with an affiliated person of the Trusts: President and Chief Executive Officer – U.S. and Asia, Natixis Global Asset Management, L.P. |
| 114
Trustee and Officer Information
| | | | | | |
Name and Year of Birth | | Position(s) Held with the Trusts | | Term of Office1 and Length of Time Served | | Principal Occupation(s) During Past 5 Years2 |
|
| OFFICERS OF THE TRUSTS |
| | | |
Coleen Downs Dinneen (1960) | | Secretary, Clerk and Chief Legal Officer | | Since September 2004 | | Executive Vice President, General Counsel, Secretary and Clerk (formerly, Senior Vice President, Deputy General Counsel, Assistant Secretary and Assistant Clerk), NGAM Distribution Corporation, NGAM Advisors, L.P. and NGAM Distribution, L.P. |
| | | |
Daniel J. Fuss (1933) One Financial Center Boston, MA 02111 | | Executive Vice President of Loomis Sayles Funds II | | Since June 2003 | | Vice Chairman and Director, Loomis, Sayles & Company, L.P. |
| | | |
Russell L. Kane (1969) | | Chief Compliance Officer, Assistant Secretary and Anti-Money Laundering Officer | | Chief Compliance Officer, since May 2006; Assistant Secretary since June 2004; and Anti-Money Laundering Officer since April 2007 | | Chief Compliance Officer for Mutual Funds, Senior Vice President, Deputy General Counsel, Assistant Secretary and Assistant Clerk, NGAM Distribution Corporation, NGAM Advisors, L.P. and NGAM Distribution, L.P. |
| | | |
Michael C. Kardok (1959) | | Treasurer, Principal Financial and Accounting Officer | | Since October 2004 | | Senior Vice President, NGAM Advisors, L.P. and NGAM Distribution, L.P. |
| 1 | Each officer of the Trusts serves for an indefinite term in accordance with the Trusts’ current by-laws until the date his or her successor is elected and qualified, or until he or she sooner dies, retires, is removed or becomes disqualified. |
| 2 | Each person listed above, except as noted, holds the same position(s) with the Fund Complex. Mr. Fuss is not an officer of the Natixis Funds Trusts or the Hansberger International Series. Previous positions during the past five years with NGAM Distribution, L.P., NGAM Advisors, L.P. or Loomis, Sayles & Company, L.P. are omitted, if not materially different from a trustee’s or officer’s current position with such entity. |
115 |
ANNUAL REPORT
September 30, 2012

Loomis Sayles Global Equity and Income Fund
Loomis Sayles Growth Fund
Loomis Sayles Mid Cap Growth Fund
Loomis Sayles Value Fund
TABLE OF CONTENTS
Portfolio Review page 1
Portfolio of Investments page 26
Financial Statements page 55
Notes to Financial Statements page 69
LOOMIS SAYLES GLOBAL EQUITY AND INCOME FUND
Management Discussion
Managers:
Daniel J. Fuss, CFA, CIC
Warren Koontz, CFA, CIC
David Rolley, CFA
Loomis, Sayles & Company, L.P.
Objective:
Seeks high total investment return through a combination of capital appreciation and current income
Strategy:
Invests 80% of its net assets in equity and fixed-income securities of U.S. and foreign issuers, including securities of issuers located in emerging markets
Symbols:
| | |
| Class A | | LGMAX |
| Class C | | LGMCX |
| Class Y | | LSWWX |
Market Conditions
During the 12-month period ended September 30, 2012, global financial markets alternated between periods of risk appetite and risk aversion. The general shift in focus from slowing macroeconomic data to loose monetary policy measures aimed at sparking economic growth drove most equity markets higher for the period. Similarly, credit yield spreads (the difference between the yield offered by credit instruments and comparable maturity U.S. Treasury securities) tightened and higher-beta (higher risk/reward potential) fixed-income sectors, such as commercial mortgage-backed securities, emerging markets and, most notably, assets linked to the European debt saga, outperformed toward the end of the period.
Performance Results
For the 12 months ended September 30, 2012, Class A shares of Loomis Sayles Global Equity and Income Fund returned 21.75% at net asset value. The fund performed in line with its primary benchmark, the Morgan Stanley Capital International (MSCI) World Index, which returned 22.32% for the period. The fund outperformed its secondary benchmark, the Citigroup World Government Bond Index, which returned 3.29%. The fund’s return was higher than the 13.74% average return of funds in its peer group, the Morningstar World Allocation category.
Explanation of Fund Performance
Within the fund’s equity component, the consumer staples and information technology sectors were strong contributors to performance. The fund’s investment in Belgium-based Anheuser Busch InBev, a brewing company, drove results in consumer staples. The company continued to gain market share, announcing an agreement to buy a remaining share in Grupo Modelo, bolstering the company’s presence in the growing Mexican market. A significant position in U.S.-based Apple, the computer and electronic device maker, led performance in the information technology sector. Apple shares advanced strongly during the period on record profits stemming from robust demand for iPhone and iPad products.
1 |
Weak relative performance from the consumer discretionary sector was due primarily to an investment in Arcos Dorados, the Latin American franchisee for McDonald’s. The company reported disappointing profits and was hurt by concerns about economic slowdown and increasing competition in Brazil. In financials, a position in property developer China Overseas Land & Investment drove down relative results as there were increased concerns about slowing growth in China. Neither stock is in the benchmark.
Exposure to U.S. corporate bonds, which outpaced government bonds, drove performance in the fund’s fixed-income segment. The sector benefited from positive news out of Europe and the Federal Reserve’s mid-September announcement of a third round of large-scale bond purchases. In addition, an allocation to high-yield corporate bonds contributed favorably to performance. Selective positioning along the U.S. yield curve (a curve that shows the relationship among bond yields across the maturity spectrum) also boosted performance. From a currency perspective, underweight positions in the euro and Japanese yen and an overweight relative to the benchmark in the Mexican peso helped performance.
The fund’s bias toward U.S. local markets detracted from performance, as did a large underweight in European local markets. In addition, overweight positions in selected emerging market currencies such as the Brazilian real, Indian rupee and Indonesian rupiah, slightly detracted from relative results.
Outlook
Equity valuation indicators suggest stocks are currently attractively valued relative to history, and they have continued to be attractively valued relative to sovereign interest rates. We believe 2013 should be another year of slow, but positive, economic growth with expanding corporate earnings and favorable equity returns. Nevertheless, we recognize the ongoing challenges facing the euro zone and the U.S. economic recovery make the earnings outlook less robust and less predictable than it was previously. While equity valuations appear supportive and market liquidity remains plentiful in the wake of central bank intervention, global economic data remain weak. Furthermore, unexpected events can upset the balance, making for choppy equity markets. Strong year-to-date stock performance suggests a short-term pullback may be a possibility. We will view any selloff as an opportunity to add judiciously to our positions.
Within fixed income, we remain comfortable with selected emerging market securities and short- to medium-term corporate debt because we believe the “roll-down” effect (a type of return generated when the value of a bond moves toward par as it approaches maturity) likely will preserve capital in the low interest-rate environment we expect to prevail over the next two years.
| 2
LOOMIS SAYLES GLOBAL EQUITY AND INCOME FUND
Investment Results through September 30, 2012
Growth of a $10,000 Investment in Class A Shares1,6
September 30, 2002 through September 30, 2012
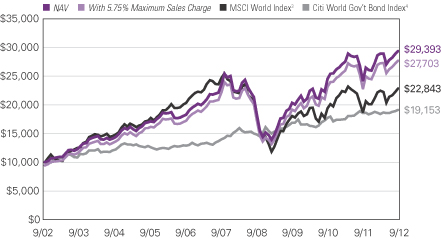
3 |
Average Annual Total Returns — September 30, 20126
| | | | | | | | | | | | |
| | | | |
| | | 1 Year | | | 5 Years | | | 10 Years | |
| | | | |
| Class A (Inception 2/1/06)1 | | | | | | | | | | | | |
| NAV | | | 21.75 | % | | | 4.46 | % | | | 11.38 | % |
| With 5.75% Maximum Sales Charge | | | 14.74 | | | | 3.23 | | | | 10.73 | |
| | | | |
| Class C (Inception 2/1/06)1 | | | | | | | | | | | | |
| NAV | | | 20.83 | | | | 3.69 | | | | 10.56 | |
| With CDSC2 | | | 19.83 | | | | 3.69 | | | | 10.56 | |
| | | | |
| Class Y (Inception 5/1/96) | | | | | | | | | | | | |
| NAV | | | 21.96 | | | | 4.72 | | | | 11.66 | |
| | | | |
| Comparative Performance | | | | | | | | | | | | |
| MSCI World Index3 | | | 22.32 | | | | -1.58 | | | | 8.61 | |
| Citigroup World Government Bond Index4 | | | 3.29 | | | | 6.45 | | | | 6.71 | |
| Morningstar World Allocation Fund Avg.5 | | | 13.74 | | | | 1.55 | | | | 8.29 | |
Past performance does not guarantee future results. The chart and table do not reflect taxes shareholders might owe on any fund distributions or when they redeem their shares. Returns reflect changes in share price and reinvestment of dividends and capital gains, if any. Unlike a fund, an index is not managed and does not reflect fees and expenses.
NOTES TO CHARTS
| 1 | Prior to the inception of Class A and C shares (2/1/06), performance is that of Institutional Class shares, restated to reflect the higher net expenses and sales loads of Class A and C shares. |
| 2 | Performance for Class C shares assumes a 1% contingent deferred sales charge (“CDSC”) applied when you sell shares within one year of purchase. |
| 3 | MSCI World Index is an unmanaged index that is designed to measure the equity market performance of developed markets. |
| 4 | Citigroup World Government Bond Index is an unmanaged index that includes the most significant and liquid government bond markets globally that carry at least an investment-grade rating. |
| 5 | Morningstar World Allocation Fund Average is the average performance without sales charges of funds with similar investment objectives, as calculated by Morningstar, Inc. |
| 6 | Fund performance has been increased by fee waivers and/or expense reimbursements, if any, without which performance would have been lower. |
| 4
LOOMIS SAYLES GROWTH FUND
Management Discussion
Manager:
Aziz Hamzaogullari, CFA
Loomis, Sayles & Company, L.P.
Objective:
Long-term growth of capital
Strategy:
Invests primarily in equity securities, including common stocks, convertible securities, and warrants; focuses on stocks of large-capitalization companies, but may invest in companies of any size
Symbols:
| | |
| Class A | | LGRRX |
| Class B | | LGRBX |
| Class C | | LGRCX |
| Class Y | | LSGRX |
Market Conditions
Most equity markets posted strong returns for the 12-month period ended September 30, 2012. Although many concerns persisted during the period, including the European sovereign debt crisis and slowing global economic growth, these factors did not hamper returns for most of the world’s equity markets.
Performance Results
For the 12 months ended September 30, 2012, Class A shares of Loomis Sayles Growth Fund returned 24.22% at net asset value. The fund underperformed its benchmark, the Russell 1000® Growth Index, which returned 29.19% for the period. The fund underperformed the 26.84% average return of funds in its peer group, the Morningstar Large Growth category.
Explanation of Fund Performance
The strong returns in the broad-based equity markets were difficult to keep pace with during the 12-month period. Stock selection in information technology, industrials and consumer staples sectors primarily accounted for the fund’s lagging performance relative to the benchmark, while an underweight position in energy and stock selection in the financials sector contributed positively to relative performance. Within the financials sector, a position in SEI Investments was among the leading contributors. SEI Investments is a leading wealth management and business processing outsourcer to global financial institutions. Over the past several quarters SEI has reported accelerating new sales growth driven by increasing demand in several business segments and has benefited from higher asset under administration and management levels. One segment showing increased new sales growth is SEI’s private banking, where SEI is introducing its new global wealth platform. We expect this platform to lead to increased growth and profitability over the next several years.
The information technology and industrials sectors were among the largest performance detractors during the period. While technology contributed positively to
5 |
the fund’s performance, including a position in Visa, which logged strong gains for the period, stock selection in the sector detracted from performance relative to the benchmark. In particular, a position in social media company Facebook hurt results. The stock’s weakness was driven primarily by uncertainty surrounding a shift toward more mobile usage, where Facebook has begun to monetize and increase its potential investments. We continue to believe Facebook is a high-quality company with significant growth opportunities given the unique attributes in terms of its platform and reach. In addition, exposure in industrials detracted on a relative basis. This was due in large part to Expeditors International of Washington, a logistics company. Shares declined after the company lowered its earnings expectations due to weaker-than-expected airfreight volumes. We view this as a temporary pullback based on the cyclical nature of Expeditors’ business. We remain confident in the company’s expertise, technology and network of regional centers that have created industry-leading competitive advantages.
Outlook
Our investment process is characterized by bottom-up, fundamental research and a long-term time horizon. The nature of the process creates a portfolio with lower turnover in which sector positioning is derived from our fundamental research. Despite the volatility in the market during the 12-month period, we remained focused on bottom-up company fundamentals. This approach led to overweight positions in the financials and information technology sectors and underweight positions in the industrials, consumer discretionary and materials sectors. We remain committed to our long-term investment approach.
| 6
LOOMIS SAYLES GROWTH FUND
Investment Results through September 30, 2012
Growth of a $10,000 Investment in Class A Shares1,5
September 30, 2002 through September 30, 2012
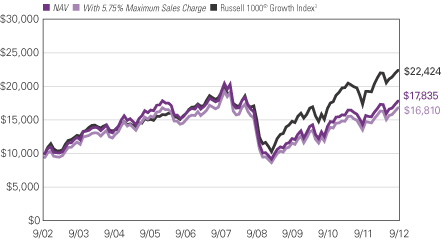
7 |
Average Annual Total Returns — September 30, 20125
| | | | | | | | | | | | |
| | | | |
| | | 1 Year | | | 5 Years | | | 10 Years | |
| | | | |
| Class A (Inception 12/31/96)1 | | | | | | | | | | | | |
| NAV | | | 24.22 | % | | | -1.47 | % | | | 5.96 | % |
| With 5.75% Maximum Sales Charge | | | 17.07 | | | | -2.64 | | | | 5.34 | |
| | | | |
| Class B (Inception 9/12/03)1 | | | | | | | | | | | | |
| NAV | | | 23.28 | | | | -2.15 | | | | 5.17 | |
| With CDSC2 | | | 18.28 | | | | -2.55 | | | | 5.17 | |
| | | | |
| Class C (Inception 9/12/03)1 | | | | | | | | | | | | |
| NAV | | | 23.28 | | | | -2.18 | | | | 5.17 | |
| With CDSC2 | | | 22.28 | | | | -2.18 | | | | 5.17 | |
| | | | |
| Class Y (Inception 5/16/91) | | | | | | | | | | | | |
| NAV | | | 24.57 | | | | -1.10 | | | | 6.33 | |
| | | | |
| Comparative Performance | | | | | | | | | | | | |
| Russell 1000® Growth Index3 | | | 29.19 | | | | 3.24 | | | | 8.41 | |
| Morningstar Large Growth Fund Avg.4 | | | 26.84 | | | | 1.10 | | | | 7.74 | |
Past performance does not guarantee future results. The chart and table do not reflect taxes shareholders might owe on any fund distributions or when they redeem their shares. Returns reflect changes in share price and reinvestment of dividends and capital gains, if any. Unlike a fund, an index is not managed and does not reflect fees and expenses.
NOTES TO CHARTS
| 1 | Prior to 9/15/03, performance of Class A shares is that of Retail Class shares, which were redesignated as Class A shares, restated to reflect the sales load of Class A shares. Prior to the inception of Class B and C shares (9/12/03), performance is that of Institutional Class shares, restated to reflect the higher net expenses and sales loads of Class B and C shares. |
| 2 | Performance for Class B shares assumes a maximum of 5% contingent deferred sales charge (“CDSC”) applied when you sell shares, which declines annually between years 1-6 according to the following schedule: 5, 4, 3, 3, 2, 1, 0%. Class C shares performance assumes a 1% CDSC applied when you sell shares within one year of purchase. |
| 3 | Russell 1000® Growth Index is an unmanaged index that measures the performance of the large-cap growth segment of the U.S. equity universe. It includes those Russell 1000 companies with higher price-to-book ratios and higher forecasted growth values. |
| 4 | Morningstar Large Growth Fund Average is the average performance without sales charges of funds with similar investment objectives, as calculated by Morningstar, Inc. |
| 5 | Fund performance has been increased by fee waivers and/or expense reimbursements, if any, without which performance would have been lower. |
| 8
LOOMIS SAYLES MID CAP GROWTH FUND
Management Discussion
Manager:
Philip C. Fine, CFA
Loomis, Sayles & Company, L.P.
Objective:
Long-term growth of capital
Strategy:
Invests 80% of its net assets in common stocks or other equity securities; focuses on stocks of companies that fall within the capitalization range of the companies included in the Russell Midcap Growth Index, but may invest in companies of any size.
Symbols:
| | |
| Class A | | LAGRX |
| Class C | | LSACX |
| Class Y | | LSAIX |
Market Conditions
Ongoing concerns related to the sovereign debt crisis in Europe contributed to market volatility at the start of the period, but the European Central Bank’s December 2011 decision to open a low-interest-rate financing program for banks helped calm the markets. The U.S. economy continued to show signs of improvement during the first quarter of 2012, with increased strength in consumer spending and job growth. Beginning in the second quarter, however, all the major engines of global growth were struggling. In the United States, second-quarter economic growth decelerated as investment and consumption appeared constrained by the looming “fiscal cliff” of scheduled federal tax hikes and spending cuts. Meanwhile, Europe slipped into recession and China’s economy slowed dramatically.
Policy initiatives by the major central banks were among the most important events of the past 12 months. The European Central Bank took several steps to shore up its currency and banking system, while the Federal Reserve launched a third quantitative easing program in an effort to stimulate growth and employment and further drive down mortgage rates. These initiatives helped drive stocks higher during the period.
Performance Results
For the 12 months ended September 30, 2012, Class A shares of Loomis Sayles Mid Cap Growth Fund returned 18.25% at net asset value. The fund underperformed its benchmark, the Russell Midcap® Growth Index, which returned 26.69% for the period. The fund also underperformed the 24.40% average return of funds in its peer group, the Morningstar Mid-Cap Growth category.
Explanation of Fund Performance
The fund lagged its benchmark during the period. The shortfall was primarily due to the fund’s positioning during the fourth quarter of 2011. The market rally that began in October 2011 was led by low-quality, high-volatility cyclical stocks. Unfortunately, the fund was defensively positioned when the markets advanced.
9 |
In particular, positions in the consumer discretionary, industrials, technology and materials sectors performed poorly relative to the benchmark.
In terms of individual stocks, a position in Lululemon Athletica, an athletic apparel retailer in the consumer discretionary sector, was among the fund’s weakest holdings. The company’s stock sold off after disappointing guidance on earnings for the second half of 2012 against very high expectations. A position in United Rentals, a provider of construction and maintenance equipment, was the top detractor in the industrials sector. The company reported disappointing revenues and utilization trends in the second quarter of 2012, and our stop-loss discipline triggered a review and a subsequent sell. A position in Green Mountain Coffee Roasters, the maker of the Keurig brewer and K-cup single-portion beverage packs, also dragged down results in the consumer staples sector. The company reported disappointing third quarter 2011 revenues, resulting from inventory destocking at grocery and club retail stores. Additionally, a poorly timed investment in Alpha Natural Resources in late 2011 detracted from performance in the energy sector. The coal company reported a weak quarter due to rising costs, falling commodity prices and headwinds from a stronger dollar. Our stop-loss discipline caused us to review the stock. We proceeded to sell the position.
The healthcare sector made the greatest contribution to the fund’s returns. In particular, the biotechnology industry, which was the fund’s biggest overweight, accounted for much of the positive performance. Positions in Alexion, whose lead drug combats a potentially fatal blood disorder, and Medivation, which recently launched a drug for metastatic prostate cancer, were leading performers. Although the fund failed to keep pace with the benchmark in industrials, the sector delivered strong returns for the fund, led by positions in Transdigm Group, which designs and produces components for commercial and military aircraft, and Kansas City Southern, a rail transportation company. Transdigm consistently exceeded expectations during the past year, while growing its revenues organically and through acquisitions. Kansas City Southern benefited from the cyclical manufacturing recovery in the United States, the “near sourcing” of manufacturing in Mexico and increased container traffic through the port of Lazaro Cardenas.
During the period, the fund held options (puts and calls) on several exchange-traded funds (ETFs) and one individual stock, primarily for hedging purposes. In addition, we bought calls on an ETF to increase the fund’s exposure to volatility during the initial stages of the late-2011 market rally. While these instruments behaved as expected, the combined returns had a negative impact on performance.
Outlook
Equity valuation measures suggest stocks are attractively valued relative to history, and they have continued to be attractively valued relative to sovereign interest rates. We believe 2013 should be another year of slow, but positive, economic growth with expanding corporate earnings and favorable equity returns. Nevertheless, we recognize the ongoing challenges facing the euro zone and the U.S. economic recovery make the earnings outlook less robust and less predictable than it was previously. While equity valuations appear supportive, U.S. economic data reflect sluggish growth. Furthermore, unexpected events can upset the balance, making for choppy equity markets. Strong year-to-date stock performance suggests a short-term pullback may be a possibility. We will view any selloff as an opportunity to add judiciously to fund positions.
| 10
LOOMIS SAYLES MID CAP GROWTH FUND
Investment Results through September 30, 2012
Growth of a $10,000 Investment in Class A Shares1,5
September 30, 2002 through September 30, 2012
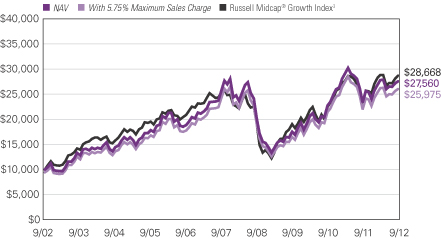
11 |
Average Annual Total Returns — September 30, 20125
| | | | | | | | | | | | |
| | | | |
| | | 1 Year | | | 5 Years | | | 10 Years | |
| | | | |
| Class A (Inception 12/31/96)1 | | | | | | | | | | | | |
| NAV | | | 18.25 | % | | | 1.45 | % | | | 10.67 | % |
| With 5.75% Maximum Sales Charge | | | 11.44 | | | | 0.25 | | | | 10.02 | |
| | | | |
| Class C (Inception 2/2/09)1 | | | | | | | | | | | | |
| NAV | | | 17.34 | | | | 0.68 | | | | 9.82 | |
| With CDSC2 | | | 16.34 | | | | 0.68 | | | | 9.82 | |
| | | | |
| Class Y (Inception 12/31/96) | | | | | | | | | | | | |
| NAV | | | 18.53 | | | | 1.71 | | | | 10.95 | |
| | | | |
| Comparative Performance | | | | | | | | | | | | |
| Russell Midcap® Growth Index3 | | | 26.69 | | | | 2.54 | | | | 11.11 | |
| Morningstar Mid-Cap Growth Avg.4 | | | 24.40 | | | | 1.34 | | | | 9.43 | |
Past performance does not guarantee future results. The chart and table do not reflect taxes shareholders might owe on any fund distributions or when they redeem their shares. Returns reflect changes in share price and reinvestment of dividends and capital gains, if any. Unlike a fund, an index is not managed and does not reflect fees and expenses.
NOTES TO CHARTS
| 1 | Prior to 2/1/09, performance of Class A shares is that of Retail Class shares, which were redesignated as Class A shares, restated to reflect the sales load of Class A shares. Prior to the inception of Class C shares (2/2/09), performance is that of Retail Class shares, restated to reflect the higher net expenses and sales loads of Class C shares. The fund revised its investment strategies on 2/1/07; performance may have been different had the current strategies been in place for all periods shown. |
| 2 | Class C shares performance assumes a 1% CDSC applied when you sell shares within one year of purchase. |
| 3 | Russell Midcap® Growth Index is an unmanaged index that measures the performance of the mid-cap growth segment of the U.S. equity universe. It includes those Russell Midcap Index companies with higher price-to-book ratios and higher forecasted growth values. |
| 4 | Morningstar Mid-Cap Growth Average is the average performance without sales charges of funds with similar investment objectives, as calculated by Morningstar, Inc. |
| 5 | Fund performance has been increased by fee waivers and/or expense reimbursements, if any, without which performance would have been lower. |
| 12
LOOMIS SAYLES VALUE FUND
Management Discussion
Managers:
Arthur Barry, CFA
James L. Carroll, CFA
Warren N. Koontz, CFA, CIC
Loomis, Sayles & Company, L.P.
Objective:
Long-term growth of capital and income
Strategy:
Invests primarily in equity securities, including common stocks, convertible securities, and warrants.
Symbols:
| | |
| Class A | | LSVRX |
| Class B | | LSVBX |
| Class C | | LSCVX |
| Class Y | | LSGIX |
| Admin Class | | LSAVX |
Market Conditions
U.S. equities rallied off the market low of October 3, 2011, the first trading day of the fund’s fiscal year. Market sentiment was at its low point at that time, primarily due to the European banking and sovereign debt crises and mounting economic concerns in the United States. Equities rallied as various measures to delay or postpone the debt crisis in Europe emerged, and economic prospects in the United States appeared to strengthen relative to cautious expectations. Market leadership changed many times during the year, as investors rotated between having an appetite for risk and an aversion to risk, between large cap and small cap stocks and also between the growth and value styles. Ultimately, all segments of the market posted strong returns for the 12-month period.
Performance Results
For the 12 months ended September 30, 2012, Class A shares of Loomis Sayles Value Fund returned 31.71% at net asset value. The fund outperformed its benchmark, the Russell 1000® Value Index, which returned 30.92% for the period. The fund also outperformed the 27.19% average return of funds in its peer group, the Morningstar Large Value category.
Explanation of Fund Performance
Stock selection delivered positive returns for the fund, with financials, healthcare and consumer discretionary segments having the biggest impact on the fund’s overall results. The healthcare and information technology sectors were among the best performers relative to the benchmark.
A significant position in Comcast, a provider of cable television, high-speed Internet and telephone services, aided results, as subscriber growth and profitability continued to beat expectations. In addition, a position in natural gas producer El Paso Corporation boosted returns. In the fourth quarter of 2011, Kinder Morgan agreed to acquire El Paso in a friendly deal. The fund’s overweight in Merck, a pharmaceutical company, also contributed favorably to performance. The company
13 |
had a solid year due to a strong late-stage pipeline of drugs and management’s commitment to return cash to shareholders.
By contrast, a position in Alcatel Lucent, a global communications provider, detracted from results. The company struggled due to a combination of poor operational performance and worsening end markets. With decreasing confidence in management’s ability to execute the turnaround, we exited the position in late 2011. In addition, a position in Exelon, a utility company, dragged down results. We began to sell Exelon shares as declining natural gas prices were eroding its earnings power and cash flow. We exited the position late in the period. The fund’s position in Texas Instruments, a semiconductor company, also detracted from performance. Difficulties navigating the smartphone and tablet markets led to poor performance, but we believe the company is addressing the situation, and we continue to hold the shares.
Outlook
Equity valuation measures suggest stocks are attractively valued relative to history, and they have continued to be attractively valued relative to sovereign interest rates. We believe 2013 should be another year of slow, but positive, economic growth with expanding corporate earnings and favorable equity returns. Nevertheless, we recognize the ongoing challenges facing the euro zone and the U.S. economic recovery make the earnings outlook less robust and less predictable than it was previously. While equity valuations appear supportive, U.S. economic data reflect sluggish growth. Furthermore, unexpected events can upset the balance, making for choppy equity markets. Strong year-to-date stock performance suggests a short-term pullback may be a possibility. We will view any selloff as an opportunity to add judiciously to fund positions.
| 14
LOOMIS SAYLES VALUE FUND
Investment Results through September 30, 2012
Growth of a $10,000 Investment in Class A Shares1,5
September 30, 2002 through September 30, 2012
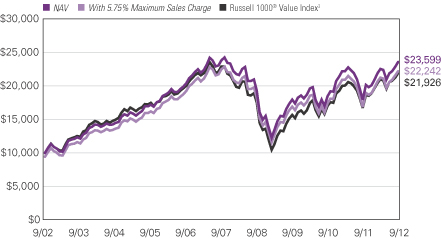
15 |
Average Annual Total Returns — September 30, 20125
| | | | | | | | | | | | |
| | | | |
| | | 1 Year | | | 5 Years | | | 10 Years | |
| | | | |
| Class A (Inception 6/30/06)1 | | | | | | | | | | | | |
| NAV | | | 31.71 | % | | | -0.22 | % | | | 8.97 | % |
| With 5.75% Maximum Sales Charge | | | 24.13 | | | | -1.40 | | | | 8.32 | |
| | | | |
| Class B (Inception 6/1/07)1 | | | | | | | | | | | | |
| NAV | | | 30.79 | | | | -0.97 | | | | 8.07 | |
| With CDSC2 | | | 25.79 | | | | -1.34 | | | | 8.07 | |
| | | | |
| Class C (Inception 6/1/07)1 | | | | | | | | | | | | |
| NAV | | | 30.78 | | | | -0.96 | | | | 8.08 | |
| With CDSC2 | | | 29.78 | | | | -0.96 | | | | 8.08 | |
| | | | |
| Class Y (Inception 5/13/91) | | | | | | | | | | | | |
| NAV | | | 32.05 | | | | 0.08 | | | | 9.28 | |
| | | | |
| Admin Class (Inception 2/1/10)1 | | | | | | | | | | | | |
| NAV | | | 31.43 | | | | -0.48 | | | | 8.66 | |
| | | | |
| Comparative Performance | | | | | | | | | | | | |
| Russell 1000® Value Index3 | | | 30.92 | | | | -0.90 | | | | 8.17 | |
| Morningstar Large Value Fund Avg.4 | | | 27.19 | | | | -0.88 | | | | 7.36 | |
Past performance does not guarantee future results. The chart and table do not reflect taxes shareholders might owe on any fund distributions or when they redeem their shares. Returns reflect changes in share price and reinvestment of dividends and capital gains, if any. Unlike a fund, an index is not managed and does not reflect fees and expenses.
NOTES TO CHARTS
| 1 | Prior to 6/1/07, performance of Class A shares is that of Retail Class shares, which were redesignated as Class A shares, restated to reflect the sales load of Class A shares. Prior to the inception of Retail Class shares (6/30/06), performance is that of Institutional Class shares, restated to reflect the higher net expenses and sales loads of Class A shares. Prior to the inception of Class B and C shares (6/1/07), performance is that of Institutional Class shares, restated to reflect the higher net expenses and sales loads of Class B and C shares. Prior to the inception of Admin Class shares (2/1/10), performance is that of Class A shares, restated to reflect the higher net expenses of Admin Class shares. |
| 2 | Performance for Class B shares assumes a maximum of 5% contingent deferred sales charge (“CDSC”) applied when you sell shares, which declines annually between years 1-6 according to the following schedule: 5, 4, 3, 3, 2, 1, 0%. Class C shares performance assumes a 1% CDSC applied when you sell shares within one year of purchase. |
| 3 | Russell 1000® Value Index is an unmanaged index that measures the performance of the large-cap value segment of the U.S. equity universe. It includes those Russell 1000 companies with lower price-to-book ratios and higher forecasted growth values. |
| 4 | Morningstar Large Value Fund Average is the average performance without sales charges of funds with similar investment objectives, as calculated by Morningstar, Inc. |
| 5 | Fund performance has been increased by fee waivers and/or expense reimbursements, if any, without which performance would have been lower. |
| 16
ADDITIONAL INFORMATION
The views expressed in this report reflect those of the portfolio managers as of the dates indicated. The managers’ views are subject to change at any time without notice based on changes in market or other conditions. References to specific securities or industries should not be regarded as investment advice. Because these funds are actively managed, there is no assurance that they will continue to invest in the securities or industries mentioned.
PROXY VOTING INFORMATION
A description of the funds’ proxy voting policies and procedures is available without charge, upon request, by calling Natixis Funds at 800-225-5478; on the funds’ website at ngam.natixis.com; and on the Securities and Exchange Commission’s website at www.sec.gov. Information regarding how the funds voted proxies relating to portfolio securities during the 12-month period ended June 30, 2012 is available from the funds’ website and the SEC’s website.
QUARTERLY PORTFOLIO SCHEDULES
The funds will file a complete schedule of portfolio holdings with the SEC for the first and third quarters of each fiscal year on Form N-Q. The funds’ Forms N-Q are available on the SEC’s website at www.sec.gov and may be reviewed and copied at the SEC’s Public Reference Room in Washington, DC. Information on the operation of the Public Reference Room may be obtained by calling
800-SEC-0330.
17 |
UNDERSTANDING FUND EXPENSES
As a mutual fund shareholder, you incur different types of costs: transaction costs, including sales charges (loads) on purchases and contingent deferred sales charges on redemptions, and ongoing costs, including management fees, distribution and/or service fees (12b-1 fees), and other fund expenses. These costs are described in more detail in the funds’ prospectus. The examples below are intended to help you understand the ongoing costs of investing in the funds and help you compare these with the ongoing costs of investing in other mutual funds.
The first line in the table for each class shows the actual amount of fund expenses you would have paid on a $1,000 investment in the fund from April 1, 2012 through September 30, 2012. It also shows how much a $1,000 investment would be worth at the close of the period, assuming actual fund returns and expenses. To estimate the expenses you paid over the period, simply divide your account value by $1,000 (for example, $8,600 account value divided by $1,000 = 8.6) and multiply the result by the number in the Expenses Paid During Period row as shown below for your class.
The second line in the table for each class provides information about hypothetical account values and hypothetical expenses based on the fund’s actual expense ratios and an assumed rate of return of 5% per year before expenses, which is not the fund’s actual return. The hypothetical account values and expenses may not be used to estimate the actual ending account balance or expenses you paid on your investment for the period. You may use this information to compare the ongoing costs of investing in the fund and other funds. To do so, compare this 5% hypothetical example with the 5% hypothetical examples that appear in the shareholder reports of the other funds.
Please note that the expenses shown reflect ongoing costs only, and do not include any transaction costs, such as sales charges. Therefore, the second line in the table of each fund is useful in comparing ongoing costs only, and will not help you determine the relative costs of owning different funds. If transaction costs were included, total costs would be higher.
| | | | | | | | | | | | |
LOOMIS SAYLES GLOBAL EQUITY AND
INCOME FUND | | BEGINNING ACCOUNT VALUE 4/1/2012 | | | ENDING ACCOUNT VALUE 9/30/2012 | | | EXPENSES PAID DURING PERIOD* 4/1/2012 – 9/30/2012 | |
Class A | | | | | | | | | | | | |
Actual | | | $1,000.00 | | | | $1,016.70 | | | | $6.10 | |
Hypothetical (5% return before expenses) | | | $1,000.00 | | | | $1,018.95 | | | | $6.11 | |
Class C | | | | | | | | | | | | |
Actual | | | $1,000.00 | | | | $1,012.60 | | | | $9.86 | |
Hypothetical (5% return before expenses) | | | $1,000.00 | | | | $1,015.20 | | | | $9.87 | |
Class Y | | | | | | | | | | | | |
Actual | | | $1,000.00 | | | | $1,017.20 | | | | $4.84 | |
Hypothetical (5% return before expenses) | | | $1,000.00 | | | | $1,020.20 | | | | $4.85 | |
| * | Expenses are equal to the Fund's annualized expense ratio: 1.21%, 1.96% and 0.96% for Class A, C and Y, respectively, multiplied by the average account value over the period, multiplied by the number of days in the most recent fiscal half-year, divided by 366 (to reflect the half-year period). |
| 18
| | | | | | | | | | | | |
| LOOMIS SAYLES GROWTH FUND | | BEGINNING ACCOUNT VALUE 4/1/2012 | | | ENDING ACCOUNT VALUE 9/30/2012 | | | EXPENSES PAID DURING PERIOD* 4/1/2012 – 9/30/2012 | |
Class A | | | | | | | | | | | | |
Actual | | | $1,000.00 | | | | $1,026.90 | | | | $5.22 | |
Hypothetical (5% return before expenses) | | | $1,000.00 | | | | $1,019.85 | | | | $5.20 | |
Class B | | | | | | | | | | | | |
Actual | | | $1,000.00 | | | | $1,025.30 | | | | $9.01 | |
Hypothetical (5% return before expenses) | | | $1,000.00 | | | | $1,016.10 | | | | $8.97 | |
Class C | | | | | | | | | | | | |
Actual | | | $1,000.00 | | | | $1,023.50 | | | | $9.00 | |
Hypothetical (5% return before expenses) | | | $1,000.00 | | | | $1,016.10 | | | | $8.97 | |
Class Y | | | | | | | | | | | | |
Actual | | | $1,000.00 | | | | $1,028.30 | | | | $3.96 | |
Hypothetical (5% return before expenses) | | | $1,000.00 | | | | $1,021.10 | | | | $3.94 | |
| * | Expenses are equal to the Fund's annualized expense ratio: 1.03%, 1.78%, 1.78% and 0.78% for Class A, B, C and Y, respectively, multiplied by the average account value over the period, multiplied by the number of days in the most recent fiscal half-year, divided by 366 (to reflect the half-year period). |
| | | | | | | | | | | | |
| LOOMIS SAYLES MID CAP GROWTH FUND | | BEGINNING ACCOUNT VALUE 4/1/2012 | | | ENDING ACCOUNT VALUE 9/30/2012 | | | EXPENSES PAID DURING PERIOD* 4/1/2012 – 9/30/2012 | |
Class A | | | | | | | | | | | | |
Actual | | | $1,000.00 | | | | $991.70 | | | | $6.22 | |
Hypothetical (5% return before expenses) | | | $1,000.00 | | | | $1,018.75 | | | | $6.31 | |
Class C | | | | | | | | | | | | |
Actual | | | $1,000.00 | | | | $988.00 | | | | $9.94 | |
Hypothetical (5% return before expenses) | | | $1,000.00 | | | | $1,015.00 | | | | $10.08 | |
Class Y | | | | | | | | | | | | |
Actual | | | $1,000.00 | | | | $993.00 | | | | $4.98 | |
Hypothetical (5% return before expenses) | | | $1,000.00 | | | | $1,020.00 | | | | $5.05 | |
| * | Expenses are equal to the Fund's annualized expense ratio (after waiver/reimbursement): 1.25%, 2.00% and 1.00% for Class A, C and Y, respectively, multiplied by the average account value over the period, multiplied by the number of days in the most recent fiscal half-year, divided by 366 (to reflect the half-year period). |
19 |
| | | | | | | | | | | | |
| LOOMIS SAYLES VALUE FUND | | BEGINNING ACCOUNT VALUE 4/1/2012 | | | ENDING ACCOUNT VALUE 9/30/2012 | | | EXPENSES PAID DURING PERIOD* 4/1/2012 – 9/30/2012 | |
Class A | | | | | | | | | | | | |
Actual | | | $1,000.00 | | | | $1,045.60 | | | | $5.01 | |
Hypothetical (5% return before expenses) | | | $1,000.00 | | | | $1,020.10 | | | | $4.95 | |
Class B | | | | | | | | | | | | |
Actual | | | $1,000.00 | | | | $1,042.30 | | | | $8.83 | |
Hypothetical (5% return before expenses) | | | $1,000.00 | | | | $1,016.35 | | | | $8.72 | |
Class C | | | | | | | | | | | | |
Actual | | | $1,000.00 | | | | $1,041.90 | | | | $8.83 | |
Hypothetical (5% return before expenses) | | | $1,000.00 | | | | $1,016.35 | | | | $8.72 | |
Class Y | | | | | | | | | | | | |
Actual | | | $1,000.00 | | | | $1,047.10 | | | | $3.74 | |
Hypothetical (5% return before expenses) | | | $1,000.00 | | | | $1,021.35 | | | | $3.69 | |
Admin Class | | | | | | | | | | | | |
Actual | | | $1,000.00 | | | | $1,044.70 | | | | $6.24 | |
Hypothetical (5% return before expenses) | | | $1,000.00 | | | | $1,018.90 | | | | $6.16 | |
| * | Expenses are equal to the Fund's annualized expense ratio: 0.98%, 1.73%, 1.73%, 0.73% and 1.22% for Class A, B, C, Y and Admin Class, respectively, multiplied by the average account value over the period, multiplied by the number of days in the most recent fiscal half-year, divided by 366 (to reflect the half-year period). |
| 20
BOARD APPROVAL OF THE EXISTING ADVISORY AGREEMENTS
The Board of Trustees of the Trust, including the Independent Trustees, considers matters bearing on each Fund’s advisory agreement (collectively, the “Agreements”) at most of its meetings throughout the year. Each year, usually in the spring, the Contract Review and Governance Committee of the Board meets to review the Agreements to determine whether to recommend that the full Board approve the continuation of the Agreements, typically for an additional one-year period. After the Committee has made its recommendation, the full Board, including the Independent Trustees, determines whether to approve the continuation of the Agreements.
In connection with these meetings, the Trustees receive materials that the Funds’ investment adviser (the “Adviser”) believes to be reasonably necessary for the Trustees to evaluate the Agreements. These materials generally include, among other items, (i) information on the investment performance of the Funds and the performance of peer groups of funds and the Funds’ performance benchmarks, (ii) information on the Funds’ advisory fees and other expenses, including information comparing the Funds’ expenses to the fees charged to institutional accounts with similar strategies managed by the Adviser and to those of peer groups of funds and information about any applicable expense caps and fee “breakpoints,” (iii) sales and redemption data in respect of the Funds, (iv) information about the profitability of the Agreements to the Adviser and (v) information obtained through the completion by the Adviser of a questionnaire distributed on behalf of the Trustees. The Board of Trustees, including the Independent Trustees, also consider other matters such as (i) the Adviser’s financial results and financial condition, (ii) each Fund’s investment objective and strategies and the size, education and experience of the Adviser’s investment staff and its use of technology, external research and trading cost measurement tools, (iii) arrangements in respect of the distribution of the Funds’ shares and the related costs, (iv) the procedures employed to determine the value of the Funds’ assets, (v) the allocation of the Funds’ brokerage, if any, including, if applicable, allocations to brokers affiliated with the Adviser and the use of “soft” commission dollars to pay Fund expenses and to pay for research and other similar services, (vi) the resources devoted to, and the record of compliance with, the Funds’ investment policies and restrictions, policies on personal securities transactions and other compliance policies, (vii) information about amounts invested by the Funds’ portfolio managers in the Funds or in similar accounts that they manage and (viii) the general economic outlook with particular emphasis on the mutual fund industry. Throughout the process, the Trustees are afforded the opportunity to ask questions of and request additional materials from the Adviser.
In addition to the materials requested by the Trustees in connection with their annual consideration of the continuation of the Agreements, the Trustees receive materials in advance of each regular quarterly meeting of the Board of Trustees that provide detailed information about the Funds’ investment performance and the fees charged to the Funds for advisory and other services. This information generally includes, among other things, an internal performance rating for each Fund based on agreed-upon criteria, graphs showing each Fund’s performance and fee differentials against each Fund’s peer group/category, performance ratings provided by a third-party, total return information for
21 |
various periods, and third-party performance rankings for various periods comparing a Fund against similarly categorized funds. The portfolio management team for each Fund or other representatives of the Adviser make periodic presentations to the Contract Review and Governance Committee and/or the full Board of Trustees, and Funds identified as presenting possible performance concerns may be subject to more frequent board presentations and reviews. In addition, each quarter the Trustees are provided with detailed statistical information about each Fund’s portfolio. The Trustees also receive periodic updates between meetings.
The Board of Trustees most recently approved the continuation of the Agreements at their meeting held in June 2012. The Agreements were continued for a one-year period for the Funds. In considering whether to approve the continuation of the Agreements, the Board of Trustees, including the Independent Trustees, did not identify any single factor as determinative. Individual Trustees may have evaluated the information presented differently from one another, giving different weights to various factors. Matters considered by the Trustees, including the Independent Trustees, in connection with their approval of the Agreements included, but were not limited to, the factors listed below.
The nature, extent and quality of the services provided to the Funds under the Agreements. The Trustees considered the nature, extent and quality of the services provided by the Adviser and its affiliates to the Funds and the resources dedicated to the Funds by the Adviser and its affiliates.
The Trustees considered not only the advisory services provided by the Adviser to the Funds, but also the administrative services provided by NGAM Advisors, L.P. (“NGAM Advisors”) and its affiliates to the Funds.
For each Fund, the Trustees also considered the benefits to shareholders of investing in a mutual fund that is part of a family of funds that offers shareholders the right to exchange shares of one type of fund for shares of another type of fund, and provides a variety of fund and shareholder services.
After reviewing these and related factors, the Trustees concluded, within the context of their overall conclusions regarding each of the Agreements, that the nature, extent and quality of services provided supported the renewal of the Agreements.
Investment performance of the Funds and the Adviser. As noted above, the Trustees received information about the performance of the Funds over various time periods, including information which compared the performance of the Funds to the performance of peer groups and categories of funds and the Funds’ respective performance benchmarks. In addition, the Trustees also reviewed data prepared by an independent third party which analyzed the performance of the Funds using a variety of performance metrics, including metrics which also measured the performance of the Funds on a risk adjusted basis.
With respect to each Fund, the Board concluded that the Fund’s performance or other relevant factors supported the renewal of the Agreement relating to that Fund. In the case of each Fund that had performance that lagged that of a relevant peer group median and/or category median for certain (although not necessarily all) periods, the Board concluded that other factors relevant to performance supported renewal of the Agreements. These factors included one or more of the following: (1) that the
| 22
underperformance was attributable, to a significant extent, to investment decisions (such as security selection or sector allocation) by the Adviser that were reasonable and consistent with the Fund’s investment objective and policies; (2) that the Fund’s more recent performance, although lagging in certain periods, was competitive when compared to relevant performance benchmarks or peer groups and (3) that the Fund’s performance, although lagging in certain recent periods, was stronger over the long term.
The Trustees also considered the Adviser’s performance and reputation generally, the performance of the fund family generally (as noted by certain financial publications), and the historical responsiveness of the Adviser to Trustee concerns about performance and the willingness of the Adviser to take steps intended to improve performance.
After reviewing these and related factors, the Trustees concluded, within the context of their overall conclusions regarding each of the Agreements, that the performance of the Funds and the Adviser supported the renewal of the Agreements.
The costs of the services to be provided and profits to be realized by the Adviser and its affiliates from their respective relationships with the Funds. The Trustees considered the fees charged to the Funds for advisory services as well as the total expense levels of the Funds. This information included comparisons (provided both by management and also by an independent third party) of the Funds’ advisory fees and total expense levels to those of their peer groups and information about the advisory fees charged by the Adviser to comparable accounts (such as institutional separate accounts), as well as information about differences in such fees and the reasons for any such differences. In considering the fees charged to comparable accounts, the Trustees considered, among other things, management’s representations about the differences between managing mutual funds as compared to other types of accounts, including the additional resources required to effectively manage and the greater regulatory costs associated with the management of mutual fund assets. In evaluating each Fund’s advisory fee, the Trustees also took into account the demands, complexity and quality of the investment management of such Fund and the need for the Adviser to offer competitive compensation. The Trustees considered that over the past several years, management had made recommendations regarding reductions in advisory fee rates, implementation of advisory fee breakpoints and the institution of advisory fee waivers and expense caps for various funds in the fund family. They noted that, as of December 31, 2011, all four of the Funds included in this report have expense caps in place, and the Trustees considered the amounts waived or reimbursed by the Adviser under these caps for each Fund other than those for which current expenses are below the cap.
The Trustees also considered the compensation directly or indirectly received by the Adviser and its affiliates from their relationships with the Funds. The Trustees reviewed information provided by management as to the profitability of the Adviser’s and its affiliates’ relationships with the Funds, and information about the allocation of expenses used to calculate profitability. They also reviewed information provided by management about the effect of distribution costs and changes in asset levels on Adviser profitability, including information regarding resources spent on distribution activities. When reviewing profitability, the Trustees also considered information about court cases in which adviser compensation or profitability were issues, the performance
23 |
of the relevant Funds, the expense levels of the Funds, and whether the Adviser had implemented breakpoints and/or expense caps with respect to such Funds.
After reviewing these and related factors, the Trustees concluded, within the context of their overall conclusions regarding each of the Agreements, that the advisory fee charged to each of the Funds was fair and reasonable, and that the costs of these services generally and the related profitability of the Adviser and its affiliates in respect of their relationships with the Funds supported the renewal of the Agreements.
Economies of Scale. The Trustees considered the existence of any economies of scale in the provision of services by the Adviser and whether those economies are shared with the Funds through breakpoints in their investment advisory fees or other means, such as expense waivers or caps. The Trustees also discussed with management the factors considered with respect to the implementation of breakpoints in investment advisory fees or expense waivers or caps for certain funds. Management explained that a number of factors are taken into account in considering the possible implementation of breakpoints or an expense cap for a fund, including, among other things, factors such as a fund’s assets, the projected growth of a fund, projected profitability and a fund’s fees and performance. With respect to economies of scale, the Trustees noted that each of the Funds was subject to an expense cap or waiver. In considering these issues, the Trustees also took note of the costs of the services provided (both on an absolute and a relative basis) and the profitability to the Adviser and its affiliates of their relationships with the Funds, as discussed above.
After reviewing these and related factors, the Trustees concluded, within the context of their overall conclusions regarding each of the Agreements, that the extent to which economies of scale were shared with the Funds supported the renewal of the Agreements.
The Trustees also considered other factors, which included but were not limited to the following:
| · | | The effect of recent market and economic events on the performance, asset levels and expense ratios of each Fund. |
| · | | Whether each Fund has operated in accordance with its investment objective and the Fund’s record of compliance with its investment restrictions, and the compliance programs of the Funds and the Adviser. They also considered the compliance-related resources the Adviser and its affiliates were providing to the Funds. |
| · | | The nature, quality, cost and extent of administrative and shareholder services performed by the Adviser and its affiliates, both under the Agreements and under separate agreements covering administrative services. |
| · | | So-called “fallout benefits” to the Adviser, such as the engagement of affiliates of the Adviser to provide distribution, administrative and brokerage services to the Funds, and the benefits of research made available to the Adviser by reason of brokerage commissions (if any) generated by the Funds’ securities transactions. |
| 24
| | The Trustees also considered the fact that NGAM Advisors’ parent company benefits from the retention of an affiliated Adviser. The Trustees considered the possible conflicts of interest associated with these fallout and other benefits, and the reporting, disclosure and other processes in place to disclose and monitor such possible conflicts of interest. |
| · | | The Trustees’ review and discussion of the Funds’ advisory arrangements in prior years, and management’s record of responding to Trustee concerns raised during the year and in prior years. |
Based on their evaluation of all factors that they deemed to be material, including those factors described above, and assisted by the advice of independent counsel, the Trustees, including the Independent Trustees, concluded that each of the existing Agreements should be continued through June 30, 2013.
25 |
Portfolio of Investments – as of September 30, 2012
Loomis Sayles Global Equity and Income Fund
| | | | | | | | |
| Shares | | | Description | | Value (†) | |
| | Common Stocks — 65.4% of Net Assets | | | | |
| | | | Argentina — 0.9% | | | | |
| | 574,197 | | | Arcos Dorados Holdings, Inc., Class A | | $ | 8,859,860 | |
| | | | | | | | |
| | | | Belgium — 1.4% | | | | |
| | 148,057 | | | Anheuser-Busch InBev NV | | | 12,666,076 | |
| | | | | | | | |
| | | | Brazil — 3.8% | | | | |
| | 503,400 | | | Cia Hering | | | 11,380,354 | |
| | 640,500 | | | Mills Estruturas e Servicos de Engenharia S.A. | | | 9,257,196 | |
| | 358,000 | | | Natura Cosmeticos S.A. | | | 9,756,813 | |
| | 518,500 | | | Qualicorp, S.A.(b) | | | 5,064,151 | |
| | | | | | | | |
| | | | | | | 35,458,514 | |
| | | | | | | | |
| | | | Canada — 0.7% | | | | |
| | 142,485 | | | Potash Corp. of Saskatchewan, Inc. | | | 6,186,699 | |
| | | | | | | | |
| | | | Chile — 2.4% | | | | |
| | 144,445 | | | Banco Santander Chile, ADR | | | 10,579,152 | |
| | 1,193,724 | | | S.A.C.I. Falabella | | | 12,029,094 | |
| | | | | | | | |
| | | | | | | 22,608,246 | |
| | | | | | | | |
| | | | China — 2.0% | | | | |
| | 76,811 | | | Baidu, Inc., Sponsored ADR(b) | | | 8,973,061 | |
| | 879,500 | | | China Mobile Ltd. | | | 9,778,413 | |
| | | | | | | | |
| | | | | | | 18,751,474 | |
| | | | | | | | |
| | | | Denmark — 0.8% | | | | |
| | 49,587 | | | Novo Nordisk A/S, Class B | | | 7,803,698 | |
| | | | | | | | |
| | | | France — 1.6% | | | | |
| | 172,688 | | | Sanofi | | | 14,778,030 | |
| | | | | | | | |
| | | | Germany — 0.9% | | | | |
| | 81,816 | | | Siemens AG, (Registered) | | | 8,183,280 | |
| | | | | | | | |
| | | | Hong Kong — 0.6% | | | | |
| | 1,796,000 | | | Hang Lung Properties Ltd. | | | 6,115,163 | |
| | | | | | | | |
| | | | Japan — 1.3% | | | | |
| | 73,200 | | | FANUC Corp. | | | 11,782,143 | |
| | | | | | | | |
| | | | Mexico — 1.0% | | | | |
| | 4,778,000 | | | Genomma Lab Internacional S.A. de CV, Class B(b) | | | 9,246,604 | |
| | | | | | | | |
| | | | Netherlands — 2.4% | | | | |
| | 926,754 | | | DE Master Blenders 1753 NV(b) | | | 11,175,449 | |
| | 164,525 | | | Royal Dutch Shell PLC, ADR | | | 11,419,680 | |
| | | | | | | | |
| | | | | | | 22,595,129 | |
| | | | | | | | |
| | | | Russia — 0.9% | | | | |
| | 244,594 | | | Mail.ru Group Ltd., GDR, 144A(c) | | | 8,154,764 | |
| | | | | | | | |
| | | | Sweden — 2.4% | | | | |
| | 440,572 | | | Atlas Copco AB, Class A | | | 10,294,569 | |
| | 889,570 | | | Elekta AB, Class B | | | 11,744,289 | |
| | | | | | | | |
| | | | | | | 22,038,858 | |
| | | | | | | | |
See accompanying notes to financial statements.
| 26
Portfolio of Investments – as of September 30, 2012
Loomis Sayles Global Equity and Income Fund – (continued)
| | | | | | | | |
| Shares | | | Description | | Value (†) | |
| | | | United Kingdom — 8.5% | | | | |
| | 403,016 | | | Antofagasta PLC | | $ | 8,242,478 | |
| | 521,044 | | | BG Group PLC | | | 10,543,172 | |
| | 226,684 | | | British American Tobacco PLC | | | 11,647,786 | |
| | 285,851 | | | Burberry Group PLC | | | 4,628,511 | |
| | 633,870 | | | Diageo PLC | | | 17,848,601 | |
| | 533,148 | | | Standard Chartered PLC | | | 12,080,544 | |
| | 4,748,441 | | | Vodafone Group PLC | | | 13,493,313 | |
| | | | | | | | |
| | | | | | | 78,484,405 | |
| | | | | | | | |
| | | | United States — 33.8% | | | | |
| | 159,998 | | | ACE Ltd. | | | 12,095,849 | |
| | 252,334 | | | American Express Co. | | | 14,347,711 | |
| | 30,391 | | | Apple, Inc. | | | 20,278,699 | |
| | 275,679 | | | AT&T, Inc. | | | 10,393,098 | |
| | 735,298 | | | Calpine Corp.(b) | | | 12,720,656 | |
| | 98,824 | | | Caterpillar, Inc. | | | 8,502,817 | |
| | 275,521 | | | CenturyLink, Inc. | | | 11,131,048 | |
| | 541,347 | | | Citigroup, Inc. | | | 17,712,874 | |
| | 354,330 | | | Coca-Cola Enterprises, Inc. | | | 11,079,899 | |
| | 237,627 | | | CVS Caremark Corp. | | | 11,505,899 | |
| | 265,704 | | | FMC Technologies, Inc.(b) | | | 12,302,095 | |
| | 87,160 | | | Genesee & Wyoming, Inc., Class A(b) | | | 5,827,518 | |
| | 24,235 | | | Google, Inc., Class A(b) | | | 18,285,308 | |
| | 955 | | | Hawaiian Telcom Holdco, Inc.(b) | | | 16,932 | |
| | 117,934 | | | Jones Lang LaSalle, Inc. | | | 9,004,261 | |
| | 366,486 | | | Microsoft Corp. | | | 10,913,953 | |
| | 182,708 | | | National Fuel Gas Co. | | | 9,873,540 | |
| | 192,673 | | | National Oilwell Varco, Inc. | | | 15,435,034 | |
| | 557,067 | | | Oracle Corp. | | | 17,542,040 | |
| | 254,051 | | | PNC Financial Services Group, Inc. | | | 16,030,618 | |
| | 139,898 | | | Praxair, Inc. | | | 14,532,604 | |
| | 47,776 | | | Precision Castparts Corp. | | | 7,803,732 | |
| | 18,329 | | | Priceline.com, Inc.(b) | | | 11,340,702 | |
| | 170,086 | | | QUALCOMM, Inc. | | | 10,628,674 | |
| | 185,510 | | | Schlumberger Ltd. | | | 13,417,938 | |
| | 334,561 | | | Texas Instruments, Inc. | | | 9,217,156 | |
| | 26,818 | | | Vertex Pharmaceuticals, Inc.(b) | | | 1,500,467 | |
| | | | | | | | |
| | | | | | | 313,441,122 | |
| | | | | | | | |
| | | | Total Common Stocks
(Identified Cost $563,863,006) | | | 607,154,065 | |
| | | | | | | | |
| | | | | | | | |
Principal
Amount (‡) | | | | | | |
| | Bonds and Notes — 26.5% | | | | |
| | Non-Convertible Bonds — 25.7% | | | | |
| | | | Argentina — 0.1% | | | | |
| $ | 634,759 | | | Argentina Government International Bond, 8.280%, 12/31/2033 | | | 498,285 | |
| | 170,000 | | | Pan American Energy LLC, 7.875%, 5/07/2021, 144A | | | 155,550 | |
See accompanying notes to financial statements.
27 |
Portfolio of Investments – as of September 30, 2012
Loomis Sayles Global Equity and Income Fund – (continued)
| | | | | | | | |
Principal
Amount (‡) | | | Description | | Value (†) | |
| | | | Argentina — continued | | | | |
| $ | 500,000 | | | Transportadora de Gas del Sur S.A., 7.875%, 5/14/2017, 144A | | $ | 426,250 | |
| | | | | | | | |
| | | | | | | 1,080,085 | |
| | | | | | | | |
| | | | Australia — 0.2% | | | | |
| | 1,200,000 | | | Macquarie Bank Ltd., 5.000%, 2/22/2017, 144A | | | 1,281,720 | |
| | 500,000 | | | Macquarie Bank Ltd., 6.625%, 4/07/2021, 144A | | | 535,050 | |
| | 235,000 | | | New South Wales Treasury Corp., 6.000%, 2/01/2018, (AUD) | | | 275,572 | |
| | 155,000 | | | Sydney Airport Finance Co., 5.125%, 2/22/2021, 144A | | | 168,037 | |
| | | | | | | | |
| | | | | | | 2,260,379 | |
| | | | | | | | |
| | | | Belgium — 0.1% | | | | |
| | 350,000 | | | Anheuser-Busch InBev NV, EMTN, 6.500%, 6/23/2017, (GBP) | | | 685,403 | |
| | | | | | | | |
| | | | Brazil — 1.2% | | | | |
| | 600,000 | | | Banco BTG Pactual, S.A., 5.750%, 9/28/2022, 144A | | | 607,500 | |
| | 400,000 | | | Banco Santander Brasil S.A., 4.500%, 4/06/2015, 144A | | | 410,500 | |
| | 600,000 | | | Banco Santander Brasil S.A., 4.625%, 2/13/2017, 144A | | | 618,000 | |
| | 1,809,743 | | | Banco Votorantim S.A., 6.250%, 5/16/2016, 144A, (BRL) | | | 943,268 | |
| | 800,000 | | | Braskem Finance Ltd., 5.750%, 4/15/2021, 144A | | | 848,000 | |
| | 654,212(††) | | | Brazil Notas do Tesouro Nacional, Series B, 6.000%, 8/15/2014, (BRL) | | | 343,434 | |
| | 523,369(††) | | | Brazil Notas do Tesouro Nacional, Series B, 6.000%, 5/15/2015, (BRL) | | | 279,160 | |
| | 1,115(†††) | | | Brazil Notas do Tesouro Nacional, Series F, 10.000%, 1/01/2021, (BRL) | | | 561,087 | |
| | 600,000 | | | BRF - Brazil Foods S.A., 5.875%, 6/06/2022, 144A | | | 655,500 | |
| | 400,000 | | | CSN Resources S.A., 6.500%, 7/21/2020, 144A | | | 431,000 | |
| | 450,000 | | | Fibria Overseas Finance Ltd., 6.750%, 3/03/2021, 144A | | | 480,375 | |
| | 300,000 | | | Itau Unibanco Holding S.A., 6.200%, 12/21/2021, 144A | | | 326,250 | |
| | 100,000 | | | LPG International, Inc., 7.250%, 12/20/2015 | | | 110,750 | |
| | 100,000 | | | Marfrig Overseas Ltd., 9.500%, 5/04/2020, 144A | | | 82,650 | |
| | 194,000 | | | Odebrecht Drilling Norbe VIII/IX Ltd., 6.350%, 6/30/2021, 144A | | | 218,153 | |
| | 500,000 | | | Odebrecht Finance Ltd., 6.000%, 4/05/2023, 144A | | | 555,000 | |
| | 600,000 | | | OGX Austria GmbH, 8.500%, 6/01/2018, 144A | | | 540,000 | |
| | 2,400,000 | | | Oi S.A., 9.750%, 9/15/2016, 144A, (BRL) | | | 1,243,063 | |
| | 320,000 | | | Petrobras International Finance Co., 5.375%, 1/27/2021 | | | 360,567 | |
| | 300,000 | | | Petrobras International Finance Co., 6.875%, 1/20/2040 | | | 375,582 | |
| | 350,000 | | | Republic of Brazil, 8.500%, 1/05/2024, (BRL) | | | 201,998 | |
| | 129,000 | | | Telemar Norte Leste S.A., 5.500%, 10/23/2020, 144A | | | 135,450 | |
| | 536,000 | | | Vale Overseas Ltd., 6.875%, 11/21/2036 | | | 620,623 | |
| | 400,000 | | | Votorantim Cimentos S.A., 7.250%, 4/05/2041, 144A | | | 431,000 | |
| | | | | | | | |
| | | | | | | 11,378,910 | |
| | | | | | | | |
| | | | Canada — 0.6% | | | | |
| | 2,880,000 | | | Canadian Government, 3.000%, 12/01/2015, (CAD)(d) | | | 3,094,674 | |
| | 650,000 | | | Canadian Government, 3.500%, 6/01/2013, (CAD) | | | 671,944 | |
| | 465,000 | | | Pacific Rubiales Energy Corp., 7.250%, 12/12/2021, 144A | | | 546,375 | |
| | 100,000 | | | Shaw Communications, Inc., 5.650%, 10/01/2019, (CAD) | | | 114,572 | |
| | 600,000 | | | Telus Corp., Series CG, 5.050%, 12/04/2019, (CAD) | | | 697,779 | |
| | | | | | | | |
| | | | | | | 5,125,344 | |
| | | | | | | | |
See accompanying notes to financial statements.
| 28
Portfolio of Investments – as of September 30, 2012
Loomis Sayles Global Equity and Income Fund – (continued)
| | | | | | | | |
Principal
Amount (‡) | | | Description | | Value (†) | |
| | | | Chile — 0.3% | | | | |
| $ | 1,450,000 | | | Banco de Credito e Inversiones, 3.000%, 9/13/2017, 144A | | $ | 1,447,868 | |
| | 250,000,000 | | | Banco Santander Chile, 6.500%, 9/22/2020, 144A, (CLP) | | | 511,226 | |
| | 200,000 | | | Celulosa Arauco y Constitucion S.A., 4.750%, 1/11/2022 | | | 208,844 | |
| | 250,000 | | | E.CL S.A., 5.625%, 1/15/2021, 144A | | | 279,566 | |
| | | | | | | | |
| | | | | | | 2,447,504 | |
| | | | | | | | |
| | | | China — 0.0% | | | | |
| | 400,000 | | | China Resources Gas Group Ltd., 4.500%, 4/05/2022, 144A | | | 433,744 | |
| | | | | | | | |
| | | | Colombia — 0.2% | | | | |
| | 400,000 | | | Banco Davivienda S.A., 5.875%, 7/09/2022, 144A | | | 412,600 | |
| | 555,000 | | | Colombia Telecomunicaciones S.A., E.S.P., 5.375%, 9/27/2022, 144A | | | 563,325 | |
| | 435,000,000 | | | Emgesa S.A. E.S.P., 8.750%, 1/25/2021, 144A, (COP) | | | 273,142 | |
| | 1,300,000,000 | | | Empresas Publicas de Medellin E.S.P., 8.375%, 2/01/2021, 144A, (COP) | | | 809,062 | |
| | 200,000,000 | | | Republic of Colombia, 7.750%, 4/14/2021, (COP) | | | 136,806 | |
| | 40,000 | | | Republic of Colombia, 8.125%, 5/21/2024 | | | 59,700 | |
| | | | | | | | |
| | | | | | | 2,254,635 | |
| | | | | | | | |
| | | | Czech Republic — 0.0% | | | | |
| | 400,000 | | | CEZ AS, 4.250%, 4/03/2022, 144A | | | 425,912 | |
| | | | | | | | |
| | | | France — 0.1% | | | | |
| | 200,000 | | | AXA S.A., 7.125%, 12/15/2020, (GBP) | | | 359,490 | |
| | 150,000 | | | Lafarge S.A., EMTN, 5.375%, 6/26/2017, (EUR) | | | 203,314 | |
| | | | | | | | |
| | | | | | | 562,804 | |
| | | | | | | | |
| | | | Germany — 0.0% | | | | |
| | 185,000 | | | Bundesrepublik Deutschland, 3.750%, 1/04/2017, (EUR) | | | 272,061 | |
| | | | | | | | |
| | | | Hong Kong — 0.2% | | | | |
| | 600,000 | | | Bank of East Asia Ltd., EMTN, (fixed rate to 5/04/2017, variable rate thereafter), 6.375%, 5/04/2022 | | | 670,620 | |
| | 400,000 | | | Hutchison Whampoa International 11 Ltd., 3.500%, 1/13/2017, 144A | | | 424,271 | |
| | 400,000 | | | Noble Group Ltd., 6.750%, 1/29/2020, 144A | | | 424,000 | |
| | | | | | | | |
| | | | | | | 1,518,891 | |
| | | | | | | | |
| | | | Hungary — 0.0% | | | | |
| | 200,000 | | | Hungary Government International Bond, 6.375%, 3/29/2021 | | | 217,760 | |
| | | | | | | | |
| | | | Iceland — 0.1% | | | | |
| | 1,000,000 | | | Republic of Iceland, 5.875%, 5/11/2022, 144A | | | 1,090,000 | |
| | | | | | | | |
| | | | India — 0.3% | | | | |
| | 200,000 | | | Canara Bank Ltd., (fixed rate to 11/28/2016, variable rate thereafter),
6.365%, 11/28/2021 | | | 197,765 | |
| | 1,400,000 | | | ICICI Bank Ltd., (fixed rate to 4/30/2017, variable rate thereafter),
6.375%, 4/30/2022, 144A | | | 1,400,000 | |
| | 700,000 | | | State Bank of India/London, 4.125%, 8/01/2017, 144A | | | 716,061 | |
| | | | | | | | |
| | | | | | | 2,313,826 | |
| | | | | | | | |
See accompanying notes to financial statements.
29 |
Portfolio of Investments – as of September 30, 2012
Loomis Sayles Global Equity and Income Fund – (continued)
| | | | | | | | |
Principal
Amount (‡) | | | Description | | Value (†) | |
| | | | Indonesia — 0.1% | | | | |
| $ | 200,000 | | | Adaro Indonesia PT, 7.625%, 10/22/2019, 144A | | $ | 220,000 | |
| | 3,500,000,000 | | | Indonesia Government International Bond, 9.500%, 7/15/2023, (IDR) | | | 459,692 | |
| | 781,000,000 | | | Indonesia Government International Bond, 11.500%, 9/15/2019, (IDR) | | | 107,642 | |
| | | | | | | | |
| | | | | | | 787,334 | |
| | | | | | | | |
| | | | Ireland — 0.0% | | | | |
| | 100,000 | | | WPP 2008 Ltd., 6.000%, 4/04/2017, (GBP) | | | 186,576 | |
| | | | | | | | |
| | | | Italy — 0.4% | | | | |
| | 250,000 | | | Finmeccanica SpA, EMTN, 4.875%, 3/24/2025, (EUR) | | | 273,073 | |
| | 500,000 | | | Italy Buoni Poliennali Del Tesoro, 4.000%, 2/01/2037, (EUR) | | | 512,542 | |
| | 1,515,000 | | | Italy Buoni Poliennali Del Tesoro, 4.500%, 8/01/2018, (EUR) | | | 1,979,090 | |
| | 400,000 | | | Italy Buoni Poliennali Del Tesoro, 5.000%, 3/01/2022, (EUR) | | | 516,210 | |
| | 125,000 | | | Telecom Italia Capital S.A., 6.000%, 9/30/2034 | | | 110,625 | |
| | 10,000 | | | Telecom Italia Capital S.A., 6.375%, 11/15/2033 | | | 9,125 | |
| | 100,000 | | | Telecom Italia SpA, EMTN, 5.375%, 1/29/2019, (EUR) | | | 132,687 | |
| | | | | | | | |
| | | | | | | 3,533,352 | |
| | | | | | | | |
| | | | Korea — 0.8% | | | | |
| | 8,000,000 | | | Export-Import Bank of Korea, 4.000%, 11/26/2015, 144A, (PHP) | | | 198,279 | |
| | 400,000 | | | Hana Bank, 4.000%, 11/03/2016, 144A | | | 431,018 | |
| | 600,000 | | | Hyundai Capital Services, Inc., 3.500%, 9/13/2017, 144A | | | 627,396 | |
| | 600,000 | | | Hyundai Steel Co., 4.625%, 4/21/2016, 144A | | | 645,360 | |
| | 600,000 | | | Industrial Bank of Korea, 2.375%, 7/17/2017, 144A | | | 609,887 | |
| | 400,000 | | | Kia Motors Corp., 3.625%, 6/14/2016, 144A | | | 420,678 | |
| | 400,000 | | | Korea Finance Corp., 4.625%, 11/16/2021 | | | 451,954 | |
| | 400,000 | | | Korea National Oil Corp., 3.125%, 4/03/2017, 144A | | | 420,296 | |
| | 2,700,000,000 | | | Korea Treasury Bond, 5.000%, 9/10/2014, (KRW) | | | 2,528,229 | |
| | 250,000 | | | Lotte Shopping Co. Ltd., 3.375%, 5/09/2017, 144A | | | 260,488 | |
| | 400,000 | | | Shinhan Bank, 4.375%, 7/27/2017, 144A | | | 440,120 | |
| | 140,000 | | | SK Telecom Co. Ltd., 6.625%, 7/20/2027, 144A | | | 172,962 | |
| | 200,000 | | | Woori Bank, 5.875%, 4/13/2021, 144A | | | 231,769 | |
| | | | | | | | |
| | | | | | | 7,438,436 | |
| | | | | | | | |
| | | | Latvia — 0.1% | | | | |
| | 600,000 | | | Republic of Latvia, 5.250%, 2/22/2017, 144A | | | 660,000 | |
| | | | | | | | |
| | | | Luxembourg — 0.1% | | | | |
| | 400,000 | | | ArcelorMittal, 7.000%, 3/01/2041 | | | 359,599 | |
| | 400,000 | | | VTB Bank OJSC, 6.000%, 4/12/2017, 144A | | | 416,840 | |
| | | | | | | | |
| | | | | | | 776,439 | |
| | | | | | | | |
| | | | Malaysia — 0.1% | | | | |
| | 1,750,000 | | | Malaysia Government Bond, 3.434%, 8/15/2014, (MYR) | | | 576,193 | |
| | 1,000,000 | | | Malaysia Government Bond, 4.262%, 9/15/2016, (MYR) | | | 339,426 | |
| | | | | | | | |
| | | | | | | 915,619 | |
| | | | | | | | |
| | | | Mexico — 1.4% | | | | |
| | 7,000,000 | | | America Movil SAB de CV, 3.500%, 2/08/2015, (CNY) | | | 1,114,938 | |
| | 195,000 | | | Axtel SAB de CV, 7.625%, 2/01/2017, 144A | | | 120,900 | |
| | 145,000 | | | Axtel SAB de CV, 9.000%, 9/22/2019, 144A | | | 89,900 | |
See accompanying notes to financial statements.
| 30
Portfolio of Investments – as of September 30, 2012
Loomis Sayles Global Equity and Income Fund – (continued)
| | | | | | | | |
Principal
Amount (‡) | | | Description | | Value (†) | |
| | | | Mexico — continued | | | | |
| $ | 600,000 | | | BBVA Bancomer S.A., 6.750%, 9/30/2022, 144A | | $ | 655,500 | |
| | 700,000 | | | Corporacion GEO SAB de CV, 9.250%, 6/30/2020, 144A | | | 721,000 | |
| | 600,000 | | | Desarrolladora Homex SAB de CV, 9.750%, 3/25/2020, 144A | | | 612,000 | |
| | 94,000(††††) | | | Mexican Fixed Rate Bonds, Series M, 6.500%, 6/10/2021, (MXN) | | | 795,358 | |
| | 668,400(††††) | | | Mexican Fixed Rate Bonds, Series M-10, 7.750%, 12/14/2017, (MXN) | | | 5,843,753 | |
| | 74,000(††††) | | | Mexican Fixed Rate Bonds, Series M-10, 8.000%, 12/17/2015, (MXN) | | | 628,362 | |
| | 88,000(††††) | | | Mexican Fixed Rate Bonds, Series M-10, 8.500%, 12/13/2018, (MXN) | | | 806,518 | |
| | 65,000(††††) | | | Mexican Fixed Rate Bonds, Series M-20, 10.000%, 12/05/2024, (MXN) | | | 710,189 | |
| | 80,000(††††) | | | Mexican Fixed Rate Bonds, Series M-30, 8.500%, 11/18/2038, (MXN) | | | 776,708 | |
| | | | | | | | |
| | | | | | | 12,875,126 | |
| | | | | | | | |
| | | | Netherlands — 0.1% | | | | |
| | 200,000 | | | EADS Finance BV, EMTN, 4.625%, 8/12/2016, (EUR) | | | 289,126 | |
| | 200,000 | | | Indosat Palapa Co. BV, 7.375%, 7/29/2020, 144A | | | 227,000 | |
| | 400,000 | | | Listrindo Capital BV, 6.950%, 2/21/2019, 144A | | | 440,676 | |
| | 100,000 | | | Myriad International Holding BV, 6.375%, 7/28/2017, 144A | | | 113,250 | |
| | 50,000 | | | OI European Group BV, 6.875%, 3/31/2017, 144A, (EUR) | | | 66,180 | |
| | 200,000 | | | Portugal Telecom International Finance BV, EMTN, 5.000%,
11/04/2019, (EUR) | | | 237,117 | |
| | | | | | | | |
| | | | | | | 1,373,349 | |
| | | | | | | | |
| | | | New Zealand — 0.1% | | | | |
| | 1,000,000 | | | New Zealand Government Bond, 6.000%, 5/15/2021, (NZD) | | | 993,822 | |
| | | | | | | | |
| | | | Norway — 0.3% | | | | |
| | 475,000 | | | Eksportfinans ASA, 2.000%, 9/15/2015 | | | 444,125 | |
| | 3,335,000 | | | Norwegian Government Bond, 4.250%, 5/19/2017, (NOK) | | | 653,425 | |
| | 6,360,000 | | | Norwegian Government Bond, 4.500%, 5/22/2019, (NOK) | | | 1,299,443 | |
| | | | | | | | |
| | | | | | | 2,396,993 | |
| | | | | | | | |
| | | | Oman — 0.0% | | | | |
| | 200,000 | | | MBPS Finance Co., 11.250%, 11/15/2015, 144A | | | 177,000 | |
| | | | | | | | |
| | | | Panama — 0.0% | | | | |
| | 300,000 | | | Banco Latinoamericano de Comercio Exterior, S.A., 3.750%, 4/04/2017, 144A | | | 311,250 | |
| | | | | | | | |
| | | | Philippines — 0.1% | | | | |
| | 30,000,000 | | | Philippine Government International Bond, 6.250%, 1/14/2036, (PHP) | | | 799,173 | |
| | | | | | | | |
| | | | Poland — 0.2% | | | | |
| | 2,200,000 | | | Poland Government Bond, 4.750%, 4/25/2017, (PLN) | | | 702,511 | |
| | 95,000 | | | Poland Government International Bond, 3.000%, 9/23/2014, (CHF) | | | 105,606 | |
| | 800,000 | | | Poland Government International Bond, 3.000%, 3/17/2023 | | | 786,160 | |
| | | | | | | | |
| | | | | | | 1,594,277 | |
| | | | | | | | |
| | | | Russia — 0.0% | | | | |
| | 200,000 | | | Gazprom OAO Via Gaz Capital S.A., 4.950%, 5/23/2016, 144A | | | 211,754 | |
| | | | | | | | |
| | | | Singapore — 0.6% | | | | |
| | 1,200,000 | | | DBS Bank Ltd., (fixed rate to 9/21/2017, variable rate thereafter),
3.625%, 9/21/2022, 144A | | | 1,233,048 | |
| | 3,355,000 | | | Singapore Government Bond, 1.625%, 4/01/2013, (SGD) | | | 2,751,636 | |
| | 345,000 | | | Singapore Government Bond, 2.250%, 7/01/2013, (SGD) | | | 285,255 | |
See accompanying notes to financial statements.
31 |
Portfolio of Investments – as of September 30, 2012
Loomis Sayles Global Equity and Income Fund – (continued)
| | | | | | | | |
Principal
Amount (‡) | | | Description | | Value (†) | |
| | | | Singapore — continued | | | | |
| | 605,000 | | | Singapore Government Bond, 2.250%, 6/01/2021, (SGD) | | $ | 530,458 | |
| | 770,000 | | | Singapore Government Bond, 2.500%, 6/01/2019, (SGD) | | | 693,512 | |
| | 150,000 | | | STATS ChipPAC Ltd., 7.500%, 8/12/2015, 144A | | | 156,750 | |
| | | | | | | | |
| | | | | | | 5,650,659 | |
| | | | | | | | |
| | | | South Africa — 0.3% | | | | |
| | 650,000 | | | AngloGold Ashanti Holdings PLC, 5.125%, 8/01/2022 | | | 661,913 | |
| | 450,000 | | | Edcon Proprietary Ltd., 3.502%, 6/15/2014, (EUR)(e) | | | 537,793 | |
| | 130,000 | | | Edcon Proprietary Ltd., 3.502%, 6/15/2014, 144A, (EUR)(e) | | | 155,363 | |
| | 285,000 | | | Republic of South Africa, EMTN, 4.500%, 4/05/2016, (EUR) | | | 400,116 | |
| | 700,000 | | | Transnet SOC Ltd., 4.000%, 7/26/2022, 144A | | | 711,550 | |
| | | | | | | | |
| | | | | | | 2,466,735 | |
| | | | | | | | |
| | | | Spain — 0.2% | | | | |
| | 1,600,000 | | | Spain Government Bond, 4.200%, 1/31/2037, (EUR) | | | 1,450,618 | |
| | 550,000 | | | Spain Government Bond, 4.250%, 10/31/2016, (EUR) | | | 693,419 | |
| | | | | | | | |
| | | | | | | 2,144,037 | |
| | | | | | | | |
| | | | Supranationals — 0.3% | | | | |
| | 840,000 | | | Central American Bank for Economic Integration, 3.875%, 2/09/2017, 144A | | | 888,658 | |
| | 1,115,000 | | | Corp Andina de Fomento, 4.375%, 6/15/2022 | | | 1,209,225 | |
| | 305,000 | | | European Investment Bank, 2.375%, 7/10/2020, (CHF) | | | 360,617 | |
| | 400,000,000 | | | International Bank for Reconstruction & Development, GMTN,
2.300%, 2/26/2013, (KRW) | | | 359,106 | |
| | | | | | | | |
| | | | | | | 2,817,606 | |
| | | | | | | | |
| | | | Sweden — 0.2% | | | | |
| | 1,000,000 | | | PKO Finance AB, 4.630%, 9/26/2022, 144A | | | 1,003,000 | |
| | 2,450,000 | | | Sweden Government Bond, 5.000%, 12/01/2020, (SEK) | | | 477,916 | |
| | | | | | | | |
| | | | | | | 1,480,916 | |
| | | | | | | | |
| | | | Turkey — 0.5% | | | | |
| | 600,000 | | | Akbank TAS, 5.125%, 7/22/2015, 144A | | | 620,250 | |
| | 600,000 | | | Export Credit Bank of Turkey, 5.375%, 11/04/2016, 144A | | | 643,500 | |
| | 1,200,000 | | | Turkey Government Bond, Zero Coupon, 5/15/2013, (TRY) | | | 639,210 | |
| | 1,120,000 | | | Turkey Government Bond, 9.000%, 3/08/2017, (TRY) | | | 654,333 | |
| | 1,200,000 | | | Turkey Government International Bond, 5.125%, 3/25/2022 | | | 1,321,500 | |
| | 600,000 | | | Turkiye Garanti Bankasi A.S., 4.000%, 9/13/2017, 144A | | | 600,360 | |
| | 600,000 | | | Yapi ve Kredi Bankasi Via Unicredit Luxembourg S.A.,
5.188%, 10/13/2015, 144A | | | 615,000 | |
| | | | | | | | |
| | | | | | | 5,094,153 | |
| | | | | | | | |
| | | | United Arab Emirates — 0.1% | | | | |
| | 600,000 | | | Dubai Electricity & Water Authority, 6.375%, 10/21/2016, 144A | | | 654,900 | |
| | 200,000 | | | Dubai Electricity & Water Authority, 8.500%, 4/22/2015, 144A | | | 225,000 | |
| | | | | | | | |
| | | | | | | 879,900 | |
| | | | | | | | |
| | | | United Kingdom — 0.5% | | | | |
| | 600,000 | | | Anglo American Capital PLC, 2.625%, 9/27/2017, 144A | | | 602,040 | |
| | 410,000,000 | | | Barclays Bank PLC, EMTN, 3.680%, 8/20/2015, (KRW) | | | 377,653 | |
See accompanying notes to financial statements.
| 32
Portfolio of Investments – as of September 30, 2012
Loomis Sayles Global Equity and Income Fund – (continued)
| | | | | | | | |
Principal
Amount (‡) | | | Description | | Value (†) | |
| | | | United Kingdom — continued | | | | |
| $ | 250,000 | | | BAT International Finance PLC, 3.250%, 6/07/2022, 144A | | $ | 256,544 | |
| | 150,000 | | | British Telecommunications PLC, 5.750%, 12/07/2028, (GBP) | | | 288,616 | |
| | 60,000 | | | BSKYB Finance UK PLC, 5.750%, 10/20/2017, (GBP) | | | 112,398 | |
| | 150,000 | | | Imperial Tobacco Finance PLC, EMTN, 6.250%, 12/04/2018, (GBP) | | | 290,106 | |
| | 400,000 | | | Old Mutual PLC, EMTN, 8.000%, 6/03/2021, (GBP) | | | 705,183 | |
| | 100,000 | | | Rexam PLC, EMTN, 4.375%, 3/15/2013, (EUR) | | | 130,109 | |
| | 250,000 | | | Standard Chartered Bank, Series 17, EMTN, 5.875%, 9/26/2017, (EUR) | | | 353,575 | |
| | 730,000 | | | United Kingdom Treasury, 1.750%, 1/22/2017, (GBP) | | | 1,238,628 | |
| | 250,000 | | | United Kingdom Treasury, 4.250%, 3/07/2036, (GBP) | | | 498,595 | |
| | | | | | | | |
| | | | | | | 4,853,447 | |
| | | | | | | | |
| | | | United States — 15.5% | | | | |
| | 425,000 | | | Alcatel-Lucent USA, Inc., 6.450%, 3/15/2029 | | | 278,375 | |
| | 15,000 | | | Alcatel-Lucent USA, Inc., 6.500%, 1/15/2028 | | | 9,750 | |
| | 975,000 | | | Alcoa, Inc., 5.900%, 2/01/2027 | | | 1,019,444 | |
| | 1,325,000 | | | Ally Financial, Inc., 5.500%, 2/15/2017 | | | 1,385,000 | |
| | 257,000 | | | Ally Financial, Inc., 6.750%, 12/01/2014 | | | 274,990 | |
| | 55,000 | | | Ally Financial, Inc., 7.500%, 12/31/2013 | | | 58,025 | |
| | 129,000 | | | Ally Financial, Inc., 8.000%, 12/31/2018 | | | 145,125 | |
| | 1,728,000 | | | Ally Financial, Inc., 8.000%, 11/01/2031 | | | 2,014,848 | |
| | 720,000 | | | American International Group, Inc., (fixed rate to 5/15/2038, variable rate thereafter), 8.175%, 5/15/2068 | | | 881,100 | |
| | 60,000 | | | Arrow Electronics, Inc., 6.875%, 7/01/2013 | | | 62,704 | |
| | 18,056 | | | Atlas Air Pass Through Trust, Series 1998-1, Class B, 7.680%, 7/02/2015 | | | 17,244 | |
| | 925,000 | | | Aviation Capital Group Corp., 6.750%, 4/06/2021, 144A | | | 942,945 | |
| | 145,000 | | | Avnet, Inc., 6.000%, 9/01/2015 | | | 158,698 | |
| | 1,820,000 | | | Ball Corp., 5.000%, 3/15/2022 | | | 1,906,450 | |
| | 200,000 | | | Bank of America Corp., 5.490%, 3/15/2019 | | | 217,893 | |
| | 450,000 | | | Bank of America Corp., (fixed rate to 5/06/2014, variable rate thereafter), 4.750%, 5/06/2019, (EUR) | | | 531,143 | |
| | 115,000 | | | Bank of America Corp., MTN, 5.000%, 5/13/2021 | | | 126,406 | |
| | 15,000 | | | Boston Scientific Corp., 5.125%, 1/12/2017 | | | 16,805 | |
| | 5,000 | | | Boston Scientific Corp., 5.450%, 6/15/2014 | | | 5,355 | |
| | 15,000 | | | Boston Scientific Corp., 6.400%, 6/15/2016 | | | 17,364 | |
| | 1,415,000 | | | Cantor Fitzgerald LP, 6.375%, 6/26/2015, 144A | | | 1,436,613 | |
| | 1,995,000 | | | CenturyLink, Inc., 6.450%, 6/15/2021 | | | 2,251,357 | |
| | 510,000 | | | CenturyLink, Inc., 7.650%, 3/15/2042 | | | 543,360 | |
| | 55,000 | | | CenturyLink, Inc., Series G, 6.875%, 1/15/2028 | | | 59,100 | |
| | 605,000 | | | CenturyLink, Inc., Series P, 7.600%, 9/15/2039 | | | 639,863 | |
| | 20,000 | | | Chesapeake Energy Corp., 6.625%, 8/15/2020 | | | 20,625 | |
| | 95,000 | | | Chesapeake Energy Corp., 6.875%, 11/15/2020 | | | 100,225 | |
| | 2,300,000 | | | Chrysler Group LLC/CG Co-Issuer, Inc., 8.250%, 6/15/2021 | | | 2,449,500 | |
| | 750,000 | | | Citigroup, Inc., 6.250%, 6/29/2017, (NZD) | | | 638,272 | |
| | 568,224 | | | Continental Airlines Pass Through Trust, Series 1999-1, Class B,
6.795%, 2/02/2020 | | | 602,318 | |
| | 80,000 | | | Credit Suisse Mortgage Capital Certificates, Series 2007-C5, Class AM, 5.869%, 9/15/2040 | | | 75,799 | |
| | 190,000 | | | CSX Corp., 6.250%, 3/15/2018 | | | 233,016 | |
See accompanying notes to financial statements.
33 |
Portfolio of Investments – as of September 30, 2012
Loomis Sayles Global Equity and Income Fund – (continued)
| | | | | | | | |
Principal
Amount (‡) | | | Description | | Value (†) | |
| | | | United States — continued | | | | |
| $ | 265,000 | | | Cummins, Inc., 5.650%, 3/01/2098 | | $ | 277,328 | |
| | 243,858 | | | Delta Air Lines Pass Through Trust, Series 2007-1, Class B, 8.021%, 2/10/2024 | | | 263,367 | |
| | 234,054 | | | Delta Air Lines Pass Through Trust, Series 2007-1, Class C, 8.954%, 8/10/2014 | | | 240,209 | |
| | 42,000 | | | Dillard’s, Inc., 6.625%, 1/15/2018 | | | 44,310 | |
| | 50,000 | | | Dillard’s, Inc., 7.000%, 12/01/2028 | | | 49,750 | |
| | 8,000 | | | Dillard’s, Inc., 7.750%, 7/15/2026 | | | 8,270 | |
| | 250,000 | | | Exelon Corp., 4.900%, 6/15/2015 | | | 274,793 | |
| | 150,000 | | | Foot Locker, Inc., 8.500%, 1/15/2022 | | | 165,750 | |
| | 25,000 | | | Ford Motor Co., 6.375%, 2/01/2029 | | | 27,225 | |
| | 50,000 | | | Ford Motor Co., 6.625%, 2/15/2028 | | | 54,068 | |
| | 2,105,000 | | | Ford Motor Co., 6.625%, 10/01/2028 | | | 2,350,952 | |
| | 40,000 | | | Ford Motor Co., 7.125%, 11/15/2025 | | | 45,200 | |
| | 835,000 | | | Ford Motor Co., 7.450%, 7/16/2031 | | | 1,038,531 | |
| | 5,000 | | | Ford Motor Co., 7.500%, 8/01/2026 | | | 5,763 | |
| | 1,000,000 | | | Ford Motor Credit Co. LLC, 5.000%, 5/15/2018 | | | 1,091,723 | |
| | 2,250,000 | | | Ford Motor Credit Co. LLC, 7.000%, 10/01/2013 | | | 2,378,340 | |
| | 845,000 | | | Ford Motor Credit Co. LLC, 7.000%, 4/15/2015 | | | 946,400 | |
| | 905,000 | | | Forethought Financial Group, Inc., 8.625%, 4/15/2021, 144A | | | 968,350 | |
| | 28,000 | | | Freescale Semiconductor, Inc., 10.125%, 12/15/2016 | | | 29,050 | |
| | 45,000 | | | General Electric Capital Corp., 5.625%, 5/01/2018 | | | 53,069 | |
| | 600,000 | | | General Electric Capital Corp., Series A, (fixed rate to 6/15/2022, variable rate thereafter), 7.125%, 12/15/2049 | | | 668,652 | |
| | 900,000 | | | General Electric Capital Corp., Series A, GMTN, 7.625%, 12/10/2014, (NZD) | | | 801,297 | |
| | 750,000 | | | General Electric Capital Corp., Series A, MTN, 4.875%, 3/04/2015 | | | 818,576 | |
| | 3,435,000 | | | Georgia-Pacific LLC, 7.250%, 6/01/2028 | | | 4,346,810 | |
| | 105,000 | | | Georgia-Pacific LLC, 7.375%, 12/01/2025 | | | 138,977 | |
| | 180,000 | | | Georgia-Pacific LLC, 7.750%, 11/15/2029 | | | 237,813 | |
| | 315,000 | | | Georgia-Pacific LLC, 8.875%, 5/15/2031 | | | 465,935 | |
| | 200,000 | | | Gerdau Holdings, Inc., 7.000%, 1/20/2020, 144A | | | 231,000 | |
| | 2,295,000 | | | Goldman Sachs Group, Inc. (The), 6.750%, 10/01/2037 | | | 2,458,592 | |
| | 50,000 | | | Goldman Sachs Group, Inc. (The), 6.875%, 1/18/2038, (GBP) | | | 82,576 | |
| | 3,045,000 | | | Goodyear Tire & Rubber Co. (The), 7.000%, 5/15/2022 | | | 3,227,700 | |
| | 165,000 | | | Goodyear Tire & Rubber Co. (The), 7.000%, 3/15/2028 | | | 165,412 | |
| | 410,000 | | | Hanover Insurance Group, Inc. (The), 6.375%, 6/15/2021 | | | 469,279 | |
| | 20,000 | | | HCA, Inc., 5.750%, 3/15/2014 | | | 21,000 | |
| | 90,000 | | | HCA, Inc., 6.375%, 1/15/2015 | | | 96,975 | |
| | 225,000 | | | HCA, Inc., 7.050%, 12/01/2027 | | | 212,625 | |
| | 245,000 | | | HCA, Inc., 7.190%, 11/15/2015 | | | 268,275 | |
| | 90,000 | | | HCA, Inc., 7.500%, 12/15/2023 | | | 90,900 | |
| | 250,000 | | | HCA, Inc., 7.500%, 11/06/2033 | | | 245,000 | |
| | 1,500,000 | | | HCA, Inc., 7.690%, 6/15/2025 | | | 1,522,500 | |
| | 395,000 | | | HCA, Inc., 8.360%, 4/15/2024 | | | 413,762 | |
| | 195,000 | | | HCA, Inc., MTN, 7.580%, 9/15/2025 | | | 195,975 | |
| | 75,000 | | | HCA, Inc., MTN, 7.750%, 7/15/2036 | | | 74,437 | |
| | 585,000 | | | Hercules, Inc., 6.500%, 6/30/2029 | | | 535,275 | |
| | 470,000 | | | Highwoods Properties, Inc., 5.850%, 3/15/2017 | | | 515,911 | |
| | 110,000 | | | Incitec Pivot Finance LLC, 6.000%, 12/10/2019, 144A | | | 121,899 | |
See accompanying notes to financial statements.
| 34
Portfolio of Investments – as of September 30, 2012
Loomis Sayles Global Equity and Income Fund – (continued)
| | | | | | | | |
Principal
Amount (‡) | | | Description | | Value (†) | |
| | | | United States — continued | | | | |
| $ | 80,000 | | | International Lease Finance Corp., 5.875%, 4/01/2019 | | $ | 84,823 | |
| | 1,620,000 | | | International Lease Finance Corp., 6.250%, 5/15/2019 | | | 1,741,500 | |
| | 1,670,000 | | | International Lease Finance Corp., Series R, MTN, 5.625%, 9/20/2013 | | | 1,722,187 | |
| | 70,000 | | | iStar Financial, Inc., 5.850%, 3/15/2017 | | | 66,500 | |
| | 405,000 | | | iStar Financial, Inc., 5.875%, 3/15/2016 | | | 390,825 | |
| | 145,000 | | | iStar Financial, Inc., 6.050%, 4/15/2015 | | | 142,100 | |
| | 1,235,000 | | | iStar Financial, Inc., 8.625%, 6/01/2013 | | | 1,272,050 | |
| | 35,000 | | | iStar Financial, Inc., Series B, 5.700%, 3/01/2014 | | | 35,044 | |
| | 950,000 | | | iStar Financial, Inc., Series B, 5.950%, 10/15/2013 | | | 950,000 | |
| | 5,000 | | | J.C. Penney Corp., Inc., 5.750%, 2/15/2018 | | | 4,750 | |
| | 64,000 | | | J.C. Penney Corp., Inc., 6.375%, 10/15/2036 | | | 52,240 | |
| | 15,000 | | | J.C. Penney Corp., Inc., 7.125%, 11/15/2023 | | | 14,288 | |
| | 10,000 | | | J.C. Penney Corp., Inc., 7.400%, 4/01/2037 | | | 8,963 | |
| | 5,000 | | | J.C. Penney Corp., Inc., 7.625%, 3/01/2097 | | | 4,263 | |
| | 370,000 | | | Jefferies Group, Inc., 3.875%, 11/09/2015 | | | 372,312 | |
| | 665,000 | | | Jefferies Group, Inc., 5.125%, 4/13/2018 | | | 674,975 | |
| | 1,030,000 | | | Jefferies Group, Inc., 6.250%, 1/15/2036 | | | 1,019,700 | |
| | 685,000 | | | Jefferies Group, Inc., 6.450%, 6/08/2027 | | | 702,125 | |
| | 1,410,000 | | | Jefferies Group, Inc., 6.875%, 4/15/2021 | | | 1,517,512 | |
| | 15,000 | | | K. Hovnanian Enterprises, Inc., 5.000%, 11/01/2021, 144A | | | 12,450 | |
| | 260,000 | | | K. Hovnanian Enterprises, Inc., 6.250%, 1/15/2016 | | | 240,500 | |
| | 1,665,000 | | | KB Home, 8.000%, 3/15/2020 | | | 1,843,987 | |
| | 190,000 | | | Ladder Capital Finance Holdings LLLP/Ladder Capital Finance Corp.,
7.375%, 10/01/2017, 144A | | | 193,800 | |
| | 15,000 | | | Lennar Corp., Series B, 5.500%, 9/01/2014 | | | 15,750 | |
| | 1,090,000 | | | Lennar Corp., Series B, 5.600%, 5/31/2015 | | | 1,160,850 | |
| | 55,000 | | | Lennar Corp., Series B, 6.500%, 4/15/2016 | | | 59,950 | |
| | 135,000 | | | Level 3 Financing, Inc., 7.000%, 6/01/2020, 144A | | | 136,350 | |
| | 1,435,000 | | | Level 3 Financing, Inc., 8.625%, 7/15/2020 | | | 1,549,800 | |
| | 30,000 | | | Level 3 Financing, Inc., 9.375%, 4/01/2019 | | | 33,300 | |
| | 165,000 | | | Masco Corp., 6.500%, 8/15/2032 | | | 170,863 | |
| | 865,000 | | | Masco Corp., 7.750%, 8/01/2029 | | | 913,803 | |
| | 600,000 | | | Merrill Lynch & Co., Inc., 6.050%, 5/16/2016 | | | 655,575 | |
| | 2,700,000 | | | Merrill Lynch & Co., Inc., 6.110%, 1/29/2037 | | | 2,864,346 | |
| | 310,000 | | | MGM Resorts International, 8.625%, 2/01/2019, 144A | | | 337,900 | |
| | 310,000 | | | Momentive Specialty Chemicals, Inc., 7.875%, 2/15/2023(f) | | | 241,800 | |
| | 410,000 | | | Momentive Specialty Chemicals, Inc., 8.375%, 4/15/2016(f) | | | 369,000 | |
| | 230,000 | | | Morgan Stanley, 5.375%, 11/14/2013, (GBP) | | | 381,762 | |
| | 2,500,000 | | | Morgan Stanley, 5.750%, 1/25/2021 | | | 2,744,127 | |
| | 500,000 | | | Morgan Stanley, GMTN, 7.625%, 3/03/2016, (AUD) | | | 549,429 | |
| | 600,000 | | | Morgan Stanley, MTN, 6.250%, 8/09/2026 | | | 675,095 | |
| | 100,000 | | | Morgan Stanley, Series F, MTN, 0.905%, 10/18/2016(e) | | | 92,937 | |
| | 1,382,000 | | | New Albertson’s, Inc., 7.450%, 8/01/2029 | | | 770,465 | |
| | 100,000 | | | New Albertson’s, Inc., 7.750%, 6/15/2026 | | | 61,250 | |
| | 3,450,000 | | | New Albertson’s, Inc., 8.000%, 5/01/2031 | | | 2,035,500 | |
| | 1,965,000 | | | New Albertson’s, Inc., 8.700%, 5/01/2030 | | | 1,166,719 | |
| | 155,000 | | | New Albertson’s, Inc., Series C, MTN, 6.625%, 6/01/2028 | | | 83,700 | |
See accompanying notes to financial statements.
35 |
Portfolio of Investments – as of September 30, 2012
Loomis Sayles Global Equity and Income Fund – (continued)
| | | | | | | | |
Principal
Amount (‡) | | | Description | | Value (†) | |
| | | | United States — continued | | | | |
| $ | 15,000 | | | News America, Inc., 6.400%, 12/15/2035 | | $ | 18,587 | |
| | 486,000 | | | Nextel Communications, Inc., Series D, 7.375%, 8/01/2015 | | | 487,822 | |
| | 250,000 | | | NGC Corp. Capital Trust I, Series B, 8.316%, 6/01/2027(f)(g) | | | 32,500 | |
| | 155,000 | | | NGPL PipeCo LLC, 7.768%, 12/15/2037, 144A | | | 155,000 | |
| | 2,475,000 | | | NGPL PipeCo LLC, 9.625%, 6/01/2019, 144A | | | 2,821,500 | |
| | 35,000 | | | Nortel Networks Capital Corp., 7.875%, 6/15/2026(g) | | | 37,188 | |
| | 565,000 | | | Owens Corning, Inc., 6.500%, 12/01/2016 | | | 634,448 | |
| | 535,000 | | | Owens Corning, Inc., 7.000%, 12/01/2036 | | | 587,039 | |
| | 40,000 | | | Owens-Illinois, Inc., 7.800%, 5/15/2018 | | | 46,100 | |
| | 47,000 | | | Pulte Group, Inc., 5.200%, 2/15/2015 | | | 49,820 | |
| | 540,000 | | | Pulte Group, Inc., 6.000%, 2/15/2035 | | | 488,700 | |
| | 785,000 | | | Pulte Group, Inc., 6.375%, 5/15/2033 | | | 730,050 | |
| | 220,000 | | | Pulte Group, Inc., 7.875%, 6/15/2032 | | | 228,800 | |
| | 1,335,000 | | | Qwest Capital Funding, Inc., 6.500%, 11/15/2018 | | | 1,525,163 | |
| | 650,000 | | | Qwest Capital Funding, Inc., 6.875%, 7/15/2028 | | | 685,884 | |
| | 400,000 | | | Qwest Capital Funding, Inc., 7.625%, 8/03/2021 | | | 441,508 | |
| | 60,000 | | | Qwest Capital Funding, Inc., 7.750%, 2/15/2031 | | | 65,152 | |
| | 560,000 | | | Qwest Corp., 6.875%, 9/15/2033 | | | 567,000 | |
| | 115,000 | | | Qwest Corp., 7.250%, 9/15/2025 | | | 140,845 | |
| | 1,155,000 | | | R.R. Donnelley & Sons Co., 8.250%, 3/15/2019 | | | 1,172,325 | |
| | 500,000 | | | Range Resources Corp., 5.000%, 8/15/2022 | | | 527,500 | |
| | 750,000 | | | Reliance Holdings USA, Inc., 5.400%, 2/14/2022, 144A | | | 798,889 | |
| | 403,000 | | | Residential Capital LLC, 9.625%, 5/15/2015(g) | | | 403,504 | |
| | 80,000 | | | Reynolds American, Inc., 6.750%, 6/15/2017 | | | 96,834 | |
| | 20,000 | | | Reynolds American, Inc., 7.250%, 6/15/2037 | | | 25,283 | |
| | 400,000 | | | Reynolds Group Issuer, Inc./Reynolds Group Issuer LLC/Reynolds Group Issuer (Luxembourg) S.A., 9.875%, 8/15/2019 | | | 425,500 | |
| | 655,000 | | | Rockies Express Pipeline LLC, 3.900%, 4/15/2015, 144A | | | 645,175 | |
| | 855,000 | | | Rockies Express Pipeline LLC, 6.875%, 4/15/2040, 144A | | | 748,125 | |
| | 1,600(†††††) | | | SLM Corp., 6.000%, 12/15/2043 | | | 37,985 | |
| | 120,000 | | | SLM Corp., MTN, 5.050%, 11/14/2014 | | | 126,661 | |
| | 1,130,000 | | | SLM Corp., MTN, 7.250%, 1/25/2022 | | | 1,265,600 | |
| | 10,000 | | | SLM Corp., Series A, MTN, 0.751%, 1/27/2014(e) | | | 9,711 | |
| | 228,000 | | | SLM Corp., Series A, MTN, 5.000%, 10/01/2013 | | | 236,265 | |
| | 10,000 | | | SLM Corp., Series A, MTN, 5.000%, 6/15/2018 | | | 10,016 | |
| | 115,000 | | | SLM Corp., Series A, MTN, 5.375%, 1/15/2013 | | | 116,457 | |
| | 65,000 | | | SLM Corp., Series A, MTN, 5.375%, 5/15/2014 | | | 68,463 | |
| | 2,560,000 | | | SLM Corp., Series A, MTN, 5.625%, 8/01/2033 | | | 2,416,640 | |
| | 625,000 | | | SLM Corp., Series A, MTN, 8.450%, 6/15/2018 | | | 732,011 | |
| | 400,000 | | | Springleaf Finance Corp., MTN, 5.750%, 9/15/2016 | | | 345,248 | |
| | 100,000 | | | Springleaf Finance Corp., Series H, MTN, 5.375%, 10/01/2012 | | | 100,000 | |
| | 300,000 | | | Springleaf Finance Corp., Series I, MTN, 5.400%, 12/01/2015 | | | 269,436 | |
| | 330,000 | | | Springleaf Finance Corp., Series I, MTN, 5.850%, 6/01/2013 | | | 328,350 | |
| | 595,000 | | | Springleaf Finance Corp., Series J, MTN, 6.900%, 12/15/2017 | | | 505,750 | |
| | 294,000 | | | Sprint Capital Corp., 6.875%, 11/15/2028 | | | 270,480 | |
| | 420,000 | | | Sprint Capital Corp., 6.900%, 5/01/2019 | | | 435,750 | |
| | 110,000 | | | Sprint Capital Corp., 8.750%, 3/15/2032 | | | 113,850 | |
See accompanying notes to financial statements.
| 36
Portfolio of Investments – as of September 30, 2012
Loomis Sayles Global Equity and Income Fund – (continued)
| | | | | | | | |
Principal
Amount (‡) | | | Description | | Value (†) | |
| | | | United States — continued | | | | |
| $ | 26,000 | | | Sprint Nextel Corp., 6.000%, 12/01/2016 | | $ | 26,780 | |
| | 1,360,000 | | | Tenet Healthcare Corp., 6.875%, 11/15/2031 | | | 1,217,200 | |
| | 250,000 | | | Textron, Inc., 3.875%, 3/11/2013, (EUR) | | | 322,837 | |
| | 820,000 | | | Textron, Inc., 5.950%, 9/21/2021 | | | 957,170 | |
| | 1,431,000 | | | Toys R Us, Inc., 7.375%, 10/15/2018 | | | 1,284,322 | |
| | 3,150,000 | | | TXU Corp., Series P, 5.550%, 11/15/2014 | | | 2,535,750 | |
| | 2,570,000 | | | TXU Corp., Series Q, 6.500%, 11/15/2024 | | | 1,529,150 | |
| | 30,000 | | | TXU Corp., Series R, 6.550%, 11/15/2034 | | | 16,350 | |
| | 7,795,000 | | | U.S. Treasury Note, 0.250%, 2/15/2015(d) | | | 7,790,128 | |
| | 9,200,000 | | | U.S. Treasury Note, 0.375%, 6/30/2013 | | | 9,213,653 | |
| | 1,100,000 | | | U.S. Treasury Note, 0.750%, 3/31/2013 | | | 1,103,266 | |
| | 12,500,000 | | | U.S. Treasury Note, 0.750%, 6/30/2017 | | | 12,594,725 | |
| | 356,741 | | | UAL Pass Through Trust, Series 2009-1, 10.400%, 5/01/2018 | | | 411,144 | |
| | 1,735,000 | | | United States Steel Corp., 6.650%, 6/01/2037 | | | 1,457,400 | |
| | 770,000 | | | United States Steel Corp., 7.500%, 3/15/2022 | | | 760,375 | |
| | 295,000 | | | UR Financing Escrow Corp., 7.625%, 4/15/2022, 144A | | | 323,025 | |
| | 140,000 | | | US Airways Pass Through Trust, Series 2012-1A, Class A, 5.900%, 4/01/2026 | | | 148,050 | |
| | 75,000 | | | US Airways Pass Through Trust, Series 2012-1B, Class B, 8.000%, 4/01/2021 | | | 77,250 | |
| | 50,000 | | | USG Corp., 6.300%, 11/15/2016 | | | 50,500 | |
| | 230,000 | | | USG Corp., 9.750%, 1/15/2018 | | | 248,400 | |
| | 110,000 | | | Valeant Pharmaceuticals International, 6.375%, 10/15/2020, 144A | | | 112,200 | |
| | 5,000 | | | Verizon Maryland, Inc., Series B, 5.125%, 6/15/2033 | | | 5,302 | |
| | 110,000 | | | Verizon Pennsylvania, Inc., 6.000%, 12/01/2028 | | | 119,582 | |
| | 415,000 | | | VPI Escrow Corp., 6.375%, 10/15/2020, 144A | | | 423,300 | |
| | 85,000 | | | Wells Fargo & Co., 4.625%, 11/02/2035, (GBP) | | | 149,345 | |
| | 100,000 | | | Wells Fargo & Co., Series F, EMTN, 4.875%, 11/29/2035, (GBP) | | | 159,206 | |
| | 60,000 | | | Weyerhaeuser Co., 6.950%, 10/01/2027 | | | 65,045 | |
| | 315,000 | | | Weyerhaeuser Co., 7.375%, 3/15/2032 | | | 373,790 | |
| | 125,000 | | | Xerox Corp., 6.750%, 2/01/2017 | | | 147,434 | |
| | 20,000 | | | Xerox Corp., MTN, 7.200%, 4/01/2016 | | | 23,264 | |
| | 250,000 | | | Zurich Finance USA, Inc., EMTN, (fixed rate to 6/15/2015, variable rate thereafter), 4.500%, 6/15/2025, (EUR) | | | 329,294 | |
| | | | | | | | |
| | | | | | | 143,946,629 | |
| | | | | | | | |
| | | | Uruguay — 0.2% | | | | |
| | 4,229,669 | | | Uruguay Government International Bond, 3.700%, 6/26/2037, (UYU) | | | 224,930 | |
| | 5,370,034 | | | Uruguay Government International Bond, 4.375%, 12/15/2028, (UYU) | | | 308,523 | |
| | 18,640,703 | | | Uruguay Government International Bond, 5.000%, 9/14/2018, (UYU) | | | 1,038,564 | |
| | | | | | | | |
| | | | | | | 1,572,017 | |
| | | | | | | | |
| | | | Venezuela — 0.1% | | | | |
| | 800,000 | | | Petroleos de Venezuela S.A., 5.375%, 4/12/2027 | | | 494,000 | |
| | | | | | | | |
| | | | Total Non-Convertible Bonds
(Identified Cost $223,391,690) | | | 238,497,857 | |
| | | | | | | | |
| | | | | | | | |
See accompanying notes to financial statements.
37 |
Portfolio of Investments – as of September 30, 2012
Loomis Sayles Global Equity and Income Fund – (continued)
| | | | | | | | |
Principal
Amount (‡) | | | Description | | Value (†) | |
| | Convertible Bonds — 0.7% | | | | |
| | | | United States — 0.7% | | | | |
| $ | 350,000 | | | ArvinMeritor, Inc., (Step to Zero Coupon on 2/15/2019), 4.000%, 2/15/2027(h) | | $ | 260,531 | |
| | 285,000 | | | Chesapeake Energy Corp., 2.500%, 5/15/2037 | | | 255,966 | |
| | 135,000 | | | Chesapeake Energy Corp., 2.750%, 11/15/2035 | | | 128,503 | |
| | 185,000 | | | Ciena Corp., 3.750%, 10/15/2018, 144A | | | 194,250 | |
| | 125,000 | | | Ford Motor Co., 4.250%, 11/15/2016 | | | 172,422 | |
| | 745,000 | | | Hologic, Inc., (accretes to principal after 12/15/2013), 2.000%, 12/15/2037(h) | | | 738,947 | |
| | 1,125,000 | | | Intel Corp., 3.250%, 8/01/2039 | | | 1,386,562 | |
| | 215,000 | | | Level 3 Communications, Inc., 7.000%, 3/15/2015, 144A(f) | | | 260,016 | |
| | 2,200,000 | | | Old Republic International Corp., 3.750%, 3/15/2018 | | | 2,189,000 | |
| | 375,000 | | | Omnicare, Inc., 3.750%, 12/15/2025 | | | 529,687 | |
| | 610,000 | | | Owens-Brockway Glass Container, Inc., 3.000%, 6/01/2015, 144A | | | 597,800 | |
| | 90,000 | | | Trinity Industries, Inc., 3.875%, 6/01/2036 | | | 92,981 | |
| | | | | | | | |
| | | | Total Convertible Bonds
(Identified Cost $6,215,725) | | | 6,806,665 | |
| | | | | | | | |
| | Municipals — 0.1% | | | | |
| | | | United States — 0.1% | | | | |
| | 415,000 | | | State of Illinois, 5.100%, 6/01/2033 | | | 402,201 | |
| | 135,000 | | | Virginia Tobacco Settlement Financing Corp., Series A-1,
6.706%, 6/01/2046(f) | | | 91,621 | |
| | | | | | | | |
| | | | Total Municipals
(Identified Cost $450,487) | | | 493,822 | |
| | | | | | | | |
| | | | Total Bonds and Notes
(Identified Cost $230,057,902) | | | 245,798,344 | |
| | | | | | | | |
| | Senior Loans — 0.6% | | | | |
| | | | United States — 0.6% | | | | |
| | 4,215,000 | | | Chesapeake Energy Corporation, Unsecured Term Loan, 8.500%, 12/01/2017(e) | | | 4,225,748 | |
| | 1,270,000 | | | Flying Fortress, Inc., 1st Lien Term Loan, 5.000%, 6/30/2017(e) | | | 1,284,288 | |
| | 46,909 | | | SuperMedia, Inc., Exit Term Loan, 11.000%, 12/31/2015(e) | | | 30,647 | |
| | | | | | | | |
| | | | Total Senior Loans
(Identified Cost $5,426,007) | | | 5,540,683 | |
| | | | | | | | |
| | | | | | | | |
| Shares | | | | | | |
| | Preferred Stocks — 0.4% | | | | |
| | Convertible Preferred Stocks — 0.3% | | | | |
| | | | United States — 0.3% | | | | |
| | 71,820 | | | General Motors Co., Series B, 4.750% | | | 2,677,449 | |
| | 820 | | | Lucent Technologies Capital Trust I, 7.750% | | | 475,600 | |
| | | | | | | | |
| | | | Total Convertible Preferred Stocks
(Identified Cost $3,969,958) | | | 3,153,049 | |
| | | | | | | | |
See accompanying notes to financial statements.
| 38
Portfolio of Investments – as of September 30, 2012
Loomis Sayles Global Equity and Income Fund – (continued)
| | | | | | | | |
| Shares | | | Description | | Value (†) | |
| | Non-Convertible Preferred Stock — 0.1% | | | | |
| | | | United States — 0.1% | | | | |
| | 682 | | | Ally Financial, Inc., Series G, 7.000% 144A
(Identified Cost $145,366) | | $ | 637,990 | |
| | | | | | | | |
| | | | Total Preferred Stocks
(Identified Cost $4,115,324) | | | 3,791,039 | |
| | | | | | | | |
| | | | | | | | |
Principal
Amount (‡) | | | | | | |
| | Short-Term Investments — 6.9% | | | | |
| $ | 18,478 | | | Repurchase Agreement with State Street Bank and Trust Company, dated 9/28/2012 at 0.010% to be repurchased at $18,478 on 10/01/2012 collateralized by $15,000 U.S. Treasury Bond, 5.250% due 2/15/2029 valued at $21,132 including accrued interest (Note 2 of Notes to Financial Statements) | | | 18,478 | |
| | 63,621,556 | | | Tri-Party Repurchase Agreement with Fixed Income Clearing Corporation, dated 9/28/2012 at 0.010% to be repurchased at $63,621,609 on 10/01/2012 collateralized by $20,955,000 Federal National Mortgage Association, 2.750% due 4/16/2019 valued at $22,002,750; $37,260,000 U.S. Treasury Bond, 3.500% due 2/15/2018 valued at $42,895,575 including accrued interest (Note 2 of Notes to Financial Statements) | | | 63,621,556 | |
| | | | | | | | |
| | | | Total Short-Term Investments
(Identified Cost $63,640,034) | | | 63,640,034 | |
| | | | | | | | |
| | | | | | | | |
| | | | Total Investments — 99.8% (Identified Cost $867,102,273)(a) | | | 925,924,165 | |
| | | | Other assets less liabilities — 0.2% | | | 1,753,964 | |
| | | | | | | | |
| | | | Net Assets — 100.0% | | $ | 927,678,129 | |
| | | | | | | | |
| | | | | | | | |
| | (‡) | | | Principal Amount stated in U.S. dollars unless otherwise noted. | |
| | (†) | | | See Note 2 of Notes to Financial Statements. | |
| | (††) | | | Security held in units. One unit represents a principal amount of 1,000. Amount shown represents principal amount including inflation adjustments. | |
| | (†††) | | | Amount shown represents units. One unit represents a principal amount of 1,000. | |
| | (††††) | | | Amount shown represents units. One unit represents a principal amount of 100. | |
| | (†††††) | | | Amount shown represents units. One unit represents a principal amount of 25. | |
| | (a) | | | Federal Tax Information: | |
| | | | At September 30, 2012, the net unrealized appreciation on investments based on a cost of $868,209,507 for federal income tax purposes was as follows: | |
| | | | Aggregate gross unrealized appreciation for all investments in which there is an excess of value over tax cost | | $ | 73,827,950 | |
| | | | Aggregate gross unrealized depreciation for all investments in which there is an excess of tax cost over value | | | (16,113,292 | ) |
| | | | | | | | |
| | | | Net unrealized appreciation | | $ | 57,714,658 | |
| | | | | | | | |
| | | | | | | | |
| | (b) | | | Non-income producing security. | |
| | (c) | | | Fair valued security by the Fund’s investment adviser. At September 30, 2012, the value of this security amounted to $8,154,764 or 0.9% of net assets. | |
See accompanying notes to financial statements.
39 |
Portfolio of Investments – as of September 30, 2012
Loomis Sayles Global Equity and Income Fund – (continued)
| | | | | | |
| | (d) | | | All or a portion of this security has been designated to cover the Fund’s obligations under open forward foreign currency contracts. |
| | (e) | | | Variable rate security. Rate as of September 30, 2012 is disclosed. |
| | (f) | | | Illiquid security. At September 30, 2012, the value of these securities amounted to $994,937 or 0.1% of net assets. |
| | (g) | | | The issuer is in default with respect to interest and/or principal payments. Income is not being accrued. |
| | (h) | | | Coupon rate is a fixed rate for an initial period then resets at a specified date and rate. |
| | | | | | |
| | 144A | | | All or a portion of these securities are exempt from registration under Rule 144A of the Securities Act of 1933. These securities may be resold in transactions exempt from registration, normally to qualified institutional buyers. At September 30, 2012, the value of Rule 144A holdings amounted to $58,970,275 or 6.4% of net assets. |
| ADR/
GDR |
| | An American Depositary Receipt or Global Depositary Receipt is a certificate issued by a custodian bank representing the right to receive securities of the foreign issuer described. The values of ADRs and GDRs may be significantly influenced by trading on exchanges not located in the United States. |
| | EMTN | | | Euro Medium Term Note |
| | GMTN | | | Global Medium Term Note |
| | MTN | | | Medium Term Note |
| | OJSC | | | Open Joint-Stock Company |
| | | | | | |
| | AUD | | | Australian Dollar |
| | BRL | | | Brazilian Real |
| | CAD | | | Canadian Dollar |
| | CHF | | | Swiss Franc |
| | CLP | | | Chilean Peso |
| | CNY | | | Chinese Renminbi |
| | COP | | | Colombian Peso |
| | EUR | | | Euro |
| | GBP | | | British Pound |
| | IDR | | | Indonesian Rupiah |
| | KRW | | | South Korean Won |
| | MXN | | | Mexican Peso |
| | MYR | | | Malaysian Ringgit |
| | NOK | | | Norwegian Krone |
| | NZD | | | New Zealand Dollar |
| | PHP | | | Philippine Peso |
| | PLN | | | Polish Zloty |
| | SEK | | | Swedish Krona |
| | SGD | | | Singapore Dollar |
| | TRY | | | Turkish Lira |
| | UYU | | | Uruguayan Peso |
See accompanying notes to financial statements.
| 40
Portfolio of Investments – as of September 30, 2012
Loomis Sayles Global Equity and Income Fund – (continued)
At September 30, 2012, the Fund had the following open forward foreign currency contracts:
| | | | | | | | | | | | | | | | | | |
Contract
to
Buy/Sell | | Delivery
Date | | | Currency | | Units | | | Notional
Value | | | Unrealized
Appreciation
(Depreciation) | |
| Sell1 | | | 12/19/2012 | | | Australian Dollar | | | 700,000 | | | $ | 721,327 | | | $ | 3,824 | |
| Buy1 | | | 11/06/2012 | | | Brazilian Real | | | 1,000,000 | | | | 491,058 | | | | 7,966 | |
| Buy1 | | | 11/13/2012 | | | Brazilian Real | | | 980,000 | | | | 480,874 | | | | (4,515 | ) |
| Buy1 | | | 12/21/2012 | | | Brazilian Real | | | 1,280,000 | | | | 624,985 | | | | 14,006 | |
| Buy2 | | | 12/21/2012 | | | Malaysian Ringgit | | | 1,250,000 | | | | 406,642 | | | | 375 | |
| Sell3 | | | 10/31/2012 | | | New Zealand Dollar | | | 3,165,000 | | | | 2,618,206 | | | | (139,853 | ) |
| Buy1 | | | 12/10/2012 | | | South Korean Won | | | 1,488,000,000 | | | | 1,334,356 | | | | 30,409 | |
| Buy3 | | | 12/10/2012 | | | South Korean Won | | | 780,000,000 | | | | 699,461 | | | | 15,671 | |
| | | | | | | | | | | | | | | | | | |
| Total | | | | | | | | | | | | | | | | $ | (72,117 | ) |
| | | | | | | | | | | | | | | | | | |
At September 30, 2012, the Fund had the following open forward cross currency contracts:
| | | | | | | | | | | | | | |
| Settlement Date | | Deliver/Units of Currency | | Receive4/Units of Currency | | | Unrealized
Appreciation
(Depreciation) | |
| 12/12/2012 | | Norwegian Krone | | 5,600,000 | | Euro | | | 759,435 | | | $ | 1,718 | |
| | | | | | | | | | | | | | |
1 Counterparty is Credit Suisse AG.
2 Counterparty is JP Morgan Chase Bank, N.A.
3 Counterparty is Barclays Bank PLC.
4 Counterparty is Deutsche Bank AG.
See accompanying notes to financial statements.
41 |
Portfolio of Investments – as of September 30, 2012
Loomis Sayles Global Equity and Income Fund – (continued)
Industry Summary at September 30, 2012 (Unaudited)
| | | | |
Treasuries | | | 7.4 | % |
Beverages | | | 4.5 | |
Energy Equipment & Services | | | 4.4 | |
Commercial Banks | | | 4.1 | |
Internet Software & Services | | | 3.9 | |
Pharmaceuticals | | | 3.5 | |
Banking | | | 3.4 | |
Machinery | | | 3.3 | |
Software | | | 3.1 | |
Wireless Telecommunication Services | | | 2.5 | |
Chemicals | | | 2.5 | |
Oil, Gas & Consumable Fuels | | | 2.3 | |
Diversified Telecommunication Services | | | 2.3 | |
Computers & Peripherals | | | 2.2 | |
Other Investments, less than 2% each | | | 43.5 | |
Short-Term Investments | | | 6.9 | |
| | | | |
Total Investments | | | 99.8 | |
Other assets less liabilities (including open forward foreign currency contracts) | | | 0.2 | |
| | | | |
Net Assets | | | 100.0 | % |
| | | | |
Currency Exposure Summary at September 30, 2012 (Unaudited)
| | | | |
United States Dollar | | | 68.1 | % |
British Pound | | | 9.0 | |
Euro | | | 5.9 | |
Brazilian Real | | | 4.1 | |
Swedish Krona | | | 2.5 | |
Mexican Peso | | | 2.0 | |
Other, less than 2% each | | | 8.2 | |
| | | | |
Total Investments | | | 99.8 | |
Other assets less liabilities (including open forward foreign currency contracts) | | | 0.2 | |
| | | | |
Net Assets | | | 100.0 | % |
| | | | |
See accompanying notes to financial statements.
| 42
Portfolio of Investments – as of September 30, 2012
Loomis Sayles Growth Fund
| | | | | | | | |
| Shares | | | Description | | Value (†) | |
| | Common Stocks — 98.5% of Net Assets | | | | |
| | | | Air Freight & Logistics — 6.0% | | | | |
| | 106,667 | | | Expeditors International of Washington, Inc. | | $ | 3,878,412 | |
| | 70,539 | | | United Parcel Service, Inc., Class B | | | 5,048,476 | |
| | | | | | | | |
| | | | | | | 8,926,888 | |
| | | | | | | | |
| | | | Beverages — 4.8% | | | | |
| | 97,769 | | | Coca-Cola Co. (The) | | | 3,708,378 | |
| | 5,480 | | | Diageo PLC, Sponsored ADR | | | 617,761 | |
| | 62,543 | | | SABMiller PLC, Sponsored ADR | | | 2,751,892 | |
| | | | | | | | |
| | | | | | | 7,078,031 | |
| | | | | | | | |
| | | | Biotechnology — 2.4% | | | | |
| | 41,610 | | | Amgen, Inc. | | | 3,508,555 | |
| | | | | | | | |
| | | | Capital Markets — 9.3% | | | | |
| | 17,500 | | | Franklin Resources, Inc. | | | 2,188,725 | |
| | 59,311 | | | Greenhill & Co., Inc. | | | 3,069,344 | |
| | 85,737 | | | Legg Mason, Inc. | | | 2,115,989 | |
| | 302,165 | | | SEI Investments Co. | | | 6,481,440 | |
| | | | | | | | |
| | | | | | | 13,855,498 | |
| | | | | | | | |
| | | | Communications Equipment — 10.1% | | | | |
| | 408,490 | | | Cisco Systems, Inc. | | | 7,798,074 | |
| | 115,213 | | | QUALCOMM, Inc. | | | 7,199,660 | |
| | | | | | | | |
| | | | | | | 14,997,734 | |
| | | | | | | | |
| | | | Consumer Finance — 3.5% | | | | |
| | 90,356 | | | American Express Co. | | | 5,137,642 | |
| | | | | | | | |
| | | | Energy Equipment & Services — 3.4% | | | | |
| | 71,023 | | | Schlumberger Ltd. | | | 5,137,094 | |
| | | | | | | | |
| | | | Food Products — 3.7% | | | | |
| | 445,322 | | | Danone S.A., Sponsored ADR | | | 5,455,194 | |
| | | | | | | | |
| | | | Health Care Equipment & Supplies — 5.6% | | | | |
| | 52,110 | | | Medtronic, Inc. | | | 2,246,983 | |
| | 91,013 | | | Zimmer Holdings, Inc. | | | 6,154,299 | |
| | | | | | | | |
| | | | | | | 8,401,282 | |
| | | | | | | | |
| | | | Household Products — 3.9% | | | | |
| | 28,511 | | | Clorox Co. (The) | | | 2,054,218 | |
| | 54,548 | | | Procter & Gamble Co. (The) | | | 3,783,449 | |
| | | | | | | | |
| | | | | | | 5,837,667 | |
| | | | | | | | |
| | | | Internet & Catalog Retail — 7.2% | | | | |
| | 35,473 | | | Amazon.com, Inc.(b) | | | 9,021,493 | |
| | 44,146 | | | Blue Nile, Inc.(b) | | | 1,637,375 | |
| | | | | | | | |
| | | | | | | 10,658,868 | |
| | | | | | | | |
See accompanying notes to financial statements.
43 |
Portfolio of Investments – as of September 30, 2012
Loomis Sayles Growth Fund – (continued)
| | | | | | | | |
| Shares | | | Description | | Value (†) | |
| | | | Internet Software & Services — 8.0% | | | | |
| | 97,117 | | | Facebook, Inc., Class A(b) | | $ | 2,102,583 | |
| | 13,061 | | | Google, Inc., Class A(b) | | | 9,854,525 | |
| | | | | | | | |
| | | | | | | 11,957,108 | |
| | | | | | | | |
| | | | IT Services — 6.4% | | | | |
| | 38,805 | | | Automatic Data Processing, Inc. | | | 2,276,301 | |
| | 53,981 | | | Visa, Inc., Class A | | | 7,248,569 | |
| | | | | | | | |
| | | | | | | 9,524,870 | |
| | | | | | | | |
| | | | Pharmaceuticals — 5.2% | | | | |
| | 62,563 | | | Merck & Co., Inc. | | | 2,821,591 | |
| | 79,861 | | | Novartis AG, ADR | | | 4,892,285 | |
| | | | | | | | |
| | | | | | | 7,713,876 | |
| | | | | | | | |
| | | | Semiconductors & Semiconductor Equipment — 3.1% | | | | |
| | 15,547 | | | Altera Corp. | | | 528,365 | |
| | 18,607 | | | Analog Devices, Inc. | | | 729,208 | |
| | 119,814 | | | ARM Holdings PLC, Sponsored ADR | | | 3,352,396 | |
| | | | | | | | |
| | | | | | | 4,609,969 | |
| | | | | | | | |
| | | | Software — 12.2% | | | | |
| | 108,317 | | | Autodesk, Inc.(b) | | | 3,614,538 | |
| | 36,372 | | | FactSet Research Systems, Inc. | | | 3,506,988 | |
| | 124,616 | | | Microsoft Corp. | | | 3,711,065 | |
| | 233,161 | | | Oracle Corp. | | | 7,342,240 | |
| | | | | | | | |
| | | | | | | 18,174,831 | |
| | | | | | | | |
| | | | Specialty Retail — 3.7% | | | | |
| | 51,471 | | | Home Depot, Inc. (The) | | | 3,107,304 | |
| | 78,947 | | | Lowe’s Cos., Inc. | | | 2,387,358 | |
| | | | | | | | |
| | | | | | | 5,494,662 | |
| | | | | | | | |
| | | | Total Common Stocks (Identified Cost $120,003,719) | | | 146,469,769 | |
| | | | | | | | |
Principal
Amount | | | | | | |
| | Short-Term Investments — 1.4% | | | | |
| $ | 2,143,051 | | | Tri-Party Repurchase Agreement with Fixed Income Clearing Corporation, dated 9/28/2012 at 0.010% to be repurchased at $2,143,053 on 10/01/2012 collateralized by $2,185,000 Federal Home Loan Bank, 0.350% due 7/17/2013 valued at $2,187,731 including accrued interest (Note 2 of Notes to Financial Statements) (Identified Cost $2,143,051) | | | 2,143,051 | |
| | | | | | | | |
| | | | Total Investments — 99.9% (Identified Cost $122,146,770)(a) | | | 148,612,820 | |
| | | | Other assets less liabilities — 0.1% | | | 135,476 | |
| | | | | | | | |
| | | | Net Assets — 100.0% | | $ | 148,748,296 | |
| | | | | | | | |
| | (†) | | | See Note 2 of Notes to Financial Statements | | | . | |
See accompanying notes to financial statements.
| 44
Portfolio of Investments – as of September 30, 2012
Loomis Sayles Growth Fund – (continued)
| | | | | | | | |
| | (a) | | | Federal Tax Information: | | | | |
| | | | At September 30, 2012, the net unrealized appreciation on investments based on a cost of $122,920,664 for federal income tax purposes was as follows: | | | | |
| | | | Aggregate gross unrealized appreciation for all investments in which there is an excess of value over tax cost | | $ | 28,699,585 | |
| | | | Aggregate gross unrealized depreciation for all investments in which there is an excess of tax cost over value | | | (3,007,429 | ) |
| | | | | | | | |
| | | | Net unrealized appreciation | | $ | 25,692,156 | |
| | | | | | | | |
| | (b) | | | Non-income producing security. | | | | |
| | | | | |
| | ADR | | | An American Depositary Receipt is a certificate issued by a custodian bank representing the right to receive securities of the foreign issuer described. The values of ADRs may be significantly influenced by trading on exchanges not located in the United States. | | | | |
Industry Summary at September 30, 2012 (Unaudited)
| | | | |
Software | | | 12.2 | % |
Communications Equipment | | | 10.1 | |
Capital Markets | | | 9.3 | |
Internet Software & Services | | | 8.0 | |
Internet & Catalog Retail | | | 7.2 | |
IT Services | | | 6.4 | |
Air Freight & Logistics | | | 6.0 | |
Health Care Equipment & Supplies | | | 5.6 | |
Pharmaceuticals | | | 5.2 | |
Beverages | | | 4.8 | |
Household Products | | | 3.9 | |
Specialty Retail | | | 3.7 | |
Food Products | | | 3.7 | |
Consumer Finance | | | 3.5 | |
Energy Equipment & Services | | | 3.4 | |
Semiconductors & Semiconductor Equipment | | | 3.1 | |
Biotechnology | | | 2.4 | |
Short-Term Investments | | | 1.4 | |
| | | | |
Total Investments | | | 99.9 | |
Other assets less liabilities | | | 0.1 | |
| | | | |
Net Assets | | | 100.0 | % |
| | | | |
See accompanying notes to financial statements.
45 |
Portfolio of Investments – as of September 30, 2012
Loomis Sayles Mid Cap Growth Fund
| | | | | | | | |
| Shares | | | Description | | Value (†) | |
| | Common Stocks — 97.1% of Net Assets | | | | |
| | | | Aerospace & Defense — 2.2% | | | | |
| | 16,272 | | | TransDigm Group, Inc.(b) | | $ | 2,308,509 | |
| | | | | | | | |
| | | | Auto Components — 1.4% | | | | |
| | 20,939 | | | BorgWarner, Inc.(b) | | | 1,447,094 | |
| | | | | | | | |
| | | | Biotechnology — 12.8% | | | | |
| | 35,336 | | | Alexion Pharmaceuticals, Inc.(b) | | | 4,042,438 | |
| | 68,267 | | | ARIAD Pharmaceuticals, Inc.(b) | | | 1,653,768 | |
| | 45,260 | | | Medivation, Inc.(b) | | | 2,550,854 | |
| | 13,710 | | | Onyx Pharmaceuticals, Inc.(b) | | | 1,158,495 | |
| | 12,043 | | | Regeneron Pharmaceuticals, Inc.(b) | | | 1,838,484 | |
| | 14,317 | | | Synageva BioPharma Corp.(b) | | | 764,957 | |
| | 19,829 | | | Vertex Pharmaceuticals, Inc.(b) | | | 1,109,433 | |
| | | | | | | | |
| | | | | | | 13,118,429 | |
| | | | | | | | |
| | | | Capital Markets — 3.3% | | | | |
| | 14,765 | | | Affiliated Managers Group, Inc.(b) | | | 1,816,095 | |
| | 24,259 | | | T. Rowe Price Group, Inc. | | | 1,535,595 | |
| | | | | | | | |
| | | | | | | 3,351,690 | |
| | | | | | | | |
| | | | Chemicals — 6.3% | | | | |
| | 9,943 | | | CF Industries Holdings, Inc. | | | 2,209,732 | |
| | 36,400 | | | Eastman Chemical Co. | | | 2,075,164 | |
| | 29,489 | | | Westlake Chemical Corp. | | | 2,154,467 | |
| | | | | | | | |
| | | | | | | 6,439,363 | |
| | | | | | | | |
| | | | Commercial Services & Supplies — 1.4% | | | | |
| | 16,342 | | | Stericycle, Inc.(b) | | | 1,479,278 | |
| | | | | | | | |
| | | | Communications Equipment — 4.0% | | | | |
| | 14,757 | | | F5 Networks, Inc.(b) | | | 1,545,058 | |
| | 14,513 | | | Palo Alto Networks, Inc.(b) | | | 893,566 | |
| | 70,157 | | | Riverbed Technology, Inc.(b) | | | 1,632,553 | |
| | | | | | | | |
| | | | | | | 4,071,177 | |
| | | | | | | | |
| | | | Electronic Equipment, Instruments & Components — 0.8% | | | | |
| | 72,653 | | | InvenSense, Inc.(b) | | | 868,203 | |
| | | | | | | | |
| | | | Energy Equipment & Services — 2.0% | | | | |
| | 36,989 | | | Oceaneering International, Inc. | | | 2,043,642 | |
| | | | | | | | |
| | | | Food & Staples Retailing — 2.1% | | | | |
| | 22,656 | | | Whole Foods Market, Inc. | | | 2,206,694 | |
| | | | | | | | |
| | | | Food Products — 1.5% | | | | |
| | 25,416 | | | McCormick & Co., Inc. | | | 1,576,809 | |
| | | | | | | | |
| | | | Health Care Equipment & Supplies — 1.1% | | | | |
| | 10,126 | | | Edwards Lifesciences Corp.(b) | | | 1,087,229 | |
| | | | | | | | |
| | | | Health Care Providers & Services — 1.9% | | | | |
| | 20,400 | | | Catamaran Corp.(b) | | | 1,998,588 | |
| | | | | | | | |
| | | | Health Care Technology — 1.6% | | | | |
| | 17,987 | | | athenahealth, Inc.(b) | | | 1,650,667 | |
| | | | | | | | |
See accompanying notes to financial statements.
| 46
Portfolio of Investments – as of September 30, 2012
Loomis Sayles Mid Cap Growth Fund – (continued)
| | | | | | | | |
| Shares | | | Description | | Value (†) | |
| | | | Household Durables — 7.5% | | | | |
| | 98,961 | | | D.R. Horton, Inc. | | $ | 2,042,555 | |
| | 66,786 | | | Lennar Corp., Class A | | | 2,322,149 | |
| | 117,304 | | | Pulte Group, Inc.(b) | | | 1,818,212 | |
| | 44,816 | | | Toll Brothers, Inc.(b) | | | 1,489,236 | |
| | | | | | | | |
| | | | | | | 7,672,152 | |
| | | | | | | | |
| | | | Internet Software & Services — 4.0% | | | | |
| | 10,931 | | | Equinix, Inc.(b) | | | 2,252,333 | |
| | 15,181 | | | LinkedIn Corp., Class A(b) | | | 1,827,792 | |
| | | | | | | | |
| | | | | | | 4,080,125 | |
| | | | | | | | |
| | | | IT Services — 1.6% | | | | |
| | 21,221 | | | Teradata Corp.(b) | | | 1,600,276 | |
| | | | | | | | |
| | | | Machinery — 2.9% | | | | |
| | 34,558 | | | Ingersoll-Rand PLC | | | 1,548,890 | |
| | 25,990 | | | Joy Global, Inc. | | | 1,456,999 | |
| | | | | | | | |
| | | | | | | 3,005,889 | |
| | | | | | | | |
| | | | Oil, Gas & Consumable Fuels — 6.9% | | | | |
| | 33,587 | | | Approach Resources, Inc.(b) | | | 1,011,976 | |
| | 46,828 | | | Cabot Oil & Gas Corp. | | | 2,102,577 | |
| | 17,916 | | | Concho Resources, Inc.(b) | | | 1,697,541 | |
| | 35,786 | | | Gulfport Energy Corp.(b) | | | 1,118,671 | |
| | 24,022 | | | Rosetta Resources, Inc.(b) | | | 1,150,654 | |
| | | | | | | | |
| | | | | | | 7,081,419 | |
| | | | | | | | |
| | | | Real Estate Management & Development — 2.5% | | | | |
| | 84,794 | | | CBRE Group, Inc., Class A(b) | | | 1,561,057 | |
| | 23,321 | | | Zillow, Inc., Class A(b) | | | 983,680 | |
| | | | | | | | |
| | | | | | | 2,544,737 | |
| | | | | | | | |
| | | | REITs - Apartments — 1.5% | | | | |
| | 10,233 | | | Essex Property Trust, Inc. | | | 1,516,940 | |
| | | | | | | | |
| | | | Road & Rail — 2.0% | | | | |
| | 27,789 | | | Kansas City Southern | | | 2,105,850 | |
| | | | | | | | |
| | | | Semiconductors & Semiconductor Equipment — 2.9% | | | | |
| | 9,516 | | | Mellanox Technologies Ltd.(b) | | | 966,160 | |
| | 80,147 | | | NXP Semiconductors NV(b) | | | 2,004,476 | |
| | | | | | | | |
| | | | | | | 2,970,636 | |
| | | | | | | | |
| | | | Software — 7.1% | | | | |
| | 47,408 | | | Fortinet, Inc.(b) | | | 1,144,429 | |
| | 22,203 | | | NetSuite, Inc.(b) | | | 1,416,551 | |
| | 36,455 | | | SolarWinds, Inc.(b) | | | 2,032,002 | |
| | 33,411 | | | Sourcefire, Inc.(b) | | | 1,638,141 | |
| | 10,647 | | | Ultimate Software Group, Inc.(The)(b) | | | 1,087,059 | |
| | | | | | | | |
| | | | | | | 7,318,182 | |
| | | | | | | | |
See accompanying notes to financial statements.
47 |
Portfolio of Investments – as of September 30, 2012
Loomis Sayles Mid Cap Growth Fund – (continued)
| | | | | | | | |
| Shares | | | Description | | Value (†) | |
| | | | Specialty Retail — 7.0% | | | | |
| | 23,307 | | | PetSmart, Inc. | | $ | 1,607,717 | |
| | 24,090 | | | Ross Stores, Inc. | | | 1,556,214 | |
| | 18,034 | | | Tractor Supply Co. | | | 1,783,382 | |
| | 23,808 | | | Ulta Salon, Cosmetics & Fragrance, Inc. | | | 2,292,829 | |
| | | | | | | | |
| | | | | | | 7,240,142 | |
| | | | | | | | |
| | | | Textiles, Apparel & Luxury Goods — 5.2% | | | | |
| | 35,633 | | | Michael Kors Holdings Ltd.(b) | | | 1,894,963 | |
| | 34,052 | | | Under Armour, Inc., Class A(b) | | | 1,901,123 | |
| | 9,878 | | | VF Corp. | | | 1,574,158 | |
| | | | | | | | |
| | | | | | | 5,370,244 | |
| | | | | | | | |
| | | | Trading Companies & Distributors — 1.3% | | | | |
| | 41,825 | | | United Rentals, Inc.(b) | | | 1,368,096 | |
| | | | | | | | |
| | | | Wireless Telecommunication Services — 2.3% | | | | |
| | 37,961 | | | SBA Communications Corp., Class A(b) | | | 2,387,747 | |
| | | | | | | | |
| | | | Total Common Stocks
(Identified Cost $85,126,020) | | | 99,909,807 | |
| | | | | | | | |
| | | | | | | | |
Principal
Amount | | | | | | |
| | Short-Term Investments — 2.5% | | | | |
| $ | 2,544,137 | | | Tri-Party Repurchase Agreement with Fixed Income Clearing Corporation, dated 9/28/2012 at 0.010% to be repurchased at $2,544,139 on 10/01/2012 collateralized by $2,535,000 U.S. Treasury Note, 1.000% due 3/31/2017 valued at $2,600,018, including accrued interest (Note 2 of Notes to Financial Statements) (Identified Cost $2,544,137) | | | 2,544,137 | |
| | | | | | | | |
| | | | | | | | |
| | | | Total Investments — 99.6%
(Identified Cost $87,670,157)(a) | | | 102,453,944 | |
| | | | Other assets less liabilities — 0.4% | | | 362,529 | |
| | | | | | | | |
| | | | Net Assets — 100.0% | | $ | 102,816,473 | |
| | | | | | | | |
| | (†) | | | See Note 2 of Notes to Financial Statements. | | | | |
| | (a) | | | Federal Tax Information: | | | | |
| | | | At September 30, 2012, the net unrealized appreciation on investments based on a cost of $87,684,586 for federal income tax purposes was as follows: | | | | |
| | | | Aggregate gross unrealized appreciation for all investments in which there is an excess of value over tax cost | | $ | 15,945,064 | |
| | | | Aggregate gross unrealized depreciation for all investments in which there is an excess of tax cost over value | | | (1,175,706 | ) |
| | | | | | | | |
| | | | Net unrealized appreciation | | $ | 14,769,358 | |
| | | | | | | | |
| | (b) | | | Non-income producing security. | | | | |
| | | | | | | | |
| | REITs | | | Real Estate Investment Trusts | | | | |
See accompanying notes to financial statements.
| 48
Portfolio of Investments – as of September 30, 2012
Loomis Sayles Mid Cap Growth Fund – (continued)
Industry Summary at September 30, 2012 (Unaudited)
| | | | |
Biotechnology | | | 12.8 | % |
Household Durables | | | 7.5 | |
Software | | | 7.1 | |
Specialty Retail | | | 7.0 | |
Oil, Gas & Consumable Fuels | | | 6.9 | |
Chemicals | | | 6.3 | |
Textiles, Apparel & Luxury Goods | | | 5.2 | |
Internet Software & Services | | | 4.0 | |
Communications Equipment | | | 4.0 | |
Capital Markets | | | 3.3 | |
Machinery | | | 2.9 | |
Semiconductors & Semiconductor Equipment | | | 2.9 | |
Real Estate Management & Development | | | 2.5 | |
Wireless Telecommunication Services | | | 2.3 | |
Aerospace & Defense | | | 2.2 | |
Food & Staples Retailing | | | 2.1 | |
Road & Rail | | | 2.0 | |
Energy Equipment & Services | | | 2.0 | |
Other Investments, less than 2% each | | | 14.1 | |
Short-Term Investments | | | 2.5 | |
| | | | |
Total Investments | | | 99.6 | |
Other assets less liabilities | | | 0.4 | |
| | | | |
Net Assets | | | 100.0 | % |
| | | | |
See accompanying notes to financial statements.
49 |
Portfolio of Investments – as of September 30, 2012
Loomis Sayles Value Fund
| | | | | | | | |
| Shares | | | Description | | Value (†) | |
| | Common Stocks — 98.0% of Net Assets | | | | |
| | | | Aerospace & Defense — 2.8% | | | | |
| | 300,794 | | | Honeywell International, Inc. | | $ | 17,972,442 | |
| | 309,245 | | | Northrop Grumman Corp. | | | 20,543,145 | |
| | | | | | | | |
| | | | | | | 38,515,587 | |
| | | | | | | | |
| | | | Auto Components — 0.6% | | | | |
| | 678,305 | | | Goodyear Tire & Rubber Co. (The)(b) | | | 8,268,538 | |
| | | | | | | | |
| | | | Automobiles — 0.9% | | | | |
| | 540,724 | | | General Motors Co.(b) | | | 12,301,471 | |
| | | | | | | | |
| | | | Beverages — 3.2% | | | | |
| | 685,839 | | | Coca-Cola Enterprises, Inc. | | | 21,446,186 | |
| | 320,416 | | | PepsiCo, Inc. | | | 22,675,840 | |
| | | | | | | | |
| | | | | | | 44,122,026 | |
| | | | | | | | |
| | | | Capital Markets — 3.8% | | | | |
| | 346,478 | | | Ameriprise Financial, Inc. | | | 19,641,838 | |
| | 481,484 | | | Legg Mason, Inc. | | | 11,883,025 | |
| | 486,795 | | | State Street Corp. | | | 20,425,918 | |
| | | | | | | | |
| | | | | | | 51,950,781 | |
| | | | | | | | |
| | | | Chemicals — 0.9% | | | | |
| | 148,772 | | | Air Products & Chemicals, Inc. | | | 12,303,444 | |
| | | | | | | | |
| | | | Commercial Banks — 6.4% | | | | |
| | 1,342,365 | | | Fifth Third Bancorp | | | 20,820,081 | |
| | 359,807 | | | PNC Financial Services Group, Inc. | | | 22,703,822 | |
| | 449,826 | | | U.S. Bancorp | | | 15,429,032 | |
| | 862,365 | | | Wells Fargo & Co. | | | 29,777,463 | |
| | | | | | | | |
| | | | | | | 88,730,398 | |
| | | | | | | | |
| | | | Communications Equipment — 2.3% | | | | |
| | 748,689 | | | Cisco Systems, Inc. | | | 14,292,473 | |
| | 358,450 | | | Motorola Solutions, Inc. | | | 18,119,648 | |
| | | | | | | | |
| | | | | | | 32,412,121 | |
| | | | | | | | |
| | | | Computers & Peripherals — 1.1% | | | | |
| | 21,997 | | | Apple, Inc. | | | 14,677,718 | |
| | | | | | | | |
| | | | Construction Materials — 0.8% | | | | |
| | 242,754 | | | Vulcan Materials Co. | | | 11,482,264 | |
| | | | | | | | |
| | | | Consumer Finance — 1.5% | | | | |
| | 539,213 | | | Discover Financial Services | | | 21,422,932 | |
| | | | | | | | |
| | | | Diversified Financial Services — 5.0% | | | | |
| | 1,480,833 | | | Bank of America Corp. | | | 13,075,755 | |
| | 649,585 | | | Citigroup, Inc. | | | 21,254,421 | |
| | 859,335 | | | JPMorgan Chase & Co. | | | 34,785,881 | |
| | | | | | | | |
| | | | | | | 69,116,057 | |
| | | | | | | | |
See accompanying notes to financial statements.
| 50
Portfolio of Investments – as of September 30, 2012
Loomis Sayles Value Fund – (continued)
| | | | | | | | |
| Shares | | | Description | | Value (†) | |
| | | | Diversified Telecommunication Services — 3.2% | | | | |
| | 705,798 | | | AT&T, Inc. | | $ | 26,608,585 | |
| | 429,908 | | | CenturyLink, Inc. | | | 17,368,283 | |
| | | | | | | | |
| | | | | | | 43,976,868 | |
| | | | | | | | |
| | | | Electric Utilities — 2.7% | | | | |
| | 462,730 | | | Edison International | | | 21,142,134 | |
| | 379,468 | | | FirstEnergy Corp. | | | 16,734,539 | |
| | | | | | | | |
| | | | | | | 37,876,673 | |
| | | | | | | | |
| | | | Energy Equipment & Services — 2.5% | | | | |
| | 269,705 | | | Schlumberger Ltd. | | | 19,507,763 | |
| | 340,318 | | | Transocean Ltd. | | | 15,276,875 | |
| | | | | | | | |
| | | | | | | 34,784,638 | |
| | | | | | | | |
| | | | Food & Staples Retailing — 1.2% | | | | |
| | 340,316 | | | CVS Caremark Corp. | | | 16,478,101 | |
| | | | | | | | |
| | | | Food Products — 1.3% | | | | |
| | 488,763 | | | Unilever NV | | | 17,341,311 | |
| | | | | | | | |
| | | | Health Care Equipment & Supplies — 2.6% | | | | |
| | 295,591 | | | Baxter International, Inc. | | | 17,812,313 | |
| | 315,540 | | | Covidien PLC | | | 18,749,387 | |
| | | | | | | | |
| | | | | | | 36,561,700 | |
| | | | | | | | |
| | | | Health Care Providers & Services — 2.7% | | | | |
| | 398,961 | | | HCA Holdings, Inc. | | | 13,265,453 | |
| | 425,192 | | | UnitedHealth Group, Inc. | | | 23,559,889 | |
| | | | | | | | |
| | | | | | | 36,825,342 | |
| | | | | | | | |
| | | | Household Products — 1.2% | | | | |
| | 230,427 | | | Procter & Gamble Co. (The) | | | 15,982,417 | |
| | | | | | | | |
| | | | Independent Power Producers & Energy Traders — 1.7% | | | | |
| | 810,082 | | | Calpine Corp.(b) | | | 14,014,419 | |
| | 455,388 | | | NRG Energy, Inc. | | | 9,740,749 | |
| | | | | | | | |
| | | | | | | 23,755,168 | |
| | | | | | | | |
| | | | Industrial Conglomerates — 2.0% | | | | |
| | 1,232,039 | | | General Electric Co. | | | 27,979,606 | |
| | | | | | | | |
| | | | Insurance — 4.0% | | | | |
| | 624,012 | | | MetLife, Inc. | | | 21,503,453 | |
| | 248,237 | | | Travelers Cos., Inc. (The) | | | 16,944,658 | |
| | 847,628 | | | Unum Group | | | 16,291,410 | |
| | | | | | | | |
| | | | | | | 54,739,521 | |
| | | | | | | | |
| | | | Internet & Catalog Retail — 1.2% | | | | |
| | 888,819 | | | Liberty Interactive Corp., Class A(b) | | | 16,443,152 | |
| | | | | | | | |
| | | | Internet Software & Services — 2.9% | | | | |
| | 367,943 | | | AOL, Inc.(b) | | | 12,962,632 | |
| | 323,642 | | | eBay, Inc.(b) | | | 15,667,509 | |
| | 14,337 | | | Google, Inc., Class A(b) | | | 10,817,267 | |
| | | | | | | | |
| | | | | | | 39,447,408 | |
| | | | | | | | |
See accompanying notes to financial statements.
51 |
Portfolio of Investments – as of September 30, 2012
Loomis Sayles Value Fund – (continued)
| | | | | | | | |
| Shares | | | Description | | Value (†) | |
| | | | Machinery — 3.7% | | | | |
| | 281,562 | | | Dover Corp. | | $ | 16,750,123 | |
| | 343,012 | | | Eaton Corp. | | | 16,210,747 | |
| | 236,294 | | | Stanley Black & Decker, Inc. | | | 18,017,418 | |
| | | | | | | | |
| | | | | | | 50,978,288 | |
| | | | | | | | |
| | | | Media — 5.7% | | | | |
| | 331,932 | | | CBS Corp., Class B | | | 12,059,089 | |
| | 692,732 | | | Comcast Corp., Class A | | | 24,779,024 | |
| | 186,781 | | | DIRECTV(b) | | | 9,798,531 | |
| | 297,930 | | | Omnicom Group, Inc. | | | 15,361,271 | |
| | 320,929 | | | Viacom, Inc., Class B | | | 17,198,585 | |
| | | | | | | | |
| | | | | | | 79,196,500 | |
| | | | | | | | |
| | | | Multiline Retail — 1.2% | | | | |
| | 266,107 | | | Target Corp. | | | 16,889,811 | |
| | | | | | | | |
| | | | Oil, Gas & Consumable Fuels — 11.0% | | | | |
| | 251,039 | | | Chevron Corp. | | | 29,261,106 | |
| | 240,348 | | | CONSOL Energy, Inc. | | | 7,222,457 | |
| | 148,981 | | | EOG Resources, Inc. | | | 16,693,321 | |
| | 493,798 | | | ExxonMobil Corp. | | | 45,157,827 | |
| | 408,664 | | | Hess Corp. | | | 21,953,430 | |
| | 238,984 | | | Noble Energy, Inc. | | | 22,156,207 | |
| | 172,016 | | | SM Energy Co. | | | 9,307,786 | |
| | | | | | | | |
| | | | | | | 151,752,134 | |
| | | | | | | | |
| | | | Pharmaceuticals — 8.1% | | | | |
| | 423,637 | | | Bristol-Myers Squibb Co. | | | 14,297,749 | |
| | 442,716 | | | Forest Laboratories, Inc.(b) | | | 15,765,117 | |
| | 727,418 | | | Merck & Co., Inc. | | | 32,806,552 | |
| | 1,108,625 | | | Pfizer, Inc. | | | 27,549,331 | |
| | 499,760 | | | Sanofi, ADR | | | 21,519,665 | |
| | | | | | | | |
| | | | | | | 111,938,414 | |
| | | | | | | | |
| | | | REITs - Diversified — 1.3% | | | | |
| | 710,332 | | | Weyerhaeuser Co. | | | 18,568,078 | |
| | | | | | | | |
| | | | Road & Rail — 1.2% | | | | |
| | 260,500 | | | Norfolk Southern Corp. | | | 16,575,615 | |
| | | | | | | | |
| | | | Semiconductors & Semiconductor Equipment — 1.8% | | | | |
| | 875,337 | | | Applied Materials, Inc. | | | 9,773,137 | |
| | 535,363 | | | Texas Instruments, Inc. | | | 14,749,251 | |
| | | | | | | | |
| | | | | | | 24,522,388 | |
| | | | | | | | |
| | | | Software — 2.7% | | | | |
| | 498,270 | | | Microsoft Corp. | | | 14,838,481 | |
| | 714,650 | | | Oracle Corp. | | | 22,504,328 | |
| | | | | | | | |
| | | | | | | 37,342,809 | |
| | | | | | | | |
| | | | Specialty Retail — 1.3% | | | | |
| | 582,247 | | | Lowe’s Cos., Inc. | | | 17,607,149 | |
| | | | | | | | |
See accompanying notes to financial statements.
| 52
Portfolio of Investments – as of September 30, 2012
Loomis Sayles Value Fund – (continued)
| | | | | | | | |
| Shares | | | Description | | Value (†) | |
| | | | Wireless Telecommunication Services — 1.5% | | | | |
| | 715,595 | | | Vodafone Group PLC, Sponsored ADR | | $ | 20,390,880 | |
| | | | | | | | |
| | | | Total Common Stocks
(Identified Cost $1,128,207,630) | | | 1,353,257,308 | |
| | | | | | | | |
| | | | | | | | |
Principal
Amount | | | | | | |
| | Short-Term Investments — 1.8% | | | | |
| $ | 24,564,851 | | | Tri-Party Repurchase Agreement with Fixed Income Clearing Corporation, dated 9/28/2012 at 0.010% to be repurchased at $24,564,871 on 10/01/2012 collateralized by $24,430,000 U.S. Treasury Note, 1.000% due 3/31/2017 valued at $25,056,581 including accrued interest (Note 2 of Notes to Financial Statements)
(Identified Cost $24,564,851) | | | 24,564,851 | |
| | | | | | | | |
| | | | Total Investments — 99.8%
(Identified Cost $1,152,772,481)(a) | | | 1,377,822,159 | |
| | | | Other assets less liabilities — 0.2% | | | 2,482,825 | |
| | | | | | | | |
| | | | Net Assets — 100.0% | | $ | 1,380,304,984 | |
| | | | | | | | |
| | (†) | | | See Note 2 of Notes to Financial Statements. | | | | |
| | (a) | | | Federal Tax Information: | | | | |
| | | | At September 30, 2012, the net unrealized appreciation on investments based on a cost of $1,156,358,732 for federal income tax purposes was as follows: | | | | |
| | | | Aggregate gross unrealized appreciation for all investments in which there is an excess of value over tax cost | | $ | 257,582,436 | |
| | | | Aggregate gross unrealized depreciation for all investments in which there is an excess of tax cost over value | | | (36,119,009 | ) |
| | | | | | | | |
| | | | Net unrealized appreciation | | $ | 221,463,427 | |
| | | | | | | | |
| | (b) | | | Non-income producing security. | | | | |
| | | | | | | | |
| | ADR | | | An American Depositary Receipt is a certificate issued by a custodian bank representing the right to receive securities of the foreign issuer described. The values of ADRs may be significantly influenced by trading on exchanges not located in the United States. | | | | |
| | REITs | | | Real Estate Investment Trusts | | | | |
See accompanying notes to financial statements.
53 |
Portfolio of Investments – as of September 30, 2012
Loomis Sayles Value Fund – (continued)
Industry Summary at September 30, 2012 (Unaudited)
| | | | |
Oil, Gas & Consumable Fuels | | | 11.0 | % |
Pharmaceuticals | | | 8.1 | |
Commercial Banks | | | 6.4 | |
Media | | | 5.7 | |
Diversified Financial Services | | | 5.0 | |
Insurance | | | 4.0 | |
Capital Markets | | | 3.8 | |
Machinery | | | 3.7 | |
Beverages | | | 3.2 | |
Diversified Telecommunication Services | | | 3.2 | |
Internet Software & Services | | | 2.9 | |
Aerospace & Defense | | | 2.8 | |
Electric Utilities | | | 2.7 | |
Software | | | 2.7 | |
Health Care Providers & Services | | | 2.7 | |
Health Care Equipment & Supplies | | | 2.6 | |
Energy Equipment & Services | | | 2.5 | |
Communications Equipment | | | 2.3 | |
Industrial Conglomerates | | | 2.0 | |
Other Investments, less than 2% each | | | 20.7 | |
Short-Term Investments | | | 1.8 | |
| | | | |
Total Investments | | | 99.8 | |
Other assets less liabilities | | | 0.2 | |
| | | | |
Net Assets | | | 100.0 | % |
| | | | |
See accompanying notes to financial statements.
| 54
Statements of Assets and Liabilities
September 30, 2012
| | | | | | | | | | | | | | | | |
| | | Global Equity
and Income
Fund | | | Growth
Fund | | | Mid Cap
Growth
Fund | | | Value
Fund | |
ASSETS | | | | | | | | | | | | | | | | |
Investments at cost | | $ | 867,102,273 | | | $ | 122,146,770 | | | $ | 87,670,157 | | | $ | 1,152,772,481 | |
Net unrealized appreciation | | | 58,821,892 | | | | 26,466,050 | | | | 14,783,787 | | | | 225,049,678 | |
| | | | | | | | | | | | | | | | |
Investments at value | | | 925,924,165 | | | | 148,612,820 | | | | 102,453,944 | | | | 1,377,822,159 | |
Foreign currency at value (identified cost $4,394,301, $0, $0 and $0) | | | 4,411,468 | | | | — | | | | — | | | | — | |
Receivable for Fund shares sold | | | 6,851,585 | | | | 434,564 | | | | 147,700 | | | | 2,720,020 | |
Receivable for securities sold | | | 3,351,395 | | | | — | | | | 636,692 | | | | 1,794,716 | |
Dividends and interest receivable | | | 4,501,978 | | | | 125,160 | | | | 29,121 | | | | 1,799,921 | |
Unrealized appreciation on forward foreign currency contracts (Note 2) | | | 73,969 | | | | — | | | | — | | | | — | |
Tax reclaims receivable | | | 40,728 | | | | 67,721 | | | | — | | | | — | |
Receivable from distributor (Note 6d) | | | — | | | | 693 | | | | 2,267 | | | | — | |
| | | | | | | | | | | | | | | | |
TOTAL ASSETS | | | 945,155,288 | | | | 149,240,958 | | | | 103,269,724 | | | | 1,384,136,816 | |
| | | | | | | | | | | | | | | | |
LIABILITIES | | | | | | | | | | | | | | | | |
Payable for securities purchased | | | 15,775,695 | | | | 43,045 | | | | 106,760 | | | | — | |
Payable for Fund shares redeemed | | | 690,040 | | | | 176,905 | | | | 128,077 | | | | 2,755,140 | |
Unrealized depreciation on forward foreign currency contracts (Note 2) | | | 144,368 | | | | — | | | | — | | | | — | |
Management fees payable (Note 6) | | | 556,475 | | | | 60,318 | | | | 52,594 | | | | 565,474 | |
Deferred Trustees’ fees (Note 6) | | | 91,851 | | | | 123,799 | | | | 83,046 | | | | 310,022 | |
Administrative fees payable (Note 6) | | | 33,294 | | | | 5,413 | | | | 3,839 | | | | 50,749 | |
Payable to distributor (Note 6d) | | | 7,041 | | | | — | | | | — | | | | 23,863 | |
Other accounts payable and accrued expenses | | | 178,395 | | | | 83,182 | | | | 78,935 | | | | 126,584 | |
| | | | | | | | | | | | | | | | |
TOTAL LIABILITIES | | | 17,477,159 | | | | 492,662 | | | | 453,251 | | | | 3,831,832 | |
| | | | | | | | | | | | | | | | |
NET ASSETS | | $ | 927,678,129 | | | $ | 148,748,296 | | | $ | 102,816,473 | | | $ | 1,380,304,984 | |
| | | | | | | | | | | | | | | | |
NET ASSETS CONSIST OF: | | | | | | | | | | | | | | | | |
Paid-in capital | | $ | 884,019,425 | | | $ | 209,770,166 | | | $ | 131,010,952 | | | $ | 1,156,336,896 | |
Accumulated net investment (loss)/Undistributed net investment income | | | 11,769,372 | | | | 809,831 | | | | (660,102 | ) | | | 14,397,277 | |
Accumulated net realized loss on investments, options written and foreign currency transactions | | | (26,905,333 | ) | | | (88,297,751 | ) | | | (42,318,164 | ) | | | (15,478,867 | ) |
Net unrealized appreciation on investments and foreign currency translations | | | 58,794,665 | | | | 26,466,050 | | | | 14,783,787 | | | | 225,049,678 | |
| | | | | | | | | | | | | | | | |
NET ASSETS | | $ | 927,678,129 | | | $ | 148,748,296 | | | $ | 102,816,473 | | | $ | 1,380,304,984 | |
| | | | | | | | | | | | | | | | |
See accompanying notes to financial statements.
55 |
Statements of Assets and Liabilities (continued)
September 30, 2012
| | | | | | | | | | | | | | | | |
| | | Global Equity
and Income
Fund | | | Growth
Fund | | | Mid Cap
Growth
Fund | | | Value
Fund | |
COMPUTATION OF NET ASSET VALUE AND OFFERING PRICE: | | | | | | | | | | | | | | | | |
Class A shares: | | | | | | | | | | | | | | | | |
Net assets | | $ | 216,209,094 | | | $ | 33,662,837 | | | $ | 43,222,810 | | | $ | 129,572,066 | |
| | | | | | | | | | | | | | | | |
Shares of beneficial interest | | | 12,668,132 | | | | 5,177,975 | | | | 1,498,744 | | | | 6,211,116 | |
| | | | | | | | | | | | | | | | |
Net asset value and redemption price per share | | $ | 17.07 | | | $ | 6.50 | | | $ | 28.84 | | | $ | 20.86 | |
| | | | | | | | | | | | | | | | |
Offering price per share (100/94.25 of net asset value) (Note 1) | | $ | 18.11 | | | $ | 6.90 | | | $ | 30.60 | | | $ | 22.13 | |
| | | | | | | | | | | | | | | | |
Class B shares: (redemption price per share is equal to net asset value less any applicable contingent deferred sales charge) (Note 1) | | | | | | | | | | | | | | | | |
Net assets | | $ | — | | | $ | 1,908,101 | | | $ | — | | | $ | 1,533,663 | |
| | | | | | | | | | | | | | | | |
Shares of beneficial interest | | | — | | | | 313,569 | | | | — | | | | 73,205 | |
| | | | | | | | | | | | | | | | |
Net asset value and offering price per share | | $ | — | | | $ | 6.09 | | | $ | — | | | $ | 20.95 | |
| | | | | | | | | | | | | | | | |
Class C shares: (redemption price per share is equal to net asset value less any applicable contingent deferred sales charge) (Note 1) | | | | | | | | | | | | | | | | |
Net assets | | $ | 251,365,851 | | | $ | 10,489,193 | | | $ | 2,491,150 | | | $ | 9,104,461 | |
| | | | | | | | | | | | | | | | |
Shares of beneficial interest | | | 14,876,844 | | | | 1,723,156 | | | | 88,722 | | | | 440,918 | |
| | | | | | | | | | | | | | | | |
Net asset value and offering price per share | | $ | 16.90 | | | $ | 6.09 | | | $ | 28.08 | | | $ | 20.65 | |
| | | | | | | | | | | | | | | | |
Class Y shares: | | | | | | | | | | | | | | | | |
Net assets | | $ | 460,103,184 | | | $ | 102,688,165 | | | $ | 57,102,513 | | | $ | 1,240,092,902 | |
| | | | | | | | | | | | | | | | |
Shares of beneficial interest | | | 26,823,352 | | | | 14,886,681 | | | | 1,907,482 | | | | 59,302,444 | |
| | | | | | | | | | | | | | | | |
Net asset value, offering and redemption price per share | | $ | 17.15 | | | $ | 6.90 | | | $ | 29.94 | | | $ | 20.91 | |
| | | | | | | | | | | | | | | | |
Admin Class shares: | | | | | | | | | | | | | | | | |
Net assets | | $ | — | | | $ | — | | | $ | — | | | $ | 1,892 | |
| | | | | | | | | | | | | | | | |
Shares of beneficial interest | | | — | | | | — | | | | — | | | | 91 | |
| | | | | | | | | | | | | | | | |
Net asset value, offering and redemption price per share | | $ | — | | | $ | — | | | $ | — | | | $ | 20.79 | |
| | | | | | | | | | | | | | | | |
See accompanying notes to financial statements.
| 56
Statements of Operations
For the Year Ended September 30, 2012
| | | | | | | | | | | | | | | | |
| | | Global Equity
and Income
Fund | | | Growth
Fund | | | Mid Cap
Growth
Fund | | | Value
Fund | |
INVESTMENT INCOME | | | | | | | | | | | | | | | | |
Dividends | | $ | 12,476,916 | (a) | | $ | 2,230,533 | | | $ | 547,900 | | | $ | 31,248,859 | |
Interest | | | 11,457,665 | | | | 20 | | | | 59 | | | | 370 | |
Less net foreign taxes withheld | | | (529,310 | ) | | | (53,002 | ) | | | — | | | | (283,122 | ) |
| | | | | | | | | | | | | | | | |
| | | 23,405,271 | | | | 2,177,551 | | | | 547,959 | | | | 30,966,107 | |
| | | | | | | | | | | | | | | | |
Expenses | | | | | | | | | | | | | | | | |
Management fees (Note 6) | | | 5,184,567 | | | | 646,746 | | | | 794,290 | | | | 6,406,256 | |
Service and distribution fees (Note 6) | | | 2,307,806 | | | | 199,639 | | | | 142,034 | | | | 438,374 | |
Administrative fees (Note 6) | | | 314,448 | | | | 58,912 | | | | 48,278 | | | | 583,746 | |
Trustees’ fees and expenses (Note 6) | | | 34,477 | | | | 28,121 | | | | 24,252 | | | | 62,634 | |
Transfer agent fees and expenses (Note 6) | | | 581,266 | | | | 179,611 | | | | 167,789 | | | | 1,985,068 | |
Audit and tax services fees | | | 54,070 | | | | 41,616 | | | | 46,243 | | | | 34,772 | |
Custodian fees and expenses | | | 231,381 | | | | 18,875 | | | | 19,800 | | | | 58,560 | |
Legal fees | | | 9,788 | | | | 1,842 | | | | 1,530 | | | | 18,286 | |
Registration fees | | | 161,477 | | | | 61,549 | | | | 69,143 | | | | 104,633 | |
Shareholder reporting expenses | | | 41,180 | | | | 10,072 | | | | 6,785 | | | | 89,939 | |
Miscellaneous expenses | | | 29,189 | | | | 10,053 | | | | 14,662 | | | | 37,275 | |
| | | | | | | | | | | | | | | | |
Total expenses | | | 8,949,649 | | | | 1,257,036 | | | | 1,334,806 | | | | 9,819,543 | |
Less waiver and/or expense reimbursement (Note 6) | | | — | | | | — | | | | (131,776 | ) | | | — | |
| | | | | | | | | | | | | | | | |
Net expenses | | | 8,949,649 | | | | 1,257,036 | | | | 1,203,030 | | | | 9,819,543 | |
| | | | | | | | | | | | | | | | |
Net investment income (loss) | | | 14,455,622 | | | | 920,515 | | | | (655,071 | ) | | | 21,146,564 | |
| | | | | | | | | | | | | | | | |
NET REALIZED AND UNREALIZED GAIN (LOSS) ON INVESTMENTS, OPTIONS WRITTEN AND FOREIGN CURRENCY TRANSACTIONS | | | | | | | | | | | | | | | | |
Net realized gain (loss) on: | | | | | | | | | | | | | | | | |
Investments | | | 26,915,835 | | | | 4,329,020 | | | | 3,214,956 | | | | 44,413,605 | |
Options written | | | — | | | | — | | | | (43,815 | ) | | | — | |
Foreign currency transactions | | | (383,060 | ) | | | — | | | | — | | | | — | |
Net change in unrealized appreciation (depreciation) on: | | | | | | | | | | | | | | | | |
Investments | | | 76,848,366 | | | | 22,338,515 | | | | 15,354,072 | | | | 278,326,235 | |
Foreign currency translations | | | 258,530 | | | | — | | | | — | | | | — | |
| | | | | | | | | | | | | | | | |
Net realized and unrealized gain on investments, options written and foreign currency transactions | | | 103,639,671 | | | | 26,667,535 | | | | 18,525,213 | | | | 322,739,840 | |
| | | | | | | | | | | | | | | | |
NET INCREASE IN NET ASSETS RESULTING FROM OPERATIONS | | $ | 118,095,293 | | | $ | 27,588,050 | | | $ | 17,870,142 | | | $ | 343,886,404 | |
| | | | | | | | | | | | | | | | |
| (a) | Includes a non-recurring dividend of $1,639,872. |
See accompanying notes to financial statements.
57 |
Statements of Changes in Net Assets
| | | | | | | | | | | | | | | | |
| | | Global Equity and Income Fund | | | Growth Fund | |
| | | Year Ended
September 30,
2012 | | | Year Ended
September 30,
2011 | | | Year Ended
September 30,
2012 | | | Year Ended
September 30,
2011 | |
FROM OPERATIONS: | | | | | | | | | | | | | | | | |
Net investment income | | $ | 14,455,622 | | | $ | 5,683,385 | | | $ | 920,515 | | | $ | 312,880 | |
Net realized gain on investments and foreign currency transactions | | | 26,532,775 | | | | 42,116,459 | | | | 4,329,020 | | | | 6,408,021 | |
Net change in unrealized appreciation (depreciation) on investments and foreign currency translations | | | 77,106,896 | | | | (73,870,933 | ) | | | 22,338,515 | | | | (5,147,611 | ) |
| | | | | | | | | | | | | | | | |
Net increase (decrease) in net assets resulting from operations | | | 118,095,293 | | | | (26,071,089 | ) | | | 27,588,050 | | | | 1,573,290 | |
| | | | | | | | | | | | | | | | |
FROM DISTRIBUTIONS TO SHAREHOLDERS: | | | | | | | | | | | | | | | | |
Net investment income | | | | | | | | | | | | | | | | |
Class A | | | (2,072,301 | ) | | | (1,363,693 | ) | | | (40,999 | ) | | | — | |
Class C | | | (1,277,382 | ) | | | (1,202,095 | ) | | | — | | | | — | |
Class Y | | | (4,073,326 | ) | | | (3,043,709 | ) | | | (290,006 | ) | | | — | |
| | | | | | | | | | | | | | | | |
Total distributions | | | (7,423,009 | ) | | | (5,609,497 | ) | | | (331,005 | ) | | | — | |
| | | | | | | | | | | | | | | | |
NET INCREASE IN NET ASSETS
FROM CAPITAL SHARE TRANSACTIONS (NOTE 11) | | | 343,913,074 | | | | 186,170,302 | | | | 11,726,064 | | | | 8,413,669 | |
| | | | | | | | | | | | | | | | |
Net increase in net assets | | | 454,585,358 | | | | 154,489,716 | | | | 38,983,109 | | | | 9,986,959 | |
NET ASSETS | | | | | | | | | | | | | | | | |
Beginning of the year | | | 473,092,771 | | | | 318,603,055 | | | | 109,765,187 | | | | 99,778,228 | |
| | | | | | | | | | | | | | | | |
End of the year | | $ | 927,678,129 | | | $ | 473,092,771 | | | $ | 148,748,296 | | | $ | 109,765,187 | |
| | | | | | | | | | | | | | | | |
UNDISTRIBUTED NET INVESTMENT INCOME | | $ | 11,769,372 | | | $ | 5,054,497 | | | $ | 809,831 | | | $ | 220,321 | |
| | | | | | | | | | | | | | | | |
See accompanying notes to financial statements.
| 58
Statements of Changes in Net Assets (continued)
| | | | | | | | | | | | | | | | |
| | | Mid Cap Growth Fund | | | Value Fund | |
| | | Year Ended
September 30,
2012 | | | Year Ended
September 30,
2011 | | | Year Ended
September 30,
2012 | | | Year Ended
September 30,
2011 | |
FROM OPERATIONS: | | | | | | | | | | | | | | | | |
Net investment income (loss) | | $ | (655,071 | ) | | $ | (907,310 | ) | | $ | 21,146,564 | | | $ | 15,885,984 | |
Net realized gain on investments and options written | | | 3,171,141 | | | | 28,275,493 | | | | 44,413,605 | | | | 26,999,839 | |
Net change in unrealized appreciation (depreciation) on investments | | | 15,354,072 | | | | (23,131,410 | ) | | | 278,326,235 | | | | (91,039,296 | ) |
| | | | | | | | | | | | | | | | |
Net increase (decrease) in net assets resulting from operations | | | 17,870,142 | | | | 4,236,773 | | | | 343,886,404 | | | | (48,153,473 | ) |
| | | | | | | | | | | | | | | | |
FROM DISTRIBUTIONS TO SHAREHOLDERS: | | | | | | | | | | | | | | | | |
Net investment income | | | | | | | | | | | | | | | | |
Class A | | | — | | | | — | | | | (1,701,635 | ) | | | (1,714,073 | ) |
Class B | | | — | | | | — | | | | (4,098 | ) | | | (8,769 | ) |
Class C | | | — | | | | — | | | | (35,308 | ) | | | (44,845 | ) |
Class Y | | | — | | | | — | | | | (16,240,641 | ) | | | (14,549,558 | ) |
Admin Class | | | — | | | | — | | | | (19 | ) | | | (11 | ) |
| | | | | | | | | | | | | | | | |
Total distributions | | | — | | | | — | | | | (17,981,701 | ) | | | (16,317,256 | ) |
| | | | | | | | | | | | | | | | |
NET INCREASE (DECREASE) IN NET ASSETS FROM CAPITAL SHARE TRANSACTIONS (NOTE 11) | | | (16,818,326 | ) | | | (3,901,540 | ) | | | (41,007,267 | ) | | | 226,492,861 | |
| | | | | | | | | | | | | | | | |
Net increase in net assets | | | 1,051,816 | | | | 335,233 | | | | 284,897,436 | | | | 162,022,132 | |
NET ASSETS | | | | | | | | | | | | | | | | |
Beginning of the year | | | 101,764,657 | | | | 101,429,424 | | | | 1,095,407,548 | | | | 933,385,416 | |
| | | | | | | | | | | | | | | | |
End of the year | | $ | 102,816,473 | | | $ | 101,764,657 | | | $ | 1,380,304,984 | | | $ | 1,095,407,548 | |
| | | | | | | | | | | | | | | | |
ACCUMULATED NET INVESTMENT (LOSS)/UNDISTRIBUTED NET INVESTMENT INCOME | | $ | (660,102 | ) | | $ | (71,466 | ) | | $ | 14,397,277 | | | $ | 11,990,543 | |
| | | | | | | | | | | | | | | | |
See accompanying notes to financial statements.
59 |
This Page Intentionally Left Blank
| 60
Financial Highlights
For a share outstanding throughout each period.
| | | | | | | | | | | | | | | | | | | | | | | | | | | | |
| | | | | | Income (Loss) from Investment
Operations: | | | Less Distributions: | |
| | | Net asset
value,
beginning
of the
period | | | Net
investment
income (a) | | | Net realized
and
unrealized
gain (loss) | | | Total from
investment
operations | | | Dividends
from net
investment
income | | | Distributions
from net
realized
capital
gains (b) | | | Total
distributions | |
GLOBAL EQUITYAND INCOME FUND | | | | | | | | | | | | | | | | | | | | | |
Class A | | | | | | | | | | | | | | | | | | | | | | | | | | | | |
9/30/2012 | | $ | 14.24 | | | $ | 0.35 | (h) | | $ | 2.71 | | | $ | 3.06 | | | $ | (0.23 | ) | | $ | — | | | $ | (0.23 | ) |
9/30/2011 | | | 14.72 | | | | 0.22 | | | | (0.45 | ) | | | (0.23 | ) | | | (0.25 | ) | | | — | | | | (0.25 | ) |
9/30/2010 | | | 12.50 | | | | 0.26 | | | | 2.26 | | | | 2.52 | | | | (0.30 | ) | | | — | | | | (0.30 | ) |
9/30/2009 | | | 11.65 | | | | 0.36 | | | | 0.74 | (j) | | | 1.10 | | | | (0.25 | ) | | | (0.00 | ) | | | (0.25 | ) |
9/30/2008 | | | 15.83 | | | | 0.25 | | | | (3.46 | ) | | | (3.21 | ) | | | (0.53 | ) | | | (0.44 | ) | | | (0.97 | ) |
Class C | | | | | | | | | | | | | | | | | | | | | | | | | | | | |
9/30/2012 | | | 14.10 | | | | 0.22 | (h) | | | 2.70 | | | | 2.92 | | | | (0.12 | ) | | | — | | | | (0.12 | ) |
9/30/2011 | | | 14.59 | | | | 0.10 | | | | (0.44 | ) | | | (0.34 | ) | | | (0.15 | ) | | | — | | | | (0.15 | ) |
9/30/2010 | | | 12.39 | | | | 0.16 | | | | 2.26 | | | | 2.42 | | | | (0.22 | ) | | | — | | | | (0.22 | ) |
9/30/2009 | | | 11.51 | | | | 0.28 | | | | 0.75 | (j) | | | 1.03 | | | | (0.15 | ) | | | (0.00 | ) | | | (0.15 | ) |
9/30/2008 | | | 15.70 | | | | 0.15 | | | | (3.43 | ) | | | (3.28 | ) | | | (0.47 | ) | | | (0.44 | ) | | | (0.91 | ) |
Class Y | | | | | | | | | | | | | | | | | | | | | | | | | | | | |
9/30/2012 | | | 14.31 | | | | 0.40 | (h) | | | 2.71 | | | | 3.11 | | | | (0.27 | ) | | | — | | | | (0.27 | ) |
9/30/2011 | | | 14.78 | | | | 0.26 | | | | (0.45 | ) | | | (0.19 | ) | | | (0.28 | ) | | | — | | | | (0.28 | ) |
9/30/2010 | | | 12.54 | | | | 0.29 | | | | 2.28 | | | | 2.57 | | | | (0.33 | ) | | | — | | | | (0.33 | ) |
9/30/2009 | | | 11.70 | | | | 0.38 | | | | 0.75 | (j) | | | 1.13 | | | | (0.29 | ) | | | (0.00 | ) | | | (0.29 | ) |
9/30/2008 | | | 15.87 | | | | 0.30 | | | | (3.48 | ) | | | (3.18 | ) | | | (0.55 | ) | | | (0.44 | ) | | | (0.99 | ) |
| (a) | Per share net investment income has been calculated using the average shares outstanding during the period. |
| (b) | Amount rounds to less than $0.01 per share, if applicable. |
| (c) | Effective June 2, 2008, redemption fees were eliminated. |
| (d) | Had certain expenses not been waived/reimbursed during the period, if applicable, total returns would have been lower. |
| (e) | A sales charge for Class A shares and a contingent deferred sales charge for Class C shares are not reflected in total return calculations. Periods less than one year, if applicable, are not annualized. |
| (f) | The investment adviser and/or administrator agreed to waive its fees and/or reimburse a portion of the Fund’s expenses during the period. Without this waiver/reimbursement, if applicable, expenses would have been higher. |
| (g) | Computed on an annualized basis for periods less than one year, if applicable. |
| (h) | Includes a non-recurring dividend. Without this dividend, net investment income per share would have been $0.31, $0.19 and $0.36 for Class A, Class C and Class Y shares, respectively, total return would have been 21.46%, 20.55% and 21.75% for Class A, Class C and Class Y shares, respectively, and the ratio of net investment income to average net assets would have been 1.93%, 1.18% and 2.20% for Class A, Class C and Class Y shares, respectively. |
| (i) | Includes fee/expense recovery of 0.02%. |
| (j) | The amount shown for a share outstanding does not correspond with the aggregate realized and unrealized gain (loss) on investments for the period due to the timing of sales and redemptions of fund shares in relation to fluctuating market values of investments of the Fund. |
| (k) | Includes fee/expense recovery of less than 0.01%. |
See accompanying notes to financial statements.
61 |
| | | | | | | | | | | | | | | | | | | | | | | | | | | | | | |
| | | | | |
| | | | | | | | | | | | | Ratios to Average Net Assets: | | | | |
| | | | | | | |
Redemption
fees (b)(c) | | | Net asset
value,
end of
the period | | | Total
return
(%) (d)(e) | | | Net assets,
end of
the period
(000’s) | | | Net
expenses
(%) (f)(g) | | | Gross
expenses
(%) (g) | | | Net investment
income
(%) (g) | | | Portfolio
turnover
rate (%) | |
| | | | | | | | | | | | | | | | | | | | | | | | | | | | | | |
| | | | | | | | | | | | | | | | | | | | | | | | | | | | | | |
| $ | — | | | $ | 17.07 | | | | 21.75 | (h) | | $ | 216,209 | | | | 1.21 | | | | 1.21 | | | | 2.16 | (h) | | | 29 | |
| | — | | | | 14.24 | | | | (1.67 | ) | | | 111,589 | | | | 1.24 | (i) | | | 1.24 | (i) | | | 1.41 | | | | 65 | |
| | — | | | | 14.72 | | | | 20.61 | | | | 64,367 | | | | 1.25 | | | | 1.29 | | | | 1.96 | | | | 99 | |
| | — | | | | 12.50 | | | | 10.27 | | | | 44,669 | | | | 1.25 | | | | 1.34 | | | | 3.56 | | | | 114 | |
| | 0.00 | | | | 11.65 | | | | (21.87 | ) | | | 67,647 | | | | 1.25 | | | | 1.27 | | | | 1.74 | | | | 133 | |
| | | | | | | | | | | | | | | | | | | | | | | | | | | | | | |
| | — | | | | 16.90 | | | | 20.83 | (h) | | | 251,366 | | | | 1.96 | | | | 1.96 | | | | 1.40 | (h) | | | 29 | |
| | — | | | | 14.10 | | | | (2.42 | ) | | | 145,369 | | | | 1.99 | (i) | | | 1.99 | (i) | | | 0.64 | | | | 65 | |
| | — | | | | 14.59 | | | | 19.79 | | | | 109,455 | | | | 2.00 | | | | 2.04 | | | | 1.21 | | | | 99 | |
| | — | | | | 12.39 | | | | 9.40 | | | | 96,208 | | | | 2.00 | | | | 2.09 | | | | 2.82 | | | | 114 | |
| | 0.00 | | | | 11.51 | | | | (22.42 | ) | | | 124,178 | | | | 2.00 | | | | 2.02 | | | | 1.04 | | | | 133 | |
| | | | | | | | | | | | | | | | | | | | | | | | | | | | | | |
| | — | | | | 17.15 | | | | 21.96 | (h) | | | 460,103 | | | | 0.96 | | | | 0.96 | | | | 2.44 | (h) | | | 29 | |
| | — | | | | 14.31 | | | | (1.42 | ) | | | 216,136 | | | | 0.99 | (i) | | | 0.99 | (i) | | | 1.65 | | | | 65 | |
| | — | | | | 14.78 | | | | 21.02 | | | | 144,780 | | | | 1.00 | | | | 1.04 | | | | 2.20 | | | | 99 | |
| | — | | | | 12.54 | | | | 10.49 | | | | 108,728 | | | | 1.00 | | | | 1.01 | | | | 3.79 | | | | 114 | |
| | 0.00 | | | | 11.70 | | | | (21.66 | ) | | | 120,322 | | | | 0.99 | (k) | | | 0.99 | (k) | | | 2.06 | | | | 133 | |
See accompanying notes to financial statements.
| 62
Financial Highlights (continued)
For a share outstanding throughout each period.
| | | | | | | | | | | | | | | | | | | | | | | | | | | | |
| | | | | | Income (Loss) from Investment
Operations: | | | Less Distributions: | |
| | | Net asset
value,
beginning
of the
period | | | Net
investment
income
(loss) (a)(b) | | | Net realized
and
unrealized
gain (loss) | | | Total from
investment
operations | | | Dividends
from net
investment
income | | | Distributions
from net
realized
capital
gains | | | Total
distributions | |
GROWTH FUND | | | | | | | | | | | | | | | | | | | | | | | | | |
Class A | | | | | | | | | | | | | | | | | | | | | | | | | | | | |
9/30/2012 | | $ | 5.24 | | | $ | 0.04 | | | $ | 1.23 | | | $ | 1.27 | | | $ | (0.01 | ) | | $ | — | | | $ | (0.01 | ) |
9/30/2011 | | | 5.14 | | | | 0.01 | | | | 0.09 | | | | 0.10 | | | | — | | | | — | | | | — | |
9/30/2010 | | | 4.48 | | | | (0.01 | ) | | | 0.67 | | | | 0.66 | | | | — | | | | — | | | | — | |
9/30/2009 | | | 4.99 | | | | (0.01 | ) | | | (0.50 | ) | | | (0.51 | ) | | | — | | | | — | | | | — | |
9/30/2008 | | | 7.01 | | | | (0.02 | ) | | | (2.00 | ) | | | (2.02 | ) | | | — | | | | — | | | | — | |
Class B | | | | | | | | | | | | | | | | | | | | | | | | | | | | |
9/30/2012 | | | 4.94 | | | | (0.01 | ) | | | 1.16 | | | | 1.15 | | | | — | | | | — | | | | — | |
9/30/2011 | | | 4.87 | | | | (0.03 | ) | | | 0.10 | | | | 0.07 | | | | — | | | | — | | | | — | |
9/30/2010 | | | 4.28 | | | | (0.05 | ) | | | 0.64 | | | | 0.59 | | | | — | | | | — | | | | — | |
9/30/2009 | | | 4.81 | | | | (0.04 | ) | | | (0.49 | ) | | | (0.53 | ) | | | — | | | | — | | | | — | |
9/30/2008 | | | 6.79 | | | | (0.07 | ) | | | (1.91 | ) | | | (1.98 | ) | | | — | | | | — | | | | — | |
Class C | | | | | | | | | | | | | | | | | | | | | | | | | | | | |
9/30/2012 | | | 4.94 | | | | (0.01 | ) | | | 1.16 | | | | 1.15 | | | | — | | | | — | | | | — | |
9/30/2011 | | | 4.87 | | | | (0.03 | ) | | | 0.10 | | | | 0.07 | | | | — | | | | — | | | | — | |
9/30/2010 | | | 4.28 | | | | (0.05 | ) | | | 0.64 | | | | 0.59 | | | | — | | | | — | | | | — | |
9/30/2009 | | | 4.81 | | | | (0.04 | ) | | | (0.49 | ) | | | (0.53 | ) | | | — | | | | — | | | | — | |
9/30/2008 | | | 6.80 | | | | (0.07 | ) | | | (1.92 | ) | | | (1.99 | ) | | | — | | | | — | | | | — | |
Class Y | | | | | | | | | | | | | | | | | | | | | | | | | | | | |
9/30/2012 | | | 5.56 | | | | 0.06 | | | | 1.30 | | | | 1.36 | | | | (0.02 | ) | | | — | | | | (0.02 | ) |
9/30/2011 | | | 5.43 | | | | 0.03 | | | | 0.10 | | | | 0.13 | | | | — | | | | — | | | | — | |
9/30/2010 | | | 4.73 | | | | (0.00 | ) | | | 0.70 | | | | 0.70 | | | | — | �� | | | — | | | | — | |
9/30/2009 | | | 5.24 | | | | 0.01 | | | | (0.52 | ) | | | (0.51 | ) | | | — | | | | — | | | | — | |
9/30/2008 | | | 7.32 | | | | 0.01 | | | | (2.09 | ) | | | (2.08 | ) | | | — | | | | — | | | | — | |
| (a) | Per share net investment income (loss) has been calculated using the average shares outstanding during the period. |
| (b) | Amount rounds to less than $0.01 per share, if applicable. |
| (c) | Had certain expenses not been waived/reimbursed during the period, if applicable, total returns would have been lower. |
| (d) | A sales charge for Class A shares and a contingent deferred sales charge for Class B and Class C shares are not reflected in total return calculations. Periods less than one year, if applicable, are not annualized. |
| (e) | The investment adviser and/or administrator agreed to waive its fees and/or reimburse a portion of the Fund’s expenses during the period. Without this waiver/reimbursement, if applicable, expenses would have been higher. |
| (f) | Computed on an annualized basis for periods less than one year, if applicable. |
| (g) | Effective February 1, 2010, the expense limit increased from 0.85% to 1.00% for Class Y shares. |
See accompanying notes to financial statements.
63 |
| | | | | | | | | | | | | | | | | | | | | | | | | | |
| | | | |
| | | | | | | | | | Ratios to Average Net Assets: | | | | |
| | | | | | |
Net asset
value, end
of the period | | | Total
return
(%) (c)(d) | | | Net assets,
end of
the period
(000’s) | | | Net
expenses
(%) (e)(f) | | | Gross
expenses
(%) (f) | | | Net investment
income (loss)
(%) (f) | | | Portfolio
turnover
rate (%) | |
| | | | | | | | | | | | | | | | | | | | | | | | | | |
| | | | | | | | | | | | | | | | | | | | | | | | | | |
| $ | 6.50 | | | | 24.22 | | | $ | 33,663 | | | | 1.07 | | | | 1.07 | | | | 0.61 | | | | 16 | |
| | 5.24 | | | | 1.95 | | | | 26,716 | | | | 1.14 | | | | 1.14 | | | | 0.23 | | | | 16 | |
| | 5.14 | | | | 14.73 | | | | 29,901 | | | | 1.19 | | | | 1.20 | | | | (0.30 | ) | | | 163 | |
| | 4.48 | | | | (10.40 | ) | | | 33,207 | | | | 1.25 | | | | 1.31 | | | | (0.25 | ) | | | 191 | |
| | 4.99 | | | | (28.67 | ) | | | 156,841 | | | | 1.10 | | | | 1.10 | | | | (0.33 | ) | | | 179 | |
| | | | | | | | | | | | | | | | | | | | | | | | | | |
| | 6.09 | | | | 23.28 | | | | 1,908 | | | | 1.82 | | | | 1.82 | | | | (0.12 | ) | | | 16 | |
| | 4.94 | | | | 1.44 | | | | 2,609 | | | | 1.89 | | | | 1.89 | | | | (0.54 | ) | | | 16 | |
| | 4.87 | | | | 13.79 | | | | 4,086 | | | | 1.93 | | | | 1.95 | | | | (1.06 | ) | | | 163 | |
| | 4.28 | | | | (11.02 | ) | | | 5,397 | | | | 2.00 | | | | 2.12 | | | | (1.06 | ) | | | 191 | |
| | 4.81 | | | | (29.16 | ) | | | 9,553 | | | | 1.85 | | | | 1.85 | | | | (1.05 | ) | | | 179 | |
| | | | | | | | | | | | | | | | | | | | | | | | | | |
| | 6.09 | | | | 23.28 | | | | 10,489 | | | | 1.82 | | | | 1.82 | | | | (0.13 | ) | | | 16 | |
| | 4.94 | | | | 1.44 | | | | 10,262 | | | | 1.89 | | | | 1.89 | | | | (0.53 | ) | | | 16 | |
| | 4.87 | | | | 13.79 | | | | 12,493 | | | | 1.93 | | | | 1.95 | | | | (1.06 | ) | | | 163 | |
| | 4.28 | | | | (11.02 | ) | | | 16,336 | | | | 2.00 | | | | 2.12 | | | | (1.06 | ) | | | 191 | |
| | 4.81 | | | | (29.26 | ) | | | 27,743 | | | | 1.85 | | | | 1.85 | | | | (1.08 | ) | | | 179 | |
| | | | | | | | | | | | | | | | | | | | | | | | | | |
| | 6.90 | | | | 24.57 | | | | 102,688 | | | | 0.82 | | | | 0.82 | | | | 0.87 | | | | 16 | |
| | 5.56 | | | | 2.21 | | | | 70,177 | | | | 0.89 | | | | 0.89 | | | | 0.49 | | | | 16 | |
| | 5.43 | | | | 15.01 | | | | 53,299 | | | | 0.93 | (g) | | | 0.95 | | | | (0.05 | ) | | | 163 | |
| | 4.73 | | | | (9.73 | ) | | | 57,033 | | | | 0.75 | | | | 0.75 | | | | 0.18 | | | | 191 | |
| | 5.24 | | | | (28.42 | ) | | | 75,389 | | | | 0.66 | | | | 0.66 | | | | 0.11 | | | | 179 | |
See accompanying notes to financial statements.
| 64
Financial Highlights (continued)
For a share outstanding throughout each period.
| | | | | | | | | | | | | | | | | | | | | | | | | | | | |
| | | | | | Income (Loss) from Investment
Operations: | | | Less Distributions: | |
| | | Net asset
value,
beginning
of the
period | | | Net
investment
loss (a) | | | Net realized
and
unrealized
gain (loss) | | | Total from
investment
operations | | | Dividends
from net
investment
income | | | Distributions
from net
realized
capital
gains | | | Total
distributions | |
MID CAP GROWTH FUND | | | | | | | | | | | | | | | | | | | | | | | | | |
Class A* | | | | | | | | | | | | | | | | | | | | | | | | | | | | |
9/30/2012 | | $ | 24.40 | | | $ | (0.20 | ) | | $ | 4.64 | | | $ | 4.44 | | | $ | — | | | $ | — | | | $ | — | |
9/30/2011 | | | 23.76 | | | | (0.23 | )(f) | | | 0.87 | | | | 0.64 | | | | — | | | | — | | | | — | |
9/30/2010 | | | 18.29 | | | | (0.09 | )(h) | | | 5.56 | | | | 5.47 | | | | — | | | | — | | | | — | |
9/30/2009 | | | 21.12 | | | | (0.07 | )(i) | | | (2.76 | ) | | | (2.83 | ) | | | — | | | | — | | | | — | |
9/30/2008 | | | 26.84 | | | | (0.15 | ) | | | (5.57 | ) | | | (5.72 | ) | | | — | | | | — | | | | — | |
Class C | | | | | | | | | | | | | | | | | | | | | | | | | | | | |
9/30/2012 | | | 23.93 | | | | (0.39 | ) | | | 4.54 | | | | 4.15 | | | | — | | | | — | | | | — | |
9/30/2011 | | | 23.47 | | | | (0.45 | )(f) | | | 0.91 | | | | 0.46 | | | | — | | | | — | | | | — | |
9/30/2010 | | | 18.20 | | | | (0.18 | )(h) | | | 5.45 | | | | 5.27 | | | | — | | | | — | | | | — | |
9/30/2009** | | | 15.13 | | | | (0.16 | ) | | | 3.23 | | | | 3.07 | | | | — | | | | — | | | | — | |
Class Y* | | | | | | | | | | | | | | | | | | | | | | | | | | | | |
9/30/2012 | | | 25.27 | | | | (0.14 | ) | | | 4.81 | | | | 4.67 | | | | — | | | | — | | | | — | |
9/30/2011 | | | 24.53 | | | | (0.17 | )(f) | | | 0.91 | | | | 0.74 | | | | — | | | | — | | | | — | |
9/30/2010 | | | 18.84 | | | | (0.07 | )(h) | | | 5.76 | | | | 5.69 | | | | — | | | | — | | | | — | |
9/30/2009 | | | 21.70 | | | | (0.05 | )(i) | | | (2.81 | ) | | | (2.86 | ) | | | — | | | | — | | | | — | |
9/30/2008 | | | 27.51 | | | | (0.10 | ) | | | (5.71 | ) | | | (5.81 | ) | | | — | | | | — | | | | — | |
| * | Prior to the close of business on February 2, 2009, the Fund offered Retail and Institutional Class shares, which were redesignated as Class A and Class Y shares, respectively, on that date. |
| ** | From commencement of Class operations on February 2, 2009 through September 30, 2009. |
| (a) | Per share net investment loss has been calculated using the average shares outstanding during the period. |
| (b) | Had certain expenses not been waived/reimbursed during the period, if applicable, total returns would have been lower. |
| (c) | A sales charge for Class A shares and a contingent deferred sales charge for Class C shares are not reflected in total return calculations. Periods less than one year, if applicable, are not annualized. |
| (d) | The investment adviser and/or administrator agreed to waive its fees and/or reimburse a portion of the Fund’s expenses during the period. Without this waiver/reimbursement, if applicable, expenses would have been higher. |
| (e) | Computed on an annualized basis for periods less than one year, if applicable. |
| (f) | Includes a non-recurring dividend. Without this dividend, net investment loss per share would have been $(0.27), $(0.47) and $(0.20) for Class A, Class C and Class Y shares, respectively, total return would have been 2.53%, 1.79% and 2.81% for Class A, Class C and Class Y shares, respectively, and the ratio of net investment loss to average net assets would have been (0.96)%, (1.68)% and (0.70)% for Class A, Class C and Class Y shares, respectively. |
See accompanying notes to financial statements.
65 |
| | | | | | | | | | | | | | | | | | | | | | | | | | |
| | | | | | | | | | Ratios to Average Net Assets: | | | | |
Net asset
value,
end of
the period | | | Total
return
(%) (b)(c) | | | Net assets,
end of
the period
(000’s) | | | Net
expenses
(%) (d)(e) | | | Gross
expenses
(%) (e) | | | Net investment
loss
(%) (e) | | | Portfolio
turnover
rate (%) | |
| | | | | | | | | | | | | | | | | | | | | | | | | | |
| | | | | | | | | | | | | | | | | | | | | | | | | | |
| $ | 28.84 | | | | 18.25 | | | $ | 43,223 | | | | 1.25 | | | | 1.38 | | | | (0.72 | ) | | | 191 | |
| | 24.40 | | | | 2.65 | (f) | | | 49,177 | | | | 1.25 | (g) | | | 1.32 | | | | (0.81 | )(f) | | | 204 | |
| | 23.76 | | | | 29.91 | | | | 67,639 | | | | 1.25 | | | | 1.46 | | | | (0.45 | )(h) | | | 191 | |
| | 18.29 | | | | (13.44 | ) | | | 54,951 | | | | 1.25 | | | | 1.52 | | | | (0.45 | )(i) | | | 292 | |
| | 21.12 | | | | (21.27 | ) | | | 120,524 | | | | 1.25 | | | | 1.32 | | | | (0.58 | ) | | | 299 | |
| | | | | | | | | | | | | | | | | | | | | | | | | | |
| | 28.08 | | | | 17.34 | | | | 2,491 | | | | 2.00 | | | | 2.13 | | | | (1.47 | ) | | | 191 | |
| | 23.93 | | | | 1.96 | (f) | | | 2,182 | | | | 2.01 | (g) | | | 2.08 | | | | (1.63 | )(f) | | | 204 | |
| | 23.47 | | | | 28.96 | | | | 34 | | | | 2.00 | | | | 2.24 | | | | (0.89 | )(h) | | | 191 | |
| | 18.20 | | | | 20.29 | | | | 1 | | | | 2.00 | | | | 2.24 | | | | (1.54 | ) | | | 292 | |
| | | | | | | | | | | | | | | | | | | | | | | | | | |
| | 29.94 | | | | 18.53 | | | | 57,103 | | | | 1.00 | | | | 1.13 | | | | (0.49 | ) | | | 191 | |
| | 25.27 | | | | 2.98 | (f) | | | 50,406 | | | | 1.00 | (g) | | | 1.07 | | | | (0.58 | )(f) | | | 204 | |
| | 24.53 | | | | 30.20 | | | | 33,757 | | | | 1.00 | | | | 1.22 | | | | (0.34 | )(h) | | | 191 | |
| | 18.84 | | | | (13.18 | ) | | | 27,057 | | | | 1.00 | | | | 1.12 | | | | (0.27 | )(i) | | | 292 | |
| | 21.70 | | | | (21.12 | ) | | | 25,779 | | | | 1.00 | (j) | | | 1.00 | (j) | | | (0.36 | ) | | | 299 | |
| (g) | Includes interest expense from bank overdraft charges of 0.01% for Class C and less than 0.01% for Classes A and Y. Without this expense the ratio of net expenses for Class C would have been 2.00%. |
| (h) | Includes a non-recurring dividend. Without this dividend, net investment loss per share would have been $(0.21), $(0.36) and $(0.16) for Class A, Class C and Class Y shares, respectively, and the ratio of net investment loss to average net assets would have been (1.02)%, (1.74)% and (0.76)% for Class A, Class C and Class Y shares, respectively. |
| (i) | Includes a non-recurring dividend of $0.03 per share. Without this dividend, net investment loss per share would have been $(0.10) and $(0.08) for Class A and Class Y shares, respectively, and the ratio of net investment loss to average net assets would have been (0.63)% and (0.46)% for Class A and Class Y shares, respectively. |
| (j) | Includes fee/expense recovery of less than 0.01%. |
See accompanying notes to financial statements.
| 66
Financial Highlights (continued)
For a share outstanding throughout each period.
| | | | | | | | | | | | | | | | | | | | | | | | | | | | |
| | | | | | Income (Loss) from Investment
Operations: | | | Less Distributions: | |
| | | Net asset
value,
beginning
of the
period | | | Net
investment
income (a) | | | Net realized
and
unrealized
gain (loss) | | | Total from
investment
operations | | | Dividends
from net
investment
income | | | Distributions
from net
realized
capital
gains | | | Total
distributions | |
VALUE FUND | | | | | | | | | | | | | | | | | | | | | | | | | | | | |
Class A | | | | | | | | | | | | | | | | | | | | | | | | | | | | |
9/30/2012 | | $ | 16.04 | | | $ | 0.27 | | | $ | 4.78 | | | $ | 5.05 | | | $ | (0.23 | ) | | $ | — | | | $ | (0.23 | ) |
9/30/2011 | | | 16.78 | | | | 0.20 | | | | (0.72 | ) | | | (0.52 | ) | | | (0.22 | ) | | | — | | | | (0.22 | ) |
9/30/2010 | | | 16.42 | | | | 0.27 | (f) | | | 0.23 | | | | 0.50 | | | | (0.14 | ) | | | — | | | | (0.14 | ) |
9/30/2009 | | | 17.93 | | | | 0.23 | | | | (1.53 | ) | | | (1.30 | ) | | | (0.21 | ) | | | — | | | | (0.21 | ) |
9/30/2008 | | | 23.46 | | | | 0.25 | | | | (4.45 | ) | | | (4.20 | ) | | | (0.18 | ) | | | (1.15 | ) | | | (1.33 | ) |
Class B | | | | | | | | | | | | | | | | | | | | | | | | | | | | |
9/30/2012 | | | 16.05 | | | | 0.13 | | | | 4.81 | | | | 4.94 | | | | (0.04 | ) | | | — | | | | (0.04 | ) |
9/30/2011 | | | 16.77 | | | | 0.06 | | | | (0.73 | ) | | | (0.67 | ) | | | (0.05 | ) | | | — | | | | (0.05 | ) |
9/30/2010 | | | 16.40 | | | | 0.12 | (f) | | | 0.25 | | | | 0.37 | | | | — | | | | — | | | | — | |
9/30/2009 | | | 17.80 | | | | 0.14 | | | | (1.51 | ) | | | (1.37 | ) | | | (0.03 | ) | | | — | | | | (0.03 | ) |
9/30/2008 | | | 23.46 | | | | 0.10 | | | | (4.45 | ) | | | (4.35 | ) | | | (0.16 | ) | | | (1.15 | ) | | | (1.31 | ) |
Class C | | | | | | | | | | | | | | | | | | | | | | | | | | | | |
9/30/2012 | | | 15.85 | | | | 0.13 | | | | 4.74 | | | | 4.87 | | | | (0.07 | ) | | | — | | | | (0.07 | ) |
9/30/2011 | | | 16.58 | | | | 0.06 | | | | (0.71 | ) | | | (0.65 | ) | | | (0.08 | ) | | | — | | | | (0.08 | ) |
9/30/2010 | | | 16.26 | | | | 0.14 | (f) | | | 0.22 | | | | 0.36 | | | | (0.04 | ) | | | — | | | | (0.04 | ) |
9/30/2009 | | | 17.79 | | | | 0.12 | | | | (1.51 | ) | | | (1.39 | ) | | | (0.14 | ) | | | — | | | | (0.14 | ) |
9/30/2008 | | | 23.46 | | | | 0.09 | | | | (4.43 | ) | | | (4.34 | ) | | | (0.18 | ) | | | (1.15 | ) | | | (1.33 | ) |
Class Y | | | | | | | | | | | | | | | | | | | | | | | | | | | | |
9/30/2012 | | | 16.08 | | | | 0.32 | | | | 4.78 | | | | 5.10 | | | | (0.27 | ) | | | — | | | | (0.27 | ) |
9/30/2011 | | | 16.82 | | | | 0.25 | | | | (0.73 | ) | | | (0.48 | ) | | | (0.26 | ) | | | — | | | | (0.26 | ) |
9/30/2010 | | | 16.47 | | | | 0.31 | (f) | | | 0.23 | | | | 0.54 | | | | (0.19 | ) | | | — | | | | (0.19 | ) |
9/30/2009 | | | 18.01 | | | | 0.28 | | | | (1.54 | ) | | | (1.26 | ) | | | (0.28 | ) | | | — | | | | (0.28 | ) |
9/30/2008 | | | 23.54 | | | | 0.32 | | | | (4.45 | ) | | | (4.13 | ) | | | (0.25 | ) | | | (1.15 | ) | | | (1.40 | ) |
Admin Class | | | | | | | | | | | | | | | | | | | | | | | | | |
9/30/2012 | | | 16.00 | | | | 0.22 | | | | 4.77 | | | | 4.99 | | | | (0.20 | ) | | | — | | | | (0.20 | ) |
9/30/2011 | | | 16.74 | | | | 0.17 | | | | (0.73 | ) | | | (0.56 | ) | | | (0.18 | ) | | | — | | | | (0.18 | ) |
9/30/2010* | | | 16.72 | | | | 0.18 | (f) | | | (0.16 | ) | | | 0.02 | | | | — | | | | — | | | | — | |
| * | From commencement of Class operations on February 1, 2010 through September 30, 2010. |
| (a) | Per share net investment income has been calculated using the average shares outstanding during the period. |
| (b) | Had certain expenses not been waived/reimbursed during the period, if applicable, total returns would have been lower. |
| (c) | A sales charge for Class A shares and a contingent deferred sales charge for Class B and Class C shares are not reflected in total return calculations. Periods less than one year, if applicable, are not annualized. |
| (d) | The investment adviser and/or administrator agreed to waive its fees and/or reimburse a portion of the Fund’s expenses during the period. Without this waiver/reimbursement, if applicable, expenses would have been higher. |
See accompanying notes to financial statements.
67 |
| | | | | | | | | | | | | | | | | | | | | | | | | | |
| | | | | | | | | | Ratios to Average Net Assets: | | | | |
Net asset
value, end
of the period | | | Total
return
(%) (b)(c) | | | Net assets,
end of
the period
(000’s) | | | Net
expenses
(%) (d)(e) | | | Gross
expenses
(%) (e) | | | Net investment
income
(%) (e) | | | Portfolio
turnover
rate (%) | |
| | | | | | | | | | | | | | | | | | | | | | | | | | |
| | | | | | | | | | | | | | | | | | | | | | | | | | |
| $ | 20.86 | | | | 31.71 | | | $ | 129,572 | | | | 0.98 | | | | 0.98 | | | | 1.45 | | | | 25 | |
| | 16.04 | | | | (3.28 | ) | | | 126,789 | | | | 0.98 | | | | 0.98 | | | | 1.09 | | | | 29 | |
| | 16.78 | | | | 3.03 | | | | 130,922 | | | | 0.96 | | | | 0.96 | | | | 1.58 | (f) | | | 54 | |
| | 16.42 | | | | (6.97 | ) | | | 120,915 | | | | 1.06 | | | | 1.06 | | | | 1.67 | | | | 47 | |
| | 17.93 | | | | (19.01 | ) | | | 112,274 | | | | 1.05 | | | | 1.05 | | | | 1.24 | | | | 36 | (g) |
| | | | | | | | | | | | | | | | | | | | | | | | | | |
| | 20.95 | | | | 30.79 | | | | 1,534 | | | | 1.73 | | | | 1.73 | | | | 0.71 | | | | 25 | |
| | 16.05 | | | | (4.05 | ) | | | 2,037 | | | | 1.73 | | | | 1.73 | | | | 0.32 | | | | 29 | |
| | 16.77 | | | | 2.26 | | | | 3,299 | | | | 1.70 | | | | 1.70 | | | | 0.72 | (f) | | | 54 | |
| | 16.40 | | | | (7.62 | ) | | | 5,167 | | | | 1.81 | | | | 1.81 | | | | 1.03 | | | | 47 | |
| | 17.80 | | | | (19.65 | ) | | | 8,385 | | | | 1.80 | (h) | | | 1.80 | (h) | | | 0.51 | | | | 36 | (g) |
| | | | | | | | | | | | | | | | | | | | | | | | | | |
| | 20.65 | | | | 30.78 | | | | 9,104 | | | | 1.73 | | | | 1.73 | | | | 0.70 | | | | 25 | |
| | 15.85 | | | | (4.00 | ) | | | 8,996 | | | | 1.73 | | | | 1.73 | | | | 0.33 | | | | 29 | |
| | 16.58 | | | | 2.20 | | | | 10,226 | | | | 1.71 | | | | 1.71 | | | | 0.81 | (f) | | | 54 | |
| | 16.26 | | | | (7.60 | ) | | | 10,011 | | | | 1.81 | | | | 1.81 | | | | 0.89 | | | | 47 | |
| | 17.79 | | | | (19.62 | ) | | | 6,483 | | | | 1.80 | (h) | | | 1.80 | (h) | | | 0.46 | | | | 36 | (g) |
| | | | | | | | | | | | | | | | | | | | | | | | | | |
| | 20.91 | | | | 32.05 | | | | 1,240,093 | | | | 0.73 | | | | 0.73 | | | | 1.68 | | | | 25 | |
| | 16.08 | | | | (3.05 | ) | | | 957,584 | | | | 0.74 | | | | 0.74 | | | | 1.34 | | | | 29 | |
| | 16.82 | | | | 3.28 | | | | 788,937 | | | | 0.71 | | | | 0.71 | | | | 1.86 | (f) | | | 54 | |
| | 16.47 | | | | (6.66 | ) | | | 574,439 | | | | 0.66 | | | | 0.66 | | | | 1.97 | | | | 47 | |
| | 18.01 | | | | (18.67 | ) | | | 303,182 | | | | 0.65 | | | | 0.66 | | | | 1.58 | | | | 36 | (g) |
| | | | | | | | | | | | | | | | | | | | | | | | | | |
| | 20.79 | | | | 31.43 | | | | 2 | | | | 1.24 | | | | 1.24 | | | | 1.17 | | | | 25 | |
| | 16.00 | | | | (3.48 | ) | | | 1 | | | | 1.17 | | | | 1.17 | | | | 0.90 | | | | 29 | |
| | 16.74 | | | | 0.12 | | | | 1 | | | | 1.29 | | | | 1.29 | | | | 1.59 | (f) | | | 54 | |
| (e) | Computed on an annualized basis for periods less than one year, if applicable. |
| (f) | Includes a non-recurring dividend. Without this dividend, net investment income per share would have been $0.14, $0.02, $0.01, $0.18 and $0.05 for Class A, Class B, Class C, Class Y and Admin Class shares, respectively, and the ratio of net investment income to average net assets would have been 0.84%, 0.10%, 0.09%, 1.08% and 0.50% for Class A, Class B, Class C, Class Y and Admin Class shares, respectively. |
| (g) | Portfolio turnover excludes the impact of assets resulting from a merger with another fund. |
| (h) | Includes fee/expense recovery of less than 0.01% for Class B and Class C shares. |
See accompanying notes to financial statements.
| 68
Notes to Financial Statements
September 30, 2012
1. Organization. Loomis Sayles Funds II (the “Trust”) is organized as a Massachusetts business trust. The Trust is registered under the Investment Company Act of 1940, as amended (the “1940 Act”), as an open-end management investment company. The Declaration of Trust permits the Board of Trustees to authorize the issuance of an unlimited number of shares of the Trust in multiple series. The financial statements for certain funds of the Trust are presented in separate reports. The following funds (individually, a “Fund” and collectively, the “Funds”) are included in this report:
Loomis Sayles Global Equity and Income Fund (the “Global Equity and Income Fund”)
Loomis Sayles Growth Fund (the “Growth Fund”)
Loomis Sayles Mid Cap Growth Fund (the “Mid Cap Growth Fund”)
Loomis Sayles Value Fund (the “Value Fund”)
Each Fund is a diversified investment company.
Each Fund offers Class A, Class C and Class Y shares. In addition, Value Fund offers Admin Class shares. Effective October 12, 2007, Class B shares are no longer offered. Existing Class B shareholders of Growth Fund and Value Fund may continue to reinvest dividends into Class B shares and exchange their Class B shares for Class B shares of other Natixis Funds subject to existing exchange privileges as described in the prospectus.
Class A shares are sold with a maximum front-end sales charge of 5.75%. Class B shares do not pay a front-end sales charge; however, they are charged higher Rule 12b-1 fees, and are subject to a contingent deferred sales charge (“CDSC”) if such shares are redeemed within six years of purchase. After eight years of ownership, Class B shares convert to Class A shares. Class C shares do not pay a front-end sales charge, do not convert to any other class of shares, pay higher Rule 12b-1 fees than Class A shares and may be subject to a CDSC of 1.00% if those shares are redeemed within one year of acquisition, except for reinvested distributions. Class Y shares do not pay a front-end sales charge, a CDSC or Rule 12b-1 fees. Class Y shares are generally intended for institutional investors with a minimum initial investment of $100,000, though some categories of investors are exempted from the minimum investment amount as outlined in the Funds’ prospectus. Admin Class shares do not pay a front-end sales charge or a CDSC, but do pay a Rule 12b-1 fee. Admin Class shares are offered exclusively through intermediaries.
Most expenses of the Trust can be directly attributed to a fund. Expenses which cannot be directly attributed to a fund are generally apportioned based on the relative net assets of each of the funds in the Trust. Expenses of a Fund are borne pro rata by the holders of each class of shares, except that each class bears expenses unique to that class (including the Rule 12b-1 service and distribution fees). In addition, each class votes as a class only with respect to its own Rule 12b-1 Plan. Shares of each class would receive their pro rata share of the net assets of a Fund if the Fund were liquidated. The Trustees approve separate distributions from net investment income on each class of shares.
69 |
Notes to Financial Statements (continued)
September 30, 2012
2. Significant Accounting Policies. The following is a summary of significant accounting policies consistently followed by each Fund in the preparation of its financial statements. The Funds’ financial statements are prepared in accordance with accounting principles generally accepted in the United States of America which require the use of management estimates that affect the reported amounts and disclosures in the financial statements. Actual results could differ from those estimates. Management has evaluated the events and transactions subsequent to year-end through the date the financial statements were issued and has determined that there were no material events that would require disclosure in the Funds’ financial statements.
a. Valuation. Equity securities, including shares of closed-end investment companies and exchange-traded funds, for which market quotations are readily available are valued at market value, as reported by independent pricing services recommended by the investment adviser and approved by the Board of Trustees. Such independent pricing services generally use the security’s last sale price on the exchange or market where the security is primarily traded or, if there is no reported sale during the day, the closing bid price. Securities traded on the NASDAQ Global Select Market, NASDAQ Global Market and NASDAQ Capital Market are valued at the NASDAQ Official Closing Price (“NOCP”), or if lacking a NOCP, at the most recent bid quotation on the applicable NASDAQ Market. Debt securities (other than short-term obligations purchased with an original or remaining maturity of sixty days or less) and unlisted equity securities are generally valued on the basis of evaluated bids furnished to the Fund by an independent pricing service recommended by the investment adviser and approved by the Board of Trustees, which service determines valuations for normal, institutional-size trading units of such securities using market information, transactions for comparable securities and various relationships between securities which are generally recognized by institutional traders. Senior loans are priced at bid prices supplied by an independent pricing service, if available. Broker-dealer bid quotations may also be used to value debt and equity securities and senior loans where an independent pricing service is unable to price a security or where an independent pricing service does not provide a reliable price for the security. Forward foreign currency contracts are valued utilizing interpolated prices determined from information provided by an independent pricing service. Domestic exchange-traded single equity option contracts are valued at the mean of the National Best Bid and Offer quotations. Investments in other open-end investment companies are valued at their net asset value each day. Short-term obligations purchased with an original or remaining maturity of sixty days or less are valued at amortized cost, which approximates market value. Securities for which market quotations are not readily available are valued at fair value as determined in good faith by the Funds’ investment adviser using consistently applied procedures under the general supervision of the Board of Trustees.
The Funds may hold securities traded in foreign markets. Foreign securities are valued at the closing market price in the foreign market. However, if events occurring after the
| 70
Notes to Financial Statements (continued)
September 30, 2012
close of the foreign market (but before the close of regular trading on the New York Stock Exchange) are believed to materially affect the value of those securities, such securities are fair valued pursuant to procedures approved by the Board of Trustees. When fair valuing securities, the Funds may, among other things, use modeling tools or other processes that may take into account factors such as securities market activity and/or significant events that occur after the close of the foreign market and before the Funds calculate their net asset values. As of September 30, 2012, approximately 20% of the market value of Global Equity and Income Fund’s investments was fair valued pursuant to procedures approved by the Board of Trustees as events occurring after the close of the foreign market were believed to materially affect the value of those securities. Additionally, one security held by the Fund for which market quotations were not readily available as of September 30, 2012 was fair valued pursuant to procedures approved by the Board of Trustees, amounting to 0.9% of net assets.
b. Investment Transactions and Related Investment Income. Investment transactions are accounted for on a trade date plus one basis for daily net asset value calculation. However, for financial reporting purposes, investment transactions are reported on trade date. Dividend income is recorded on ex-dividend date, or in the case of certain foreign securities, as soon as a Fund is notified, and interest income is recorded on an accrual basis. Interest income is increased by the accretion of discount and decreased by the amortization of premium. Periodic principal adjustments for inflation-protected securities are recorded to interest income. In determining net gain or loss on securities sold, the cost of securities has been determined on an identified cost basis. Investment income, non-class specific expenses and realized and unrealized gains and losses are allocated on a pro rata basis to each class based on the relative net assets of each class to the total net assets of the Fund.
c. Foreign Currency Translation. The books and records of the Funds are maintained in U.S. dollars. The values of securities, currencies and other assets and liabilities denominated in currencies other than U.S. dollars are translated into U.S. dollars based upon foreign exchange rates prevailing at the end of the period. Purchases and sales of investment securities, income and expenses are translated on the respective dates of such transactions.
Since the values of investment securities are presented at the foreign exchange rates prevailing at the end of the period, it is not practical to isolate that portion of the results of operations arising from changes in exchange rates from fluctuations which arise due to changes in market prices of investment securities. Such changes are included with the net realized and unrealized gain or loss on investments.
Net realized foreign exchange gains or losses arise from sales of foreign currency, currency gains or losses realized between the trade and settlement dates on securities transactions and the difference between the amounts of dividends, interest and foreign withholding taxes recorded on the Funds’ books and the U.S. dollar equivalent of the
71 |
Notes to Financial Statements (continued)
September 30, 2012
amounts actually received or paid. Net unrealized foreign exchange gains and losses arise from changes in the value of assets and liabilities, other than investment securities, at the end of the fiscal period, resulting from changes in exchange rates.
Each Fund may use foreign currency exchange contracts to facilitate transactions in foreign-denominated investments. Losses may arise from changes in the value of the foreign currency or if the counterparties do not perform under the contracts’ terms.
d. Forward Foreign Currency Contracts. The Funds may enter into forward foreign currency contracts, including forward foreign cross currency contracts to acquire exposure to foreign currencies or to hedge the Funds’ investments against currency fluctuation. A contract can also be used to offset a previous contract. These contracts involve market risk in excess of the unrealized gain or loss reflected in the Funds’ Statements of Assets and Liabilities. The U.S. dollar value of the currencies a Fund has committed to buy or sell represents the aggregate exposure to each currency the Fund has acquired or hedged through currency contracts outstanding at period end. Gains or losses are recorded for financial statement purposes as unrealized until settlement date. Risks may arise upon entering into these contracts from the potential inability of counterparties to meet the terms of their contracts and from unanticipated movements in the value of a foreign currency relative to the U.S. dollar. Certain contracts may require the movement of cash and/or securities as collateral for the Funds’ or counterparty’s net obligations under the contracts.
e. Option Contracts. The Funds may enter into option contracts. When a Fund purchases an option, it pays a premium and the option is subsequently marked to market to reflect current value. Premiums paid for purchasing options which expire are treated as realized losses. Premiums paid for purchasing options which are exercised are added to the cost or deducted from the proceeds on the underlying instrument to determine the realized gain or loss. If the Fund enters into a closing sale transaction, the difference between the premium paid and the proceeds of the closing sale transaction is treated as a realized gain or loss. The risk associated with purchasing options is limited to the premium paid.
When a Fund writes an option, an amount equal to the net premium received (the premium less commission) is recorded as a liability and is subsequently adjusted to the current value. Net premiums received for written options which expire are treated as realized gains. Net premiums received for written options which are exercised are deducted from the cost or added to the proceeds on the underlying instrument or closing purchase transaction to determine the realized gain or loss. The Fund, as writer of a written option, bears the risk of an unfavorable change in the market value of the instrument underlying the written option.
Exchange-traded options are standardized contracts and are settled through a clearing house with fulfillment supported by the credit of the exchange. Therefore, counterparty
| 72
Notes to Financial Statements (continued)
September 30, 2012
credit risks to the Funds are reduced. Over-the-counter options are subject to the risk that the counterparty is unable or unwilling to meet its obligations under the option. For the year ended September 30, 2012, the Funds were not party to any over-the-counter options.
f. Federal and Foreign Income Taxes. The Trust treats each Fund as a separate entity for federal income tax purposes. Each Fund intends to meet the requirements of the Internal Revenue Code of 1986, as amended, applicable to regulated investment companies, and to distribute to its shareholders substantially all of its net investment income and any net realized capital gains at least annually. Management has performed an analysis of each Fund’s tax positions for the open tax years as of September 30, 2012 and has concluded that no provisions for income tax are required. The Funds’ federal tax returns for the prior three fiscal years remain subject to examination by the Internal Revenue Service. Management is not aware of any events that are reasonably possible to occur in the next twelve months that would result in the amounts of any unrecognized tax benefits significantly increasing or decreasing for the Funds. However, management’s conclusions regarding tax positions taken may be subject to review and adjustment at a later date based on factors including, but not limited to, new tax laws and accounting regulations and interpretations thereof.
A Fund may be subject to foreign withholding taxes on investment income and taxes on capital gains on investments that are accrued and paid based upon the Fund’s understanding of the tax rules and regulations that exist in the countries in which the Fund invests. Foreign withholding taxes on dividend and interest income are reflected on the Statements of Operations as a reduction of investment income, net of amounts eligible to be reclaimed. Dividends and interest receivable on the Statements of Assets and Liabilities are net of foreign withholding taxes. Foreign withholding taxes eligible to be reclaimed are reflected on the Statements of Assets and Liabilities as tax reclaims receivable. Capital gains taxes paid are included in net realized gain (loss) on investments in the Statements of Operations. Accrued but unpaid capital gains taxes are reflected as foreign taxes payable on the Statements of Assets and Liabilities, if applicable, and reduce unrealized gains on investments. In the event that realized gains on investments are subsequently offset by realized losses, taxes paid on realized gains may be returned to a Fund. Such amounts, if applicable, are reflected as foreign tax rebates receivable on the Statements of Assets and Liabilities and are recorded as a realized gain when received.
g. Dividends and Distributions to Shareholders. Dividends and distributions are recorded on ex-dividend date. The timing and characterization of certain income and capital gain distributions are determined annually in accordance with federal tax regulations, which may differ from accounting principles generally accepted in the United States of America. Permanent differences are primarily due to differing treatments for book and tax purposes of items such as net operating losses, paydown gains and losses, foreign currency transactions, return of capital and capital gain
73 |
Notes to Financial Statements (continued)
September 30, 2012
distributions from real estate investment trusts (“REITs”), defaulted bonds and premium amortization. Permanent book and tax basis differences relating to shareholder distributions will result in reclassifications to capital accounts. Temporary differences between book and tax distributable earnings are primarily due to deferred Trustees’ fees, forward foreign currency contract mark to market, wash sales, premium amortization, contingent payment debt instruments, trust preferred securities and basis adjustments for return of capital dividends. Distributions from net investment income and short-term capital gains are considered to be distributed from ordinary income for tax purposes.
The tax characterization of distributions is determined on an annual basis. The tax character of distributions paid to shareholders during the years ended September 30, 2012 and 2011 was as follows:
| | | | | | | | | | | | |
| | | 2012 Distributions Paid From: | |
Fund | | Ordinary Income | | | Long-Term
Capital Gains | | | Total | |
Global Equity and Income Fund | | $ | 7,423,009 | | | $ | — | | | $ | 7,423,009 | |
Growth Fund | | | 331,005 | | | | — | | | | 331,005 | |
Mid Cap Growth Fund | | | — | | | | — | | | | — | |
Value Fund | | | 17,981,701 | | | | — | | | | 17,981,701 | |
| |
| | | 2011 Distributions Paid From: | |
Fund | | Ordinary Income | | | Long-Term
Capital Gains | | | Total | |
Global Equity and Income Fund | | $ | 5,609,497 | | | $ | — | | | $ | 5,609,497 | |
Growth Fund | | | — | | | | — | | | | — | |
Mid Cap Growth Fund | | | — | | | | — | | | | — | |
Value Fund | | | 16,317,256 | | | | — | | | | 16,317,256 | |
| 74
Notes to Financial Statements (continued)
September 30, 2012
As of September 30, 2012, the components of distributable earnings on a tax basis were as follows:
| | | | | | | | | | | | | | | | |
| | | Global Equity
and Income
Fund | | | Growth
Fund | | | Mid Cap
Growth Fund | | | Value
Fund | |
Undistributed ordinary income | | $ | 12,311,098 | | | $ | 933,630 | | | $ | — | | | $ | 14,707,299 | |
Undistributed long-term capital gains | | | — | | | | — | | | | — | | | | — | |
| | | | | | | | | | | | | | | | |
Total undistributed earnings | | | 12,311,098 | | | | 933,630 | | | | — | | | | 14,707,299 | |
| | | | | | | | | | | | | | | | |
Capital loss carryforward: | | | | | | | | | | | | | | | | |
Short-term: | | | | | | | | | | | | | | | | |
Expires | | | | | | | | | | | | | | | | |
September 30, 2017 | | | — | | | | (52,780,165 | ) | | | (20,624,367 | ) | | | — | |
September 30, 2018 | | | (25,714,481 | ) | | | (34,679,944 | ) | | | (18,569,793 | ) | | | (6,350,604 | ) |
| | | | | | | | | | | | | | | | |
Total capital loss carryforward | | | (25,714,481 | ) | | | (87,460,109 | ) | | | (39,194,160 | ) | | | (6,350,604 | ) |
Late year ordinary and post-October capital loss deferrals* | | | (574,376 | ) | | | (63,747 | ) | | | (3,686,631 | ) | | | (5,542,012 | ) |
Unrealized appreciation | | | 57,767,227 | | | | 25,692,156 | | | | 14,769,358 | | | | 221,463,427 | |
| | | | | | | | | | | | | | | | |
Total accumulated earnings (losses) | | $ | 43,789,468 | | | $ | (60,898,070 | ) | | $ | (28,111,433 | ) | | $ | 224,278,110 | |
| | | | | | | | | | | | | | | | |
Capital loss carryforward utilized in the current year | | $ | 26,195,241 | | | $ | 4,357,796 | | | $ | 5,393,673 | | | $ | 48,937,752 | |
| | | | | | | | | | | | | | | | |
| * | Under current tax law, capital losses, foreign currency losses, and losses on passive foreign investment companies and contingent payment debt instruments after October 31 or December 31, as applicable, may be deferred and treated as occurring on the first day of the following taxable year. |
On December 22, 2010, the Regulated Investment Company Modernization Act of 2010 (the “Act”) was enacted. Under the Act, for taxable years beginning after December 22, 2010, capital losses may be carried forward indefinitely. Rules in effect previously limited the carryforward period to eight years. Capital loss carryforwards generated in taxable years beginning after the effective date of the Act must be fully used before capital loss carryforwards generated in taxable years prior to effective date of the Act; therefore, under certain circumstances, capital loss carryforwards available as of the report date, if any, may expire unused. Additionally, capital losses realized in taxable years beginning after the effective date of the Act are carried over in the character (short-term or long-term) realized. Rules in effect previously treated all capital loss carryforwards as short-term.
h. Repurchase Agreements. It is each Fund’s policy that the market value of the collateral for repurchase agreements be at least equal to 102% of the repurchase price,
75 |
Notes to Financial Statements (continued)
September 30, 2012
including interest. Certain repurchase agreements are tri-party arrangements whereby the collateral is held in a segregated account for the benefit of the Fund and on behalf of the counterparty. Repurchase agreements could involve certain risks in the event of default or insolvency of the counterparty, including possible delays or restrictions upon a Fund’s ability to dispose of the underlying securities.
i. Securities Lending. The Funds have entered into an agreement with State Street Bank and Trust Company (“State Street Bank”), as agent of the Funds, to lend securities to certain designated borrowers. The loans are collateralized with cash or securities in an amount equal to at least 105% or 102% of the market value (including accrued interest) of the loaned international or domestic securities, respectively, when the loan is initiated. Thereafter, the value of the collateral must remain at least 102% of the market value (including accrued interest) of loaned securities for U.S. equities and U.S. corporate debt; at least 105% of the market value (including accrued interest) of loaned securities for non-U.S. equities; and at least 100% of the market value (including accrued interest) of loaned securities for U.S. Government securities, sovereign debt issued by non-U.S. Governments and non-U.S. corporate debt. In the event that the market value of the collateral falls below the required percentages described above, the borrower will deliver additional collateral on the next business day. As with other extensions of credit, the Funds may bear the risk of loss with respect to the investment of the collateral. The Funds invest cash collateral in short-term investments, a portion of the income from which is remitted to the borrowers and the remainder allocated between the Funds and State Street Bank as lending agent.
For the year ended September 30, 2012, none of the Funds had loaned securities under this agreement.
j. Indemnifications. Under the Trust’s organizational documents, its officers and Trustees are indemnified against certain liabilities arising out of the performance of their duties to the Funds. Additionally, in the normal course of business, the Funds enter into contracts with service providers that contain general indemnification clauses. The Funds’ maximum exposure under these arrangements is unknown as this would involve future claims that may be made against the Funds that have not yet occurred. However, based on experience, the Funds expect the risk of loss to be remote.
k. New Accounting Pronouncement. In December 2011, Accounting Standards Update (“ASU”) No. 2011-11, “Disclosures about Offsetting Assets and Liabilities,” was issued and is effective for interim and annual periods beginning after January 1, 2013. The ASU enhances disclosure requirements with respect to an entity’s rights of setoff and related arrangements associated with its financial and derivative instruments. Management is currently evaluating the impact the adoption of ASU 2011-11 may have on the Funds’ financial statement disclosures.
3. Fair Value Measurements. In accordance with accounting standards related to fair value measurements and disclosures, the Funds have categorized the inputs utilized in
| 76
Notes to Financial Statements (continued)
September 30, 2012
determining the value of each Fund’s assets or liabilities. These inputs are summarized in the three broad levels listed below:
| | • | | Level 1 – quoted prices in active markets for identical assets or liabilities; |
| | • | | Level 2 – prices determined using other significant inputs that are observable either directly, or indirectly through corroboration with observable market data (which could include quoted prices for similar assets or liabilities, interest rates, credit risk, etc.); and |
| | • | | Level 3 – prices determined using significant unobservable inputs when quoted prices or observable inputs are unavailable such as when there is little or no market activity for an asset or liability (unobservable inputs reflect each Fund’s own assumptions in determining the fair value of assets or liabilities and would be based on the best information available). |
The inputs or methodology used for valuing securities are not necessarily an indication of the risk associated with investing in those securities.
The following is a summary of the inputs used to value the Funds’ investments as of September 30, 2012, at value:
Global Equity and Income Fund
Asset Valuation Inputs
| | | | | | | | | | | | | | | | |
Description | | Level 1 | | | Level 2 | | | Level 3 | | | Total | |
Common Stocks | | | | | | | | | | | | | | | | |
Belgium | | $ | — | | | $ | 12,666,076 | | | $ | — | | | $ | 12,666,076 | |
China | | | 8,973,061 | | | | 9,778,413 | | | | — | | | | 18,751,474 | |
Denmark | | | — | | | | 7,803,698 | | | | — | | | | 7,803,698 | |
France | | | — | | | | 14,778,030 | | | | — | | | | 14,778,030 | |
Germany | | | — | | | | 8,183,280 | | | | — | | | | 8,183,280 | |
Hong Kong | | | — | | | | 6,115,163 | | | | — | | | | 6,115,163 | |
Japan | | | — | | | | 11,782,143 | | | | — | | | | 11,782,143 | |
Netherlands | | | 11,419,680 | | | | 11,175,449 | | | | — | | | | 22,595,129 | |
Russia | | | — | | | | 8,154,764 | | | | — | | | | 8,154,764 | |
Sweden | | | — | | | | 22,038,858 | | | | — | | | | 22,038,858 | |
United Kingdom | | | — | | | | 78,484,405 | | | | — | | | | 78,484,405 | |
All Other Common Stocks(a) | | | 395,801,045 | | | | — | | | | — | | | | 395,801,045 | |
| | | | | | | | | | | | | | | | |
Total Common Stocks | | | 416,193,786 | | | | 190,960,279 | | | | — | | | | 607,154,065 | |
| | | | | | | | | | | | | | | | |
77 |
Notes to Financial Statements (continued)
September 30, 2012
Global Equity and Income Fund (continued)
Asset Valuation Inputs (continued)
| | | | | | | | | | | | | | | | |
Description | | Level 1 | | | Level 2 | | | Level 3 | | | Total | |
Bonds and Notes | | | | | | | | | | | | | | | | |
Non-Convertible Bonds | | | | | | | | | | | | | | | | |
Korea | | $ | — | | | $ | 4,910,207 | | | $ | 2,528,229 | | | $ | 7,438,436 | |
United States | | | 37,985 | | | | 143,270,372 | | | | 638,272 | | | | 143,946,629 | |
All Other Non-Convertible Bonds(a) | | | — | | | | 87,112,792 | | | | — | | | | 87,112,792 | |
| | | | | | | | | | | | | | | | |
Total Non-Convertible Bonds | | | 37,985 | | | | 235,293,371 | | | | 3,166,501 | | | | 238,497,857 | |
| �� | | | | | | | | | | | | | | | |
Convertible Bonds(a) | | | — | | | | 6,806,665 | | | | — | | | | 6,806,665 | |
Municipals(a) | | | — | | | | 493,822 | | | | — | | | | 493,822 | |
| | | | | | | | | | | | | | | | |
Total Bonds and Notes | | | 37,985 | | | | 242,593,858 | | | | 3,166,501 | | | | 245,798,344 | |
| | | | | | | | | | | | | | | | |
Senior Loans(a) | | | — | | | | 5,540,683 | | | | — | | | | 5,540,683 | |
Preferred Stocks | | | | | | | | | | | | | | | | |
Convertible Preferred Stocks(a) | | | 3,153,049 | | | | — | | | | — | | | | 3,153,049 | |
Non-Convertible Preferred Stock(a) | | | — | | | | 637,990 | | | | — | | | | 637,990 | |
| | | | | | | | | | | | | | | | |
Total Preferred Stocks | | | 3,153,049 | | | | 637,990 | | | | — | | | | 3,791,039 | |
| | | | | | | | | | | | | | | | |
Short-Term Investments | | | — | | | | 63,640,034 | | | | — | | | | 63,640,034 | |
| | | | | | | | | | | | | | | | |
Total Investments | | | 419,384,820 | | | | 503,372,844 | | | | 3,166,501 | | | | 925,924,165 | |
| | | | | | | | | | | | | | | | |
Forward Foreign Currency Contracts (unrealized appreciation) | | | — | | | | 73,969 | | | | — | | | | 73,969 | |
| | | | | | | | | | | | | | | | |
Total | | $ | 419,384,820 | | | $ | 503,446,813 | | | $ | 3,166,501 | | | $ | 925,998,134 | |
| | | | | | | | | | | | | | | | |
Liability Valuation Inputs
| | | | | | | | | | | | | | | | |
Description | | Level 1 | | | Level 2 | | | Level 3 | | | Total | |
Forward Foreign Currency Contracts (unrealized depreciation) | | $ | — | | | $ | (144,368 | ) | | $ | — | | | $ | (144,368 | ) |
| | | | | | | | | | | | | | | | |
| (a) | Details of the major categories of the Fund’s investments are reflected within the Portfolio of Investments. |
| 78
Notes to Financial Statements (continued)
September 30, 2012
Growth Fund
Asset Valuation Inputs
| | | | | | | | | | | | | | | | |
Description | | Level 1 | | | Level 2 | | | Level 3 | | | Total | |
Common Stocks(a) | | $ | 146,469,769 | | | $ | — | | | $ | — | | | $ | 146,469,769 | |
Short-Term Investments | | | — | | | | 2,143,051 | | | | — | | | | 2,143,051 | |
| | | | | | | | | | | | | | | | |
Total | | $ | 146,469,769 | | | $ | 2,143,051 | | | $ | — | | | $ | 148,612,820 | |
| | | | | | | | | | | | | | | | |
| (a) | Details of the major categories of the Fund’s investments are reflected within the Portfolio of Investments. |
For the year ended September 30, 2012, there were no transfers between Levels 1, 2 and 3.
Mid Cap Growth Fund
Asset Valuation Inputs
| | | | | | | | | | | | | | | | |
Description | | Level 1 | | | Level 2 | | | Level 3 | | | Total | |
Common Stocks(a) | | $ | 99,909,807 | | | $ | — | | | $ | — | | | $ | 99,909,807 | |
Short-Term Investments | | | — | | | | 2,544,137 | | | | — | | | | 2,544,137 | |
| | | | | | | | | | | | | | | | |
Total | | $ | 99,909,807 | | | $ | 2,544,137 | | | $ | — | | | $ | 102,453,944 | |
| | | | | | | | | | | | | | | | |
| (a) | Details of the major categories of the Fund’s investments are reflected within the Portfolio of Investments. |
For the year ended September 30, 2012, there were no transfers between Levels 1, 2 and 3.
Value Fund
Asset Valuation Inputs
| | | | | | | | | | | | | | | | |
Description | | Level 1 | | | Level 2 | | | Level 3 | | | Total | |
Common Stocks(a) | | $ | 1,353,257,308 | | | $ | — | | | $ | — | | | $ | 1,353,257,308 | |
Short-Term Investments | | | — | | | | 24,564,851 | | | | — | | | | 24,564,851 | |
| | | | | | | | | | | | | | | | |
Total | | $ | 1,353,257,308 | | | $ | 24,564,851 | | | $ | — | | | $ | 1,377,822,159 | |
| | | | | | | | | | | | | | | | |
| (a) | Details of the major categories of the Fund’s investments are reflected within the Portfolio of Investments. |
For the year ended September 30, 2012, there were no transfers between Levels 1, 2 and 3.
79 |
Notes to Financial Statements (continued)
September 30, 2012
The following is a reconciliation of Level 3 investments for which significant unobservable inputs were used to determine fair values as of September 30, 2012:
Global Equity and Income Fund
Asset Valuation Inputs
| | | | | | | | | | | | | | | | | | | | |
Investments in Securities | | Balance as of
September 30,
2011 | | | Accrued
Discounts
(Premiums) | | | Realized
Gain
(Loss) | | | Change in
Unrealized
Appreciation
(Depreciation) | | | Purchases | |
Bonds and Notes | | | | | | | | | | | | | | | | | | | | |
Non-Convertible Bonds | | | | | | | | | | | | | | | | | | | | |
Korea | | $ | 351,758 | | | $ | (11,411 | ) | | $ | — | | | $ | 177,366 | | | $ | 2,010,516 | |
Supranationals | | | 983,784 | | | | 229 | | | | (168,909 | ) | | | 60,154 | | | | — | |
United States | | | 10,000 | | | | 688 | | | | (22,067 | ) | | | 72,201 | | | | 590,550 | |
Preferred Stocks | | | | | | | | | | | | | | | | | | | | |
Non-Convertible Preferred Stocks | | | | | | | | | | | | | | | | | | | | |
United States | | | 409,200 | | | | — | | | | — | | | | — | | | | — | |
| | | | | | | | | | | | | | | | | | | | |
Total | | $ | 1,754,742 | | | $ | (10,494 | ) | | $ | (190,976 | ) | | $ | 309,721 | | | $ | 2,601,066 | |
| | | | | | | | | | | | | | | | | | | | |
| | | | | |
Investments in Securities | | Sales | | | Transfers
into Level 3 | | | Transfers
out of
Level 3 | | | Balance as of
September 30,
2012 | | | Change in
Unrealized
Appreciation
(Depreciation)
from
Investments
Still Held at
September 30,
2012 | |
Bonds and Notes | | | | | | | | | | | | | | | | | | | | |
Non-Convertible Bonds | | | | | | | | | | | | | | | | | | | | |
Korea | | $ | — | | | $ | — | | | $ | — | | | $ | 2,528,229 | | | $ | 177,366 | |
Supranationals | | | (875,258 | ) | | | — | | | | — | | | | — | | | | — | |
United States | | | (13,100 | ) | | | — | | | | — | | | | 638,272 | | | | 47,722 | |
Preferred Stocks | | | | | | | | | | | | | | | | | | | | |
Non-Convertible Preferred Stocks | | | | | | | | | | | | | | | | | | | | |
United States | | | — | | | | — | | | | (409,200 | ) | | | — | | | | — | |
| | | | | | | | | | | | | | | | | | | | |
Total | | $ | (888,358 | ) | | $ | — | | | $ | (409,200 | ) | | $ | 3,166,501 | | | $ | 225,088 | |
| | | | | | | | | | | | | | | | | | | | |
| 80
Notes to Financial Statements (continued)
September 30, 2012
A preferred stock valued at $409,200 was transferred from Level 3 to Level 2 during the period ended September 30, 2012. At September 30, 2011, this security was valued using broker-dealer bid quotations based on inputs unobservable to the Fund as an independent pricing service did not provide a reliable price for the security; at September 30, 2012, this security was valued on the basis of evaluated bids furnished to the Fund by an independent pricing service in accordance with the Fund’s valuation policies.
All transfers are recognized as of the beginning of the reporting period.
4. Derivatives. Derivative instruments are defined as financial instruments whose value and performance are based on the value and performance of another security or financial instrument. Derivative instruments that Global Equity and Income Fund and Mid Cap Growth Fund used during the period include forward foreign currency contracts and option contracts.
Global Equity and Income Fund is subject to the risk that changes in foreign currency exchange rates will have an unfavorable effect on the value of Fund assets denominated in foreign currencies. The Fund may enter into forward foreign currency contracts for hedging purposes to protect the value of the Fund’s holdings of foreign securities. The Fund may also use forward foreign currency contracts to gain exposure to foreign currencies, regardless of whether securities denominated in such currencies are held in the Fund. During the year ended September 30, 2012, Global Equity and Income Fund engaged in forward foreign currency transactions for hedging purposes and to gain exposure to foreign currencies.
Mid Cap Growth Fund is subject to the risk of unpredictable declines in the value of individual equity securities and periods of below-average performance in individual securities or in the equity market as a whole. The Fund may use purchased put options and written call options to hedge against a decline in value of an equity security that it owns, and may use written put options to offset the cost of options used for hedging purposes. The Fund may also use purchased call options to gain exposure to an equity security without committing the capital required to buy it, while also limiting the downside risk associated with owning it. During the year ended September 30, 2012, Mid Cap Growth Fund engaged in purchased put and written call options for hedging purposes, written put options to offset the cost of options used for hedging purposes, and in purchased call options to gain exposure to equity securities.
Global Equity and Income Fund is party to agreements with counterparties that govern transactions in forward foreign currency contracts. The agreements contain credit-risk-related contingent features that allow the counterparties to terminate open contracts early if the net asset value of the Fund declines beyond a certain threshold. If such features were to be triggered, the counterparties could request immediate settlement of open contracts at current fair value. As of September 30, 2012, the fair value of derivative positions (including open trades) subject to credit-risk-related
81 |
Notes to Financial Statements (continued)
September 30, 2012
contingent features that are in a net liability position by counterparty, and the value of collateral pledged to counterparties for such contracts is as follows:
| | | | | | | | | | | | |
Fund | | Counterparty | | | Derivatives | | | Collateral Pledged | |
Global Equity and Income Fund | | | Barclays Bank PLC | | | $ | (124,182 | ) | | $ | — | |
Forward foreign currency contracts are subject to the risk that the counterparty will be unwilling or unable to meet its obligations under the contracts. Global Equity and Income Fund has mitigated this risk by entering into master netting agreements with counterparties that allow the Fund and the counterparty to offset amounts owed by each related to derivative contracts to one net amount payable by either the Fund or the counterparty. As of September 30, 2012, the maximum amount of loss that Global Equity and Income Fund would incur if counterparties failed to meet their obligations is $73,969 and the amount of loss that Global Equity and Income Fund would incur after taking into account master netting arrangements is $53,783.
Counterparty risk is managed based on policies and procedures established by the Fund’s adviser. Such policies and procedures may include, but are not limited to, minimum counterparty credit rating requirements, monitoring of counterparty credit default swap spreads and posting of collateral. Collateral is posted based on the requirements established under International Swaps and Derivatives Association (“ISDA”) agreements negotiated between the fund and the derivative counterparties. The risk of loss to a fund from counterparty default should be limited to the extent a Fund is undercollateralized; however, final settlement of a Fund’s claim against any collateral received may be subject to bankruptcy court proceedings.
The following is a summary of derivative instruments for Global Equity and Income Fund as of September 30, 2012:
| | | | |
Statements of Assets and Liabilities Caption | | Foreign
Exchange
Contracts | |
Assets | | | | |
Unrealized appreciation on forward foreign currency contracts | | $ | 73,969 | |
Liabilities | | | | |
Unrealized depreciation on forward foreign currency contracts | | | (144,368 | ) |
| 82
Notes to Financial Statements (continued)
September 30, 2012
Transactions in derivative instruments for Global Equity and Income Fund during the year ended September 30, 2012, were as follows:
| | | | |
Statements of Operations Caption | | Foreign
Exchange
Contracts | |
Net Realized Gain (Loss) on: | | | | |
Foreign currency transactions* | | $ | (910,521 | ) |
Net Change in Unrealized Appreciation (Depreciation) on: | | | | |
Foreign currency translations* | | | 119,837 | |
| * | Represents realized loss and change in unrealized appreciation (depreciation), respectively, for forward foreign currency contracts during the period. |
Transactions in derivative instruments for Mid Cap Growth Fund during the year ended September 30, 2012 were as follows:
| | | | |
Statements of Operations Caption | | Equity
Contracts | |
Net Realized Gain (Loss) on: | | | | |
Investments* | | $ | (1,307,409 | ) |
Options written | | | (43,815 | ) |
| * | Represents realized loss on purchased options during the period. |
As the Funds value their derivatives at fair value and recognize changes in fair value through the Statements of Operations, they do not qualify for hedge accounting under authoritative guidance for derivative instruments. The Funds’ investments in derivatives may represent an economic hedge; however, they are considered to be non-hedge transactions for the purpose of these disclosures.
The volume of forward foreign currency contract activity, as a percentage of net assets, for Global Equity and Income Fund, based on gross month-end notional amounts outstanding during the period, including long and short positions at absolute value, was as follows for the year ended September 30, 2012:
| | | | |
Global Equity and Income Fund | | Forwards | |
Average Notional Amount Outstanding | | | 1.15 | % |
Highest Notional Amount Outstanding | | | 1.80 | % |
Lowest Notional Amount Outstanding | | | 0.80 | % |
Notional Amount Outstanding as of September 30, 2012 | | | 1.01 | % |
Notional amounts outstanding at the end of the prior period are included in the average notional amount outstanding.
83 |
Notes to Financial Statements (continued)
September 30, 2012
The volume of option contracts activity, as a percentage of net assets, for Mid Cap Growth Fund, based on month-end and/or daily market values of equity securities underlying purchased and written options, at absolute value, was as follows for the year ended September 30, 2012:
| | | | | | | | | | | | | | | | |
Mid Cap Growth Fund* | | Call Options
Written | | | Put Options Written | | | Call Options Purchased | | | Put Options
Purchased | |
Average Market Value of Underlying Securities | | | 0.03 | % | | | 0.04 | % | | | 0.16 | % | | | 2.12 | % |
Highest Market Value of Underlying Securities | | | 0.88 | % | | | 2.64 | % | | | 4.11 | % | | | 18.56 | % |
Lowest Market Value of Underlying Securities | | | 0.00 | % | | | 0.00 | % | | | 0.00 | % | | | 0.00 | % |
Market Value of Underlying Securities as of September 30, 2012 | | | 0.00 | % | | | 0.00 | % | | | 0.00 | % | | | 0.00 | % |
| * | Market value of underlying securities is determined by multiplying option shares by the price of the option’s underlying security, as determined by the Fund’s Pricing Policies and Procedures. |
The following is a summary of Mid Cap Growth Fund’s written option activity:
| | | | | | | | |
| | | Number of Contracts | | | Premiums | |
Outstanding at 9/30/2011 | | | — | | | $ | — | |
Options written | | | 44,139 | | | | 964,918 | |
Options terminated in closing purchase transactions | | | (44,139 | ) | | | (964,918 | ) |
Options exercised | | | — | | | | — | |
Options expired | | | — | | | | — | |
| | | | | | | | |
Outstanding at 9/30/2012 | | | — | | | $ | — | |
| | | | | | | | |
5. Purchases and Sales of Securities. For the year ended September 30, 2012, purchases and sales of securities (excluding short-term investments and U.S. Government/Agency securities and including paydowns) were as follows:
| | | | | | | | |
Fund | | Purchases | | | Sales | |
Global Equity and Income Fund | | $ | 472,290,052 | | | $ | 168,679,880 | |
Growth Fund | | | 31,129,825 | | | | 20,857,089 | |
Mid Cap Growth Fund | | | 193,289,639 | | | | 207,771,922 | |
Value Fund | | | 309,474,308 | | | | 336,968,880 | |
For the year ended September 30, 2012, purchases and sales of U.S. Government/Agency securities by the Global Equity and Income Fund were $34,914,871 and $15,628,920, respectively.
| 84
Notes to Financial Statements (continued)
September 30, 2012
6. Management Fees and Other Transactions with Affiliates.
a. Management Fees. Loomis, Sayles & Company, L.P. (“Loomis Sayles”) serves as investment adviser to each Fund. Separate management agreements for each Fund in effect for the year ended September 30, 2012, provided for fees at the following annual percentage rates of each Fund’s average daily net assets:
| | | | |
Fund | | Percentage of
Average
Daily Net Assets | |
Global Equity and Income Fund | | | 0.75 | % |
Growth Fund | | | 0.50 | % |
Mid Cap Growth Fund | | | 0.75 | % |
Value Fund | | | 0.50 | % |
Loomis Sayles has given binding undertakings to the Funds to waive management fees and/or reimburse certain expenses to limit the Funds’ operating expenses, exclusive of acquired fund fees and expenses, brokerage expenses, interest expense, taxes and extraordinary expenses. These undertakings are in effect until January 31, 2013 and are reevaluated on an annual basis. Management fees payable, as reflected on the Statements of Assets and Liabilities, is net of waivers and/or expense reimbursements, if any, pursuant to these undertakings.
For the year ended September 30, 2012, the expense limits as a percentage of average daily net assets under the expense limitation agreements were as follows:
| | | | | | | | | | | | | | | | | | | | |
| | | Expense Limit as a Percentage of Average Daily
Net Assets | |
Fund | | Class A | | | Class B | | | Class C | | | Class Y | | | Admin Class | |
Global Equity and Income Fund | | | 1.25 | % | | | — | | | | 2.00 | % | | | 1.00 | % | | | — | |
Growth Fund | | | 1.25 | % | | | 2.00 | % | | | 2.00 | % | | | 1.00 | % | | | — | |
Mid Cap Growth Fund | | | 1.25 | % | | | — | | | | 2.00 | % | | | 1.00 | % | | | — | |
Value Fund | | | 1.10 | % | | | 1.85 | % | | | 1.85 | % | | | 0.85 | % | | | 1.35 | % |
Loomis Sayles shall be permitted to recover expenses it has borne under the expense limitation agreements (whether through waiver of its management fees or otherwise) on a class by class basis in later periods to the extent the expenses of a class fall below a class’ expense limits, provided, however, that a class is not obligated to pay such waived/reimbursed fees or expenses more than one year after the end of the fiscal year in which the fees or expenses were waived/reimbursed.
85 |
Notes to Financial Statements (continued)
September 30, 2012
For the year ended September 30, 2012, the management fees and waivers of management fees for each Fund were as follows:
| | | | | | | | | | | | | | | | | | | | |
| | | Gross
Management
Fees | | | Waivers of
Management
Fees1 | | | Net
Management
Fees | | | Percentage of
Average
Daily Net Assets | |
Fund | | | | | Gross | | | Net | |
Global Equity and Income Fund | | $ | 5,184,567 | | | $ | — | | | $ | 5,184,567 | | | | 0.75 | % | | | 0.75 | % |
Growth Fund | | | 646,746 | | | | — | | | | 646,746 | | | | 0.50 | % | | | 0.50 | % |
Mid Cap Growth Fund | | | 794,290 | | | | 131,776 | | | | 662,514 | | | | 0.75 | % | | | 0.63 | % |
Value Fund | | | 6,406,256 | | | | — | | | | 6,406,256 | | | | 0.50 | % | | | 0.50 | % |
| 1 | Management fee waivers are subject to possible recovery until September 30, 2013. |
No expenses were recovered for any of the Funds during the year ended September 30, 2012 under the terms of the expense limitation agreements.
Certain officers and employees of Loomis Sayles are also officers or Trustees of the Trust. Loomis Sayles’ general partner is indirectly owned by Natixis Global Asset Management, L.P. (“Natixis US”), which is part of Natixis Global Asset Management, an international asset management group based in Paris, France.
b. Service and Distribution Fees. NGAM Distribution, L.P. (“NGAM Distribution”), which is a wholly-owned subsidiary of Natixis US, has entered into a distribution agreement with the Trust. Pursuant to this agreement, NGAM Distribution serves as principal underwriter of the Funds of the Trust.
Pursuant to Rule 12b-1 under the 1940 Act, the Trust has adopted a Service Plan relating to each Fund’s Class A shares (the “Class A Plans”), a Distribution and Service Plan relating to each Fund’s Class B (if applicable) and Class C shares (the “Class B and Class C Plans”), and Value Fund has adopted a Distribution Plan relating to its Admin Class shares (the “Admin Class Plan”).
Under the Class A Plans, each Fund pays NGAM Distribution a monthly service fee at an annual rate not to exceed 0.25% of the average daily net assets attributable to the Funds’ Class A shares, as reimbursement for expenses incurred by NGAM Distribution in providing personal services to investors in Class A shares and/or the maintenance of shareholder accounts.
Under the Class B (if applicable) and Class C Plans, each Fund pays NGAM Distribution a monthly service fee at an annual rate not to exceed 0.25% of the average daily net assets attributable to the Funds’ Class B (if applicable) and Class C shares, as compensation for services provided by NGAM Distribution in providing personal
| 86
Notes to Financial Statements (continued)
September 30, 2012
services to investors in Class B (if applicable) and Class C shares and/or the maintenance of shareholder accounts.
Also under the Class B (if applicable) and Class C Plans, each Fund pays NGAM Distribution a monthly distribution fee at an annual rate of 0.75% of the average daily net assets attributable to the Funds’ Class B (if applicable) and Class C shares, as compensation for services provided by NGAM Distribution in connection with the marketing or sale of Class B (if applicable) and Class C shares.
Under the Admin Class Plan, Value Fund pays NGAM Distribution a monthly distribution fee at an annual rate not to exceed 0.25% of the average daily net assets attributable to the Fund’s Admin Class shares, as compensation for services provided by NGAM Distribution in connection with the marketing or sale of Admin Class shares or for payments made by NGAM Distribution to securities dealers or other financial intermediaries as commissions, asset-based sales charges or other compensation with respect to the sale of Admin Class shares, or for providing personal services to investors and/or the maintenance of shareholder accounts.
In addition, the Admin Class shares of Value Fund may pay NGAM Distribution an administrative service fee, at an annual rate not to exceed 0.25% of the average daily net assets attributable to Admin Class shares. These fees are subsequently paid to securities dealers or financial intermediaries for providing personal services and/or account maintenance for their customers who hold such shares.
For the year ended September 30, 2012, service and distribution fees for each Fund were as follows:
| | | | | | | | | | | | | | | | | | | | | | | | | | | | |
| | | Service Fees | | | Distribution Fees | |
Fund | | Class A | | | Class B | | | Class C | | | Admin
Class | | | Class B | | | Class C | | | Admin
Class | |
Global Equity and Income Fund | | $ | 402,507 | | | $ | — | | | $ | 476,325 | | | $ | — | | | $ | — | | | $ | 1,428,974 | | | $ | — | |
Growth Fund | | | 74,397 | | | | 5,707 | | | | 25,604 | | | | — | | | | 17,119 | | | | 76,812 | | | | — | |
Mid Cap Growth Fund | | | 114,316 | | | | — | | | | 6,929 | | | | — | | | | — | | | | 20,789 | | | | — | |
Value Fund | | | 326,936 | | | | 4,678 | | | | 23,179 | | | | 3 | | | | 14,035 | | | | 69,536 | | | | 7 | |
c. Administrative Fees. NGAM Advisors, L.P. (“NGAM Advisors”) provides certain administrative services for the Funds and contracts with State Street Bank to serve as sub-administrator. NGAM Advisors is a wholly-owned subsidiary of Natixis US. Pursuant to an agreement among Natixis Funds Trust I, Natixis Funds Trust II, Natixis Funds Trust IV, Gateway Trust (“Natixis Funds Trusts”), Loomis Sayles Funds I, Loomis Sayles Funds II (“Loomis Sayles Funds Trusts”), Hansberger International Series and NGAM Advisors, each Fund pays NGAM Advisors monthly its pro rata portion of fees
87 |
Notes to Financial Statements (continued)
September 30, 2012
equal to an annual rate of 0.0575% of the first $15 billion of the average daily net assets of the Natixis Funds Trusts, Loomis Sayles Funds Trusts and Hansberger International Series, 0.0500% of the next $15 billion, 0.0400% of the next $30 billion and 0.0350% of such assets in excess of $60 billion, subject to an annual aggregate minimum fee for the Natixis Funds Trusts, Loomis Sayles Funds Trusts and Hansberger International Series of $10 million, which is reevaluated on an annual basis.
For the year ended September 30, 2012, administrative fees for each Fund were as follows:
| | | | |
Fund | | Administrative
Fees | |
Global Equity and Income Fund | | $ | 314,448 | |
Growth Fund | | | 58,912 | |
Mid Cap Growth Fund | | | 48,278 | |
Value Fund | | | 583,746 | |
d. Sub-Transfer Agent Fees. NGAM distribution has entered into agreements, which include servicing agreements, with financial intermediaries that provide recordkeeping, processing, shareholder communications and other services to customers of the intermediaries that hold positions in the Funds and has agreed to compensate the intermediaries for providing those services. Intermediaries transact with the Funds primarily through the use of omnibus accounts on behalf of their customers who hold positions in the Funds. These services would have been provided by the Funds’ transfer agent and other service providers if the shareholders’ accounts were maintained directly at the Funds’ transfer agent. Accordingly, the Funds have agreed to reimburse NGAM Distribution for all or a portion of the servicing fees paid to these intermediaries. The reimbursement amounts (sub-transfer agent fees) paid to NGAM Distribution are subject to a current per-account equivalent fee limit approved by the Funds’ Board, which is based on fees for similar services paid to the Funds’ transfer agent and other service providers.
For the year ended September 30, 2012, sub-transfer agent fees (which are reflected in transfer agent fees and expenses in the Statements of Operations) for each Fund were as follows:
| | | | |
Fund | | Sub-Transfer
Agent Fees | |
Global Equity and Income Fund | | $ | 492,745 | |
Growth Fund | | | 63,992 | |
Mid Cap Growth Fund | | | 142,349 | |
Value Fund | | | 1,858,768 | |
| 88
Notes to Financial Statements (continued)
September 30, 2012
As of September 30, 2012, the Funds owe NGAM Distribution the following reimbursements for sub-transfer agent fees:
| | | | |
Fund | | Reimbursements
of Sub-Transfer
Agent Fees | |
Global Equity and Income Fund | | $ | 7,041 | |
Value Fund | | | 23,863 | |
As of September 30, 2012, NGAM Distribution owes the Funds the following for overpayments of sub-transfer agent fees:
| | | | |
Fund | | Overpayments of Sub-Transfer
Agent Fees | |
Growth Fund | | $ | 693 | |
Mid Cap Growth Fund | | | 2,267 | |
e. Commissions. Commissions (including CDSCs) on Fund shares retained by NGAM Distribution during the year ended September 30, 2012, were as follows:
| | | | |
Fund | | Commissions | |
Global Equity and Income Fund | | $ | 1,078,423 | |
Growth Fund | | | 65,179 | |
Mid Cap Growth Fund | | | 17,100 | |
Value Fund | | | 24,934 | |
f. Trustees Fees and Expenses. The Trust does not pay any compensation directly to its officers or Trustees who are directors, officers or employees of NGAM Advisors, NGAM Distribution, Natixis US or their affiliates. Effective January 1, 2012, the Chairperson of the Board receives a retainer fee at the annual rate of $265,000. The Chairperson does not receive any meeting attendance fees for Board of Trustees meetings or committee meetings that she attends. Each Independent Trustee (other than the Chairperson) receives, in the aggregate, a retainer fee at the annual rate of $95,000. Each Independent Trustee also receives a meeting attendance fee of $10,000 for each meeting of the Board of Trustees that he or she attends in person and $5,000 for each meeting of the Board of Trustees that he or she attends telephonically. In addition, each committee chairman receives an additional retainer fee at the annual rate of $15,000. Each Contract Review and Governance Committee member is compensated $6,000 for each Committee meeting that he or she attends in person and $3,000 for each meeting that he or she attends telephonically. Each Audit Committee member is compensated $7,500 for each Committee meeting that he or she attends in person and $3,750 for each meeting that he or she attends telephonically. These fees are allocated among the funds in the Natixis Funds Trusts, Loomis Sayles Funds Trusts
89 |
Notes to Financial Statements (continued)
September 30, 2012
and Hansberger International Series based on a formula that takes into account, among other factors, the relative net assets of each fund. Trustees are reimbursed for travel expenses in connection with attendance at meetings.
Prior to January 1, 2012, the Chairperson of the Board received a retainer fee at the annual rate of $250,000 and each Independent Trustee (other than the Chairperson) received, in aggregate, a retainer fee at the annual rate of $80,000. All other Trustee fees remain unchanged.
A deferred compensation plan (the “Plan”) is available to the Trustees on a voluntary basis. Deferred amounts remain in the Funds until distributed in accordance with the provisions of the Plan. The value of a participating Trustee’s deferral account is based on theoretical investments of deferred amounts, on the normal payment dates, in certain funds of the Natixis Funds Trusts, Loomis Sayles Funds Trusts and Hansberger International Series as designated by the participating Trustees. Changes in the value of participants’ deferral accounts are allocated pro rata among the funds in the Natixis Funds Trusts, Loomis Sayles Funds Trusts, and Hansberger International Series, and are normally reflected as Trustees’ fees and expenses in the Statements of Operations. The portions of the accrued obligations allocated to the Funds under the Plan are reflected as Deferred Trustees’ fees on the Statements of Assets and Liabilities.
g. Affiliated Ownership. At September 30, 2012, Loomis Sayles Funded Pension Plan and Trust (“Pension Plan”) and Loomis Sayles Employees’ Profit Sharing Retirement Plan (“Retirement Plan”) held shares of beneficial interest in the Funds representing the following percentages of net assets:
| | | | | | | | | | | | |
Fund | | Pension
Plan | | | Retirement
Plan | | | Total Affiliated
Ownership | |
Global Equity and Income Fund | | | 1.73 | % | | | 1.18 | % | | | 2.91 | % |
Growth Fund | | | 4.82 | % | | | 10.57 | % | | | 15.39 | % |
Mid Cap Growth Fund | | | 9.47 | % | | | 10.07 | % | | | 19.54 | % |
Value Fund | | | 0.65 | % | | | 1.16 | % | | | 1.81 | % |
Investment activities of affiliated shareholders could have material impacts on the Funds.
7. Line of Credit. Each Fund, together with certain other funds of Natixis Funds Trusts, Loomis Sayles Funds Trusts and Hansberger International Series, participates in a $200,000,000 committed unsecured line of credit provided by State Street Bank, with an individual limit of $125,000,000 for each fund that participates in the line of credit. Interest is charged to each participating fund based on its borrowings at a rate per annum equal to the greater of the Federal Funds rate or overnight LIBOR, plus 1.25%. In addition, a commitment fee of 0.10% per annum, payable at the end of each calendar
| 90
Notes to Financial Statements (continued)
September 30, 2012
quarter, is accrued and apportioned among the participating funds based on their average daily unused portion of the line of credit. Prior to April 19, 2012, the commitment fee was 0.125% per annum.
For the year ended September 30, 2012, none of the Funds had borrowings under these agreements.
8. Brokerage Commission Recapture. Each Fund has entered into agreements with certain brokers whereby the brokers will rebate a portion of brokerage commissions. All amounts rebated by the brokers are returned to the Funds under such agreements and are included in realized gains on investments on the Statements of Operations. For the year ended September 30, 2012, amounts rebated under these agreements were as follows:
| | | | |
Fund | | Rebates | |
Global Equity and Income Fund | | $ | 20,277 | |
Growth Fund | | | 4,811 | |
Mid Cap Growth Fund | | | 22,617 | |
Value Fund | | | 65,711 | |
9. Concentration of Risk. Each Fund’s investments in foreign securities are subject to foreign currency fluctuations, higher volatility than U.S. securities, varying degrees of regulation and limited liquidity. Greater political, economic, credit and information risks are also associated with foreign securities.
10. Concentration of Ownership. From time to time, the Funds may have a concentration of one or more accounts constituting a significant percentage of shares outstanding. Investment activities by holders of such accounts could have material impacts on the Funds. As of September 30, 2012, based on management’s evaluation of the shareholder account base, certain Funds had accounts representing controlling ownership of more than 5% of the Fund’s total outstanding shares. The number of such accounts, including affiliated accounts, based on accounts that represent more than 5% of an individual class of shares, and the aggregate percentage of net assets represented by such holdings was as follows:
| | | | | | | | | | | | | | | | |
Fund | | Number of > 5%
Non-Affiliated
Shareholders | | | Percentage of Non-Affiliated
Ownership | | | Percentage of
Affiliated Ownership (Note 6) | | | Total Percentage of
Ownership | |
Growth Fund | | | 2 | | | | 15.42 | % | | | 15.39 | % | | | 30.81 | % |
Mid Cap Growth Fund | | | 1 | | | | 10.37 | % | | | 19.54 | % | | | 29.91 | % |
Shareholder positions in the Funds may be held by intermediaries utilizing omnibus accounts. The Funds may not have information on the individual shareholder accounts underlying omnibus accounts; therefore, there could be other 5% shareholders in addition to those disclosed in the table above.
91 |
Notes to Financial Statements (continued)
September 30, 2012
11. Capital Shares. Each Fund may issue an unlimited number of shares of beneficial interest, without par value. Transactions in capital shares were as follows:
| | | | | | | | | | | | | | | | |
| |
| Year Ended
September 30, 2012 |
| |
| Year Ended
September 30, 2011 |
|
Global Equity and Income Fund | | | Shares | | | | Amount | | | | Shares | | | | Amount | |
| Class A | | | | | | | | | | | | | | | | |
Issued from the sale of shares | | | 8,720,812 | | | $ | 141,220,300 | | | | 5,840,219 | | | $ | 93,587,527 | |
Issued in connection with the reinvestment of distributions | | | 110,750 | | | | 1,656,822 | | | | 72,247 | | | | 1,114,772 | |
Redeemed | | | (3,998,699 | ) | | | (64,584,778 | ) | | | (2,449,449 | ) | | | (38,839,952 | ) |
| | | | | | | | | | | | | | | | |
Net change | | | 4,832,863 | | | $ | 78,292,344 | | | | 3,463,017 | | | $ | 55,862,347 | |
| | | | | | | | | | | | | | | | |
| Class C | | | | | | | | | | | | | | | | |
Issued from the sale of shares | | | 6,618,891 | | | $ | 107,450,527 | | | | 4,630,760 | | | $ | 73,457,166 | |
Issued in connection with the reinvestment of distributions | | | 37,940 | | | | 564,931 | | | | 29,527 | | | | 453,530 | |
Redeemed | | | (2,089,254 | ) | | | (32,993,910 | ) | | | (1,854,383 | ) | | | (29,059,321 | ) |
| | | | | | | | | | | | | | | | |
Net change | | | 4,567,577 | | | $ | 75,021,548 | | | | 2,805,904 | | | $ | 44,851,375 | |
| | | | | | | | | | | | | | | | |
| Class Y | | | | | | | | | | | | | | | | |
Issued from the sale of shares | | | 16,942,461 | | | $ | 274,580,271 | | | | 9,009,593 | | | $ | 143,819,801 | |
Issued in connection with the reinvestment of distributions | | | 185,653 | | | | 2,784,787 | | | | 117,939 | | | | 1,824,523 | |
Redeemed | | | (5,411,226 | ) | | | (86,765,876 | ) | | | (3,819,207 | ) | | | (60,187,744 | ) |
| | | | | | | | | | | | | | | | |
Net change | | | 11,716,888 | | | $ | 190,599,182 | | | | 5,308,325 | | | $ | 85,456,580 | |
| | | | | | | | | | | | | | | | |
Increase (decrease) from capital share transactions | | | 21,117,328 | | | $ | 343,913,074 | | | | 11,577,246 | | | $ | 186,170,302 | |
| | | | | | | | | | | | | | | | |
| 92
Notes to Financial Statements (continued)
September 30, 2012
11. Capital Shares (continued).
| | | | | | | | | | | | | | | | |
| |
| Year Ended
September 30, 2012 |
| |
| Year Ended
September 30, 2011 |
|
Growth Fund | | | Shares | | | | Amount | | | | Shares | | | | Amount | |
| Class A | | | | | | | | | | | | | | | | |
Issued from the sale of shares | | | 1,936,271 | | | $ | 11,163,676 | | | | 789,422 | | | $ | 4,312,824 | |
Issued in connection with the reinvestment of distributions | | | 6,836 | | | | 38,350 | | | | — | | | | — | |
Redeemed | | | (1,860,105 | ) | | | (10,830,069 | ) | | | (1,515,900 | ) | | | (8,531,709 | ) |
| | | | | | | | | | | | | | | | |
Net change | | | 83,002 | | | $ | 371,957 | | | | (726,478 | ) | | $ | (4,218,885 | ) |
| | | | | | | | | | | | | | | | |
| Class B | | | | | | | | | | | | | | | | |
Issued from the sale of shares | | | 12,916 | | | $ | 73,151 | | | | 12,241 | | | $ | 64,046 | |
Issued in connection with the reinvestment of distributions | | | — | | | | — | | | | — | | | | — | |
Redeemed | | | (227,838 | ) | | | (1,269,777 | ) | | | (322,361 | ) | | | (1,716,414 | ) |
| | | | | | | | | | | | | | | | |
Net change | | | (214,922 | ) | | $ | (1,196,626 | ) | | | (310,120 | ) | | $ | (1,652,368 | ) |
| | | | | | | | | | | | | | | | |
| Class C | | | | | | | | | | | | | | | | |
Issued from the sale of shares | | | 245,606 | | | $ | 1,431,273 | | | | 174,419 | | | $ | 922,261 | |
Issued in connection with the reinvestment of distributions | | | — | | | | — | | | | — | | | | — | |
Redeemed | | | (600,111 | ) | | | (3,380,312 | ) | | | (659,616 | ) | | | (3,529,748 | ) |
| | | | | | | | | | | | | | | | |
Net change | | | (354,505 | ) | | $ | (1,949,039 | ) | | | (485,197 | ) | | $ | (2,607,487 | ) |
| | | | | | | | | | | | | | | | |
| Class Y | | | | | | | | | | | | | | | | |
Issued from the sale of shares | | | 3,663,289 | | | $ | 23,444,311 | | | | 4,020,714 | | | $ | 24,184,766 | |
Issued in connection with the reinvestment of distributions | | | 46,359 | | | | 275,371 | | | | — | | | | — | |
Redeemed | | | (1,438,726 | ) | | | (9,219,910 | ) | | | (1,211,579 | ) | | | (7,292,357 | ) |
| | | | | | | | | | | | | | | | |
Net change | | | 2,270,922 | | | $ | 14,499,772 | | | | 2,809,135 | | | $ | 16,892,409 | |
| | | | | | | | | | | | | | | | |
Increase (decrease) from capital share transactions | | | 1,784,497 | | | $ | 11,726,064 | | | | 1,287,340 | | | $ | 8,413,669 | |
| | | | | | | | | | | | | | | | |
93 |
Notes to Financial Statements (continued)
September 30, 2012
11. Capital Shares (continued).
| | | | | | | | | | | | | | | | |
| |
| Year Ended
September 30, 2012 |
| |
| Year Ended
September 30, 2011 |
|
Mid Cap Growth Fund | | | Shares | | | | Amount | | | | Shares | | | | Amount | |
| Class A | | | | | | | | | | | | | | | | |
Issued from the sale of shares | | | 382,245 | | | $ | 10,336,274 | | | | 1,466,372 | | | $ | 40,418,776 | |
Issued in connection with the reinvestment of distributions | | | — | | | | — | | | | — | | | | — | |
Redeemed | | | (898,702 | ) | | | (24,081,488 | ) | | | (2,298,231 | ) | | | (65,461,720 | ) |
| | | | | | | | | | | | | | | | |
Net change | | | (516,457 | ) | | $ | (13,745,214 | ) | | | (831,859 | ) | | $ | (25,042,944 | ) |
| | | | | | | | | | | | | | | | |
| Class C | | | | | | | | | | | | | | | | |
Issued from the sale of shares | | | 39,669 | | | $ | 1,032,950 | | | | 98,542 | | | $ | 2,756,174 | |
Issued in connection with the reinvestment of distributions | | | — | | | | — | | | | — | | | | — | |
Redeemed | | | (42,106 | ) | | | (1,135,742 | ) | | | (8,837 | ) | | | (239,677 | ) |
| | | | | | | | | | | | | | | | |
Net change | | | (2,437 | ) | | $ | (102,792 | ) | | | 89,705 | | | $ | 2,516,497 | |
| | | | | | | | | | | | | | | | |
| Class Y | | | | | | | | | | | | | | | | |
Issued from the sale of shares | | | 547,417 | | | $ | 15,078,148 | | | | 1,071,985 | | | $ | 31,656,798 | |
Issued in connection with the reinvestment of distributions | | | — | | | | — | | | | — | | | | — | |
Redeemed | | | (634,861 | ) | | | (18,048,468 | ) | | | (453,103 | ) | | | (13,031,891 | ) |
| | | | | | | | | | | | | | | | |
Net change | | | (87,444 | ) | | $ | (2,970,320 | ) | | | 618,882 | | | $ | 18,624,907 | |
| | | | | | | | | | | | | | | | |
Increase (decrease) from capital share transactions | | | (606,338 | ) | | $ | (16,818,326 | ) | | | (123,272 | ) | | $ | (3,901,540 | ) |
| | | | | | | | | | | | | | | | |
| 94
Notes to Financial Statements (continued)
September 30, 2012
11. Capital Shares (continued).
| | | | | | | | | | | | | | | | |
| |
| Year Ended
September 30, 2012 |
| |
| Year Ended
September 30, 2011 |
|
Value Fund | | | Shares | | | | Amount | | | | Shares | | | | Amount | |
| Class A | | | | | | | | | | | | | | | | |
Issued from the sale of shares | | | 989,772 | | | $ | 18,793,820 | | | | 1,915,039 | | | $ | 35,613,722 | |
Issued in connection with the reinvestment of distributions | | | 87,182 | | | | 1,538,775 | | | | 88,461 | | | | 1,648,032 | |
Redeemed | | | (2,772,225 | ) | | | (51,186,817 | ) | | | (1,900,272 | ) | | | (35,517,239 | ) |
| | | | | | | | | | | | | | | | |
Net change | | | (1,695,271 | ) | | $ | (30,854,222 | ) | | | 103,228 | | | $ | 1,744,515 | |
| | | | | | | | | | | | | | | | |
| Class B | | | | | | | | | | | | | | | | |
Issued from the sale of shares | | | 1,714 | | | $ | 31,648 | | | | 11,718 | | | $ | 225,248 | |
Issued in connection with the reinvestment of distributions | | | 211 | | | | 3,758 | | | | 438 | | | | 8,207 | |
Redeemed | | | (55,615 | ) | | | (1,054,644 | ) | | | (81,989 | ) | | | (1,540,415 | ) |
| | | | | | | | | | | | | | | | |
Net change | | | (53,690 | ) | | $ | (1,019,238 | ) | | | (69,833 | ) | | $ | (1,306,960 | ) |
| | | | | | | | | | | | | | | | |
| Class C | | | | | | | | | | | | | | | | |
Issued from the sale of shares | | | 54,410 | | | $ | 1,016,926 | | | | 207,950 | | | $ | 3,898,637 | |
Issued in connection with the reinvestment of distributions | | | 1,337 | | | | 23,495 | | | | 1,601 | | | | 29,658 | |
Redeemed | | | (182,376 | ) | | | (3,372,547 | ) | | | (258,633 | ) | | | (4,682,108 | ) |
| | | | | | | | | | | | | | | | |
Net change | | | (126,629 | ) | | $ | (2,332,126 | ) | | | (49,082 | ) | | $ | (753,813 | ) |
| | | | | | | | | | | | | | | | |
| Class Y | | | | | | | | | | | | | | | | |
Issued from the sale of shares | | | 12,644,597 | | | $ | 238,607,810 | | | | 21,675,948 | | | $ | 394,526,208 | |
Issued in connection with the reinvestment of distributions | | | 871,612 | | | | 15,392,660 | | | | 734,748 | | | | 13,695,698 | |
Redeemed | | | (13,771,730 | ) | | | (260,802,172 | ) | | | (9,761,611 | ) | | | (181,413,250 | ) |
| | | | | | | | | | | | | | | | |
Net change | | | (255,521 | ) | | $ | (6,801,702 | ) | | | 12,649,085 | | | $ | 226,808,656 | |
| | | | | | | | | | | | | | | | |
| Admin Class | | | | | | | | | | | | | | | | |
Issued from the sale of shares | | | 98 | | | $ | 1,835 | | | | 27 | | | $ | 502 | |
Issued in connection with the reinvestment of distributions | | | 1 | | | | 12 | | | | 1 | | | | 11 | |
Redeemed | | | (93 | ) | | | (1,826 | ) | | | (3 | ) | | | (50 | ) |
| | | | | | | | | | | | | | | | |
Net change | | | 6 | | | $ | 21 | | | | 25 | | | $ | 463 | |
| | | | | | | | | | | | | | | | |
Increase (decrease) from capital share transactions | | | (2,131,105 | ) | | $ | (41,007,267 | ) | | | 12,633,423 | | | $ | 226,492,861 | |
| | | | | | | | | | | | | | | | |
95 |
Report of Independent Registered Public Accounting Firm
To the Trustees of Loomis Sayles Funds II and Shareholders of Loomis Sayles Global Equity and Income Fund, Loomis Sayles Growth Fund, Loomis Sayles Mid Cap Growth Fund and Loomis Sayles Value Fund:
In our opinion, the accompanying statements of assets and liabilities, including the portfolios of investments, and the related statements of operations and of changes in net assets and the financial highlights present fairly, in all material respects, the financial position of the Loomis Sayles Global Equity and Income Fund, Loomis Sayles Growth Fund, Loomis Sayles Mid Cap Growth Fund and Loomis Sayles Value Fund, each a series of Loomis Sayles Funds II (collectively, the “Funds”), at September 30, 2012, and the results of each of their operations, the changes in each of their net assets and the financial highlights for each of the periods indicated, in conformity with accounting principles generally accepted in the United States of America. These financial statements and financial highlights (hereafter referred to as “financial statements”) are the responsibility of the Funds’ management; our responsibility is to express an opinion on these financial statements based on our audits. We conducted our audits of these financial statements in accordance with the standards of the Public Company Accounting Oversight Board (United States). Those standards require that we plan and perform the audits to obtain reasonable assurance about whether the financial statements are free of material misstatement. An audit includes examining, on a test basis, evidence supporting the amounts and disclosures in the financial statements, assessing the accounting principles used and significant estimates made by management, and evaluating the overall financial statement presentation. We believe that our audits, which included confirmation of securities at September 30, 2012 by correspondence with the custodian and brokers, provide a reasonable basis for our opinion.
PricewaterhouseCoopers LLP
Boston, Massachusetts
November 20, 2012
| 96
2012 U.S. Tax Distribution Information to Shareholders (Unaudited)
Corporate Dividends Received Deduction. For the fiscal year ended September 30, 2012, a percentage of dividends distributed by the Funds listed below qualify for the dividends received deduction for corporate shareholders. These percentages are as follows:
| | | | |
Fund | | Qualifying
Percentage | |
Global Equity and Income | | | 18.41 | % |
Growth | | | 100.00 | % |
Value | | | 100.00 | % |
Qualified Dividend Income. For the fiscal year ended September 30, 2012, the Funds below will designate up to the maximum amount allowable pursuant to the Internal Revenue Code as qualified dividend income eligible for reduced tax rates. These lower rates range from 0% to 15% depending on an individual’s tax bracket. If the Funds pay a distribution during calendar year 2012, complete information will be reported in conjunction with Form 1099-DIV.
| | |
Fund | | |
Global Equity and Income | | |
Growth | | |
Value | | |
97 |
Trustee and Officer Information
The tables below provide certain information regarding the trustees and officers of Loomis Sayles Funds II (the “Trust”). Unless otherwise indicated, the address of all persons below is 399 Boylston Street, Boston, MA 02116. The Funds’ Statement of Additional Information includes additional information about the trustees of the Trust and are available by calling Natixis Funds at 800-225-5478.
| | | | | | | | |
Name and Year of
Birth | | Position(s) Held
with the Trust,
Length of Time
Served and Term
of Office1 | | Principal
Occupation(s)
During Past
5 Years | | Number of
Portfolios in
Fund Complex
Overseen2 and Other
Directorships Held
During Past 5
Years | | Experience,
Qualifications,
Attributes, Skills
for Board
Membership |
| | | |
| INDEPENDENT TRUSTEES | | | | | | |
| | | | |
Graham T. Allison, Jr. (1940) | | Trustee Since 2003 Contract Review and Governance Committee Member | | Douglas Dillon Professor and Director of the Belfer Center for Science and International Affairs, John F. Kennedy School of Government, Harvard University | | 44 Director, Taubman Centers, Inc. (real estate investment trust) | | Significant experience on the Board of Trustees of the Trust and on the board of other business organizations (including a real estate investment trust); government experience (including as Assistant Secretary of Defense under President Clinton); academic experience |
| | | | |
Charles D. Baker (1956) | | Trustee From 2005 to 2009 and Since 2011 Contract Review and Governance Committee Member | | Executive in Residence at General Catalyst Partners (venture capital and growth equity firm); formerly, President and Chief Executive Officer, Harvard Pilgrim Health Care (health care organization) | | 44 None | | Significant experience on the Board of Trustees of the Trust; executive experience (including president and chief executive officer of a health care organization and executive officer of a venture capital and growth equity firm) |
| 98
Trustee and Officer Information
| | | | | | | | |
Name and Year of
Birth | | Position(s) Held
with the Trust,
Length of Time
Served and Term
of Office1 | | Principal
Occupation(s)
During Past
5 Years | | Number of
Portfolios in
Fund Complex
Overseen2 and Other
Directorships Held
During Past 5
Years | | Experience,
Qualifications,
Attributes, Skills
for Board
Membership |
| | | |
INDEPENDENT TRUSTEES continued | | | | | | |
| | | | |
Daniel M. Cain (1945) | | Trustee Since 2003 Chairman of the Contract Review and Governance Committee | | Chairman (formerly, President and Chief Executive Officer) of Cain Brothers & Company, Incorporated (investment banking) | | 44 Director, Sheridan Healthcare Inc. (physician practice management) | | Significant experience on the Board of Trustees of the Trust and on the board of other business organizations (including at a health care organization); experience in the financial industry (including roles as chairman and former chief executive officer of an investment banking firm) |
| | | | |
Kenneth A. Drucker (1945) | | Trustee Since 2008 Chairman of the Audit Committee | | Retired | | 44 Formerly, Director, M Fund, Inc. (investment company); Director, Gateway Trust (investment company) | | Significant experience on the Board of Trustees of the Trust and on the board of other business organizations (including at investment companies); executive experience (including as treasurer of an aerospace, automotive, and metal manufacturing corporation) |
99 |
Trustee and Officer Information
| | | | | | | | |
Name and Year of
Birth | | Position(s) Held
with the Trust,
Length of Time
Served and Term
of Office1 | | Principal
Occupation(s)
During Past
5 Years | | Number of
Portfolios in
Fund Complex
Overseen2 and Other
Directorships Held
During Past 5
Years | | Experience,
Qualifications,
Attributes, Skills
for Board
Membership |
| | | |
INDEPENDENT TRUSTEES continued | | | | | | |
| | | | |
Wendell J. Knox (1948) | | Trustee Since 2009 Audit Committee Member | | Director (formerly, President and Chief Executive Officer) of Abt Associates Inc. (research and consulting) | | 44 Director, Eastern Bank (commercial bank); Director, The Hanover Insurance Group (property and casualty insurance) | | Significant experience on the Board of Trustees of the Trust and on the board of other business organizations (including at a commercial bank and at a property and casualty insurance firm); executive experience (including roles as president and chief executive officer of a consulting company) |
| | | | |
Martin T. Meehan3 (1956) | | Trustee Since 2012 Contract Review and Governance Committee Member | | Chancellor and faculty member, University of Massachusetts Lowell | | 44 Director, Lowell Cooperative Bank (commercial bank); Director, Lowell General Hospital (healthcare); formerly, Director, Qteros, Inc. (biofuels); formerly, Trustee, Suffolk University (education); formerly, Director, D’Youville Foundation (senior care) | | Experience as Chancellor of the University of Massachusetts Lowell; experience on the board of other business organizations; government experience (including as a member of the U.S. House of Representatives); academic experience |
| 100
Trustee and Officer Information
| | | | | | | | |
Name and Year of
Birth | | Position(s) Held
with the Trust,
Length of Time
Served and Term
of Office1 | | Principal
Occupation(s)
During Past
5 Years | | Number of
Portfolios in
Fund Complex
Overseen2 and Other
Directorships Held
During Past 5
Years | | Experience,
Qualifications,
Attributes, Skills
for Board
Membership |
| | | |
INDEPENDENT TRUSTEES continued | | | | | | |
| | | | |
Sandra O. Moose (1942) | | Chairperson of the Board of Trustees since November 2005 Trustee Since 2003 Ex officio member of the Audit Committee and Contract Review and Governance Committee | | President, Strategic Advisory Services (management consulting) | | 44 Director, Verizon Communications; Director, AES Corporation (international power company); formerly, Director, Rohm and Haas Company (specialty chemicals) | | Significant experience on the Board of Trustees of the Trust and on the board of other business organizations (including at an international power company and a specialty chemicals corporation); executive experience (including at a management consulting company) |
| | | | |
Erik R. Sirri (1958) | | Trustee Since 2009 Contract Review and Governance Committee Member | | Professor of Finance at Babson College; formerly, Director of the Division of Trading and Markets at the Securities and Exchange Commission | | 44 None | | Experience on the Board of Trustees of the Trust; experience as Director of the Division of Trading and Markets at the Securities and Exchange Commission; academic experience; training as an economist |
101 |
Trustee and Officer Information
| | | | | | | | |
Name and Year of
Birth | | Position(s) Held
with the Trust,
Length of Time
Served and Term
of Office1 | | Principal
Occupation(s)
During Past
5 Years | | Number of
Portfolios in
Fund Complex
Overseen2 and Other
Directorships Held
During Past 5
Years | | Experience,
Qualifications,
Attributes, Skills
for Board
Membership |
| | | |
INDEPENDENT TRUSTEES continued | | | | | | |
| | | | |
Peter J. Smail (1952) | | Trustee Since 2009 Contract Review and Governance Committee Member | | Retired; formerly, President and Chief Executive Officer of Pyramis Global Advisors (investment management) | | 44 None | | Experience on the Board of Trustees of the Trust; mutual fund industry and executive experience (including roles as president and chief executive officer for an investment adviser) |
| | | | |
Cynthia L. Walker (1956) | | Trustee Since 2005 Audit Committee Member | | Deputy Dean for Finance and Administration, Yale University School of Medicine; formerly, Executive Dean for Administration, Harvard Medical School | | 44 None | | Significant experience on the Board of Trustees of the Trust; executive experience in a variety of academic organizations (including roles as dean for finance and administration) |
| | | |
| INTERESTED TRUSTEES | | | | | | |
| | | | |
Robert J. Blanding4 (1947) 555 California Street San Francisco, CA 94104 | | Trustee and Chief Executive Officer Since 2002 | | President, Chairman, Director and Chief Executive Officer, Loomis, Sayles & Company, L.P. | | 44 None | | Significant experience on the Board of Trustees of the Trust; continuing service as President, Chairman, and Chief Executive Officer of Loomis, Sayles & Company, L.P. |
| 102
Trustee and Officer Information
| | | | | | | | |
Name and Year of
Birth | | Position(s) Held
with the Trust,
Length of Time
Served and Term
of Office1 | | Principal
Occupation(s)
During Past
5 Years | | Number of
Portfolios in
Fund Complex
Overseen2 and Other
Directorships Held
During Past 5
Years | | Experience,
Qualifications,
Attributes, Skills
for Board
Membership |
| | | |
INTERESTED TRUSTEES continued | | | | | | |
| | | | |
| David L. Giunta5 (1965) | | Trustee Since 2011 President Since 2008 | | President and Chief Executive Officer, NGAM Distribution Corporation, NGAM Advisors, L.P. and NGAM Distribution, L.P.; formerly President, Fidelity Charitable Gift Fund; and formerly, Senior Vice President, Fidelity Brokerage Company | | 44 None | | Experience on the Board of Trustees of the Trust; continuing experience as President and Chief Executive Officer of NGAM Advisors, L.P. |
| | | | |
John T. Hailer6 (1960) | | Trustee Since 2003 | | President and Chief Executive Officer – U.S. and Asia, Natixis Global Asset Management, L.P.; formerly, President and Chief Executive Officer, NGAM Distribution Corporation, NGAM Advisors L.P. and NGAM Distribution, L.P. | | 44 None | | Significant experience on the Board of Trustees of the Trust; continuing experience as Chief Executive Officer – U.S. and Asia, Natixis Global Asset Management, L.P. |
| 1 | Each trustee serves until retirement, resignation or removal from the Board of the Trust. The current retirement age is 72. The position of Chairperson of the Board is appointed for a two-year term. Ms. Moose was appointed to serve an additional two year term as the Chairperson of the Board on November 18, 2011. |
| 2 | The trustees of the Trust serve as trustees of a fund complex that includes all series of the Natixis Funds Trust I, Natixis Funds Trust II, Natixis Funds Trust IV and Gateway Trust (collectively, the “Natixis Funds Trusts”), Loomis Sayles Funds I and Loomis Sayles Funds II (collectively, the “Loomis Sayles Funds Trusts”), and Hansberger International Series (collectively, the “Fund Complex”). |
103 |
Trustee and Officer Information
| 3 | Mr. Meehan was appointed as a trustee effective July 1, 2012. |
| 4 | Mr. Blanding is deemed an “interested person” of the Trust because he holds the following positions with an affiliated person of the Trust: President, Chairman, Director and Chief Executive Officer of Loomis, Sayles & Company, L.P. |
| 5 | Mr. Giunta is deemed an “interested person” of the Trust because he holds the following positions with an affiliated person of the Trust: President and Chief Executive Officer of NGAM Distribution Corporation, NGAM Advisors, L.P. and NGAM Distribution, L.P. |
| 6 | Mr. Hailer is deemed an “interested person” of the Trust because he holds the following positions with an affiliated person of the Trust: President and Chief Executive Officer – U.S. and Asia, Natixis Global Asset Management, L.P. |
| 104
Trustee and Officer Information
| | | | | | |
Name and Year of Birth | | Position(s) Held with
the Trust | | Term of Office1 and
Length of Time Served | | Principal Occupation(s)
During Past 5 Years2 |
| | |
| OFFICERS OF THE TRUST | | | | |
| | | |
Coleen Downs Dinneen (1960) | | Secretary, Clerk and Chief Legal Officer | | Since September 2004 | | Executive Vice President, General Counsel, Secretary and Clerk (formerly, Senior Vice President, Deputy General Counsel, Assistant Secretary and Assistant Clerk), NGAM Distribution Corporation, NGAM Advisors, L.P. and NGAM Distribution, L.P. |
| | | |
Daniel J. Fuss (1933) One Financial Center Boston, MA 02111 | | Executive Vice President | | Since June 2003 | | Vice Chairman and Director, Loomis, Sayles & Company, L.P. |
| | | |
Russell L. Kane (1969) | | Chief Compliance Officer, Assistant Secretary and Anti-Money Laundering Officer | | Chief Compliance Officer, since May 2006; Assistant Secretary since June 2004; and Anti-Money Laundering Officer since April 2007 | | Chief Compliance Officer for Mutual Funds, Senior Vice President, Deputy General Counsel, Assistant Secretary and Assistant Clerk, NGAM Distribution Corporation, NGAM Advisors, L.P. and NGAM Distribution, L.P. |
| | | |
Michael C. Kardok (1959) | | Treasurer, Principal Financial and Accounting Officer | | Since October 2004 | | Senior Vice President, NGAM Advisors, L.P. and NGAM Distribution, L.P. |
| 1 | Each officer of the Trust serves for an indefinite term in accordance with the Trust’s current by-laws until the date his or her successor is elected and qualified, or until he or she sooner dies, retires, is removed or becomes disqualified. |
| 2 | Each person listed above, except as noted, holds the same position(s) with the Fund Complex. Mr. Fuss is not an officer of the Natixis Funds Trusts or the Hansberger International Series. Previous positions during the past five years with NGAM Distribution, L.P., NGAM Advisors, L.P. or Loomis, Sayles & Company, L.P. are omitted, if not materially different from a trustee’s or officer’s current position with such entity. |
105 |

Loomis Sayles Small Cap Growth Fund
Loomis Sayles Small Cap Value Fund
Annual Report
September 30, 2012
LOOMIS SAYLES SMALL CAP GROWTH FUND
Portfolio Review
Managers:
Mark F. Burns, CFA
John J. Slavik, CFA
Symbols:
| | |
| Institutional Class | | LSSIX |
| Retail Class | | LCGRX |
Objective:
Long-term capital growth from investments in common stocks or other equity securities
Strategy:
Invests at least 80% of its net assets (plus any borrowings made for investment purposes) in equity securities of companies with market capitalizations that fall within the capitalization range of the Russell 2000 Index or is $3 billion or less at the time of investment. Unlike the Index, the fund may invest in companies of any size.
The fund may invest any portion of its assets in Canadian securities and up to 20% of assets in other foreign securities, including emerging markets securities.
Market Conditions
U.S. equities rallied off the market low of October 3, 2011, the first trading day of the fund’s fiscal year. Market sentiment was at its low point at that time, primarily due to the European banking and sovereign debt crises and mounting economic concerns in the United States. Equities rallied, as various measures to delay or postpone the debt crisis in Europe emerged, and economic prospects in the United States appeared to strengthen relative to cautious expectations. Market leadership changed many times during the year, as investors rotated between having an appetite for risk and an aversion toward risk, between large-cap and small-cap stocks and between growth and value styles. Ultimately, all market segments posted strong returns for the 12-month period.
Performance Results
For the 12 months ended September 30, 2012, Institutional Class shares of Loomis Sayles Small Cap Growth Fund returned 27.29%. The fund underperformed its benchmark, the Russell 2000 Growth Index, which returned 31.18%.
Explanation of Fund Performance
The healthcare sector was among the largest detractors from relative performance, primarily due to results in the biotechnology segment. Given the volatility of these companies, we tend to underweight the industry. As a result, the fund did not own some of the sector’s leading performers for the period. Stock selection in the industrials sector also detracted from relative performance, while stock selection in the information technology, financials and energy sectors represented the largest contributors to relative results.
In terms of individual holdings, a position in hardwood flooring retailer Lumber Liquidators was a top contributor. The company reported strong earnings and improving same-store sales. Better margins and improving efficiencies within the supply chain drove the
1 |
firm’s guidance higher. A position in Ultimate Software, a provider of cloud-based people management software, also contributed positively to performance. With their best-in-class products, the company continued to add new clients and gain market share from incumbents. A position in Allot Communications, a developer of solutions to help broadband carriers track and bill usage, also aided performance as secular tailwinds for this company’s must-have technology drove above-average revenue growth.
On the other hand, a position in ZELTIQ Aesthetics, a developer of a non-invasive fat-elimination procedure, was among the largest performance detractors for the year. Slow growth and potential competition clouded the company’s outlook and led to poor results. This triggered our stop-loss discipline, and we exited the position. A position in Maxwell Technologies, a provider of energy storage solutions for the automotive and heavy transportation industries, also detracted from returns. Weakness in the European auto and bus markets led management to reduce earnings estimates for the coming year, triggering a sharp decline in the stock price, and we exited the position. In addition, a position in Titan Machinery, an agricultural and construction equipment provider, dragged down results. The company reported two consecutive disappointing quarters due to investments in its low-margin rental business and increasing inventory levels. The recent drought in the U.S. Midwest and expiring tax incentives at the end of 2012 further weakened Titan’s outlook, which led to a sharp decline in the stock price. We exited the position.
Outlook
Looking ahead, we believe equity valuations remain attractive and company balance sheets generally appear to be in decent shape. Although volatility abated somewhat in recent months, we believe it may move higher due to the continuing fiscal uncertainties in the United States, the results of the presidential election and slower global growth, which could make for a challenging environment. Because of our steadfast commitment to investing in high-quality, high growth small-cap companies while paying close attention to risk, we believe our portfolio is best positioned to offer attractive, consistent risk-adjusted returns despite the market conditions.
| 2
LOOMIS SAYLES SMALL CAP GROWTH FUND
Average Annual Total Returns
September 30, 2012
| | | | | | | | | | | | |
| | | | |
| | | 1 year | | | 5 years | | | 10 years | |
| | | | |
| Institutional Class (Inception 12/31/96) | | | 27.29 | % | | | 3.85 | % | | | 11.68 | % |
| Retail Class (Inception 12/31/96) | | | 26.79 | | | | 3.57 | | | | 11.39 | |
| | | | |
| Comparative Performance | | | | | | | | | | | | |
| Russell 2000 Growth Index(c) | | | 31.18 | | | | 2.96 | | | | 10.55 | |
| Russell 2000 Index(c) | | | 31.91 | | | | 2.21 | | | | 10.17 | |
| Lipper Small-Cap Growth Funds Index(c) | | | 29.61 | | | | 1.54 | | | | 9.13 | |
Cumulative Performance
September 30, 2002 to September 30, 2012(a)(b)
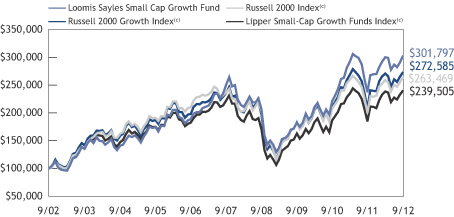
Past performance does not guarantee future results. The chart and table do not reflect taxes shareholders might owe on any fund distributions or when they redeem their shares. Returns reflect changes in share price and reinvestment of dividends and capital gains, if any. Unlike a fund, an index is not managed and does not reflect fees and expenses.
| (a) | | Cumulative performance is shown for the Institutional Class. Performance of the Retail Class would be lower due to higher fees and expenses. |
| (b) | | The mountain chart is based on the initial investment minimum of $100,000 for the Institutional Class. |
| (c) | | See page 7 for a description of the indices. |
3 |
LOOMIS SAYLES SMALL CAP VALUE FUND
Portfolio Review
Managers:
Joseph R. Gatz, CFA
Jeffrey Schwartz, CFA
Symbols:
| | |
| Institutional Class | | LSSCX |
| Retail Class | | LSCRX |
| Admin Class | | LSVAX |
Objective:
Long-term capital growth from investments in common stocks or other equity securities
Strategy:
Invests at least 80% of its net assets (plus any borrowings made for investment purposes) in equity securities of companies with market capitalizations that fall within the capitalization range of the Russell 2000 Index or is $3 billion or less at the time of investment. Unlike the Index, the fund may invest in companies of any size.
The fund may invest up to 20% of its assets in securities of foreign issuers, including emerging market securities.
Market Conditions
U.S. equities rallied off the market low of October 3, 2011, the first trading day of the fund’s fiscal year. Market sentiment was at its low point at that time, primarily due to the European banking and sovereign debt crises and mounting economic concerns in the United States. Equities rallied as various measures to delay or postpone the debt crisis in Europe emerged, and economic prospects in the United States appeared to strengthen relative to cautious expectations. Market leadership changed many times during the year, as investors rotated between having an appetite for risk and being risk averse, between large-cap and small-cap stocks and between growth and value styles. Ultimately, all stock market segments posted strong returns for the 12-month period.
Performance Results
For the 12 months ended September 30, 2012, Institutional Class shares of Loomis Sayles Small Cap Value Fund returned 30.59%. The fund underperformed its benchmark, the Russell 2000 Value Index, which returned 32.63% for the period.
Explanation of Fund Performance
The fund outperformed its benchmark during the first half of the fiscal year, but it lagged modestly during the final six months, as market risk tolerance increased simultaneously with central bank stimulus in Europe and the United States. Stock selection was a slightly positive factor relative to the benchmark, with favorable selections in information technology, industrials and energy outweighing negative selections in financials, specifically real estate investment trusts (REITs).
A position in Wright Express, a provider of payment processing and information services to commercial and government vehicle fleets, was a leading positive contributor to performance. The company reported solid earnings and favorable results from acquisitions and progress in the healthcare and online travel payment
| 4
processing markets. Similarly, a position in AZZ, a manufacturer of electrical equipment and provider of galvanizing services to the steel structures industry, boosted performance. The company reported strong earnings along with enhanced growth prospects from acquisitions. Thomas & Betts, a manufacturer of electrical equipment for utility, industrial, and residential markets, was acquired at a premium by ABB in early 2012, which aided the fund’s results.
In terms of detractors, ACCO Brands, a manufacturer of office products, hurt performance. The company reported lower-than-expected earnings due to anemic economic conditions in the United States and Europe and a negative impact from currency exchange. The weak market for office products overshadowed the material cost and revenue advantages we expected from the company’s recently completed merger with the office products division of MeadWestvaco. In addition, the fund’s position in Cash America International, a provider of specialty financial services to consumers, detracted from performance. Shares declined as an acquisition of jewelry-only pawn shops in Mexico proved disappointing, and the company cancelled plans for an initial public offering of its Internet lending business. Late in September, the company announced plans to exit the jewelry-only pawn business in Mexico. Finally, a position in PHH, an outsource provider of mortgages and vehicle fleet services, sold-off sharply late in 2011 when Standard & Poor’s downgraded its debt rating. With prospects for higher borrowing costs in the intermediate term, we eliminated our position in early 2012.
Outlook
Looking ahead, we remain confident in our strategy, the fundamental character of the fund’s portfolio and what we view as reasonable stock market valuations. We believe our investment strategy is built around our greatest strength: selecting inefficiently priced small-cap value stocks through rigorous fundamental bottom-up analysis. As usual, there is less certainty surrounding events beyond our control, including the trajectory of the U.S. economy, the fallout from the European debt crisis and the political and fiscal hurdles remaining in the United States and worldwide.
5 |
LOOMIS SAYLES SMALL CAP VALUE FUND
Average Annual Total Returns
September 30, 2012
| | | | | | | | | | | | |
| | | | |
| | | 1 year | | | 5 years | | | 10 years | |
| | | | |
| Institutional Class (Inception 5/13/91) | | | 30.59 | % | | | 2.78 | % | | | 10.41 | % |
| Retail Class (Inception 12/31/96) | | | 30.26 | | | | 2.53 | | | | 10.14 | |
| Admin Class (Inception 1/2/98) | | | 29.93 | | | | 2.27 | | | | 9.86 | |
| Comparative Performance | | | | | | | | | | | | |
| Russell 2000 Value Index(c) | | | 32.63 | | | | 1.35 | | | | 9.68 | |
| Russell 2000 Index(c) | | | 31.91 | | | | 2.21 | | | | 10.17 | |
| Lipper Small-Cap Core Funds Index(c) | | | 28.06 | | | | 2.44 | | | | 9.99 | |
Cumulative Performance
September 30, 2002 to September 30, 2012(a)(b)
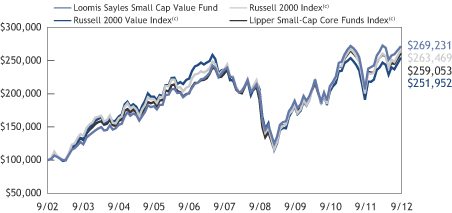
Past performance does not guarantee future results. The chart and table do not reflect taxes shareholders might owe on any fund distributions or when they redeem their shares. Returns reflect changes in share price and reinvestment of dividends and capital gains, if any. Unlike a fund, an index is not managed and does not reflect fees and expenses.
| (a) | | Cumulative performance is shown for the Institutional Class. Performance of the Retail and Admin Classes would be lower due to higher fees and expenses. |
| (b) | | The mountain chart is based on the initial investment minimum of $100,000 for the Institutional Class. |
| (c) | | See page 7 for a description of the indices. |
| 6
ADDITIONAL INFORMATION
The views expressed in this report reflect those of the portfolio managers as of the dates indicated. The managers’ views are subject to change at any time without notice based on changes in market or other conditions. References to specific securities or industries should not be regarded as investment advice. Because the funds are actively managed, there is no assurance that they will continue to invest in the securities or industries mentioned.
Index Definitions
Indices are unmanaged and do not have expenses that affect results, unlike mutual funds. Index returns are adjusted for the reinvestment of capital gain distributions and income dividends. It is not possible to invest directly in an index.
Lipper Small-Cap Core Funds Index is an unmanaged index that tracks the average performance of the 30 largest small-cap core funds according to Lipper Inc.
Lipper Small-Cap Growth Funds Index is an unmanaged index that tracks the average performance of the 30 largest small-cap growth funds according to Lipper Inc.
Source: Lipper, Inc.
Russell 2000 Index is an unmanaged index that measures the performance of the small-cap segment of the U.S. equity universe.
Russell 2000 Growth Index is an unmanaged index that measures the performance of the small-cap growth segment of the U.S. equity universe. It includes those Russell 2000 companies with higher price-to-book ratios and higher forecasted growth values.
Russell 2000 Value Index is an unmanaged index that measures the performance of the small-cap value segment of the U.S. equity universe. It includes those Russell 2000 companies with lower price-to-book ratios and lower forecasted growth values.
Proxy Voting Information
A description of the funds’ proxy voting policies and procedures is available without charge, upon request, (i) by calling Loomis Sayles at 800-633-3330; (ii) on the funds’ website, www.loomissayles.com, and (iii) on the SEC’s website, www.sec.gov. Information about how the funds voted proxies relating to portfolio securities during the 12 months ended June 30, 2012 is available on (i) the funds’ website and (ii) the SEC’s website.
Quarterly Portfolio Schedules
The funds file a complete schedule of portfolio holdings with the SEC for the first and third quarters of each fiscal year on Form N-Q. The funds’ Forms N-Q are available on the SEC’s website at www.sec.gov and may be reviewed and copied at the SEC’s Public Reference Room in Washington, DC. Information on the operation of the Public Reference Room may be obtained by calling 800-SEC-0330.
7 |
UNDERSTANDING YOUR FUND’S EXPENSES
As a mutual fund shareholder you incur two types of costs: (1) transaction costs and (2) ongoing costs, including management fees, distribution and/or service fees (12b-1 fees), and other fund expenses. These costs are described in more detail in the funds’ prospectus. The examples below are intended to help you understand the ongoing costs of investing in the funds and help you compare these with the ongoing costs of investing in other mutual funds.
The first line in the table of each fund shows the actual amount of fund expenses you would have paid on a $1,000 investment in the fund from April 1, 2012 through September 30, 2012. It also shows how much a $1,000 investment would be worth at the close of the period, assuming actual fund returns and expenses. To estimate the expenses you paid over the period, simply divide your account value by $1,000 (for example $8,600 account value divided by $1,000 = 8.6) and multiply the result by the number in the Expenses Paid During Period column as shown below for your class.
The second line in the table of each fund provides information about hypothetical account values and hypothetical expenses based on the fund’s actual expense ratios and an assumed rate of return of 5% per year before expenses, which is not the fund’s actual return. The hypothetical account values and expenses may not be used to estimate the actual ending account balance or expenses you paid on your investment for the period. You may use this information to compare the ongoing costs of investing in the funds and other funds. To do so, compare this 5% hypothetical example with the 5% hypothetical examples that appear in the shareholder reports of other funds.
Please note that the expenses shown reflect ongoing costs only, and do not include any transaction costs. Therefore, the second line in the table is useful in comparing ongoing costs only, and will not help you determine the relative costs of owning different funds. If transaction costs were included, total costs would be higher.
Loomis Sayles Small Cap Growth Fund
| | | | | | | | | | | | |
Institutional Class | | Beginning
Account Value
4/1/2012 | | | Ending
Account Value
9/30/2012 | | | Expenses Paid During
Period*
4/1/2012–9/30/2012 | |
Actual | | | $1,000.00 | | | | $1,005.20 | | | | $4.76 | |
Hypothetical
(5% return before expenses) | | | $1,000.00 | | | | $1,020.25 | | | | $4.80 | |
| | | |
Retail Class | | | | | | | | | |
Actual | | | $1,000.00 | | | | $1,003.80 | | | | $6.26 | |
Hypothetical
(5% return before expenses) | | | $1,000.00 | | | | $1,018.75 | | | | $6.31 | |
* Expenses are equal to the Fund’s annualized expense ratio (after waiver/reimbursement): 0.95% and 1.25% for Institutional and Retail Class, respectively, multiplied by the average account value over the period, multiplied by the number of days in the most recent fiscal half-year, divided by 366 (to reflect the half-year period). | |
| 8
Loomis Sayles Small Cap Value Fund
| | | | | | | | | | | | |
Institutional Class | | Beginning
Account Value
4/1/2012 | | | Ending
Account Value
9/30/2012 | | | Expenses Paid During
Period*
4/1/2012–9/30/2012 | |
Actual | | | $1,000.00 | | | | $992.80 | | | | $4.48 | |
Hypothetical
(5% return before expenses) | | | $1,000.00 | | | | $1,020.50 | | | | $4.55 | |
| | | |
Retail Class | | | | | | | | | |
Actual | | | $1,000.00 | | | | $992.10 | | | | $5.73 | |
Hypothetical
(5% return before expenses) | | | $1,000.00 | | | | $1,019.25 | | | | $5.81 | |
| | | |
Admin Class | | | | | | | | | |
Actual | | | $1,000.00 | | | | $990.50 | | | | $6.97 | |
Hypothetical
(5% return before expenses) | | | $1,000.00 | | | | $1,018.00 | | | | $7.06 | |
* Expenses are equal to the Fund’s annualized expense ratio (after waiver/reimbursement): 0.90%, 1.15% and 1.40% for Institutional, Retail and Admin Class, respectively, multiplied by the average account value over the period, multiplied by the number of days in the most recent fiscal half-year, divided by 366 (to reflect the half-year period). | |
9 |
BOARD APPROVAL OF THE EXISTING ADVISORY AGREEMENTS
The Board of Trustees of the Trusts, including the Independent Trustees, considers matters bearing on each Fund’s advisory agreement (collectively, the “Agreements”) at most of its meetings throughout the year. Each year, usually in the spring, the Contract Review and Governance Committee of the Board meets to review the Agreements to determine whether to recommend that the full Board approve the continuation of the Agreements, typically for an additional one-year period. After the Committee has made its recommendation, the full Board, including the Independent Trustees, determines whether to approve the continuation of the Agreements.
In connection with these meetings, the Trustees receive materials that the Funds’ investment adviser (the “Adviser”) believes to be reasonably necessary for the Trustees to evaluate the Agreements. These materials generally include, among other items, (i) information on the investment performance of the Funds and the performance of peer groups of funds and the Funds’ performance benchmarks, (ii) information on the Funds’ advisory fees and other expenses, including information comparing the Funds’ expenses to the fees charged to institutional accounts with similar strategies managed by the Adviser and to those of peer groups of funds and information about applicable expense caps and fee “breakpoints,” (iii) sales and redemption data in respect of the Funds, (iv) information about the profitability of the Agreements to the Adviser and (v) information obtained through the completion by the Adviser of a questionnaire distributed on behalf of the Trustees. The Board of Trustees, including the Independent Trustees, also consider other matters such as (i) the Adviser’s financial results and financial condition, (ii) each Fund’s investment objective and strategies and the size, education and experience of the Adviser’s investment staff and its use of technology, external research and trading cost measurement tools, (iii) arrangements in respect of the distribution of the Funds’ shares and the related costs, (iv) the procedures employed to determine the value of the Funds’ assets, (v) the allocation of the Funds’ brokerage, if any, including, if applicable, allocations to brokers affiliated with the Adviser and the use of “soft” commission dollars to pay Fund expenses and to pay for research and other similar services, (vi) the resources devoted to, and the record of compliance with, the Funds’ investment policies and restrictions, policies on personal securities transactions and other compliance policies, (vii) information about amounts invested by the Funds’ portfolio managers in the Funds or in similar accounts that they manage and (viii) the general economic outlook with particular emphasis on the mutual fund industry. Throughout the process, the Trustees are afforded the opportunity to ask questions of and request additional materials from the Adviser.
In addition to the materials requested by the Trustees in connection with their annual consideration of the continuation of the Agreements, the Trustees receive materials in advance of each regular quarterly meeting of the Board of Trustees that provide detailed information about the Funds’ investment performance and the fees charged to the Funds for advisory and other services. This information generally includes, among other things, an internal performance rating for each Fund based on agreed-upon criteria, graphs showing each Fund’s performance and fee differentials against each Fund’s peer group/category,
| 10
performance ratings provided by a third-party, total return information for various periods, and third-party performance rankings for various periods comparing a Fund against similarly categorized funds. The portfolio management team for each Fund or other representatives of the Adviser make periodic presentations to the Contract Review and Governance Committee and/or the full Board of Trustees, and Funds identified as presenting possible performance concerns may be subject to more frequent board presentations and reviews. In addition, each quarter the Trustees are provided with detailed statistical information about each Fund’s portfolio. The Trustees also receive periodic updates between meetings.
The Board of Trustees most recently approved the continuation of the Agreements at their meeting held in June 2012. The Agreements were continued for a one-year period for the Funds. In considering whether to approve the continuation of the Agreements, the Board of Trustees, including the Independent Trustees, did not identify any single factor as determinative. Individual Trustees may have evaluated the information presented differently from one another, giving different weights to various factors. Matters considered by the Trustees, including the Independent Trustees, in connection with their approval of the Agreements included, but were not limited to, the factors listed below.
The nature, extent and quality of the services provided to the Funds under the Agreements. The Trustees considered the nature, extent and quality of the services provided by the Adviser and its affiliates to the Funds and the resources dedicated to the Funds by the Adviser and its affiliates. The Trustees also considered the administrative services provided by NGAM Advisors, L.P. (“NGAM Advisors”) and its affiliates to the Funds.
For each Fund, the Trustees also considered the benefits to shareholders of investing in a mutual fund that is part of a family of funds that offers shareholders the right to exchange shares of one type of fund for shares of another type of fund, and provides a variety of fund and shareholder services.
After reviewing these and related factors, the Trustees concluded, within the context of their overall conclusions regarding each of the Agreements, that the nature, extent and quality of services provided supported the renewal of the Agreements.
Investment performance of the Funds and the Adviser. As noted above, the Trustees received information about the performance of the Funds over various time periods, including information which compared the performance of the Funds to the performance of peer groups and categories of funds and the Funds’ respective performance benchmarks. In addition, the Trustees also reviewed data prepared by an independent third party which analyzed the performance of the Funds using a variety of performance metrics, including metrics which also measured the performance of the Funds on a risk adjusted basis. With respect to each Fund, the Board concluded that the Fund’s performance or other relevant factors supported the renewal of the Agreement relating to that Fund. In the case of the Loomis Sayles Small Cap Value Fund, the performance of which lagged that of a relevant peer group median and/or category median of funds for certain (although not necessarily all) periods, the Board concluded that other factors relevant to performance supported renewal of the relevant Agreement, including (1) that the underperformance was attributable, to a significant extent, to investment decisions (such as security selection or
11 |
sector allocation) by the Adviser that were reasonable and consistent with the Fund’s investment objective and policies and (2) that the Fund’s performance was stronger over the long term.
The Trustees also considered the Adviser’s performance and reputation generally, the performance of the fund family generally (as noted by certain financial publications), and the historical responsiveness of the Adviser to Trustee concerns about performance and the willingness of the Adviser to take steps intended to improve performance.
After reviewing these and related factors, the Trustees concluded, within the context of their overall conclusions regarding each of the Agreements, that the performance of the Funds and the Adviser supported the renewal of the Agreements.
The costs of the services to be provided and profits to be realized by the Adviser and its affiliates from their respective relationships with the Funds. The Trustees considered the fees charged to the Funds for advisory services as well as the total expense levels of the Funds. This information included comparisons (provided both by management and also by an independent third party) of the Funds’ advisory fees and total expense levels to those of their peer groups and information about the advisory fees charged by the Adviser to comparable accounts (such as institutional separate accounts), as well as information about differences in such fees and the reasons for any such differences. In considering the fees charged to comparable accounts, the Trustees considered, among other things, management’s representations about the differences between managing mutual funds as compared to other types of accounts, including the additional resources required to effectively manage and the greater regulatory costs associated with the management of mutual fund assets. In evaluating each Fund’s advisory fee, the Trustees also took into account the demands, complexity and quality of the investment management of such Fund and the need for the Adviser to offer competitive compensation. The Trustees considered that over the past several years, management had made recommendations regarding reductions in advisory fee rates, implementation of advisory fee breakpoints and the institution of advisory fee waivers and expense caps for various funds in the fund family. They noted that both of the Funds in this report have expense caps in place, and they considered the amounts waived or reimbursed by the Adviser for the Loomis Sayles Small Cap Value Fund. The Loomis Sayles Small Cap Growth Fund current expenses are below the cap. The Trustees noted that the Loomis Sayles Small Cap Value Fund had an advisory fee rate that was above the median of a peer group of funds. The Trustees considered factors that management believed justified the relatively higher advisory fee rate. They also noted that the Fund had an expense cap in place that had the effect of reducing the advisory fee and that the Fund’s advisory fee rate was only slightly above its peer group median.
The Trustees also considered the compensation directly or indirectly received by the Adviser and its affiliates from their relationships with the Funds. The Trustees reviewed information provided by management as to the profitability of the Adviser and its affiliates’ relationships with the Funds, and information about the allocation of expenses used to calculate profitability. They also reviewed information provided by management about the effect of distribution costs and changes in asset levels on Adviser profitability,
| 12
including information regarding resources spent on distribution activities. When reviewing profitability, the Trustees also considered information about court cases in which adviser compensation or profitability were issues, the performance of the relevant Funds, the expense levels of the Funds, and whether the Adviser had implemented breakpoints and/or expense caps with respect to such Funds.
After reviewing these and related factors, the Trustees concluded, within the context of their overall conclusions regarding each of the Agreements, that the advisory fee charged to each of the Funds was fair and reasonable, and that the costs of these services generally and the related profitability of the Adviser and its affiliates in respect of their relationships with the Funds supported the renewal of the Agreements.
Economies of Scale. The Trustees considered the existence of any economies of scale in the provision of services by the Adviser and whether those economies are shared with the Funds through breakpoints in their investment advisory fees or other means, such as expense waivers or caps. The Trustees also discussed with management the factors considered with respect to the implementation of breakpoints in investment advisory fees or expense waivers or caps for certain funds. Management explained that a number of factors are taken into account in considering the implementation of breakpoints or an expense cap for a fund, including, among other things, factors such as a fund’s assets, the projected growth of a fund, projected profitability and a fund’s fees and performance. With respect to economies of scale, the Trustees noted that although neither Fund’s management fee was subject to breakpoints, the Loomis Sayles Small Cap Growth Fund’s management fee and each Fund’s overall net expense ratio was at or below the median fee for a peer group of funds and that each Fund was subject to an expense cap. In considering these issues, the Trustees also took note of the costs of the services provided (both on an absolute and a relative basis) and the profitability to the Adviser and its affiliates of their relationships with the Funds, as discussed above.
After reviewing these and related factors, the Trustees concluded, within the context of their overall conclusions regarding each of the Agreements, that the extent to which economies of scale were shared with the Funds supported the renewal of the Agreements.
The Trustees also considered other factors, which included but were not limited to the following:
| • | | the effect of recent market and economic events on the performance, asset levels and expense ratios of each Fund. |
| • | | whether each Fund has operated in accordance with its investment objective and the Fund’s record of compliance with its investment restrictions, and the compliance programs of the Funds and the Adviser. They also considered the compliance-related resources the Adviser and its affiliates were providing to the Funds. |
| • | | the nature, quality, cost and extent of administrative and shareholder services performed by the Adviser and its affiliates, both under the Agreements and under separate agreements covering administrative services. |
13 |
| • | | so-called “fallout benefits” to the Adviser, such as the engagement of affiliates of the Adviser to provide distribution, administrative and brokerage services to the Funds, and the benefits of research made available to the Adviser by reason of brokerage commissions (if any) generated by the Funds’ securities transactions. The Trustees also considered the fact that NGAM Advisors’ parent company benefits from the retention of an affiliated Adviser. The Trustees considered the possible conflicts of interest associated with these fallout and other benefits, and the reporting, disclosure and other processes in place to disclose and monitor such possible conflicts of interest. |
| • | | the Trustees’ review and discussion of the Funds’ advisory arrangements in prior years, and management’s record of responding to Trustee concerns raised during the year and in prior years. |
Based on their evaluation of all factors that they deemed to be material, including those factors described above, and assisted by the advice of independent counsel, the Trustees, including the Independent Trustees, concluded that each of the existing Agreements should be continued through June 30, 2013.
| 14
Portfolio of Investments – as of September 30, 2012
Loomis Sayles Small Cap Growth Fund
| | | | | | | | |
| | |
| Shares | | | Description | | Value (†) | |
| | | | | | | | |
| |
| | Common Stocks – 96.5% of Net Assets | | | | |
| | |
| | | | Aerospace & Defense – 2.1% | | | | |
| | 353,630 | | | Hexcel Corp.(b) | | $ | 8,494,193 | |
| | 147,759 | | | Triumph Group, Inc. | | | 9,239,370 | |
| | | | | | | | |
| | | | | | | 17,733,563 | |
| | | | | | | | |
| | | | Airlines – 0.4% | | | | |
| | 192,933 | | | Spirit Airlines, Inc.(b) | | | 3,295,296 | |
| | | | | | | | |
| | | | Biotechnology – 6.2% | | | | |
| | 258,260 | | | Aegerion Pharmaceuticals, Inc.(b) | | | 3,827,413 | |
| | 487,973 | | | Alkermes PLC(b) | | | 10,125,440 | |
| | 189,029 | | | Cubist Pharmaceuticals, Inc.(b) | | | 9,012,903 | |
| | 560,944 | | | Exact Sciences Corp.(b) | | | 6,175,993 | |
| | 165,027 | | | Genomic Health, Inc.(b) | | | 5,724,787 | |
| | 199,080 | | | Myriad Genetics, Inc.(b) | | | 5,373,169 | |
| | 651,398 | | | Neurocrine Biosciences, Inc.(b) | | | 5,198,156 | |
| | 218,700 | | | Seattle Genetics, Inc.(b) | | | 5,893,965 | |
| | | | | | | | |
| | | | | | | 51,331,826 | |
| | | | | | | | |
| | | | Building Products – 0.2% | | | | |
| | 191,254 | | | NCI Building Systems, Inc.(b) | | | 1,918,278 | |
| | | | | | | | |
| | | | Capital Markets – 2.2% | | | | |
| | 422,272 | | | Financial Engines, Inc.(b) | | | 10,062,742 | |
| | 234,630 | | | Stifel Financial Corp.(b) | | | 7,883,568 | |
| | | | | | | | |
| | | | | | | 17,946,310 | |
| | | | | | | | |
| | | | Chemicals – 1.2% | | | | |
| | 754,144 | | | Flotek Industries, Inc.(b) | | | 9,555,004 | |
| | | | | | | | |
| | | | Commercial Banks – 4.9% | | | | |
| | 159,467 | | | Bank of the Ozarks, Inc. | | | 5,496,827 | |
| | 812,574 | | | Boston Private Financial Holdings, Inc. | | | 7,792,585 | |
| | 139,526 | | | Signature Bank(b) | | | 9,359,404 | |
| | 133,273 | | | SVB Financial Group(b) | | | 8,057,686 | |
| | 208,038 | | | Texas Capital Bancshares, Inc.(b) | | | 10,341,569 | |
| | | | | | | | |
| | | | | | | 41,048,071 | |
| | | | | | | | |
| | | | Communications Equipment – 2.5% | | | | |
| | 541,592 | | | Ciena Corp.(b) | | | 7,365,651 | |
| | 379,345 | | | Ixia(b) | | | 6,096,074 | |
| | 298,836 | | | Procera Networks, Inc.(b) | | | 7,022,646 | |
| | | | | | | | |
| | | | | | | 20,484,371 | |
| | | | | | | | |
| | | | Construction & Engineering – 0.8% | | | | |
| | 341,015 | | | MasTec, Inc.(b) | | | 6,717,996 | |
| | | | | | | | |
| | | | Distributors – 1.0% | | | | |
| | 202,180 | | | Pool Corp. | | | 8,406,644 | |
| | | | | | | | |
See accompanying notes to financial statements.
15 |
Portfolio of Investments – as of September 30, 2012
Loomis Sayles Small Cap Growth Fund – continued
| | | | | | | | |
| | |
| Shares | | | Description | | Value (†) | |
| | | | | | | | |
| |
| | Common Stocks – continued | | | | |
| | |
| | | | Diversified Consumer Services – 1.0% | | | | |
| | 354,059 | | | Grand Canyon Education, Inc.(b) | | $ | 8,331,008 | |
| | | | | | | | |
| | | | Diversified Financial Services – 0.8% | | | | |
| | 199,668 | | | MarketAxess Holdings, Inc. | | | 6,309,509 | |
| | | | | | | | |
| | | | Electrical Equipment – 1.1% | | | | |
| | 358,389 | | | Thermon Group Holdings, Inc.(b) | | | 8,956,141 | |
| | | | | | | | |
| | | | Electronic Equipment, Instruments & Components – 3.7% | | | | |
| | 111,247 | | | FARO Technologies, Inc.(b) | | | 4,596,726 | |
| | 91,308 | | | FEI Co. | | | 4,884,978 | |
| | 152,197 | | | IPG Photonics Corp.(b) | | | 8,720,888 | |
| | 203,677 | | | Measurement Specialties, Inc.(b) | | | 6,717,268 | |
| | 76,018 | | | OSI Systems, Inc.(b) | | | 5,917,241 | |
| | | | | | | | |
| | | | | | | 30,837,101 | |
| | | | | | | | |
| | | | Energy Equipment & Services – 3.5% | | | | |
| | 107,719 | | | Dril-Quip, Inc.(b) | | | 7,742,842 | |
| | 330,697 | | | Forum Energy Technologies, Inc.(b) | | | 8,042,551 | |
| | 126,751 | | | Lufkin Industries, Inc. | | | 6,821,739 | |
| | 118,625 | | | Oceaneering International, Inc. | | | 6,554,031 | |
| | | | | | | | |
| | | | | | | 29,161,163 | |
| | | | | | | | |
| | | | Food & Staples Retailing – 1.7% | | | | |
| | 111,621 | | | Fresh Market, Inc. (The)(b) | | | 6,695,028 | |
| | 205,173 | | | Susser Holdings Corp.(b) | | | 7,421,107 | |
| | | | | | | | |
| | | | | | | 14,116,135 | |
| | | | | | | | |
| | | | Health Care Equipment & Supplies – 9.9% | | | | |
| | 235,111 | | | Abaxis, Inc.(b) | | | 8,445,187 | |
| | 284,508 | | | ABIOMED, Inc.(b) | | | 5,971,823 | |
| | 284,667 | | | Align Technology, Inc.(b) | | | 10,524,139 | |
| | 416,231 | | | Conceptus, Inc.(b) | | | 8,453,652 | |
| | 180,690 | | | Cyberonics, Inc.(b) | | | 9,471,770 | |
| | 437,668 | | | Endologix, Inc.(b) | | | 6,048,572 | |
| | 91,628 | | | ICU Medical, Inc.(b) | | | 5,541,661 | |
| | 376,083 | | | Insulet Corp.(b) | | | 8,115,871 | |
| | 344,328 | | | NuVasive, Inc.(b) | | | 7,888,555 | |
| | 318,468 | | | NxStage Medical, Inc.(b) | | | 4,206,962 | |
| | 271,355 | | | Volcano Corp.(b) | | | 7,752,612 | |
| | | | | | | | |
| | | | | | | 82,420,804 | |
| | | | | | | | |
| | | | Health Care Providers & Services – 2.3% | | | | |
| | 354,163 | | | Hanger Orthopedic Group, Inc.(b) | | | 10,104,271 | |
| | 330,855 | | | Team Health Holdings, Inc.(b) | | | 8,976,096 | |
| | | | | | | | |
| | | | | | | 19,080,367 | |
| | | | | | | | |
| | | | Health Care Technology – 0.7% | | | | |
| | 304,289 | | | MedAssets, Inc.(b) | | | 5,416,344 | |
| | | | | | | | |
See accompanying notes to financial statements.
| 16
Portfolio of Investments – as of September 30, 2012
Loomis Sayles Small Cap Growth Fund – continued
| | | | | | | | |
| | |
| Shares | | | Description | | Value (†) | |
| | | | | | | | |
| |
| | Common Stocks – continued | | | | |
| | |
| | | | Hotels, Restaurants & Leisure – 5.2% | | | | |
| | 214,797 | | | Life Time Fitness, Inc.(b) | | $ | 9,824,815 | |
| | 37,368 | | | Panera Bread Co., Class A(b) | | | 6,385,817 | |
| | 589,063 | | | Shuffle Master, Inc.(b) | | | 9,313,086 | |
| | 475,464 | | | Texas Roadhouse, Inc. | | | 8,130,434 | |
| | 162,621 | | | Vail Resorts, Inc. | | | 9,375,101 | |
| | | | | | | | |
| | | | | | | 43,029,253 | |
| | | | | | | | |
| | | | Insurance – 0.9% | | | | |
| | 287,021 | | | Amtrust Financial Services, Inc. | | | 7,353,478 | |
| | | | | | | | |
| | | | Internet Software & Services – 4.2% | | | | |
| | 253,554 | | | Cornerstone OnDemand, Inc.(b) | | | 7,773,966 | |
| | 126,804 | | | CoStar Group, Inc.(b) | | | 10,339,598 | |
| | 466,693 | | | DealerTrack Holdings, Inc.(b) | | | 12,997,400 | |
| | 165,905 | | | Trulia, Inc.(b) | | | 3,553,685 | |
| | | | | | | | |
| | | | | | | 34,664,649 | |
| | | | | | | | |
| | | | IT Services – 2.2% | | | | |
| | 262,856 | | | Heartland Payment Systems, Inc. | | | 8,327,278 | |
| | 447,718 | | | InterXion Holding NV(b) | | | 10,172,153 | |
| | | | | | | | |
| | | | | | | 18,499,431 | |
| | | | | | | | |
| | | | Life Sciences Tools & Services – 1.1% | | | | |
| | 300,972 | | | PAREXEL International Corp.(b) | | | 9,257,899 | |
| | | | | | | | |
| | | | Machinery – 4.2% | | | | |
| | 161,285 | | | Chart Industries, Inc.(b) | | | 11,910,897 | |
| | 67,465 | | | Middleby Corp. (The)(b) | | | 7,801,653 | |
| | 184,592 | | | RBC Bearings, Inc.(b) | | | 8,878,875 | |
| | 99,968 | | | Robbins & Myers, Inc. | | | 5,958,093 | |
| | | | | | | | |
| | | | | | | 34,549,518 | |
| | | | | | | | |
| | | | Oil, Gas & Consumable Fuels – 3.4% | | | | |
| | 252,325 | | | Approach Resources, Inc.(b) | | | 7,602,552 | |
| | 148,026 | | | Gulfport Energy Corp.(b) | | | 4,627,293 | |
| | 260,289 | | | Oasis Petroleum, Inc.(b) | | | 7,670,717 | |
| | 179,407 | | | Rosetta Resources, Inc.(b) | | | 8,593,595 | |
| | | | | | | | |
| | | | | | | 28,494,157 | |
| | | | | | | | |
| | | | Pharmaceuticals – 1.9% | | | | |
| | 96,012 | | | Medicis Pharmaceutical Corp., Class A | | | 4,154,439 | |
| | 605,261 | | | Nektar Therapeutics(b) | | | 6,464,187 | |
| | 70,221 | | | Optimer Pharmaceuticals, Inc.(b) | | | 991,521 | |
| | 239,122 | | | Pacira Pharmaceuticals, Inc.(b) | | | 4,160,723 | |
| | | | | | | | |
| | | | | | | 15,770,870 | |
| | | | | | | | |
See accompanying notes to financial statements.
17 |
Portfolio of Investments – as of September 30, 2012
Loomis Sayles Small Cap Growth Fund – continued
| | | | | | | | |
| | |
| Shares | | | Description | | Value (†) | |
| | | | | | | | |
| |
| | Common Stocks – continued | | | | |
| | |
| | | | Professional Services – 3.9% | | | | |
| | 211,857 | | | Advisory Board Co. (The)(b) | | $ | 10,133,120 | |
| | 279,321 | | | Corporate Executive Board Co. (The) | | | 14,979,985 | |
| | 215,545 | | | Huron Consulting Group, Inc.(b) | | | 7,505,277 | |
| | | | | | | | |
| | | | | | | 32,618,382 | |
| | | | | | | | |
| | | | Road & Rail – 1.3% | | | | |
| | 163,491 | | | Genesee & Wyoming, Inc., Class A(b) | | | 10,931,008 | |
| | | | | | | | |
| | | | Semiconductors & Semiconductor Equipment – 5.4% | | | | |
| | 244,894 | | | Cavium, Inc.(b) | | | 8,162,317 | |
| | 137,977 | | | Cymer, Inc.(b) | | | 7,045,106 | |
| | 182,454 | | | EZchip Semiconductor Ltd.(b) | | | 5,581,268 | |
| | 144,926 | | | Hittite Microwave Corp.(b) | | | 8,039,045 | |
| | 159,253 | | | Silicon Laboratories, Inc.(b) | | | 5,854,140 | |
| | 156,419 | | | Ultratech, Inc.(b) | | | 4,908,428 | |
| | 230,194 | | | Volterra Semiconductor Corp.(b) | | | 5,034,343 | |
| | | | | | | | |
| | | | | | | 44,624,647 | |
| | | | | | | | |
| | | | Software – 8.2% | | | | |
| | 342,725 | | | Allot Communications Ltd.(b) | | | 9,089,067 | |
| | 156,847 | | | CommVault Systems, Inc.(b) | | | 9,206,919 | |
| | 197,422 | | | Ellie Mae, Inc.(b) | | | 5,375,801 | |
| | 294,023 | | | Guidewire Software, Inc.(b) | | | 9,129,414 | |
| | 206,350 | | | Imperva, Inc.(b) | | | 7,632,887 | |
| | 276,917 | | | QLIK Technologies, Inc.(b) | | | 6,205,710 | |
| | 182,240 | | | Sourcefire, Inc.(b) | | | 8,935,227 | |
| | 118,731 | | | Ultimate Software Group, Inc. (The)(b) | | | 12,122,435 | |
| | | | | | | | |
| | | | | | | 67,697,460 | |
| | | | | | | | |
| | | | Specialty Retail – 6.6% | | | | |
| | 369,292 | | | Asbury Automotive Group, Inc.(b) | | | 10,321,711 | |
| | 150,165 | | | Cabela’s, Inc.(b) | | | 8,211,022 | |
| | 419,492 | | | Chico’s FAS, Inc. | | | 7,597,000 | |
| | 135,678 | | | Hibbett Sports, Inc.(b) | | | 8,066,057 | |
| | 148,941 | | | Lumber Liquidators Holdings, Inc.(b) | | | 7,548,330 | |
| | 132,951 | | | rue21, Inc.(b) | | | 4,141,424 | |
| | 155,137 | | | Vitamin Shoppe, Inc.(b) | | | 9,047,590 | |
| | | | | | | | |
| | | | | | | 54,933,134 | |
| | | | | | | | |
| | | | Textiles, Apparel & Luxury Goods – 1.8% | | | | |
| | 300,920 | | | Fifth & Pacific Cos., Inc.(b) | | | 3,845,757 | |
| | 196,353 | | | Oxford Industries, Inc. | | | 11,084,127 | |
| | | | | | | | |
| | | | | | | 14,929,884 | |
| | | | | | | | |
| | | | Total Common Stocks
(Identified Cost $702,495,487) | | | 800,419,701 | |
| | | | | | | | |
See accompanying notes to financial statements.
| 18
Portfolio of Investments – as of September 30, 2012
Loomis Sayles Small Cap Growth Fund – continued
| | | | | | | | |
Principal
Amount | | | Description | | Value (†) | |
| | | | | | | | |
| |
| | Short-Term Investments – 2.8% | | | | |
| $ | 23,095,920 | | | Tri-Party Repurchase Agreement with Fixed Income Clearing Corporation, dated 9/28/2012 at 0.010% to be repurchased at $23,095,939 on 10/01/2012 collateralized by $22,970,000 U.S. Treasury Note, 1.000% due 3/31/2017 valued at $23,559,135 including accrued interest (Note 2 of Notes to Financial Statements) (Identified Cost $23,095,920) | | $ | 23,095,920 | |
| | | | | | | | |
| | |
| | | | Total Investments – 99.3%
(Identified Cost $725,591,407)(a) | | | 823,515,621 | |
| | | | Other assets less liabilities—0.7% | | | 5,774,550 | |
| | | | | | | | |
| | | | Net Assets – 100.0% | | $ | 829,290,171 | |
| | | | | | | | |
| | |
| | (†) | | | See Note 2 of Notes to Financial Statements. | | | | |
| | (a) | | | Federal Tax Information: | | | | |
| | | | At September 30, 2012, the net unrealized appreciation on investments based on a cost of $726,096,514 for federal income tax purposes was as follows: | | | | |
| | | | Aggregate gross unrealized appreciation for all investments in which there is an excess of value over tax cost | | $ | 107,189,185 | |
| | | | Aggregate gross unrealized depreciation for all investments in which there is an excess of tax cost over value | | | (9,770,078 | ) |
| | | | | | | | |
| | | | Net unrealized appreciation | | $ | 97,419,107 | |
| | | | | | | | |
| | (b) | | | Non-income producing security. | | | | |
Industry Summary at September 30, 2012 (Unaudited)
| | | | |
Health Care Equipment & Supplies | | | 9.9 | % |
Software | | | 8.2 | |
Specialty Retail | | | 6.6 | |
Biotechnology | | | 6.2 | |
Semiconductors & Semiconductor Equipment | | | 5.4 | |
Hotels, Restaurants & Leisure | | | 5.2 | |
Commercial Banks | | | 4.9 | |
Internet Software & Services | | | 4.2 | |
Machinery | | | 4.2 | |
Professional Services | | | 3.9 | |
Electronic Equipment, Instruments & Components | | | 3.7 | |
Energy Equipment & Services | | | 3.5 | |
Oil, Gas & Consumable Fuels | | | 3.4 | |
Communications Equipment | | | 2.5 | |
Health Care Providers & Services | | | 2.3 | |
IT Services | | | 2.2 | |
Capital Markets | | | 2.2 | |
Aerospace & Defense | | | 2.1 | |
Other Investments, less than 2% each | | | 15.9 | |
Short-Term Investments | | | 2.8 | |
| | | | |
Total Investments | | | 99.3 | |
Other assets less liabilities | | | 0.7 | |
| | | | |
Net Assets | | | 100.0 | % |
| | | | |
See accompanying notes to financial statements.
19 |
Portfolio of Investments – as of September 30, 2012
Loomis Sayles Small Cap Value Fund
| | | | | | | | |
| Shares | | | Description | | Value (†) | |
| | | | | | | | |
| |
| | Common Stocks – 98.0% of Net Assets | | | | |
| | |
| | | | Auto Components – 1.2% | | | | |
| | 534,579 | | | Dana Holding Corp. | | $ | 6,575,322 | |
| | 172,744 | | | Tenneco, Inc.(b) | | | 4,836,832 | |
| | | | | | | | |
| | | | | | | 11,412,154 | |
| | | | | | | | |
| | | | Building Products – 0.6% | | | | |
| | 136,504 | | | Armstrong World Industries, Inc.(b) | | | 6,329,691 | |
| | | | | | | | |
| | | | Capital Markets – 1.8% | | | | |
| | 777,711 | | | Fifth Street Finance Corp. | | | 8,539,267 | |
| | 269,619 | | | Stifel Financial Corp.(b) | | | 9,059,198 | |
| | | | | | | | |
| | | | | | | 17,598,465 | |
| | | | | | | | |
| | | | Chemicals – 3.0% | | | | |
| | 125,729 | | | Cabot Corp. | | | 4,597,909 | |
| | 112,430 | | | Koppers Holdings, Inc. | | | 3,927,180 | |
| | 97,033 | | | Minerals Technologies, Inc. | | | 6,882,551 | |
| | 282,814 | | | Olin Corp. | | | 6,145,548 | |
| | 83,411 | | | WR Grace & Co.(b) | | | 4,927,922 | |
| | 182,181 | | | Zep, Inc. | | | 2,754,577 | |
| | | | | | | | |
| | | | | | | 29,235,687 | |
| | | | | | | | |
| | | | Commercial Banks – 9.2% | | | | |
| | 587,102 | | | BancorpSouth, Inc. | | | 8,653,884 | |
| | 618,248 | | | Cathay General Bancorp | | | 10,670,961 | |
| | 159,134 | | | City National Corp. | | | 8,196,992 | |
| | 495,700 | | | CVB Financial Corp. | | | 5,918,658 | |
| | 482,130 | | | First Financial Bancorp | | | 8,152,818 | |
| | 138,673 | | | First Financial Bankshares, Inc. | | | 4,996,388 | |
| | 160,056 | | | IBERIABANK Corp. | | | 7,330,565 | |
| | 246,925 | | | Pinnacle Financial Partners, Inc.(b) | | | 4,770,591 | |
| | 260,432 | | | Popular, Inc.(b) | | | 4,539,330 | |
| | 183,036 | | | Prosperity Bancshares, Inc. | | | 7,800,994 | |
| | 147,680 | | | Signature Bank(b) | | | 9,906,374 | |
| | 264,608 | | | Wintrust Financial Corp. | | | 9,941,323 | |
| | | | | | | | |
| | | | | | | 90,878,878 | |
| | | | | | | | |
| | | | Commercial Services & Supplies – 3.9% | | | | |
| | 586,807 | | | ACCO Brands Corp.(b) | | | 3,808,378 | |
| | 48,642 | | | Brink’s Co. (The) | | | 1,249,613 | |
| | 506,299 | | | KAR Auction Services, Inc.(b) | | | 9,994,342 | |
| | 144,766 | | | McGrath Rentcorp | | | 3,776,945 | |
| | 438,131 | | | Rollins, Inc. | | | 10,247,884 | |
| | 130,259 | | | Team, Inc.(b) | | | 4,148,749 | |
| | 182,077 | | | Waste Connections, Inc. | | | 5,507,829 | |
| | | | | | | | |
| | | | | | | 38,733,740 | |
| | | | | | | | |
See accompanying notes to financial statements.
| 20
Portfolio of Investments – as of September 30, 2012
Loomis Sayles Small Cap Value Fund – continued
| | | | | | | | |
| Shares | | | Description | | Value (†) | |
| | | | | | | | |
| |
| | Common Stocks – continued | | | | |
| | |
| | | | Communications Equipment – 1.6% | | | | |
| | 808,082 | | | Brocade Communications Systems, Inc.(b) | | $ | 4,779,805 | |
| | 662,976 | | | Harmonic, Inc.(b) | | | 3,009,911 | |
| | 214,858 | | | NETGEAR, Inc.(b) | | | 8,194,684 | |
| | | | | | | | |
| | | | | | | 15,984,400 | |
| | | | | | | | |
| | | | Computers & Peripherals – 0.3% | | | | |
| | 256,240 | | | QLogic Corp.(b) | | | 2,926,261 | |
| | | | | | | | |
| | | | Construction & Engineering – 0.9% | | | | |
| | 277,793 | | | MYR Group, Inc.(b) | | | 5,541,970 | |
| | 237,458 | | | Primoris Services Corp. | | | 3,098,827 | |
| | | | | | | | |
| | | | | | | 8,640,797 | |
| | | | | | | | |
| | | | Consumer Finance – 1.3% | | | | |
| | 93,736 | | | Cash America International, Inc. | | | 3,615,398 | |
| | 547,970 | | | DFC Global Corp.(b) | | | 9,397,685 | |
| | | | | | | | |
| | | | | | | 13,013,083 | |
| | | | | | | | |
| | | | Distributors – 0.5% | | | | |
| | 109,064 | | | Core-Mark Holding Co., Inc. | | | 5,247,069 | |
| | | | | | | | |
| | | | Diversified Financial Services – 0.7% | | | | |
| | 222,094 | | | MarketAxess Holdings, Inc. | | | 7,018,170 | |
| | | | | | | | |
| | | | Electric Utilities – 2.5% | | | | |
| | 220,623 | | | ALLETE, Inc. | | | 9,208,804 | |
| | 81,523 | | | ITC Holdings Corp. | | | 6,161,508 | |
| | 261,847 | | | UIL Holdings Corp. | | | 9,389,834 | |
| | | | | | | | |
| | | | | | | 24,760,146 | |
| | | | | | | | |
| | | | Electrical Equipment – 3.6% | | | | |
| | 287,432 | | | AZZ, Inc. | | | 10,916,668 | |
| | 126,849 | | | Belden, Inc. | | | 4,678,191 | |
| | 128,758 | | | EnerSys(b) | | | 4,543,870 | |
| | 208,227 | | | General Cable Corp.(b) | | | 6,117,709 | |
| | 148,139 | | | Global Power Equipment Group, Inc. | | | 2,739,090 | |
| | 357,614 | | | II-VI, Inc.(b) | | | 6,801,818 | |
| | | | | | | | |
| | | | | | | 35,797,346 | |
| | | | | | | | |
| | | | Electronic Equipment, Instruments & Components – 3.7% | | | | |
| | 137,741 | | | Cognex Corp. | | | 4,763,084 | |
| | 359,931 | | | GSI Group, Inc.(b) | | | 3,206,985 | |
| | 152,527 | | | Littelfuse, Inc. | | | 8,623,877 | |
| | 337,014 | | | Methode Electronics, Inc. | | | 3,272,406 | |
| | 146,804 | | | Rogers Corp.(b) | | | 6,218,617 | |
| | 158,371 | | | ScanSource, Inc.(b) | | | 5,071,039 | |
| | 545,241 | | | Vishay Intertechnology, Inc.(b) | | | 5,359,719 | |
| | | | | | | | |
| | | | | | | 36,515,727 | |
| | | | | | | | |
See accompanying notes to financial statements.
21 |
Portfolio of Investments – as of September 30, 2012
Loomis Sayles Small Cap Value Fund – continued
| | | | | | | | |
| Shares | | | Description | | Value (†) | |
| | | | | | | | |
| |
| | Common Stocks – continued | | | | |
| | |
| | | | Energy Equipment & Services – 2.2% | | | | |
| | 289,873 | | | Helix Energy Solutions Group, Inc.(b) | | $ | 5,295,980 | |
| | 149,148 | | | Lufkin Industries, Inc. | | | 8,027,145 | |
| | 148,637 | | | Oceaneering International, Inc. | | | 8,212,194 | |
| | | | | | | | |
| | | | | | | 21,535,319 | |
| | | | | | | | |
| | | | Food & Staples Retailing – 0.9% | | | | |
| | 62,891 | | | Casey’s General Stores, Inc. | | | 3,593,592 | |
| | 348,659 | | | Spartan Stores, Inc. | | | 5,337,969 | |
| | | | | | | | |
| | | | | | | 8,931,561 | |
| | | | | | | | |
| | | | Food Products – 2.0% | | | | |
| | 329,955 | | | Darling International, Inc.(b) | | | 6,034,877 | |
| | 147,190 | | | Ingredion, Inc. | | | 8,119,000 | |
| | 93,203 | | | J & J Snack Foods Corp. | | | 5,343,328 | |
| | | | | | | | |
| | | | | | | 19,497,205 | |
| | | | | | | | |
| | | | Gas Utilities – 0.9% | | | | |
| | 280,109 | | | UGI Corp. | | | 8,893,461 | |
| | | | | | | | |
| | | | Health Care Equipment & Supplies – 1.1% | | | | |
| | 155,947 | | | SurModics, Inc.(b) | | | 3,153,248 | |
| | 112,062 | | | Teleflex, Inc. | | | 7,714,348 | |
| | | | | | | | |
| | | | | | | 10,867,596 | |
| | | | | | | | |
| | | | Health Care Providers & Services – 3.0% | | | | |
| | 263,596 | | | Bio-Reference Labs, Inc.(b) | | | 7,533,574 | |
| | 193,953 | | | Hanger Orthopedic Group, Inc.(b) | | | 5,533,479 | |
| | 116,531 | | | MEDNAX, Inc.(b) | | | 8,675,733 | |
| | 136,766 | | | WellCare Health Plans, Inc.(b) | | | 7,734,117 | |
| | | | | | | | |
| | | | | | | 29,476,903 | |
| | | | | | | | |
| | | | Hotels, Restaurants & Leisure – 3.8% | | | | |
| | 122,741 | | | Churchill Downs, Inc. | | | 7,698,316 | |
| | 117,929 | | | Cracker Barrel Old Country Store, Inc. | | | 7,914,215 | |
| | 233,793 | | | Marriott Vacations Worldwide Corp.(b) | | | 8,421,224 | |
| | 113,080 | | | Six Flags Entertainment Corp. | | | 6,649,104 | |
| | 124,251 | | | Wyndham Worldwide Corp. | | | 6,520,692 | |
| | | | | | | | |
| | | | | | | 37,203,551 | |
| | | | | | | | |
| | | | Household Durables – 1.7% | | | | |
| | 229,532 | | | Jarden Corp. | | | 12,128,471 | |
| | 329,952 | | | La-Z-Boy, Inc.(b) | | | 4,827,198 | |
| | | | | | | | |
| | | | | | | 16,955,669 | |
| | | | | | | | |
| | | | Industrial Conglomerates – 0.7% | | | | |
| | 240,946 | | | Raven Industries, Inc. | | | 7,091,041 | |
| | | | | | | | |
See accompanying notes to financial statements.
| 22
Portfolio of Investments – as of September 30, 2012
Loomis Sayles Small Cap Value Fund – continued
| | | | | | | | |
| Shares | | | Description | | Value (†) | |
| | | | | | | | |
| |
| | Common Stocks – continued | | | | |
| | |
| | | | Insurance – 3.7% | | | | |
| | 446,540 | | | Employers Holdings, Inc. | | $ | 8,185,078 | |
| | 326,467 | | | HCC Insurance Holdings, Inc. | | | 11,063,967 | |
| | 108,309 | | | ProAssurance Corp. | | | 9,795,466 | |
| | 133,959 | | | Reinsurance Group of America, Inc., Class A | | | 7,752,207 | |
| | | | | | | | |
| | | | | | | 36,796,718 | |
| | | | | | | | |
| | | | Internet & Catalog Retail – 1.1% | | | | |
| | 127,655 | | | HSN, Inc. | | | 6,261,478 | |
| | 97,059 | | | Liberty Ventures, Series A(b) | | | 4,818,009 | |
| | | | | | | | |
| | | | | | | 11,079,487 | |
| | | | | | | | |
| | | | Internet Software & Services – 0.9% | | | | |
| | 98,524 | | | IAC/InterActiveCorp | | | 5,129,159 | |
| | 341,227 | | | Perficient, Inc.(b) | | | 4,118,610 | |
| | | | | | | | |
| | | | | | | 9,247,769 | |
| | | | | | | | |
| | | | IT Services – 3.1% | | | | |
| | 463,380 | | | Convergys Corp. | | | 7,261,164 | |
| | 429,339 | | | Euronet Worldwide, Inc.(b) | | | 8,067,280 | |
| | 215,207 | | | Wright Express Corp.(b) | | | 15,004,232 | |
| | | | | | | | |
| | | | | | | 30,332,676 | |
| | | | | | | | |
| | | | Machinery – 5.4% | | | | |
| | 172,663 | | | Actuant Corp., Class A | | | 4,941,615 | |
| | 110,937 | | | Alamo Group, Inc. | | | 3,747,452 | |
| | 296,706 | | | Albany International Corp., Class A | | | 6,518,631 | |
| | 443,446 | | | Altra Holdings, Inc. | | | 8,070,717 | |
| | 185,466 | | | John Bean Technologies Corp. | | | 3,028,660 | |
| | 34,988 | | | Middleby Corp. (The)(b) | | | 4,046,012 | |
| | 170,275 | | | RBC Bearings, Inc.(b) | | | 8,190,228 | |
| | 189,727 | | | TriMas Corp.(b) | | | 4,574,318 | |
| | 123,266 | | | Wabtec Corp. | | | 9,897,027 | |
| | | | | | | | |
| | | | | | | 53,014,660 | |
| | | | | | | | |
| | | | Marine – 0.7% | | | | |
| | 121,016 | | | Kirby Corp.(b) | | | 6,689,765 | |
| | | | | | | | |
| | | | Media – 2.0% | | | | |
| | 178,757 | | | Arbitron, Inc. | | | 6,774,890 | |
| | 186,322 | | | John Wiley & Sons, Inc., Class A | | | 8,561,496 | |
| | 447,724 | | | Live Nation Entertainment, Inc.(b) | | | 3,854,904 | |
| | | | | | | | |
| | | | | | | 19,191,290 | |
| | | | | | | | |
| | | | Metals & Mining – 2.6% | | | | |
| | 102,828 | | | Haynes International, Inc. | | | 5,362,480 | |
| | 560,885 | | | Horsehead Holding Corp.(b) | | | 5,238,666 | |
See accompanying notes to financial statements.
23 |
Portfolio of Investments – as of September 30, 2012
Loomis Sayles Small Cap Value Fund – continued
| | | | | | | | |
| Shares | | | Description | | Value (†) | |
| | | | | | | | |
| |
| | Common Stocks – continued | | | | |
| | |
| | | | Metals & Mining – continued | | | | |
| | 154,083 | | | Reliance Steel & Aluminum Co. | | $ | 8,066,245 | |
| | 440,342 | | | SunCoke Energy, Inc.(b) | | | 7,098,313 | |
| | | | | | | | |
| | | | | | | 25,765,704 | |
| | | | | | | | |
| | | | Multi Utilities – 0.4% | | | | |
| | 96,223 | | | NorthWestern Corp. | | | 3,486,159 | |
| | | | | | | | |
| | | | Multiline Retail – 0.6% | | | | |
| | 398,351 | | | Fred’s, Inc. Class A | | | 5,668,535 | |
| | | | | | | | |
| | | | Oil, Gas & Consumable Fuels – 1.9% | | | | |
| | 109,369 | | | Berry Petroleum Co., Class A | | | 4,443,662 | |
| | 232,910 | | | Cloud Peak Energy, Inc.(b) | | | 4,215,671 | |
| | 488,885 | | | EPL Oil & Gas, Inc.(b) | | | 9,919,477 | |
| | | | | | | | |
| | | | | | | 18,578,810 | |
| | | | | | | | |
| | | | Pharmaceuticals – 0.8% | | | | |
| | 287,573 | | | Impax Laboratories, Inc.(b) | | | 7,465,395 | |
| | | | | | | | |
| | | | REITs – Apartments – 3.4% | | | | |
| | 233,803 | | | American Campus Communities, Inc. | | | 10,259,276 | |
| | 124,279 | | | Home Properties, Inc. | | | 7,614,574 | |
| | 133,984 | | | Mid-America Apartment Communities, Inc. | | | 8,750,495 | |
| | 258,603 | | | UDR, Inc. | | | 6,418,526 | |
| | | | | | | | |
| | | | | | | 33,042,871 | |
| | | | | | | | |
| | | | REITs – Diversified – 1.4% | | | | |
| | 317,842 | | | DuPont Fabros Technology, Inc. | | | 8,025,510 | |
| | 157,581 | | | Potlatch Corp. | | | 5,888,802 | |
| | | | | | | | |
| | | | | | | 13,914,312 | |
| | | | | | | | |
| | | | REITs – Healthcare – 1.0% | | | | |
| | 427,396 | | | Omega Healthcare Investors, Inc. | | | 9,714,711 | |
| | | | | | | | |
| | | | REITs – Hotels – 0.8% | | | | |
| | 1,629,443 | | | Hersha Hospitality Trust | | | 7,984,271 | |
| | | | | | | | |
| | | | REITs – Office Property – 1.0% | | | | |
| | 532,268 | | | BioMed Realty Trust, Inc. | | | 9,964,057 | |
| | | | | | | | |
| | | | REITs – Single Tenant – 0.6% | | | | |
| | 195,910 | | | National Retail Properties, Inc. | | | 5,975,255 | |
| | | | | | | | |
| | | | REITs – Storage – 2.1% | | | | |
| | 776,343 | | | CubeSmart | | | 9,991,535 | |
| | 180,366 | | | Sovran Self Storage, Inc. | | | 10,434,173 | |
| | | | | | | | |
| | | | | | | 20,425,708 | |
| | | | | | | | |
| | | | Road & Rail – 2.8% | | | | |
| | 381,765 | | | Avis Budget Group, Inc.(b) | | | 5,871,546 | |
See accompanying notes to financial statements.
| 24
Portfolio of Investments – as of September 30, 2012
Loomis Sayles Small Cap Value Fund – continued
| | | | | | | | |
| Shares | | | Description | | Value (†) | |
| | | | | | | | |
| |
| | Common Stocks – continued | | | | |
| | |
| | | | Road & Rail – continued | | | | |
| | 121,198 | | | Genesee & Wyoming, Inc., Class A(b) | | $ | 8,103,298 | |
| | 293,871 | | | Old Dominion Freight Line, Inc.(b) | | | 8,863,150 | |
| | 207,617 | | | Werner Enterprises, Inc. | | | 4,436,775 | |
| | | | | | | | |
| | | | | | | 27,274,769 | |
| | | | | | | | |
| | | | Semiconductors & Semiconductor Equipment – 2.1% | | | | |
| | 624,302 | | | Lattice Semiconductor Corp.(b) | | | 2,391,077 | |
| | 90,846 | | | MKS Instruments, Inc. | | | 2,315,664 | |
| | 278,294 | | | Semtech Corp.(b) | | | 6,999,094 | |
| | 619,995 | | | Teradyne, Inc.(b) | | | 8,816,329 | |
| | | | | | | | |
| | | | | | | 20,522,164 | |
| | | | | | | | |
| | | | Software – 1.5% | | | | |
| | 453,580 | | | Comverse Technology, Inc.(b) | | | 2,789,517 | |
| | 285,214 | | | Monotype Imaging Holdings, Inc. | | | 4,446,486 | |
| | 314,189 | | | SS&C Technologies Holdings, Inc.(b) | | | 7,920,705 | |
| | | | | | | | |
| | | | | | | 15,156,708 | |
| | | | | | | | |
| | | | Specialty Retail – 4.2% | | | | |
| | 131,282 | | | Genesco, Inc.(b) | | | 8,760,448 | |
| | 941,746 | | | Hot Topic, Inc. | | | 8,193,190 | |
| | 105,292 | | | Jos. A. Bank Clothiers, Inc.(b) | | | 5,104,556 | |
| | 175,920 | | | Rent-A-Center, Inc. | | | 6,171,274 | |
| | 510,856 | | | Sally Beauty Holdings, Inc.(b) | | | 12,817,377 | |
| | | | | | | | |
| | | | | | | 41,046,845 | |
| | | | | | | | |
| | | | Thrifts & Mortgage Finance – 0.7% | | | | |
| | 557,049 | | | Capitol Federal Financial, Inc. | | | 6,662,306 | |
| | | | | | | | |
| | | | Trading Companies & Distributors – 1.4% | | | | |
| | 91,850 | | | DXP Enterprises, Inc.(b) | | | 4,387,675 | |
| | 211,603 | | | H&E Equipment Services, Inc. | | | 2,564,628 | |
| | 341,141 | | | Rush Enterprises, Inc., Class A(b) | | | 6,570,376 | |
| | | | | | | | |
| | | | | | | 13,522,679 | |
| | | | | | | | |
| | | | Transportation Infrastructure – 0.3% | | | | |
| | 251,543 | | | Wesco Aircraft Holdings, Inc.(b) | | | 3,436,077 | |
| | | | | | | | |
| | | | Water Utilities – 0.4% | | | | |
| | 222,776 | | | Middlesex Water Co. | | | 4,268,388 | |
| | | | | | | | |
| | | | Total Common Stocks
(Identified Cost $736,274,157) | | | 964,772,009 | |
| | | | | | | | |
| |
| | Closed End Investment Companies – 0.9% | | | | |
| | 527,881 | | | Ares Capital Corp.
(Identified Cost $7,110,703) | | | 9,047,880 | |
| | | | | | | | |
See accompanying notes to financial statements.
25 |
Portfolio of Investments – as of September 30, 2012
Loomis Sayles Small Cap Value Fund – continued
| | | | | | | | |
| Shares | | | Description | | Value (†) | |
| | | | | | | | |
|
| | Warrants – 0.0% | |
| | 67,892 | | | Magnum Hunter Resources Corp.,
Expiration on 10/14/2013 at $10.50(b)(c)(d)
(Identified Cost $0) | | $ | — | |
| | | | | | | | |
| | |
| Principal
Amount |
| | | | | | |
| |
| | Short-Term Investments – 1.3% | | | | |
| $ | 12,694,726 | | | Tri-Party Repurchase Agreement with Fixed Income Clearing Corporation, dated 9/28/2012 at 0.010% to be repurchased at $12,694,737 on 10/01/2012 collateralized by $12,335,000 Federal National Mortgage Association, 2.750% due 4/16/2019 valued at $12,951,750 including accrued interest (Note 2 of Notes to Financial Statements) (Identified Cost $12,694,726) | | | 12,694,726 | |
| | | | | | | | |
| | |
| | | | Total Investments – 100.2%
(Identified Cost $756,079,586)(a) | | | 986,514,615 | |
| | | | Other assets less liabilities—(0.2)% | | | (2,405,323 | ) |
| | | | | | | | |
| | | | Net Assets – 100.0% | | $ | 984,109,292 | |
| | | | | | | | |
| | (†) | | | See Note 2 of Notes to Financial Statements. | | | | |
| | (a) | | | Federal Tax Information: | | | | |
| | | | At September 30, 2012, the net unrealized appreciation on investments based on a cost of $757,282,514 for federal income tax purposes was as follows: | | | | |
| | | | Aggregate gross unrealized appreciation for all investments in which there is an excess of value over tax cost | | $ | 250,346,557 | |
| | | | Aggregate gross unrealized depreciation for all investments in which there is an excess of tax cost over value | | | (21,114,456 | ) |
| | | | | | | | |
| | | | Net unrealized appreciation | | $ | 229,232,101 | |
| | | | | | | | |
| | (b) | | | Non-income producing security. | | | | |
| | (c) | | | Fair valued security by the Fund’s investment adviser. | | | | |
| | (d) | | | Illiquid security. | | | | |
| | |
| | REITs | | | Real Estate Investment Trusts | | | | |
See accompanying notes to financial statements.
| 26
Portfolio of Investments – as of September 30, 2012
Loomis Sayles Small Cap Value Fund – continued
Industry Summary at September 30, 2012 (Unaudited)
| | | | |
Commercial Banks | | | 9.2 | % |
Machinery | | | 5.4 | |
Specialty Retail | | | 4.2 | |
Commercial Services & Supplies | | | 3.9 | |
Hotels, Restaurants & Leisure | | | 3.8 | |
Insurance | | | 3.7 | |
Electronic Equipment, Instruments & Components | | | 3.7 | |
Electrical Equipment | | | 3.6 | |
REITs—Apartments | | | 3.4 | |
IT Services | | | 3.1 | |
Health Care Providers & Services | | | 3.0 | |
Chemicals | | | 3.0 | |
Road & Rail | | | 2.8 | |
Metals & Mining | | | 2.6 | |
Electric Utilities | | | 2.5 | |
Energy Equipment & Services | | | 2.2 | |
Semiconductors & Semiconductor Equipment | | | 2.1 | |
REITs—Storage | | | 2.1 | |
Food Products | | | 2.0 | |
Media | | | 2.0 | |
Other Investments, less than 2% each | | | 30.6 | |
Short-Term Investments | | | 1.3 | |
| | | | |
Total Investments | | | 100.2 | |
Other assets less liabilities | | | (0.2 | ) |
| | | | |
Net Assets | | | 100.0 | % |
| | | | |
See accompanying notes to financial statements.
27 |
Statements of Assets and Liabilities
September 30, 2012
| | | | | | | | |
| | | Small Cap
Growth Fund | | | Small Cap
Value Fund | |
ASSETS | | | | | | | | |
Investments at cost | | $ | 725,591,407 | | | $ | 756,079,586 | |
Net unrealized appreciation | | | 97,924,214 | | | | 230,435,029 | |
| | | | | | | | |
Investments at value | | | 823,515,621 | | | | 986,514,615 | |
Cash | | | — | | | | 26,394 | |
Receivable for Fund shares sold | | | 5,472,353 | | | | 713,396 | |
Receivable for securities sold | | | 1,584,638 | | | | 642,058 | |
Dividends and interest receivable | | | 38,322 | | | | 1,117,016 | |
| | | | | | | | |
TOTAL ASSETS | | | 830,610,934 | | | | 989,013,479 | |
| | | | | | | | |
LIABILITIES | | | | | | | | |
Payable for securities purchased | | | — | | | | 3,280,386 | |
Payable for Fund shares redeemed | | | 534,522 | | | | 712,225 | |
Management fees payable (Note 5) | | | 498,455 | | | | 605,069 | |
Deferred Trustees’ fees (Note 5) | | | 84,000 | | | | 156,943 | |
Administrative fees payable (Note 5) | | | 29,704 | | | | 36,724 | |
Payable to distributor (Note 5d) | | | 8,429 | | | | 13,178 | |
Other accounts payable and accrued expenses | | | 165,653 | | | | 99,662 | |
| | | | | | | | |
TOTAL LIABILITIES | | | 1,320,763 | | | | 4,904,187 | |
| | | | | | | | |
NET ASSETS | | $ | 829,290,171 | | | $ | 984,109,292 | |
| | | | | | | | |
NET ASSETS CONSIST OF: | | | | | | | | |
Paid-in capital | | $ | 748,215,241 | | | $ | 756,053,456 | |
Accumulated net investment (loss)/Undistributed net investment income | | | (4,261,711 | ) | | | 4,639,670 | |
Accumulated net realized loss on investments | | | (12,587,573 | ) | | | (7,018,863 | ) |
Net unrealized appreciation on investments | | | 97,924,214 | | | | 230,435,029 | |
| | | | | | | | |
NET ASSETS | | $ | 829,290,171 | | | $ | 984,109,292 | |
| | | | | | | | |
| | |
COMPUTATION OF NET ASSET VALUE AND OFFERING PRICE: | | | | | | | | |
Institutional Class: | | | | | | | | |
Net assets | | $ | 599,468,619 | | | $ | 572,776,302 | |
| | | | | | | | |
Shares of beneficial interest | | | 31,273,924 | | | | 19,653,624 | |
| | | | | | | | |
Net asset value, offering and redemption price per share | | $ | 19.17 | | | $ | 29.14 | |
| | | | | | | | |
Retail Class: | | | | | | | | |
Net assets | | $ | 229,821,552 | | | $ | 343,480,452 | |
| | | | | | | | |
Shares of beneficial interest | | | 12,480,596 | | | | 11,911,680 | |
| | | | | | | | |
Net asset value, offering and redemption price per share | | $ | 18.41 | | | $ | 28.84 | |
| | | | | | | | |
Admin Class: | | | | | | | | |
Net assets | | $ | — | | | $ | 67,852,538 | |
| | | | | | | | |
Shares of beneficial interest | | | — | | | | 2,404,344 | |
| | | | | | | | |
Net asset value, offering and redemption price per share | | $ | — | | | $ | 28.22 | |
| | | | | | | | |
See accompanying notes to financial statements.
| 28
Statements of Operations
For the Year Ended September 30, 2012
| | | | | | | | |
| | | Small Cap
Growth Fund | | | Small Cap
Value Fund | |
INVESTMENT INCOME | | | | | | | | |
Dividends | | $ | 885,578 | | | $ | 16,167,925 | |
Interest | | | 616 | | | | 333 | |
Less net foreign taxes withheld | | | (8,759 | ) | | | — | |
| | | | | | | | |
| | | 877,435 | | | | 16,168,258 | |
| | | | | | | | |
Expenses | | | | | | | | |
Management fees (Note 5) | | | 4,191,200 | | | | 7,351,125 | |
Service and distribution fees (Note 5) | | | 465,283 | | | | 1,270,059 | |
Administrative fees (Note 5) | | | 253,968 | | | | 446,654 | |
Trustees’ fees and expenses (Note 5) | | | 31,364 | | | | 43,982 | |
Transfer agent fees and expenses (Notes 5 and 6) | | | 721,584 | | | | 1,026,268 | |
Audit and tax services fees | | | 37,282 | | | | 42,503 | |
Custodian fees and expenses | | | 40,327 | | | | 36,769 | |
Legal fees | | | 8,003 | | | | 14,068 | |
Registration fees | | | 122,993 | | | | 81,647 | |
Shareholder reporting expenses | | | 43,334 | | | | 73,248 | |
Miscellaneous expenses | | | 14,953 | | | | 29,632 | |
| | | | | | | | |
Total expenses | | | 5,930,291 | | | | 10,415,955 | |
Fee/expense recovery (Note 5) | | | — | | | | 5,398 | |
Less waiver and/or expense reimbursement (Note 5) | | | (60,902 | ) | | | (329,939 | ) |
| | | | | | | | |
Net expenses | | | 5,869,389 | | | | 10,091,414 | |
| | | | | | | | |
Net investment income (loss) | | | (4,991,954 | ) | | | 6,076,844 | |
| | | | | | | | |
| | |
NET REALIZED AND UNREALIZED GAIN ON INVESTMENTS | | | | | | | | |
Net realized gain on: | | | | | | | | |
Investments | | | 14,608,048 | | | | 49,521,017 | |
Net change in unrealized appreciation (depreciation) on: | | | | | | | | |
Investments | | | 100,644,997 | | | | 195,787,207 | |
| | | | | | | | |
Net realized and unrealized gain on investments | | | 115,253,045 | | | | 245,308,224 | |
| | | | | | | | |
| | |
NET INCREASE IN NET ASSETS RESULTING FROM OPERATIONS | | $ | 110,261,091 | | | $ | 251,385,068 | |
| | | | | | | | |
See accompanying notes to financial statements.
29 |
Statements of Changes in Net Assets
| | | | | | | | | | | | | | | | |
| | | Small Cap Growth Fund | | | Small Cap Value Fund | |
| | | Year Ended
September 30,
2012 | | | Year Ended
September 30,
2011 | | | Year Ended
September 30,
2012 | | | Year Ended
September 30,
2011 | |
FROM OPERATIONS: | | | | | | | | | | | | | | | | |
Net investment income (loss) | | $ | (4,991,954 | ) | | $ | (2,094,856 | ) | | $ | 6,076,844 | | | $ | 1,910,022 | |
Net realized gain on investments | | | 14,608,048 | | | | 24,546,166 | | | | 49,521,017 | | | | 92,685,709 | |
Net change in unrealized appreciation (depreciation) on investments | | | 100,644,997 | | | | (32,206,864 | ) | | | 195,787,207 | | | | (102,463,891 | ) |
| | | | | | | | | | | | | | | | |
Net increase (decrease) in net assets resulting from operations | | | 110,261,091 | | | | (9,755,554 | ) | | | 251,385,068 | | | | (7,868,160 | ) |
| | | | | | | | | | | | | | | | |
FROM DISTRIBUTIONS TO SHAREHOLDERS: | | | | | | | | | | | | | | | | |
Net investment income | | | | | | | | | | | | | | | | |
Institutional Class | | | — | | | | — | | | | (1,033,252 | ) | | | (3,276,433 | ) |
Retail Class | | | — | | | | — | | | | — | | | | (1,768,636 | ) |
Admin Class | | | — | | | | — | | | | — | | | | (178,569 | ) |
| | | | | | | | | | | | | | | | |
Total distributions | | | — | | | | — | | | | (1,033,252 | ) | | | (5,223,638 | ) |
| | | | | | | | | | | | | | | | |
NET INCREASE (DECREASE) IN NET ASSETS FROM CAPITAL SHARE TRANSACTIONS (NOTE 9) | | | 451,606,631 | | | | 149,332,650 | | | | (111,263,616 | ) | | | (54,117,495 | ) |
| | | | | | | | | | | | | | | | |
Net increase (decrease) in net assets | | | 561,867,722 | | | | 139,577,096 | | | | 139,088,200 | | | | (67,209,293 | ) |
NET ASSETS | | | | | | | | | | | | | | | | |
Beginning of the year | | | 267,422,449 | | | | 127,845,353 | | | | 845,021,092 | | | | 912,230,385 | |
| | | | | | | | | | | | | | | | |
End of the year | | $ | 829,290,171 | | | $ | 267,422,449 | | | $ | 984,109,292 | | | $ | 845,021,092 | |
| | | | | | | | | | | | | | | | |
UNDISTRIBUTED (DISTRIBUTIONS IN EXCESS OF) NET INVESTMENT INCOME/ACCUMULATED NET INVESTMENT (LOSS) | | $ | (4,261,711 | ) | | $ | (69,983 | ) | | $ | 4,639,670 | | | $ | (141,018 | ) |
| | | | | | | | | | | | | | | | |
See accompanying notes to financial statements.
| 30
Financial Highlights
For a share outstanding throughout each period.
| | | | | | | | | | | | | | | | | | | | | | | | | | | | | | |
| | | | | | Income (Loss) from
Investment Operations: | | | | | Less Distributions: | |
| | | Net asset
value,
beginning
of the
period | | | Net
investment
loss (a) | | | Net
realized
and
unrealized
gain (loss) | | | Total
from
investment
operations | | | | | Dividends
from net
investment
income | | | Distributions
from net
realized
capital
gains | | | Total
distributions | |
SMALL CAP GROWTH FUND | | | | | | | | | | | | | | | | | | | | | | | | | | | | | | |
| | | | | | | |
| Institutional Class | | | | | | | | | | | | | | | | | | | | | | | | | | | |
9/30/2012 | | $ | 15.06 | | | $ | (0.14 | ) | | $ | 4.25 | | | $ | 4.11 | | | | | $ | — | | | $ | — | | | $ | — | |
9/30/2011 | | | 14.03 | | | | (0.13 | ) | | | 1.16 | (g) | | | 1.03 | | | | | | — | | | | — | | | | — | |
9/30/2010 | | | 11.58 | | | | (0.11 | )(i) | | | 2.56 | | | | 2.45 | | | | | | — | | | | — | | | | — | |
9/30/2009 | | | 13.07 | | | | (0.07 | ) | | | (1.42 | ) | | | (1.49 | ) | | | | | — | | | | — | | | | — | |
9/30/2008 | | | 15.87 | | | | (0.07 | ) | | | (2.73 | ) | | | (2.80 | ) | | | | | — | | | | — | | | | — | |
| | | | | | | | |
| Retail Class | | | | | | | | | | | | | | | | | | | | | | | | | | | | | | |
9/30/2012 | | | 14.52 | | | | (0.19 | ) | | | 4.08 | | | | 3.89 | | | | | | — | | | | — | | | | — | |
9/30/2011 | | | 13.55 | | | | (0.18 | ) | | | 1.15 | (g) | | | 0.97 | | | | | | — | | | | — | | | | — | |
9/30/2010 | | | 11.21 | | | | (0.13 | )(i) | | | 2.47 | | | | 2.34 | | | | | | — | | | | — | | | | — | |
9/30/2009 | | | 12.69 | | | | (0.09 | ) | | | (1.39 | ) | | | (1.48 | ) | | | | | — | | | | — | | | | — | |
9/30/2008 | | | 15.45 | | | | (0.10 | ) | | | (2.66 | ) | | | (2.76 | ) | | | | | — | | | | — | | | | — | |
| (a) | Per share net investment loss has been calculated using the average shares outstanding during the period. | |
| (b) | Amount rounds to less than $0.01 per share, if applicable. | |
| (c) | Effective June 1, 2009, redemption fees were eliminated. | |
| (d) | Had certain expenses not been waived/reimbursed during the period, if applicable, total returns would have been lower. Periods less than one year, if applicable, are not annualized. | |
| (e) | The investment adviser and/or administrator agreed to waive its fees and/or reimburse a portion of the Fund’s expenses during the period. Without this waiver/reimbursement, if applicable, expenses would have been higher. | |
| (f) | Computed on an annualized basis for periods less than one year, if applicable. | |
| (g) | The amount shown for a share outstanding does not correspond with the aggregate realized and unrealized gain (loss) on investments for the period due to the timing of sales and redemptions of fund shares in relation to fluctuating market values of investments of the Fund. | |
| (h) | Includes fee/expense recovery of 0.03%. | |
| (i) | Includes a non-recurring dividend. Without this dividend, net investment loss per share would have been $(0.12) and $(0.14) for Institutional Class and Retail Class, respectively, and the ratio of net investment loss to average net assets would have been (0.92)% and (1.17)% for Institutional Class and Retail Class, respectively. | |
See accompanying notes to financial statements.
31 |
| | | | | | | | | | | | | | | | | | | | | | | | | | | | | | |
| | | | | | | | | | | | |
Ratios to Average Net Assets: | | | | |
Redemption
fees (b)(c) | | | Net asset
value,
end of
the
period | | | Total
return
(%) (d) | | | Net assets,
end of
the period
(000’s) | | | Net
expenses
(%) (e)(f) | | | Gross
expenses (%) (f) | | | Net
investment
loss
(%) (f) | | | Portfolio
turnover
rate (%) | |
| | | | | | | | | | | | | | | | | | | | | | | | | | | | | | |
| | | | | | | |
| | | | | | | | | | | | | | | | | | | | | | | | | | | | | | |
| $ | — | | | $ | 19.17 | | | | 27.29 | | | $ | 599,469 | | | | 0.95 | | | | 0.95 | | | | (0.79 | ) | | | 77 | |
| | — | | | | 15.06 | | | | 7.34 | | | | 154,313 | | | | 0.98 | (h) | | | 0.98 | (h) | | | (0.78 | ) | | | 76 | |
| | — | | | | 14.03 | | | | 21.16 | | | | 52,501 | | | | 1.00 | | | | 1.06 | | | | (0.85 | )(i) | | | 69 | |
| | — | | | | 11.58 | | | | (11.40 | ) | | | 45,557 | | | | 1.00 | | | | 1.01 | | | | (0.68 | ) | | | 107 | |
| | 0.00 | | | | 13.07 | | | | (17.64 | ) | | | 44,540 | | | | 1.00 | | | | 1.01 | | | | (0.47 | ) | | | 92 | |
| | | | | | | |
| | | | | | | | | | | | | | | | | | | | | | | | | | | | | | |
| | — | | | | 18.41 | | | | 26.79 | | | | 229,822 | | | | 1.25 | | | | 1.28 | | | | (1.09 | ) | | | 77 | |
| | — | | | | 14.52 | | | | 7.16 | | | | 113,110 | | | | 1.25 | | | | 1.27 | | | | (1.07 | ) | | | 76 | |
| | — | | | | 13.55 | | | | 20.87 | | | | 75,344 | | | | 1.25 | | | | 1.39 | | | | (1.10 | )(i) | | | 69 | |
| | — | | | | 11.21 | | | | (11.66 | ) | | | 75,478 | | | | 1.25 | | | | 1.43 | | | | (0.93 | ) | | | 107 | |
| | 0.00 | | | | 12.69 | | | | (17.86 | ) | | | 79,897 | | | | 1.25 | | | | 1.42 | | | | (0.70 | ) | | | 92 | |
See accompanying notes to financial statements.
| 32
Financial Highlights – continued
For a share outstanding throughout each period.
| | | | | | | | | | | | | | | | | | | | | | | | | | | | | | |
| | | | | | Income (Loss) from
Investment Operations: | | | | | Less Distributions: | |
| | | Net asset
value,
beginning
of the
period | | | Net
investment
income
(loss) (a)(b) | | | Net
realized
and
unrealized
gain (loss) | | | Total
from
investment
operations | | | | | Dividends
from net
investment
income (b) | | | Distributions
from net
realized
capital
gains | | | Total
distributions | |
SMALL CAP VALUE FUND | | | | | | | | | | | | | | | | | | | | | | | | | | | | | | |
| | | | | | | |
| Institutional Class | | | | | | | | | | | | | | | | | | | | | | | | | | | |
9/30/2012 | | $ | 22.36 | | | $ | 0.21 | | | $ | 6.62 | | | $ | 6.83 | | | | | $ | (0.05 | ) | | $ | — | | | $ | (0.05 | ) |
9/30/2011 | | | 22.93 | | | | 0.09 | (h) | | | (0.50 | ) | | | (0.41 | ) | | | | | (0.16 | ) | | | — | | | | (0.16 | ) |
9/30/2010 | | | 20.66 | | | | 0.11 | | | | 2.23 | | | | 2.34 | | | | | | (0.07 | ) | | | — | | | | (0.07 | ) |
9/30/2009 | | | 22.01 | | | | 0.09 | | | | (1.32 | ) | | | (1.23 | ) | | | | | (0.11 | ) | | | (0.01 | ) | | | (0.12 | ) |
9/30/2008 | | | 28.77 | | | | 0.11 | (i) | | | (4.03 | ) | | | (3.92 | ) | | | | | (0.06 | ) | | | (2.78 | ) | | | (2.84 | ) |
| | | | | | | |
| Retail Class | | | | | | | | | | | | | | | | | | | | | | | | | | | |
9/30/2012 | | | 22.14 | | | | 0.13 | | | | 6.57 | | | | 6.70 | | | | | | — | | | | — | | | | — | |
9/30/2011 | | | 22.71 | | | | 0.02 | (h) | | | (0.48 | ) | | | (0.46 | ) | | | | | (0.11 | ) | | | — | | | | (0.11 | ) |
9/30/2010 | | | 20.47 | | | | 0.06 | | | | 2.21 | | | | 2.27 | | | | | | (0.03 | ) | | | — | | | | (0.03 | ) |
9/30/2009 | | | 21.79 | | | | 0.04 | | | | (1.30 | ) | | | (1.26 | ) | | | | | (0.05 | ) | | | (0.01 | ) | | | (0.06 | ) |
9/30/2008 | | | 28.52 | | | | 0.05 | (i) | | | (4.00 | ) | | | (3.95 | ) | | | | | — | | | | (2.78 | ) | | | (2.78 | ) |
| | | | | | | |
| Admin Class | | | | | | | | | | | | | | | | | | | | | | | | | | | |
9/30/2012 | | | 21.72 | | | | 0.06 | | | | 6.44 | | | | 6.50 | | | | | | — | | | | — | | | | — | |
9/30/2011 | | | 22.30 | | | | (0.04 | )(h) | | | (0.49 | ) | | | (0.53 | ) | | | | | (0.05 | ) | | | — | | | | (0.05 | ) |
9/30/2010 | | | 20.11 | | | | 0.00 | | | | 2.19 | | | | 2.19 | | | | | | — | | | | — | | | | — | |
9/30/2009 | | | 21.40 | | | | 0.00 | | | | (1.28 | ) | | | (1.28 | ) | | | | | (0.00 | ) | | | (0.01 | ) | | | (0.01 | ) |
9/30/2008 | | | 28.13 | | | | (0.01 | )(i) | | | (3.94 | ) | | | (3.95 | ) | | | | | — | | | | (2.78 | ) | | | (2.78 | ) |
| (a) | Per share net investment income (loss) has been calculated using the average shares outstanding during the period. | |
| (b) | Amount rounds to less than $0.01 per share, if applicable. | |
| (c) | Effective June 1, 2009, redemption fees were eliminated. | |
| (d) | Had certain expenses not been waived/reimbursed during the period, if applicable, total returns would have been lower. Periods less than one year, if applicable, are not annualized. | |
| (e) | The investment adviser and/or administrator agreed to waive its fees and/or reimburse a portion of the Fund’s expenses during the period. Without this waiver/reimbursement, if applicable, expenses would have been higher. | |
| (f) | Computed on an annualized basis for periods less than one year, if applicable. | |
| (g) | Includes fee/expense recovery of less than 0.01%. | |
| (h) | Includes a non-recurring dividend. Without this dividend, net investment income (loss) per share would have been $0.07, $0.01 and $(0.06) for Institutional Class, Retail Class and Admin Class, respectively, total return would have been (1.93)%, (2.16)% and (2.44)% for Institutional Class, Retail Class and Admin Class, respectively and the ratio of net investment income (loss) to average net assets would have been 0.28%, 0.03% and (0.22)% for Institutional Class, Retail Class and Admin Class, respectively. | |
| (i) | Includes a non-recurring dividend of $0.02 per share. | |
See accompanying notes to financial statements.
33 |
| | | | | | | | | | | | | | | | | | | | | | | | | | | | | | |
| | | | | | | | | | | | |
Ratios to Average Net Assets: | | | | |
Redemption
fees (b)(c) | | | Net asset
value,
end of
the
period | | | Total
return
(%) (d) | | | Net assets,
end of
the period
(000’s) | | | Net
expenses
(%) (e)(f) | | | Gross
expenses (%) (f) | | | Net
investment
income (loss)
(%) (f) | | | Portfolio
turnover
rate (%) | |
| | | | | | | | | | | | | | | | | | | | | | | | | | | | | | |
| | | | | | | |
| | | | | | | | | | | | | | | | | | | | | | | | | | | | | | |
| $ | — | | | $ | 29.14 | | | | 30.59 | | | $ | 572,776 | | | | 0.90 | (g) | | | 0.90 | (g) | | | 0.76 | | | | 19 | |
| | — | | | | 22.36 | | | | (1.88 | )(h) | | | 431,761 | | | | 0.90 | | | | 0.93 | | | | 0.33 | (h) | | | 42 | |
| | — | | | | 22.93 | | | | 11.39 | | | | 454,853 | | | | 0.90 | | | | 0.94 | | | | 0.50 | | | | 52 | |
| | 0.00 | | | | 20.66 | | | | (5.42 | ) | | | 506,324 | | | | 0.90 | | | | 0.94 | | | | 0.52 | | | | 55 | |
| | 0.00 | | | | 22.01 | | | | (15.02 | ) | | | 553,268 | | | | 0.89 | | | | 0.89 | | | | 0.47 | | | | 61 | |
| | | | | | | |
| | | | | | | | | | | | | | | | | | | | | | | | | | | | | | |
| | — | | | | 28.84 | | | | 30.26 | | | | 343,480 | | | | 1.15 | | | | 1.22 | | | | 0.49 | | | | 19 | |
| | — | | | | 22.14 | | | | (2.12 | )(h) | | | 347,759 | | | | 1.15 | | | | 1.22 | | | | 0.08 | (h) | | | 42 | |
| | — | | | | 22.71 | | | | 11.10 | | | | 383,934 | | | | 1.15 | | | | 1.24 | | | | 0.26 | | | | 52 | |
| | 0.00 | | | | 20.47 | | | | (5.66 | ) | | | 387,383 | | | | 1.15 | | | | 1.31 | | | | 0.26 | | | | 55 | |
| | 0.00 | | | | 21.79 | | | | (15.21 | ) | | | 464,525 | | | | 1.15 | | | | 1.27 | | | | 0.21 | | | | 61 | |
| | | | | | | |
| | | | | | | | | | | | | | | | | | | | | | | | | | | | | | |
| | — | | | | 28.22 | | | | 29.93 | | | | 67,853 | | | | 1.40 | | | | 1.52 | | | | 0.24 | | | | 19 | |
| | — | | | | 21.72 | | | | (2.40 | )(h) | | | 65,500 | | | | 1.40 | | | | 1.52 | | | | (0.17 | )(h) | | | 42 | |
| | — | | | | 22.30 | | | | 10.89 | | | | 73,443 | | | | 1.40 | | | | 1.56 | | | | 0.02 | | | | 52 | |
| | 0.00 | | | | 20.11 | | | | (5.93 | ) | | | 74,195 | | | | 1.40 | | | | 1.77 | | | | 0.02 | | | | 55 | |
| | 0.00 | | | | 21.40 | | | | (15.44 | ) | | | 77,855 | | | | 1.40 | | | | 1.68 | | | | (0.04 | ) | | | 61 | |
See accompanying notes to financial statements.
| 34
Notes to Financial Statements
September 30, 2012
1. Organization. Loomis Sayles Funds I and Loomis Sayles Funds II (the “Trusts” and each a “Trust”) are each organized as a Massachusetts business trust. Each Trust is registered under the Investment Company Act of 1940, as amended (the “1940 Act”), as an open-end management investment company. Each Declaration of Trust permits the Board of Trustees to authorize the issuance of an unlimited number of shares of the Trust in multiple series. The financial statements for certain funds of the Trusts are presented in separate reports. The following funds (individually, a “Fund” and collectively, the “Funds”) are included in this report:
Loomis Sayles Funds I:
Loomis Sayles Small Cap Value Fund (the “Small Cap Value Fund”)
Loomis Sayles Funds II:
Loomis Sayles Small Cap Growth Fund (the “Small Cap Growth Fund”)
Each Fund is a diversified investment company.
Small Cap Growth Fund and Small Cap Value Fund were closed to new investors effective September 14, 2012 and September 15, 2008, respectively. The Funds continue to offer Institutional Class and Retail Class shares to existing investors and Small Cap Value Fund continues to offer Admin Class shares to existing investors.
Most expenses of the Trusts can be directly attributed to a fund. Expenses which cannot be directly attributed to a fund are generally apportioned based on the relative net assets of each of the funds in the Trusts. Expenses of a Fund are borne pro rata by the holders of each class of shares, except that each class bears expenses unique to that class (including the Rule 12b-1 service and distribution fees and transfer agent fees). In addition, each class votes as a class only with respect to its own Rule 12b-1 Plan. Shares of each class would receive their pro rata share of the net assets of a Fund if the Fund were liquidated. The Trustees approve separate distributions from net investment income on each class of shares.
2. Significant Accounting Policies. The following is a summary of significant accounting policies consistently followed by each Fund in the preparation of its financial statements. The Funds’ financial statements are prepared in accordance with accounting principles generally accepted in the United States of America which require the use of management estimates that affect the reported amounts and disclosures in the financial statements. Actual results could differ from those estimates. Management has evaluated the events and transactions subsequent to year-end through the date the financial statements were issued and has determined that there were no material events that would require disclosure in the Funds’ financial statements.
a. Valuation. Equity securities, including shares of closed-end investment companies and exchange-traded funds, for which market quotations are readily available are valued at market value, as reported by independent pricing services recommended by the investment adviser and approved by the Board of Trustees. Such independent pricing services
35 |
Notes to Financial Statements – continued
September 30, 2012
generally use the security’s last sale price on the exchange or market where the security is primarily traded or, if there is no reported sale during the day, the closing bid price. Securities traded on the NASDAQ Global Select Market, NASDAQ Global Market and NASDAQ Capital Market are valued at the NASDAQ Official Closing Price (“NOCP”), or if lacking a NOCP, at the most recent bid quotation on the applicable NASDAQ Market. Debt securities (other than short-term obligations purchased with an original or remaining maturity of sixty days or less) and unlisted equity securities are generally valued on the basis of evaluated bids furnished to the Funds by an independent pricing service recommended by the investment adviser and approved by the Board of Trustees, which service determines valuations for normal, institutional-size trading units of such securities using market information, transactions for comparable securities and various relationships between securities which are generally recognized by institutional traders. Broker-dealer bid quotations may also be used to value debt and equity securities where an independent pricing service is unable to price a security or where an independent pricing service does not provide a reliable price for the security. Investments in other open-end investment companies are valued at their net asset value each day. Short-term obligations purchased with an original or remaining maturity of sixty days or less are valued at amortized cost, which approximates market value. Securities for which market quotations are not readily available are valued at fair value as determined in good faith by the Funds’ investment adviser using consistently applied procedures under the general supervision of the Board of Trustees.
The Funds may hold securities traded in foreign markets. Foreign securities are valued at the closing market price in the foreign market. However, if events occurring after the close of the foreign market (but before the close of regular trading on the New York Stock Exchange) are believed to materially affect the value of those securities, such securities are fair valued pursuant to procedures approved by the Board of Trustees. When fair valuing securities, the Funds may, among other things, use modeling tools or other processes that may take into account factors such as securities market activity and/or significant events that occur after the close of the foreign market and before the Funds calculate their net asset values.
b. Investment Transactions and Related Investment Income. Investment transactions are accounted for on a trade date plus one basis for daily net asset value calculation. However, for financial reporting purposes, investment transactions are reported on trade date. Dividend income is recorded on ex-dividend date, or in the case of certain foreign securities, as soon as a Fund is notified, and interest income is recorded on an accrual basis. Interest income is increased by the accretion of discount and decreased by the amortization of premium. Distributions received from investments in securities that represent a return of capital or capital gain are recorded as a reduction of cost of the investments or as a realized gain, respectively. The calendar year-end amounts of ordinary income, capital gains, and return of capital included in distributions received from the Funds’ investments in real estate investment trusts (“REITs”) are reported to the Funds after the end of the fiscal year; accordingly, the Funds estimate these amounts for accounting purposes until the characterization of REIT distributions is reported to the
| 36
Notes to Financial Statements – continued
September 30, 2012
Funds after the end of the fiscal year. Estimates are based on the most recent REIT distribution information available. In determining net gain or loss on securities sold, the cost of securities has been determined on an identified cost basis. Investment income, non-class specific expenses and realized and unrealized gains and losses are allocated on a pro rata basis to each class based on the relative net assets of each class to the total net assets of the Fund.
c. Foreign Currency Translation. The books and records of the Funds are maintained in U.S. dollars. The values of securities, currencies and other assets and liabilities denominated in currencies other than U.S. dollars are translated into U.S. dollars based upon foreign exchange rates prevailing at the end of the period. Purchases and sales of investment securities, income and expenses are translated on the respective dates of such transactions.
Since the values of investment securities are presented at the foreign exchange rates prevailing at the end of the period, it is not practical to isolate that portion of the results of operations arising from changes in exchange rates from fluctuations which arise due to changes in market prices of investment securities. Such changes are included with the net realized and unrealized gain or loss on investments.
Net realized foreign exchange gains or losses arise from sales of foreign currency, currency gains or losses realized between the trade and settlement dates on securities transactions and the difference between the amounts of dividends, interest and foreign withholding taxes recorded on the Funds’ books and the U.S. dollar equivalent of the amounts actually received or paid. Net unrealized foreign exchange gains and losses arise from changes in the value of assets and liabilities, other than investment securities, at the end of the fiscal period, resulting from changes in exchange rates.
Each Fund may use foreign currency exchange contracts to facilitate transactions in foreign-denominated investments. Losses may arise from changes in the value of the foreign currency or if the counterparties do not perform under the contracts’ terms.
d. Federal and Foreign Income Taxes. Each Trust treats each Fund as a separate entity for federal income tax purposes. Each Fund intends to meet the requirements of the Internal Revenue Code of 1986, as amended, applicable to regulated investment companies, and to distribute to its shareholders substantially all of its net investment income and any net realized capital gains at least annually. Management has performed an analysis of each Fund’s tax positions for the open tax years as of September 30, 2012 and has concluded that no provisions for income tax are required. The Funds’ federal tax returns for the prior three fiscal years remain subject to examination by the Internal Revenue Service. Management is not aware of any events that are reasonably possible to occur in the next twelve months that would result in the amounts of any unrecognized tax benefits significantly increasing or decreasing for the Funds. However, management’s conclusions regarding tax positions taken may be subject to review and adjustment at a later date based on factors including, but not limited to, new tax laws and accounting regulations and interpretations thereof.
37 |
Notes to Financial Statements – continued
September 30, 2012
The Funds may be subject to foreign withholding taxes on investment income and taxes on capital gains on investments that are accrued and paid based upon the Funds’ understanding of the tax rules and regulations that exist in the countries in which the Funds invest. Foreign withholding taxes on dividend and interest income are reflected on the Statements of Operations as a reduction of investment income, net of amounts eligible to be reclaimed. Dividends and interest receivable on the Statements of Assets and Liabilities are net of foreign withholding taxes. Foreign withholding taxes eligible to be reclaimed are reflected on the Statements of Assets and Liabilities as tax reclaims receivable. Capital gains taxes paid are included in net realized gain (loss) on investments in the Statements of Operations. Accrued but unpaid capital gains taxes are reflected as foreign taxes payable on the Statements of Assets and Liabilities, if applicable, and reduce unrealized gains on investments. In the event that realized gains on investments are subsequently offset by realized losses, taxes paid on realized gains may be returned to the Funds. Such amounts, if applicable, are reflected as foreign tax rebates receivable on the Statements of Assets and Liabilities and are recorded as a realized gain when received.
e. Dividends and Distributions to Shareholders. Dividends and distributions are recorded on ex-dividend date. The timing and characterization of certain income and capital gain distributions are determined annually in accordance with federal tax regulations, which may differ from accounting principles generally accepted in the United States of America. Permanent differences are primarily due to differing treatments for book and tax purposes of items such as net operating losses and REIT basis adjustments. Permanent book and tax basis differences relating to shareholder distributions will result in reclassifications to capital accounts. Temporary differences between book and tax distributable earnings are primarily due to deferred Trustees’ fees and wash sales. Distributions from net investment income and short-term capital gains are considered to be distributed from ordinary income for tax purposes.
The tax characterization of distributions is determined on an annual basis. The tax character of distributions paid to shareholders during the years ended September 30, 2012 and 2011 was as follows:
| | | | | | | | | | | | | | | | | | | | | | | | |
| | | 2012 Distributions Paid From: | | | 2011 Distributions Paid From: | |
Fund | | Ordinary
Income | | | Long-Term
Capital Gains | | | Total | | | Ordinary
Income | | | Long-Term
Capital Gains | | | Total | |
Small Cap Growth Fund | | $ | — | | | $ | — | | | $ | — | | | $ | — | | | $ | — | | | $ | — | |
Small Cap Value Fund | | | 1,033,252 | | | | — | | | | 1,033,252 | | | | 5,223,638 | | | | — | | | | 5,223,638 | |
| 38
Notes to Financial Statements – continued
September 30, 2012
As of September 30, 2012, the components of distributable earnings on a tax basis were as follows:
| | | | | | | | |
| | | Small Cap
Growth Fund | | | Small Cap
Value Fund | |
Undistributed ordinary income | | $ | — | | | $ | 4,796,613 | |
Undistributed long-term capital gains | | | — | | | | — | |
| | | | | | | | |
Total undistributed earnings | | | — | | | | 4,796,613 | |
| | | | | | | | |
Late-year ordinary and post-October capital loss deferrals* | | | (16,260,177 | ) | | | (5,815,935 | ) |
Unrealized appreciation | | | 97,419,107 | | | | 229,232,101 | |
| | | | | | | | |
Total accumulated earnings | | $ | 81,158,930 | | | $ | 228,212,779 | |
| | | | | | | | |
Capital loss carryforward utilized in the current year | | $ | 26,874,285 | | | $ | 55,320,015 | |
| | | | | | | | |
* Under current tax law, capital losses, foreign currency losses, and losses on passive foreign investment companies and contingent payment debt instruments after October 31 or December 31, as applicable, may be deferred and treated as occurring on the first day of the following taxable year.
On December 22, 2010, the Regulated Investment Company Modernization Act of 2010 (the “Act”) was enacted. Under the Act, for taxable years beginning after December 22, 2010, capital losses may be carried forward indefinitely. Rules in effect previously limited the carryforward period to eight years. Additionally, capital losses realized in taxable years beginning after the effective date of the Act are carried over in the character (short-term or long-term) realized. Rules in effect previously treated all capital loss carryforwards as short-term.
f. Repurchase Agreements. It is each Fund’s policy that the market value of the collateral for repurchase agreements be at least equal to 102% of the repurchase price, including interest. Certain repurchase agreements are tri-party arrangements whereby the collateral is held in a segregated account for the benefit of the Fund and on behalf of the counterparty. Repurchase agreements could involve certain risks in the event of default or insolvency of the counterparty, including possible delays or restrictions upon a Fund’s ability to dispose of the underlying securities.
g. Securities Lending. The Funds have entered into an agreement with State Street Bank and Trust Company (“State Street Bank”), as agent of the Funds, to lend securities to certain designated borrowers. The loans are collateralized with cash or securities in an amount equal to at least 105% or 102% of the market value (including accrued interest) of the loaned international or domestic securities, respectively, when the loan is initiated. Thereafter, the value of the collateral must remain at least 102% of the market value (including accrued interest) of loaned securities for U.S. equities and U.S. corporate debt; at least 105% of the market value (including accrued interest) of loaned securities for non-U.S. equities; and at least 100% of the market value (including accrued interest) of loaned securities for U.S. Government securities, sovereign debt issued by non-U.S. Governments and non-U.S. corporate debt. In the event that the market value of the collateral falls below the required percentages described above, the borrower will deliver
39 |
Notes to Financial Statements – continued
September 30, 2012
additional collateral on the next business day. As with other extensions of credit, the Funds may bear the risk of loss with respect to the investment of the collateral. The Funds invest cash collateral in short-term investments, a portion of the income from which is remitted to the borrowers and the remainder allocated between the Funds and State Street Bank as lending agent.
For the year ended September 30, 2012 , neither Fund had loaned securities under this agreement.
h. Indemnifications. Under the Trusts’ organizational documents, their officers and Trustees are indemnified against certain liabilities arising out of the performance of their duties to the Funds. Additionally, in the normal course of business, the Funds enter into contracts with service providers that contain general indemnification clauses. The Funds’ maximum exposure under these arrangements is unknown as this would involve future claims that may be made against the Funds that have not yet occurred. However, based on experience, the Funds expect the risk of loss to be remote.
3. Fair Value Measurements. In accordance with accounting standards related to fair value measurements and disclosures, the Funds have categorized the inputs utilized in determining the value of each Fund’s assets or liabilities. These inputs are summarized in the three broad levels listed below:
| | • | | Level 1—quoted prices in active markets for identical assets or liabilities; |
| | • | | Level 2—prices determined using other significant inputs that are observable either directly, or indirectly through corroboration with observable market data (which could include quoted prices for similar assets or liabilities, interest rates, credit risk, etc.); and |
| | • | | Level 3—prices determined using significant unobservable inputs when quoted prices or observable inputs are unavailable such as when there is little or no market activity for an asset or liability (unobservable inputs reflect each Fund’s own assumptions in determining the fair value of assets or liabilities and would be based on the best information available). |
The inputs or methodology used for valuing securities are not necessarily an indication of the risk associated with investing in those securities.
| 40
Notes to Financial Statements – continued
September 30, 2012
The following is a summary of the inputs used to value the Funds’ investments as of September 30, 2012, at value:
Small Cap Growth Fund
Asset Valuation Inputs
| | | | | | | | | | | | | | | | |
Description | | Level 1 | | | Level 2 | | | Level 3 | | | Total | |
Common Stocks(a) | | $ | 800,419,701 | | | $ | — | | | $ | — | | | $ | 800,419,701 | |
Short-Term Investments | | | — | | | | 23,095,920 | | | | — | | | | 23,095,920 | |
| | | | | | | | | | | | | | | | |
Total | | $ | 800,419,701 | | | $ | 23,095,920 | | | $ | — | | | $ | 823,515,621 | |
| | | | | | | | | | | | | | | | |
(a) Details of the major categories of the Fund’s investments are reflected within the Portfolio of Investments.
For the year ended September 30, 2012, there were no transfers between Levels 1, 2 and 3.
Small Cap Value Fund
Asset Valuation Inputs
| | | | | | | | | | | | | | | | |
Description | | Level 1 | | | Level 2 | | | Level 3 | | | Total | |
Common Stocks(a) | | $ | 964,772,009 | | | $ | — | | | $ | — | | | $ | 964,772,009 | |
Closed End Investment Companies | | | 9,047,880 | | | | — | | | | — | | | | 9,047,880 | |
Warrants(b) | | | — | | | | — | | | | — | | | | — | |
Short-Term Investments | | | — | | | | 12,694,726 | | | | — | | | | 12,694,726 | |
| | | | | | | | | | | | | | | | |
Total | | $ | 973,819,889 | | | $ | 12,694,726 | | | $ | — | | | $ | 986,514,615 | |
| | | | | | | | | | | | | | | | |
(a) Details of the major categories of the Fund’s investments are reflected within the Portfolio of Investments.
(b) Fair valued at zero using level 2 inputs.
For the year ended September 30, 2012, there were no transfers between Levels 1, 2 and 3.
4. Purchases and Sales of Securities. For the year ended September 30, 2012, purchases and sales of securities (excluding short-term investments) were as follows:
| | | | | | | | |
Fund | | Purchases | | | Sales | |
Small Cap Growth Fund | | $ | 840,553,855 | | | $ | 411,310,539 | |
Small Cap Value Fund | | | 184,085,761 | | | | 279,488,146 | |
5. Management Fees and Other Transactions with Affiliates.
a. Management Fees. Loomis, Sayles & Company, L.P. (“Loomis Sayles”) serves as investment adviser to each Fund. Under the terms of the management agreements, each Fund pays a management fee at the following annual rates, calculated daily and payable monthly, based on each Fund’s average daily net assets:
| | | | |
Fund | | Percentage of
Average Daily Net Assets | |
Small Cap Growth Fund | | | 0.75% | |
Small Cap Value Fund | | | 0.75% | |
41 |
Notes to Financial Statements – continued
September 30, 2012
Loomis Sayles has given binding undertakings to the Funds to waive management fees and/or reimburse certain expenses to limit the Funds’ operating expenses, exclusive of acquired fund fees and expenses, brokerage expenses, interest expense, taxes and extraordinary expenses. These undertakings are in effect until January 31, 2013 and are reevaluated on an annual basis. Management fees payable, as reflected on the Statements of Assets and Liabilities, is net of waivers and/or expense reimbursements, if any, pursuant to these undertakings.
For the year ended September 30, 2012, the expense limits as a percentage of average daily net assets under the expense limitation agreements were as follows:
| | | | | | | | | | | | |
| | | Expense Limit as a Percentage of
Average Daily Net Assets | |
Fund | | Institutional Class | | | Retail Class | | | Admin Class | |
Small Cap Growth Fund | | | 1.00% | | | | 1.25% | | | | — | |
Small Cap Value Fund | | | 0.90% | | | | 1.15% | | | | 1.40% | |
Loomis Sayles shall be permitted to recover expenses it has borne under the expense limitation agreements (whether through waiver of its management fees or otherwise) on a class by class basis in later periods to the extent the expenses of a class fall below a class’ expense limits, provided, however, that a class is not obligated to pay such waived/reimbursed fees or expenses more than one year after the end of the fiscal year in which the fees or expenses were waived/reimbursed.
For the year ended September 30, 2012, the management fees for each Fund were as follows:
| | | | | | | | |
Fund | | Management
Fees | | | Percentage of
Average Daily Net Assets | |
Small Cap Growth Fund | | $ | 4,191,200 | | | | 0.75% | |
Small Cap Value Fund | | | 7,351,125 | | | | 0.75% | |
For the year ended September 30, 2012, class-specific expenses have been reimbursed as follows:
| | | | | | | | | | | | | | | | |
| | | Reimbursement1 | |
Fund | | Institutional
Class | | | Retail
Class | | | Admin
Class | | | Total | |
Small Cap Growth Fund | | $ | — | | | $ | 60,902 | | | $ | — | | | $ | 60,902 | |
Small Cap Value Fund | | | — | | | | 247,967 | | | | 81,972 | | | | 329,939 | |
1Expense reimbursements are subject to possible recovery until September 30, 2013.
For the year ended September 30, 2012, expense reimbursements related to the prior fiscal year were recovered as follows:
| | | | | | | | | | | | | | |
| | | Recovered Expenses | |
Fund | | Institutional
Class | | | Retail Class | | | Total | |
Small Cap Value Fund | | $ | 5,398 | | | $ | — | | | $ | 5,398 | |
| 42
Notes to Financial Statements – continued
September 30, 2012
Certain officers and employees of Loomis Sayles are also officers or Trustees of the Trusts. Loomis Sayles’ general partner is indirectly owned by Natixis Global Asset Management, L.P. (“Natixis US”), which is part of Natixis Global Asset Management, an international asset management group based in Paris, France.
b. Service and Distribution Fees. NGAM Distribution, L.P. (“NGAM Distribution”), which is a wholly-owned subsidiary of Natixis US, has entered into a distribution agreement with the Trusts. Pursuant to this agreement, NGAM Distribution serves as principal underwriter of the Funds of the Trusts.
Pursuant to Rule 12b-1 under the 1940 Act, Small Cap Growth Fund and Small Cap Value Fund have adopted a Distribution Plan relating to each Fund’s Retail Class shares (the “Retail Class Plans”) and Small Cap Value Fund has adopted a Distribution Plan relating to its Admin Class shares (the “Admin Class Plan”).
Under the Retail Class Plans, each Fund pays NGAM Distribution a monthly distribution fee at an annual rate not to exceed 0.25% of the average daily net assets attributable to the Funds’ Retail Class shares, as compensation for services provided by NGAM Distribution in connection with the marketing or sale of Retail Class shares or for payments made by NGAM Distribution to securities dealers or other financial intermediaries as commissions, asset-based sales charges or other compensation with respect to the sale of Retail Class shares, or for providing personal services to investors and/or maintenance of shareholder accounts.
Under the Admin Class Plan, Small Cap Value Fund pays NGAM Distribution a monthly distribution fee at an annual rate not to exceed 0.25% of the average daily net assets attributable to the Fund’s Admin Class shares, as compensation for services provided by NGAM Distribution in connection with the marketing or sale of Admin Class shares or for payments made by NGAM Distribution to securities dealers or other financial intermediaries as commissions, asset-based sales charges or other compensation with respect to the sale of Admin Class shares, or for providing personal services to investors and/or the maintenance of shareholder accounts.
In addition, the Admin Class shares of Small Cap Value Fund may pay NGAM Distribution an administrative service fee, at an annual rate not to exceed 0.25% of the average daily net assets attributable to Admin Class shares. These fees are subsequently paid to securities dealers or financial intermediaries for providing personal services and/or account maintenance for their customers who hold such shares.
For the year ended September 30, 2012, the service and distribution fees for each Fund were as follows:
| | | | | | | | | | | | |
| | | Service Fees | | | Distribution Fees | |
Fund | | Admin Class | | | Retail Class | | | Admin Class | |
Small Cap Growth Fund | | $ | — | | | $ | 465,283 | | | $ | — | |
Small Cap Value Fund | | | 178,127 | | | | 913,805 | | | | 178,127 | |
43 |
Notes to Financial Statements – continued
September 30, 2012
c. Administrative Fees. NGAM Advisors, L.P. (“NGAM Advisors”) provides certain administrative services for the Funds and contracts with State Street Bank to serve as sub-administrator. NGAM Advisors is a wholly-owned subsidiary of Natixis US. Pursuant to an agreement among Natixis Funds Trust I, Natixis Funds Trust II, Natixis Funds Trust IV, Gateway Trust (“Natixis Funds Trusts”), Loomis Sayles Funds I, Loomis Sayles Funds II (“Loomis Sayles Funds Trusts”), Hansberger International Series and NGAM Advisors, each Fund pays NGAM Advisors monthly its pro rata portion of fees equal to an annual rate of 0.0575% of the first $15 billion of the average daily net assets of the Natixis Funds Trusts, Loomis Sayles Funds Trusts and Hansberger International Series, 0.0500% of the next $15 billion, 0.0400% of the next $30 billion and 0.0350% of such assets in excess of $60 billion, subject to an annual aggregate minimum fee for the Natixis Funds Trusts, Loomis Sayles Funds Trusts and Hansberger International Series of $10 million, which is reevaluated on an annual basis.
For the year ended September 30, 2012, the administrative fees for each Fund were as follows:
| | | | |
Fund | | Administrative
Fees | |
Small Cap Growth Fund | | $ | 253,968 | |
Small Cap Value Fund | | | 446,654 | |
d. Sub-Transfer Agent Fees. NGAM distribution has entered into agreements, which include servicing agreements, with financial intermediaries that provide recordkeeping, processing, shareholder communications and other services to customers of the intermediaries that hold positions in the Funds and has agreed to compensate the intermediaries for providing those services. Intermediaries transact with the Funds primarily through the use of omnibus accounts on behalf of their customers who hold positions in the Funds. These services would have been provided by the Funds’ transfer agent and other service providers if the shareholders’ accounts were maintained directly at the Funds’ transfer agent. Accordingly, the Funds have agreed to reimburse NGAM Distribution for all or a portion of the servicing fees paid to these intermediaries. The reimbursement amounts (sub-transfer agent fees) paid to NGAM Distribution are subject to a current per-account equivalent fee limit approved by the Funds’ Board, which is based on fees for similar services paid to the Funds’ transfer agent and other service providers.
For the year ended September 30, 2012, the sub-transfer agent fees (which are reflected in transfer agent fees and expenses in the Statements of Operations) for each Fund were as follows:
| | | | | | | | | | | | |
| | | Sub-Transfer Agent Fees | |
Fund | | Institutional
Class | | | Retail Class | | | Admin
Class | |
Small Cap Growth Fund | | $ | 358,661 | | | $ | 185,330 | | | $ | — | |
Small Cap Value Fund | | | 352,238 | | | | 498,329 | | | | 130,622 | |
| 44
Notes to Financial Statements – continued
September 30, 2012
As of September 30, 2012, the Funds owe NGAM Distribution the following reimbursements for sub-transfer agent fees:
| | | | | | | | | | | | |
| | | Reimbursements of Sub-Transfer
Agent Fees | |
Fund | | Institutional
Class | | | Retail Class | | | Admin
Class | |
Small Cap Growth Fund | | $ | 5,725 | | | $ | 2,704 | | | $ | — | |
Small Cap Value Fund | | | 5,720 | | | | 5,886 | | | | 1,572 | |
e. Trustees Fees and Expenses. The Trusts do not pay any compensation directly to their officers or Trustees who are directors, officers or employees of NGAM Advisors, NGAM Distribution, Natixis US or their affiliates. Effective January 1, 2012, the Chairperson of the Board receives a retainer fee at the annual rate of $265,000. The Chairperson does not receive any meeting attendance fees for Board of Trustees meetings or committee meetings that she attends. Each Independent Trustee (other than the Chairperson) receives, in the aggregate, a retainer fee at the annual rate of $95,000. Each Independent Trustee also receives a meeting attendance fee of $10,000 for each meeting of the Board of Trustees that he or she attends in person and $5,000 for each meeting of the Board of Trustees that he or she attends telephonically. In addition, each committee chairman receives an additional retainer fee at an annual rate of $15,000. Each Contract Review and Governance Committee member is compensated $6,000 for each Committee meeting that he or she attends in person and $3,000 for each meeting that he or she attends telephonically. Each Audit Committee member is compensated $7,500 for each Committee meeting that he or she attends in person and $3,750 for each meeting that he or she attends telephonically. These fees are allocated among the funds in the Natixis Funds Trusts, Loomis Sayles Funds Trusts and Hansberger International Series based on a formula that takes into account, among other factors, the relative net assets of each fund. Trustees are reimbursed for travel expenses in connection with attendance at meetings.
Prior to January 1, 2012, the Chairperson of the Board received a retainer fee at the annual rate of $250,000. Each Independent Trustee (other than the Chairperson) received, in aggregate, a retainer fee at the annual rate of $80,000. All other Trustee fees remain unchanged.
A deferred compensation plan (the “Plan”) is available to the Trustees on a voluntary basis. Deferred amounts remain in the Funds until distributed in accordance with the provisions of the Plan. The value of a participating Trustee’s deferral account is based on theoretical investments of deferred amounts, on the normal payment dates, in certain funds of the Natixis Funds Trusts, Loomis Sayles Funds Trusts and Hansberger International Series as designated by the participating Trustees. Changes in the value of participants’ deferral accounts are allocated pro rata among the funds in the Natixis Funds Trusts, Loomis Sayles Funds Trusts, and Hansberger International Series, and are normally reflected as Trustees’ fees and expenses in the Statements of Operations. The portions of the accrued obligations allocated to the Funds under the Plan are reflected as Deferred Trustees’ fees in the Statements of Assets and Liabilities.
45 |
Notes to Financial Statements – continued
September 30, 2012
f. Affiliated Ownership. At September 30, 2012, Loomis Sayles Funded Pension Plan and Trust (“Pension Plan”) and Loomis Sayles Employees’ Profit Sharing Retirement Plan (“Retirement Plan”) held shares of beneficial interest of the Funds representing the following percentages of net assets:
| | | | | | | | | | | | |
Fund | | Pension Plan | | | Retirement Plan | | | Total
Affiliated
Ownership | |
Small Cap Growth Fund | | | 0.81% | | | | 1.11% | | | | 1.92% | |
Small Cap Value Fund | | | 1.14% | | | | 2.04% | | | | 3.18% | |
Investment activities of affiliated shareholders could have material impacts on the Funds.
6. Class-Specific Expenses. For the year ended September 30, 2012, the class-specific transfer agent fees and expenses (including sub-transfer agent fees) for each Fund were as follows:
| | | | | | | | | | | | |
| | | Transfer Agent Fees and Expenses | |
Fund | | Institutional
Class | | | Retail Class | | | Admin
Class | |
Small Cap Growth Fund | | $ | 378,018 | | | $ | 343,566 | | | $ | — | |
Small Cap Value Fund | | | 382,299 | | | | 510,805 | | | | 133,164 | |
7. Line of Credit. Each Fund, together with certain other funds of Natixis Funds Trusts, Loomis Sayles Funds Trusts and Hansberger International Series, participates in a $200,000,000 committed unsecured line of credit provided by State Street Bank, with an individual limit of $125,000,000 for each fund that participates in the line of credit. Interest is charged to each participating fund based on its borrowings at a rate per annum equal to the greater of the Federal Funds rate or overnight LIBOR, plus 1.25%. In addition, a commitment fee of 0.10% per annum, payable at the end of each calendar quarter, is accrued and apportioned among the participating funds based on their average daily unused portion of the line of credit. Prior to April 19, 2012, the commitment fee was 0.125% per annum.
For the year ended September 30, 2012, neither Fund had borrowings under these agreements.
8. Brokerage Commission Recapture. Each Fund has entered into agreements with certain brokers whereby the brokers will rebate a portion of brokerage commissions. All amounts rebated by the brokers are returned to the Funds under such agreements and are included in realized gains on investments in the Statements of Operations. For the year ended September 30, 2012, amounts rebated under these agreements were as follows:
| | | | |
Fund | | Rebates | |
Small Cap Growth Fund | | $ | 51,598 | |
Small Cap Value Fund | | | 44,143 | |
| 46
Notes to Financial Statements – continued
September 30, 2012
9. Capital Shares. Each Fund may issue an unlimited number of shares of beneficial interest, without par value. Transactions in capital shares were as follows:
| | | | | | | | | | | | | | | | |
| | | Small Cap Growth Fund | |
| | | Year Ended
September 30, 2012 | | | Year Ended
September 30, 2011 | |
| Institutional Class | | Shares | | | Amount | | | Shares | | | Amount | |
Issued from the sale of shares | | | 25,012,829 | | | $ | 444,379,599 | | | | 8,270,565 | | | $ | 142,244,743 | |
Issued in connection with the reinvestment of distributions | | | — | | | | — | | | | — | | | | — | |
Redeemed | | | (3,982,168 | ) | | | (71,766,116 | ) | | | (1,769,935 | ) | | | (30,230,462 | ) |
| | | | | | | | | | | | | | | | |
Net change | | | 21,030,661 | | | $ | 372,613,483 | | | | 6,500,630 | | | $ | 112,014,281 | |
| | | | | | | | | | | | | | | | |
| | | | |
| Retail Class | | | | | | | | | | | | |
Issued from the sale of shares | | | 8,772,957 | | | $ | 149,204,216 | | | | 5,486,059 | | | $ | 91,670,428 | |
Issued in connection with the reinvestment of distributions | | | — | | | | — | | | | — | | | | — | |
Redeemed | | | (4,084,044 | ) | | | (70,211,068 | ) | | | (3,253,098 | ) | | | (54,352,059 | ) |
| | | | | | | | | | | | | | | | |
Net change | | | 4,688,913 | | | $ | 78,993,148 | | | | 2,232,961 | | | $ | 37,318,369 | |
| | | | | | | | | | | | | | | | |
Increase (decrease) from capital share transactions | | | 25,719,574 | | | $ | 451,606,631 | | | | 8,733,591 | | | $ | 149,332,650 | |
| | | | | | | | | | | | | | | | |
47 |
Notes to Financial Statements – continued
September 30, 2012
9. Capital Shares – continued.
| | | | | | | | | | | | | | | | |
| | | Small Cap Value Fund | |
| | | Year Ended
September 30, 2012 | | | Year Ended
September 30, 2011 | |
| Institutional Class | | Shares | | | Amount | | | Shares | | | Amount | |
Issued from the sale of shares | | | 4,160,980 | | | $ | 112,254,002 | | | | 3,546,529 | | | $ | 95,137,414 | |
Issued in connection with the reinvestment of distributions | | | 37,002 | | | | 980,177 | | | | 114,244 | | | | 3,053,733 | |
Redeemed | | | (3,852,812 | ) | | | (105,017,313 | ) | | | (4,186,397 | ) | | | (112,560,971 | ) |
| | | | | | | | | | | | | | | | |
Net change | | | 345,170 | | | $ | 8,216,866 | | | | (525,624 | ) | | $ | (14,369,824 | ) |
| | | | | | | | | | | | | | | | |
| | | | |
| Retail Class | | | | | | | | | | | | |
Issued from the sale of shares | | | 1,188,522 | | | $ | 32,260,155 | | | | 2,574,140 | | | $ | 67,167,049 | |
Issued in connection with the reinvestment of distributions | | | — | | | | — | | | | 66,486 | | | | 1,762,558 | |
Redeemed | | | (4,987,227 | ) | | | (135,496,848 | ) | | | (3,836,066 | ) | | | (101,096,155 | ) |
| | | | | | | | | | | | | | | | |
Net change | | | (3,798,705 | ) | | $ | (103,236,693 | ) | | | (1,195,440 | ) | | $ | (32,166,548 | ) |
| | | | | | | | | | | | | | | | |
| | | | |
| Admin Class | | | | | | | | | | | | |
Issued from the sale of shares | | | 593,951 | | | $ | 15,631,061 | | | | 1,061,267 | | | $ | 27,365,871 | |
Issued in connection with the reinvestment of distributions | | | — | | | | — | | | | 5,109 | | | | 133,140 | |
Redeemed | | | (1,205,509 | ) | | | (31,874,850 | ) | | | (1,344,604 | ) | | | (35,080,134 | ) |
| | | | | | | | | | | | | | | | |
Net change | | | (611,558 | ) | | $ | (16,243,789 | ) | | | (278,228 | ) | | $ | (7,581,123 | ) |
| | | | | | | | | | | | | | | | |
Increase (decrease) from capital share transactions | | | (4,065,093 | ) | | $ | (111,263,616 | ) | | | (1,999,292 | ) | | $ | (54,117,495 | ) |
| | | | | | | | | | | | | | | | |
| 48
Report of Independent Registered Public Accounting Firm
To the Trustees of Loomis Sayles Funds I and Loomis Sayles Funds II and Shareholders of Loomis Sayles Small Cap Value Fund and Loomis Sayles Small Cap Growth Fund:
In our opinion, the accompanying statements of assets and liabilities, including the portfolios of investments, and the related statements of operations and of changes in net assets and the financial highlights present fairly, in all material respects, the financial position of the Loomis Sayles Small Cap Value Fund, a series of Loomis Sayles Funds I, and the Loomis Sayles Small Cap Growth Fund, a series of Loomis Sayles Funds II (collectively, the “Funds”), at September 30, 2012, and the results of each of their operations, the changes in each of their net assets and the financial highlights for each of the periods indicated, in conformity with accounting principles generally accepted in the United States of America. These financial statements and financial highlights (hereafter referred to as “financial statements”) are the responsibility of the Funds’ management; our responsibility is to express an opinion on these financial statements based on our audits. We conducted our audits of these financial statements in accordance with the standards of the Public Company Accounting Oversight Board (United States). Those standards require that we plan and perform the audits to obtain reasonable assurance about whether the financial statements are free of material misstatement. An audit includes examining, on a test basis, evidence supporting the amounts and disclosures in the financial statements, assessing the accounting principles used and significant estimates made by management, and evaluating the overall financial statement presentation. We believe that our audits, which included confirmation of securities at September 30, 2012 by correspondence with the custodian and brokers, provide a reasonable basis for our opinion.
PricewaterhouseCoopers LLP
Boston, Massachusetts
November 20, 2012
49 |
2012 U.S. Tax Distribution Information to Shareholders (Unaudited)
Corporate Dividends Received Deduction. For the fiscal year ended September 30, 2012, a percentage of dividends distributed by the Funds listed below qualify for the dividends received deduction for corporate shareholders. These percentages are as follows:
| | | | |
Fund | | Qualifying Percentage | |
Small Cap Value | | | 100.00% | |
Qualified Dividend Income. For the fiscal year ended September 30, 2012, the Funds below will designate up to the maximum amount allowable pursuant to the Internal Revenue Code as qualified dividend income eligible for reduced tax rates. These lower rates range from 0% to 15% depending on an individual’s tax bracket. If the Funds pay a distribution during calendar year 2012, complete information will be reported in conjunction with Form 1099-DIV.
| 50
Trustee and Officer Information
As of 9/30/12
The tables below provide certain information regarding the trustees and officers of Loomis Sayles Funds I and Loomis Sayles Funds II (the “Trusts”). Unless otherwise indicated, the address of all persons below is 399 Boylston Street, Boston, MA 02116. The Funds’ Statement of Additional Information includes additional information about the trustees of the Trusts and is available by calling Natixis Funds at 800-225-5478.
| | | | | | | | |
| Name and Year of Birth | | Position(s) Held
with the Trusts,
Length of Time
Served and
Term of Office1 | | Principal
Occupation(s)
During Past 5 Years | | Number of
Portfolios in
Fund Complex
Overseen2 and
Other
Directorships Held
During Past 5 Years | | Experience,
Qualifications,
Attributes, Skills
for Board
Membership |
| | |
| INDEPENDENT TRUSTEES | | | | |
| | | | |
Graham T. Allison, Jr.
(1940) | | Trustee Since 2003 Contract Review and Governance Committee Member | | Douglas Dillon Professor and Director of the Belfer Center for Science and International Affairs, John F. Kennedy School of Government, Harvard University | | 44
Director, Taubman Centers, Inc. (real estate investment trust) | | Significant experience on the Board of Trustees of the Trusts and on the board of other business organizations (including a real estate investment trust); government experience (including as Assistant Secretary of Defense under President Clinton); academic experience |
| | | | |
Charles D. Baker
(1956) | | Trustee From 2005 to 2009 and since 2011 Contract Review and Governance Committee Member | | Executive in Residence at General Catalyst Partners (venture capital and growth equity firm); formerly, President and Chief Executive Officer, Harvard Pilgrim Health Care (health care organization) | | 44
None | | Significant experience on the Board of Trustees of the Trusts; executive experience (including president and chief executive officer of a health care organization and executive officer of a venture capital and growth equity firm) |
51 |
Trustee and Officer Information – continued
| | | | | | | | |
| Name and Year of Birth | | Position(s) Held
with the Trusts,
Length of Time
Served and
Term of Office1 | | Principal
Occupation(s)
During Past 5 Years | | Number of
Portfolios in
Fund Complex
Overseen2 and
Other
Directorships Held
During Past 5 Years | | Experience,
Qualifications,
Attributes, Skills
for Board
Membership |
| | |
| INDEPENDENT TRUSTEES – continued | | | | |
| | | | |
Daniel M. Cain
(1945) | | Trustee Since 2003 Chairman of the Contract Review and Governance Committee | | Chairman (formerly, President and Chief Executive Officer) of Cain Brothers & Company, Incorporated (investment banking) | | 44
Director, Sheridan Healthcare Inc. (physician practice management) | | Significant experience on the Board of Trustees of the Trusts and on the board of other business organizations (including at a health care organization); experience in the financial industry (including roles as chairman and former chief executive officer of an investment banking firm) |
| | | | |
Kenneth A. Drucker
(1945) | | Trustee Since 2008 Chairman of the Audit Committee | | Retired | | 44
Formerly, Director, M Fund, Inc. (investment company); Director, Gateway Trust (investment company) | | Significant experience on the Board of Trustees of the Trusts and on the board of other business organizations (including at investment companies); executive experience (including as treasurer of an aerospace, automotive, and metal manufacturing corporation) |
| 52
Trustee and Officer Information – continued
| | | | | | | | |
| Name and Year of Birth | | Position(s) Held
with the Trusts,
Length of Time
Served and
Term of Office1 | | Principal
Occupation(s)
During Past 5 Years | | Number of
Portfolios in
Fund Complex
Overseen2 and
Other
Directorships Held
During Past 5 Years | | Experience,
Qualifications,
Attributes, Skills
for Board
Membership |
| | |
| INDEPENDENT TRUSTEES – continued | | | | |
| | | | |
Wendell J. Knox
(1948) | | Trustee Since 2009 Audit Committee Member | | Director (formerly, President and Chief Executive Officer) of Abt Associates Inc. (research and consulting) | | 44
Director, Eastern Bank (commercial bank); Director, The Hanover Insurance Group (property and casualty insurance) | | Significant experience on the Board of Trustees of the Trusts and on the board of other business organizations (including at a commercial bank and at a property and casualty insurance firm); executive experience (including roles as president and chief executive officer of a consulting company) |
| | | | |
Martin T. Meehan3
(1956) | | Trustee Since 2012 Contract Review and Governance Committee Member | | Chancellor and faculty member, University of Massachusetts Lowell | | 44
Director, Lowell Cooperative Bank (commercial bank); Director, Lowell General Hospital (healthcare); formerly, Director, Qteros, Inc. (biofuels); formerly, Trustee, Suffolk University (education); formerly, Director, D’Youville Foundation (senior care) | | Experience as Chancellor of the University of Massachusetts Lowell; experience on the board of other business organizations; government experience (including as a member of the U.S. House of Representatives); academic experience |
53 |
Trustee and Officer Information – continued
| | | | | | | | |
| Name and Year of Birth | | Position(s) Held
with the Trusts,
Length of Time
Served and
Term of Office1 | | Principal
Occupation(s)
During Past 5 Years | | Number of
Portfolios in
Fund Complex
Overseen2 and
Other
Directorships Held
During Past 5 Years | | Experience,
Qualifications,
Attributes, Skills
for Board
Membership |
| | |
| INDEPENDENT TRUSTEES – continued | | | | |
| | | | |
Sandra O. Moose
(1942) | | Chairperson of the Board of Trustees since November 2005 Trustee Since 2003 Ex officio member of the Audit Committee and Contract Review and Governance Committee | | President, Strategic Advisory Services (management consulting) | | 44
Director, Verizon Communications; Director, AES Corporation (international power company); formerly, Director, Rohm and Haas Company (specialty chemicals) | | Significant experience on the Board of Trustees of the Trusts and on the board of other business organizations (including at an international power company and a specialty chemicals corporation); executive experience (including at a management consulting company) |
| | | | |
Erik R. Sirri
(1958) | | Trustee Since 2009 Contract Review and Governance Committee Member | | Professor of Finance at Babson College; formerly, Director of the Division of Trading and Markets at the Securities and Exchange Commission | | 44
None | | Experience on the Board of Trustees of the Trusts; experience as Director of the Division of Trading and Markets at the Securities and Exchange Commission; academic experience; training as an economist |
| | | | |
Peter J. Smail
(1952) | | Trustee Since 2009 Contract Review and Governance Committee Member | | Retired; formerly, President and Chief Executive Officer of Pyramis Global Advisors (investment management) | | 44
None | | Experience on the Board of Trustees of the Trusts; mutual fund industry and executive experience (including roles as president and chief executive officer for an investment adviser) |
| 54
Trustee and Officer Information – continued
| | | | | | | | |
| Name and Year of Birth | | Position(s) Held
with the Trusts,
Length of Time
Served and
Term of Office1 | | Principal
Occupation(s)
During Past 5 Years | | Number of
Portfolios in
Fund Complex
Overseen2 and
Other
Directorships Held
During Past 5 Years | | Experience,
Qualifications,
Attributes, Skills
for Board
Membership |
| | |
| INDEPENDENT TRUSTEES – continued | | | | |
| | | | |
Cynthia L. Walker
(1956) | | Trustee Since 2005 Audit Committee Member | | Deputy Dean for Finance and Administration, Yale University School of Medicine; formerly, Executive Dean for Administration, Harvard Medical School | | 44
None | | Significant experience on the Board of Trustees of the Trusts; executive experience in a variety of academic organizations (including roles as dean for finance and administration) |
| | | |
| INTERESTED TRUSTEES | | | | | | |
| | | | |
Robert J. Blanding4
(1947) 555 California Street San Francisco, CA 94104 | | Trustee Since 2002 President and Chief Executive Officer of Loomis Sayles Funds I since 2002 Chief Executive Officer of Loomis Sayles Funds II since 2002 | | President, Chairman, Director and Chief Executive Officer, Loomis, Sayles & Company, L.P. | | 44
None | | Significant experience on the Board of Trustees of the Trusts; continuing service as President, Chairman, and Chief Executive Officer of Loomis, Sayles & Company, L.P. |
| | | | |
David L. Giunta5
(1965) | | Trustee Since 2011 President of Loomis Sayles Funds II and Executive Vice President of Loomis Sayles Funds I since 2008 | | President and Chief Executive Officer, NGAM Distribution Corporation, NGAM Advisors, L.P. and NGAM Distribution, L.P.; formerly President, Fidelity Charitable Gift Fund; and formerly, Senior Vice President, Fidelity Brokerage Company | | 44
None | | Experience on the Board of Trustees of the Trusts; continuing experience as President and Chief Executive Officer of NGAM Advisors, L.P. |
55 |
Trustee and Officer Information – continued
| | | | | | | | |
| Name and Year of Birth | | Position(s) Held
with the Trusts,
Length of Time
Served and
Term of Office1 | | Principal
Occupation(s)
During Past 5 Years | | Number of
Portfolios in
Fund Complex
Overseen2 and
Other
Directorships Held
During Past 5 Years | | Experience,
Qualifications,
Attributes, Skills
for Board
Membership |
| |
| INTERESTED TRUSTEES – continued | | |
| | | | |
John T. Hailer6
(1960) | | Trustee Since 2003 | | President and Chief Executive Officer-U.S. and Asia, Natixis Global Asset Management, L.P.; formerly, President and Chief Executive Officer, NGAM Distribution Corporation, NGAM Advisors L.P. and NGAM Distribution, L.P. | | 44
None | | Significant experience on the Board of Trustees of the Trusts; continuing experience as Chief Executive Officer-U.S. and Asia, Natixis Global Asset Management, L.P. |
| 1 | Each trustee serves until retirement, resignation or removal from the Board of Trustees of the Trusts. The current retirement age is 72. The position of Chairperson of the Board is appointed for a two-year term. Ms. Moose was appointed to serve an additional two year term as the Chairperson of the Board on November 18, 2011. |
| 2 | The trustees of the Trusts serve as trustees of a fund complex that includes all series of the Natixis Funds Trust I, Natixis Funds Trust II, Natixis Funds Trust IV and Gateway Trust (collectively, the “Natixis Funds Trusts”), Loomis Sayles Funds I and Loomis Sayles Funds II (collectively, the “Loomis Sayles Funds Trusts”), and Hansberger International Series (collectively, the “Fund Complex”). |
| 3 | Mr. Meehan was appointed as a trustee effective July 1, 2012. |
| 4 | Mr. Blanding is deemed an “interested person” of the Trusts because he holds the following positions with an affiliated person of the Trusts: President, Chairman, Director and Chief Executive Officer of Loomis, Sayles & Company, L.P. |
| 5 | Mr. Giunta is deemed an “interested person” of the Trusts because he holds the following positions with an affiliated person of the Trusts: President and Chief Executive Officer of NGAM Distribution Corporation, NGAM Advisors, L.P. and NGAM Distribution, L.P. |
| 6 | Mr. Hailer is deemed an “interested person” of the Trusts because he holds the following positions with an affiliated person of the Trusts: President and Chief Executive Officer – U.S. and Asia, Natixis Global Asset Management, L.P. |
| 56
Trustee and Officer Information – continued
| | | | | | |
| Name and Year of Birth | | Position(s) Held with
the Trusts | | Term of Office1 and
Length of Time Served | | Principal Occupation(s)
During Past 5 Years2 |
| | |
| OFFICERS OF THE TRUSTS | | | | |
| | | |
Coleen Downs Dinneen
(1960) | | Secretary, Clerk and Chief Legal Officer | | Since September 2004 | | Executive Vice President, General Counsel, Secretary and Clerk (formerly, Senior Vice President, Deputy General Counsel, Assistant Secretary and Assistant Clerk), NGAM Distribution Corporation, NGAM Advisors, L.P. and NGAM Distribution, L.P. |
| | | |
Daniel J. Fuss
(1933) One Financial Center Boston, MA 02111 | | Executive Vice President of Loomis Sayles Funds I and Loomis Sayles Funds II | | Since June 2003 | | Vice Chairman and Director, Loomis, Sayles & Company, L.P. |
| | | |
Russell L. Kane
(1969) | | Chief Compliance Officer, Assistant Secretary and Anti-Money Laundering Officer | | Chief Compliance Officer, since May 2006; Assistant Secretary since June 2004; and Anti-Money Laundering Officer since April 2007 | | Chief Compliance Officer for Mutual Funds, Senior Vice President, Deputy General Counsel, Assistant Secretary and Assistant Clerk, NGAM Distribution Corporation, NGAM Advisors, L.P. and NGAM Distribution, L.P. |
| | | |
Michael C. Kardok
(1959) | | Treasurer, Principal Financial and Accounting Officer | | Since October 2004 | | Senior Vice President, NGAM Advisors, L.P. and NGAM Distribution, L.P. |
| 1 | Each officer of the Trusts serves for an indefinite term in accordance with the Trusts’ current by-laws until the date his or her successor is elected and qualified, or until he or she sooner dies, retires, is removed or becomes disqualified. |
| 2 | Each person listed above, except as noted, holds the same position(s) with the Fund Complex. Mr. Fuss is not an officer of the Natixis Funds Trusts or the Hansberger International Series. Previous positions during the past five years with NGAM Distribution, L.P., NGAM Advisors, L.P. or Loomis, Sayles & Company, L.P. are omitted, if not materially different from a trustee’s or officer’s current position with such entity. |
57 |
ANNUAL REPORT
September 30, 2012

Loomis Sayles Investment Grade Bond Fund
TABLE OF CONTENTS
Portfolio Review page 1
Portfolio of Investments page 13
Financial Statements page 34
Notes to Financial Statements page 41
Loomis Sayles Investment Grade Bond Fund
Management Discussion
Managers:
Matthew J. Eagan, CFA
Daniel J. Fuss, CFA, CIC
Kathleen C. Gaffney, CFA*
Elaine M. Stokes
Loomis, Sayles & Company, L.P.
Objective:
High total investment return through a combination of current income and capital appreciation
Strategy:
Invests primarily in investment-grade, fixed-income securities, although it may invest up to 10% of its assets in below investment-grade fixed-income securities and up to 10% of its assets in equity securities (including up to 5% in common stocks). The fund may invest any portion of its assets in securities of Canadian issuers and up to 20% in other foreign securities, including emerging markets.
Symbols:
| | |
| Class A | | LIGRX |
| Class B | | LGBBX |
| Class C | | LGBCX |
| Class Y | | LSIIX |
| Admin Class | | LIGAX |
| * | Effective October 22, 2012, Kathleen Gaffney no longer serves as a portfolio manager of the fund. |
Market Conditions
U.S. economic data showed signs of improvement during the first half of the 12-month period that ended September 30, 2012, but began to deteriorate in the second half. The U.S. Commerce Department revised the second quarter economic growth rate lower, and employment numbers remained weak. U.S. Treasury yields fell to record lows as volatility persisted during the period, reflecting concerns about the ongoing sovereign debt crisis in Europe and the global economic slowdown.
Quantitative easing, a central bank tool designed to help keep long-term interest rates low and a major theme during the 12-month period, helped buoy the financial markets intermittently. In December 2011, the European Central Bank (ECB) implemented a program designed to provide additional liquidity to the euro zone. Midway through 2012, the Federal Reserve (the Fed) extended Operation Twist (a stimulus plan in which the Fed is buying long-term securities and selling the same dollar amount of short-term securities) through the remainder of the year. Late in the period, the ECB launched an additional sovereign debt-buying program, and the Fed announced its third round of quantitative easing, in which it will purchase $40 billion per month of agency mortgage-backed securities (MBS) with no specified end date.
Performance Results
For the 12 months ended September 30, 2012, Class A shares of Loomis Sayles Investment Grade Bond Fund returned 11.74% at net asset value. The fund outperformed its benchmark, the Barclays U.S. Government/Credit Bond Index, which returned 5.66% for the period. It also outperformed the 7.70% average return of the Morningstar Intermediate-Term Bond category.
Explanation of Fund Performance
Nearly every sector outperformed during the period, led by high-grade corporate holdings, which represented the fund’s largest source of outperformance relative to
1 |
the index. In particular, overweight positions in financial and industrial holdings significantly boosted results. Selected names within the banking, communication, transportation and technology sectors were top performers, while utility credits were modest contributors.
Out-of-benchmark allocations to non-U.S.-dollar-denominated and high-yield securities also boosted relative performance. Issues denominated in the commodity-linked currencies of New Zealand, Australia and Canada largely contributed to the fund’s outperformance, while selected holdings denominated in the euro benefitted from the ECB’s bond-buying program. Issues denominated in the British pound, Mexican peso and Brazilian real also slightly aided returns. Among high-yield corporate bonds, industrials and financials led results. Specifically, selected names within finance, consumer cyclicals, basic industry, capital goods and transportation were top performers. In addition, an underweight position in U.S. Treasuries proved beneficial, as the fund was able to generate stronger returns from higher-beta (higher risk/reward potential) securities.
Commercial mortgage-backed securities (CMBS) also helped performance, while convertible bonds in the technology, insurance and consumer cyclical sectors posted strong returns, following in step with equity markets.
Despite posting positive total returns, Norwegian krone- and Indonesian rupiah-denominated issues were a slight drag on relative performance. In addition, the fund’s duration (price sensitivity to interest rate changes) was shorter than the benchmark’s, which detracted somewhat from relative performance, as interest rates fell and the yield curve (a curve that shows the relationship among bond yields across the maturity spectrum) flattened.
Outlook
Unprecedented monetary support in both the United States and Europe continues to largely dictate market sentiment and flows, while preserving low interest rates. Investor desire for yield in this environment will most likely support sustained demand in the corporate arena. Fundamental credit quality in the corporate sector remains a source of confidence for investors. However, if economic conditions continue to deteriorate globally, the challenge of investing in stable to improving companies will become more challenging.
The U.S. elections, pending “fiscal cliff” and increasingly weakening economic conditions in Europe, China and the United States are all situations that could potentially provide market volatility and opportunities. We consider recent positive developments in the U.S. housing market along with the Fed’s latest purchase program in the mortgage market to be sources of good news on the economic front and view the sectors as continuing opportunities. Our strategy of populating the fund with individual specific-risks ideas remains an important theme, as do the concepts of yield advantage and investing with a long-term horizon in mind. Macroeconomic developments continue to dominate the headlines and market flows, but our belief that owning quality companies based on fundamentals continues to serve us well and will drive our investment process through the rest of this calendar year.
| 2
Loomis Sayles Investment Grade Bond Fund
Investment Results through September 30, 2012
Growth of a $10,000 Investment in Class A Shares1,5
September 30, 2002 through September 30, 2012
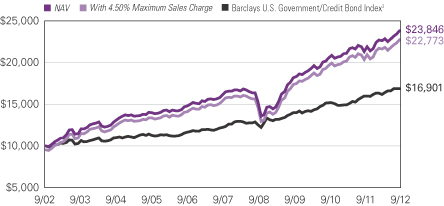
3 |
Average Annual Total Returns — September 30, 20125
| | | | | | | | | | | | |
| | | | |
| | | 1 Year | | | 5 Years | | | 10 Years | |
| | | | |
| Class A (Inception 12/31/96)1 | | | | | | | | | | | | |
| NAV | | | 11.74 | % | | | 8.10 | % | | | 9.08 | % |
| With 4.50% Maximum Sales Charge | | | 6.72 | | | | 7.11 | | | | 8.58 | |
| | | | |
| Class B (Inception 9/12/03)1 | | | | | | | | | | | | |
| NAV | | | 10.96 | | | | 7.23 | | | | 8.18 | |
| With CDSC2 | | | 5.96 | | | | 6.93 | | | | 8.18 | |
| | | | |
| Class C (Inception 9/12/03)1 | | | | | | | | | | | | |
| NAV | | | 10.91 | | | | 7.31 | | | | 8.23 | |
| With CDSC2 | | | 9.91 | | | | 7.31 | | | | 8.23 | |
| | | | |
| Class Y (Inception 12/31/96) | | | | | | | | | | | | |
| NAV | | | 12.01 | | | | 8.39 | | | | 9.39 | |
| | | | |
| Admin Class (Inception 2/1/10)1 | | | | | | | | | | | | |
| NAV | | | 11.41 | | | | 7.71 | | | | 8.59 | |
| | | | |
| COMPARATIVE PERFORMANCE | | | | | | | | | | | | |
| Barclays U.S. Government/Credit Bond Index3 | | | 5.66 | | | | 6.63 | | | | 5.39 | |
| Morningstar Intermediate-Term Bond Fund Avg.4 | | | 7.70 | | | | 6.30 | | | | 5.22 | |
Past performance does not guarantee future results. The chart and table do not reflect taxes shareholders might owe on any fund distributions or when they redeem their shares. Returns reflect changes in share price and reinvestment of dividends and capital gains, if any. Unlike a fund, an index is not managed and does not reflect fees and expenses.
NOTES TO CHARTS
| 1 | Prior to 9/15/03, performance of Class A shares is that of Retail Class shares, which were redesignated as Class A shares, restated to reflect the sales load of Class A shares. Prior to the inception of Class B and C shares (9/12/03), performance is that of Institutional Class shares, which were redesignated as Class Y shares, restated to reflect the higher net expenses and sales loads of Class B and C shares. Prior to the inception of Admin Class shares (2/1/10), performance is that of Class A shares, restated to reflect the higher net expenses of Admin Class shares. |
| 2 | Performance for Class B shares assumes a maximum 5% contingent deferred sales charge (“CDSC”) applied when you sell shares, which declines annually between years 1-6 according to the following schedule: 5, 4, 3, 3, 2, 1, 0%. Class C shares performance assumes a 1% CDSC applied when you sell shares within one year of purchase. |
| 3 | Barclays U.S. Government/Credit Bond Index is an unmanaged index that includes U.S. Treasuries, government-related issues, and investment grade U.S. corporate securities. |
| 4 | Morningstar Intermediate-Term Bond Fund Average is the average performance without sales charges of funds with similar investment objectives, as calculated by Morningstar, Inc. |
| 5 | Fund performance has been increased by fee waivers and/or expense reimbursements, if any, without which performance would have been lower. |
| 4
ADDITIONAL INFORMATION
The views expressed in this report reflect those of the portfolio managers as of the dates indicated. The managers’ views are subject to change at any time without notice based on changes in market or other conditions. References to specific securities or industries should not be regarded as investment advice. Because the fund is actively managed, there is no assurance that it will continue to invest in the securities, countries or industries mentioned.
PROXY VOTING INFORMATION
A description of the fund’s proxy voting policies and procedures is available without charge, upon request, by calling Natixis Funds at 800-225-5478; on the fund’s website at ngam.natixis.com; and on the Securities and Exchange Commission’s (SEC’s) website at www.sec.gov. Information regarding how the fund voted proxies relating to portfolio securities during the 12-month period ended June 30, 2012 is available from the fund’s website and the SEC’s website.
QUARTERLY PORTFOLIO SCHEDULES
The fund files a complete schedule of portfolio holdings with the SEC for the first and third quarters of each fiscal year on Form N-Q. The fund’s Forms N-Q are available on the SEC’s website at www.sec.gov and may be reviewed and copied at the SEC’s Public Reference Room in Washington, DC. Information on the operation of the Public Reference Room may be obtained by calling 800-SEC-0330.
5 |
UNDERSTANDING YOUR FUND’S EXPENSES
As a mutual fund shareholder, you incur different types of costs: transaction costs, including sales charges (loads) on purchases and contingent deferred sales charges on redemptions; and ongoing costs, including management fees, distribution fees (12b-1 fees) and/or service fees, and other fund expenses. These costs are described in more detail in the fund’s prospectus. The examples below are intended to help you understand the ongoing costs of investing in the fund and help you compare these with the ongoing costs of investing in other mutual funds.
The first line in the table for each class shows the actual amount of fund expenses you would have paid on a $1,000 investment in the fund from April 1, 2012 through September 30, 2012. It also shows how much a $1,000 investment would be worth at the close of the period, assuming actual fund returns and expenses. To estimate the expenses you paid over the period, simply divide your account value by $1,000 (for example $8,600 account value divided by $1,000 =8.60) and multiply the result by the number in the Expenses Paid During Period row as shown below for your class.
The second line in the table for each class provides information about hypothetical account values and hypothetical expenses based on the fund’s actual expense ratios and an assumed rate of return of 5% per year before expenses, which is not the fund’s actual return. The hypothetical account values and expenses may not be used to estimate the actual ending account balance or expenses you paid on your investment for the period. You may use this information to compare the ongoing costs of investing in the fund and other funds. To do so, compare this 5% hypothetical example with the 5% hypothetical examples that appear in the shareholder reports of the other funds.
Please note that the expenses shown reflect ongoing costs only, and do not include any transaction costs. Therefore, the second line in the table of the fund is useful in comparing ongoing costs only, and will not help you determine the relative costs of owning different funds. If transaction costs were included, total costs would be higher.
| 6
| | | | | | | | | | | | |
LOOMIS SAYLES INVESTMENT GRADE
BOND FUND | | BEGINNING
ACCOUNT VALUE
4/1/2012 | | | ENDING
ACCOUNT VALUE
9/30/2012 | | | EXPENSES PAID
DURING PERIOD*
4/1/2012 – 9/30/2012 | |
Class A | | | | | | | | | | | | |
Actual | | | $1,000.00 | | | | $1,052.30 | | | | $4.26 | |
Hypothetical (5% return before expenses) | | | $1,000.00 | | | | $1,020.85 | | | | $4.19 | |
Class B | | | | | | | | | | | | |
Actual | | | $1,000.00 | | | | $1,048.60 | | | | $8.09 | |
Hypothetical (5% return before expenses) | | | $1,000.00 | | | | $1,017.10 | | | | $7.97 | |
Class C | | | | | | | | | | | | |
Actual | | | $1,000.00 | | | | $1,048.80 | | | | $8.09 | |
Hypothetical (5% return before expenses) | | | $1,000.00 | | | | $1,017.10 | | | | $7.97 | |
Class Y | | | | | | | | | | | | |
Actual | | | $1,000.00 | | | | $1,053.60 | | | | $2.98 | |
Hypothetical (5% return before expenses) | | | $1,000.00 | | | | $1,022.10 | | | | $2.93 | |
Admin Class | | | | | | | | | | | | |
Actual | | | $1,000.00 | | | | $1,051.10 | | | | $5.54 | |
Hypothetical (5% return before expenses) | | | $1,000.00 | | | | $1,019.60 | | | | $5.45 | |
| * | Expenses are equal to the Fund's annualized expense ratio: 0.83%, 1.58%, 1.58%, 0.58% and 1.08% for Class A, B, C, Y and Admin Class, respectively, multiplied by the average account value over the period, multiplied by the number of days in the most recent fiscal half-year, divided by 366 (to reflect the half-year period). |
7 |
BOARD APPROVAL OF THE EXISTING ADVISORY AGREEMENT
The Board of Trustees of the Trust, including the Independent Trustees, considers matters bearing on the Fund’s advisory agreement (the “Agreement”) at most of its meetings throughout the year. Each year, usually in the spring, the Contract Review and Governance Committee of the Board meets to review the Agreement to determine whether to recommend that the full Board approve the continuation of the Agreement, typically for an additional one-year period. After the Committee has made its recommendation, the full Board, including the Independent Trustees, determines whether to approve the continuation of the Agreement.
In connection with these meetings, the Trustees receive materials that the Fund’s investment adviser (the “Adviser”) believes to be reasonably necessary for the Trustees to evaluate the Agreement. These materials generally include, among other items, (i) information on the investment performance of the Fund and the performance of a peer group of funds and the Fund’s performance benchmarks, (ii) information on the Fund’s advisory fee and other expenses, including information comparing the Fund’s expenses to the fees charged to institutional accounts with similar strategies managed by the Adviser and to those of a peer group of funds and information about any applicable expense caps and fee “breakpoints,” (iii) sales and redemption data in respect of the Fund, (iv) information about the profitability of the Agreement to the Adviser and (v) information obtained through the completion by the Adviser of a questionnaire distributed on behalf of the Trustees. The Board of Trustees, including the Independent Trustees, also consider other matters such as (i) the Adviser’s financial results and financial condition, (ii) the Fund’s investment objective and strategies and the size, education and experience of the Adviser’s investment staff and its use of technology, external research and trading cost measurement tools, (iii) arrangements in respect of the distribution of the Fund’s shares and the related costs, (iv) the procedures employed to determine the value of the Fund’s assets, (v) the allocation of the Fund’s brokerage, if any, including, if applicable, allocations to brokers affiliated with the Adviser and the use of “soft” commission dollars to pay Fund expenses and to pay for research and other similar services, (vi) the resources devoted to, and the record of compliance with, the Fund’s investment policies and restrictions, policies on personal securities transactions and other compliance policies, (vii) information about amounts invested by the Fund’s portfolio managers in the Fund or in similar accounts that they manage and (viii) the general economic outlook with particular emphasis on the mutual fund industry. Throughout the process, the Trustees are afforded the opportunity to ask questions of and request additional materials from the Adviser.
In addition to the materials requested by the Trustees in connection with their annual consideration of the continuation of the Agreement, the Trustees receive materials in advance of each regular quarterly meeting of the Board of Trustees of the Trust that provide detailed information about the Fund’s investment performance and the fees charged to the Fund for advisory and other services. This information generally includes, among other things, an internal performance rating for the Fund based on agreed-upon criteria, graphs showing performance and fee differentials against the Fund’s peer group/
| 8
category of funds, performance ratings provided by a third-party, total return information for various periods, and third-party performance rankings for various periods comparing the Fund against similarly categorized funds. The portfolio management team for the Fund or other representatives of the Adviser make periodic presentations to the Contract Review and Governance Committee and/or the full Board of Trustees of the Trust, and if the Fund is identified as presenting possible performance concerns it may be subject to more frequent board presentations and reviews. In addition, each quarter the Trustees are provided with detailed statistical information about the Fund’s portfolio. The Trustees also receive periodic updates between meetings.
The Board of Trustees of the Trust most recently approved the continuation of the Agreement at their meeting held in June 2012. The Agreement was continued for a one-year period. In considering whether to approve the continuation of the Agreement, the Board of Trustees of the Trust, including the Independent Trustees, did not identify any single factor as determinative. Individual Trustees may have evaluated the information presented differently from one another, giving different weights to various factors. Matters considered by the Trustees, including the Independent Trustees, in connection with their approval of the Agreement included, but were not limited to, the factors listed below.
The nature, extent and quality of the services provided to the Fund under the Agreement. The Trustees considered the nature, extent and quality of the services provided by the Adviser and its affiliates to the Fund and the resources dedicated to the Fund by the Adviser and its affiliates.
The Trustees considered not only the advisory services provided by the Adviser to the Fund, but also the administrative services provided by NGAM Advisors, L.P. (“NGAM Advisors”) and its affiliates to the Fund.
The Trustees also considered the benefits to shareholders of investing in a mutual fund that is part of a family of funds that offers shareholders the right to exchange shares of one type of fund for shares of another type of fund, and provides a variety of fund and shareholder services.
After reviewing these and related factors, the Trustees concluded, within the context of their overall conclusions regarding the Agreement, that the nature, extent and quality of services provided supported the renewal of the Agreement.
Investment performance of the Fund and the Adviser. As noted above, the Trustees received information about the performance of the Fund over various time periods, including information which compared the performance of the Fund to the performance of peer groups and categories of funds and the Fund’s performance benchmark. In addition, the Trustees also reviewed data prepared by an independent third party which analyzed the performance of the Fund using a variety of performance metrics, including metrics which also measured the performance of the Fund on a risk adjusted basis.
The Board concluded that the Fund’s performance or other relevant factors supported the renewal of the Fund’s Agreement. Although the Trustees noted that the Fund had performance that lagged that of a relevant peer group median and/or category median for certain (although not necessarily all) periods, the Board concluded that other factors
9 |
relevant to performance supported renewal of the Agreement. These factors included the following: (1) that the underperformance was attributable, to a significant extent, to investment decisions (such as security selection or sector allocation) by the Adviser that were reasonable and consistent with the Fund’s investment objective and policies and (2) that the Fund’s performance was stronger over the long term.
The Trustees also considered the Adviser’s performance and reputation generally, the performance of the fund family generally (as noted by certain financial publications), and the historical responsiveness of the Adviser to Trustee concerns about performance and the willingness of the Adviser to take steps intended to improve performance.
After reviewing these and related factors, the Trustees concluded, within the context of their overall conclusions regarding the Agreement, that the performance of the Fund and the Adviser supported the renewal of the Agreement.
The costs of the services to be provided and profits to be realized by the Adviser and its affiliates from their respective relationships with the Fund. The Trustees considered the fees charged to the Fund for advisory services as well as the total expense levels of the Fund. This information included comparisons (provided both by management and also by an independent third party) of the Fund’s advisory fee and total expense levels to those of its peer group and information about the advisory fees charged by the Adviser to comparable accounts (such as institutional separate accounts), as well as information about differences in such fees and the reasons for any such differences. In considering the fees charged to comparable accounts, the Trustees considered, among other things, management’s representations about the differences between managing mutual funds as compared to other types of accounts, including the additional resources required to effectively manage and the greater regulatory costs associated with the management of mutual fund assets. In evaluating the Fund’s advisory fee, the Trustees also took into account the demands, complexity and quality of the investment management of the Fund, as well as the need for the Adviser to offer competitive compensation in order to attract and retain capable personnel and the need for the Adviser to expend additional resources as the Fund grows in size. The Trustees considered that over the past several years, management had made recommendations regarding reductions in advisory fee rates, implementation of advisory fee breakpoints and the institution of advisory fee waivers and expense caps for various funds in the fund family. They noted that the Fund currently has an expense cap in place, although the current expenses of the Fund are below the cap.
The Trustees also considered the compensation directly or indirectly received by the Adviser and its affiliates from their relationships with the Fund. The Trustees reviewed information provided by management as to the profitability of the Adviser’s and its affiliates’ relationships with the Fund, and information about the allocation of expenses used to calculate profitability. They also reviewed information provided by management about the effect of distribution costs and changes in asset levels on Adviser profitability, including information regarding resources spent on distribution activities. When reviewing profitability, the Trustees also considered information about court cases in which adviser compensation or profitability were issues, the performance of the Fund, the expense levels of the Fund and whether the Adviser had implemented breakpoints and/or expense caps with respect to the Fund.
| 10
After reviewing these and related factors, the Trustees concluded, within the context of their overall conclusions regarding the Agreement, that the advisory fee charged to the Fund was fair and reasonable, and that the costs of these services generally and the related profitability of the Adviser and its affiliates in respect of their relationships with the Fund supported the renewal of the Agreement.
Economies of Scale. The Trustees considered the existence of any economies of scale in the provision of services by the Adviser and whether those economies are shared with the Fund through breakpoints in its investment advisory fee or other means, such as expense waivers or caps. The Trustees also discussed with management the factors considered with respect to the implementation of breakpoints in investment advisory fees or expense waivers or caps for certain funds. Management explained that a number of factors are taken into account in considering the possible implementation of breakpoints or an expense cap for a fund, including, among other things, factors such as a fund’s assets, the projected growth of a fund, projected profitability and a fund’s fees and performance. With respect to economies of scale, the Trustees noted that although the Fund’s advisory fee was not subject to breakpoints, the Fund was subject to an expense cap and the Fund’s overall net expense ratio was below the median compared to a peer group of funds. In considering these issues, the Trustees also took note of the costs of the services provided (both on an absolute and a relative basis) and the profitability to the Adviser and its affiliates of their relationships with the Fund, as discussed above.
After reviewing these and related factors, the Trustees concluded, within the context of their overall conclusions regarding the Agreement, that the extent to which economies of scale were shared with the Fund supported the renewal of the Agreement.
The Trustees also considered other factors, which included but were not limited to the following:
| · | | The effect of recent market and economic events on the performance, asset levels and expense ratios of the Fund. |
| · | | Whether the Fund has operated in accordance with its investment objective and the Fund’s record of compliance with its investment restrictions, and the compliance programs of the Fund and the Adviser. They also considered the compliance-related resources the Adviser and its affiliates were providing to the Fund. |
| · | | The nature, quality, cost and extent of administrative and shareholder services performed by the Adviser and its affiliates, both under the Agreement and under a separate agreement covering administrative services. |
| · | | So-called “fallout benefits” to the Adviser, such as the engagement of affiliates of the Adviser to provide distribution, administrative and brokerage services to the Fund, and the benefits of research made available to the Adviser by reason of brokerage commissions (if any) generated by the Fund’s securities transactions. The Trustees also considered the fact that NGAM Advisors’ parent company benefits from the retention of an affiliated Adviser. The Trustees considered the possible conflicts of interest associated with these fallout and other benefits, and |
11 |
| | the reporting, disclosure and other processes in place to disclose and monitor such possible conflicts of interest. |
| · | | The Trustees’ review and discussion of the Fund’s advisory arrangements in prior years, and management’s record of responding to Trustee concerns raised during the year and in prior years. |
Based on their evaluation of all factors that they deemed to be material, including those factors described above, and assisted by the advice of independent counsel, the Trustees, including the Independent Trustees, concluded that the existing Agreement should be continued through June 30, 2013.
| 12
Portfolio of Investments – as of September 30, 2012
Loomis Sayles Investment Grade Bond Fund
| | | | | | | | |
Principal
Amount (‡) | | | Description | | Value (†) | |
| | Bonds and Notes — 87.7% of Net Assets | |
| | Non-Convertible Bonds — 83.8% | |
| | | | ABS Car Loan — 0.6% | | | | |
| $ | 831,000 | | | Avis Budget Rental Car Funding AESOP LLC, Series 2010-2A, Class B,
5.740%, 8/20/2014, 144A | | $ | 852,339 | |
| | 4,590,000 | | | Avis Budget Rental Car Funding AESOP LLC, Series 2010-3A, Class B,
6.740%, 5/20/2016, 144A | | | 5,090,407 | |
| | 2,889,250 | | | Avis Budget Rental Car Funding AESOP LLC, Series 2010-5A, Class B,
5.110%, 3/20/2017, 144A | | | 3,162,050 | |
| | 18,620,000 | | | Chesapeake Funding LLC, Series 2009-2A, Class B,
1.971%, 9/15/2021, 144A(b) | | | 18,713,100 | |
| | 16,736,000 | | | Chesapeake Funding LLC, Series 2009-2A, Class C,
1.971%, 9/15/2021, 144A(b) | | | 16,836,416 | |
| | 19,574,000 | | | Ford Auto Securitization Trust, Series 2010-R3A, Class A3,
2.714%, 9/15/2015, 144A, (CAD) | | | 20,206,158 | |
| | 5,481,000 | | | Ford Auto Securitization Trust, Series 2010-R3A, Class D,
4.526%, 3/15/2017, 144A, (CAD) | | | 5,642,124 | |
| | 57,520 | | | Merrill Auto Trust Securitization Asset, Series 2008-1, Class B,
6.750%, 4/15/2015 | | | 57,689 | |
| | | | | | | | |
| | | | | | | 70,560,283 | |
| | | | | | | | |
| | | | ABS Credit Card — 0.6% | | | | |
| | 28,592,000 | | | Chase Issuance Trust, Series 2007-B1, Class B1, 0.471%, 4/15/2019(b) | | | 28,370,927 | |
| | 19,182,000 | | | GE Capital Credit Card Master Note Trust, Series 2009-4, Class B,
5.390%, 11/15/2017, 144A | | | 20,661,450 | |
| | 14,465,000 | | | MBNA Credit Card Master Note Trust, Series 2004-B1, Class B1,
4.450%, 8/15/2016 | | | 15,235,767 | |
| | 2,324,000 | | | World Financial Network Credit Card Master Trust,
Series 2010-A, Class B, 6.750%, 4/15/2019 | | | 2,588,778 | |
| | | | | | | | |
| | | | | | | 66,856,922 | |
| | | | | | | | |
| | | | ABS Other — 1.2% | | | | |
| | 1,630,454 | | | Community Program Loan Trust, Series 1987-A, Class A5, 4.500%, 4/01/2029 | | | 1,647,660 | |
| | 6,668,039 | | | Diamond Resorts Owner Trust, Series 2011-1, Class A,
4.000%, 3/20/2023, 144A | | | 6,788,444 | |
| | 30,839,426 | | | Marriott Vacation Club Owner Trust, Series 2009-2A, Class A,
4.809%, 7/20/2031, 144A | | | 32,183,994 | |
| | 28,659,676 | | | SVO VOI Mortgage Corp., Series 2009-BA, Class NT,
5.810%, 12/20/2028, 144A | | | 29,536,490 | |
| | 40,096,400 | | | Trinity Rail Leasing LP, Series 2009-1A, Class A, 6.657%, 11/16/2039, 144A | | | 47,057,816 | |
| | 15,728,505 | | | Trinity Rail Leasing LP, Series 2010-1A, Class A, 5.194%, 10/16/2040, 144A | | | 16,332,008 | |
| | 15,614,455 | | | Trip Rail Master Funding LLC, Series 2011-1A, Class A1A,
4.370%, 7/15/2041, 144A | | | 16,023,413 | |
| | | | | | | | |
| | | | | | | 149,569,825 | |
| | | | | | | | |
| | | | Aerospace & Defense — 0.8% | | | | |
| | 2,100,000 | | | Bombardier, Inc., 7.450%, 5/01/2034, 144A | | | 2,142,000 | |
| | 78,795,000 | | | Textron, Inc., 5.950%, 9/21/2021 | | | 91,975,828 | |
| | | | | | | | |
| | | | | | | 94,117,828 | |
| | | | | | | | |
See accompanying notes to financial statements.
13 |
Portfolio of Investments – as of September 30, 2012
Loomis Sayles Investment Grade Bond Fund – (continued)
| | | | | | | | |
Principal
Amount (‡) | | | Description | | Value (†) | |
| | | | Airlines — 2.4% | | | | |
| $ | 100,553 | | | Continental Airlines Pass Through Trust, Series 1997-1, Class A,
7.461%, 10/01/2016 | | $ | 105,581 | |
| | 769,912 | | | Continental Airlines Pass Through Trust, Series 1998-1, Class A,
6.648%, 3/15/2019 | | | 831,505 | |
| | 871,126 | | | Continental Airlines Pass Through Trust, Series 1999-1, Class A,
6.545%, 8/02/2020 | | | 953,882 | |
| | 8,640,983 | | | Continental Airlines Pass Through Trust, Series 2000-1, Class A-1,
8.048%, 5/01/2022 | | | 9,872,323 | |
| | 1,741,229 | | | Continental Airlines Pass Through Trust, Series 2000-2, Class A-1,
7.707%, 10/02/2022 | | | 1,945,823 | |
| | 3,122,083 | | | Continental Airlines Pass Through Trust, Series 2001-1, Class A-1,
6.703%, 12/15/2022 | | | 3,390,551 | |
| | 54,678,179 | | | Continental Airlines Pass Through Trust, Series 2007-1, Class A,
5.983%, 10/19/2023 | | | 60,966,169 | |
| | 11,397,351 | | | Continental Airlines Pass Through Trust, Series 2007-1, Class B,
6.903%, 10/19/2023 | | | 11,966,535 | |
| | 25,175,224 | | | Continental Airlines Pass Through Trust, Series 2009-1, 9.000%, 1/08/2018 | | | 29,077,384 | |
| | 19,508,363 | | | Continental Airlines Pass Through Trust, Series 2009-2, Class A,
7.250%, 5/10/2021 | | | 22,288,305 | |
| | 3,065,000 | | | Continental Airlines Pass Through Trust, Series 2012-1, Class B,
6.250%, 10/22/2021 | | | 3,172,275 | |
| | 1,789,851 | | | Delta Air Lines Pass Through Trust, Series 2007-1, Class A,
6.821%, 2/10/2024 | | | 1,977,785 | |
| | 12,828,217 | | | Delta Air Lines Pass Through Trust, Series 2007-1, Class B,
8.021%, 2/10/2024 | | | 13,854,474 | |
| | 33,381,292 | | | Delta Air Lines Pass Through Trust, Series 2009-1, Class A,
7.750%, 6/17/2021 | | | 38,138,126 | |
| | 2,610,048 | | | Delta Air Lines Pass Through Trust, Series 2009-1, Series B,
9.750%, 6/17/2018 | | | 2,884,103 | |
| | 19,137,928 | | | Delta Air Lines Pass Through Trust, Series 2010-1, Class A,
6.200%, 1/02/2020 | | | 20,908,186 | |
| | 6,139,070 | | | Northwest Airlines, Inc., Series 2007-1, Class B, 8.028%, 5/01/2019 | | | 6,515,395 | |
| | 7,277,000 | | | Qantas Airways Ltd., 6.050%, 4/15/2016, 144A | | | 7,506,939 | |
| | 23,414,984 | | | UAL Pass Through Trust, Series 2007-1, Class A, 6.636%, 1/02/2024 | | | 24,468,658 | |
| | 5,864,389 | | | UAL Pass Through Trust, Series 2009-1, 10.400%, 5/01/2018 | | | 6,758,708 | |
| | 17,106,706 | | | US Airways Pass Through Trust, Series 2011-1A, Class A,
7.125%, 4/22/2025 | | | 18,646,310 | |
| | | | | | | | |
| | | | | | | 286,229,017 | |
| | | | | | | | |
| | | | Automotive — 1.1% | | | | |
| | 40,992,000 | | | Cummins, Inc., 5.650%, 3/01/2098 | | | 42,898,907 | |
| | 5,274,000 | | | Cummins, Inc., 6.750%, 2/15/2027 | | | 6,605,026 | |
| | 1,948,000 | | | Ford Motor Co., 6.375%, 2/01/2029 | | | 2,121,352 | |
| | 125,000 | | | Ford Motor Co., 6.500%, 8/01/2018 | | | 144,375 | |
| | 255,000 | | | Ford Motor Co., 6.625%, 2/15/2028 | | | 275,749 | |
| | 5,074,000 | | | Ford Motor Co., 6.625%, 10/01/2028 | | | 5,666,856 | |
| | 8,544,000 | | | Ford Motor Co., 7.450%, 7/16/2031 | | | 10,626,600 | |
| | 240,000 | | | Ford Motor Co., 7.500%, 8/01/2026 | | | 276,600 | |
See accompanying notes to financial statements.
| 14
Portfolio of Investments – as of September 30, 2012
Loomis Sayles Investment Grade Bond Fund – (continued)
| | | | | | | | |
Principal
Amount (‡) | | | Description | | Value (†) | |
| | | | Automotive — continued | | | | |
| $ | 5,000,000 | | | Ford Motor Credit Co. LLC, 5.000%, 5/15/2018 | | $ | 5,458,615 | |
| | 40,126,000 | | | Ford Motor Credit Co. LLC, 6.625%, 8/15/2017 | | | 46,542,789 | |
| | 338,000 | | | Ford Motor Credit Co. LLC, 7.000%, 10/01/2013 | | | 357,280 | |
| | 5,319,000 | | | Ford Motor Credit Co. LLC, 7.000%, 4/15/2015 | | | 5,957,280 | |
| | 2,370,000 | | | Goodyear Tire & Rubber Co. (The), 7.000%, 3/15/2028 | | | 2,375,925 | |
| | | | | | | | |
| | | | | | | 129,307,354 | |
| | | | | | | | |
| | | | Banking — 12.2% | | | | |
| | 22,547,000 | | | AgriBank FCB, 9.125%, 7/15/2019, 144A | | | 29,922,462 | |
| | 7,200,000 | | | American Express Centurion Bank, Series BKN1, 6.000%, 9/13/2017 | | | 8,733,809 | |
| | 35,878,000 | | | Associates Corp. of North America, 6.950%, 11/01/2018 | | | 43,140,317 | |
| | 3,590,000 | | | Bank of America Corp., 5.420%, 3/15/2017 | | | 3,880,603 | |
| | 9,805,000 | | | Bank of America Corp., 6.000%, 9/01/2017 | | | 11,341,247 | |
| | 11,100,000 | | | Bank of America Corp., MTN, 5.000%, 5/13/2021 | | | 12,200,909 | |
| | 5,000,000 | | | Bank of America Corp., MTN, 6.750%, 9/09/2013, (AUD) | | | 5,309,587 | |
| | 2,393,000 | | | Bank of America Corp., Series L, MTN, 7.625%, 6/01/2019 | | | 2,988,213 | |
| | 17,249,000 | | | Bank of America NA, 5.300%, 3/15/2017 | | | 19,154,049 | |
| | 10,227,000 | | | Barclays Bank PLC, 6.050%, 12/04/2017, 144A | | | 11,004,947 | |
| | 7,110,000,000 | | | Barclays Bank PLC, EMTN, 3.680%, 8/20/2015, (KRW) | | | 6,549,062 | |
| | 337,230,000,000 | | | Barclays Financial LLC, EMTN, 8.250%, 10/27/2014, (IDR) | | | 36,251,344 | |
| | 2,173,000 | | | Bear Stearns Cos., Inc. (The), 4.650%, 7/02/2018 | | | 2,459,882 | |
| | 370,000 | | | BNP Paribas/Australia, 7.000%, 5/24/2016, (AUD) | | | 408,542 | |
| | 8,994,000 | | | Capital One Financial Corp., 6.150%, 9/01/2016 | | | 10,266,669 | |
| | 51,425,000 | | | Citigroup, Inc., 4.450%, 1/10/2017 | | | 56,484,089 | |
| | 6,473,000 | | | Citigroup, Inc., 5.000%, 9/15/2014 | | | 6,827,203 | |
| | 2,700,000 | | | Citigroup, Inc., 5.365%, 3/06/2036, (CAD)(c) | | | 2,360,378 | |
| | 10,000,000 | | | Citigroup, Inc., 5.375%, 8/09/2020 | | | 11,561,180 | |
| | 14,680,000 | | | Citigroup, Inc., 5.500%, 2/15/2017 | | | 16,258,482 | |
| | 460,000 | | | Citigroup, Inc., 5.850%, 12/11/2034 | | | 543,246 | |
| | 2,740,000 | | | Citigroup, Inc., 5.875%, 2/22/2033 | | | 2,893,906 | |
| | 9,875,000 | | | Citigroup, Inc., 6.125%, 5/15/2018 | | | 11,690,193 | |
| | 8,705,000 | | | Citigroup, Inc., 6.125%, 8/25/2036 | | | 9,452,342 | |
| | 44,910,000 | | | Citigroup, Inc., 6.250%, 6/29/2017, (NZD) | | | 38,219,714 | |
| | 21,257,000 | | | Citigroup, Inc., 6.375%, 8/12/2014 | | | 23,132,250 | |
| | 2,398,000 | | | Citigroup, Inc., EMTN, (fixed rate to 11/30/2012, variable rate thereafter),
3.625%, 11/30/2017, (EUR) | | | 2,773,394 | |
| | 63,845,000 | | | Citigroup, Inc., MTN, 5.500%, 10/15/2014 | | | 68,846,553 | |
| | 4,625,000 | | | Cooperatieve Centrale Raiffeisen-Boerenleenbank BA/Utrect,
3.375%, 1/19/2017 | | | 4,909,021 | |
| | 27,045,000 | | | Cooperatieve Centrale Raiffeisen-Boerenleenbank BA/Utrect,
3.875%, 2/08/2022 | | | 28,702,588 | |
| | 1,174,000 | | | Goldman Sachs Group, Inc. (The), 6.450%, 5/01/2036 | | | 1,230,081 | |
| | 112,330,000 | | | Goldman Sachs Group, Inc. (The), 6.750%, 10/01/2037 | | | 120,337,107 | |
| | 6,645,000 | | | Goldman Sachs Group, Inc. (The), GMTN, 5.375%, 3/15/2020 | | | 7,415,594 | |
| | 1,527,000 | | | HBOS PLC, 6.000%, 11/01/2033, 144A | | | 1,295,888 | |
| | 1,000,000 | | | HBOS PLC, GMTN, 6.750%, 5/21/2018, 144A | | | 1,015,000 | |
| | 700,000 | | | ICICI Bank Ltd., (fixed rate to 4/30/2017, variable rate thereafter),
6.375%, 4/30/2022, 144A | | | 700,000 | |
See accompanying notes to financial statements.
15 |
Portfolio of Investments – as of September 30, 2012
Loomis Sayles Investment Grade Bond Fund – (continued)
| | | | | | | | |
Principal
Amount (‡) | | | Description | | Value (†) | |
| | | | Banking — continued | | | | |
| | 2,950,000 | | | JPMorgan Chase & Co., EMTN, 1.074%, 5/30/2017, (GBP)(b) | | $ | 4,330,165 | |
| | 12,000,000,000 | | | JPMorgan Chase & Co., EMTN, 7.070%, 3/22/2014, (IDR) | | | 1,245,893 | |
| | 16,000,000,000 | | | JPMorgan Chase Bank NA, 7.700%, 6/01/2016, 144A, (IDR) | | | 1,756,823 | |
| | 100,000 | | | Keybank NA, 6.950%, 2/01/2028 | | | 122,936 | |
| | 9,787,000 | | | Lloyds TSB Bank PLC, EMTN, 4.570%, 10/13/2015, (CAD) | | | 10,338,321 | |
| | 81,622,000 | | | Lloyds TSB Bank PLC, MTN, 6.500%, 9/14/2020, 144A | | | 85,980,615 | |
| | 6,479,000 | | | Merrill Lynch & Co., Inc., 5.700%, 5/02/2017 | | | 7,088,130 | |
| | 4,300,000 | | | Merrill Lynch & Co., Inc., 6.050%, 5/16/2016 | | | 4,698,287 | |
| | 103,309,000 | | | Merrill Lynch & Co., Inc., 6.110%, 1/29/2037 | | | 109,597,315 | |
| | 9,780,000 | | | Merrill Lynch & Co., Inc., 10.710%, 3/08/2017, (BRL) | | | 5,294,636 | |
| | 3,132,000 | | | Merrill Lynch & Co., Inc., EMTN, 4.625%, 9/14/2018, (EUR) | | | 4,004,652 | |
| | 11,641,000 | | | Merrill Lynch & Co., Inc., MTN, 6.875%, 4/25/2018 | | | 13,947,245 | |
| | 40,126,000 | | | Merrill Lynch & Co., Inc., Series C, MTN, 6.050%, 6/01/2034 | | | 41,370,588 | |
| | 2,652,000 | | | Merrill Lynch & Co., Inc., Series C, MTN, 6.400%, 8/28/2017 | | | 3,085,239 | |
| | 1,500,000 | | | Morgan Stanley, 0.935%, 10/15/2015(b) | | | 1,429,236 | |
| | 4,250,000 | | | Morgan Stanley, 3.450%, 11/02/2015 | | | 4,355,204 | |
| | 14,023,000 | | | Morgan Stanley, 3.800%, 4/29/2016 | | | 14,490,527 | |
| | 110,093,000 | | | Morgan Stanley, 5.500%, 7/24/2020 | | | 118,868,073 | |
| | 5,900,000 | | | Morgan Stanley, 5.750%, 1/25/2021 | | | 6,476,141 | |
| | 151,076,000 | | | Morgan Stanley, 7.600%, 8/08/2017, (NZD) | | | 130,264,053 | |
| | 60,800,000 | | | Morgan Stanley, 8.000%, 5/09/2017, (AUD) | | | 68,196,283 | |
| | 550,000 | | | Morgan Stanley, EMTN, 5.750%, 2/14/2017, (GBP) | | | 948,125 | |
| | 5,400,000 | | | Morgan Stanley, GMTN, 5.500%, 1/26/2020 | | | 5,877,851 | |
| | 24,100,000 | | | Morgan Stanley, GMTN, 7.625%, 3/03/2016, (AUD) | | | 26,482,474 | |
| | 3,800,000 | | | Morgan Stanley, MTN, 7.250%, 5/26/2015, (AUD) | | | 4,103,116 | |
| | 38,206,000 | | | Morgan Stanley, Series F, GMTN, 5.625%, 9/23/2019 | | | 41,739,253 | |
| | 5,187,000 | | | Morgan Stanley, Series F, GMTN, 6.625%, 4/01/2018 | | | 5,959,552 | |
| | 9,400,000 | | | Morgan Stanley, Series F, MTN, 0.905%, 10/18/2016(b) | | | 8,736,069 | |
| | 9,699,000 | | | Morgan Stanley, Series F, MTN, 5.950%, 12/28/2017 | | | 10,894,363 | |
| | 2,239,000 | | | Morgan Stanley, Series G & H, GMTN, 5.125%, 11/30/2015, (GBP) | | | 3,804,176 | |
| | 2,875,000 | | | National City Bank of Indiana, 4.250%, 7/01/2018 | | | 3,209,144 | |
| | 8,638,000 | | | National City Corp., 6.875%, 5/15/2019 | | | 10,663,836 | |
| | 5,250,000 | | | Royal Bank of Scotland PLC (The), EMTN, 4.350%, 1/23/2017, (EUR) | | | 6,412,127 | |
| | 6,150,000 | | | Royal Bank of Scotland PLC (The), EMTN, 6.934%, 4/09/2018, (EUR) | | | 8,042,063 | |
| | 1,650,000 | | | Royal Bank of Scotland PLC (The), EMTN, (fixed rate to 9/22/2016, variable rate thereafter), 4.625%, 9/22/2021, (EUR) | | | 1,836,738 | |
| | 700,000 | | | Santander Financial Issuances Ltd., 7.250%, 11/01/2015 | | | 717,850 | |
| | 16,175,000 | | | Santander Holdings USA, Inc., 4.625%, 4/19/2016 | | | 16,945,205 | |
| | 1,000,000 | | | Santander International Debt SAU, EMTN, 4.000%, 3/27/2017, (EUR) | | | 1,234,689 | |
| | 1,800,000 | | | Santander Issuances SAU, 5.911%, 6/20/2016, 144A | | | 1,773,000 | |
| | 1,400,000 | | | Santander Issuances SAU, (fixed rate to 8/11/2014, variable rate thereafter), 6.500%, 8/11/2019, 144A | | | 1,369,185 | |
| | 30,886,000 | | | Societe Generale S.A., MTN, 5.200%, 4/15/2021, 144A | | | 33,143,767 | |
| | 3,300,000 | | | Standard Chartered Bank, 6.400%, 9/26/2017, 144A | | | 3,759,591 | |
| | 17,861,000 | | | Standard Chartered PLC, 5.500%, 11/18/2014, 144A | | | 19,279,163 | |
| | | | | | | | |
| | | | | | | 1,474,131,550 | |
| | | | | | | | |
See accompanying notes to financial statements.
| 16
Portfolio of Investments – as of September 30, 2012
Loomis Sayles Investment Grade Bond Fund – (continued)
| | | | | | | | |
Principal
Amount (‡) | | | Description | | Value (†) | |
| | | | Brokerage — 1.1% | | | | |
| $ | 55,355,000 | | | Cantor Fitzgerald LP, 6.375%, 6/26/2015, 144A | | $ | 56,200,492 | |
| | 15,245,000 | | | Cantor Fitzgerald LP, 7.875%, 10/15/2019, 144A(c) | | | 15,745,006 | |
| | 17,258,000 | | | Jefferies Group, Inc., 6.250%, 1/15/2036 | | | 17,085,420 | |
| | 8,760,000 | | | Jefferies Group, Inc., 6.450%, 6/08/2027 | | | 8,979,000 | |
| | 1,693,000 | | | Jefferies Group, Inc., 6.875%, 4/15/2021 | | | 1,822,091 | |
| | 28,310,000 | | | Jefferies Group, Inc., 8.500%, 7/15/2019 | | | 32,485,725 | |
| | | | | | | | |
| | | | | | | 132,317,734 | |
| | | | | | | | |
| | | | Building Materials — 1.2% | | | | |
| | 6,640,000 | | | Masco Corp., 4.800%, 6/15/2015 | | | 6,993,753 | |
| | 10,942,000 | | | Masco Corp., 5.850%, 3/15/2017 | | | 11,879,215 | |
| | 6,616,000 | | | Masco Corp., 6.125%, 10/03/2016 | | | 7,281,841 | |
| | 4,808,000 | | | Masco Corp., 6.500%, 8/15/2032 | | | 4,978,838 | |
| | 28,539,000 | | | Masco Corp., 7.125%, 3/15/2020 | | | 32,486,400 | |
| | 5,725,000 | | | Masco Corp., 7.750%, 8/01/2029 | | | 6,048,004 | |
| | 24,394,000 | | | Owens Corning, Inc., 6.500%, 12/01/2016 | | | 27,392,413 | |
| | 41,379,000 | | | Owens Corning, Inc., 7.000%, 12/01/2036 | | | 45,403,894 | |
| | 1,037,000 | | | USG Corp., 6.300%, 11/15/2016 | | | 1,047,370 | |
| | | | | | | | |
| | | | | | | 143,511,728 | |
| | | | | | | | |
| | | | Chemicals — 0.1% | | | | |
| | 3,469,000 | | | Cytec Industries, Inc., 6.000%, 10/01/2015 | | | 3,790,111 | |
| | 1,700,000 | | | Methanex Corp., 5.250%, 3/01/2022 | | | 1,816,113 | |
| | 2,349,000 | | | Methanex Corp., Senior Note, 6.000%, 8/15/2015 | | | 2,503,278 | |
| | | | | | | | |
| | | | | | | 8,109,502 | |
| | | | | | | | |
| | | | Commercial Mortgage-Backed Securities — 3.0% | | | | |
| | 2,477,877 | | | Bear Stearns Commercial Mortgage Securities, Series 2007-PW15, Class A4, 5.331%, 2/11/2044 | | | 2,713,744 | |
| | 33,167,701 | | | Citigroup/Deutsche Bank Commercial Mortgage Trust, Series 2007-CD4, Class A4, 5.322%, 12/11/2049 | | | 37,765,540 | |
| | 12,000,000 | | | Credit Suisse Mortgage Capital Certificates, Series 2007-C2, Class A3,
5.542%, 1/15/2049 | | | 13,451,088 | |
| | 62,292,812 | | | Credit Suisse Mortgage Capital Certificates, Series 2007-C3, Class A4,
5.866%, 6/15/2039(b) | | | 70,401,779 | |
| | 34,381,273 | | | Credit Suisse Mortgage Capital Certificates, Series 2007-C4, Class A4,
5.955%, 9/15/2039(b) | | | 38,128,110 | |
| | 6,711,090 | | | Credit Suisse Mortgage Capital Certificates, Series 2007-C5, Class A4,
5.695%, 9/15/2040 | | | 7,622,241 | |
| | 57,694,000 | | | Crown Castle Towers LLC, 6.113%, 1/15/2040, 144A | | | 69,485,730 | |
| | 23,544,272 | | | Greenwich Capital Commercial Funding Corp., Series 2007-GG11, Class A4, 5.736%, 12/10/2049 | | | 27,463,357 | |
| | 15,789,051 | | | JPMorgan Chase Commercial Mortgage Securities Corp., Series 2006-LDP6, Class A4, 5.475%, 4/15/2043 | | | 17,902,273 | |
| | 15,928,923 | | | JPMorgan Chase Commercial Mortgage Securities Corp., Series 2007-LD11, Class A4, 6.003%, 6/15/2049(b) | | | 18,437,346 | |
| | 21,524,263 | | | JPMorgan Chase Commercial Mortgage Securities Corp., Series 2007-LDPX, Class A3, 5.420%, 1/15/2049 | | | 24,764,633 | |
See accompanying notes to financial statements.
17 |
Portfolio of Investments – as of September 30, 2012
Loomis Sayles Investment Grade Bond Fund – (continued)
| | | | | | | | |
Principal
Amount (‡) | | | Description | | Value (†) | |
| | | | Commercial Mortgage-Backed Securities — continued | | | | |
| $ | 3,131,798 | | | LB-UBS Commercial Mortgage Trust, Series 2006-C4, Class A4,
6.064%, 6/15/2038(b) | | $ | 3,619,053 | |
| | 1,311,441 | | | Merrill Lynch/Countrywide Commercial Mortgage Trust, Series 2007-6, Class A4, 5.485%, 3/12/2051 | | | 1,490,332 | |
| | 9,786,870 | | | Morgan Stanley Re-REMIC Trust, Series 2009-GG10, Class A4B,
5.983%, 8/12/2045, 144A(b) | | | 10,596,411 | |
| | 6,851,000 | | | Vornado DP LLC, Series 2010-VNO, Class D, 6.356%, 9/13/2028, 144A | | | 7,899,326 | |
| | 3,621,142 | | | Wachovia Bank Commercial Mortgage Trust, Series 2006-C29, Class A4,
5.308%, 11/15/2048 | | | 4,187,507 | |
| | 6,222,000 | | | Wachovia Bank Commercial Mortgage Trust, Series 2007-C30, Class A5,
5.342%, 12/15/2043 | | | 7,042,713 | |
| | 4,250,000 | | | WF-RBS Commercial Mortgage Trust, Series 2011-C3, Class D,
5.722%, 3/15/2044, 144A(b) | | | 4,103,333 | |
| | | | | | | | |
| | | | | | | 367,074,516 | |
| | | | | | | | |
| | | | Construction Machinery — 0.3% | | | | |
| | 23,638,000 | | | Case New Holland, Inc., 7.750%, 9/01/2013 | | | 24,731,257 | |
| | 6,787,000 | | | Toro Co., 6.625%, 5/01/2037(c) | | | 7,222,902 | |
| | 400,000 | | | United Rentals North America, Inc., 8.375%, 9/15/2020 | | | 428,000 | |
| | | | | | | | |
| | | | | | | 32,382,159 | |
| | | | | | | | |
| | | | Consumer Cyclical Services — 0.0% | | | | |
| | 196,000 | | | Western Union Co. (The), 6.200%, 6/21/2040 | | | 232,180 | |
| | | | | | | | |
| | | | Consumer Products — 0.2% | | | | |
| | 7,458,000 | | | Hasbro, Inc., 6.600%, 7/15/2028 | | | 8,471,587 | |
| | 11,754,000 | | | Snap-on, Inc., 6.700%, 3/01/2019 | | | 14,221,823 | |
| | | | | | | | |
| | | | | | | 22,693,410 | |
| | | | | | | | |
| | | | Distributors — 0.1% | | | | |
| | 5,740,000 | | | ONEOK, Inc., 6.000%, 6/15/2035 | | | 6,277,574 | |
| | | | | | | | |
| | | | Diversified Manufacturing — 0.4% | | | | |
| | 1,395,000 | | | Ingersoll-Rand Global Holding Co. Ltd., 6.875%, 8/15/2018 | | | 1,725,025 | |
| | 2,814,000 | | | Textron Financial Corp., 5.400%, 4/28/2013 | | | 2,886,725 | |
| | 1,181,000 | | | Textron Financial Corp., Series E, MTN, 5.125%, 8/15/2014 | | | 1,241,808 | |
| | 18,800,000 | | | Textron, Inc., 3.875%, 3/11/2013, (EUR) | | | 24,277,314 | |
| | 11,040,000 | | | Textron, Inc., EMTN, 6.625%, 4/07/2020, (GBP) | | | 20,369,748 | |
| | | | | | | | |
| | | | | | | 50,500,620 | |
| | | | | | | | |
| | | | Electric — 2.0% | | | | |
| | 34,609,764 | | | Alta Wind Holdings LLC, 7.000%, 6/30/2035, 144A | | | 38,347,965 | |
| | 14,055,000 | | | AmerenEnergy Generating Co., Series H, 7.000%, 4/15/2018 | | | 13,633,350 | |
| | 10,973,249 | | | Bruce Mansfield Unit, 6.850%, 6/01/2034 | | | 11,669,721 | |
| | 17,435,000 | | | Cleveland Electric Illuminating Co. (The), 5.700%, 4/01/2017 | | | 19,704,165 | |
| | 1,477,000 | | | Cleveland Electric Illuminating Co. (The), 5.950%, 12/15/2036 | | | 1,714,719 | |
| | 876,000 | | | Commonwealth Edison Co., 4.700%, 4/15/2015 | | | 955,539 | |
| | 12,185,000 | | | EDP Finance BV, 4.900%, 10/01/2019, 144A | | | 11,332,050 | |
| | 3,300,000 | | | EDP Finance BV, 6.000%, 2/02/2018, 144A | | | 3,294,126 | |
| | 1,000,000 | | | EDP Finance BV, EMTN, 4.625%, 6/13/2016, (EUR) | | | 1,236,860 | |
See accompanying notes to financial statements.
| 18
Portfolio of Investments – as of September 30, 2012
Loomis Sayles Investment Grade Bond Fund – (continued)
| | | | | | | | |
Principal
Amount (‡) | | | Description | | Value (†) | |
| | | | Electric — continued | | | | |
| | 900,000 | | | EDP Finance BV, EMTN, 5.875%, 2/01/2016, (EUR) | | $ | 1,153,084 | |
| | 979,000 | | | Empresa Nacional de Electricidad S.A. (Endesa-Chile), 8.350%, 8/01/2013 | | | 1,033,594 | |
| | 4,491,000 | | | Endesa S.A./Cayman Islands, 7.875%, 2/01/2027 | | | 5,545,047 | |
| | 50,103,000 | | | Enel Finance International NV, 6.000%, 10/07/2039, 144A | | | 45,053,018 | |
| | 9,007,000 | | | Enel Finance International NV, 6.800%, 9/15/2037, 144A | | | 8,727,414 | |
| | 3,603,000 | | | Exelon Corp., 4.900%, 6/15/2015 | | | 3,960,313 | |
| | 3,600,000 | | | Iberdrola Finance Ireland Ltd., 3.800%, 9/11/2014, 144A | | | 3,664,836 | |
| | 1,864,000 | | | ITC Holdings Corp., 5.875%, 9/30/2016, 144A | | | 2,142,720 | |
| | 7,716,813 | | | Mackinaw Power LLC, 6.296%, 10/31/2023, 144A(c) | | | 8,009,435 | |
| | 50,026,000 | | | Southwestern Electric Power Co., 6.450%, 1/15/2019 | | | 61,326,974 | |
| | 2,850,000 | | | Texas Competitive Electric Holdings Co. LLC/TCEH Finance, Inc.,
11.500%, 10/01/2020, 144A | | | 2,230,125 | |
| | 1,075,000 | | | White Pine Hydro LLC, 6.310%, 7/10/2017(c)(d) | | | 849,250 | |
| | 1,600,000 | | | White Pine Hydro LLC, 6.960%, 7/10/2037(c)(d) | | | 1,040,000 | |
| | | | | | | | |
| | | | | | | 246,624,305 | |
| | | | | | | | |
| | | | Entertainment — 0.0% | | | | |
| | 3,616,000 | | | Viacom, Inc., 6.125%, 10/05/2017 | | | 4,343,734 | |
| | | | | | | | |
| | | | Financial Other — 0.8% | | | | |
| | 65,015,000 | | | Aviation Capital Group Corp., 6.750%, 4/06/2021, 144A | | | 66,276,291 | |
| | 26,914,000 | | | National Life Insurance Co., 10.500%, 9/15/2039, 144A | | | 35,938,076 | |
| | | | | | | | |
| | | | | | | 102,214,367 | |
| | | | | | | | |
| | | | Food & Beverage — 0.0% | | | | |
| | 2,450,000 | | | Cargill, Inc., EMTN, 5.375%, 3/02/2037, (GBP) | | | 4,660,813 | |
| | | | | | | | |
| | | | Government Guaranteed — 0.6% | | | | |
| | 12,910,000 | | | Instituto de Credito Oficial, EMTN, 4.530%, 3/17/2016, (CAD) | | | 11,959,511 | |
| | 13,005,000 | | | Instituto de Credito Oficial, MTN, 5.500%, 10/11/2012, (AUD) | | | 13,482,900 | |
| | 11,311,000 | | | Instituto de Credito Oficial, MTN, 6.125%, 2/27/2014, (AUD) | | | 11,195,419 | |
| | 31,142,000 | | | Queensland Treasury Corp., 7.125%, 9/18/2017, 144A, (NZD) | | | 29,597,346 | |
| | | | | | | | |
| | | | | | | 66,235,176 | |
| | | | | | | | |
| | | | Government Owned - No Guarantee — 1.3% | | | | |
| | 3,720,000 | | | Abu Dhabi National Energy Co., 6.500%, 10/27/2036, 144A | | | 4,626,750 | |
| | 36,975,000 | | | Abu Dhabi National Energy Co., 7.250%, 8/01/2018, 144A | | | 45,017,063 | |
| | 58,060,000 | | | DP World Ltd., 6.850%, 7/02/2037, 144A | | | 62,559,650 | |
| | 26,030,000,000 | | | Export-Import Bank of Korea, 6.600%, 11/04/2013, 144A, (IDR) | | | 2,718,870 | |
| | 27,800,000,000 | | | Export-Import Bank of Korea, 8.300%, 3/15/2014, 144A, (IDR) | | | 2,963,009 | |
| | 22,478,000 | | | Federal Home Loan Mortgage Corp., 1.625%, 4/15/2013 | | | 22,650,901 | |
| | 15,170,000 | | | Korea Gas Corp., 6.000%, 7/15/2014, 144A | | | 16,388,818 | |
| | 1,000,000 | | | Telekom Malaysia Berhad, 7.875%, 8/01/2025, 144A | | | 1,413,524 | |
| | | | | | | | |
| | | | | | | 158,338,585 | |
| | | | | | | | |
| | | | Government Sponsored — 0.6% | | | | |
| | 66,200,000 | | | Federal Home Loan Bank, 1.875%, 6/21/2013 | | | 67,004,595 | |
| | | | | | | | |
| | | | Health Insurance — 0.0% | | | | |
| | 1,569,000 | | | CIGNA Corp., 7.875%, 5/15/2027 | | | 2,079,994 | |
| | 1,174,000 | | | CIGNA Corp., (Step to 8.080% on 1/15/2023), 8.300%, 1/15/2033(e) | | | 1,490,024 | |
| | | | | | | | |
| | | | | | | 3,570,018 | |
| | | | | | | | |
See accompanying notes to financial statements.
19 |
Portfolio of Investments – as of September 30, 2012
Loomis Sayles Investment Grade Bond Fund – (continued)
| | | | | | | | |
Principal
Amount (‡) | | | Description | | Value (†) | |
| | | | Healthcare — 1.0% | | | | |
| $ | 20,100,000 | | | Aristotle Holding, Inc., 4.750%, 11/15/2021, 144A | | $ | 23,256,625 | |
| | 7,692,000 | | | Boston Scientific Corp., 6.000%, 1/15/2020 | | | 9,143,111 | |
| | 7,374,000 | | | Covidien International Finance S.A., 6.000%, 10/15/2017 | | | 9,064,541 | |
| | 17,416,000 | | | Express Scripts, Inc., 6.250%, 6/15/2014 | | | 18,971,719 | |
| | 9,459,000 | | | Express Scripts, Inc., 7.250%, 6/15/2019 | | | 12,189,444 | |
| | 9,278,000 | | | HCA, Inc., 5.750%, 3/15/2014 | | | 9,741,900 | |
| | 802,000 | | | HCA, Inc., 5.875%, 3/15/2022 | | | 869,168 | |
| | 1,908,000 | | | HCA, Inc., 6.250%, 2/15/2013 | | | 1,934,235 | |
| | 3,729,000 | | | HCA, Inc., 6.375%, 1/15/2015 | | | 4,017,997 | |
| | 3,127,000 | | | HCA, Inc., 6.500%, 2/15/2016 | | | 3,439,700 | |
| | 357,000 | | | HCA, Inc., 6.750%, 7/15/2013 | | | 369,495 | |
| | 2,936,000 | | | HCA, Inc., 7.050%, 12/01/2027 | | | 2,774,520 | |
| | 2,241,000 | | | HCA, Inc., 7.190%, 11/15/2015 | | | 2,453,895 | |
| | 4,119,000 | | | HCA, Inc., 7.500%, 12/15/2023 | | | 4,160,190 | |
| | 1,282,000 | | | HCA, Inc., 7.500%, 11/06/2033 | | | 1,256,360 | |
| | 3,807,000 | | | HCA, Inc., 7.690%, 6/15/2025 | | | 3,864,105 | |
| | 4,164,000 | | | HCA, Inc., 8.360%, 4/15/2024 | | | 4,361,790 | |
| | 1,199,000 | | | HCA, Inc., MTN, 7.580%, 9/15/2025 | | | 1,204,995 | |
| | 3,068,000 | | | HCA, Inc., MTN, 7.750%, 7/15/2036 | | | 3,044,990 | |
| | 2,256,000 | | | Owens & Minor, Inc., 6.350%, 4/15/2016(c) | | | 2,467,119 | |
| | 2,200,000 | | | Tenet Healthcare Corp., 6.875%, 11/15/2031 | | | 1,969,000 | |
| | | | | | | | |
| | | | | | | 120,554,899 | |
| | | | | | | | |
| | | | Home Construction — 0.1% | | | | |
| | 2,006,000 | | | Desarrolladora Homex SAB de CV, 7.500%, 9/28/2015 | | | 2,006,000 | |
| | 2,546,000 | | | Pulte Group, Inc., 5.200%, 2/15/2015 | | | 2,698,760 | |
| | 9,200,000 | | | Pulte Group, Inc., 6.000%, 2/15/2035 | | | 8,326,000 | |
| | 3,567,000 | | | Pulte Group, Inc., 6.375%, 5/15/2033 | | | 3,317,310 | |
| | | | | | | | |
| | | | | | | 16,348,070 | |
| | | | | | | | |
| | | | Independent Energy — 0.9% | | | | |
| | 11,930,000 | | | Anadarko Petroleum Corp., 6.375%, 9/15/2017 | | | 14,383,023 | |
| | 1,065,000 | | | Chesapeake Energy Corp., 6.625%, 8/15/2020 | | | 1,098,281 | |
| | 1,015,000 | | | Chesapeake Energy Corp., 6.875%, 11/15/2020 | | | 1,070,825 | |
| | 9,787,000 | | | EQT Corp., 8.125%, 6/01/2019 | | | 11,848,015 | |
| | 60,038,000 | | | Equitable Resources, Inc., 6.500%, 4/01/2018 | | | 69,092,991 | |
| | 7,240,000 | | | Newfield Exploration Co., 5.625%, 7/01/2024 | | | 8,036,400 | |
| | | | | | | | |
| | | | | | | 105,529,535 | |
| | | | | | | | |
| | | | Industrial Other — 0.0% | | | | |
| | 4,893,000 | | | Worthington Industries, Inc., 6.500%, 4/15/2020 | | | 5,447,392 | |
| | | | | | | | |
| | | | Life Insurance — 1.0% | | | | |
| | 7,100,000 | | | American International Group, Inc., EMTN, 5.000%, 4/26/2023, (GBP) | | | 12,015,353 | |
| | 6,910,000 | | | American International Group, Inc., Series G, MTN, 5.850%, 1/16/2018 | | | 8,015,137 | |
| | 2,036,000 | | | American International Group, Inc., Series MP, MTN, 5.450%, 5/18/2017 | | | 2,321,374 | |
| | 9,777,000 | | | ASIF III Jersey Ltd., Series 2003-G, EMTN, 4.750%, 9/11/2013, (EUR) | | | 12,950,900 | |
| | 600,000 | | | AXA S.A., EMTN, (fixed rate to 10/16/2019, variable rate thereafter),
6.772%, 10/29/2049, (GBP) | | | 789,559 | |
See accompanying notes to financial statements.
| 20
Portfolio of Investments – as of September 30, 2012
Loomis Sayles Investment Grade Bond Fund – (continued)
| | | | | | | | |
Principal
Amount (‡) | | | Description | | Value (†) | |
| | | | Life Insurance — continued | | | | |
| | 5,900,000 | | | AXA S.A., EMTN, (fixed rate to 4/16/2020, variable rate thereafter),
5.250%, 4/16/2040, (EUR) | | $ | 6,941,283 | |
| | 15,000,000 | | | Forethought Financial Group, Inc., 8.625%, 4/15/2021, 144A | | | 16,050,000 | |
| | 10,971,000 | | | MetLife, Inc., 6.400%, 12/15/2066 | | | 11,509,468 | |
| | 9,063,000 | | | Mutual of Omaha Insurance Co., 6.800%, 6/15/2036, 144A | | | 10,793,535 | |
| | 6,440,000 | | | NLV Financial Corp., 7.500%, 8/15/2033, 144A | | | 6,634,881 | |
| | 2,872,000 | | | Penn Mutual Life Insurance Co. (The), 6.650%, 6/15/2034, 144A | | | 3,253,626 | |
| | 14,489,000 | | | Penn Mutual Life Insurance Co. (The), 7.625%, 6/15/2040, 144A | | | 18,626,276 | |
| | 4,732,000 | | | Unum Group, 7.125%, 9/30/2016 | | | 5,507,234 | |
| | | | | | | | |
| | | | | | | 115,408,626 | |
| | | | | | | | |
| | | | Local Authorities — 2.2% | | | | |
| | 7,448,000 | | | Manitoba (Province of), GMTN, 6.375%, 9/01/2015, (NZD) | | | 6,649,301 | |
| | 99,450,000 | | | New South Wales Treasury Corp., 5.500%, 8/01/2013, (AUD) | | | 105,402,613 | |
| | 68,930,000 | | | New South Wales Treasury Corp., 6.000%, 2/01/2018, (AUD) | | | 80,830,644 | |
| | 17,930,000 | | | New South Wales Treasury Corp., Series 17RG, 5.500%, 3/01/2017, (AUD) | | | 20,462,747 | |
| | 15,314 | | | Province of Alberta, 5.930%, 9/16/2016, (CAD) | | | 17,288 | |
| | 489,000 | | | Province of Nova Scotia, 6.600%, 6/01/2027, (CAD) | | | 699,363 | |
| | 29,791,000 | | | Province of Quebec, Canada, Series QC, 6.750%, 11/09/2015, (NZD) | | | 26,939,932 | |
| | 26,518,000 | | | Queensland Treasury Corp., Series 14, 5.750%, 11/21/2014, (AUD) | | | 29,075,998 | |
| | | | | | | | |
| | | | | | | 270,077,886 | |
| | | | | | | | |
| | | | Lodging — 0.7% | | | | |
| | 52,516,000 | | | Choice Hotels International, Inc., 5.700%, 8/28/2020 | | | 56,719,066 | |
| | 4,522,000 | | | Wyndham Worldwide Corp., 5.750%, 2/01/2018 | | | 5,091,460 | |
| | 100,000 | | | Wyndham Worldwide Corp., 6.000%, 12/01/2016 | | | 112,641 | |
| | 23,518,000 | | | Wyndham Worldwide Corp., 7.375%, 3/01/2020 | | | 28,334,792 | |
| | | | | | | | |
| | | | | | | 90,257,959 | |
| | | | | | | | |
| | | | Media Cable — 1.0% | | | | |
| | 17,832,000 | | | Shaw Communications, Inc., 5.650%, 10/01/2019, (CAD) | | | 20,430,527 | |
| | 4,101,000 | | | Time Warner Cable, Inc., 5.850%, 5/01/2017 | | | 4,884,931 | |
| | 78,178,000 | | | Time Warner Cable, Inc., 6.750%, 7/01/2018 | | | 98,319,233 | |
| | | | | | | | |
| | | | | | | 123,634,691 | |
| | | | | | | | |
| | | | Media Non-Cable — 0.3% | | | | |
| | 5,000,000 | | | Clear Channel Communications, Inc., 9.000%, 3/01/2021 | | | 4,450,000 | |
| | 7,536,000 | | | News America, Inc., 6.150%, 3/01/2037 | | | 9,030,916 | |
| | 4,482,000 | | | News America, Inc., 8.150%, 10/17/2036 | | | 6,148,457 | |
| | 5,000,000 | | | R.R. Donnelley & Sons Co., 7.250%, 5/15/2018 | | | 4,962,500 | |
| | 10,870,000 | | | R.R. Donnelley & Sons Co., 8.250%, 3/15/2019 | | | 11,033,050 | |
| | | | | | | | |
| | | | | | | 35,624,923 | |
| | | | | | | | |
| | | | Metals & Mining — 1.7% | | | | |
| | 15,060,000 | | | Alcoa, Inc., 5.870%, 2/23/2022 | | | 16,198,431 | |
| | 26,000,000 | | | Alcoa, Inc., 5.900%, 2/01/2027 | | | 27,185,184 | |
| | 5,505,000 | | | Alcoa, Inc., 5.950%, 2/01/2037 | | | 5,507,274 | |
| | 28,838,000 | | | Alcoa, Inc., 6.150%, 8/15/2020 | | | 31,824,665 | |
| | 5,804,000 | | | Alcoa, Inc., 6.750%, 1/15/2028 | | | 6,440,983 | |
See accompanying notes to financial statements.
21 |
Portfolio of Investments – as of September 30, 2012
Loomis Sayles Investment Grade Bond Fund – (continued)
| | | | | | | | |
Principal
Amount (‡) | | | Description | | Value (†) | |
| | | | Metals & Mining — continued | | | | |
| $ | 430,000 | | | ArcelorMittal, 5.750%, 3/01/2021 | | $ | 409,674 | |
| | 7,080,000 | | | ArcelorMittal, 6.125%, 6/01/2018 | | | 7,033,626 | |
| | 3,890,000 | | | ArcelorMittal, 6.500%, 2/25/2022 | | | 3,831,541 | |
| | 47,920,000 | | | ArcelorMittal, 7.000%, 3/01/2041 | | | 43,079,936 | |
| | 19,365,000 | | | ArcelorMittal, 7.250%, 10/15/2039 | | | 17,714,928 | |
| | 4,500,000 | | | Essar Steel Algoma, Inc., 9.875%, 6/15/2015, 144A | | | 3,566,250 | |
| | 1,943,000 | | | United States Steel Corp., 6.050%, 6/01/2017 | | | 1,928,427 | |
| | 4,612,000 | | | United States Steel Corp., 6.650%, 6/01/2037 | | | 3,874,080 | |
| | 31,210,000 | | | United States Steel Corp., 7.000%, 2/01/2018 | | | 31,288,025 | |
| | 3,655,000 | | | Vale Overseas Ltd., 6.875%, 11/21/2036 | | | 4,232,044 | |
| | | | | | | | |
| | | | | | | 204,115,068 | |
| | | | | | | | |
| | | | Mortgage Related — 0.0% | | | | |
| | 71,563 | | | FHLMC, 5.000%, 12/01/2031 | | | 77,815 | |
| | 11,070 | | | FNMA, 6.000%, 7/01/2029 | | | 12,501 | |
| | | | | | | | |
| | | | | | | 90,316 | |
| | | | | | | | |
| | | | Non-Captive Consumer — 1.5% | | | | |
| | 62,425(††) | | | SLM Corp., 6.000%, 12/15/2043 | | | 1,482,022 | |
| | 6,342,000 | | | SLM Corp., MTN, 5.050%, 11/14/2014 | | | 6,694,051 | |
| | 8,895,000 | | | SLM Corp., MTN, 7.250%, 1/25/2022 | | | 9,962,400 | |
| | 641,000 | | | SLM Corp., MTN, 8.000%, 3/25/2020 | | | 740,355 | |
| | 5,616,000 | | | SLM Corp., Series A, MTN, 0.751%, 1/27/2014(b) | | | 5,453,827 | |
| | 9,224,000 | | | SLM Corp., Series A, MTN, 5.000%, 10/01/2013 | | | 9,558,370 | |
| | 6,547,000 | | | SLM Corp., Series A, MTN, 5.000%, 4/15/2015 | | | 6,915,537 | |
| | 1,957,000 | | | SLM Corp., Series A, MTN, 5.000%, 6/15/2018 | | | 1,960,061 | |
| | 6,141,000 | | | SLM Corp., Series A, MTN, 5.375%, 1/15/2013 | | | 6,218,819 | |
| | 4,548,000 | | | SLM Corp., Series A, MTN, 5.375%, 5/15/2014 | | | 4,790,281 | |
| | 19,496,000 | | | SLM Corp., Series A, MTN, 5.625%, 8/01/2033 | | | 18,404,224 | |
| | 30,667,000 | | | SLM Corp., Series A, MTN, 8.450%, 6/15/2018 | | | 35,917,711 | |
| | 4,893,000 | | | Springleaf Finance Corp., Series I, MTN, 5.400%, 12/01/2015 | | | 4,394,501 | |
| | 87,676,000 | | | Springleaf Finance Corp., Series J, MTN, 6.900%, 12/15/2017 | | | 74,524,600 | |
| | | | | | | | |
| | | | | | | 187,016,759 | |
| | | | | | | | |
| | | | Non-Captive Diversified — 2.9% | | | | |
| | 1,634,000 | | | Ally Financial, Inc., 6.750%, 12/01/2014 | | | 1,744,718 | |
| | 3,075,000 | | | Ally Financial, Inc., 7.500%, 12/31/2013 | | | 3,244,125 | |
| | 5,543,000 | | | Ally Financial, Inc., 8.000%, 12/31/2018 | | | 6,235,875 | |
| | 2,285,000 | | | Ally Financial, Inc., 8.000%, 11/01/2031 | | | 2,631,554 | |
| | 15,688,000 | | | GATX Corp., 4.750%, 10/01/2012 | | | 15,688,000 | |
| | 3,500,000 | | | General Electric Capital Australia Funding Pty Ltd.,
7.000%, 10/08/2015, (AUD) | | | 3,926,699 | |
| | 7,570,000 | | | General Electric Capital Australia Funding Pty Ltd., MTN,
6.000%, 5/15/2013, (AUD) | | | 7,954,742 | |
| | 3,100,000 | | | General Electric Capital Australia Funding Pty Ltd., MTN,
6.000%, 4/15/2015, (AUD) | | | 3,364,080 | |
| | 1,874,000 | | | General Electric Capital Australia Funding Pty Ltd., MTN,
6.000%, 3/15/2019, (AUD) | | | 2,063,470 | |
See accompanying notes to financial statements.
| 22
Portfolio of Investments – as of September 30, 2012
Loomis Sayles Investment Grade Bond Fund – (continued)
| | | | | | | | |
Principal
Amount (‡) | | | Description | | Value (†) | |
| | | | Non-Captive Diversified — continued | | | | |
| $ | 969,000 | | | General Electric Capital Corp., 5.625%, 5/01/2018 | | $ | 1,142,742 | |
| | 51,370,000 | | | General Electric Capital Corp., Series A, EMTN, 5.500%, 2/01/2017, (NZD) | | | 44,574,235 | |
| | 14,225,000 | | | General Electric Capital Corp., Series A, EMTN, 6.750%, 9/26/2016, (NZD) | | | 12,804,945 | |
| | 36,850,000 | | | General Electric Capital Corp., Series A, GMTN, 7.625%, 12/10/2014, (NZD) | | | 32,808,657 | |
| | 10,247,000 | | | General Electric Capital Corp., Series A, MTN, 0.755%, 5/13/2024(b) | | | 8,788,862 | |
| | 16,696,000 | | | General Electric Capital Corp., Series A, MTN, 4.875%, 3/04/2015 | | | 18,222,599 | |
| | 26,931,000 | | | General Electric Capital Corp., Series A, MTN, 6.500%, 9/28/2015, (NZD) | | | 23,676,216 | |
| | 548,000 | | | International Lease Finance Corp., 5.750%, 5/15/2016 | | | 581,013 | |
| | 22,425,000 | | | International Lease Finance Corp., 5.875%, 4/01/2019 | | | 23,776,914 | |
| | 38,780,000 | | | International Lease Finance Corp., 6.250%, 5/15/2019 | | | 41,688,500 | |
| | 13,899,000 | | | International Lease Finance Corp., 6.375%, 3/25/2013 | | | 14,176,980 | |
| | 60,419,000 | | | International Lease Finance Corp., 7.125%, 9/01/2018, 144A | | | 70,388,135 | |
| | 1,473,000 | | | International Lease Finance Corp., Series R, MTN, 5.625%, 9/20/2013 | | | 1,519,031 | |
| | 1,625,000 | | | International Lease Finance Corp., Series R, MTN, 5.650%, 6/01/2014 | | | 1,702,350 | |
| | 3,580,000 | | | iStar Financial, Inc., 8.625%, 6/01/2013 | | | 3,687,400 | |
| | | | | | | | |
| | | | | | | 346,391,842 | |
| | | | | | | | |
| | | | Oil Field Services — 0.5% | | | | |
| | 5,965,000 | | | Nabors Industries, Inc., 6.150%, 2/15/2018 | | | 7,005,386 | |
| | 22,583,000 | | | Nabors Industries, Inc., 9.250%, 1/15/2019 | | | 29,554,824 | |
| | 23,338,000 | | | Rowan Cos., Inc., 7.875%, 8/01/2019 | | | 28,933,822 | |
| | 587,000 | | | Transocean Ltd., 7.375%, 4/15/2018 | | | 701,754 | |
| | | | | | | | |
| | | | | | | 66,195,786 | |
| | | | | | | | |
| | | | Paper — 1.1% | | | | |
| | 4,365,000 | | | Celulosa Arauco y Constitucion S.A., 7.250%, 7/29/2019 | | | 5,239,851 | |
| | 23,225,000 | | | Georgia-Pacific LLC, 5.400%, 11/01/2020, 144A | | | 27,220,281 | |
| | 715,000 | | | Georgia-Pacific LLC, 7.250%, 6/01/2028 | | | 904,795 | |
| | 2,672,000 | | | Georgia-Pacific LLC, 7.375%, 12/01/2025 | | | 3,536,643 | |
| | 644,000 | | | Georgia-Pacific LLC, 7.750%, 11/15/2029 | | | 850,841 | |
| | 1,031,000 | | | Georgia-Pacific LLC, 8.875%, 5/15/2031 | | | 1,525,013 | |
| | 6,161,000 | | | International Paper Co., 5.250%, 4/01/2016 | | | 6,835,321 | |
| | 7,611,000 | | | International Paper Co., 8.700%, 6/15/2038 | | | 11,340,177 | |
| | 5,270,000 | | | Mead Corp. (The), 7.550%, 3/01/2047 | | | 5,633,224 | |
| | 5,764,000 | | | Westvaco Corp., 8.200%, 1/15/2030 | | | 7,682,715 | |
| | 26,007,000 | | | Weyerhaeuser Co., 6.875%, 12/15/2033 | | | 30,210,355 | |
| | 7,374,000 | | | Weyerhaeuser Co., 7.375%, 10/01/2019 | | | 9,150,256 | |
| | 18,254,000 | | | Weyerhaeuser Co., 7.375%, 3/15/2032 | | | 21,660,854 | |
| | | | | | | | |
| | | | | | | 131,790,326 | |
| | | | | | | | |
| | | | Pharmaceuticals — 0.5% | | | | |
| | 56,052,000 | | | Roche Holdings, Inc., 5.000%, 3/01/2014, 144A | | | 59,438,326 | |
| | 489,000 | | | Schering-Plough Corp., 5.300%, 12/01/2013 | | | 516,314 | |
| | | | | | | | |
| | | | | | | 59,954,640 | |
| | | | | | | | |
| | | | Pipelines — 3.3% | | | | |
| | 650,000 | | | DCP Midstream LP, 6.450%, 11/03/2036, 144A | | | 744,588 | |
| | 528,000 | | | Energy Transfer Partners LP, 6.125%, 2/15/2017 | | | 606,411 | |
See accompanying notes to financial statements.
23 |
Portfolio of Investments – as of September 30, 2012
Loomis Sayles Investment Grade Bond Fund – (continued)
| | | | | | | | |
Principal
Amount (‡) | | | Description | | Value (†) | |
| | | | Pipelines — continued | | | | |
| $ | 1,571,000 | | | Energy Transfer Partners LP, 6.625%, 10/15/2036 | | $ | 1,778,642 | |
| | 9,257,000 | | | Enterprise Products Operating LLC, 4.050%, 2/15/2022 | | | 10,118,892 | |
| | 3,328,000 | | | Florida Gas Transmission Co., 7.900%, 5/15/2019, 144A | | | 4,286,730 | |
| | 14,300,000 | | | IFM US Colonial Pipeline 2 LLC, 6.450%, 5/01/2021, 144A | | | 15,956,269 | |
| | 17,765,000 | | | Kinder Morgan Energy Partners LP, 5.300%, 9/15/2020 | | | 20,708,092 | |
| | 63,075,000 | | | Kinder Morgan Energy Partners LP, 5.950%, 2/15/2018 | | | 75,934,037 | |
| | 303,000 | | | Kinder Morgan Finance Co. LLC, 5.700%, 1/05/2016 | | | 327,084 | |
| | 28,438,200 | | | Maritimes & Northeast Pipeline LLC, 7.500%, 5/31/2014, 144A(c) | | | 30,243,173 | |
| | 30,760,000 | | | NGPL PipeCo LLC, 7.119%, 12/15/2017, 144A | | | 32,682,500 | |
| | 635,000 | | | NGPL PipeCo LLC, 7.768%, 12/15/2037, 144A | | | 635,000 | |
| | 4,950,000 | | | NGPL PipeCo LLC, 9.625%, 6/01/2019, 144A | | | 5,643,000 | |
| | 13,790,000 | | | NiSource Finance Corp., 6.125%, 3/01/2022 | | | 16,935,416 | |
| | 24,110,000 | | | NiSource Finance Corp., 6.400%, 3/15/2018 | | | 29,488,965 | |
| | 21,614,000 | | | NiSource Finance Corp., 6.800%, 1/15/2019 | | | 26,095,922 | |
| | 9,899,000 | | | Panhandle Eastern Pipeline Co., 6.200%, 11/01/2017 | | | 11,837,590 | |
| | 47,594,000 | | | Panhandle Eastern Pipeline Co., 7.000%, 6/15/2018 | | | 59,155,582 | |
| | 1,404,000 | | | Panhandle Eastern Pipeline Co., 8.125%, 6/01/2019 | | | 1,750,134 | |
| | 2,085,000 | | | Plains All American Pipeline LP, 6.125%, 1/15/2017 | | | 2,487,190 | |
| | 15,683,000 | | | Plains All American Pipeline LP, 6.500%, 5/01/2018 | | | 19,378,777 | |
| | 4,125,000 | | | Southern Natural Gas Co., 5.900%, 4/01/2017, 144A | | | 4,839,966 | |
| | 19,574,000 | | | Texas Eastern Transmission LP, 6.000%, 9/15/2017, 144A | | | 22,723,457 | |
| | | | | | | | |
| | | | | | | 394,357,417 | |
| | | | | | | | |
| | | | Property & Casualty Insurance — 0.8% | | | | |
| | 2,740,000 | | | Fidelity National Financial, Inc., 5.500%, 9/01/2022 | | | 2,937,302 | |
| | 3,083,000 | | | Hanover Insurance Group, Inc. (The), 7.500%, 3/01/2020 | | | 3,601,613 | |
| | 9,038,000 | | | Liberty Mutual Group, Inc., 6.500%, 3/15/2035, 144A | | | 9,665,391 | |
| | 30,054,000 | | | Marsh & McLennan Cos., Inc., 5.875%, 8/01/2033 | | | 35,437,783 | |
| | 944,000 | | | MBIA Insurance Corp., (fixed rate to 1/15/2013, variable rate thereafter),
14.000%, 1/15/2033, 144A | | | 481,440 | |
| | 14,575,000 | | | Nationwide Mutual Insurance Co., 6.600%, 4/15/2034, 144A | | | 14,623,608 | |
| | 7,609,000 | | | White Mountains Re Group Ltd., 6.375%, 3/20/2017, 144A | | | 8,050,185 | |
| | 13,521,000 | | | Willis North America, Inc., 7.000%, 9/29/2019 | | | 16,075,279 | |
| | 2,212,000 | | | XL Group PLC, 6.250%, 5/15/2027 | | | 2,511,733 | |
| | 1,463,000 | | | XL Group PLC, 6.375%, 11/15/2024 | | | 1,738,573 | |
| | | | | | | | |
| | | | | | | 95,122,907 | |
| | | | | | | | |
| | | | Property Trust — 0.4% | | | | |
| | 36,192,000 | | | WEA Finance LLC/WT Finance Australia Property Ltd.,
6.750%, 9/02/2019, 144A | | | 43,885,695 | |
| | | | | | | | |
| | | | Railroads — 0.1% | | | | |
| | 9,787,000 | | | Canadian Pacific Railway Co., 7.250%, 5/15/2019 | | | 12,241,315 | |
| | 237,000 | | | Missouri Pacific Railroad Co., 4.750%, 1/01/2030(c) | | | 229,890 | |
| | 1,701,000 | | | Missouri Pacific Railroad Co., 5.000%, 1/01/2045(c) | | | 1,403,325 | |
| | 191,000 | | | Missouri Pacific Railroad Co., Series A, 4.750%, 1/01/2020(c) | | | 191,000 | |
| | | | | | | | |
| | | | | | | 14,065,530 | |
| | | | | | | | |
See accompanying notes to financial statements.
| 24
Portfolio of Investments – as of September 30, 2012
Loomis Sayles Investment Grade Bond Fund – (continued)
| | | | | | | | |
Principal
Amount (‡) | | | Description | | Value (†) | |
| | | | Real Estate Operations/Development — 0.1% | | | | |
| $ | 10,276,000 | | | First Industrial LP, 5.950%, 5/15/2017 | | $ | 10,923,522 | |
| | | | | | | | |
| | | | Refining — 0.1% | | | | |
| | 7,700,000 | | | Reliance Holdings USA, Inc., 5.400%, 2/14/2022, 144A | | | 8,201,932 | |
| | | | | | | | |
| | | | REITs - Apartments — 0.3% | | | | |
| | 12,243,000 | | | Camden Property Trust, 5.000%, 6/15/2015 | | | 13,335,688 | |
| | 16,491,000 | | | Camden Property Trust, 5.700%, 5/15/2017 | | | 18,923,719 | |
| | 988,000 | | | ERP Operating LP, 5.125%, 3/15/2016 | | | 1,112,914 | |
| | 1,762,000 | | | ERP Operating LP, 5.375%, 8/01/2016 | | | 2,021,111 | |
| | 1,508,000 | | | ERP Operating LP, 5.750%, 6/15/2017 | | | 1,794,612 | |
| | | | | | | | |
| | | | | | | 37,188,044 | |
| | | | | | | | |
| | | | REITs - Diversified — 0.2% | | | | |
| | 4,140,000 | | | Duke Realty LP, 5.950%, 2/15/2017 | | | 4,688,376 | |
| | 19,574,000 | | | Duke Realty LP, 6.500%, 1/15/2018 | | | 22,728,996 | |
| | | | | | | | |
| | | | | | | 27,417,372 | |
| | | | | | | | |
| | | | REITs - Healthcare — 0.1% | | | | |
| | 5,972,000 | | | Health Care REIT, Inc., 6.500%, 3/15/2041 | | | 6,983,304 | |
| | | | | | | | |
| | | | REITs - Office Property — 0.3% | | | | |
| | 20,817,000 | | | Highwoods Properties, Inc., 5.850%, 3/15/2017 | | | 22,850,467 | |
| | 11,306,000 | | | Highwoods Properties, Inc., 7.500%, 4/15/2018 | | | 13,306,597 | |
| | | | | | | | |
| | | | | | | 36,157,064 | |
| | | | | | | | |
| | | | REITs - Regional Malls — 0.2% | | | | |
| | 2,427,000 | | | Simon Property Group LP, 5.250%, 12/01/2016 | | | 2,780,473 | |
| | 12,209,000 | | | Simon Property Group LP, 5.750%, 12/01/2015 | | | 13,810,845 | |
| | 1,889,000 | | | Simon Property Group LP, 5.875%, 3/01/2017 | | | 2,220,006 | |
| | 4,066,000 | | | Simon Property Group LP, 6.100%, 5/01/2016 | | | 4,690,745 | |
| | | | | | | | |
| | | | | | | 23,502,069 | |
| | | | | | | | |
| | | | REITs - Shopping Centers — 0.1% | | | | |
| | 4,893,000 | | | Equity One, Inc., 6.000%, 9/15/2017 | | | 5,512,635 | |
| | 1,918,000 | | | Federal Realty Investment Trust, 5.650%, 6/01/2016 | | | 2,166,657 | |
| | | | | | | | |
| | | | | | | 7,679,292 | |
| | | | | | | | |
| | | | REITs - Single Tenant — 0.3% | | | | |
| | 5,862,000 | | | Realty Income Corp., 5.750%, 1/15/2021 | | | 6,829,042 | |
| | 25,529,000 | | | Realty Income Corp., 6.750%, 8/15/2019 | | | 31,185,895 | |
| | | | | | | | |
| | | | | | | 38,014,937 | |
| | | | | | | | |
| | | | REITs - Warehouse/Industrials — 0.5% | | | | |
| | 3,873,000 | | | ProLogis LP, 5.625%, 11/15/2015 | | | 4,235,071 | |
| | 11,179,000 | | | ProLogis LP, 5.625%, 11/15/2016 | | | 12,462,081 | |
| | 10,889,000 | | | ProLogis LP, 5.750%, 4/01/2016 | | | 12,030,766 | |
| | 9,698,000 | | | ProLogis LP, 6.625%, 5/15/2018 | | | 11,587,374 | |
| | 18,869,000 | | | ProLogis LP, 7.375%, 10/30/2019 | | | 23,366,181 | |
| | | | | | | | |
| | | | | | | 63,681,473 | |
| | | | | | | | |
See accompanying notes to financial statements.
25 |
Portfolio of Investments – as of September 30, 2012
Loomis Sayles Investment Grade Bond Fund – (continued)
| | | | | | | | |
Principal
Amount (‡) | | | Description | | Value (†) | |
| | | | Restaurants — 0.1% | | | | |
| $ | 10,320,000 | | | Darden Restaurants, Inc., 6.000%, 8/15/2035 | | $ | 11,033,618 | |
| | | | | | | | |
| | | | Retailers — 0.4% | | | | |
| | 7,996,000 | | | J.C. Penney Corp., Inc., 5.750%, 2/15/2018 | | | 7,596,200 | |
| | 8,139,000 | | | J.C. Penney Corp., Inc., 6.375%, 10/15/2036 | | | 6,643,459 | |
| | 12,000 | | | J.C. Penney Corp., Inc., 7.125%, 11/15/2023 | | | 11,430 | |
| | 8,656,000 | | | J.C. Penney Corp., Inc., 7.625%, 3/01/2097 | | | 7,379,240 | |
| | 10,467,000 | | | Macy’s Retail Holdings, Inc., 6.790%, 7/15/2027 | | | 11,609,755 | |
| | 2,691,000 | | | Macy’s Retail Holdings, Inc., 6.900%, 4/01/2029 | | | 3,174,998 | |
| | 8,064,000 | | | Marks & Spencer PLC, 7.125%, 12/01/2037, 144A | | | 8,803,227 | |
| | | | | | | | |
| | | | | | | 45,218,309 | |
| | | | | | | | |
| | | | Sovereigns — 1.3% | | | | |
| | 44,750,000 | | | Republic of Brazil, 8.500%, 1/05/2024, (BRL) | | | 25,826,859 | |
| | 24,178,000 | | | Republic of Brazil, 10.250%, 1/10/2028, (BRL) | | | 15,593,900 | |
| | 52,555,000 | | | Republic of Croatia, 6.750%, 11/05/2019, 144A | | | 59,255,762 | |
| | 33,600,000 | | | Republic of Iceland, 5.875%, 5/11/2022, 144A | | | 36,624,000 | |
| | 1,415,381,000 | | | Republic of Iceland, 6.000%, 10/13/2016, (ISK) | | | 7,721,862 | |
| | 776,294,507 | | | Republic of Iceland, 7.250%, 5/17/2013, (ISK) | | | 4,144,685 | |
| | 479,712,000 | | | Republic of Iceland, 8.750%, 2/26/2019, (ISK) | | | 2,818,808 | |
| | | | | | | | |
| | | | | | | 151,985,876 | |
| | | | | | | | |
| | | | Supermarkets — 0.1% | | | | |
| | 4,130,000 | | | American Stores Co., Series B, MTN, 7.100%, 3/20/2028 | | | 3,293,675 | |
| | 1,120,000 | | | Delhaize Group S.A., 5.700%, 10/01/2040 | | | 996,485 | |
| | 3,269,000 | | | Kroger Co. (The), 6.400%, 8/15/2017 | | | 3,956,065 | |
| | 6,595,000 | | | New Albertson’s, Inc., 7.450%, 8/01/2029 | | | 3,676,713 | |
| | 7,875,000 | | | New Albertson’s, Inc., 8.000%, 5/01/2031 | | | 4,646,250 | |
| | 979,000 | | | New Albertson’s, Inc., Series C, MTN, 6.625%, 6/01/2028 | | | 528,660 | |
| | | | | | | | |
| | | | | | | 17,097,848 | |
| | | | | | | | |
| | | | Supranational — 1.1% | | | | |
| | 11,745,000 | | | European Bank for Reconstruction & Development, GMTN,
9.000%, 4/28/2014, (BRL) | | | 6,087,760 | |
| | 192,350,850,000 | | | European Investment Bank, EMTN, Zero Coupon, 4/24/2013, 144A, (IDR) | | | 19,474,267 | |
| | 9,640,000 | | | European Investment Bank, MTN, 6.000%, 8/06/2020, (AUD) | | | 11,015,621 | |
| | 329,210,000,000 | | | Inter-American Development Bank, EMTN, Zero Coupon, 5/20/2013, (IDR) | | | 33,251,242 | |
| | 410,030,000,000 | | | Inter-American Development Bank, EMTN, Zero Coupon, 9/23/2013, (IDR) | | | 40,518,848 | |
| | 12,982,000 | | | Inter-American Development Bank, EMTN, 6.000%, 12/15/2017, (NZD) | | | 11,988,427 | |
| | 15,070,000 | | | International Bank for Reconstruction & Development,
1.430%, 3/05/2014, (SGD) | | | 12,310,294 | |
| | | | | | | | |
| | | | | | | 134,646,459 | |
| | | | | | | | |
| | | | Technology — 2.7% | | | | |
| | 1,560,000 | | | Agilent Technologies, Inc., 6.500%, 11/01/2017 | | | 1,908,980 | |
| | 4,600,000 | | | Alcatel-Lucent USA, Inc., 6.450%, 3/15/2029 | | | 3,013,000 | |
| | 1,028,000 | | | Arrow Electronics, Inc., 6.875%, 6/01/2018 | | | 1,201,152 | |
| | 3,059,000 | | | Avnet, Inc., 5.875%, 3/15/2014 | | | 3,218,977 | |
| | 6,097,000 | | | Avnet, Inc., 6.000%, 9/01/2015 | | | 6,672,977 | |
| | 1,507,000 | | | Avnet, Inc., 6.625%, 9/15/2016 | | | 1,713,124 | |
See accompanying notes to financial statements.
| 26
Portfolio of Investments – as of September 30, 2012
Loomis Sayles Investment Grade Bond Fund – (continued)
| | | | | | | | |
Principal
Amount (‡) | | | Description | | Value (†) | |
| | | | Technology — continued | | | | |
| $ | 10,219,000 | | | BMC Software, Inc., 7.250%, 6/01/2018(c) | | $ | 12,309,460 | |
| | 13,457,000 | | | Corning, Inc., 6.750%, 9/15/2013 | | | 14,214,508 | |
| | 1,448,000 | | | Corning, Inc., 6.850%, 3/01/2029 | | | 1,817,321 | |
| | 56,271,000 | | | Corning, Inc., 7.000%, 5/15/2024 | | | 74,067,885 | |
| | 7,487,000 | | | Corning, Inc., 7.250%, 8/15/2036 | | | 9,587,014 | |
| | 55,237,000 | | | Dun & Bradstreet Corp. (The), 6.000%, 4/01/2013 | | | 56,626,431 | |
| | 7,051,000 | | | Equifax, Inc., 7.000%, 7/01/2037 | | | 8,753,118 | |
| | 112,000 | | | Freescale Semiconductor, Inc., 10.125%, 12/15/2016 | | | 116,200 | |
| | 70,969,000 | | | Ingram Micro, Inc., 5.250%, 9/01/2017 | | | 77,827,870 | |
| | 7,795,000 | | | Intuit, Inc., 5.750%, 3/15/2017 | | | 9,050,891 | |
| | 19,078,000 | | | KLA-Tencor Corp., 6.900%, 5/01/2018 | | | 23,022,930 | |
| | 1,502,000 | | | Motorola Solutions, Inc., 6.625%, 11/15/2037 | | | 1,609,425 | |
| | 2,256,000 | | | Samsung Electronics Co. Ltd., 7.700%, 10/01/2027, 144A | | | 2,915,068 | |
| | 5,603,000 | | | Tyco Electronics Group S.A., 6.550%, 10/01/2017 | | | 6,775,798 | |
| | 561,000 | | | Xerox Corp., 6.350%, 5/15/2018 | | | 658,660 | |
| | 7,110,000 | | | Xerox Corp., 6.750%, 2/01/2017 | | | 8,386,032 | |
| | | | | | | | |
| | | | | | | 325,466,821 | |
| | | | | | | | |
| | | | Textile — 0.0% | | | | |
| | 3,755,000 | | | Phillips-Van Heusen Corp., 7.750%, 11/15/2023 | | | 4,369,615 | |
| | | | | | | | |
| | | | Tobacco — 0.1% | | | | |
| | 8,128,000 | | | Reynolds American, Inc., 6.750%, 6/15/2017 | | | 9,838,359 | |
| | 1,992,000 | | | Reynolds American, Inc., 7.250%, 6/15/2037 | | | 2,518,161 | |
| | | | | | | | |
| | | | | | | 12,356,520 | |
| | | | | | | | |
| | | | Transportation Services — 0.6% | | | | |
| | 8,436,000 | | | Erac USA Finance Co., 6.375%, 10/15/2017, 144A | | | 10,077,831 | |
| | 2,824,000 | | | Erac USA Finance Co., 6.700%, 6/01/2034, 144A | | | 3,372,071 | |
| | 51,504,000 | | | Erac USA Finance Co., 7.000%, 10/15/2037, 144A | | | 64,180,216 | |
| | | | | | | | |
| | | | | | | 77,630,118 | |
| | | | | | | | |
| | | | Treasuries — 19.5% | | | | |
| | 93,805,000 | | | Canadian Government, 1.750%, 3/01/2013, (CAD) | | | 95,711,443 | |
| | 306,210,000 | | | Canadian Government, 2.250%, 8/01/2014, (CAD) | | | 318,089,615 | |
| | 372,145,000 | | | Canadian Government, 2.500%, 6/01/2015, (CAD) | | | 392,404,587 | |
| | 156,655,000 | | | Canadian Government, 3.000%, 12/01/2015, (CAD) | | | 168,332,020 | |
| | 106,195,000 | | | Canadian Government, 3.500%, 6/01/2013, (CAD) | | | 109,780,202 | |
| | 194,485,000 | | | Canadian Government, 3.750%, 6/01/2019, (CAD) | | | 226,511,423 | |
| | 4,159,000 | | | Canadian Government, 4.000%, 6/01/2016, (CAD) | | | 4,652,360 | |
| | 183,949,000 | | | Canadian Government, 4.250%, 6/01/2018, (CAD) | | | 216,566,221 | |
| | 85,198,516 | | | Ireland Government Bond, 4.500%, 10/18/2018, (EUR) | | | 108,901,874 | |
| | 66,038,126 | | | Ireland Government Bond, 4.500%, 4/18/2020, (EUR) | | | 81,637,509 | |
| | 29,854,296 | | | Ireland Government Bond, 5.000%, 10/18/2020, (EUR) | | | 38,049,668 | |
| | 63,183,488 | | | Ireland Government Bond, 5.400%, 3/13/2025, (EUR) | | | 80,646,595 | |
| | 1,130,000 | | | Italy Buoni Poliennali Del Tesoro, 5.000%, 8/01/2034, (EUR) | | | 1,318,803 | |
| | 1,130,000 | | | Italy Buoni Poliennali Del Tesoro, 5.250%, 11/01/2029, (EUR) | | | 1,402,502 | |
| | 1,120,000 | | | Italy Buoni Poliennali Del Tesoro, 5.750%, 2/01/2033, (EUR) | | | 1,436,694 | |
| | 4,111,400(†††) | | | Mexican Fixed Rate Bonds, Series M-20, 8.000%, 12/07/2023, (MXN) | | | 38,808,895 | |
See accompanying notes to financial statements.
27 |
Portfolio of Investments – as of September 30, 2012
Loomis Sayles Investment Grade Bond Fund – (continued)
| | | | | | | | |
Principal
Amount (‡) | | | Description | | Value (†) | |
| | | | Treasuries — continued | | | | |
| | 12,263,000 | | | New Zealand Government Bond, 6.000%, 12/15/2017, (NZD) | | $ | 11,694,307 | |
| | 108,370,000 | | | New Zealand Government Bond, 6.500%, 4/15/2013, (NZD) | | | 91,717,563 | |
| | 726,401,000 | | | Norwegian Government Bond, 4.250%, 5/19/2017, (NOK) | | | 142,323,320 | |
| | 118,387,000 | | | Norwegian Government Bond, 5.000%, 5/15/2015, (NOK) | | | 22,555,711 | |
| | 994,369,000 | | | Norwegian Government Bond, 6.500%, 5/15/2013, (NOK) | | | 178,607,689 | |
| | 13,956,446 | | | Portugal Obrigacoes do Tesouro OT, 3.850%, 4/15/2021, (EUR) | | | 12,613,494 | |
| | 4,599,829 | | | Portugal Obrigacoes do Tesouro OT, 4.800%, 6/15/2020, (EUR) | | | 4,605,267 | |
| | 6,000,000 | | | Singapore Government Bond, 1.375%, 10/01/2014, (SGD) | | | 4,995,743 | |
| | | | | | | | |
| | | | | | | 2,353,363,505 | |
| | | | | | | | |
| | | | Wireless — 0.6% | | | | |
| | 31,416,000 | | | Cellco Partnership/Verizon Wireless Capital LLC, 8.500%, 11/15/2018 | | | 44,016,015 | |
| | 13,250,000 | | | Nextel Communications, Inc., Series C, 5.950%, 3/15/2014 | | | 13,283,125 | |
| | 5,544,000 | | | Nextel Communications, Inc., Series D, 7.375%, 8/01/2015 | | | 5,564,790 | |
| | 6,373,000 | | | Sprint Capital Corp., 6.875%, 11/15/2028 | | | 5,863,160 | |
| | 2,594,000 | | | Sprint Capital Corp., 6.900%, 5/01/2019 | | | 2,691,275 | |
| | 612,000 | | | Sprint Capital Corp., 8.750%, 3/15/2032 | | | 633,420 | |
| | 91,000 | | | Sprint Nextel Corp., 6.000%, 12/01/2016 | | | 93,730 | |
| | 1,619,000 | | | Vodafone Group PLC, 5.000%, 9/15/2015 | | | 1,818,971 | |
| | | | | | | | |
| | | | | | | 73,964,486 | |
| | | | | | | | |
| | | | Wirelines — 4.5% | | | | |
| | 406,000 | | | Bell Canada, MTN, 7.300%, 2/23/2032, (CAD) | | | 551,972 | |
| | 1,874,000 | | | BellSouth Corp., 6.000%, 11/15/2034 | | | 2,145,944 | |
| | 2,936,000 | | | BellSouth Telecommunications, Inc., 5.850%, 11/15/2045 | | | 3,130,980 | |
| | 6,665,000 | | | BellSouth Telecommunications, Inc., 7.000%, 12/01/2095 | | | 8,363,575 | |
| | 62,040,000 | | | CenturyLink, Inc., 6.450%, 6/15/2021 | | | 70,012,140 | |
| | 4,990,000 | | | CenturyLink, Inc., Series G, 6.875%, 1/15/2028 | | | 5,362,019 | |
| | 2,708,000 | | | CenturyLink, Inc., Series P, 7.600%, 9/15/2039 | | | 2,864,046 | |
| | 121,506,000 | | | Deutsche Telekom International Finance BV, 6.000%, 7/08/2019 | | | 147,081,919 | |
| | 24,103,000 | | | Embarq Corp., 7.995%, 6/01/2036 | | | 27,107,246 | |
| | 825,000 | | | Level 3 Financing, Inc., 7.000%, 6/01/2020, 144A | | | 833,250 | |
| | 200,000 | | | Level 3 Financing, Inc., 9.375%, 4/01/2019 | | | 222,000 | |
| | 5,200,000 | | | Oi S.A., 9.750%, 9/15/2016, 144A, (BRL) | | | 2,693,304 | |
| | 8,450,000 | | | Portugal Telecom International Finance BV, EMTN, 4.500%, 6/16/2025, (EUR) | | | 8,686,936 | |
| | 18,850,000 | | | Portugal Telecom International Finance BV, EMTN, 5.000%, 11/04/2019, (EUR) | | | 22,348,313 | |
| | 200,000 | | | Portugal Telecom International Finance BV, EMTN, 5.625%, 2/08/2016, (EUR) | | | 255,725 | |
| | 300,000 | | | Portugal Telecom International Finance BV, GMTN, 4.375%, 3/24/2017, (EUR) | | | 363,733 | |
| | 1,698,000 | | | Qwest Capital Funding, Inc., 6.500%, 11/15/2018 | | | 1,939,870 | |
| | 2,755,000 | | | Qwest Capital Funding, Inc., 6.875%, 7/15/2028 | | | 2,907,092 | |
| | 4,370,000 | | | Qwest Capital Funding, Inc., 7.625%, 8/03/2021 | | | 4,823,475 | |
| | 3,469,000 | | | Qwest Capital Funding, Inc., 7.750%, 2/15/2031 | | | 3,766,880 | |
| | 333,000 | | | Qwest Corp., 6.500%, 6/01/2017 | | | 391,056 | |
| | 14,480,000 | | | Qwest Corp., 6.875%, 9/15/2033 | | | 14,661,000 | |
See accompanying notes to financial statements.
| 28
Portfolio of Investments – as of September 30, 2012
Loomis Sayles Investment Grade Bond Fund – (continued)
| | | | | | | | |
Principal
Amount (‡) | | | Description | | Value (†) | |
| | | | Wirelines — continued | | | | |
| $ | 4,668,000 | | | Qwest Corp., 7.200%, 11/10/2026 | | $ | 4,720,515 | |
| | 9,077,000 | | | Qwest Corp., 7.250%, 9/15/2025 | | | 11,116,983 | |
| | 9,474,000 | | | Qwest Corp., 7.250%, 10/15/2035 | | | 9,710,850 | |
| | 41,791,000 | | | Telecom Italia Capital S.A., 6.000%, 9/30/2034 | | | 36,985,035 | |
| | 23,240,000 | | | Telecom Italia Capital S.A., 6.375%, 11/15/2033 | | | 21,206,500 | |
| | 525,000 | | | Telefonica Emisiones SAU, 5.134%, 4/27/2020 | | | 515,156 | |
| | 975,000 | | | Telefonica Emisiones SAU, 5.462%, 2/16/2021 | | | 955,500 | |
| | 14,375,000 | | | Telefonica Emisiones SAU, 7.045%, 6/20/2036 | | | 14,015,625 | |
| | 1,700,000 | | | Telefonica Emisiones SAU, EMTN, 5.289%, 12/09/2022, (GBP) | | | 2,556,105 | |
| | 2,700,000 | | | Telefonica Emisiones SAU, EMTN, 5.375%, 2/02/2026, (GBP) | | | 3,933,171 | |
| | 2,100,000 | | | Telefonica Emisiones SAU, EMTN, 5.445%, 10/08/2029, (GBP) | | | 2,936,281 | |
| | 8,800,000 | | | Telefonica Emisiones SAU, EMTN, 5.597%, 3/12/2020, (GBP) | | | 13,962,095 | |
| | 14,137,000 | | | Telus Corp., 4.950%, 3/15/2017, (CAD) | | | 15,967,002 | |
| | 54,665,000 | | | Telus Corp., Series CG, 5.050%, 12/04/2019, (CAD) | | | 63,573,432 | |
| | 3,598,000 | | | Verizon Communications, Inc., 6.100%, 4/15/2018 | | | 4,497,093 | |
| | 1,278,000 | | | Verizon Maryland, Inc., Series B, 5.125%, 6/15/2033 | | | 1,355,238 | |
| | 2,642,000 | | | Verizon New England, Inc., 7.875%, 11/15/2029 | | | 3,395,464 | |
| | 5,260,000 | | | Verizon Pennsylvania, Inc., 6.000%, 12/01/2028 | | | 5,718,209 | |
| | | | | | | | |
| | | | | | | 547,632,729 | |
| | | | | | | | |
| | | | Total Non-Convertible Bonds
(Identified Cost $8,814,917,834) | | | 10,127,248,975 | |
| | | | | | | | |
| | | | | | | | |
| | Convertible Bonds — 3.4% | | | | |
| | | | Automotive — 0.4% | | | | |
| | 34,827,000 | | | Ford Motor Co., 4.250%, 11/15/2016 | | | 48,039,493 | |
| | | | | | | | |
| | | | Independent Energy — 0.3% | | | | |
| | 26,100,000 | | | Chesapeake Energy Corp., 2.500%, 5/15/2037 | | | 23,441,062 | |
| | 10,720,000 | | | Chesapeake Energy Corp., 2.750%, 11/15/2035 | | | 10,204,100 | |
| | | | | | | | |
| | | | | | | 33,645,162 | |
| | | | | | | | |
| | | | Life Insurance — 0.6% | | | | |
| | 72,915,000 | | | Old Republic International Corp., 3.750%, 3/15/2018 | | | 72,550,425 | |
| | | | | | | | |
| | | | Media Non-Cable — 0.0% | | | | |
| | 393,745 | | | Liberty Media LLC, 3.500%, 1/15/2031 | | | 186,045 | |
| | | | | | | | |
| | | | REITs - Warehouse/Industrials — 0.3% | | | | |
| | 27,359,000 | | | ProLogis LP, 3.250%, 3/15/2015 | | | 30,693,378 | |
| | | | | | | | |
| | | | Technology — 1.8% | | | | |
| | 35,120,000 | | | Intel Corp., 2.950%, 12/15/2035 | | | 38,193,000 | |
| | 137,016,000 | | | Intel Corp., 3.250%, 8/01/2039 | | | 168,872,220 | |
| | 11,515,000 | | | Lam Research Corp., Series B, 1.250%, 5/15/2018 | | | 11,126,369 | |
| | 880,000 | | | Micron Technology, Inc., 1.875%, 6/01/2014 | | | 870,100 | |
| | | | | | | | |
| | | | | | | 219,061,689 | |
| | | | | | | | |
| | | | Wirelines — 0.0% | | | | |
| | 2,926,000 | | | Level 3 Communications, Inc., 7.000%, 3/15/2015, 144A(c) | | | 3,538,631 | |
| | | | | | | | |
| | | | Total Convertible Bonds
(Identified Cost $353,639,837) | | | 407,714,823 | |
| | | | | | | | |
See accompanying notes to financial statements.
29 |
Portfolio of Investments – as of September 30, 2012
Loomis Sayles Investment Grade Bond Fund – (continued)
| | | | | | | | |
Principal
Amount (‡) | | | Description | | Value (†) | |
| | Municipals — 0.5% | | | | |
| | | | District of Columbia — 0.2% | | | | |
| $ | 14,680,000 | | | Metropolitan Washington Airports Authority, 7.462%, 10/01/2046 | | $ | 17,650,204 | |
| | | | | | | | |
| | | | Illinois — 0.2% | | | | |
| | 530,000 | | | Chicago O’Hare International Airport, Series A, (AGMC insured),
4.500%, 1/01/2038 | | | 552,329 | |
| | 24,640,000 | | | State of Illinois, 5.100%, 6/01/2033 | | | 23,880,102 | |
| | | | | | | | |
| | | | | | | 24,432,431 | |
| | | | | | | | |
| | | | Michigan — 0.0% | | | | |
| | 2,465,000 | | | Michigan Tobacco Settlement Finance Authority Taxable Turbo, Series A, 7.309%, 6/01/2034(c) | | | 1,989,280 | |
| | | | | | | | |
| | | | Ohio — 0.0% | | | | |
| | 6,430,000 | | | Buckeye Tobacco Settlement Financing Authority, Series A-2,
5.875%, 6/01/2047(c) | | | 5,170,942 | |
| | | | | | | | |
| | | | Virginia — 0.1% | | | | |
| | 14,240,000 | | | Virginia Tobacco Settlement Financing Corp., Series A-1,
6.706%, 6/01/2046(c) | | | 9,664,261 | |
| | | | | | | | |
| | | | Total Municipals
(Identified Cost $56,544,919) | | | 58,907,118 | |
| | | | | | | | |
| | | | Total Bonds and Notes
(Identified Cost $9,225,102,590) | | | 10,593,870,916 | |
| | | | | | | | |
| | | | | | | | |
| | Senior Loans — 0.9% | | | | |
| | | | Non-Captive Diversified — 0.6% | | | | |
| | 15,120,000 | | | AWAS Finance Luxembourg S.A.R.L., Term Loan B, 5.250%, 6/10/2016(b) | | | 15,327,900 | |
| | 55,685,000 | | | Flying Fortress, Inc., 1st Lien Term Loan, 5.000%, 6/30/2017(b) | | | 56,311,456 | |
| | | | | | | | |
| | | | | | | 71,639,356 | |
| | | | | | | | |
| | | | Aerospace & Defense — 0.2% | | | | |
| | 28,050,000 | | | AWAS Finance Luxembourg 2012 S.A., New Term Loan,
5.750%, 7/16/2018(b) | | | 28,050,000 | |
| | | | | | | | |
| | | | Healthcare — 0.1% | | | | |
| | 12,180,000 | | | Hologic, Inc., Term Loan B, 4.500%, 8/01/2019(b) | | | 12,322,141 | |
| | | | | | | | |
| | | | Total Senior Loans
(Identified Cost $110,149,637) | | | 112,011,497 | |
| | | | | | | | |
| | | | | | | | |
| Shares | | | | | | |
| | Common Stocks — 1.9% | | | | |
| | | | Electronic Equipment, Instruments & Components — 1.9% | | | | |
| | 17,550,000 | | | Corning, Inc.
(Identified Cost $226,654,590) | | | 230,782,500 | |
| | | | | | | | |
See accompanying notes to financial statements.
| 30
Portfolio of Investments – as of September 30, 2012
Loomis Sayles Investment Grade Bond Fund – (continued)
| | | | | | | | |
Principal
Amount (‡) | | | Description | | Value (†) | |
| | Short-Term Investments — 8.1% | | | | |
| $ | 746,427 | | | Repurchase Agreement with State Street Bank and Trust Company, dated 9/28/2012 at 0.010% to be repurchased at $746,427 on 10/01/2012 collateralized by $540,000 U.S. Treasury Bond, 5.250% due 2/15/2029 valued at $760,740 including accrued interest (Note 2 of Notes to Financial Statements) | | $ | 746,427 | |
| | 978,547,074 | | | Tri-Party Repurchase Agreement with Fixed Income Clearing Corporation, dated 9/28/2012 at 0.010% to be repurchased at $978,547,890 on 10/01/2012 collateralized by $2,315,000 U.S. Treasury Note, 3.250% due 3/31/2017 valued at $2,631,817; $970,600,000 U.S. Treasury Note, 1.000% due 3/31/2017 valued at $995,493,949 including accrued interest (Note 2 of Notes to Financial Statements) | | | 978,547,074 | |
| | | | | | | | |
| | | | Total Short-Term Investments
(Identified Cost $979,293,501) | | | 979,293,501 | |
| | | | | | | | |
| | | | | | | | |
| | | | Total Investments — 98.6%
(Identified Cost $10,541,200,318)(a) | | | 11,915,958,414 | |
| | | | Other assets less liabilities — 1.4% | | | 171,688,312 | |
| | | | | | | | |
| | | | Net Assets — 100.0% | | $ | 12,087,646,726 | |
| | | | | | | | |
| | | | | | | | |
| | (‡) | | | Principal Amount stated in U.S. dollars unless otherwise noted. | | | | |
| | (†) | | | See Note 2 of Notes to Financial Statements. | | | | |
| | (††) | | | Amount shown represents units. One unit represents a principal amount of 25. | | | | |
| | (†††) | | | Amount shown represents units. One unit represents a principal amount of 100. | | | | |
| | (a) | | | Federal Tax Information: | | | | |
| | | | At September 30, 2012, the net unrealized appreciation on investments based on a cost of $10,610,942,136 for federal income tax purposes was as follows: | | | | |
| | | | Aggregate gross unrealized appreciation for all investments in which there is an excess of value over tax cost | | $ | 1,348,784,111 | |
| | | | Aggregate gross unrealized depreciation for all investments in which there is an excess of tax cost over value | | | (43,767,833 | ) |
| | | | | | | | |
| | | | Net unrealized appreciation | | $ | 1,305,016,278 | |
| | | | | | | | |
| | | | | | | | |
| | (b) | | | Variable rate security. Rate as of September 30, 2012 is disclosed. | | | | |
| | (c) | | | Illiquid security. At September 30, 2012, the value of these securities amounted to $102,434,052 or 0.8% of net assets. | | | | |
| | (d) | | | Fair valued security by the Fund’s investment adviser. At September 30, 2012, the value of these securities amounted to $1,889,250 or less than 0.1% of net assets. | | | | |
| | (e) | | | Coupon rate is a fixed rate for an initial period then resets at a specified date and rate. | | | | |
| | | | | | | | |
See accompanying notes to financial statements.
31 |
Portfolio of Investments – as of September 30, 2012
Loomis Sayles Investment Grade Bond Fund – (continued)
| | | | | | |
| | 144A | | | All or a portion of these securities are exempt from registration under Rule 144A of the Securities Act of 1933. These securities may be resold in transactions exempt from registration, normally to qualified institutional buyers. At September 30, 2012, the value of Rule 144A holdings amounted to $1,647,725,469 or 13.6% of net assets. | | |
| | ABS | | | Asset-Backed Securities | | |
| | AGMC | | | Assured Guaranty Municipal Corp. | | |
| | EMTN | | | Euro Medium Term Note | | |
| | FHLMC | | | Federal Home Loan Mortgage Corp. | | |
| | FNMA | | | Federal National Mortgage Association | | |
| | GMTN | | | Global Medium Term Note | | |
| | MTN | | | Medium Term Note | | |
| | REITs | | | Real Estate Investment Trusts | | |
| | REMIC | | | Real Estate Mortgage Investment Conduit | | |
| | | | | | |
| | AUD | | | Australian Dollar | | |
| | BRL | | | Brazilian Real | | |
| | CAD | | | Canadian Dollar | | |
| | EUR | | | Euro | | |
| | GBP | | | British Pound | | |
| | IDR | | | Indonesian Rupiah | | |
| | ISK | | | Icelandic Krona | | |
| | KRW | | | South Korean Won | | |
| | MXN | | | Mexican Peso | | |
| | NOK | | | Norwegian Krone | | |
| | NZD | | | New Zealand Dollar | | |
| | SGD | | | Singapore Dollar | | |
Industry Summary at September 30, 2012 (Unaudited)
| | | | |
Treasuries | | | 19.5 | % |
Banking | | | 12.2 | |
Wirelines | | | 4.5 | |
Technology | | | 4.5 | |
Non-Captive Diversified | | | 3.5 | |
Pipelines | | | 3.3 | |
Commercial Mortgage-Backed Securities | | | 3.0 | |
Airlines | | | 2.4 | |
Local Authorities | | | 2.2 | |
Electric | | | 2.0 | |
Other Investments, less than 2% each | | | 33.4 | |
Short-Term Investments | | | 8.1 | |
| | | | |
Total Investments | | | 98.6 | |
Other assets less liabilities | | | 1.4 | |
| | | | |
Net Assets | | | 100.0 | % |
| | | | |
See accompanying notes to financial statements.
| 32
Portfolio of Investments – as of September 30, 2012
Loomis Sayles Investment Grade Bond Fund – (continued)
Currency Exposure Summary at September 30, 2012 (Unaudited)
| | | | |
United States Dollar | | | 68.5 | % |
Canadian Dollar | | | 14.0 | |
New Zealand Dollar | | | 4.0 | |
Euro | | | 3.6 | |
Australian Dollar | | | 3.1 | |
Norwegian Krone | | | 2.9 | |
Other, less than 2% each | | | 2.5 | |
| | | | |
Total Investments | | | 98.6 | |
Other assets less liabilities | | | 1.4 | |
| | | | |
Net Assets | | | 100.0 | % |
| | | | |
See accompanying notes to financial statements.
33 |
Statement of Assets and Liabilities
September 30, 2012
| | | | |
ASSETS | | | | |
Investments at cost | | $ | 10,541,200,318 | |
Net unrealized appreciation | | | 1,374,758,096 | |
| | | | |
Investments at value | | | 11,915,958,414 | |
Foreign currency at value (identified cost $1,579,318) | | | 1,456,285 | |
Receivable for Fund shares sold | | | 37,111,860 | |
Receivable for securities sold | | | 9,264,166 | |
Dividends and interest receivable | | | 147,727,634 | |
Tax reclaims receivable | | | 65,570 | |
| | | | |
TOTAL ASSETS | | | 12,111,583,929 | |
| | | | |
LIABILITIES | | | | |
Payable for securities purchased | | | 2,973,136 | |
Payable for Fund shares redeemed | | | 15,073,602 | |
Foreign taxes payable (Note 2) | | | 43,337 | |
Management fees payable (Note 5) | | | 3,922,097 | |
Deferred Trustees’ fees (Note 5) | | | 404,175 | |
Administrative fees payable (Note 5) | | | 436,971 | |
Payable to distributor (Note 5d) | | | 147,007 | |
Other accounts payable and accrued expenses | | | 936,878 | |
| | | | |
TOTAL LIABILITIES | | | 23,937,203 | |
| | | | |
NET ASSETS | | $ | 12,087,646,726 | |
| | | | |
NET ASSETS CONSIST OF: | | | | |
Paid-in capital | | $ | 10,564,038,762 | |
Undistributed net investment income | | | 95,851,767 | |
Accumulated net realized gain on investments and foreign currency transactions | | | 52,368,539 | |
Net unrealized appreciation on investments and foreign currency translations | | | 1,375,387,658 | |
| | | | |
NET ASSETS | | $ | 12,087,646,726 | |
| | | | |
See accompanying notes to financial statements.
| 34
Statement of Assets and Liabilities (continued)
September 30, 2012
| | | | |
COMPUTATION OF NET ASSET VALUE AND OFFERING PRICE: | | | | |
Class A shares: | | | | |
Net assets | | $ | 2,960,118,665 | |
| | | | |
Shares of beneficial interest | | | 231,913,813 | |
| | | | |
Net asset value and redemption price per share | | $ | 12.76 | |
| | | | |
Offering price per share (100/95.50 of net asset value) (Note 1) | | $ | 13.36 | |
| | | | |
Class B shares: (redemption price per share is equal to net asset value less any applicable contingent deferred sales charge) (Note 1) | | | | |
Net assets | | $ | 12,506,918 | |
| | | | |
Shares of beneficial interest | | | 984,880 | |
| | | | |
Net asset value and offering price per share | | $ | 12.70 | |
| | | | |
Class C shares: (redemption price per share is equal to net asset value less any applicable contingent deferred sales charge) (Note 1) | | | | |
Net assets | | $ | 2,281,142,129 | |
| | | | |
Shares of beneficial interest | | | 180,197,398 | |
| | | | |
Net asset value and offering price per share | | $ | 12.66 | |
| | | | |
Class Y shares: | | | | |
Net assets | | $ | 6,817,910,959 | |
| | | | |
Shares of beneficial interest | | | 533,786,374 | |
| | | | |
Net asset value, offering and redemption price per share | | $ | 12.77 | |
| | | | |
Admin Class shares: | | | | |
Net assets | | $ | 15,968,055 | |
| | | | |
Shares of beneficial interest | | | 1,253,012 | |
| | | | |
Net asset value, offering and redemption price per share | | $ | 12.74 | |
| | | | |
See accompanying notes to financial statements.
35 |
Statement of Operations
For the year ended September 30, 2012
| | | | |
INVESTMENT INCOME | | | | |
Interest | | $ | 539,856,038 | |
Dividends | | | 2,196,489 | |
Less net foreign taxes withheld | | | (72,603 | ) |
| | | | |
| | | 541,979,924 | |
| | | | |
Expenses | | | | |
Management fees (Note 5) | | | 43,364,292 | |
Service and distribution fees (Note 5) | | | 29,281,828 | |
Administrative fees (Note 5) | | | 4,937,995 | |
Trustees’ fees and expenses (Note 5) | | | 226,221 | |
Transfer agent fees and expenses (Notes 5 and 6) | | | 12,529,279 | |
Audit and tax services fees | | | 51,798 | |
Custodian fees and expenses | | | 501,099 | |
Legal fees (Note 6) | | | 153,534 | |
Registration fees (Note 6) | | | 601,683 | |
Shareholder reporting expenses (Note 6) | | | 1,073,728 | |
Miscellaneous expenses | | | 265,896 | |
| | | | |
Total expenses | | | 92,987,353 | |
Fee/expense recovery (Note 5) | | | 26,917 | |
| | | | |
Net expenses | | | 93,014,270 | |
| | | | |
Net investment income | | | 448,965,654 | |
| | | | |
NET REALIZED AND UNREALIZED GAIN (LOSS) ON INVESTMENTS AND FOREIGN CURRENCY TRANSACTIONS | | | | |
Net realized gain (loss) on: | | | | |
Investments | | | 185,188,913 | |
Foreign currency transactions | | | (1,228,842 | ) |
Net change in unrealized appreciation (depreciation) on: | | | | |
Investments | | | 569,518,215 | |
Foreign currency translations | | | 3,625,592 | |
| | | | |
Net realized and unrealized gain on investments and foreign currency transactions | | | 757,103,878 | |
| | | | |
NET INCREASE IN NET ASSETS RESULTING FROM OPERATIONS | | $ | 1,206,069,532 | |
| | | | |
See accompanying notes to financial statements.
| 36
Statement of Changes in Net Assets
| | | | | | | | |
| | | Year Ended
September 30,
2012 | | | Year Ended
September 30,
2011 | |
FROM OPERATIONS: | | | | | | | | |
Net investment income | | $ | 448,965,654 | | | $ | 431,680,023 | |
Net realized gain on investments and foreign currency transactions | | | 183,960,071 | | | | 192,463,151 | |
Net change in unrealized appreciation (depreciation) on investments and foreign currency translations | | | 573,143,807 | | | | (325,162,613 | ) |
| | | | | | | | |
Net increase in net assets resulting from operations | | | 1,206,069,532 | | | | 298,980,561 | |
| | | | | | | | |
FROM DISTRIBUTIONS TO SHAREHOLDERS: | | | | | | | | |
Net investment income | | | | | | | | |
Class A | | | (140,578,594 | ) | | | (135,092,743 | ) |
Class B | | | (558,660 | ) | | | (629,400 | ) |
Class C | | | (93,060,242 | ) | | | (94,388,368 | ) |
Class Y | | | (295,684,484 | ) | | | (221,472,525 | ) |
Admin Class | | | (455,185 | ) | | | (116,800 | ) |
Class J | | | (1,366,652 | ) | | | (5,237,024 | ) |
Net realized capital gains | | | | | | | | |
Class A | | | (26,530,935 | ) | | | (60,444,223 | ) |
Class B | | | (123,858 | ) | | | (338,411 | ) |
Class C | | | (20,065,620 | ) | | | (51,169,312 | ) |
Class Y | | | (48,043,542 | ) | | | (92,540,414 | ) |
Admin Class | | | (72,361 | ) | | | (26,910 | ) |
Class J | | | (427,583 | ) | | | (2,664,737 | ) |
| | | | | | | | |
Total distributions | | | (626,967,716 | ) | | | (664,120,867 | ) |
| | | | | | | | |
NET INCREASE (DECREASE) IN NET ASSETS FROM CAPITAL SHARE TRANSACTIONS (NOTE 10) | | | 1,700,532,135 | | | | (137,153,662 | ) |
| | | | | | | | |
Net increase (decrease) in net assets | | | 2,279,633,951 | | | | (502,293,968 | ) |
NET ASSETS | | | | | | | | |
Beginning of the year | | | 9,808,012,775 | | | | 10,310,306,743 | |
| | | | | | | | |
End of the year | | $ | 12,087,646,726 | | | $ | 9,808,012,775 | |
| | | | | | | | |
UNDISTRIBUTED NET INVESTMENT INCOME | | $ | 95,851,767 | | | $ | 75,922,048 | |
| | | | | | | | |
See accompanying notes to financial statements.
37 |
This Page Intentionally Left Blank
| 38
FINANCIAL HIGHLIGHTS
For a share outstanding throughout each period.
| | | | | | | | | | | | | | | | | | | | | | | | | | | | |
| | | | | | Income (Loss) from Investment
Operations: | | | Less Distributions: | |
| | | Net asset
value,
beginning
of the
period | | | Net
investment
income (a) | | | Net realized
and
unrealized
gain (loss) | | | Total from
investment
operations | | | Dividends
from net
investment
income | | | Distributions
from net
realized
capital
gains | | | Total
distributions | |
Class A | | | | | | | | | | | | | | | | | | | | | | | | | | | | |
9/30/2012 | | $ | 12.12 | | | $ | 0.51 | | | $ | 0.86 | | | $ | 1.37 | | | $ | (0.62 | ) | | $ | (0.11 | ) | | $ | (0.73 | ) |
9/30/2011 | | | 12.56 | | | | 0.57 | | | | (0.15 | ) | | | 0.42 | | | | (0.60 | ) | | | (0.26 | ) | | | (0.86 | ) |
9/30/2010 | | | 11.64 | | | | 0.55 | | | | 0.96 | | | | 1.51 | | | | (0.56 | ) | | | (0.03 | ) | | | (0.59 | ) |
9/30/2009 | | | 10.54 | | | | 0.60 | | | | 1.22 | | | | 1.82 | | | | (0.59 | ) | | | (0.13 | ) | | | (0.72 | ) |
9/30/2008 | | | 11.73 | | | | 0.60 | | | | (1.15 | ) | | | (0.55 | ) | | | (0.64 | ) | | | — | | | | (0.64 | ) |
Class B | | | | | | | | | | | | | | | | | | | | | | | | | | | | |
9/30/2012 | | | 12.06 | | | | 0.42 | | | | 0.86 | | | | 1.28 | | | | (0.53 | ) | | | (0.11 | ) | | | (0.64 | ) |
9/30/2011 | | | 12.50 | | | | 0.47 | | | | (0.14 | ) | | | 0.33 | | | | (0.51 | ) | | | (0.26 | ) | | | (0.77 | ) |
9/30/2010 | | | 11.59 | | | | 0.45 | | | | 0.95 | | | | 1.40 | | | | (0.46 | ) | | | (0.03 | ) | | | (0.49 | ) |
9/30/2009 | | | 10.50 | | | | 0.51 | | | | 1.21 | | | | 1.72 | | | | (0.50 | ) | | | (0.13 | ) | | | (0.63 | ) |
9/30/2008 | | | 11.68 | | | | 0.50 | | | | (1.14 | ) | | | (0.64 | ) | | | (0.54 | ) | | | — | | | | (0.54 | ) |
Class C | | | | | | | | | | | | | | | | | | | | | | | | | | | | |
9/30/2012 | | | 12.03 | | | | 0.42 | | | | 0.85 | | | | 1.27 | | | | (0.53 | ) | | | (0.11 | ) | | | (0.64 | ) |
9/30/2011 | | | 12.47 | | | | 0.47 | | | | (0.14 | ) | | | 0.33 | | | | (0.51 | ) | | | (0.26 | ) | | | (0.77 | ) |
9/30/2010 | | | 11.56 | | | | 0.46 | | | | 0.96 | | | | 1.42 | | | | (0.48 | ) | | | (0.03 | ) | | | (0.51 | ) |
9/30/2009 | | | 10.47 | | | | 0.52 | | | | 1.22 | | | | 1.74 | | | | (0.52 | ) | | | (0.13 | ) | | | (0.65 | ) |
9/30/2008 | | | 11.66 | | | | 0.51 | | | | (1.15 | ) | | | (0.64 | ) | | | (0.55 | ) | | | — | | | | (0.55 | ) |
Class Y | | | | | | | | | | | | | | | | | | | | | | | | | | | | |
9/30/2012 | | | 12.13 | | | | 0.54 | | | | 0.86 | | | | 1.40 | | | | (0.65 | ) | | | (0.11 | ) | | | (0.76 | ) |
9/30/2011 | | | 12.56 | | | | 0.60 | | | | (0.14 | ) | | | 0.46 | | | | (0.63 | ) | | | (0.26 | ) | | | (0.89 | ) |
9/30/2010 | | | 11.65 | | | | 0.58 | | | | 0.95 | | | | 1.53 | | | | (0.59 | ) | | | (0.03 | ) | | | (0.62 | ) |
9/30/2009 | | | 10.55 | | | | 0.62 | | | | 1.23 | | | | 1.85 | | | | (0.62 | ) | | | (0.13 | ) | | | (0.75 | ) |
9/30/2008 | | | 11.73 | | | | 0.64 | | | | (1.15 | ) | | | (0.51 | ) | | | (0.67 | ) | | | — | | | | (0.67 | ) |
Admin Class | | | | | | | | | | | | | | | | | |
9/30/2012 | | | 12.11 | | | | 0.48 | | | | 0.85 | | | | 1.33 | | | | (0.59 | ) | | | (0.11 | ) | | | (0.70 | ) |
9/30/2011 | | | 12.55 | | | | 0.54 | | | | (0.15 | ) | | | 0.39 | | | | (0.57 | ) | | | (0.26 | ) | | | (0.83 | ) |
9/30/2010* | | | 11.80 | | | | 0.33 | | | | 0.73 | | | | 1.06 | | | | (0.31 | ) | | | — | | | | (0.31 | ) |
| * | From commencement of Class operations on February 1, 2010 through September 30, 2010. |
| (a) | Per share net investment income has been calculated using the average shares outstanding during the period. |
| (b) | Had certain expenses not been waived/reimbursed during the period, if applicable, total returns would have been lower. |
| (c) | A sales charge for Class A shares and a contingent deferred sales charge for Class B and Class C shares are not reflected in total return calculations. Periods less than one year, if applicable, are not annualized. |
| (d) | The investment adviser and/or administrator agreed to waive its fees and/or reimburse a portion of the Fund’s expenses during the period. Without this waiver/reimbursement, if applicable, expenses would have been higher. |
| (e) | Computed on an annualized basis for periods less than one year, if applicable. |
| (f) | Includes fee/expense recovery of less than 0.01%. |
See accompanying notes to financial statements.
39 |
| | | | | | | | | | | | | | | | | | | | | | | | | | |
| | | | | | | | | |
Ratios to Average Net Assets: | | | | |
| | | | | | |
Net asset
value, end of
the period | | | Total return
(%) (b)(c) | | | Net assets,
end of
the period
(000’s) | | | Net
expenses
(%) (d)(e) | | | Gross
expenses
(%) (e) | | | Net investment
income
(%) (e) | | | Portfolio
turnover
rate (%) | |
| | | | | | | | | | | | | | | | | | | | | | | | | | |
| | $12.76 | | | | 11.74 | | | $ | 2,960,119 | | | | 0.84 | | | | 0.84 | | | | 4.17 | | | | 19 | |
| | 12.12 | | | | 3.47 | | | | 2,705,810 | | | | 0.81 | | | | 0.81 | | | | 4.56 | | | | 19 | |
| | 12.56 | | | | 13.41 | | | | 3,092,956 | | | | 0.81 | | | | 0.81 | | | | 4.58 | | | | 25 | |
| | 11.64 | | | | 18.64 | | | | 2,946,489 | | | | 0.80 | | | | 0.80 | | | | 5.87 | | | | 30 | |
| | 10.54 | | | | (5.12 | ) | | | 1,867,335 | | | | 0.80 | | | | 0.80 | | | | 5.20 | | | | 35 | |
| | | | | | | | | | | | | | | | | | | | | | | | | | |
| | 12.70 | | | | 10.96 | | | | 12,507 | | | | 1.59 | | | | 1.59 | | | | 3.42 | | | | 19 | |
| | 12.06 | | | | 2.70 | | | | 13,549 | | | | 1.56 | | | | 1.56 | | | | 3.81 | | | | 19 | |
| | 12.50 | | | | 12.43 | | | | 17,113 | | | | 1.65 | | | | 1.65 | | | | 3.74 | | | | 25 | |
| | 11.59 | | | | 17.59 | | | | 17,489 | | | | 1.67 | | | | 1.67 | | | | 5.07 | | | | 30 | |
| | 10.50 | | | | (5.88 | ) | | | 16,009 | | | | 1.65 | (f) | | | 1.65 | (f) | | | 4.29 | | | | 35 | |
| | | | | | | | | | | | | | | | | | | | | | | | | | |
| | 12.66 | | | | 10.91 | | | | 2,281,142 | | | | 1.59 | | | | 1.59 | | | | 3.42 | | | | 19 | |
| | 12.03 | | | | 2.71 | | | | 2,091,834 | | | | 1.56 | | | | 1.56 | | | | 3.81 | | | | 19 | |
| | 12.47 | | | | 12.58 | | | | 2,593,324 | | | | 1.56 | | | | 1.56 | | | | 3.83 | | | | 25 | |
| | 11.56 | | | | 17.80 | | | | 2,495,305 | | | | 1.56 | | | | 1.56 | | | | 5.09 | | | | 30 | |
| | 10.47 | | | | (5.84 | ) | | | 1,333,421 | | | | 1.55 | | | | 1.55 | | | | 4.45 | | | | 35 | |
| | | | | | | | | | | | | | | | | | | | | | | | | | |
| | 12.77 | | | | 12.01 | | | | 6,817,911 | | | | 0.59 | | | | 0.59 | | | | 4.41 | | | | 19 | |
| | 12.13 | | | | 3.81 | | | | 4,887,742 | | | | 0.56 | | | | 0.56 | | | | 4.81 | | | | 19 | |
| | 12.56 | | | | 13.60 | | | | 4,473,001 | | | | 0.56 | | | | 0.56 | | | | 4.82 | | | | 25 | |
| | 11.65 | | | | 18.94 | | | | 3,531,187 | | | | 0.54 | | | | 0.54 | | | | 6.01 | | | | 30 | |
| | 10.55 | | | | (4.79 | ) | | | 1,044,046 | | | | 0.53 | | | | 0.53 | | | | 5.48 | | | | 35 | |
| | | | | | | | | | | | | | | | | | | | | | | | | | |
| | 12.74 | | | | 11.41 | | | | 15,968 | | | | 1.09 | | | | 1.09 | | | | 3.89 | | | | 19 | |
| �� | 12.11 | | | | 3.26 | | | | 5,967 | | | | 1.07 | | | | 1.07 | | | | 4.32 | | | | 19 | |
| | 12.55 | | | | 9.13 | | | | 879 | | | | 1.08 | | | | 7.68 | | | | 4.06 | | | | 25 | |
See accompanying notes to financial statements.
| 40
Notes to Financial Statements
September 30, 2012
1. Organization. Loomis Sayles Funds II (the “Trust”) is organized as a Massachusetts business trust. The Trust is registered under the Investment Company Act of 1940, as amended (the “1940 Act”), as an open-end management investment company. The Declaration of Trust permits the Board of Trustees to authorize the issuance of an unlimited number of shares of the Trust in multiple series. The financial statements for certain funds of the Trust are presented in separate reports. Information presented in these financial statements pertains to Loomis Sayles Investment Grade Bond Fund (the “Fund”).
The Fund is a diversified investment company.
The Fund offers Class A, Class C, Class Y and Admin Class shares. Class J shares ceased to be offered on October 17, 2011 and were liquidated after the close of business on January 11, 2012. Effective October 12, 2007, Class B shares are no longer offered. Existing Class B shareholders may continue to reinvest dividends into Class B shares and exchange their Class B shares for Class B shares of other Natixis Funds subject to existing exchange privileges as described in the prospectus.
Class A shares are sold with a maximum front-end sales charge of 4.50%. Class B shares do not pay a front-end sales charge; however, they are charged higher Rule 12b-1 fees, and are subject to a contingent deferred sales charge (“CDSC”) if such shares are redeemed within six years of purchase. After eight years of ownership, Class B shares convert to Class A shares. Class C shares do not pay a front-end sales charge, do not convert to any other class of shares, pay higher Rule 12b-1 fees than Class A shares and may be subject to a CDSC of 1.00% if those shares are redeemed within one year of acquisition, except for reinvested distributions. Class Y shares do not pay a front-end sales charge, a CDSC or Rule 12b-1 fees. Class Y shares are generally intended for institutional investors with a minimum initial investment of $100,000, though some categories of investors are exempted from the minimum investment amount as outlined in the Fund’s prospectus. Admin Class shares do not pay a front-end sales charge or a CDSC, but do pay a Rule 12b-1 fee. Admin Class shares are offered exclusively through intermediaries.
Most expenses of the Trust can be directly attributed to a fund. Expenses which cannot be directly attributed to a fund are generally apportioned based on the relative net assets of each of the funds in the Trust. Expenses of the Fund are borne pro rata by the holders of each class of shares, except that each class bears expenses unique to that class (Rule 12b-1 service and distribution fees for Class A, Class B, Class C and Admin Class). For the period from October 1, 2011 through January 11, 2012, Class J incurred class-specific expenses for Rule 12b-1 service and distribution, registration, legal, shareholder reporting and transfer agent fees. In addition, each class votes as a class only with respect to its own Rule 12b-1 Plan. Shares of each class would receive their pro rata share of the net assets of the Fund if the Fund were liquidated. The Trustees approve separate distributions from net investment income on each class of shares.
41 |
Notes to Financial Statements (continued)
September 30, 2012
2. Significant Accounting Policies. The following is a summary of significant accounting policies consistently followed by the Fund in the preparation of its financial statements. The Fund’s financial statements are prepared in accordance with accounting principles generally accepted in the United States of America which require the use of management estimates that affect the reported amounts and disclosures in the financial statements. Actual results could differ from those estimates. Management has evaluated the events and transactions subsequent to year-end through the date the financial statements were issued and has determined that there were no material events that would require disclosure in the Fund’s financial statements.
a. Valuation. Debt securities (other than short-term obligations purchased with an original or remaining maturity of sixty days or less) and unlisted equity securities are generally valued on the basis of evaluated bids furnished to the Fund by an independent pricing service recommended by the investment adviser and approved by the Board of Trustees, which service determines valuations for normal, institutional-size trading units of such securities using market information, transactions for comparable securities and various relationships between securities which are generally recognized by institutional traders. Senior loans are priced at bid prices supplied by an independent pricing service, if available. Equity securities, including shares of closed-end investment companies and exchange-traded funds, for which market quotations are readily available are valued at market value, as reported by independent pricing services recommended by the investment adviser and approved by the Board of Trustees. Such independent pricing services generally use the security’s last sale price on the exchange or market where the security is primarily traded or, if there is no reported sale during the day, the closing bid price. Securities traded on the NASDAQ Global Select Market, NASDAQ Global Market and NASDAQ Capital Market are valued at the NASDAQ Official Closing Price (“NOCP”), or if lacking a NOCP, at the most recent bid quotation on the applicable NASDAQ Market. Broker-dealer bid quotations may also be used to value debt and equity securities and senior loans where an independent pricing service is unable to price a security or where an independent pricing service does not provide a reliable price for the security. Forward foreign currency contracts are valued utilizing interpolated prices determined from information provided by an independent pricing service. Investments in other open-end investment companies are valued at their net asset value each day. Short-term obligations purchased with an original or remaining maturity of sixty days or less are valued at amortized cost, which approximates market value. Securities for which market quotations are not readily available are valued at fair value as determined in good faith by the Fund’s investment adviser using consistently applied procedures under the general supervision of the Board of Trustees.
The Fund may hold securities traded in foreign markets. Foreign securities are valued at the closing market price in the foreign market. However, if events occurring after the close of the foreign market (but before the close of regular trading on the New York
| 42
Notes to Financial Statements (continued)
September 30, 2012
Stock Exchange) are believed to materially affect the value of those securities, such securities are fair valued pursuant to procedures approved by the Board of Trustees. When fair valuing securities, the Fund may, among other things, use modeling tools or other processes that may take into account factors such as securities market activity and/or significant events that occur after the close of the foreign market and before the Fund calculates its net asset value.
b. Investment Transactions and Related Investment Income. Investment transactions are accounted for on a trade date plus one basis for daily net asset value calculation. However, for financial reporting purposes, investment transactions are reported on trade date. Interest income is recorded on an accrual basis. Interest income is increased by the accretion of discount and decreased by the amortization of premium. In determining net gain or loss on securities sold, the cost of securities has been determined on an identified cost basis. Investment income, non-class specific expenses and realized and unrealized gains and losses are allocated on a pro rata basis to each class based on the relative net assets of each class to the total net assets of the Fund.
c. Foreign Currency Translation. The books and records of the Fund are maintained in U.S. dollars. The values of securities, currencies and other assets and liabilities denominated in currencies other than U.S. dollars are translated into U.S. dollars based upon foreign exchange rates prevailing at the end of the period. Purchases and sales of investment securities, income and expenses are translated on the respective dates of such transactions.
Since the values of investment securities are presented at the foreign exchange rates prevailing at the end of the period, it is not practical to isolate that portion of the results of operations arising from changes in exchange rates from fluctuations which arise due to changes in market prices of investment securities. Such changes are included with the net realized and unrealized gain or loss on investments.
Net realized foreign exchange gains or losses arise from sales of foreign currency, currency gains or losses realized between the trade and settlement dates on securities transactions and the difference between the amounts of interest and foreign withholding taxes recorded on the Fund’s books and the U.S. dollar equivalent of the amounts actually received or paid. Net unrealized foreign exchange gains and losses arise from changes in the value of assets and liabilities, other than investment securities, at the end of the fiscal period, resulting from changes in exchange rates.
The Fund may use foreign currency exchange contracts to facilitate transactions in foreign-denominated investments. Losses may arise from changes in the value of the foreign currency or if the counterparties do not perform under the contracts’ terms.
d. Forward Foreign Currency Contracts. The Fund may enter into forward foreign currency contracts to hedge the Fund’s investments against currency fluctuation. A contract can also be used to offset a previous contract. These contracts involve market
43 |
Notes to Financial Statements (continued)
September 30, 2012
risk in excess of the unrealized gain or loss reflected in the Fund’s Statement of Assets and Liabilities. The U.S. dollar value of the currencies the Fund has committed to buy or sell represents the aggregate exposure to each currency the Fund has acquired or hedged through currency contracts outstanding at period end. Gains or losses are recorded for financial statement purposes as unrealized until settlement date. Risks may arise upon entering into these contracts from the potential inability of counterparties to meet the terms of their contracts and from unanticipated movements in the value of a foreign currency relative to the U.S. dollar. Certain contracts may require the movement of cash and/or securities as collateral for the Fund’s or counterparty’s net obligations under the contracts.
No forward foreign currency contracts were held by the Fund during the year ended September 30, 2012.
e. Federal and Foreign Income Taxes. The Trust treats each Fund as a separate entity for federal income tax purposes. The Fund intends to meet the requirements of the Internal Revenue Code of 1986, as amended, applicable to regulated investment companies, and to distribute to its shareholders substantially all of its net investment income and any net realized capital gains at least annually. Management has performed an analysis of the Fund’s tax positions for the open tax years as of September 30, 2012 and has concluded that no provisions for income tax are required. The Fund’s federal tax returns for the prior three fiscal years remain subject to examination by the Internal Revenue Service. Management is not aware of any events that are reasonably possible to occur in the next twelve months that would result in the amounts of any unrecognized tax benefits significantly increasing or decreasing for the Fund. However, management’s conclusions regarding tax positions taken may be subject to review and adjustment at a later date based on factors including, but not limited to, new tax laws and accounting regulations and interpretations thereof.
The Fund may be subject to foreign withholding taxes on investment income and taxes on capital gains on investments that are accrued and paid based upon the Fund’s understanding of the tax rules and regulations that exist in the countries in which the Fund invests. Foreign withholding taxes on dividend and interest income are reflected on the Statement of Operations as a reduction of investment income, net of amounts eligible to be reclaimed. Dividends and interest receivable on the Statement of Assets and Liabilities are net of foreign withholding taxes. Foreign withholding taxes eligible to be reclaimed are reflected on the Statement of Assets and Liabilities as tax reclaims receivable. Capital gains taxes paid are included in net realized gain (loss) on investments in the Statement of Operations. Accrued but unpaid capital gains taxes are reflected as foreign taxes payable on the Statement of Assets and Liabilities, if applicable, and reduce unrealized gains on investments. In the event that realized gains on investments are subsequently offset by realized losses, taxes paid on realized gains may be returned to the Fund. Such amounts, if applicable, are reflected as foreign tax
| 44
Notes to Financial Statements (continued)
September 30, 2012
rebates receivable on the Statement of Assets and Liabilities and are recorded as a realized gain when received.
f. Dividends and Distributions to Shareholders. Dividends and distributions are recorded on ex-dividend date. The timing and characterization of certain income and capital gain distributions are determined annually in accordance with federal tax regulations, which may differ from accounting principles generally accepted in the United States of America. Permanent differences are primarily due to differing treatments for book and tax purposes of items such as foreign currency transactions, paydown adjustments and premium amortization. Permanent book and tax basis differences relating to shareholder distributions will result in reclassifications to capital accounts. Temporary differences between book and tax distributable earnings are primarily due to premium amortization, deferred Trustees’ fees, defaulted bond accruals, contingent payment debt instruments and wash sales. Distributions from net investment income and short-term capital gains are considered to be distributed from ordinary income for tax purposes.
The tax characterization of distributions is determined on an annual basis. The tax character of distributions paid to shareholders during the years ended September 30, 2012 and 2011 were as follows:
| | | | | | | | | | | | | | | | | | | | |
2012 Distributions Paid From: | | | 2011 Distributions Paid From: | |
Ordinary Income | | Long-Term Capital Gains | | | Total | | | Ordinary Income | | | Long-Term Capital Gains | | | Total | |
$556,649,900 | | | $70,317,816 | | | $ | 626,967,716 | | | $ | 554,809,060 | | | | $109,311,807 | | | $ | 664,120,867 | |
Differences between these amounts and those reported in the Statement of Changes in Net Assets are primarily attributable to different book and tax treatment for short-term capital gains.
As of September 30, 2012, the components of distributable earnings on a tax basis were as follows:
| | | | |
Undistributed ordinary income | | $ | 124,720,727 | |
Undistributed long-term capital gains | | | 93,697,971 | |
| | | | |
Total undistributed earnings | | | 218,418,698 | |
Unrealized appreciation | | | 1,305,645,840 | |
| | | | |
Total accumulated earnings | | $ | 1,524,064,538 | |
| | | | |
On December 22, 2010, the Regulated Investment Company Modernization Act of 2010 (the “Act”) was enacted. Under the Act, for taxable years beginning after December 22, 2010, capital losses may be carried forward indefinitely. Rules in effect previously limited the carryforward period to eight years. Additionally, capital losses realized in taxable years beginning after the effective date of the Act are carried over in the
45 |
Notes to Financial Statements (continued)
September 30, 2012
character (short-term or long-term) realized. Rules in effect previously treated all capital loss carryforwards as short-term.
g. Repurchase Agreements. It is the Fund’s policy that the market value of the collateral for repurchase agreements be at least equal to 102% of the repurchase price, including interest. Certain repurchase agreements are tri-party arrangements whereby the collateral is held in a segregated account for the benefit of the Fund and on behalf of the counterparty. Repurchase agreements could involve certain risks in the event of default or insolvency of the counterparty including possible delays or restrictions upon the Fund’s ability to dispose of the underlying securities.
h. Securities Lending. The Fund has entered into an agreement with State Street Bank and Trust Company (“State Street Bank”), as agent of the Fund, to lend securities to certain designated borrowers. The loans are collateralized with cash or securities in an amount equal to at least 105% or 102% of the market value (including accrued interest) of the loaned international or domestic securities, respectively, when the loan is initiated. Thereafter, the value of the collateral must remain at least 102% of the market value (including accrued interest) of loaned securities for U.S. equities and U.S. corporate debt; at least 105% of the market value (including accrued interest) of loaned securities for non-U.S. equities; and at least 100% of the market value (including accrued interest) of loaned securities for U.S. Government securities, sovereign debt issued by non-U.S. Governments and non-U.S. corporate debt. In the event that the market value of the collateral falls below the required percentages described above, the borrower will deliver additional collateral on the next business day. As with other extensions of credit, the Fund may bear the risk of loss with respect to the investment of the collateral. The Fund invests cash collateral in short-term investments, a portion of the income from which is remitted to the borrowers and the remainder allocated between the Fund and State Street Bank as lending agent.
For the year ended September 30, 2012, the Fund did not loan securities under this agreement.
i. Indemnifications. Under the Trust’s organizational documents, its officers and Trustees are indemnified against certain liabilities arising out of the performance of their duties to the Fund. Additionally, in the normal course of business, the Fund enters into contracts with service providers that contain general indemnification clauses. The Fund’s maximum exposure under these arrangements is unknown as this would involve future claims that may be made against the Fund that have not yet occurred. However, based on experience, the Fund expects the risk of loss to be remote.
3. Fair Value Measurements. In accordance with accounting standards related to fair value measurements and disclosures, the Fund has categorized the inputs utilized in determining the value of the Fund’s assets or liabilities. These inputs are summarized in the three broad levels listed below:
| | • | | Level 1 – quoted prices in active markets for identical assets or liabilities; |
| 46
Notes to Financial Statements (continued)
September 30, 2012
| | • | | Level 2 – prices determined using other significant inputs that are observable either directly, or indirectly through corroboration with observable market data (which could include quoted prices for similar assets or liabilities, interest rates, credit risk, etc.); and |
| | • | | Level 3 – prices determined using significant unobservable inputs when quoted prices or observable inputs are unavailable such as when there is little or no market activity for an asset or liability (unobservable inputs reflect the Fund’s own assumptions in determining the fair value of assets or liabilities and would be based on the best information available). |
The inputs or methodology used for valuing securities are not necessarily an indication of the risk associated with investing in those securities.
The following is a summary of the inputs used to value the Fund’s investments as of September 30, 2012, at value:
Asset Valuation Inputs
| | | | | | | | | | | | | | | | |
Description | | Level 1 | | | Level 2 | | | Level 3 | | | Total | |
Bonds and Notes | | | | | | | | | | | | | | | | |
Non-Convertible Bonds | | | | | | | | | | | | | | | | |
ABS Car Loan | | $ | — | | | $ | 64,918,159 | | | $ | 5,642,124 | | | $ | 70,560,283 | |
Banking | | | — | | | | 1,435,911,836 | | | | 38,219,714 | | | | 1,474,131,550 | |
Electric | | | — | | | | 244,735,055 | | | | 1,889,250 | | | | 246,624,305 | |
Non-Captive Consumer | | | 1,482,022 | | | | 185,534,737 | | | | — | | | | 187,016,759 | |
All Other Non-Convertible Bonds(a) | | | — | | | | 8,148,916,078 | | | | — | | | | 8,148,916,078 | |
| | | | | | | | | | | | | | | | |
Total Non-Convertible Bonds | | | 1,482,022 | | | | 10,080,015,865 | | | | 45,751,088 | | | | 10,127,248,975 | |
| | | | | | | | | | | | | | | | |
Convertible Bonds(a) | | | — | | | | 407,714,823 | | | | — | | | | 407,714,823 | |
Municipals(a) | | | — | | | | 58,907,118 | | | | — | | | | 58,907,118 | |
| | | | | | | | | | | | | | | | |
Total Bonds and Notes | | | 1,482,022 | | | | 10,546,637,806 | | | | 45,751,088 | | | | 10,593,870,916 | |
| | | | | | | | | | | | | | | | |
Senior Loans(a) | | | — | | | | 112,011,497 | | | | — | | | | 112,011,497 | |
Common Stocks(a) | | | 230,782,500 | | | | — | | | | — | | | | 230,782,500 | |
Short-Term Investments | | | — | | | | 979,293,501 | | | | — | | | | 979,293,501 | |
| | | | | | | | | | | | | | | | |
Total | | $ | 232,264,522 | | | $ | 11,637,942,804 | | | $ | 45,751,088 | | | $ | 11,915,958,414 | |
| | | | | | | | | | | | | | | | |
| (a) | Details of the major categories of the Fund’s investments are reflected within the Portfolio of Investments. |
47 |
Notes to Financial Statements (continued)
September 30, 2012
The following is a reconciliation of Level 3 investments for which significant unobservable inputs were used to determine fair value as of September 30, 2012:
Asset Valuation Inputs
| | | | | | | | | | | | | | | | | | | | |
Investments in
Securities | | Balance as of
September 30,
2011 | | | Accrued
Discounts
(Premiums) | | | Realized
Gain
(Loss) | | | Change in
Unrealized
Appreciation
(Depreciation) | | | Purchases | |
Bonds and Notes | | | | | | | | | | | | | | | | | |
Non-Convertible Bonds | | | | | | | | | | | | | | | | | | | | |
ABS Car Loan | | $ | 5,230,461 | | | $ | — | | | $ | — | | | $ | 411,663 | | | $ | — | |
Banking | | | — | | | | — | | | | — | | | | 2,877,790 | | | | 35,341,924 | |
Electric | | | — | | | | — | | | | — | | | | (994,781 | ) | | | — | |
Treasuries | | | 538,615 | | | | 14,570 | | | | (671,562 | ) | | | 421,513 | | | | — | |
| | | | | | | | | | | | | | | | | | | | |
Total | | $ | 5,769,076 | | | $ | 14,570 | | | $ | (671,562 | ) | | $ | 2,716,185 | | | $ | 35,341,924 | |
| | | | | | | | | | | | | | | | | | | | |
| | | | | |
Investments in
Securities | | Sales | | | Transfers
into Level 3 | | | Transfers
out of
Level 3 | | | Balance as of
September 30,
2012 | | | Change in
Unrealized
Appreciation
(Depreciation)
from
Investments
Still Held at
September 30,
2012 | |
Bonds and Notes | | | | | | | | | | | | | | | | | |
Non-Convertible Bonds | | | | | | | | | | | | | | | | | | | | |
ABS Car Loan | | $ | — | | | $ | — | | | $ | — | | | $ | 5,642,124 | | | $ | 411,663 | |
Banking | | | — | | | | — | | | | — | | | | 38,219,714 | | | | 2,877,790 | |
Electric | | | — | | | | 2,884,031 | | | | — | | | | 1,889,250 | | | | (994,781 | ) |
Treasuries | | | (303,136 | ) | | | — | | | | — | | | | — | | | | — | |
| | | | | | | | | | | | | | | | | | | | |
Total | | $ | (303,136 | ) | | $ | 2,884,031 | | | $ | — | | | $ | 45,751,088 | | | $ | 2,294,672 | |
| | | | | | | | | | | | | | | | | | | | |
Debt securities valued at $2,884,031 were transferred from Level 2 to Level 3 during the period ended September 30, 2012. At September 30, 2011, these securities were valued on the basis of evaluated bids furnished to the Fund by an independent pricing service in accordance with the Fund’s valuation policies; at September 30, 2012, these securities were valued at fair value as determined in good faith by the Fund’s investment adviser as an independent pricing service did not provide a reliable price for the security.
| 48
Notes to Financial Statements (continued)
September 30, 2012
All transfers are recognized as of the beginning of the reporting period.
4. Purchases and Sales of Securities. For the year ended September 30, 2012, purchases and sales of securities (excluding short-term investments and U.S. Government/Agency securities and including paydowns) were $2,706,933,012 and $1,655,667,042, respectively. Purchases and sales of U.S. Government/Agency securities (excluding short-term investments and including paydowns) were $303,441,395 and $311,886,883, respectively.
5. Management Fees and Other Transactions with Affiliates.
a. Management Fees. Loomis, Sayles & Company, L.P. (“Loomis Sayles”) serves as investment adviser to the Fund. Under the terms of the management agreement, the Fund pays a management fee at the annual rate of 0.40% of average daily net assets, calculated daily and payable monthly.
Loomis Sayles has given a binding undertaking to the Fund to waive management fees and/or reimburse certain expenses to limit the Fund’s operating expenses, exclusive of acquired fund fees and expenses, brokerage expenses, interest expense, taxes and extraordinary expenses. This undertaking is in effect until January 31, 2013 and is reevaluated on an annual basis. Management fees payable, as reflected on the Statement of Assets and Liabilities, is net of waivers and/or expense reimbursements, if any, pursuant to these undertakings.
For the year ended September 30, 2012, the expense limits as a percentage of average daily net assets under the expense limitation agreement were as follows:
| | | | | | | | | | | | | | | | |
| Expense Limit as a Percentage of Average Daily Net Assets | |
Class A | | Class B | | | Class C | | | Class Y | | | Admin Class | |
| 0.95% | | | 1.70 | % | | | 1.70 | % | | | 0.70 | % | | | 1.20 | % |
Loomis Sayles shall be permitted to recover expenses it has borne under the expense limitation agreement (whether through waiver of its management fees or otherwise) on a class by class basis in later periods to the extent the expenses of a class fall below a class’ expense limits, provided, however, that a class is not obligated to pay such waived/reimbursed fees or expenses more than one year after the end of the fiscal year in which the fees or expenses were waived/reimbursed.
For the year ended September 30, 2012, the management fees for the Fund were $43,364,292 (0.40% of average daily net assets).
For the period from October 1, 2011 through January 11, 2012, $26,917 in expense reimbursements related to the prior fiscal year were recovered for Class J.
Certain officers and employees of Loomis Sayles are also officers or Trustees of the Trust. Loomis Sayles’ general partner is indirectly owned by Natixis Global Asset Management, L.P. (“Natixis US”), which is part of Natixis Global Asset Management, an international asset management group based in Paris, France.
49 |
Notes to Financial Statements (continued)
September 30, 2012
b. Service and Distribution Fees. NGAM Distribution, L.P. (“NGAM Distribution”), which is a wholly-owned subsidiary of Natixis US, has entered into a distribution agreement with the Trust. Pursuant to this agreement, NGAM Distribution serves as principal underwriter of the Funds of the Trust.
Pursuant to Rule 12b-1 under the 1940 Act, the Trust has adopted a Service Plan relating to the Fund’s Class A shares (the “Class A Plan”), a Distribution and Service Plan relating to the Fund’s Class B and Class C shares (the “Class B and Class C Plans”), and a Distribution Plan relating to its Admin Class shares (the “Admin Class Plan”).
Under the Class A Plan, the Fund pays NGAM Distribution a monthly service fee at an annual rate not to exceed 0.25% of the average daily net assets attributable to the Fund’s Class A shares, as reimbursement for expenses incurred by NGAM Distribution in providing personal services to investors in Class A shares and/or the maintenance of shareholder accounts.
Under the Class B and Class C Plans, the Fund pays NGAM Distribution a monthly service fee at an annual rate not to exceed 0.25% of the average daily net assets attributable to the Fund’s Class B and Class C shares, as compensation for services provided by NGAM Distribution in providing personal services to investors in Class B and Class C shares and/or the maintenance of shareholder accounts.
Also under the Class B and Class C Plans, the Fund pays NGAM Distribution a monthly distribution fee at an annual rate of 0.75% of the average daily net assets attributable to the Fund’s Class B and Class C shares, as compensation for services provided by NGAM Distribution in connection with the marketing or sale of Class B and Class C shares.
Under the Admin Class Plan, the Fund pays NGAM Distribution a monthly distribution fee at an annual rate not to exceed 0.25% of the average daily net assets attributable to the Fund’s Admin Class shares, as compensation for services provided by NGAM Distribution in connection with the marketing or sale of Admin Class shares or for payments made by NGAM Distribution to securities dealers or other financial intermediaries as commissions, asset-based sales charges or other compensation with respect to the sale of Admin Class shares, or for providing personal services to investors and/or the maintenance of shareholder accounts.
In addition, the Admin Class shares of the Fund may pay NGAM Distribution an administrative service fee, at an annual rate not to exceed 0.25% of the average daily net assets attributable to Admin Class shares. These fees are subsequently paid to securities dealers or financial intermediaries for providing personal services and/or account maintenance for their customers who hold such shares.
Class J shares, liquidated as of the close of business on January 11, 2012, were subject to a monthly shareholder service fee at an annual rate of 0.25% and a monthly
| 50
Notes to Financial Statements (continued)
September 30, 2012
distribution fee at an annual rate of 0.50% of the average daily net assets attributable to the Fund’s Class J shares, both payable to Loomis Sayles Distributors, L.P. pursuant to a shareholder service and distribution plan adopted under Rule 12b-1.
For the year ended September 30, 2012, the service and distribution fees for the Fund were as follows:
| | | | | | | | | | | | | | | | | | | | | | | | |
Service Fees | | | Distribution Fees | |
Class A | | Class B | | | Class C | | | Admin Class | | | Class B | | | Class C | | | Admin Class | |
$7,073,676 | | $ | 32,591 | | | $ | 5,465,018 | | | $ | 25,862 | | | $ | 97,773 | | | $ | 16,395,053 | | | $ | 25,862 | |
For the period from October 1, 2011 through January 11, 2012, service and distribution fees for Class J were as follows:
| | |
Service Fees | | Distribution Fees |
$55,331 | | $110,662 |
c. Administrative Fees. NGAM Advisors, L.P. (“NGAM Advisors”) provides certain administrative services for the Fund and contracts with State Street Bank to serve as sub-administrator. NGAM Advisors is a wholly-owned subsidiary of Natixis US. Pursuant to an agreement among Natixis Funds Trust I, Natixis Funds Trust II, Natixis Funds Trust IV, Gateway Trust (“Natixis Funds Trusts”), Loomis Sayles Funds I, Loomis Sayles Funds II (“Loomis Sayles Funds Trusts”), Hansberger International Series and NGAM Advisors, the Fund pays NGAM Advisors monthly its pro rata portion of fees equal to an annual rate of 0.0575% of the first $15 billion of the average daily net assets of the Natixis Funds Trusts, Loomis Sayles Funds Trusts and Hansberger International Series, 0.0500% of the next $15 billion, 0.0400% of the next $30 billion and 0.0350% of such assets in excess of $60 billion, subject to an annual aggregate minimum fee for the Natixis Funds Trusts, Loomis Sayles Funds Trusts and Hansberger International Series of $10 million, which is reevaluated on an annual basis.
For the year ended September 30, 2012, the administrative fees for the Fund were $4,937,995.
d. Sub-Transfer Agent Fees. NGAM distribution has entered into agreements, which include servicing agreements, with financial intermediaries that provide recordkeeping, processing, shareholder communications and other services to customers of the intermediaries that hold positions in the Fund and has agreed to compensate the intermediaries for providing those services. Intermediaries transact with the Fund primarily through the use of omnibus accounts on behalf of their customers who hold positions in the Fund. These services would have been provided by the Fund’s transfer agent and other service providers if the shareholders’ accounts were maintained directly at the Fund’s transfer agent. Accordingly, the Fund has agreed to reimburse NGAM Distribution for all or a portion of the servicing fees paid to these intermediaries. The reimbursement amounts (sub-transfer agent fees) paid to NGAM Distribution are subject to a current per-account equivalent fee limit approved by the Fund’s Board,
51 |
Notes to Financial Statements (continued)
September 30, 2012
which is based on fees for similar services paid to the Fund’s transfer agent and other service providers.
For the year ended September 30, 2012, the sub-transfer agent fees (which are reflected in transfer agent fees and expenses in the Statement of Operations) for the Fund were $11,421,259. As of September 30, 2012, the Fund owes NGAM Distribution $147,007 in reimbursement for sub-transfer agent fees.
e. Commissions. Commissions (including CDSCs) on Fund shares retained by NGAM Distribution were $3,287,131 for the year ended September 30, 2012.
f. Trustees Fees and Expenses. The Trust does not pay any compensation directly to its officers or Trustees who are directors, officers or employees of NGAM Advisors, NGAM Distribution, Natixis US or their affiliates. Effective January 1, 2012, the Chairperson of the Board receives a retainer fee at the annual rate of $265,000. The Chairperson does not receive any meeting attendance fees for Board of Trustees meetings or committee meetings that she attends. Each Independent Trustee (other than the Chairperson) receives, in the aggregate, a retainer fee at the annual rate of $95,000. Each Independent Trustee also receives a meeting attendance fee of $10,000 for each meeting of the Board of Trustees that he or she attends in person and $5,000 for each meeting of the Board of Trustees that he or she attends telephonically. In addition, each committee chairman receives an additional retainer fee at an annual rate of $15,000. Each Contract Review and Governance Committee member is compensated $6,000 for each Committee meeting that he or she attends in person and $3,000 for each meeting that he or she attends telephonically. Each Audit Committee member is compensated $7,500 for each Committee meeting that he or she attends in person and $3,750 for each meeting that he or she attends telephonically. These fees are allocated among the funds in the Natixis Funds Trusts, Loomis Sayles Funds Trusts and Hansberger International Series based on a formula that takes into account, among other factors, the relative net assets of each fund. Trustees are reimbursed for travel expenses in connection with attendance at meetings.
Prior to January 1, 2012, the Chairperson of the Board received a retainer fee at the annual rate of $250,000 and each Independent Trustee (other than the Chairperson) received, in aggregate, a retainer fee at the annual rate of $80,000. All other Trustee fees remain unchanged.
A deferred compensation plan (the “Plan”) is available to the Trustees on a voluntary basis. Deferred amounts remain in the Fund until distributed in accordance with the provisions of the Plan. The value of a participating Trustee’s deferral account is based on theoretical investments of deferred amounts, on the normal payment dates, in certain funds of the Natixis Funds Trusts, Loomis Sayles Funds Trusts and Hansberger International Series as designated by the participating Trustees. Changes in the value of participants’ deferral accounts are allocated pro rata among the funds in the Natixis Funds Trusts, Loomis Sayles Funds Trusts, and Hansberger International Series, and are
| 52
Notes to Financial Statements (continued)
September 30, 2012
normally reflected as Trustees’ fees and expenses in the Statement of Operations. The portions of the accrued obligations allocated to the Fund under the Plan are reflected as Deferred Trustees’ fees in the Statement of Assets and Liabilities.
g. Affiliated Ownership. At September 30, 2012, Loomis Sayles Employees’ Profit Sharing Retirement Plan held shares of beneficial interest in the Fund representing 0.06% of net assets.
Investment activities of affiliated shareholders could have material impacts on the Fund.
h. Interfund Transactions. A Fund may purchase securities from, or sell securities to, an affiliated fund provided the affiliation is due solely to having a common investment adviser, common officers, or common trustees. For the year ended September 30, 2012, the Fund purchased securities from an affiliated fund in compliance with Rule 17a-7 of the 1940 Act in the amount of $41,058,412.
6. Class-Specific Expenses. For the period from October 1, 2011 through January 11, 2012, the Fund incurred the following class-specific expenses:
| | | | |
| | | Class J | |
Transfer Agent Fees and Expenses | | $ | 2,327 | |
Registration Fees | | | (1,250 | ) |
Legal Fees | | | (380 | ) |
Shareholder Reporting Expenses | | | (4,861 | ) |
Transfer agent, registration, legal, and shareholder reporting fees and expenses attributable to Class A, Class B, Class C, Class Y and Admin Class are allocated on a pro rata basis to each class based on the relative net assets of each class to the total net assets of those classes.
7. Line of Credit. The Fund, together with certain other funds of Natixis Funds Trusts, Loomis Sayles Funds Trusts and Hansberger International Series, participates in a $200,000,000 committed unsecured line of credit provided by State Street Bank, with an individual limit of $125,000,000 for each fund that participates in the line of credit. Interest is charged to each participating fund based on its borrowings at a rate per annum equal to the greater of the Federal Funds rate or overnight LIBOR, plus 1.25%. In addition, a commitment fee of 0.10% per annum, payable at the end of each calendar quarter, is accrued and apportioned among the participating funds based on their average daily unused portion of the line of credit. Prior to April 19, 2012, the commitment fee was 0.125% per annum.
For the year ended September 30, 2012, the Fund had no borrowings under these agreements.
8. Concentration of Risk. The Fund’s investments in foreign securities are subject to foreign currency fluctuations, higher volatility than U.S. securities, varying degrees of regulation and limited liquidity. Greater political, economic, credit and information risks are also associated with foreign securities.
53 |
Notes to Financial Statements (continued)
September 30, 2012
9. Concentration of Ownership. From time to time, the Fund may have a concentration of one or more accounts constituting a significant percentage of shares outstanding. Investment activities by holders of such accounts could have material impacts on the Funds. As of September 30, 2012, based on management’s evaluation of the shareholder account base, the Fund had accounts representing controlling ownership of more than 5% of the Fund’s total outstanding shares. The number of such accounts, including affiliated accounts (if applicable), based on accounts that represent more than 5% of an individual class of shares, and the aggregate percentage of net assets represented by such holdings was as follows:
| | | | | | | | | | | | | | | | | | | | |
Fund | | Number of 5%
Non-Affiliated
Shareholders | | Percentage of
Non-Affiliated
Ownership | | Percentage of
Affiliated Ownership
(Note 5) | | Total
Percentage of Ownership |
Investment Grade Bond Fund | | | | 1 | | | | | 13.03 | % | | | | 0.06 | % | | | | 13.09 | % |
Shareholder positions in the Fund may be held by intermediaries utilizing omnibus accounts. The Fund may not have information on the individual shareholder accounts underlying omnibus accounts; therefore, there could be other 5% shareholders in addition to those disclosed in the table above.
10. Capital Shares. The Fund may issue an unlimited number of shares of beneficial interest, without par value. Transactions in capital shares were as follows:
| | | | | | | | | | | | | | | | |
| |
| Year Ended
September 30, 2012 |
| |
| Year Ended
September 30, 2011 |
|
| | | | Shares | | | | Amount | | | | Shares | | | | Amount | |
| Class A | | | | | | | | | | | | | | | | |
Issued from the sale of shares | | | 92,989,022 | | | $ | 1,143,550,708 | | | | 69,625,794 | | | $ | 863,861,783 | |
Issued in connection with the reinvestment of distributions | | | 11,834,759 | | | | 143,943,676 | | | | 13,344,354 | | | | 163,533,181 | |
Redeemed | | | (96,077,704 | ) | | | (1,182,083,038 | ) | | | (106,122,504 | ) | | | (1,311,579,537 | ) |
| | | | | | | | | | | | | | | | |
Net change | | | 8,746,077 | | | $ | 105,411,346 | | | | (23,152,356 | ) | | $ | (284,184,573 | ) |
| | | | | | | | | | | | | | | | |
| Class B | | | | | | | | | | | | | | | | |
Issued from the sale of shares | | | 63,429 | | | $ | 771,205 | | | | 61,769 | | | $ | 756,452 | |
Issued in connection with the reinvestment of distributions | | | 33,273 | | | | 402,324 | | | | 44,034 | | | | 536,387 | |
Redeemed | | | (234,825 | ) | | | (2,875,706 | ) | | | (352,124 | ) | | | (4,333,694 | ) |
| | | | | | | | | | | | | | | | |
Net change | | | (138,123 | ) | | $ | (1,702,177 | ) | | | (246,321 | ) | | $ | (3,040,855 | ) |
| | | | | | | | | | | | | | | | |
| Class C | | | | | | | | | | | | | | | | |
Issued from the sale of shares | | | 30,359,028 | | | $ | 369,971,044 | | | | 22,844,773 | | | $ | 280,915,141 | |
Issued in connection with the reinvestment of distributions | | | 5,302,985 | | | | 63,969,788 | | | | 6,164,352 | | | | 74,907,182 | |
Redeemed | | | (29,338,640 | ) | | | (358,469,801 | ) | | | (63,181,424 | ) | | | (774,669,875 | ) |
| | | | | | | | | | | | | | | | |
Net change | | | 6,323,373 | | | $ | 75,471,031 | | | | (34,172,299 | ) | | $ | (418,847,552 | ) |
| | | | | | | | | | | | | | | | |
| 54
Notes to Financial Statements (continued)
September 30, 2012
10. Capital Shares (continued).
| | | | | | | | | | | | | | | | |
| |
| Year Ended
September 30, 2012 |
| |
| Year Ended
September 30, 2011 |
|
| | | | Shares | | | | Amount | | | | Shares | | | | Amount | |
| Class Y | | | | | | | | | | | | | | | | |
Issued from the sale of shares | | | 213,919,333 | | | $ | 2,639,613,755 | | | | 183,967,802 | | | $ | 2,281,887,609 | |
Issued in connection with the reinvestment of distributions | | | 23,000,671 | | | | 280,416,666 | | | | 19,605,289 | | | | 240,531,850 | |
Redeemed | | | (105,994,304 | ) | | | (1,305,561,746 | ) | | | (139,729,544 | ) | | | (1,726,639,001 | ) |
Redeemed in-kind (Note 10) | | | — | | | | — | | | | (16,974,699 | ) | | | (206,412,335 | ) |
| | | | | | | | | | | | | | | | |
Net change | | | 130,925,700 | | | $ | 1,614,468,675 | | | | 46,868,848 | | | $ | 589,368,123 | |
| | | | | | | | | | | | | | | | |
| Admin Class | | | | | | | | | | | | | | | | |
Issued from the sale of shares | | | 986,859 | | | $ | 12,078,567 | | | | 471,161 | | | $ | 5,852,745 | |
Issued in connection with the reinvestment of distributions | | | 25,251 | | | | 307,704 | | | | 7,731 | | | | 95,009 | |
Redeemed | | | (251,880 | ) | | | (3,084,159 | ) | | | (56,141 | ) | | | (693,953 | ) |
| | | | | | | | | | | | | | | | |
Net change | | | 760,230 | | | $ | 9,302,112 | | | | 422,751 | | | $ | 5,253,801 | |
| | | | | | | | | | | | | | | | |
| Class J | | | | | | | | | | | | | | | | |
Issued from the sale of shares | | | — | | | $ | — | | | | 712,300 | | | $ | 8,854,789 | |
Issued in connection with the reinvestment of distributions | | | — | | | | — | | | | — | | | | — | |
Redeemed* | | | (8,514,614 | ) | | | (102,418,852 | ) | | | (2,804,526 | ) | | | (34,557,395 | ) |
| | | | | | | | | | | | | | | | |
Net change | | | (8,514,614 | ) | | $ | (102,418,852 | ) | | | (2,092,226 | ) | | $ | (25,702,606 | ) |
| | | | | | | | | | | | | | | | |
Increase (decrease) from capital share transactions | | | 138,102,643 | | | $ | 1,700,532,135 | | | | (12,371,603 | ) | | $ | (137,153,662 | ) |
| | | | | | | | | | | | | | | | |
| * | For the period from October 1, 2011 through January 11, 2012. |
11. Redemption In-Kind. In certain circumstances, a Fund may distribute portfolio securities rather than cash as payment for redemption of Fund shares (redemption in-kind). For financial reporting purposes, the Fund will recognize a gain on in-kind redemptions to the extent the value of the distributed securities on the date of redemption exceeds the cost of those securities; the Fund will recognize a loss if the cost exceeds value. Gains and losses realized on redemptions in-kind are not recognized for tax purposes, and are re-classified from realized gain (loss) to paid-in-capital.
55 |
Report of Independent Registered Public Accounting Firm
To the Trustees of Loomis Sayles Funds II and Shareholders of Loomis Sayles Investment Grade Bond Fund:
In our opinion, the accompanying statement of assets and liabilities, including the portfolio of investments, and the related statements of operations and of changes in net assets and the financial highlights present fairly, in all material respects, the financial position of the Loomis Sayles Investment Grade Bond Fund, a series of Loomis Sayles Funds II (the “Fund”), at September 30, 2012, and the results of its operations, the changes in its net assets and the financial highlights for each of the periods indicated, in conformity with accounting principles generally accepted in the United States of America. These financial statements and financial highlights (hereafter referred to as “financial statements”) are the responsibility of the Fund’s management; our responsibility is to express an opinion on these financial statements based on our audits. We conducted our audits of these financial statements in accordance with the standards of the Public Company Accounting Oversight Board (United States). Those standards require that we plan and perform the audits to obtain reasonable assurance about whether the financial statements are free of material misstatement. An audit includes examining, on a test basis, evidence supporting the amounts and disclosures in the financial statements, assessing the accounting principles used and significant estimates made by management, and evaluating the overall financial statement presentation. We believe that our audits, which included confirmation of securities at September 30, 2012 by correspondence with the custodian and brokers, provide a reasonable basis for our opinion.
PricewaterhouseCoopers LLP
Boston, Massachusetts
November 20, 2012
| 56
2012 U.S. Tax Distribution Information to Shareholders (Unaudited)
Corporate Dividends Received Deduction. For the fiscal year ended September 30, 2012, 0.30% of dividends distributed by Investment Grade Bond Fund qualify for the dividends received deduction for corporate shareholders.
Capital Gains Distributions. Pursuant to Internal Revenue Section 852(b), the Investment Grade Bond Fund designated $70,317,816 as capital gains distributions for the fiscal year ended September 30, 2012, unless subsequently determined to be different.
Qualified Dividend Income. For the fiscal year ended September 30, 2012, the Investment Grade Bond Fund will designate up to the maximum amount allowable pursuant to the Internal Revenue Code as qualified dividend income eligible for reduced tax rates. These lower rates range from 0% to 15% depending on an individual’s tax bracket. If the Fund pays a distribution during calendar year 2012, complete information will be reported in conjunction with Form 1099-DIV.
57 |
Trustee and Officer Information
The tables below provide certain information regarding the trustees and officers of Loomis Sayles Funds II (the “Trust”). Unless otherwise indicated, the address of all persons below is 399 Boylston Street, Boston, MA 02116. The Fund’s Statement of Additional Information includes additional information about the trustees of the Trust and is available by calling Natixis Funds at 800-225-5478.
| | | | | | | | |
Name and Year of
Birth | | Position(s) Held with the Trust, Length of Time Served and Term of Office1 | | Principal Occupation(s) During Past 5 Years | | Number of Portfolios in Fund Complex Overseen2 and Other Directorships Held During Past 5 Years | | Experience, Qualifications, Attributes, Skills for Board Membership |
| | | |
| INDEPENDENT TRUSTEES | | | | | | |
| | | | |
Graham T. Allison, Jr. (1940) | | Trustee Since 2003 Contract Review and Governance Committee Member | | Douglas Dillon Professor and Director of the Belfer Center for Science and International Affairs, John F. Kennedy School of Government, Harvard University | | 44 Director, Taubman Centers, Inc. (real estate investment trust) | | Significant experience on the Board of Trustees of the Trust and on the board of other business organizations (including a real estate investment trust); government experience (including as Assistant Secretary of Defense under President Clinton); academic experience |
| | | | |
Charles D. Baker (1956) | | Trustee From 2005 to 2009 and since 2011 Contract Review and Governance Committee Member | | Executive in Residence at General Catalyst Partners (venture capital and growth equity firm); formerly, President and Chief Executive Officer, Harvard Pilgrim Health Care (health care organization) | | 44 None | | Significant experience on the Board of Trustees of the Trust; executive experience (including president and chief executive officer of a health care organization and executive officer of a venture capital and growth equity firm) |
| 58
Trustee and Officer Information
| | | | | | | | |
Name and Year of
Birth | | Position(s) Held with the Trust, Length of Time Served and Term of Office1 | | Principal Occupation(s) During Past 5 Years | | Number of Portfolios in Fund Complex Overseen2 and Other Directorships Held During Past 5 Years | | Experience, Qualifications, Attributes, Skills for Board Membership |
| | | |
INDEPENDENT TRUSTEES continued | | | | | | |
| | | | |
Daniel M. Cain (1945) | | Trustee Since 2003 Chairman of the Contract Review and Governance Committee | | Chairman (formerly, President and Chief Executive Officer) of Cain Brothers & Company, Incorporated (investment banking) | | 44 Director, Sheridan Healthcare Inc. (physician practice management) | | Significant experience on the Board of Trustees of the Trust and on the board of other business organizations (including at a health care organization); experience in the financial industry (including roles as chairman and former chief executive officer of an investment banking firm) |
| | | | |
Kenneth A. Drucker (1945) | | Trustee Since 2008 Chairman of the Audit Committee | | Retired | | 44 Formerly, Director, M Fund, Inc. (investment company); Director, Gateway Trust (investment company) | | Significant experience on the Board of Trustees of the Trust and on the board of other business organizations (including at investment companies); executive experience (including as treasurer of an aerospace, automotive, and metal manufacturing corporation) |
59 |
Trustee and Officer Information
| | | | | | | | |
Name and Year of
Birth | | Position(s) Held with the Trust, Length of Time Served and Term of Office1 | | Principal Occupation(s) During Past 5 Years | | Number of Portfolios in Fund Complex Overseen2 and Other Directorships Held During Past 5 Years | | Experience, Qualifications, Attributes, Skills for Board Membership |
| | | |
INDEPENDENT TRUSTEES continued | | | | | | |
| | | | |
Wendell J. Knox (1948) | | Trustee Since 2009 Audit Committee Member | | Director (formerly, President and Chief Executive Officer) of Abt Associates Inc. (research and consulting) | | 44 Director, Eastern Bank (commercial bank); Director, The Hanover Insurance Group (property and casualty insurance) | | Significant experience on the Board of Trustees of the Trust and on the board of other business organizations (including at a commercial bank and at a property and casualty insurance firm); executive experience (including roles as president and chief executive officer of a consulting company) |
| | | | |
Martin T. Meehan3 (1956) | | Trustee Since 2012 Contract Review and Governance Committee Member | | Chancellor and faculty member, University of Massachusetts Lowell | | 44 Director, Lowell Cooperative Bank (commercial bank); Director, Lowell General Hospital (healthcare); formerly, Director, Qteros, Inc. (biofuels); formerly, Trustee, Suffolk University (education); formerly, Director, D’Youville Foundation (senior care) | | Experience as Chancellor of the University of Massachusetts Lowell; experience on the board of other business organizations; government experience (including as a member of the U.S. House of Representatives); academic experience |
| 60
Trustee and Officer Information
| | | | | | | | |
Name and Year of
Birth | | Position(s) Held with the Trust, Length of Time Served and Term of Office1 | | Principal Occupation(s) During Past 5 Years | | Number of Portfolios in Fund Complex Overseen2 and Other Directorships Held During Past 5 Years | | Experience, Qualifications, Attributes, Skills for Board Membership |
| | | |
INDEPENDENT TRUSTEES continued | | | | | | |
| | | | |
Sandra O. Moose (1942) | | Chairperson of the Board of Trustees since November 2005 Trustee Since 2003 Ex officio member of the Audit Committee and Contract Review and Governance Committee | | President, Strategic Advisory Services (management consulting) | | 44 Director, Verizon Communications; Director, AES Corporation (international power company); formerly, Director, Rohm and Haas Company (specialty chemicals) | | Significant experience on the Board of Trustees of the Trust and on the board of other business organizations (including at an international power company and a specialty chemicals corporation); executive experience (including at a management consulting company) |
| | | | |
Erik R. Sirri (1958) | | Trustee Since 2009 Contract Review and Governance Committee Member | | Professor of Finance at Babson College; formerly, Director of the Division of Trading and Markets at the Securities and Exchange Commission | | 44 None | | Experience on the Board of Trustees of the Trust; experience as Director of the Division of Trading and Markets at the Securities and Exchange Commission; academic experience; training as an economist |
61 |
Trustee and Officer Information
| | | | | | | | |
Name and Year of
Birth | | Position(s) Held with the Trust, Length of Time Served and Term of Office1 | | Principal Occupation(s) During Past 5 Years | | Number of Portfolios in Fund Complex Overseen2 and Other Directorships Held During Past 5 Years | | Experience, Qualifications, Attributes, Skills for Board Membership |
| | | |
INDEPENDENT TRUSTEES continued | | | | | | |
| | | | |
Peter J. Smail (1952) | | Trustee Since 2009 Contract Review and Governance Committee Member | | Retired; formerly, President and Chief Executive Officer of Pyramis Global Advisors (investment management) | | 44 None | | Experience on the Board of Trustees of the Trust; mutual fund industry and executive experience (including roles as president and chief executive officer for an investment adviser) |
| | | | |
Cynthia L. Walker (1956) | | Trustee Since 2005 Audit Committee Member | | Deputy Dean for Finance and Administration, Yale University School of Medicine; formerly, Executive Dean for Administration, Harvard Medical School | | 44 None | | Significant experience on the Board of Trustees of the Trust; executive experience in a variety of academic organizations (including roles as dean for finance and administration) |
| | | |
| INTERESTED TRUSTEES | | | | | | |
| | | | |
Robert J. Blanding4 (1947) 555 California Street San Francisco, CA 94104 | | Trustee Since 2002 Chief Executive Officer since 2002 | | President, Chairman, Director and Chief Executive Officer, Loomis, Sayles & Company, L.P. | | 44 None | | Significant experience on the Board of Trustees of the Trust; continuing service as President, Chairman, and Chief Executive Officer of Loomis, Sayles & Company, L.P. |
| 62
Trustee and Officer Information
| | | | | | | | |
Name and Year of
Birth | | Position(s) Held with the Trust, Length of Time Served and Term of Office1 | | Principal Occupation(s) During Past 5 Years | | Number of Portfolios in Fund Complex Overseen2 and Other Directorships Held During Past 5 Years | | Experience, Qualifications, Attributes, Skills for Board Membership |
| | | |
INTERESTED TRUSTEES continued | | | | | | |
| | | | |
| David L. Giunta5 (1965) | | Trustee Since 2011 President Since 2008 | | President and Chief Executive Officer, NGAM Distribution Corporation, NGAM Advisors, L.P. and NGAM Distribution, L.P.; formerly President, Fidelity Charitable Gift Fund; and formerly, Senior Vice President, Fidelity Brokerage Company | | 44 None | | Experience on the Board of Trustees of the Trust; continuing experience as President and Chief Executive Officer of NGAM Advisors, L.P. |
| | | | |
John T. Hailer6 (1960) | | Trustee Since 2003 | | President and Chief Executive Officer-U.S. and Asia, Natixis Global Asset Management, L.P.; formerly, President and Chief Executive Officer, NGAM Distribution Corporation, NGAM Advisors L.P. and NGAM Distribution, L.P. | | 44 None | | Significant experience on the Board of Trustees of the Trust; continuing experience as Chief Executive Officer-U.S. and Asia, Natixis Global Asset Management, L.P. |
| 1 | Each trustee serves until retirement, resignation or removal from the Board of Trustees of the Trust. The current retirement age is 72. The position of Chairperson of the Board is appointed for a two-year term. Ms. Moose was appointed to serve an additional two year term as the Chairperson of the Board on November 18, 2011. |
| 2 | The trustees of the Trust serve as trustees of a fund complex that includes all series of the Natixis Funds Trust I, Natixis Funds Trust II, Natixis Funds Trust IV and Gateway Trust (collectively, the “Natixis Funds Trusts”), Loomis Sayles Funds I and Loomis Sayles Funds II (collectively, the “Loomis Sayles Funds Trusts”), and Hansberger International Series (collectively, the “Fund Complex”). |
63 |
Trustee and Officer Information
| 3 | Mr. Meehan was appointed as a trustee effective July 1, 2012. |
| 4 | Mr. Blanding is deemed an “interested person” of the Trust because he holds the following positions with an affiliated person of the Trust: President, Chairman, Director and Chief Executive Officer of Loomis, Sayles & Company, L.P. |
| 5 | Mr. Giunta is deemed an “interested person” of the Trust because he holds the following positions with an affiliated person of the Trust: President and Chief Executive Officer of NGAM Distribution Corporation, NGAM Advisors, L.P. and NGAM Distribution, L.P. |
| 6 | Mr. Hailer is deemed an “interested person” of the Trust because he holds the following positions with an affiliated person of the Trust: President and Chief Executive Officer – U.S. and Asia, Natixis Global Asset Management, L.P. |
| 64
Trustee and Officer Information
| | | | | | |
Name and Year of Birth | | Position(s) Held with the
Trust | | Term of Office1 and
Length of Time Served | | Principal Occupation(s)
During Past 5 Years2 |
| | |
| OFFICERS OF THE TRUST | | | | |
| | | |
Coleen Downs Dinneen (1960) | | Secretary, Clerk and Chief Legal Officer | | Since September 2004 | | Executive Vice President, General Counsel, Secretary and Clerk (formerly, Senior Vice President, Deputy General Counsel, Assistant Secretary and Assistant Clerk), NGAM Distribution Corporation, NGAM Advisors, L.P. and NGAM Distribution, L.P. |
| | | |
Daniel J. Fuss (1933) One Financial Center Boston, MA 02111 | | Executive Vice President | | Since June 2003 | | Vice Chairman and Director, Loomis, Sayles & Company, L.P. |
| | | |
Russell L. Kane (1969) | | Chief Compliance Officer, Assistant Secretary and Anti-Money Laundering Officer | | Chief Compliance Officer, since May 2006; Assistant Secretary since June 2004; and Anti-Money Laundering Officer since April 2007 | | Chief Compliance Officer for Mutual Funds, Senior Vice President, Deputy General Counsel, Assistant Secretary and Assistant Clerk, NGAM Distribution Corporation, NGAM Advisors, L.P. and NGAM Distribution, L.P. |
| | | |
Michael C. Kardok (1959) | | Treasurer, Principal Financial and Accounting Officer | | Since October 2004 | | Senior Vice President, NGAM Advisors, L.P. and NGAM Distribution, L.P. |
| 1 | Each officer of the Trust serves for an indefinite term in accordance with the Trust’s current by-laws until the date his or her successor is elected and qualified, or until he or she sooner dies, retires, is removed or becomes disqualified. |
| 2 | Each person listed above, except as noted, holds the same position(s) with the Fund Complex. Mr. Fuss is not an officer of the Natixis Funds Trusts or the Hansberger International Series. Previous positions during the past five years with NGAM Distribution, L.P., NGAM Advisors, L.P. or Loomis, Sayles & Company, L.P. are omitted, if not materially different from a trustee’s or officer’s current position with such entity. |
65 |
ANNUAL REPORT
September 30, 2012

Loomis Sayles Strategic Income Fund
TABLE OF CONTENTS
Portfolio Review page 1
Portfolio of Investments page 13
Financial Statements page 35
Notes to Financial Statements page 41
LOOMIS SAYLES STRATEGIC INCOME FUND
Management Discussion
Managers:
Matthew J. Eagan, CFA
Daniel J. Fuss, CFA, CIC
Kathleen C. Gaffney, CFA*
Elaine M. Stokes
Loomis, Sayles & Company, L.P.
Objective:
Seeks high current income with a secondary objective of capital growth
Strategy:
Invests substantially all of its assets in income-producing securities in the U.S. and around the world
Symbols:
| | |
| Class A | | NEFZX |
| Class B | | NEZBX |
| Class C | | NECZX |
| Class Y | | NEZYX |
| Admin Class | | NEZAX |
| * | Effective October 22, 2012, Kathleen Gaffney no longer serves as a portfolio manager of the fund. |
Market Conditions
Geopolitical events dominated the headlines during the 12-month period that ended September 30, 2012. The financial markets generally moved in concert with developments and setbacks tied to the European sovereign debt crisis and the nascent economic recovery in the United States. Domestic economic data turned somewhat positive but remained markedly weak, underscoring the fragility of the U.S. recovery. This, in conjunction with the potential for fresh volatility stemming from the upcoming presidential election and pending “fiscal cliff” of federal tax hikes and spending cuts, resulted in expectations for action from the Federal Reserve (the Fed). This anticipation and eventual Fed intervention generally supported the credit markets during the second half of the period. Meanwhile, after months of debate, the European Central Bank agreed to decisive policy steps to help stabilize the ailing euro. This action helped ease investor fears and alleviate the risk aversion that had dominated the market.
Performance Results
For the 12 months ended September 30, 2012, Class A shares of Loomis Sayles Strategic Income Fund returned 14.02% at net asset value. The fund outperformed its benchmark, the Barclays U.S. Aggregate Bond Index, which returned 5.16% for the period. The fund outperformed the 12.54% average return of funds in its peer group, the Morningstar Multisector Bond category.
Explanation of Fund Performance
The fund benefited from the heightened liquidity and elevated demand for yield prevalent during the 12-month period. In particular, out-of-benchmark allocations drove the fund’s relative outperformance. The fund’s non-U.S.-dollar-denominated holdings contributed the most to relative performance, as investors turned away from traditional “safe-haven” securities in their search for yield. The euro climbed markedly late in the period and was the overall winner
1 |
among the fund’s foreign-currency-denominated issues. The New Zealand dollar, Australian dollar and Canadian dollar also posted positive results. In addition, the fund’s exposure to high-yield securities benefitted from a robust new issuance market, supported by the Fed’s assurance that interest rates would remain low into 2015. Within high yield, the industrial sector contributed the most to returns, buoyed by strong showings from individual names, while the financial and utility sectors also proved additive. Exposure to convertible securities also boosted performance. Convertibles trended higher alongside equities, which climbed during the period.
An underweight position in commercial mortgage-backed securities, which were strong performers during the period, detracted from relative returns. In addition, the fund’s allocation to sovereign issues weighed on performance, largely due to certain issues denominated in the Swiss franc and Norwegian krone. Exposure to investment-grade utilities detracted from performance, as the traditionally defensive sector was out of favor for much of the period.
Outlook
Unprecedented monetary support in both the United States and Europe continues to largely dictate market sentiment and flows, while preserving low interest rates. Investor desire for yield in this environment will most likely support sustained demand in the corporate arena. Fundamental credit quality in the corporate sector remains a source of confidence for investors. However, if economic conditions continue to deteriorate globally, the challenge of investing in stable to improving companies will become more challenging.
The U.S. elections, pending “fiscal cliff” and increasingly weakening economic conditions in Europe, China and the United States are all situations that could potentially provide market volatility and opportunities. We consider recent positive developments in the U.S. housing market along with the Fed’s latest purchase program in the mortgage market to be sources of good news on the economic front and view the sectors as continuing opportunities. Our strategy of populating the fund with individual specific-risks ideas remains an important theme, as do the concepts of yield advantage and investing with a long-term horizon in mind. Macroeconomic developments continue to dominate the headlines and market flows, but our belief that owning quality companies based on fundamentals continues to serve us well and will drive our investment process through the rest of this calendar year.
| 2
LOOMIS SAYLES STRATEGIC INCOME FUND
Investment Results through September 30, 2012
Growth of a $10,000 Investment in Class A Shares6
September 30, 2002 through September 30, 2012
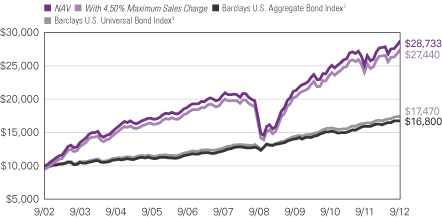
3 |
Average Annual Total Returns — September 30, 20126
| | | | | | | | | | | | |
| | | | |
| | | 1 Year | | | 5 Years | | | 10 Years | |
| | | | |
| Class A (Inception 5/1/95) | | | | | | | | | | | | |
| NAV | | | 14.02 | % | | | 6.89 | % | | | 11.13 | % |
| With 4.50% Maximum Sales Charge | | | 10.00 | | | | 6.13 | | | | 10.74 | |
| | | | |
| Class B (Inception 5/1/95) | | | | | | | | | | | | |
| NAV | | | 13.15 | | | | 6.10 | | | | 10.31 | |
| With CDSC2 | | | 8.15 | | | | 5.78 | | | | 10.31 | |
| | | | |
| Class C (Inception 5/1/95) | | | | | | | | | | | | |
| NAV | | | 13.18 | | | | 6.10 | | | | 10.31 | |
| With CDSC2 | | | 12.18 | | | | 6.10 | | | | 10.31 | |
| | | | |
| Class Y (Inception 12/1/99) | | | | | | | | | | | | |
| NAV | | | 14.31 | | | | 7.16 | | | | 11.43 | |
| | | | |
| Admin Class (Inception 2/1/10)1 | | | | | | | | | | | | |
| NAV | | | 13.79 | | | | 6.59 | | | | 10.80 | |
| | | | |
| Comparative Performance | | | | | | | | | | | | |
| Barclays U.S. Aggregate Bond Index3 | | | 5.16 | | | | 6.53 | | | | 5.32 | |
| Barclays U.S. Universal Bond Index4 | | | 6.45 | | | | 6.63 | | | | 5.74 | |
| Morningstar Multisector Bond Fund Average5 | | | 12.54 | | | | 6.69 | | | | 7.90 | |
Past performance does not guarantee future results. The chart and table do not reflect taxes shareholders might owe on any fund distributions or when they redeem their shares. Returns reflect changes in share price and reinvestment of dividends and capital gains, if any. Unlike a fund, an index is not managed and does not reflect fees and expenses.
| 1 | Prior to the inception of Admin Class shares (2/1/10), performance is that of Class A shares, restated to reflect the higher net expenses of Admin Class shares. |
| 2 | Performance for Class B shares assumes a maximum 5% contingent deferred sales charge (“CDSC”) applied when you sell shares, which declines annually between years 1-6 according to the following schedule: 5, 4, 3, 3, 2, 1, 0%. Class C share performance assumes a 1% CDSC applied when you sell shares within one year of purchase. |
| 3 | Barclays U.S. Aggregate Bond Index is an unmanaged index that covers the U.S.-dollar denominated, investment-grade, fixed-rate, taxable bond market of SEC-registered securities. The index includes bonds from the Treasury, government-related, corporate, mortgage-backed securities, asset-backed securities, and collateralized mortgage-backed securities sectors. |
| 4 | Barclays U.S. Universal Bond Index is an unmanaged index that covers U.S. dollar-denominated taxable bonds, including U.S. government and investment grade debt, non-investment grade debt, asset-backed and mortgage-backed securities, Eurobonds, 144A securities and emerging market debt. |
| 5 | Morningstar Multisector Bond Fund Average is the average performance without sales charges of funds with similar investment objectives, as calculated by Morningstar, Inc. |
| 6 | Fund performance has been increased by fee waivers and/or expense reimbursements, if any, without which performance would have been lower. |
| 4
ADDITIONAL INFORMATION
The views expressed in this report reflect those of the portfolio managers as of the dates indicated. The managers’ views are subject to change at any time without notice based on changes in market or other conditions. References to specific securities or industries should not be regarded as investment advice. Because the fund is actively managed, there is no assurance that it will continue to invest in the securities, countries or industries mentioned.
PROXY VOTING INFORMATION
A description of the fund’s proxy voting policies and procedures is available without charge, upon request, by calling Natixis Funds at 800-225-5478; on the fund’s website at ngam.natixis.com; and on the Securities and Exchange Commission’s (SEC’s) website at www.sec.gov. Information regarding how the fund voted proxies relating to portfolio securities during the 12-month period ended June 30, 2012 is available from the fund’s website and the SEC’s website.
QUARTERLY PORTFOLIO SCHEDULES
The fund files a complete schedule of portfolio holdings with the SEC for the first and third quarters of each fiscal year on Form N-Q. The fund’s Forms N-Q are available on the SEC’s website at www.sec.gov and may be reviewed and copied at the SEC’s Public Reference Room in Washington, DC. Information on the operation of the Public Reference Room may be obtained by calling 800-SEC-0330.
5 |
UNDERSTANDING YOUR FUND’S EXPENSES
As a mutual fund shareholder, you incur different types of costs: transaction costs, including sales charges (loads) on purchases and contingent deferred sales charges on redemptions; and ongoing costs, including management fees, distribution fees (12b-1 fees) and/or service fees, and other fund expenses. These costs are described in more detail in the fund’s prospectus. The examples below are intended to help you understand the ongoing costs of investing in the fund and help you compare these with the ongoing costs of investing in other mutual funds.
The first line in the table for each class shows the actual amount of fund expenses you would have paid on a $1,000 investment in the fund from April 1, 2012 through September 30, 2012. It also shows how much a $1,000 investment would be worth at the close of the period, assuming actual fund returns and expenses. To estimate the expenses you paid over the period, simply divide your account value by $1,000 (for example $8,600 account value divided by $1,000 =8.60) and multiply the result by the number in Expenses Paid During Period column as shown below for your class.
The second line in the table for each class provides information about hypothetical account values and hypothetical expenses based on the fund’s actual expense ratios and an assumed rate of return of 5% per year before expenses, which is not the fund’s actual return. The hypothetical account values and expenses may not be used to estimate the actual ending account balance or expenses you paid on your investment for the period. You may use this information to compare the ongoing costs of investing in the fund and other funds. To do so, compare this 5% hypothetical example with the 5% hypothetical examples that appear in the shareholder reports of the other funds.
Please note that the expenses shown reflect ongoing costs only, and do not include any transaction costs. Therefore, the second line in the table of the fund is useful in comparing ongoing costs only, and will not help you determine the relative costs of owning different funds. If transaction costs were included, total costs would be higher.
| 6
| | | | | | | | | | | | |
| LOOMIS SAYLES STRATEGIC INCOME FUND | | BEGINNING
ACCOUNT VALUE
4/1/2012 | | | ENDING
ACCOUNT VALUE
9/30/2012 | | | EXPENSES PAID
DURING PERIOD*
4/1/2012 – 9/30/2012 | |
Class A | | | | | | | | | | | | |
Actual | | | $1,000.00 | | | | $1,033.10 | | | | $4.88 | |
Hypothetical (5% return before expenses) | | | $1,000.00 | | | | $1,020.20 | | | | $4.85 | |
Class B | | | | | | | | | | | | |
Actual | | | $1,000.00 | | | | $1,029.60 | | | | $8.68 | |
Hypothetical (5% return before expenses) | | | $1,000.00 | | | | $1,016.45 | | | | $8.62 | |
Class C | | | | | | | | | | | | |
Actual | | | $1,000.00 | | | | $1,029.70 | | | | $8.68 | |
Hypothetical (5% return before expenses) | | | $1,000.00 | | | | $1,016.45 | | | | $8.62 | |
Class Y | | | | | | | | | | | | |
Actual | | | $1,000.00 | | | | $1,034.40 | | | | $3.61 | |
Hypothetical (5% return before expenses) | | | $1,000.00 | | | | $1,021.45 | | | | $3.59 | |
Admin Class | | | | | | | | | | | | |
Actual | | | $1,000.00 | | | | $1,032.60 | | | | $6.15 | �� |
Hypothetical (5% return before expenses) | | | $1,000.00 | | | | $1,018.95 | | | | $6.11 | |
| * | Expenses are equal to the Fund’s annualized expense ratio: 0.96%, 1.71%, 1.71%, 0.71% and 1.21% for Class A, B, C, Y and Admin Class, respectively, multiplied by the average account value over the period, multiplied by the number of days in the most recent fiscal half-year, divided by 366 (to reflect the half-year period). |
7 |
BOARD APPROVAL OF THE EXISTING ADVISORY AGREEMENT
The Board of Trustees of the Trust, including the Independent Trustees, considers matters bearing on the Fund’s advisory agreement (the “Agreement”) at most of its meetings throughout the year. Each year, usually in the spring, the Contract Review and Governance Committee of the Board meets to review the Agreement to determine whether to recommend that the full Board approve the continuation of the Agreement, typically for an additional one-year period. After the Committee has made its recommendation, the full Board, including the Independent Trustees, determines whether to approve the continuation of the Agreement.
In connection with these meetings, the Trustees receive materials that the Fund’s investment adviser (the “Adviser”) believes to be reasonably necessary for the Trustees to evaluate the Agreement. These materials generally include, among other items, (i) information on the investment performance of the Fund and the performance of a peer group of funds and the Fund’s performance benchmarks, (ii) information on the Fund’s advisory fees and other expenses, including information comparing the Fund’s expenses to the fees charged to institutional accounts with similar strategies managed by the Adviser and to those of a peer group of funds and information about any applicable expense caps and fee “breakpoints,” (iii) sales and redemption data in respect of the Fund, (iv) information about the profitability of the Agreement to the Adviser and (v) information obtained through the completion by the Adviser of a questionnaire distributed on behalf of the Trustees. The Board of Trustees, including the Independent Trustees, also consider other matters such as (i) the Adviser’s financial results and financial condition, (ii) the Fund’s investment objective and strategies and the size, education and experience of the Adviser’s investment staff and its use of technology, external research and trading cost measurement tools, (iii) arrangements in respect of the distribution of the Fund’s shares and the related costs, (iv) the procedures employed to determine the value of the Fund’s assets, (v) the allocation of the Fund’s brokerage, if any, including, if applicable, allocations to brokers affiliated with the Adviser and the use of “soft” commission dollars to pay Fund expenses and to pay for research and other similar services, (vi) the resources devoted to, and the record of compliance with, the Fund’s investment policies and restrictions, policies on personal securities transactions and other compliance policies, (vii) information about amounts invested by the Fund’s portfolio managers in the Fund or in similar accounts that they manage and (viii) the general economic outlook with particular emphasis on the mutual fund industry. Throughout the process, the Trustees are afforded the opportunity to ask questions of and request additional materials from the Adviser.
In addition to the materials requested by the Trustees in connection with their annual consideration of the continuation of the Agreement, the Trustees receive materials in advance of each regular quarterly meeting of the Board of Trustees of the Trust that provide detailed information about the Fund’s investment performance and the fees charged to the Fund for advisory and other services. This information generally includes, among other things, an internal performance rating for the Fund based on agreed-upon criteria, graphs showing the Fund’s performance and fee differentials against the Fund’s
| 8
peer group/category, performance ratings provided by a third-party, total return information for various periods, and third-party performance rankings for various periods comparing the Fund against similarly categorized funds. The portfolio management team for the Fund or other representatives of the Adviser make periodic presentations to the Contract Review and Governance Committee and/or the full Board of Trustees of the Trust, and if the Fund is identified as presenting possible performance concerns it may be subject to more frequent board presentations and reviews. In addition, each quarter the Trustees are provided with detailed statistical information about the Fund’s portfolio. The Trustees also receive periodic updates between meetings.
The Board of Trustees of the Trust most recently approved the continuation of the Agreement at their meeting held in June 2012. The Agreement was continued for a one-year period for the Fund. In considering whether to approve the continuation of the Agreement, the Board of Trustees of the Trust, including the Independent Trustees, did not identify any single factor as determinative. Individual Trustees may have evaluated the information presented differently from one another, giving different weights to various factors. Matters considered by the Trustees, including the Independent Trustees, in connection with their approval of the Agreement included, but were not limited to, the factors listed below.
The nature, extent and quality of the services provided to the Fund under the Agreement. The Trustees considered the nature, extent and quality of the services provided by the Adviser and its affiliates to the Fund and the resources dedicated to the Fund by the Adviser and its affiliates.
The Trustees considered not only the advisory services provided by the Adviser to the Fund, but also the administrative services provided by NGAM Advisors, L.P. (“NGAM Advisors”) and its affiliates to the Fund.
The Trustees also considered the benefits to shareholders of investing in a mutual fund that is part of a family of funds that offers shareholders the right to exchange shares of one type of fund for shares of another type of fund, and provides a variety of fund and shareholder services.
After reviewing these and related factors, the Trustees concluded, within the context of their overall conclusions regarding the Agreement, that the nature, extent and quality of services provided supported the renewal of the Agreement.
Investment performance of the Fund and the Adviser. As noted above, the Trustees received information about the performance of the Fund over various time periods, including information which compared the performance of the Fund to the performance of similarly categorized funds and the Fund’s performance benchmarks. In addition, the Trustees also reviewed data prepared by an independent third party which analyzed the performance of the Fund using a variety of performance metrics, including metrics which also measured the performance of the Fund on a risk adjusted basis.
The Board concluded that the Fund’s performance or other relevant factors supported the renewal of the Agreement. Although the Trustees noted that the Fund had performance that lagged that of a relevant peer group median and/or category median for certain (although not necessarily all) periods, the Board concluded that other factors relevant to
9 |
performance supported renewal of the Agreement. These factors included the following: (1) that underperformance was attributable, to a significant extent, to investment decisions (such as security selection or sector allocation) by the Adviser that were reasonable and consistent with the Fund’s investment objective and policies and (2) that the Fund’s performance was stronger over the long term.
The Trustees also considered the Adviser’s performance and reputation generally, the performance of the fund family generally (as noted by certain financial publications), and the historical responsiveness of the Adviser to Trustee concerns about performance and the willingness of the Adviser to take steps intended to improve performance.
After reviewing these and related factors, the Trustees concluded, within the context of their overall conclusions regarding each of the Agreement, that the performance of the Fund and the Adviser and/or other relevant factors supported the renewal of the Agreement.
The costs of the services to be provided and profits to be realized by the Adviser and its affiliates from their respective relationships with the Fund. The Trustees considered the fees charged to the Fund for advisory services as well as the total expense levels of the Fund. This information included comparisons (provided both by management and also by an independent third party) of the Fund’s advisory fees and total expense levels to those of its peer group and information about the advisory fees charged by the Adviser to comparable accounts (such as institutional separate accounts), as well as information about differences in such fees and the reasons for any such differences. In considering the fees charged to comparable accounts, the Trustees considered, among other things, management’s representations about the differences between managing mutual funds as compared to other types of accounts, including the additional resources required to effectively manage and the greater regulatory costs associated with the management of mutual fund assets. In evaluating the Fund’s advisory fee, the Trustees also took into account the demands, complexity and quality of the investment management of the Fund, as well as the need for the Adviser to offer competitive compensation and to expend additional resources as the Fund grows in size. The Trustees considered that over the past several years, management had made recommendations regarding reductions in advisory fee rates, implementation of advisory fee breakpoints and the institution of advisory fee waivers and expense caps for various funds in the fund family. They noted that, as of December 31, 2011, the Fund has an expense cap in place, and the Trustees considered that the current expenses are below the cap. The Trustees noted that the Fund had an advisory fee rate that was above the median of a peer group of funds. The Trustees considered the factors which management believed justified such relatively higher fees, including that: (1) the Fund’s advisory fee rate was only slightly above its peer group median and (2) the Fund had not yet reached asset levels at which the advisory fee breakpoints would have an impact on fees.
The Trustees also considered the compensation directly or indirectly received by the Adviser and its affiliates from their relationships with the Fund. The Trustees reviewed information provided by management as to the profitability of the Adviser’s and its affiliates’ relationships with the Fund, and information about the allocation of expenses used to calculate profitability. They also reviewed information provided by management about the effect of distribution costs and changes in asset levels on Adviser profitability,
| 10
including information regarding resources spent on distribution activities. When reviewing profitability, the Trustees also considered information about court cases in which adviser compensation or profitability were issues, the performance of the Fund, the expense levels of the Fund, whether the Adviser had implemented breakpoints and/or expense caps with respect to the Fund and the overall profit margin of the Adviser compared to other investment managers.
After reviewing these and related factors, the Trustees concluded, within the context of their overall conclusions regarding the Agreement, that the advisory fee charged to the Fund was fair and reasonable, and that the costs of these services generally and the related profitability of the Adviser and its affiliates in respect of their relationships with the Fund supported the renewal of the Agreement.
Economies of Scale. The Trustees considered the existence of any economies of scale in the provision of services by the Adviser and whether those economies are shared with the Fund through breakpoints in its investment advisory fees or other means, such as expense waivers or caps. The Trustees also discussed with management the factors considered with respect to the implementation of breakpoints in investment advisory fees or expense waivers or caps for certain funds. Management explained that a number of factors are taken into account in considering the possible implementation of breakpoints or an expense cap for a fund, including, among other things, factors such as a fund’s assets, the projected growth of a fund, projected profitability and a fund’s fees and performance. With respect to economies of scale, the Trustees noted the Fund is subject to breakpoints in its advisory fees. The Trustees further noted that the Fund was subject to an expense cap or waiver. In considering these issues, the Trustees also took note of the costs of the services provided (both on an absolute and a relative basis) and the profitability to the Adviser and its affiliates of their relationships with the Fund, as discussed above.
After reviewing these and related factors, the Trustees concluded, within the context of their overall conclusions regarding the Agreement, that the extent to which economies of scale were shared with the Fund supported the renewal of the Agreement.
The Trustees also considered other factors, which included but were not limited to the following:
| · | | The effect of recent market and economic events on the performance, asset levels and expense ratios of the Fund. |
| · | | Whether the Fund has operated in accordance with its investment objective and the Fund’s record of compliance with its investment restrictions, and the compliance programs of the Fund and the Adviser. They also considered the compliance-related resources the Adviser and its affiliates were providing to the Fund. |
| · | | The nature, quality, cost and extent of administrative and shareholder services performed by the Adviser and its affiliates, both under the Agreement and under a separate agreement covering administrative services. |
11 |
| · | | So-called “fallout benefits” to the Adviser, such as the engagement of affiliates of the Adviser to provide distribution, administrative and brokerage services to the Fund, and the benefits of research made available to the Adviser by reason of brokerage commissions (if any) generated by the Fund’s securities transactions. The Trustees also considered the fact that NGAM Advisors’ parent company benefits from the retention of an affiliated Adviser. The Trustees considered the possible conflicts of interest associated with these fallout and other benefits, and the reporting, disclosure and other processes in place to disclose and monitor such possible conflicts of interest. |
| · | | The Trustees’ review and discussion of the Fund’s advisory arrangements in prior years, and management’s record of responding to Trustee concerns raised during the year and in prior years. |
Based on their evaluation of all factors that they deemed to be material, including those factors described above, and assisted by the advice of independent counsel, the Trustees, including the Independent Trustees, concluded that the existing Agreement should be continued through June 30, 2013.
| 12
Portfolio of Investments – as of September 30, 2012
Loomis Sayles Strategic Income Fund
| | | | | | | | |
Principal
Amount (‡) | | | Description | | Value (†) | |
| | Bonds and Notes — 71.5% of Net Assets | |
| | Non-Convertible Bonds — 63.3% | |
| | | | ABS Car Loan — 0.0% | |
| $ | 4,093,750 | | | Avis Budget Rental Car Funding AESOP LLC, Series 2010-5A, Class B,
5.110%, 3/20/2017, 144A | | $ | 4,480,278 | |
| | | | | | | | |
| | | | Aerospace & Defense — 0.3% | |
| | 620,000 | | | Bombardier, Inc., 7.350%, 12/22/2026, 144A, (CAD) | | | 664,985 | |
| | 11,800,000 | | | Bombardier, Inc., 7.450%, 5/01/2034, 144A | | | 12,036,000 | |
| | 2,425,000 | | | Ducommun, Inc., 9.750%, 7/15/2018 | | | 2,558,375 | |
| | 8,236,000 | | | Meccanica Holdings USA, Inc., 6.250%, 7/15/2019, 144A | | | 7,762,570 | |
| | 5,436,000 | | | Meccanica Holdings USA, Inc., 6.250%, 1/15/2040, 144A | | | 4,454,498 | |
| | 20,755,000 | | | Meccanica Holdings USA, Inc., 7.375%, 7/15/2039, 144A | | | 18,366,701 | |
| | 5,310,000 | | | Textron Financial Corp., (fixed rate to 2/15/2017, variable rate thereafter),
6.000%, 2/15/2067, 144A | | | 4,433,850 | |
| | | | | | | | |
| | | | | | | 50,276,979 | |
| | | | | | | | |
| | | | Airlines — 2.6% | |
| | 35,455,000 | | | Air Canada, 10.125%, 8/01/2015, 144A, (CAD) | | | 37,326,747 | |
| | 38,693 | | | Continental Airlines Pass Through Trust, Series 1996-1, Class A,
6.940%, 4/15/2015 | | | 38,984 | |
| | 1,116,353 | | | Continental Airlines Pass Through Trust, Series 1997-1, Class A,
7.461%, 10/01/2016 | | | 1,172,171 | |
| | 1,777,301 | | | Continental Airlines Pass Through Trust, Series 1997-4, Class B,
6.900%, 7/02/2018 | | | 1,848,393 | |
| | 1,992,872 | | | Continental Airlines Pass Through Trust, Series 1998-1, Class B,
6.748%, 9/15/2018 | | | 2,092,516 | |
| | 3,297,567 | | | Continental Airlines Pass Through Trust, Series 1999-1, Class B,
6.795%, 2/02/2020 | | | 3,495,421 | |
| | 2,231,607 | | | Continental Airlines Pass Through Trust, Series 1999-2, Class B,
7.566%, 9/15/2021 | | | 2,387,819 | |
| | 1,273,967 | | | Continental Airlines Pass Through Trust, Series 2000-1, Class A-1,
8.048%, 5/01/2022 | | | 1,455,507 | |
| | 1,473,632 | | | Continental Airlines Pass Through Trust, Series 2000-2, Class A-1,
7.707%, 10/02/2022 | | | 1,646,784 | |
| | 2,962,404 | | | Continental Airlines Pass Through Trust, Series 2000-2, Class B,
8.307%, 10/02/2019 | | | 3,169,772 | |
| | 1,860,333 | | | Continental Airlines Pass Through Trust, Series 2001-1, Class A-1,
6.703%, 12/15/2022 | | | 2,020,303 | |
| | 1,063,631 | | | Continental Airlines Pass Through Trust, Series 2001-1, Class B,
7.373%, 6/15/2017 | | | 1,139,468 | |
| | 10,866,506 | | | Continental Airlines Pass Through Trust, Series 2007-1, Class A,
5.983%, 10/19/2023 | | | 12,116,154 | |
| | 18,741,526 | | | Continental Airlines Pass Through Trust, Series 2007-1, Class B,
6.903%, 10/19/2023 | | | 19,677,478 | |
| | 17,148,751 | | | Continental Airlines Pass Through Trust, Series 2009-1, 9.000%, 1/08/2018 | | | 19,806,808 | |
| | 15,712,916 | | | Continental Airlines Pass Through Trust, Series 2009-2, Class A,
7.250%, 5/10/2021 | | | 17,952,007 | |
See accompanying notes to financial statements.
13 |
Portfolio of Investments – as of September 30, 2012
Loomis Sayles Strategic Income Fund – (continued)
| | | | | | | | |
Principal
Amount (‡) | | | Description | | Value (†) | |
| | | | Airlines — continued | |
| $ | 3,980,000 | | | Continental Airlines Pass Through Trust, Series 2012-1, Class B,
6.250%, 10/22/2021 | | $ | 4,119,300 | |
| | 1,285,967 | | | Delta Air Lines Pass Through Trust, Series 2007-1, Class A,
6.821%, 2/10/2024 | | | 1,420,994 | |
| | 6,417,317 | | | Delta Air Lines Pass Through Trust, Series 2007-1, Class B,
8.021%, 2/10/2024 | | | 6,930,702 | |
| | 20,642,922 | | | Delta Air Lines Pass Through Trust, Series 2007-1, Class C,
8.954%, 8/10/2014 | | | 21,185,831 | |
| | 1,900,639 | | | Northwest Airlines, Inc., Series 2002-1, Class G2, (MBIA insured),
6.264%, 5/20/2023 | | | 2,005,175 | |
| | 1,500,000 | | | Qantas Airways Ltd., 5.125%, 6/20/2013, 144A | | | 1,519,614 | |
| | 29,995,000 | | | Qantas Airways Ltd., 6.050%, 4/15/2016, 144A | | | 30,942,782 | |
| | 17,663,390 | | | UAL Pass Through Trust, Series 2007-1, Class A, 6.636%, 1/02/2024 | | | 18,458,243 | |
| | 8,245,091 | | | UAL Pass Through Trust, Series 2009-1, 10.400%, 5/01/2018 | | | 9,502,467 | |
| | 16,831,237 | | | US Airways Pass Through Trust, Series 2010-1B, Class B,
8.500%, 10/22/2018 | | | 17,252,018 | |
| | 40,155,931 | | | US Airways Pass Through Trust, Series 2010-1C, Class C,
11.000%, 10/22/2014, 144A | | | 41,159,829 | |
| | 51,235,705 | | | US Airways Pass Through Trust, Series 2011-1B, Class B,
9.750%, 4/22/2020 | | | 53,797,490 | |
| | 21,811,204 | | | US Airways Pass Through Trust, Series 2011-1C, Class C,
10.875%, 10/22/2014 | | | 22,356,484 | |
| | 14,095,000 | | | US Airways Pass Through Trust, Series 2012-1A, Class A,
5.900%, 4/01/2026 | | | 14,905,463 | |
| | 7,280,000 | | | US Airways Pass Through Trust, Series 2012-1B, Class B,
8.000%, 4/01/2021 | | | 7,498,400 | |
| | 5,680,000 | | | US Airways Pass Through Trust, Series 2012-1C, Class C,
9.125%, 10/01/2015 | | | 5,765,200 | |
| | | | | | | | |
| | | | | | | 386,166,324 | |
| | | | | | | | |
| | | | Automotive — 0.9% | |
| | 265,000 | | | ArvinMeritor, Inc., 8.125%, 9/15/2015 | | | 278,250 | |
| | 3,800,000 | | | Chrysler Group LLC/CG Co-Issuer, Inc., 8.250%, 6/15/2021 | | | 4,047,000 | |
| | 19,011,000 | | | Ford Motor Co., 6.375%, 2/01/2029 | | | 20,702,789 | |
| | 1,220,000 | | | Ford Motor Co., 6.625%, 2/15/2028 | | | 1,319,268 | |
| | 74,829,000 | | | Ford Motor Co., 6.625%, 10/01/2028 | | | 83,572,170 | |
| | 2,365,000 | | | Ford Motor Co., 7.125%, 11/15/2025 | | | 2,672,450 | |
| | 1,345,000 | | | Ford Motor Co., 7.500%, 8/01/2026 | | | 1,550,113 | |
| | 6,000,000 | | | Goodyear Tire & Rubber Co. (The), 7.000%, 5/15/2022 | | | 6,360,000 | |
| | 4,977,000 | | | Goodyear Tire & Rubber Co. (The), 7.000%, 3/15/2028 | | | 4,989,442 | |
| | | | | | | | |
| | | | | | | 125,491,482 | |
| | | | | | | | |
| | | | Banking — 6.0% | |
| | 1,175,000 | | | AgriBank FCB, 9.125%, 7/15/2019, 144A | | | 1,559,360 | |
| | 20,565,000 | | | Associates Corp. of North America, 6.950%, 11/01/2018 | | | 24,727,706 | |
| | 1,675,000 | | | Bank of America Corp., 5.420%, 3/15/2017 | | | 1,810,588 | |
| | 900,000 | | | Bank of America Corp., 5.490%, 3/15/2019 | | | 980,518 | |
| | 265,000 | | | Bank of America Corp., MTN, 5.000%, 5/13/2021 | | | 291,283 | |
See accompanying notes to financial statements.
| 14
Portfolio of Investments – as of September 30, 2012
Loomis Sayles Strategic Income Fund – (continued)
| | | | | | | | |
Principal
Amount (‡) | | | Description | | Value (†) | |
| | | | Banking — continued | |
| | 1,000,000 | | | Bank of America Corp., MTN, 6.750%, 9/09/2013, (AUD) | | $ | 1,061,917 | |
| | 1,500,000 | | | Bank of America Corp., Series K, (fixed rate to 1/30/2018, variable rate thereafter), 8.000%, 12/29/2049 | | | 1,633,410 | |
| | 8,020,000 | | | Bank of America NA, 5.300%, 3/15/2017 | | | 8,905,761 | |
| | 1,130,000 | | | Barclays Bank PLC, (fixed rate to 12/15/2017, variable rate thereafter),
6.000%, 6/29/2049, (GBP) | | | 1,304,677 | |
| | 39,890,000,000 | | | Barclays Bank PLC, EMTN, 3.680%, 8/20/2015, (KRW) | | | 36,742,910 | |
| | 7,320,000 | | | Barclays Bank PLC, EMTN, (fixed rate to 3/15/2020, variable rate thereafter), 4.750%, 3/29/2049, (EUR) | | | 5,686,268 | |
| | 57,792,000,000 | | | Barclays Financial LLC, EMTN, 3.500%, 11/29/2016, (KRW) | | | 53,157,668 | |
| | 1,600,000 | | | BNP Paribas S.A., (fixed rate to 4/13/2017, variable rate thereafter),
5.019%, 4/29/2049, (EUR) | | | 1,727,964 | |
| | 5,331,000 | | | BNP Paribas S.A., (fixed rate to 6/29/2015, variable rate thereafter),
5.186%, 6/29/2049, 144A | | | 4,904,520 | |
| | 4,000,000 | | | Citigroup, Inc., 5.365%, 3/06/2036, (CAD)(b) | | | 3,496,857 | |
| | 350,000 | | | Citigroup, Inc., 5.850%, 12/11/2034 | | | 413,340 | |
| | 24,610,000 | | | Citigroup, Inc., 5.875%, 2/22/2033 | | | 25,992,344 | |
| | 8,999,000 | | | Citigroup, Inc., 6.000%, 10/31/2033 | | | 9,701,588 | |
| | 6,060,000 | | | Citigroup, Inc., 6.125%, 8/25/2036 | | | 6,580,263 | |
| | 22,091,000 | | | Citigroup, Inc., 6.250%, 6/29/2017, (NZD) | | | 18,800,082 | |
| | 3,350,000 | | | Citigroup, Inc., EMTN, (fixed rate to 11/30/2012, variable rate thereafter),
3.625%, 11/30/2017, (EUR) | | | 3,874,425 | |
| | 3,035,000 | | | Cooperatieve Centrale Raiffeisen-Boerenleenbank BA/Utrect,
3.375%, 1/19/2017 | | | 3,221,379 | |
| | 17,730,000 | | | Cooperatieve Centrale Raiffeisen-Boerenleenbank BA/Utrect,
3.875%, 2/08/2022 | | | 18,816,672 | |
| | 400,000 | | | Goldman Sachs Group, Inc. (The), 6.450%, 5/01/2036 | | | 419,108 | |
| | 34,060,000 | | | Goldman Sachs Group, Inc. (The), 6.750%, 10/01/2037 | | | 36,487,865 | |
| | 6,120,000 | | | HBOS PLC, 6.000%, 11/01/2033, 144A | | | 5,193,738 | |
| | 50,604,000 | | | HBOS PLC, GMTN, 6.750%, 5/21/2018, 144A | | | 51,363,060 | |
| | 9,090,000 | | | ICICI Bank Ltd., (fixed rate to 4/30/2017, variable rate thereafter),
6.375%, 4/30/2022, 144A | | | 9,090,000 | |
| | 260,000,000,000 | | | JPMorgan Chase & Co., EMTN, 7.070%, 3/22/2014, (IDR) | | | 26,994,357 | |
| | 227,000,000,000 | | | JPMorgan Chase Bank NA, 7.700%, 6/01/2016, 144A, (IDR) | | | 24,924,932 | |
| | 7,300,000 | | | Lloyds Banking Group PLC, (fixed rate to 10/01/2015, variable rate thereafter), 5.920%, 9/29/2049, 144A | | | 4,818,000 | |
| | 27,555,000 | | | Lloyds TSB Bank PLC, MTN, 6.500%, 9/14/2020, 144A | | | 29,026,437 | |
| | 3,010,000 | | | Merrill Lynch & Co., Inc., 5.700%, 5/02/2017 | | | 3,292,988 | |
| | 1,900,000 | | | Merrill Lynch & Co., Inc., 6.050%, 5/16/2016 | | | 2,075,987 | |
| | 6,700,000 | | | Merrill Lynch & Co., Inc., 6.110%, 1/29/2037 | | | 7,107,822 | |
| | 51,500,000 | | | Merrill Lynch & Co., Inc., 10.710%, 3/08/2017, (BRL) | | | 27,880,750 | |
| | 3,450,000 | | | Merrill Lynch & Co., Inc., EMTN, 4.625%, 9/14/2018, (EUR) | | | 4,411,254 | |
| | 5,410,000 | | | Merrill Lynch & Co., Inc., MTN, 6.875%, 4/25/2018 | | | 6,481,797 | |
| | 800,000 | | | Merrill Lynch & Co., Inc., Series C, MTN, 6.050%, 6/01/2034 | | | 824,814 | |
| | 1,235,000 | | | Merrill Lynch & Co., Inc., Series C, MTN, 6.400%, 8/28/2017 | | | 1,436,753 | |
| | 2,000,000 | | | Morgan Stanley, 0.935%, 10/15/2015(c) | | | 1,905,648 | |
| | 13,400,000 | | | Morgan Stanley, 5.500%, 7/24/2020 | | | 14,468,060 | |
| | 3,300,000 | | | Morgan Stanley, 5.750%, 1/25/2021 | | | 3,622,248 | |
See accompanying notes to financial statements.
15 |
Portfolio of Investments – as of September 30, 2012
Loomis Sayles Strategic Income Fund – (continued)
| | | | | | | | |
Principal
Amount (‡) | | | Description | | Value (†) | |
| | | | Banking — continued | |
| | 74,310,000 | | | Morgan Stanley, 7.600%, 8/08/2017, (NZD) | | $ | 64,073,193 | |
| | 100,265,000 | | | Morgan Stanley, 8.000%, 5/09/2017, (AUD) | | | 112,462,176 | |
| | 950,000 | | | Morgan Stanley, EMTN, 5.750%, 2/14/2017, (GBP) | | | 1,637,671 | |
| | 1,000,000 | | | Morgan Stanley, GMTN, 4.500%, 2/23/2016, (EUR) | | | 1,346,383 | |
| | 79,700,000 | | | Morgan Stanley, GMTN, 7.625%, 3/03/2016, (AUD) | | | 87,578,969 | |
| | 10,000,000 | | | Morgan Stanley, MTN, 6.250%, 8/09/2026 | | | 11,251,580 | |
| | 6,600,000 | | | Morgan Stanley, Series F, GMTN, 5.625%, 9/23/2019 | | | 7,210,361 | |
| | 7,900,000 | | | Morgan Stanley, Series F, GMTN, 6.625%, 4/01/2018 | | | 9,076,626 | |
| | 12,100,000 | | | Morgan Stanley, Series F, MTN, 0.905%, 10/18/2016(c) | | | 11,245,365 | |
| | 5,210,000 | | | Morgan Stanley, Series F, MTN, 5.950%, 12/28/2017 | | | 5,852,112 | |
| | 4,100,000 | | | Morgan Stanley, Series G & H, GMTN, 5.125%, 11/30/2015, (GBP) | | | 6,966,111 | |
| | 2,850,000 | | | RBS Capital Trust A, 2.321%, 12/29/2049, (EUR)(c) | | | 2,169,967 | |
| | 1,905,000 | | | RBS Capital Trust C, (fixed rate to 1/12/2016, variable rate thereafter),
4.243%, 12/29/2049, (EUR) | | | 1,444,332 | |
| | 3,185,000 | | | RBS Capital Trust I, (fixed rate to 7/01/2013, variable rate thereafter),
4.709%, 12/29/2049 | | | 1,974,700 | |
| | 4,050,000 | | | RBS Capital Trust II, (fixed rate to 1/03/2034, variable rate thereafter),
6.425%, 12/29/2049 | | | 3,321,000 | |
| | 2,085,000 | | | RBS Capital Trust III, (fixed rate to 9/30/2014, variable rate thereafter),
5.512%, 9/29/2049 | | | 1,303,125 | |
| | 930,000 | | | Royal Bank of Scotland Group PLC, 5.250%, 6/29/2049, (EUR) | | | 746,935 | |
| | 15,100,000 | | | Royal Bank of Scotland Group PLC, 5.500%, 11/29/2049, (EUR) | | | 12,519,623 | |
| | 1,990,000 | | | Royal Bank of Scotland Group PLC, (fixed rate to 9/29/2017, variable rate thereafter), 7.634%, 3/29/2049 | | | 1,626,825 | |
| | 850,000 | | | Royal Bank of Scotland PLC (The), EMTN, 4.350%, 1/23/2017, (EUR) | | | 1,038,154 | |
| | 7,750,000 | | | Royal Bank of Scotland PLC (The), EMTN, 6.934%, 4/09/2018, (EUR) | | | 10,134,307 | |
| | 2,150,000 | | | Royal Bank of Scotland PLC (The), EMTN, (fixed rate to 9/22/2016, variable rate thereafter), 4.625%, 9/22/2021, (EUR) | | | 2,393,325 | |
| | 700,000 | | | Santander Financial Issuances Ltd., 7.250%, 11/01/2015 | | | 717,850 | |
| | 1,300,000 | | | Santander International Debt SAU, EMTN, 4.000%, 3/27/2017, (EUR) | | | 1,605,095 | |
| | 1,800,000 | | | Santander Issuances SAU, 5.911%, 6/20/2016, 144A | | | 1,773,000 | |
| | 1,500,000 | | | Santander Issuances SAU, (fixed rate to 8/11/2014, variable rate thereafter), 6.500%, 8/11/2019, 144A | | | 1,466,984 | |
| | 4,140,000 | | | SG Capital Trust III, (fixed rate to 11/10/2013, variable rate thereafter),
5.419%, 11/29/2049, (EUR) | | | 4,628,492 | |
| | 8,750,000 | | | Societe Generale S.A., (fixed rate to 5/22/2013, variable rate thereafter),
7.756%, 5/29/2049, (EUR) | | | 9,810,552 | |
| | | | | | | | |
| | | | | | | 874,591,931 | |
| | | | | | | | |
| | | | Brokerage — 0.7% | |
| | 2,655,000 | | | Cantor Fitzgerald LP, 6.375%, 6/26/2015, 144A | | | 2,695,552 | |
| | 13,425,000 | | | Jefferies Group, Inc., 5.125%, 4/13/2018 | | | 13,626,375 | |
| | 19,810,000 | | | Jefferies Group, Inc., 6.250%, 1/15/2036 | | | 19,611,900 | |
| | 15,215,000 | | | Jefferies Group, Inc., 6.450%, 6/08/2027 | | | 15,595,375 | |
| | 39,040,000 | | | Jefferies Group, Inc., 6.875%, 4/15/2021 | | | 42,016,800 | |
| | 2,440,000 | | | Jefferies Group, Inc., 8.500%, 7/15/2019 | | | 2,799,900 | |
| | | | | | | | |
| | | | | | | 96,345,902 | |
| | | | | | | | |
See accompanying notes to financial statements.
| 16
Portfolio of Investments – as of September 30, 2012
Loomis Sayles Strategic Income Fund – (continued)
| | | | | | | | |
Principal
Amount (‡) | | | Description | | Value (†) | |
| | | | Building Materials — 0.8% | |
| $ | 6,995,000 | | | Masco Corp., 6.500%, 8/15/2032 | | $ | 7,243,546 | |
| | 5,510,000 | | | Masco Corp., 7.125%, 3/15/2020 | | | 6,272,121 | |
| | 2,630,000 | | | Masco Corp., 7.750%, 8/01/2029 | | | 2,778,385 | |
| | 35,980,000 | | | Owens Corning, Inc., 7.000%, 12/01/2036 | | | 39,479,739 | |
| | 46,412,000 | | | USG Corp., 6.300%, 11/15/2016 | | | 46,876,120 | |
| | 14,155,000 | | | USG Corp., 9.750%, 1/15/2018 | | | 15,287,400 | |
| | | | | | | | |
| | | | | | | 117,937,311 | |
| | | | | | | | |
| | | | Chemicals — 0.4% | |
| | 20,070,000 | | | Hercules, Inc., 6.500%, 6/30/2029 | | | 18,364,050 | |
| | 5,200,000 | | | Hexion US Finance Corp./Hexion Nova Scotia Finance ULC,
8.875%, 2/01/2018 | | | 5,343,000 | |
| | 23,584,000 | | | Momentive Specialty Chemicals, Inc., 7.875%, 2/15/2023(b) | | | 18,395,520 | |
| | 8,020,000 | | | Momentive Specialty Chemicals, Inc., 8.375%, 4/15/2016(b) | | | 7,218,000 | |
| | 8,757,000 | | | Momentive Specialty Chemicals, Inc., 9.200%, 3/15/2021(b) | | | 7,706,160 | |
| | | | | | | | |
| | | | | | | 57,026,730 | |
| | | | | | | | |
| | | | Collateralized Mortgage Obligations — 0.0% | |
| | 4,774,605 | | | Wells Fargo Mortgage Backed Securities Trust, Series 2005-AR4, Class 2A2, 2.690%, 4/25/2035(c) | | | 4,822,275 | |
| | | | | | | | |
| | | | Commercial Mortgage-Backed Securities — 0.1% | |
| | 7,940,000 | | | Credit Suisse Mortgage Capital Certificates, Series 2007-C5, Class AM,
5.869%, 9/15/2040 | | | 7,523,031 | |
| | | | | | | | |
| | | | Construction Machinery — 0.2% | |
| | 1,425,000 | | | Joy Global, Inc., 6.625%, 11/15/2036 | | | 1,603,386 | |
| | 10,790,000 | | | Terex Corp., 8.000%, 11/15/2017 | | | 11,167,650 | |
| | 525,000 | | | United Rentals North America, Inc., 8.375%, 9/15/2020 | | | 561,750 | |
| | 13,630,000 | | | UR Financing Escrow Corp., 7.625%, 4/15/2022, 144A | | | 14,924,850 | |
| | | | | | | | |
| | | | | | | 28,257,636 | |
| | | | | | | | |
| | | | Consumer Cyclical Services — 0.0% | |
| | 670,000 | | | ServiceMaster Co. (The), 7.100%, 3/01/2018 | | | 649,900 | |
| | 5,500,000 | | | ServiceMaster Co. (The), 7.450%, 8/15/2027 | | | 4,578,750 | |
| | 1,048,000 | | | Western Union Co. (The), 6.200%, 6/21/2040 | | | 1,241,453 | |
| | | | | | | | |
| | | | | | | 6,470,103 | |
| | | | | | | | |
| | | | Electric — 2.7% | |
| | 7,640,279 | | | AES Ironwood LLC, 8.857%, 11/30/2025 | | | 8,786,322 | |
| | 854,827 | | | AES Red Oak LLC, Series A, 8.540%, 11/30/2019 | | | 912,528 | |
| | 47,363,314 | | | Alta Wind Holdings LLC, 7.000%, 6/30/2035, 144A | | | 52,479,025 | |
| | 66,044,844 | | | Bruce Mansfield Unit, 6.850%, 6/01/2034 | | | 70,236,710 | |
| | 2,754,970 | | | CE Generation LLC, 7.416%, 12/15/2018 | | | 2,754,970 | |
| | 11,275,000 | | | Dynegy Holdings, Inc., 7.125%, 5/15/2018(d) | | | 6,398,563 | |
| | 10,185,000 | | | Dynegy Holdings, Inc., 7.625%, 10/15/2026(d) | | | 5,703,600 | |
| | 8,955,000 | | | Dynegy Holdings, Inc., 7.750%, 6/01/2019(d) | | | 5,059,575 | |
| | 51,405,000 | | | Edison Mission Energy, 7.625%, 5/15/2027 | | | 26,345,063 | |
| | 41,900,000 | | | EDP Finance BV, 4.900%, 10/01/2019, 144A | | | 38,967,000 | |
| | 15,100,000 | | | EDP Finance BV, 6.000%, 2/02/2018, 144A | | | 15,073,122 | |
| | 2,800,000 | | | EDP Finance BV, EMTN, 4.625%, 6/13/2016, (EUR) | | | 3,463,209 | |
See accompanying notes to financial statements.
17 |
Portfolio of Investments – as of September 30, 2012
Loomis Sayles Strategic Income Fund – (continued)
| | | | | | | | |
Principal
Amount (‡) | | | Description | | Value (†) | |
| | | | Electric — continued | |
| | 500,000 | | | EDP Finance BV, EMTN, 4.750%, 9/26/2016, (EUR) | | $ | 616,837 | |
| | 100,000 | | | EDP Finance BV, EMTN, 5.875%, 2/01/2016, (EUR) | | | 128,120 | |
| | 250,000 | | | Empresa Nacional de Electricidad S.A. (Endesa-Chile), 8.350%, 8/01/2013 | | | 263,941 | |
| | 4,070,000 | | | Endesa S.A./Cayman Islands, 7.875%, 2/01/2027 | | | 5,025,237 | |
| | 15,552,000 | | | Enel Finance International NV, 6.000%, 10/07/2039, 144A | | | 13,984,483 | |
| | 1,435,000 | | | Enel Finance International NV, 6.800%, 9/15/2037, 144A | | | 1,390,456 | |
| | 5,940,000 | | | Energy Future Holdings Corp., 10.000%, 1/15/2020 | | | 6,548,850 | |
| | 555,000 | | | Enersis S.A., Cayman Islands, 7.400%, 12/01/2016 | | | 656,700 | |
| | 31,035,000 | | | NGC Corp. Capital Trust I, Series B, 8.316%, 6/01/2027(b)(d) | | | 4,034,550 | |
| | 16,670,000 | | | Texas Competitive Electric Holdings Co. LLC/TCEH Finance, Inc.,
11.500%, 10/01/2020, 144A | | | 13,044,275 | |
| | 50,270,000 | | | TXU Corp., Series P, 5.550%, 11/15/2014 | | | 40,467,350 | |
| | 101,735,000 | | | TXU Corp., Series Q, 6.500%, 11/15/2024 | | | 60,532,325 | |
| | 6,675,000 | | | TXU Corp., Series R, 6.550%, 11/15/2034 | | | 3,637,875 | |
| | 7,300,000 | | | White Pine Hydro LLC, 6.310%, 7/10/2017(b)(e) | | | 5,767,000 | |
| | 10,935,000 | | | White Pine Hydro LLC, 6.960%, 7/10/2037(b)(e) | | | 7,107,750 | |
| | | | | | | | |
| | | | | | | 399,385,436 | |
| | | | | | | | |
| | | | Financial Other — 0.3% | |
| | 19,005,000 | | | Aviation Capital Group Corp., 6.750%, 4/06/2021, 144A | | | 19,373,697 | |
| | 20,000,000 | | | National Life Insurance Co., 10.500%, 9/15/2039, 144A | | | 26,705,860 | |
| | | | | | | | |
| | | | | | | 46,079,557 | |
| | | | | | | | |
| | | | Food & Beverage — 0.0% | |
| | 4,370,000 | | | Viterra, Inc., 6.406%, 2/16/2021, 144A, (CAD) | | | 4,864,787 | |
| | | | | | | | |
| | | | Gaming — 0.3% | |
| | 810,000 | | | MGM Resorts International, 6.625%, 7/15/2015 | | | 866,700 | |
| | 865,000 | | | MGM Resorts International, 6.875%, 4/01/2016 | | | 903,925 | |
| | 710,000 | | | MGM Resorts International, 7.500%, 6/01/2016 | | | 759,700 | |
| | 1,770,000 | | | MGM Resorts International, 7.625%, 1/15/2017 | | | 1,876,200 | |
| | 37,005,000 | | | MGM Resorts International, 8.625%, 2/01/2019, 144A | | | 40,335,450 | |
| | | | | | | | |
| | | | | | | 44,741,975 | |
| | | | | | | | |
| | | | Government Guaranteed — 0.5% | |
| | 11,038,000 | | | Instituto de Credito Oficial, MTN, 5.500%, 10/11/2012, (AUD) | | | 11,443,618 | |
| | 72,695,000 | | | Queensland Treasury Corp., 7.125%, 9/18/2017, 144A, (NZD) | | | 69,089,302 | |
| | | | | | | | |
| | | | | | | 80,532,920 | |
| | | | | | | | |
| | | | Government Owned — No Guarantee — 0.6% | |
| | 19,500,000 | | | DP World Ltd., 6.850%, 7/02/2037, 144A | | | 21,011,250 | |
| | 70,300,000,000 | | | Export-Import Bank of Korea, 6.600%, 11/04/2013, 144A, (IDR) | | | 7,342,934 | |
| | 499,300,000,000 | | | Export-Import Bank of Korea, 8.300%, 3/15/2014, 144A, (IDR) | | | 53,216,928 | |
| | 8,935,000 | | | Petroleos de Venezuela S.A., 5.375%, 4/12/2027 | | | 5,517,363 | |
| | | | | | | | |
| | | | | | | 87,088,475 | |
| | | | | | | | |
| | | | Government Sponsored — 0.1% | |
| | 10,807,000 | | | Eksportfinans ASA, 2.000%, 9/15/2015 | | | 10,104,545 | |
| | 9,005,000 | | | Eksportfinans ASA, 2.375%, 5/25/2016 | | | 8,329,625 | |
| | 1,000,000 | | | Eksportfinans ASA, EMTN, 2.250%, 2/11/2021, (CHF) | | | 914,407 | |
| | | | | | | | |
| | | | | | | 19,348,577 | |
| | | | | | | | |
See accompanying notes to financial statements.
| 18
Portfolio of Investments – as of September 30, 2012
Loomis Sayles Strategic Income Fund – (continued)
| | | | | | | | |
Principal
Amount (‡) | | | Description | | Value (†) | |
| | | | Healthcare — 1.5% | |
| $ | 9,960,000 | | | HCA, Inc., 5.875%, 3/15/2022 | | $ | 10,794,150 | |
| | 14,620,000 | | | HCA, Inc., 7.050%, 12/01/2027 | | | 13,815,900 | |
| | 11,104,000 | | | HCA, Inc., 7.190%, 11/15/2015 | | | 12,158,880 | |
| | 20,447,000 | | | HCA, Inc., 7.500%, 12/15/2023 | | | 20,651,470 | |
| | 24,215,000 | | | HCA, Inc., 7.500%, 11/06/2033 | | | 23,730,700 | |
| | 46,148,000 | | | HCA, Inc., 7.690%, 6/15/2025 | | | 46,840,220 | |
| | 32,745,000 | | | HCA, Inc., 8.360%, 4/15/2024 | | | 34,300,387 | |
| | 15,815,000 | | | HCA, Inc., MTN, 7.580%, 9/15/2025 | | | 15,894,075 | |
| | 9,492,000 | | | HCA, Inc., MTN, 7.750%, 7/15/2036 | | | 9,420,810 | |
| | 32,559,000 | | | Tenet Healthcare Corp., 6.875%, 11/15/2031 | | | 29,140,305 | |
| | | | | | | | |
| | | | | | | 216,746,897 | |
| | | | | | | | |
| | | | Home Construction — 0.8% | |
| | 11,265,000 | | | Desarrolladora Homex SAB de CV, 7.500%, 9/28/2015 | | | 11,265,000 | |
| | 13,360,000 | | | K. Hovnanian Enterprises, Inc., 5.000%, 11/01/2021, 144A | | | 11,088,800 | |
| | 16,075,000 | | | K. Hovnanian Enterprises, Inc., 6.250%, 1/15/2016 | | | 14,869,375 | |
| | 6,290,000 | | | K. Hovnanian Enterprises, Inc., 7.500%, 5/15/2016 | | | 5,881,150 | |
| | 11,315,000 | | | KB Home, 7.250%, 6/15/2018 | | | 12,191,912 | |
| | 47,260,000 | | | Pulte Group, Inc., 6.000%, 2/15/2035 | | | 42,770,300 | |
| | 13,190,000 | | | Pulte Group, Inc., 6.375%, 5/15/2033 | | | 12,266,700 | |
| | | | | | | | |
| | | | | | | 110,333,237 | |
| | | | | | | | |
| | | | Independent Energy — 0.3% | |
| | 1,150,000 | | | Chesapeake Energy Corp., 6.250%, 1/15/2017, (EUR) | | | 1,522,141 | |
| | 1,375,000 | | | Chesapeake Energy Corp., 6.625%, 8/15/2020 | | | 1,417,969 | |
| | 1,040,000 | | | Chesapeake Energy Corp., 6.875%, 11/15/2020 | | | 1,097,200 | |
| | 19,645,000 | | | Connacher Oil and Gas Ltd., 8.500%, 8/01/2019, 144A | | | 16,894,700 | |
| | 12,635,000 | | | QEP Resources, Inc., 6.875%, 3/01/2021 | | | 14,277,550 | |
| | 2,780,000 | | | SandRidge Energy, Inc., 7.500%, 2/15/2023, 144A | | | 2,863,400 | |
| | | | | | | | |
| | | | | | | 38,072,960 | |
| | | | | | | | |
| | | | Industrial Other — 0.1% | |
| | 10,000,000 | | | Worthington Industries, Inc., 6.500%, 4/15/2020 | | | 11,133,030 | |
| | | | | | | | |
| | | | Life Insurance — 1.2% | |
| | 34,562,000 | | | American International Group, Inc., 6.250%, 3/15/2087 | | | 34,907,620 | |
| | 27,655,000 | | | American International Group, Inc., (fixed rate to 5/15/2038, variable rate thereafter), 8.175%, 5/15/2068 | | | 33,842,806 | |
| | 19,625,000 | | | American International Group, Inc., Series G, MTN, 5.850%, 1/16/2018 | | | 22,763,685 | |
| | 2,855,000 | | | American International Group, Inc., Series MPLE,
4.900%, 6/02/2014, (CAD) | | | 2,974,184 | |
| | 23,200,000 | | | AXA S.A., (fixed rate to 12/14/2036, variable rate thereafter),
6.379%, 12/29/2049, 144A | | | 20,880,000 | |
| | 1,000,000 | | | AXA S.A., EMTN, (fixed rate to 10/16/2019, variable rate thereafter),
6.772%, 10/29/2049, (GBP) | | | 1,315,932 | |
| | 1,350,000 | | | AXA S.A., EMTN, (fixed rate to 4/16/2020, variable rate thereafter),
5.250%, 4/16/2040, (EUR) | | | 1,588,260 | |
| | 15,000,000 | | | Forethought Financial Group, Inc., 8.625%, 4/15/2021, 144A | | | 16,050,000 | |
| | 1,475,000 | | | MetLife Capital Trust X, 9.250%, 4/08/2068, 144A | | | 1,947,000 | |
| | 15,930,000 | | | MetLife, Inc., 6.400%, 12/15/2066 | | | 16,711,860 | |
See accompanying notes to financial statements.
19 |
Portfolio of Investments – as of September 30, 2012
Loomis Sayles Strategic Income Fund – (continued)
| | | | | | | | |
Principal
Amount (‡) | | | Description | | Value (†) | |
| | | | Life Insurance — continued | |
| $ | 8,145,000 | | | MetLife, Inc., 10.750%, 8/01/2069 | | $ | 12,095,325 | |
| | 8,920,000 | | | NLV Financial Corp., 7.500%, 8/15/2033, 144A | | | 9,189,928 | |
| | 3,910,000 | | | Penn Mutual Life Insurance Co. (The), 6.650%, 6/15/2034, 144A | | | 4,429,553 | |
| | | | | | | | |
| | | | | | | 178,696,153 | |
| | | | | | | | |
| | | | Local Authorities — 1.4% | |
| | 3,905,000 | | | Manitoba (Province of), GMTN, 6.375%, 9/01/2015, (NZD) | | | 3,486,240 | |
| | 82,840,000 | | | New South Wales Treasury Corp., 6.000%, 2/01/2018, (AUD) | | | 97,142,182 | |
| | 66,305,000 | | | New South Wales Treasury Corp., Series 17RG, 5.500%, 3/01/2017, (AUD) | | | 75,671,077 | |
| | 26,730,000 | | | Queensland Treasury Corp., Series 14, 5.750%, 11/21/2014, (AUD) | | | 29,308,448 | |
| | | | | | | | |
| | | | | | | 205,607,947 | |
| | | | | | | | |
| | | | Media Cable — 0.6% | |
| | 25,270,000 | | | Shaw Communications, Inc., 5.650%, 10/01/2019, (CAD) | | | 28,952,413 | |
| | 44,800,000 | | | UPC Holding BV, 6.375%, 9/15/2022, 144A, (EUR) | | | 57,006,040 | |
| | | | | | | | |
| | | | | | | 85,958,453 | |
| | | | | | | | |
| | | | Media Non-Cable — 0.6% | |
| | 4,295,000 | | | Clear Channel Communications, Inc., 5.500%, 9/15/2014 | | | 3,865,500 | |
| | 64,250,000 | | | Clear Channel Communications, Inc., 9.000%, 3/01/2021 | | | 57,182,500 | |
| | 28,455,000 | | | R.R. Donnelley & Sons Co., 8.250%, 3/15/2019 | | | 28,881,825 | |
| | | | | | | | |
| | | | | | | 89,929,825 | |
| | | | | | | | |
| | | | Metals & Mining — 0.6% | |
| | 3,949,000 | | | Alcoa, Inc., 5.870%, 2/23/2022 | | | 4,247,517 | |
| | 1,405,000 | | | Alcoa, Inc., 5.950%, 2/01/2037 | | | 1,405,580 | |
| | 4,330,000 | | | Alcoa, Inc., 6.750%, 1/15/2028 | | | 4,805,213 | |
| | 25,271,000 | | | ArcelorMittal, 7.000%, 3/01/2041 | | | 22,718,553 | |
| | 18,750,000 | | | Essar Steel Algoma, Inc., 9.875%, 6/15/2015, 144A | | | 14,859,375 | |
| | 16,135,000 | | | Russel Metals, Inc., 6.000%, 4/19/2022, 144A, (CAD) | | | 16,791,823 | |
| | 7,000,000 | | | United States Steel Corp., 6.050%, 6/01/2017 | | | 6,947,500 | |
| | 6,779,000 | | | United States Steel Corp., 6.650%, 6/01/2037 | | | 5,694,360 | |
| | 16,435,000 | | | United States Steel Corp., 7.000%, 2/01/2018 | | | 16,476,088 | |
| | | | | | | | |
| | | | | | | 93,946,009 | |
| | | | | | | | |
| | | | Non-Captive Consumer — 4.2% | |
| | 63,088,000 | | | Residential Capital LLC, 9.625%, 5/15/2015(d) | | | 63,166,860 | |
| | 109,950(††) | | | SLM Corp., 6.000%, 12/15/2043 | | | 2,610,305 | |
| | 20,970,000 | | | SLM Corp., MTN, 5.050%, 11/14/2014 | | | 22,134,066 | |
| | 17,600,000 | | | SLM Corp., MTN, 7.250%, 1/25/2022 | | | 19,712,000 | |
| | 2,160,000 | | | SLM Corp., MTN, 8.000%, 3/25/2020 | | | 2,494,800 | |
| | 3,750,000 | | | SLM Corp., Series A, MTN, 0.751%, 1/27/2014(c) | | | 3,641,711 | |
| | 41,770,000 | | | SLM Corp., Series A, MTN, 5.000%, 4/15/2015 | | | 44,121,275 | |
| | 14,465,000 | | | SLM Corp., Series A, MTN, 5.000%, 6/15/2018 | | | 14,487,623 | |
| | 48,100,000 | | | SLM Corp., Series A, MTN, 5.625%, 8/01/2033 | | | 45,406,400 | |
| | 95,060,000 | | | SLM Corp., Series A, MTN, 8.450%, 6/15/2018 | | | 111,335,888 | |
| | 26,150,000 | | | Springleaf Finance Corp., 3.250%, 1/16/2013, (EUR) | | | 33,099,990 | |
| | 10,120,000 | | | Springleaf Finance Corp., MTN, 5.750%, 9/15/2016 | | | 8,734,774 | |
| | 6,900,000 | | | Springleaf Finance Corp., Series H, MTN, 5.375%, 10/01/2012 | | | 6,900,000 | |
| | 14,232,000 | | | Springleaf Finance Corp., Series I, MTN, 5.400%, 12/01/2015 | | | 12,782,044 | |
See accompanying notes to financial statements.
| 20
Portfolio of Investments – as of September 30, 2012
Loomis Sayles Strategic Income Fund – (continued)
| | | | | | | | |
Principal
Amount (‡) | | | Description | | Value (†) | |
| | | | Non-Captive Consumer —continued | |
| $ | 14,430,000 | | | Springleaf Finance Corp., Series I, MTN, 5.850%, 6/01/2013 | | $ | 14,357,850 | |
| | 800,000 | | | Springleaf Finance Corp., Series J, MTN, 6.500%, 9/15/2017 | | | 676,000 | |
| | 248,290,000 | | | Springleaf Finance Corp., Series J, MTN, 6.900%, 12/15/2017 | | | 211,046,500 | |
| | | | | | | | |
| | | | | | | 616,708,086 | |
| | | | | | | | |
| | | | Non-Captive Diversified — 4.6% | |
| | 7,855,000 | | | Aircastle Ltd., 7.625%, 4/15/2020 | | | 8,699,412 | |
| | 32,711,000 | | | Ally Financial, Inc., 8.000%, 12/31/2018 | | | 36,799,875 | |
| | 29,332,000 | | | Ally Financial, Inc., 8.000%, 11/01/2031 | | | 34,201,112 | |
| | 25,320,000 | | | General Electric Capital Corp., Series A, EMTN, 5.500%, 2/01/2017, (NZD) | | | 21,970,404 | |
| | 79,035,000 | | | General Electric Capital Corp., Series A, EMTN, 6.750%, 9/26/2016, (NZD) | | | 71,145,085 | |
| | 58,490,000 | | | General Electric Capital Corp., Series A, GMTN,
7.625%, 12/10/2014, (NZD) | | | 52,075,396 | |
| | 15,305,000 | | | General Electric Capital Corp., Series A, MTN, 0.755%, 5/13/2024(c) | | | 13,127,114 | |
| | 245,797,000 | | | General Electric Capital Corp., Series A, MTN, 6.500%, 9/28/2015, (NZD) | | | 216,090,856 | |
| | 1,710,000 | | | International Lease Finance Corp., 5.875%, 4/01/2019 | | | 1,813,089 | |
| | 24,750,000 | | | International Lease Finance Corp., 5.875%, 8/15/2022 | | | 25,567,987 | |
| | 2,950,000 | | | International Lease Finance Corp., 6.250%, 5/15/2019 | | | 3,171,250 | |
| | 20,610,000 | | | International Lease Finance Corp., 7.125%, 9/01/2018, 144A | | | 24,010,650 | |
| | 10,245,000 | | | International Lease Finance Corp., 8.250%, 12/15/2020 | | | 12,191,550 | |
| | 2,620,000 | | | International Lease Finance Corp., Series R, MTN, 5.625%, 9/20/2013 | | | 2,701,875 | |
| | 2,547,000 | | | International Lease Finance Corp., Series R, MTN, 5.650%, 6/01/2014 | | | 2,668,237 | |
| | 23,175,000 | | | iStar Financial, Inc., 5.850%, 3/15/2017 | | | 22,016,250 | |
| | 20,478,000 | | | iStar Financial, Inc., 5.875%, 3/15/2016 | | | 19,761,270 | |
| | 8,300,000 | | | iStar Financial, Inc., 6.050%, 4/15/2015 | | | 8,134,000 | |
| | 35,130,000 | | | iStar Financial, Inc., 8.625%, 6/01/2013 | | | 36,183,900 | |
| | 2,920,000 | | | iStar Financial, Inc., Series B, 5.700%, 3/01/2014 | | | 2,923,650 | |
| | 44,610,000 | | | iStar Financial, Inc., Series B, 5.950%, 10/15/2013 | | | 44,610,000 | |
| | 19,915,000 | | | Ladder Capital Finance Holdings LLLP/Ladder Capital Finance Corp.,
7.375%, 10/01/2017, 144A | | | 20,313,300 | |
| | | | | | | | |
| | | | | | | 680,176,262 | |
| | | | | | | | |
| | | | Oil Field Services — 0.1% | |
| | 7,275,000 | | | Rowan Cos., Inc., 7.875%, 8/01/2019 | | | 9,019,349 | |
| | | | | | | | |
| | | | Paper — 1.1% | |
| | 14,715,000 | | | Georgia-Pacific LLC, 7.250%, 6/01/2028 | | | 18,621,053 | |
| | 12,410,000 | | | Georgia-Pacific LLC, 7.375%, 12/01/2025 | | | 16,425,801 | |
| | 47,875,000 | | | Georgia-Pacific LLC, 7.750%, 11/15/2029 | | | 63,251,588 | |
| | 775,000 | | | Georgia-Pacific LLC, 8.875%, 5/15/2031 | | | 1,146,348 | |
| | 14,520,000 | | | Westvaco Corp., 7.950%, 2/15/2031 | | | 19,070,379 | |
| | 25,210,000 | | | Westvaco Corp., 8.200%, 1/15/2030 | | | 33,601,880 | |
| | 2,840,000 | | | Weyerhaeuser Co., 6.950%, 10/01/2027 | | | 3,078,779 | |
| | | | | | | | |
| | | | | | | 155,195,828 | |
| | | | | | | | |
| | | | Pharmaceuticals — 0.4% | |
| | 11,225,000 | | | Valeant Pharmaceuticals International, 6.375%, 10/15/2020, 144A | | | 11,449,500 | |
| | 43,165,000 | | | VPI Escrow Corp., 6.375%, 10/15/2020, 144A | | | 44,028,300 | |
| | | | | | | | |
| | | | | | | 55,477,800 | |
| | | | | | | | |
See accompanying notes to financial statements.
21 |
Portfolio of Investments – as of September 30, 2012
Loomis Sayles Strategic Income Fund – (continued)
| | | | | | | | |
Principal
Amount (‡) | | | Description | | Value (†) | |
| | | | Pipelines — 1.2% | |
| $ | 750,000 | | | El Paso Corp., GMTN, 7.800%, 8/01/2031 | | $ | 871,466 | |
| | 9,115,000 | | | Energy Transfer Partners LP, 6.625%, 10/15/2036 | | | 10,319,748 | |
| | 13,175,000 | | | Enterprise Products Operating LLC, 4.050%, 2/15/2022 | | | 14,401,685 | |
| | 8,935,000 | | | IFM US Colonial Pipeline 2 LLC, 6.450%, 5/01/2021, 144A | | | 9,969,879 | |
| | 41,557,104 | | | Maritimes & Northeast Pipeline LLC, 7.500%, 5/31/2014, 144A(b) | | | 44,194,733 | |
| | 81,710,000 | | | NGPL PipeCo LLC, 7.119%, 12/15/2017, 144A | | | 86,816,875 | |
| | 3,870,000 | | | NGPL PipeCo LLC, 7.768%, 12/15/2037, 144A | | | 3,870,000 | |
| | 3,065,000 | | | Rockies Express Pipeline LLC, 6.875%, 4/15/2040, 144A | | | 2,681,875 | |
| | 4,168,000 | | | Transportadora de Gas del Sur S.A., 7.875%, 5/14/2017, 144A | | | 3,553,220 | |
| | | | | | | | |
| | | | | | | 176,679,481 | |
| | | | | | | | |
| | | | Property & Casualty Insurance — 0.4% | |
| | 14,855,000 | | | Hanover Insurance Group, Inc. (The), 6.375%, 6/15/2021 | | | 17,002,795 | |
| | 3,405,000 | | | Hanover Insurance Group, Inc. (The), 7.500%, 3/01/2020 | | | 3,977,779 | |
| | 6,075,000 | | | Marsh & McLennan Cos., Inc., 5.875%, 8/01/2033 | | | 7,163,257 | |
| | 11,865,000 | | | MBIA Insurance Corp., (fixed rate to 1/15/2013, variable rate thereafter),
14.000%, 1/15/2033, 144A | | | 6,051,150 | |
| | 2,275,000 | | | Nationwide Mutual Insurance Co., 6.600%, 4/15/2034, 144A | | | 2,282,587 | |
| | 11,200,000 | | | White Mountains Re Group Ltd., 6.375%, 3/20/2017, 144A | | | 11,849,399 | |
| | 3,000,000 | | | White Mountains Re Group Ltd., (fixed rate to 6/30/2017, variable rate thereafter), 7.506%, 5/29/2049, 144A | | | 3,057,480 | |
| | 1,425,000 | | | XL Group PLC, 6.375%, 11/15/2024 | | | 1,693,416 | |
| | | | | | | | |
| | | | | | | 53,077,863 | |
| | | | | | | | |
| | | | Railroads — 0.0% | |
| | 1,153,000 | | | Missouri Pacific Railroad Co., 5.000%, 1/01/2045(b) | | | 951,225 | |
| | | | | | | | |
| | | | Retailers — 0.8% | |
| | 2,500,000 | | | Dillard’s, Inc., 6.625%, 1/15/2018 | | | 2,637,500 | |
| | 3,325,000 | | | Dillard’s, Inc., 7.000%, 12/01/2028 | | | 3,308,375 | |
| | 4,187,000 | | | Dillard’s, Inc., 7.130%, 8/01/2018 | | | 4,532,427 | |
| | 1,500,000 | | | Dillard’s, Inc., 7.750%, 7/15/2026 | | | 1,550,625 | |
| | 425,000 | | | Dillard’s, Inc., 7.875%, 1/01/2023 | | | 454,750 | |
| | 10,270,000 | | | Foot Locker, Inc., 8.500%, 1/15/2022 | | | 11,348,350 | |
| | 3,685,000 | | | J.C. Penney Corp., Inc., 5.750%, 2/15/2018 | | | 3,500,750 | |
| | 37,064,000 | | | J.C. Penney Corp., Inc., 6.375%, 10/15/2036 | | | 30,253,490 | |
| | 635,000 | | | J.C. Penney Corp., Inc., 7.125%, 11/15/2023 | | | 604,838 | |
| | 160,000 | | | J.C. Penney Corp., Inc., 7.400%, 4/01/2037 | | | 143,400 | |
| | 3,985,000 | | | J.C. Penney Corp., Inc., 7.625%, 3/01/2097 | | | 3,397,212 | |
| | 12,275,000 | | | Macy’s Retail Holdings, Inc., 6.790%, 7/15/2027 | | | 13,615,148 | |
| | 2,365,000 | | | Macy’s Retail Holdings, Inc., 6.900%, 4/01/2029 | | | 2,790,364 | |
| | 6,365,000 | | | Marks & Spencer PLC, 7.125%, 12/01/2037, 144A | | | 6,948,480 | |
| | 37,646,000 | | | Toys R Us, Inc., 7.375%, 10/15/2018 | | | 33,787,285 | |
| | | | | | | | |
| | | | | | | 118,872,994 | |
| | | | | | | | |
| | | | Sovereigns — 2.0% | |
| | 47,935,000 | | | Hellenic Republic Government International Bond,
2.125%, 7/05/2013, (CHF) | | | 21,173,458 | |
| | 64,132,000,000 | | | Indonesia Treasury Bond, Series FR43, 10.250%, 7/15/2022, (IDR) | | | 8,725,738 | |
| | 10,000,000,000 | | | Indonesia Treasury Bond, Series FR47, 10.000%, 2/15/2028, (IDR) | | | 1,400,690 | |
See accompanying notes to financial statements.
| 22
Portfolio of Investments – as of September 30, 2012
Loomis Sayles Strategic Income Fund – (continued)
| | | | | | | | |
Principal
Amount (‡) | | | Description | | Value (†) | |
| | | | Sovereigns — continued | |
| | 272,460,000,000 | | | Indonesia Treasury Bond, Series ZC3, Zero Coupon, 11/20/2012, (IDR) | | $ | 28,240,351 | |
| | 166,250,000 | | | Republic of Brazil, 8.500%, 1/05/2024, (BRL) | | | 95,948,946 | |
| | 56,700,000 | | | Republic of Brazil, 10.250%, 1/10/2028, (BRL) | | | 36,569,367 | |
| | 49,120,000 | | | Republic of Brazil, 12.500%, 1/05/2016, (BRL) | | | 30,420,599 | |
| | 18,400,000 | | | Republic of Croatia, 6.750%, 11/05/2019, 144A | | | 20,746,000 | |
| | 5,226,139,000 | | | Republic of Iceland, 6.000%, 10/13/2016, (ISK) | | | 28,512,127 | |
| | 3,178,700,000 | | | Republic of Iceland, 7.250%, 5/17/2013, (ISK) | | | 16,971,278 | |
| | 1,715,823,000 | | | Republic of Iceland, 8.750%, 2/26/2019, (ISK) | | | 10,082,247 | |
| | | | | | | | |
| | | | | | | 298,790,801 | |
| | | | | | | | |
| | | | Supermarkets — 0.5% | |
| | 8,336,000 | | | American Stores Co., 7.900%, 5/01/2017 | | | 7,752,480 | |
| | 73,686,000 | | | New Albertson’s, Inc., 7.450%, 8/01/2029 | | | 41,079,945 | |
| | 20,250,000 | | | New Albertson’s, Inc., 7.750%, 6/15/2026 | | | 12,403,125 | |
| | 10,950,000 | | | New Albertson’s, Inc., 8.000%, 5/01/2031 | | | 6,460,500 | |
| | 3,425,000 | | | New Albertson’s, Inc., 8.700%, 5/01/2030 | | | 2,033,594 | |
| | 13,707,000 | | | New Albertson’s, Inc., Series C, MTN, 6.625%, 6/01/2028 | | | 7,401,780 | |
| | | | | | | | |
| | | | | | | 77,131,424 | |
| | | | | | | | |
| | | | Supranational — 1.6% | |
| | 128,560,000 | | | European Bank for Reconstruction & Development, GMTN,
9.000%, 4/28/2014, (BRL) | | | 66,636,220 | |
| | 16,375,000 | | | European Investment Bank, 11.250%, 2/14/2013, (BRL) | | | 8,240,609 | |
| | 460,500,000,000 | | | European Investment Bank, EMTN, Zero Coupon, 4/24/2013, 144A, (IDR) | | | 46,622,617 | |
| | 60,665,000 | | | European Investment Bank, MTN, 6.250%, 4/15/2015, (AUD) | | | 66,877,927 | |
| | 244,840,000,000 | | | Inter-American Development Bank, EMTN, Zero Coupon, 5/20/2013, (IDR) | | | 24,729,607 | |
| | 24,450,000 | | | Inter-American Development Bank, EMTN, 6.000%, 12/15/2017, (NZD) | | | 22,578,727 | |
| | 8,300,000 | | | International Bank for Reconstruction & Development,
1.430%, 3/05/2014, (SGD) | | | 6,780,056 | |
| | | | | | | | |
| | | | | | | 242,465,763 | |
| | | | | | | | |
| | | | Technology — 0.9% | |
| | 7,475,000 | | | Agilent Technologies, Inc., 6.500%, 11/01/2017 | | | 9,147,195 | |
| | 832,000 | | | Alcatel-Lucent, EMTN, 6.375%, 4/07/2014, (EUR) | | | 1,082,526 | |
| | 31,237,000 | | | Alcatel-Lucent France, Inc., 8.500%, 1/15/2016, (EUR) | | | 37,632,280 | |
| | 79,074,000 | | | Alcatel-Lucent USA, Inc., 6.450%, 3/15/2029 | | | 51,793,470 | |
| | 5,845,000 | | | Alcatel-Lucent USA, Inc., 6.500%, 1/15/2028 | | | 3,799,250 | |
| | 21,850,000 | | | Amkor Technology, Inc., 6.375%, 10/01/2022, 144A | | | 21,522,250 | |
| | 63,000 | | | Freescale Semiconductor, Inc., 8.875%, 12/15/2014 | | | 63,945 | |
| | 475,000 | | | Motorola Solutions, Inc., 6.000%, 11/15/2017 | | | 566,941 | |
| | 2,562,000 | | | Motorola Solutions, Inc., 6.625%, 11/15/2037 | | | 2,745,237 | |
| | 4,170,000 | | | Nortel Networks Capital Corp., 7.875%, 6/15/2026(d) | | | 4,430,625 | |
| | 240,000 | | | Samsung Electronics Co. Ltd., 7.700%, 10/01/2027, 144A | | | 310,113 | |
| | | | | | | | |
| | | | | | | 133,093,832 | |
| | | | | | | | |
| | | | Textile — 0.0% | |
| | 2,595,000 | | | Jones Group, Inc. (The), 6.125%, 11/15/2034 | | | 2,127,900 | |
| | 3,450,000 | | | Jones Group, Inc./Apparel Group Holdings/Apparel Group USA/Footwear Accessories Retail, 6.875%, 3/15/2019 | | | 3,562,125 | |
| | | | | | | | |
| | | | | | | 5,690,025 | |
| | | | | | | | |
See accompanying notes to financial statements.
23 |
Portfolio of Investments – as of September 30, 2012
Loomis Sayles Strategic Income Fund – (continued)
| | | | | | | | |
Principal
Amount (‡) | | | Description | | Value (†) | |
| | | | Tobacco — 0.1% | |
| $ | 6,175,000 | | | Reynolds American, Inc., 7.250%, 6/15/2037 | | $ | 7,806,046 | |
| | | | | | | | |
| | | | Transportation Services — 0.3% | |
| | 10,503,000 | | | APL Ltd., 8.000%, 1/15/2024(b) | | | 8,953,808 | |
| | 7,403,003 | | | Atlas Air Pass Through Trust, Series 1998-1, Class B, 7.680%, 7/02/2015 | | | 7,069,868 | |
| | 6,862,758 | | | Atlas Air Pass Through Trust, Series 1998-1, Class C,
8.010%, 7/02/2011(f)(g) | | | 6,039,227 | |
| | 6,325,041 | | | Atlas Air Pass Through Trust, Series 1999-1, Class A-1, 7.200%, 7/02/2020 | | | 6,388,292 | |
| | 6,267,285 | | | Atlas Air Pass Through Trust, Series 1999-1, Class B, 7.630%, 7/02/2016 | | | 5,421,202 | |
| | 4,744,556 | | | Atlas Air Pass Through Trust, Series 1999-1, Class C,
8.770%, 7/02/2012(f)(g) | | | 3,629,585 | |
| | 2,815,458 | | | Atlas Air Pass Through Trust, Series 2000-1, Class B, 9.057%, 7/02/2017 | | | 2,787,303 | |
| | 3,280,000 | | | Continental Airlines Pass Through Certificates, Series 2012-2, Class B,
5.500%, 4/29/2022 | | | 3,362,000 | |
| | 3,970,000 | | | Erac USA Finance Co., 7.000%, 10/15/2037, 144A | | | 4,947,100 | |
| | | | | | | | |
| | | | | | | 48,598,385 | |
| | | | | | | | |
| | | | Treasuries — 17.1% | |
| | 272,755,000 | | | Canadian Government, 2.250%, 8/01/2014, (CAD) | | | 283,336,707 | |
| | 201,485,000 | | | Canadian Government, 2.500%, 6/01/2015, (CAD) | | | 212,453,851 | |
| | 89,045,000 | | | Canadian Government, 3.000%, 12/01/2015, (CAD) | | | 95,682,390 | |
| | 80,216,000 | | | Canadian Government, 3.500%, 6/01/2013, (CAD) | | | 82,924,137 | |
| | 171,980,000 | | | Canadian Government, 3.750%, 6/01/2019, (CAD) | | | 200,300,458 | |
| | 25,445,000 | | | Canadian Government, 4.250%, 6/01/2018, (CAD) | | | 29,956,822 | |
| | 118,375,000 | | | Ireland Government Bond, 4.500%, 10/18/2018, (EUR) | | | 151,308,495 | |
| | 80,820,000 | | | Ireland Government Bond, 4.500%, 4/18/2020, (EUR) | | | 99,911,126 | |
| | 24,400,000 | | | Ireland Government Bond, 5.000%, 10/18/2020, (EUR) | | | 31,098,101 | |
| | 121,560,000 | | | Ireland Government Bond, 5.400%, 3/13/2025, (EUR) | | | 155,157,629 | |
| | 1,440,000 | | | Italy Buoni Poliennali Del Tesoro, 5.000%, 8/01/2034, (EUR) | | | 1,680,598 | |
| | 1,440,000 | | | Italy Buoni Poliennali Del Tesoro, 5.250%, 11/01/2029, (EUR) | | | 1,787,260 | |
| | 1,435,000 | | | Italy Buoni Poliennali Del Tesoro, 5.750%, 2/01/2033, (EUR) | | | 1,840,764 | |
| | 18,686,981(†††) | | | Mexican Fixed Rate Bonds, Series M-20, 8.000%, 12/07/2023, (MXN) | | | 176,392,731 | |
| | 22,670,000 | | | New Zealand Government Bond, 6.000%, 12/15/2017, (NZD) | | | 21,618,686 | |
| | 53,301,000 | | | New Zealand Government Bond, 6.500%, 4/15/2013, (NZD) | | | 45,110,619 | |
| | 457,420,000 | | | Norwegian Government Bond, 4.250%, 5/19/2017, (NOK) | | | 89,622,031 | |
| | 221,050,000 | | | Norwegian Government Bond, 5.000%, 5/15/2015, (NOK) | | | 42,115,602 | |
| | 1,520,540,000 | | | Norwegian Government Bond, 6.500%, 5/15/2013, (NOK) | | | 273,118,063 | |
| | 21,120,000 | | | Portugal Obrigacoes do Tesouro OT, 3.850%, 4/15/2021, (EUR) | | | 19,087,738 | |
| | 1,995,000 | | | Portugal Obrigacoes do Tesouro OT, 4.100%, 4/15/2037, (EUR) | | | 1,400,535 | |
| | 6,225,000 | | | Portugal Obrigacoes do Tesouro OT, 4.800%, 6/15/2020, (EUR) | | | 6,232,359 | |
| | 14,475,000 | | | Portugal Obrigacoes do Tesouro OT, 4.950%, 10/25/2023, (EUR) | | | 13,294,203 | |
| | 65,300,000 | | | Singapore Government Bond, 1.375%, 10/01/2014, (SGD) | | | 54,370,338 | |
| | 419,985,000 | | | U.S. Treasury Note, 0.250%, 6/30/2014 | | | 420,066,897 | |
| | | | | | | | |
| | | | | | | 2,509,868,140 | |
| | | | | | | | |
| | | | Wireless — 0.7% | |
| | 19,004,000 | | | Nextel Communications, Inc., Series D, 7.375%, 8/01/2015 | | | 19,075,265 | |
| | 31,041,000 | | | Sprint Capital Corp., 6.875%, 11/15/2028 | | | 28,557,720 | |
| | 29,252,000 | | | Sprint Capital Corp., 6.900%, 5/01/2019 | | | 30,348,950 | |
See accompanying notes to financial statements.
| 24
Portfolio of Investments – as of September 30, 2012
Loomis Sayles Strategic Income Fund – (continued)
| | | | | | | | |
Principal
Amount (‡) | | | Description | | Value (†) | |
| | | | Wireless — continued | |
| $ | 6,260,000 | | | Sprint Capital Corp., 8.750%, 3/15/2032 | | $ | 6,479,100 | |
| | 11,309,000 | | | Sprint Nextel Corp., 6.000%, 12/01/2016 | | | 11,648,270 | |
| | | | | | | | |
| | | | | | | 96,109,305 | |
| | | | | | | | |
| | | | Wirelines — 3.7% | |
| | 5,650,000 | | | Axtel SAB de CV, 9.000%, 9/22/2019, 144A | | | 3,503,000 | |
| | 4,370,000 | | | Bell Canada, MTN, 6.550%, 5/01/2029, 144A, (CAD) | | | 5,518,886 | |
| | 21,480,000 | | | Bell Canada, Series M-17, 6.100%, 3/16/2035, (CAD) | | | 26,655,214 | |
| | 2,715,000 | | | BellSouth Telecommunications, Inc., 7.000%, 12/01/2095 | | | 3,406,918 | |
| | 72,320,000 | | | CenturyLink, Inc., 6.450%, 6/15/2021 | | | 81,613,120 | |
| | 765,000 | | | CenturyLink, Inc., 7.650%, 3/15/2042 | | | 815,039 | |
| | 7,410,000 | | | CenturyLink, Inc., Series G, 6.875%, 1/15/2028 | | | 7,962,438 | |
| | 2,965,000 | | | CenturyLink, Inc., Series P, 7.600%, 9/15/2039 | | | 3,135,855 | |
| | 350,000 | | | Cincinnati Bell Telephone Co. LLC, 6.300%, 12/01/2028 | | | 318,500 | |
| | 155,000 | | | Cincinnati Bell, Inc., 7.000%, 2/15/2015 | | | 156,550 | |
| | 5,330,000 | | | Embarq Corp., 7.995%, 6/01/2036 | | | 5,994,342 | |
| | 38,336,000 | | | Frontier Communications Corp., 7.875%, 1/15/2027 | | | 37,665,120 | |
| | 1,120,000 | | | Koninklijke (Royal) KPN NV, EMTN, 5.750%, 3/18/2016, (GBP) | | | 2,020,707 | |
| | 1,800,000 | | | Koninklijke (Royal) KPN NV, GMTN, 4.000%, 6/22/2015, (EUR) | | | 2,482,981 | |
| | 28,505,000 | | | Level 3 Financing, Inc., 7.000%, 6/01/2020, 144A | | | 28,790,050 | |
| | 5,965,000 | | | Level 3 Financing, Inc., 8.625%, 7/15/2020 | | | 6,442,200 | |
| | 2,555,000 | | | Level 3 Financing, Inc., 9.375%, 4/01/2019 | | | 2,836,050 | |
| | 500,000 | | | OTE PLC, GMTN, 4.625%, 5/20/2016, (EUR) | | | 446,568 | |
| | 16,550,000 | | | Portugal Telecom International Finance BV, EMTN,
4.500%, 6/16/2025, (EUR) | | | 17,014,058 | |
| | 29,750,000 | | | Portugal Telecom International Finance BV, EMTN,
5.000%, 11/04/2019, (EUR) | | | 35,271,210 | |
| | 750,000 | | | Portugal Telecom International Finance BV, EMTN,
5.625%, 2/08/2016, (EUR) | | | 958,968 | |
| | 800,000 | | | Portugal Telecom International Finance BV, GMTN,
4.375%, 3/24/2017, (EUR) | | | 969,956 | |
| | 16,335,000 | | | Qwest Capital Funding, Inc., 6.500%, 11/15/2018 | | | 18,661,823 | |
| | 42,460,000 | | | Qwest Capital Funding, Inc., 6.875%, 7/15/2028 | | | 44,804,047 | |
| | 12,463,000 | | | Qwest Capital Funding, Inc., 7.625%, 8/03/2021 | | | 13,756,285 | |
| | 32,395,000 | | | Qwest Capital Funding, Inc., 7.750%, 2/15/2031 | | | 35,176,726 | |
| | 31,060,000 | | | Qwest Corp., 6.875%, 9/15/2033 | | | 31,448,250 | |
| | 3,075,000 | | | Qwest Corp., 7.200%, 11/10/2026 | | | 3,109,594 | |
| | 3,999,000 | | | Qwest Corp., 7.250%, 9/15/2025 | | | 4,897,743 | |
| | 26,800,000 | | | Telecom Italia Capital S.A., 6.000%, 9/30/2034 | | | 23,718,000 | |
| | 22,415,000 | | | Telecom Italia Capital S.A., 6.375%, 11/15/2033 | | | 20,453,687 | |
| | 4,350,000 | | | Telefonica Emisiones SAU, 7.045%, 6/20/2036 | | | 4,241,250 | |
| | 31,690,000 | | | Telus Corp., 4.950%, 3/15/2017, (CAD) | | | 35,792,197 | |
| | 18,600,000 | | | Telus Corp., Series CG, 5.050%, 12/04/2019, (CAD) | | | 21,631,132 | |
| | 3,060,000 | | | Verizon Maryland, Inc., Series B, 5.125%, 6/15/2033 | | | 3,244,937 | |
| | 3,346,000 | | | Verizon New England, Inc., 7.875%, 11/15/2029 | | | 4,300,236 | |
| | 5,215,000 | | | Verizon Pennsylvania, Inc., 6.000%, 12/01/2028 | | | 5,669,289 | |
| | | | | | | | |
| | | | | | | 544,882,926 | |
| | | | | | | | |
| | | | Total Non-Convertible Bonds
(Identified Cost $8,608,650,732) | | | 9,302,451,755 | |
| | | | | | | | |
See accompanying notes to financial statements.
25 |
Portfolio of Investments – as of September 30, 2012
Loomis Sayles Strategic Income Fund – (continued)
| | | | | | | | |
Principal
Amount (‡) | | | Description | | Value (†) | |
| | Convertible Bonds — 7.2% | |
| | | | Airlines — 0.0% | | | | |
| $ | 1,255,000 | | | United Continental Holdings, Inc., 4.500%, 6/30/2021 | | $ | 1,189,351 | |
| | | | | | | | |
| | | | Automotive — 1.3% | | | | |
| | 4,240,000 | | | ArvinMeritor, Inc., (Step to Zero Coupon on 2/15/2019),
4.000%, 2/15/2027(h) | | | 3,156,150 | |
| | 125,580,000 | | | Ford Motor Co., 4.250%, 11/15/2016 | | | 173,221,912 | |
| | 8,460,000 | | | Navistar International Corp., 3.000%, 10/15/2014 | | | 7,502,963 | |
| | | | | | | | |
| | | | | | | 183,881,025 | |
| | | | | | | | |
| | | | Brokerage — 0.0% | | | | |
| | 5,025,000 | | | Jefferies Group, Inc., 3.875%, 11/01/2029 | | | 4,842,844 | |
| | | | | | | | |
| | | | Diversified Manufacturing — 0.3% | | | | |
| | 30,570,000 | | | Owens-Brockway Glass Container, Inc., 3.000%, 6/01/2015, 144A | | | 29,958,600 | |
| | 16,727,000 | | | Trinity Industries, Inc., 3.875%, 6/01/2036 | | | 17,281,082 | |
| | | | | | | | |
| | | | | | | 47,239,682 | |
| | | | | | | | |
| | | | Electric — 0.0% | |
| | 1,800,000 | | | CMS Energy Corp., 5.500%, 6/15/2029 | | | 3,071,250 | |
| | | | | | | | |
| | | | Healthcare — 0.4% | |
| | 19,215,000 | | | Hologic, Inc., (accretes to principal after 12/15/2013),
2.000%, 12/15/2037(h) | | | 19,058,878 | |
| | 1,300,000 | | | Hologic, Inc., (accretes to principal after 3/1/2018), 2.000%, 3/01/2042(h) | | | 1,265,063 | |
| | 1,810,000 | | | Illumina, Inc., 0.250%, 3/15/2016, 144A | | | 1,686,694 | |
| | 190,000 | | | LifePoint Hospitals, Inc., 3.250%, 8/15/2025 | | | 190,950 | |
| | 2,380,000 | | | LifePoint Hospitals, Inc., 3.500%, 5/15/2014 | | | 2,586,762 | |
| | 3,780,000 | | | Omnicare, Inc., 3.250%, 12/15/2035 | | | 3,732,750 | |
| | 20,495,000 | | | Omnicare, Inc., 3.750%, 12/15/2025 | | | 28,949,187 | |
| | | | | | | | |
| | | | | | | 57,470,284 | |
| | | | | | | | |
| | | | Home Construction — 0.6% | |
| | 52,005,000 | | | Lennar Corp., 3.250%, 11/15/2021, 144A | | | 85,743,244 | |
| | | | | | | | |
| | | | Independent Energy — 0.3% | |
| | 20,440,000 | | | Chesapeake Energy Corp., 2.250%, 12/15/2038 | | | 16,466,975 | |
| | 24,655,000 | | | Chesapeake Energy Corp., 2.500%, 5/15/2037 | | | 22,143,272 | |
| | 11,536,000 | | | Chesapeake Energy Corp., 2.750%, 11/15/2035 | | | 10,980,830 | |
| | | | | | | | |
| | | | | | | 49,591,077 | |
| | | | | | | | |
| | | | Life Insurance — 0.5% | |
| | 72,915,000 | | | Old Republic International Corp., 3.750%, 3/15/2018 | | | 72,550,425 | |
| | | | | | | | |
| | | | Media Non-Cable — 0.0% | |
| | 5,841,174 | | | Liberty Media LLC, 3.500%, 1/15/2031 | | | 2,759,955 | |
| | | | | | | | |
| | | | Metals & Mining — 0.1% | |
| | 1,000,000 | | | Steel Dynamics, Inc., 5.125%, 6/15/2014 | | | 1,045,625 | |
| | 11,270,000 | | | United States Steel Corp., 4.000%, 5/15/2014 | | | 11,389,744 | |
| | | | | | | | |
| | | | | | | 12,435,369 | |
| | | | | | | | |
| | | | Pharmaceuticals — 0.0% | |
| | 3,065,000 | | | Vertex Pharmaceuticals, Inc., 3.350%, 10/01/2015 | | | 3,936,609 | |
| | | | | | | | |
See accompanying notes to financial statements.
| 26
Portfolio of Investments – as of September 30, 2012
Loomis Sayles Strategic Income Fund – (continued)
| | | | | | | | |
Principal
Amount (‡) | | | Description | | Value (†) | |
| | | | REITs - Warehouse/Industrials — 0.2% | |
| $ | 19,445,000 | | | ProLogis LP, 3.250%, 3/15/2015 | | $ | 21,814,859 | |
| | | | | | | | |
| | | | Technology — 2.7% | |
| | 4,320,000 | | | Alcatel-Lucent USA, Inc., Series B, 2.875%, 6/15/2025 | | | 4,233,600 | |
| | 49,215,000 | | | Ciena Corp., 0.875%, 6/15/2017 | | | 42,355,659 | |
| | 7,185,000 | | | Ciena Corp., 3.750%, 10/15/2018, 144A | | | 7,544,250 | |
| | 6,075,000 | | | Ciena Corp., 4.000%, 3/15/2015, 144A | | | 6,538,219 | |
| | 11,463,000 | | | Intel Corp., 2.950%, 12/15/2035 | | | 12,466,013 | |
| | 220,000,000 | | | Intel Corp., 3.250%, 8/01/2039 | | | 271,150,000 | |
| | 1,055,000 | | | Lam Research Corp., Series B, 1.250%, 5/15/2018 | | | 1,019,394 | |
| | 52,965,000 | | | Micron Technology, Inc., Series B, 1.875%, 8/01/2031 | | | 46,642,303 | |
| | 8,550,000 | | | Micron Technology, Inc., Series C, 2.375%, 5/01/2032, 144A | | | 7,994,250 | |
| | | | | | | | |
| | | | 399,943,688 | |
| | | | | | | | |
| | | | Wirelines — 0.8% | |
| | 6,000,000 | | | Level 3 Communications, Inc., 6.500%, 10/01/2016 | | | 8,625,000 | |
| | 54,075,000 | | | Level 3 Communications, Inc., 7.000%, 3/15/2015, 144A(b) | | | 65,396,953 | |
| | 32,895,000 | | | Level 3 Communications, Inc., Series B, 7.000%, 3/15/2015(b) | | | 39,782,390 | |
| | 900,000 | | | Portugal Telecom International Finance BV, Series PTC,
4.125%, 8/28/2014, (EUR) | | | 1,147,871 | |
| | | | | | | | |
| | | | 114,952,214 | |
| | | | | | | | |
| | | | Total Convertible Bonds
(Identified Cost $893,931,444) | | | 1,061,421,876 | |
| | | | | | | | |
| | | | | | | | |
| | Municipals — 1.0% | |
| | | | District of Columbia — 0.0% | |
| | 3,850,000 | | | Metropolitan Washington DC Airports Authority, Series D,
8.000%, 10/01/2047 | | | 4,770,612 | |
| | | | | | | | |
| | | | Illinois — 0.3% | |
| | 1,725,000 | | | Chicago O’Hare International Airport, Series A, (AGMC insured),
4.500%, 1/01/2038 | | | 1,797,674 | |
| | 47,285,000 | | | State of Illinois, 5.100%, 6/01/2033 | | | 45,826,731 | |
| | | | | | | | |
| | | | 47,624,405 | |
| | | | | | | | |
| | | | Michigan — 0.1% | |
| | 12,375,000 | | | Michigan Tobacco Settlement Finance Authority Taxable Turbo, Series A, 7.309%, 6/01/2034(b) | | | 9,986,749 | |
| | | | | | | | |
| | | | Virginia — 0.6% | |
| | 128,820,000 | | | Virginia Tobacco Settlement Financing Corp., Series A-1,
6.706%, 6/01/2046(b) | | | 87,426,269 | |
| | | | | | | | |
| | | | Total Municipals
(Identified Cost $182,422,709) | | | 149,808,035 | |
| | | | | | | | |
| | | | Total Bonds and Notes
(Identified Cost $9,685,004,885) | | | 10,513,681,666 | |
| | | | | | | | |
See accompanying notes to financial statements.
27 |
Portfolio of Investments – as of September 30, 2012
Loomis Sayles Strategic Income Fund – (continued)
| | | | | | | | |
Principal
Amount (‡) | | | Description | | Value (†) | |
| | Senior Loans — 1.7% | |
| | | | Automotive — 0.1% | |
| $ | 19,082,055 | | | TI Group Automotive Systems, LLC, New Term Loan, 6.750%, 3/14/2018(c) | | $ | 19,177,466 | |
| | | | | | | | |
| | | | Consumer Products — 0.2% | |
| | 2,665,820 | | | Supervalu, Inc., New Term Loan B, 8/30/2018(i) | | | 2,678,189 | |
| | 26,543,729 | | | Supervalu, Inc., New Term Loan B, 8.000%, 8/30/2018(c) | | | 26,666,892 | |
| | | | | | | | |
| | | | | | | 29,345,081 | |
| | | | | | | | |
| | | | Electric — 0.0% | |
| | 4,788,467 | | | Texas Competitive Electric Holdings Company, LLC, Non-Extended Term Loan, 3.757%, 10/10/2014(j) | | | 3,553,952 | |
| | | | | | | | |
| | | | Food & Beverage — 0.1% | |
| | 13,701,976 | | | DS Waters Enterprises, LP, 1st Lien Term Loan, 10.500%, 8/29/2017(c) | | | 14,113,035 | |
| | | | | | | | |
| | | | Independent Energy — 0.2% | |
| | 22,900,000 | | | Chesapeake Energy Corporation, Unsecured Term Loan,
8.500%, 12/01/2017(c) | | | 22,958,395 | |
| | | | | | | | |
| | | | Media Non-Cable — 0.1% | |
| | 21,200,705 | | | SuperMedia, Inc., Exit Term Loan, 11.000%, 12/31/2015(c) | | | 13,851,057 | |
| | | | | | | | |
| | | | Metals & Mining — 0.1% | |
| | 11,620,000 | | | Essar Steel Algoma, Inc., ABL Term Loan, 8.750%, 9/19/2014(c) | | | 11,649,050 | |
| | | | | | | | |
| | | | Non-Captive Diversified — 0.6% | |
| | 84,000,000 | | | iStar Financial, Inc., Add on Term Loan A2, 7.000%, 3/17/2017(c) | | | 85,260,000 | |
| | | | | | | | |
| | | | Wireless — 0.1% | |
| | 19,725,000 | | | Hawaiian Telcom Communications, Inc., Term Loan B,
7.000%, 2/28/2017(c) | | | 19,959,333 | |
| | | | | | | | |
| | | | Wirelines — 0.2% | |
| | 24,458,644 | | | FairPoint Communications, Inc., New Term Loan B, 6.501%, 1/22/2016(j) | | | 22,925,576 | |
| | | | | | | | |
| | | | Total Senior Loans
(Identified Cost $248,122,199) | | | 242,792,945 | |
| | | | | | | | |
| | | | | | | | |
| Shares | | | | | | |
| | Common Stocks — 17.3% | |
| | | | Biotechnology — 0.3% | |
| | 867,059 | | | Vertex Pharmaceuticals, Inc.(g) | | | 48,511,951 | |
| | | | | | | | |
| | | | Chemicals — 1.8% | |
| | 1,364,851 | | | Dow Chemical Co. (The) | | | 39,526,085 | |
| | 2,000,000 | | | PPG Industries, Inc. | | | 229,680,000 | |
| | | | | | | | |
| | | | 269,206,085 | |
| | | | | | | | |
| | | | Containers & Packaging — 0.1% | |
| | 460,656 | | | Owens-Illinois, Inc.(g) | | | 8,641,907 | |
| | 1,675 | | | Rock-Tenn Co., Class A | | | 120,901 | |
| | | | | | | | |
| | | | 8,762,808 | |
| | | | | | | | |
| | | | Diversified Financial Services — 0.2% | |
| | 3,979,932 | | | Bank of America Corp. | | | 35,142,800 | |
| | | | | | | | |
See accompanying notes to financial statements.
| 28
Portfolio of Investments – as of September 30, 2012
Loomis Sayles Strategic Income Fund – (continued)
| | | | | | | | |
Shares | | | Description | | Value (†) | |
| | | | Diversified Telecommunication Services — 2.1% | |
| | 183,181 | | | FairPoint Communications, Inc.(g) | | $ | 1,384,849 | |
| | 283,397 | | | Hawaiian Telcom Holdco, Inc.(g) | | | 5,024,629 | |
| | 200,000 | | | Telecom Italia SpA, Sponsored ADR | | | 2,008,000 | |
| | 3,871,339 | | | Telecom Italia SpA, Sponsored ADR | | | 33,487,082 | |
| | 19,550,590 | | | Telefonica S.A., Sponsored ADR | | | 259,631,835 | |
| | | | | | | | |
| | | | | | | 301,536,395 | |
| | | | | | | | |
| | | | Electric Utilities — 0.0% | |
| | 94,166 | | | Duke Energy Corp. | | | 6,101,957 | |
| | | | | | | | |
| | | | Electronic Equipment, Instruments & Components — 2.9% | |
| | 32,000,000 | | | Corning, Inc. | | | 420,800,000 | |
| | | | | | | | |
| | | | Food Products — 0.4% | |
| | 2,309,175 | | | ConAgra Foods, Inc. | | | 63,710,138 | |
| | | | | | | | |
| | | | Household Durables — 0.2% | |
| | 477,725 | | | KB Home | | | 6,855,354 | |
| | 549,450 | | | Lennar Corp., Class A | | | 19,104,376 | |
| | | | | | | | |
| | | | | | | 25,959,730 | |
| | | | | | | | |
| | | | Insurance — 0.6% | |
| | 1,510,275 | | | Prudential Financial, Inc. | | | 82,325,090 | |
| | | | | | | | |
| | | | Oil, Gas & Consumable Fuels — 1.9% | |
| | 846,398 | | | Chesapeake Energy Corp. | | | 15,971,530 | |
| | 5,351,804 | | | Repsol YPF S.A., Sponsored ADR | | | 103,289,817 | |
| | 2,134,173 | | | Royal Dutch Shell PLC, ADR | | | 148,132,948 | |
| | 141,249 | | | Spectra Energy Corp. | | | 4,147,071 | |
| | | | | | | | |
| | | | | | | 271,541,366 | |
| | | | | | | | |
| | | | Pharmaceuticals — 3.0% | |
| | 8,514,190 | | | Bristol-Myers Squibb Co. | | | 287,353,912 | |
| | 2,288 | | | Teva Pharmaceutical Industries, Ltd., Sponsored ADR | | | 94,746 | |
| | 2,691,177 | | | Valeant Pharmaceuticals International, Inc.(g) | | | 148,741,353 | |
| | | | | | | | |
| | | | | | | 436,190,011 | |
| | | | | | | | |
| | | | REITs — Apartments — 0.3% | |
| | 290,904 | | | Apartment Investment & Management Co., Class A | | | 7,560,595 | |
| | 889,730 | | | Associated Estates Realty Corp. | | | 13,488,307 | |
| | 460,000 | | | Equity Residential | | | 26,463,800 | |
| | | | | | | | |
| | | | | | | 47,512,702 | |
| | | | | | | | |
| | | | REITs — Regional Malls — 0.1% | |
| | 123,159 | | | Simon Property Group, Inc. | | | 18,696,768 | |
| | | | | | | | |
| | | | REITs — Shopping Centers — 0.0% | |
| | 201,557 | | | DDR Corp. | | | 3,095,915 | |
| | | | | | | | |
| | | | Semiconductors & Semiconductor Equipment — 2.1% | |
| | 13,359,360 | | | Intel Corp. | | | 302,990,285 | |
| | | | | | | | |
| | | | Software — 1.3% | |
| | 6,568,091 | | | Microsoft Corp. | | | 195,597,750 | |
| | | | | | | | |
| | | | Total Common Stocks
(Identified Cost $2,301,163,783) | | | 2,537,681,751 | |
| | | | | | | | |
See accompanying notes to financial statements.
29 |
Portfolio of Investments – as of September 30, 2012
Loomis Sayles Strategic Income Fund – (continued)
| | | | | | | | |
Shares | | | Description | | Value (†) | |
| | Preferred Stocks — 2.7% | | | | |
| | Convertible Preferred Stocks — 1.9% | | | | |
| | | | Automotive — 0.9% | |
| | 2,826,055 | | | General Motors Co., Series B, 4.750% | | $ | 105,355,330 | |
| | 657,940 | | | Goodyear Tire & Rubber Co. (The), 5.875% | | | 29,061,210 | |
| | | | | | | | |
| | | | 134,416,540 | |
| | | | | | | | |
| | | | Banking — 0.3% | |
| | 19,062 | | | Bank of America Corp., Series L, 7.250% | | | 20,777,580 | |
| | 203,658 | | | Sovereign Capital Trust IV, 4.375% | | | 13,339,599 | |
| | 8,533 | | | Wells Fargo & Co., Series L, Class A, 7.500% | | | 10,563,854 | |
| | | | | | | | |
| | | | 44,681,033 | |
| | | | | | | | |
| | | | Construction Machinery — 0.1% | |
| | 145,110 | | | United Rentals Trust I, 6.500% | | | 7,024,224 | |
| | | | | | | | |
| | | | Electric — 0.1% | |
| | 380,577 | | | AES Trust III, 6.750% | | | 18,967,958 | |
| | | | | | | | |
| | | | Home Construction — 0.1% | |
| | 355,000 | | | Hovnanian Enterprises, Inc., 7.250% | | | 6,737,900 | |
| | | | | | | | |
| | | | Independent Energy — 0.1% | |
| | 52,020 | | | Chesapeake Energy Corp., 4.500% | | | 4,214,140 | |
| | 99,800 | | | SandRidge Energy, Inc., 8.500% | | | 10,859,238 | |
| | | | | | | | |
| | | | 15,073,378 | |
| | | | | | | | |
| | | | Pipelines — 0.1% | |
| | 242,297 | | | El Paso Energy Capital Trust I, 4.750% | | | 13,166,419 | |
| | | | | | | | |
| | | | REITs - Healthcare — 0.0% | |
| | 116,700 | | | Health Care REIT, Inc., Series I, 6.500% | | | 6,432,504 | |
| | | | | | | | |
| | | | Technology — 0.2% | |
| | 55,430 | | | Lucent Technologies Capital Trust I, 7.750% | | | 32,149,400 | |
| | | | | | | | |
| | | | Total Convertible Preferred Stocks
(Identified Cost $306,794,784) | | | 278,649,356 | |
| | | | | | | | |
| | | | | | | | |
| | Non-Convertible Preferred Stocks — 0.8% | | | | |
| | | | Banking — 0.2% | |
| | 35,000 | | | Bank of America Corp., 6.375% | | | 872,900 | |
| | 847,800 | | | Citigroup Capital XIII, (fixed rate to 10/30/2015, variable rate thereafter), 7.875% | | | 23,611,230 | |
| | 389,800 | | | Countrywide Capital IV, 6.750% | | | 9,745,000 | |
| | | | | | | | |
| | | | 34,229,130 | |
| | | | | | | | |
| | | | Electric — 0.0% | |
| | 393 | | | Entergy New Orleans, Inc., 4.750% | | | 40,896 | |
| | | | | | | | |
| | | | Government Sponsored — 0.2% | |
| | 26,000 | | | Falcons Funding Trust I, (Step to 10.875% on 3/15/2015, variable rate after 3/15/2020), 8.875%, 144A(h) | | | 27,308,125 | |
| | | | | | | | |
| | | | Home Construction — 0.0% | |
| | 208,246 | | | Hovnanian Enterprises, Inc., 7.625%(g) | | | 1,707,617 | |
| | | | | | | | |
See accompanying notes to financial statements.
| 30
Portfolio of Investments – as of September 30, 2012
Loomis Sayles Strategic Income Fund – (continued)
| | | | | | | | |
Shares | | | Description | | Value (†) | |
| | | | Independent Energy — 0.0% | |
| | 20,800 | | | Chesapeake Energy Corp., 5.000% | | $ | 1,664,000 | |
| | | | | | | | |
| | | | Non-Captive Consumer — 0.0% | |
| | 101,175 | | | SLM Corp., Series A, 6.970% | | | 4,843,247 | |
| | | | | | | | |
| | | | Non-Captive Diversified — 0.3% | |
| | 45,861 | | | Ally Financial, Inc., Series G, 7.000%, 144A | | | 42,901,535 | |
| | | | | | | | |
| | | | REITs — Office Property — 0.0% | |
| | 1,596 | | | Highwoods Properties, Inc., Series A, 8.625% | | | 1,925,175 | |
| | | | | | | | |
| | | | REITs — Warehouse/Industrials — 0.1% | |
| | 116,192 | | | ProLogis, Inc., Series Q, 8.540% | | | 7,087,712 | |
| | | | | | | | |
| | | | Total Non-Convertible Preferred Stocks
(Identified Cost $84,479,145) | | | 121,707,437 | |
| | | | | | | | |
| | | | Total Preferred Stocks
(Identified Cost $391,273,929) | | | 400,356,793 | |
| | | | | | | | |
| | | | | | | | |
| | Closed End Investment Companies — 0.0% | | | | |
| | 37,350 | | | Morgan Stanley Emerging Markets Debt Fund, Inc. | | | 450,068 | |
| | 681,131 | | | NexPoint Credit Strategies Fund | | | 4,706,615 | |
| | | | | | | | |
| | | | Total Closed End Investment Companies
(Identified Cost $10,586,370) | | | 5,156,683 | |
| | | | | | | | |
| | | | | | | | |
Principal
Amount (‡) | | | | | | |
| | Short-Term Investments — 5.9% | | | | |
| $ | 2,655,073 | | | Repurchase Agreement with State Street Bank and Trust Company, dated 9/28/2012 at 0.010% to be repurchased at $2,655,075 on 10/01/2012 collateralized by $1,920,000 U.S. Treasury Bond, 5.250% due 2/15/2029 valued at $2,704,852 including accrued interest (Note 2 of Notes to Financial Statements) | | | 2,655,073 | |
| | 866,468,158 | | | Tri-Party Repurchase Agreement with Fixed Income Clearing Corporation, dated 9/28/2012 at 0.010% to be repurchased at $866,468,880 on 10/01/2012 collateralized by $112,120,000 Federal Home Loan Mortgage Corp., 3.000% due 8/01/2019 valued at $115,012,696; $109,860,000 Federal Home Loan Mortgage Corp., 3.000% due 7/10/2019 valued at $112,881,150; $142,000,000 Federal Home Loan Mortgage Corp., 3.000% due 7/31/2019 valued at $145,905,000; $150,000,000 Federal National Mortgage Association, 0.750%, due 9/21/2016 valued at $150,021,875; $143,055,000 U.S. Treasury Note, 2.750% due 11/30/2016 valued at $157,718,138; $40,520,000 U.S. Treasury Note, 1.500% due 7/31/2016 valued at $42,257,254; $156,000,000 U.S. Treasury Note, 1.000% due 10/31/2016 valued at $160,003,896 including accrued interest (Note 2 of Notes to Financial Statements) | | | 866,468,158 | |
| | | | | | | | |
| | | | Total Short-Term Investments
(Identified Cost $869,123,231) | | | 869,123,231 | |
| | | | | | | | |
See accompanying notes to financial statements.
31 |
Portfolio of Investments – as of September 30, 2012
Loomis Sayles Strategic Income Fund – (continued)
| | | | | | | | |
| | | | | | Value (†) | |
| | | | Total Investments — 99.1%
(Identified Cost $13,505,274,397)(a) | | $ | 14,568,793,069 | |
| | | | Other assets less liabilities — 0.9% | | | 128,957,713 | |
| | | | | | | | |
| | | | Net Assets — 100.0% | | $ | 14,697,750,782 | |
| | | | | | | | |
| | (‡) | | | Principal Amount stated in U.S. dollars unless otherwise noted. | | | | |
| | (†) | | | See Note 2 of Notes to Financial Statements. | | | | |
| | (††) | | | Amount shown represents units. One unit represents a principal amount of 25. | | | | |
| | (†††) | | | Amount shown represents units. One unit represents a principal amount of 100. | | | | |
| | (a) | | | Federal Tax Information: | |
| | | | At September 30, 2012, the net unrealized appreciation on investments based on a cost of $13,606,771,954 for federal income tax purposes was as follows: | |
| | | | Aggregate gross unrealized appreciation for all investments in which there is an excess of value over tax cost | | $ | 1,631,360,131 | |
| | | | Aggregate gross unrealized depreciation for all investments in which there is an excess of tax cost over value | | | (669,339,016 | ) |
| | | | | | | | |
| | | | Net unrealized appreciation | | $ | 962,021,115 | |
| | | | | | | | |
| | (b) | | | Illiquid security. At September 30, 2012, the value of these securities amounted to $310,417,964 or 2.1% of net assets. | |
| | (c) | | | Variable rate security. Rate as of September 30, 2012 is disclosed. | |
| | (d) | | | The issuer is in default with respect to interest and/or principal payments. Income is not being accrued. | |
| | (e) | | | Fair valued security by the Fund’s investment adviser. At September 30, 2012, the value of this security amounted to $12,874,750 or 0.1% of net assets. | |
| | (f) | | | Maturity has been extended under the terms of a plan of reorganization. | |
| | (g) | | | Non-income producing security. | |
| | (h) | | | Coupon rate is a fixed rate for an initial period then resets at a specified date and rate. | |
| | (i) | | | Position is unsettled. Contract rate was not determined at September 30, 2012 and does not take effect until settlement date. | |
| | (j) | | | Variable rate security. Rate shown represents the weighted average rate of underlying contracts at September 30, 2012. | |
| | | | | | | | |
| | 144A | | | All or a portion of these securities are exempt from registration under Rule 144A of the Securities Act of 1933. These securities may be resold in transactions exempt from registration, normally to qualified institutional buyers. At September 30, 2012, the value of Rule 144A holdings amounted to $1,551,876,789 or 10.6% of net assets. | |
| | ADR | | | An American Depositary Receipt is a certificate issued by a custodian bank representing the right to receive securities of the foreign issuer described. The values of ADRs may be significantly influenced by trading on exchanges not located in the United States. | |
| | ABS | | | Asset-Backed Securities | |
| | AGMC | | | Assured Guaranty Municipal Corp. | |
| | EMTN | | | Euro Medium Term Note | |
| | GMTN | | | Global Medium Term Note | |
| | MBIA | | | Municipal Bond Investors Assurance Corp. | |
| | MTN | | | Medium Term Note | |
| | REITs | | | Real Estate Investment Trusts | |
See accompanying notes to financial statements.
| 32
Portfolio of Investments – as of September 30, 2012
Loomis Sayles Strategic Income Fund – (continued)
| | | | | | |
| | AUD | | | Australian Dollar |
| | BRL | | | Brazilian Real |
| | CAD | | | Canadian Dollar |
| | CHF | | | Swiss Franc |
| | EUR | | | Euro |
| | GBP | | | British Pound |
| | IDR | | | Indonesian Rupiah |
| | ISK | | | Icelandic Krona |
| | KRW | | | South Korean Won |
| | MXN | | | Mexican Peso |
| | NOK | | | Norwegian Krone |
| | NZD | | | New Zealand Dollar |
| | SGD | | | Singapore Dollar |
Industry Summary at September 30, 2012 (Unaudited)
| | | | |
Treasuries | | | 17.1 | % |
Banking | | | 6.5 | |
Non-Captive Diversified | | | 5.5 | |
Wirelines | | | 4.7 | |
Non-Captive Consumer | | | 4.2 | |
Technology | | | 3.8 | |
Pharmaceuticals | | | 3.4 | |
Automotive | | | 3.2 | |
Electronic Equipment, Instruments & Components | | | 2.9 | |
Electric | | | 2.8 | |
Airlines | | | 2.6 | |
Chemicals | | | 2.2 | |
Semiconductors & Semiconductor Equipment | | | 2.1 | |
Diversified Telecommunication Services | | | 2.1 | |
Sovereigns | | | 2.0 | |
Other Investments, less than 2% each | | | 28.1 | |
Short-Term Investments | | | 5.9 | |
| | | | |
Total Investments | | | 99.1 | |
Other assets less liabilities | | | 0.9 | |
| | | | |
Net Assets | | | 100.0 | % |
| | | | |
See accompanying notes to financial statements.
33 |
Portfolio of Investments – as of September 30, 2012
Loomis Sayles Strategic Income Fund – (continued)
Currency Exposure Summary at September 30, 2012 (Unaudited)
| | | | |
United States Dollar | | | 70.3 | % |
Canadian Dollar | | | 7.5 | |
Euro | | | 4.8 | |
New Zealand Dollar | | | 3.9 | |
Australian Dollar | | | 3.4 | |
Norwegian Krone | | | 2.8 | |
Other, less than 2% each | | | 6.4 | |
| | | | |
Total Investments | | | 99.1 | |
Other assets less liabilities | | | 0.9 | |
| | | | |
Net Assets | | | 100.0 | % |
| | | | |
See accompanying notes to financial statements.
| 34
Statement of Assets and Liabilities
September 30, 2012
| | | | |
ASSETS | |
Investments at cost | | $ | 13,505,274,397 | |
Net unrealized appreciation | | | 1,063,518,672 | |
| | | | |
Investments at value | | | 14,568,793,069 | |
Cash | | | 76,018 | |
Due from custodian (Note 2) | | | 2,847,444 | |
Foreign currency at value (identified cost $6,644,076) | | | 6,620,909 | |
Receivable for Fund shares sold | | | 35,957,697 | |
Receivable for securities sold | | | 13,517,809 | |
Dividends and interest receivable | | | 176,716,225 | |
Tax reclaims receivable | | | 266,865 | |
| | | | |
TOTAL ASSETS | | | 14,804,796,036 | |
| | | | |
LIABILITIES | | | | |
Payable for securities purchased | | | 66,884,925 | |
Payable for Fund shares redeemed | | | 27,757,140 | |
Foreign taxes payable (Note 2) | | | 167,609 | |
Due to brokers (Note 2) | | | 2,847,444 | |
Management fees payable (Note 5) | | | 6,709,397 | |
Deferred Trustees’ fees (Note 5) | | | 834,963 | |
Administrative fees payable (Note 5) | | | 540,045 | |
Payable to distributor (Note 5d) | | | 124,277 | |
Other accounts payable and accrued expenses | | | 1,179,454 | |
| | | | |
TOTAL LIABILITIES | | | 107,045,254 | |
| | | | |
NET ASSETS | | $ | 14,697,750,782 | |
| | | | |
NET ASSETS CONSIST OF: | | | | |
Paid-in capital | | $ | 13,885,428,398 | |
Undistributed net investment income | | | 38,251,969 | |
Accumulated net realized loss on investments and foreign currency transactions | | | (289,873,847 | ) |
Net unrealized appreciation on investments and foreign currency translations | | | 1,063,944,262 | |
| | | | |
NET ASSETS | | $ | 14,697,750,782 | |
| | | | |
See accompanying notes to financial statements.
35 |
| | | | |
COMPUTATION OF NET ASSET VALUE AND OFFERING PRICE: | | | | |
Class A shares: | | | | |
Net assets | | $ | 5,155,286,543 | |
| | | | |
Shares of beneficial interest | | | 336,874,690 | |
| | | | |
Net asset value and redemption price per share | | $ | 15.30 | |
| | | | |
Offering price per share (100/95.50 of net asset value) (Note 1) | | $ | 16.02 | |
| | | | |
Class B shares: (redemption price per share is equal to net asset value less any applicable contingent deferred sales charge) (Note 1) | | | | |
Net assets | | $ | 89,552,103 | |
| | | | |
Shares of beneficial interest | | | 5,812,402 | |
| | | | |
Net asset value and offering price per share | | $ | 15.41 | |
| | | | |
Class C shares: (redemption price per share is equal to net asset value less any applicable contingent deferred sales charge) (Note 1) | | | | |
Net assets | | $ | 5,064,185,562 | |
| | | | |
Shares of beneficial interest | | | 329,044,586 | |
| | | | |
Net asset value and offering price per share | | $ | 15.39 | |
| | | | |
Class Y shares: | | | | |
Net assets | | $ | 4,339,240,236 | |
| | | | |
Shares of beneficial interest | | | 283,754,124 | |
| | | | |
Net asset value, offering and redemption price per share | | $ | 15.29 | |
| | | | |
Admin Class shares: | | | | |
Net assets | | $ | 49,486,338 | |
| | | | |
Shares of beneficial interest | | | 3,241,722 | |
| | | | |
Net asset value, offering and redemption price per share | | $ | 15.27 | |
| | | | |
See accompanying notes to financial statements.
| 36
Statement of Operations
For the Year Ended September 30, 2012
| | | | |
INVESTMENT INCOME | |
Interest | | $ | 681,795,151 | |
Dividends | | | 131,109,522 | |
Less net foreign taxes withheld | | | (9,311,011 | ) |
| | | | |
| | | 803,593,662 | |
| | | | |
Expenses | | | | |
Management fees (Note 5) | | | 77,503,021 | |
Service and distribution fees (Note 5) | | | 63,469,687 | |
Administrative fees (Note 5) | | | 6,330,496 | |
Trustees’ fees and expenses (Note 5) | | | 313,364 | |
Transfer agent fees and expenses (Note 5) | | | 11,634,164 | |
Audit and tax services fees | | | 54,256 | |
Custodian fees and expenses | | | 648,642 | |
Legal fees | | | 196,521 | |
Registration fees | | | 376,056 | |
Shareholder reporting expenses | | | 645,226 | |
Miscellaneous expenses | | | 345,364 | |
| | | | |
Total expenses | | | 161,516,797 | |
| | | | |
Net investment income | | | 642,076,865 | |
| | | | |
NET REALIZED AND UNREALIZED GAIN (LOSS) ON INVESTMENTS AND FOREIGN CURRENCY TRANSACTIONS | | | | |
Net realized gain (loss) on: | | | | |
Investments | | | 294,161,002 | |
Foreign currency transactions | | | (5,976,561 | ) |
Net change in unrealized appreciation (depreciation) on: | | | | |
Investments | | | 827,816,685 | |
Foreign currency translations | | | 7,452,752 | |
| | | | |
Net realized and unrealized gain on investments and foreign currency transactions | | | 1,123,453,878 | |
| | | | |
NET INCREASE IN NET ASSETS RESULTING FROM OPERATIONS | | $ | 1,765,530,743 | |
| | | | |
See accompanying notes to financial statements.
37 |
Statement of Changes in Net Assets
| | | | | | | | |
| | | Year Ended
September 30,
2012 | | | Year Ended
September 30,
2011 | |
FROM OPERATIONS: | |
Net investment income | | $ | 642,076,865 | | | $ | 662,753,316 | |
Net realized gain on investments and foreign currency transactions | | | 288,184,441 | | | | 365,118,083 | |
Net change in unrealized appreciation (depreciation) on investments and foreign currency translations | | | 835,269,437 | | | | (756,514,895 | ) |
| | | | | | | | |
Net increase in net assets resulting from operations | | | 1,765,530,743 | | | | 271,356,504 | |
| | | | | | | | |
FROM DISTRIBUTIONS TO SHAREHOLDERS: | | | | | | | | |
Net investment income | | | | | | | | |
Class A | | | (300,094,602 | ) | | | (312,937,228 | ) |
Class B | | | (4,942,822 | ) | | | (5,960,721 | ) |
Class C | | | (241,863,153 | ) | | | (237,583,471 | ) |
Class Y | | | (208,703,036 | ) | | | (155,221,506 | ) |
Admin Class | | | (1,997,277 | ) | | | (816,337 | ) |
| | | | | | | | |
Total distributions | | | (757,600,890 | ) | | | (712,519,263 | ) |
| | | | | | | | |
NET INCREASE (DECREASE) IN NET ASSETS FROM CAPITAL SHARE TRANSACTIONS (NOTE 8) | | | 820,378,728 | | | | (256,613,434 | ) |
| | | | | | | | |
Net increase (decrease) in net assets | | | 1,828,308,581 | | | | (697,776,193 | ) |
NET ASSETS | | | | | | | | |
Beginning of the year | | | 12,869,442,201 | | | | 13,567,218,394 | |
| | | | | | | | |
End of the year | | $ | 14,697,750,782 | | | $ | 12,869,442,201 | |
| | | | | | | | |
UNDISTRIBUTED NET INVESTMENT INCOME | | $ | 38,251,969 | | | $ | 62,197,900 | |
| | | | | | | | |
See accompanying notes to financial statements.
| 38
Financial Highlights
For a share outstanding throughout each period.
| | | | | | | | | | | | | | | | | | | | | | | | | | | | |
| | | | | | Income (Loss) from Investment
Operations: | | | Less Distributions: | |
| | | Net asset
value,
beginning
of the
period | | | Net
investment
income (a) | | | Net realized
and
unrealized
gain (loss) | | | Total from
investment
operations | | | Dividends
from net
investment
income | | | Distributions
from net
realized
capital
gains | | | Total
distributions | |
| | | | | | | | | | | | | | | | | | | | | |
Class A | | | | | | | | | | | | | | | | | | | | | | | | | |
9/30/2012 | | $ | 14.21 | | | $ | 0.72 | | | $ | 1.21 | | | $ | 1.93 | | | $ | (0.84 | ) | | $ | — | | | $ | (0.84 | ) |
9/30/2011 | | | 14.69 | | | | 0.77 | | | | (0.42 | ) | | | 0.35 | | | | (0.83 | ) | | | — | | | | (0.83 | ) |
9/30/2010 | | | 13.39 | | | | 0.80 | | | | 1.31 | | | | 2.11 | | | | (0.81 | ) | | | — | | | | (0.81 | ) |
9/30/2009 | | | 12.10 | | | | 0.87 | | | | 1.36 | | | | 2.23 | | | | (0.86 | ) | | | (0.08 | ) | | | (0.94 | ) |
9/30/2008 | | | 15.18 | | | | 0.96 | | | | (3.02 | ) | | | (2.06 | ) | | | (1.01 | ) | | | (0.01 | ) | | | (1.02 | ) |
Class B | | | | | | | | | | | | | | | | | | | | | | | | | |
9/30/2012 | | | 14.30 | | | | 0.61 | | | | 1.23 | | | | 1.84 | | | | (0.73 | ) | | | — | | | | (0.73 | ) |
9/30/2011 | | | 14.78 | | | | 0.66 | | | | (0.43 | ) | | | 0.23 | | | | (0.71 | ) | | | — | | | | (0.71 | ) |
9/30/2010 | | | 13.46 | | | | 0.69 | | | | 1.33 | | | | 2.02 | | | | (0.70 | ) | | | — | | | | (0.70 | ) |
9/30/2009 | | | 12.16 | | | | 0.79 | | | | 1.36 | | | | 2.15 | | | | (0.77 | ) | | | (0.08 | ) | | | (0.85 | ) |
9/30/2008 | | | 15.25 | | | | 0.85 | | | | (3.04 | ) | | | (2.19 | ) | | | (0.89 | ) | | | (0.01 | ) | | | (0.90 | ) |
Class C | | | | | | | | | | | | | | | | | | | | | | | | | |
9/30/2012 | | | 14.29 | | | | 0.61 | | | | 1.23 | | | | 1.84 | | | | (0.74 | ) | | | — | | | | (0.74 | ) |
9/30/2011 | | | 14.77 | | | | 0.66 | | | | (0.43 | ) | | | 0.23 | | | | (0.71 | ) | | | — | | | | (0.71 | ) |
9/30/2010 | | | 13.45 | | | | 0.69 | | | | 1.33 | | | | 2.02 | | | | (0.70 | ) | | | — | | | | (0.70 | ) |
9/30/2009 | | | 12.15 | | | | 0.79 | | | | 1.37 | | | | 2.16 | | | | (0.78 | ) | | | (0.08 | ) | | | (0.86 | ) |
9/30/2008 | | | 15.24 | | | | 0.85 | | | | (3.03 | ) | | | (2.18 | ) | | | (0.90 | ) | | | (0.01 | ) | | | (0.91 | ) |
Class Y | | | | | | | | | | | | | | | | | | | | | | | | | |
9/30/2012 | | | 14.20 | | | | 0.75 | | | | 1.22 | | | | 1.97 | | | | (0.88 | ) | | | — | | | | (0.88 | ) |
9/30/2011 | | | 14.68 | | | | 0.81 | | | | (0.43 | ) | | | 0.38 | | | | (0.86 | ) | | | — | | | | (0.86 | ) |
9/30/2010 | | | 13.38 | | | | 0.83 | | | | 1.31 | | | | 2.14 | | | | (0.84 | ) | | | — | | | | (0.84 | ) |
9/30/2009 | | | 12.09 | | | | 0.90 | | | | 1.36 | | | | 2.26 | | | | (0.89 | ) | | | (0.08 | ) | | | (0.97 | ) |
9/30/2008 | | | 15.17 | | | | 1.00 | | | | (3.03 | ) | | | (2.03 | ) | | | (1.04 | ) | | | (0.01 | ) | | | (1.05 | ) |
Admin Class | | | | | | | | | | | | | | | | | | | | | | | | | |
9/30/2012 | | | 14.18 | | | | 0.67 | | | | 1.23 | | | | 1.90 | | | | (0.81 | ) | | | — | | | | (0.81 | ) |
9/30/2011 | | | 14.66 | | | | 0.73 | | | | (0.42 | ) | | | 0.31 | | | | (0.79 | ) | | | — | | | | (0.79 | ) |
9/30/2010* | | | 13.87 | | | | 0.52 | | | | 0.79 | | | | 1.31 | | | | (0.52 | ) | | | — | | | | (0.52 | ) |
| * | From commencement of Class operations on February 1, 2010 through September 30, 2010. |
| (a) | Per share net investment income has been calculated using the average shares outstanding during the period. |
| (b) | Amount rounds to less than $0.01 per share, if applicable. |
| (c) | Effective June 2, 2008, redemption fees were eliminated. |
| (d) | Had certain expenses not been waived/reimbursed during the period, if applicable, total returns would have been lower. |
| (e) | A sales charge for Class A shares and a contingent deferred sales charge for Class B and Class C shares are not reflected in total return calculations. Periods less than one year, if applicable, are not annualized. |
| (f) | The investment adviser and/or administrator agreed to waive its fees and/or reimburse a portion of the Fund’s expenses during the period. Without this waiver/reimbursement, if applicable, expenses would have been higher. |
| (g) | Computed on an annualized basis for periods less than one year, if applicable. |
See accompanying notes to financial statements.
39 |
| | | | | | | | | | | | | | | | | | | | | | | | | | | | | | |
| | | | | |
| | | | | | | | | | | | | Ratios to Average Net Assets: | | | | |
| | | | | | | |
Redemption
fees (b)(c) | | | Net asset
value,
end of
the period | | | Total
return
(%) (d)(e) | | | Net assets,
end of
the period
(000’s) | | | Net
expenses
(%) (f)(g) | | | Gross
expenses
(%) (g) | | | Net
investment
income
(%) (g) | | | Portfolio
turnover
rate (%) | |
| | | | | | | | | | | | | | | | | | | | | | | | | | | | | | |
| | | | | | | | | | | | | | | | | | | | | | | | | | | | | | |
| $ | — | | | $ | 15.30 | | | | 14.02 | | | $ | 5,155,287 | | | | 0.96 | | | | 0.96 | | | | 4.84 | | | | 30 | |
| | — | | | | 14.21 | | | | 2.20 | | | | 5,262,765 | | | | 0.95 | | | | 0.95 | | | | 5.10 | | | | 25 | |
| | — | | | | 14.69 | | | | 16.20 | | | | 5,758,070 | | | | 0.96 | | | | 0.96 | | | | 5.67 | | | | 27 | |
| | — | | | | 13.39 | | | | 20.56 | | | | 5,544,029 | | | | 0.99 | | | | 0.99 | | | | 7.74 | | | | 39 | |
| | 0.00 | | | | 12.10 | | | | (14.54 | ) | | | 5,551,066 | | | | 0.97 | | | | 0.98 | | | | 6.59 | | | | 24 | |
| | | | | | | | | | | | | | | | | | | | | | | | | | | | | | |
| | — | | | | 15.41 | | | | 13.15 | | | | 89,552 | | | | 1.70 | | | | 1.70 | | | | 4.11 | | | | 30 | |
| | — | | | | 14.30 | | | | 1.48 | | | | 107,400 | | | | 1.70 | | | | 1.70 | | | | 4.35 | | | | 25 | |
| | — | | | | 14.78 | | | | 15.39 | | | | 137,268 | | | | 1.71 | | | | 1.71 | | | | 4.92 | | | | 27 | |
| | — | | | | 13.46 | | | | 19.62 | | | | 148,887 | | | | 1.74 | | | | 1.74 | | | | 7.02 | | | | 39 | |
| | 0.00 | | | | 12.16 | | | | (15.19 | ) | | | 161,751 | | | | 1.72 | | | | 1.73 | | | | 5.78 | | | | 24 | |
| | | | | | | | | | | | | | | | | | | | | | | | | | | | | | |
| | — | | | | 15.39 | | | | 13.18 | | | | 5,064,186 | | | | 1.71 | | | | 1.71 | | | | 4.08 | | | | 30 | |
| | — | | | | 14.29 | | | | 1.42 | | | | 4,666,077 | | | | 1.70 | | | | 1.70 | | | | 4.35 | | | | 25 | |
| | — | | | | 14.77 | | | | 15.40 | | | | 5,146,164 | | | | 1.71 | | | | 1.71 | | | | 4.92 | | | | 27 | |
| | — | | | | 13.45 | | | | 19.66 | | | | 4,894,546 | | | | 1.74 | | | | 1.74 | | | | 6.95 | | | | 39 | |
| | 0.00 | | | | 12.15 | | | | (15.19 | ) | | | 3,984,204 | | | | 1.72 | | | | 1.73 | | | | 5.85 | | | | 24 | |
| | | | | | | | | | | | | | | | | | | | | | | | | | | | | | |
| | — | | | | 15.29 | | | | 14.31 | | | | 4,339,240 | | | | 0.71 | | | | 0.71 | | | | 5.05 | | | | 30 | |
| | — | | | | 14.20 | | | | 2.46 | | | | 2,807,777 | | | | 0.70 | | | | 0.70 | | | | 5.35 | | | | 25 | |
| | — | | | | 14.68 | | | | 16.50 | | | | 2,521,337 | | | | 0.71 | | | | 0.71 | | | | 5.92 | | | | 27 | |
| | — | | | | 13.38 | | | | 20.91 | | | | 2,057,888 | | | | 0.72 | | | | 0.72 | | | | 7.76 | | | | 39 | |
| | 0.00 | | | | 12.09 | | | | (14.34 | ) | | | 783,058 | | | | 0.72 | | | | 0.72 | | | | 6.88 | | | | 24 | |
| | | | | | | | | | | | | | | | | | | | | | | | | | | | | | |
| | — | | | | 15.27 | | | | 13.79 | | | | 49,486 | | | | 1.21 | | | | 1.21 | | | | 4.52 | | | | 30 | |
| | — | | | | 14.18 | | | | 1.98 | | | | 25,424 | | | | 1.21 | | | | 1.21 | | | | 4.87 | | | | 25 | |
| | — | | | | 14.66 | | | | 9.61 | | | | 4,379 | | | | 1.24 | | | | 1.24 | | | | 5.52 | | | | 27 | |
See accompanying notes to financial statements.
| 40
Notes to Financial Statements
September 30, 2012
1. Organization. Loomis Sayles Funds II (the “Trust”) is organized as a Massachusetts business trust. The Trust is registered under the Investment Company Act of 1940, as amended (the “1940 Act”), as an open-end management investment company. The Declaration of Trust permits the Board of Trustees to authorize the issuance of an unlimited number of shares of the Trust in multiple series. The financial statements for certain funds of the Trust are presented in separate reports. Information presented in these financial statements pertains to Loomis Sayles Strategic Income Fund (the “Fund”).
The Fund is a diversified investment company.
The Fund offers Class A, Class C, Class Y and Admin Class shares. Effective October 12, 2007, Class B shares are no longer offered. Existing Class B shareholders may continue to reinvest dividends into Class B shares and exchange their Class B shares for Class B shares of other Natixis Funds subject to existing exchange privileges as described in the prospectus.
Class A shares are sold with a maximum front-end sales charge of 4.50%. Class B shares do not pay a front-end sales charge; however, they are charged higher Rule 12b-1 fees, and are subject to a contingent deferred sales charge (“CDSC”) if such shares are redeemed within six years of purchase. After eight years of ownership, Class B shares convert to Class A shares. Class C shares do not pay a front-end sales charge, do not convert to any other class of shares, pay higher Rule 12b-1 fees than Class A shares and may be subject to a CDSC of 1.00% if those shares are redeemed within one year of acquisition, except for reinvested distributions. Class Y shares do not pay a front-end sales charge, a CDSC or Rule 12b-1 fees. Class Y shares are generally intended for institutional investors with a minimum initial investment of $100,000, though some categories of investors are exempted from the minimum investment amount as outlined in the Fund’s prospectus. Admin Class shares do not pay a front-end sales charge or a CDSC, but do pay a Rule 12b-1 fee. Admin Class shares are offered exclusively through intermediaries.
Most expenses of the Trust can be directly attributed to a fund. Expenses which cannot be directly attributed to a fund are generally apportioned based on the relative net assets of each of the funds in the Trust. Expenses of the Fund are borne pro rata by the holders of each class of shares, except that each class bears expenses unique to that class (including the Rule 12b-1 service and distribution fees). In addition, each class votes as a class only with respect to its own Rule 12b-1 Plan. Shares of each class would receive their pro rata share of the net assets of the Fund if the Fund were liquidated. The Trustees approve separate distributions from net investment income on each class of shares.
2. Significant Accounting Policies. The following is a summary of significant accounting policies consistently followed by the Fund in the preparation of its financial
41 |
Notes to Financial Statements (continued)
September 30, 2012
statements. The Fund’s financial statements are prepared in accordance with accounting principles generally accepted in the United States of America which require the use of management estimates that affect the reported amounts and disclosures in the financial statements. Actual results could differ from those estimates. Management has evaluated the events and transactions subsequent to year-end through the date the financial statements were issued and has determined that there were no material events that would require disclosure in the Fund’s financial statements.
a. Valuation. Debt securities (other than short-term obligations purchased with an original or remaining maturity of sixty days or less) and unlisted equity securities are generally valued on the basis of evaluated bids furnished to the Fund by an independent pricing service recommended by the investment adviser and approved by the Board of Trustees, which service determines valuations for normal, institutional-size trading units of such securities using market information, transactions for comparable securities and various relationships between securities which are generally recognized by institutional traders. Senior loans are priced at bid prices supplied by an independent pricing service, if available. Equity securities, including shares of closed-end investment companies and exchange-traded funds, for which market quotations are readily available are valued at market value, as reported by independent pricing services recommended by the investment adviser and approved by the Board of Trustees. Such independent pricing services generally use the security’s last sale price on the exchange or market where the security is primarily traded or, if there is no reported sale during the day, the closing bid price. Securities traded on the NASDAQ Global Select Market, NASDAQ Global Market and NASDAQ Capital Market are valued at the NASDAQ Official Closing Price (“NOCP”), or if lacking a NOCP, at the most recent bid quotation on the applicable NASDAQ Market. Broker-dealer bid quotations may also be used to value debt and equity securities and senior loans where an independent pricing service is unable to price a security or where an independent pricing service does not provide a reliable price for the security. Investments in other open-end investment companies are valued at their net asset value each day. Short-term obligations purchased with an original or remaining maturity of sixty days or less are valued at amortized cost, which approximates market value. Securities for which market quotations are not readily available are valued at fair value as determined in good faith by the Fund’s investment adviser using consistently applied procedures under the general supervision of the Board of Trustees.
The Fund may hold securities traded in foreign markets. Foreign securities are valued at the closing market price in the foreign market. However, if events occurring after the close of the foreign market (but before the close of regular trading on the New York Stock Exchange) are believed to materially affect the value of those securities, such securities are fair valued pursuant to procedures approved by the Board of Trustees. When fair valuing securities, the Fund may, among other things, use modeling tools or other processes that may take into account factors such as securities market activity
| 42
Notes to Financial Statements (continued)
September 30, 2012
and/or significant events that occur after the close of the foreign market and before the Fund calculates its net asset value.
b. Investment Transactions and Related Investment Income. Investment transactions are accounted for on a trade date plus one basis for daily net asset value calculation. However, for financial reporting purposes, investment transactions are reported on trade date. Dividend income is recorded on ex-dividend date, or in the case of certain foreign securities, as soon as the Fund is notified, and interest income is recorded on an accrual basis. Interest income is increased by the accretion of discount and decreased by the amortization of premium. Distributions received from investments in securities that represent a return of capital or capital gain are recorded as a reduction of the cost of investments or as a realized gain, respectively. In determining net gain or loss on securities sold, the cost of securities has been determined on an identified cost basis. Investment income, non-class specific expenses and realized and unrealized gains and losses are allocated on a pro rata basis to each class based on the relative net assets of each class to the total net assets of the Fund.
c. Foreign Currency Translation. The books and records of the Fund are maintained in U.S. dollars. The values of securities, currencies and other assets and liabilities denominated in currencies other than U.S. dollars are translated into U.S. dollars based upon foreign exchange rates prevailing at the end of the period. Purchases and sales of investment securities, income and expenses are translated on the respective dates of such transactions.
Since the values of investment securities are presented at the foreign exchange rates prevailing at the end of the period, it is not practical to isolate that portion of the results of operations arising from changes in exchange rates from fluctuations which arise due to changes in market prices of investment securities. Such changes are included with the net realized and unrealized gain or loss on investments.
Net realized foreign exchange gains or losses arise from sales of foreign currency, currency gains or losses realized between the trade and settlement dates on securities transactions, and the difference between the amounts of dividends, interest and foreign withholding taxes recorded on the Fund’s books and the U.S. dollar equivalent of the amounts actually received or paid. Net unrealized foreign exchange gains and losses arise from changes in the value of assets and liabilities, other than investment securities, at the end of the fiscal period, resulting from changes in exchange rates.
The Fund may use foreign currency exchange contracts to facilitate transactions in foreign-denominated investments. Losses may arise from changes in the value of the foreign currency or if the counterparties do not perform under the contracts’ terms.
d. Federal and Foreign Income Taxes. The Trust treats each fund as a separate entity for federal income tax purposes. The Fund intends to meet the requirements of the
43 |
Notes to Financial Statements (continued)
September 30, 2012
Internal Revenue Code of 1986, as amended, applicable to regulated investment companies, and to distribute to its shareholders substantially all of its net investment income and any net realized capital gains at least annually. Management has performed an analysis of the Fund’s tax positions for the open tax years as of September 30, 2012 and has concluded that no provisions for income tax are required. The Fund’s federal tax returns for the prior three fiscal years remain subject to examination by the Internal Revenue Service. Management is not aware of any events that are reasonably possible to occur in the next twelve months that would result in the amounts of any unrecognized tax benefits significantly increasing or decreasing for the Fund. However, management’s conclusions regarding tax positions taken may be subject to review and adjustment at a later date based on factors including, but not limited to, new tax laws and accounting regulations and interpretations thereof.
The Fund may be subject to foreign withholding taxes on investment income and taxes on capital gains on investments that are accrued and paid based upon the Fund’s understanding of the tax rules and regulations that exist in the countries in which the Fund invests. Foreign withholding taxes on dividend and interest income are reflected on the Statements of Operations as a reduction of investment income, net of amounts eligible to be reclaimed. Dividends and interest receivable on the Statements of Assets and Liabilities are net of foreign withholding taxes. Foreign withholding taxes eligible to be reclaimed are reflected on the Statements of Assets and Liabilities as tax reclaims receivable. Capital gains taxes paid are included in net realized gain (loss) on investments in the Statements of Operations. Accrued but unpaid capital gains taxes are reflected as foreign taxes payable on the Statements of Assets and Liabilities, if applicable, and reduce unrealized gains on investments. In the event that realized gains on investments are subsequently offset by realized losses, taxes paid on realized gains may be returned to the Fund. Such amounts, if applicable, are reflected as foreign tax rebates receivable on the Statements of Assets and Liabilities and are recorded as a realized gain when received.
e. Dividends and Distributions to Shareholders. Dividends and distributions are recorded on ex-dividend date. The timing and characterization of certain income and capital gain distributions are determined annually in accordance with federal tax regulations, which may differ from accounting principles generally accepted in the United States of America. Permanent differences are primarily due to differing treatments for book and tax purposes of items such as foreign currency transactions, contingent payment debt instruments, premium amortization, defaulted bond adjustments, paydown gains and losses, trust preferred securities and return of capital and capital gains distributions from real estate investment trusts (“REITs”). Permanent book and tax basis differences relating to shareholder distributions will result in reclassifications to capital accounts. Temporary differences between book and tax distributable earnings are primarily due to wash sales, premium amortization, non-REIT return of capital outstanding, REIT basis adjustments, trust preferred securities,
| 44
Notes to Financial Statements (continued)
September 30, 2012
contingent payment debt instruments and defaulted bond interest. Distributions from net investment income and short-term capital gains are considered to be distributed from ordinary income for tax purposes.
The tax characterization of distributions is determined on an annual basis. The tax character of distributions paid to shareholders during the years ended September 30, 2012 and 2011 was as follows:
| | | | | | | | | | | | | | | | | | | | |
2012 Distributions Paid From: | | | 2011 Distributions Paid From: | |
Ordinary
Income | | Long-Term Capital Gains | | | Total | | | Ordinary Income | | | Long-Term Capital Gains | | | Total | |
$757,600,890 | | $ | — | | | $ | 757,600,890 | | | $ | 712,519,263 | | | $ | — | | | $ | 712,519,263 | |
As of September 30, 2012, the components of distributable earnings on a tax basis were as follows:
| | | | |
Undistributed ordinary income | | $ | 103,098,571 | |
Undistributed long-term capital gains | | | — | |
| | | | |
Total undistributed earnings | | | 103,098,571 | |
| | | | |
Capital loss carryforward: | | | | |
Short-term: | | | | |
Expires September 30, 2018 | | | (242,738,243 | ) |
| | | | |
Unrealized appreciation | | | 962,451,446 | |
| | | | |
Total accumulated gains | | $ | 822,811,774 | |
| | | | |
Capital loss carryforward utilized in the current year | | $ | 197,790,946 | |
| | | | |
On December 22, 2010, the Regulated Investment Company Modernization Act of 2010 (the “Act”) was enacted. Under the Act, for taxable years beginning after December 22, 2010, capital losses may be carried forward indefinitely. Rules in effect previously limited the carryforward period to eight years. Additionally, capital losses realized in taxable years beginning after the effective date of the Act are carried over in the character (short-term or long-term) realized. Rules in effect previously treated all capital loss carryforwards as short-term.
f. Repurchase Agreements. It is the Fund’s policy that the market value of the collateral for repurchase agreements be at least equal to 102% of the repurchase price, including interest. Certain repurchase agreements are tri-party arrangements whereby the collateral is held in a segregated account for the benefit of the Fund and on behalf of the counterparty. Repurchase agreements could involve certain risks in the event of default or insolvency of the counterparty including possible delays or restrictions upon the Fund’s ability to dispose of the underlying securities.
45 |
Notes to Financial Statements (continued)
September 30, 2012
g. Securities Lending. The Fund has entered into an agreement with State Street Bank and Trust Company (“State Street Bank”), as agent of the Fund, to lend securities to certain designated borrowers. The loans are collateralized with cash or securities in an amount equal to at least 105% or 102% of the market value (including accrued interest) of the loaned international or domestic securities, respectively, when the loan is initiated. Thereafter, the value of the collateral must remain at least 102% of the market value (including accrued interest) of loaned securities for U.S. equities and U.S. corporate debt; at least 105% of the market value (including accrued interest) of loaned securities for non-U.S. equities; and at least 100% of the market value (including accrued interest) of loaned securities for U.S. Government securities, sovereign debt issued by non-U.S. Governments and non-U.S. corporate debt. In the event that the market value of the collateral falls below the required percentages described above, the borrower will deliver additional collateral on the next business day. As with other extensions of credit, the Fund may bear the risk of loss with respect to the investment of the collateral. The Fund invests cash collateral in short-term investments, a portion of the income from which is remitted to the borrowers and the remainder allocated between the Fund and State Street Bank as lending agent. Excess collateral in the amount of $2,847,444 related to terminated loans with a bankrupt borrower is held by State Street Bank on behalf of the Fund.
For the year ended September 30, 2012, the Fund did not loan securities under this agreement.
h. Indemnifications. Under the Trust’s organizational documents, its officers and Trustees are indemnified against certain liabilities arising out of the performance of their duties to the Fund. Additionally, in the normal course of business, the Fund enters into contracts with service providers that contain general indemnification clauses. The Fund’s maximum exposure under these arrangements is unknown as this would involve future claims that may be made against the Fund that have not yet occurred. However, based on experience, the Fund expects the risk of loss to be remote.
3. Fair Value Measurements. In accordance with accounting standards related to fair value measurements and disclosures, the Fund has categorized the inputs utilized in determining the value of the Fund’s assets or liabilities. These inputs are summarized in the three broad levels listed below:
| | • | | Level 1 – quoted prices in active markets for identical assets or liabilities; |
| | • | | Level 2 – prices determined using other significant inputs that are observable either directly, or indirectly through corroboration with observable market data (which could include quoted prices for similar assets or liabilities, interest rates, credit risk, etc.); and |
| 46
Notes to Financial Statements (continued)
September 30, 2012
| | • | | Level 3 – prices determined using significant unobservable inputs when quoted prices or observable inputs are unavailable such as when there is little or no market activity for an asset or liability (unobservable inputs reflect the Fund’s own assumptions in determining the fair value of assets or liabilities and would be based on the best information available). |
The inputs or methodology used for valuing securities are not necessarily an indication of the risk associated with investing in those securities.
The following is a summary of the inputs used to value the Fund’s investments as of September 30, 2012, at value:
Asset Valuation Inputs
| | | | | | | | | | | | | | | | |
Description | | Level 1 | | | Level 2 | | | Level 3 | | | Total | |
Bonds and Notes | | | | | | | | | | | | | | | | |
Non-Convertible Bonds | | | | | | | | | | | | | | | | |
Banking | | $ | — | | | $ | 855,791,849 | | | $ | 18,800,082 | | | $ | 874,591,931 | |
Electric | | | — | | | | 386,510,686 | | | | 12,874,750 | | | | 399,385,436 | |
Non-Captive Consumer | | | 2,610,305 | | | | 614,097,781 | | | | — | | | | 616,708,086 | |
Sovereigns | | | — | | | | 277,617,343 | | | | 21,173,458 | | | | 298,790,801 | |
Transportation Services | | | — | | | | 39,644,577 | | | | 8,953,808 | | | | 48,598,385 | |
All Other Non-Convertible Bonds(a) | | | — | | | | 7,064,377,116 | | | | — | | | | 7,064,377,116 | |
| | | | | | | | | | | | | | | | |
Total Non-Convertible Bonds | | | 2,610,305 | | | | 9,238,039,352 | | | | 61,802,098 | | | | 9,302,451,755 | |
| | | | | | | | | | | | | | | | |
Convertible Bonds(a) | | | — | | | | 1,061,421,876 | | | | — | | | | 1,061,421,876 | |
Municipals(a) | | | — | | | | 149,808,035 | | | | — | | | | 149,808,035 | |
| | | | | | | | | | | | | | | | |
Total Bonds and Notes | | | 2,610,305 | | | | 10,449,269,263 | | | | 61,802,098 | | | | 10,513,681,666 | |
| | | | | | | | | | | | | | | | |
Senior Loans(a) | | | — | | | | 242,792,945 | | | | — | | | | 242,792,945 | |
Common Stocks(a) | | | 2,537,681,751 | | | | — | | | | — | | | | 2,537,681,751 | |
47 |
Notes to Financial Statements (continued)
September 30, 2012
Asset Valuation Inputs (continued)
| | | | | | | | | | | | | | | | |
Description | | Level 1 | | | Level 2 | | | Level 3 | | | Total | |
Preferred Stocks | | | | | | | | | | | | | | | | |
Convertible Preferred Stocks | | | | | | | | | | | | | | | | |
Banking | | $ | 31,341,434 | | | $ | 13,339,599 | | | $ | — | | | $ | 44,681,033 | |
Construction Machinery | | | — | | | | 7,024,224 | | | | — | | | | 7,024,224 | |
Independent Energy | | | 4,214,140 | | | | 10,859,238 | | | | — | | | | 15,073,378 | |
All Other Convertible Preferred Stocks(a) | | | 211,870,721 | | | | — | | | | — | | | | 211,870,721 | |
| | | | | | | | | | | | | | | | |
Total Convertible Preferred Stocks | | | 247,426,295 | | | | 31,223,061 | | | | — | | | | 278,649,356 | |
| | | | | | | | | | | | | | | | |
Non-Convertible Preferred Stocks | | | | | | | | | | | | | | | | |
Electric | | | — | | | | 40,896 | | | | — | | | | 40,896 | |
Government Sponsored | | | — | | | | 27,308,125 | | | | — | | | | 27,308,125 | |
Non-Captive Diversified | | | — | | | | 42,901,535 | | | | — | | | | 42,901,535 | |
REITs - Office Property | | | — | | | | 1,925,175 | | | | — | | | | 1,925,175 | |
All Other Non-Convertible Preferred Stocks(a) | | | 49,531,706 | | | | — | | | | — | | | | 49,531,706 | |
| | | | | | | | | | | | | | | | |
Total Non-Convertible Preferred Stocks | | | 49,531,706 | | | | 72,175,731 | | | | — | | | | 121,707,437 | |
| | | | | | | | | | | | | | | | |
Total Preferred Stocks | | | 296,958,001 | | | | 103,398,792 | | | | — | �� | | | 400,356,793 | |
| | | | | | | | | | | | | | | | |
Closed End Investment Companies | | | 5,156,683 | | | | — | | | | — | | | | 5,156,683 | |
Short-Term Investments | | | — | | | | 869,123,231 | | | | — | | | | 869,123,231 | |
| | | | | | | | | | | | | | | | |
Total | | $ | 2,842,406,740 | | | $ | 11,664,584,231 | | | $ | 61,802,098 | | | $ | 14,568,793,069 | |
| | | | | | | | | | | | | | | | |
| (a) | Details of the major categories of the Fund’s investments are reflected within the Portfolio of Investments. |
A preferred stock valued at $9,179,640 was transferred from Level 1 to Level 2 during the period ended September 30, 2012. At September 30, 2011, this security was valued at market price in accordance with the Fund’s valuation policies; at September 30, 2012, this security was valued on the basis of evaluated bids furnished to the Fund by an independent pricing service as a market price was not available.
| 48
Notes to Financial Statements (continued)
September 30, 2012
All transfers are recognized as of the beginning of the reporting period.
The following is a reconciliation of Level 3 investments for which significant unobservable inputs were used to determine fair value as of September 30, 2012:
Asset Valuation Inputs
| | | | | | | | | | | | | | | | | | | | |
Investments in Securities | | Balance as of
September 30,
2011 | | | Accrued
Discounts
(Premiums) | | | Realized
Gain
(Loss) | | | Change in
Unrealized
Appreciation
(Depreciation) | | | Purchases | |
Bonds and Notes | | | | | | | | | | | | | | | | | | | | |
Non-Convertible Bonds | | | | | | | | | | | | | | | | | | | | |
Banking | | $ | — | | | $ | — | | | | $ — | | | $ | 1,415,570 | | | $ | 17,384,512 | |
Consumer Cyclical Services | | | 4,482,500 | | | | — | | | | — | | | | — | | | | — | |
Electric | | | — | | | | — | | | | — | | | | (6,785,170 | ) | | | — | |
Sovereigns | | | — | | | | 6,988,544 | | | | — | | | | (19,781,429 | ) | | | 16,686 | |
Technology | | | 1,740,000 | | | | 106,837 | | | | (3,925,024 | ) | | | 4,358,575 | | | | — | |
Transportation Services | | | — | | | | 65,117 | | | | — | | | | 2,166,771 | | | | — | |
Treasuries | | | 742,727 | | | | 20,092 | | | | (926,055 | ) | | | 581,249 | | | | — | |
Preferred Stocks | | | | | | | | | | | | | | | | | | | | |
Convertible Preferred Stocks | | | | | | | | | | | | | | | | | | | | |
Electric | | | 4,847,625 | | | | — | | | | 105,583 | | | | 433,042 | | | | — | |
Independent Energy | | | 9,980,000 | | | | — | | | | — | | | | — | | | | — | |
Non-Convertible Preferred Stocks | | | | | | | | | | | | | | | | | | | | |
Non-Captive Diversified | | | 22,149,600 | | | | — | | | | — | | | | — | | | | — | |
| | | | | | | | | | | | | | | | | | | | |
Total | | $ | 43,942,452 | | | $ | 7,180,590 | | | $ | (4,745,496 | ) | | $ | (17,611,392 | ) | | $ | 17,401,198 | |
| | | | | | | | | | | | | | | | | | | | |
49 |
Notes to Financial Statements (continued)
September 30, 2012
Asset Valuation Inputs (continued)
| | | | | | | | | | | | | | | | | | | | |
Investments in Securities | | Sales | | | Transfers into Level 3 | | | Transfers
out of Level 3 | | | Balance as of
September 30,
2012 | | | Change in
Unrealized
Appreciation
(Depreciation)
from
Investments
Still Held at
September 30,
2012 | |
Bonds and Notes | | | | | | | | | | | | | | | | | | | | |
Non-Convertible Bonds | | | | | | | | | | | | | | | | | | | | |
Banking | | $ | — | | | $ | — | | | $ | — | | | $ | 18,800,082 | | | $ | 1,415,570 | |
Consumer Cyclical Services | | | — | | | | — | | | | (4,482,500 | ) | | | — | | | | — | |
Electric | | | — | | | | 19,659,920 | | | | — | | | | 12,874,750 | | | | (6,785,170 | ) |
Sovereigns | | | — | | | | 33,949,657 | | | | — | | | | 21,173,458 | | | | (19,781,429 | ) |
Technology | | | (2,280,388 | ) | | | — | | | | — | | | | — | | | | — | |
Transportation Services | | | — | | | | 6,721,920 | | | | — | | | | 8,953,808 | | | | 2,166,771 | |
Treasuries | | | (418,013 | ) | | | — | | | | — | | | | — | | | | — | |
Preferred Stocks | | | | | | | | | | | | | | | | | | | | |
Convertible Preferred Stocks | | | | | | | | | | | | | | | | | | | | |
Electric | | | (5,386,250 | ) | | | — | | | | — | | | | — | | | | — | |
Independent Energy | | | — | | | | — | | | | (9,980,000 | ) | | | — | | | | — | |
Non-Convertible Preferred Stocks | | | | | | | | | | | | | | | | | | | | |
Non-Captive Diversified | | | — | | | | — | | | | (22,149,600 | ) | | | — | | | | — | |
| | | | | | | | | | | | | | | | | | | | |
Total | | $ | (8,084,651 | ) | | $ | 60,331,497 | | | $ | (36,612,100 | ) | | $ | 61,802,098 | | | $ | (22,984,258 | ) |
| | | | | | | | | | | | | | | | | | | | |
A debt security ($4,482,500) and preferred stocks ($32,129,600) valued at $36,612,100 were transferred from Level 3 to Level 2 during the period ended September 30, 2012. At September 30, 2011, these securities were valued using broker-dealer bid quotations based on inputs unobservable to the Fund as an independent pricing service did not provide a reliable price for the security; at September 30, 2012, these securities were valued on the basis of evaluated bids furnished to the Fund by an independent pricing service in accordance with the Fund’s valuation policies.
| 50
Notes to Financial Statements (continued)
September 30, 2012
Debt securities valued at $40,671,577 were transferred from Level 2 to Level 3 during the period ended September 30, 2012. At September 30, 2011, these securities were valued on the basis of evaluated bids furnished to the Fund by an independent pricing service in accordance with the Fund’s valuation policies; at September 30, 2012, these securities were valued using broker-dealer bid quotations based on inputs unobservable to the Fund as an independent pricing service did not provide a reliable price for the security.
Debt securities valued at $19,659,920 were transferred from Level 2 to Level 3 during the period ended September 30, 2012. At September 30, 2011, these securities were valued on the basis of evaluated bids furnished to the Fund by an independent pricing service in accordance with the Fund’s valuation policies; at September 30, 2012, these securities were valued at fair value as determined in good faith by the Fund’s investment adviser as an independent pricing service did not provide a reliable price for the security.
All transfers are recognized as of the beginning of the reporting period.
4. Purchases and Sales of Securities. For the year ended September 30, 2012, purchases and sales of securities (excluding short-term investments and U.S. Government/Agency securities and including paydowns) were $3,266,712,923 and $3,507,917,510, respectively. Purchases and sales of U.S. Government/Agency securities (excluding short-term investments and including paydowns) were $827,101,946 and $418,916,792, respectively.
5. Management Fees and Other Transactions with Affiliates.
a. Management Fees. Loomis, Sayles & Company, L.P. (“Loomis Sayles”) serves as investment adviser to the Fund. Under the terms of the management agreement, the Fund pays a management fee at the following annual rates, calculated daily and payable monthly, based on the Fund’s average daily net assets:
| | | | | | | | | | | | |
Percentage of Average Daily Net Assets | |
First
$200 million | | Next
$1.8 billion | | | Next
$13 billion | | | Over
$15 billion | |
0.65% | | | 0.60 | % | | | 0.55 | % | | | 0.54 | % |
Loomis Sayles has given a binding undertaking to the Fund to waive management fees and/or reimburse certain expenses to limit the Fund’s operating expenses, exclusive of acquired fund fees and expenses, brokerage expenses, interest expense, taxes and extraordinary expenses. This undertaking is in effect until January 31, 2013 and is reevaluated on an annual basis. Management fees payable, as reflected on the Statement of Assets and Liabilities, is net of waivers and/or expense reimbursements, if any, pursuant to this undertaking.
51 |
Notes to Financial Statements (continued)
September 30, 2012
For the year ended September 30, 2012, the expense limits as a percentage of average daily net assets under the expense limitation agreement were as follows:
| | | | | | | | | | | | | | | | |
Expense Limit as a Percentage of Average Daily Net Assets | |
Class A | | Class B | | | Class C | | | Class Y | | | Admin Class | |
1.25% | | | 2.00 | % | | | 2.00 | % | | | 1.00 | % | | | 1.50 | % |
Loomis Sayles shall be permitted to recover expenses it has borne under the expense limitation agreement (whether through waiver of its management fees or otherwise) on a class by class basis in later periods to the extent the expenses of a class fall below a class’ expense limits, provided, however, that a class is not obligated to pay such waived/reimbursed fees or expenses more than one year after the end of the fiscal year in which the fees or expenses were waived/reimbursed.
For the year ended September 30, 2012, the management fees for the Fund were $77,503,021 (effective rate of 0.56% of average daily net assets).
No expenses were recovered during the year ended September 30, 2012 under the terms of the expense limitation agreement.
Certain officers and employees of Loomis Sayles are also officers or Trustees of the Trust. Loomis Sayles’ general partner is indirectly owned by Natixis Global Asset Management, L.P. (“Natixis US”), which is part of Natixis Global Asset Management, an international asset management group based in Paris, France.
b. Service and Distribution Fees. NGAM Distribution, L.P. (“NGAM Distribution”), which is a wholly-owned subsidiary of Natixis US, has entered into a distribution agreement with the Trust. Pursuant to this agreement, NGAM Distribution serves as principal underwriter of the Funds of the Trust.
Pursuant to Rule 12b-1 under the 1940 Act, the Trust has adopted a Service Plan relating to the Fund’s Class A shares (the “Class A Plan”), a Distribution and Service Plan relating to the Fund’s Class B and Class C shares (the “Class B and Class C Plans”), and a Distribution Plan relating to its Admin Class shares (the “Admin Class Plan”).
Under the Class A Plan, the Fund pays NGAM Distribution a monthly service fee at an annual rate not to exceed 0.25% of the average daily net assets attributable to the Fund’s Class A shares, as reimbursement for expenses incurred by NGAM Distribution in providing personal services to investors in Class A shares and/or the maintenance of shareholder accounts.
Under the Class B and Class C Plans, the Fund pays NGAM Distribution a monthly service fee at an annual rate not to exceed 0.25% of the average daily net assets attributable to the Fund’s Class B and Class C shares, as compensation for services provided by NGAM Distribution in providing personal services to investors in Class B and Class C shares and/or the maintenance of shareholder accounts.
| 52
Notes to Financial Statements (continued)
September 30, 2012
Also under the Class B and Class C Plans, the Fund pays NGAM Distribution a monthly distribution fee at an annual rate of 0.75% of the average daily net assets attributable to the Fund’s Class B and Class C shares, as compensation for services provided by NGAM Distribution in connection with the marketing or sale of Class B and Class C shares.
Under the Admin Class Plan, the Fund pays NGAM Distribution a monthly distribution fee at an annual rate not to exceed 0.25% of the average daily net assets attributable to the Fund’s Admin Class shares, as compensation for services provided by NGAM Distribution in connection with the marketing or sale of Admin Class shares or for payments made by NGAM Distribution to securities dealers or other financial intermediaries as commissions, asset-based sales charges or other compensation with respect to the sale of Admin Class shares, or for providing personal services to investors and/or the maintenance of shareholder accounts.
In addition, the Admin Class shares of the Fund may pay NGAM Distribution an administrative service fee, at an annual rate not to exceed 0.25% of the average daily net assets attributable to Admin Class shares. These fees are subsequently paid to securities dealers or financial intermediaries for providing personal services and/or account maintenance for their customers who hold such shares.
For the year ended September 30, 2012, the service and distribution fees for the Fund were as follows:
| | | | | | | | | | | | |
| Service Fees | | Distribution Fees |
Class A | | Class B | | Class C | | Admin Class | | Class B | | Class C | | Admin Class |
| $13,114,937 | | $249,385 | | $12,292,508 | | $93,589 | | $748,156 | | $36,877,523 | | $93,589 |
c. Administrative Fees. NGAM Advisors, L.P. (“NGAM Advisors”) provides certain administrative services for the Fund and contracts with State Street Bank to serve as sub-administrator. NGAM Advisors is a wholly-owned subsidiary of Natixis US. Pursuant to an agreement among Natixis Funds Trust I, Natixis Funds Trust II, Natixis Funds Trust IV, Gateway Trust (“Natixis Funds Trusts”), Loomis Sayles Funds I, Loomis Sayles Funds II (“Loomis Sayles Funds Trusts”), Hansberger International Series and NGAM Advisors, the Fund pays NGAM Advisors monthly its pro rata portion of fees equal to an annual rate of 0.0575% of the first $15 billion of the average daily net assets of the Natixis Funds Trusts, Loomis Sayles Funds Trusts and Hansberger International Series, 0.0500% of the next $15 billion, 0.0400% of the next $30 billion and 0.0350% of such assets in excess of $60 billion, subject to an annual aggregate minimum fee for the Natixis Funds Trusts, Loomis Sayles Funds Trusts and Hansberger International Series of $10 million, which is reevaluated on an annual basis.
For the year ended September 30, 2012, the administrative fees for the Fund were $6,330,496.
53 |
Notes to Financial Statements (continued)
September 30, 2012
d. Sub-Transfer Agent Fees. NGAM distribution has entered into agreements, which include servicing agreements, with financial intermediaries that provide recordkeeping, processing, shareholder communications and other services to customers of the intermediaries that hold positions in the Fund and has agreed to compensate the intermediaries for providing those services. Intermediaries transact with the Fund primarily through the use of omnibus accounts on behalf of their customers who hold positions in the Fund. These services would have been provided by the Fund’s transfer agent and other service providers if the shareholders’ accounts were maintained directly at the Fund’s transfer agent. Accordingly, the Fund has agreed to reimburse NGAM Distribution for all or a portion of the servicing fees paid to these intermediaries. The reimbursement amounts (sub-transfer agent fees) paid to NGAM Distribution are subject to a current per-account equivalent fee limit approved by the Fund’s Board, which is based on fees for similar services paid to the Fund’s transfer agent and other service providers.
For the year ended September 30, 2012, the sub-transfer agent fees (which are reflected in transfer agent fees and expenses in the Statement of Operations) for the Fund were $9,803,740. As of September 30, 2012, the Fund owes NGAM Distribution $124,277 in reimbursement for sub-transfer agent fees.
e. Commissions. Commissions (including CDSCs) on Fund shares retained by NGAM Distribution during the year ended September 30, 2012 amounted to $4,914,453.
f. Trustees Fees and Expenses. The Trust does not pay any compensation directly to its officers or Trustees who are directors, officers or employees of NGAM Advisors, NGAM Distribution, Natixis US or their affiliates. Effective January 1, 2012, the Chairperson of the Board receives a retainer fee at the annual rate of $265,000. The Chairperson does not receive any meeting attendance fees for Board of Trustees meetings or committee meetings that she attends. Each Independent Trustee (other than the Chairperson) receives, in the aggregate, a retainer fee at the annual rate of $95,000. Each Independent Trustee also receives a meeting attendance fee of $10,000 for each meeting of the Board of Trustees that he or she attends in person and $5,000 for each meeting of the Board of Trustees that he or she attends telephonically. In addition, each committee chairman receives an additional retainer fee at an annual rate of $15,000. Each Contract Review and Governance Committee member is compensated $6,000 for each Committee meeting that he or she attends in person and $3,000 for each meeting that he or she attends telephonically. Each Audit Committee member is compensated $7,500 for each Committee meeting that he or she attends in person and $3,750 for each meeting that he or she attends telephonically. These fees are allocated among the funds in the Natixis Funds Trusts, Loomis Sayles Funds Trusts and Hansberger International Series based on a formula that takes into account, among other factors, the relative net assets of each fund. Trustees are reimbursed for travel expenses in connection with attendance at meetings.
| 54
Notes to Financial Statements (continued)
September 30, 2012
Prior to January 1, 2012, the Chairperson of the Board received a retainer fee at the annual rate of $250,000 and each Independent Trustee (other than the Chairperson) received, in aggregate, a retainer fee at the annual rate of $80,000. All other Trustee fees remain unchanged.
A deferred compensation plan (the “Plan”) is available to the Trustees on a voluntary basis. Deferred amounts remain in the Fund until distributed in accordance with the provisions of the Plan. The value of a participating Trustee’s deferral account is based on theoretical investments of deferred amounts, on the normal payment dates, in certain funds of the Natixis Funds Trusts, Loomis Sayles Funds Trusts and Hansberger International Series as designated by the participating Trustees. Changes in the value of participants’ deferral accounts are allocated pro rata among the funds in the Natixis Funds Trusts, Loomis Sayles Funds Trusts, and Hansberger International Series, and are normally reflected as Trustees’ fees and expenses in the Statement of Operations. The portions of the accrued obligations allocated to the Fund under the Plan are reflected as Deferred Trustees’ fees in the Statement of Assets and Liabilities.
6. Line of Credit. The Fund, together with certain other funds of Natixis Funds Trusts, Loomis Sayles Funds Trusts and Hansberger International Series, participates in a $200,000,000 committed unsecured line of credit provided by State Street Bank, with an individual limit of $125,000,000 for each fund that participates in the line of credit. Interest is charged to each participating fund based on its borrowings at a rate per annum equal to the greater of the Federal Funds rate or overnight LIBOR, plus 1.25%. In addition, a commitment fee of 0.10% per annum, payable at the end of each calendar quarter, is accrued and apportioned among the participating funds based on their average daily unused portion of the line of credit. Prior to April 19, 2012, the commitment fee was 0.125% per annum.
For the year ended September 30, 2012, the Fund had no borrowings under these agreements.
7. Concentration of Risk. The Fund’s investments in foreign securities are subject to foreign currency fluctuations, higher volatility than U.S. securities, varying degrees of regulation and limited liquidity. Greater political, economic, credit and information risks are also associated with foreign securities.
55 |
Notes to Financial Statements (continued)
September 30, 2012
8. Capital Shares. The Fund may issue an unlimited number of shares of beneficial interest, without par value. Transactions in capital shares were as follows:
| | | | | | | | | | | | | | | | |
| |
| Year Ended
September 30, 2012 |
| |
| Year Ended
September 30, 2011 |
|
| | | | Shares | | | | Amount | | | | Shares | | | | Amount | |
| Class A | | | | | | | | | | | | | | | | |
Issued from the sale of shares | | | 89,649,016 | | | $ | 1,329,714,799 | | | | 100,728,799 | | | $ | 1,519,559,694 | |
Issued in connection with the reinvestment of distributions | | | 17,112,282 | | | | 251,237,402 | | | | 16,985,705 | | | | 254,980,186 | |
Redeemed | | | (140,160,164 | ) | | | (2,089,858,590 | ) | | | (139,402,301 | ) | | | (2,096,241,991 | ) |
| | | | | | | | | | | | | | | | |
Net change | | | (33,398,866 | ) | | $ | (508,906,389 | ) | | | (21,687,797 | ) | | $ | (321,702,111 | ) |
| | | | | | | | | | | | | | | | |
| Class B | | | | | | | | | | | | | | | | |
Issued from the sale of shares | | | 142,281 | | | $ | 2,116,364 | | | | 192,090 | | | $ | 2,919,791 | |
Issued in connection with the reinvestment of distributions | | | 185,322 | | | | 2,735,333 | | | | 201,211 | | | | 3,037,937 | |
Redeemed | | | (2,023,077 | ) | | | (30,224,174 | ) | | | (2,173,334 | ) | | | (32,992,197 | ) |
| | | | | | | | | | | | | | | | |
Net change | | | (1,695,474 | ) | | $ | (25,372,477 | ) | | | (1,780,033 | ) | | $ | (27,034,469 | ) |
| | | | | | | | | | | | | | | | |
| Class C | | | | | | | | | | | | | | | | |
Issued from the sale of shares | | | 46,818,995 | | | $ | 698,131,858 | | | | 43,771,397 | | | $ | 662,887,999 | |
Issued in connection with the reinvestment of distributions | | | 8,706,591 | | | | 128,555,991 | | | | 7,721,378 | | | | 116,516,115 | |
Redeemed | | | (52,957,737 | ) | | | (789,494,609 | ) | | | (73,499,317 | ) | | | (1,110,786,820 | ) |
| | | | | | | | | | | | | | | | |
Net change | | | 2,567,849 | | | $ | 37,193,240 | | | | (22,006,542 | ) | | $ | (331,382,706 | ) |
| | | | | | | | | | | | | | | | |
| Class Y | | | | | | | | | | | | | | | | |
Issued from the sale of shares | | | 152,377,472 | | | $ | 2,276,301,803 | | | | 98,118,850 | | | $ | 1,481,121,222 | |
Issued in connection with the reinvestment of distributions | | | 7,426,725 | | | | 109,413,688 | | | | 4,346,254 | | | | 65,258,226 | |
Redeemed | | | (73,738,087 | ) | | | (1,089,758,132 | ) | | | (76,525,358 | ) | | | (1,145,382,580 | ) |
| | | | | | | | | | | | | | | | |
Net change | | | 86,066,110 | | | $ | 1,295,957,359 | | | | 25,939,746 | | | $ | 400,996,868 | |
| | | | | | | | | | | | | | | | |
| Admin Class | | | | | | | | | | | | | | | | |
Issued from the sale of shares | | | 1,594,030 | | | $ | 23,654,032 | | | | 1,568,042 | | | $ | 23,628,559 | |
Issued in connection with the reinvestment of distributions | | | 108,806 | | | | 1,599,070 | | | | 41,605 | | | | 625,462 | |
Redeemed | | | (253,748 | ) | | | (3,746,107 | ) | | | (115,648 | ) | | | (1,745,037 | ) |
| | | | | | | | | | | | | | | | |
Net change | | | 1,449,088 | | | $ | 21,506,995 | | | | 1,493,999 | | | $ | 22,508,984 | |
| | | | | | | | | | | | | | | | |
Increase (decrease) from capital share transactions | | | 54,988,707 | | | $ | 820,378,728 | | | | (18,040,627 | ) | | $ | (256,613,434 | ) |
| | | | | | | | | | | | | | | | |
| 56
Report of Independent Registered Public Accounting Firm
To the Trustees of Loomis Sayles Funds II and Shareholders of Loomis Sayles Strategic Income Fund:
In our opinion, the accompanying statement of assets and liabilities, including the portfolio of investments, and the related statements of operations and of changes in net assets and the financial highlights present fairly, in all material respects, the financial position of the Loomis Sayles Strategic Income Fund, a series of Loomis Sayles Funds II (the “Fund”), at September 30, 2012, and the results of its operations, the changes in its net assets and the financial highlights for each of the periods indicated, in conformity with accounting principles generally accepted in the United States of America. These financial statements and financial highlights (hereafter referred to as “financial statements”) are the responsibility of the Fund’s management; our responsibility is to express an opinion on these financial statements based on our audits. We conducted our audits of these financial statements in accordance with the standards of the Public Company Accounting Oversight Board (United States). Those standards require that we plan and perform the audits to obtain reasonable assurance about whether the financial statements are free of material misstatement. An audit includes examining, on a test basis, evidence supporting the amounts and disclosures in the financial statements, assessing the accounting principles used and significant estimates made by management, and evaluating the overall financial statement presentation. We believe that our audits, which included confirmation of securities at September 30, 2012 by correspondence with the custodian and brokers, provide a reasonable basis for our opinion.
PricewaterhouseCoopers LLP
Boston, Massachusetts
November 20, 2012
57 |
2012 U.S. Tax Distribution Information to Shareholders (Unaudited)
Corporate Dividends Received Deduction. For the fiscal year ended September 30, 2012, 7.37% of dividends distributed by Strategic Income Fund qualify for the dividends received deduction for corporate shareholders.
Qualified Dividend Income. For the fiscal year ended September 30, 2012, the Strategic Income Fund will designate up to the maximum amount allowable pursuant to the Internal Revenue Code as qualified dividend income eligible for reduced tax rates. These lower rates range from 0% to 15% depending on an individual’s tax bracket. If the Fund pays a distribution during calendar year 2012, complete information will be reported in conjunction with Form 1099-DIV.
| 58
Trustee and Officer Information
The tables below provide certain information regarding the trustees and officers of Loomis Sayles Funds II (the “Trust”). Unless otherwise indicated, the address of all persons below is 399 Boylston Street, Boston, MA 02116. The Fund’s Statement of Additional Information includes additional information about the trustees of the Trust and is available by calling Natixis Funds at 800-225-5478.
| | | | | | | | |
Name and Year of
Birth | | Position(s) Held with the Trust, Length of Time Served and Term of Office1 | | Principal Occupation(s) During Past 5 Years | | Number of Portfolios in Fund Complex Overseen2 and Other Directorships Held During Past 5 Years | | Experience, Qualifications, Attributes, Skills for Board Membership |
| | | |
| INDEPENDENT TRUSTEES | | | | | | |
| | | | |
| Graham T. Allison, Jr. (1940) | | Trustee Since 2003 Contract Review and Governance Committee Member | | Douglas Dillon Professor and Director of the Belfer Center for Science and International Affairs, John F. Kennedy School of Government, Harvard University | | 44 Director, Taubman Centers, Inc. (real estate investment trust) | | Significant experience on the Board of Trustees of the Trust and on the board of other business organizations (including a real estate investment trust); government experience (including as Assistant Secretary of Defense under President Clinton); academic experience |
| | | | |
| Charles D. Baker (1956) | | Trustee From 2005 to 2009 and Since 2011 Contract Review and Governance Committee Member | | Executive in Residence at General Catalyst Partners (venture capital and growth equity firm); formerly, President and Chief Executive Officer, Harvard Pilgrim Health Care (health care organization) | | 44 None | | Significant experience on the Board of Trustees of the Trust; executive experience (including president and chief executive officer of a health care organization and executive officer of a venture capital and growth equity firm) |
59 |
Trustee and Officer Information
| | | | | | | | |
Name and Year of
Birth | | Position(s) Held with the Trust, Length of Time Served and Term of Office1 | | Principal Occupation(s) During Past 5 Years | | Number of Portfolios in Fund Complex Overseen2 and Other Directorships Held During Past 5 Years | | Experience, Qualifications, Attributes, Skills for Board Membership |
| | | |
INDEPENDENT TRUSTEES continued | | | | | | |
| | | | |
Daniel M. Cain (1945) | | Trustee Since 2003 Chairman of the Contract Review and Governance Committee | | Chairman (formerly, President and Chief Executive Officer) of Cain Brothers & Company, Incorporated (investment banking) | | 44 Director, Sheridan Healthcare Inc. (physician practice management) | | Significant experience on the Board of Trustees of the Trust and on the board of other business organizations (including at a health care organization); experience in the financial industry (including roles as chairman and former chief executive officer of an investment banking firm) |
| | | | |
Kenneth A. Drucker (1945) | | Trustee Since 2008 Chairman of the Audit Committee | | Retired | | 44 Formerly, Director, M Fund, Inc. (investment company); Director, Gateway Trust (investment company) | | Significant experience on the Board of Trustees of the Trust and on the board of other business organizations (including at investment companies); executive experience (including as treasurer of an aerospace, automotive, and metal manufacturing corporation) |
| 60
Trustee and Officer Information
| | | | | | | | |
Name and Year of
Birth | | Position(s) Held with the Trust, Length of Time Served and Term of Office1 | | Principal Occupation(s) During Past 5 Years | | Number of Portfolios in Fund Complex Overseen2 and Other Directorships Held During Past 5 Years | | Experience, Qualifications, Attributes, Skills for Board Membership |
| | | |
INDEPENDENT TRUSTEES continued | | | | | | |
| | | | |
Wendell J. Knox (1948) | | Trustee Since 2009 Audit Committee Member | | Director (formerly, President and Chief Executive Officer) of Abt Associates Inc. (research and consulting) | | 44 Director, Eastern Bank (commercial bank); Director, The Hanover Insurance Group (property and casualty insurance) | | Significant experience on the Board of Trustees of the Trust and on the board of other business organizations (including at a commercial bank and at a property and casualty insurance firm); executive experience (including roles as president and chief executive officer of a consulting company) |
| | | | |
| Martin T. Meehan3 (1956) | | Trustee Since 2012 Contract Review and Governance Committee Member | | Chancellor and faculty member, University of Massachusetts Lowell | | 44 Director, Lowell Cooperative Bank (commercial bank); Director, Lowell General Hospital (healthcare); formerly, Director, Qteros, Inc. (biofuels); formerly, Trustee, Suffolk University (education); formerly, Director, D’Youville Foundation (senior care) | | Experience as Chancellor of the University of Massachusetts Lowell; experience on the board of other business organizations; government experience (including as a member of the U.S. House of Representatives); academic experience |
61 |
Trustee and Officer Information
| | | | | | | | |
Name and Year of
Birth | | Position(s) Held with the Trust, Length of Time Served and Term of Office1 | | Principal Occupation(s) During Past 5 Years | | Number of Portfolios in Fund Complex Overseen2 and Other Directorships Held During Past 5 Years | | Experience, Qualifications, Attributes, Skills for Board Membership |
| | | |
INDEPENDENT TRUSTEES continued | | | | | | |
| | | | |
Sandra O. Moose (1942) | | Chairperson of the Board of Trustees Since November 2005 Trustee Since 2003 Ex officio member of the Audit Committee and Contract Review and Governance Committee | | President, Strategic Advisory Services (management consulting) | | 44 Director, Verizon Communications; Director, AES Corporation (international power company); formerly, Director, Rohm and Haas Company (specialty chemicals) | | Significant experience on the Board of Trustees of the Trust and on the board of other business organizations (including at an international power company and a specialty chemicals corporation); executive experience (including at a management consulting company) |
| | | | |
Erik R. Sirri (1958) | | Trustee Since 2009 Contract Review and Governance Committee Member | | Professor of Finance at Babson College; formerly, Director of the Division of Trading and Markets at the Securities and Exchange Commission | | 44 None | | Experience on the Board of Trustees of the Trust; experience as Director of the Division of Trading and Markets at the Securities and Exchange Commission; academic experience; training as an economist |
| 62
Trustee and Officer Information
| | | | | | | | |
Name and Year of
Birth | | Position(s) Held with the Trust, Length of Time Served and Term of Office1 | | Principal Occupation(s) During Past 5 Years | | Number of Portfolios in Fund Complex Overseen2 and Other Directorships Held During Past 5 Years | | Experience, Qualifications, Attributes, Skills for Board Membership |
| | | |
INDEPENDENT TRUSTEES continued | | | | | | |
| | | | |
Peter J. Smail (1952) | | Trustee Since 2009 Contract Review and Governance Committee Member | | Retired; formerly, President and Chief Executive Officer of Pyramis Global Advisors (investment management) | | 44 None | | Experience on the Board of Trustees of the Trust; mutual fund industry and executive experience (including roles as president and chief executive officer for an investment adviser) |
| | | | |
Cynthia L. Walker (1956) | | Trustee Since 2005 Audit Committee Member | | Deputy Dean for Finance and Administration, Yale University School of Medicine; formerly, Executive Dean for Administration, Harvard Medical School | | 44 None | | Significant experience on the Board of Trustees of the Trust; executive experience in a variety of academic organizations (including roles as dean for finance and administration) |
| | | |
| INTERESTED TRUSTEES | | | | | | |
| | | | |
Robert J. Blanding4 (1947) 555 California Street San Francisco, CA 94104 | | Trustee and Chief Executive Officer since 2002 | | President, Chairman, Director and Chief Executive Officer, Loomis, Sayles & Company, L.P. | | 44 None | | Significant experience on the Board of Trustees of the Trust; continuing service as President, Chairman, and Chief Executive Officer of Loomis, Sayles & Company, L.P. |
63 |
Trustee and Officer Information
| | | | | | | | |
Name and Year of
Birth | | Position(s) Held with the Trust, Length of Time Served and Term of Office1 | | Principal Occupation(s) During Past 5 Years | | Number of Portfolios in Fund Complex Overseen2 and Other Directorships Held During Past 5 Years | | Experience, Qualifications, Attributes, Skills for Board Membership |
| | | |
INTERESTED TRUSTEES continued | | | | | | |
| | | | |
| David L. Giunta5 (1965) | | Trustee Since 2011 President Since 2008 | | President and Chief Executive Officer, NGAM Distribution Corporation, NGAM Advisors, L.P. and NGAM Distribution, L.P.; formerly President, Fidelity Charitable Gift Fund; and formerly, Senior Vice President, Fidelity Brokerage Company | | 44 None | | Experience on the Board of Trustees of the Trust; continuing experience as President and Chief Executive Officer of NGAM Advisors, L.P. |
| | | | |
John T. Hailer6 (1960) | | Trustee Since 2003 | | President and Chief Executive Officer-U.S. and Asia, Natixis Global Asset Management, L.P.; formerly, President and Chief Executive Officer, NGAM Distribution Corporation, NGAM Advisors L.P. and NGAM Distribution, L.P. | | 44 None | | Significant experience on the Board of Trustees of the Trust; continuing experience as Chief Executive Officer-U.S. and Asia, Natixis Global Asset Management, L.P. |
| 1 | Each trustee serves until retirement, resignation or removal from the Board of Trustees of the Trust. The current retirement age is 72. The position of Chairperson of the Board is appointed for a two-year term. Ms. Moose was appointed to serve an additional two year term as the Chairperson of the Board on November 18, 2011. |
| 2 | The trustees of the Trust serve as trustees of a fund complex that includes all series of the Natixis Funds Trust I, Natixis Funds Trust II, Natixis Funds Trust IV and Gateway Trust (collectively, the “Natixis Funds Trusts”), Loomis Sayles Funds I and Loomis Sayles Funds II (collectively, the “Loomis Sayles Funds Trusts”), and Hansberger International Series (collectively, the “Fund Complex”). |
| 3 | Mr. Meehan was appointed as a trustee effective July 1, 2012. |
| 4 | Mr. Blanding is deemed an “interested person” of the Trust because he holds the following positions with an affiliated person of the Trust: President, Chairman, Director and Chief Executive Officer of Loomis, Sayles & Company, L.P. |
| 64
Trustee and Officer Information
| 5 | Mr. Giunta is deemed an “interested person” of the Trust because he holds the following positions with an affiliated person of the Trust: President and Chief Executive Officer of NGAM Distribution Corporation, NGAM Advisors, L.P. and NGAM Distribution, L.P. |
| 6 | Mr. Hailer is deemed an “interested person” of the Trust because he holds the following positions with an affiliated person of the Trust: President and Chief Executive Officer – U.S. and Asia, Natixis Global Asset Management, L.P. |
65 |
Trustee and Officer Information
| | | | | | |
Name and Year of Birth | | Position(s) Held with the
Trust | | Term of Office1 and
Length of Time Served | | Principal Occupation(s)
During Past 5 Years2 |
| | |
| OFFICERS OF THE TRUST | | | | |
| | | |
Coleen Downs Dinneen (1960) | | Secretary, Clerk and Chief Legal Officer | | Since September 2004 | | Executive Vice President, General Counsel, Secretary and Clerk (formerly, Senior Vice President, Deputy General Counsel, Assistant Secretary and Assistant Clerk), NGAM Distribution Corporation, NGAM Advisors, L.P. and NGAM Distribution, L.P. |
| | | |
Daniel J. Fuss (1933) One Financial Center Boston, MA 02111 | | Executive Vice President | | Since June 2003 | | Vice Chairman and Director, Loomis, Sayles & Company, L.P. |
| | | |
Russell L. Kane (1969) | | Chief Compliance Officer, Assistant Secretary and Anti-Money Laundering Officer | | Chief Compliance Officer, since May 2006; Assistant Secretary since June 2004; and Anti-Money Laundering Officer since April 2007 | | Chief Compliance Officer for Mutual Funds, Senior Vice President, Deputy General Counsel, Assistant Secretary and Assistant Clerk, NGAM Distribution Corporation, NGAM Advisors, L.P. and NGAM Distribution, L.P. |
| | | |
Michael C. Kardok (1959) | | Treasurer, Principal Financial and Accounting Officer | | Since October 2004 | | Senior Vice President, NGAM Advisors, L.P. and NGAM Distribution, L.P. |
| 1 | Each officer of the Trust serves for an indefinite term in accordance with the Trust’s current by-laws until the date his or her successor is elected and qualified, or until he or she sooner dies, retires, is removed or becomes disqualified. |
| 2 | Each person listed above, except as noted, holds the same position(s) with the Fund Complex. Mr. Fuss is not an officer of the Natixis Funds Trusts or the Hansberger International Series. Previous positions during the past five years with NGAM Distribution, L.P., NGAM Advisors, L.P. or Loomis, Sayles & Company, L.P. are omitted, if not materially different from a trustee’s or officer’s current position with such entity. |
| 66
The Registrant has adopted a code of ethics that applies to the Registrant’s principal executive officer, principal financial officer and persons performing similar functions. There have been no amendments or waivers of the Registrant’s code of ethics during the period.
| Item 3. | Audit Committee Financial Expert. |
The Board of Trustees of the Registrant has established an audit committee. Ms. Cynthia L. Walker, Mr. Wendell J. Knox and Mr. Kenneth A. Drucker are members of the audit committee and have been designated as “audit committee financial experts” by the Board of Trustees. Each of these individuals is also an Independent Trustee of the Registrant.
| Item 4. | Principal Accountant Fees and Services. |
Fees billed by the Principal Accountant for services rendered to the Registrant.
The table below sets forth fees billed by the principal accountant, PricewaterhouseCoopers LLP, for the past two fiscal years for professional services rendered in connection with a) the audit of the Registrant’s annual financial statements and services provided in connection with regulatory filings; b) audit-related services (including services that are reasonably related to the performance of the audit of the Registrant’s financial statements and but not reported under “Audit Fees”); c) tax compliance, tax advice and tax planning and d) all other fees billed for professional services rendered by the principal accountant to the Registrant, other than the services reported as a part of (a) through (c) of this Item.
| | | | | | | | | | | | | | | | | | | | | | | | | | | | | | | | |
| | | Audit fees | | | Audit-related fees1 | | | Tax fees2 | | | All other fees3 | |
| | | 10/1/10-
9/30/11 | | | 10/1/11-
9/30/12 | | | 10/1/10-
9/30/11 | | | 10/1/11-
9/30/12 | | | 10/1/10-
9/30/11 | | | 10/1/11-
9/30/12 | | | 10/1/10-
9/30/11 | | | 10/1/11-
9/30/12 | |
Loomis Sayles Funds II | | $ | 378,470 | | | $ | 384,464 | | | $ | 13,432 | | | $ | 4,846 | | | $ | 97,230 | | | $ | 83,360 | | | $ | 30,422 | | | $ | 18,578 | |
| | 1. | Audit-related fees consist of: |
2011 & 2012 – performance of agreed-upon procedures related to the Registrant’s deferred compensation plan and consulting services with respect to regulatory matters.
2011 & 2012 – review of Registrant’s tax returns, consulting services with respect to complex security types, consulting services related to Form 1099 penalties and review of liquidating fund distributions.
| | 3. | All other fees consist of: |
2011 & 2012 – filing and translation services with respect to Japanese shareholders in Loomis Sayles Investment Grade Bond Fund.
Aggregate fees billed to the Registrant for non-audit services during 2011 and 2012 were $141,084 and $106,784, respectively.
Fees billed by the Principal Accountant for services rendered to the Adviser and Control Affiliates.
The following table sets forth the fees billed by the Registrant’s principal accountant for non-audit services rendered to Loomis, Sayles & Company, L.P. and entities controlling, controlled by or under common control with Loomis, Sayles & Company, L.P. Registrant (“Control Affiliates”) that provide ongoing services to the Registrant, for engagements that related directly to the operations and financial reporting of the Registrant for the last two fiscal years.
| | | | | | | | | | | | | | | | | | | | | | | | |
| | | Audit-related fees | | | Tax fees | | | All other fees | |
| | | 10/1/10-
9/30/11 | | | 10/1/11-
9/30/12 | | | 10/1/10-
9/30/11 | | | 10/1/11-
9/30/12 | | | 10/1/10-
9/30/11 | | | 10/1/11-
9/30/12 | |
Control Affiliates | | $ | — | | | $ | — | | | $ | — | | | $ | 6,838 | | | $ | — | | | $ | — | |
The following table sets forth the aggregate fees billed by the Registrant’s principal accountant for non-audit services rendered to Loomis, Sayles & Company, L.P. and Control Affiliates that provide ongoing services to the Registrant, for the last two fiscal years, including the fees disclosed in the table above.
| | | | | | | | |
| | | Aggregate Non-Audit Fees | |
| | | 10/1/10-9/30/11 | | | 10/1/11-9/30/12 | |
Control Affiliates | | $ | 56,589 | | | $ | 87,658 | |
None of the services described above were approved pursuant to (c)(7)(i)(C) of Regulation S-X.
Audit Committee Pre Approval Policies.
Annually, the Registrant’s Audit Committee reviews the audit, audit-related, tax and other non-audit services together with the projected fees, for services proposed to be rendered to the Trust and/or other entities for which pre-approval is required during the upcoming year. Any subsequent revisions to already pre-approved services or fees (including fee increases) and requests for pre-approval of new services would be presented for consideration quarterly as needed.
If, in the opinion of management, a proposed engagement by the Registrant’s independent accountants needs to commence before the next regularly scheduled Audit Committee meeting, any member of the Audit Committee who is an independent Board member is authorized to pre-approve the engagement, but only for engagements to provide audit, audit related and tax services. This approval is subject to review of the full Audit Committee at its next quarterly meeting. All other engagements require the approval of all the members of the Audit Committee.
| Item 5. | Audit Committee of Listed Registrants. |
Not applicable.
| Item 6. | Schedule of Investments. |
Included as part of the Report to Shareholders filed as Item 1 herewith.
| Item 7. | Disclosure of Proxy Voting Policies and Procedures for Closed-End Management Investment Companies. |
Not applicable.
| Item 8. | Portfolio Managers of Closed-End Management Investment Companies |
Not applicable.
| Item 9. | Purchases of Equity Securities by Closed-End Management Investment Companies and Affiliated Purchasers. |
Not applicable.
| Item 10. | Submission of Matters to a Vote of Securities Holders. |
There were no material changes to the procedures by which shareholders may recommend nominees to the Registrant’s Board of Trustees.
| Item 11. | Controls and Procedures. |
The Registrant’s principal executive officer and principal financial officer have concluded that the Registrant’s disclosure controls and procedures are sufficient to ensure that information required to be disclosed by the Registrant in this Form N-CSR was recorded, processed, summarized and reported within the time periods specified in the Securities and Exchange Commission’s rules and forms, based upon such officers’ evaluation of these controls and procedures as of a date within 90 days of the filing date of the report.
There were no changes in the Registrant’s internal control over financial reporting that occurred during the Registrant’s last fiscal quarter of the period covered by the report that has materially affected, or is reasonably likely to materially affect, the Registrant’s internal control over financial reporting.
| | | | | | |
(a) | | | (1 | ) | | Code of Ethics required by Item 2 hereof, filed herewith as Exhibit (a)(1). |
| | |
(a) | | | (2 | ) | | Certifications of Principal Executive Officer and Principal Financial Officer pursuant to Rule 30a-2(a) under the Investment Company Act of 1940 (17 CFR 270.30a-2(a)), filed herewith as Exhibits (a)(2)(1) and (a)(2)(2), respectively. |
| | |
(a) | | | (3 | ) | | Not applicable. |
| | |
(b) | | | | | | Certification of Principal Executive Officer and Principal Financial Officer pursuant to Section 906 of Sarbanes-Oxley Act of 2002 are filed herewith as Exhibit (b). |
SIGNATURES
Pursuant to the requirements of the Securities Exchange Act of 1934 and the Investment Company Act of 1940, the Registrant has duly caused this report to be signed on its behalf by the undersigned, thereunto duly authorized.
| | |
| Loomis Sayles Funds II |
| |
| By: | | /s/ Robert J. Blanding |
| Name: | | Robert J. Blanding |
| Title: | | Chief Executive Officer |
| Date: | | November 20, 2012 |
Pursuant to the requirements of the Securities Exchange Act of 1934 and the Investment Company Act of 1940, this report has been signed by the following persons on behalf of the Registrant and in the capacities and on the dates indicated.
| | |
| By: | | /s/ Robert J. Blanding |
| Name: | | Robert J. Blanding |
| Title: | | Chief Executive Officer |
| Date: | | November 20, 2012 |
| | |
| By: | | /s/ Michael C. Kardok |
| Name: | | Michael C. Kardok |
| Title: | | Treasurer |
| Date: | | November 20, 2012 |