UNITED STATES
SECURITIES AND EXCHANGE COMMISSION
Washington, D.C. 20549
FORM N-CSR
CERTIFIED SHAREHOLDER REPORT OF REGISTERED
MANAGEMENT INVESTMENT COMPANIES
Investment Company Act file number: 811-06241
Loomis Sayles Funds II
(Exact name of Registrant as specified in charter)
399 Boylston Street, Boston, Massachusetts 02116
(Address of principal executive offices) (Zip code)
Coleen Downs Dinneen, Esq.
Natixis Distributors, L.P.
399 Boylston Street
Boston, Massachusetts 02116
(Name and address of agent for service)
Registrant’s telephone number, including area code: (617) 449-2810
Date of fiscal year end: September 30
Date of reporting period: September 30, 2011
Item 1. Reports to Stockholders.
The Registrant’s annual report transmitted to shareholders pursuant to Rule 30e-1 under the Investment Company Act of 1940 is as follows:
ANNUAL REPORT
September 30, 2011

Loomis Sayles Core Plus Bond Fund
Loomis Sayles High Income Fund
Loomis Sayles International Bond Fund
Loomis Sayles Limited Term Government and Agency Fund
TABLE OF CONTENTS
Management Discussion and Investment Results page 1
Portfolio of Investments page 26
Financial Statements page 61
LOOMIS SAYLES CORE PLUS BOND FUND
Management Discussion
Managers:
Peter W. Palfrey, CFA
Richard G. Raczkowski
Loomis, Sayles & Company, L.P.
Objective:
Seeks high total investment return through a combination of current income and capital appreciation
Strategy:
Invests primarily in bonds
Fund Inception:
November 7, 1973
Symbols:
| | |
| Class A | | NEFRX |
| Class B | | NERBX |
| Class C | | NECRX |
| Class Y | | NERYX |
Market Conditions
Fixed-income markets rallied through the start of 2011, fueled by the Federal Reserve Board’s (the Fed) large-scale asset purchase program, known more technically as “quantitative easing.” Riskier assets were the primary beneficiaries of the program, and high-yield bonds and equity-sensitive convertible bonds posted robust returns in the first half of the reporting period. However, the continued release of weaker-than-expected domestic economic data, combined with Standard & Poor’s downgrade of long-term U.S. debt and ongoing sovereign debt concerns in Europe, weighed on the financial markets. In the final months of the period, investors exited riskier assets, including credit and structured securities, preferring the quality and liquidity of U.S. Treasury securities. The Treasury market received additional support from the latest Fed stimulus program, “Operation Twist.” The program calls for the Fed to purchase long-term Treasuries and sell the same amount of short-term Treasuries in an effort to drive down longer-term interest rates and keep short-term rates at current or higher levels.
Performance Results
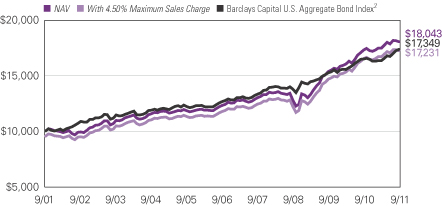
For the 12 months ended September 30, 2011, Class A shares of Loomis Sayles Core Plus Bond Fund returned 4.42% at net asset value. The fund underperformed its benchmark, the Barclays Capital U.S. Aggregate Bond Index, which returned 5.26% for the period, but it outperformed the 3.53% average return of funds in its peer group, the Morningstar Intermediate-Term Bond category.
Explanation of Fund Performance
From a sector perspective, the fund’s Treasury allocation was among the largest contributors to return. In particular, we favored longer-term Treasuries, which helped support our overall long duration strategy (price sensitivity to interest rate changes) — a decision that contributed significantly to the fund’s performance. During the second and third quarters of 2011, the
1 |
market’s flight-to-quality sentiment sent U.S. Treasury yields tumbling (and prices rising). The yield decline was greatest among longer-term Treasuries, and the fund’s longer-duration securities benefited. (When yields decline, longer-duration securities and strategies tend to realize greater price appreciation.) In addition, the fund’s allocation to 30-year mortgage-backed securities (MBS) was a contributor to return. Within the MBS sector, we maintained a modest tilt toward higher-coupon issues to boost the fund’s yield. Within the fund’s allocation to investment-grade corporate bonds, security selection within the financial sector contributed favorably to fund performance.
A small, out-of-benchmark allocation to equity-sensitive preferred securities generated a modestly negative contribution to the fund’s return. Performance among these securities mirrored that of the equity markets, which declined sharply in the second half of the period. Out-of-benchmark exposure to high-yield financials and industrials also were among the weakest contributors to the fund’s return, as soft economic data and sovereign-debt concerns in Europe weighed heavily on the markets. Overall, we maintained significant high-yield exposure, focusing on higher-quality credits within the sector. Our goal is to maintain a significant yield advantage in the portfolio, but with less price sensitivity to the high-yield market as a whole. The fund’s holdings in investment-grade corporate bonds in the industrial sector detracted from performance, primarily due to our focus on securities with lower investment-grade quality ratings. The fund’s super senior higher-quality commercial mortgage-backed securities (CMBS) weighed on overall returns, as the CMBS market came under pressure in a risk-averse environment.
In terms of derivatives exposure, we established a 6% short (sell) position in the euro in late spring. We believe the euro is likely to come under additional pressure as European authorities address the sovereign debt problems in peripheral Europe and seek to bolster bank capital. Monetary policy easing also may put downward pressure on euro trading levels. In our view, the euro zone debt problems represent the most likely sources of risk to the fund’s holdings, and this short euro position offers a hedge against the possibility of a pronounced selloff of riskier assets if sovereign debt concerns escalate.
Outlook
We expect to maintain underweight positions in government securities and overweight positions in investment-grade, high-yield and CMBS in the foreseeable future. We believe the portfolio is well positioned for a longer-term U.S. and global market recovery. Our goal is to maintain liquidity, which gives us the flexibility to move in and out of specific markets and sectors.
What You Should Know
Investments in the fund are subject to a number of risks. Please see the “Principal Risks” section of the fund’s prospectus. The purchase of fund shares should be seen as a long-term investment.
| 2
LOOMIS SAYLES CORE PLUS BOND FUND
Investment Results through September 30, 2011
The charts comparing the fund’s performance to an index provide you with a general sense of how it performed. The fund’s total return for the period shown below appears with and without sales charges and includes fund expenses and fees. An index measures the performance of a theoretical portfolio. Unlike a fund, an index is unmanaged and does not have expenses that affect the results. It is not possible to invest directly in an index. Investors would incur transaction costs and other expenses if they purchased the securities necessary to match the index.
Growth of $10,000 Investment in Class A Shares4
September 30, 2001 through September 30, 2011
Average Annual Total Returns — September 30, 20114
| | | | | | | | | | | | |
| | | | |
| | | 1 Year | | | 5 Years | | | 10 Years | |
| | | | |
| Class A (Inception 11/7/73) | | | | | | | | | | | | |
| NAV | | | 4.42 | % | | | 7.97 | % | | | 6.08 | % |
| With 4.50% Maximum Sales Charge | | | -0.28 | | | | 6.98 | | | | 5.59 | |
| | | | |
| Class B (Inception 9/13/93) | | | | | | | | | | | | |
| NAV | | | 3.60 | | | | 7.18 | | | | 5.30 | |
| With CDSC1 | | | -1.38 | | | | 6.87 | | | | 5.30 | |
| | | | |
| Class C (Inception 12/30/94) | | | | | | | | | | | | |
| NAV | | | 3.56 | | | | 7.16 | | | | 5.29 | |
| With CDSC1 | | | 2.56 | | | | 7.16 | | | | 5.29 | |
| | | | |
| Class Y (Inception 12/30/94) | | | | | | | | | | | | |
| NAV | | | 4.65 | | | | 8.26 | | | | 6.42 | |
| | | | |
| Comparative Performance | | | | | | | | | | | | |
| Barclays Capital U.S. Aggregate Bond Index2 | | | 5.26 | | | | 6.53 | | | | 5.66 | |
| Morningstar Int.-Term Bond Fund Avg.3 | | | 3.53 | | | | 5.63 | | | | 5.10 | |
Performance data quoted represents past performance and is no guarantee of future results. Total return and value will vary and you may have a gain or loss when shares are sold. Current performance may be lower or higher than quoted. For most recent month-end performance, visit ga.natixis.com. Performance for other share classes will be greater or less than shown based on differences in fees and sales charges. Performance for periods less than one year is cumulative, not annualized. Returns reflect changes in share price and reinvestment of dividends and capital gains, if any. Class Y shares are not available for purchase by all investors. The table and graph do not reflect taxes shareholders might owe on any fund distributions or when they redeem their shares.
3 |
| | | | |
| Credit Quality | | % of Net
Assets as of
9/30/2011 | |
Aaa | | | 44.9 | |
Aa | | | 5.3 | |
A | | | 10.1 | |
Baa | | | 19.9 | |
Ba | | | 13.3 | |
B | | | 3.2 | |
Caa & Lower | | | 0.0 | |
Not Rated | | | 0.3 | |
Short-Term and Other | | | 3.0 | |
Credit quality at 9/30/11 reflects the highest credit rating assigned to individual holdings of the fund among Moody’s, S&P or Fitch; ratings are subject to change. The fund’s shares are not rated by any rating agency and no credit rating for the fund’s shares is implied. The Moody’s equivalent of the assigned rating is presented in the table.
| | | | |
| Effective Duration | | % of Net
Assets as of
9/30/2011 | |
1 year or less | | | 4.5 | |
1-5 years | | | 53.2 | |
5-10 years | | | 29.9 | |
10+ years | | | 12.4 | |
Average Effective Duration | | | 5.9 years | |
Portfolio characteristics will vary.
Expense Ratios
as stated in the most recent prospectus
| | | | | | | | |
| Share Class | | Gross Expense Ratio5 | | | Net Expense Ratio6 | |
| A | | | 0.90 | % | | | 0.90 | % |
| B | | | 1.65 | | | | 1.65 | |
| C | | | 1.65 | | | | 1.65 | |
| Y | | | 0.65 | | | | 0.65 | |
NOTES TO CHARTS
| 1 | Performance for Class B shares assumes a maximum 5% contingent deferred sales charge (“CDSC”) applied when you sell shares, which declines annually between years 1-6 according to the following schedule: 5, 4, 3, 3, 2, 1, 0%. Class C shares performance assumes a 1% CDSC applied when you sell shares within one year of purchase. |
| 2 | Barclays Capital U.S. Aggregate Bond Index is an unmanaged index that covers the U.S.-dollar denominated, investment-grade, fixed-rate, taxable bond market of SEC-registered securities. The index includes bonds from the Treasury, government-related, corporate, mortgage-backed securities, asset-backed securities, and collateralized mortgage-backed securities sectors. |
| 3 | Morningstar Int.-Term Bond Fund Average is the average performance without sales charges of funds with similar investment objectives, as calculated by Morningstar, Inc. |
| 4 | Fund performance has been increased by fee waivers and/or expense reimbursements, if any, without which performance would have been lower. |
| 5 | Before fee waivers and/or expense reimbursements. |
| 6 | After fee waivers and/or expense reimbursements. Waivers/reimbursements are contractual and are set to expire on 1/31/12. Contracts are reevaluated on an annual basis. |
| 4
LOOMIS SAYLES HIGH INCOME FUND
Management Discussion
Managers:
Matthew J. Eagan, CFA
Kathleen C. Gaffney, CFA
Associate Manager:
Elaine M. Stokes
Loomis, Sayles & Company, L.P.
Objective:
Seeks high current income plus the opportunity for capital appreciation to produce a high total return
Strategy:
Invests primarily in below investment-grade fixed-income securities
Fund Inception:
February 22, 1984
Symbols:
| | |
| Class A | | NEFHX |
| Class B | | NEHBX |
| Class C | | NEHCX |
| Class Y | | NEHYX |
Market Conditions
Early in the period, strong corporate earnings and positive economic news laid the groundwork for positive returns in the credit sector, while the Federal Reserve Board’s (the Fed) second large-scale asset purchase program — known as quantitative easing or “QE2” helped calm investors. Bumps emerged along the way — namely, political upheaval in the Middle East and North Africa and supply-chain disruptions originating in Japan — but positive economic data helped moderate concerns. A few months later, negative housing, inflation and employment data suggested the U.S. economy was slowing, while the expiration of QE2 in June generated uncertainty. The final months of the period were especially harsh, due to slower-than-expected global economic growth. Standard & Poor’s downgrade of U.S. debt and persistent fears of a euro zone default further roiled markets. Market liquidity tightened, and a flight to perceived safety pushed U.S. Treasury yields to historical lows.
Performance Results
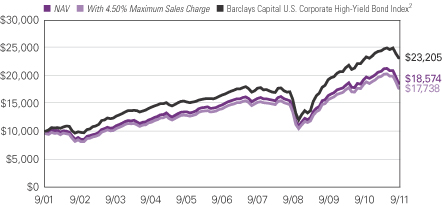
For the 12 months ended September 30, 2011, Class A shares of Loomis Sayles High Income Fund returned -3.30% at net asset value. The fund underperformed its benchmark, the Barclays Capital U.S. Corporate High-Yield Bond Index, which returned 1.78% for the period. The fund also underperformed the 0.77% average return of funds in its peer group, the Morningstar High Yield Bond category.
Explanation of Fund Performance
The fund’s duration (price sensitivity to interest rate changes) strategy contributed positively to performance for the period. Specifically, a longer-than-benchmark duration enhanced performance as interest rates fell throughout the period. (When interest rates fall, funds with longer duration strategies tend to experience greater price appreciation.) Below-investment-grade mortgage-backed securities also contributed positively.
5 |
High-yield industrial issues were significant performance detractors, hurt by the flight to quality, with names in the communications, consumer cyclical, basic industry and consumer non-cyclical industries suffering most. Certain high-yield financial holdings also hampered results. Out-of-benchmark allocations to equities, preferred securities and equity-sensitive convertibles hurt return relative to the benchmark when the equity market sold off late in the period. An out-of-benchmark allocation to non-U.S.-dollar securities also hindered results. Poor returns from issues denominated in the Mexican peso, euro, Brazilian real, South Korean won and Canadian dollar muted gains from certain issues denominated in the Philippine peso, Colombian peso and Australian dollar.
In terms of derivatives, hedging strategies helped offset downside risk on the fund’s non-U.S.-dollar-denominated securities in the euro zone. Overall, the strategies were successful and benefited performance.
Outlook
Pronounced market illiquidity, re-pricing of risk assets for slower global growth, the effects of the Fed’s latest stimulus plan, named “Operation Twist,” and events in Europe are among the themes we will focus on through year-end. Growth expectations for the U.S. and other developed economies remain lackluster, as high volatility and an uncertain business environment persist. Geopolitical factors are further clouding the outlook. Details of new regulations (healthcare reform and the Dodd-Frank Act and Basel III financial regulation) have yet to be implemented, and election posturing in the U.S. will likely begin to overshadow policy formulation.
While our base case for economic growth for the remainder of 2011 and into 2012 remains less than robust, we believe there are many long-term, fundamentally stable or improving credits that currently offer attractive relative value. Default expectations are historically low, many corporate balance sheets remain strong and companies are behaving conservatively given the uncertain business climate. These are all factors that can potentially benefit bondholders.
Although the Fed has signaled that it remains accommodative on a number of fronts in the short term, we believe U.S. interest rates are currently in a period of transition, with a bias higher over the long term. We will continue to pursue what we believe are less market-sensitive securities, seeking to own credits that move independent of the general market, regardless of the direction of rates. As macroeconomic fears and illiquidity feed periods of price declines, we intend to use these opportunities to increase allocations to fundamentally sound credits. Our conviction in opportunistic investing driven by fundamental research has not changed, and we remain steadfast in our long-term approach.
What You Should Know
Investments in the fund are subject to a number of risks. Please see the “Principal Risks” section of the fund’s prospectus. The purchase of fund shares should be seen as a long-term investment.
| 6
LOOMIS SAYLES HIGH INCOME FUND
Investment Results through September 30, 2011
The charts comparing the fund’s performance to an index provide you with a general sense of how it performed. The fund’s total return for the period shown below appears with and without sales charges and includes fund expenses and fees. An index measures the performance of a theoretical portfolio. Unlike a fund, the index is unmanaged and does not have expenses that affect the results. It is not possible to invest directly in an index. Investors would incur transaction costs and other expenses if they purchased the securities necessary to match the index.
Growth of a $10,000 Investment in Class A Shares4
September 30, 2001 through September 30, 2011
Average Annual Total Returns — September 30, 20114
| | | | | | | | | | | | | | | | |
| | | | | |
| | | 1 Year | | | 5 Years | | | 10 Years | | | Since Class Y
Inception5 | |
| | | | | |
| Class A (Inception 2/22/84) | | | | | | | | | | | | | | | | |
| NAV | | | -3.30 | % | | | 4.78 | % | | | 6.39 | % | | | — | |
| With 4.50% Maximum Sales Charge | | | -7.63 | | | | 3.82 | | | | 5.89 | | | | — | |
| | | | | |
| Class B (Inception 9/20/93) | | | | | | | | | | | | | | | | |
| NAV | | | -4.04 | | | | 3.97 | | | | 5.58 | | | | — | |
| With CDSC1 | | | -8.58 | | | | 3.66 | | | | 5.58 | | | | — | |
| | | | | |
| Class C (Inception 3/2/98) | | | | | | | | | | | | | | | | |
| NAV | | | -4.02 | | | | 4.03 | | | | 5.59 | | | | — | |
| With CDSC1 | | | -4.93 | | | | 4.03 | | | | 5.59 | | | | — | |
| | | | | |
| Class Y (Inception 2/29/08) | | | | | | | | | | | | | | | | |
| NAV | | | -2.86 | | | | — | | | | — | | | | 5.28 | % |
| | | | | |
| Comparative Performance | | | | | | | | | | | | | | | | |
| Barclays Capital U.S. Corporate High-Yield Bond Index2 | | | 1.78 | | | | 7.08 | | | | 8.78 | | | | 9.02 | |
| Morningstar High Yield Bond Fund Avg.3 | | | 0.77 | | | | 4.74 | | | | 6.93 | | | | 6.02 | |
Performance data quoted represents past performance and is no guarantee of future results. Total return and value will vary and you may have a gain or loss when shares are sold. Current performance may be lower or higher than quoted. For most recent month-end performance, visit ga.natixis.com. Performance for other share classes will be greater or less than shown based on differences in fees and sales charges. Performance for periods less than one year is cumulative, not annualized. Returns reflect changes in share price and reinvestment of dividends and capital gains, if any. Class Y shares are not available for purchase by all investors. The table and graph do not reflect taxes shareholders might owe on any fund distributions or when they redeem their shares.
7 |
| | | | |
| Credit Quality | | % of Net
Assets as of
9/30/2011 | |
Aaa | | | 5.5 | |
Aa | | | 3.5 | |
A | | | 8.1 | |
Baa | | | 7.2 | |
Ba | | | 24.9 | |
B | | | 30.7 | |
Caa & Lower | | | 9.1 | |
Not Rated | | | 4.6 | |
Short-Term and Other | | | 6.4 | |
Credit quality at 9/30/11 reflects the highest credit rating assigned to individual holdings of the fund among Moody’s, S&P or Fitch; ratings are subject to change. The fund’s shares are not rated by any rating agency and no credit rating for the fund’s shares is implied. The Moody’s equivalent of the assigned rating is presented in the table.
| | | | |
| Effective Maturity | | % of Net
Assets as of
9/30/2011 | |
1 year or less | | | 8.5 | |
1-5 years | | | 22.4 | |
5-10 years | | | 31.2 | |
10+ years | | | 37.9 | |
Average Effective Maturity | | | 11.3 years | |
Portfolio characteristics will vary.
Expense Ratios
as stated in the most recent prospectus
| | | | | | | | |
| Share Class | | Gross Expense Ratio6 | | | Net Expense Ratio7 | |
| A | | | 1.20 | % | | | 1.15 | % |
| B | | | 1.94 | | | | 1.90 | |
| C | | | 1.95 | | | | 1.90 | |
| Y | | | 0.93 | | | | 0.90 | |
NOTES TO CHARTS
| 1 | Performance for Class B shares assumes a maximum 5% contingent deferred sales charge (“CDSC”) applied when you sell shares, which declines annually between years 1-6 according to the following schedule: 5, 4, 3, 3, 2, 1, 0%. Class C shares performance assumes a 1% CDSC applied when you sell shares within one year of purchase. |
| 2 | Barclays Capital U.S. Corporate High-Yield Bond Index is an unmanaged index that covers the U.S. dollar-denominated, non-investment grade, fixed-rate, taxable corporate bond market. |
| 3 | Morningstar High Yield Bond Fund Average is the average performance without sales charges of funds with similar investment objectives, as calculated by Morningstar, Inc. |
| 4 | Fund performance has been increased by fee waivers and/or expense reimbursements, if any, without which performance would have been lower. |
| 5 | The since-inception comparative performance figures shown for Class Y shares are calculated from 3/1/08. |
| 6 | Before fee waivers and/or expense reimbursements. |
| 7 | After fee waivers and/or expense reimbursements. Waivers/reimbursements are contractual and are set to expire on 1/31/12. Contracts are reevaluated on an annual basis. |
| 8
LOOMIS SAYLES INTERNATIONAL BOND FUND
Management Discussion
Managers:
Kenneth M. Buntrock, CFA, CIC
David W. Rolley, CFA
Lynda L. Schweitzer, CFA
Loomis, Sayles & Company, L.P.
Objective:
Seeks high total return through a combination of high current income and capital appreciation
Strategy:
Invests primarily in fixed-income securities located outside the U.S.
Fund Inception:
February 1, 2008
Symbols:
| | |
| Class A | | LSIAX |
| Class C | | LSICX |
| Class Y | | LSIYX |
Market Conditions
High volatility stemming from the U.S. debt downgrade, euro policymakers’ continual piecemeal approach to combat the ongoing debt crisis in Europe and outflows from emerging markets led to market uncertainty and deteriorating sentiment in the final months of the reporting period. Several asset categories that held up well for a majority of the period also succumbed to sellers in late August, including emerging market corporate debt and non-Japan Asian currencies. Credit spreads (the difference in yields between Treasury and non-Treasury securities of similar maturity) slowly widened during the summer and accelerated in early August, as a flight to quality pushed government bond yields lower in the United States and Germany.
Through the end of spring 2011, the U.S. dollar and Japanese yen underperformed other developed and emerging market currencies. This trend changed during the summer selloff, and the dollar and yen appreciated. In addition, a selloff in commodity prices led to the depreciation of currencies in Australia, Canada and Norway.
Performance Results
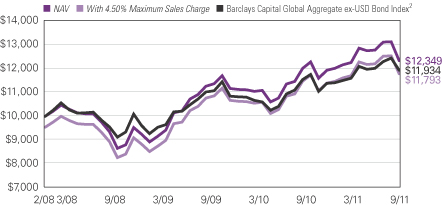
For the 12 months ended September 30, 2011, Class A shares of Loomis Sayles International Bond Fund returned 2.70% at net asset value. The fund underperformed its benchmark, the Barclays Capital Global Aggregate, ex-USD Bond Index, which returned 3.33% for the period. The fund outperformed the 1.45% average return of funds in its peer group, the Morningstar World Bond category.
Explanation of Fund Performance
Country allocation was a chief source of fund performance. In particular, the fund’s underweight positions in European and Japanese local markets aided the 12-month return. In addition, due to strong performance from U.S. Treasury markets, security selection in this sector boosted returns. In addition, our overall preference for higher-quality securities had a
9 |
positive impact on the fund’s return. From a currency perspective, an underweight position in the Australian dollar, the Canadian dollar and the euro were positive influences on performance.
By contrast, an underweight in the Japanese yen detracted from performance, given the strong positive returns the yen generated during the period. In addition, as bond yields fell, the fund’s relatively short duration (price sensitivity to interest rate changes) in the euro-denominated Treasury market dragged down performance. (When yields decline, longer duration strategies tend to realize greater price appreciation.) In addition, an overweight in corporate bonds was a performance detractor. Spreads widened during the period, and the corporate sector’s contribution to return was slightly negative.
To better align the currency exposure of specific holdings, we traded foreign currency contracts throughout the 12-month period. These derivative securities are regular components of the fund’s currency strategy.
Outlook
In the euro zone, we continue to closely monitor the mounting sovereign debt problems and the steps European policymakers will take next to stanch the crisis. Sovereign risk fears have extended to Italy, Europe’s largest bond market, while a likely default in Greece continues to fuel investors’ flight-to-quality sentiment. We will also maintain a watchful eye on the Chinese economy, as a significant deceleration in its growth could have negative implications for the global economic recovery. We intend to marginally increase the fund’s risk exposure via specific credit purchases, as illiquidity and forced selling are generating price discrepancies in bonds we believe are desirable.
What You Should Know
Investments in the fund are subject to a number of risks. Please see the “Principal Risks” section of the fund’s prospectus. The purchase of fund shares should be seen as a long-term investment.
| 10
LOOMIS SAYLES INTERNATIONAL BOND FUND
Investment Results through September 30, 2011
The charts comparing the fund’s performance to an index provide you with a general sense of how it performed. The fund’s total return for the period shown below appears with and without sales charges and includes fund expenses and fees. An index measures the performance of a theoretical portfolio. Unlike a fund, an index is unmanaged and does not have expenses that affect the results. It is not possible to invest directly in an index. Investors would incur transaction costs and other expenses if they purchased the securities necessary to match the index.
Growth of $10,000 Investment in Class A Shares4
February 1, 2008 (inception) through September 30, 2011
Average Annual Total Returns — September 30, 20114
| | | | | | | | |
| | | |
| | | 1 Year | | | Since
Inception | |
| | | |
| Class A (Inception 2/1/08) | | | | | | | | |
| NAV | | | 2.70 | % | | | 5.93 | % |
| With 4.50% Maximum Sales Charge | | | -1.96 | | | | 4.61 | |
| | | |
| Class C (Inception 2/1/08) | | | | | | | | |
| NAV | | | 1.87 | | | | 5.10 | |
| With CDSC1 | | | 0.90 | | | | 5.10 | |
| | | |
| Class Y (Inception 2/1/08) | | | | | | | | |
| NAV | | | 3.06 | | | | 6.17 | |
| | | |
| Comparative Performance | | | | | | | | |
| Barclays Capital Global Aggregate ex-USD Bond Index2 | | | 3.33 | | | | 4.94 | |
| Morningstar World Bond Fund Avg.3 | | | 1.45 | | | | 4.94 | |
Performance data quoted represents past performance and is no guarantee of future results. Total return and value will vary and you may have a gain or loss when shares are sold. Current performance may be lower or higher than quoted. For most recent month-end performance, visit ga.natixis.com. Performance for other share classes will be greater or less than shown based on differences in fees and sales charges. Performance for periods less than one year is cumulative, not annualized. Returns reflect changes in share price and reinvestment of dividends and capital gains, if any. Class Y shares are not available for purchase by all investors. The table and graph do not reflect taxes shareholders might owe on any fund distributions or when they redeem their shares.
11 |
| | | | |
| Credit Quality | | % of Net
Assets as of
9/30/2011 | |
Aaa | | | 31.9 | |
Aa | | | 36.7 | |
A | | | 11.7 | |
Baa | | | 8.6 | |
Ba | | | 6.2 | |
B | | | 1.9 | |
Caa & Lower | | | 0.0 | |
Not Rated | | | 0.0 | |
Short-Term and Other | | | 3.0 | |
Credit quality at 9/30/11 reflects the highest credit rating assigned to individual holdings of the fund among Moody’s, S&P or Fitch; ratings are subject to change. The fund’s shares are not rated by any rating agency and no credit rating for the fund’s shares is implied. The Moody’s equivalent of the assigned rating is presented in the table.
| | | | |
| Effective Maturity | | % of Net
Assets as of
9/30/2011 | |
1 year or less | | | 3.1 | |
1-5 years | | | 37.1 | |
5-10 years | | | 39.9 | |
10+ years | | | 19.9 | |
Average Effective Maturity | | | 7.4 years | |
Portfolio characteristics will vary.
Expense Ratios
as stated in the most recent prospectus
| | | | | | | | |
| Share Class | | Gross Expense Ratio5 | | | Net Expense Ratio6 | |
| A | | | 1.49 | % | | | 1.10 | % |
| C | | | 2.24 | | | | 1.85 | |
| Y | | | 1.23 | | | | 0.85 | |
NOTES TO CHARTS
| 1 | Class C shares performance assumes a 1% CDSC applied when you sell shares within one year of purchase. |
| 2 | Barclays Capital Global Aggregate ex-USD Bond Index is an unmanaged index that provides a broad-based measure of the international investment-grade fixed-rate debt markets. |
| 3 | Morningstar World Bond Fund Average is the average performance without sales charges of funds with similar investment objectives, as calculated by Morningstar, Inc. |
| 4 | Fund performance has been increased by fee waivers and/or expense reimbursements, if any, without which performance would have been lower. |
| 5 | Before fee waivers and/or expense reimbursements. |
| 6 | After fee waivers and/or expense reimbursements. Waivers/reimbursements are contractual and are set to expire on 1/31/12. Contracts are reevaluated on an annual basis. |
| 12
LOOMIS SAYLES LIMITED TERM GOVERNMENT AND AGENCY FUND
Management Discussion
Managers:
John Hyll
Clifton V. Rowe, CFA
Loomis, Sayles & Company, L.P.
Objective:
Seeks a high current return consistent with preservation of capital
Strategy:
Invests primarily in securities issued or guaranteed by the U.S. government, its agencies or instrumentalities
Fund Inception:
January 3, 1989
Symbols:
| | |
| Class A | | NEFLX |
| Class B | | NELBX |
| Class C | | NECLX |
| Class Y | | NELYX |
Market Conditions
Projections in late 2010 for strong global growth in 2011 were frequently pared back, as negative news outweighed upbeat reports. Then in the first quarter of 2011, an earthquake, tsunami and partial nuclear reactor meltdown in Japan disrupted auto and technology sector supply chains worldwide, as the country dealt with catastrophic losses of life, property and productivity. This, coupled with political upheaval in the Middle East, caused a flight to quality and spikes in oil prices. Domestically, orderly political dissatisfaction emerged, as the United States approached its debt ceiling and Congress reached a last-minute agreement to raise the limit. This controversial process was followed by Standard & Poor’s downgrade of the United States’ long-term credit rating. Despite the downgrade, investors worldwide sought the safety of U.S. Treasuries, fueling a historic rally in the asset class that indicated U.S. debt remains the world’s choice for safe-haven assets.
Performance Results
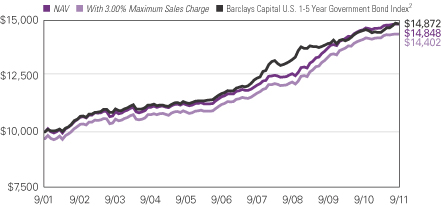
For the 12 months ended September 30, 2011, Class A shares of Loomis Sayles Limited Term Government and Agency Fund returned 1.71% at net asset value. The fund underperformed its benchmark, the Barclays Capital U.S. 1-5 Year Government Bond Index, which returned 2.16% for the period. It outperformed the 1.46% average return of funds in its peer group, the Morningstar Short Government category.
Explanation of Fund Performance
Relative to the benchmark, the fund’s significant overweight in agency mortgage-backed securities (MBS) contributed strongly to its 12-month return. In particular, we were able to identify bonds with favorable prepayment profiles and relative yield advantages. Security selection within asset-backed securities (ABS) also bolstered returns, as the ABS sector remained liquid when other sectors were not amid periods of high market volatility. In addition, specific security selection within commercial mortgage-backed securities
13 |
(CMBS) was among the top contributors to return, due to our emphasis on the most senior securities.
In the period’s declining yield environment, our short duration strategy detracted from results. Duration is a measure of price sensitivity to interest rate changes. When interest rates decline, longer-duration securities and strategies tend to experience greater price appreciation. While individual securities within the fund’s CMBS allocation were positive, an overweight position in the sector hampered performance relative to the benchmark due to the benchmark’s significant Treasury holdings. Despite their yield advantage, CMBS were unable to keep pace with Treasuries during the flight to quality late in the period.
Outlook
We expect the Federal Reserve Board to maintain its current interest rate policy well into 2012. In the intermediate term, we expect a gradual increase in market interest rates, as measured economic growth persists.
We are maintaining overweight positions in CMBS and ABS. While we expect fundamental weakness to persist in the mortgage and consumer loan markets, we believe the securities we hold continue to offer compelling risk-adjusted returns. We expect the fund’s government-sponsored enterprise (GSE) mortgage positions to benefit from a relatively stable interest rate environment. We will continue to look for opportunities to take advantage of a flattening yield curve (a curve that shows the relationship between bond yields across the maturity spectrum) and will focus on income, rather than price appreciation. We believe GSEs will continue to offer modest yield advantages with strong credit quality.
What You Should Know
Investments in the fund are subject to a number of risks. Please see the “Principal Risks” section of the fund’s prospectus. The purchase of fund shares should be seen as a long-term investment.
| 14
LOOMIS SAYLES LIMITED TERM GOVERNMENT AND AGENCY FUND
Investment Results through September 30, 2011
The charts comparing the fund’s performance to an index provide you with a general sense of how it performed. The fund’s total return for the period shown below appears with and without sales charges and includes fund expenses and fees. An index measures the performance of a theoretical portfolio. Unlike a fund, the index is unmanaged and does not have expenses that affect the results. It is not possible to invest directly in an index. Investors would incur transaction costs and other expenses if they purchased the securities necessary to match the index.
Growth of a $10,000 Investment in Class A Shares4
September 30, 2001 through September 30, 2011
Average Annual Total Returns — September 30, 20114
| | | | | | | | | | | | |
| | | | |
| | | 1 Year | | | 5 Years | | | 10 Years | |
| | | | |
| Class A (Inception 1/3/89) | | | | | | | | | | | | |
| NAV | | | 1.71 | % | | | 5.08 | % | | | 4.03 | % |
| With 3.00% Maximum Sales Charge | | | -1.32 | | | | 4.45 | | | | 3.71 | |
| | | | |
| Class B (Inception 9/27/93) | | | | | | | | | | | | |
| NAV | | | 1.04 | | | | 4.31 | | | | 3.28 | |
| With CDSC1 | | | -3.90 | | | | 3.97 | | | | 3.28 | |
| | | | |
| Class C (Inception 12/30/94) | | | | | | | | | | | | |
| NAV | | | 0.96 | | | | 4.31 | | | | 3.29 | |
| With CDSC1 | | | -0.03 | | | | 4.31 | | | | 3.29 | |
| | | | |
| Class Y (Inception 3/31/94) | | | | | | | | | | | | |
| NAV | | | 2.05 | | | | 5.37 | | | | 4.32 | |
| | | | |
| Comparative Performance | | | | | | | | | | | | |
| Barclays Capital U.S. 1-5 Year Government Bond Index2 | | | 2.16 | | | | 4.87 | | | | 4.05 | |
| Morningstar Short Gov’t Fund Avg.3 | | | 1.46 | | | | 3.91 | | | | 3.24 | |
Performance data quoted represents past performance and is no guarantee of future results. Total return and value will vary and you may have a gain or loss when shares are sold. Current performance may be lower or higher than quoted. For most recent month-end performance, visit ga.natixis.com. Performance for other share classes will be greater or less than shown based on differences in fees and sales charges. Performance for periods less than one year is cumulative, not annualized. Returns reflect changes in share price and reinvestment of dividends and capital gains, if any. Class Y shares are not available for purchase by all investors. The table and graph do not reflect taxes shareholders might owe on any fund distributions or when they redeem their shares.
15 |
| | | | |
| Fund Composition | | % of Net
Assets as of
9/30/2011 | |
Hybrid ARMs | | | 20.7 | |
Mortgage Related | | | 17.5 | |
Treasuries | | | 16.3 | |
Commercial Mortgage-Backed Securities | | | 14.0 | |
Collateralized Mortgage Obligations | | | 11.1 | |
Government Owned - No Guarantee | | | 10.2 | |
ABS Car Loan | | | 1.8 | |
ABS Credit Card | | | 0.6 | |
Government Guaranteed | | | 0.5 | |
ABS Student Loan | | | 0.2 | |
Government Sponsored | | | 0.2 | |
ABS Home Equity | | | 0.2 | |
Short-Term and Other | | | 6.7 | |
| | | | |
| Effective Maturity | | % of Net
Assets as of
9/30/2011 | |
1 year or less | | | 19.6 | |
1-5 years | | | 62.7 | |
5-10 years | | | 17.7 | |
Average Effective Maturity | | | 3.0 years | |
Portfolio characteristics will vary.
Expense Ratios
as stated in the most recent prospectus
| | | | | | | | |
| Share Class | | Gross Expense Ratio5 | | | Net Expense Ratio6 | |
| A | | | 0.97 | % | | | 0.85 | % |
| B | | | 1.72 | | | | 1.60 | |
| C | | | 1.72 | | | | 1.60 | |
| Y | | | 0.71 | | | | 0.60 | |
NOTES TO CHARTS
| 1 | Performance for Class B shares assumes a maximum 5% contingent deferred sales charge (“CDSC”) applied when you sell shares, which declines annually between years 1-6 according to the following schedule: 5, 4, 3, 3, 2, 1, 0%. Class C shares performance assumes a 1% CDSC applied when you sell shares within one year of purchase. |
| 2 | Barclays Capital U.S. 1-5 Year Government Bond Index is an unmanaged index that includes U.S. Treasury and agency securities with remaining maturities of one to five years. |
| 3 | Morningstar Short Gov’t Fund Average is the average performance without sales charges of funds with similar investment objectives, as calculated by Morningstar, Inc. |
| 4 | Fund performance has been increased by fee waivers and/or expense reimbursements, if any, without which performance would have been lower. |
| 5 | Before fee waivers and/or expense reimbursements. |
| 6 | After fee waivers and/or expense reimbursements. Waivers/reimbursements are contractual and are set to expire on 1/31/12. Contracts are reevaluated on an annual basis. |
| 16
ADDITIONAL INFORMATION
The views expressed in this report reflect those of the portfolio managers as of the dates indicated. The managers’ views are subject to change at any time without notice based on changes in market or other conditions. References to specific securities or industries should not be regarded as investment advice. Because the funds are actively managed, there is no assurance that they will continue to invest in the securities or industries mentioned.
Before investing, consider the fund’s investment objectives, risks, charges and expenses. Visit ga.natixis.com or call 800-225-5478 for a prospectus and/or a summary prospectus, both of which contain this and other information. Read it carefully.
PROXY VOTING INFORMATION
A description of the funds’ proxy voting policies and procedures is available without charge, upon request, by calling Natixis Funds at 800-225-5478; on the funds’ website at ga.natixis.com; and on the Securities and Exchange Commission’s (SEC’s) website at www.sec.gov. Information regarding how the funds voted proxies relating to portfolio securities during the 12-month period ended June 30, 2011 is available from the funds’ website and the SEC’s website.
QUARTERLY PORTFOLIO SCHEDULES
The funds file a complete schedule of portfolio holdings with the SEC for the first and third quarters of each fiscal year on Form N-Q. The funds’ Forms N-Q are available on the SEC’s website at www.sec.gov and may be reviewed and copied at the SEC’s Public Reference Room in Washington, DC. Information on the operation of the Public Reference Room may be obtained by calling
800-SEC-0330.
17 |
UNDERSTANDING FUND EXPENSES
As a mutual fund shareholder, you incur different costs: transaction costs, including sales charges (loads) on purchases and contingent deferred sales charges on redemptions, and ongoing costs, including management fees, distribution and/or service fees (12b-1 fees), and other fund expenses. Certain exemptions may apply. These costs are described in more detail in the funds’ prospectuses. The examples below are intended to help you understand the ongoing costs of investing in the funds and help you compare these with the ongoing costs of investing in other mutual funds.
The first line in the table of each class of fund shares shows the actual account values and actual fund expenses you would have paid on a $1,000 investment in the fund from April 1, 2011 through September 30, 2011. To estimate the expenses you paid over the period, simply divide your account value by $1,000 (for example $8,600 account value divided by $1,000 = 8.60) and multiply the result by the number in the Expenses Paid During Period column as shown below for your class.
The second line in the table of each class of fund shares provides information about hypothetical account values and hypothetical expenses based on the fund’s actual expense ratios and an assumed rate of return of 5% per year before expenses, which is not the fund’s actual return. The hypothetical account values and expenses may not be used to estimate the actual ending account balance or expenses you paid on your investment for the period. You may use this information to compare the ongoing costs of investing in the fund and other funds. To do so, compare this 5% hypothetical example with the 5% hypothetical examples that appear in the shareholder reports of the other funds.
Please note that the expenses shown reflect ongoing costs only, and do not include any transaction costs such as sales charges. Therefore, the second line in the table of each fund is useful in comparing ongoing costs only, and will not help you determine the relative costs of owning different funds. If transaction costs were included, total costs would be higher.
| | | | | | | | | | | | |
| LOOMIS SAYLES CORE PLUS BOND FUND | | BEGINNING
ACCOUNT VALUE
4/1/2011 | | | ENDING
ACCOUNT VALUE
9/30/2011 | | | EXPENSES PAID
DURING PERIOD*
4/1/2011 – 9/30/2011 | |
Class A | | | | | | | | | | | | |
Actual | | | $1,000.00 | | | | $1,032.70 | | | | $4.43 | |
Hypothetical (5% return before expenses) | | | $1,000.00 | | | | $1,020.71 | | | | $4.41 | |
Class B | | | | | | | | | | | | |
Actual | | | $1,000.00 | | | | $1,028.70 | | | | $8.24 | |
Hypothetical (5% return before expenses) | | | $1,000.00 | | | | $1,016.95 | | | | $8.19 | |
Class C | | | | | | | | | | | | |
Actual | | | $1,000.00 | | | | $1,028.90 | | | | $8.24 | |
Hypothetical (5% return before expenses) | | | $1,000.00 | | | | $1,016.95 | | | | $8.19 | |
Class Y | | | | | | | | | | | | |
Actual | | | $1,000.00 | | | | $1,033.80 | | | | $3.11 | |
Hypothetical (5% return before expenses) | | | $1,000.00 | | | | $1,022.01 | | | | $3.09 | |
| * | Expenses are equal to the Fund’s annualized expense ratio: 0.87%, 1.62%, 1.62% and 0.61% for Class A, B, C and Y, respectively, multiplied by the average account value over the period, multiplied by the number of days in the most recent fiscal half-year, divided by 365 (to reflect the half-year period). |
| 18
| | | | | | | | | | | | |
| LOOMIS SAYLES HIGH INCOME FUND | | BEGINNING
ACCOUNT VALUE
4/1/2011 | | | ENDING
ACCOUNT VALUE
9/30/2011 | | | EXPENSES PAID DURING PERIOD*
4/1/2011 – 9/30/2011 | |
Class A | | | | | | | | | | | | |
Actual | | | $1,000.00 | | | | $893.40 | | | | $5.46 | |
Hypothetical (5% return before expenses) | | | $1,000.00 | | | | $1,019.30 | | | | $5.82 | |
Class B | | | | | | | | | | | | |
Actual | | | $1,000.00 | | | | $890.20 | | | | $9.00 | |
Hypothetical (5% return before expenses) | | | $1,000.00 | | | | $1,015.54 | | | | $9.60 | |
Class C | | | | | | | | | | | | |
Actual | | | $1,000.00 | | | | $892.00 | | | | $9.01 | |
Hypothetical (5% return before expenses) | | | $1,000.00 | | | | $1,015.54 | | | | $9.60 | |
Class Y | | | | | | | | | | | | |
Actual | | | $1,000.00 | | | | $896.30 | | | | $4.23 | |
Hypothetical (5% return before expenses) | | | $1,000.00 | | | | $1,020.61 | | | | $4.51 | |
| * | Expenses are equal to the Fund’s annualized expense ratio: 1.15%, 1.90%, 1.90% and 0.89% for Class A, B, C and Y, respectively, multiplied by the average account value over the period, multiplied by the number of days in the most recent fiscal half-year, divided by 365 (to reflect the half-year period). |
| | | | | | | | | | | | |
LOOMIS SAYLES INTERNATIONAL BOND
FUND | | BEGINNING
ACCOUNT VALUE
4/1/2011 | | | ENDING ACCOUNT VALUE
9/30/2011 | | | EXPENSES PAID
DURING PERIOD*
4/1/2011 – 9/30/2011 | |
Class A | | | | | | | | | | | | |
Actual | | | $1,000.00 | | | | $1,007.00 | | | | $5.53 | |
Hypothetical (5% return before expenses) | | | $1,000.00 | | | | $1,019.55 | | | | $5.57 | |
Class C | | | | | | | | | | | | |
Actual | | | $1,000.00 | | | | $1,002.60 | | | | $9.29 | |
Hypothetical (5% return before expenses) | | | $1,000.00 | | | | $1,015.79 | | | | $9.35 | |
Class Y | | | | | | | | | | | | |
Actual | | | $1,000.00 | | | | $1,008.40 | | | | $4.28 | |
Hypothetical (5% return before expenses) | | | $1,000.00 | | | | $1,020.81 | | | | $4.31 | |
| * | Expenses are equal to the Fund’s annualized expense ratio (after waiver/reimbursement): 1.10%, 1.85% and 0.85% for Class A, C and Y, respectively, multiplied by the average account value over the period, multiplied by the number of days in the most recent fiscal half-year, divided by 365 (to reflect the half-year period). |
19 |
| | | | | | | | | | | | |
LOOMIS SAYLES LIMITED TERM
GOVERNMENT AND AGENCY FUND | | BEGINNING
ACCOUNT VALUE
4/1/2011 | | | ENDING
ACCOUNT VALUE
9/30/2011 | | | EXPENSES PAID
DURING PERIOD*
4/1/2011 – 9/30/2011 | |
Class A | | | | | | | | | | | | |
Actual | | | $1,000.00 | | | | $1,011.90 | | | | $4.29 | |
Hypothetical (5% return before expenses) | | | $1,000.00 | | | | $1,020.81 | | | | $4.31 | |
Class B | | | | | | | | | | | | |
Actual | | | $1,000.00 | | | | $1,008.10 | | | | $8.05 | |
Hypothetical (5% return before expenses) | | | $1,000.00 | | | | $1,017.05 | | | | $8.09 | |
Class C | | | | | | | | | | | | |
Actual | | | $1,000.00 | | | | $1,008.20 | | | | $8.05 | |
Hypothetical (5% return before expenses) | | | $1,000.00 | | | | $1,017.05 | | | | $8.09 | |
Class Y | | | | | | | | | | | | |
Actual | | | $1,000.00 | | | | $1,013.20 | | | | $3.03 | |
Hypothetical (5% return before expenses) | | | $1,000.00 | | | | $1,022.06 | | | | $3.04 | |
| * | Expenses are equal to the Fund’s annualized expense ratio (after waiver/reimbursement): 0.85%, 1.60%, 1.60% and 0.60% for Class A, B, C and Y, respectively, multiplied by the average account value over the period, multiplied by the number of days in the most recent fiscal half-year, divided by 365 (to reflect the half-year period). |
| 20
BOARD APPROVAL OF THE EXISTING ADVISORY AGREEMENTS
The Board of Trustees, including the Independent Trustees, considers matters bearing on each Fund’s advisory agreement and, with respect to the Loomis Sayles Core Plus Bond Fund, its Advisory Administration Agreement (collectively, the “Agreements”) at most of its meetings throughout the year. Each year, usually in the spring, the Contract Review and Governance Committee of the Board meets to review the Agreements to determine whether to recommend that the full Board approve the continuation of the Agreements, typically for an additional one-year period. After the Committee has made its recommendation, the full Board, including the Independent Trustees, determines whether to approve the continuation of the Agreements.
In connection with these meetings, the Trustees receive materials that the Funds’ investment adviser ( the “Adviser”) believes to be reasonably necessary for the Trustees to evaluate the Agreements. These materials generally include, among other items, (i) information on the investment performance of the Funds and the performance of peer groups of funds and the Funds’ performance benchmarks, (ii) information on the Funds’ advisory fees and other expenses, including information comparing the Funds’ expenses to the fees charged to institutional accounts with similar strategies managed by the Adviser and to those of peer groups of funds and information about any applicable expense caps and fee “breakpoints,” (iii) sales and redemption data in respect of the Funds, (iv) information about the profitability of the Agreements to the Adviser and (v) information obtained through the completion of a questionnaire by the Adviser (the Trustees are consulted as to the information requested through that questionnaire). The Board of Trustees, including the Independent Trustees, also consider other matters such as (i) the Adviser’s financial results and financial condition, (ii) each Fund’s investment objective and strategies and the size, education and experience of the Adviser’s investment staff and its use of technology, external research and trading cost measurement tools, (iii) arrangements in respect of the distribution of the Funds’ shares and the related costs, (iv) the procedures employed to determine the value of the Funds’ assets, (v) the allocation of the Funds’ brokerage, if any, including, if applicable, allocations to brokers affiliated with the Adviser and the use of “soft” commission dollars to pay Fund expenses and to pay for research and other similar services, (vi) the resources devoted to, and the record of compliance with, the Funds’ investment policies and restrictions, policies on personal securities transactions and other compliance policies, (vii) information about amounts invested by the Funds’ portfolio managers in the Funds or in similar accounts that they manage and (viii) the general economic outlook with particular emphasis on the mutual fund industry. Throughout the process, the Trustees are afforded the opportunity to ask questions of and request additional materials from the Adviser.
In addition to the materials requested by the Trustees in connection with their annual consideration of the continuation of the Agreements, the Trustees receive materials in advance of each regular quarterly meeting of the Board of Trustees that provide detailed information about the Funds’ investment performance and the fees charged to the Funds for advisory and other services. This information generally includes, among other things, an internal performance rating for each Fund based on agreed-upon criteria, graphs
21 |
showing each Fund’s performance and fee differentials against each Fund’s peer group of funds, performance ratings provided by a third-party, total return information for various periods, and third-party performance rankings for various periods comparing a Fund against its peer group. The portfolio management team for each Fund or other representatives of the Adviser make periodic presentations to the Contract Review and Governance Committee and/or the full Board of Trustees, and Funds identified as presenting possible performance concerns may be subject to more frequent board presentations and reviews. In addition, each quarter the Trustees are provided with detailed statistical information about each Fund’s portfolio. The Trustees also receive periodic updates between meetings.
The Board of Trustees most recently approved the continuation of the Agreements at their meeting held in June 2011. The Agreements were continued for a one-year period for the Funds. In considering whether to approve the continuation of the Agreements, the Board of Trustees, including the Independent Trustees, did not identify any single factor as determinative. Individual Trustees may have evaluated the information presented differently from one another, giving different weights to various factors. Matters considered by the Trustees, including the Independent Trustees, in connection with their approval of the Agreements included, but were not limited to, the factors listed below.
The nature, extent and quality of the services provided to the Funds under the Agreements. The Trustees considered the nature, extent and quality of the services provided by the Adviser and its affiliates to the Funds and the resources dedicated to the Funds by the Adviser and its affiliates.
The Trustees considered not only the advisory services provided by the Adviser to the Funds, but also the administrative services provided by Natixis Asset Management Advisors, L.P. (“Natixis Advisors”) and its affiliates to the Funds.
For each Fund, the Trustees also considered the benefits to shareholders of investing in a mutual fund that is part of a family of funds that offers shareholders the right to exchange shares of one type of fund for shares of another type of fund, and provides a variety of fund and shareholder services.
After reviewing these and related factors, the Trustees concluded, within the context of their overall conclusions regarding each of the Agreements, that the nature, extent and quality of services provided supported the renewal of the Agreements.
Investment performance of the Funds and the Adviser. As noted above, the Trustees received information about the performance of the Funds over various time periods, including information which compared the performance of the Funds to the performance of peer groups of funds and the Funds’ respective performance benchmarks. In addition, the Trustees also reviewed data prepared by an independent third party which analyzed the performance of the Funds using a variety of performance metrics, including metrics which also measured the performance of the Funds on a risk adjusted basis.
With respect to each Fund, the Board concluded that the Fund’s performance or other relevant factors supported the renewal of the Agreement relating to that Fund. In the case of each Fund that had performance that lagged that of a relevant peer group for
| 22
certain (although not necessarily all) periods, the Board concluded that other factors relevant to performance supported renewal of the Agreements. These factors included one or more of the following: (1) that underperformance was attributable, to a significant extent, to investment decisions (such as security selection or sector allocation) by the Adviser that was reasonable and consistent with the Fund’s investment objective and policies; (2) that the Fund’s more recent performance was competitive when compared to relevant performance benchmarks or peer groups; and (3) the Fund had a limited operating history.
The Trustees also considered the Adviser’s performance and reputation generally, the Funds’ performance as a fund family generally (as noted by certain financial publications), and the historical responsiveness of the Adviser to Trustee concerns about performance and the willingness of the Adviser to take steps intended to improve performance.
After reviewing these and related factors, the Trustees concluded, within the context of their overall conclusions regarding each of the Agreements, that the performance of the Funds and the Adviser and/or other relevant factors supported the renewal of the Agreements.
The costs of the services to be provided and profits to be realized by the Adviser and its affiliates from their respective relationships with the Funds. The Trustees considered the fees charged to the Funds for advisory services as well as the total expense levels of the Funds. This information included comparisons (provided both by management and also by an independent third party) of the Funds’ advisory fees and total expense levels to those of their peer groups and information about the advisory fees charged by the Adviser to comparable accounts (such as institutional separate accounts), as well as information about differences in such fees. In considering the fees charged to comparable accounts, the Trustees considered, among other things, management’s representations about the differences between managing mutual funds as compared to other types of accounts, including the additional resources required to effectively manage and the greater regulatory costs associated with the management of mutual fund assets. In evaluating each Fund’s advisory fee, the Trustees also took into account the demands, complexity and quality of the investment management of such Fund, as well as the need for the Adviser to offer competitive compensation and to expend additional resources as the Funds grow in size. The Trustees considered that over the past several years, management had made recommendations regarding reductions in advisory fee rates, implementation of advisory fee breakpoints and the institution of advisory fee waivers and expense caps for various Funds in the Fund family. They noted that, as of December 31, 2010, all of the Funds in this report have expense caps in place. The Trustees noted that certain Funds had advisory fee rates that were above the median of a peer group of funds. The Trustees considered the circumstances that accounted for such relatively higher expenses. These factors varied from Fund to Fund, but included one or more of the following: (1) the Fund’s advisory fee rate was only slightly above its peer group median and (2) although the Fund’s advisory fee rate was above its peer group median, it is subject to an expense cap which resulted in the reduction of the advisory fee.
The Trustees also considered the compensation directly or indirectly received or to be received by the Adviser and its affiliates from their relationships with the Funds. The Trustees reviewed information provided by management as to the profitability of the
23 |
Adviser’s and its affiliates’ relationships with the Funds, and information about the allocation of expenses used to calculate profitability. They also reviewed information provided by management about the effect of distribution costs and changes in asset levels on Adviser profitability, including information regarding resources spent on distribution activities. When reviewing profitability, the Trustees also considered information about court cases in which adviser profitability was an issue, the performance of the relevant Funds, the expense levels of the Funds, whether the Adviser had implemented breakpoints and/or expense caps with respect to such Funds and the overall profit margin of the Adviser compared to other investment managers.
After reviewing these and related factors, the Trustees concluded, within the context of their overall conclusions regarding each of the Agreements, that the advisory fee charged to each of the Funds was fair and reasonable, and that the costs of these services generally and the related profitability of the Adviser and its affiliates in respect of their relationships with the Funds supported the renewal of the Agreements.
Economies of Scale. The Trustees considered the existence of any economies of scale in the provision of services by the Adviser and whether those economies are shared with the Funds through breakpoints in their investment advisory fees or other means, such as expense waivers or caps. The Trustees noted that the Loomis Sayles Core Plus Bond Fund and the Loomis Sayles Limited Term Government and Agency Fund are subject to breakpoints in their respective advisory fees. The Trustees further noted that each of the Funds was subject to an expense cap or waiver. In considering these issues, the Trustees also took note of the costs of the services provided (both on an absolute and a relative basis) and the profitability to the Adviser and its affiliates of their relationships with the Funds, as discussed above.
After reviewing these and related factors, the Trustees concluded, within the context of their overall conclusions regarding each of the Agreements, that the extent to which economies of scale were shared with the Funds supported the renewal of the Agreements.
The Trustees also considered other factors, which included but were not limited to the following:
| · | | the effect of recent market and economic turmoil on the performance, asset levels and expense ratios of each Fund. |
| · | | whether each Fund has operated in accordance with its investment objective and the Fund’s record of compliance with its investment restrictions, and the compliance programs of the Funds and the Adviser. They also considered the compliance-related resources the Adviser and its affiliates were providing to the Funds. |
| · | | the nature, quality, cost and extent of administrative and shareholder services performed by the Adviser and its affiliates, both under the Agreements and under separate agreements covering administrative services. |
| · | | so-called “fallout benefits” to the Adviser, such as the engagement of affiliates of the Adviser to provide distribution, administrative and brokerage services to the Funds, and the benefits of research made available to the Adviser by reason of |
| 24
| | brokerage commissions (if any) generated by the Funds’ securities transactions. The Trustees also considered the fact that Natixis Advisors’ parent company benefits from the retention of an affiliated Adviser. The Trustees considered the possible conflicts of interest associated with these fallout and other benefits, and the reporting, disclosure and other processes in place to disclose and monitor such possible conflicts of interest. |
| · | | the Trustees’ review and discussion of the Funds’ advisory arrangements in prior years, and management’s record of responding to Trustee concerns raised during the year and in prior years. |
Based on their evaluation of all factors that they deemed to be material, including those factors described above, and assisted by the advice of independent counsel, the Trustees, including the Independent Trustees, concluded that each of the existing Agreements should be continued through June 30, 2012.
25 |
Portfolio of Investments – as of September 30, 2011
Loomis Sayles Core Plus Bond Fund
| | | | | | | | |
Principal
Amount (‡) | | | Description | | Value (†) | |
| | | | | | | | |
| | Bonds and Notes — 96.7% of Net Assets | | | | |
| | | | ABS Car Loan — 2.2% | | | | |
| $ | 2,290,000 | | | Ally Master Owner Trust, Series 2011-1, Class A2, 2.150%, 1/15/2016 | | $ | 2,325,483 | |
| | 570,000 | | | AmeriCredit Automobile Receivables Trust, Series 2011-2, Class A3, 1.610%, 10/08/2015 | | | 573,852 | |
| | 780,000 | | | AmeriCredit Automobile Receivables Trust, Series 2011-3, Class A3, 1.170%, 1/08/2016 | | | 780,764 | |
| | 2,410,000 | | | AmeriCredit Automobile Receivables Trust, Series 2011-4, Class A3, 1.170%, 5/09/2016 | | | 2,406,085 | |
| | 1,240,000 | | | Avis Budget Rental Car Funding AESOP LLC, Series 2010-2A, Class A, 3.630%, 8/20/2014, 144A | | | 1,281,606 | |
| | 1,300,000 | | | Avis Budget Rental Car Funding AESOP LLC, Series 2011-2A, Class A, 2.370%, 11/20/2014, 144A | | | 1,325,708 | |
| | 388,677 | | | Centre Point Funding LLC, Series 2010-1A, Class 1, 5.430%, 7/20/2016, 144A | | | 410,397 | |
| | 1,775,000 | | | DSC Floorplan Master Owner Trust, Series 2011-1, Class A, 3.910%, 3/15/2016, 144A | | | 1,804,662 | |
| | 790,000 | | | Hertz Vehicle Financing LLC, Series 2009-2A, Class A1, 4.260%, 3/25/2014, 144A | | | 818,962 | |
| | | | | | | | |
| | | | | | | 11,727,519 | |
| | | | | | | | |
| | | | ABS Credit Card — 0.4% | | | | |
| | 1,580,000 | | | World Financial Network Credit Card Master Trust, Series 2009-D, Class A, 4.660%, 5/15/2017 | | | 1,672,191 | |
| | 500,000 | | | World Financial Network Credit Card Master Trust, Series 2010-A, Class A, 3.960%, 4/15/2019 | | | 538,448 | |
| | | | | | | | |
| | | | | | | 2,210,639 | |
| | | | | | | | |
| | | | ABS Home Equity — 0.6% | | | | |
| | 603,844 | | | Countrywide Asset-Backed Certificates, Series 2004-S1, Class A3, 4.615%, 2/25/2035 | | | 568,429 | |
| | 2,470,692 | | | Wells Fargo Mortgage Backed Securities Trust, Series 2005-11, Class 2A3, 5.500%, 11/25/2035 | | | 2,478,010 | |
| | | | | | | | |
| | | | | | | 3,046,439 | |
| | | | | | | | |
| | | | ABS Other — 0.3% | | | | |
| | 1,620,000 | | | Avis Budget Rental Car Funding AESOP LLC, Series 2011-1A, Class A, 1.850%, 11/20/2014, 144A | | | 1,623,904 | |
| | | | | | | | |
| | | | Aerospace & Defense — 0.7% | | | | |
| | 1,590,000 | | | Bombardier, Inc., 7.500%, 3/15/2018, 144A | | | 1,677,450 | |
| | 2,205,000 | | | Oshkosh Corp., 8.250%, 3/01/2017 | | | 2,138,850 | |
| | | | | | | | |
| | | | | | | 3,816,300 | |
| | | | | | | | |
| | | | Airlines — 0.2% | | | | |
| | 1,235,000 | | | Continental Airlines Pass Through Trust, Series 2010-1, Class A, 4.750%, 1/12/2021 | | | 1,185,600 | |
| | | | | | | | |
| | | | Automotive — 2.7% | | | | |
| | 4,580,000 | | | Ford Motor Credit Co. LLC, 5.000%, 5/15/2018 | | | 4,423,895 | |
| | 510,000 | | | Ford Motor Credit Co. LLC, 5.625%, 9/15/2015 | | | 513,017 | |
| | 1,070,000 | | | Ford Motor Credit Co. LLC, 6.625%, 8/15/2017 | | | 1,114,199 | |
See accompanying notes to financial statements.
| 26
Portfolio of Investments – as of September 30, 2011
Loomis Sayles Core Plus Bond Fund – (continued)
| | | | | | | | |
Principal
Amount (‡) | | | Description | | Value (†) | |
| | | | | | | | |
| | | | Automotive — continued | | | | |
| $ | 880,000 | | | Ford Motor Credit Co. LLC, 7.000%, 10/01/2013 | | $ | 924,103 | |
| | 1,830,000 | | | Ford Motor Credit Co. LLC, 7.000%, 4/15/2015 | | | 1,921,500 | |
| | 660,000 | | | Ford Motor Credit Co. LLC, 8.000%, 12/15/2016 | | | 720,199 | |
| | 1,745,000 | | | General Motors Financial Co., Inc., 6.750%, 6/01/2018, 144A | | | 1,710,100 | |
| | 1,480,000 | | | Kia Motors Corp., 3.625%, 6/14/2016, 144A | | | 1,472,175 | |
| | 1,155,000 | | | Lear Corp., 7.875%, 3/15/2018 | | | 1,189,650 | |
| | | | | | | | |
| | | | | | | 13,988,838 | |
| | | | | | | | |
| | | | Banking — 3.9% | | | | |
| | 1,365,000 | | | Bear Stearns Cos., Inc. (The), 6.400%, 10/02/2017 | | | 1,549,822 | |
| | 605,000 | | | Citigroup, Inc., 6.125%, 5/15/2018 | | | 648,925 | |
| | 2,910,000 | | | Citigroup, Inc., 6.500%, 8/19/2013 | | | 3,062,181 | |
| | 625,000 | | | Goldman Sachs Group, Inc. (The), 5.300%, 2/14/2012 | | | 632,762 | |
| | 2,265,000 | | | Goldman Sachs Group, Inc. (The), 6.750%, 10/01/2037 | | | 2,071,893 | |
| | 1,880,000 | | | JPMorgan Chase & Co., 6.000%, 1/15/2018 | | | 2,093,628 | |
| | 2,765,000 | | | Merrill Lynch & Co., Inc., MTN, 6.875%, 4/25/2018 | | | 2,765,993 | |
| | 960,000 | | | Morgan Stanley, 4.750%, 4/01/2014 | | | 912,306 | |
| | 1,015,000 | | | Morgan Stanley, 5.375%, 10/15/2015 | | | 1,006,919 | |
| | 3,420,000 | | | Morgan Stanley, 5.750%, 1/25/2021 | | | 3,146,629 | |
| | 2,390,000 | | | Royal Bank of Scotland PLC (The), 4.875%, 3/16/2015 | | | 2,340,083 | |
| | | | | | | | |
| | | | | | | 20,231,141 | |
| | | | | | | | |
| | | | Building Materials — 0.9% | | | | |
| | 1,915,000 | | | Owens Corning, Inc., 7.000%, 12/01/2036 | | | 1,984,170 | |
| | 1,480,000 | | | USG Corp., 6.300%, 11/15/2016 | | | 1,084,100 | |
| | 1,545,000 | | | Vulcan Materials Co., 6.500%, 12/01/2016 | | | 1,424,128 | |
| | | | | | | | |
| | | | | | | 4,492,398 | |
| | | | | | | | |
| | | | Chemicals — 1.2% | | | | |
| | 2,265,000 | | | Braskem America Finance Co., 7.125%, 7/22/2041, 144A | | | 2,066,812 | |
| | 2,060,000 | | | Chevron Phillips Chemical Co. LLC, 8.250%, 6/15/2019, 144A | | | 2,599,180 | |
| | 1,330,000 | | | RPM International, Inc., 6.125%, 10/15/2019 | | | 1,436,310 | |
| | | | | | | | |
| | | | | | | 6,102,302 | |
| | | | | | | | |
| | | | Collateralized Mortgage Obligations — 0.4% | | | | |
| | 1,628,660 | | | Banc of America Funding Corp., Series 2005-B, Class 3A1, 0.461%, 4/20/2035(b) | | | 1,146,412 | |
| | 797,544 | | | Chase Mortgage Finance Corp., Series 2007-A1, Class 2A3, 2.755%, 2/25/2037(b) | | | 715,216 | |
| | | | | | | | |
| | | | | | | 1,861,628 | |
| | | | | | | | |
| | | | Commercial Mortgage-Backed Securities — 11.0% | | | | |
| | 794,982 | | | Banc of America Merrill Lynch Commercial Mortgage, Inc.,
Series 2007-2, Class A2, 5.634%, 4/10/2049 | | | 805,809 | |
| | 2,680,000 | | | Banc of America Merrill Lynch Commercial Mortgage, Inc.,
Series 2007-5, Class A4, 5.492%, 2/10/2051 | | | 2,799,043 | |
| | 405,865 | | | Bear Stearns Commercial Mortgage Securities, Series 2005-PW10, Class A2, 5.270%, 12/11/2040 | | | 405,265 | |
See accompanying notes to financial statements.
27 |
Portfolio of Investments – as of September 30, 2011
Loomis Sayles Core Plus Bond Fund – (continued)
| | | | | | | | |
Principal
Amount (‡) | | | Description | | Value (†) | |
| | | | | | | | |
| | | | Commercial Mortgage-Backed Securities — continued | | | | |
| $ | 3,810,000 | | | Bear Stearns Commercial Mortgage Securities, Series 2007-PW15, Class A4,
5.331%, 2/11/2044 | | $ | 3,930,388 | |
| | 975,168 | | | Bear Stearns Commercial Mortgage Securities, Series 2007-PW16, Class A2,
5.663%, 6/11/2040(b) | | | 995,032 | |
| | 690,000 | | | Citigroup Commercial Mortgage Trust, Series 2007-C6, Class A4,
5.697%, 12/10/2049(b) | | | 743,285 | |
| | 1,000,000 | | | Citigroup Commercial Mortgage Trust, Series 2008-C7, Class A4,
6.072%, 12/10/2049(b) | | | 1,089,399 | |
| | 264,142 | | | Citigroup/Deutsche Bank Commercial Mortgage Trust,
Series 2006-CD2, Class A2, 5.408%, 1/15/2046 | | | 263,856 | |
| | 1,895,000 | | | Citigroup/Deutsche Bank Commercial Mortgage Trust, Series 2007-CD4,
Class A4, 5.322%, 12/11/2049 | | | 1,953,368 | |
| | 5,060,000 | | | Credit Suisse Mortgage Capital Certificates, Series 2007-C3, Class A4,
5.714%, 6/15/2039(b) | | | 5,269,403 | |
| | 1,155,000 | | | Credit Suisse Mortgage Capital Certificates, Series 2007-C5, Class A4,
5.695%, 9/15/2040 | | | 1,230,554 | |
| | 1,835,000 | | | CW Capital Cobalt Ltd., Series 2007-C2, Class A3, 5.484%, 4/15/2047 | | | 1,944,428 | |
| | 1,168,813 | | | Greenwich Capital Commercial Funding Corp., Series 2005-GG5, Class A2,
5.117%, 4/10/2037 | | | 1,172,960 | |
| | 425,000 | | | Greenwich Capital Commercial Funding Corp., Series 2006-GG7, Class A4,
5.877%, 7/10/2038(b) | | | 457,607 | |
| | 3,820,000 | | | Greenwich Capital Commercial Funding Corp., Series 2007-GG11, Class A4,
5.736%, 12/10/2049 | | | 3,965,515 | |
| | 3,319,000 | | | GS Mortgage Securities Corp. II, Series 2006-GG6, Class A4,
5.553%, 4/10/2038 | | | 3,523,022 | |
| | 1,140,000 | | | GS Mortgage Securities Corp. II, Series 2006-GG8, Class A4,
5.560%, 11/10/2039 | | | 1,204,706 | |
| | 3,625,000 | | | GS Mortgage Securities Corp. II, Series 2007-GG10, Class A4,
5.790%, 8/10/2045(b) | | | 3,766,067 | |
| | 1,375,000 | | | JPMorgan Chase Commercial Mortgage Securities Corp.,
Series 2006-LDP7, Class A4, 5.878%, 4/15/2045(b) | | | 1,511,379 | |
| | 3,000,000 | | | JPMorgan Chase Commercial Mortgage Securities Corp.,
Series 2006-LDP9, Class A3, 5.336%, 5/15/2047 | | | 3,097,830 | |
| | 2,650,000 | | | JPMorgan Chase Commercial Mortgage Securities Corp.,
Series 2007-CB18, Class A4, 5.440%, 6/12/2047 | | | 2,752,277 | |
| | 1,027,565 | | | LB-UBS Commercial Mortgage Trust, Series 2005-C3, Class A3,
4.647%, 7/15/2030 | | | 1,033,048 | |
| | 1,920,000 | | | LB-UBS Commercial Mortgage Trust, Series 2007-C2, Class A3,
5.430%, 2/15/2040 | | | 1,971,806 | |
| | 1,540,000 | | | Merrill Lynch/Countrywide Commercial Mortgage Trust,
Series 2007-6, Class A4, 5.485%, 3/12/2051 | | | 1,579,902 | |
| | 2,930,000 | | | Morgan Stanley Capital I, Series 2007-IQ14, Class A4, 5.692%, 4/15/2049 | | | 3,037,475 | |
| | 305,000 | | | Morgan Stanley Capital I, Series 2007-T27, Class A4, 5.641%, 6/11/2042(b) | | | 340,722 | |
| | 1,175,000 | | | Morgan Stanley Capital I, Series 2008-T29, Class A4, 6.279%, 1/11/2043(b) | | | 1,358,777 | |
| | 2,070,000 | | | Wachovia Bank Commercial Mortgage Trust, Series 2006-C29, Class A4,
5.308%, 11/15/2048 | | | 2,204,583 | |
See accompanying notes to financial statements.
| 28
Portfolio of Investments – as of September 30, 2011
Loomis Sayles Core Plus Bond Fund – (continued)
| | | | | | | | |
Principal
Amount (‡) | | | Description | | Value (†) | |
| | | | | | | | |
| | | | Commercial Mortgage-Backed Securities — continued | | | | |
| $ | 3,090,000 | | | Wachovia Bank Commercial Mortgage Trust, Series 2007-C30, Class A5,
5.342%, 12/15/2043 | | $ | 3,149,999 | |
| | | | | | | | |
| | | | | | | 57,557,505 | |
| | | | | | | | |
| | | | Consumer Cyclical Services — 0.4% | | | | |
| | 370,000 | | | Expedia, Inc., 5.950%, 8/15/2020 | | | 371,788 | |
| | 1,475,000 | | | Service Corp. International, 7.000%, 5/15/2019 | | | 1,489,750 | |
| | | | | | | | |
| | | | | | | 1,861,538 | |
| | | | | | | | |
| | | | Consumer Products — 0.7% | | | | |
| | 3,840,000 | | | Whirlpool Corp., MTN, 4.850%, 6/15/2021 | | | 3,857,994 | |
| | | | | | | | |
| | | | Diversified Manufacturing — 0.8% | | | | |
| | 1,200,000 | | | Crane Co., 6.550%, 11/15/2036 | | | 1,335,221 | |
| | 770,000 | | | Fibria Overseas Finance Ltd., 6.750%, 3/03/2021, 144A | | | 689,150 | |
| | 2,320,000 | | | Votorantim Cimentos S.A., 7.250%, 4/05/2041, 144A | | | 2,169,200 | |
| | | | | | | | |
| | | | | | | 4,193,571 | |
| | | | | | | | |
| | | | Electric — 1.1% | | | | |
| | 215,000 | | | Dubai Electricity & Water Authority, 6.375%, 10/21/2016, 144A | | | 220,913 | |
| | 1,440,000 | | | Dubai Electricity & Water Authority, 8.500%, 4/22/2015, 144A | | | 1,533,600 | |
| | 1,115,000 | | | Enersis S.A., 7.375%, 1/15/2014 | | | 1,215,013 | |
| | 720,000 | | | Ipalco Enterprises, Inc., 5.000%, 5/01/2018, 144A | | | 658,800 | |
| | 1,845,000 | | | TransAlta Corp., 4.750%, 1/15/2015 | | | 1,959,951 | |
| | | | | | | | |
| | | | | | | 5,588,277 | |
| | | | | | | | |
| | | | Energy Equipment & Services — 0.5% | | | | |
| | 2,475,000 | | | Nabors Industries, Inc., 4.625%, 9/15/2021, 144A | | | 2,429,727 | |
| | | | | | | | |
| | | | Food & Beverage — 0.8% | | | | |
| | 760,000 | | | Anheuser-Busch Cos., Inc., 4.500%, 4/01/2018 | | | 825,456 | |
| | 1,445,000 | | | Bunge Ltd. Finance Corp., 4.100%, 3/15/2016 | | | 1,484,091 | |
| | 775,000 | | | Sigma Alimentos S.A. de CV, 5.625%, 4/14/2018, 144A | | | 755,625 | |
| | 1,068,000 | | | Smithfield Foods, Inc., 10.000%, 7/15/2014 | | | 1,212,180 | |
| | | | | | | | |
| | | | | | | 4,277,352 | |
| | | | | | | | |
| | | | Government Owned - No Guarantee — 1.7% | | | | |
| | 2,440,000 | | | Korea Development Bank, 4.000%, 9/09/2016 | | | 2,413,284 | |
| | 1,495,000 | | | Petrobras International Finance Co., 6.750%, 1/27/2041 | | | 1,547,325 | |
| | 2,535,000 | | | Petrobras International Finance Co., 6.875%, 1/20/2040 | | | 2,674,425 | |
| | 1,860,000 | | | Qtel International Finance Ltd., 7.875%, 6/10/2019, 144A | | | 2,264,550 | |
| | | | | | | | |
| | | | | | | 8,899,584 | |
| | | | | | | | |
| | | | Healthcare — 0.9% | | | | |
| | 2,420,000 | | | HCA, Inc., 7.500%, 2/15/2022 | | | 2,232,450 | |
| | 575,000 | | | HCA, Inc., 7.500%, 12/15/2023 | | | 517,500 | |
| | 670,000 | | | Medco Health Solutions, 7.250%, 8/15/2013 | | | 733,225 | |
| | 960,000 | | | Omnicare, Inc., 7.750%, 6/01/2020 | | | 979,200 | |
| | | | | | | | |
| | | | | | | 4,462,375 | |
| | | | | | | | |
See accompanying notes to financial statements.
29 |
Portfolio of Investments – as of September 30, 2011
Loomis Sayles Core Plus Bond Fund – (continued)
| | | | | | | | |
Principal
Amount (‡) | | | Description | | Value (†) | |
| | | | | | | | |
| | | | Hybrid ARMs — 0.1% | | | | |
| $ | 447,783 | | | FHLMC, 6.017%, 11/01/2036(b) | | $ | 483,331 | |
| | 240,938 | | | FNMA, 5.932%, 2/01/2037(b) | | | 257,460 | |
| | | | | | | | |
| | | | | | | 740,791 | |
| | | | | | | | |
| | | | Independent Energy — 1.4% | | | | |
| | 1,560,000 | | | Anadarko Petroleum Corp., 5.950%, 9/15/2016 | | | 1,706,326 | |
| | 1,865,000 | | | Anadarko Petroleum Corp., 6.375%, 9/15/2017 | | | 2,092,202 | |
| | 1,655,000 | �� | | Denbury Resources, Inc., 6.375%, 8/15/2021 | | | 1,605,350 | |
| | 1,680,000 | | | Newfield Exploration Co., 5.750%, 1/30/2022 | | | 1,661,100 | |
| | 415,000 | | | SM Energy Co., 6.625%, 2/15/2019, 144A | | | 412,925 | |
| | | | | | | | |
| | | | | | | 7,477,903 | |
| | | | | | | | |
| | | | Industrial Other — 1.0% | | | | |
| | 1,360,000 | | | Briggs & Stratton Corp., 6.875%, 12/15/2020 | | | 1,373,600 | |
| | 1,865,000 | | | Hutchison Whampoa International Ltd., 5.750%, 9/11/2019, 144A | | | 2,002,688 | |
| | 1,570,000 | | | Timken Co. (The), 6.000%, 9/15/2014 | | | 1,736,426 | |
| | | | | | | | |
| | | | | | | 5,112,714 | |
| | | | | | | | |
| | | | Media Cable — 0.8% | | | | |
| | 1,175,000 | | | Cablevision Systems Corp., 7.750%, 4/15/2018 | | | 1,186,750 | |
| | 1,060,000 | | | Cablevision Systems Corp., 8.000%, 4/15/2020 | | | 1,078,550 | |
| | 410,000 | | | Cox Communications, Inc., 5.450%, 12/15/2014 | | | 453,978 | |
| | 1,330,000 | | | Time Warner Cable, Inc., 8.250%, 4/01/2019 | | | 1,665,459 | |
| | | | | | | | |
| | | | | | | 4,384,737 | |
| | | | | | | | |
| | | | Media Non-Cable — 0.7% | | | | |
| | 1,375,000 | | | Inmarsat Finance PLC, 7.375%, 12/01/2017, 144A | | | 1,378,437 | |
| | 955,000 | | | Myriad International Holding BV, 6.375%, 7/28/2017, 144A | | | 990,813 | |
| | 1,310,000 | | | RR Donnelley & Sons Co., 7.250%, 5/15/2018 | | | 1,183,912 | |
| | | | | | | | |
| | | | | | | 3,553,162 | |
| | | | | | | | |
| | | | Metals & Mining — 0.9% | | | | |
| | 1,225,000 | | | Alcoa, Inc., 6.150%, 8/15/2020 | | | 1,240,902 | |
| | 525,000 | | | APERAM, 7.375%, 4/01/2016, 144A | | | 462,000 | |
| | 2,390,000 | | | ArcelorMittal, 6.750%, 3/01/2041 | | | 2,065,447 | |
| | 400,000 | | | United States Steel Corp., 6.650%, 6/01/2037 | | | 308,000 | |
| | 555,000 | | | United States Steel Corp., 7.375%, 4/01/2020 | | | 499,500 | |
| | | | | | | | |
| | | | | | | 4,575,849 | |
| | | | | | | | |
| | | | Mortgage Related — 17.2% | | | | |
| | 10,682,085 | | | FHLMC, 4.000%, with various maturities from 2019 to 2041(c) | | | 11,201,164 | |
| | 11,194,437 | | | FHLMC, 4.500%, with various maturities from 2034 to 2041(c) | | | 11,857,902 | |
| | 8,986,428 | | | FHLMC, 5.000%, with various maturities from 2018 to 2040(c) | | | 9,660,553 | |
| | 15,284,617 | | | FHLMC, 5.500%, with various maturities from 2018 to 2040(c) | | | 16,586,764 | |
| | 83,384 | | | FHLMC, 6.000%, 6/01/2035 | | | 92,444 | |
| | 321,100 | | | FNMA, 4.000%, 6/01/2019 | | | 341,702 | |
| | 9,689,196 | | | FNMA, 4.500%, with various maturities from 2039 to 2041(c) | | | 10,301,805 | |
| | 2,336,588 | | | FNMA, 5.000%, 8/01/2039 | | | 2,516,164 | |
| | 16,346,937 | | | FNMA, 5.500%, with various maturities from 2018 to 2039(c) | | | 17,790,090 | |
| | 3,427,926 | | | FNMA, 6.000%, with various maturities from 2016 to 2039(c) | | | 3,804,871 | |
See accompanying notes to financial statements.
| 30
Portfolio of Investments – as of September 30, 2011
Loomis Sayles Core Plus Bond Fund – (continued)
| | | | | | | | |
Principal
Amount (‡) | | | Description | | Value (†) | |
| | | | | | | | |
| | | | Mortgage Related — continued | | | | |
| $ | 191,862 | | | FNMA, 6.500%, with various maturities from 2029 to 2036(c) | | $ | 215,920 | |
| | 112,655 | | | FNMA, 7.000%, with various maturities in 2030(c) | | | 129,768 | |
| | 129,580 | | | FNMA, 7.500%, with various maturities from 2024 to 2032(c) | | | 151,481 | |
| | 701,555 | | | GNMA, 5.000%, 4/15/2038 | | | 771,211 | |
| | 2,934,299 | | | GNMA, 5.500%, with various maturities from 2038 to 2039(c) | | | 3,244,329 | |
| | 431,178 | | | GNMA, 6.000%, with various maturities from 2029 to 2038(c) | | | 482,399 | |
| | 285,024 | | | GNMA, 6.500%, with various maturities from 2028 to 2032(c) | | | 329,611 | |
| | 177,969 | | | GNMA, 7.000%, with various maturities from 2025 to 2029(c) | | | 206,148 | |
| | 64,350 | | | GNMA, 7.500%, with various maturities from 2025 to 2030(c) | | | 75,071 | |
| | 29,289 | | | GNMA, 8.000%, 11/15/2029 | | | 34,773 | |
| | 73,666 | | | GNMA, 8.500%, with various maturities from 2017 to 2023(c) | | | 83,022 | |
| | 12,251 | | | GNMA, 9.000%, with various maturities in 2016(c) | | | 12,743 | |
| | 21,171 | | | GNMA, 11.500%, with various maturities from 2013 to 2015(c) | | | 21,358 | |
| | | | | | | | |
| | | | | | | 89,911,293 | |
| | | | | | | | |
| | | | Non-Captive Consumer — 1.4% | | | | |
| | 735,000 | | | HSBC Finance Corp., 7.000%, 5/15/2012 | | | 756,699 | |
| | 325,000 | | | SLM Corp., MTN, 5.050%, 11/14/2014 | | | 313,600 | |
| | 4,370,000 | | | SLM Corp., MTN, 6.250%, 1/25/2016 | | | 4,289,303 | |
| | 350,000 | | | SLM Corp., Series A, MTN, 5.000%, 10/01/2013 | | | 342,607 | |
| | 30,000 | | | SLM Corp., Series A, MTN, 5.000%, 4/15/2015 | | | 27,977 | |
| | 120,000 | | | SLM Corp., Series A, MTN, 5.000%, 6/15/2018 | | | 105,460 | |
| | 55,000 | | | SLM Corp., Series A, MTN, 5.375%, 1/15/2013 | | | 55,002 | |
| | 35,000 | | | SLM Corp., Series A, MTN, 5.375%, 5/15/2014 | | | 34,445 | |
| | 420,000 | | | SLM Corp., Series A, MTN, 5.625%, 8/01/2033 | | | 334,444 | |
| | 1,135,000 | | | SLM Corp., Series A, MTN, 8.450%, 6/15/2018 | | | 1,180,591 | |
| | | | | | | | |
| | | | | | | 7,440,128 | |
| | | | | | | | |
| | | | Non-Captive Diversified — 3.7% | | | | |
| | 1,740,000 | | | Ally Financial, Inc., 6.250%, 12/01/2017 | | | 1,515,731 | |
| | 1,211,000 | | | Ally Financial, Inc., 8.000%, 11/01/2031 | | | 1,062,652 | |
| | 2,480,000 | | | Ally Financial, Inc., 8.300%, 2/12/2015 | | | 2,452,100 | |
| | 2,070,000 | | | GATX Corp., 4.750%, 5/15/2015 | | | 2,193,186 | |
| | 6,045,000 | | | General Electric Capital Corp., 2.250%, 11/09/2015 | | | 5,975,313 | |
| | 1,595,000 | | | General Electric Capital Corp., 5.300%, 2/11/2021 | | | 1,654,655 | |
| | 3,080,000 | | | International Lease Finance Corp., 5.750%, 5/15/2016 | | | 2,737,547 | |
| | 670,000 | | | International Lease Finance Corp., 6.250%, 5/15/2019 | | | 582,359 | |
| | 205,000 | | | International Lease Finance Corp., 6.375%, 3/25/2013 | | | 199,363 | |
| | 40,000 | | | International Lease Finance Corp., Series R, MTN, 5.550%, 9/05/2012 | | | 39,350 | |
| | 200,000 | | | International Lease Finance Corp., Series R, MTN, 5.625%, 9/20/2013 | | | 192,000 | |
| | 830,000 | | | International Lease Finance Corp., Series R, MTN, 5.650%, 6/01/2014 | | | 769,825 | |
| | | | | | | | |
| | | | | | | 19,374,081 | |
| | | | | | | | |
| | | | Oil Field Services — 2.3% | | | | |
| | 2,665,000 | | | Pan American Energy LLC, 7.875%, 5/07/2021, 144A | | | 2,668,198 | |
| | 2,290,000 | | | Parker Drilling Co., 9.125%, 4/01/2018 | | | 2,312,900 | |
| | 1,780,000 | | | Rowan Cos., Inc., 5.000%, 9/01/2017 | | | 1,844,493 | |
See accompanying notes to financial statements.
31 |
Portfolio of Investments – as of September 30, 2011
Loomis Sayles Core Plus Bond Fund – (continued)
| | | | | | | | |
Principal
Amount (‡) | | | Description | | Value (†) | |
| | | | | | | | |
| | | | Oil Field Services — continued | | | | |
| $ | 4,805,000 | | | Transocean, Inc., 4.950%, 11/15/2015 | | $ | 5,060,419 | |
| | | | | | | | |
| | | | | | | 11,886,010 | |
| | | | | | | | |
| | | | Packaging — 0.2% | | | | |
| | 1,145,000 | | | Reynolds Group Issuer, Inc./Reynolds Group Issuer LLC/Reynolds Group Issuer (Luxembourg) S.A., 7.875%, 8/15/2019, 144A | | | 1,104,925 | |
| | | | | | | | |
| | | | Paper — 1.3% | | | | |
| | 1,595,000 | | | Celulosa Arauco y Constitucion S.A., 5.000%, 1/21/2021 | | | 1,603,482 | |
| | 1,410,000 | | | Georgia-Pacific LLC, 7.375%, 12/01/2025 | | | 1,573,240 | |
| | 1,860,000 | | | Georgia-Pacific LLC, 7.750%, 11/15/2029 | | | 2,150,904 | |
| | 735,000 | | | Georgia-Pacific LLC, 8.000%, 1/15/2024 | | | 862,878 | |
| | 365,000 | | | Georgia-Pacific LLC, 8.875%, 5/15/2031 | | | 455,557 | |
| | | | | | | | |
| | | | | | | 6,646,061 | |
| | | | | | | | |
| | | | Pharmaceuticals — 0.7% | | | | |
| | 600,000 | | | Valeant Pharmaceuticals International, 6.750%, 10/01/2017, 144A | | | 552,750 | |
| | 2,810,000 | | | Valeant Pharmaceuticals International, 6.875%, 12/01/2018, 144A | | | 2,543,050 | |
| | 525,000 | | | Valeant Pharmaceuticals International, 7.250%, 7/15/2022, 144A | | | 460,687 | |
| | | | | | | | |
| | | | | | | 3,556,487 | |
| | | | | | | | |
| | | | Pipelines — 1.6% | | | | |
| | 3,895,000 | | | Energy Transfer Partners LP, 6.050%, 6/01/2041 | | | 3,641,112 | |
| | 3,190,000 | | | Kinder Morgan Finance Co. LLC, 6.000%, 1/15/2018, 144A | | | 3,158,100 | |
| | 1,255,000 | | | ONEOK Partners LP, 8.625%, 3/01/2019 | | | 1,616,521 | |
| | | | | | | | |
| | | | | | | 8,415,733 | |
| | | | | | | | |
| | | | Property & Casualty Insurance — 0.7% | | | | |
| | 1,175,000 | | | Willis Group Holdings PLC, 4.125%, 3/15/2016 | | | 1,194,404 | |
| | 1,775,000 | | | Willis North America, Inc., 6.200%, 3/28/2017 | | | 1,938,277 | |
| | 555,000 | | | Willis North America, Inc., 7.000%, 9/29/2019 | | | 642,028 | |
| | | | | | | | |
| | | | | | | 3,774,709 | |
| | | | | | | | |
| | | | Railroads — 0.1% | | | | |
| | 555,000 | | | Burlington Northern Santa Fe LLC, 4.950%, 9/15/2041 | | | 588,899 | |
| | | | | | | | |
| | | | Refining — 0.6% | | | | |
| | 2,670,000 | | | Coffeyville Resources LLC/Coffeyville Finance, Inc., 10.875%, 4/01/2017, 144A | | | 2,977,050 | |
| | | | | | | | |
| | | | Sovereigns — 4.6% | | | | |
| | 2,583,000(††) | | | Mexican Fixed Rate Bonds, Series M-10, 7.750%, 12/14/2017, (MXN) | | | 20,703,969 | |
| | 3,018,000 | | | Mexico Government International Bond, Series A, MTN, 6.050%, 1/11/2040 | | | 3,410,340 | |
| | | | | | | | |
| | | | | | | 24,114,309 | |
| | | | | | | | |
| | | | Supranational — 0.1% | | | | |
| | 6,990,000 | | | International Bank for Reconstruction & Development,
6.500%, 9/11/2013, (MXN) | | | 526,577 | |
| | | | | | | | |
| | | | Technology — 2.1% | | | | |
| | 2,535,000 | | | Amphenol Corp., 4.750%, 11/15/2014 | | | 2,687,607 | |
| | 1,405,000 | | | Brocade Communications Systems, Inc., 6.625%, 1/15/2018 | | | 1,429,588 | |
| | 495,000 | | | Brocade Communications Systems, Inc., 6.875%, 1/15/2020 | | | 505,519 | |
| | 1,425,000 | | | Equifax, Inc., 7.000%, 7/01/2037 | | | 1,682,597 | |
See accompanying notes to financial statements.
| 32
Portfolio of Investments – as of September 30, 2011
Loomis Sayles Core Plus Bond Fund – (continued)
| | | | | | | | |
Principal
Amount (‡) | | | Description | | Value (†) | |
| | | | | | | | |
| | | | Technology — continued | | | | |
| $ | 2,615,000 | | | Fiserv, Inc., 3.125%, 10/01/2015 | | $ | 2,661,918 | |
| | 69,000 | | | Motorola Solutions, Inc., 6.625%, 11/15/2037 | | | 82,064 | |
| | 340,000 | | | Motorola Solutions, Inc., 7.500%, 5/15/2025 | | | 398,153 | |
| | 985,000 | | | National Semiconductor Corp., 3.950%, 4/15/2015 | | | 1,055,393 | |
| | 279,000 | | | Xerox Corp., 5.500%, 5/15/2012 | | | 286,724 | |
| | | | | | | | |
| | | | | | | 10,789,563 | |
| | | | | | | | |
| | | | Textile — 0.4% | | | | |
| | 475,000 | | | Hanesbrands, Inc., 6.375%, 12/15/2020 | | | 460,750 | |
| | 1,715,000 | | | Hanesbrands, Inc., 8.000%, 12/15/2016 | | | 1,813,613 | |
| | | | | | | | |
| | | | | | | 2,274,363 | |
| | | | | | | | |
| | | | Tobacco — 0.7% | | | | |
| | 3,020,000 | | | Reynolds American, Inc., 7.250%, 6/15/2037 | | | 3,390,823 | |
| | | | | | | | |
| | | | Transportation Services — 0.1% | | | | |
| | 585,000 | | | Erac USA Finance Co., 5.250%, 10/01/2020, 144A | | | 640,773 | |
| | | | | | | | |
| | | | Treasuries — 15.3% | | | | |
| | 8,640,000 | | | U.S. Treasury Bond, 3.750%, 8/15/2041 | | | 10,058,861 | |
| | 3,875,000 | | | U.S. Treasury Bond, 3.875%, 8/15/2040 | | | 4,603,984 | |
| | 3,005,000 | | | U.S. Treasury Bond, 4.375%, 5/15/2040 | | | 3,868,006 | |
| | 2,290,000 | | | U.S. Treasury Bond, 4.375%, 5/15/2041 | | | 2,958,405 | |
| | 1,665,000 | | | U.S. Treasury Bond, 4.750%, 2/15/2041 | | | 2,275,066 | |
| | 1,020,000 | | | U.S. Treasury Bond, 5.375%, 2/15/2031 | | | 1,434,853 | |
| | 660,000 | | | U.S. Treasury Note, 2.250%, 7/31/2018 | | | 696,506 | |
| | 13,550,000 | | | U.S. Treasury Note, 2.625%, 11/15/2020 | | | 14,490,031 | |
| | 3,685,000 | | | U.S. Treasury Note, 3.125%, 1/31/2017 | | | 4,082,287 | |
| | 8,975,000 | | | U.S. Treasury Note, 3.125%, 5/15/2021 | | | 9,961,532 | |
| | 5,275,000 | | | U.S. Treasury Note, 3.625%, 8/15/2019 | | | 6,074,490 | |
| | 16,690,000 | | | U.S. Treasury Note, 3.625%, 2/15/2021(d) | | | 19,280,856 | |
| | | | | | | | |
| | | | | | | 79,784,877 | |
| | | | | | | | |
| | | | Wireless — 3.1% | | | | |
| | 1,070,000 | | | American Tower Corp., 4.625%, 4/01/2015 | | | 1,134,548 | |
| | 2,615,000 | | | CC Holdings GS V LLC/Crown Castle GS III Corp., 7.750%, 5/01/2017, 144A | | | 2,784,975 | |
| | 15,000 | | | Nextel Communications, Inc., Series C, 5.950%, 3/15/2014 | | | 14,063 | |
| | 10,000 | | | Nextel Communications, Inc., Series D, 7.375%, 8/01/2015 | | | 9,475 | |
| | 895,000 | | | NII Capital Corp., 7.625%, 4/01/2021 | | | 888,287 | |
| | 2,325,000 | | | SK Telecom Co. Ltd., 6.625%, 7/20/2027, 144A | | | 2,819,800 | |
| | 5,635,000 | | | Sprint Capital Corp., 6.875%, 11/15/2028 | | | 4,212,162 | |
| | 1,959,000 | | | Telemar Norte Leste S.A., 5.500%, 10/23/2020, 144A | | | 1,861,050 | |
| | 100,000 | | | True Move Co. Ltd., 10.375%, 8/01/2014, 144A | | | 106,000 | |
| | 2,335,000 | | | True Move Co. Ltd., 10.750%, 12/16/2013, 144A | | | 2,475,100 | |
| | | | | | | | |
| | | | | | | 16,305,460 | |
| | | | | | | | |
| | | | Wirelines — 4.2% | | | | |
| | 3,610,000 | | | Axtel SAB de CV, 9.000%, 9/22/2019, 144A | | | 3,032,400 | |
| | 2,445,000 | | | eAccess Ltd., 8.250%, 4/01/2018, 144A | | | 2,237,175 | |
| | 4,778,000 | | | Embarq Corp., 7.995%, 6/01/2036 | | | 4,483,169 | |
See accompanying notes to financial statements.
33 |
Portfolio of Investments – as of September 30, 2011
Loomis Sayles Core Plus Bond Fund – (continued)
| | | | | | | | |
Principal
Amount (‡) | | | Description | | Value (†) | |
| | | | | | | | |
| | | | Wirelines — continued | | | | |
| $ | 2,175,000 | | | Frontier Communications Corp., 7.875%, 4/15/2015 | | $ | 2,180,437 | |
| | 1,575,000 | | | Frontier Communications Corp., 7.875%, 1/15/2027 | | | 1,362,375 | |
| | 450,000 | | | Frontier Communications Corp., 8.250%, 4/15/2017 | | | 436,500 | |
| | 415,000 | | | Frontier Communications Corp., 9.000%, 8/15/2031 | | | 353,788 | |
| | 1,745,000 | | | Qwest Corp., 6.750%, 12/01/2021 | | | 1,705,737 | |
| | 775,000 | | | Qwest Corp., 8.875%, 3/15/2012 | | | 801,156 | |
| | 5,290,000 | | | Windstream Corp., 7.500%, 4/01/2023 | | | 4,932,925 | |
| | 515,000 | | | Windstream Corp., 8.125%, 9/01/2018 | | | 518,863 | |
| | | | | | | | |
| | | | | | | 22,044,525 | |
| | | | | | | | |
| | | | Total Bonds and Notes
(Identified Cost $491,578,694) | | | 504,806,433 | |
| | | | | | | | |
| Shares | | | | | | |
| | Preferred Stocks — 0.3% | | | | |
| | | | Non-Captive Consumer — 0.0% | | | | |
| | 5,510 | | | SLM Corp., Series A, 6.970% | | | 231,916 | |
| | | | | | | | |
| | | | Non-Captive Diversified — 0.3% | | | | |
| | 68,182 | | | Ally Financial, Inc., Series A, (fixed rate to 5/15/2016, variable rate thereafter),
8.500% | | | 1,189,776 | |
| | 532 | | | Ally Financial, Inc., Series G, 7.000%, 144A | | | 319,200 | |
| | | | | | | | |
| | | | | | | 1,508,976 | |
| | | | | | | | |
| | | | Total Preferred Stocks
(Identified Cost $2,068,801) | | | 1,740,892 | |
| | | | | | | | |
Principal
Amount (‡) | | | | | | |
| | Short-Term Investments — 3.5% | | | | |
| $ | 18,140,121 | | | Tri-Party Repurchase Agreement with Fixed Income Clearing Corporation, dated 9/30/2011 at 0.000% to be repurchased at $18,140,121 on 10/03/2011 collateralized by $18,480,000 Federal Home Loan Mortgage Corp., 0.600% due 8/23/2013 valued at $18,503,261 including accrued interest (Note 2 of Notes to Financial Statements) (Identified Cost $18,140,121) | | | 18,140,121 | |
| | | | | | | | |
| | | | | | | | |
| | | | Total Investments — 100.5%
(Identified Cost $511,787,616)(a) | | | 524,687,446 | |
| | | | Other assets less liabilities — (0.5)% | | | (2,784,830 | ) |
| | | | | | | | |
| | | | Net Assets — 100.0% | | $ | 521,902,616 | |
| | | | | | | | |
| | | | | | | | |
| | (‡) | | | Principal amount stated in U.S. dollars unless otherwise noted. | | | | |
| | (†) | | | See Note 2 of Notes to Financial Statements. | | | | |
| | (††) | | | Amount shown represents units. One unit represents a principal amount of 100. | |
See accompanying notes to financial statements.
| 34
Portfolio of Investments – as of September 30, 2011
Loomis Sayles Core Plus Bond Fund – (continued)
| | | | | | | | |
| | (a) | | | Federal Tax Information: | |
| | | | | | | | |
| | | | At September 30, 2011, the net unrealized appreciation on investments based on a cost of $512,605,572 for federal income tax purposes was as follows: | | | | |
| | | | Aggregate gross unrealized appreciation for all investments in which there is an excess of value over tax cost | | $ | 21,061,671 | |
| | | | Aggregate gross unrealized depreciation for all investments in which there is an excess of tax cost over value | | | (8,979,797 | ) |
| | | | | | | | |
| | | | Net unrealized appreciation | | $ | 12,081,874 | |
| | | | | | | | |
| | | | | | | | |
| | (b) | | | Variable rate security. Rate as of September 30, 2011 is disclosed. | | | | |
| | (c) | | | The Fund’s investment in mortgage related securities of Federal Home Loan Mortgage Corporation, Federal National Mortgage Association and Government National Mortgage Association are interests in separate pools of mortgages. All separate investments in securities of each issuer which have the same coupon rate have been aggregated for the purpose of presentation in the Portfolio of Investments. | |
| | (d) | | | All or a portion of this security has been designated to cover the Fund’s obligations under open forward foreign currency contracts. | |
| | | | | |
| | 144A | | | All or a portion of these securities are exempt from registration under Rule 144A of the Securities Act of 1933. These securities may be resold in transactions exempt from registration, normally to qualified institutional buyers. At September 30, 2011, the value of Rule 144A holdings amounted to $62,500,617 or 12.0% of net assets. | |
| | | | | |
| | ABS | | | Asset-Backed Securities | | | | |
| | ARMs | | | Adjustable Rate Mortgages | | | | |
| | FHLMC | | | Federal Home Loan Mortgage Corp. | �� | | | |
| | FNMA | | | Federal National Mortgage Association | | | | |
| | GNMA | | | Government National Mortgage Association | | | | |
| | MTN | | | Medium Term Note | | | | |
| | | | | | | | |
| | MXN | | | Mexican Peso | | | | |
At September 30, 2011, the Fund had the following open forward foreign currency contracts:
| | | | | | | | | | | | | | | | | | |
Contract to Buy/Sell | | Delivery Date | | | Currency | | Units | | | Notional
Value | | | Unrealized Appreciation (Depreciation) | |
| Sell1 | | | 12/21/2011 | | | Euro | | | 20,475,000 | | | $ | 27,422,369 | | | $ | 628,790 | |
| | | | | | | | | | | | | | | | | | |
1 Counterparty is Credit Suisse.
See accompanying notes to financial statements.
35 |
Portfolio of Investments – as of September 30, 2011
Loomis Sayles Core Plus Bond Fund – (continued)
Industry Summary at September 30, 2011 (Unaudited)
| | | | |
| Mortgage Related | | | 17.2 | % |
| Treasuries | | | 15.3 | |
Commercial Mortgage-Backed Securities | | | 11.0 | |
| Sovereigns | | | 4.6 | |
| Wirelines | | | 4.2 | |
| Non-Captive Diversified | | | 4.0 | |
| Banking | | | 3.9 | |
| Wireless | | | 3.1 | |
| Automotive | | | 2.7 | |
| Oil Field Services | | | 2.3 | |
| ABS Car Loan | | | 2.2 | |
| Technology | | | 2.1 | |
| Other Investments, less than 2% each | | | 24.4 | |
| Short-Term Investments | | | 3.5 | |
| | | | |
| Total Investments | | | 100.5 | |
Other assets less liabilities (including open forward foreign currency contracts) | | | (0.5 | ) |
| | | | |
| Net Assets | | | 100.0 | % |
| | | | |
See accompanying notes to financial statements.
| 36
Portfolio of Investments – as of September 30, 2011
Loomis Sayles High Income Fund
| | | | | | | | |
Principal
Amount (‡) | | | Description | | Value (†) | |
| | | | | | | | |
| | Bonds and Notes — 84.6% of Net Assets | |
| | Non-Convertible Bonds — 68.5% | |
| | | | ABS Car Loan — 0.3% | | | | |
| $ | 350,000 | | | DSC Floorplan Master Owner Trust, Series 2011-1, Class B,
8.110%, 3/15/2016, 144A | | $ | 356,359 | |
| | | | | | | | |
| | | | ABS Home Equity — 2.2% | | | | |
| | 200,000 | | | Ameriquest Mortgage Securities, Inc., Series 2005-R11, Class M1,
0.685%, 1/25/2036(b) | | | 118,119 | |
| | 600,000 | | | Ameriquest Mortgage Securities, Inc., Series 2005-R7, Class M2,
0.735%, 9/25/2035(b) | | | 284,213 | |
| | 523,564 | | | Argent Securities, Inc., Series 2003-W3, Class M2, 2.935%, 9/25/2033(b) | | | 351,264 | |
| | 146,779 | | | Countrywide Home Loan Mortgage Pass Through Trust, Series 2005-11, Class 4A1, 0.505%, 4/25/2035(b) | | | 83,274 | |
| | 576,797 | | | GSAA Home Equity Trust, Series 2006-20, Class 1A1, 0.305%, 12/25/2046(b) | | | 241,150 | |
| | 87,200 | | | GSR Mortgage Loan Trust, Series 2004-14, Class 3A1, 3.039%, 12/25/2034(b) | | | 59,699 | |
| | 479,962 | | | MASTR Asset Securitization Trust, Series 2007-1, Class 1A4,
6.500%, 11/25/2037 | | | 397,933 | |
| | 200,000 | | | New Century Home Equity Loan Trust, Series 2005-1, Class M3,
0.755%, 3/25/2035(b) | | | 128,264 | |
| | 300,000 | | | New Century Home Equity Loan Trust, Series 2005-2, Class M2,
0.685%, 6/25/2035(b) | | | 179,032 | |
| | 158,504 | | | New York Mortgage Trust, Series 2006-1, Class 2A2, 2.789%, 5/25/2036(b) | | | 128,829 | |
| | 575,000 | | | Park Place Securities, Inc., Series 2005-WCW2, Class M1,
0.735%, 7/25/2035(b) | | | 339,173 | |
| | 199,738 | | | Saxon Asset Securities Trust, Series 2004-3, Class M2,
0.885%, 12/26/2034(b) | | | 148,154 | |
| | 154,288 | | | WaMu Mortgage Pass Through Certificates, Series 2007-OA3, Class 2A1A,
1.002%, 4/25/2047(b) | | | 102,632 | |
| | | | | | | | |
| | | | | | | 2,561,736 | |
| | | | | | | | |
| | | | Airlines — 0.3% | | | | |
| | 28,291 | | | Continental Airlines Pass Through Trust, Series 1997-4, Class B,
6.900%, 7/02/2018 | | | 27,442 | |
| | 198,446 | | | Continental Airlines Pass Through Trust, Series 2001-1, Class B,
7.373%, 6/15/2017 | | | 194,477 | |
| | 175,149 | | | Continental Airlines Pass Through Trust, Series 2007-1, Class B,
6.903%, 4/19/2022 | | | 162,888 | |
| | | | | | | | |
| | | | | | | 384,807 | |
| | | | | | | | |
| | | | Banking — 3.7% | | | | |
| | 2,210,000,000 | | | Barclays Bank PLC, EMTN, 3.680%, 8/20/2015, (KRW) | | | 1,881,308 | |
| | 12,176,250,000 | | | JPMorgan Chase Bank NA, EMTN, Zero Coupon, 10/17/2011, 144A, (IDR) | | | 1,358,365 | |
| | 900,000 | | | Morgan Stanley, GMTN, 7.625%, 3/03/2016, (AUD) | | | 863,169 | |
| | 200,000 | | | Societe Generale S.A., MTN, 5.200%, 4/15/2021, 144A | | | 173,655 | |
| | | | | | | | |
| | | | | | | 4,276,497 | |
| | | | | | | | |
| | | | Building Materials — 3.0% | | | | |
| | 50,000 | | | Masco Corp., 6.500%, 8/15/2032 | | | 44,284 | |
| | 345,000 | | | Masco Corp., 7.750%, 8/01/2029 | | | 338,424 | |
See accompanying notes to financial statements.
37 |
Portfolio of Investments – as of September 30, 2011
Loomis Sayles High Income Fund – (continued)
| | | | | | | | |
Principal
Amount (‡) | | | Description | | Value (†) | |
| | | | | | | | |
| | | | Building Materials — continued | | | | |
| $ | 845,000 | | | Masonite International Corp., 8.250%, 4/15/2021, 144A | | $ | 762,613 | |
| | 2,955,000 | | | USG Corp., 6.300%, 11/15/2016 | | | 2,164,537 | |
| | 100,000 | | | USG Corp., 8.375%, 10/15/2018, 144A | | | 83,500 | |
| | 75,000 | | | USG Corp., 9.750%, 1/15/2018 | | | 60,281 | |
| | | | | | | | |
| | | | | | | 3,453,639 | |
| | | | | | | | |
| | | | Chemicals — 1.1% | | | | |
| | 1,085,000 | | | Hercules, Inc., 6.500%, 6/30/2029 | | | 802,900 | |
| | 730,000 | | | Reichhold Industries, Inc., 9.000%, 8/15/2014, 144A(c) | | | 496,400 | |
| | | | | | | | |
| | | | | | | 1,299,300 | |
| | | | | | | | |
| | | | Collateralized Mortgage Obligations — 5.0% | | | | |
| | 360,538 | | | Adjustable Rate Mortgage Trust, Series 2005-10, Class 5A1,
0.495%, 1/25/2036(b) | | | 206,600 | |
| | 163,940 | | | American Home Mortgage Investment Trust, Series 2004-3, Class 3A,
2.298%, 10/25/2034(b) | | | 120,251 | |
| | 370,263 | | | American Home Mortgage Investment Trust, Series 2005-2, Class 4A1,
2.037%, 9/25/2045(b) | | | 286,756 | |
| | 403,710 | | | American Home Mortgage Investment Trust, Series 2006-1, Class 11A1,
0.375%, 3/25/2046(b) | | | 240,336 | |
| | 84,393 | | | Banc of America Mortgage Securities, Inc., Series 2005-A, Class 2A1,
2.883%, 2/25/2035(b) | | | 70,729 | |
| | 225,061 | | | Countrywide Alternative Loan Trust, Series 2005-38, Class A3,
0.585%, 9/25/2035(b) | | | 134,133 | |
| | 325,218 | | | GSR Mortgage Loan Trust, Series 2005-AR7, Class 2A1, 2.740%, 11/25/2035(b) | | | 285,871 | |
| | 640,720 | | | Indymac Index Mortgage Loan Trust, Series 2005-AR14, Class 2A1A,
0.535%, 7/25/2035(b) | | | 390,189 | |
| | 191,694 | | | Indymac Index Mortgage Loan Trust, Series 2005-AR3, Class 4A1,
4.730%, 4/25/2035(b) | | | 139,029 | |
| | 335,882 | | | Indymac Index Mortgage Loan Trust, Series 2005-AR35, Class 1A1,
5.433%, 2/25/2036(b) | | | 215,313 | |
| | 601,400 | | | Lehman Mortgage Trust, Series 2005-3, Class 1A6, 0.735%, 1/25/2036(b) | | | 343,675 | |
| | 647,266 | | | Lehman XS Trust, Series 2007-10H, Class 1A11, 0.355%, 7/25/2037(b)(d) | | | 257,100 | |
| | 536,606 | | | Luminent Mortgage Pass Through Trust, Series 2006-6, Class A1,
0.435%, 10/25/2046(b) | | | 325,353 | |
| | 407,383 | | | MASTR Adjustable Rate Mortgages Trust, Series 2005-2, Class 3A1,
2.612%, 3/25/2035(b) | | | 252,603 | |
| | 279,409 | | | MASTR Adjustable Rate Mortgages Trust, Series 2005-2, Class 5A1,
2.612%, 3/25/2035(b) | | | 232,803 | |
| | 699,913 | | | MASTR Adjustable Rate Mortgages Trust, Series 2007-1, Class I2A1,
0.395%, 1/25/2047(b) | | | 378,914 | |
| | 671,186 | | | Merrill Lynch Alternative Note Asset, Series 2007-F1, Class 2A7,
6.000%, 3/25/2037 | | | 418,039 | |
| | 694,767 | | | Residential Accredit Loans, Inc., Series 2006-QO7, Class 1A1,
1.042%, 9/25/2046(b) | | | 282,494 | |
| | 633,946 | | | Residential Accredit Loans, Inc., Series 2006-QS6, Class 1A16,
6.000%, 6/25/2036 | | | 399,389 | |
| | 282,975 | | | Sequoia Mortgage Trust, Series 2007-2, Class 1A1, 0.441%, 6/20/2036(b) | | | 196,167 | |
See accompanying notes to financial statements.
| 38
Portfolio of Investments – as of September 30, 2011
Loomis Sayles High Income Fund – (continued)
| | | | | | | | |
Principal
Amount (‡) | | | Description | | Value (†) | |
| | | | | | | | |
| | | | Collateralized Mortgage Obligations — continued | | | | |
| $ | 497,519 | | | Washington Mutual Alternative Mortgage Pass-Through Certificates, Series 2006-AR6, Class 2A, 1.202%, 8/25/2046(b) | | $ | 224,663 | |
| | 689,135 | | | Washington Mutual Alternative Mortgage Pass-Through Certificates, Series 2007-OC1, Class A1, 0.475%, 1/25/2047(b) | | | 252,797 | |
| | | | | | | | |
| | | | | | | 5,653,204 | |
| | | | | | | | |
| | | | Commercial Mortgage-Backed Securities — 1.5% | | | | |
| | 537,887 | | | GMAC Mortgage Corp. Loan Trust, Series 2005-AR3, Class 2A1,
2.867%, 6/19/2035(b) | | | 454,334 | |
| | 1,690,000 | | | GS Mortgage Securities Trust, Series 2007-GG10, Class AM,
5.790%, 8/10/2045(b) | | | 1,229,697 | |
| | | | | | | | |
| | | | | | | 1,684,031 | |
| | | | | | | | |
| | | | Consumer Cyclical Services — 0.7% | | | | |
| | 1,035,000 | | | ServiceMaster Co. (The), 7.450%, 8/15/2027 | | | 843,525 | |
| | | | | | | | |
| | | | Consumer Products — 0.2% | | | | |
| | 275,000 | | | Visant Corp., 10.000%, 10/01/2017 | | | 254,375 | |
| | | | | | | | |
| | | | Electric — 2.2% | | | | |
| | 20,078 | | | AES Red Oak LLC, Series A, 8.540%, 11/30/2019 | | | 20,580 | |
| | 375,000 | | | Dynegy Holdings, Inc., 7.125%, 5/15/2018 | | | 219,375 | |
| | 180,000 | | | Dynegy Holdings, Inc., 7.625%, 10/15/2026 | | | 100,800 | |
| | 815,000 | | | Dynegy Holdings, Inc., 7.750%, 6/01/2019 | | | 493,075 | |
| | 1,055,000 | | | Edison Mission Energy, 7.625%, 5/15/2027 | | | 580,250 | |
| | 140,000 | | | NGC Corp. Capital Trust I, Series B, 8.316%, 6/01/2027(c)(e) | | | 50,400 | |
| | 515,000 | | | Texas Competitive Electric Holdings Co. LLC/TCEH Finance, Inc.,
11.500%, 10/01/2020, 144A | | | 412,000 | |
| | 195,000 | | | TXU Corp., Series P, 5.550%, 11/15/2014 | | | 119,925 | |
| | 1,015,000 | | | TXU Corp., Series Q, 6.500%, 11/15/2024 | | | 385,700 | |
| | 370,000 | | | TXU Corp., Series R, 6.550%, 11/15/2034 | | | 136,900 | |
| | | | | | | | |
| | | | | | | 2,519,005 | |
| | | | | | | | |
| | | | Food & Beverage — 0.6% | | | | |
| | 400,000 | | | Marfrig Holding Europe BV, 8.375%, 5/09/2018, 144A | | | 252,000 | |
| | 700,000 | | | Marfrig Overseas Ltd., 9.500%, 5/04/2020, 144A | | | 448,000 | |
| | | | | | | | |
| | | | | | | 700,000 | |
| | | | | | | | |
| | | | Gaming — 1.1% | | | | |
| | 2,045,000 | | | Caesars Entertainment Operating Co., Inc., 10.000%, 12/15/2018 | | | 1,216,775 | |
| | | | | | | | |
| | | | Government Owned — No Guarantee — 1.2% | | | | |
| | 900,000 | | | DP World Ltd., 6.850%, 7/02/2037, 144A | | | 819,000 | |
| | 4,800,000,000 | | | Export-Import Bank of Korea, 6.600%, 11/04/2013, 144A, (IDR) | | | 510,908 | |
| | | | | | | | |
| | | | | | | 1,329,908 | |
| | | | | | | | |
| | | | Healthcare — 3.4% | | | | |
| | 1,185,000 | | | CDRT Merger Sub, Inc., 8.125%, 6/01/2019, 144A | | | 1,096,125 | |
| | 35,000 | | | HCA, Inc., 7.050%, 12/01/2027 | | | 29,225 | |
| | 630,000 | | | HCA, Inc., 7.500%, 12/15/2023 | | | 567,000 | |
| | 465,000 | | | HCA, Inc., 7.690%, 6/15/2025 | | | 418,500 | |
| | 480,000 | | | HCA, Inc., 8.360%, 4/15/2024 | | | 459,600 | |
See accompanying notes to financial statements.
39 |
Portfolio of Investments – as of September 30, 2011
Loomis Sayles High Income Fund – (continued)
| | | | | | | | |
Principal
Amount (‡) | | | Description | | Value (†) | |
| | | | | | | | |
| | | | Healthcare — continued | | | | |
| $ | 750,000 | | | HCA, Inc., MTN, 7.580%, 9/15/2025 | | $ | 671,250 | |
| | 345,000 | | | HCA, Inc., MTN, 7.750%, 7/15/2036 | | | 298,425 | |
| | 425,000 | | | Kindred Healthcare, Inc., 8.250%, 6/01/2019, 144A | | | 324,594 | |
| | | | | | | | |
| | | | | | | 3,864,719 | |
| | | | | | | | |
| | | | Home Construction — 5.8% | | | | |
| | 305,000 | | | K. Hovnanian Enterprises, Inc., 10.625%, 10/15/2016 | | | 228,750 | |
| | 2,580,000 | | | KB Home, 7.250%, 6/15/2018 | | | 2,025,300 | |
| | 1,850,000 | | | Lennar Corp., 6.950%, 6/01/2018 | | | 1,646,500 | |
| | 3,135,000 | | | Pulte Group, Inc., 6.000%, 2/15/2035 | | | 2,100,450 | |
| | 495,000 | | | Pulte Group, Inc., 6.375%, 5/15/2033 | | | 344,025 | |
| | 380,000 | | | Pulte Group, Inc., 7.875%, 6/15/2032 | | | 304,000 | |
| | | | | | | | |
| | | | | | | 6,649,025 | |
| | | | | | | | |
| | | | Hybrid ARMs — 0.2% | | | | |
| | 414,610 | | | Countrywide Home Loan Mortgage Pass Through Trust, Series 2005-11, Class 3A3, 3.030%, 4/25/2035(b) | | | 183,368 | |
| | | | | | | | |
| | | | Independent Energy — 0.5% | | | | |
| | 785,000 | | | Connacher Oil and Gas Ltd., 8.500%, 8/01/2019, 144A | | | 604,450 | |
| | | | | | | | |
| | | | Life Insurance — 0.7% | | | | |
| | 860,000 | | | American International Group, Inc., (fixed rate to 5/15/2038, variable rate thereafter), 8.175%, 5/15/2068 | | | 758,950 | |
| | | | | | | | |
| | | | Lodging — 0.2% | | | | |
| | 180,000 | | | Royal Caribbean Cruises Ltd., 7.500%, 10/15/2027 | | | 169,200 | |
| | | | | | | | |
| | | | Media Non-Cable — 0.6% | | | | |
| | 180,000 | | | Clear Channel Communications, Inc., 5.750%, 1/15/2013 | | | 160,200 | |
| | 645,000 | | | Intelsat S.A., 11.250%, 2/04/2017 | | | 559,537 | |
| | | | | | | | |
| | | | | | | 719,737 | |
| | | | | | | | |
| | | | Metals & Mining — 0.7% | | | | |
| | 780,000 | | | Algoma Acquisition Corp., 9.875%, 6/15/2015, 144A | | | 604,500 | |
| | 35,000 | | | Essar Steel Algoma, Inc., 9.375%, 3/15/2015, 144A | | | 30,975 | |
| | 190,000 | | | United States Steel Corp., 6.650%, 6/01/2037 | | | 146,300 | |
| | | | | | | | |
| | | | | | | 781,775 | |
| | | | | | | | |
| | | | Non-Captive Consumer — 3.5% | | | | |
| | 1,290,000 | | | Residential Capital LLC, 9.625%, 5/15/2015 | | | 999,750 | |
| | 715,000 | | | SLM Corp., Series A, MTN, 5.625%, 8/01/2033 | | | 569,351 | |
| | 1,920,000 | | | Springleaf Finance Corp., MTN, 5.750%, 9/15/2016 | | | 1,401,600 | |
| | 1,400,000 | | | Springleaf Finance Corp., Series J, MTN, 6.900%, 12/15/2017 | | | 1,008,000 | |
| | | | | | | | |
| | | | | | | 3,978,701 | |
| | | | | | | | |
| | | | Non-Captive Diversified — 0.1% | | | | |
| | 80,000 | | | iStar Financial, Inc., 5.850%, 3/15/2017 | | | 61,600 | |
| | 10,000 | | | iStar Financial, Inc., 5.875%, 3/15/2016 | | | 7,900 | |
| | 15,000 | | | iStar Financial, Inc., Series B, 5.950%, 10/15/2013 | | | 13,013 | |
| | | | | | | | |
| | | | | | | 82,513 | |
| | | | | | | | |
See accompanying notes to financial statements.
| 40
Portfolio of Investments – as of September 30, 2011
Loomis Sayles High Income Fund – (continued)
| | | | | | | | |
Principal
Amount (‡) | | | Description | | Value (†) | |
| | | | | | | | |
| | | | Oil Field Services — 0.2% | | | | |
| $ | 200,000 | | | OGX Petroleo e Gas Participacoes S.A., 8.500%, 6/01/2018, 144A | | $ | 179,000 | |
| | | | | | | | |
| | | | Packaging — 0.2% | | | | |
| | 300,000 | | | Reynolds Group Issuer, Inc./Reynolds Group Issuer LLC/Reynolds Group Issuer (Luxembourg) S.A., 8.250%, 2/15/2021, 144A | | | 237,000 | |
| | | | | | | | |
| | | | Refining — 0.5% | | | | |
| | 745,000 | | | Petroplus Finance Ltd., 7.000%, 5/01/2017, 144A | | | 603,450 | |
| | | | | | | | |
| | | | Retailers — 1.4% | | | | |
| | 385,000 | | | Dillard’s, Inc., 7.750%, 7/15/2026 | | | 365,750 | |
| | 205,000 | | | Dillard’s, Inc., 7.750%, 5/15/2027 | | | 189,625 | |
| | 1,285,000 | | | Toys R Us, Inc., 7.375%, 10/15/2018 | | | 1,092,250 | |
| | | | | | | | |
| | | | | | | 1,647,625 | |
| | | | | | | | |
| | | | Sovereigns — 3.2% | | | | |
| | 301,500(††) | | | Mexican Fixed Rate Bonds, Series M-20, 8.000%, 12/07/2023, (MXN) | | | 2,406,371 | |
| | 2,250,000 | | | Republic of Brazil, 10.250%, 1/10/2028, (BRL) | | | 1,256,482 | |
| | | | | | | | |
| | | | | | | 3,662,853 | |
| | | | | | | | |
| | | | Supermarkets — 1.4% | | | | |
| | 315,000 | | | American Stores Co., 8.000%, 6/01/2026 | | | 267,750 | |
| | 955,000 | | | New Albertson’s, Inc., 7.750%, 6/15/2026 | | | 783,100 | |
| | 735,000 | | | New Albertson’s, Inc., Series C, MTN, 6.625%, 6/01/2028 | | | 510,825 | |
| | | | | | | | |
| | | | | | | 1,561,675 | |
| | | | | | | | |
| | | | Supranational — 3.2% | | | | |
| | 2,000,000 | | | European Bank for Reconstruction & Development, GMTN,
9.250%, 9/10/2012, (BRL) | | | 1,077,835 | |
| | 24,630,000,000 | | | Inter-American Development Bank, EMTN, Zero Coupon, 8/20/2015, (IDR) | | | 1,983,850 | |
| | 700,000,000 | | | International Bank for Reconstruction & Development, EMTN,
2.300%, 2/26/2013, (KRW) | | | 604,423 | |
| | | | | | | | |
| | | | | | | 3,666,108 | |
| | | | | | | | |
| | | | Technology — 3.1% | | | | |
| | 1,090,000 | | | Alcatel-Lucent USA, Inc., 6.450%, 3/15/2029 | | | 904,700 | |
| | 1,930,000 | | | Alcatel-Lucent USA, Inc., 6.500%, 1/15/2028 | | | 1,601,900 | |
| | 1,040,000 | | | First Data Corp., 8.250%, 1/15/2021, 144A | | | 821,600 | |
| | 225,000 | | | Syniverse Holdings, Inc., 9.125%, 1/15/2019 | | | 220,500 | |
| | | | | | | | |
| | | | | | | 3,548,700 | |
| | | | | | | | |
| | | | Textile — 1.6% | | | | |
| | 2,550,000 | | | Jones Apparel Group, Inc., 6.125%, 11/15/2034 | | | 1,797,750 | |
| | | | | | | | |
| | | | Transportation Services — 0.5% | | | | |
| | 275,000 | | | APL Ltd., 8.000%, 1/15/2024(c) | | | 176,000 | |
| | 640,000 | | | Overseas Shipholding Group, 7.500%, 2/15/2024 | | | 427,200 | |
| | | | | | | | |
| | | | | | | 603,200 | |
| | | | | | | | |
| | | | Treasuries — 7.1% | | | | |
| | 2,380,000 | | | Canadian Government Bond, 1.750%, 3/01/2013, (CAD)(f) | | | 2,299,281 | |
| | 60,199 | | | Hellenic Republic Government Bond, 2.300%, 7/25/2030, (EUR) | | | 23,881 | |
| | 55,000 | | | Hellenic Republic Government Bond, 4.500%, 9/20/2037, (EUR) | | | 22,997 | |
See accompanying notes to financial statements.
41 |
Portfolio of Investments – as of September 30, 2011
Loomis Sayles High Income Fund – (continued)
| | | | | | | | |
Principal
Amount (‡) | | | Description | | Value (†) | |
| | | | | | | | |
| | | | Treasuries — continued | | | | |
| | 50,000 | | | Hellenic Republic Government Bond, 4.600%, 7/20/2018, (EUR) | | $ | 27,508 | |
| | 2,240,000 | | | Hellenic Republic Government Bond, 4.700%, 3/20/2024, (EUR) | | | 945,628 | |
| | 150,000 | | | Ireland Government Bond, 4.500%, 10/18/2018, (EUR) | | | 169,737 | |
| | 375,000 | | | Ireland Government Bond, 4.500%, 4/18/2020, (EUR) | | | 413,536 | |
| | 930,000 | | | Ireland Government Bond, 5.400%, 3/13/2025, (EUR) | | | 1,031,661 | |
| | 10,000,000 | | | Philippine Government International Bond, 4.950%, 1/15/2021, (PHP) | | | 218,982 | |
| | 120,000,000 | | | Philippine Government International Bond, 6.250%, 1/14/2036, (PHP) | | | 2,598,422 | |
| | 50,000 | | | Portugal Obrigacoes do Tesouro OT, 3.850%, 4/15/2021, (EUR) | | | 38,739 | |
| | 400,000 | | | Portugal Obrigacoes do Tesouro OT, 4.950%, 10/25/2023, (EUR) | | | 316,181 | |
| | | | | | | | |
| | | | | | | 8,106,553 | |
| | | | | | | | |
| | | | Wireless — 3.6% | | | | |
| | 1,595,000 | | | Clearwire Communications LLC/Clearwire Finance Inc.,
12.000%, 12/01/2015, 144A | | | 1,351,762 | |
| | 3,736,000 | | | Sprint Capital Corp., 6.875%, 11/15/2028 | | | 2,792,660 | |
| | 20,000 | | | Sprint Capital Corp., 8.750%, 3/15/2032 | | | 17,375 | |
| | | | | | | | |
| | | | | | | 4,161,797 | |
| | | | | | | | |
| | | | Wirelines — 3.7% | | | | |
| | 120,000 | | | Axtel SAB de CV, 9.000%, 9/22/2019, 144A | | | 100,800 | |
| | 900,000 | | | Bakrie Telecom Pte Ltd., 11.500%, 5/07/2015, 144A | | | 567,000 | |
| | 130,000 | | | Cincinnati Bell Telephone Co. LLC, 6.300%, 12/01/2028 | | | 98,150 | |
| | 665,000 | | | Cincinnati Bell, Inc., 8.750%, 3/15/2018 | | | 590,187 | |
| | 605,000 | | | Frontier Communications Corp., 9.000%, 8/15/2031 | | | 515,763 | |
| | 1,910,000 | | | Level 3 Financing, Inc., 8.750%, 2/15/2017 | | | 1,759,587 | |
| | 320,000 | | | Level 3 Financing, Inc., 9.250%, 11/01/2014 | | | 316,000 | |
| | 50,000 | | | Portugal Telecom International Finance BV, EMTN, 4.500%, 6/16/2025, (EUR) | | | 43,542 | |
| | 250,000 | | | Portugal Telecom International Finance BV, EMTN, 5.000%, 11/04/2019, (EUR) | | | 249,528 | |
| | 25,000 | | | Telecom Italia Capital S.A., 6.000%, 9/30/2034 | | | 20,452 | |
| | 15,000 | | | Telecom Italia Capital S.A., 6.375%, 11/15/2033 | | | 12,833 | |
| | | | | | | | |
| | | | | | | 4,273,842 | |
| | | | | | | | |
| | | | Total Non-Convertible Bonds
(Identified Cost $86,720,296) | | | 78,375,152 | |
| | | | | | | | |
| | | | | | | | |
| | Convertible Bonds — 16.1% | |
| | | | Airlines — 0.1% | | | | |
| | 125,000 | | | AMR Corp., 6.250%, 10/15/2014 | | | 73,906 | |
| | | | | | | | |
| | | | Automotive — 2.7% | | | | |
| | 1,165,000 | | | ArvinMeritor, Inc., (Step to Zero Coupon on 2/15/2019), 4.000%, 2/15/2027(g) | | | 793,656 | |
| | 1,760,000 | | | Ford Motor Co., 4.250%, 11/15/2016 | | | 2,285,800 | |
| | | | | | | | |
| | | | | | | 3,079,456 | |
| | | | | | | | |
| | | | Diversified Manufacturing — 2.0% | | | | |
| | 1,230,000 | | | Owens-Brockway Glass Container, Inc., 3.000%, 6/01/2015, 144A | | | 1,107,000 | |
| | 1,325,000 | | | Trinity Industries, Inc., 3.875%, 6/01/2036 | | | 1,190,844 | |
| | | | | | | | |
| | | | | | | 2,297,844 | |
| | | | | | | | |
See accompanying notes to financial statements.
| 42
Portfolio of Investments – as of September 30, 2011
Loomis Sayles High Income Fund – (continued)
| | | | | | | | |
Principal
Amount (‡) | | | Description | | Value (†) | |
| | | | | | | | |
| | | | Healthcare — 1.8% | | | | |
| $ | 1,560,000 | | | Hologic, Inc., 2.000% (accretes to principal after 12/15/2013), 12/15/2037(g) | | $ | 1,460,550 | |
| | 35,000 | | | Hologic, Inc., 2.000% (accretes to principal after 12/15/2016), 12/15/2037(g) | | | 36,181 | |
| | 515,000 | | | Omnicare, Inc., 3.750%, 12/15/2025 | | | 576,157 | |
| | | | | | | | |
| | | | | | | 2,072,888 | |
| | | | | | | | |
| | | | Home Construction — 0.1% | | | | |
| | 70,000 | | | Lennar Corp., 2.000%, 12/01/2020, 144A | | | 65,625 | |
| | | | | | | | |
| | | | Independent Energy — 1.1% | | | | |
| | 1,300,000 | | | Chesapeake Energy Corp., 2.500%, 5/15/2037 | | | 1,238,250 | |
| | | | | | | | |
| | | | Metals & Mining — 0.3% | | | | |
| | 210,000 | | | Peabody Energy Corp., 4.750%, 12/15/2066 | | | 217,350 | |
| | 165,000 | | | Steel Dynamics, Inc., 5.125%, 6/15/2014 | | | 169,744 | |
| | | | | | | | |
| | | | | | | 387,094 | |
| | | | | | | | |
| | | | Pharmaceuticals — 0.9% | | | | |
| | 895,000 | | | Vertex Pharmaceuticals, Inc., 3.350%, 10/01/2015 | | | 1,027,013 | |
| | | | | | | | |
| | | | Technology — 7.0% | | | | |
| | 15,000 | | | Ciena Corp., 0.250%, 5/01/2013 | | | 14,306 | |
| | 4,155,000 | | | Ciena Corp., 0.875%, 6/15/2017 | | | 3,033,150 | |
| | 145,000 | | | Ciena Corp., 3.750%, 10/15/2018, 144A | | | 128,506 | |
| | 40,000 | | | Ciena Corp., 4.000%, 3/15/2015, 144A | | | 38,350 | |
| | 3,925,000 | | | Intel Corp., 2.950%, 12/15/2035 | | | 3,978,969 | |
| | 595,000 | | | Micron Technology, Inc., 1.875%, 6/01/2014 | | | 555,581 | |
| | 225,000 | | | Micron Technology, Inc., Series B, 1.875%, 8/01/2031, 144A | | | 172,125 | |
| | 80,000 | | | SanDisk Corp., 1.500%, 8/15/2017 | | | 83,500 | |
| | | | | | | | |
| | | | | | | 8,004,487 | |
| | | | | | | | |
| | | | Textile — 0.1% | | | | |
| | 150,000 | | | Iconix Brand Group, Inc., 2.500%, 6/01/2016, 144A | | | 139,875 | |
| | | | | | | | |
| | | | Total Convertible Bonds
(Identified Cost $18,267,574) | | | 18,386,438 | |
| | | | | | | | |
| | | | Total Bonds and Notes
(Identified Cost $104,987,870) | | | 96,761,590 | |
| | | | | | | | |
| | | | | | | | |
| | Senior Loans — 0.7% | |
| | | | Media Non-Cable — 0.2% | | | | |
| | 343,538 | | | SuperMedia, Inc., Exit Term Loan, 11.000%, 12/31/2015(b) | | | 149,954 | |
| | 224,012 | | | Tribune Company, Term Loan X, 5.000%, 6/04/2009(b)(h)(i) | | | 116,067 | |
| | | | | | | | |
| | | | | | | 266,021 | |
| | | | | | | | |
| | | | Wireless — 0.0% | | | | |
| | 17,815 | | | Hawaiian Telcom Communications, Inc., Exit Term Loan,
9.000%, 11/01/2015(b)(j) | | | 17,743 | |
| | | | | | | | |
| | | | Wirelines — 0.5% | | | | |
| | 370,146 | | | FairPoint Communications, Inc., New Term Loan B, 6.500%, 1/22/2016(b) | | | 290,565 | |
See accompanying notes to financial statements.
43 |
Portfolio of Investments – as of September 30, 2011
Loomis Sayles High Income Fund – (continued)
| | | | | | | | |
Principal
Amount (‡) | | | Description | | Value (†) | |
| | | | | | | | |
| | | | Wirelines — continued | | | | |
| $ | 250,000 | | | Level 3 Financing, Inc., Add on Term Loan, 11.500%, 3/13/2014(b) | | $ | 260,000 | |
| | | | | | | | |
| | | | | | | 550,565 | |
| | | | | | | | |
| | | | Total Senior Loans
(Identified Cost $1,314,727) | | | 834,329 | |
| | | | | | | | |
| | | | | | | | |
| Shares | | | | | | |
| | Preferred Stocks — 5.5% | |
| | Convertible Preferred Stocks — 4.3% | |
| | | | Automotive — 1.3% | | | | |
| | 41,200 | | | General Motors Co., Series B, 4.750% | | | 1,445,296 | |
| | 1,000 | | | Goodyear Tire & Rubber Co. (The), 5.875% | | | 38,950 | |
| | | | | | | | |
| | | | | | | 1,484,246 | |
| | | | | | | | |
| | | | Banking — 0.0% | | | | |
| | 25 | | | Bank of America Corp., Series L, 7.250% | | | 19,150 | |
| | | | | | | | |
| | | | Construction Machinery — 0.1% | | | | |
| | 3,500 | | | United Rentals Trust I, 6.500% | | | 140,000 | |
| | | | | | | | |
| | | | Consumer Products — 2.1% | | | | |
| | 55,115 | | | Newell Financial Trust I, 5.250% | | | 2,314,830 | |
| | | | | | | | |
| | | | Pipelines — 0.8% | | | | |
| | 20,675 | | | El Paso Energy Capital Trust I, 4.750% | | | 924,586 | |
| | | | | | | | |
| | | | Total Convertible Preferred Stocks
(Identified Cost $5,263,316) | | | 4,882,812 | |
| | | | | | | | |
| | | | | | | | |
| | Non-Convertible Preferred Stock — 1.2% | |
| | | | Non-Captive Diversified — 1.2% | | | | |
| | 78,785 | | | Ally Financial, Inc., Series A, (fixed rate to 5/15/2016, variable rate thereafter),
8.500%
(Identified Cost $2,043,470) | | | 1,374,798 | |
| | | | | | | | |
| | | | Total Preferred Stocks
(Identified Cost $7,306,786) | | | 6,257,610 | |
| | | | | | | | |
| | | | | | | | |
| | Common Stocks — 2.8% | |
| | | | Automobiles — 0.5% | | | | |
| | 53,720 | | | Ford Motor Co.(e) | | | 519,472 | |
| | | | | | | | |
| | | | Chemicals — 0.0% | | | | |
| | 1,087 | | | Ashland, Inc. | | | 47,980 | |
| | | | | | | | |
| | | | Diversified Telecommunication Services — 0.1% | | | | |
| | 14,623 | | | FairPoint Communications, Inc.(e) | | | 62,879 | |
| | 593 | | | Hawaiian Telcom Holdco, Inc.(e) | | | 8,266 | |
| | | | | | | | |
| | | | | | | 71,145 | |
| | | | | | | | |
| | | | Household Durables — 0.2% | | | | |
| | 46,500 | | | KB Home | | | 272,490 | |
| | | | | | | | |
See accompanying notes to financial statements.
| 44
Portfolio of Investments – as of September 30, 2011
Loomis Sayles High Income Fund – (continued)
| | | | | | | | |
| Shares | | | Description | | Value (†) | |
| | | | | | | | |
| | | | Media — 0.0% | | | | |
| | 388 | | | Dex One Corp.(e) | | $ | 218 | |
| | 1,835 | | | SuperMedia, Inc.(e) | | | 2,844 | |
| | | | | | | | |
| | | | | | | 3,062 | |
| | | | | | | | |
| | | | Oil, Gas & Consumable Fuels — 0.5% | | | | |
| | 35,176 | | | El Paso Corp. | | | 614,877 | |
| | | | | | | | |
| | | | Pharmaceuticals — 1.5% | | | | |
| | 6,875 | | | Merck & Co., Inc. | | | 224,881 | |
| | 39,928 | | | Valeant Pharmaceuticals International, Inc. | | | 1,482,128 | |
| | | | | | | | |
| | | | | | | 1,707,009 | |
| | | | | | | | |
| | | | Total Common Stocks
(Identified Cost $3,156,125) | | | 3,236,035 | |
| | | | | | | | |
| | | | | | | | |
| | Warrants — 0.0% | |
| | 10,023 | | | FairPoint Communications, Inc., Expiration on 1/24/2018(c)(e)(k)
(Identified Cost $0) | | | — | |
| | | | | | | | |
| | | | | | | | |
Principal
Amount (‡) | | | | | | |
| | Short-Term Investments — 3.4% | |
| $ | 15,673 | | | Repurchase Agreement with State Street Bank and Trust Company, dated 9/30/2011 at 0.000% to be repurchased at $15,673 on 10/03/2011 collateralized by $20,000 U.S. Treasury Note, 1.375% due 5/15/2013 valued at $20,459 including accrued interest (Note 2 of Notes to Financial Statements) | | | 15,673 | |
| | 3,865,789 | | | Tri-Party Repurchase Agreement with Fixed Income Clearing Corporation, dated 9/30/2011, at 0.000% to be repurchased at $3,865,789 on 10/03/2011 collateralized by $3,830,000 U.S. Treasury Note, 1.500% due 12/31/2013 valued at $3,944,900 including accrued interest (Note 2 of Notes to Financial Statements) | | | 3,865,789 | |
| | | | | | | | |
| | | | Total Short-Term Investments
(Identified Cost $3,881,462) | | | 3,881,462 | |
| | | | | | | | |
| | | | | | | | |
| | | | Total Investments — 97.0%
(Identified Cost $120,646,970)(a) | | | 110,971,026 | |
| | | | Other assets less liabilities — 3.0% | | | 3,474,283 | |
| | | | | | | | |
| | | | Net Assets — 100.0% | | $ | 114,445,309 | |
| | | | | | | | |
| | (‡) | | | Principal amount stated in U.S. dollars unless otherwise noted. | | | | |
| | (†) | | | See Note 2 of Notes to Financial Statements. | | | | |
| | (††) | | | Amount shown represents units. One unit represents a principal amount of 100. | |
| | (a) | | | Federal Tax Information: | | | | |
| | | | At September 30, 2011, the net unrealized depreciation on investments based on a cost of $121,320,283 for federal income tax purposes was as follows: | |
| | | | Aggregate gross unrealized appreciation for all investments in which there is an excess of value over tax cost | | $ | 5,075,414 | |
| | | | Aggregate gross unrealized depreciation for all investments in which there is an excess of tax cost over value | | | (15,424,671 | ) |
| | | | | | | | |
| | | | Net unrealized depreciation | | $ | (10,349,257 | ) |
| | | | | | | | |
See accompanying notes to financial statements.
45 |
Portfolio of Investments – as of September 30, 2011
Loomis Sayles High Income Fund – (continued)
| | | | | | |
| | | | | | |
| | (b) | | | Variable rate security. Rate as of September 30, 2011 is disclosed. | | |
| | (c) | | | Illiquid security. At September 30, 2011, the value of these securities amounted to $722,800 or 0.6% of net assets. | | |
| | (d) | | | The issuer has made partial payment with respect to interest and/or principal. Income is not being accrued. | | |
| | (e) | | | Non-income producing security. | | |
| | (f) | | | All or a portion of this security has been designated to cover the Fund’s obligations under open forward foreign currency contracts. | | |
| | (g) | | | Coupon rate is a fixed rate for an initial period then resets at a specified date and rate. | | |
| | (h) | | | The issuer is in default with respect to interest and/or principal payments. Income is not being accrued. | | |
| | (i) | | | Issuer has filed for bankruptcy. | | |
| | (j) | | | All or a portion of interest payment is paid-in-kind. | | |
| | (k) | | | Fair valued security by the Fund’s investment adviser. At September 30, 2011, the value of this security amounted to $0. | | |
| | | | | | |
| | 144A | | | All or a portion of these securities are exempt from registration under Rule 144A of the Securities Act of 1933. These securities may be resold in transactions exempt from registration, normally to qualified institutional buyers. At September 30, 2011, the value of Rule 144A holdings amounted to $13,845,537 or 12.1% of net assets. | | |
| | ABS | | | Asset-Backed Securities | | |
| | ARMs | | | Adjustable Rate Mortgages | | |
| | EMTN | | | Euro Medium Term Note | | |
| | GMTN | | | Global Medium Term Note | | |
| | MTN | | | Medium Term Note | | |
| | | | | | |
| | AUD | | | Australian Dollar | | |
| | BRL | | | Brazilian Real | | |
| | CAD | | | Canadian Dollar | | |
| | EUR | | | Euro | | |
| | IDR | | | Indonesian Rupiah | | |
| | KRW | | | South Korean Won | | |
| | MXN | | | Mexican Peso | | |
| | PHP | | | Philippine Peso | | |
At September 30, 2011, the Fund had the following open forward foreign currency contracts:
| | | | | | | | | | | | | | | | | | |
Contract to Buy/Sell1 | | Delivery Date | | | Currency | | Units | | | Notional
Value | | | Unrealized Appreciation (Depreciation) | |
| Buy | | | 10/31/2011 | | | Euro | | | 300,000 | | | $ | 401,844 | | | $ | (11,340 | ) |
| Sell | | | 10/31/2011 | | | Euro | | | 2,670,000 | | | | 3,576,411 | | | | 243,595 | |
| | | | | | | | | | | | | | | | | | |
| Total | | | | | | | | | | | | | | | | $ | 232,255 | |
| | | | | | | | | | | | | | | | | | |
1 Counterparty is Barclays.
See accompanying notes to financial statements.
| 46
Portfolio of Investments – as of September 30, 2011
Loomis Sayles High Income Fund – (continued)
Industry Summary at September 30, 2011 (Unaudited)
| | | | |
Technology | | | 10.1 | % |
Treasuries | | | 7.1 | |
Home Construction | | | 5.9 | |
Healthcare | | | 5.2 | |
Collateralized Mortgage Obligations | | | 5.0 | |
Wirelines | | | 4.2 | |
Automotive | | | 4.0 | |
Banking | | | 3.7 | |
Wireless | | | 3.6 | |
Non-Captive Consumer | | | 3.5 | |
Supranational | | | 3.2 | |
Sovereigns | | | 3.2 | |
Building Materials | | | 3.0 | |
Pharmaceuticals | | | 2.4 | |
Consumer Products | | | 2.3 | |
ABS Home Equity | | | 2.2 | |
Electric | | | 2.2 | |
Diversified Manufacturing | | | 2.0 | |
Other Investments, less than 2% each | | | 20.8 | |
Short-Term Investments | | | 3.4 | |
| | | | |
Total Investments | | | 97.0 | |
Other assets less liabilities (including open forward foreign currency contracts) | | | 3.0 | |
| | | | |
Net Assets | | | 100.0 | % |
| | | | |
See accompanying notes to financial statements.
47 |
Portfolio of Investments – as of September 30, 2011
Loomis Sayles International Bond Fund
| | | | | | | | |
Principal
Amount (‡) | | | Description | | Value (†) | |
| | | | | | | | |
| | Bonds and Notes — 97.0% of Net Assets | |
| | Non-Convertible Bonds – 96.8% | |
| | | | Argentina — 0.4% | | | | |
| $ | 138,314 | | | Argentina Government International Bond, 8.280%, 12/31/2033 | | $ | 94,745 | |
| | | | | | | | |
| | | | Brazil — 0.5% | | | | |
| | 100,000 | | | Telemar Norte Leste S.A., 5.125%, 12/15/2017, 144A, (EUR) | | | 126,338 | |
| | | | | | | | |
| | | | Canada — 7.3% | | | | |
| | 225,000 | | | Bell Canada, Series M-17, 6.100%, 3/16/2035, (CAD) | | | 227,817 | |
| | 165,000 | | | Corus Entertainment, Inc., 7.250%, 2/10/2017, 144A, (CAD) | | | 160,607 | |
| | 200,000 | | | Province of Ontario, EMTN, 4.000%, 12/03/2019, (EUR) | | | 294,210 | |
| | 25,000,000 | | | Province of Quebec Canada, 1.600%, 5/09/2013, (JPY) | | | 329,622 | |
| | 150,000 | | | Province of Quebec Canada, EMTN, 3.375%, 6/20/2016, (EUR) | | | 213,176 | |
| | 200,000 | | | Province of Quebec Canada, Series 169, EMTN, 3.625%, 2/10/2015, (EUR) | | | 284,281 | |
| | 200,000 | | | Shaw Communications, Inc., 5.650%, 10/01/2019, (CAD) | | | 202,830 | |
| | 60,000 | | | Videotron Ltee, 6.875%, 7/15/2021, 144A, (CAD) | | | 56,677 | |
| | | | | | | | |
| | | | | | | 1,769,220 | |
| | | | | | | | |
| | | | Cayman Islands — 0.5% | | | | |
| | 119,000 | | | Fibria Overseas Finance Ltd., 7.500%, 5/04/2020, 144A | | | 111,860 | |
| | | | | | | | |
| | | | China — 0.9% | | | | |
| | 150,000 | | | Credit Suisse London, EMTN, 5.125%, 9/18/2017, (EUR) | | | 211,286 | |
| | | | | | | | |
| | | | Colombia — 0.3% | | | | |
| | 160,000,000 | | | Empresas Publicas de Medellin, E.S.P., 8.375%, 2/01/2021, 144A, (COP) | | | 82,189 | |
| | | | | | | | |
| | | | Denmark — 2.2% | | | | |
| | 50,000 | | | Kingdom of Denmark, EMTN, 1.750%, 10/05/2015, (EUR) | | | 67,442 | |
| | 2,350,000 | | | Kingdom of Denmark, 4.000%, 11/15/2015, (DKK) | | | 472,072 | |
| | | | | | | | |
| | | | | | | 539,514 | |
| | | | | | | | |
| | | | Finland — 1.4% | | | | |
| | 245,000 | | | Finland Government Bond, 3.125%, 9/15/2014, (EUR) | | | 348,229 | |
| | | | | | | | |
| | | | France — 1.4% | | | | |
| | 100,000 | | | Alstom, S.A., 4.125%, 2/01/2017, (EUR) | | | 133,515 | |
| | 150,000 | | | AXA, S.A., EMTN (fixed rate to 4/16/2020, variable rate thereafter), 5.250%, 4/16/2040, (EUR) | | | 144,402 | |
| | 50,000 | | | Lafarge S.A., EMTN, 5.375%, 6/26/2017, (EUR) | | | 59,941 | |
| | | | | | | | |
| | | | | | | 337,858 | |
| | | | | | | | |
| | | | Germany — 7.3% | | | | |
| | 400,000 | | | Bundesobligation, 2.250%, 4/10/2015, (EUR) | | | 562,400 | |
| | 135,000 | | | Bundesrepublik Deutschland, 3.250%, 1/04/2020, (EUR) | | | 202,760 | |
| | 595,000 | | | Bundesrepublik Deutschland, 3.750%, 7/04/2013, (EUR) | | | 841,879 | |
| | 115,000 | | | Bundesrepublik Deutschland, Series 6, 3.750%, 1/04/2017, (EUR) | | | 173,850 | |
| | | | | | | | |
| | | | | | | 1,780,889 | |
| | | | | | | | |
| | | | Italy — 4.9% | | | | |
| | 100,000 | | | Finmeccanica SpA, EMTN, 4.875%, 3/24/2025, (EUR) | | | 111,132 | |
| | 670,000 | | | Italy Buoni Poliennali Del Tesoro, 4.000%, 9/01/2020, (EUR) | | | 808,596 | |
See accompanying notes to financial statements.
| 48
Portfolio of Investments – as of September 30, 2011
Loomis Sayles International Bond Fund – (continued)
| | | | | | | | |
Principal
Amount (‡) | | | Description | | Value (†) | |
| | | | | | | | |
| | | | Italy — continued | | | | |
| | 210,000 | | | Italy Buoni Poliennali Del Tesoro, 4.750%, 9/15/2016, (EUR) | | $ | 277,921 | |
| | | | | | | | |
| | | | | | | 1,197,649 | |
| | | | | | | | |
| | | | Japan — 20.7% | | | | |
| | 72,000,000 | | | Japan Finance Organization for Municipal Enterprises,
1.350%, 11/26/2013, (JPY) | | | 955,986 | |
| | 75,000,000 | | | Japan Government Five Year Bond, 0.700%, 6/20/2014, (JPY) | | | 985,923 | |
| | 68,000,000 | | | Japan Government Ten Year Bond, 1.300%, 3/20/2019, (JPY)(c) | | | 923,012 | |
| | 69,000,000 | | | Japan Government Ten Year Bond, 1.700%, 9/20/2017, (JPY) | | | 958,434 | |
| | 86,000,000 | | | Japan Government Twenty Year Bond, 2.000%, 9/20/2025, (JPY) | | | 1,199,601 | |
| | | | | | | | |
| | | | | | | 5,022,956 | |
| | | | | | | | |
| | | | Jersey — 0.7% | | | | |
| | 100,000 | | | WPP 2008 Ltd., 6.000%, 4/04/2017, (GBP) | | | 170,466 | |
| | | | | | | | |
| | | | Korea — 0.5% | | | | |
| | 5,700,000 | | | Export-Import Bank of Korea, 4.000%, 11/26/2015, 144A, (PHP) | | | 121,587 | |
| | | | | | | | |
| | | | Luxembourg — 1.2% | | | | |
| | 100,000 | | | Enel Finance International S.A., EMTN, 5.625%, 8/14/2024, (GBP) | | | 135,586 | |
| | 50,000 | | | FMC Finance VIII, S.A., 6.500%, 9/15/2018, 144A, (EUR) | | | 69,667 | |
| | 75,000 | | | Telecom Italia Finance S.A., EMTN, 7.750%, 1/24/2033, (EUR) | | | 96,361 | |
| | | | | | | | |
| | | | | | | 301,614 | |
| | | | | | | | |
| | | | Malaysia — 0.5% | | | | |
| | 370,000 | | | Malaysia Government Bond, 4.262%, 9/15/2016, (MYR) | | | 120,252 | |
| | | | | | | | |
| | | | Mexico — 3.5% | | | | |
| | 160,000 | | | Axtel SAB de CV, 9.000%, 9/22/2019, 144A | | | 134,400 | |
| | 100,000 | | | BBVA Bancomer S.A., 7.250%, 4/22/2020, 144A | | | 97,500 | |
| | 15,000(††) | | | Mexican Fixed Rate Bonds, Series M, 6.500%, 6/10/2021, (MXN) | | | 108,146 | |
| | 27,500(††) | | | Mexican Fixed Rate Bonds, Series M-10, 8.500%, 12/13/2018, (MXN) | | | 227,491 | |
| | 37,500(††) | | | Mexican Fixed Rate Bonds, Series M-30, 8.500%, 11/18/2038, (MXN) | | | 291,578 | |
| | | | | | | | |
| | | | | | | 859,115 | |
| | | | | | | | |
| | | | Netherlands — 3.4% | | | | |
| | 45,000 | | | Deutsche Telekom International Finance BV, EMTN, 4.875%, 4/22/2025, (EUR) | | | 61,498 | |
| | 50,000 | | | Deutsche Telekom International Finance BV, EMTN, 4.250%, 7/13/2022, (EUR) | | | 66,484 | |
| | 50,000 | | | EDP Finance BV, EMTN, 4.750%, 9/26/2016, (EUR) | | | 52,584 | |
| | 50,000 | | | EDP Finance BV, EMTN, 8.625%, 1/04/2024, (GBP) | | | 69,718 | |
| | 230,000 | | | Kingdom of Netherlands, 4.500%, 7/15/2017, (EUR)(c) | | | 354,672 | |
| | 50,000 | | | Portugal Telecom International Finance BV, EMTN, 5.000%, 11/04/2019, (EUR) | | | 49,906 | |
| | 100,000 | | | RWE Finance BV, EMTN, 5.500%, 7/06/2022, (GBP) | | | 170,201 | |
| | | | | | | | |
| | | | | | | 825,063 | |
| | | | | | | | |
| | | | New Zealand — 0.7% | | | | |
| | 210,000 | | | New Zealand Government Bond, 6.000%, 5/15/2021, (NZD) | | | 179,007 | |
| | | | | | | | |
| | | | Norway — 3.0% | | | | |
| | 2,500,000 | | | Norwegian Government, 4.250%, 5/19/2017, (NOK) | | | 476,862 | |
| | 1,250,000 | | | Norwegian Government, 4.500%, 5/22/2019, (NOK) | | | 246,484 | |
| | | | | | | | |
| | | | | | | 723,346 | |
| | | | | | | | |
See accompanying notes to financial statements.
49 |
Portfolio of Investments – as of September 30, 2011
Loomis Sayles International Bond Fund – (continued)
| | | | | | | | |
Principal
Amount (‡) | | | Description | | Value (†) | |
| | | | | | | | |
| | | | Philippines — 0.5% | | | | |
| | 5,000,000 | | | Philippine Government International Bond, 4.950%, 1/15/2021, (PHP) | | $ | 109,491 | |
| | | | | | | | |
| | | | Poland — 1.0% | | | | |
| | 800,000 | | | Poland Government International Bond, 5.000%, 10/24/2013, (PLN) | | | 243,702 | |
| | | | | | | | |
| | | | Singapore — 3.0% | | | | |
| | 495,000 | | | Singapore Government Bond, 1.625%, 4/01/2013, (SGD) | | | 387,064 | |
| | 240,000 | | | Singapore Government Bond, 2.250%, 7/01/2013, (SGD) | | | 190,103 | |
| | 180,000 | | | Singapore Government Bond, 2.250%, 6/01/2021, (SGD) | | | 145,552 | |
| | | | | | | | |
| | | | | | | 722,719 | |
| | | | | | | | |
| | | | South Africa — 0.6% | | | | |
| | 150,000 | | | Edcon Proprietary Ltd., 4.778%, 6/15/2014, 144A, (EUR)(b) | | | 148,712 | |
| | | | | | | | |
| | | | Spain — 3.8% | | | | |
| | 525,000 | | | Spain Government Bond, 4.100%, 7/30/2018, (EUR) | | | 682,809 | |
| | 175,000 | | | Spain Government Bond, 5.500%, 4/30/2021, (EUR) | | | 241,021 | |
| | | | | | | | |
| | | | | | | 923,830 | |
| | | | | | | | |
| | | | Supranationals — 6.7% | | | | |
| | 40,000,000 | | | Asian Development Bank, EMTN, 2.350%, 6/21/2027, (JPY) | | | 569,256 | |
| | 921,000,000 | | | European Investment Bank, EMTN, Zero Coupon, 4/24/2013, 144A, (IDR) | | | 90,266 | |
| | 900,000,000 | | | Inter-American Development Bank, EMTN, Zero Coupon, 9/23/2013, (IDR) | | | 85,290 | |
| | 4,200,000,000 | | | Inter-American Development Bank, EMTN, Zero Coupon, 8/20/2015, (IDR) | | | 338,294 | |
| | 5,700,000 | | | Inter-American Development Bank, EMTN, 4.750%, 1/10/2014, (INR) | | | 118,679 | |
| | 30,000,000 | | | Nordic Investment Bank, Series C, GMTN, 1.700%, 4/27/2017, (JPY) | | | 413,211 | |
| | | | | | | | |
| | | | | | | 1,614,996 | |
| | | | | | | | |
| | | | Sweden — 1.4% | | | | |
| | 2,100,000 | | | Sweden Government Bond, 4.500%, 8/12/2015, (SEK) | | | 342,269 | |
| | | | | | | | |
| | | | United Arab Emirates — 0.4% | | | | |
| | 100,000 | | | DP World Ltd., 6.850%, 7/02/2037, 144A | | | 91,000 | |
| | | | | | | | |
| | | | United Kingdom — 6.5% | | | | |
| | 100,000 | | | Anglo American Capital PLC, 4.375%, 12/02/2016, (EUR) | | | 136,026 | |
| | 100,000 | | | British Sky Broadcasting Group PLC, EMTN, 6.000%, 5/21/2027, (GBP) | | | 169,798 | |
| | 105,000 | | | British Telecommunications PLC, 5.750%, 12/07/2028, (GBP) | | | 167,654 | |
| | 50,000 | | | BSKYB Finance UK PLC, 5.750%, 10/20/2017, (GBP) | | | 86,780 | |
| | 100,000 | | | Standard Chartered Bank, Series 17, EMTN, 5.875%, 9/26/2017, (EUR) | | | 132,708 | |
| | 140,000 | | | United Kingdom Treasury, 4.000%, 9/07/2016, (GBP) | | | 245,623 | |
| | 140,000 | | | United Kingdom Treasury, 4.750%, 12/07/2038, (GBP) | | | 266,782 | |
| | 170,000 | | | United Kingdom Treasury, 5.000%, 3/07/2025, (GBP) | | | 330,630 | |
| | 25,000 | | | United Kingdom Treasury, 5.250%, 6/07/2012, (GBP) | | | 40,214 | |
| | | | | | | | |
| | | | | | | 1,576,215 | |
| | | | | | | | |
| | | | United States — 10.9% | | | | |
| | 100,000 | | | BA Credit Card Trust, Series 04A1, 4.500%, 6/17/2016, (EUR) | | | 139,017 | |
| | 25,000 | | | Bear Stearns Commercial Mortgage Securities, Series 2007-PW15, Class A4, 5.331%, 2/11/2044 | | | 25,790 | |
| | 50,000 | | | Cargill, Inc., EMTN, 5.375%, 3/02/2037, (GBP) | | | 83,343 | |
| | 15,000,000 | | | Citigroup, Inc., 2.400%, 10/31/2025, (JPY) | | | 172,476 | |
See accompanying notes to financial statements.
| 50
Portfolio of Investments – as of September 30, 2011
Loomis Sayles International Bond Fund – (continued)
| | | | | | | | |
Principal
Amount (‡) | | | Description | | Value (†) | |
| | | | | | | | |
| | | | United States — continued | | | | |
| $ | 140,000 | | | DISH DBS Corp., 6.750%, 6/01/2021, 144A | | $ | 133,700 | |
| | 60,000 | | | Dolpin Subsidiary II, Inc., 6.500%, 10/15/2016, 144A | | | 59,250 | |
| | 150,000 | | | Frontier Communications Corp., 9.000%, 8/15/2031 | | | 127,875 | |
| | 50,000 | | | Goldman Sachs Group, Inc. (The), 6.875%, 1/18/2038, (GBP) | | | 63,573 | |
| | 25,000 | | | Greenwich Capital Commercial Funding Corp., Series 2007-GG11, Class A4, 5.736%, 12/10/2049 | | | 25,952 | |
| | 45,000 | | | HCA, Inc., 7.500%, 2/15/2022 | | | 41,513 | |
| | 45,000 | | | HCA, Inc., 8.360%, 4/15/2024 | | | 43,088 | |
| | 200,000 | | | HSBC Finance Corp., EMTN, 4.500%, 6/14/2016, (EUR) | | | 267,314 | |
| | 100,000 | | | JPMorgan Chase & Co., EMTN, 4.375%, 1/30/2014, (EUR) | | | 137,201 | |
| | 25,000 | | | LB-UBS Commercial Mortgage Trust, Series 2007-C2, Class A3, 5.430%, 2/15/2040 | | | 25,675 | |
| | 150,000 | | | Merrill Lynch & Co., Inc., EMTN, 4.625%, 9/14/2018, (EUR) | | | 148,308 | |
| | 130,000 | | | Morgan Stanley, 5.375%, 11/14/2013, (GBP) | | | 199,886 | |
| | 55,000 | | | Morgan Stanley Capital I, Series 2007-IQ14, Class A4, 5.692%, 4/15/2049 | | | 57,018 | |
| | 140,000 | | | Nextel Communications, Inc., Series D, 7.375%, 8/01/2015 | | | 132,650 | |
| | 130,000 | | | Owens-Illinois, Inc., 7.800%, 5/15/2018 | | | 133,250 | |
| | 100,000 | | | Reynolds Group Issuer, Inc./Reynolds Group Issuer LLC/Reynolds Group Issuer (Luxembourg) S.A., 6.875%, 2/15/2021, 144A | | | 90,000 | |
| | 75,000 | | | Valeant Pharmaceuticals International, 6.750%, 8/15/2021, 144A | | | 64,969 | |
| | 35,000 | | | Valeant Pharmaceuticals International, 7.250%, 7/15/2022, 144A | | | 30,713 | |
| | 55,000 | | | Wachovia Bank Commercial Mortgage Trust, Series 2007-C30, Class A5, 5.342%, 12/15/2043 | | | 56,068 | |
| | 100,000 | | | Wachovia Corp., EMTN, 4.375%, 11/27/2018, (EUR) | | | 123,276 | |
| | 100,000 | | | Wells Fargo & Co., 4.625%, 11/02/2035, (GBP) | | | 137,072 | |
| | 100,000 | | | Zurich Finance USA, Inc., EMTN, (fixed rate to 6/15/2015, variable rate thereafter), 4.500%, 6/15/2025, (EUR) | | | 124,592 | |
| | | | | | | | |
| | | | | | | 2,643,569 | |
| | | | | | | | |
| | | | Uruguay — 0.7% | | | | |
| | 3,551,707 | | | Uruguay Government International Bond, 5.000%, 9/14/2018, (UYU) | | | 179,754 | |
| | | | | | | | |
| | | | Total Non-Convertible Bonds
(Identified Cost $23,546,182) | | | 23,519,440 | |
| | | | | | | | |
| | | | | | | | |
| | Convertible Bonds — 0.2% | | | | |
| | | | United States — 0.2% | | | | |
| | 50,000 | | | Hologic, Inc., 2.000% (accretes to principal after 12/15/2013), 12/15/2037(d) (Identified Cost $35,411) | | | 46,812 | |
| | | | | | | | |
| | | | Total Bonds and Notes
(Identified Cost $23,581,593) | | | 23,566,252 | |
| | | | | | | | |
See accompanying notes to financial statements.
51 |
Portfolio of Investments – as of September 30, 2011
Loomis Sayles International Bond Fund – (continued)
| | | | | | | | |
Principal
Amount (‡) | | | Description | | Value (†) | |
| | | | | | | | |
| | Short-Term Investments — 2.0% | |
| $ | 481,399 | | | Tri-Party Repurchase Agreement with Fixed Income Clearing Corporation, dated 9/30/2011 at 0.000% to be repurchased at $481,399 on 10/03/2011 collateralized by $485,000 U.S. Treasury Note, 1.375% due 2/15/2013 valued at $493,488 including accrued interest (Note 2 of Notes to Financial Statements)
(Identified Cost $481,399) | | $ | 481,399 | |
| | | | | | | | |
| | | | | | | | |
| | | | Total Investments — 99.0%
(Identified Cost $24,062,992)(a) | | | 24,047,651 | |
| | | | Other assets less liabilities — 1.0% | | | 234,886 | |
| | | | | | | | |
| | | | Net Assets — 100.0% | | $ | 24,282,537 | |
| | | | | | | | |
| | | | | | | | |
| | (‡) | | | Principal amount stated in U.S. dollars unless otherwise noted. | | | | |
| | (†) | | | See Note 2 of Notes to Financial Statements. | | | | |
| | (††) | | | Amount shown represents units. One unit represents a principal amount of 100. | |
| | (a) | | | Federal Tax Information: | | | | |
| | | | At September 30, 2011, the net unrealized depreciation on investments based on a cost of $24,165,960 for federal income tax purposes was as follows: | |
| | | | Aggregate gross unrealized appreciation for all investments in which there is an excess of value over tax cost | | $ | 880,549 | |
| | | | Aggregate gross unrealized depreciation for all investments in which there is an excess of tax cost over value | | | (998,858 | ) |
| | | | | | | | |
| | | | Net unrealized depreciation | | $ | (118,309 | ) |
| | | | | | | | |
| | | | | | | | |
| | (b) | | | Variable rate security. Rate as of September 30, 2011 is disclosed. | |
| | (c) | | | All or a portion of this security has been designated to cover the Fund’s obligations under open forward foreign currency contracts. | |
| | (d) | | | Coupon rate is a fixed rate for an initial period then resets at a specified date and rate. | |
| | | | | | | | |
| | 144A | | | All or a portion of these securities are exempt from registration under Rule 144A of the Securities Act of 1933. These securities may be resold in transactions exempt from registration, normally to qualified institutional buyers. At September 30, 2011, the value of Rule 144A holdings amounted to $1,669,435 or 6.9% of net assets. | |
| | EMTN | | | Euro Medium Term Note | |
| | GMTN | | | Global Medium Term Note | |
| | | | | | | | |
| | CAD | | | Canadian Dollar | |
| | COP | | | Colombian Peso | |
| | DKK | | | Danish Krone | |
| | EUR | | | Euro | |
| | GBP | | | British Pound | |
| | IDR | | | Indonesian Rupiah | |
| | INR | | | Indian Rupee | |
| | JPY | | | Japanese Yen | |
See accompanying notes to financial statements.
| 52
Portfolio of Investments – as of September 30, 2011
Loomis Sayles International Bond Fund – (continued)
| | | | | | |
| | | | | | |
| | MXN | | | Mexican Peso |
| | MYR | | | Malaysian Ringgit |
| | NOK | | | Norwegian Krone |
| | NZD | | | New Zealand Dollar |
| | PHP | | | Philippine Peso |
| | PLN | | | Polish Zloty |
| | SEK | | | Swedish Krona |
| | SGD | | | Singapore Dollar |
| | UYU | | | Uruguayan Peso |
At September 30, 2011, the Fund had the following open forward foreign currency contracts:
| | | | | | | | | | | | | | | | | | |
Contract
to
Buy/Sell | | Delivery
Date | | | Currency | | Units | | | Notional
Value | | | Unrealized
Appreciation
(Depreciation) | |
| Buy1 | | | 12/21/2011 | | | Australian Dollar | | | 328,000 | | | $ | 314,478 | | | $ | (21,761 | ) |
| Sell2 | | | 12/28/2011 | | | British Pound | | | 156,000 | | | | 243,068 | | | | 1,560 | |
| Buy3 | | | 12/21/2011 | | | Canadian Dollar | | | 720,000 | | | | 685,932 | | | | (43,832 | ) |
| Buy1 | | | 12/21/2011 | | | Euro | | | 280,000 | | | | 375,007 | | | | (8,599 | ) |
| Buy4 | | | 12/21/2011 | | | Japanese Yen | | | 131,000,000 | | | | 1,700,390 | | | | 416 | |
| Sell4 | | | 12/21/2011 | | | Japanese Yen | | | 37,000,000 | | | | 480,263 | | | | 4,455 | |
| Buy4 | | | 10/19/2011 | | | Malaysian Ringgit | | | 775,000 | | | | 242,606 | | | | (7,839 | ) |
| Buy2 | | | 12/12/2011 | | | South Korean Won | | | 416,000,000 | | | | 351,768 | | | | (34,598 | ) |
| Buy1 | | | 12/12/2011 | | | South Korean Won | | | 555,000,000 | | | | 469,306 | | | | (45,680 | ) |
| Buy1 | | | 12/06/2011 | | | Swedish Krona | | | 1,090,000 | | | | 158,361 | | | | (2,567 | ) |
| Sell1 | | | 12/06/2011 | | | Swedish Krona | | | 1,780,000 | | | | 258,608 | | | | 18,047 | |
| Buy3 | | | 12/06/2011 | | | Swiss Franc | | | 220,000 | | | | 243,020 | | | | (34,776 | ) |
| Buy1 | | | 11/02/2011 | | | Turkish Lira | | | 515,000 | | | | 275,837 | | | | (16,431 | ) |
| | | | | | | | | | | | | | | | | | |
| Total | | | | | | | | | | | | | | | | $ | (191,605 | ) |
| | | | | | | | | | | | | | | | | | |
1 Counterparty is Credit Suisse.
2 Counterparty is Barclays.
3 Counterparty is UBS AG.
4 Counterparty is JPMorgan Chase.
See accompanying notes to financial statements.
53 |
Portfolio of Investments – as of September 30, 2011
Loomis Sayles International Bond Fund – (continued)
Industry Summary at September 30, 2011 (Unaudited)
| | | | |
Treasuries | | | 50.9 | % |
Supranational | | | 6.7 | |
Banking | | | 5.9 | |
Local Authorities | | | 4.7 | |
Sovereigns | | | 3.9 | |
Government Guaranteed | | | 3.9 | |
Wirelines | | | 3.8 | |
Media Non-Cable | | | 2.4 | |
Electric | | | 2.2 | |
Other Investments, less than 2% each | | | 12.6 | |
Short-Term Investments | | | 2.0 | |
| | | | |
Total Investments | | | 99.0 | |
Other assets less liabilities (including open forward foreign currency contracts) | | | 1.0 | |
| | | | |
Net Assets | | | 100.0 | % |
| | | | |
Currency Exposure at September 30, 2011 (Unaudited)
| | | | |
Euro | | | 32.5 | % |
Japanese Yen | | | 26.8 | |
British Pound | | | 9.6 | |
United States Dollar | | | 8.7 | |
Norwegian Krone | | | 3.0 | |
Singapore Dollar | | | 3.0 | |
Canadian Dollar | | | 2.7 | |
Mexican Peso | | | 2.6 | |
Indonesian Rupiah | | | 2.1 | |
Other, less than 2% each | | | 8.0 | |
| | | | |
Total Investments | | | 99.0 | |
Other assets less liabilities (including open forward foreign currency contracts) | | | 1.0 | |
| | | | |
Net Assets | | | 100.0 | % |
| | | | |
See accompanying notes to financial statements.
| 54
PORTFOLIO OF INVESTMENTS – as of September 30, 2011
Loomis Sayles Limited Term Government and Agency Fund
| | | | | | | | |
Principal
Amount | | | Description | | Value (†) | |
| | | | | | | | |
| | Bonds and Notes — 93.3% of Net Assets | |
| | | | ABS Car Loan — 1.8% | | | | |
| $ | 1,380,000 | | | Ally Master Owner Trust, Series 2011-1, Class A2, 2.150%, 1/15/2016 | | $ | 1,401,383 | |
| | 541,293 | | | ARI Fleet Lease Trust, Series 2010-A, Class A, 1.679%, 8/15/2018, 144A(b) | | | 544,318 | |
| | 3,245,000 | | | Navistar Financial Dealer Note Master Trust, Series 2010-1, Class A, 1.885%, 1/26/2015, 144A(b) | | | 3,256,360 | |
| | 1,810,000 | | | Nissan Master Owner Trust Receivables, Series 2010-AA, Class A, 1.379%, 1/15/2015, 144A(b) | | | 1,826,558 | |
| | 2,000,000 | | | World Omni Auto Receivables Trust, Series 2011-A, Class A3, 1.110%, 5/15/2015 | | | 2,004,919 | |
| | | | | | | | |
| | | | | | | 9,033,538 | |
| | | | | | | | |
| | | | ABS Credit Card — 0.6% | | | | |
| | 985,000 | | | American Express Credit Account Master, Series 2004-2, Class A, 0.399%, 12/15/2016(b) | | | 985,647 | |
| | 2,100,000 | | | World Financial Network Credit Card Master Trust, Series 2010-A, Class A, 3.960%, 4/15/2019 | | | 2,261,480 | |
| | | | | | | | |
| | | | | | | 3,247,127 | |
| | | | | | | | |
| | | | ABS Home Equity — 0.2% | | | | |
| | 570,757 | | | Countrywide Asset-Backed Certificates, Series 2004-S1, Class A3, 4.615%, 2/25/2035 | | | 537,282 | |
| | 421,190 | | | Residential Funding Mortgage Securities II, Series 2002-HI5, Class A7, 5.700%, 1/25/2028(b) | | | 401,448 | |
| | | | | | | | |
| | | | | | | 938,730 | |
| | | | | | | | |
| | | | ABS Student Loan — 0.2% | | | | |
| | 1,203,476 | | | NCUA Guaranteed Notes, Series 2010-A1, Class A, 0.591%, 12/07/2020(b) | | | 1,205,919 | |
| | | | | | | | |
| | | | Collateralized Mortgage Obligations — 11.1% | | | | |
| | 3,825,000 | | | Federal Home Loan Mortgage Corp., REMIC, Series 2874, Class BC, 5.000%, 10/15/2019 | | | 4,292,885 | |
| | 319,041 | | | Federal Home Loan Mortgage Corp., REMIC, Series 2901, Class UA, 5.000%, 1/15/2030 | | | 325,643 | |
| | 6,280,000 | | | Federal Home Loan Mortgage Corp., REMIC, Series 2931, Class DE, 4.000%, 2/15/2020(c) | | | 6,712,338 | |
| | 7,667,208 | | | Federal Home Loan Mortgage Corp., REMIC, Series 3561, Class W, 5.375%, 6/15/2048(b) | | | 8,052,669 | |
| | 11,023,643 | | | Federal National Mortgage Association, REMIC, Series 2008-86, Class LA, 5.000%, 8/25/2038(b) | | | 11,214,658 | |
| | 6,000,000 | | | FHLMC Multifamily Structured Pass Through Certificates, Series K006, Class A2, 4.251%, 1/25/2020 | | | 6,638,935 | |
| | 4,305,000 | | | FHLMC Multifamily Structured Pass Through Certificates, Series K014, Class A2, 3.871%, 4/25/2021 | | | 4,655,957 | |
| | 3,535,000 | | | FHLMC Multifamily Structured Pass Through Certificates, Series K703, Class A2, 2.699%, 5/25/2018 | | | 3,547,726 | |
| | 1,280,000 | | | NCUA Guaranteed Notes, Series 2010-C1, Class A2, 2.900%, 10/29/2020 | | | 1,341,425 | |
| | 2,199,363 | | | NCUA Guaranteed Notes, Series 2010-R1, Class 1A, 0.691%, 10/07/2020(b) | | | 2,202,794 | |
See accompanying notes to financial statements.
55 |
PORTFOLIO OF INVESTMENTS – as of September 30, 2011
Loomis Sayles Limited Term Government and Agency Fund – (continued)
| | | | | | | | |
Principal
Amount | | | Description | | Value (†) | |
| | | | | | | | |
| | | | Collateralized Mortgage Obligations — continued | | | | |
| $ | 6,827,390 | | | NCUA Guaranteed Notes, Series 2010-R3, Class 1A, 0.801%, 12/08/2020(b) | | $ | 6,868,968 | |
| | | | | | | | |
| | | | | | | 55,853,998 | |
| | | | | | | | |
| | | | Commercial Mortgage-Backed Securities — 14.0% | | | | |
| | 1,780,000 | | | Banc of America Merrill Lynch Commercial Mortgage, Inc., Series 2007-2, Class A4, 5.645%, 4/10/2049(b) | | | 1,902,589 | |
| | 1,500,000 | | | Banc of America Merrill Lynch Commercial Mortgage, Inc., Series 2007-5, Class A4, 5.492%, 2/10/2051 | | | 1,566,629 | |
| | 4,645,000 | | | Bear Stearns Commercial Mortgage Securities, Series 2007-PW15, Class A4, 5.331%, 2/11/2044 | | | 4,791,773 | |
| | 360,000 | | | Citigroup Commercial Mortgage Trust, Series 2006-C5, Class A4, 5.431%, 10/15/2049 | | | 391,644 | |
| | 1,500,000 | | | Citigroup Commercial Mortgage Trust, Series 2007-C6, Class A4, 5.697%, 12/10/2049(b) | | | 1,615,836 | |
| | 1,470,000 | | | Citigroup Commercial Mortgage Trust, Series 2008-C7, Class A4, 6.072%, 12/10/2049(b) | | | 1,601,417 | |
| | 3,200,500 | | | Citigroup/Deutsche Bank Commercial Mortgage Trust, Series 2007-CD4, Class A4, 5.322%, 12/11/2049 | | | 3,299,079 | |
| | 2,670,000 | | | Credit Suisse Mortgage Capital Certificates, Series 2006-C3, Class A3, 5.817%, 6/15/2038(b) | | | 2,851,168 | |
| | 2,625,000 | | | Credit Suisse Mortgage Capital Certificates, Series 2007-C2, Class A3, 5.542%, 1/15/2049 | | | 2,780,232 | |
| | 5,270,000 | | | Credit Suisse Mortgage Capital Certificates, Series 2007-C5, Class A4, 5.695%, 9/15/2040 | | | 5,614,737 | |
| | 1,500,000 | | | Greenwich Capital Commercial Funding Corp., Series 2006-GG7, Class A4, 5.877%, 7/10/2038(b) | | | 1,615,084 | |
| | 5,000,000 | | | Greenwich Capital Commercial Funding Corp., Series 2007-GG9, Class A4, 5.444%, 3/10/2039 | | | 5,184,525 | |
| | 5,778,000 | | | Greenwich Capital Commercial Funding Corp., Series 2007-GG11, Class A4, 5.736%, 12/10/2049 | | | 5,998,101 | |
| | 1,140,000 | | | GS Mortgage Securities Corp. II, Series 2006-GG8, Class A4, 5.560%, 11/10/2039 | | | 1,204,706 | |
| | 6,075,000 | | | GS Mortgage Securities Corp. II, Series 2007-GG10, Class A4, 5.790%, 8/10/2045(b) | | | 6,311,409 | |
| | 295,000 | | | JPMorgan Chase Commercial Mortgage Securities Corp., Series 2006-CB15, Class A4, 5.814%, 6/12/2043 | | | 314,433 | |
| | 2,785,000 | | | JPMorgan Chase Commercial Mortgage Securities Corp., Series 2007-CB18, Class A4, 5.440%, 6/12/2047 | | | 2,892,487 | |
| | 5,000,000 | | | JPMorgan Chase Commercial Mortgage Securities Corp., Series 2007-LDPX, Class A3, 5.420%, 1/15/2049 | | | 5,184,145 | |
| | 2,000,000 | | | LB-UBS Commercial Mortgage Trust, Series 2007-C2, Class A3, 5.430%, 2/15/2040 | | | 2,053,964 | |
| | 1,173,000 | | | Merrill Lynch/Countrywide Commercial Mortgage Trust, Series 2007-5, Class A4, 5.378%, 8/12/2048 | | | 1,188,450 | |
| | 5,364,000 | | | Merrill Lynch/Countrywide Commercial Mortgage Trust, Series 2007-6, Class A4, 5.485%, 3/12/2051 | | | 5,502,981 | |
See accompanying notes to financial statements.
| 56
PORTFOLIO OF INVESTMENTS – as of September 30, 2011
Loomis Sayles Limited Term Government and Agency Fund – (continued)
| | | | | | | | |
Principal
Amount | | | Description | | Value (†) | |
| | | | | | | | |
| | | | Commercial Mortgage-Backed Securities — continued | | | | |
| $ | 1,500,000 | | | Morgan Stanley Capital I, Series 2007-IQ15, Class A4, 5.884%, 6/11/2049(b) | | $ | 1,590,274 | |
| | 4,410,000 | | | Wachovia Bank Commercial Mortgage Trust, Series 2006-C28, Class A4, 5.572%, 10/15/2048 | | | 4,679,658 | |
| | 580,000 | | | Wachovia Bank Commercial Mortgage Trust, Series 2007-C30, Class A5, 5.342%, 12/15/2043 | | | 591,262 | |
| | | | | | | | |
| | | | | | | 70,726,583 | |
| | | | | | | | |
| | | | Government Guaranteed — 0.5% | | | | |
| | 2,340,000 | | | US Central Federal Credit Union, (FDIC insured), 1.900%, 10/19/2012 | | | 2,380,676 | |
| | | | | | | | |
| | | | Government Owned — No Guarantee — 10.2% | | | | |
| | 6,435,000 | | | Federal Home Loan Mortgage Corp., 1.750%, 6/15/2012(c) | | | 6,502,001 | |
| | 11,920,000 | | | Federal Home Loan Mortgage Corp., 2.125%, 3/23/2012(c) | | | 12,027,971 | |
| | 5,400,000 | | | Federal Home Loan Mortgage Corp., MTN, 0.142%, 2/02/2012(b) | | | 5,399,584 | |
| | 17,970,000 | | | Federal National Mortgage Association, 3.625%, 2/12/2013 | | | 18,747,472 | |
| | 8,265,000 | | | Federal National Mortgage Association, 4.750%, 11/19/2012 | | | 8,677,300 | |
| | | | | | | | |
| | | | | | | 51,354,328 | |
| | | | | | | | |
| | | | Government Sponsored — 0.2% | | | | |
| | 1,070,000 | | | Federal Home Loan Bank, 0.186%, 10/06/2011(b) | | | 1,070,000 | |
| | | | | | | | |
| | | | Hybrid ARMs — 20.7% | | | | |
| | 3,523,273 | | | FHLMC, 2.422%, 4/01/2036(b) | | | 3,702,169 | |
| | 2,988,241 | | | FHLMC, 2.495%, 4/01/2035(b) | | | 3,152,534 | |
| | 8,973,684 | | | FHLMC, 2.497%, 2/01/2036(b) | | | 9,424,005 | |
| | 5,635,235 | | | FHLMC, 2.996%, 9/01/2035(b) | | | 5,948,996 | |
| | 5,361,055 | | | FHLMC, 3.364%, 11/01/2036(b) | | | 5,679,752 | |
| | 1,378,005 | | | FHLMC, 5.279%, 12/01/2037(b) | | | 1,483,848 | |
| | 5,403,210 | | | FHLMC, 5.499%, 4/01/2037(b) | | | 5,748,950 | |
| | 1,766,740 | | | FHLMC, 5.684%, 9/01/2038(b) | | | 1,901,390 | |
| | 1,610,712 | | | FHLMC, 5.710%, 4/01/2037(b) | | | 1,708,551 | |
| | 3,383,179 | | | FHLMC, 5.914%, 6/01/2037(b) | | | 3,602,826 | |
| | 4,328,134 | | | FNMA, 1.996%, 7/01/2035(b) | | | 4,532,988 | |
| | 5,657,934 | | | FNMA, 2.347%, 8/01/2035(b) | | | 5,904,029 | |
| | 1,768,437 | | | FNMA, 2.373%, 9/01/2034(b) | | | 1,856,145 | |
| | 1,258,624 | | | FNMA, 2.389%, 12/01/2034(b) | | | 1,320,902 | |
| | 4,047,430 | | | FNMA, 2.393%, 6/01/2036(b) | | | 4,257,695 | |
| | 2,250,004 | | | FNMA, 2.430%, 8/01/2034(b) | | | 2,366,927 | |
| | 1,036,138 | | | FNMA, 2.445%, 4/01/2033(b) | | | 1,091,155 | |
| | 3,468,932 | | | FNMA, 2.537%, 6/01/2033(b) | | | 3,646,360 | |
| | 896,291 | | | FNMA, 2.568%, 8/01/2033(b) | | | 944,973 | |
| | 5,457,140 | | | FNMA, 3.223%, 6/01/2035(b) | | | 5,769,640 | |
| | 2,516,096 | | | FNMA, 3.334%, 1/01/2036(b) | | | 2,637,065 | |
| | 964,913 | | | FNMA, 3.382%, 8/01/2036(b) | | | 1,021,639 | |
| | 7,445,008 | | | FNMA, 5.439%, 6/01/2037(b) | | | 7,933,599 | |
| | 3,124,205 | | | FNMA, 5.513%, 2/01/2047(b) | | | 3,323,831 | |
| | 13,536,585 | | | FNMA, 5.787%, 9/01/2037(b) | | | 14,611,782 | |
See accompanying notes to financial statements.
57 |
PORTFOLIO OF INVESTMENTS – as of September 30, 2011
Loomis Sayles Limited Term Government and Agency Fund – (continued)
| | | | | | | | |
Principal
Amount | | | Description | | Value (†) | |
| | | | | | | | |
| | | | Hybrid ARMs — continued | | | | |
| $ | 549,616 | | | FNMA, 5.932%, 2/01/2037(b) | | $ | 587,304 | |
| | | | | | | | |
| | | | | | | 104,159,055 | |
| | | | | | | | |
| | | | Mortgage Related — 17.5% | | | | |
| | 7,270,089 | | | FHLMC, 4.000%, with various maturities from 2024 to 2025(d) | | | 7,658,036 | |
| | 12,267,318 | | | FHLMC, 4.500%, with various maturities from 2025 to 2034(d) | | | 13,039,822 | |
| | 1,645,214 | | | FHLMC, 5.500%, 10/01/2023 | | | 1,779,845 | |
| | 2,258,292 | | | FHLMC, 6.000%, with various maturities from 2019 to 2021(d) | | | 2,459,390 | |
| | 3,701,795 | | | FHLMC, 6.500%, with various maturities from 2014 to 2034(d) | | | 4,112,571 | |
| | 110,195 | | | FHLMC, 7.000%, 2/01/2016 | | | 118,937 | |
| | 6,014 | | | FHLMC, 7.500%, with various maturities from 2012 to 2026(d) | | | 6,456 | |
| | 6,839 | | | FHLMC, 8.000%, 9/01/2015 | | | 7,495 | |
| | 3,305 | | | FHLMC, 10.000%, 7/01/2019 | | | 3,817 | |
| | 90,251 | | | FHLMC, 11.500%, with various maturities from 2015 to 2020(d) | | | 91,803 | |
| | 5,713,560 | | | FNMA, 4.000%, with various maturities from 2018 to 2019(d) | | | 6,082,175 | |
| | 7,598,305 | | | FNMA, 4.500%, with various maturities from 2019 to 2025(d) | | | 8,094,582 | |
| | 5,434,965 | | | FNMA, 5.000%, 4/01/2040 | | | 5,856,061 | |
| | 5,020,074 | | | FNMA, 5.500%, with various maturities from 2017 to 2033(d) | | | 5,452,761 | |
| | 9,480,259 | | | FNMA, 6.000%, with various maturities from 2017 to 2022(d) | | | 10,321,019 | |
| | 2,663,589 | | | FNMA, 6.500%, with various maturities from 2017 to 2037(d) | | | 2,966,906 | |
| | 101,178 | | | FNMA, 7.000%, 12/01/2022 | | | 112,305 | |
| | 275,963 | | | FNMA, 7.500%, with various maturities from 2015 to 2032(d) | | | 319,976 | |
| | 29,787 | | | FNMA, 8.000%, with various maturities from 2015 to 2016(d) | | | 32,379 | |
| | 18,390,000 | | | FNMA (TBA), 3.000%, 11/01/2026(e) | | | 18,872,737 | |
| | 62,590 | | | GNMA, 6.000%, 12/15/2031 | | | 70,151 | |
| | 219,359 | | | GNMA, 6.500%, 5/15/2031 | | | 253,674 | |
| | 248,570 | | | GNMA, 7.000%, 10/15/2028 | | | 289,473 | |
| | 1,355 | | | GNMA, 12.500%, 6/15/2014 | | | 1,366 | |
| | 2,339 | | | GNMA, 16.000%, with various maturities from 2011 to 2012(d) | | | 2,353 | |
| | | | | | | | |
| | | | | | | 88,006,090 | |
| | | | | | | | |
| | | | Treasuries — 16.3% | | | | |
| | 10,060,000 | | | U.S. Treasury Note, 0.625%, 7/15/2014 | | | 10,121,265 | |
| | 35,660,000 | | | U.S. Treasury Note, 1.375%, 9/15/2012 | | | 36,059,784 | |
| | 35,445,000 | | | U.S. Treasury Note, 1.750%, 4/15/2013 | | | 36,252,083 | |
| | | | | | | | |
| | | | | | | 82,433,132 | |
| | | | | | | | |
| | | | Total Bonds and Notes
(Identified Cost $460,563,624) | | | 470,409,176 | |
| | | | | | | | |
| | | | | | | | |
See accompanying notes to financial statements.
| 58
PORTFOLIO OF INVESTMENTS – as of September 30, 2011
Loomis Sayles Limited Term Government and Agency Fund – (continued)
| | | | | | | | |
Principal
Amount | | | Description | | Value (†) | |
| | | | | | | | |
| | Short-Term Investments — 13.5% | | | | |
| $ | 21,000,000 | | | Federal National Mortgage Association, Discount Note, 12/07/2011 | | $ | 20,999,244 | |
| | 38,768,380 | | | Tri-Party Repurchase Agreement with Fixed Income Clearing Corporation, dated 9/30/2011 at 0.000% to be repurchased at $38,768,380 on 10/03/2011 collateralized by $39,545,000 Federal Home Loan Mortgage Corp., 0.500% due 8/23/2013 valued at $39,545,000 including accrued interest (Note 2 of Notes to Financial Statements) | | | 38,768,380 | |
| | 8,400,000 | | | U.S. Treasury Bill, 0.026%, 10/13/2011(f) | | | 8,399,975 | |
| | | | | | | | |
| | | | Total Short-Term Investments
(Identified Cost $68,166,745) | | | 68,167,599 | |
| | | | | | | | |
| | | | | | | | |
| | | | Total Investments — 106.8%
(Identified Cost $528,730,369)(a) | | | 538,576,775 | |
| | | | Other assets less liabilities — (6.8)% | | | (34,277,244 | ) |
| | | | | | | | |
| | | | Net Assets — 100.0% | | $ | 504,299,531 | |
| | | | | | | | |
| | | | | | | | |
| | (†) | | | See Note 2 of Notes to Financial Statements. | | | | |
| | (a) | | | Federal Tax Information: | | | | |
| | | | At September 30, 2011, the net unrealized appreciation on investments based on a cost of $530,028,467 for federal income tax purposes was as follows: | | | | |
| | | | Aggregate gross unrealized appreciation for all investments in which there is an excess of value over tax cost | | $ | 9,922,389 | |
| | | | Aggregate gross unrealized depreciation for all investments in which there is an excess of tax cost over value | | | (1,374,081 | ) |
| | | | | | | | |
| | | | Net unrealized appreciation | | $ | 8,548,308 | |
| | | | | | | | |
| | (b) | | | Variable rate security. Rate as of September 30, 2011 is disclosed. | |
| | (c) | | | All or a portion of this security has been designated to cover the Fund’s obligations under open TBA transactions. | |
| | (d) | | | The Fund’s investment in mortgage related securities of Federal Home Loan Mortgage Corporation, Federal National Mortgage Association and Government National Mortgage Association are interests in separate pools of mortgages. All separate investments in securities of each issuer which have the same coupon rate have been aggregated for the purpose of presentation in the Portfolio of Investments. | |
| | (e) | | | Delayed delivery. See Note 2 of Notes to Financial Statements. | |
| | (f) | | | Interest rate represents discount rate at time of purchase; not a coupon rate. | |
| | | | | | | | |
| | 144A | | | All or a portion of these securities are exempt from registration under Rule 144A of the Securities Act of 1933. These securities may be resold in transactions exempt from registration, normally to qualified institutional buyers. At September 30, 2011, the value of Rule 144A holdings amounted to $5,627,236 or 1.1% of net assets. | |
| | ABS | | | Asset-Backed Securities | | | | |
| | ARMs | | | Adjustable Rate Mortgages | | | | |
| | FDIC | | | Federal Deposit Insurance Corporation | | | | |
| | FHLMC | | | Federal Home Loan Mortgage Corp. | | | | |
See accompanying notes to financial statements.
59 |
PORTFOLIO OF INVESTMENTS – as of September 30, 2011
Loomis Sayles Limited Term Government and Agency Fund – (continued)
| | | | | | |
| | | | | | |
| | FNMA | | | Federal National Mortgage Association | | |
| | GNMA | | | Government National Mortgage Association | | |
| | MTN | | | Medium Term Note | | |
| | REMIC | | | Real Estate Mortgage Investment Conduit | | |
| | TBA | | | To Be Announced | | |
Industry Summary at September 30, 2011 (Unaudited)
| | | | |
Hybrid ARMs | | | 20.7 | % |
Mortgage Related | | | 17.5 | |
Treasuries | | | 16.3 | |
Commercial Mortgage-Backed Securities | | | 14.0 | |
Collateralized Mortgage Obligations | | | 11.1 | |
Government Owned — No Guarantee | | | 10.2 | |
Other Investments, less than 2% each | | | 3.5 | |
Short-Term Investments | | | 13.5 | |
| | | | |
Total Investments | | | 106.8 | |
Other assets less liabilities | | | (6.8 | ) |
| | | | |
Net Assets | | | 100.0 | % |
| | | | |
See accompanying notes to financial statements.
| 60
Statements of Assets and Liabilities
September 30, 2011
| | | | | | | | | | | | | | | | |
| | | Core Plus
Bond Fund | | | High Income
Fund | | | International
Bond Fund | | | Limited Term
Government
and Agency
Fund | |
ASSETS | | | | | | | | | | | | | | | | |
Investments at cost | | $ | 511,787,616 | | | $ | 120,646,970 | | | $ | 24,062,992 | | | $ | 528,730,369 | |
Net unrealized appreciation (depreciation) | | | 12,899,830 | | | | (9,675,944 | ) | | | (15,341 | ) | | | 9,846,406 | |
| | | | | | | | | | | | | | | | |
Investments at value | | | 524,687,446 | | | | 110,971,026 | | | | 24,047,651 | | | | 538,576,775 | |
Foreign currency at value (identified cost $0, $41,299, $279,481 and $0) | | | — | | | | 37,477 | | | | 271,938 | | | | — | |
Receivable for Fund shares sold | | | 4,854,388 | | | | 1,565,286 | | | | 39,665 | | | | 2,578,061 | |
Receivable for securities sold | | | — | | | | 214,331 | | | | — | | | | — | |
Collateral received for open forward foreign currency contracts (Note 2) | | | 189,000 | | | | — | | | | — | | | | — | |
Dividends and interest receivable | | | 5,958,049 | | | | 1,886,641 | | | | 284,628 | | | | 2,280,665 | |
Unrealized appreciation on forward foreign currency contracts (Note 2) | | | 628,790 | | | | 243,595 | | | | 24,478 | | | | — | |
Tax reclaims receivable | | | — | | | | 11,590 | | | | 1,686 | | | | — | |
| | | | | | | | | | | | | | | | |
TOTAL ASSETS | | | 536,317,673 | | | | 114,929,946 | | | | 24,670,046 | | | | 543,435,501 | |
| | | | | | | | | | | | | | | | |
LIABILITIES | | | | | | | | | | | | | | | | |
Payable for securities purchased | | | 12,880,715 | | | | 176,790 | | | | 60,000 | | | | 18,370,028 | |
Payable for delayed delivery securities purchased (Note 2) | | | — | | | | — | | | | — | | | | 18,759,689 | |
Payable for Fund shares redeemed | | | 809,764 | | | | 42,968 | | | | 7,026 | | | | 1,183,942 | |
Unrealized depreciation on forward foreign currency contracts (Note 2) | | | — | | | | 11,340 | | | | 216,083 | | | | — | |
Due to broker (Note 2) | | | 189,000 | | | | — | | | | — | | | | — | |
Dividends payable | | | — | | | | — | | | | — | | | | 258,429 | |
Management fees payable (Note 6) | | | 162,676 | | | | 74,091 | | | | 6,675 | | | | 167,705 | |
Deferred Trustees’ fees (Note 6) | | | 254,226 | | | | 107,916 | | | | 36,888 | | | | 245,799 | |
Administrative fees payable (Note 6) | | | 18,873 | | | | 4,579 | | | | 1,031 | | | | 18,194 | |
Other accounts payable and accrued expenses | | | 99,803 | | | | 66,953 | | | | 59,806 | | | | 132,184 | |
| | | | | | | | | | | | | | | | |
TOTAL LIABILITIES | | | 14,415,057 | | | | 484,637 | | | | 387,509 | | | | 39,135,970 | |
| | | | | | | | | | | | | | | | |
NET ASSETS | | $ | 521,902,616 | | | $ | 114,445,309 | | | $ | 24,282,537 | | | $ | 504,299,531 | |
| | | | | | | | | | | | | | | | |
NET ASSETS CONSIST OF: | | | | | | | | | | | | | | | | |
Paid-in capital | | $ | 498,916,578 | | | $ | 111,714,534 | | | $ | 22,688,367 | | | $ | 496,255,450 | |
Undistributed net investment income (Distributions in excess of net investment income) | | | 1,152,730 | | | | 932,138 | | | | 1,252,531 | | | | (504,228 | ) |
Accumulated net realized gain (loss) on investments and foreign currency transactions | | | 8,337,929 | | | | 11,271,794 | | | | 569,857 | | | | (1,298,097 | ) |
Net unrealized appreciation (depreciation) on investments and foreign currency translations | | | 13,495,379 | | | | (9,473,157 | ) | | | (228,218 | ) | | | 9,846,406 | |
| | | | | | | | | | | | | | | | |
NET ASSETS | | $ | 521,902,616 | | | $ | 114,445,309 | | | $ | 24,282,537 | | | $ | 504,299,531 | |
| | | | | | | | | | | | | | | | |
See accompanying notes to financial statements.
61 |
| | | | | | | | | | | | | | | | |
| | | Core Plus
Bond Fund | | | High Income
Fund | | | International
Bond Fund | | | Limited Term
Government
and Agency
Fund | |
COMPUTATION OF NET ASSET VALUE AND OFFERING PRICE: | | | | | | | | | | | | | | | | |
Class A shares: | | | | | | | | | | | | | | | | |
Net assets | | $ | 237,759,295 | | | $ | 59,906,677 | | | $ | 10,927,254 | | | $ | 293,674,629 | |
| | | | | | | | | | | | | | | | |
Shares of beneficial interest | | | 18,713,226 | | | | 13,441,161 | | | | 999,115 | | | | 24,734,914 | |
| | | | | | | | | | | | | | | | |
Net asset value and redemption price per share | | $ | 12.71 | | | $ | 4.46 | | | $ | 10.94 | | | $ | 11.87 | |
| | | | | | | | | | | | | | | | |
Offering price per share (100/[100-maximum sales charge] of net asset value) (Note 1) | | $ | 13.31 | | | $ | 4.67 | | | $ | 11.46 | | | $ | 12.24 | |
| | | | | | | | | | | | | | | | |
Class B shares: (redemption price per share is equal to net asset value less any applicable contingent deferred sales charge) (Note 1) | | | | | | | | | | | | | | | | |
Net assets | | $ | 3,092,073 | | | $ | 737,841 | | | $ | — | | | $ | 10,975,605 | |
| | | | | | | | | | | | | | | | |
Shares of beneficial interest | | | 242,479 | | | | 165,065 | | | | — | | | | 925,387 | |
| | | | | | | | | | | | | | | | |
Net asset value and offering price per share | | $ | 12.75 | | | $ | 4.47 | | | $ | — | | | $ | 11.86 | |
| | | | | | | | | | | | | | | | |
Class C shares: (redemption price per share is equal to net asset value less any applicable contingent deferred sales charge) (Note 1) | | | | | | | | | | | | | | | | |
Net assets | | $ | 137,836,091 | | | $ | 15,790,270 | | | $ | 7,503,382 | | | $ | 68,775,628 | |
| | | | | | | | | | | | | | | | |
Shares of beneficial interest | | | 10,842,202 | | | | 3,534,939 | | | | 690,279 | | | | 5,787,673 | |
| | | | | | | | | | | | | | | | |
Net asset value and offering price per share | | $ | 12.71 | | | $ | 4.47 | | | $ | 10.87 | | | $ | 11.88 | |
| | | | | | | | | | | | | | | | |
Class Y shares: | | | | | | | | | | | | | | | | |
Net assets | | $ | 143,215,157 | | | $ | 38,010,521 | | | $ | 5,851,901 | | | $ | 130,873,669 | |
| | | | | | | | | | | | | | | | |
Shares of beneficial interest | | | 11,204,576 | | | | 8,530,189 | | | | 535,257 | | | | 10,988,443 | |
| | | | | | | | | | | | | | | | |
Net asset value, offering and redemption price per share | | $ | 12.78 | | | $ | 4.46 | | | $ | 10.93 | | | $ | 11.91 | |
| | | | | | | | | | | | | | | | |
See accompanying notes to financial statements.
| 62
Statements of Operations
For the Year Ended September 30, 2011
| | | | | | | | | | | | | | | | |
| | | Core Plus
Bond Fund | | | High Income
Fund | | | International
Bond Fund | | | Limited Term
Government
and Agency
Fund | |
INVESTMENT INCOME | | | | | | | | | | | | | | | | |
Interest | | $ | 20,014,505 | | | $ | 10,526,318 | | | $ | 879,388 | | | $ | 9,212,539 | |
Dividends | | | 104,421 | | | | 445,659 | | | | — | | | | — | |
| | | | | | | | | | | | | | | | |
| | | 20,118,926 | | | | 10,971,977 | | | | 879,388 | | | | 9,212,539 | |
| | | | | | | | | | | | | | | | |
Expenses | | | | | | | | | | | | | | | | |
Management fees (Note 6) | | | 1,652,390 | | | | 973,876 | | | | 157,239 | | | | 1,862,522 | |
Service and distribution fees (Note 6) | | | 1,783,850 | | | | 400,652 | | | | 102,366 | | | | 1,351,006 | |
Administrative fees (Note 6) | | | 189,203 | | | | 75,402 | | | | 12,176 | | | | 187,246 | |
Trustees’ fees and expenses (Note 6) | | | 42,222 | | | | 25,078 | | | | 17,969 | | | | 38,627 | |
Transfer agent fees and expenses (Note 6) | | | 377,849 | | | | 163,551 | | | | 17,107 | | | | 378,854 | |
Audit and tax services fees | | | 49,183 | | | | 48,663 | | | | 49,334 | | | | 49,387 | |
Custodian fees and expenses | | | 32,184 | | | | 38,397 | | | | 44,661 | | | | 29,897 | |
Legal fees | | | 28,358 | | | | 2,645 | | | | 414 | | | | 6,572 | |
Registration fees | | | 75,894 | | | | 87,632 | | | | 52,679 | | | | 95,716 | |
Shareholder reporting expenses | | | 61,238 | | | | 15,653 | | | | 5,674 | | | | 40,031 | |
Miscellaneous expenses | | | 18,216 | | | | 11,131 | | | | 7,129 | | | | 16,830 | |
| | | | | | | | | | | | | | | | |
Total expenses | | | 4,310,587 | | | | 1,842,680 | | | | 466,748 | | | | 4,056,688 | |
Fee/expense recovery (Note 6) | | | — | | | | 14,930 | | | | — | | | | — | |
Less waiver and/or expense reimbursement (Note 6) | | | — | | | | — | | | | (141,627 | ) | | | (286,899 | ) |
| | | | | | | | | | | | | | | | |
Net expenses | | | 4,310,587 | | | | 1,857,610 | | | | 325,121 | | | | 3,769,789 | |
| | | | | | | | | | | | | | | | |
Net investment income | | | 15,808,339 | | | | 9,114,367 | | | | 554,267 | | | | 5,442,750 | |
| | | | | | | | | | | | | | | | |
NET REALIZED AND UNREALIZED GAIN (LOSS) ON INVESTMENTS AND FOREIGN CURRENCY TRANSACTIONS | | | | | | | | | | | | | | | | |
Net realized gain (loss) on: | | | | | | | | | | | | | | | | |
Investments | | | 11,410,140 | | | | 13,248,553 | | | | 2,157,361 | | | | 3,687,939 | |
Foreign currency transactions | | | 1,258,801 | | | | (114,002 | ) | | | 364,373 | | | | — | |
Net change in unrealized appreciation (depreciation) on: | | | | | | | | | | | | | | | | |
Investments | | | (13,755,321 | ) | | | (24,267,692 | ) | | | (2,307,197 | ) | | | (2,532,547 | ) |
Foreign currency translations | | | 582,642 | | | | 197,764 | | | | (378,994 | ) | | | — | |
| | | | | | | | | | | | | | | | |
Net realized and unrealized gain (loss) on investments and foreign currency transactions | | | (503,738 | ) | | | (10,935,377 | ) | | | (164,457 | ) | | | 1,155,392 | |
| | | | | | | | | | | | | | | | |
NET INCREASE (DECREASE) IN NET ASSETS RESULTING FROM OPERATIONS | | $ | 15,304,601 | | | $ | (1,821,010 | ) | | $ | 389,810 | | | $ | 6,598,142 | |
| | | | | | | | | | | | | | | | |
See accompanying notes to financial statements.
63 |
Statements of Changes in Net Assets
| | | | | | | | | | | | | | | | |
| | | Core Plus Bond Fund | | | High Income Fund | |
| | | Year Ended
September 30,
2011 | | | Year Ended
September 30,
2010 | | | Year Ended
September 30,
2011 | | | Year Ended
September 30,
2010 | |
FROM OPERATIONS: | | | | | | | | | | | | | | | | |
Net investment income | | $ | 15,808,339 | | | $ | 13,660,599 | | | $ | 9,114,367 | | | $ | 10,726,616 | |
Net realized gain on investments and foreign currency transactions | | | 12,668,941 | | | | 11,688,056 | | | | 13,134,551 | | | | 15,069,056 | |
Net change in unrealized appreciation (depreciation) on investments and foreign currency translations | | | (13,172,679 | ) | | | 13,900,860 | | | | (24,069,928 | ) | | | (11,929 | ) |
| | | | | | | | | | | | | | | | |
Net increase (decrease) in net assets resulting from operations | | | 15,304,601 | | | | 39,249,515 | | | | (1,821,010 | ) | | | 25,783,743 | |
| | | | | | | | | | | | | | | | |
FROM DISTRIBUTIONS TO SHAREHOLDERS: | | | | | | | | | | | | | | | | |
Net investment income | | | | | | | | | | | | | | | | |
Class A | | | (9,722,337 | ) | | | (8,308,883 | ) | | | (4,818,304 | ) | | | (4,606,994 | ) |
Class B | | | (140,826 | ) | | | (232,826 | ) | | | (55,282 | ) | | | (84,337 | ) |
Class C | | | (4,743,579 | ) | | | (4,369,129 | ) | | | (1,092,134 | ) | | | (1,149,766 | ) |
Class Y | | | (3,422,261 | ) | | | (2,762,927 | ) | | | (4,173,442 | ) | | | (5,066,381 | ) |
| | | | | | | | | | | | | | | | |
Total distributions | | | (18,029,003 | ) | | | (15,673,765 | ) | | | (10,139,162 | ) | | | (10,907,478 | ) |
| | | | | | | | | | | | | | | | |
NET INCREASE (DECREASE) IN NET ASSETS FROM CAPITAL SHARE TRANSACTIONS (NOTE 10) | | | 112,969,587 | | | | 128,799,979 | | | | (32,012,862 | ) | | | (41,510,546 | ) |
| | | | | | | | | | | | | | | | |
Net increase (decrease) in net assets | | | 110,245,185 | | | | 152,375,729 | | | | (43,973,034 | ) | | | (26,634,281 | ) |
NET ASSETS | | | | | | | | | | | | | | | | |
Beginning of the year | | | 411,657,431 | | | | 259,281,702 | | | | 158,418,343 | | | | 185,052,624 | |
| | | | | | | | | | | | | | | | |
End of the year | | $ | 521,902,616 | | | $ | 411,657,431 | | | $ | 114,445,309 | | | $ | 158,418,343 | |
| | | | | | | | | | | | | | | | |
UNDISTRIBUTED NET INVESTMENT INCOME | | $ | 1,152,730 | | | $ | 249,369 | | | $ | 932,138 | | | $ | 178,040 | |
| | | | | | | | | | | | | | | | |
See accompanying notes to financial statements.
| 64
Statements of Changes in Net Assets (continued)
| | | | | | | | | | | | | | | | |
| | | International Bond Fund | | | Limited Term Government and
Agency Fund | |
| | | Year Ended
September 30,
2011 | | | Year Ended
September 30,
2010 | | | Year Ended
September 30,
2011 | | | Year Ended
September 30,
2010 | |
FROM OPERATIONS: | | | | | | | | | | | | | | | | |
Net investment income | | $ | 554,267 | | | $ | 647,223 | | | $ | 5,442,750 | | | $ | 4,207,760 | |
Net realized gain on investments and foreign currency transactions | | | 2,521,734 | | | | 81,150 | | | | 3,687,939 | | | | 5,299,478 | |
Net change in unrealized appreciation (depreciation) on investments and foreign currency translations | | | (2,686,191 | ) | | | 1,114,447 | | | | (2,532,547 | ) | | | 5,267,995 | |
| | | | | | | | | | | | | | | | |
Net increase in net assets resulting from operations | | | 389,810 | | | | 1,842,820 | | | | 6,598,142 | | | | 14,775,233 | |
| | | | | | | | | | | | | | | | |
FROM DISTRIBUTIONS TO SHAREHOLDERS: | | | | | | | | | | | | | | | | |
Net investment income | | | | | | | | | | | | | | | | |
Class A | | | (571,142 | ) | | | (356,057 | ) | | | (5,000,378 | ) | | | (3,182,978 | ) |
Class B | | | — | | | | — | | | | (124,663 | ) | | | (65,117 | ) |
Class C | | | (182,583 | ) | | | (148,175 | ) | | | (990,378 | ) | | | (971,553 | ) |
Class Y | | | (143,686 | ) | | | (329,863 | ) | | | (2,328,759 | ) | | | (1,424,364 | ) |
Net realized capital gains | | | | | | | | | | | | | | | | |
Class A | | | (229,358 | ) | | | (81,934 | ) | | | (1,500,749 | ) | | | — | |
Class B | | | — | | | | — | | | | (29,955 | ) | | | — | |
Class C | | | (79,673 | ) | | | (46,824 | ) | | | (583,534 | ) | | | — | |
Class Y | | | (24,156 | ) | | | (94,216 | ) | | | (770,404 | ) | | | — | |
| | | | | | | | | | | | | | | | |
Total distributions | | | (1,230,598 | ) | | | (1,057,069 | ) | | | (11,328,820 | ) | | | (5,644,012 | ) |
| | | | | | | | | | | | | | | | |
NET INCREASE (DECREASE) IN NET ASSETS FROM CAPITAL SHARE TRANSACTIONS (NOTE 10) | | | (8,686,919 | ) | | | 8,541,560 | | | | 168,885,860 | | | | 128,975,189 | |
| | | | | | | | | | | | | | | | |
Net increase (decrease) in net assets | | | (9,527,707 | ) | | | 9,327,311 | | | | 164,155,182 | | | | 138,106,410 | |
NET ASSETS | | | | | | | | | | | | | | | | |
Beginning of the year | | | 33,810,244 | | | | 24,482,933 | | | | 340,144,349 | | | | 202,037,939 | |
| | | | | | | | | | | | | | | | |
End of the year | | $ | 24,282,537 | | | $ | 33,810,244 | | | $ | 504,299,531 | | | $ | 340,144,349 | |
| | | | | | | | | | | | | | | | |
UNDISTRIBUTED NET INVESTMENT INCOME (DISTRIBUTIONS IN EXCESS OF NET INVESTMENT INCOME) | | $ | 1,252,531 | | | $ | (163,380 | ) | | $ | (504,228 | ) | | $ | (127,347 | ) |
| | | | | | | | | | | | | | | | |
See accompanying notes to financial statements.
65 |
This Page Intentionally Left Blank
| 66
Financial Highlights
For a share outstanding throughout each period.
| | | | | | | | | | | | | | | | | | | | | | | | | | | | |
| | | | | | Income (Loss) from Investment
Operations: | | | Less Distributions: | |
| | | Net asset
value,
beginning
of the
period | | | Net
investment
income (a) | | | Net realized
and
unrealized
gain (loss) | | | Total from
investment
operations | | | Dividends
from net
investment
income | | | Distributions
from net
realized
capital
gains | | | Total
distributions | |
CORE PLUS BOND FUND | |
Class A | | | | | | | | | | | | | | | | | | | | | | | | | | | | |
9/30/2011 | | $ | 12.75 | | | $ | 0.52 | | | $ | 0.03 | (h) | | $ | 0.55 | | | $ | (0.59 | ) | | $ | — | | | $ | (0.59 | ) |
9/30/2010 | | | 11.91 | | | | 0.54 | | | | 0.91 | | | | 1.45 | | | | (0.61 | ) | | | — | | | | (0.61 | ) |
9/30/2009 | | | 10.54 | | | | 0.59 | | | | 1.44 | | | | 2.03 | | | | (0.66 | ) | | | — | | | | (0.66 | ) |
9/30/2008 | | | 11.31 | | | | 0.55 | | | | (0.71 | ) | | | (0.16 | ) | | | (0.61 | ) | | | — | | | | (0.61 | ) |
9/30/2007 | | | 11.23 | | | | 0.50 | | | | 0.14 | | | | 0.64 | | | | (0.56 | ) | | | — | | | | (0.56 | ) |
Class B | | | | | | | | | | | | | | | | | | | | | | | | | | | | |
9/30/2011 | | | 12.79 | | | | 0.42 | | | | 0.03 | (h) | | | 0.45 | | | | (0.49 | ) | | | — | | | | (0.49 | ) |
9/30/2010 | | | 11.95 | | | | 0.44 | | | | 0.92 | | | | 1.36 | | | | (0.52 | ) | | | — | | | | (0.52 | ) |
9/30/2009 | | | 10.57 | | | | 0.50 | | | | 1.45 | | | | 1.95 | | | | (0.57 | ) | | | — | | | | (0.57 | ) |
9/30/2008 | | | 11.31 | | | | 0.44 | | | | (0.67 | ) | | | (0.23 | ) | | | (0.51 | ) | | | — | | | | (0.51 | ) |
9/30/2007 | | | 11.24 | | | | 0.41 | | | | 0.13 | | | | 0.54 | | | | (0.47 | ) | | | — | | | | (0.47 | ) |
Class C | | | | | | | | | | | | | | | | | | | | | | | | | | | | |
9/30/2011 | | | 12.76 | | | | 0.42 | | | | 0.02 | (h) | | | 0.44 | | | | (0.49 | ) | | | — | | | | (0.49 | ) |
9/30/2010 | | | 11.92 | | | | 0.45 | | | | 0.91 | | | | 1.36 | | | | (0.52 | ) | | | — | | | | (0.52 | ) |
9/30/2009 | | | 10.55 | | | | 0.51 | | | | 1.44 | | | | 1.95 | | | | (0.58 | ) | | | — | | | | (0.58 | ) |
9/30/2008 | | | 11.32 | | | | 0.47 | | | | (0.71 | ) | | | (0.24 | ) | | | (0.53 | ) | | | — | | | | (0.53 | ) |
9/30/2007 | | | 11.25 | | | | 0.41 | | | | 0.13 | | | | 0.54 | | | | (0.47 | ) | | | — | | | | (0.47 | ) |
Class Y | | | | | | | | | | | | | | | | | | | | | | | | | | | | |
9/30/2011 | | | 12.82 | | | | 0.55 | | | | 0.03 | (h) | | | 0.58 | | | | (0.62 | ) | | | — | | | | (0.62 | ) |
9/30/2010 | | | 11.97 | | | | 0.57 | | | | 0.92 | | | | 1.49 | | | | (0.64 | ) | | | — | | | | (0.64 | ) |
9/30/2009 | | | 10.60 | | | | 0.62 | | | | 1.44 | | | | 2.06 | | | | (0.69 | ) | | | — | | | | (0.69 | ) |
9/30/2008 | | | 11.36 | | | | 0.58 | | | | (0.70 | ) | | | (0.12 | ) | | | (0.64 | ) | | | — | | | | (0.64 | ) |
9/30/2007 | | | 11.29 | | | | 0.54 | | | | 0.13 | | | | 0.67 | | | | (0.60 | ) | | | — | | | | (0.60 | ) |
| (a) | Per share net investment income has been calculated using the average shares outstanding during the period. |
| (b) | Amount rounds to less than $0.01 per share, if applicable. |
| (c) | Effective June 2, 2008, redemption fees were eliminated. |
| (d) | A sales charge for Class A shares and a contingent deferred sales charge for Class B and Class C shares are not reflected in total return calculations. Periods less than one year, if applicable, are not annualized. |
See accompanying notes to financial statements.
67 |
| | | | | | | | | | | | | | | | | | | | | | | | | | | | | | |
| | | | | | | | | | | | | Ratios to Average Net Assets: | | | | |
Redemption
fees (b)(c) | | | Net asset
value,
end of
the period | | | Total
return
(%) (d)(e) | | | Net assets,
end of
the period
(000’s) | | | Net
expenses
(%) (f)(g) | | | Gross
expenses
(%) (g) | | | Net investment
income
(%) (g) | | | Portfolio
turnover
rate (%) | |
| | | | | | | | | | | | | | | | | | | | | | | | | | | | | | |
| | | | | | | | | | | | | | | | | | | | | | | | | | | | | | |
| $ | — | | | $ | 12.71 | | | | 4.42 | | | $ | 237,759 | | | | 0.87 | | | | 0.87 | | | | 4.07 | | | | 86 | |
| | — | | | | 12.75 | | | | 12.55 | | | | 214,723 | | | | 0.90 | | | | 0.90 | | | | 4.41 | | | | 87 | |
| | — | | | | 11.91 | | | | 20.07 | | | | 140,779 | | | | 0.90 | | | | 0.97 | | | | 5.43 | | | | 102 | |
| | 0.00 | | | | 10.54 | | | | (1.61 | ) | | | 115,873 | | | | 0.93 | | | | 1.04 | | | | 4.86 | | | | 82 | |
| | 0.00 | | | | 11.31 | | | | 5.70 | | | | 105,780 | | | | 1.04 | | | | 1.09 | | | | 4.41 | | | | 69 | |
| | | | | | | | | | | | | | | | | | | | | | | | | | | | | | |
| | — | | | | 12.75 | | | | 3.60 | | | | 3,092 | | | | 1.62 | | | | 1.62 | | | | 3.32 | | | | 86 | |
| | — | | | | 12.79 | | | | 11.64 | | | | 4,490 | | | | 1.65 | | | | 1.65 | | | | 3.64 | | | | 87 | |
| | — | | | | 11.95 | | | | 19.19 | | | | 7,028 | | | | 1.65 | | | | 1.72 | | | | 4.66 | | | | 102 | |
| | 0.00 | | | | 10.57 | | | | (2.21 | ) | | | 10,481 | | | | 1.70 | | | | 1.80 | | | | 3.92 | | | | 82 | |
| | 0.00 | | | | 11.31 | | | | 4.90 | | | | 87,101 | | | | 1.79 | | | | 1.85 | | | | 3.64 | | | | 69 | |
| | | | | | | | | | | | | | | | | | | | | | | | | | | | | | |
| | — | | | | 12.71 | | | | 3.56 | | | | 137,836 | | | | 1.62 | | | | 1.62 | | | | 3.32 | | | | 86 | |
| | — | | | | 12.76 | | | | 11.71 | | | | 123,123 | | | | 1.65 | | | | 1.65 | | | | 3.66 | | | | 87 | |
| | — | | | | 11.92 | | | | 19.20 | | | | 77,081 | | | | 1.65 | | | | 1.72 | | | | 4.69 | | | | 102 | |
| | 0.00 | | | | 10.55 | | | | (2.32 | ) | | | 26,698 | | | | 1.68 | | | | 1.79 | | | | 4.17 | | | | 82 | |
| | 0.00 | | | | 11.32 | | | | 4.91 | | | | 12,690 | | | | 1.78 | | | | 1.82 | | | | 3.66 | | | | 69 | |
| | | | | | | | | | | | | | | | | | | | | | | | | | | | | | |
| | — | | | | 12.78 | | | | 4.65 | | | | 143,215 | | | | 0.62 | | | | 0.62 | | | | 4.31 | | | | 86 | |
| | — | | | | 12.82 | | | | 12.85 | | | | 69,322 | | | | 0.65 | | | | 0.65 | | | | 4.66 | | | | 87 | |
| | — | | | | 11.97 | | | | 20.37 | | | | 34,394 | | | | 0.65 | | | | 0.68 | | | | 5.67 | | | | 102 | |
| | 0.00 | | | | 10.60 | | | | (1.36 | ) | | | 20,407 | | | | 0.68 | | | | 0.75 | | | | 5.14 | | | | 82 | |
| | 0.00 | | | | 11.36 | | | | 6.06 | | | | 15,946 | | | | 0.70 | | | | 0.75 | | | | 4.75 | | | | 69 | |
| (e) | Had certain expenses not been waived/reimbursed during the period, if applicable, total returns would have been lower. |
| (f) | The investment adviser and/or administrator agreed to waive its fees and/or reimburse a portion of the Fund’s expenses during the period. Without this waiver/reimbursement, if applicable, expenses would have been higher. |
| (g) | Computed on an annualized basis for periods less than one year, if applicable. |
| (h) | The amount shown for a share outstanding does not correspond with the aggregate realized and unrealized gain (loss) on investments for the period due to the timing of sales and redemptions of fund shares in relation to fluctuating market values of investments of the Fund. |
See accompanying notes to financial statements.
| 68
Financial Highlights (continued)
For a share outstanding throughout each period.
| | | | | | | | | | | | | | | | | | | | | | | | | | | | |
| | | | | | Income (Loss) from Investment
Operations: | | | Less Distributions: | |
| | | Net asset
value,
beginning
of the
period | | | Net
investment
income (a) | | | Net realized
and
unrealized
gain (loss) | | | Total from
investment
operations | | | Dividends
from net
investment
income | | | Distributions
from net
realized
capital
gains | | | Total
distributions | |
HIGH INCOME FUND | |
Class A | | | | | | | | | | | | | | | | | | | | | | | | | | | | |
9/30/2011 | | $ | 4.91 | | | $ | 0.28 | | | $ | (0.42 | ) | | $ | (0.14 | ) | | $ | (0.31 | ) | | $ | — | | | $ | (0.31 | ) |
9/30/2010 | | | 4.49 | | | | 0.32 | | | | 0.42 | | | | 0.74 | | | | (0.32 | ) | | | — | | | | (0.32 | ) |
9/30/2009 | | | 4.24 | | | | 0.34 | | | | 0.24 | | | | 0.58 | | | | (0.33 | ) | | | — | | | | (0.33 | ) |
9/30/2008 | | | 5.12 | | | | 0.34 | | | | (0.87 | ) | | | (0.53 | ) | | | (0.35 | ) | | | — | | | | (0.35 | ) |
9/30/2007 | | | 5.09 | | | | 0.33 | | | | 0.08 | | | | 0.41 | | | | (0.38 | ) | | | — | | | | (0.38 | ) |
Class B | | | | | | | | | | | | | | | | | | | | | | | | | | | | |
9/30/2011 | | | 4.92 | | | | 0.25 | | | | (0.43 | ) | | | (0.18 | ) | | | (0.27 | ) | | | — | | | | (0.27 | ) |
9/30/2010 | | | 4.50 | | | | 0.28 | | | | 0.42 | | | | 0.70 | | | | (0.28 | ) | | | — | | | | (0.28 | ) |
9/30/2009 | | | 4.25 | | | | 0.31 | | | | 0.25 | | | | 0.56 | | | | (0.31 | ) | | | — | | | | (0.31 | ) |
9/30/2008 | | | 5.13 | | | | 0.30 | | | | (0.87 | ) | | | (0.57 | ) | | | (0.31 | ) | | | — | | | | (0.31 | ) |
9/30/2007 | | | 5.10 | | | | 0.29 | | | | 0.07 | | | | 0.36 | | | | (0.33 | ) | | | — | | | | (0.33 | ) |
Class C | | | | | | | | | | | | | | | | | | | | | | | | | | | | |
9/30/2011 | | | 4.92 | | | | 0.25 | | | | (0.43 | ) | | | (0.18 | ) | | | (0.27 | ) | | | — | | | | (0.27 | ) |
9/30/2010 | | | 4.50 | | | | 0.28 | | | | 0.43 | | | | 0.71 | | | | (0.29 | ) | | | — | | | | (0.29 | ) |
9/30/2009 | | | 4.24 | | | | 0.31 | | | | 0.26 | | | | 0.57 | | | | (0.31 | ) | | | — | | | | (0.31 | ) |
9/30/2008 | | | 5.12 | | | | 0.31 | | | | (0.87 | ) | | | (0.56 | ) | | | (0.32 | ) | | | — | | | | (0.32 | ) |
9/30/2007 | | | 5.09 | | | | 0.29 | | | | 0.07 | | | | 0.36 | | | | (0.33 | ) | | | — | | | | (0.33 | ) |
Class Y | | | | | | | | | | | | | | | | | | | | | | | | | | | | |
9/30/2011 | | | 4.90 | | | | 0.29 | | | | (0.41 | ) | | | (0.12 | ) | | | (0.32 | ) | | | — | | | | (0.32 | ) |
9/30/2010 | | | 4.49 | | | | 0.33 | | | | 0.41 | | | | 0.74 | | | | (0.33 | ) | | | — | | | | (0.33 | ) |
9/30/2009 | | | 4.24 | | | | 0.34 | | | | 0.25 | | | | 0.59 | | | | (0.34 | ) | | | — | | | | (0.34 | ) |
9/30/2008* | | | 4.87 | | | | 0.22 | | | | (0.65 | ) | | | (0.43 | ) | | | (0.21 | ) | | | — | | | | (0.21 | ) |
INTERNATIONAL BOND FUND | |
Class A | | | | | | | | | | | | | | | | | | | | | | | | | | | | |
9/30/2011 | | $ | 11.17 | | | $ | 0.25 | | | $ | 0.06 | (i) | | $ | 0.31 | | | $ | (0.40 | ) | | $ | (0.14 | ) | | $ | (0.54 | ) |
9/30/2010 | | | 10.84 | | | | 0.22 | | | | 0.48 | | | | 0.70 | | | | (0.29 | ) | | | (0.08 | ) | | | (0.37 | ) |
9/30/2009 | | | 9.19 | | | | 0.32 | | | | 1.53 | | | | 1.85 | | | | (0.20 | ) | | | — | | | | (0.20 | ) |
9/30/2008(j) | | | 10.00 | | | | 0.17 | | | | (0.79 | ) | | | (0.62 | ) | | | (0.19 | ) | | | — | | | | (0.19 | ) |
Class C | | | | | | | | | | | | | | | | | | | | | | | | | | | | |
9/30/2011 | | | 11.11 | | | | 0.17 | | | | 0.05 | (i) | | | 0.22 | | | | (0.32 | ) | | | (0.14 | ) | | | (0.46 | ) |
9/30/2010 | | | 10.82 | | | | 0.15 | | | | 0.46 | | | | 0.61 | | | | (0.24 | ) | | | (0.08 | ) | | | (0.32 | ) |
9/30/2009 | | | 9.18 | | | | 0.24 | | | | 1.53 | | | | 1.77 | | | | (0.13 | ) | | | — | | | | (0.13 | ) |
9/30/2008(j) | | | 10.00 | | | | 0.13 | | | | (0.81 | ) | | | (0.68 | ) | | | (0.15 | ) | | | — | | | | (0.15 | ) |
Class Y | | | | | | | | | | | | | | | | | | | | | | | | | | | | |
9/30/2011 | | | 11.16 | | | | 0.28 | | | | 0.06 | (i) | | | 0.34 | | | | (0.43 | ) | | | (0.14 | ) | | | (0.57 | ) |
9/30/2010 | | | 10.82 | | | | 0.25 | | | | 0.47 | | | | 0.72 | | | | (0.30 | ) | | | (0.08 | ) | | | (0.38 | ) |
9/30/2009 | | | 9.18 | | | | 0.33 | | | | 1.53 | | | | 1.86 | | | | (0.22 | ) | | | ��� | | | | (0.22 | ) |
9/30/2008(j) | | | 10.00 | | | | 0.18 | | | | (0.81 | ) | | | (0.63 | ) | | | (0.20 | ) | | | — | | | | (0.20 | ) |
| * | From commencement of Class operations on February 29, 2008 through September 30, 2008. |
| (a) | Per share net investment income has been calculated using the average shares outstanding during the period. |
| (b) | Amount rounds to less than $0.01 per share, if applicable. |
| (c) | Had certain expenses not been waived/reimbursed during the period, if applicable, total returns would have been lower. |
| (d) | A sales charge for Class A shares and a contingent deferred sales charge for Class B and Class C shares are not reflected in total return calculations. Periods less than one year, if applicable, are not annualized. |
| (e) | The investment adviser and/or administrator agreed to waive its fees and/or reimburse a portion of the Fund’s expenses during the period. Without this waiver/reimbursement, if applicable, expenses would have been higher. |
See accompanying notes to financial statements.
69 |
| | | | | | | | | | | | | | | | | | | | | | | | | | | | | | |
| | | | | | | | | | | | | Ratios to Average Net Assets: | | | | |
Redemption
fees (b) | | | Net asset
value,
end of
the period | | | Total
return
(%) (c)(d) | | | Net assets,
end of
the period
(000’s) | | | Net
expenses
(%) (e)(f) | | | Gross
expenses
(%) (f) | | | Net investment
income
(%) (f) | | | Portfolio
turnover
rate (%) | |
| | | | | | | | | | | | | | | | | | | | | | | | | | | | | | |
| | | | | | | | | | | | | | | | | | | | | | | | | | | | | | |
| $ | — | | | $ | 4.46 | | | | (3.30 | ) | | $ | 59,907 | | | | 1.15 | (g) | | | 1.15 | (g) | | | 5.60 | | | | 67 | |
| | — | | | | 4.91 | | | | 17.05 | | | | 68,011 | | | | 1.15 | | | | 1.20 | | | | 6.72 | | | | 56 | |
| | 0.00 | (h) | | | 4.49 | | | | 15.97 | | | | 59,944 | | | | 1.15 | | | | 1.28 | | | | 8.82 | | | | 30 | |
| | 0.00 | | | | 4.24 | | | | (10.98 | ) | | | 38,577 | | | | 1.15 | | | | 1.40 | | | | 7.01 | | | | 27 | |
| | 0.00 | | | | 5.12 | | | | 8.10 | | | | 32,603 | | | | 1.18 | | | | 1.43 | | | | 6.40 | | | | 41 | |
| | | | | | | | | | | | | | | | | | | | | | | | | | | | | | |
| | — | | | | 4.47 | | | | (4.04 | ) | | | 738 | | | | 1.90 | (g) | | | 1.90 | (g) | | | 4.90 | | | | 67 | |
| | — | | | | 4.92 | | | | 16.13 | | | | 1,209 | | | | 1.90 | | | | 1.94 | | | | 6.00 | | | | 56 | |
| | 0.00 | (h) | | | 4.50 | | | | 15.06 | | | | 1,569 | | | | 1.90 | | | | 2.06 | | | | 8.32 | | | | 30 | |
| | 0.00 | | | | 4.25 | | | | (11.64 | ) | | | 2,267 | | | | 1.90 | | | | 2.15 | | | | 6.15 | | | | 27 | |
| | 0.00 | | | | 5.13 | | | | 7.21 | | | | 4,201 | | | | 1.94 | | | | 2.18 | | | | 5.63 | | | | 41 | |
| | | | | | | | | | | | | | | | | | | | | | | | | | | | | | |
| | — | | | | 4.47 | | | | (4.02 | ) | | | 15,790 | | | | 1.90 | (g) | | | 1.90 | (g) | | | 4.89 | | | | 67 | |
| | — | | | | 4.92 | | | | 16.15 | | | | 19,312 | | | | 1.90 | | | | 1.95 | | | | 5.97 | | | | 56 | |
| | 0.00 | (h) | | | 4.50 | | | | 15.37 | | | | 17,827 | | | | 1.90 | | | | 2.03 | | | | 8.09 | | | | 30 | |
| | 0.00 | | | | 4.24 | | | | (11.62 | ) | | | 9,945 | | | | 1.90 | | | | 2.15 | | | | 6.32 | | | | 27 | |
| | 0.00 | | | | 5.12 | | | | 7.22 | | | | 5,275 | | | | 1.93 | | | | 2.17 | | | | 5.63 | | | | 41 | |
| | | | | | | | | | | | | | | | | | | | | | | | | | | | | | |
| | — | | | | 4.46 | | | | (2.86 | ) | | | 38,011 | | | | 0.90 | (g) | | | 0.90 | (g) | | | 5.86 | | | | 67 | |
| | — | | | | 4.90 | | | | 17.11 | | | | 69,887 | | | | 0.90 | | | | 0.93 | | | | 7.02 | | | | 56 | |
| | 0.00 | (h) | | | 4.49 | | | | 16.29 | | | | 105,713 | | | | 0.90 | | | | 0.92 | | | | 8.32 | | | | 30 | |
| | 0.01 | | | | 4.24 | | | | (9.10 | ) | | | 3,833 | | | | 0.90 | | | | 1.15 | | | | 8.03 | | | | 27 | |
| | | | | | | | | | | | | | | | | | | | | | | | | | | | | | |
| | | | | | | | | | | | | | | | | | | | | | | | | | | | | | |
| $ | — | | | $ | 10.94 | | | | 2.70 | | | $ | 10,927 | | | | 1.10 | | | | 1.64 | | | | 2.26 | | | | 136 | |
| | — | | | | 11.17 | | | | 6.66 | | | | 18,758 | | | | 1.10 | | | | 1.49 | | | | 2.14 | | | | 128 | |
| | — | | | | 10.84 | | | | 20.41 | | | | 8,479 | | | | 1.10 | | | | 2.11 | | | | 3.29 | | | | 91 | |
| | 0.00 | (k) | | | 9.19 | | | | (6.37 | ) | | | 1,953 | | | | 1.10 | | | | 2.95 | | | | 2.66 | | | | 60 | |
| | | | | | | | | | | | | | | | | | | | | | | | | | | | | | |
| | — | | | | 10.87 | | | | 1.87 | | | | 7,503 | | | | 1.85 | | | | 2.40 | | | | 1.52 | | | | 136 | |
| | — | | | | 11.11 | | | | 5.86 | | | | 6,145 | | | | 1.85 | | | | 2.24 | | | | 1.40 | | | | 128 | |
| | — | | | | 10.82 | | | | 19.58 | | | | 2,955 | | | | 1.85 | | | | 2.93 | | | | 2.56 | | | | 91 | |
| | 0.01 | (k) | | | 9.18 | | | | (6.95 | ) | | | 683 | | | | 1.85 | | | | 3.70 | | | | 1.92 | | | | 60 | |
| | | | | | | | | | | | | | | | | | | | | | | | | | | | | | |
| | — | | | | 10.93 | | | | 3.06 | | | | 5,852 | | | | 0.85 | | | | 1.36 | | | | 2.47 | | | | 136 | |
| | — | | | | 11.16 | | | | 6.92 | | | | 8,908 | | | | 0.85 | | | | 1.23 | | | | 2.41 | | | | 128 | |
| | — | | | | 10.82 | | | | 20.73 | | | | 13,049 | | | | 0.85 | | | | 1.92 | | | | 3.53 | | | | 91 | |
| | 0.01 | (k) | | | 9.18 | | | | (6.39 | ) | | | 9,981 | | | | 0.85 | | | | 2.48 | | | | 2.74 | | | | 60 | |
| (f) | Computed on an annualized basis for periods less than one year, if applicable. |
| (g) | Includes fee/expense recovery of 0.01%. |
| (h) | Effective June 1, 2009, redemption fees were eliminated. |
| (i) | The amount shown for a share outstanding does not correspond with the aggregate realized and unrealized gain (loss) on investments for the period due to the timing of sales and redemptions of fund shares in relation to fluctuating market values of investments of the Fund. |
| (j) | For the period February 1, 2008 (inception) through September 30, 2008. |
| (k) | Effective June 2, 2008, redemption fees were eliminated. |
See accompanying notes to financial statements.
| 70
Financial Highlights (continued)
For a share outstanding throughout each period.
| | | | | | | | | | | | | | | | | | | | | | | | | | | | |
| | | | | | Income (Loss) from Investment
Operations: | | | Less Distributions: | |
| | | Net asset
value,
beginning
of the
period | | | Net
investment
income (a) | | | Net realized
and
unrealized
gain (loss) | | | Total from
investment
operations | | | Dividends
from net
investment
income | | | Distributions
from net
realized
capital
gains | | | Total
distributions | |
LIMITED TERM GOVERNMENTAND AGENCY FUND | |
Class A | | | | | | | | | | | | | | | | | | | | | | | | | | | | |
9/30/2011 | | $ | 12.02 | | | $ | 0.17 | | | $ | 0.03 | | | $ | 0.20 | | | $ | (0.26 | ) | | $ | (0.09 | ) | | $ | (0.35 | ) |
9/30/2010 | | | 11.60 | | | | 0.20 | | | | 0.49 | | | | 0.69 | | | | (0.27 | ) | | | — | | | | (0.27 | ) |
9/30/2009 | | | 10.98 | | | | 0.35 | | | | 0.63 | | | | 0.98 | | | | (0.36 | ) | | | — | | | | (0.36 | ) |
9/30/2008 | | | 11.00 | | | | 0.45 | | | | 0.02 | | | | 0.47 | | | | (0.49 | ) | | | — | | | | (0.49 | ) |
9/30/2007 | | | 11.00 | | | | 0.45 | | | | 0.03 | | | | 0.48 | | | | (0.48 | ) | | | — | | | | (0.48 | ) |
Class B | | | | | | | | | | | | | | | | | | | | | | | | | | | | |
9/30/2011 | | | 12.00 | | | | 0.09 | | | | 0.03 | | | | 0.12 | | | | (0.17 | ) | | | (0.09 | ) | | | (0.26 | ) |
9/30/2010 | | | 11.59 | | | | 0.12 | | | | 0.47 | | | | 0.59 | | | | (0.18 | ) | | | — | | | | (0.18 | ) |
9/30/2009 | | | 10.97 | | | | 0.26 | | | | 0.63 | | | | 0.89 | | | | (0.27 | ) | | | — | | | | (0.27 | ) |
9/30/2008 | | | 10.99 | | | | 0.36 | | | | 0.02 | | | | 0.38 | | | | (0.40 | ) | | | — | | | | (0.40 | ) |
9/30/2007 | | | 10.98 | | | | 0.37 | | | | 0.03 | | | | 0.40 | | | | (0.39 | ) | | | — | | | | (0.39 | ) |
Class C | | | | | | | | | | | | | | | | | | | | | | | | | | | | |
9/30/2011 | | | 12.03 | | | | 0.08 | | | | 0.03 | | | | 0.11 | | | | (0.17 | ) | | | (0.09 | ) | | | (0.26 | ) |
9/30/2010 | | | 11.61 | | | | 0.12 | | | | 0.48 | | | | 0.60 | | | | (0.18 | ) | | | — | | | | (0.18 | ) |
9/30/2009 | | | 10.99 | | | | 0.26 | | | | 0.63 | | | | 0.89 | | | | (0.27 | ) | | | — | | | | (0.27 | ) |
9/30/2008 | | | 11.00 | | | | 0.36 | | | | 0.03 | | | | 0.39 | | | | (0.40 | ) | | | — | | | | (0.40 | ) |
9/30/2007 | | | 10.99 | | | | 0.37 | | | | 0.03 | | | | 0.40 | | | | (0.39 | ) | | | — | | | | (0.39 | ) |
Class Y | | | | | | | | | | | | | | | | | | | | | | | | | | | | |
9/30/2011 | | | 12.05 | | | | 0.20 | | | | 0.04 | | | | 0.24 | | | | (0.29 | ) | | | (0.09 | ) | | | (0.38 | ) |
9/30/2010 | | | 11.64 | | | | 0.23 | | | | 0.48 | | | | 0.71 | | | | (0.30 | ) | | | — | | | | (0.30 | ) |
9/30/2009 | | | 11.01 | | | | 0.39 | | | | 0.63 | | | | 1.02 | | | | (0.39 | ) | | | — | | | | (0.39 | ) |
9/30/2008 | | | 11.03 | | | | 0.47 | | | | 0.02 | | | | 0.49 | | | | (0.51 | ) | | | — | | | | (0.51 | ) |
9/30/2007 | | | 11.03 | | | | 0.49 | | | | 0.03 | | | | 0.52 | | | | (0.52 | ) | | | — | | | | (0.52 | ) |
| (a) | Per share net investment income has been calculated using the average shares outstanding during the period. |
| (b) | A sales charge for Class A shares and a contingent deferred sales charge for Class B and Class C shares are not reflected in total return calculations. Periods less than one year, if applicable, are not annualized. |
See accompanying notes to financial statements.
71 |
| | | | | | | | | | | | | | | | | | | | | | | | | | |
| | | | | | | | | | Ratios to Average Net Assets: | | | | |
Net asset
value,
end of
the period | | | Total
return
(%) (b)(c) | | | Net assets,
end of
the period
(000’s) | | | Net
expenses
(%) (d)(e) | | | Gross
expenses
(%) (d) | | | Net investment
income
(%) (d) | | | Portfolio
turnover
rate (%) | |
| | | | | | | | | | | | | | | | | | | | | | | | | | |
| | | | | | | | | | | | | | | | | | | | | | | | | | |
| $ | 11.87 | | | | 1.71 | | | $ | 293,675 | | | | 0.85 | | | | 0.92 | | | | 1.44 | | | | 66 | |
| | 12.02 | | | | 6.03 | | | | 164,265 | | | | 0.89 | | | | 0.97 | | | | 1.73 | | | | 89 | |
| | 11.60 | | | | 9.05 | | | | 118,619 | | | | 0.90 | | | | 0.99 | | | | 3.10 | | | | 77 | |
| | 10.98 | | | | 4.29 | | | | 105,047 | | | | 0.92 | | | | 1.07 | | | | 4.04 | | | | 52 | |
| | 11.00 | | | | 4.46 | | | | 108,536 | | | | 0.99 | | | | 1.10 | | | | 4.13 | | | | 45 | |
| | | | | | | | | | | | | | | | | | | | | | | | | | |
| | 11.86 | | | | 1.04 | | | | 10,976 | | | | 1.60 | | | | 1.68 | | | | 0.72 | | | | 66 | |
| | 12.00 | | | | 5.16 | | | | 4,049 | | | | 1.64 | | | | 1.72 | | | | 1.00 | | | | 89 | |
| | 11.59 | | | | 8.24 | | | | 4,442 | | | | 1.65 | | | | 1.74 | | | | 2.32 | | | | 77 | |
| | 10.97 | | | | 3.52 | | | | 4,532 | | | | 1.67 | | | | 1.82 | | | | 3.29 | | | | 52 | |
| | 10.99 | | | | 3.72 | | | | 6,787 | | | | 1.74 | | | | 1.85 | | | | 3.37 | | | | 45 | |
| | | | | | | | | | | | | | | | | | | | | | | | | | |
| | 11.88 | | | | 0.96 | | | | 68,776 | | | | 1.60 | | | | 1.67 | | | | 0.68 | | | | 66 | |
| | 12.03 | | | | 5.24 | | | | 75,984 | | | | 1.64 | | | | 1.72 | | | | 0.98 | | | | 89 | |
| | 11.61 | | | | 8.24 | | | | 50,973 | | | | 1.65 | | | | 1.74 | | | | 2.32 | | | | 77 | |
| | 10.99 | | | | 3.62 | | | | 22,711 | | | | 1.66 | | | | 1.83 | | | | 3.29 | | | | 52 | |
| | 11.00 | | | | 3.62 | | | | 5,261 | | | | 1.74 | | | | 1.85 | | | | 3.38 | | | | 45 | |
| | | | | | | | | | | | | | | | | | | | | | | | | | |
| | 11.91 | | | | 2.05 | | | | 130,874 | | | | 0.60 | | | | 0.67 | | | | 1.68 | | | | 66 | |
| | 12.05 | | | | 6.20 | | | | 95,847 | | | | 0.63 | | | | 0.71 | | | | 1.94 | | | | 89 | |
| | 11.64 | | | | 9.40 | | | | 28,004 | | | | 0.65 | | | | 0.72 | | | | 3.42 | | | | 77 | |
| | 11.01 | | | | 4.55 | | | | 6,577 | | | | 0.67 | | | | 0.72 | | | | 4.28 | | | | 52 | |
| | 11.03 | | | | 4.79 | | | | 4,201 | | | | 0.71 | | | | 0.75 | | | | 4.43 | | | | 45 | |
| (c) | Had certain expenses not been waived/reimbursed during the period, if applicable, total returns would have been lower. |
| (d) | Computed on an annualized basis for periods less than one year, if applicable. |
| (e) | The investment adviser and/or administrator agreed to waive its fees and/or reimburse a portion of the Fund’s expenses during the period. Without this waiver/reimbursement, if applicable, expenses would have been higher. |
See accompanying notes to financial statements.
| 72
Notes to Financial Statements
September 30, 2011
1. Organization. Natixis Funds Trust I and Loomis Sayles Funds II (the “Trusts” and each a “Trust”) are each organized as a Massachusetts business trust. Each Trust is registered under the Investment Company Act of 1940, as amended (“1940 Act”), as an open-end management investment company. Each Declaration of Trust permits the Board of Trustees to authorize the issuance of an unlimited number of shares of the Trust in multiple series. The financial statements for certain funds of the Trusts are presented in separate reports. The following funds (individually, a “Fund” and collectively, the “Funds”) are included in this report:
Natixis Funds Trust I:
Loomis Sayles Core Plus Bond Fund (the “Core Plus Bond Fund”)
Loomis Sayles Funds II:
Loomis Sayles High Income Fund (the “High Income Fund”)
Loomis Sayles International Bond Fund (the “International Bond Fund”)
Loomis Sayles Limited Term Government and Agency Fund (the “Limited Term Government and Agency Fund”)
Each Fund is a diversified investment company, except for International Bond Fund, which is a non-diversified investment company.
The Funds each offer Class A, Class C and Class Y shares. Effective October 12, 2007, Class B shares are no longer offered. Existing Class B shareholders may continue to reinvest dividends into Class B shares and exchange their Class B shares for Class B shares of other Natixis Funds subject to existing exchange privileges as described in the prospectus.
Class A shares of all Funds except Limited Term Government and Agency Fund are sold with a maximum front-end sales charge of 4.50%. Class A shares of Limited Term Government and Agency Fund are sold with a maximum front-end sales charge of 3.00%. Class B shares do not pay a front-end sales charge; however, they are charged higher Rule 12b-1 fees, and are subject to a contingent deferred sales charge (“CDSC”) if such shares are redeemed within six years of purchase. After eight years of ownership, Class B shares convert to Class A shares. Class C shares do not pay a front-end sales charge, do not convert to any other class of shares, pay higher Rule 12b-1 fees than Class A shares and may be subject to a CDSC of 1.00% if those shares are redeemed within one year of acquisition, except for reinvested distributions. Class Y shares do not pay a front-end sales charge, a CDSC or Rule 12b-1 fees. Class Y shares are generally intended for institutional investors with a minimum initial investment of $100,000, though some categories of investors are exempted from the minimum investment amount as outlined in the Funds’ prospectus.
Most expenses of the Trusts can be directly attributed to a Fund. Expenses which cannot be directly attributed to a Fund are generally apportioned based on the relative net assets of each of the Funds in the Trusts. Expenses of a Fund are borne pro rata by
73 |
Notes to Financial Statements (continued)
September 30, 2011
the holders of each class of shares, except that each class bears expenses unique to that class (including the Rule 12b-1 service and distribution fees). In addition, each class votes as a class only with respect to its own Rule 12b-1 Plan. Shares of each class would receive their pro rata share of the net assets of a Fund if the Fund were liquidated. The Trustees approve separate distributions from net investment income on each class of shares.
2. Significant Accounting Policies. The following is a summary of significant accounting policies consistently followed by each Fund in the preparation of its financial statements. The Funds’ financial statements are prepared in accordance with accounting principles generally accepted in the United States of America which require the use of management estimates that affect the reported amounts and disclosures in the financial statements. Actual results could differ from those estimates. Management has evaluated the events and transactions subsequent to year-end through the date the financial statements were issued and has determined that there were no material events that would require disclosure in the Funds’ financial statements.
a. Valuation. Debt securities (other than short-term obligations purchased with an original or remaining maturity of sixty days or less) and unlisted equity securities are generally valued on the basis of evaluated bids furnished to the Funds by a pricing service recommended by the investment adviser and approved by the Board of Trustees, which service determines valuations for normal, institutional-size trading units of such securities using market information, transactions for comparable securities and various relationships between securities which are generally recognized by institutional traders. Senior loans shall be priced at bid prices supplied by a pricing service, if available. Equity securities, including shares of closed-end investment companies and exchange-traded funds, for which market quotations are readily available are valued at market value, as reported by pricing services recommended by the investment adviser and approved by the Board of Trustees. Such pricing services generally use the security’s last sale price on the exchange or market where the security is primarily traded or, if there is no reported sale during the day, the closing bid price. Securities traded on the NASDAQ Global Select Market, NASDAQ Global Market and NASDAQ Capital Market are valued at the NASDAQ Official Closing Price (“NOCP”), or if lacking a NOCP, at the most recent bid quotation on the applicable NASDAQ Market. Broker-dealer bid quotations may also be used to value debt and equity securities where a pricing service does not price a security or where a pricing service does not provide a reliable price for the security. In instances where broker-dealer bid quotations are not available, certain securities held by the Funds may be valued on the basis of a price provided by a principal market maker. Forward foreign currency contracts are valued utilizing interpolated prices determined from information provided by an independent pricing service. Swap agreements are valued based on mid prices supplied by a pricing service, if available, or quotations obtained from broker-dealers. Investments in other open-end investment companies are valued at their net
| 74
Notes to Financial Statements (continued)
September 30, 2011
asset value each day. Short-term obligations purchased with an original or remaining maturity of sixty days or less are valued at amortized cost, which approximates market value. Securities for which market quotations are not readily available are valued at fair value as determined in good faith by the Funds’ investment adviser using consistently applied procedures under the general supervision of the Board of Trustees.
Certain Funds may hold securities traded in foreign markets. Foreign securities are valued at the market price in the foreign market. However, if events occurring after the close of the foreign market (but before the close of regular trading on the New York Stock Exchange) are believed to materially affect the value of those securities, such securities are fair valued pursuant to procedures approved by the Board of Trustees. When fair valuing securities, the Funds may, among other things, use modeling tools or other processes that may take into account factors such as securities market activity and/or significant events that occur after the close of the foreign market and before the Funds calculate their net asset values.
b. Investment Transactions and Related Investment Income. Investment transactions are accounted for on a trade date plus one basis for daily net asset value calculation. However, for financial reporting purposes, investment transactions are reported on trade date. Dividend income is recorded on ex-dividend date, or in the case of certain foreign securities, as soon as a Fund is notified, and interest income is recorded on an accrual basis. Interest income is increased by the accretion of discount and decreased by the amortization of premium. Periodic principal adjustments for inflation-protected securities are recorded to interest income. Negative principal adjustments (in the event of deflation) are recorded as reductions of interest income to the extent of interest income earned, not to exceed the amount of positive principal adjustments on a cumulative basis. Investment income is recorded net of foreign taxes withheld when applicable. In determining net gain or loss on securities sold, the cost of securities has been determined on an identified cost basis. Investment income, non-class specific expenses and realized and unrealized gains and losses are allocated on a pro rata basis to each class based on the relative net assets of each class to the total net assets of the Fund.
c. Foreign Currency Translation. The books and records of the Funds are maintained in U.S. dollars. The values of securities, currencies and other assets and liabilities denominated in currencies other than U.S. dollars are translated into U.S. dollars based upon foreign exchange rates prevailing at the end of the period. Purchases and sales of investment securities, income and expenses are translated on the respective dates of such transactions.
Since the values of investment securities are presented at the foreign exchange rates prevailing at the end of the period, it is not practical to isolate that portion of the results of operations arising from changes in exchange rates from fluctuations which arise due to changes in market prices of investment securities. Such changes are included with the net realized and unrealized gain or loss on investments.
75 |
Notes to Financial Statements (continued)
September 30, 2011
Net realized foreign exchange gains or losses arise from sales of foreign currency, currency gains or losses realized between the trade and settlement dates on securities transactions, and the difference between the amounts of dividends, interest and foreign withholding taxes recorded on the Funds’ books and the U.S. dollar equivalent of the amounts actually received or paid. Net unrealized foreign exchange gains and losses arise from changes in the value of assets and liabilities, other than investment securities, at the end of the fiscal period, resulting from changes in exchange rates.
Each Fund may use foreign currency exchange contracts to facilitate transactions in foreign-denominated investments. Losses may arise from changes in the value of the foreign currency or if the counterparties do not perform under the contracts’ terms.
d. Forward Foreign Currency Contracts. The Funds may enter into forward foreign currency contracts, including forward foreign cross currency contracts. Contracts to buy generally are used to acquire exposure to foreign currencies, while contracts to sell generally are used to hedge a Fund’s investments against currency fluctuation. Also, a contract to buy or sell can offset a previous contract. These contracts involve market risk in excess of the unrealized gain or loss reflected in the Funds’ Statements of Assets and Liabilities. The U.S. dollar value of the currencies the Fund has committed to buy or sell represents the aggregate exposure to each currency the Fund has acquired or hedged through currency contracts outstanding at period end. Gains or losses are recorded for financial statement purposes as unrealized until settlement date. Risks may arise upon entering into these contracts from the potential inability of counterparties to meet the terms of their contracts and from unanticipated movements in the value of a foreign currency relative to the U.S. dollar. Certain contracts may require the movement of cash and/or securities as collateral for the Funds’ or counterparty’s net obligations under the contracts.
e. Swap Agreements. Each Fund may enter into credit default swaps. A credit default swap is an agreement between two parties (the “protection buyer” and “protection seller”) to exchange the credit risk of an issuer (“reference obligation”) for a specified time period. The reference obligation may be one or more debt securities or an index of such securities. The Funds may be either the protection buyer or the protection seller. As a protection buyer, the Funds have the ability to hedge the downside risk of an issuer or group of issuers. As a protection seller, the Funds have the ability to gain exposure to an issuer or group of issuers whose bonds are unavailable or in short supply in the cash bond market, as well as realize additional income in the form of fees paid by the protection buyer. The protection buyer is obligated to pay the protection seller a stream of payments (“fees”) over the term of the contract, provided that no credit event, such as a default or a downgrade in credit rating, occurs on the reference obligation. The Funds may also make or receive upfront payments. If a credit event occurs, the protection seller must pay the protection buyer the difference between the agreed upon notional value and market value of the reference obligation. Market value in this case is
| 76
Notes to Financial Statements (continued)
September 30, 2011
determined by a facilitated auction whereby a minimum number of allowable broker bids, together with a specified valuation method, are used to calculate the value. The maximum potential amount of undiscounted future payments that a Fund as the protection seller could be required to make under a credit default swap agreement would be an amount equal to the notional amount of the agreement.
The notional amounts of credit default swaps are not recorded in the financial statements. Credit default swaps are marked-to-market daily. Fluctuations in the value of credit default swaps are recorded in the Statements of Operations as change in unrealized appreciation (depreciation) on swap agreements. Fees are accrued in accordance with the terms of the agreement and are recorded in the Statements of Operations as realized gain or loss when received or paid. Upfront fees paid or received by the Funds are recorded on the Statements of Assets and Liabilities as an asset or liability, respectively, and are amortized or accreted over the term of the agreement and recorded as realized gain or loss. Payments made or received by the Funds as a result of a credit event or termination of the agreement are recorded as realized gain or loss.
Credit default swaps are privately negotiated and traded between counterparties and, as such, are subject to the risk that a party to the agreement will not be able to meet its obligations. The Funds cover their net obligations under outstanding credit default swaps by segregating or earmarking liquid assets or cash.
There were no credit default swaps held by the Funds during the year ended September 30, 2011.
f. Due to Brokers. Transactions and positions in forward foreign currency contracts are maintained and cleared by registered U.S. broker/dealers pursuant to customer agreements between a Fund and the various broker/dealers. Due to brokers’ balances in the Statements of Assets and Liabilities for Core Plus Bond Fund represent securities received as collateral for forward foreign currency contracts. In certain circumstances a Fund’s use of securities held at brokers is restricted by regulation or broker mandated limits.
g. Federal and Foreign Income Taxes. Each Trust treats each Fund as a separate entity for federal income tax purposes. Each Fund intends to meet the requirements of the Internal Revenue Code of 1986, as amended, applicable to regulated investment companies, and to distribute to its shareholders substantially all of its net investment income and any net realized capital gains at least annually. Management has performed an analysis of each Fund’s tax positions for the open tax years as of September 30, 2011 and has concluded that no provisions for income tax are required. The Funds’ federal tax returns for the prior three fiscal years remain subject to examination by the Internal Revenue Service. Management is not aware of any events that are reasonably possible to occur in the next twelve months that would result in the amounts of any unrecognized tax benefits significantly increasing or decreasing for the Funds. However, management’s conclusions regarding tax positions taken may be
77 |
Notes to Financial Statements (continued)
September 30, 2011
subject to review and adjustment at a later date based on factors including, but not limited to, new tax laws and accounting regulations and interpretations thereof.
A Fund may be subject to foreign taxes on income and gains on investments that are accrued based upon the Fund’s understanding of the tax rules and regulations that exist in the countries in which the Fund invests. Foreign governments may also impose taxes or other payments on investments with respect to foreign securities. Such taxes are accrued as applicable, and are reflected as foreign taxes payable on the Statements of Assets and Liabilities.
h. Dividends and Distributions to Shareholders. Dividends and distributions are recorded on ex-dividend date. The timing and characterization of certain income and capital gain distributions are determined annually in accordance with federal tax regulations, which may differ from accounting principles generally accepted in the United States of America. Permanent differences are primarily due to differing treatments for book and tax purposes of items such as foreign currency transactions, contingent payment debt instruments, preferred securities adjustments, premium amortization, defaulted bond adjustments, paydown gains and losses, deferred Trustees’ fees, return of capital dividend received and distribution redesignations. Permanent book and tax basis differences relating to shareholder distributions will result in reclassifications to capital accounts. Temporary differences between book and tax distributable earnings are primarily due to deferred Trustees’ fees, wash sales, premium amortization, forward foreign currency contract mark to market, dividends payable, return of capital dividend received, preferred securities adjustments, contingent payment debt instruments and defaulted bond interest. Distributions from net investment income and short-term capital gains are considered to be distributed from ordinary income for tax purposes.
The tax characterization of distributions is determined on an annual basis. The tax character of distributions paid to shareholders during the years ended September 30, 2011 and 2010 was as follows:
| | | | | | | | | | | | | | | | | | | | | | | | |
| | | 2011 Distributions Paid From: | | | 2010 Distributions Paid From: | |
Fund | | Ordinary Income | | | Long-Term Capital Gains | | | Total | | | Ordinary Income | | | Long-Term Capital Gains | | | Total | |
Core Plus Bond Fund | | $ | 18,029,003 | | | $ | — | | | $ | 18,029,003 | | | $ | 15,673,765 | | | $ | — | | | $ | 15,673,765 | |
High Income Fund | | | 10,139,162 | | | | — | | | | 10,139,162 | | | | 10,907,478 | | | | — | | | | 10,907,478 | |
International Bond Fund | | | 1,028,434 | | | | 202,164 | | | | 1,230,598 | | | | 1,057,069 | | | | — | | | | 1,057,069 | |
Limited Term Government and Agency Fund | | | 10,215,010 | | | | 1,113,810 | | | | 11,328,820 | | | | 5,644,012 | | | | — | | | | 5,644,012 | |
Differences between these amounts and those reported in the Statements of Changes in Net Assets are primarily attributable to different book and tax treatment for short-term capital gains.
| 78
Notes to Financial Statements (continued)
September 30, 2011
As of September 30, 2011, the components of distributable earnings on a tax basis were as follows:
| | | | | | | | | | | | | | | | |
| | | Core Plus Bond
Fund | | | High Income
Fund | | | International
Bond Fund | | | Limited Term
Government and
Agency Fund | |
Undistributed ordinary income | | $ | 5,504,837 | | | $ | 3,761,158 | | | $ | 1,440,170 | | | $ | — | |
Undistributed long-term capital gains | | | 5,686,797 | | | | 9,465,931 | | | | 303,712 | | | | — | |
| | | | | | | | | | | | | | | | |
Total undistributed earnings | | | 11,191,634 | | | | 13,227,089 | | | | 1,743,882 | | | | — | |
| | | | | | | | | | | | | | | | |
Unrealized appreciation (depreciation) | | | 12,048,633 | | | | (10,378,726 | ) | | | (112,822 | ) | | | 8,548,308 | |
| | | | | | | | | | | | | | | | |
Total accumulated earnings | | $ | 23,240,267 | | | $ | 2,848,363 | | | $ | 1,631,060 | | | $ | 8,548,308 | |
| | | | | | | | | | | | | | | | |
Capital loss carryforward utilized in the current year | | $ | 181,728 | | | $ | 33,112 | | | $ | — | | | $ | 815,748 | |
| | | | | | | | | | | | | | | | |
On December 22, 2010, the Regulated Investment Company Modernization Act of 2010 (the “Act”) was enacted. The Act modernizes several of the federal income and excise tax provisions related to RICs, and, with certain exceptions, is effective for taxable years beginning after December 22, 2010. Among the changes made are changes to the capital loss carryforward rules allowing for capital losses to be carried forward indefinitely. Rules in effect as of the report date limit the carryforward period to eight years. Capital loss carryforwards generated in taxable years beginning after the effective date of the Act must be fully used before capital loss carryforwards generated in taxable years prior to effective date of the Act; therefore, under certain circumstances, capital loss carryforwards available as of the report date, if any, may expire unused.
i. Repurchase Agreements. It is each Fund’s policy that the market value of the collateral for repurchase agreements be at least equal to 102% of the repurchase price, including interest. Certain repurchase agreements are tri-party arrangements whereby the collateral is held in a segregated account for the benefit of the Fund and on behalf of the counterparty. Repurchase agreements could involve certain risks in the event of default or insolvency of the counterparty, including possible delays or restrictions upon a Fund’s ability to dispose of the underlying securities.
j. Delayed Delivery Commitments. The Funds may purchase securities, including those designated as TBAs in the Portfolio of Investments, for which delivery or payment will
79 |
Notes to Financial Statements (continued)
September 30, 2011
occur at a later date, beyond the normal settlement period. The price of the security and the date when the security will be delivered and paid for are fixed at the time the transaction is negotiated. The security and the obligation to pay for it are recorded by the Funds at the time the commitment is entered into. The actual security that will be delivered to fulfill a TBA trade is not designated at the time of the trade. The security is “to be announced” 48 hours prior to the established trade settlement date. The value of the security may vary with market fluctuations during the time before the Funds take delivery of the security. When the Funds enter into such a transaction, collateral consisting of liquid securities or cash and cash equivalents is required to be segregated or earmarked at the custodian in an amount at least equal to the amount of the Funds’ commitment. No interest accrues to the Funds until the transaction settles.
Purchases of delayed delivery securities may have a similar effect on the Funds’ net asset value as if the Funds had created a degree of leverage in the portfolio. Risks may arise upon entering into such transactions from the potential inability of counterparties to meet their obligations under the transactions. Additionally, losses may arise due to changes in the value of the underlying securities.
k. Securities Lending. The Funds have entered into an agreement with State Street Bank and Trust Company (“State Street Bank”), as agent of the Funds, to lend securities to certain designated borrowers. The loans are collateralized with cash or securities in an amount equal to at least 105% or 102% of the market value (including accrued interest) of the loaned international or domestic securities, respectively, when the loan is initiated. Thereafter, the value of the collateral must remain at least 102% of the market value (including accrued interest) of loaned securities for U.S. equities and U.S. corporate debt; at least 105% of the market value (including accrued interest) of loaned securities for non-U.S. equities; and at least 100% of the market value (including accrued interest) of loaned securities for U.S. Government securities, sovereign debt issued by non-U.S. Governments and non-U.S. corporate debt. In the event that the market value of the collateral falls below the required percentages described above, the borrower will deliver additional collateral on the next business day. As with other extensions of credit, the Funds may bear the risk of loss with respect to the investment of the collateral. The Funds invest cash collateral in short-term investments, a portion of the income from which is remitted to the borrowers and the remainder allocated between the Funds and State Street Bank as lending agent.
For the year ended September 30, 2011, none of the Funds had loaned securities under this agreement.
l. Indemnifications. Under the Trusts’ organizational documents, their officers and Trustees are indemnified against certain liabilities arising out of the performance of their duties to the Funds. Additionally, in the normal course of business, the Funds enter into contracts with service providers that contain general indemnification clauses. The Funds’ maximum exposure under these arrangements is unknown as this would involve
| 80
Notes to Financial Statements (continued)
September 30, 2011
future claims that may be made against the Funds that have not yet occurred. However, based on experience, the Funds expect the risk of loss to be remote.
3. Fair Value Measurements. In accordance with accounting standards related to fair value measurements and disclosures, the Funds have categorized the inputs utilized in determining the value of each Fund’s assets or liabilities. These inputs are summarized in the three broad levels listed below:
| | • | | Level 1 – quoted prices in active markets for identical assets or liabilities; |
| | • | | Level 2 – prices determined using other significant inputs that are observable either directly, or indirectly through corroboration with observable market data (which could include quoted prices for similar assets or liabilities, interest rates, credit risk, etc.); |
| | • | | Level 3 – prices determined using significant unobservable inputs when quoted prices or observable inputs are unavailable such as when there is little or no market activity for an asset or liability (unobservable inputs reflect each Fund’s own assumptions in determining the fair value of assets or liabilities and would be based on the best information available). |
The inputs or methodology used for valuing securities are not necessarily an indication of the risk associated with investing in those securities.
The following is a summary of the inputs used to value the Funds’ investments as of September 30, 2011, at value:
Core Plus Bond Fund
Asset Valuation Inputs
| | | | | | | | | | | | | | | | |
Description | | Level 1 | | | Level 2 | | | Level 3 | | | Total | |
Bonds and Notes(a) | | $ | — | | | $ | 504,806,433 | | | $ | — | | | $ | 504,806,433 | |
Preferred Stocks | | | | | | | | | | | | | | | | |
Non-Captive Consumer | | | 231,916 | | | | — | | | | — | | | | 231,916 | |
Non-Captive Diversified | | | 1,189,776 | | | | — | | | | 319,200 | | | | 1,508,976 | |
| | | | | | | | | | | | | | | | |
Total Preferred Stocks | | | 1,421,692 | | | | — | | | | 319,200 | | | | 1,740,892 | |
| | | | | | | | | | | | | | | | |
Short-Term Investments | | | — | | | | 18,140,121 | | | | — | | | | 18,140,121 | |
| | | | | | | | | | | | | | | | |
Total Investments | | | 1,421,692 | | | | 522,946,554 | | | | 319,200 | | | | 524,687,446 | |
| | | | | | | | | | | | | | | | |
Forward Foreign Currency Contracts (unrealized appreciation) | | | — | | | | 628,790 | | | | — | | | | 628,790 | |
| | | | | | | | | | | | | | | | |
Total | | $ | 1,421,692 | | | $ | 523,575,344 | | | $ | 319,200 | | | $ | 525,316,236 | |
| | | | | | | | | | | | | | | | |
| (a) | Details of the major categories of the Fund’s investments are reflected within the Portfolio of Investments. |
81 |
Notes to Financial Statements (continued)
September 30, 2011
High Income Fund
Asset Valuation Inputs
| | | | | | | | | | | | | | | | |
Description | | Level 1 | | | Level 2 | | | Level 3 | | | Total | |
Bonds and Notes | | | | | | | | | | | | | | | | |
Non-Convertible Bonds | | | | | | | | | | | | | | | | |
Consumer Cyclical Services | | $ | — | | | $ | — | | | $ | 843,525 | | | $ | 843,525 | |
Treasuries | | | — | | | | 8,079,045 | | | | 27,508 | | | | 8,106,553 | |
All Other Non-Convertible Bonds(a) | | | — | | | | 69,425,074 | | | | — | | | | 69,425,074 | |
| | | | | | | | | | | | | | | | |
Total Non-Convertible Bonds | | | — | | | | 77,504,119 | | | | 871,033 | | | | 78,375,152 | |
| | | | | | | | | | | | | | | | |
Convertible Bonds(a) | | | — | | | | 18,386,438 | | | | — | | | | 18,386,438 | |
| | | | | | | | | | | | | | | | |
Total Bonds and Notes | | | — | | | | 95,890,557 | | | | 871,033 | | | | 96,761,590 | |
| | | | | | | | | | | | | | | | |
Senior Loans(a) | | | — | | | | 834,329 | | | | — | | | | 834,329 | |
Preferred Stocks(a) | | | 3,942,780 | | | | 2,314,830 | | | | — | | | | 6,257,610 | |
Common Stocks(a) | | | 3,236,035 | | | | — | | | | — | | | | 3,236,035 | |
Warrants(b) | | | — | | | | — | | | | — | | | | — | |
Short-Term Investments | | | — | | | | 3,881,462 | | | | — | | | | 3,881,462 | |
| | | | | | | | | | | | | | | | |
Total Investments | | | 7,178,815 | | | | 102,921,178 | | | | 871,033 | | | | 110,971,026 | |
| | | | | | | | | | | | | | | | |
Forward Foreign Currency Contracts (unrealized appreciation) | | | — | | | | 243,595 | | | | — | | | | 243,595 | |
| | | | | | | | | | | | | | | | |
Total | | $ | 7,178,815 | | | $ | 103,164,773 | | | $ | 871,033 | | | $ | 111,214,621 | |
| | | | | | | | | | | | | | | | |
Liability Valuation Inputs
| | | | | | | | | | | | | | | | |
Description | | Level 1 | | | Level 2 | | | Level 3 | | | Total | |
Forward Foreign Currency Contracts (unrealized depreciation) | | $ | — | | | $ | (11,340 | ) | | $ | — | | | $ | (11,340 | ) |
| | | | | | | | | | | | | | | | |
| (a) | Details of the major categories of the Fund’s investments are reflected within the Portfolio of Investments. |
| (b) | Fair valued at zero using Level 3 inputs. |
A preferred stock valued at $85,425 was transferred from Level 2 to Level 1 during the period ended September 30, 2011. At September 30, 2010, this security was valued on the basis of evaluated bids furnished to the Fund by a pricing service; at September 30, 2011, this security was valued at a market price in accordance with the Fund’s valuation policies.
All transfers are recognized as of the beginning of the reporting period.
| 82
Notes to Financial Statements (continued)
September 30, 2011
International Bond Fund
Asset Valuation Inputs
| | | | | | | | | | | | | | | | |
Description | | Level 1 | | | Level 2 | | | Level 3 | | | Total | |
Bonds and Notes | | | | | | | | | | | | | | | | |
Non-Convertible Bonds | | | | | | | | | | | | | | | | |
Supranationals | | $ | — | | | $ | 1,496,317 | | | $ | 118,679 | | | $ | 1,614,996 | |
All Other Non-Convertible Bonds(a) | | | — | | | | 21,904,444 | | | | — | | | | 21,904,444 | |
| | | | | | | | | | | | | | | | |
Total Non-Convertible Bonds | | | — | | | | 23,400,761 | | | | 118,679 | | | | 23,519,440 | |
| | | | | | | | | | | | | | | | |
Convertible Bonds(a) | | | — | | | | 46,812 | | | | — | | | | 46,812 | |
| | | | | | | | | | | | | | | | |
Total Bonds and Notes | | | — | | | | 23,447,573 | | | | 118,679 | | | | 23,566,252 | |
| | | | | | | | | | | | | | | | |
Short-Term Investments | | | — | | | | 481,399 | | | | — | | | | 481,399 | |
| | | | | | | | | | | | | | | | |
Total Investments | | | — | | | | 23,928,972 | | | | 118,679 | | | | 24,047,651 | |
| | | | | | | | | | | | | | | | |
Forward Foreign Currency Contracts (unrealized appreciation) | | | — | | | | 24,478 | | | | — | | | | 24,478 | |
| | | | | | | | | | | | | | | | |
Total | | $ | — | | | $ | 23,953,450 | | | $ | 118,679 | | | $ | 24,072,129 | |
| | | | | | | | | | | | | | | | |
Liability Valuation Inputs
| | | | | | | | | | | | | | | | |
Description | | Level 1 | | | Level 2 | | | Level 3 | | | Total | |
Forward Foreign Currency Contracts (unrealized depreciation) | | $ | — | | | $ | (216,083 | ) | | $ | — | | | $ | (216,083 | ) |
| | | | | | | | | | | | | | | | |
| (a) | Details of the major categories of the Fund’s investments are reflected within the Portfolio of Investments. |
Limited Term Government and Agency Fund
Asset Valuation Inputs
| | | | | | | | | | | | | | | | |
Description(a) | | Level 1 | | | Level 2 | | | Level 3 | | | Total | |
Bonds and Notes | | $ | — | | | $ | 470,409,176 | | | $ | — | | | $ | 470,409,176 | |
Short-Term Investments | | | — | | | | 68,167,599 | | | | — | | | | 68,167,599 | |
| | | | | | | | | | | | | | | | |
Total | | $ | — | | | $ | 538,576,775 | | | $ | — | | | $ | 538,576,775 | |
| | | | | | | | | | | | | | | | |
| (a) | Details of the major categories of the Fund’s investments are reflected within the Portfolio of Investments. |
83 |
Notes to Financial Statements (continued)
September 30, 2011
The following is a reconciliation of Level 3 investments for which significant unobservable inputs were used to determine fair value as of September 30, 2011:
Core Plus Bond Fund
Asset Valuation Inputs
| | | | | | | | | | | | | | | | | | | | |
Investments in Securities | | Balance as of
September 30,
2010 | | | Accrued
Discounts
(Premiums) | | | Realized
Gain
(Loss) | | | Change in
Unrealized
Appreciation
(Depreciation) | | | Purchases | |
Preferred Stocks | | | | | | | | | | | | | | | | | | | | |
Non-Captive Diversified | | $ | — | | | $ | — | | | $ | — | | | $ | (159,683 | ) | | $ | — | |
| | | | | | | | | | | | | | | | | | | | |
| | | | | |
Investments in Securities | | Sales | | | Transfers
into Level 3 | | | Transfers
out of
Level 3 | | | Balance as of
September 30,
2011 | | | Change in
Unrealized
Appreciation
(Depreciation)
from
Investments
Still Held at
September 30,
2011 | |
Preferred Stocks | | | | | | | | | | | | | | | | | | | | |
Non-Captive Diversified | | $ | — | | | $ | 478,883 | | | $ | — | | | $ | 319,200 | | | $ | (159,683 | ) |
| | | | | | | | | | | | | | | | | | | | |
A preferred stock valued at $478,883 was transferred from Level 2 to Level 3 during the period ended September 30, 2011. At September 30, 2010, this security was valued on the basis of evaluated bids furnished to the Fund by a pricing service; at September 30, 2011, this security was valued using broker-dealer bid quotations based on inputs unobservable to the Fund.
All transfers are recognized as of the beginning of the reporting period.
High Income Fund
Asset Valuation Inputs
| | | | | | | | | | | | | | | | | | | | |
Investments in Securities | | Balance as of
September 30,
2010 | | | Accrued
Discounts
(Premiums) | | | Realized
Gain
(Loss) | | | Change in
Unrealized
Appreciation
(Depreciation) | | | Purchases | |
Bonds and Notes | | | | | | | | | | | | | | | | | | | | |
Non-Convertible Bonds | | | | | | | | | | | | | | | | | | | | |
Consumer Cyclical Services | | $ | — | | | $ | 4,723 | | | $ | — | | | $ | 30,752 | | | $ | 488,850 | |
Treasuries | | | — | | | | 1,749 | | | | — | | | | (22,081 | ) | | | 47,840 | |
| | | | | | | | | | | | | | | | | | | | |
Total | | $ | — | | | $ | 6,472 | | | $ | — | | | $ | 8,671 | | | $ | 536,690 | |
| | | | | | | | | | | | | | | | | | | | |
| 84
Notes to Financial Statements (continued)
September 30, 2011
High Income Fund (continued)
Asset Valuation Inputs (continued)
| | | | | | | | | | | | | | | | | | | | |
Investments in Securities | | Sales | | | Transfers
into Level 3 | | | Transfers
out of
Level 3 | | | Balance as of
September 30,
2011 | | | Change in
Unrealized
Appreciation
(Depreciation)
from
Investments
Still Held at
September 30,
2011 | |
Bonds and Notes | | | | | | | | | | | | | | | | | | | | |
Non-Convertible Bonds | | | | | | | | | | | | | | | | | | | | |
Consumer Cyclical Services | | $ | — | | | $ | 319,200 | | | $ | — | | | $ | 843,525 | | | $ | 30,752 | |
Treasuries | | | — | | | | — | | | | — | | | | 27,508 | | | | (22,081 | ) |
| | | | | | | | | | | | | | | | | | | | |
Total | | $ | — | | | $ | 319,200 | | | $ | — | | | $ | 871,033 | | | $ | 8,671 | |
| | | | | | | | | | | | | | | | | | | | |
A debt security valued at $319,200 was transferred from Level 2 to Level 3 during the period ended September 30, 2011. At September 30, 2010, this security was valued on the basis of evaluated bids furnished to the Fund by a pricing service; at September 30, 2011, this security was valued using broker-dealer bid quotations based on inputs unobservable to the Fund.
All transfers are recognized as of the beginning of the reporting period.
International Bond Fund
Asset Valuation Inputs
| | | | | | | | | | | | | | | | | | | | |
Investments in Securities | | Balance as of
September 30,
2010 | | | Accrued
Discounts
(Premiums) | | | Realized
Gain
(Loss) | | | Change in
Unrealized
Appreciation
(Depreciation) | | | Purchases | |
Bonds and Notes | | | | | | | | | | | | | | | | | | | | |
Non-Convertible Bonds | | | | | | | | | | | | | | | | | | | | |
Supranationals | | $ | — | | | $ | 112 | | | $ | — | | | $ | (7,247 | ) | | $ | 125,814 | |
| | | | | | | | | | | | | | | | | | | | |
| | | | | |
Investments in Securities | | Sales | | | Transfers
into Level 3 | | | Transfers
out of
Level 3 | | | Balance as of
September 30,
2011 | | | Change in
Unrealized
Appreciation
(Depreciation)
from
Investments
Still Held at
September 30,
2011 | |
Bonds and Notes | | | | | | | | | | | | | | | | | | | | |
Non-Convertible Bonds | | | | | | | | | | | | | | | | | | | | |
Supranationals | | $ | — | | | $ | — | | | $ | — | | | $ | 118,679 | | | $ | (7,247 | ) |
| | | | | | | | | | | | | | | | | | | | |
85 |
Notes to Financial Statements (continued)
September 30, 2011
4. Derivatives. Derivative instruments are defined as financial instruments whose value and performance are based on the value and performance of another security or financial instrument. Derivative instruments that certain Funds used during the period include forward foreign currency contracts.
The Funds are subject to the risk that changes in foreign currency exchange rates will have an unfavorable effect on the value of Fund assets denominated in foreign currencies. The Funds may enter into forward foreign currency contracts for hedging purposes to protect the value of the Funds’ holdings of foreign securities. The Funds may also use forward foreign currency contracts to gain exposure to foreign currencies, regardless of whether securities denominated in such currencies are held in the Funds. During the year ended September 30, 2011, High Income Fund engaged in forward foreign currency transactions for hedging purposes. During the same period, Core Plus Bond Fund and International Bond Fund engaged in forward foreign currency transactions for hedging purposes and to gain exposure to foreign currencies.
Each Fund is party to agreements with counterparties that govern transactions in forward foreign currency contracts. The agreements contain credit-risk-related contingent features that allow the counterparties to terminate open contracts early if the net asset value of a Fund declines beyond a certain threshold. If such features were to be triggered, the counterparties could request immediate settlement of open contracts at current fair value. As of September 30, 2011, the fair value of derivative positions (including open trades) subject to credit-risk-related contingent features that are in a net liability position by counterparty, and the value of collateral pledged to counterparties for such contracts is as follows:
| | | | | | | | | | |
Fund | | Counterparty | | Derivatives | | | Collateral
Pledged | |
International Bond Fund | | Barclays | | $ | (33,038 | ) | | $ | — | |
| | Credit Suisse | | | (76,991 | ) | | | — | |
| | JPMorgan Chase | | | (2,968 | ) | | | — | |
| | UBS AG | | | (78,608 | ) | | | — | |
Forward foreign currency contracts are subject to the risk that the counterparty will be unwilling or unable to meet its obligations under the contracts. The Funds have mitigated this risk by entering into master netting agreements with counterparties that allow the Fund and the counterparty to net amounts owed by each related to derivative contracts to one net amount payable by either the Fund or the counterparty. The maximum amount of loss that the Funds would incur if counterparties failed to meet their obligations and the amount of loss that the Funds would incur after taking into account master netting arrangements, are as follows as of September 30, 2011:
| | | | | | | | |
Fund | | Maximum Amount of
Loss - Gross | | | Maximum Amount of
Loss - Net | |
Core Plus Bond Fund | | $ | 628,790 | | | $ | 628,790 | |
High Income Fund | | | 243,595 | | | | 232,255 | |
International Bond Fund | | | 24,478 | | | | — | |
| 86
Notes to Financial Statements (continued)
September 30, 2011
These amounts do not take into account the value of any collateral received by the Funds.
Counterparty risk is managed through the posting of collateral and, as a result, the risk of loss to a Fund from counterparty default should be limited to the extent a Fund is undercollateralized. In addition to collateral requirements, the Funds also require counterparties to meet minimum credit quality requirements.
The following is a summary of derivative instruments for Core Plus Bond Fund as of September 30, 2011:
| | | | |
Statements of Assets and Liabilities Caption | | Foreign
Exchange
Contracts | |
Assets | | | | |
Unrealized appreciation on forward foreign currency contracts | | $ | 628,790 | |
Transactions in derivative instruments for Core Plus Bond Fund during the year ended September 30, 2011, were as follows:
| | | | |
Statements of Operations Caption | | Foreign
Exchange
Contracts | |
Net Realized Gain (Loss) on: | | | | |
Foreign currency transactions* | | $ | 1,324,388 | |
Net Change in Unrealized Appreciation (Depreciation) on: | | | | |
Foreign currency translations* | | | 628,790 | |
| * | Represents realized gain and change in unrealized appreciation (depreciation), respectively, for forward foreign currency contracts during the period. |
The following is a summary of derivative instruments for High Income Fund as of September 30, 2011:
| | | | |
Statements of Assets and Liabilities Caption | | Foreign
Exchange
Contracts | |
Assets | | | | |
Unrealized appreciation on forward foreign currency contracts | | $ | 243,595 | |
Liabilities | | | | |
Unrealized depreciation on forward foreign currency contracts | | | (11,340 | ) |
87 |
Notes to Financial Statements (continued)
September 30, 2011
Transactions in derivative instruments for High Income Fund during the year ended September 30, 2011, were as follows:
| | | | |
Statements of Operations Caption | | Foreign
Exchange
Contracts | |
Net Realized Gain (Loss) on: | | | | |
Foreign currency transactions* | | $ | (135,361 | ) |
Net Change in Unrealized Appreciation (Depreciation) on: | | | | |
Foreign currency translations* | | | 232,255 | |
| * | Represents realized loss and change in unrealized appreciation (depreciation), respectively, for forward foreign currency contracts during the period. |
The following is a summary of derivative instruments for International Bond Fund as of September 30, 2011:
| | | | |
Statements of Assets and Liabilities Caption | | Foreign
Exchange
Contracts | |
Assets | | | | |
Unrealized appreciation on forward foreign currency contracts | | $ | 24,478 | |
Liabilities | | | | |
Unrealized depreciation on forward foreign currency contracts | | | (216,083 | ) |
Transactions in derivative instruments for International Bond Fund during the year ended September 30, 2011, were as follows:
| | | | |
Statements of Operations Caption | | Foreign
Exchange
Contracts | |
Net Realized Gain (Loss) on: | | | | |
Foreign currency transactions* | | $ | 325,787 | |
Net Change in Unrealized Appreciation (Depreciation) on: | | | | |
Foreign currency translations* | | | (326,196 | ) |
| * | Represents realized gain and change in unrealized appreciation (depreciation), respectively, for forward foreign currency contracts during the period. |
As the Funds value their derivatives at fair value and recognize changes in fair value through the Statements of Operations, they do not qualify for hedge accounting under authoritative guidance for derivative instruments. The Funds’ investments in derivatives
| 88
Notes to Financial Statements (continued)
September 30, 2011
may represent an economic hedge; however, they are considered to be non-hedge transactions for the purpose of these disclosures.
The volume of forwards activity, as a percentage of net assets, for Core Plus Bond Fund, High Income Fund and International Bond Fund, based on month-end notional amounts outstanding during the period, at absolute value, was as follows for the year ended September 30, 2011:
| | | | |
Core Plus Bond Fund | | Forwards | |
Average Notional Amount Outstanding | | | 2.97 | % |
Highest Notional Amount Outstanding | | | 6.81 | % |
Lowest Notional Amount Outstanding | | | 0.00 | % |
Notional Amount Outstanding as of September 30, 2011 | | | 5.25 | % |
| | | | |
High Income Fund | | Forwards | |
Average Notional Amount Outstanding | | | 1.35 | % |
Highest Notional Amount Outstanding | | | 3.48 | % |
Lowest Notional Amount Outstanding | | | 0.00 | % |
Notional Amount Outstanding as of September 30, 2011 | | | 3.48 | % |
| | | | |
International Bond Fund | | Forwards | |
Average Notional Amount Outstanding | | | 26.10 | % |
Highest Notional Amount Outstanding | | | 42.00 | % |
Lowest Notional Amount Outstanding | | | 16.81 | % |
Notional Amount Outstanding as of September 30, 2011 | | | 23.88 | % |
Notional amounts outstanding at the end of the prior period are included in the average notional amount outstanding.
5. Purchases and Sales of Securities. For the year ended September 30, 2011, purchases and sales of securities (excluding short-term investments and including paydowns) were as follows:
| | | | | | | | | | | | | | | | |
| | | U.S. Government/
Agency Securities | | | Other Securities | |
Fund | | Purchases | | | Sales | | | Purchases | | | Sales | |
Core Plus Bond Fund | | $ | 233,115,145 | | | $ | 209,074,498 | | | $ | 237,900,742 | | | $ | 136,150,727 | |
High Income Fund | | | — | | | | — | | | | 96,264,356 | | | | 124,632,317 | |
International Bond Fund | | | 3,836,224 | | | | 3,834,511 | | | | 30,430,208 | | | | 39,393,804 | |
Limited Term Government and Agency Fund | | | 324,250,781 | | | | 227,810,506 | | | | 69,103,919 | | | | 31,674,196 | |
89 |
Notes to Financial Statements (continued)
September 30, 2011
6. Management Fees and Other Transactions with Affiliates.
a. Management Fees. Loomis, Sayles & Company, L.P. (“Loomis Sayles”) serves as investment adviser to each Fund. Under the terms of the management agreements, each Fund pays a management fee at the following annual rates, calculated daily and payable monthly, based on each Fund’s average daily net assets:
| | | | | | | | | | | | |
| | | Percentage of Average Daily Net Assets | |
Fund | | First $100 million | | | Next $150 million | | | Over $250 million | |
Core Plus Bond Fund | | | 0.2500 | % | | | 0.1875 | % | | | 0.1875 | % |
High Income Fund | | | 0.6000 | % | | | 0.6000 | % | | | 0.6000 | % |
International Bond Fund | | | 0.6000 | % | | | 0.6000 | % | | | 0.6000 | % |
Limited Term Government and Agency Fund | | | 0.5000 | % | | | 0.5000 | % | | | 0.4000 | % |
Natixis Asset Management Advisors, L.P. (“Natixis Advisors”) serves as the advisory administrator to Core Plus Bond Fund. Under the terms of the advisory administration agreement, the Fund pays an advisory administration fee at the following annual rates, calculated daily and payable monthly, based on its average daily net assets:
| | | | | | | | |
| | | Percentage of Average Daily Net Assets | |
Fund | | First $100 million | | | Over $100 million | |
Core Plus Bond Fund | | | 0.2500 | % | | | 0.1875 | % |
Management and advisory administration fees are presented in the Statements of Operations as management fees.
Loomis Sayles has given binding undertakings to the Funds to waive management fees and/or reimburse certain expenses to limit the Funds’ operating expenses, exclusive of acquired fund fees and expenses, brokerage expenses, interest expense, taxes and extraordinary expenses. These undertakings are in effect until January 31, 2012 and are reevaluated on an annual basis. Management fees payable, as reflected on the Statements of Assets and Liabilities, is net of waivers and/or expense reimbursements, if any, pursuant to these undertakings.
For the year ended September 30, 2011, the expense limits as a percentage of average daily net assets under the expense limitation agreements were as follows:
| | | | | | | | | | | | | | | | |
| | | Expense Limit as a Percentage of
Average Daily Net Assets | |
Fund | | Class A | | | Class B | | | Class C | | | Class Y | |
Core Plus Bond Fund | | | 0.90 | % | | | 1.65 | % | | | 1.65 | % | | | 0.65 | % |
High Income Fund | | | 1.15 | % | | | 1.90 | % | | | 1.90 | % | | | 0.90 | % |
International Bond Fund | | | 1.10 | % | | | — | | | | 1.85 | % | | | 0.85 | % |
Limited Term Government and Agency Fund | | | 0.85 | % | | | 1.60 | % | | | 1.60 | % | | | 0.60 | % |
| 90
Notes to Financial Statements (continued)
September 30, 2011
Loomis Sayles and Natixis Advisors have agreed to equally bear the waivers and/or expense reimbursements for Core Plus Bond Fund.
Loomis Sayles (and Natixis Advisors for Core Plus Bond Fund) shall be permitted to recover expenses borne under the expense limitation agreements (whether through waiver of its management fees or otherwise) on a class by class basis in later periods to the extent the expenses of a class fall below a class’ expense limits, provided, however, that a class is not obligated to pay such waived/reimbursed fees or expenses more than one year after the end of the fiscal year in which the fees or expenses were waived/reimbursed.
For the year ended September 30, 2011, the management fees and waivers of management fees for each Fund were as follows:
| | | | | | | | | | | | | | | | | | | | |
| | | Gross
Management
Fees | | | Waivers of
Management
Fees(1) | | | Net
Management
Fees | | | Percentage of
Average
Daily Net Assets | |
Fund | | | | | Gross | | | Net | |
Core Plus Bond Fund | | $ | 826,195 | | | $ | — | | | $ | 826,195 | | | | 0.203 | % | | | 0.203 | % |
High Income Fund | | | 973,876 | | | | — | | | | 973,876 | | | | 0.600 | % | | | 0.600 | % |
International Bond Fund | | | 157,239 | | | | 141,627 | | | | 15,612 | | | | 0.600 | % | | | 0.060 | % |
Limited Term Government and Agency Fund | | | 1,862,522 | | | | 286,899 | | | | 1,575,623 | | | | 0.462 | % | | | 0.391 | % |
| (1) | Management fee waivers are subject to possible recovery until September 30, 2012. |
For the year ended September 30, 2011, the advisory administration fees for Core Plus Bond Fund were as follows:
| | | | | | | | |
| | | Advisory
Administration
Fee | | | Percentage of
Average
Daily Net Assets | |
| | $ | 826,195 | | | | 0.203 | % |
For the year ended September 30, 2011, expense reimbursements related to the prior fiscal year were recovered as follows:
| | | | | | | | | | | | | | | | | | | | |
| | | Recovered Expenses | |
Fund | | Class A | | | Class B | | | Class C | | | Class Y | | | Total | |
High Income Fund | | $ | 7,050 | | | $ | 93 | | | $ | 1,820 | | | $ | 5,967 | | | $ | 14,930 | |
Certain officers and employees of Loomis Sayles are also officers or Trustees of the Trust. Loomis Sayles’ general partner is indirectly owned by Natixis Global Asset
91 |
Notes to Financial Statements (continued)
September 30, 2011
Management, L.P. (“Natixis US”), which is part of Natixis Global Asset Management, an international asset management group based in Paris, France.
b. Service and Distribution Fees. Natixis Distributors, L.P. (“Natixis Distributors”), a wholly-owned subsidiary of Natixis US, has entered into a distribution agreement with the Trusts. Pursuant to this agreement, Natixis Distributors serves as principal underwriter of the Funds of the Trusts.
Pursuant to Rule 12b-1 under the 1940 Act, the Trusts have adopted a Service Plan relating to each Fund’s Class A shares (the “Class A Plans”), and a Distribution and Service Plan relating to each Fund’s Class B (if applicable) and Class C shares (the “Class B and Class C Plans”).
Under the Class A Plans, each Fund pays Natixis Distributors a monthly service fee at an annual rate not to exceed 0.25% of the average daily net assets attributable to the Fund’s Class A shares, as reimbursement for expenses incurred by Natixis Distributors in providing personal services to investors in Class A shares and/or the maintenance of shareholder accounts.
Under the Class B (if applicable) and Class C Plans, each Fund pays Natixis Distributors a monthly service fee at an annual rate not to exceed 0.25% of the average daily net assets attributable to the Fund’s Class B (if applicable) and Class C shares, as compensation for services provided by Natixis Distributors in providing personal services to investors in Class B (if applicable) and Class C shares and/or the maintenance of shareholder accounts.
Also under the Class B (if applicable) and Class C Plans, each Fund pays Natixis Distributors a monthly distribution fee at the annual rate of 0.75% of the average daily net assets attributable to the Fund’s Class B (if applicable) and Class C shares, as compensation for services provided by Natixis Distributors in connection with the marketing or sale of Class B (if applicable) and Class C shares.
For the year ended September 30, 2011, the Funds paid the following service and distribution fees:
| | | | | | | | | | | | | | | | | | | | |
| | | Service Fees | | | Distribution Fees | |
Fund | | Class A | | | Class B | | | Class C | | | Class B | | | Class C | |
Core Plus Bond Fund | | $ | 525,086 | | | $ | 9,162 | | | $ | 305,529 | | | $ | 27,488 | | | $ | 916,585 | |
High Income Fund | | | 192,113 | | | | 2,531 | | | | 49,604 | | | | 7,594 | | | | 148,810 | |
International Bond Fund | | | 38,790 | | | | — | | | | 15,894 | | | | — | | | | 47,682 | |
Limited Term Government and Agency Fund | | | 573,178 | | | | 21,540 | | | | 172,917 | | | | 64,619 | | | | 518,752 | |
c. Administrative Fees. Natixis Advisors provides certain administrative services for the Funds and contracts with State Street Bank to serve as sub-administrator. Natixis Advisors is a wholly-owned subsidiary of Natixis US. Pursuant to an agreement among
| 92
Notes to Financial Statements (continued)
September 30, 2011
Natixis Funds Trust I, Natixis Funds Trust II, Natixis Funds Trust IV, Gateway Trust (“Natixis Funds Trusts”), Loomis Sayles Funds I, Loomis Sayles Funds II (“Loomis Sayles Funds Trusts”), Hansberger International Series and Natixis Advisors, each Fund pays Natixis Advisors monthly its pro rata portion of fees equal to an annual rate of 0.0575% of the first $15 billion of the average daily net assets of the Natixis Funds Trusts, Loomis Sayles Funds Trusts and Hansberger International Series, 0.0500% of the next $15 billion, 0.0400% of the next $30 billion and 0.0350% of such assets in excess of $60 billion, subject to an annual aggregate minimum fee for the Natixis Funds Trusts, Loomis Sayles Funds Trusts and Hansberger International Series of $10 million, which is reevaluated on an annual basis.
For the year ended September 30, 2011, each Fund paid the following administrative fees to Natixis Advisors:
| | | | |
Fund | | Administrative
Fees | |
Core Plus Bond Fund | | $ | 189,203 | |
High Income Fund | | | 75,402 | |
International Bond Fund | | | 12,176 | |
Limited Term Government and Agency Fund | | | 187,246 | |
d. Sub-Transfer Agent Fees. Natixis Distributors has entered into agreements with financial intermediaries to provide certain recordkeeping, processing, shareholder communications and other services to customers of the intermediaries and has agreed to compensate the intermediaries for providing those services. Certain services would be provided by the Funds if the shares of those customers were registered directly with the Funds’ transfer agent. Accordingly, the Funds agreed to pay a portion of the intermediary fees attributable to shares of the Fund held by the intermediaries (which generally are a percentage of the value of shares held) not to exceed what the Funds would have paid their transfer agent had each customer’s shares been registered directly with the transfer agent instead of held through the intermediaries. Natixis Distributors pays the remainder of the fees.
For the year ended September 30, 2011, the Funds paid the following sub-transfer agent fees, which are reflected in transfer agent fees and expenses in the Statements of Operations:
| | | | |
Fund | | Sub-Transfer
Agent Fees | |
Core Plus Bond Fund | | $ | 257,319 | |
High Income Fund | | | 105,419 | |
International Bond Fund | | | 11,160 | |
Limited Term Government and Agency Fund | | | 141,500 | |
93 |
Notes to Financial Statements (continued)
September 30, 2011
e. Commissions. Commissions (including CDSCs) on Fund shares retained by Natixis Distributors during the year ended September 30, 2011 were as follows:
| | | | |
Fund | | Commissions | |
Core Plus Bond Fund | | $ | 454,454 | |
High Income Fund | | | 101,403 | |
International Bond Fund | | | 40,922 | |
Limited Term Government and Agency Fund | | | 273,492 | |
f. Trustees Fees and Expenses. The Trusts do not pay any compensation directly to their officers or Trustees who are directors, officers or employees of Natixis Advisors, Natixis Distributors, Natixis US or their affiliates. The Chairperson of the Board receives a retainer fee at the annual rate of $250,000. The Chairperson does not receive any meeting attendance fees for Board of Trustees meetings or committee meetings that she attends. Each Independent Trustee (other than the Chairperson) receives, in the aggregate, a retainer fee at the annual rate of $80,000. Each Independent Trustee also receives a meeting attendance fee of $10,000 for each meeting of the Board of Trustees that he or she attends in person and $5,000 for each meeting of the Board of Trustees that he or she attends telephonically. In addition, each committee chairman receives an additional retainer fee at an annual rate of $15,000. Each Contract Review and Governance Committee member is compensated $6,000 for each Committee meeting that he or she attends in person and $3,000 for each meeting that he or she attends telephonically. Each Audit Committee member is compensated $7,500 for each Committee meeting that he or she attends in person and $3,750 for each meeting that he or she attends telephonically. These fees are allocated among the funds in the Natixis Funds Trusts, Loomis Sayles Funds Trusts and Hansberger International Series based on a formula that takes into account, among other factors, the relative net assets of each fund. Trustees are reimbursed for travel expenses in connection with attendance at meetings.
A deferred compensation plan (the “Plan”) is available to the Trustees on a voluntary basis. Deferred amounts remain in the Funds until distributed in accordance with the provisions of the Plan. The value of a participating Trustee’s deferral account is based on theoretical investments of deferred amounts, on the normal payment dates, in certain funds of the Natixis Funds Trusts, Loomis Sayles Funds Trusts and Hansberger International Series as designated by the participating Trustees. Changes in the value of participants’ deferral accounts are allocated pro rata among the funds in the Natixis Funds Trusts, Loomis Sayles Funds Trusts, and Hansberger International Series, and are normally reflected as Trustees’ fees and expenses in the Statements of Operations. The portions of the accrued obligations allocated to the Funds under the Plan are reflected as Deferred Trustees’ fees in the Statements of Assets and Liabilities.
7. Line of Credit. Each Fund, together with certain other funds of Natixis Funds Trusts, Loomis Sayles Funds Trusts and Hansberger International Series, participates in a
| 94
Notes to Financial Statements (continued)
September 30, 2011
$200,000,000 committed unsecured line of credit provided by State Street Bank, with an individual limit of $125,000,000 for each fund that participates in the line of credit. Interest is charged to each participating fund based on its borrowings at a rate per annum equal to the greater of the Federal Funds rate or overnight LIBOR, plus 1.25%. In addition, a commitment fee of 0.125% per annum, payable at the end of each calendar quarter, is accrued and apportioned among the participating funds based on their average daily unused portion of the line of credit. Prior to April 21, 2011, the commitment fee was 0.15% per annum.
For the year ended September 30, 2011, none of the Funds had borrowings under these agreements.
8. Concentration of Risk. International Bond Fund is a non-diversified fund. Compared with diversified mutual funds, International Bond Fund may invest a greater percentage of its assets in a particular country. Therefore, International Bond Fund’s returns could be significantly affected by the performance of any one of the small number of countries in its portfolio.
Each Fund’s investments in foreign securities are subject to foreign currency fluctuations, higher volatility than U.S. securities, varying degrees of regulation and limited liquidity. Greater political, economic, credit and information risks are also associated with foreign securities.
9. Concentration of Ownership. At September 30, 2011, the Loomis Sayles Employees’ Profit Sharing Retirement Plan (“Retirement Plan”) held shares of beneficial interest in the Funds representing the following percentage of net assets:
| | | | |
Fund | | Retirement Plan | |
International Bond Fund | | | 0.37 | % |
Limited Term Government and Agency Fund | | | 0.08 | % |
From time to time, the Funds may have a concentration of one or more shareholder accounts holding a significant percentage of shares outstanding. Investment activities of these shareholder accounts could have material impacts on the Funds. As of September 30, 2011, certain Funds had shareholder accounts that comprised more than 5% of the Fund’s total outstanding shares. Such accounts may be beneficially held by one or more individuals or entities other than the owner of record. The number of shareholder accounts owning more than 5% of total outstanding shares, based on accounts that represent more than 5% of an individual class of shares, and the aggregate percentage of net assets represented by such holdings was as follows:
| | | | | | | | |
| | | Number of 5%
Shareholder
Accounts | | | Percentage of
Ownership | |
Core Plus Bond Fund | | | 1 | | | | 31.31 | % |
International Bond Fund | | | 1 | | | | 36.42 | % |
Limited Term Government and Agency Fund | | | 1 | | | | 6.71 | % |
95 |
Notes to Financial Statements (continued)
September 30, 2011
10. Capital Shares. Each Fund may issue an unlimited number of shares of beneficial interest, without par value. Transactions in capital shares were as follows:
| | | | | | | | | | | | | | | | |
| |
| Year Ended
September 30, 2011 |
| |
| Year Ended
September 30, 2010 |
|
Core Plus Bond Fund | | | Shares | | | | Amount | | | | Shares | | | | Amount | |
| Class A | | | | | | | | | | | | | | | | |
Issued from the sale of shares | | | 7,870,741 | | | $ | 100,254,532 | | | | 8,076,791 | | | $ | 99,281,285 | |
Issued in connection with the reinvestment of distributions | | | 562,968 | | | | 7,131,144 | | | | 503,145 | | | | 6,118,146 | |
Redeemed | | | (6,563,842 | ) | | | (83,095,094 | ) | | | (3,556,858 | ) | | | (43,324,928 | ) |
| | | | | | | | | | | | | | | | |
Net change | | | 1,869,867 | | | $ | 24,290,582 | | | | 5,023,078 | | | $ | 62,074,503 | |
| | | | | | | | | | | | | | | | |
| Class B | | | | | | | | | | | | | | | | |
Issued from the sale of shares | | | 26,416 | | | $ | 338,841 | | | | 46,593 | | | $ | 562,160 | |
Issued in connection with the reinvestment of distributions | | | 8,589 | | | | 109,089 | | | | 14,472 | | | | 175,787 | |
Redeemed | | | (143,488 | ) | | | (1,828,591 | ) | | | (298,342 | ) | | | (3,615,617 | ) |
| | | | | | | | | | | | | | | | |
Net change | | | (108,483 | ) | | $ | (1,380,661 | ) | | | (237,277 | ) | | $ | (2,877,670 | ) |
| | | | | | | | | | | | | | | | |
| Class C | | | | | | | | | | | | | | | | |
Issued from the sale of shares | | | 3,812,615 | | | $ | 48,580,295 | | | | 4,971,733 | | | $ | 60,338,041 | |
Issued in connection with the reinvestment of distributions | | | 149,316 | | | | 1,892,845 | | | | 143,826 | | | | 1,750,082 | |
Redeemed | | | (2,772,280 | ) | | | (35,095,298 | ) | | | (1,930,707 | ) | | | (23,457,007 | ) |
| | | | | | | | | | | | | | | | |
Net change | | | 1,189,651 | | | $ | 15,377,842 | | | | 3,184,852 | | | $ | 38,631,116 | |
| | | | | | | | | | | | | | | | |
| Class Y | | | | | | | | | | | | | | | | |
Issued from the sale of shares | | | 9,029,915 | | | $ | 116,089,119 | | | | 4,875,867 | | | $ | 59,587,010 | |
Issued in connection with the reinvestment of distributions | | | 140,385 | | | | 1,792,593 | | | | 102,891 | | | | 1,263,048 | |
Redeemed | | | (3,372,809 | ) | | | (43,199,888 | ) | | | (2,443,989 | ) | | | (29,878,028 | ) |
| | | | | | | | | | | | | | | | |
Net change | | | 5,797,491 | | | $ | 74,681,824 | | | | 2,534,769 | | | $ | 30,972,030 | |
| | | | | | | | | | | | | | | | |
Increase (decrease) from capital share transactions | | | 8,748,526 | | | $ | 112,969,587 | | | | 10,505,422 | | | $ | 128,799,979 | |
| | | | | | | | | | | | | | | | |
| 96
Notes to Financial Statements (continued)
September 30, 2011
10. Capital Shares (continued).
| | | | | | | | | | | | | | | | |
| |
| Year Ended
September 30, 2011 |
| |
| Year Ended
September 30, 2010 |
|
High Income Fund | | | Shares | | | | Amount | | | | Shares | | | | Amount | |
| Class A | | | | | | | | | | | | | | | | |
Issued from the sale of shares | | | 18,914,773 | | | $ | 95,991,464 | | | | 7,886,065 | | | $ | 37,432,096 | |
Issued in connection with the reinvestment of distributions | | | 752,698 | | | | 3,747,490 | | | | 740,661 | | | | 3,486,120 | |
Redeemed | | | (20,080,912 | ) | | | (101,121,007 | ) | | | (8,110,153 | ) | | | (38,368,078 | ) |
| | | | | | | | | | | | | | | | |
Net change | | | (413,441 | ) | | $ | (1,382,053 | ) | | | 516,573 | | | $ | 2,550,138 | |
| | | | | | | | | | | | | | | | |
| Class B | | | | | | | | | | | | | | | | |
Issued from the sale of shares | | | 7,798 | | | $ | 39,272 | | | | 27,891 | | | $ | 131,139 | |
Issued in connection with the reinvestment of distributions | | | 8,794 | | | | 43,828 | | | | 13,045 | | | | 61,362 | |
Redeemed | | | (97,228 | ) | | | (487,971 | ) | | | (143,704 | ) | | | (680,984 | ) |
| | | | | | | | | | | | | | | | |
Net change | | | (80,636 | ) | | $ | (404,871 | ) | | | (102,768 | ) | | $ | (488,483 | ) |
| | | | | | | | | | | | | | | | |
| Class C | | | | | | | | | | | | | | | | |
Issued from the sale of shares | | | 1,268,510 | | | $ | 6,372,692 | | | | 1,272,869 | | | $ | 6,002,594 | |
Issued in connection with the reinvestment of distributions | | | 130,779 | | �� | | 650,658 | | | | 138,274 | | | | 650,996 | |
Redeemed | | | (1,792,125 | ) | | | (8,989,058 | ) | | | (1,443,966 | ) | | | (6,801,815 | ) |
| | | | | | | | | | | | | | | | |
Net change | | | (392,836 | ) | | $ | (1,965,708 | ) | | | (32,823 | ) | | $ | (148,225 | ) |
| | | | | | | | | | | | | | | | |
| Class Y | | | | | | | | | | | | | | | | |
Issued from the sale of shares | | | 15,208,663 | | | $ | 76,115,275 | | | | 10,174,824 | | | $ | 47,942,376 | |
Issued in connection with the reinvestment of distributions | | | 718,068 | | | | 3,585,069 | | | | 940,961 | | | | 4,395,066 | |
Redeemed | | | (21,646,978 | ) | | | (107,960,574 | ) | | | (20,410,850 | ) | | | (95,761,418 | ) |
| | | | | | | | | | | | | | | | |
Net change | | | (5,720,247 | ) | | $ | (28,260,230 | ) | | | (9,295,065 | ) | | $ | (43,423,976 | ) |
| | | | | | | | | | | | | | | | |
Increase (decrease) from capital share transactions | | | (6,607,160 | ) | | $ | (32,012,862 | ) | | | (8,914,083 | ) | | $ | (41,510,546 | ) |
| | | | | | | | | | | | | | | | |
97 |
Notes to Financial Statements (continued)
September 30, 2011
10. Capital Shares (continued).
| | | | | | | | | | | | | | | | |
| |
| Year Ended
September 30, 2011 |
| |
| Year Ended
September 30, 2010 |
|
International Bond Fund | | | Shares | | | | Amount | | | | Shares | | | | Amount | |
| Class A | | | | | | | | | | | | | | | | |
Issued from the sale of shares | | | 1,211,150 | | | $ | 13,782,950 | | | | 1,454,026 | | | $ | 15,450,317 | |
Issued in connection with the reinvestment of distributions | | | 59,092 | | | | 637,499 | | | | 25,628 | | | | 268,292 | |
Redeemed | | | (1,950,042 | ) | | | (21,739,657 | ) | | | (582,821 | ) | | | (6,085,212 | ) |
| | | | | | | | | | | | | | | | |
Net change | | | (679,800 | ) | | $ | (7,319,208 | ) | | | 896,833 | | | $ | 9,633,397 | |
| | | | | | | | | | | | | | | | |
| Class C | | | | | | | | | | | | | | | | |
Issued from the sale of shares | | | 309,408 | | | $ | 3,486,185 | | | | 488,076 | | | $ | 5,290,541 | |
Issued in connection with the reinvestment of distributions | | | 9,437 | | | | 102,127 | | | | 4,722 | | | | 49,432 | |
Redeemed | | | (181,598 | ) | | | (1,994,024 | ) | | | (212,865 | ) | | | (2,176,537 | ) |
| | | | | | | | | | | | | | | | |
Net change | | | 137,247 | | | $ | 1,594,288 | | | | 279,933 | | | $ | 3,163,436 | |
| | | | | | | | | | | | | | | | |
| Class Y | | | | | | | | | | | | | | | | |
Issued from the sale of shares | | | 505,134 | | | $ | 5,693,161 | | | | 363,950 | | | $ | 3,901,435 | |
Issued in connection with the reinvestment of distributions | | | 8,923 | | | | 97,881 | | | | 34,152 | | | | 358,772 | |
Redeemed | | | (776,615 | ) | | | (8,753,041 | ) | | | (805,893 | ) | | | (8,515,480 | ) |
| | | | | | | | | | | | | | | | |
Net change | | | (262,558 | ) | | $ | (2,961,999 | ) | | | (407,791 | ) | | $ | (4,255,273 | ) |
| | | | | | | | | | | | | | | | |
Increase (decrease) from capital share transactions | | | (805,111 | ) | | $ | (8,686,919 | ) | | | 768,975 | | | $ | 8,541,560 | |
| | | | | | | | | | | | | | | | |
| 98
Notes to Financial Statements (continued)
September 30, 2011
10. Capital Shares (continued).
| | | | | | | | | | | | | | | | |
| |
| Year Ended
September 30, 2011 |
| |
| Year Ended
September 30, 2010 |
|
Limited Term Government and Agency Fund | | | Shares | | | | Amount | | | | Shares | | | | Amount | |
| Class A | | | | | | | | | | | | | | | | |
Issued from the sale of shares | | | 20,840,756 | | | $ | 248,142,366 | | | | 11,266,230 | | | $ | 133,267,058 | |
Issued in connection with the reinvestment of distributions | | | 438,301 | | | | 5,215,842 | | | | 199,254 | | | | 2,358,259 | |
Redeemed | | | (10,214,288 | ) | | | (121,563,216 | ) | | | (8,020,196 | ) | | | (94,867,976 | ) |
| | | | | | | | | | | | | | | | |
Net change | | | 11,064,769 | | | $ | 131,794,992 | | | | 3,445,288 | | | $ | 40,757,341 | |
| | | | | | | | | | | | | | | | |
| Class B | | | | | | | | | | | | | | | | |
Issued from the sale of shares | | | 912,056 | | | $ | 10,801,235 | | | | 74,327 | | | $ | 877,417 | |
Issued in connection with the reinvestment of distributions | | | 11,626 | | | | 138,181 | | | | 4,282 | | | | 50,516 | |
Redeemed | | | (335,640 | ) | | | (3,991,576 | ) | | | (124,533 | ) | | | (1,466,258 | ) |
| | | | | | | | | | | | | | | | |
Net change | | | 588,042 | | | $ | 6,947,840 | | | | (45,924 | ) | | $ | (538,325 | ) |
| | | | | | | | | | | | | | | | |
| Class C | | | | | | | | | | | | | | | | |
Issued from the sale of shares | | | 2,478,244 | | | $ | 29,568,408 | | | | 4,108,090 | | | $ | 48,568,618 | |
Issued in connection with the reinvestment of distributions | | | 74,077 | | | | 882,261 | | | | 41,123 | | | | 487,281 | |
Redeemed | | | (3,083,387 | ) | | | (36,752,240 | ) | | | (2,221,038 | ) | | | (26,267,537 | ) |
| | | | | | | | | | | | | | | | |
Net change | | | (531,066 | ) | | $ | (6,301,571 | ) | | | 1,928,175 | | | $ | 22,788,362 | |
| | | | | | | | | | | | | | | | |
| Class Y | | | | | | | | | | | | | | | | |
Issued from the sale of shares | | | 11,014,945 | | | $ | 131,705,304 | | | | 10,058,653 | | | $ | 119,749,282 | |
Issued in connection with the reinvestment of distributions | | | 100,885 | | | | 1,204,459 | | | | 40,673 | | | | 484,828 | |
Redeemed | | | (8,080,128 | ) | | | (96,465,164 | ) | | | (4,553,430 | ) | | | (54,266,299 | ) |
| | | | | | | | | | | | | | | | |
Net change | | | 3,035,702 | | | $ | 36,444,599 | | | | 5,545,896 | | | $ | 65,967,811 | |
| | | | | | | | | | | | | | | | |
Increase (decrease) from capital share transactions | | | 14,157,447 | | | $ | 168,885,860 | | | | 10,873,435 | | | $ | 128,975,189 | |
| | | | | | | | | | | | | | | | |
99 |
Report of Independent Registered Public Accounting Firm
To the Trustees of Natixis Funds Trust I and Loomis Sayles Funds II and Shareholders of Loomis Sayles Core Plus Bond Fund, Loomis Sayles High Income Fund, Loomis Sayles International Bond Fund, and Loomis Sayles Limited Term Government and Agency Fund:
In our opinion, the accompanying statements of assets and liabilities, including the portfolios of investments, and the related statements of operations and of changes in net assets and the financial highlights present fairly, in all material respects, the financial position of Loomis Sayles Core Plus Bond Fund, a series of Natixis Funds Trust I, and Loomis Sayles High Income Fund, Loomis Sayles International Bond Fund and Loomis Sayles Limited Term Government and Agency Fund, each a series of Loomis Sayles Funds II (collectively, the “Funds”), at September 30, 2011, and the results of each of their operations, the changes in each of their net assets and the financial highlights for each of the periods indicated, in conformity with accounting principles generally accepted in the United States of America. These financial statements and financial highlights (hereafter referred to as “financial statements”) are the responsibility of the Funds’ management; our responsibility is to express an opinion on these financial statements based on our audits. We conducted our audits of these financial statements in accordance with the standards of the Public Company Accounting Oversight Board (United States). Those standards require that we plan and perform the audits to obtain reasonable assurance about whether the financial statements are free of material misstatement. An audit includes examining, on a test basis, evidence supporting the amounts and disclosures in the financial statements, assessing the accounting principles used and significant estimates made by management, and evaluating the overall financial statement presentation. We believe that our audits, which included confirmation of securities at September 30, 2011 by correspondence with the custodian and brokers, provide a reasonable basis for our opinion.
PricewaterhouseCoopers LLP
Boston, Massachusetts
November 22, 2011
| 100
2011 U.S. Tax Distribution Information to Shareholders (Unaudited)
Corporate Dividends Received Deduction. For the fiscal year ended September 30, 2011, a percentage of dividends distributed by the Funds listed below qualify for the dividends received deduction for corporate shareholders. These percentages are as follows:
| | | | |
Fund | | Qualifying
Percentage | |
Core Plus Bond | | | 0.41 | % |
High Income | | | 1.32 | % |
Capital Gains Distributions. Pursuant to Internal Revenue Section 852(b), the following Funds paid distributions, which have been designated as capital gains distributions for the fiscal year ended September 30, 2011, unless subsequently determined to be different.
| | | | |
Fund | | Amount | |
Limited Term Government and Agency | | $ | 1,113,810 | |
International Bond | | | 202,164 | |
Qualified Dividend Income. For the fiscal year ended September 30, 2011, the Funds below will designate up to the maximum amount allowable pursuant to the Internal Revenue Code as qualified dividend income eligible for reduced tax rates. These lower rates range from 0% to 15% depending on an individual’s tax bracket. If the Funds pay a distribution during calendar year 2011, complete information will be reported in conjunction with Form 1099-DIV.
| | |
Fund | | |
Core Plus Bond | | |
High Income | | |
101 |
Trustee and Officer Information
The tables below provide certain information regarding the trustees and officers of Natixis Funds Trust I and Loomis Sayles Funds II (the “Trusts”). Unless otherwise indicated, the address of all persons below is 399 Boylston Street, Boston, MA 02116. The Funds’ Statements of Additional Information include additional information about the trustees of the Trusts and are available by calling Natixis Funds at 800-225-5478.
| | | | | | | | |
Name and Year of
Birth | | Position(s) Held with the Trusts, Length of Time
Served and Term
of Office* | | Principal Occupation(s)
During Past 5 Years | | Number of Portfolios in Fund Complex
Overseen** and Other
Directorships Held During Past 5 Years | | Experience, Qualifications,
Attributes, Skills for Board
Membership |
|
| INDEPENDENT TRUSTEES |
| | | | |
| Graham T. Allison, Jr. (1940) | | Trustee From 1984 to 1993 and since 1995 for Natixis Funds Trust I (including its predecessors); since 2003 for Loomis Sayles Funds II Contract Review and Governance Committee Member | | Douglas Dillon Professor and Director of the Belfer Center for Science and International Affairs, John F. Kennedy School of Government, Harvard University | | 44 Director, Taubman Centers, Inc. (real estate investment trust) | | Significant experience on Board of Trustees of the Trusts and/or other business organizations; government experience (including as Assistant Secretary of Defense under President Clinton); academic experience |
| | | | |
| Charles D. Baker1 (1956) | | Trustee From 2005 to 2009 and since 2011 for Natixis Funds Trust I and Loomis Sayles Funds II Contract Review and Governance Committee Member | | Executive in Residence at General Catalyst Partners (venture capital and growth equity firm); formerly, President and Chief Executive Officer, Harvard Pilgrim Health Care (health plan) | | 44 None | | Significant experience on Board of Trustees of the Trusts and/or other business organizations; executive experience including president and chief executive officer of a corporation |
| 102
Trustee and Officer Information
| | | | | | | | |
Name and Year of
Birth | | Position(s) Held with the Trusts, Length of Time
Served and Term
of Office* | | Principal Occupation(s)
During Past 5 Years | | Number of Portfolios in Fund Complex
Overseen** and Other
Directorships Held During Past 5 Years | | Experience, Qualifications,
Attributes, Skills for Board
Membership |
|
INDEPENDENT TRUSTEES continued |
| | | | |
Edward A. Benjamin (1938) | | Trustee Since 2003 for Natixis Funds Trust I; since 2002 for Loomis Sayles Funds II Chairman of the Contract Review and Governance Committee | | Retired | | 44 Formerly, Director, Precision Optics Corporation (optics manufacturer) | | Significant experience on Board of Trustees of the Trusts and/or other business organizations; significant experience providing legal counsel to boards, funds, advisers and other financial institutions (former partner at Ropes & Gray LLP) |
| | | | |
Daniel M. Cain (1945) | | Trustee Since 1996 for Natixis Funds Trust I; since 2003 for Loomis Sayles Funds II Contract Review and Governance Committee Member | | Chairman (formerly, President and Chief Executive Officer) of Cain Brothers & Company, Incorporated (investment banking) | | 44 Director, Sheridan Healthcare Inc. (physician practice management) | | Significant experience on Board of Trustees of the Trusts and/or other business organizations; experience in the financial industry, including roles as chairman and former chief executive officer of an investment banking firm |
| | | | |
| Kenneth A. Drucker (1945) | | Trustee Since 2008 for Natixis Funds Trust I and Loomis Sayles Funds II Chairman of the Audit Committee | | Formerly, Vice President and Treasurer, Sequa Corp. (aerospace, automotive and metal manufacturing) | | 44 Formerly, Director, M Fund, Inc. (investment company); Director, Gateway Trust (investment company) | | Significant experience on Board of Trustees of the Trusts and/or other business organizations; executive experience including as treasurer of a corporation |
103 |
Trustee and Officer Information
| | | | | | | | |
Name and Year of
Birth | | Position(s) Held with the Trusts, Length of Time
Served and Term
of Office* | | Principal Occupation(s)
During Past 5 Years | | Number of Portfolios in Fund Complex
Overseen** and Other
Directorships Held During Past 5 Years | | Experience, Qualifications,
Attributes, Skills for Board
Membership |
|
INDEPENDENT TRUSTEES continued |
| | | | |
Wendell J. Knox (1948) | | Trustee Since 2009 for Natixis Funds Trust I and Loomis Sayles Funds II Audit Committee Member | | Director (formerly, President and Chief Executive Officer) of Abt Associates Inc. (research and consulting) | | 44 Director, Eastern Bank (commercial bank); Director, The Hanover Insurance Group (property and casualty insurance) | | Significant experience on Board of Trustees of the Trusts and/or other business organizations; executive experience including roles as president and chief executive officer of a consulting company |
| | | | |
| Sandra O. Moose (1942) | | Chairperson of the Board of Trustees since November 2005 Trustee since 1982 for Natixis Funds Trust I (including its predecessors); since 2003 for Loomis Sayles Funds II Ex officio member of the Audit Committee and Contract Review and Governance Committee | | President, Strategic Advisory Services (management consulting); formerly, Senior Vice President and Director, The Boston Consulting Group, Inc. (management consulting) | | 44 Director, Verizon Communications; Director, AES Corporation (international power company); formerly, Director, Rohm and Haas Company (specialty chemicals) | | Significant experience on Board of Trustees of the Trusts and/or other business organizations; executive experience at a management consulting company |
| 104
Trustee and Officer Information
| | | | | | | | |
Name and Year of
Birth | | Position(s) Held with the Trusts, Length of Time
Served and Term
of Office* | | Principal Occupation(s)
During Past 5 Years | | Number of Portfolios in Fund Complex
Overseen** and Other
Directorships Held During Past 5 Years | | Experience, Qualifications,
Attributes, Skills for Board
Membership |
|
INDEPENDENT TRUSTEES continued |
| | | | |
Erik R. Sirri (1958) | | Trustee Since 2009 for Natixis Funds Trust I and Loomis Sayles Funds II Contract Review and Governance Committee Member | | Professor of Finance at Babson College; formerly, Director of the Division of Trading and Markets at the Securities and Exchange Commission | | 44 None | | Experience on Board of Trustees of the Trusts; experience as Director of the Division of Trading and Markets at the Securities and Exchange Commission; academic experience and training as an economist |
| | | | |
Peter J. Smail (1952) | | Trustee Since 2009 for Natixis Funds Trust I and Loomis Sayles Funds II Contract Review and Governance Committee Member | | Retired; formerly, President and Chief Executive Officer of Pyramis Global Advisors (investment management) | | 44 None | | Experience on Board of Trustees of the Trusts; mutual fund industry and executive experience, including roles as president and chief executive officer for an investment adviser |
| | | | |
| Cynthia L. Walker (1956) | | Trustee Since 2005 for Natixis Funds Trust I and Loomis Sayles Funds II Audit Committee Member | | Deputy Dean for Finance and Administration, Yale University School of Medicine; formerly, Executive Dean for Administration, Harvard Medical School; and formerly, Dean for Finance and Chief Financial Officer, Harvard Medical School | | 44 None | | Significant experience on Board of Trustees of the Trusts and/or other business organizations; executive experience in a variety of academic organizations, including roles as dean for finance and administration |
105 |
Trustee and Officer Information
| | | | | | | | |
Name and Year of
Birth | | Position(s) Held with the Trusts, Length of Time
Served and Term
of Office* | | Principal Occupation(s)
During Past 5 Years** | | Number of Portfolios in Fund Complex
Overseen** and Other
Directorships Held During Past 5 Years | | Experience, Qualifications,
Attributes, Skills for Board
Membership |
|
| INTERESTED TRUSTEES |
| | | | |
Robert J. Blanding2 (1947) 555 California Street San Francisco, CA 94104 | | Trustee Since 2003 for Natixis Funds Trust I; since 2002 for Loomis Sayles Funds II Chief Executive Officer of Loomis Sayles Funds II since 2002 | | President, Chairman, Director and Chief Executive Officer, Loomis, Sayles & Company, L.P. | | 44 None | | Significant experience on Board of Trustees of the Trusts; continuing service as president, chairman, and chief executive officer of Loomis, Sayles & Company, L.P. |
| | | | |
| David L. Giunta1, 3 (1965) | | Trustee Since 2011 for Natixis Funds Trust I and Loomis Sayles Funds II President and Chief Executive Officer of Natixis Funds Trust I and President of Loomis Sayles Funds II since 2008 | | President and Chief Executive Officer, Natixis Distribution Corporation, Natixis Asset Management Advisors, L.P. and Natixis Distributors, L.P.; formerly President, Fidelity Charitable Gift Fund; and formerly, Senior Vice President, Fidelity Brokerage Company. | | 44 None | | Experience on Board of Trustees of the Trusts; continuing experience as President and Chief Executive Officer of Natixis Global Associates – U.S. |
| 106
Trustee and Officer Information
| | | | | | | | |
Name and Year of
Birth | | Position(s) Held with the Trusts, Length of Time
Served and Term
of Office* | | Principal Occupation(s)
During Past 5 Years | | Number of Portfolios in Fund Complex
Overseen** and Other
Directorships Held During Past 5 Years | | Experience, Qualifications,
Attributes, Skills for Board
Membership |
|
INTERESTED TRUSTEES continued |
| | | | |
John T. Hailer4 (1960) | | Trustee Since 2000 for Natixis Funds Trust I; since 2003 for Loomis Sayles Funds II | | President and Chief Executive Officer-U.S. and Asia, Natixis Global Asset Management, L.P.; formerly, President and Chief Executive Officer, Natixis Distribution Corporation, Natixis Asset Management Advisors, L.P., Natixis Distributors, L.P. and Natixis Global Associates, Inc. | | 44 None | | Significant experience on Board of Trustees of the Trusts; continuing experience as Chief Executive Officer of Natixis Global Asset Management, L.P. |
| * | Each trustee serves until retirement, resignation or removal from the Board of Trustees. The current retirement age is 72; however, the trustees designated 2010 as a transition period so that any trustees who were age 72 or older during 2010 will not be required to retire until the end of calendar year 2011. The position of Chairperson of the Board is appointed for a two-year term. Ms. Moose was appointed to serve an additional two year term as the Chairperson of the Board of Trustees on November 20, 2009. |
| ** | The trustees of the Trusts serve as trustees of a fund complex that includes all series of the Natixis Funds Trust I, Natixis Funds Trust II, Natixis Funds Trust IV and Gateway Trust (collectively, the “Natixis Funds Trusts”), Loomis Sayles Funds I and Loomis Sayles Funds II (collectively, the “Loomis Sayles Funds Trusts”), and Hansberger International Series (collectively, the “Fund Complex”). |
| 1 | Mr. Baker and Mr. Giunta were appointed as trustees effective January 1, 2011. |
| 2 | Mr. Blanding is deemed an “interested person” of the Trusts because he holds the following positions with an affiliated person of the Trusts: President, Chairman, Director and Chief Executive Officer of Loomis, Sayles & Company, L.P. |
| 3 | Mr. Giunta is deemed an “interested person” of the Trusts because he holds the following positions with an affiliated person of the Trusts: Chief Executive Officer of Natixis Funds Trust I and President and Chief Executive Officer, Natixis Distribution Corporation, Natixis Asset Management Advisors, L.P. and Natixis Distributors, L.P |
107 |
Trustee and Officer Information
| 4 | Mr. Hailer is deemed an “interested person” of the Trusts because he holds the following positions with an affiliated person of the Trusts: President and Chief Executive Officer – U.S. and Asia, Natixis Global Asset Management, L.P. |
| | | | | | |
Name and Year of Birth | | Position(s) Held With the Trusts | | Term of Office* and Length of Time Served | | Principal Occupation(s) During Past 5 Years** |
|
| OFFICERS OF THE TRUSTS |
| | | |
| Coleen Downs Dinneen (1960) | | Secretary, Clerk and Chief Legal Officer | | Since September 2004 | | Executive Vice President, General Counsel, Secretary and Clerk (formerly, Senior Vice President, Deputy General Counsel, Assistant Secretary and Assistant Clerk), Natixis Distribution Corporation, Natixis Asset Management Advisors, L.P. and Natixis Distributors, L.P. |
| | | |
Daniel J. Fuss (1933) One Financial Center Boston, MA 02111 | | Executive Vice President of Loomis Sayles Funds II | | Since June 2003 | | Vice Chairman and Director, Loomis, Sayles & Company, L.P. |
| | | |
Russell L. Kane (1969) | | Chief Compliance Officer, Assistant Secretary and Anti-Money Laundering Officer | | Chief Compliance Officer, since May 2006; Assistant Secretary since June 2004; and Anti-Money Laundering Officer since April 2007 | | Chief Compliance Officer for Mutual Funds, Senior Vice President, Deputy General Counsel, Assistant Secretary and Assistant Clerk, Natixis Distribution Corporation, Natixis Asset Management Advisors, L.P. and Natixis Distributors, L.P. |
| 108
Trustee and Officer Information
| | | | | | |
Name and Year of Birth | | Position(s) Held with the Trusts | | Term of Office* and Length of Time Served | | Principal Occupation(s) During Past 5 Years** |
|
OFFICERS OF THE TRUSTS continued |
| | | |
Michael C. Kardok (1959) | | Treasurer, Principal Financial and Accounting Officer | | Since October 2004 | | Senior Vice President, Natixis Asset Management Advisors, L.P. and Natixis Distributors, L.P. |
| * | Each officer of the Trusts serves for an indefinite term in accordance with the Trusts’ current by-laws until the date his or her successor is elected and qualified, or until he or she sooner dies, retires, is removed or becomes disqualified. |
| ** | Each person listed above, except as noted, holds the same position(s) with the Natixis Funds Trusts, Loomis Sayles Funds Trust and Hansberger International Series. Mr. Fuss is not an officer of the Natixis Funds Trusts or the Hansberger International Series. Previous positions during the past five years with the Distributor, Natixis Advisors or Loomis Sayles are omitted, if not materially different from a trustee’s or officer’s current position with such entity. |
109 |
ANNUAL REPORT
September 30, 2011

Loomis Sayles Global Equity and Income Fund
Loomis Sayles Growth Fund
Loomis Sayles Mid Cap Growth Fund
Loomis Sayles Value Fund
TABLE OF CONTENTS
Management Discussion and Performance page 1
Portfolio of Investments page 26
Financial Statements page 53
LOOMIS SAYLES GLOBAL EQUITY AND INCOME FUND
Management Discussion
Managers:
Mark Baribeau, CFA*
Dan Fuss, CFA, CIC
Warren Koontz, CFA, CIC
David Rolley, CFA
Loomis, Sayles & Company, L.P.
Objective:
Seeks high total return through a combination of capital appreciation and current income
Strategy:
Invests primarily in equity and fixed-income securities of U.S. and foreign issuers, including securities of issuers located in emerging markets
Fund Inception:
May 1, 1996
Symbols:
| | |
| Class A | | LGMAX |
| Class C | | LGMCX |
| Class Y | | LSWWX |
| * | Effective May 2, 2011, Mark Baribeau no longer serves as a portfolio manager of the fund. |
Market Conditions
The period began positively, as prospects for global economic growth appeared to be in place. Nevertheless, the markets began to struggle following a multitude of shocks, including a devastating earthquake and tsunami in Japan, which caused negative growth in the world’s third largest economy and disrupted the global supply chain, unrest in the Middle East and Northern Africa, which caused oil to spike above $100 a barrel, and Standard & Poor’s downgrade of the United States’ long-term credit rating. In Europe, the sovereign-debt crisis sent fears through the region’s banking system further roiling markets. These headwinds, coupled with weaker-than-anticipated U.S. economic data, led to an increase in market volatility as the second half of the period unfolded.
Performance Results
For the 12 months ended September 30, 2011, Class A shares of Loomis Sayles Global Equity and Income Fund returned -1.67% at net asset value. The fund outperformed its primary benchmark, the Morgan Stanley Capital International (MSCI) World Index, which returned -3.84% for the period. The fund underperformed its secondary benchmark, the Citigroup World Government Bond Index, which returned 4.61%. The fund held up better than the average fund in its peer group, the Morningstar World Allocation category, which returned -2.85%.
Explanation of Fund Performance
Within the fund’s stock portfolio, robust stock selection and overweight positions in the information technology and consumer discretionary sectors contributed most to performance. Positions in Apple and ARM Holdings were among the fund’s strongest individual performers. Strong sales of the iPads and iPhones greatly boosted Apple’s results. Shares of ARM Holdings, a semiconductor designer, were up due to record sales of mobile communication devices, solid growth in new licensees and Microsoft’s decision to run its new mobile operating system on ARM chip technology.
The financials and energy sectors were the largest performance detractors, primarily due to stock selection. In financials, U.K.-based Standard
1 |
Chartered, a banking company, and U.S.-based Jones Lang LaSalle, a real estate and investment management company, were among the fund’s weakest holdings. Concerns about European debt and uncertainty surrounding U.K. financial services regulation and taxation policies helped drive down Standard Chartered shares, while Jones Lang LaSalle shares declined due to the potential impact of slowing global growth on commercial real estate. In energy, National Oilwell Varco, an oil and gas equipment company lagged due to expectations for declining margins.
In the fixed-income portfolio, country allocation contributed most to performance, primarily due to an overweight position in the United States and underweight positions in Europe and Japan. An underweight in euro-denominated securities also helped. Within the U.S. bond allocation, security selection in the utilities and pharmaceuticals sectors was effective. Lower-quality corporate bond positions detracted from performance, as investors shunned risk late in the period. In addition, an underweight in the yen and an overweight in certain emerging market currencies detracted. To better align the currency exposure of specific holdings, we used foreign exchange forward contracts, which had a minimal impact on performance.
Outlook
The market remains highly responsive to and strongly influenced by macroeconomic and related geopolitical considerations, and we think it’s unlikely this pattern will change in the near term. It appears corporate earnings growth rates have peaked. For certain sectors, industries and many companies, earnings actually may decline in the year ahead. We also believe much of this bad news already has been priced into the market. Stock market valuation indicators point to equities being attractively valued relative to history, and equity valuations appear especially attractive relative to interest rates. While our long-term conviction in equities remains intact, especially at these low historical valuation levels, the near to intermediate term could offer a wide range of outcomes and continued volatility.
What You Should Know:
Investments in the fund are subject to a number of risks. Please see the “Principal Risks” section of the fund’s prospectus. The purchase of fund shares should be seen as a long-term investment.
| 2
LOOMIS SAYLES GLOBAL EQUITY AND INCOME FUND
Investment Results through September 30, 2011
The charts comparing the fund’s performance to two indexes provide you with a general sense of how it performed. The fund’s total return for the period shown below appears with and without sales charges and includes fund expenses and fees. An index measures the performance of a theoretical portfolio. Unlike a fund, the index is unmanaged and does not have expenses that affect the results. It is not possible to invest directly in an index. Investors would incur transaction costs and other expenses if they purchased the securities necessary to match the index.
Growth of a $10,000 Investment in Class A Shares1,6
September 30, 2001 through September 30, 2011
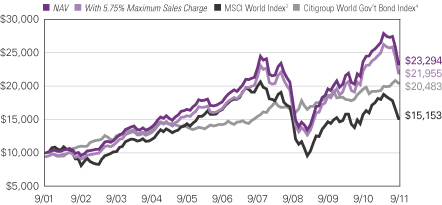
Average Annual Total Returns — September 30, 20116
| | | | | | | | | | | | |
| | | | |
| | | 1 Year | | | 5 Years | | | 10 Years | |
| | | | |
| Class A (Inception 2/1/06)1 | | | | | | | | | | | | |
| NAV | | | -1.67 | % | | | 5.69 | % | | | 8.82 | % |
| With 5.75% Maximum Sales Charge | | | -7.33 | | | | 4.45 | | | | 8.18 | |
| | | | |
| Class C (Inception 2/1/06)1 | | | | | | | | | | | | |
| NAV | | | -2.42 | | | | 4.89 | | | | 8.02 | |
| With CDSC2 | | | -3.39 | | | | 4.89 | | | | 8.02 | |
| | | | |
| Class Y (Inception 5/1/96) | | | | | | | | | | | | |
| NAV | | | -1.42 | | | | 5.96 | | | | 9.10 | |
| | | | |
| Comparative Performance | | | | | | | | | | | | |
| MSCI World Index3 | | | -3.84 | | | | -1.68 | | | | 4.24 | |
| Citigroup World Government Bond Index4 | | | 4.61 | | | | 7.54 | | | | 7.43 | |
| Morningstar World Allocation Fund Avg.5 | | | -2.85 | | | | 1.86 | | | | 5.99 | |
Performance data quoted represents past performance and is no guarantee of future results. Total return and value will vary and you may have a gain or loss when shares are sold. Current performance may be lower or higher than quoted. For most recent month-end performance, visit ga.natixis.com. Performance for other share classes will be greater or less than shown based on differences in fees and sales charges. Performance for periods less than one year is cumulative, not annualized. Returns reflect changes in share price and reinvestment of dividends and capital gains, if any. Class Y shares are not available for purchase by all investors.
The table and graph do not reflect taxes shareholders might owe on any fund distributions or when they redeem their shares.
3 |
| | | | |
| Fund Composition | | % of Net
Assets as of
9/30/11 | |
Common Stocks | | | 62.4 | |
Bonds and Notes | | | 28.8 | |
Preferred Stocks | | | 0.7 | |
Senior Loans | | | 0.0 | |
Short-Term Investments and Other | | | 8.1 | |
| |
| Ten Largest Holdings | | % of Net
Assets as of
9/30/11 | |
Apple, Inc. | | | 4.1 | |
Novo Nordisk A/S, Class B | | | 2.3 | |
Siemens AG, (Registered) | | | 1.8 | |
Baidu, Inc., Sponsored ADR | | | 1.8 | |
PepsiCo, Inc. | | | 1.7 | |
Standard Chartered PLC | | | 1.6 | |
Google, Inc., Class A | | | 1.6 | |
FMC Technologies, Inc. | | | 1.6 | |
Priceline.com, Inc. | | | 1.6 | |
U.S. Treasury Note, 0.875%, 01/31/2012 | | | 1.5 | |
| | | | |
| Five Largest Industries | | % of Net
Assets as of
9/30/11 | |
Treasuries | | | 6.2 | |
Beverages | | | 6.0 | |
Pharmaceuticals | | | 4.4 | |
Computers & Peripherals | | | 4.1 | |
Internet Software & Services | | | 4.0 | |
Portfolio holdings and asset allocations will vary.
Expense Ratios
as stated in the most recent prospectus
| | | | | | | | |
| Share Class | | Gross Expense Ratio7 | | | Net Expense Ratio8 | |
| A | | | 1.29 | % | | | 1.25 | % |
| C | | | 2.04 | | | | 2.00 | |
| Y | | | 1.04 | | | | 1.00 | |
NOTES TO CHARTS
| 1 | Prior to the inception of Class A and C shares (2/1/06), performance is that of Institutional Class shares, restated to reflect the higher net expenses and sales loads of Class A and C shares. |
| 2 | Performance for Class C shares assumes a 1% contingent deferred sales charge (“CDSC”) applied when you sell shares within one year of purchase. |
| 3 | MSCI World Index is an unmanaged index that is designed to measure the equity market performance of developed markets. |
| 4 | Citigroup World Government Bond Index is an unmanaged index that includes the most significant and liquid government bond markets globally that carry at least an investment-grade rating. |
| 5 | Morningstar World Allocation Fund Average is the average performance without sales charges of funds with similar investment objectives, as calculated by Morningstar, Inc. |
| 6 | Fund performance has been increased by fee waivers and/or expense reimbursements, if any, without which performance would have been lower. |
| 7 | Before fee waivers and/or expense reimbursements. |
| 8 | After fee waivers and/or expense reimbursements. Waivers/reimbursements are contractual and are set to expire 1/31/12. Contracts are reevaluated on an annual basis. |
| 4
LOOMIS SAYLES GROWTH FUND
Management Discussion
Manager:
Aziz Hamzaogullari, CFA
Loomis, Sayles & Company, L.P.
Objective:
Long-term growth of capital
Strategy:
Invests primarily in equity securities, including common stocks, convertible securities, and warrants; focuses on stocks of large-capitalization companies, but may invest in companies of any size
Fund Inception:
May 16, 1991
Symbols:
| | |
| Class A | | LGRRX |
| Class B | | LGRBX |
| Class C | | LGRCX |
| Class Y | | LSGRX |
Market Conditions
The period began positively, as prospects for global economic growth appeared to be in place. Nevertheless, the markets began to struggle following a multitude of shocks, including a devastating earthquake and tsunami in Japan, which caused negative growth in the world’s third largest economy and disrupted the global supply chain, unrest in the Middle East and Northern Africa, which caused oil to spike above $100 a barrel, and Standard & Poor’s downgrade of the United States’ long-term credit rating. In Europe, the sovereign-debt crisis sent fears through the region’s banking system further roiling markets. These headwinds, coupled with weaker-than-anticipated U.S. economic data, led to an increase in market volatility as the second half of the period unfolded.
Performance Results
For the 12 months ended September 30, 2011, Class A shares of Loomis Sayles Growth Fund returned 1.95% at net asset value. The fund underperformed its benchmark, the Russell 1000 Growth Index, which returned 3.78% for the period. The fund outperformed the average fund in its peer group, the Morningstar Large Growth category, which returned -0.42%.
Explanation of Fund Performance
The fund’s healthcare, consumer discretionary and consumer staples sectors made the greatest positive contributions to performance. In terms of individual holdings, positions in Amazon.com, Biogen and Visa were among the leading contributors to the fund’s return. Shares in biotechnology company Biogen advanced after the company reported strong sales of its multiple sclerosis drug and reported it would be increasing the price of its multiple sclerosis-related offerings. Internet retailer Amazon.com also was strong during the period, as the company reported stronger-than-expected sales during the period. The company benefited from a secular shift from traditional offline retail to on-line retail. It continued to gain share in ecommerce, given its competitive advantages, such as brand, scale and logistics. Shares of Visa, the provider of a retail electronic payments network, advanced during the reporting period, as investors reacted to the government’s decision to allow higher-than-expected fees on debit cards.
The underperformance was concentrated in the first six months of the time period, where lower quality, less attractively valued names outperformed their higher
5 |
quality, attractively valued counterparts. The financial services and producer durables sectors represented the weakest contributors to the fund’s 12-month return. In terms of individual holdings, Cisco Systems, SEI Investments and Greenhill were among the weakest-performing stocks. Although Cisco was an underperformer, we increased the fund’s position in the networking equipment maker. We believe the company has significant competitive advantages and sustainable, profitable growth potential. The market’s current low expectations for the company have created a significant disparity between our estimate of intrinsic value and the current price. Short-term concerns surrounding SEI Investments’ lower margins related to an increase in expenses to invest in the company’s global wealth platform. Slow progress from this division weighed on the stock during the period, but we increased the fund’s position in the stock because we believe our long-term investment thesis remains intact. Shares of investment advisory company Greenhill were down due to short-term concerns about the potential decline of mergers- and-acquisitions activity in light of market volatility. Nevertheless, we have maintained the fund’s position in Greenhill because our long-term investment thesis remains intact.
Outlook
At the end of the period, the fund had more exposure than the benchmark to the financial services, health care and consumer staples sectors and less exposure to the energy, producer durables, consumer discretionary and technology groups. These sector weights are the result of the stock selection process. It is important to note that we do not manage the fund based on projections of macroeconomic trends. Our disciplined investment approach relies on fundamental and bottom-up research. Regardless of the current market environment, we search for what we believe are high-quality businesses with sustainable competitive advantages and profitable growth characteristics whose shares are trading at significant discounts to intrinsic values. We believe this discipline can limit the downside risks of losing capital and result in a diversified portfolio of companies with different fundamental drivers of return. Our approach may not produce the highest results in any one period, but we are confident that it is a prudent strategy for the long term. Because we take a long-term view on the fund’s investments, portfolio turnover tends to be relatively low.
What You Should Know:
Investments in the fund are subject to a number of risks. Please see the “Principal Risks” section of the fund’s prospectus. The purchase of fund shares should be seen as a long-term investment.
| 6
LOOMIS SAYLES GROWTH FUND
Investment Results through September 30, 2011
The charts comparing the fund’s performance to an index provide you with a general sense of how it performed. The fund’s total return for the period shown below appears with and without sales charges and includes fund expenses and fees. An index measures the performance of a theoretical portfolio. Unlike a fund, the index is unmanaged and does not have expenses that affect the results. It is not possible to invest directly in an index. Investors would incur transaction costs and other expenses if they purchased the securities necessary to match the index.
Growth of a $10,000 Investment in Class A Shares1,5
September 30, 2001 through September 30, 2011
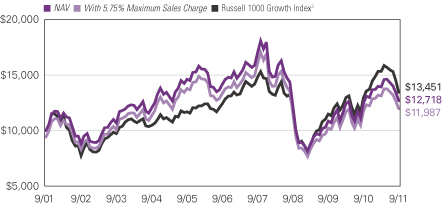
Average Annual Total Returns — September 30, 20115
| | | | | | | | | | | | |
| | | | |
| | | 1 Year | | | 5 Years | | | 10 Years | |
| | | | |
| Class A (Inception 12/31/96)1 | | | | | | | | | | | | |
| NAV | | | 1.95 | % | | | -2.14 | % | | | 2.43 | % |
| With 5.75% Maximum Sales Charge | | | -3.85 | | | | -3.31 | | | | 1.83 | |
| | | | |
| Class B (Inception 9/12/03)1 | | | | | | | | | | | | |
| NAV | | | 1.44 | | | | -2.82 | | | | 1.68 | |
| With CDSC2 | | | -3.56 | | | | -3.21 | | | | 1.68 | |
| | | | |
| Class C (Inception 9/12/03)1 | | | | | | | | | | | | |
| NAV | | | 1.44 | | | | -2.86 | | | | 1.68 | |
| With CDSC2 | | | 0.44 | | | | -2.86 | | | | 1.68 | |
| | | | |
| Class Y (Inception 5/16/91) | | | | | | | | | | | | |
| NAV | | | 2.21 | | | | -1.77 | | | | 2.77 | |
| | | | |
| Comparative Performance | | | | | | | | | | | | |
| Russell 1000 Growth Index3 | | | 3.78 | | | | 1.62 | | | | 3.01 | |
| Morningstar Large Growth Fund Avg.4 | | | -0.42 | | | | 0.15 | | | | 2.79 | |
Performance data quoted represents past performance and is no guarantee of future results. Total return and value will vary and you may have a gain or loss when shares are sold. Current performance may be lower or higher than quoted. For most recent month-end performance, visit ga.natixis.com. Performance for other share classes will be greater or less than shown based on differences in fees and sales charges. Performance for periods less than one year is cumulative, not annualized. Returns reflect changes in share price and reinvestment of dividends and capital gains, if any. Class Y shares are not available for purchase by all investors.
The table and graph do not reflect taxes shareholders might owe on any fund distributions or when they redeem their shares.
7 |
| | | | |
| Fund Composition | | % of Net
Assets as of
9/30/11 | |
Common Stocks | | | 99.8 | |
Short-Term Investments and Other | | | 0.2 | |
| |
| Ten Largest Holdings | | % of Net
Assets as of
9/30/11 | |
Amazon.com, Inc. | | | 7.0 | |
Visa, Inc., Class A | | | 6.6 | |
Google, Inc., Class A | | | 5.8 | |
Cisco Systems, Inc. | | | 5.5 | |
Oracle Corp. | | | 5.3 | |
QUALCOMM, Inc. | | | 4.7 | |
Amgen, Inc. | | | 4.3 | |
United Parcel Service, Inc., Class B | | | 3.8 | |
Danone S.A., Sponsored ADR | | | 3.8 | |
SEI Investments Co. | | | 3.7 | |
| | | | |
| Five Largest Industries | | % of Net
Assets as of
9/30/11 | |
Software | | | 10.9 | |
Communications Equipment | | | 10.2 | |
Capital Markets | | | 8.4 | |
Internet & Catalog Retail | | | 8.3 | |
IT Services | | | 8.2 | |
Portfolio holdings and asset allocations will vary.
Expense Ratios
as stated in the most recent prospectus
| | | | | | | | |
| Share Class | | Gross Expense Ratio6 | | | Net Expense Ratio7 | |
| A | | | 1.20 | % | | | 1.20 | % |
| B | | | 1.95 | | | | 1.95 | |
| C | | | 1.95 | | | | 1.95 | |
| Y | | | 0.95 | | | | 0.95 | |
NOTES TO CHARTS
| 1 | Prior to 9/15/03, performance of Class A shares is that of Retail Class shares, which were redesignated as Class A shares, restated to reflect the sales load of Class A shares. Prior to the inception of Class B and C shares (9/12/03), performance is that of Institutional Class shares, restated to reflect the higher net expenses and sales loads of Class B and C shares. |
| 2 | Performance for Class B shares assumes a maximum of 5% contingent deferred sales charge (“CDSC”) applied when you sell shares, which declines annually between years 1-6 according to the following schedule: 5, 4, 3, 3, 2, 1, 0%. Class C shares performance assumes a 1% CDSC applied when you sell shares within one year of purchase. |
| 3 | Russell 1000 Growth Index is an unmanaged index that measures the performance of the large-cap growth segment of the U.S. equity universe. If includes those Russell 1000 companies with higher price-to-book ratios and higher forecasted growth values. |
| 4 | Morningstar Large Growth Fund Average is the average performance without sales charges of funds with similar investment objectives, as calculated by Morningstar, Inc. |
| 5 | Fund performance has been increased by fee waivers and/or expense reimbursements, if any, without which performance would have been lower. |
| 6 | Before fee waivers and/or expense reimbursements. |
| 7 | After fee waivers and/or expense reimbursements. Waivers/reimbursements are contractual and are set to expire 1/31/12. Contracts are reevaluated on an annual basis. |
| 8
LOOMIS SAYLES MID CAP GROWTH FUND
Management Discussion
Manager:
Philip C. Fine, CFA
Loomis, Sayles & Company, L.P.
Objective:
Long-term growth of capital
Strategy:
Invests primarily in common stocks or other equity securities; focuses on stocks of companies that fall within the capitalization range of the companies included in the Russell Midcap Growth Index.
Fund Inception:
December 31, 1996
Symbols:
| | |
| Class A | | LAGRX |
| Class C | | LSACX |
| Class Y | | LSAIX |
Market Conditions
Federal Reserve Board policy helped stocks maintain their uptrend into the second quarter of 2011, despite a multitude of shocks, both natural and geopolitical including a devastating earthquake and tsunami in Japan, which caused negative growth in the world’s third largest economy and disrupted the global supply chain, and unrest in the Middle East and Northern Africa, which caused oil to spike above $100 a barrel. Yet, the signature moment of the period likely occurred in early August, when Standard & Poor’s downgraded the United States’ long-term credit rating. In Europe, the sovereign-debt crisis sent fears through the region’s banking system. Faced with weakening global growth, investors dumped riskier assets in favor of perceived “safe-haven” U.S. Treasuries and the U.S. dollar.
Performance Results
For the 12 months ended September 30, 2011, Class A shares of Loomis Sayles Mid Cap Growth Fund returned 2.65% at net asset value. The Fund outperformed its benchmark, the Russell Midcap Growth Index, which returned 0.80% for the period. The Fund outperformed the -1.15% average return of funds in its peer group, the Morningstar Mid-Cap Growth category.
Explanation of Fund Performance
The consumer discretionary and healthcare sectors, where the fund’s stock selection was robust, made the greatest positive contributions. Performance was broad-based, with strong results from the retail, apparel and restaurants and leisure industries. Lululemon, a designer and retailer of women’s athletic apparel, was among the top contributors, benefiting from a consistent pattern of strong same-store sales. Dollar Tree, a discount retailer, also performed well.
Performance in the healthcare sector was broad-based, with biotechnology and pharmaceutical companies leading the way. Among the fund’s top performers were Alexion Pharmaceuticals, a biotech company specializing in drugs for rare diseases, and Perrigo, a generic drug and nutritional products manufacturer. Alexion’s lead drug, Soliris, was recently approved to
9 |
treat an additional disease, and the company benefited from increasing patient awareness in the United States, Europe and Japan. Perrigo’s efforts to increase market share of store-brand drugs, roll out new products and acquire other companies pushed shares higher.
The materials and financial services sectors provided the only negative contributions to Fund performance. Materials stocks struggled due to a rising U.S. dollar, falling commodity prices and diminished global growth expectations. Rockwood Holdings, a specialty chemicals company, and Titan International, a manufacturer of tires and wheels for construction and agricultural equipment, were among the fund’s weakest holdings. Macro factors, rather than company-specific events, also drove down results in financial services. Shares of SVB Financial, a bank holding company, fell due to slowing loan growth and net interest margin compression. The fund’s two holdings in commercial real estate services, CB Richard Ellis and Jones Lang LaSalle, sold off due to concerns that sales and leasing activities were slowing.
During the period the fund owned options (puts and calls) on several individual stocks and exchange-traded funds, primarily for hedging purposes. We bought calls on one stock because we believed it would appreciate in price. These positions did not have a material impact on fund performance during the period.
Outlook
The market remains highly responsive to and strongly influenced by macroeconomic and related geopolitical considerations, and we think it’s unlikely this pattern will change in the near term. It appears corporate earnings growth rates have peaked. For certain sectors, industries and many companies, earnings actually may decline in the year ahead. We also believe much of this bad news already has been priced into the market. Stock market valuation indicators point to equities being attractively valued relative to history, and equity valuations appear especially attractive relative to interest rates. While our long-term conviction in equities remains intact, especially at these low historical valuation levels, the near to intermediate term could offer a wide range of outcomes and continued volatility.
What You Should Know
Investments in the fund are subject to a number of risks. Please see the “Principal Risks” section of the fund’s prospectus. The purchase of fund shares should be seen as a long-term investment.
| 10
LOOMIS SAYLES MID CAP GROWTH FUND
Investment Results through September 30, 2011
The charts comparing the fund’s performance to an index provide you with a general sense of how it performed. The fund’s total return for the period shown below appears with and without sales charges and includes fund expenses and fees. An index measures the performance of a theoretical portfolio. Unlike a fund, the index is unmanaged and does not have expenses that affect the results. It is not possible to invest directly in an index. Investors would incur transaction costs and other expenses if they purchased the securities necessary to match the index.
Growth of a $10,000 Investment in Class A Shares1,5
September 30, 2001 through September 30, 2011

Average Annual Total Returns — September 30, 20115
| | | | | | | | | | | | |
| | | | |
| | | 1 Year | | | 5 Years | | | 10 Years | |
| | | | |
| Class A (Inception 12/31/96)1 | | | | | | | | | | | | |
| NAV | | | 2.65 | % | | | 4.37 | % | | | 6.25 | % |
| With 5.75% Maximum Sales Charge | | | -3.25 | | | | 3.15 | | | | 5.62 | |
| | | | |
| Class C (Inception 2/2/09)1 | | | | | | | | | | | | |
| NAV | | | 1.96 | | | | 3.58 | | | | 5.42 | |
| With CDSC2 | | | 0.96 | | | | 3.58 | | | | 5.42 | |
| | | | |
| Class Y (Inception 12/31/96) | | | | | | | | | | | | |
| NAV | | | 2.98 | | | | 4.64 | | | | 6.53 | |
| | | | |
| Comparative Performance | | | | | | | | | | | | |
| Russell Midcap Growth Index3 | | | 0.80 | | | | 1.64 | | | | 6.70 | |
| Morningstar Mid-Cap Growth Avg.4 | | | -1.15 | | | | 1.34 | | | | 5.21 | |
Performance data quoted represents past performance and is no guarantee of future results. Total return and value will vary and you may have a gain or loss when shares are sold. Current performance may be lower or higher than quoted. For most recent month-end performance, visit ga.natixis.com. Performance for other share classes will be greater or less than shown based on differences in fees and sales charges. Performance for periods less than one year is cumulative, not annualized. Returns reflect changes in share price and reinvestment of dividends and capital gains, if any. Class Y shares are not available for purchase by all investors.
The table and graph do not reflect taxes shareholders might owe on any fund distributions or when they redeem their shares.
11 |
| | | | |
| Fund Composition | | % of Net
Assets as of
9/30/11 | |
Common Stocks | | | 92.9 | |
Short-Term Investments and Other | | | 7.1 | |
| |
| Ten Largest Holdings | | % of Net
Assets as of
9/30/11 | |
Dollar Tree, Inc. | | | 3.5 | |
Perrigo Co. | | | 3.1 | |
Alexion Pharmaceuticals, Inc. | | | 2.7 | |
Green Mountain Coffee Roasters, Inc. | | | 2.3 | |
Stericycle, Inc. | | | 2.3 | |
AutoZone, Inc. | | | 2.2 | |
Wynn Resorts Ltd. | | | 2.2 | |
PetSmart, Inc. | | | 2.2 | |
Teradata Corp. | | | 2.1 | |
SXC Health Solutions Corp. | | | 2.1 | |
| | | | |
| Five Largest Industries | | % of Net
Assets as of
9/30/11 | |
Specialty Retail | | | 7.7 | |
Food Products | | | 7.5 | |
Biotechnology | | | 6.6 | |
Oil, Gas & Consumable Fuels | | | 5.9 | |
Semiconductors & Semiconductor Equipment | | | 5.8 | |
Portfolio holdings and asset allocations will vary.
Expense Ratios
as stated in the most recent prospectus
| | | | | | | | |
| Share Class | | Gross Expense Ratio6 | | | Net Expense Ratio7 | |
| A | | | 1.46 | % | | | 1.25 | % |
| C | | | 2.24 | | | | 2.00 | |
| Y | | | 1.22 | | | | 1.00 | |
NOTES TO CHARTS
| 1 | Prior to 2/1/09, performance of Class A shares is that of Retail Class shares, which were redesignated as Class A shares, restated to reflect the sales load of Class A shares. Prior to the inception of Class C shares (2/2/09), performance is that of Retail Class shares, restated to reflect the higher net expenses and sales loads of Class C shares. The fund revised its investment strategies on 2/1/07; performance may have been different had the current strategies been in place for all periods shown. |
| 2 | Class C shares performance assumes a 1% CDSC applied when you sell shares within one year of purchase. |
| 3 | Russell Midcap Growth Index is an unmanaged index that measures the performance of the mid-cap growth segment of the U.S. equity universe. It includes those Russell Midcap Index companies with higher price-to-book ratios and higher forecasted growth values. |
| 4 | Morningstar Mid-Cap Growth Average is the average performance without sales charges of funds with similar investment objectives, as calculated by Morningstar, Inc. |
| 5 | Fund performance has been increased by fee waivers and/or expense reimbursements, if any, without which performance would have been lower. |
| 6 | Before fee waivers and/or expense reimbursements. |
| 7 | After fee waivers and/or expense reimbursements. Waivers/reimbursements are contractual and are set to expire 1/31/12. Contracts are reevaluated on an annual basis. |
| 12
LOOMIS SAYLES VALUE FUND
Management Discussion
Managers:
Arthur Barry, CFA
James L. Carroll, CFA
Warren N. Koontz, CFA, CIC
Loomis, Sayles & Company, L.P.
Objective:
Long-term growth of capital and income
Strategy:
Invests primarily in equity securities, including common stocks, convertible securities, and warrants.
Fund Inception:
May 13, 1991
Symbols:
| | |
| Class A | | LSVRX |
| Class B | | LSVBX |
| Class C | | LSCVX |
| Class Y | | LSGIX |
| Admin Class | | LSAVX |
Market Conditions
After a strong fourth quarter 2010 and a strong start to 2011, economic growth hit a soft patch and slowed in the second quarter of 2011, weighed down by a multitude of global and domestic issues. Additionally, U.S. equities posted steep declines in the third quarter of 2011, with the major large-cap value benchmarks dropping approximately 16%. Economically sensitive stocks suffered the most in the third-quarter selloff.
Performance Results
For the 12 months ended September 30, 2011, Class A shares of Loomis Sayles Value Fund returned -3.28% at net asset value. The fund underperformed its benchmark, the Russell 1000 Value Index, which returned -1.89% for the period. The fund also underperformed the -2.41% average return of funds in its peer group, the Morningstar Large Value category.
Explanation of Fund Performance
The energy, consumer staples and healthcare sectors made the greatest positive contributions to the fund’s performance on an absolute basis. Individual holdings in the consumer staples (Coca-Cola and Kellogg) and healthcare (UnitedHealth and Bristol-Myers Squibb) sectors also boosted performance. In the energy sector, the fund’s position in El Paso, a natural gas company, was among the top performers, advancing on management’s efforts to improve the company’s balance sheet while executing its core businesses. Additionally, better-than-expected earnings, exploration and production and cash costs, along with a lower-than-expected tax rate, boosted the company’s first-quarter performance. The fund’s position in oil and natural gas company Exxon Mobil also was a leading contributor. The stock, which has been a relative safe haven in uncertain times, benefitted from strong cash-flow generation. In addition, a position in banking and payment services company Discover Financial was among the fund’s strongest performers. Shares advanced on the company’s portfolio and revenue growth and regulator approval for higher-than-expected bank debit card fees.
13 |
Stock selection and an underweight lifted the fund’s financial services sector on a relative basis. The fund did not own Goldman Sachs and eliminated a position in Berkshire Hathaway early in the period, which helped offset the fund’s market weight in the big banks. However, the sector as a whole was the largest detractor from the fund’s contribution to return. Bank stocks, which are very sensitive economically, continued to struggle in a market dominated by headlines of ongoing European sovereign-debt issues and a weakening U.S. economy. Certain technology holdings, including Alcatel Lucent, a communication equipment company, and Cisco Systems, a networking equipment company, also detracted from performance. After a strong start to 2011, shares of Alcatel Lucent underperformed, as European economies weakened, and investors lost confidence in management’s ability to achieve profitability targets. Market-share loss and poor execution in recent quarters contributed to Cisco’s downturn. Nevertheless, we are optimistic that recent corporate restructuring and internal changes have put the company back on the right track.
Outlook
The market remains highly responsive to and strongly influenced by macroeconomic and related geopolitical considerations, and we think it’s unlikely this pattern will change in the near term. It appears corporate earnings growth rates have peaked. For certain sectors, industries and many companies, earnings actually may decline in the year ahead. We also believe much of this bad news already has been priced into the market. Stock market valuation indicators point to equities being attractively valued relative to history, and equity valuations appear especially attractive relative to interest rates. While our long-term conviction in equities remains intact, especially at these low historical valuation levels, the near to intermediate term could offer a wide range of outcomes and continued volatility.
What You Should Know:
Investments in the fund are subject to a number of risks. Please see the “Principal Risks” section of the fund’s prospectus. The purchase of fund shares should be seen as a long-term investment.
| 14
LOOMIS SAYLES VALUE FUND
Investment Results through September 30, 2011
The charts comparing the fund’s performance to an index provide you with a general sense of how it performed. The fund’s total return for the period shown below appears with and without sales charges and includes fund expenses and fees. An index measures the performance of a theoretical portfolio. Unlike a fund, the index is unmanaged and does not have expenses that affect the results. It is not possible to invest directly in an index. Investors would incur transaction costs and other expenses if they purchased the securities necessary to match the index.
Growth of a $10,000 Investment in Class A Shares1,5
September 30, 2001 through September 30, 2011
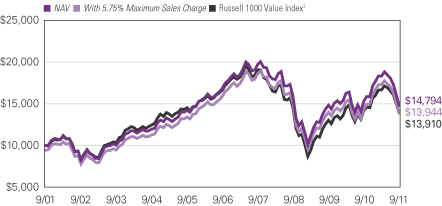
Average Annual Total Returns — September 30, 20115
| | | | | | | | | | | | |
| | | | |
| | | 1 Year | | | 5 Years | | | 10 Years | |
| | | | |
| Class A (Inception 6/30/06)1 | | | | | | | | | | | | |
| NAV | | | -3.28 | % | | | -2.58 | % | | | 4.00 | % |
| With 5.75% Maximum Sales Charge | | | -8.82 | | | | -3.73 | | | | 3.38 | |
| | | | |
| Class B (Inception 6/1/07)1 | | | | | | | | | | | | |
| NAV | | | -4.05 | | | | -3.33 | | | | 3.11 | |
| With CDSC2 | | | -8.83 | | | | -3.68 | | | | 3.11 | |
| | | | |
| Class C (Inception 6/1/07)1 | | | | | | | | | | | | |
| NAV | | | -4.00 | | | | -3.31 | | | | 3.12 | |
| With CDSC2 | | | -4.95 | | | | -3.31 | | | | 3.12 | |
| | | | |
| Class Y (Inception 5/13/91) | | | | | | | | | | | | |
| NAV | | | -3.05 | | | | -2.28 | | | | 4.30 | |
| | | | |
| Admin Class (Inception 2/1/10)1 | | | | | | | | | | | | |
| NAV | | | -3.48 | | | | -2.85 | | | | 3.71 | |
| | | | |
| Comparative Performance | | | | | | | | | | | | |
| Russell 1000 Value Index3 | | | -1.89 | | | | -3.53 | | | | 3.36 | |
| Morningstar Large Value Fund Avg.4 | | | -2.41 | | | | -2.90 | | | | 2.98 | |
Performance data quoted represents past performance and is no guarantee of future results. Total return and value will vary and you may have a gain or loss when shares are sold. Current performance may be lower or higher than quoted. For most recent month-end performance, visit ga.natixis.com. Performance for other share classes will be greater or less than shown based on differences in fees and sales charges. Performance for periods less than one year is cumulative, not annualized. Returns reflect changes in share price and reinvestment of dividends and capital gains, if any. Class Y shares are not available for purchase by all investors.
The table and graph do not reflect taxes shareholders might owe on any fund distributions or when they redeem their shares.
15 |
| | | | |
| Fund Composition | | % of Net
Assets as of
9/30/11 | |
Common Stocks | | | 96.6 | |
Short-Term Investments and Other | | | 3.4 | |
| |
| Ten Largest Holdings | | % of Net
Assets as of
9/30/11 | |
ExxonMobil Corp. | | | 2.6 | |
Chevron Corp. | | | 2.2 | |
JPMorgan Chase & Co. | | | 2.2 | |
Merck & Co., Inc. | | | 2.1 | |
Comcast Corp., Class A | | | 2.1 | |
El Paso Corp. | | | 2.1 | |
UnitedHealth Group, Inc. | | | 1.9 | |
AT&T, Inc. | | | 1.9 | |
PepsiCo, Inc. | | | 1.9 | |
Pfizer, Inc. | | | 1.8 | |
| | | | |
| Five Largest Industries | | % of Net
Assets as of
9/30/11 | |
Oil, Gas & Consumable Fuels | | | 10.3 | |
Pharmaceuticals | | | 7.1 | |
Media | | | 6.2 | |
Commercial Banks | | | 5.6 | |
Capital Markets | | | 4.4 | |
Portfolio holdings and asset allocations will vary.
Expense Ratios
as stated in the most recent prospectus
| | | | | | | | |
| Share Class | | Gross Expense Ratio6 | | | Net Expense Ratio7 | |
| A | | | 0.96 | % | | | 0.96 | % |
| B | | | 1.70 | | | | 1.70 | |
| C | | | 1.71 | | | | 1.71 | |
| Y | | | 0.71 | | | | 0.71 | |
| Admin | | | 1.29 | | | | 1.29 | |
NOTES TO CHARTS
| 1 | Prior to 6/1/07, performance of Class A shares is that of Retail Class shares, which were redesignated as Class A shares, restated to reflect the sales load of Class A shares. Prior to the inception of Retail Class shares (6/30/06), performance is that of Institutional Class shares, restated to reflect the higher net expenses and sales loads of Class A shares. Prior to the inception of Class B and C shares (6/1/07), performance is that of Institutional Class shares, restated to reflect the higher net expenses and sales loads of Class B and C shares. Prior to the inception of Admin Class shares (2/1/10), performance is that of Class A shares, restated to reflect the higher net expenses of Admin Class shares. |
| 2 | Performance for Class B shares assumes a maximum of 5% contingent deferred sales charge (“CDSC”) applied when you sell shares, which declines annually between years 1-6 according to the following schedule: 5, 4, 3, 3, 2, 1, 0%. Class C shares performance assumes a 1% CDSC applied when you sell shares within one year of purchase. |
| 3 | Russell 1000 Value Index is an unmanaged index that measures the performance of the large-cap value segment of the U.S. equity universe. It includes those Russell 1000 companies with lower price-to-book ratios and higher forecasted growth values. |
| 4 | Morningstar Large Value Fund Average is the average performance without sales charges of funds with similar investment objectives, as calculated by Morningstar, Inc. |
| 5 | Fund performance has been increased by fee waivers and/or expense reimbursements, if any, without which performance would have been lower. |
| 6 | Before fee waivers and/or expense reimbursements. |
| 7 | After fee waivers and/or expense reimbursements. Waivers/reimbursements are contractual and are set to expire 1/31/12. Contracts are reevaluated on an annual basis. |
| 16
ADDITIONAL INFORMATION
The views expressed in this report reflect those of the portfolio managers as of the dates indicated. The managers’ views are subject to change at any time without notice based on changes in market or other conditions. References to specific securities or industries should not be regarded as investment advice. Because these funds are actively managed, there is no assurance that they will continue to invest in the securities or industries mentioned.
Before investing, consider the fund’s investment objectives, risks, charges and expenses. Visit ga.natixis.com or call 800-225-5478 for a prospectus and/or a summary prospectus, both of which contain this and other information. Read it carefully.
PROXY VOTING INFORMATION
A description of the funds’ proxy voting policies and procedures is available without charge, upon request, by calling Natixis Funds at 800-225-5478; on the funds’ website at ga.natixis.com; and on the Securities and Exchange Commission’s website at www.sec.gov. Information regarding how the funds voted proxies relating to portfolio securities during the 12-month period ended June 30, 2011 is available from the funds’ website and the SEC’s website.
QUARTERLY PORTFOLIO SCHEDULES
The funds will file a complete schedule of portfolio holdings with the SEC for the first and third quarters of each fiscal year on Form N-Q. The funds’ Forms N-Q are available on the SEC’s website at www.sec.gov and may be reviewed and copied at the SEC’s Public Reference Room in Washington, DC. Information on the operation of the Public Reference Room may be obtained by calling
800-SEC-0330.
17 |
UNDERSTANDING FUND EXPENSES
As a mutual fund shareholder, you incur different types of costs: transaction costs, including sales charges (loads) on purchases and contingent deferred sales charges on redemptions, and ongoing costs, including management fees, distribution and/or service fees (12b-1 fees), and other fund expenses. These costs are described in more detail in the funds’ prospectus. The examples below are intended to help you understand the ongoing costs of investing in the funds and help you compare these with the ongoing costs of investing in other mutual funds.
The first line in the table for each class shows the actual amount of fund expenses you would have paid on a $1,000 investment in the fund from April 1, 2011 through September 30, 2011. It also shows how much a $1,000 investment would be worth at the close of the period, assuming actual fund returns and expenses. To estimate the expenses you paid over the period, simply divide your account value by $1,000 (for example, $8,600 account value divided by $1,000 = 8.6) and multiply the result by the number in the Expenses Paid During Period row as shown below for your class.
The second line in the table for each class provides information about hypothetical account values and hypothetical expenses based on the fund’s actual expense ratios and an assumed rate of return of 5% per year before expenses, which is not the fund’s actual return. The hypothetical account values and expenses may not be used to estimate the actual ending account balance or expenses you paid on your investment for the period. You may use this information to compare the ongoing costs of investing in the fund and other funds. To do so, compare this 5% hypothetical example with the 5% hypothetical examples that appear in the shareholder reports of the other funds.
Please note that the expenses shown reflect ongoing costs only, and do not include any transaction costs, such as sales charges. Therefore, the second line in the table of each fund is useful in comparing ongoing costs only, and will not help you determine the relative costs of owning different funds. If transaction costs were included, total costs would be higher.
| | | | | | | | | | | | |
LOOMIS SAYLES GLOBAL EQUITY AND
INCOME FUND | | BEGINNING
ACCOUNT VALUE
4/1/2011 | | | ENDING
ACCOUNT VALUE
9/30/2011 | | | EXPENSES PAID
DURING PERIOD*
4/1/2011 – 9/30/2011 | |
Class A | | | | | | | | | | | | |
Actual | | | $1,000.00 | | | | $876.80 | | | | $5.83 | |
Hypothetical (5% return before expenses) | | | $1,000.00 | | | | $1,018.85 | | | | $6.28 | |
Class C | | | | | | | | | | | | |
Actual | | | $1,000.00 | | | | $873.60 | | | | $9.30 | |
Hypothetical (5% return before expenses) | | | $1,000.00 | | | | $1,015.14 | | | | $10.00 | |
Class Y | | | | | | | | | | | | |
Actual | | | $1,000.00 | | | | $878.50 | | | | $4.61 | |
Hypothetical (5% return before expenses) | | | $1,000.00 | | | | $1,020.16 | | | | $4.96 | |
| * | Expenses are equal to the Fund’s annualized expense ratio: 1.24%, 1.98% and 0.98% for Class A, C and Y, respectively, multiplied by the average account value over the period, multiplied by the number of days in the most recent fiscal half-year, divided by 365 (to reflect the half-year period). |
| 18
| | | | | | | | | | | | |
| LOOMIS SAYLES GROWTH FUND | | BEGINNING
ACCOUNT VALUE
4/1/2011 | | | ENDING
ACCOUNT VALUE
9/30/2011 | | | EXPENSES PAID
DURING PERIOD*
4/1/2011 – 9/30/2011 | |
Class A | | | | | | | | | | | | |
Actual | | | $1,000.00 | | | | $911.30 | | | | $5.27 | |
Hypothetical (5% return before expenses) | | | $1,000.00 | | | | $1,019.55 | | | | $5.57 | |
Class B | | | | | | | | | | | | |
Actual | | | $1,000.00 | | | | $908.10 | | | | $8.90 | |
Hypothetical (5% return before expenses) | | | $1,000.00 | | | | $1,015.74 | | | | $9.40 | |
Class C | | | | | | | | | | | | |
Actual | | | $1,000.00 | | | | $908.10 | | | | $8.85 | |
Hypothetical (5% return before expenses) | | | $1,000.00 | | | | $1,015.79 | | | | $9.35 | |
Class Y | | | | | | | | | | | | |
Actual | | | $1,000.00 | | | | $913.00 | | | | $4.08 | |
Hypothetical (5% return before expenses) | | | $1,000.00 | | | | $1,020.81 | | | | $4.31 | |
| * | Expenses are equal to the Fund’s annualized expense ratio: 1.10%, 1.86%, 1.85% and 0.85% for Class A, B, C and Y, respectively, multiplied by the average account value over the period, multiplied by the number of days in the most recent fiscal half-year, divided by 365 (to reflect the half-year period). |
| | | | | | | | | | | | |
| LOOMIS SAYLES MID CAP GROWTH FUND | | BEGINNING
ACCOUNT VALUE
4/1/2011 | | | ENDING
ACCOUNT VALUE
9/30/2011 | | | EXPENSES PAID
DURING PERIOD*
4/1/2011 – 9/30/2011 | |
Class A | | | | | | | | | | | | |
Actual | | | $1,000.00 | | | | $801.80 | | | | $5.69 | |
Hypothetical (5% return before expenses) | | | $1,000.00 | | | | $1,018.75 | | | | $6.38 | |
Class C | | | | | | | | | | | | |
Actual | | | $1,000.00 | | | | $799.30 | | | | $9.07 | |
Hypothetical (5% return before expenses) | | | $1,000.00 | | | | $1,014.99 | | | | $10.15 | |
Class Y | | | | | | | | | | | | |
Actual | | | $1,000.00 | | | | $803.20 | | | | $4.57 | |
Hypothetical (5% return before expenses) | | | $1,000.00 | | | | $1,020.00 | | | | $5.11 | |
| * | Expenses are equal to the Fund’s annualized expense ratio (after waiver/reimbursement): 1.26%, 2.01% and 1.01% for Class A, C and Y, respectively, multiplied by the average account value over the period, multiplied by the number of days in the most recent fiscal half-year, divided by 365 (to reflect the half-year period). |
19 |
| | | | | | | | | | | | |
| LOOMIS SAYLES VALUE FUND | | BEGINNING
ACCOUNT VALUE
4/1/2011 | | | ENDING
ACCOUNT VALUE
9/30/2011 | | | EXPENSES PAID
DURING PERIOD*
4/1/2011 – 9/30/2011 | |
Class A | | | | | | | | | | | | |
Actual | | $ | 1,000.00 | | | | $806.80 | | | $ | 4.57 | |
Hypothetical (5% return before expenses) | | $ | 1,000.00 | | | $ | 1,020.00 | | | $ | 5.11 | |
Class B | | | | | | | | | | | | |
Actual | | $ | 1,000.00 | | | | $803.70 | | | $ | 7.96 | |
Hypothetical (5% return before expenses) | | $ | 1,000.00 | | | $ | 1,016.24 | | | $ | 8.90 | |
Class C | | | | | | | | | | | | |
Actual | | $ | 1,000.00 | | | | $803.80 | | | $ | 7.96 | |
Hypothetical (5% return before expenses) | | $ | 1,000.00 | | | $ | 1,016.24 | | | $ | 8.90 | |
Class Y | | | | | | | | | | | | |
Actual | | $ | 1,000.00 | | | | $808.00 | | | $ | 3.49 | |
Hypothetical (5% return before expenses) | | $ | 1,000.00 | | | $ | 1,021.21 | | | $ | 3.90 | |
Admin Class | | | | | | | | | | | | |
Actual | | $ | 1,000.00 | | | | $806.00 | | | $ | 5.39 | |
Hypothetical (5% return before expenses) | | $ | 1,000.00 | | | $ | 1,019.10 | | | $ | 6.02 | |
| * | Expenses are equal to the Fund’s annualized expense ratio: 1.01%, 1.76%, 1.76%, 0.77% and 1.19% for Class A, B, C, Y and Admin Class, respectively, multiplied by the average account value over the period, multiplied by the number of days in the most recent fiscal half-year, divided by 365 (to reflect the half-year period). |
| 20
BOARD APPROVAL OF THE EXISTING ADVISORY AGREEMENTS
The Board of Trustees, including the Independent Trustees, considers matters bearing on each Fund’s advisory agreement (collectively, the “Agreements”) at most of its meetings throughout the year. Each year, usually in the spring, the Contract Review and Governance Committee of the Board meets to review the Agreements to determine whether to recommend that the full Board approve the continuation of the Agreements, typically for an additional one-year period. After the Committee has made its recommendation, the full Board, including the Independent Trustees, determines whether to approve the continuation of the Agreements.
In connection with these meetings, the Trustees receive materials that the Funds’ investment adviser (the “Adviser”) believes to be reasonably necessary for the Trustees to evaluate the Agreements. These materials generally include, among other items, (i) information on the investment performance of the Funds and the performance of peer groups of funds and the Funds’ performance benchmarks, (ii) information on the Funds’ advisory fees and other expenses, including information comparing the Funds’ expenses to the fees charged to institutional accounts with similar strategies managed by the Adviser and to those of peer groups of funds and information about any applicable expense caps and fee “breakpoints,” (iii) sales and redemption data in respect of the Funds, (iv) information about the profitability of the Agreements to the Adviser and (v) information obtained through the completion of a questionnaire by the Adviser (the Trustees are consulted as to the information requested through that questionnaire). The Board of Trustees, including the Independent Trustees, also consider other matters such as (i) the Adviser’s financial results and financial condition, (ii) each Fund’s investment objective and strategies and the size, education and experience of the Adviser’s investment staff and its use of technology, external research and trading cost measurement tools, (iii) arrangements in respect of the distribution of the Funds’ shares and the related costs, (iv) the procedures employed to determine the value of the Funds’ assets, (v) the allocation of the Funds’ brokerage, if any, including, if applicable, allocations to brokers affiliated with the Adviser and the use of “soft” commission dollars to pay Fund expenses and to pay for research and other similar services, (vi) the resources devoted to, and the record of compliance with, the Funds’ investment policies and restrictions, policies on personal securities transactions and other compliance policies, (vii) information about amounts invested by the Funds’ portfolio managers in the Funds or in similar accounts that they manage and (viii) the general economic outlook with particular emphasis on the mutual fund industry. Throughout the process, the Trustees are afforded the opportunity to ask questions of and request additional materials from the Adviser.
In addition to the materials requested by the Trustees in connection with their annual consideration of the continuation of the Agreements, the Trustees receive materials in advance of each regular quarterly meeting of the Board of Trustees that provide detailed information about the Funds’ investment performance and the fees charged to the Funds for advisory and other services. This information generally includes, among other things, an internal performance rating for each Fund based on agreed-upon criteria, graphs showing each Fund’s performance and fee differentials against each Fund’s peer group of
21 |
funds, performance ratings provided by a third-party, total return information for various periods, and third-party performance rankings for various periods comparing a Fund against its peer group. The portfolio management team for each Fund or other representatives of the Adviser make periodic presentations to the Contract Review and Governance Committee and/or the full Board of Trustees, and Funds identified as presenting possible performance concerns may be subject to more frequent board presentations and reviews. In addition, each quarter the Trustees are provided with detailed statistical information about each Fund’s portfolio. The Trustees also receive periodic updates between meetings.
The Board of Trustees most recently approved the continuation of the Agreements at their meeting held in June 2011. The Agreements were continued for a one-year period for the Funds. In considering whether to approve the continuation of the Agreements, the Board of Trustees, including the Independent Trustees, did not identify any single factor as determinative. Individual Trustees may have evaluated the information presented differently from one another, giving different weights to various factors. Matters considered by the Trustees, including the Independent Trustees, in connection with their approval of the Agreements included, but were not limited to, the factors listed below.
The nature, extent and quality of the services provided to the Funds under the Agreements. The Trustees considered the nature, extent and quality of the services provided by the Adviser and its affiliates to the Funds and the resources dedicated to the Funds by the Adviser and its affiliates.
The Trustees considered not only the advisory services provided by the Adviser to the Funds, but also the administrative services provided by Natixis Asset Management Advisors, L.P. (“Natixis Advisors”) and its affiliates to the Funds.
For each Fund, the Trustees also considered the benefits to shareholders of investing in a mutual fund that is part of a family of funds that offers shareholders the right to exchange shares of one type of fund for shares of another type of fund, and provides a variety of fund and shareholder services.
After reviewing these and related factors, the Trustees concluded, within the context of their overall conclusions regarding each of the Agreements, that the nature, extent and quality of services provided supported the renewal of the Agreements.
Investment performance of the Funds and the Adviser. As noted above, the Trustees received information about the performance of the Funds over various time periods, including information which compared the performance of the Funds to the performance of peer groups of funds and the Funds’ respective performance benchmarks. In addition, the Trustees also reviewed data prepared by an independent third party which analyzed the performance of the Funds using a variety of performance metrics, including metrics which also measured the performance of the Funds on a risk adjusted basis.
With respect to each Fund, the Board concluded that the Fund’s performance or other relevant factors supported the renewal of the Agreement relating to that Fund. In the case of each Fund that had performance that lagged that of a relevant peer group for certain (although not necessarily all) periods, the Board concluded that other factors
| 22
relevant to performance supported renewal of the Agreements. These factors included one or more of the following: (1) that the underperformance was attributable, to a significant extent, to investment decisions (such as security selection or sector allocation) by the Adviser that were reasonable and consistent with the Fund’s investment objective and policies; (2) that the Fund’s more recent performance was competitive when compared to relevant performance benchmarks or peer groups; and (3) that the Adviser had recently changed the Fund’s portfolio management team.
The Trustees also considered the Adviser’s performance and reputation generally, the Funds’ performance as a fund family generally (as noted by certain financial publications), and the historical responsiveness of the Adviser to Trustee concerns about performance and the willingness of the Adviser to take steps intended to improve performance.
After reviewing these and related factors, the Trustees concluded, within the context of their overall conclusions regarding each of the Agreements, that the performance of the Funds and the Adviser supported the renewal of the Agreements.
The costs of the services to be provided and profits to be realized by the Adviser and its affiliates from their respective relationships with the Funds. The Trustees considered the fees charged to the Funds for advisory services as well as the total expense levels of the Funds. This information included comparisons (provided both by management and also by an independent third party) of the Funds’ advisory fees and total expense levels to those of their peer groups and information about the advisory fees charged by the Adviser to comparable accounts (such as institutional separate accounts), as well as information about differences in such fees. In considering the fees charged to comparable accounts, the Trustees considered, among other things, management’s representations about the differences between managing mutual funds as compared to other types of accounts, including the additional resources required to effectively manage and the greater regulatory costs associated with the management of mutual fund assets. In evaluating each Fund’s advisory fee, the Trustees also took into account the demands, complexity and quality of the investment management of such Fund and the need for the Adviser to offer competitive compensation. The Trustees considered that over the past several years, management had made recommendations regarding reductions in advisory fee rates, implementation of advisory fee breakpoints and the institution of advisory fee waivers and expense caps for various funds in the fund family. They noted that, as of December 31, 2010, all four of the Natixis Equity Funds included in this report have expense caps in place, and the Trustees considered the amounts waived or reimbursed by the Adviser under these caps for each Fund other than Loomis Sayles Value Fund, for which current expenses are below the cap. The Trustees noted that the Loomis Sayles Global Equity and Income Fund had an advisory fee rate that was slightly above the median of a peer group of funds. The Trustees considered the circumstances that accounted for such relatively higher expenses and noted that the Fund’s total net expenses were equal to the median of the Fund’s peer group of funds even though the advisory fee was above the median.
The Trustees also considered the compensation directly or indirectly received by the Adviser and its affiliates from their relationships with the Funds. The Trustees reviewed information provided by management as to the profitability of the Adviser’s and its affiliates’ relationships with the Funds, and information about the allocation of expenses
23 |
used to calculate profitability. They also reviewed information provided by management about the effect of distribution costs and changes in asset levels on Adviser profitability, including information regarding resources spent on distribution activities. When reviewing profitability, the Trustees also considered information about court cases in which adviser profitability was an issue, the performance of the relevant Funds, the expense levels of the Funds, and whether the Adviser had implemented breakpoints and/or expense caps with respect to such Funds.
After reviewing these and related factors, the Trustees concluded, within the context of their overall conclusions regarding each of the Agreements, that the advisory fee charged to each of the Funds was fair and reasonable, and that the costs of these services generally and the related profitability of the Adviser and its affiliates in respect of their relationships with the Funds supported the renewal of the Agreements.
Economies of Scale. The Trustees considered the existence of any economies of scale in the provision of services by the Adviser and whether those economies are shared with the Funds through breakpoints in their investment advisory fees or other means, such as expense waivers or caps. The Trustees noted that each of the Funds was subject to an expense cap or waiver. In considering these issues, the Trustees also took note of the costs of the services provided (both on an absolute and a relative basis) and the profitability to the Adviser and its affiliates of their relationships with the Funds, as discussed above.
After reviewing these and related factors, the Trustees concluded, within the context of their overall conclusions regarding each of the Agreements, that the extent to which economies of scale were shared with the Funds supported the renewal of the Agreements.
The Trustees also considered other factors, which included but were not limited to the following:
| · | | the effect of recent market and economic turmoil on the performance, asset levels and expense ratios of each Fund. |
| · | | whether each Fund has operated in accordance with its investment objective and the Fund’s record of compliance with its investment restrictions, and the compliance programs of the Funds and the Adviser. They also considered the compliance-related resources the Adviser and its affiliates were providing to the Funds. |
| · | | the nature, quality, cost and extent of administrative and shareholder services performed by the Adviser and its affiliates, both under the Agreements and under separate agreements covering administrative services. |
| · | | so-called “fallout benefits” to the Adviser, such as the engagement of affiliates of the Adviser to provide distribution, administrative and brokerage services to the Funds, and the benefits of research made available to the Adviser by reason of brokerage commissions (if any) generated by the Funds’ securities transactions. The Trustees also considered the fact that Natixis Advisors’ parent company benefits from the retention of an affiliated Adviser. The Trustees considered the possible conflicts of interest associated with these fallout and other benefits, and the reporting, disclosure and other processes in place to disclose and monitor such possible conflicts of interest. |
| 24
| · | | the Trustees’ review and discussion of the Funds’ advisory arrangements in prior years, and management’s record of responding to Trustee concerns raised during the year and in prior years. |
Based on their evaluation of all factors that they deemed to be material, including those factors described above, and assisted by the advice of independent counsel, the Trustees, including the Independent Trustees, concluded that each of the existing Agreements should be continued through June 30, 2012.
25 |
Portfolio of Investments – as of September 30, 2011
Loomis Sayles Global Equity and Income Fund
| | | | | | | | |
Shares | | | Description | | Value (†) | |
| | | | | | | | |
| | Common Stocks — 62.4% of Net Assets | | | | |
| | | | Belgium — 1.5% | | | | |
| | 131,460 | | | Anheuser-Busch InBev NV | | $ | 6,977,782 | |
| | | | | | | | |
| | | | Brazil — 4.0% | | | | |
| | 315,900 | | | Cia Hering | | | 5,277,181 | |
| | 229,228 | | | Embraer S.A., ADR | | | 5,815,514 | |
| | 347,800 | | | Mills Estruturas e Servicos de Engenharia S.A. | | | 3,570,025 | |
| | 255,400 | | | Natura Cosmeticos S.A. | | | 4,346,656 | |
| | | | | | | | |
| | | | | | | 19,009,376 | |
| | | | | | | | |
| | | | British Virgin Islands — 0.6% | | | | |
| | 99,015 | | | Mail.ru Group Ltd., GDR, 144A(b) | | | 2,891,238 | |
| | | | | | | | |
| | | | Canada — 0.1% | | | | |
| | 9,996 | | | Valeant Pharmaceuticals International, Inc. | | | 371,052 | |
| | | | | | | | |
| | | | Cayman Islands — 2.8% | | | | |
| | 77,983 | | | Baidu, Inc., Sponsored ADR(b) | | | 8,337,162 | |
| | 2,158,800 | | | Wynn Macau Ltd. | | | 5,077,974 | |
| | | | | | | | |
| | | | | | | 13,415,136 | |
| | | | | | | | |
| | | | Chile — 2.1% | | | | |
| | 85,750 | | | Banco Santander Chile, ADR | | | 6,300,910 | |
| | 443,597 | | | S.A.C.I. Falabella | | | 3,540,922 | |
| | | | | | | | |
| | | | | | | 9,841,832 | |
| | | | | | | | |
| | | | Denmark — 2.3% | | | | |
| | 109,161 | | | Novo Nordisk A/S, Class B | | | 10,887,080 | |
| | | | | | | | |
| | | | France — 1.3% | | | | |
| | 93,169 | | | Sanofi | | | 6,128,354 | |
| | | | | | | | |
| | | | Germany — 1.8% | | | | |
| | 93,708 | | | Siemens AG, (Registered) | | | 8,430,943 | |
| | | | | | | | |
| | | | Hong Kong — 1.2% | | | | |
| | 2,242,000 | | | China Overseas Land & Investment Ltd. | | | 3,196,540 | |
| | 811,000 | | | Hang Lung Properties Ltd. | | | 2,438,769 | |
| | | | | | | | |
| | | | | | | 5,635,309 | |
| | | | | | | | |
| | | | Japan — 2.3% | | | | |
| | 44,100 | | | FANUC Corp. | | | 6,074,593 | |
| | 531,000 | | | Mitsubishi Electric Corp. | | | 4,703,522 | |
| | | | | | | | |
| | | | | | | 10,778,115 | |
| | | | | | | | |
| | | | Korea — 0.7% | | | | |
| | 12,901 | | | LG Chem Ltd. | | | 3,419,593 | |
| | | | | | | | |
| | | | Mexico — 0.7% | | | | |
| | 2,005,100 | | | Genomma Lab Internacional S.A. de CV, Class B(b) | | | 3,306,544 | |
| | | | | | | | |
| | | | Netherlands Antilles — 0.9% | | | | |
| | 75,235 | | | Schlumberger Ltd. | | | 4,493,787 | |
| | | | | | | | |
| | | | Sweden — 1.0% | | | | |
| | 261,517 | | | Atlas Copco AB, Class A | | | 4,628,983 | |
| | | | | | | | |
See accompanying notes to financial statements.
| 26
Portfolio of Investments – as of September 30, 2011
Loomis Sayles Global Equity and Income Fund – (continued)
| | | | | | | | |
Shares | | | Description | | Value (†) | |
| | | | | | | | |
| | | | United Kingdom — 8.3% | | | | |
| | 238,555 | | | Antofagasta PLC | | $ | 3,406,236 | |
| | 119,689 | | | British American Tobacco PLC | | | 5,053,905 | |
| | 168,925 | | | Burberry Group PLC | | | 3,067,558 | |
| | 375,995 | | | Diageo PLC | | | 7,168,951 | |
| | 90,280 | | | Royal Dutch Shell PLC, ADR | | | 5,554,026 | |
| | 389,025 | | | Standard Chartered PLC | | | 7,761,428 | |
| | 2,813,793 | | | Vodafone Group PLC | | | 7,251,930 | |
| | | | | | | | |
| | | | | | | 39,264,034 | |
| | | | | | | | |
| | | | United States — 29.7% | | | | |
| | 149,691 | | | American Express Co. | | | 6,721,126 | |
| | 50,331 | | | Apple, Inc.(b) | | | 19,185,171 | |
| | 163,652 | | | AT&T, Inc. | | | 4,667,355 | |
| | 444,030 | | | Calpine Corp.(b) | | | 6,251,942 | |
| | 78,990 | | | Caterpillar, Inc. | | | 5,832,622 | |
| | 163,555 | | | CenturyLink, Inc. | | | 5,416,942 | |
| | 245,536 | | | Coca-Cola Enterprises, Inc. | | | 6,108,936 | |
| | 1,679 | | | Dex One Corp.(b) | | | 940 | |
| | 51,665 | | | Estee Lauder Cos., Inc. (The), Class A | | | 4,538,254 | |
| | 201,852 | | | FMC Technologies, Inc.(b) | | | 7,589,635 | |
| | 14,859 | | | Google, Inc., Class A(b) | | | 7,643,172 | |
| | 955 | | | Hawaiian Telcom Holdco, Inc.(b) | | | 13,313 | |
| | 70,013 | | | Jones Lang LaSalle, Inc. | | | 3,627,373 | |
| | 217,553 | | | Microsoft Corp. | | | 5,414,894 | |
| | 114,178 | | | National-Oilwell Varco, Inc. | | | 5,848,197 | |
| | 225,628 | | | Oracle Corp. | | | 6,484,549 | |
| | 129,771 | | | PepsiCo, Inc. | | | 8,032,825 | |
| | 99,147 | | | PNC Financial Services Group, Inc. | | | 4,777,894 | |
| | 73,884 | | | Praxair, Inc. | | | 6,906,676 | |
| | 35,142 | | | Precision Castparts Corp. | | | 5,463,175 | |
| | 16,360 | | | Priceline.com, Inc.(b) | | | 7,353,166 | |
| | 100,972 | | | QUALCOMM, Inc. | | | 4,910,268 | |
| | 27,757 | | | Salesforce.com, Inc.(b) | | | 3,172,070 | |
| | 299 | | | SuperMedia, Inc.(b) | | | 463 | |
| | 26,818 | | | Vertex Pharmaceuticals, Inc.(b) | | | 1,194,474 | |
| | 41,566 | | | VMware, Inc., Class A(b) | | | 3,341,075 | |
| | | | | | | | |
| | | | | | | 140,496,507 | |
| | | | | | | | |
| | | | Virgin Islands — 1.1% | | | | |
| | 221,091 | | | Arcos Dorados Holdings, Inc., Class A | | | 5,127,100 | |
| | | | | | | | |
| | | | Total Common Stocks
(Identified Cost $311,651,286) | | | 295,102,765 | |
| | | | | | | | |
See accompanying notes to financial statements.
27 |
Portfolio of Investments – as of September 30, 2011
Loomis Sayles Global Equity and Income Fund – (continued)
| | | | | | | | |
Principal
Amount (‡) | | | Description | | Value (†) | |
| | | | | | | | |
| | Bonds and Notes — 28.8% | |
| | Non-Convertible Bonds — 27.4% | |
| | | | Argentina — 0.2% | | | | |
| $ | 619,121 | | | Argentina Government International Bond, 8.280%, 12/31/2033 | | $ | 424,098 | |
| | 190,000 | | | Pan American Energy LLC, 7.875%, 5/07/2021, 144A | | | 190,228 | |
| | 515,000 | | | Transportadora de Gas del Sur S.A., 7.875%, 5/14/2017, 144A | | | 453,200 | |
| | | | | | | | |
| | | | | | | 1,067,526 | |
| | | | | | | | |
| | | | Australia — 0.2% | | | | |
| | 500,000 | | | Macquarie Bank Ltd., 6.625%, 4/07/2021, 144A | | | 469,731 | |
| | 250,000 | | | New South Wales Treasury Corp., 6.000%, 5/01/2012, (AUD) | | | 244,219 | |
| | 155,000 | | | Sydney Airport Finance Co., 5.125%, 2/22/2021, 144A | | | 161,399 | |
| | | | | | | | |
| | | | | | | 875,349 | |
| | | | | | | | |
| | | | Bermuda — 0.0% | | | | |
| | 100,000 | | | Noble Group Ltd., 6.750%, 1/29/2020, 144A | | | 88,000 | |
| | | | | | | | |
| | | | Brazil — 0.7% | | | | |
| | 200,000 | | | Banco Nacional de Desenvolvimento Economico e Social, 6.500%, 6/10/2019, 144A | | | 221,000 | |
| | 400,000 | | | Banco Santander Brasil S.A., 4.500%, 4/06/2015, 144A | | | 384,000 | |
| | 505,773 | | | Banco Votorantim S.A., 6.250%, 5/16/2016, 144A, (BRL) | | | 268,741 | |
| | 300,000 | | | Brasil Telecom S.A., 9.750%, 9/15/2016, 144A, (BRL) | | | 145,193 | |
| | 621,803(††) | | | Brazil Notas do Tesouro Nacional, Series B, 6.000%, 8/15/2014, (BRL) | | | 340,638 | |
| | 497,443(††) | | | Brazil Notas do Tesouro Nacional, Series B, 6.000%, 5/15/2015, (BRL) | | | 272,435 | |
| | 1,115(†††) | | | Brazil Notas do Tesouro Nacional, Series F, 10.000%, 1/01/2021, (BRL) | | | 554,842 | |
| | 250,000 | | | Hypermarcas S.A., 6.500%, 4/20/2021, 144A | | | 227,500 | |
| | 300,000 | | | Itau Unibanco Holding S.A., 6.200%, 12/21/2021, 144A | | | 294,000 | |
| | 200,000 | | | OGX Petroleo e Gas Participacoes S.A., 8.500%, 6/01/2018, 144A | | | 179,000 | |
| | 129,000 | | | Telemar Norte Leste S.A., 5.500%, 10/23/2020, 144A | | | 122,550 | |
| | 400,000 | | | Votorantim Cimentos S.A., 7.250%, 4/05/2041, 144A | | | 374,000 | |
| | | | | | | | |
| | | | | | | 3,383,899 | |
| | | | | | | | |
| | | | Canada — 0.7% | | | | |
| | 2,265,000 | | | Canadian Government, 3.000%, 12/01/2015, (CAD)(c) | | | 2,312,271 | |
| | 650,000 | | | Canadian Government, 3.500%, 6/01/2013, (CAD) | | | 647,072 | |
| | 180,000 | | | Corus Entertainment, Inc., 7.250%, 2/10/2017, 144A, (CAD) | | | 175,208 | |
| | 100,000 | | | Pacific Rubiales Energy Corp., 8.750%, 11/10/2016, 144A | | | 107,250 | |
| | 100,000 | | | Shaw Communications, Inc., 5.650%, 10/01/2019, (CAD) | | | 101,415 | |
| | | | | | | | |
| | | | | | | 3,343,216 | |
| | | | | | | | |
| | | | Cayman Islands — 0.9% | | | | |
| | 200,000 | | | Braskem Finance Ltd., 5.750%, 4/15/2021, 144A | | | 182,520 | |
| | 200,000 | | | Embraer Overseas Ltd., 6.375%, 1/24/2017 | | | 215,000 | |
| | 250,000 | | | ENN Energy Holdings Ltd., 6.000%, 5/13/2021, 144A | | | 241,706 | |
| | 300,000 | | | Fibria Overseas Finance Ltd., 6.750%, 3/03/2021, 144A | | | 268,500 | |
| | 119,000 | | | Fibria Overseas Finance Ltd., 7.500%, 5/04/2020, 144A | | | 111,860 | |
| | 100,000 | | | Hutchison Whampoa International Ltd., 7.625%, 4/09/2019, 144A | | | 118,839 | |
| | 100,000 | | | LPG International, Inc., 7.250%, 12/20/2015 | | | 110,500 | |
| | 700,000 | | | Marfrig Overseas Ltd., 9.500%, 5/04/2020, 144A | | | 448,000 | |
| | 170,000 | | | Marfrig Overseas Ltd., 9.625%, 11/16/2016, 144A | | | 127,500 | |
See accompanying notes to financial statements.
| 28
Portfolio of Investments – as of September 30, 2011
Loomis Sayles Global Equity and Income Fund – (continued)
| | | | | | | | |
Principal
Amount (‡) | | | Description | | Value (†) | |
| | | | | | | | |
| | | | Cayman Islands — continued | | | | |
| $ | 200,000 | | | MBPS Finance Co., 11.250%, 11/15/2015, 144A | | $ | 172,000 | |
| | 200,000 | | | Odebrecht Drilling Norbe VIII/IX Ltd., 6.350%, 6/30/2021, 144A | | | 198,000 | |
| | 500,000 | | | Odebrecht Finance Ltd., 6.000%, 4/05/2023, 144A | | | 465,000 | |
| | 320,000 | | | Petrobras International Finance Co., 5.875%, 3/01/2018 | | | 333,238 | |
| | 300,000 | | | Petrobras International Finance Co., 6.875%, 1/20/2040 | | | 316,500 | |
| | 536,000 | | | Vale Overseas Ltd., 6.875%, 11/21/2036 | | | 578,129 | |
| | 200,000 | | | Voto-Votorantim Ltd., 6.750%, 4/05/2021, 144A | | | 197,000 | |
| | | | | | | | |
| | | | | | | 4,084,292 | |
| | | | | | | | |
| | | | Chile — 0.2% | | | | |
| | 250,000,000 | | | Banco Santander Chile, 6.500%, 9/22/2020, 144A, (CLP) | | | 469,065 | |
| | 185,000 | | | Celulosa Arauco y Constitucion S.A., 5.000%, 1/21/2021 | | | 185,984 | |
| | 250,000 | | | E.CL S.A., 5.625%, 1/15/2021, 144A | | | 260,956 | |
| | | | | | | | |
| | | | | | | 916,005 | |
| | | | | | | | |
| | | | Colombia — 0.2% | | | | |
| | 450,000,000 | | | Emgesa S.A. E.S.P., 8.750%, 1/25/2021, 144A, (COP) | | | 237,870 | |
| | 1,430,000,000 | | | Empresas Publicas de Medellin E.S.P., 8.375%, 2/01/2021, 144A, (COP) | | | 734,561 | |
| | 200,000,000 | | | Republic of Colombia, 7.750%, 4/14/2021, (COP) | | | 111,399 | |
| | 40,000 | | | Republic of Colombia, 8.125%, 5/21/2024 | | | 53,040 | |
| | | | | | | | |
| | | | | | | 1,136,870 | |
| | | | | | | | |
| | | | France — 0.2% | | | | |
| | 150,000 | | | Lafarge S.A., EMTN, 5.375%, 6/26/2017, (EUR) | | | 179,823 | |
| | 240,000 | | | Veolia Environnement S.A., EMTN, 4.000%, 2/12/2016, (EUR) | | | 333,533 | |
| | 25,000 | | | Veolia Environnement S.A., EMTN, 5.125%, 5/24/2022, (EUR) | | | 35,227 | |
| | 200,000 | | | Vivendi S.A., EMTN, 4.250%, 12/01/2016, (EUR) | | | 275,393 | |
| | | | | | | | |
| | | | | | | 823,976 | |
| | | | | | | | |
| | | | Hungary — 0.0% | | | | |
| | 200,000 | | | Hungary Government International Bond, 6.375%, 3/29/2021 | | | 194,600 | |
| | | | | | | | |
| | | | India — 0.1% | | | | |
| | 200,000 | | | Canara Bank Ltd., (fixed rate to 11/28/2016, variable rate thereafter), 6.365%, 11/28/2021 | | | 185,883 | |
| | 100,000 | | | ICICI Bank Ltd., (fixed rate to 4/30/2017, variable rate thereafter), 6.375%, 4/30/2022, 144A | | | 83,000 | |
| | | | | | | | |
| | | | | | | 268,883 | |
| | | | | | | | |
| | | | Indonesia — 0.2% | | | | |
| | 200,000 | | | Adaro Indonesia PT, 7.625%, 10/22/2019, 144A | | | 196,000 | |
| | 3,500,000,000 | | | Indonesia Government International Bond, 9.500%, 7/15/2023, (IDR) | | | 471,501 | |
| | 1,500,000,000 | | | Indonesia Government International Bond, 11.500%, 9/15/2019, (IDR) | | | 219,437 | |
| | | | | | | | |
| | | | | | | 886,938 | |
| | | | | | | | |
| | | | Italy — 0.5% | | | | |
| | 250,000 | | | Finmeccanica SpA, EMTN, 4.875%, 3/24/2025, (EUR) | | | 277,831 | |
| | 1,535,000 | | | Italy Buoni Poliennali Del Tesoro, 4.750%, 9/15/2016, (EUR) | | | 2,031,468 | |
| | 100,000 | | | Telecom Italia SpA, EMTN, 5.375%, 1/29/2019, (EUR) | | | 121,916 | |
| | | | | | | | |
| | | | | | | 2,431,215 | |
| | | | | | | | |
See accompanying notes to financial statements.
29 |
Portfolio of Investments – as of September 30, 2011
Loomis Sayles Global Equity and Income Fund – (continued)
| | | | | | | | |
Principal
Amount (‡) | | | Description | | Value (†) | |
| | | | | | | | |
| | | | Jersey — 0.0% | | | | |
| | 100,000 | | | WPP 2008 Ltd., 6.000%, 4/04/2017, (GBP) | | $ | 170,466 | |
| | | | | | | | |
| | | | Korea — 0.5% | | | | |
| | 8,000,000 | | | Export-Import Bank of Korea, 4.000%, 11/26/2015, 144A, (PHP) | | | 170,648 | |
| | 400,000 | | | Hana Bank, 4.000%, 11/03/2016, 144A | | | 384,881 | |
| | 600,000 | | | Hyundai Steel Co., 4.625%, 4/21/2016, 144A | | | 600,152 | |
| | 400,000 | | | Kia Motors Corp., 3.625%, 6/14/2016, 144A | | | 397,885 | |
| | 400,000,000 | | | Korea Treasury Bond, 5.000%, 9/10/2014, (KRW) | | | 351,758 | |
| | 260,000 | | | SK Broadband Co. Ltd., 7.000%, 2/01/2012, 144A | | | 262,189 | |
| | 140,000 | | | SK Telecom Co. Ltd., 6.625%, 7/20/2027, 144A | | | 169,795 | |
| | 200,000 | | | Woori Bank, 5.875%, 4/13/2021, 144A | | | 190,856 | |
| | | | | | | | |
| | | | | | | 2,528,164 | |
| | | | | | | | |
| | | | Luxembourg — 0.2% | | | | |
| | 400,000 | | | ArcelorMittal, 6.750%, 3/01/2041 | | | 345,681 | |
| | 100,000 | | | CSN Resources S.A., 6.500%, 7/21/2020, 144A | | | 104,250 | |
| | 200,000 | | | Gazprom Via Gaz Capital S.A., 5.092%, 11/29/2015, 144A | | | 196,000 | |
| | 125,000 | | | Telecom Italia Capital S.A., 6.000%, 9/30/2034 | | | 102,261 | |
| | 10,000 | | | Telecom Italia Capital S.A., 6.375%, 11/15/2033 | | | 8,555 | |
| | | | | | | | |
| | | | | | | 756,747 | |
| | | | | | | | |
| | | | Malaysia — 0.2% | | | | |
| | 1,750,000 | | | Malaysia Government Bond, 3.434%, 8/15/2014, (MYR) | | | 550,413 | |
| | 1,000,000 | | | Malaysia Government Bond, 4.262%, 9/15/2016, (MYR) | | | 325,005 | |
| | | | | | | | |
| | | | | | | 875,418 | |
| | | | | | | | |
| | | | Mexico — 0.9% | | | | |
| | 195,000 | | | Axtel SAB de CV, 7.625%, 2/01/2017, 144A | | | 159,900 | |
| | 145,000 | | | Axtel SAB de CV, 9.000%, 9/22/2019, 144A | | | 121,800 | |
| | 200,000 | | | BBVA Bancomer S.A., 6.500%, 3/10/2021, 144A | | | 184,500 | |
| | 200,000 | | | Corporacion GEO SAB de CV, 9.250%, 6/30/2020, 144A | | | 178,000 | |
| | 295,000 | | | Desarrolladora Homex SAB de CV, 7.500%, 9/28/2015 | | | 286,150 | |
| | 40,000(††††) | | | Mexican Fixed Rate Bonds, Series M, 6.500%, 6/10/2021, (MXN) | | | 288,390 | |
| | 74,000(††††) | | | Mexican Fixed Rate Bonds, Series M-10, 8.000%, 12/17/2015, (MXN) | | | 589,667 | |
| | 41,000(††††) | | | Mexican Fixed Rate Bonds, Series M-10, 8.500%, 12/13/2018, (MXN) | | | 339,169 | |
| | 65,000(††††) | | | Mexican Fixed Rate Bonds, Series M-20, 10.000%, 12/05/2024, (MXN) | | | 597,719 | |
| | 80,000(††††) | | | Mexican Fixed Rate Bonds, Series M-30, 8.500%, 11/18/2038, (MXN) | | | 622,033 | |
| | 100,000 | | | Mexichem SAB de CV, 8.750%, 11/06/2019, 144A | | | 115,000 | |
| | 330,000 | | | Petroleos Mexicanos, 8.000%, 5/03/2019 | | | 402,600 | |
| | 200,000 | | | Urbi Desarrollos Urbanos SAB de CV, 9.500%, 1/21/2020, 144A | | | 190,000 | |
| | | | | | | | |
| | | | | | | 4,074,928 | |
| | | | | | | | |
| | | | Netherlands — 0.2% | | | | |
| | 50,000 | | | British American Tobacco Holdings BV, 4.000%, 7/07/2020, (EUR) | | | 68,214 | |
| | 200,000 | | | EADS Finance BV, EMTN, 4.625%, 8/12/2016, (EUR) | | | 284,905 | |
| | 200,000 | | | Indosat Palapa Co. BV, 7.375%, 7/29/2020, 144A | | | 198,000 | |
| | 200,000 | | | Listrindo Capital BV, 9.250%, 1/29/2015, 144A | | | 196,296 | |
| | 300,000 | | | Marfrig Holding Europe BV, 8.375%, 5/09/2018, 144A | | | 189,000 | |
| | 100,000 | | | Myriad International Holding BV, 6.375%, 7/28/2017, 144A | | | 103,750 | |
| | 50,000 | | | OI European Group BV, 6.875%, 3/31/2017, 144A, (EUR) | | | 63,303 | |
| | | | | | | | |
| | | | | | | 1,103,468 | |
| | | | | | | | |
See accompanying notes to financial statements.
| 30
Portfolio of Investments – as of September 30, 2011
Loomis Sayles Global Equity and Income Fund – (continued)
| | | | | | | | |
Principal
Amount (‡) | | | Description | | Value (†) | |
| | | | | | | | |
| | | | New Zealand — 0.2% | | | | |
| | 1,000,000 | | | New Zealand Government Bond, 6.000%, 5/15/2021, (NZD) | | $ | 852,414 | |
| | | | | | | | |
| | | | Norway — 0.4% | | | | |
| | 3,335,000 | | | Norwegian Government, 4.250%, 5/19/2017, (NOK) | | | 636,134 | |
| | 6,360,000 | | | Norwegian Government, 4.500%, 5/22/2019, (NOK) | | | 1,254,108 | |
| | | | | | | | |
| | | | | | | 1,890,242 | |
| | | | | | | | |
| | | | Philippines — 0.1% | | | | |
| | 30,000,000 | | | Philippine Government International Bond, 6.250%, 1/14/2036, (PHP) | | | 649,606 | |
| | | | | | | | |
| | | | Poland — 0.0% | | | | |
| | 95,000 | | | Poland Government International Bond, 3.000%, 9/23/2014, (CHF) | | | 107,766 | |
| | | | | | | | |
| | | | Qatar — 0.1% | | | | |
| | 100,000 | | | Qatar Government International Bond, 4.000%, 1/20/2015, 144A | | | 105,250 | |
| | 250,000 | | | Ras Laffan Liquefied Natural Gas Co. Ltd. III, 5.500%, 9/30/2014, 144A | | | 270,625 | |
| | | | | | | | |
| | | | | | | 375,875 | |
| | | | | | | | |
| | | | Singapore — 0.7% | | | | |
| | 3,355,000 | | | Singapore Government Bond, 1.625%, 4/01/2013, (SGD) | | | 2,623,434 | |
| | 345,000 | | | Singapore Government Bond, 2.250%, 7/01/2013, (SGD) | | | 273,273 | |
| | 605,000 | | | Singapore Government Bond, 2.250%, 6/01/2021, (SGD) | | | 489,216 | |
| | 150,000 | | | STATS ChipPAC Ltd., 7.500%, 8/12/2015, 144A | | | 144,000 | |
| | | | | | | | |
| | | | | | | 3,529,923 | |
| | | | | | | | |
| | | | South Africa — 0.3% | | | | |
| | 450,000 | | | Edcon Proprietary Ltd., 4.778%, 6/15/2014, (EUR)(d) | | | 446,137 | |
| | 130,000 | | | Edcon Proprietary Ltd., 4.778%, 6/15/2014, 144A, (EUR)(d) | | | 128,884 | |
| | 285,000 | | | Republic of South Africa, EMTN, 4.500%, 4/05/2016, (EUR) | | | 385,647 | |
| | 400,000 | | | Transnet Ltd., 4.500%, 2/10/2016, 144A | | | 411,019 | |
| | | | | | | | |
| | | | | | | 1,371,687 | |
| | | | | | | | |
| | | | Spain — 0.3% | | | | |
| | 535,000 | | | Spain Government Bond, 4.100%, 7/30/2018, (EUR) | | | 695,815 | |
| | 465,000 | | | Spain Government Bond, 5.500%, 4/30/2021, (EUR) | | | 640,427 | |
| | | | | | | | |
| | | | | | | 1,336,242 | |
| | | | | | | | |
| | | | Supranationals — 0.3% | | | | |
| | 305,000 | | | European Investment Bank, 2.375%, 7/10/2020, (CHF) | | | 364,884 | |
| | 47,250,000 | | | Inter-American Development Bank, EMTN, 4.750%, 1/10/2014, (INR) | | | 983,784 | |
| | | | | | | | |
| | | | | | | 1,348,668 | |
| | | | | | | | |
| | | | Sweden — 0.2% | | | | |
| | 2,210,000 | | | Sweden Government Bond, 5.000%, 12/01/2020, (SEK) | | | 411,060 | |
| | 3,020,000 | | | Sweden Government Bond, 5.500%, 10/08/2012, (SEK) | | | 459,288 | |
| | | | | | | | |
| | | | | | | 870,348 | |
| | | | | | | | |
| | | | Thailand — 0.1% | | | | |
| | 330,000 | | | True Move Co. Ltd., 10.375%, 8/01/2014 | | | 349,800 | |
| | 100,000 | | | True Move Co. Ltd., 10.375%, 8/01/2014, 144A | | | 106,000 | |
| | | | | | | | |
| | | | | | | 455,800 | |
| | | | | | | | |
See accompanying notes to financial statements.
31 |
Portfolio of Investments – as of September 30, 2011
Loomis Sayles Global Equity and Income Fund – (continued)
| | | | | | | | |
Principal
Amount (‡) | | | Description | | Value (†) | |
| | | | | | | | |
| | | | Turkey — 0.1% | | | | |
| $ | 200,000 | | | Akbank TAS, 5.125%, 7/22/2015, 144A | | $ | 193,000 | |
| | 636,032 | | | Republic of Turkey, 4.000%, 4/29/2015, (TRY) | | | 362,086 | |
| | | | | | | | |
| | | | | | | 555,086 | |
| | | | | | | | |
| | | | United Arab Emirates — 0.5% | | | | |
| | 400,000 | | | Abu Dhabi National Energy Co., 6.500%, 10/27/2036, 144A | | | 403,000 | |
| | 400,000 | | | Abu Dhabi National Energy Co., 7.250%, 8/01/2018, 144A | | | 466,500 | |
| | 500,000 | | | DP World Ltd., 6.850%, 7/02/2037, 144A | | | 455,000 | |
| | 300,000 | | | Dubai Electricity & Water Authority, 6.375%, 10/21/2016, 144A | | | 308,250 | |
| | 200,000 | | | Dubai Electricity & Water Authority, 8.500%, 4/22/2015, 144A | | | 213,000 | |
| | 250,000 | | | Mubadala Development Co., GMTN, 7.625%, 5/06/2019, 144A | | | 302,347 | |
| | | | | | | | |
| | | | | | | 2,148,097 | |
| | | | | | | | |
| | | | United Kingdom — 0.7% | | | | |
| | 410,000,000 | | | Barclays Bank PLC, EMTN, 3.680%, 8/20/2015, (KRW) | | | 349,021 | |
| | 100,000 | | | BAT International Finance PLC, EMTN, 5.375%, 6/29/2017, (EUR) | | | 148,926 | |
| | 150,000 | | | British Telecommunications PLC, 5.750%, 12/07/2028, (GBP) | | | 239,505 | |
| | 60,000 | | | BSKYB Finance UK PLC, 5.750%, 10/20/2017, (GBP) | | | 104,136 | |
| | 150,000 | | | Imperial Tobacco Finance PLC, EMTN, 6.250%, 12/04/2018, (GBP) | | | 263,404 | |
| | 100,000 | | | Rexam PLC, EMTN, 4.375%, 3/15/2013, (EUR) | | | 137,123 | |
| | 250,000 | | | Standard Chartered Bank, Series 17, EMTN, 5.875%, 9/26/2017, (EUR) | | | 331,769 | |
| | 400,000 | | | United Kingdom Treasury, 4.250%, 3/07/2036, (GBP) | | | 706,533 | |
| | 300,000 | | | United Kingdom Treasury, 5.250%, 6/07/2012, (GBP) | | | 482,575 | |
| | 350,000 | | | Vedanta Resources PLC, 6.750%, 6/07/2016, 144A | | | 283,500 | |
| | 200,000 | | | Vedanta Resources PLC, 8.250%, 6/07/2021, 144A | | | 154,000 | |
| | | | | | | | |
| | | | | | | 3,200,492 | |
| | | | | | | | |
| | | | United States — 17.1% | | | | |
| | 310,000 | | | Alcatel-Lucent USA, Inc., 6.450%, 3/15/2029 | | | 257,300 | |
| | 15,000 | | | Alcatel-Lucent USA, Inc., 6.500%, 1/15/2028 | | | 12,450 | |
| | 975,000 | | | Alcoa, Inc., 5.900%, 2/01/2027 | | | 965,221 | |
| | 257,000 | | | Ally Financial, Inc., 6.750%, 12/01/2014 | | | 245,756 | |
| | 60,000 | | | Ally Financial, Inc., 6.875%, 8/28/2012 | | | 61,125 | |
| | 63,000 | | | Ally Financial, Inc., 7.000%, 2/01/2012 | | | 63,394 | |
| | 55,000 | | | Ally Financial, Inc., 7.500%, 12/31/2013 | | | 55,825 | |
| | 129,000 | | | Ally Financial, Inc., 8.000%, 12/31/2018 | | | 117,390 | |
| | 1,946,000 | | | Ally Financial, Inc., 8.000%, 11/01/2031 | | | 1,707,615 | |
| | 720,000 | | | American International Group, Inc., (fixed rate to 5/15/2038, variable rate thereafter), 8.175%, 5/15/2068 | | | 635,400 | |
| | 60,000 | | | Arrow Electronics, Inc., 6.875%, 7/01/2013 | | | 64,135 | |
| | 26,244 | | | Atlas Air Pass Through Trust, Series 1998-1, Class B, 7.680%, 7/02/2015 | | | 24,145 | |
| | 615,000 | | | Aviation Capital Group Corp., 6.750%, 4/06/2021, 144A | | | 591,698 | |
| | 145,000 | | | Avnet, Inc., 6.000%, 9/01/2015 | | | 156,756 | |
| | 450,000 | | | Bank of America Corp., (fixed rate to 5/06/2014, variable rate thereafter), 4.750%, 5/06/2019, (EUR) | | | 422,191 | |
| | 115,000 | | | Bank of America Corp., MTN, 5.000%, 5/13/2021 | | | 102,598 | |
| | 15,000 | | | Boston Scientific Corp., 5.125%, 1/12/2017 | | | 16,112 | |
| | 5,000 | | | Boston Scientific Corp., 5.450%, 6/15/2014 | | | 5,379 | |
| | 15,000 | | | Boston Scientific Corp., 6.400%, 6/15/2016 | | | 16,765 | |
See accompanying notes to financial statements.
| 32
Portfolio of Investments – as of September 30, 2011
Loomis Sayles Global Equity and Income Fund – (continued)
| | | | | | | | |
Principal
Amount (‡) | | | Description | | Value (†) | |
| | | | | | | | |
| | | | United States — continued | | | | |
| $ | 60,000 | | | Boston Scientific Corp., 7.000%, 11/15/2035 | | $ | 70,150 | |
| | 1,865,000 | | | CenturyLink, Inc., 6.450%, 6/15/2021 | | | 1,728,139 | |
| | 55,000 | | | CenturyLink, Inc., Series G, 6.875%, 1/15/2028 | | | 47,621 | |
| | 310,000 | | | CenturyLink, Inc., Series P, 7.600%, 9/15/2039 | | | 278,851 | |
| | 75,000 | | | Chesapeake Energy Corp., 6.875%, 11/15/2020 | | | 78,375 | |
| | 1,900,000 | | | Chrysler Group LLC/CG Co-Issuer, Inc., 8.250%, 6/15/2021, 144A | | | 1,463,000 | |
| | 21,019 | | | CIT Group, Inc., 7.000%, 5/01/2014 | | | 21,439 | |
| | 119,429 | | | CIT Group, Inc., 7.000%, 5/01/2015 | | | 118,533 | |
| | 199,049 | | | CIT Group, Inc., 7.000%, 5/01/2016 | | | 193,078 | |
| | 278,673 | | | CIT Group, Inc., 7.000%, 5/01/2017 | | | 270,313 | |
| | 300,000 | | | Comcast Corp., 5.650%, 6/15/2035 | | | 314,049 | |
| | 772,108 | | | Continental Airlines Pass Through Trust, Series 1999-1, Class B, 6.795%, 2/02/2020 | | | 737,363 | |
| | 190,000 | | | CSX Corp., 6.250%, 3/15/2018 | | | 228,925 | |
| | 265,000 | | | Cummins, Inc., 5.650%, 3/01/2098 | | | 253,828 | |
| | 160,000 | | | Cummins, Inc., 7.125%, 3/01/2028 | | | 201,898 | |
| | 272,477 | | | Delta Air Lines Pass Through Trust, Series 2007-1, Class B, 8.021%, 2/10/2024 | | | 265,665 | |
| | 266,589 | | | Delta Air Lines Pass Through Trust, Series 2007-1, Class C, 8.954%, 8/10/2014 | | | 262,590 | |
| | 42,000 | | | Dillard’s, Inc., 6.625%, 1/15/2018 | | | 41,160 | |
| | 50,000 | | | Dillard’s, Inc., 7.000%, 12/01/2028 | | | 44,500 | |
| | 8,000 | | | Dillard’s, Inc., 7.750%, 7/15/2026 | | | 7,600 | |
| | 40,000 | | | Eastman Kodak Co., 7.250%, 11/15/2013 | | | 10,000 | |
| | 200,000 | | | Eastman Kodak Co., 9.750%, 3/01/2018, 144A | | | 140,000 | |
| | 310,000 | | | Eastman Kodak Co., 10.625%, 3/15/2019, 144A | | | 220,100 | |
| | 250,000 | | | Exelon Corp., 4.900%, 6/15/2015 | | | 270,598 | |
| | 150,000 | | | Foot Locker, Inc., 8.500%, 1/15/2022 | | | 152,250 | |
| | 25,000 | | | Ford Motor Co., 6.375%, 2/01/2029 | | | 24,172 | |
| | 50,000 | | | Ford Motor Co., 6.625%, 2/15/2028 | | | 49,625 | |
| | 2,105,000 | | | Ford Motor Co., 6.625%, 10/01/2028 | | | 2,089,103 | |
| | 40,000 | | | Ford Motor Co., 7.125%, 11/15/2025 | | | 39,465 | |
| | 835,000 | | | Ford Motor Co., 7.450%, 7/16/2031 | | | 942,615 | |
| | 5,000 | | | Ford Motor Co., 7.500%, 8/01/2026 | | | 5,054 | |
| | 2,250,000 | | | Ford Motor Credit Co. LLC, 7.000%, 10/01/2013 | | | 2,362,763 | |
| | 845,000 | | | Ford Motor Credit Co. LLC, 7.000%, 4/15/2015 | | | 887,250 | |
| | 905,000 | | | Ford Motor Credit Co. LLC, 8.000%, 12/15/2016 | | | 987,545 | |
| | 905,000 | | | Forethought Financial Group, Inc., 8.625%, 4/15/2021, 144A | | | 931,817 | |
| | 80,000 | | | Freescale Semiconductor, Inc., 10.125%, 12/15/2016 | | | 81,400 | |
| | 45,000 | | | General Electric Capital Corp., 5.625%, 5/01/2018 | | | 49,194 | |
| | 205,000 | | | General Electric Capital Corp., MTN, 5.875%, 1/14/2038 | | | 210,118 | |
| | 900,000 | | | General Electric Capital Corp., Series A, GMTN, 7.625%, 12/10/2014, (NZD) | | | 744,634 | |
| | 750,000 | | | General Electric Capital Corp., Series A, MTN, 4.875%, 3/04/2015 | | | 800,870 | |
| | 3,435,000 | | | Georgia-Pacific LLC, 7.250%, 6/01/2028 | | | 3,824,962 | |
| | 105,000 | | | Georgia-Pacific LLC, 7.375%, 12/01/2025 | | | 117,156 | |
| | 180,000 | | | Georgia-Pacific LLC, 7.750%, 11/15/2029 | | | 208,152 | |
| | 220,000 | | | Georgia-Pacific LLC, 8.000%, 1/15/2024 | | | 258,276 | |
| | 405,000 | | | Georgia-Pacific LLC, 8.875%, 5/15/2031 | | | 505,481 | |
| | 200,000 | | | Gerdau Holdings, Inc., 7.000%, 1/20/2020, 144A | | | 205,000 | |
See accompanying notes to financial statements.
33 |
Portfolio of Investments – as of September 30, 2011
Loomis Sayles Global Equity and Income Fund – (continued)
| | | | | | | | |
Principal
Amount (‡) | | | Description | | Value (†) | |
| | | | | | | | |
| | | | United States — continued | | | | |
| $ | 455,000 | | | Goldman Sachs Group, Inc. (The), 6.750%, 10/01/2037 | | $ | 416,208 | |
| | 50,000 | | | Goldman Sachs Group, Inc. (The), 6.875%, 1/18/2038, (GBP) | | | 63,573 | |
| | 165,000 | | | Goodyear Tire & Rubber Co. (The), 7.000%, 3/15/2028 | | | 149,325 | |
| | 410,000 | | | Hanover Insurance Group, Inc. (The), 6.375%, 6/15/2021 | | | 429,794 | |
| | 20,000 | | | HCA, Inc., 5.750%, 3/15/2014 | | | 19,500 | |
| | 90,000 | | | HCA, Inc., 6.375%, 1/15/2015 | | | 87,525 | |
| | 225,000 | | | HCA, Inc., 7.050%, 12/01/2027 | | | 187,875 | |
| | 245,000 | | | HCA, Inc., 7.190%, 11/15/2015 | | | 237,650 | |
| | 90,000 | | | HCA, Inc., 7.500%, 12/15/2023 | | | 81,000 | |
| | 250,000 | | | HCA, Inc., 7.500%, 11/06/2033 | | | 213,125 | |
| | 1,495,000 | | | HCA, Inc., 7.690%, 6/15/2025 | | | 1,345,500 | |
| | 395,000 | | | HCA, Inc., 8.360%, 4/15/2024 | | | 378,212 | |
| | 195,000 | | | HCA, Inc., MTN, 7.580%, 9/15/2025 | | | 174,525 | |
| | 75,000 | | | HCA, Inc., MTN, 7.750%, 7/15/2036 | | | 64,875 | |
| | 470,000 | | | Highwoods Properties, Inc., 5.850%, 3/15/2017 | | | 495,730 | |
| | 110,000 | | | Incitec Pivot Finance LLC, 6.000%, 12/10/2019, 144A | | | 120,959 | |
| | 1,265,000 | | | International Lease Finance Corp., 6.250%, 5/15/2019 | | | 1,099,528 | |
| | 1,255,000 | | | International Lease Finance Corp., Series R, MTN, 5.625%, 9/20/2013 | | | 1,204,800 | |
| | 250,000 | | | iStar Financial, Inc., 5.150%, 3/01/2012 | | | 240,000 | |
| | 95,000 | | | iStar Financial, Inc., 5.500%, 6/15/2012 | | | 90,963 | |
| | 70,000 | | | iStar Financial, Inc., 5.850%, 3/15/2017 | | | 53,900 | |
| | 405,000 | | | iStar Financial, Inc., 5.875%, 3/15/2016 | | | 319,950 | |
| | 145,000 | | | iStar Financial, Inc., 6.050%, 4/15/2015 | | | 114,550 | |
| | 985,000 | | | iStar Financial, Inc., 8.625%, 6/01/2013 | | | 896,350 | |
| | 35,000 | | | iStar Financial, Inc., Series B, 5.700%, 3/01/2014 | | | 28,000 | |
| | 950,000 | | | iStar Financial, Inc., Series B, 5.950%, 10/15/2013 | | | 824,125 | |
| | 5,000 | | | J.C. Penney Corp., Inc., 5.750%, 2/15/2018 | | | 4,875 | |
| | 64,000 | | | J.C. Penney Corp., Inc., 6.375%, 10/15/2036 | | | 53,760 | |
| | 15,000 | | | J.C. Penney Corp., Inc., 7.125%, 11/15/2023 | | | 15,150 | |
| | 5,000 | | | J.C. Penney Corp., Inc., 7.625%, 3/01/2097 | | | 4,200 | |
| | 95,000 | | | Jefferies Group, Inc., 6.250%, 1/15/2036 | | | 86,177 | |
| | 375,000 | | | Jefferies Group, Inc., 8.500%, 7/15/2019 | | | 417,068 | |
| | 260,000 | | | K. Hovnanian Enterprises, Inc., 6.250%, 1/15/2016 | | | 96,200 | |
| | 15,000 | | | K. Hovnanian Enterprises, Inc., 6.375%, 12/15/2014 | | | 7,688 | |
| | 375,000 | | | Kindred Healthcare, Inc., 8.250%, 6/01/2019, 144A | | | 286,406 | |
| | 15,000 | | | Lennar Corp., Series B, 5.500%, 9/01/2014 | | | 14,100 | |
| | 1,090,000 | | | Lennar Corp., Series B, 5.600%, 5/31/2015 | | | 991,900 | |
| | 55,000 | | | Lennar Corp., Series B, 6.500%, 4/15/2016 | | | 50,600 | |
| | 235,000 | | | Level 3 Financing, Inc., 8.750%, 2/15/2017 | | | 216,494 | |
| | 6,000 | | | Level 3 Financing, Inc., 9.250%, 11/01/2014 | | | 5,925 | |
| | 30,000 | | | Level 3 Financing, Inc., 9.375%, 4/01/2019, 144A | | | 27,900 | |
| | 110,000 | | | Masco Corp., 6.500%, 8/15/2032 | | | 97,424 | |
| | 765,000 | | | Masco Corp., 7.125%, 3/15/2020 | | | 741,313 | |
| | 75,000 | | | Masco Corp., 7.750%, 8/01/2029 | | | 73,571 | |
| | 1,200,000 | | | Merrill Lynch & Co., Inc., 6.110%, 1/29/2037 | | | 929,797 | |
| | 300,000 | | | Merrill Lynch & Co., Inc., 6.220%, 9/15/2026 | | | 253,717 | |
See accompanying notes to financial statements.
| 34
Portfolio of Investments – as of September 30, 2011
Loomis Sayles Global Equity and Income Fund – (continued)
| | | | | | | | |
Principal
Amount (‡) | | | Description | | Value (†) | |
| | | | | | | | |
| | | | United States — continued | | | | |
| $ | 310,000 | | | Momentive Specialty Chemicals, Inc., 7.875%, 2/15/2023 | | $ | 238,700 | |
| | 410,000 | | | Momentive Specialty Chemicals, Inc., 8.375%, 4/15/2016 | | | 342,350 | |
| | 230,000 | | | Morgan Stanley, 5.375%, 11/14/2013, (GBP) | | | 353,645 | |
| | 2,500,000 | | | Morgan Stanley, 5.750%, 1/25/2021 | | | 2,300,167 | |
| | 500,000 | | | Morgan Stanley, GMTN, 7.625%, 3/03/2016, (AUD) | | | 479,538 | |
| | 1,327,000 | | | New Albertson’s, Inc., 7.450%, 8/01/2029 | | | 995,250 | |
| | 100,000 | | | New Albertson’s, Inc., 7.750%, 6/15/2026 | | | 82,000 | |
| | 3,450,000 | | | New Albertson’s, Inc., 8.000%, 5/01/2031 | | | 2,725,500 | |
| | 1,965,000 | | | New Albertson’s, Inc., 8.700%, 5/01/2030 | | | 1,675,162 | |
| | 155,000 | | | New Albertson’s, Inc., Series C, MTN, 6.625%, 6/01/2028 | | | 107,725 | |
| | 15,000 | | | News America, Inc., 6.400%, 12/15/2035 | | | 16,243 | |
| | 935,000 | | | Nextel Communications, Inc., Series D, 7.375%, 8/01/2015 | | | 885,912 | |
| | 30,000 | | | Nextel Communications, Inc., Series E, 6.875%, 10/31/2013 | | | 29,175 | |
| | 250,000 | | | NGC Corp. Capital Trust I, Series B, 8.316%, 6/01/2027(b)(e) | | | 90,000 | |
| | 35,000 | | | Nortel Networks Capital Corp., 7.875%, 6/15/2026(f) | | | 36,050 | |
| | 50,000 | �� | | Ohio Edison Co., 6.875%, 7/15/2036 | | | 61,991 | |
| | 565,000 | | | Owens Corning, Inc., 6.500%, 12/01/2016 | | | 609,486 | |
| | 535,000 | | | Owens Corning, Inc., 7.000%, 12/01/2036 | | | 554,324 | |
| | 40,000 | | | Owens-Illinois, Inc., 7.800%, 5/15/2018 | | | 41,000 | |
| | 47,000 | | | Pulte Group, Inc., 5.200%, 2/15/2015 | | | 42,535 | |
| | 540,000 | | | Pulte Group, Inc., 6.000%, 2/15/2035 | | | 361,800 | |
| | 695,000 | | | Pulte Group, Inc., 6.375%, 5/15/2033 | | | 483,025 | |
| | 1,335,000 | | | Qwest Capital Funding, Inc., 6.500%, 11/15/2018 | | | 1,281,600 | |
| | 650,000 | | | Qwest Capital Funding, Inc., 6.875%, 7/15/2028 | | | 562,250 | |
| | 400,000 | | | Qwest Capital Funding, Inc., 7.625%, 8/03/2021 | | | 414,000 | |
| | 60,000 | | | Qwest Capital Funding, Inc., 7.750%, 2/15/2031 | | | 55,800 | |
| | 560,000 | | | Qwest Corp., 6.875%, 9/15/2033 | | | 529,200 | |
| | 115,000 | | | Qwest Corp., 7.250%, 9/15/2025 | | | 110,975 | |
| | 600,000 | | | Residential Capital LLC, 9.625%, 5/15/2015 | | | 465,000 | |
| | 80,000 | | | Reynolds American, Inc., 6.750%, 6/15/2017 | | | 92,207 | |
| | 20,000 | | | Reynolds American, Inc., 7.250%, 6/15/2037 | | | 22,456 | |
| | 1,600(†††††) | | | SLM Corp., 6.000%, 12/15/2043 | | | 32,220 | |
| | 120,000 | | | SLM Corp., MTN, 5.050%, 11/14/2014 | | | 115,791 | |
| | 35,000 | | | SLM Corp., MTN, 5.125%, 8/27/2012 | | | 34,984 | |
| | 228,000 | | | SLM Corp., Series A, MTN, 5.000%, 10/01/2013 | | | 223,184 | |
| | 10,000 | | | SLM Corp., Series A, MTN, 5.000%, 6/15/2018 | | | 8,788 | |
| | 115,000 | | | SLM Corp., Series A, MTN, 5.375%, 1/15/2013 | | | 115,005 | |
| | 75,000 | | | SLM Corp., Series A, MTN, 5.375%, 5/15/2014 | | | 73,810 | |
| | 265,000 | | | SLM Corp., Series A, MTN, 5.625%, 8/01/2033 | | | 211,018 | |
| | 625,000 | | | SLM Corp., Series A, MTN, 8.450%, 6/15/2018 | | | 650,105 | |
| | 400,000 | | | Springleaf Finance Corp., MTN, 5.750%, 9/15/2016 | | | 292,000 | |
| | 100,000 | | | Springleaf Finance Corp., Series H, MTN, 5.375%, 10/01/2012 | | | 92,000 | |
| | 300,000 | | | Springleaf Finance Corp., Series I, MTN, 4.875%, 7/15/2012 | | | 280,500 | |
| | 300,000 | | | Springleaf Finance Corp., Series I, MTN, 5.400%, 12/01/2015 | | | 219,000 | |
| | 330,000 | | | Springleaf Finance Corp., Series I, MTN, 5.850%, 6/01/2013 | | | 282,150 | |
| | 200,000 | | | Springleaf Finance Corp., Series J, MTN, 5.900%, 9/15/2012 | | | 183,750 | |
| | 400,000 | | | Springleaf Finance Corp., Series J, MTN, 6.900%, 12/15/2017 | | | 288,000 | |
See accompanying notes to financial statements.
35 |
Portfolio of Investments – as of September 30, 2011
Loomis Sayles Global Equity and Income Fund – (continued)
| | | | | | | | |
Principal
Amount (‡) | | | Description | | Value (†) | |
| | | | | | | | |
| | | | United States — continued | | | | |
| $ | 294,000 | | | Sprint Capital Corp., 6.875%, 11/15/2028 | | $ | 219,765 | |
| | 420,000 | | | Sprint Capital Corp., 6.900%, 5/01/2019 | | | 361,200 | |
| | 110,000 | | | Sprint Capital Corp., 8.750%, 3/15/2032 | | | 95,563 | |
| | 26,000 | | | Sprint Nextel Corp., 6.000%, 12/01/2016 | | | 22,360 | |
| | 265,000 | | | Tenet Healthcare Corp., 6.875%, 11/15/2031 | | | 201,400 | |
| | 250,000 | | | Textron, Inc., 3.875%, 3/11/2013, (EUR) | | | 335,564 | |
| | 820,000 | | | Textron, Inc., 5.950%, 9/21/2021 | | | 857,718 | |
| | 1,431,000 | | | Toys R Us, Inc., 7.375%, 10/15/2018 | | | 1,216,350 | |
| | 3,150,000 | | | TXU Corp., Series P, 5.550%, 11/15/2014 | | | 1,937,250 | |
| | 2,570,000 | | | TXU Corp., Series Q, 6.500%, 11/15/2024 | | | 976,600 | |
| | 30,000 | | | TXU Corp., Series R, 6.550%, 11/15/2034 | | | 11,100 | |
| | 2,700,000 | | | U.S. Treasury Note, 0.375%, 6/30/2013 | | | 2,705,913 | |
| | 1,100,000 | | | U.S. Treasury Note, 0.750%, 3/31/2013 | | | 1,108,635 | |
| | 7,250,000 | | | U.S. Treasury Note, 0.875%, 1/31/2012 | | | 7,269,539 | |
| | 445,469 | | | UAL Pass Through Trust, Series 2009-1, 10.400%, 5/01/2018 | | | 481,107 | |
| | 770,000 | | | United States Steel Corp., 6.650%, 6/01/2037 | | | 592,900 | |
| | 50,000 | | | USG Corp., 6.300%, 11/15/2016 | | | 36,625 | |
| | 230,000 | | | USG Corp., 9.750%, 1/15/2018 | | | 184,863 | |
| | 5,000 | | | Verizon Maryland, Inc., Series B, 5.125%, 6/15/2033 | | | 5,082 | |
| | 110,000 | | | Verizon Pennsylvania, Inc., 6.000%, 12/01/2028 | | | 122,562 | |
| | 85,000 | | | Wells Fargo & Co., 4.625%, 11/02/2035, (GBP) | | | 116,512 | |
| | 100,000 | | | Wells Fargo & Co., Series F, EMTN, 4.875%, 11/29/2035, (GBP) | | | 118,573 | |
| | 60,000 | | | Weyerhaeuser Co., 6.950%, 10/01/2027 | | | 64,207 | |
| | 315,000 | | | Weyerhaeuser Co., 7.375%, 3/15/2032 | | | 314,156 | |
| | 125,000 | | | Xerox Corp., 6.750%, 2/01/2017 | | | 143,465 | |
| | 20,000 | | | Xerox Corp., MTN, 7.200%, 4/01/2016 | | | 23,159 | |
| | 250,000 | | | Zurich Finance USA, Inc., EMTN, (fixed rate to 6/15/2015, variable rate thereafter), 4.500%, 6/15/2025, (EUR) | | | 311,481 | |
| | | | | | | | |
| | | | | | | 80,958,759 | |
| | | | | | | | |
| | | | Uruguay — 0.1% | | | | |
| | 3,923,246 | | | Uruguay Government International Bond, 3.700%, 6/26/2037, (UYU) | | | 161,669 | |
| | 4,466,650 | | | Uruguay Government International Bond, 5.000%, 9/14/2018, (UYU) | | | 226,060 | |
| | | | | | | | |
| | | | | | | 387,729 | |
| | | | | | | | |
| | | | Venezuela — 0.1% | | | | |
| | 800,000 | | | Petroleos de Venezuela S.A., 5.375%, 4/12/2027 | | | 366,000 | |
| | | | | | | | |
| | | | Total Non-Convertible Bonds
(Identified Cost $130,437,719) | | | 129,414,694 | |
| | | | | | | | |
| | | | | | | | |
| | Convertible Bonds — 1.3% | | | | |
| | | | United States — 1.3% | | | | |
| | 125,000 | | | Ford Motor Co., 4.250%, 11/15/2016 | | | 162,344 | |
| | 745,000 | | | Hologic, Inc., 2.000% (accretes to principal after 12/15/2013), 12/15/2037(g) | | | 697,506 | |
| | 1,125,000 | | | Intel Corp., 3.250%, 8/01/2039 | | | 1,323,281 | |
| | 430,000 | | | iStar Financial, Inc., 0.746%, 10/01/2012(d) | | | 376,250 | |
| | 365,000 | | | Kulicke & Soffa Industries, Inc., 0.875%, 6/01/2012 | | | 358,156 | |
See accompanying notes to financial statements.
| 36
Portfolio of Investments – as of September 30, 2011
Loomis Sayles Global Equity and Income Fund – (continued)
| | | | | | | | |
Principal
Amount (‡) | | | Description | | Value (†) | |
| | | | | | | | |
| | | | United States — continued | | | | |
| $ | 195,000 | | | Level 3 Communications, Inc., 3.500%, 6/15/2012 | | $ | 192,319 | |
| | 215,000 | | | Level 3 Communications, Inc., 7.000%, 3/15/2015, 144A(e) | | | 256,925 | |
| | 200,000 | | | NII Holdings, Inc., 3.125%, 6/15/2012 | | | 201,500 | |
| | 1,795,000 | | | Old Republic International Corp., 3.750%, 3/15/2018 | | | 1,622,231 | |
| | 375,000 | | | Omnicare, Inc., 3.750%, 12/15/2025 | | | 419,531 | |
| | 610,000 | | | Owens-Brockway Glass Container, Inc., 3.000%, 6/01/2015, 144A | | | 549,000 | |
| | 90,000 | | | Trinity Industries, Inc., 3.875%, 6/01/2036 | | | 80,888 | |
| | | | | | | | |
| | | | Total Convertible Bonds
(Identified Cost $6,153,801) | | | 6,239,931 | |
| | | | | | | | |
| | | | | | | | |
| | Municipals — 0.1% | | | | |
| | | | United States — 0.1% | | | | |
| | 415,000 | | | State of Illinois, 5.100%, 6/01/2033 | | | 375,123 | |
| | 135,000 | | | Virginia Tobacco Settlement Financing Corp., Series A-1, 6.706%, 6/01/2046(e) | | | 89,058 | |
| | | | | | | | |
| | | | Total Municipals
(Identified Cost $448,483) | | | 464,181 | |
| | | | | | | | |
| | | | Total Bonds and Notes
(Identified Cost $137,040,003) | | | 136,118,806 | |
| | | | | | | | |
| | | | | | | | |
| | Senior Loans — 0.0% | | | | |
| | | | United States — 0.0% | | | | |
| | 28,697 | | | Hawaiian Telcom Communications, Inc., Exit Term Loan,
9.000%, 11/01/2015(d)(h) | | | 28,580 | |
| | 2,676 | | | Sungard Data Systems, Inc., Tranche A, 1.977%, 2/28/2014(i) | | | 2,576 | |
| | 55,993 | | | SuperMedia, Inc., Exit Term Loan, 11.000%, 12/31/2015(d) | | | 24,441 | |
| | | | | | | | |
| | | | Total Senior Loans
(Identified Cost $107,632) | | | 55,597 | |
| | | | | | | | |
| | | | | | | | |
| Shares | | | | | | |
| | Preferred Stocks — 0.7% | | | | |
| | Convertible Preferred Stocks — 0.6% | | | | |
| | | | United States — 0.6% | | | | |
| | 69,840 | | | General Motors Co., Series B, 4.750% | | | 2,449,987 | |
| | 820 | | | Lucent Technologies Capital Trust I, 7.750% | | | 676,500 | |
| | | | | | | | |
| | | | Total Convertible Preferred Stocks
(Identified Cost $3,895,042) | | | 3,126,487 | |
| | | | | | | | |
| | | | | | | | |
| | Non-Convertible Preferred Stock — 0.1% | | | | |
| | | | United States — 0.1% | | | | |
| | 682 | | | Ally Financial, Inc., Series G, 7.000%, 144A Total Non- Convertible Preferred Stocks
(Identified Cost $145,366) | | | 409,200 | |
| | | | | | | | |
| | | | Total Preferred Stocks
(Identified Cost $4,040,408) | | | 3,535,687 | |
| | | | | | | | |
See accompanying notes to financial statements.
37 |
Portfolio of Investments – as of September 30, 2011
Loomis Sayles Global Equity and Income Fund – (continued)
| | | | | | | | |
Principal
Amount (‡) | | | Description | | Value (†) | |
| | | | | | | | |
| | Short-Term Investments — 6.8% | | | | |
| $ | 1,553 | | | Repurchase Agreement with State Street Bank and Trust Company, dated 9/30/2011 at 0.000%, to be repurchased at $1,553 on 10/03/2011 collateralized by $5,000 U.S. Treasury Note, 1.375% due 5/15/2013 valued at $5,115 including accrued interest (Note 2 of Notes to Financial Statements) | | $ | 1,553 | |
| | 32,295,691 | | | Tri-Party Repurchase Agreement with Fixed Income Clearing Corporation, dated 9/30/2011 at 0.000% to be repurchased at $32,295,691 on 10/03/2011 collateralized by $32,380,000 U.S. Treasury Note, 1.375% due 2/15/13 valued at $32,946,650 including accrued interest (Note 2 of Notes to Financial Statements) | | | 32,295,691 | |
| | | | | | | | |
| | | | Total Short-Term Investments
(Identified Cost $32,297,244) | | | 32,297,244 | |
| | | | | | | | |
| | | | | | | | |
| | | | Total Investments — 98.7%
(Identified Cost $485,136,573)(a) | | | 467,110,099 | |
| | | | Other assets less liabilities — 1.3% | | | 5,982,672 | |
| | | | | | | | |
| | | | Net Assets — 100.0% | | $ | 473,092,771 | |
| | | | | | | | |
| | | | | | | | |
| | (‡) | | | Principal amount stated in U.S. dollars unless otherwise noted. | | | | |
| | (†) | | | See Note 2 of Notes to Financial Statements. | | | | |
| | (††) | | | Security held in units. One unit represents a principal amount of 1,000. Amount shown represents principal amount including inflation adjustments. | |
| | (†††) | | | Amount shown represents units. One unit represents a principal amount of 1,000. | |
| | (††††) | | | Amount shown represents units. One unit represents a principal amount of 100. | |
| | (†††††) | | | Amount shown represents units. One unit represents a principal amount of 25. | |
| | | | | | | | |
| | (a) | | | Federal Tax Information: | | | | |
| | | | At September 30, 2011, the net unrealized depreciation on investments based on a cost of $487,247,648 for federal income tax purposes was as follows: | |
| | | | Aggregate gross unrealized appreciation for all investments in which there is an excess of value over tax cost | | $ | 21,968,560 | |
| | | | Aggregate gross unrealized depreciation for all investments in which there is an excess of tax cost over value | | | (42,106,109 | ) |
| | | | | | | | |
| | | | Net unrealized depreciation | | $ | (20,137,549 | ) |
| | | | | | | | |
| | | | | | | | |
| | (b) | | | Non-income producing security. | | | | |
| | (c) | | | All or a portion of this security has been designated to cover the Fund’s obligations under open forward foreign currency contracts. | |
| | (d) | | | Variable rate security. Rate as of September 30, 2011 is disclosed. | | | | |
| | (e) | | | Illiquid security. At September 30, 2011, the value of these securities amounted to $435,983 or 0.1% of net assets. | |
| | (f) | | | The issuer is in default with respect to interest and/or principal payments. Income is not being accrued. | |
| | (g) | | | Coupon rate is a fixed rate for an initial period then resets at a specified date and rate. | |
| | (h) | | | All or a portion of interest payment is paid-in-kind. | | | | |
| | (i) | | | Variable rate security. Rate shown represents the weighted average rate at September 30, 2011. | |
See accompanying notes to financial statements.
| 38
Portfolio of Investments – as of September 30, 2011
Loomis Sayles Global Equity and Income Fund – (continued)
| | | | | | |
| | | | | | |
| | 144A | | | All or a portion of these securities are exempt from registration under Rule 144A of the Securities Act of 1933. These securities may be resold in transactions exempt from registration, normally to qualified institutional buyers. At September 30, 2011, the value of Rule 144A holdings amounted to $24,587,200 or 5.2% of net assets. |
| | | | | | |
| | ADR/GDR | | | An American Depositary Receipt or Global Depositary Receipt is a certificate issued by a custodian bank representing the right to receive securities of the foreign issuer described. The values of ADRs and GDRs may be significantly influenced by trading on exchanges not located in the United States. |
| | EMTN | | | Euro Medium Term Note | | |
| | GMTN | | | Global Medium Term Note | | |
| | MTN | | | Medium Term Note | | |
| | |
| | AUD | | | Australian Dollar | | |
| | BRL | | | Brazilian Real | | |
| | CAD | | | Canadian Dollar | | |
| | CHF | | | Swiss Franc | | |
| | CLP | | | Chilean Peso | | |
| | COP | | | Colombian Peso | | |
| | EUR | | | Euro | | |
| | GBP | | | British Pound | | |
| | IDR | | | Indonesian Rupiah | | |
| | INR | | | Indian Rupee | | |
| | KRW | | | South Korean Won | | |
| | MXN | | | Mexican Peso | | |
| | MYR | | | Malaysian Ringgit | | |
| | NOK | | | Norwegian Krone | | |
| | NZD | | | New Zealand Dollar | | |
| | PHP | | | Philippine Peso | | |
| | SEK | | | Swedish Krona | | |
| | SGD | | | Singapore Dollar | | |
| | TRY | | | Turkish Lira | | |
| | UYU | | | Uruguayan Peso | | |
At September 30, 2011, the Fund had the following open forward foreign currency contracts:
| | | | | | | | | | | | | | | | | | |
Contract
to
Buy/Sell | | Delivery
Date | | | Currency | | Units | | | Notional
Value | | | Unrealized
Appreciation
(Depreciation) | |
| Sell1 | | | 12/21/2011 | | | Australian Dollar | | | 500,000 | | | $ | 479,387 | | | $ | 33,173 | |
| Sell1 | | | 11/03/2011 | | | Brazilian Real | | | 250,000 | | | | 131,969 | | | | 21,311 | |
| Buy2 | | | 08/22/2012 | | | Chinese Renminbi | | | 11,630,000 | | | | 1,833,802 | | | | (13,696 | ) |
| Buy3 | | | 11/28/2011 | | | Indian Rupee | | | 24,300,000 | | | | 492,218 | | | | (31,038 | ) |
| Buy4 | | | 10/19/2011 | | | Malaysian Ringgit | | | 1,250,000 | | | | 391,300 | | | | (12,643 | ) |
| Buy3 | | | 12/12/2011 | | | South Korean Won | | | 780,000,000 | | | | 659,565 | | | | (64,871 | ) |
| Buy1 | | | 12/12/2011 | | | South Korean Won | | | 1,488,000,000 | | | | 1,258,246 | | | | (122,472 | ) |
| | | | | | | | | | | | | | | | | | |
| Total | | | | | | | | | | | | | | | | $ | (190,236 | ) |
| | | | | | | | | | | | | | | | | | |
1 Counterparty is Credit Suisse.
See accompanying notes to financial statements.
39 |
Portfolio of Investments – as of September 30, 2011
Loomis Sayles Global Equity and Income Fund – (continued)
2 Counterparty is Morgan Stanley.
3 Counterparty is Barclays.
4 Counterparty is JPMorgan Chase.
Industry Summary at September 30, 2011 (Unaudited)
| | | | |
Treasuries | | | 6.2 | % |
Beverages | | | 6.0 | |
Pharmaceuticals | | | 4.4 | |
Computers & Peripherals | | | 4.1 | |
Internet Software & Services | | | 4.0 | |
Commercial Banks | | | 4.0 | |
Software | | | 3.9 | |
Energy Equipment & Services | | | 3.8 | |
Machinery | | | 3.5 | |
Automotive | | | 2.6 | |
Aerospace & Defense | | | 2.5 | |
Chemicals | | | 2.4 | |
Non-Captive Diversified | | | 2.2 | |
Hotels, Restaurants & Leisure | | | 2.1 | |
Diversified Telecommunication Services | | | 2.1 | |
Other Investments, less than 2% each | | | 38.1 | |
Short-Term Investments | | | 6.8 | |
| | | | |
Total Investments | | | 98.7 | |
Other assets less liabilities (including open forward foreign currency contracts) | | | 1.3 | |
| | | | |
Net Assets | | | 100.0 | % |
| | | | |
Currency Exposure at September 30, 2011 (Unaudited)
| | | | |
United States Dollar | | | 67.3 | % |
British Pound | | | 7.7 | |
Euro | | | 6.2 | |
Brazilian Real | | | 3.1 | |
Danish Krone | | | 2.3 | |
Japanese Yen | | | 2.3 | |
Hong Kong Dollar | | | 2.2 | |
Other, less than 2% each | | | 7.6 | |
| | | | |
Total Investments | | | 98.7 | |
Other assets less liabilities (including open forward foreign currency contracts) | | | 1.3 | |
| | | | |
Net Assets | | | 100.0 | % |
| | | | |
See accompanying notes to financial statements.
| 40
Portfolio of Investments – as of September 30, 2011
Loomis Sayles Growth Fund
| | | | | | | | |
| Shares | | | Description | | Value (†) | |
| | | | | | | | |
| | Common Stocks — 99.8% of Net Assets | | | | |
| | | | Air Freight & Logistics — 6.9% | | | | |
| | 83,412 | | | Expeditors International of Washington, Inc. | | $ | 3,382,357 | |
| | 66,060 | | | United Parcel Service, Inc., Class B | | | 4,171,689 | |
| | | | | | | | |
| | | | | | | 7,554,046 | |
| | | | | | | | |
| | | | Beverages — 4.4% | | | | |
| | 46,102 | | | Coca-Cola Co. (The) | | | 3,114,651 | |
| | 22,636 | | | Diageo PLC, Sponsored ADR | | | 1,718,752 | |
| | | | | | | | |
| | | | | | | 4,833,403 | |
| | | | | | | | |
| | | | Biotechnology — 6.3% | | | | |
| | 85,337 | | | Amgen, Inc. | | | 4,689,268 | |
| | 57,458 | | | Gilead Sciences, Inc.(b) | | | 2,229,371 | |
| | | | | | | | |
| | | | | | | 6,918,639 | |
| | | | | | | | |
| | | | Capital Markets — 8.4% | | | | |
| | 16,503 | | | Franklin Resources, Inc. | | | 1,578,347 | |
| | 54,171 | | | Greenhill & Co., Inc. | | | 1,548,749 | |
| | 80,854 | | | Legg Mason, Inc. | | | 2,078,756 | |
| | 263,192 | | | SEI Investments Co. | | | 4,047,893 | |
| | | | | | | | |
| | | | | | | 9,253,745 | |
| | | | | | | | |
| | | | Communications Equipment — 10.2% | | | | |
| | 386,267 | | | Cisco Systems, Inc. | | | 5,983,276 | |
| | 106,595 | | | QUALCOMM, Inc. | | | 5,183,715 | |
| | | | | | | | |
| | | | | | | 11,166,991 | |
| | | | | | | | |
| | | | Consumer Finance — 3.7% | | | | |
| | 89,666 | | | American Express Co. | | | 4,026,003 | |
| | | | | | | | |
| | | | Energy Equipment & Services — 2.4% | | | | |
| | 44,111 | | | Schlumberger Ltd. | | | 2,634,750 | |
| | | | | | | | |
| | | | Food Products — 3.8% | | | | |
| | 335,836 | | | Danone S.A., Sponsored ADR | | | 4,171,083 | |
| | | | | | | | |
| | | | Health Care Equipment & Supplies — 4.5% | | | | |
| | 49,141 | | | Medtronic, Inc. | | | 1,633,447 | |
| | 61,835 | | | Zimmer Holdings, Inc.(b) | | | 3,308,172 | |
| | | | | | | | |
| | | | | | | 4,941,619 | |
| | | | | | | | |
| | | | Household Products — 4.6% | | | | |
| | 26,891 | | | Clorox Co. (The) | | | 1,783,680 | |
| | 51,441 | | | Procter & Gamble Co. (The) | | | 3,250,042 | |
| | | | | | | | |
| | | | | | | 5,033,722 | |
| | | | | | | | |
| | | | Internet & Catalog Retail — 8.3% | | | | |
| | 35,456 | | | Amazon.com, Inc.(b) | | | 7,666,651 | |
| | 40,706 | | | Blue Nile, Inc.(b) | | | 1,436,108 | |
| | | | | | | | |
| | | | | | | 9,102,759 | |
| | | | | | | | |
| | | | Internet Software & Services — 5.8% | | | | |
| | 12,353 | | | Google, Inc., Class A(b) | | | 6,354,136 | |
| | | | | | | | |
See accompanying notes to financial statements.
41 |
Portfolio of Investments – as of September 30, 2011
Loomis Sayles Growth Fund – (continued)
| | | | | | | | |
| Shares | | | Description | | Value (†) | |
| | | | | | | | |
| | | | IT Services — 8.2% | | | | |
| | 36,595 | | | Automatic Data Processing, Inc. | | $ | 1,725,454 | |
| | 84,974 | | | Visa, Inc., Class A | | | 7,283,972 | |
| | | | | | | | |
| | | | | | | 9,009,426 | |
| | | | | | | | |
| | | | Media — 1.8% | | | | |
| | 53,669 | | | Omnicom Group, Inc. | | | 1,977,166 | |
| | | | | | | | |
| | | | Multiline Retail — 0.3% | | | | |
| | 6,914 | | | Target Corp. | | | 339,063 | |
| | | | | | | | |
| | | | Pharmaceuticals — 5.7% | | | | |
| | 70,373 | | | Merck & Co., Inc. | | | 2,301,901 | |
| | 70,815 | | | Novartis AG, ADR | | | 3,949,352 | |
| | | | | | | | |
| | | | | | | 6,251,253 | |
| | | | | | | | |
| | | | Semiconductors & Semiconductor Equipment — 0.9% | | | | |
| | 14,317 | | | Altera Corp. | | | 451,415 | |
| | 17,158 | | | Analog Devices, Inc. | | | 536,187 | |
| | | | | | | | |
| | | | | | | 987,602 | |
| | | | | | | | |
| | | | Software — 10.9% | | | | |
| | 43,502 | | | FactSet Research Systems, Inc. | | | 3,870,373 | |
| | 90,089 | | | Microsoft Corp. | | | 2,242,315 | |
| | 204,008 | | | Oracle Corp. | | | 5,863,190 | |
| | | | | | | | |
| | | | | | | 11,975,878 | |
| | | | | | | | |
| | | | Specialty Retail — 2.7% | | | | |
| | 48,544 | | | Home Depot, Inc. (The) | | | 1,595,641 | |
| | 72,785 | | | Lowe’s Cos., Inc. | | | 1,407,662 | |
| | | | | | | | |
| | | | | | | 3,003,303 | |
| | | | | | | | |
| | | | Total Common Stocks
(Identified Cost $105,407,052) | | | 109,534,587 | |
| | | | | | | | |
| | | | | | | | |
Principal
Amount | | | | | | |
| | Short-Term Investments — 0.2% | | | | |
| $ | 225,975 | | | Tri-Party Repurchase Agreement with Fixed Income Clearing Corporation, dated 9/30/2011 at 0.000% to be repurchased at $225,975 on 10/03/2011 collateralized by $235,000 Federal Home Loan Mortgage Corp., 0.600% due 8/23/2013 valued at $235,296 including accrued interest (Note 2 of Notes to Financial Statements) (Identified Cost $225,975) | | | 225,975 | |
| | | | | | | | |
| | | | | | | | |
| | | | Total Investments — 100.0%
(Identified Cost $105,633,027)(a) | | | 109,760,562 | |
| | | | Other assets less liabilities — 0.0% | | | 4,625 | |
| | | | | | | | |
| | | | Net Assets — 100.0% | | $ | 109,765,187 | |
| | | | | | | | |
See accompanying notes to financial statements.
| 42
Portfolio of Investments – as of September 30, 2011
Loomis Sayles Growth Fund – (continued)
| | | | | | | | |
| | (†) | | | See Note 2 of Notes to Financial Statements. | | | | |
| | (a) | | | Federal Tax Information: | | | | |
| | | | At September 30, 2011, the net unrealized appreciation on investments based on a cost of $106,441,892 for federal income tax purposes was as follows: | | | | |
| | | | Aggregate gross unrealized appreciation for all investments in which there is an excess of value over tax cost | | $ | 9,918,201 | |
| | | | Aggregate gross unrealized depreciation for all investments in which there is an excess of tax cost over value | | | (6,599,531 | ) |
| | | | | | | | |
| | | | Net unrealized appreciation | | $ | 3,318,670 | |
| | | | | | | | |
| | | | | | | | |
| | (b) | | | Non-income producing security. | | | | |
| | | | | | | | |
| | ADR | | | An American Depositary Receipt is a certificate issued by a custodian bank representing the right to receive securities of the foreign issuer described. The values of ADRs may be significantly influenced by trading on exchanges not located in the United States. | | | | |
Industry Summary at September 30, 2011 (Unaudited)
| | | | |
Software | | | 10.9 | % |
Communications Equipment | | | 10.2 | |
Capital Markets | | | 8.4 | |
Internet & Catalog Retail | | | 8.3 | |
IT Services | | | 8.2 | |
Air Freight & Logistics | | | 6.9 | |
Biotechnology | | | 6.3 | |
Internet Software & Services | | | 5.8 | |
Pharmaceuticals | | | 5.7 | |
Household Products | | | 4.6 | |
Health Care Equipment & Supplies | | | 4.5 | |
Beverages | | | 4.4 | |
Food Products | | | 3.8 | |
Consumer Finance | | | 3.7 | |
Specialty Retail | | | 2.7 | |
Energy Equipment & Services | | | 2.4 | |
Other Investments, less than 2% each | | | 3.0 | |
Short-Term Investments | | | 0.2 | |
| | | | |
Total Investments | | | 100.0 | |
Other assets less liabilities | | | 0.0 | |
| | | | |
Net Assets | | | 100.0 | % |
| | | | |
See accompanying notes to financial statements.
43 |
Portfolio of Investments – as of September 30, 2011
Loomis Sayles Mid Cap Growth Fund
| | | | | | | | |
| Shares | | | Description | | Value (†) | |
| | | | | | | | |
| | Common Stocks — 92.9% of Net Assets | | | | |
| | | | Aerospace & Defense — 1.8% | | | | |
| | 22,339 | | | TransDigm Group, Inc.(b) | | $ | 1,824,426 | |
| | | | | | | | |
| | | | Biotechnology — 6.6% | | | | |
| | 42,288 | | | Alexion Pharmaceuticals, Inc.(b) | | | 2,708,969 | |
| | 18,839 | | | Pharmasset, Inc.(b) | | | 1,551,769 | |
| | 23,030 | | | Regeneron Pharmaceuticals, Inc.(b) | | | 1,340,346 | |
| | 25,819 | | | Vertex Pharmaceuticals, Inc.(b) | | | 1,149,978 | |
| | | | | | | | |
| | | | | | | 6,751,062 | |
| | | | | | | | |
| | | | Chemicals — 1.4% | | | | |
| | 11,852 | | | CF Industries Holdings, Inc. | | | 1,462,418 | |
| | | | | | | | |
| | | | Commercial Services & Supplies — 2.3% | | | | |
| | 28,380 | | | Stericycle, Inc.(b) | | | 2,290,834 | |
| | | | | | | | |
| | | | Communications Equipment — 0.9% | | | | |
| | 22,187 | | | Acme Packet, Inc.(b) | | | 944,944 | |
| | | | | | | | |
| | | | Electrical Equipment — 3.5% | | | | |
| | 35,494 | | | Polypore International, Inc.(b) | | | 2,006,121 | |
| | 27,292 | | | Rockwell Automation, Inc. | | | 1,528,352 | |
| | | | | | | | |
| | | | | | | 3,534,473 | |
| | | | | | | | |
| | | | Food & Staples Retailing — 2.0% | | | | |
| | 31,608 | | | Whole Foods Market, Inc. | | | 2,064,319 | |
| | | | | | | | |
| | | | Food Products — 7.5% | | | | |
| | 22,290 | | | Diamond Foods, Inc. | | | 1,778,519 | |
| | 25,510 | | | Green Mountain Coffee Roasters, Inc.(b) | | | 2,370,899 | |
| | 22,809 | | | J.M. Smucker Co. (The) | | | 1,662,548 | |
| | 26,273 | | | Mead Johnson Nutrition Co. | | | 1,808,371 | |
| | | | | | | | |
| | | | | | | 7,620,337 | |
| | | | | | | | |
| | | | Health Care Equipment & Supplies — 1.8% | | | | |
| | 4,937 | | | Intuitive Surgical, Inc.(b) | | | 1,798,450 | |
| | | | | | | | |
| | | | Health Care Providers & Services — 3.7% | | | | |
| | 68,217 | | | HMS Holdings Corp.(b) | | | 1,663,813 | |
| | 28,643 | | | Humana, Inc. | | | 2,083,205 | |
| | | | | | | | |
| | | | | | | 3,747,018 | |
| | | | | | | | |
| | | | Health Care Technology — 2.1% | | | | |
| | 38,643 | | | SXC Health Solutions Corp.(b) | | | 2,152,415 | |
| | | | | | | | |
| | | | Hotels, Restaurants & Leisure — 5.6% | | | | |
| | 61,385 | | | Arcos Dorados Holdings, Inc., Class A | | | 1,423,518 | |
| | 6,914 | | | Chipotle Mexican Grill, Inc.(b) | | | 2,094,596 | |
| | 19,018 | | | Wynn Resorts Ltd. | | | 2,188,592 | |
| | | | | | | | |
| | | | | | | 5,706,706 | |
| | | | | | | | |
| | | | Household Durables — 1.5% | | | | |
| | 29,101 | | | Tempur-Pedic International, Inc.(b) | | | 1,531,004 | |
| | | | | | | | |
| | | | Internet & Catalog Retail — 1.4% | | | | |
| | 3,201 | | | Priceline.com, Inc.(b) | | | 1,438,721 | |
| | | | | | | | |
See accompanying notes to financial statements.
| 44
Portfolio of Investments – as of September 30, 2011
Loomis Sayles Mid Cap Growth Fund – (continued)
| | | | | | | | |
| Shares | | | Description | | Value (†) | |
| | | | | | | | |
| | | | Internet Software & Services — 4.1% | | | | |
| | 13,799 | | | LinkedIn Corp., Class A(b) | | $ | 1,077,426 | |
| | 18,680 | | | MercadoLibre, Inc. | | | 1,004,050 | |
| | 60,659 | | | Rackspace Hosting, Inc.(b) | | | 2,070,898 | |
| | | | | | | | |
| | | | | | | 4,152,374 | |
| | | | | | | | |
| | | | IT Services — 2.1% | | | | |
| | 40,617 | | | Teradata Corp.(b) | | | 2,174,228 | |
| | | | | | | | |
| | | | Life Sciences Tools & Services — 2.1% | | | | |
| | 14,868 | | | Mettler-Toledo International, Inc.(b) | | | 2,080,925 | |
| | | | | | | | |
| | | | Machinery — 0.8% | | | | |
| | 52,313 | | | Titan International, Inc. | | | 784,695 | |
| | | | | | | | |
| | | | Metals & Mining — 1.7% | | | | |
| | 27,575 | | | Royal Gold, Inc. | | | 1,766,455 | |
| | | | | | | | |
| | | | Multiline Retail — 3.5% | | | | |
| | 47,836 | | | Dollar Tree, Inc.(b) | | | 3,592,962 | |
| | | | | | | | |
| | | | Oil, Gas & Consumable Fuels — 5.9% | | | | |
| | 59,776 | | | Brigham Exploration Co.(b) | | | 1,509,942 | |
| | 24,841 | | | Cabot Oil & Gas Corp. | | | 1,537,906 | |
| | 33,936 | | | Rosetta Resources, Inc.(b) | | | 1,161,290 | |
| | 28,862 | | | SM Energy Co. | | | 1,750,480 | |
| | | | | | | | |
| | | | | | | 5,959,618 | |
| | | | | | | | |
| | | | Personal Products — 1.8% | | | | |
| | 20,703 | | | Estee Lauder Cos., Inc. (The), Class A | | | 1,818,552 | |
| | | | | | | | |
| | | | Pharmaceuticals — 3.1% | | | | |
| | 32,449 | | | Perrigo Co. | | | 3,151,122 | |
| | | | | | | | |
| | | | REITs - Apartments — 1.4% | | | | |
| | 12,529 | | | AvalonBay Communities, Inc. | | | 1,428,932 | |
| | | | | | | | |
| | | | REITs - Office Property — 1.4% | | | | |
| | 15,935 | | | Boston Properties, Inc. | | | 1,419,809 | |
| | | | | | | | |
| | | | Road & Rail — 2.0% | | | | |
| | 40,811 | | | Kansas City Southern(b) | | | 2,038,918 | |
| | | | | | | | |
| | | | Semiconductors & Semiconductor Equipment — 5.8% | | | | |
| | 81,321 | | | ARM Holdings PLC, Sponsored ADR | | | 2,073,685 | |
| | 56,458 | | | Avago Technologies Ltd. | | | 1,850,129 | |
| | 41,380 | | | Ceva, Inc.(b) | | | 1,005,948 | |
| | 141,083 | | | ON Semiconductor Corp.(b) | | | 1,011,565 | |
| | | | | | | | |
| | | | | | | 5,941,327 | |
| | | | | | | | |
| | | | Software — 4.2% | | | | |
| | 28,331 | | | Informatica Corp.(b) | | | 1,160,155 | |
| | 17,597 | | | Salesforce.com, Inc.(b) | | | 2,010,985 | |
| | 45,696 | | | SuccessFactors, Inc.(b) | | | 1,050,551 | |
| | | | | | | | |
| | | | | | | 4,221,691 | |
| | | | | | | | |
See accompanying notes to financial statements.
45 |
Portfolio of Investments – as of September 30, 2011
Loomis Sayles Mid Cap Growth Fund – (continued)
| | | | | | | | |
| Shares | | | Description | | Value (†) | |
| | | | | | | | |
| | | | Specialty Retail — 7.7% | | | | |
| | 32,848 | | | Abercrombie & Fitch Co., Class A | | $ | 2,022,123 | |
| | 7,040 | | | AutoZone, Inc.(b) | | | 2,247,097 | |
| | 51,183 | | | PetSmart, Inc. | | | 2,182,955 | |
| | 23,035 | | | Tiffany & Co. | | | 1,400,989 | |
| | | | | | | | |
| | | | | | | 7,853,164 | |
| | | | | | | | |
| | | | Textiles, Apparel & Luxury Goods — 3.2% | | | | |
| | 18,846 | | | Fossil, Inc.(b) | | | 1,527,657 | |
| | 36,191 | | | Lululemon Athletica, Inc.(b) | | | 1,760,692 | |
| | | | | | | | |
| | | | | | | 3,288,349 | |
| | | | | | | | |
| | | | Total Common Stocks
(Identified Cost $95,110,533) | | | 94,540,248 | |
| | | | | | | | |
| | | | | | | | |
Principal
Amount | | | | | | |
| | Short-Term Investments — 7.1% | | | | |
| $ | 7,230,246 | | | Tri-Party Repurchase Agreement with Fixed Income Clearing Corporation, dated 9/30/2011 at 0.000% to be repurchased at $7,230,246 on 10/03/2011 collateralized by $7,165,000 U.S. Treasury Note, 1.500% due 12/31/2013 valued at $7,379,950, including accrued interest (Note 2 of Notes to Financial Statements) (Identified Cost $7,230,246) | | | 7,230,246 | |
| | | | | | | | |
| | | | | | | | |
| | | | Total Investments — 100.0%
(Identified Cost $102,340,779)(a) | | | 101,770,494 | |
| | | | Other assets less liabilities — (0.0)% | | | (5,837 | ) |
| | | | | | | | |
| | | | Net Assets — 100.0% | | $ | 101,764,657 | |
| | | | | | | | |
| | | | | | | | |
| | (†) | | | See Note 2 of Notes to Financial Statements. | | | | |
| | (a) | | | Federal Tax Information: | | | | |
| | | | At September 30, 2011, the net unrealized depreciation on investments based on a cost of $103,261,014 for federal income tax purposes was as follows: | |
| | | | Aggregate gross unrealized appreciation for all investments in which there is an excess of value over tax cost | | $ | 6,559,961 | |
| | | | Aggregate gross unrealized depreciation for all investments in which there is an excess of tax cost over value | | | (8,050,481 | ) |
| | | | | | | | |
| | | | Net unrealized depreciation | | $ | (1,490,520 | ) |
| | | | | | | | |
| | | | | | | | |
| | (b) | | | Non-income producing security. | | | | |
| | | | | | | | |
| | ADR | | | An American Depositary Receipt is a certificate issued by a custodian bank representing the right to receive securities of the foreign issuer described. The values of ADRs may be significantly influenced by trading on exchanges not located in the United States. | |
| | REITs | | | Real Estate Investment Trusts | |
See accompanying notes to financial statements.
| 46
Portfolio of Investments – as of September 30, 2011
Loomis Sayles Mid Cap Growth Fund – (continued)
Industry Summary at September 30, 2011 (Unaudited)
| | | | |
Specialty Retail | | | 7.7 | % |
Food Products | | | 7.5 | |
Biotechnology | | | 6.6 | |
Oil, Gas & Consumable Fuels | | | 5.9 | |
Semiconductors & Semiconductor Equipment | | | 5.8 | |
Hotels, Restaurants & Leisure | | | 5.6 | |
Software | | | 4.2 | |
Internet Software & Services | | | 4.1 | |
Health Care Providers & Services | | | 3.7 | |
Multiline Retail | | | 3.5 | |
Electrical Equipment | | | 3.5 | |
Textiles, Apparel & Luxury Goods | | | 3.2 | |
Pharmaceuticals | | | 3.1 | |
Commercial Services & Supplies | | | 2.3 | |
IT Services | | | 2.1 | |
Health Care Technology | | | 2.1 | |
Life Sciences Tools & Services | | | 2.1 | |
Food & Staples Retailing | | | 2.0 | |
Road & Rail | | | 2.0 | |
Other Investments, less than 2% each | | | 15.9 | |
Short-Term Investments | | | 7.1 | |
| | | | |
Total Investments | | | 100.0 | |
Other assets less liabilities | | | (0.0 | ) |
| | | | |
Net Assets | | | 100.0 | % |
| | | | |
See accompanying notes to financial statements.
47 |
Portfolio of Investments – as of September 30, 2011
Loomis Sayles Value Fund
| | | | | | | | |
| Shares | | | Description | | Value (†) | |
| | | | | | | | |
| | Common Stocks — 96.6% of Net Assets | |
| | | | Aerospace & Defense — 2.8% | | | | |
| | 309,143 | | | Honeywell International, Inc. | | $ | 13,574,469 | |
| | 317,828 | | | Northrop Grumman Corp. | | | 16,577,909 | |
| | | | | | | | |
| | | | | | | 30,152,378 | |
| | | | | | | | |
| | | | Auto Components — 1.4% | | | | |
| | 697,131 | | | Goodyear Tire & Rubber Co. (The)(b) | | | 7,034,052 | |
| | 321,744 | | | Johnson Controls, Inc. | | | 8,484,389 | |
| | | | | | | | |
| | | | | | | 15,518,441 | |
| | | | | | | | |
| | | | Automobiles — 0.8% | | | | |
| | 409,915 | | | General Motors Co.(b) | | | 8,272,085 | |
| | | | | | | | |
| | | | Beverages — 3.3% | | | | |
| | 651,759 | | | Coca-Cola Enterprises, Inc. | | | 16,215,764 | |
| | 329,309 | | | PepsiCo, Inc. | | | 20,384,227 | |
| | | | | | | | |
| | | | | | | 36,599,991 | |
| | | | | | | | |
| | | | Biotechnology — 1.4% | | | | |
| | 269,609 | | | Amgen, Inc. | | | 14,815,015 | |
| | | | | | | | |
| | | | Capital Markets — 4.4% | | | | |
| | 320,300 | | | Ameriprise Financial, Inc. | | | 12,607,008 | |
| | 495,525 | | | Bank of New York Mellon Corp. | | | 9,211,810 | |
| | 494,848 | | | Legg Mason, Inc. | | | 12,722,542 | |
| | 437,176 | | | State Street Corp. | | | 14,059,580 | |
| | | | | | | | |
| | | | | | | 48,600,940 | |
| | | | | | | | |
| | | | Chemicals — 1.2% | | | | |
| | 171,700 | | | Air Products & Chemicals, Inc. | | | 13,112,729 | |
| | | | | | | | |
| | | | Commercial Banks — 5.6% | | | | |
| | 1,190,472 | | | Fifth Third Bancorp | | | 12,023,767 | |
| | 343,999 | | | PNC Financial Services Group, Inc. | | | 16,577,312 | |
| | 563,235 | | | U.S. Bancorp | | | 13,258,552 | |
| | 803,313 | | | Wells Fargo & Co. | | | 19,375,909 | |
| | | | | | | | |
| | | | | | | 61,235,540 | |
| | | | | | | | |
| | | | Communications Equipment — 2.9% | | | | |
| | 1,780,205 | | | Alcatel-Lucent, Sponsored ADR(b) | | | 5,037,980 | |
| | 854,019 | | | Cisco Systems, Inc. | | | 13,228,754 | |
| | 328,301 | | | Motorola Solutions, Inc. | | | 13,755,812 | |
| | | | | | | | |
| | | | | | | 32,022,546 | |
| | | | | | | | |
| | | | Computers & Peripherals — 0.9% | | | | |
| | 27,315 | | | Apple, Inc.(b) | | | 10,411,932 | |
| | | | | | | | |
| | | | Construction Materials — 0.7% | | | | |
| | 276,995 | | | Vulcan Materials Co. | | | 7,633,982 | |
| | | | | | | | |
| | | | Consumer Finance — 1.5% | | | | |
| | 723,179 | | | Discover Financial Services | | | 16,589,726 | |
| | | | | | | | |
| | | | Diversified Financial Services — 4.4% | | | | |
| | 1,521,931 | | | Bank of America Corp. | | | 9,314,218 | |
See accompanying notes to financial statements.
| 48
Portfolio of Investments – as of September 30, 2011
Loomis Sayles Value Fund – (continued)
| | | | | | | | |
| Shares | | | Description | | Value (†) | |
| | | | | | | | |
| | | | Diversified Financial Services — continued | | | | |
| | 599,534 | | | Citigroup, Inc. | | $ | 15,360,061 | |
| | 786,121 | | | JPMorgan Chase & Co. | | | 23,677,964 | |
| | | | | | | | |
| | | | | | | 48,352,243 | |
| | | | | | | | |
| | | | Diversified Telecommunication Services — 3.4% | | | | |
| | 725,387 | | | AT&T, Inc. | | | 20,688,037 | |
| | 503,544 | | | CenturyLink, Inc. | | | 16,677,378 | |
| | | | | | | | |
| | | | | | | 37,365,415 | |
| | | | | | | | |
| | | | Electric Utilities — 3.2% | | | | |
| | 462,040 | | | Edison International | | | 17,673,030 | |
| | 593,773 | | | PPL Corp. | | | 16,946,281 | |
| | | | | | | | |
| | | | | | | 34,619,311 | |
| | | | | | | | |
| | | | Electrical Equipment — 1.0% | | | | |
| | 234,950 | | | Cooper Industries PLC | | | 10,835,894 | |
| | | | | | | | |
| | | | Energy Equipment & Services — 1.8% | | | | |
| | 329,957 | | | Schlumberger Ltd. | | | 19,708,332 | |
| | | | | | | | |
| | | | Food & Staples Retailing — 1.8% | | | | |
| | 572,935 | | | CVS Caremark Corp. | | | 19,239,157 | |
| | | | | | | | |
| | | | Food Products — 2.7% | | | | |
| | 307,730 | | | Kellogg Co. | | | 16,368,159 | |
| | 841,229 | | | Sara Lee Corp. | | | 13,754,094 | |
| | | | | | | | |
| | | | | | | 30,122,253 | |
| | | | | | | | |
| | | | Health Care Equipment & Supplies — 2.8% | | | | |
| | 382,477 | | | Covidien PLC | | | 16,867,236 | |
| | 399,110 | | | Medtronic, Inc. | | | 13,266,416 | |
| | | | | | | | |
| | | | | | | 30,133,652 | |
| | | | | | | | |
| | | | Health Care Providers & Services — 2.8% | | | | |
| | 465,541 | | | HCA Holdings, Inc.(b) | | | 9,385,307 | |
| | 461,375 | | | UnitedHealth Group, Inc. | | | 21,278,615 | |
| | | | | | | | |
| | | | | | | 30,663,922 | |
| | | | | | | | |
| | | | Independent Power Producers & Energy Traders — 1.4% | | | | |
| | 1,090,242 | | | Calpine Corp.(b) | | | 15,350,607 | |
| | | | | | | | |
| | | | Industrial Conglomerates — 1.8% | | | | |
| | 1,266,233 | | | General Electric Co. | | | 19,297,391 | |
| | | | | | | | |
| | | | Insurance — 3.4% | | | | |
| | 496,168 | | | MetLife, Inc. | | | 13,897,666 | |
| | 223,504 | | | Travelers Cos., Inc. (The) | | | 10,891,350 | |
| | 611,309 | | | Unum Group | | | 12,813,036 | |
| | | | | | | | |
| | | | | | | 37,602,052 | |
| | | | | | | | |
| | | | Internet & Catalog Retail — 1.2% | | | | |
| | 913,488 | | | Liberty Interactive Corp., Class A(b) | | | 13,492,218 | |
| | | | | | | | |
| | | | Internet Software & Services — 1.8% | | | | |
| | 482,041 | | | AOL, Inc.(b) | | | 5,784,492 | |
See accompanying notes to financial statements.
49 |
Portfolio of Investments – as of September 30, 2011
Loomis Sayles Value Fund – (continued)
| | | | | | | | |
| Shares | | | Description | | Value (†) | |
| | | | | | | | |
| | | | Internet Software & Services — continued | | | | |
| | 482,290 | | | eBay, Inc.(b) | | $ | 14,222,732 | |
| | | | | | | | |
| | | | | | | 20,007,224 | |
| | | | | | | | |
| | | | Machinery — 2.8% | | | | |
| | 314,250 | | | Eaton Corp. | | | 11,155,875 | |
| | 290,390 | | | Harsco Corp. | | | 5,630,662 | |
| | 273,722 | | | Stanley Black & Decker, Inc. | | | 13,439,750 | |
| | | | | | | | |
| | | | | | | 30,226,287 | |
| | | | | | | | |
| | | | Media — 6.2% | | | | |
| | 392,725 | | | CBS Corp., Class B | | | 8,003,736 | |
| | 1,109,690 | | | Comcast Corp., Class A | | | 23,192,521 | |
| | 243,523 | | | DIRECTV, Class A(b) | | | 10,288,847 | |
| | 306,199 | | | Omnicom Group, Inc. | | | 11,280,371 | |
| | 382,480 | | | Viacom, Inc., Class B | | | 14,817,275 | |
| | | | | | | | |
| | | | | | | 67,582,750 | |
| | | | | | | | |
| | | | Multi Utilities — 1.3% | | | | |
| | 424,899 | | | Public Service Enterprise Group, Inc. | | | 14,178,880 | |
| | | | | | | | |
| | | | Oil, Gas & Consumable Fuels — 10.3% | | | | |
| | 258,007 | | | Chevron Corp. | | | 23,870,808 | |
| | 194,358 | | | CONSOL Energy, Inc. | | | 6,594,567 | |
| | 1,281,734 | | | El Paso Corp. | | | 22,404,710 | |
| | 397,171 | | | ExxonMobil Corp. | | | 28,846,530 | |
| | 369,781 | | | Hess Corp. | | | 19,398,711 | |
| | 195,183 | | | SM Energy Co. | | | 11,837,849 | |
| | | | | | | | |
| | | | | | | 112,953,175 | |
| | | | | | | | |
| | | | Paper & Forest Products — 0.4% | | | | |
| | 327,177 | | | AbitibiBowater, Inc.(b) | | | 4,907,655 | |
| | | | | | | | |
| | | | Pharmaceuticals — 7.1% | | | | |
| | 515,499 | | | Bristol-Myers Squibb Co. | | | 16,176,359 | |
| | 715,057 | | | Merck & Co., Inc. | | | 23,389,514 | |
| | 1,139,394 | | | Pfizer, Inc. | | | 20,144,486 | |
| | 542,951 | | | Sanofi, Sponsored ADR | | | 17,808,793 | |
| | | | | | | | |
| | | | | | | 77,519,152 | |
| | | | | | | | |
| | | | REITs — Diversified — 1.1% | | | | |
| | 765,649 | | | Weyerhaeuser Co. | | | 11,905,842 | |
| | | | | | | | |
| | | | Road & Rail — 1.2% | | | | |
| | 224,357 | | | Norfolk Southern Corp. | | | 13,690,264 | |
| | | | | | | | |
| | | | Semiconductors & Semiconductor Equipment — 1.1% | | | | |
| | 1,157,235 | | | Applied Materials, Inc. | | | 11,977,382 | |
| | | | | | | | |
| | | | Software — 3.0% | | | | |
| | 512,099 | | | Microsoft Corp. | | | 12,746,144 | |
| | 688,618 | | | Oracle Corp. | | | 19,790,881 | |
| | | | | | | | |
| | | | | | | 32,537,025 | |
| | | | | | | | |
See accompanying notes to financial statements.
| 50
Portfolio of Investments – as of September 30, 2011
Loomis Sayles Value Fund – (continued)
| | | | | | | | |
| Shares | | | Description | | Value (†) | |
| | | | | | | | |
| | | | Wireless Telecommunication Services — 1.7% | | | | |
| | 735,456 | | | Vodafone Group PLC, Sponsored ADR | | $ | 18,864,446 | |
| | | | | | | | |
| | | | Total Common Stocks
(Identified Cost $1,111,374,391) | | | 1,058,097,834 | |
| | | | | | | | |
Principal
Amount | | | | | | |
| | Short-Term Investments — 3.6% | |
| $ | 39,386,426 | | | Tri-Party Repurchase Agreement with Fixed Income Clearing Corporation, dated 9/30/2011 at 0.000% to be repurchased at $39,386,426 on 10/03/2011 collateralized by $39,485,000 U.S. Treasury Note, 1.375% due 2/15/2013 valued at $40,175,988 including accrued interest (Note 2 of Notes to Financial Statements) (Identified Cost $39,386,426) | | | 39,386,426 | |
| | | | | | | | |
| | | | | | | | |
| | | | Total Investments — 100.2%
(Identified Cost $1,150,760,817)(a) | | | 1,097,484,260 | |
| | | | Other assets less liabilities — (0.2)% | | | (2,076,712 | ) |
| | | | | | | | |
| | | | Net Assets — 100.0% | | $ | 1,095,407,548 | |
| | | | | | | | |
| | | | | | | | |
| | (†) | | | See Note 2 of Notes to Financial Statements. | | | | |
| | (a) | | | Federal Tax Information: | | | | |
| | | | At September 30, 2011, the net unrealized depreciation on investments based on a cost of $1,155,810,305 for federal income tax purposes was as follows: | |
| | | | Aggregate gross unrealized appreciation for all investments in which there is an excess of value over tax cost | | $ | 69,231,482 | |
| | | | Aggregate gross unrealized depreciation for all investments in which there is an excess of tax cost over value | | | (127,557,527 | ) |
| | | | | | | | |
| | | | Net unrealized depreciation | | $ | (58,326,045 | ) |
| | | | | | | | |
| | | | | | | | |
| | (b) | | | Non-income producing security. | | | | |
| | | | | | | | |
| | ADR | | | An American Depositary Receipt is a certificate issued by a custodian bank representing the right to receive securities of the foreign issuer described. The values of ADRs may be significantly influenced by trading on exchanges not located in the United States. | | | | |
| | REITs | | | Real Estate Investment Trusts | | | | |
See accompanying notes to financial statements.
51 |
Portfolio of Investments – as of September 30, 2011
Loomis Sayles Value Fund – (continued)
Industry Summary at September 30, 2011 (Unaudited)
| | | | |
Oil, Gas & Consumable Fuels | | | 10.3 | % |
Pharmaceuticals | | | 7.1 | |
Media | | | 6.2 | |
Commercial Banks | | | 5.6 | |
Capital Markets | | | 4.4 | |
Diversified Financial Services | | | 4.4 | |
Insurance | | | 3.4 | |
Diversified Telecommunication Services | | | 3.4 | |
Beverages | | | 3.3 | |
Electric Utilities | | | 3.2 | |
Software | | | 3.0 | |
Communications Equipment | | | 2.9 | |
Health Care Providers & Services | | | 2.8 | |
Machinery | | | 2.8 | |
Aerospace & Defense | | | 2.8 | |
Health Care Equipment & Supplies | | | 2.8 | |
Food Products | | | 2.7 | |
Other Investments, less than 2% each | | | 25.5 | |
Short-Term Investments | | | 3.6 | |
| | | | |
Total Investments | | | 100.2 | |
Other assets less liabilities | | | (0.2 | ) |
| | | | |
Net Assets | | | 100.0 | % |
| | | | |
See accompanying notes to financial statements.
| 52
Statements of Assets and Liabilities
September 30, 2011
| | | | | | | | | | | | | | | | |
| | | Global Equity
and Income
Fund | | | Growth
Fund | | | Mid Cap
Growth
Fund | | | Value
Fund | |
ASSETS | | | | | | | | | | | | | | | | |
Investments at cost | | $ | 485,136,573 | | | $ | 105,633,027 | | | $ | 102,340,779 | | | $ | 1,150,760,817 | |
Net unrealized appreciation (depreciation) | | | (18,026,474 | ) | | | 4,127,535 | | | | (570,285 | ) | | | (53,276,557 | ) |
| | | | | | | | | | | | | | | | |
Investments at value | | | 467,110,099 | | | | 109,760,562 | | | | 101,770,494 | | | | 1,097,484,260 | |
Cash | | | 54,079 | | | | — | | | | — | | | | — | |
Foreign currency at value (identified cost $1,826,812, $0, $0 and $0) | | | 1,753,557 | | | | — | | | | — | | | | — | |
Receivable for Fund shares sold | | | 1,820,215 | | | | 12,429 | | | | 481,267 | | | | 2,039,237 | |
Receivable for securities sold | | | 15,346,809 | | | | 660,151 | | | | 7,217,600 | | | | 9,774,981 | |
Dividends and interest receivable | | | 3,098,620 | | | | 127,071 | | | | 53,385 | | | | 1,754,623 | |
Unrealized appreciation on forward foreign currency contracts (Note 2) | | | 54,484 | | | | — | | | | — | | | | — | |
Tax reclaims receivable | | | 29,772 | | | | 39,376 | | | | — | | | | 88,802 | |
| | | | | | | | | | | | | | | | |
TOTAL ASSETS | | | 489,267,635 | | | | 110,599,589 | | | | 109,522,746 | | | | 1,111,141,903 | |
| | | | | | | | | | | | | | | | |
LIABILITIES | | | | | | | | | | | | | | | | |
Payable for securities purchased | | | 13,686,992 | | | | 547,611 | | | | 7,477,775 | | | | 13,104,078 | |
Payable for Fund shares redeemed | | | 1,645,110 | | | | 41,165 | | | | 77,793 | | | | 1,678,154 | |
Unrealized depreciation on forward foreign currency contracts (Note 2) | | | 244,720 | | | | — | | | | — | | | | — | |
Management fees payable (Note 6) | | | 393,296 | | | | 46,632 | | | | 64,408 | | | | 469,952 | |
Deferred Trustees’ fees (Note 6) | | | 76,674 | | | | 110,370 | | | | 71,466 | | | | 282,473 | |
Administrative fees payable (Note 6) | | | 19,036 | | | | 4,338 | | | | 4,095 | | | | 43,703 | |
Other accounts payable and accrued expenses | | | 109,036 | | | | 84,286 | | | | 62,552 | | | | 155,995 | |
| | | | | | | | | | | | | | | | |
TOTAL LIABILITIES | | | 16,174,864 | | | | 834,402 | | | | 7,758,089 | | | | 15,734,355 | |
| | | | | | | | | | | | | | | | |
NET ASSETS | | $ | 473,092,771 | | | $ | 109,765,187 | | | $ | 101,764,657 | | | $ | 1,095,407,548 | |
| | | | | | | | | | | | | | | | |
NET ASSETS CONSIST OF: | | | | | | | | | | | | | | | | |
Paid-in capital | | $ | 540,106,351 | | | $ | 198,044,102 | | | $ | 147,919,156 | | | $ | 1,197,344,162 | |
Accumulated net investment (loss)/Undistributed net investment income | | | 5,054,497 | | | | 220,321 | | | | (71,466 | ) | | | 11,990,543 | |
Accumulated net realized loss on investments, options written and foreign currency transactions | | | (53,755,846 | ) | | | (92,626,771 | ) | | | (45,512,748 | ) | | | (60,650,600 | ) |
Net unrealized appreciation (depreciation) on investments and foreign currency translations | | | (18,312,231 | ) | | | 4,127,535 | | | | (570,285 | ) | | | (53,276,557 | ) |
| | | | | | | | | | | | | | | | |
NET ASSETS | | $ | 473,092,771 | | | $ | 109,765,187 | | | $ | 101,764,657 | | | $ | 1,095,407,548 | |
| | | | | | | | | | | | | | | | |
See accompanying notes to financial statements.
53 |
Statements of Assets and Liabilities (continued)
September 30, 2011
| | | | | | | | | | | | | | | | |
| | | Global Equity
and Income
Fund | | | Growth
Fund | | | Mid Cap
Growth
Fund | | | Value
Fund | |
COMPUTATION OF NET ASSET VALUE AND OFFERING PRICE: | | | | | | | | | | | | | | | | |
Class A shares: | | | | | | | | | | | | | | | | |
Net assets | | $ | 111,588,663 | | | $ | 26,716,076 | | | $ | 49,176,902 | | | $ | 126,788,877 | |
| | | | | | | | | | | | | | | | |
Shares of beneficial interest | | | 7,835,269 | | | | 5,094,973 | | | | 2,015,201 | | | | 7,906,387 | |
| | | | | | | | | | | | | | | | |
Net asset value and redemption price per share | | $ | 14.24 | | | $ | 5.24 | | | $ | 24.40 | | | $ | 16.04 | |
| | | | | | | | | | | | | | | | |
Offering price per share (100/94.25 of net asset value) (Note 1) | | $ | 15.11 | | | $ | 5.56 | | | $ | 25.89 | | | $ | 17.02 | |
| | | | | | | | | | | | | | | | |
Class B shares: (redemption price per share is equal to net asset value less any applicable contingent deferred sales charge) (Note 1) | | | | | | | | | | | | | | | | |
Net assets | | $ | — | | | $ | 2,609,362 | | | $ | — | | | $ | 2,036,755 | |
| | | | | | | | | | | | | | | | |
Shares of beneficial interest | | | — | | | | 528,491 | | | | — | | | | 126,895 | |
| | | | | | | | | | | | | | | | |
Net asset value and offering price per share | | $ | — | | | $ | 4.94 | | | $ | — | | | $ | 16.05 | |
| | | | | | | | | | | | | | | | |
Class C shares: (redemption price per share is equal to net asset value less any applicable contingent deferred sales charge) (Note 1) | | | | | | | | | | | | | | | | |
Net assets | | $ | 145,368,518 | | | $ | 10,262,309 | | | $ | 2,181,841 | | | $ | 8,996,197 | |
| | | | | | | | | | | | | | | | |
Shares of beneficial interest | | | 10,309,267 | | | | 2,077,661 | | | | 91,159 | | | | 567,547 | |
| | | | | | | | | | | | | | | | |
Net asset value and offering price per share | | $ | 14.10 | | | $ | 4.94 | | | $ | 23.93 | | | $ | 15.85 | |
| | | | | | | | | | | | | | | | |
Class Y shares: | | | | | | | | | | | | | | | | |
Net assets | | $ | 216,135,590 | | | $ | 70,177,440 | | | $ | 50,405,914 | | | $ | 957,584,359 | |
| | | | | | | | | | | | | | | | |
Shares of beneficial interest | | | 15,106,464 | | | | 12,615,759 | | | | 1,994,926 | | | | 59,557,965 | |
| | | | | | | | | | | | | | | | |
Net asset value, offering and redemption price per share | | $ | 14.31 | | | $ | 5.56 | | | $ | 25.27 | | | $ | 16.08 | |
| | | | | | | | | | | | | | | | |
Admin Class shares: | | | | | | | | | | | | | | | | |
Net assets | | $ | — | | | $ | — | | | $ | — | | | $ | 1,360 | |
| | | | | | | | | | | | | | | | |
Shares of beneficial interest | | | — | | | | — | | | | — | | | | 85 | |
| | | | | | | | | | | | | | | | |
Net asset value, offering and redemption price per share | | $ | — | | | $ | — | | | $ | — | | | $ | 16.00 | |
| | | | | | | | | | | | | | | | |
See accompanying notes to financial statements.
| 54
Statements of Operations
For the Year Ended September 30, 2011
| | | | | | | | | | | | | | | | |
| | | Global Equity
and Income
Fund | | | Growth
Fund | | | Mid Cap
Growth
Fund | | | Value
Fund | |
INVESTMENT INCOME | | | | | | | | | | | | | | | | |
Dividends | | $ | 4,644,498 | | | $ | 1,591,081 | | | $ | 538,989 | (a) | | $ | 25,702,697 | |
Interest | | | 7,451,701 | | | | — | | | | — | | | | — | |
Less net foreign taxes withheld | | | (328,722 | ) | | | (35,753 | ) | | | (1,674 | ) | | | (302,782 | ) |
| | | | | | | | | | | | | | | | |
| | | 11,767,477 | | | | 1,555,328 | | | | 537,315 | | | | 25,399,915 | |
| | | | | | | | | | | | | | | | |
Expenses | | | | | | | | | | | | | | | | |
Management fees (Note 6) | | | 3,346,185 | | | | 566,290 | | | | 929,737 | | | | 6,121,595 | |
Service and distribution fees (Note 6) | | | 1,664,845 | | | | 235,689 | | | | 200,416 | | | | 511,764 | |
Administrative fees (Note 6) | | | 207,132 | | | | 52,614 | | | | 57,598 | | | | 568,761 | |
Trustees’ fees and expenses (Note 6) | | | 30,800 | | | | 29,698 | | | | 25,109 | | | | 68,038 | |
Transfer agent fees and expenses (Note 6) | | | 319,431 | | | | 178,419 | | | | 136,782 | | | | 1,881,308 | |
Audit and tax services fees | | | 53,474 | | | | 42,824 | | | | 56,090 | | | | 35,555 | |
Custodian fees and expenses | | | 209,106 | | | | 16,502 | | | | 23,896 | | | | 41,499 | |
Legal fees | | | 7,246 | | | | 1,828 | | | | 2,035 | | | | 19,923 | |
Registration fees | | | 83,970 | | | | 93,629 | | | | 65,184 | | | | 106,027 | |
Shareholder reporting expenses | | | 46,457 | | | | 14,524 | | | | 10,507 | | | | 122,087 | |
Miscellaneous expenses | | | 30,048 | | | | 10,431 | | | | 18,287 | | | | 37,374 | |
| | | | | | | | | | | | | | | | |
Total expenses | | | 5,998,694 | | | | 1,242,448 | | | | 1,525,641 | | | | 9,513,931 | |
Fee/expense recovery (Note 6) | | | 85,398 | | | | — | | | | — | | | | — | |
Less waiver and/or expense reimbursement (Note 6) | | | — | | | | — | | | | (81,016 | ) | | | — | |
| | | | | | | | | | | | | | | | |
Net expenses | | | 6,084,092 | | | | 1,242,448 | | | | 1,444,625 | | | | 9,513,931 | |
| | | | | | | | | | | | | | | | |
Net investment income (loss) | | | 5,683,385 | | | | 312,880 | | | | (907,310 | ) | | | 15,885,984 | |
| | | | | | | | | | | | | | | | |
NET REALIZED AND UNREALIZED GAIN (LOSS) ON INVESTMENTS, OPTIONS WRITTEN AND FOREIGN CURRENCY TRANSACTIONS | | | | | | | | | | | | | | | | |
Net realized gain (loss) on: | | | | | | | | | | | | | | | | |
Investments | | | 42,124,625 | | | | 6,408,021 | | | | 29,787,319 | | | | 26,999,839 | |
Options written | | | — | | | | — | | | | (1,518,684 | ) | | | — | |
Foreign currency transactions | | | (8,166 | ) | | | — | | | | 6,858 | | | | — | |
Net change in unrealized appreciation (depreciation) on: | | | | | | | | | | | | | | | | |
Investments | | | (73,457,518 | ) | | | (5,147,611 | ) | | | (23,020,182 | ) | | | (91,039,296 | ) |
Options written | | | — | | | | — | | | | (111,228 | ) | | | — | |
Foreign currency translations | | | (413,415 | ) | | | — | | | | — | | | | — | |
| | | | | | | | | | | | | | | | |
Net realized and unrealized gain (loss) on investments, options written and foreign currency transactions | | | (31,754,474 | ) | | | 1,260,410 | | | | 5,144,083 | | | | (64,039,457 | ) |
| | | | | | | | | | | | | | | | |
NET INCREASE (DECREASE) IN NET ASSETS RESULTING FROM OPERATIONS | | $ | (26,071,089 | ) | | $ | 1,573,290 | | | $ | 4,236,773 | | | $ | (48,153,473 | ) |
| | | | | | | | | | | | | | | | |
| (a) | Includes a non-recurring dividend of $165,704. |
See accompanying notes to financial statements.
55 |
Statements of Changes in Net Assets
| | | | | | | | | | | | | | | | |
| | | Global Equity and Income Fund | | | Growth Fund | |
| | | Year Ended
September 30,
2011 | | | Year Ended
September 30,
2010 | | | Year Ended
September 30,
2011 | | | Year Ended
September 30,
2010 | |
FROM OPERATIONS: | | | | | | | | | | | | | | | | |
Net investment income (loss) | | $ | 5,683,385 | | | $ | 4,895,993 | | | $ | 312,880 | | | $ | (323,963 | ) |
Net realized gain on investments and foreign currency transactions | | | 42,116,459 | | | | 18,063,372 | | | | 6,408,021 | | | | 24,201,174 | |
Net change in unrealized appreciation (depreciation) on investments and foreign currency translations | | | (73,870,933 | ) | | | 28,908,742 | | | | (5,147,611 | ) | | | (9,534,757 | ) |
| | | | | | | | | | | | | | | | |
Net increase (decrease) in net assets resulting from operations | | | (26,071,089 | ) | | | 51,868,107 | | | | 1,573,290 | | | | 14,342,454 | |
| | | | | | | | | | | | | | | | |
FROM DISTRIBUTIONS TO SHAREHOLDERS: | | | | | | | | | | | | | | | | |
Net investment income | | | | | | | | | | | | | | | | |
Class A | | | (1,363,693 | ) | | | (1,152,275 | ) | | | — | | | | — | |
Class C | | | (1,202,095 | ) | | | (1,701,697 | ) | | | — | | | | — | |
Class Y | | | (3,043,709 | ) | | | (2,794,707 | ) | | | — | | | | — | |
| | | | | | | | | | | | | | | | |
Total distributions | | | (5,609,497 | ) | | | (5,648,679 | ) | | | — | | | | — | |
| | | | | | | | | | | | | | | | |
NET INCREASE (DECREASE) IN NET ASSETS FROM CAPITAL SHARE TRANSACTIONS (NOTE 11) | | | 186,170,302 | | | | 22,778,290 | | | | 8,413,669 | | | | (26,537,256 | ) |
| | | | | | | | | | | | | | | | |
Net increase (decrease) in net assets | | | 154,489,716 | | | | 68,997,718 | | | | 9,986,959 | | | | (12,194,802 | ) |
NET ASSETS | | | | | | | | | | | | | | | | |
Beginning of the year | | | 318,603,055 | | | | 249,605,337 | | | | 99,778,228 | | | | 111,973,030 | |
| | | | | | | | | | | | | | | | |
End of the year | | $ | 473,092,771 | �� | | $ | 318,603,055 | | | $ | 109,765,187 | | | $ | 99,778,228 | |
| | | | | | | | | | | | | | | | |
ACCUMULATED NET INVESTMENT (LOSS)/UNDISTRIBUTED NET INVESTMENT INCOME | | $ | 5,054,497 | | | $ | 3,780,052 | | | $ | 220,321 | | | $ | (88,874 | ) |
| | | | | | | | | | | | | | | | |
See accompanying notes to financial statements.
| 56
Statements of Changes in Net Assets (continued)
| | | | | | | | | | | | | | | | |
| | | Mid Cap Growth Fund | | | Value Fund | |
| | | Year Ended
September 30,
2011 | | | Year Ended
September 30,
2010 | | | Year Ended
September 30,
2011 | | | Year Ended
September 30,
2010 | |
FROM OPERATIONS: | | | | | | | | | | | | | | | | |
Net investment income (loss) | | $ | (907,310 | ) | | $ | (328,650 | ) | | $ | 15,885,984 | | | $ | 15,587,073 | |
Net realized gain on investments, options written and foreign currency transactions | | | 28,275,493 | | | | 14,593,740 | | | | 26,999,839 | | | | 10,776,100 | |
Net change in unrealized appreciation (depreciation) on investments, options written and foreign currency translations | | | (23,131,410 | ) | | | 7,166,808 | | | | (91,039,296 | ) | | | (6,736,757 | ) |
| | | | | | | | | | | | | | | | |
Net increase (decrease) in net assets resulting from operations | | | 4,236,773 | | | | 21,431,898 | | | | (48,153,473 | ) | | | 19,626,416 | |
| | | | | | | | | | | | | | | | |
FROM DISTRIBUTIONS TO SHAREHOLDERS: | | | | | | | | | | | | | | | | |
Net investment income | | | | | | | | | | | | | | | | |
Class A | | | — | | | | — | | | | (1,714,073 | ) | | | (1,044,591 | ) |
Class B | | | — | | | | — | | | | (8,769 | ) | | | — | |
Class C | | | — | | | | — | | | | (44,845 | ) | | | (22,715 | ) |
Class Y | | | — | | | | — | | | | (14,549,558 | ) | | | (6,810,651 | ) |
Admin Class | | | — | | | | — | | | | (11 | ) | | | — | |
| | | | | | | | | | | | | | | | |
Total distributions | | | — | | | | — | | | | (16,317,256 | ) | | | (7,877,957 | ) |
| | | | | | | | | | | | | | | | |
NET INCREASE (DECREASE) IN NET ASSETS FROM CAPITAL SHARE TRANSACTIONS (NOTE 11) | | | (3,901,540 | ) | | | (2,011,419 | ) | | | 226,492,861 | | | | 211,104,442 | |
| | | | | | | | | | | | | | | | |
Net increase in net assets | | | 335,233 | | | | 19,420,479 | | | | 162,022,132 | | | | 222,852,901 | |
NET ASSETS | | | | | | | | | | | | | | | | |
Beginning of the year | | | 101,429,424 | | | | 82,008,945 | | | | 933,385,416 | | | | 710,532,515 | |
| | | | | | | | | | | | | | | | |
End of the year | | $ | 101,764,657 | | | $ | 101,429,424 | | | $ | 1,095,407,548 | | | $ | 933,385,416 | |
| | | | | | | | | | | | | | | | |
ACCUMULATED NET INVESTMENT (LOSS)/UNDISTRIBUTED NET INVESTMENT INCOME | | $ | (71,466 | ) | | $ | (55,164 | ) | | $ | 11,990,543 | | | $ | 12,741,138 | |
| | | | | | | | | | | | | | | | |
See accompanying notes to financial statements.
57 |
This Page Intentionally Left Blank
| 58
Financial Highlights
For a share outstanding throughout each period.
| | | | | | | | | | | | | | | | | | | | | | | | | | | | |
| | | | | | Income (Loss) From Investment
Operations: | | | Less Distributions: | |
| | | Net asset
value,
beginning
of the
period | | | Net
investment
income (a) | | | Net realized
and
unrealized
gain (loss) | | | Total from
investment
operations | | | Dividends
from net
investment
income | | | Distributions
from net
realized
capital
gains (b) | | | Total
distributions | |
GLOBAL EQUITYAND INCOME FUND | | | | | | | | | | | | | | | | | | | | | |
Class A | | | | | | | | | | | | | | | | | | | | | | | | | | | | |
9/30/2011 | | $ | 14.72 | | | $ | 0.22 | | | $ | (0.45 | ) | | $ | (0.23 | ) | | $ | (0.25 | ) | | $ | — | | | $ | (0.25 | ) |
9/30/2010 | | | 12.50 | | | | 0.26 | | | | 2.26 | | | | 2.52 | | | | (0.30 | ) | | | — | | | | (0.30 | ) |
9/30/2009 | | | 11.65 | | | | 0.36 | | | | 0.74 | (i) | | | 1.10 | | | | (0.25 | ) | | | (0.00 | ) | | | (0.25 | ) |
9/30/2008 | | | 15.83 | | | | 0.25 | | | | (3.46 | ) | | | (3.21 | ) | | | (0.53 | ) | | | (0.44 | ) | | | (0.97 | ) |
9/30/2007 | | | 12.49 | | | | 0.20 | | | | 3.39 | | | | 3.59 | | | | (0.25 | ) | | | — | | | | (0.25 | ) |
Class C | | | | | | | | | | | | | | | | | | | | | | | | | | | | |
9/30/2011 | | | 14.59 | | | | 0.10 | | | | (0.44 | ) | | | (0.34 | ) | | | (0.15 | ) | | | — | | | | (0.15 | ) |
9/30/2010 | | | 12.39 | | | | 0.16 | | | | 2.26 | | | | 2.42 | | | | (0.22 | ) | | | — | | | | (0.22 | ) |
9/30/2009 | | | 11.51 | | | | 0.28 | | | | 0.75 | (i) | | | 1.03 | | | | (0.15 | ) | | | (0.00 | ) | | | (0.15 | ) |
9/30/2008 | | | 15.70 | | | | 0.15 | | | | (3.43 | ) | | | (3.28 | ) | | | (0.47 | ) | | | (0.44 | ) | | | (0.91 | ) |
9/30/2007 | | | 12.43 | | | | 0.10 | | | | 3.36 | | | | 3.46 | | | | (0.19 | ) | | | — | | | | (0.19 | ) |
Class Y | | | | | | | | | | | | | | | | | | | | | | | | | | | | |
9/30/2011 | | | 14.78 | | | | 0.26 | | | | (0.45 | ) | | | (0.19 | ) | | | (0.28 | ) | | | — | | | | (0.28 | ) |
9/30/2010 | | | 12.54 | | | | 0.29 | | | | 2.28 | | | | 2.57 | | | | (0.33 | ) | | | — | | | | (0.33 | ) |
9/30/2009 | | | 11.70 | | | | 0.38 | | | | 0.75 | (i) | | | 1.13 | | | | (0.29 | ) | | | (0.00 | ) | | | (0.29 | ) |
9/30/2008 | | | 15.87 | | | | 0.30 | | | | (3.48 | ) | | | (3.18 | ) | | | (0.55 | ) | | | (0.44 | ) | | | (0.99 | ) |
9/30/2007 | | | 12.51 | | | | 0.24 | | | | 3.39 | | | | 3.63 | | | | (0.27 | ) | | | — | | | | (0.27 | ) |
| (a) | Per share net investment income has been calculated using the average shares outstanding during the period. |
| (b) | Amount rounds to less than $0.01 per share, if applicable. |
| (c) | Effective June 2, 2008, redemption fees were eliminated. |
| (d) | Had certain expenses not been waived/reimbursed during the period, if applicable, total returns would have been lower. |
| (e) | A sales charge for Class A shares and a contingent deferred sales charge for Class C shares are not reflected in total return calculations. Periods less than one year, if applicable, are not annualized. |
See accompanying notes to financial statements.
59 |
| | | | | | | | | | | | | | | | | | | | | | | | | | | | | | |
| | | | | | | | | | | | |
Ratios to Average Net Assets: | | | | |
Redemption
fees (b)(c) | | |
Net asset
value,
end of
the period | | | Total
return
(%) (d)(e) | | | Net assets,
end of
the period
(000’s) | | | Net
expenses
(%) (f)(g) | | | Gross
expenses
(%) (g) | | | Net investment
income
(%) (g) | | | Portfolio
turnover
rate (%) | |
| | | | | | | | | | | | | | | | | | | | | | | | | | | | | | |
| | | | | | | | | | | | | | | | | | | | | | | | | | | | | | |
| $ | — | | | $ | 14.24 | | | | (1.67 | ) | | $ | 111,589 | | | | 1.24 | (h) | | | 1.24 | (h) | | | 1.41 | | | | 65 | |
| | — | | | | 14.72 | | | | 20.61 | | | | 64,367 | | | | 1.25 | | | | 1.29 | | | | 1.96 | | | | 99 | |
| | — | | | | 12.50 | | | | 10.27 | | | | 44,669 | | | | 1.25 | | | | 1.34 | | | | 3.56 | | | | 114 | |
| | 0.00 | | | | 11.65 | | | | (21.87 | ) | | | 67,647 | | | | 1.25 | | | | 1.27 | | | | 1.74 | | | | 133 | |
| | 0.00 | | | | 15.83 | | | | 29.05 | | | | 28,927 | | | | 1.25 | | | | 1.37 | | | | 1.44 | | | | 78 | |
| | | | | | | | | | | | | | | | | | | | | | | | | | | | | | |
| | — | | | | 14.10 | | | | (2.42 | ) | | | 145,369 | | | | 1.99 | (h) | | | 1.99 | (h) | | | 0.64 | | | | 65 | |
| | — | | | | 14.59 | | | | 19.79 | | | | 109,455 | | | | 2.00 | | | | 2.04 | | | | 1.21 | | | | 99 | |
| | — | | | | 12.39 | | | | 9.40 | | | | 96,208 | | | | 2.00 | | | | 2.09 | | | | 2.82 | | | | 114 | |
| | 0.00 | | | | 11.51 | | | | (22.42 | ) | | | 124,178 | | | | 2.00 | | | | 2.02 | | | | 1.04 | | | | 133 | |
| | 0.00 | | | | 15.70 | | | | 27.99 | | | | 60,179 | | | | 2.00 | | | | 2.11 | | | | 0.69 | | | | 78 | |
| | | | | | | | | | | | | | | | | | | | | | | | | | | | | | |
| | — | | | | 14.31 | | | | (1.42 | ) | | | 216,136 | | | | 0.99 | (h) | | | 0.99 | (h) | | | 1.65 | | | | 65 | |
| | — | | | | 14.78 | | | | 21.02 | | | | 144,780 | | | | 1.00 | | | | 1.04 | | | | 2.20 | | | | 99 | |
| | — | | | | 12.54 | | | | 10.49 | | | | 108,728 | | | | 1.00 | | | | 1.01 | | | | 3.79 | | | | 114 | |
| | 0.00 | | | | 11.70 | | | | (21.66 | ) | | | 120,322 | | | | 0.99 | (j) | | | 0.99 | (j) | | | 2.06 | | | | 133 | |
| | 0.00 | | | | 15.87 | | | | 29.36 | | | | 80,824 | | | | 1.00 | | | | 1.02 | | | | 1.70 | | | | 78 | |
| (f) | The investment adviser and/or administrator agreed to waive its fees and/or reimburse a portion of the Fund’s expenses during the period. Without this waiver/reimbursement, if applicable, expenses would have been higher. |
| (g) | Computed on an annualized basis for periods less than one year, if applicable. |
| (h) | Includes fee/expense recovery of 0.02%. |
| (i) | The amount shown for a share outstanding does not correspond with the aggregate realized and unrealized gain (loss) on investments for the period due to the timing of sales and redemptions of fund shares in relation to fluctuating market values of investments of the Fund. |
| (j) | Includes fee/expense recovery of less than 0.01%. |
See accompanying notes to financial statements.
| 60
Financial Highlights (continued)
For a share outstanding throughout each period.
| | | | | | | | | | | | | | | | | | | | | | | | | | | | |
| | | | | | Income (Loss) From Investment
Operations: | | | Less Distributions: | |
| | | Net asset
value,
beginning
of the
period | | | Net
investment
income
(loss) (a)(b) | | | Net realized
and
unrealized
gain (loss) | | | Total from
investment
operations | | | Dividends
from net
investment
income | | | Distributions
from net
realized
capital
gains | | | Total
distributions | |
GROWTH FUND | | | | | | | | | | | | | | | | | | | | | |
Class A | | | | | | | | | | | | | | | | | | | | | | | | | | | | |
9/30/2011 | | $ | 5.14 | | | $ | 0.01 | | | $ | 0.09 | | | $ | 0.10 | | | $ | — | | | $ | — | | | $ | — | |
9/30/2010 | | | 4.48 | | | | (0.01 | ) | | | 0.67 | | | | 0.66 | | | | — | | | | — | | | | — | |
9/30/2009 | | | 4.99 | | | | (0.01 | ) | | | (0.50 | ) | | | (0.51 | ) | | | — | | | | — | | | | — | |
9/30/2008 | | | 7.01 | | | | (0.02 | ) | | | (2.00 | ) | | | (2.02 | ) | | | — | | | | — | | | | — | |
9/30/2007 | | | 5.84 | | | | (0.03 | ) | | | 1.20 | | | | 1.17 | | | | — | | | | — | | | | — | |
Class B | | | | | | | | | | | | | | | | | | | | | | | | | | | | |
9/30/2011 | | | 4.87 | | | | (0.03 | ) | | | 0.10 | | | | 0.07 | | | | — | | | | — | | | | — | |
9/30/2010 | | | 4.28 | | | | (0.05 | ) | | | 0.64 | | | | 0.59 | | | | — | | | | — | | | | — | |
9/30/2009 | | | 4.81 | | | | (0.04 | ) | | | (0.49 | ) | | | (0.53 | ) | | | — | | | | — | | | | — | |
9/30/2008 | | | 6.79 | | | | (0.07 | ) | | | (1.91 | ) | | | (1.98 | ) | | | — | | | | — | | | | — | |
9/30/2007 | | | 5.70 | | | | (0.07 | ) | | | 1.16 | | | | 1.09 | | | | — | | | | — | | | | — | |
Class C | | | | | | | | | | | | | | | | | | | | | | | | | | | | |
9/30/2011 | | | 4.87 | | | | (0.03 | ) | | | 0.10 | | | | 0.07 | | | | — | | | | — | | | | — | |
9/30/2010 | | | 4.28 | | | | (0.05 | ) | | | 0.64 | | | | 0.59 | | | | — | | | | — | | | | — | |
9/30/2009 | | | 4.81 | | | | (0.04 | ) | | | (0.49 | ) | | | (0.53 | ) | | | — | | | | — | | | | — | |
9/30/2008 | | | 6.80 | | | | (0.07 | ) | | | (1.92 | ) | | | (1.99 | ) | | | — | | | | — | | | | — | |
9/30/2007 | | | 5.71 | | | | (0.08 | ) | | | 1.17 | | | | 1.09 | | | | — | | | | — | | | | — | |
Class Y | | | | | | | | | | | | | | | | | | | | | | | | | | | | |
9/30/2011 | | | 5.43 | | | | 0.03 | | | | 0.10 | | | | 0.13 | | | | — | | | | — | | | | — | |
9/30/2010 | | | 4.73 | | | | (0.00 | ) | | | 0.70 | | | | 0.70 | | | | — | | | | — | | | | — | |
9/30/2009 | | | 5.24 | | | | 0.01 | | | | (0.52 | ) | | | (0.51 | ) | | | — | | | | — | | | | — | |
9/30/2008 | | | 7.32 | | | | 0.01 | | | | (2.09 | ) | | | (2.08 | ) | | | — | | | | — | | | | — | |
9/30/2007 | | | 6.08 | | | | (0.00 | ) | | | 1.24 | | | | 1.24 | | | | — | | | | — | | | | — | |
| (a) | Per share net investment income (loss) has been calculated using the average shares outstanding during the period. |
| (b) | Amount rounds to less than $0.01 per share, if applicable. |
| (c) | Had certain expenses not been waived/reimbursed during the period, if applicable, total returns would have been lower. |
| (d) | A sales charge for Class A shares and a contingent deferred sales charge for Class B and Class C shares are not reflected in total return calculations. Periods less than one year, if applicable, are not annualized. |
See accompanying notes to financial statements.
61 |
| | | | | | | | | | | | | | | | | | | | | | | | | | |
| | | | | | | | | |
Ratios to Average Net Assets: | | | | |
Net asset
value,
end of
the period | | | Total
return
(%) (c)(d) | | | Net assets,
end of
the period
(000’s) | | | Net
expenses
(%) (e)(f) | | | Gross
expenses
(%) (f) | | | Net investment
income
(loss)
(%) (f) | | | Portfolio
turnover
rate (%) | |
| | | | | | | | | | | | | | | | | | | | | | | | | | |
| | | | | | | | | | | | | | | | | | | | | | | | | | |
| $ | 5.24 | | | | 1.95 | | | $ | 26,716 | | | | 1.14 | | | | 1.14 | | | | 0.23 | | | | 16 | |
| | 5.14 | | | | 14.73 | | | | 29,901 | | | | 1.19 | | | | 1.20 | | | | (0.30 | ) | | | 163 | |
| | 4.48 | | | | (10.40 | ) | | | 33,207 | | | | 1.25 | | | | 1.31 | | | | (0.25 | ) | | | 191 | |
| | 4.99 | | | | (28.67 | ) | | | 156,841 | | | | 1.10 | | | | 1.10 | | | | (0.33 | ) | | | 179 | |
| | 7.01 | | | | 20.03 | | | | 228,629 | | | | 1.14 | (g) | | | 1.14 | (g) | | | (0.49 | ) | | | 134 | |
| | | | | | | | | | | | | | | | | | | | | | | | | | |
| | 4.94 | | | | 1.44 | | | | 2,609 | | | | 1.89 | | | | 1.89 | | | | (0.54 | ) | | | 16 | |
| | 4.87 | | | | 13.79 | | | | 4,086 | | | | 1.93 | | | | 1.95 | | | | (1.06 | ) | | | 163 | |
| | 4.28 | | | | (11.02 | ) | | | 5,397 | | | | 2.00 | | | | 2.12 | | | | (1.06 | ) | | | 191 | |
| | 4.81 | | | | (29.16 | ) | | | 9,553 | | | | 1.85 | | | | 1.85 | | | | (1.05 | ) | | | 179 | |
| | 6.79 | | | | 19.12 | | | | 28,258 | | | | 1.85 | (g) | | | 1.85 | (g) | | | (1.20 | ) | | | 134 | |
| | | | | | | | | | | | | | | | | | | | | | | | | | |
| | 4.94 | | | | 1.44 | | | | 10,262 | | | | 1.89 | | | | 1.89 | | | | (0.53 | ) | | | 16 | |
| | 4.87 | | | | 13.79 | | | | 12,493 | | | | 1.93 | | | | 1.95 | | | | (1.06 | ) | | | 163 | |
| | 4.28 | | | | (11.02 | ) | | | 16,336 | | | | 2.00 | | | | 2.12 | | | | (1.06 | ) | | | 191 | |
| | 4.81 | | | | (29.26 | ) | | | 27,743 | | | | 1.85 | | | | 1.85 | | | | (1.08 | ) | | | 179 | |
| | 6.80 | | | | 19.09 | | | | 39,157 | | | | 1.88 | | | | 1.88 | | | | (1.23 | ) | | | 134 | |
| | | | | | | | | | | | | | | | | | | | | | | | | | |
| | 5.56 | | | | 2.21 | | | | 70,177 | | | | 0.89 | | | | 0.89 | | | | 0.49 | | | | 16 | |
| | 5.43 | | | | 15.01 | | | | 53,299 | | | | 0.93 | (h) | | | 0.95 | | | | (0.05 | ) | | | 163 | |
| | 4.73 | | | | (9.73 | ) | | | 57,033 | | | | 0.75 | | | | 0.75 | | | | 0.18 | | | | 191 | |
| | 5.24 | | | | (28.42 | ) | | | 75,389 | | | | 0.66 | | | | 0.66 | | | | 0.11 | | | | 179 | |
| | 7.32 | | | | 20.39 | | | | 124,663 | | | | 0.67 | | | | 0.67 | | | | (0.02 | ) | | | 134 | |
| (e) | The investment adviser and/or administrator agreed to waive its fees and/or reimburse a portion of the Fund’s expenses during the period. Without this waiver/reimbursement, if applicable, expenses would have been higher. |
| (f) | Computed on an annualized basis for periods less than one year, if applicable. |
| (g) | Includes fee/expense recovery of less than 0.01% and 0.08% for Class A and Class B shares, respectively. |
| (h) | Effective February 1, 2010, the expense limit increased to 1.00% for Class Y shares. |
See accompanying notes to financial statements.
| 62
Financial Highlights (continued)
For a share outstanding throughout each period.
| | | | | | | | | | | | | | | | | | | | | | | | | | | | |
| | | | | | Income (Loss) From Investment
Operations: | | | Less Distributions: | |
| | | Net asset
value,
beginning
of the
period | | | Net
investment
loss (a) | | | Net realized
and
unrealized
gain (loss) | | | Total from
investment
operations | | | Dividends
from net
investment
income | | | Distributions
from net
realized
capital
gains | | | Total
distributions | |
MID CAP GROWTH FUND | | | | | | | | | | | | | | | | | | | | | |
Class A* | | | | | | | | | | | | | | | | | | | | | | | | | | | | |
9/30/2011 | | $ | 23.76 | | | $ | (0.23 | )(f) | | $ | 0.87 | | | $ | 0.64 | | | $ | — | | | $ | — | | | $ | — | |
9/30/2010 | | | 18.29 | | | | (0.09 | )(g) | | | 5.56 | | | | 5.47 | | | | — | | | | — | | | | — | |
9/30/2009 | | | 21.12 | | | | (0.07 | )(h) | | | (2.76 | ) | | | (2.83 | ) | | | — | | | | — | | | | — | |
9/30/2008 | | | 26.84 | | | | (0.15 | ) | | | (5.57 | ) | | | (5.72 | ) | | | — | | | | — | | | | — | |
9/30/2007 | | | 19.69 | | | | (0.16 | )(i) | | | 7.31 | | | | 7.15 | | | | — | | | | — | | | | — | |
Class C | | | | | | | | | | | | | | | | | | | | | | | | | | | | |
9/30/2011 | | | 23.47 | | | | (0.45 | )(f) | | | 0.91 | | | | 0.46 | | | | — | | | | — | | | | — | |
9/30/2010 | | | 18.20 | | | | (0.18 | )(g) | | | 5.45 | | | | 5.27 | | | | — | | | | — | | | | — | |
9/30/2009** | | | 15.13 | | | | (0.16 | ) | | | 3.23 | | | | 3.07 | | | | — | | | | — | | | | — | |
Class Y* | | | | | | | | | | | | | | | | | | | | | | | | | | | | |
9/30/2011 | | | 24.53 | | | | (0.17 | )(f) | | | 0.91 | | | | 0.74 | | | | — | | | | — | | | | — | |
9/30/2010 | | | 18.84 | | | | (0.07 | )(g) | | | 5.76 | | | | 5.69 | | | | — | | | | — | | | | — | |
9/30/2009 | | | 21.70 | | | | (0.05 | )(h) | | | (2.81 | ) | | | (2.86 | ) | | | — | | | | — | | | | — | |
9/30/2008 | | | 27.51 | | | | (0.10 | ) | | | (5.71 | ) | | | (5.81 | ) | | | — | | | | — | | | | — | |
9/30/2007 | | | 20.13 | | | | (0.11 | )(i) | | | 7.49 | | | | 7.38 | | | | — | | | | — | | | | — | |
| * | Prior to the close of business on February 2, 2009, the Fund offered Retail and Institutional Class shares, which were redesignated as Class A and Class Y shares, respectively, on that date. |
| ** | From commencement of Class operations on February 2, 2009 through September 30, 2009. |
| (a) | Per share net investment loss has been calculated using the average shares outstanding during the period. |
| (b) | Had certain expenses not been waived/reimbursed during the period, if applicable, total returns would have been lower. |
| (c) | A sales charge for Class A shares and a contingent deferred sales charge for Class B and Class C shares are not reflected in total return calculations. Periods less than one year, if applicable, are not annualized. |
| (d) | The investment adviser and/or administrator agreed to waive its fees and/or reimburse a portion of the Fund’s expenses during the period. Without this waiver/reimbursement, if applicable, expenses would have been higher. |
| (e) | Computed on an annualized basis for periods less than one year, if applicable. |
See accompanying notes to financial statements.
63 |
| | | | | | | | | | | | | | | | | | | | | | | | | | |
| | | | | | | | | |
Ratios to Average Net Assets: | | | | |
| | | | | | |
Net asset
value,
end of
the period | | | Total
return
(%) (b)(c) | | | Net assets,
end of
the period
(000’s) | | | Net
expenses
(%) (d)(e) | | | Gross
expenses
(%) (e) | | | Net investment
loss
(%) (e) | | | Portfolio
turnover
rate (%) | |
| | | | | | | | | | | | | | | | | | | | | | | | | | |
| | | | | | | | | | | | | | | | | | | | | | | | | | |
| $ | 24.40 | | | | 2.65 | (f) | | $ | 49,177 | | | | 1.25 | (j) | | | 1.32 | | | | (0.81 | )(f) | | | 204 | |
| | 23.76 | | | | 29.91 | | | | 67,639 | | | | 1.25 | | | | 1.46 | | | | (0.45 | )(g) | | | 191 | |
| | 18.29 | | | | (13.44 | ) | | | 54,951 | | | | 1.25 | | | | 1.52 | | | | (0.45 | )(h) | | | 292 | |
| | 21.12 | | | | (21.27 | ) | | | 120,524 | | | | 1.25 | | | | 1.32 | | | | (0.58 | ) | | | 299 | |
| | 26.84 | | | | 36.31 | | | | 30,654 | | | | 1.25 | | | | 1.43 | | | | (0.71 | ) | | | 194 | |
| | | | | | | | | | | | | | | | | | | | | | | | | | |
| | 23.93 | | | | 1.96 | (f) | | | 2,182 | | | | 2.01 | (j) | | | 2.08 | | | | (1.63 | )(f) | | | 204 | |
| | 23.47 | | | | 28.96 | | | | 34 | | | | 2.00 | | | | 2.24 | | | | (0.89 | )(g) | | | 191 | |
| | 18.20 | | | | 20.29 | | | | 1 | | | | 2.00 | | | | 2.24 | | | | (1.54 | ) | | | 292 | |
| | | | | | | | | | | | | | | | | | | | | | | | | | |
| | 25.27 | | | | 2.98 | (f) | | | 50,406 | | | | 1.00 | (j) | | | 1.07 | | | | (0.58 | )(f) | | | 204 | |
| | 24.53 | | | | 30.20 | | | | 33,757 | | | | 1.00 | | | | 1.22 | | | | (0.34 | )(g) | | | 191 | |
| | 18.84 | | | | (13.18 | ) | | | 27,057 | | | | 1.00 | | | | 1.12 | | | | (0.27 | )(h) | | | 292 | |
| | 21.70 | | | | (21.12 | ) | | | 25,779 | | | | 1.00 | (k) | | | 1.00 | (k) | | | (0.36 | ) | | | 299 | |
| | 27.51 | | | | 36.66 | | | | 24,143 | | | | 1.00 | | | | 1.10 | | | | (0.47 | ) | | | 194 | |
| (f) | Includes a non-recurring dividend. Without this dividend, net investment loss per share would have been $(0.27), $(0.47) and $(0.20) for Class A, Class C and Class Y shares, respectively, total return would have been 2.53%, 1.79% and 2.81% for Class A, Class C and Class Y shares, respectively, and the ratio of net investment loss to average net assets would have been (0.96)%, (1.68)% and (0.70)% for Class A, Class C and Class Y shares, respectively. |
| (g) | Includes a non-recurring dividend. Without this dividend, net investment loss per share would have been $(0.21), $(0.36) and $(0.16) for Class A, Class C and Class Y shares, respectively, and the ratio of net investment loss to average net assets would have been (1.02)%, (1.74)% and (0.76)% for Class A, Class C and Class Y shares, respectively. |
| (h) | Includes a non-recurring dividend of $0.03 per share. Without this dividend, net investment loss per share would have been $(0.10) and $(0.08) for Class A and Class Y shares, respectively, and the ratio of net investment loss to average net assets would have been (0.63)% and (0.46)% for Class A and Class Y shares, respectively. |
| (i) | Includes a non-recurring dividend of $0.02 per share. |
| (j) | Includes interest expense from bank overdraft charges of 0.01% for Class C and less than 0.01% for Classes A and Y. Without this expense the ratio of net expenses for Class C would have been 2.00%. |
| (k) | Includes fee/expense recovery of less than 0.01%. |
See accompanying notes to financial statements.
| 64
Financial Highlights (continued)
For a share outstanding throughout each period.
| | | | | | | | | | | | | | | | | | | | | | | | | | | | |
| | | | | | Income (Loss) From Investment
Operations: | | | Less Distributions: | |
| | | Net asset
value,
beginning
of the
period | | | Net
investment
income (a)(b) | | | Net realized
and
unrealized
gain (loss) | | | Total from
investment
operations | | | Dividends
from net
investment
income | | | Distributions
from net
realized
capital
gains | | | Total
distributions | |
VALUE FUND | | | | | | | | | | | | | | | | | | | | | |
Class A* | | | | | | | | | | | | | | | | | | | | | | | | | | | | |
9/30/2011 | | $ | 16.78 | | | $ | 0.20 | | | $ | (0.72 | ) | | $ | (0.52 | ) | | $ | (0.22 | ) | | $ | — | | | $ | (0.22 | ) |
9/30/2010 | | | 16.42 | | | | 0.27 | (g) | | | 0.23 | | | | 0.50 | | | | (0.14 | ) | | | — | | | | (0.14 | ) |
9/30/2009 | | | 17.93 | | | | 0.23 | | | | (1.53 | ) | | | (1.30 | ) | | | (0.21 | ) | | | — | | | | (0.21 | ) |
9/30/2008 | | | 23.46 | | | | 0.25 | | | | (4.45 | ) | | | (4.20 | ) | | | (0.18 | ) | | | (1.15 | ) | | | (1.33 | ) |
9/30/2007 | | | 21.04 | | | | 0.19 | | | | 3.27 | | | | 3.46 | | | | (0.13 | ) | | | (0.91 | ) | | | (1.04 | ) |
Class B | | | | | | | | | | | | | | | | | | | | | | | | | | | | |
9/30/2011 | | | 16.77 | | | | 0.06 | | | | (0.73 | ) | | | (0.67 | ) | | | (0.05 | ) | | | — | | | | (0.05 | ) |
9/30/2010 | | | 16.40 | | | | 0.12 | (g) | | | 0.25 | | | | 0.37 | | | | — | | | | — | | | | — | |
9/30/2009 | | | 17.80 | | | | 0.14 | | | | (1.51 | ) | | | (1.37 | ) | | | (0.03 | ) | | | — | | | | (0.03 | ) |
9/30/2008 | | | 23.46 | | | | 0.10 | | | | (4.45 | ) | | | (4.35 | ) | | | (0.16 | ) | | | (1.15 | ) | | | (1.31 | ) |
9/30/2007** | | | 24.00 | | | | 0.00 | | | | (0.54 | ) | | | (0.54 | ) | | | — | | | | — | | | | — | |
Class C | | | | | | | | | | | | | | | | | | | | | | | | | | | | |
9/30/2011 | | | 16.58 | | | | 0.06 | | | | (0.71 | ) | | | (0.65 | ) | | | (0.08 | ) | | | — | | | | (0.08 | ) |
9/30/2010 | | | 16.26 | | | | 0.14 | (g) | | | 0.22 | | | | 0.36 | | | | (0.04 | ) | | | — | | | | (0.04 | ) |
9/30/2009 | | | 17.79 | | | | 0.12 | | | | (1.51 | ) | | | (1.39 | ) | | | (0.14 | ) | | | — | | | | (0.14 | ) |
9/30/2008 | | | 23.46 | | | | 0.09 | | | | (4.43 | ) | | | (4.34 | ) | | | (0.18 | ) | | | (1.15 | ) | | | (1.33 | ) |
9/30/2007** | | | 24.00 | | | | 0.01 | | | | (0.55 | ) | | | (0.54 | ) | | | — | | | | — | | | | — | |
Class Y* | | | | | | | | | | | | | | | | | | | | | | | | | | | | |
9/30/2011 | | | 16.82 | | | | 0.25 | | | | (0.73 | ) | | | (0.48 | ) | | | (0.26 | ) | | | — | | | | (0.26 | ) |
9/30/2010 | | | 16.47 | | | | 0.31 | (g) | | | 0.23 | | | | 0.54 | | | | (0.19 | ) | | | — | | | | (0.19 | ) |
9/30/2009 | | | 18.01 | | | | 0.28 | | | | (1.54 | ) | | | (1.26 | ) | | | (0.28 | ) | | | — | | | | (0.28 | ) |
9/30/2008 | | | 23.54 | | | | 0.32 | | | | (4.45 | ) | | | (4.13 | ) | | | (0.25 | ) | | | (1.15 | ) | | | (1.40 | ) |
9/30/2007 | | | 21.05 | | | | 0.27 | | | | 3.27 | | | | 3.54 | | | | (0.14 | ) | | | (0.91 | ) | | | (1.05 | ) |
Admin Class | | | | | | | | | | | | | | | | | | | | | | | | | |
9/30/2011 | | | 16.74 | | | | 0.17 | | | | (0.73 | ) | | | (0.56 | ) | | | (0.18 | ) | | | — | | | | (0.18 | ) |
9/30/2010*** | | | 16.72 | | | | 0.18 | (g) | | | (0.16 | ) | | | 0.02 | | | | — | | | | — | | | | — | |
| * | Prior to the close of business on June 1, 2007, the Fund offered Retail and Institutional Class shares, which were redesignated as Class A and Class Y shares, respectively, on that date. |
| ** | From commencement of Class operations on June 1, 2007, through September 30, 2007. |
| *** | From commencement of Class operations on February 1, 2010 through September 30, 2010. |
| (a) | Per share net investment income has been calculated using the average shares outstanding during the period. |
| (b) | Amount rounds to less than $0.01 per share, if applicable. |
| (c) | Had certain expenses not been waived/reimbursed during the period, if applicable, total returns would have been lower. |
| (d) | A sales charge for Class A shares and a contingent deferred sales charge for Class B and Class C shares are not reflected in total return calculations. Periods less than one year, if applicable, are not annualized. |
See accompanying notes to financial statements.
65 |
| | | | | | | | | | | | | | | | | | | | | | | | | | |
| | | | | | | | | |
Ratios to Average Net Assets: | | | | |
Net asset
value,
end of
the period | | | Total
return
(%) (c)(d) | | | Net assets,
end of
the period
(000’s) | | | Net
expenses
(%) (e)(f) | | | Gross
expenses
(%) (f) | | | Net investment
income
(%) (f) | | | Portfolio
turnover
rate (%) | |
| | | | | | | | | | | | | | | | | | | | | | | | | | |
| | | | | | | | | | | | | | | | | | | | | | | | | | |
| $ | 16.04 | | | | (3.28 | ) | | $ | 126,789 | | | | 0.98 | | | | 0.98 | | | | 1.09 | | | | 29 | |
| | 16.78 | | | | 3.03 | | | | 130,922 | | | | 0.96 | | | | 0.96 | | | | 1.58 | (g) | | | 54 | |
| | 16.42 | | | | (6.97 | ) | | | 120,915 | | | | 1.06 | | | | 1.06 | | | | 1.67 | | | | 47 | |
| | 17.93 | | | | (19.01 | ) | | | 112,274 | | | | 1.05 | | | | 1.05 | | | | 1.24 | | | | 36 | (h) |
| | 23.46 | | | | 16.85 | | | | 17,500 | | | | 1.09 | (i) | | | 1.09 | (i) | | | 0.79 | | | | 41 | |
| | | | | | | | | | | | | | | | | | | | | | | | | | |
| | 16.05 | | | | (4.05 | ) | | | 2,037 | | | | 1.73 | | | | 1.73 | | | | 0.32 | | | | 29 | |
| | 16.77 | | | | 2.26 | | | | 3,299 | | | | 1.70 | | | | 1.70 | | | | 0.72 | (g) | | | 54 | |
| | 16.40 | | | | (7.62 | ) | | | 5,167 | | | | 1.81 | | | | 1.81 | | | | 1.03 | | | | 47 | |
| | 17.80 | | | | (19.65 | ) | | | 8,385 | | | | 1.80 | (j) | | | 1.80 | (j) | | | 0.51 | | | | 36 | (h) |
| | 23.46 | | | | (2.25 | ) | | | 108 | | | | 1.85 | | | | 1.89 | | | | 0.03 | | | | 41 | |
| | | | | | | | | | | | | | | | | | | | | | | | | | |
| | 15.85 | | | | (4.00 | ) | | | 8,996 | | | | 1.73 | | | | 1.73 | | | | 0.33 | | | | 29 | |
| | 16.58 | | | | 2.20 | | | | 10,226 | | | | 1.71 | | | | 1.71 | | | | 0.81 | (g) | | | 54 | |
| | 16.26 | | | | (7.60 | ) | | | 10,011 | | | | 1.81 | | | | 1.81 | | | | 0.89 | | | | 47 | |
| | 17.79 | | | | (19.62 | ) | | | 6,483 | | | | 1.80 | (j) | | | 1.80 | (j) | | | 0.46 | | | | 36 | (h) |
| | 23.46 | | | | (2.25 | ) | | | 1,390 | | | | 1.85 | | | | 1.94 | | | | 0.10 | | | | 41 | |
| | | | | | | | | | | | | | | | | | | | | | | | | | |
| | 16.08 | | | | (3.05 | ) | | | 957,584 | | | | 0.74 | | | | 0.74 | | | | 1.34 | | | | 29 | |
| | 16.82 | | | | 3.28 | | | | 788,937 | | | | 0.71 | | | | 0.71 | | | | 1.86 | (g) | | | 54 | |
| | 16.47 | | | | (6.66 | ) | | | 574,439 | | | | 0.66 | | | | 0.66 | | | | 1.97 | | | | 47 | |
| | 18.01 | | | | (18.67 | ) | | | 303,182 | | | | 0.65 | | | | 0.66 | | | | 1.58 | | | | 36 | (h) |
| | 23.54 | | | | 17.25 | | | | 182,002 | | | | 0.72 | (i) | | | 0.72 | (i) | | | 1.19 | | | | 41 | |
| | | | | | | | | | | | | | | | | | | | | | | | | | |
| | 16.00 | | | | (3.48 | ) | | | 1 | | | | 1.17 | | | | 1.17 | | | | 0.90 | | | | 29 | |
| | 16.74 | | | | 0.12 | | | | 1 | | | | 1.29 | | | | 1.29 | | | | 1.59 | (g) | | | 54 | |
| (e) | The investment adviser and/or administrator agreed to waive its fees and/or reimburse a portion of the Fund’s expenses during the period. Without this waiver/reimbursement, if applicable, expenses would have been higher. |
| (f) | Computed on an annualized basis for periods less than one year, if applicable. |
| (g) | Includes a non-recurring dividend. Without this dividend, net investment income per share would have been $0.14, $0.02, $0.01, $0.18 and $0.05 for Class A, Class B, Class C, Class Y and Admin Class shares, respectively, and the ratio of net investment income to average net assets would have been 0.84%, 0.10%, 0.09%, 1.08% and 0.50% for Class A, Class B, Class C, Class Y and Admin Class shares, respectively. |
| (h) | Portfolio turnover excludes the impact of assets resulting from a merger with another fund. |
| (i) | Includes fee/expense recovery of 0.02% and 0.01% for Class A and Class Y shares, respectively. |
| (j) | Includes fee/expense recovery of less than 0.01% for Class B and Class C shares. |
See accompanying notes to financial statements.
| 66
Notes to Financial Statements
September 30, 2011
1. Organization. Loomis Sayles Funds II (the “Trust”) is organized as a Massachusetts business trust. The Trust is registered under the Investment Company Act of 1940, as amended (the “1940 Act”), as an open-end management investment company. The Declaration of Trust permits the Board of Trustees to authorize the issuance of an unlimited number of shares of the Trust in multiple series. The financial statements for certain funds of the Trust are presented in separate reports. The following funds (individually, a “Fund” and collectively, the “Funds”) are included in this report:
Loomis Sayles Global Equity and Income Fund (the “Global Equity and Income Fund”)
Loomis Sayles Growth Fund (the “Growth Fund”)
Loomis Sayles Mid Cap Growth Fund (the “Mid Cap Growth Fund”)
Loomis Sayles Value Fund (the “Value Fund”)
Each Fund is a diversified investment company.
Each Fund offers Class A, Class C and Class Y shares. In addition, Value Fund offers Admin Class shares. Effective October 12, 2007, Class B shares are no longer offered. Existing Class B shareholders of Growth Fund and Value Fund may continue to reinvest dividends into Class B shares and exchange their Class B shares for Class B shares of other Natixis Funds subject to existing exchange privileges as described in the prospectus.
Class A shares are sold with a maximum front-end sales charge of 5.75%. Class B shares do not pay a front-end sales charge; however, they are charged higher Rule 12b-1 fees, and are subject to a contingent deferred sales charge (“CDSC”) if such shares are redeemed within six years of purchase. After eight years of ownership, Class B shares convert to Class A shares. Class C shares do not pay a front-end sales charge, do not convert to any other class of shares, pay higher Rule 12b-1 fees than Class A shares and may be subject to a CDSC of 1.00% if those shares are redeemed within one year of acquisition, except for reinvested distributions. Class Y shares do not pay a front-end sales charge, a CDSC or Rule 12b-1 fees. Class Y shares are generally intended for institutional investors with a minimum initial investment of $100,000, though some categories of investors are exempted from the minimum investment amount as outlined in the Funds’ prospectus. Admin Class shares do not pay a front-end sales charge or a CDSC, but do pay a Rule 12b-1 fee. Admin Class shares are offered exclusively through intermediaries.
Most expenses of the Trust can be directly attributed to a Fund. Expenses which can not be directly attributed to a Fund are generally apportioned based on the relative net assets of each of the Funds in the Trust. Expenses of a Fund are borne pro rata by the holders of each class of shares, except that each class bears expenses unique to that class (including the Rule 12b-1 service and distribution fees). In addition, each class votes as a class only with respect to its own Rule 12b-1 Plan. Shares of each class would receive their pro rata share of the net assets of a Fund if the Fund were
67 |
Notes to Financial Statements (continued)
September 30, 2011
liquidated. The Trustees approve separate distributions from net investment income on each class of shares.
2. Significant Accounting Policies. The following is a summary of significant accounting policies consistently followed by each Fund in the preparation of its financial statements. The Funds’ financial statements are prepared in accordance with accounting principles generally accepted in the United States of America which require the use of management estimates that affect the reported amounts and disclosures in the financial statements. Actual results could differ from those estimates. Management has evaluated the events and transactions subsequent to year-end through the date the financial statements were issued and has determined that there were no material events that would require disclosure in the Funds’ financial statements.
a. Valuation. Equity securities, including shares of closed-end investment companies and exchange-traded funds, for which market quotations are readily available are valued at market value, as reported by pricing services recommended by the investment adviser and approved by the Board of Trustees. Such pricing services generally use the security’s last sale price on the exchange or market where the security is primarily traded or, if there is no reported sale during the day, the closing bid price. Securities traded on the NASDAQ Global Select Market, NASDAQ Global Market and NASDAQ Capital Market are valued at the NASDAQ Official Closing Price (“NOCP”), or if lacking a NOCP, at the most recent bid quotation on the applicable NASDAQ Market. Debt securities (other than short-term obligations purchased with an original or remaining maturity of sixty days or less) and unlisted equity securities are generally valued on the basis of evaluated bids furnished to the Funds by a pricing service recommended by the investment adviser and approved by the Board of Trustees, which service determines valuations for normal, institutional-size trading units of such securities using market information, transactions for comparable securities and various relationships between securities which are generally recognized by institutional traders. Senior loans shall be priced at bid prices supplied by a pricing service, if available. Broker-dealer bid quotations may also be used to value debt and equity securities where a pricing service does not price a security or where a pricing service does not provide a reliable price for the security. In instances where broker-dealer bid quotations are not available, certain securities held by the Funds may be valued on the basis of a price provided by a principal market maker. Forward foreign currency contracts are valued utilizing interpolated prices determined from information provided by an independent pricing service. Domestic exchange-traded single equity option contracts are valued at the mean of the National Best Bid and Offer quotations. Investments in other open-end investment companies are valued at their net asset value each day. Short-term obligations purchased with an original or remaining maturity of sixty days or less are valued at amortized cost, which approximates market value. Securities for which market quotations are not readily available are valued at fair value
| 68
Notes to Financial Statements (continued)
September 30, 2011
as determined in good faith by the Funds’ investment adviser using consistently applied procedures under the general supervision of the Board of Trustees.
The Funds may hold securities traded in foreign markets. Foreign securities are valued at the market price in the foreign market. However, if events occurring after the close of the foreign market (but before the close of regular trading on the New York Stock Exchange) are believed to materially affect the value of those securities, such securities are fair valued pursuant to procedures approved by the Board of Trustees. When fair valuing securities, the Funds may, among other things, use modeling tools or other processes that may take into account factors such as securities market activity and/or significant events that occur after the close of the foreign market and before the Funds calculate their net asset values. As of September 30, 2011, approximately 20% of the market value of Global Equity and Income Fund’s investments was fair valued pursuant to procedures approved by the Board of Trustees.
b. Investment Transactions and Related Investment Income. Investment transactions are accounted for on a trade date plus one basis for daily net asset value calculation. However, for financial reporting purposes, investment transactions are reported on trade date. Dividend income is recorded on ex-dividend date, or in the case of certain foreign securities, as soon as a Fund is notified, and interest income is recorded on an accrual basis. Interest income is increased by the accretion of discount and decreased by the amortization of premium. Periodic principal adjustments for inflation-protected securities are recorded to interest income. Investment income is recorded net of foreign taxes withheld when applicable. In determining net gain or loss on securities sold, the cost of securities has been determined on an identified cost basis. Investment income, non-class specific expenses and realized and unrealized gains and losses are allocated on a pro rata basis to each class based on the relative net assets of each class to the total net assets of the Fund.
c. Foreign Currency Translation. The books and records of the Funds are maintained in U.S. dollars. The values of securities, currencies and other assets and liabilities denominated in currencies other than U.S. dollars are translated into U.S. dollars based upon foreign exchange rates prevailing at the end of the period. Purchases and sales of investment securities, income and expenses are translated on the respective dates of such transactions.
Since the values of investment securities are presented at the foreign exchange rates prevailing at the end of the period, it is not practical to isolate that portion of the results of operations arising from changes in exchange rates from fluctuations which arise due to changes in market prices of investment securities. Such changes are included with the net realized and unrealized gain or loss on investments.
Net realized foreign exchange gains or losses arise from sales of foreign currency, currency gains or losses realized between the trade and settlement dates on securities
69 |
Notes to Financial Statements (continued)
September 30, 2011
transactions and the difference between the amounts of dividends, interest and foreign withholding taxes recorded on the Funds’ books and the U.S. dollar equivalent of the amounts actually received or paid. Net unrealized foreign exchange gains and losses arise from changes in the value of assets and liabilities, other than investment securities, at the end of the fiscal period, resulting from changes in exchange rates.
Each Fund may use foreign currency exchange contracts to facilitate transactions in foreign-denominated investments. Losses may arise from changes in the value of the foreign currency or if the counterparties do not perform under the contracts’ terms.
d. Forward Foreign Currency Contracts. The Funds may enter into forward foreign currency contracts, including forward foreign cross currency contracts. Contracts to buy generally are used to acquire exposure to foreign currencies, while contracts to sell generally are used to hedge a Fund’s investments against currency fluctuation. Also, a contract to buy or sell can offset a previous contract. These contracts involve market risk in excess of the unrealized gain or loss reflected in the Funds’ Statements of Assets and Liabilities. The U.S. dollar value of the currencies a Fund has committed to buy or sell represents the aggregate exposure to each currency the Fund has acquired or hedged through currency contracts outstanding at period end. Gains or losses are recorded for financial statement purposes as unrealized until settlement date. Risks may arise upon entering into these contracts from the potential inability of counterparties to meet the terms of their contracts and from unanticipated movements in the value of a foreign currency relative to the U.S. dollar. Certain contracts may require the movement of cash and/or securities as collateral for the Funds’ or counterparty’s net obligations under the contracts.
e. Option Contracts. The Funds may enter into option contracts. When a Fund purchases an option, it pays a premium and the option is subsequently marked to market to reflect current value. Premiums paid for purchasing options which expire are treated as realized losses. Premiums paid for purchasing options which are exercised or closed are added to the cost or deducted from the proceeds on the underlying instrument to determine the realized gain or loss. The risk associated with purchasing options is limited to the premium paid.
When a Fund writes an option, an amount equal to the net premium received (the premium less commission) is recorded as a liability and is subsequently adjusted to the current value. Net premiums received for written options which expire are treated as realized gains. Net premiums received for written options which are exercised or closed are deducted from the cost or added to the proceeds on the underlying instrument or closing purchase transaction to determine the realized gain or loss. The Fund, as writer of a written option, bears the risk of an unfavorable change in the market value of the instrument underlying the written option.
Exchange-traded options have standardized contracts and are settled through a clearing house with fulfillment guaranteed by the credit of the exchange. Therefore,
| 70
Notes to Financial Statements (continued)
September 30, 2011
counterparty credit risks to the Funds are limited. Over-the-counter options are subject to the risk that the counterparty is unable or unwilling to meet its obligations under the option.
For the year ended September 30, 2011, the Funds were not party to any over-the-counter options.
f. Federal and Foreign Income Taxes. The Trust treats each Fund as a separate entity for federal income tax purposes. Each Fund intends to meet the requirements of the Internal Revenue Code of 1986, as amended, applicable to regulated investment companies, and to distribute to its shareholders substantially all of its net investment income and any net realized capital gains at least annually. Management has performed an analysis of each Fund’s tax positions for the open tax years as of September 30, 2011 and has concluded that no provisions for income tax are required. The Funds’ federal tax returns for the prior three fiscal years remain subject to examination by the Internal Revenue Service. Management is not aware of any events that are reasonably possible to occur in the next twelve months that would result in the amounts of any unrecognized tax benefits significantly increasing or decreasing for the Funds. However, management’s conclusions regarding tax positions taken may be subject to review and adjustment at a later date based on factors including, but not limited to, new tax laws and accounting regulations and interpretations thereof.
A Fund may be subject to foreign taxes on income and gains on investments that are accrued based upon the Fund’s understanding of the tax rules and regulations that exist in the countries in which the Fund invests. Foreign governments may also impose taxes or other payments on investments with respect to foreign securities. Such taxes are accrued as applicable, and are reflected as foreign taxes payable on the Statements of Assets and Liabilities. In the event that realized gains on investments are subsequently offset by realized losses, taxes paid on realized gains may be returned to a Fund. Such amounts, if applicable, are reflected as foreign tax rebates receivable on the Statements of Assets and Liabilities.
g. Dividends and Distributions to Shareholders. Dividends and distributions are recorded on ex-dividend date. The timing and characterization of certain income and capital gain distributions are determined annually in accordance with federal tax regulations, which may differ from accounting principles generally accepted in the United States of America. Permanent differences are primarily due to differing treatments for book and tax purposes of items such as net operating losses, paydown gains and losses, foreign currency transactions, gains realized from passive foreign investment companies (“PFICs”), defaulted bonds, premium amortization, deferred Trustees’ fees and expired capital loss carryforwards. Permanent book and tax basis differences relating to shareholder distributions will result in reclassifications to capital accounts. Temporary differences between book and tax distributable earnings are primarily due to deferred Trustees’ fees, forward foreign currency contract mark to
71 |
Notes to Financial Statements (continued)
September 30, 2011
market, securities lending collateral gain/loss adjustment, wash sales, premium amortization, contingent payment debt instruments, basis adjustments for return of capital dividends received and defaulted bond interest. Distributions from net investment income and short-term capital gains are considered to be distributed from ordinary income for tax purposes.
The tax characterization of distributions is determined on an annual basis. The tax character of distributions paid to shareholders during the years ended September 30, 2011 and 2010 was as follows:
| | | | | | | | | | | | | | | | | | | | | | | | |
| | | 2011 Distributions Paid From: | | | 2010 Distributions Paid From: | |
Fund | | Ordinary Income | | | Long-Term
Capital Gains | | | Total | | | Ordinary Income | | | Long-Term
Capital Gains | | | Total | |
Global Equity and Income Fund | | $ | 5,609,497 | | | $ | — | | | $ | 5,609,497 | | | $ | 5,648,679 | | | $ | — | | | $ | 5,648,679 | |
Value Fund | | | 16,317,256 | | | | — | | | | 16,317,256 | | | | 7,877,957 | | | | — | | | | 7,877,957 | |
As of September 30, 2011, the components of distributable earnings were as follows:
| | | | | | | | | | | | | | | | |
| | | Global
Equity and
Income Fund | | | Growth
Fund | | | Mid Cap
Growth Fund | | | Value
Fund | |
Undistributed ordinary income | | $ | 5,362,526 | | | $ | 330,691 | | | $ | — | | | $ | 12,273,015 | |
Undistributed long-term capital gains | | | — | | | | — | | | | — | | | | — | |
| | | | | | | | | | | | | | | | |
Total undistributed earnings | | | 5,362,526 | | | | 330,691 | | | | — | | | | 12,273,015 | |
| | | | | | | | | | | | | | | | |
Capital loss carryforward: | | | | | | | | | | | | | | | | |
Expires September 30, 2016 | | | — | | | | (75,866 | ) | | | — | | | | — | |
Expires September 30, 2017 | | | (13,460,729 | ) | | | (57,062,095 | ) | | | (26,022,721 | ) | | | (1,676,396 | ) |
Expires September 30, 2018 | | | (38,448,993 | ) | | | (34,679,944 | ) | | | (18,569,793 | ) | | | (53,924,716 | ) |
| | | | | | | | | | | | | | | | |
Total capital loss carryforward | | | (51,909,722 | ) | | | (91,817,905 | ) | | | (44,592,514 | ) | | | (55,601,112 | ) |
Deferred net capital losses (post-October 2010) | | | — | | | | — | | | | — | | | | — | |
Unrealized appreciation (depreciation) | | | (20,372,221 | ) | | | 3,318,670 | | | | (1,490,520 | ) | | | (58,326,045 | ) |
| | | | | | | | | | | | | | | | |
Total accumulated losses | | $ | (66,919,417 | ) | | $ | (88,168,544 | ) | | $ | (46,083,034 | ) | | $ | (101,654,142 | ) |
| | | | | | | | | | | | | | | | |
Total capital loss carryforward utilized in the current year | | $ | 40,829,982 | | | $ | 6,069,000 | | | $ | 28,787,428 | | | $ | 25,163,619 | |
| | | | | | | | | | | | | | | | |
| 72
Notes to Financial Statements (continued)
September 30, 2011
The Growth Fund had $123,314 of capital loss carryforwards expire in the current year.
On December 22, 2010, the Regulated Investment Company Modernization Act of 2010 (the “Act”) was enacted. The Act modernizes several of the federal income and excise tax provisions related to RICs, and, with certain exceptions, is effective for taxable years beginning after December 22, 2010. Among the changes made are changes to the capital loss carryforward rules allowing for capital losses to be carried forward indefinitely. Rules in effect as of the report date limit the carryforward period to eight years. Capital loss carryforwards generated in taxable years beginning after the effective date of the Act must be fully used before capital loss carryforwards generated in taxable years prior to effective date of the Act; therefore, under certain circumstances, capital loss carryforwards available as of the report date, if any, may expire unused.
h. Repurchase Agreements. It is each Fund’s policy that the market value of the collateral for repurchase agreements be at least equal to 102% of the repurchase price, including interest. Certain repurchase agreements are tri-party arrangements whereby the collateral is held in a segregated account for the benefit of the Fund and on behalf of the counterparty. Repurchase agreements could involve certain risks in the event of default or insolvency of the counterparty, including possible delays or restrictions upon a Fund’s ability to dispose of the underlying securities.
i. Securities Lending. The Funds have entered into an agreement with State Street Bank and Trust Company (“State Street Bank”), as agent of the Funds, to lend securities to certain designated borrowers. The loans are collateralized with cash or securities in an amount equal to at least 105% or 102% of the market value (including accrued interest) of the loaned international or domestic securities, respectively, when the loan is initiated. Thereafter, the value of the collateral must remain at least 102% of the market value (including accrued interest) of loaned securities for U.S. equities and U.S. corporate debt; at least 105% of the market value (including accrued interest) of loaned securities for non-U.S. equities; and at least 100% of the market value (including accrued interest) of loaned securities for U.S. Government securities, sovereign debt issued by non-U.S. Governments and non-U.S. corporate debt. In the event that the market value of the collateral falls below the required percentages described above, the borrower will deliver additional collateral on the next business day. As with other extensions of credit, the Funds may bear the risk of loss with respect to the investment of the collateral. The Funds invest cash collateral in short-term investments, a portion of the income from which is remitted to the borrowers and the remainder allocated between the Funds and State Street Bank as lending agent.
For the year ended September 30, 2011, none of the Funds had loaned securities under this agreement.
j. Indemnifications. Under the Trust’s organizational documents, its officers and Trustees are indemnified against certain liabilities arising out of the performance of
73 |
Notes to Financial Statements (continued)
September 30, 2011
their duties to the Funds. Additionally, in the normal course of business, the Funds enter into contracts with service providers that contain general indemnification clauses. The Funds’ maximum exposure under these arrangements is unknown as this would involve future claims that may be made against the Funds that have not yet occurred. However, based on experience, the Funds expect the risk of loss to be remote.
3. Fair Value Measurements. In accordance with accounting standards related to fair value measurements and disclosures, the Funds have categorized the inputs utilized in determining the value of each Fund’s assets or liabilities. These inputs are summarized in the three broad levels listed below:
| | • | | Level 1 – quoted prices in active markets for identical assets or liabilities; |
| | • | | Level 2 – prices determined using other significant inputs that are observable either directly, or indirectly through corroboration with observable market data (which could include quoted prices for similar assets or liabilities, interest rates, credit risk, etc.); |
| | • | | Level 3 – prices determined using significant unobservable inputs when quoted prices or observable inputs are unavailable such as when there is little or no market activity for an asset or liability (unobservable inputs reflect each Fund’s own assumptions in determining the fair value of assets or liabilities and would be based on the best information available). |
The inputs or methodology used for valuing securities are not necessarily an indication of the risk associated with investing in those securities.
| 74
Notes to Financial Statements (continued)
September 30, 2011
The following is a summary of the inputs used to value the Funds’ investments as of September 30, 2011, at value:
Global Equity and Income Fund
Asset Valuation Inputs
| | | | | | | | | | | | | | | | |
Description | | Level 1 | | | Level 2 | | | Level 3 | | | Total | |
Common Stocks | | | | | | | | | | | | | | | | |
Belgium | | $ | — | | | $ | 6,977,782 | | | $ | — | | | $ | 6,977,782 | |
Brazil | | | 19,009,376 | | | | — | | | | — | | | | 19,009,376 | |
British Virgin Islands | | | — | | | | 2,891,238 | | | | — | | | | 2,891,238 | |
Canada | | | 371,052 | | | | — | | | | — | | | | 371,052 | |
Cayman Islands | | | 8,337,162 | | | | 5,077,974 | | | | — | | | | 13,415,136 | |
Chile | | | 9,841,832 | | | | — | | | | — | | | | 9,841,832 | |
Denmark | | | — | | | | 10,887,080 | | | | — | | | | 10,887,080 | |
France | | | — | | | | 6,128,354 | | | | — | | | | 6,128,354 | |
Germany | | | — | | | | 8,430,943 | | | | — | | | | 8,430,943 | |
Hong Kong | | | — | | | | 5,635,309 | | | | — | | | | 5,635,309 | |
Japan | | | — | | | | 10,778,115 | | | | — | | | | 10,778,115 | |
Korea | | | — | | | | 3,419,593 | | | | — | | | | 3,419,593 | |
Mexico | | | 3,306,544 | | | | — | | | | — | | | | 3,306,544 | |
Netherlands Antilles | | | 4,493,787 | | | | — | | | | — | | | | 4,493,787 | |
Sweden | | | — | | | | 4,628,983 | | | | — | | | | 4,628,983 | |
United Kingdom | | | 5,554,026 | | | | 33,710,008 | | | | — | | | | 39,264,034 | |
United States | | | 140,496,507 | | | | — | | | | — | | | | 140,496,507 | |
Virgin Islands | | | 5,127,100 | | | | — | | | | — | | | | 5,127,100 | |
| | | | | | | | | | | | | | | | |
Total Common Stocks | | | 196,537,386 | | | | 98,565,379 | | | | — | | | | 295,102,765 | |
| | | | | | | | | | | | | | | | |
Bonds and Notes | | | | | | | | | | | | | | | | |
Non-Convertible Bonds | | | | | | | | | | | | | | | | |
Korea | | | — | | | | 2,176,406 | | | | 351,758 | | | | 2,528,164 | |
Supranationals | | | — | | | | 364,884 | | | | 983,784 | | | | 1,348,668 | |
United States | | | 32,220 | | | | 80,916,539 | | | | 10,000 | | | | 80,958,759 | |
All Other Non-Convertible Bonds(a) | | | — | | | | 44,579,103 | | | | — | | | | 44,579,103 | |
| | | | | | | | | | | | | | | | |
Total Non-Convertible Bonds | | | 32,220 | | | | 128,036,932 | | | | 1,345,542 | | | | 129,414,694 | |
| | | | | | | | | | | | | | | | |
Convertible Bonds(a) | | | — | | | | 6,239,931 | | | | — | | | | 6,239,931 | |
Municipals(a) | | | — | | | | 464,181 | | | | — | | | | 464,181 | |
| | | | | | | | | | | | | | | | |
Total Bonds and Notes | | | 32,220 | | | | 134,741,044 | | | | 1,345,542 | | | | 136,118,806 | |
| | | | | | | | | | | | | | | | |
Senior Loans(a) | | | — | | | | 55,597 | | | | — | | | | 55,597 | |
Preferred Stocks(a) | | | 3,126,487 | | | | — | | | | 409,200 | | | | 3,535,687 | |
Short-Term Investments | | | — | | | | 32,297,244 | | | | — | | | | 32,297,244 | |
| | | | | | | | | | | | | | | | |
Total Investments | | | 199,696,093 | | | | 265,659,264 | | | | 1,754,742 | | | | 467,110,099 | |
| | | | | | | | | | | | | | | | |
Forward Foreign Currency Contracts (unrealized appreciation) | | | — | | | | 54,484 | | | | — | | | | 54,484 | |
| | | | | | | | | | | | | | | | |
Total | | $ | 199,696,093 | | | $ | 265,713,748 | | | $ | 1,754,742 | | | $ | 467,164,583 | |
| | | | | | | | | | | | | | | | |
75 |
Notes to Financial Statements (continued)
September 30, 2011
Global Equity and Income Fund (continued)
Liability Valuation Inputs
| | | | | | | | | | | | | | | | |
Description | | Level 1 | | | Level 2 | | | Level 3 | | | Total | |
Forward Foreign Currency Contracts (unrealized depreciation) | | $ | — | | | $ | (244,720 | ) | | $ | — | | | $ | (244,720 | ) |
| | | | | | | | | | | | | | | | |
| (a) | Details of the major categories of the Fund’s investments are reflected within the Portfolio of Investments. |
A preferred stock valued at $664,200 was transferred from Level 2 to Level 1 during the period ended September 30, 2011. At September 30, 2010, this security was valued on the basis of evaluated bids furnished to the Fund by a pricing service; at September 30, 2011, this security was valued at a market price in accordance with the Fund’s valuation policies.
Growth Fund
Asset Valuation Inputs
| | | | | | | | | | | | | | | | |
Description(a) | | Level 1 | | | Level 2 | | | Level 3 | | | Total | |
Common Stocks | | $ | 109,534,587 | | | $ | — | | | $ | — | | | $ | 109,534,587 | |
Short-Term Investments | | | — | | | | 225,975 | | | | — | | | | 225,975 | |
| | | | | | | | | | | | | | | | |
Total | | $ | 109,534,587 | | | $ | 225,975 | | | $ | — | | | $ | 109,760,562 | |
| | | | | | | | | | | | | | | | |
| (a) | Details of the major categories of the Fund’s investments are reflected within the Portfolio of Investments. |
Mid Cap Growth Fund
Asset Valuation Inputs
| | | | | | | | | | | | | | | | |
Description(a) | | Level 1 | | | Level 2 | | | Level 3 | | | Total | |
| Common Stocks | | $ | 94,540,248 | | | $ | — | | | $ | — | | | $ | 94,540,248 | |
| Short-Term Investments | | | — | | | | 7,230,246 | | | | — | | | | 7,230,246 | |
| | | | | | | | | | | | | | | | |
Total | | $ | 94,540,248 | | | $ | 7,230,246 | | | $ | — | | | $ | 101,770,494 | |
| | | | | | | | | | | | | | | | |
| (a) | Details of the major categories of the Fund’s investments are reflected within the Portfolio of Investments. |
| 76
Notes to Financial Statements (continued)
September 30, 2011
Value Fund
Asset Valuation Inputs
| | | | | | | | | | | | | | | | |
Description(a) | | Level 1 | | | Level 2 | | | Level 3 | | | Total | |
Common Stocks | | $ | 1,058,097,834 | | | $ | — | | | $ | — | | | $ | 1,058,097,834 | |
Short-Term Investments | | | — | | | | 39,386,426 | | | | — | | | | 39,386,426 | |
| | | | | | | | | | | | | | | | |
Total | | $ | 1,058,097,834 | | | $ | 39,386,426 | | | $ | — | | | $ | 1,097,484,260 | |
| | | | | | | | | | | | | | | | |
| (a) | Details of the major categories of the Fund’s investments are reflected within the Portfolio of Investments. |
The following is a reconciliation of Level 3 investments for which significant unobservable inputs were used to determine fair values as of September 30, 2011:
Global Equity and Income Fund
Asset Valuation Inputs
| | | | | | | | | | | | | | | | | | | | |
Investments in Securities | | Balance as of
September 30,
2010 | | | Accrued
Discounts
(Premiums) | | | Realized
Gain
(Loss) | | | Change in
Unrealized
Appreciation
(Depreciation) | | | Purchases | |
Bonds and Notes | | | | | | | | | | | | | | | | | | | | |
Non-Convertible Bonds | | | | | | | | | | | | | | | | | | | | |
Korea | | $ | 368,686 | | | $ | (692 | ) | | $ | — | | | $ | (16,236 | ) | | $ | — | |
Supranationals | | | — | | | | 810 | | | | — | | | | (60,153 | ) | | | 1,043,127 | |
United States | | | — | | | | 179 | | | | — | | | | (24,479 | ) | | | 34,300 | |
Preferred Stocks | | | | | | | | | | | | | | | | | | | | |
Non-Convertible Preferred Stocks | | | | | | | | | | | | | | | | | | | | |
United States | | | — | | | | — | | | | — | | | | (204,707 | ) | | | — | |
| | | | | | | | | | | | | | | | | | | | |
Total | | $ | 368,686 | | | $ | 297 | | | $ | — | | | $ | (305,575 | ) | | $ | 1,077,427 | |
| | | | | | | | | | | | | | | | | | | | |
| | | | | |
Investments in Securities | | Sales | | | Transfers
into Level 3 | | | Transfers
out of
Level 3 | | | Balance as of
September 30,
2011 | | | Change in
Unrealized
Appreciation
(Depreciation)
from
Investments
Still Held at
September 30,
2011 | |
Bonds and Notes | | | | | | | | | | | | | | | | | | | | |
Non-Convertible Bonds | | | | | | | | | | | | | | | | | | | | |
Korea | | $ | — | | | $ | — | | | $ | — | | | $ | 351,758 | | | $ | (16,236 | ) |
Supranationals | | | — | | | | — | | | | — | | | | 983,784 | | | | (60,153 | ) |
United States | | | — | | | | — | | | | — | | | | 10,000 | | | | (24,479 | ) |
Preferred Stocks | | | | | | | | | | | | | | | | | | | | |
Non-Convertible Preferred Stocks | | | | | | | | | | | | | | | | | | | | |
United States | | | — | | | | 613,907 | | | | — | | | | 409,200 | | | | (204,707 | ) |
| | | | | | | | | | | | | | | | | | | | |
Total | | $ | — | | | $ | 613,907 | | | $ | — | | | $ | 1,754,742 | | | $ | (305,575 | ) |
| | | | | | | | | | | | | | | | | | | | |
77 |
Notes to Financial Statements (continued)
September 30, 2011
A preferred stock valued at $613,907 was transferred from Level 2 to Level 3 during the period ended September 30, 2011. At September 30, 2010, this security was valued on the basis of evaluated bids furnished to the Fund by a pricing service; at September 30, 2011, this security was valued using broker-dealer bid quotations based on inputs unobservable to the Fund.
All transfers are recognized as of the beginning of the reporting period.
4. Derivatives. Derivative instruments are defined as financial instruments whose value and performance are based on the value and performance of another security or financial instrument. Derivative instruments that certain Funds used during the period include forward foreign currency contracts and option contracts.
The Funds are subject to the risk that changes in foreign currency exchange rates will have an unfavorable effect on the value of Fund assets denominated in foreign currencies. The Funds may enter into forward foreign currency contracts for hedging purposes to protect the value of the Funds’ holdings of foreign securities. The Funds may also use forward foreign currency contracts to gain exposure to foreign currencies, regardless of whether securities denominated in such currencies are held in the Funds. During the year ended September 30, 2011, Global Equity and Income Fund engaged in forward foreign currency transactions for hedging purposes and to gain exposure to foreign currencies.
The Funds are subject to the risk of unpredictable declines in the value of individual equity securities and periods of below-average performance in individual securities or in the equity market as a whole. The Funds may use purchased put options and written call options to hedge against a decline in value of an equity security that it owns, and may use written put options to offset the cost of options used for hedging purposes. The Funds may also use purchased call options to gain exposure to an equity security without committing the capital required to buy it, while also limiting the downside risk associated with owning it. During the year ended September 30, 2011, Mid Cap Growth Fund engaged in purchased put and written call options for hedging purposes, written put options to offset the cost of options used for hedging purposes, and in purchased call options to gain exposure to equity securities.
Global Equity and Income Fund and Mid Cap Growth Fund are parties to agreements with counterparties that govern transactions in forward foreign currency contracts. The agreements contain credit-risk-related contingent features that allow the counterparties to terminate open contracts early if the net asset value of a Fund declines beyond a certain threshold. If such features were to be triggered, the counterparties could request immediate settlement of open contracts at current fair value. As of September 30, 2011, the fair value of derivative positions (including open trades) subject to credit-risk-related contingent features that are in a net liability position by counterparty, and the value of collateral pledged to counterparties for such contracts is as follows:
| 78
Notes to Financial Statements (continued)
September 30, 2011
| | | | | | | | | | |
Fund | | Counterparty | | Derivatives | | | Collateral
Pledged | |
Global Equity and Income Fund | | Barclays | | $ | (95,909 | ) | | $ | — | |
| | Credit Suisse | | | (67,988 | ) | | | — | |
| | JPMorgan Chase | | | (12,643 | ) | | | — | |
| | Morgan Stanley | | | (13,696 | ) | | | — | |
Forward foreign currency contracts are subject to the risk that the counterparty will be unwilling or unable to meet its obligations under the contracts. Global Equity and Income Fund has mitigated this risk by entering into master netting agreements with counterparties that allow the Fund and the counterparty to net amounts owed by each related to derivative contracts to one net amount payable by either the Fund or the counterparty. As of September 30, 2011, the maximum amount of loss that Global Equity and Income Fund would incur if counterparties failed to meet their obligations is $54,484 and the amount of loss that Global Equity and Income Fund would incur after taking into account master netting arrangements is $0. These amounts do not take into account the value of any collateral received by the Fund.
Counterparty risk is managed through the posting of collateral and, as a result, the risk of loss to a Fund from counterparty default should be limited to the extent a Fund is undercollateralized. In addition to collateral requirements, the Funds also require counterparties to meet minimum credit quality requirements.
The following is a summary of derivative instruments for Global Equity and Income Fund as of September 30, 2011:
| | | | |
Statements of Assets and Liabilities Caption | | Foreign
Exchange
Contracts | |
Assets | | | | |
Unrealized appreciation on forward foreign currency contracts | | $ | 54,484 | |
Liabilities | | | | |
Unrealized depreciation on forward foreign currency contracts | | | (244,720 | ) |
Transactions in derivative instruments for Global Equity and Income Fund during the year ended September 30, 2011, were as follows:
| | | | |
Statements of Operations Caption | | Foreign
Exchange
Contracts | |
Net Realized Gain (Loss) on: | | | | |
Foreign currency transactions* | | $ | 214,149 | |
Net Change in Unrealized Appreciation (Depreciation) on: | | | | |
Foreign currency translations* | | | (249,473 | ) |
| * | Represents realized gain and change in unrealized appreciation (depreciation), respectively, for forward foreign currency contracts during the period. |
79 |
Notes to Financial Statements (continued)
September 30, 2011
Transactions in derivative instruments for Mid Cap Growth Fund during the year ended September 30, 2011 were as follows:
| | | | |
Statements of Operations Caption | | Equity
Contracts | |
Net Realized Gain (Loss) on: | | | | |
Investments* | | $ | 448,482 | |
Options written | | | (1,518,684 | ) |
Net Change in Unrealized Appreciation (Depreciation) on: | | | | |
Investments* | | | 358,504 | |
Options written | | | (111,228 | ) |
| * | Represents realized gain and change in unrealized appreciation (depreciation), respectively, for purchased options during the period. |
As the Funds value their derivatives at fair value and recognize changes in fair value through the Statements of Operations, they do not qualify for hedge accounting under authoritative guidance for derivative instruments. The Funds’ investments in derivatives may represent an economic hedge; however, they are considered to be non-hedge transactions for the purpose of these disclosures.
The volume of forwards activity, as a percentage of net assets, for Global Equity and Income Fund, based on month-end notional amounts outstanding during the period, at absolute value, was as follows for the year ended September 30, 2011:
| | | | |
Global Equity and Income Fund | | Forwards | |
Average Notional Amount Outstanding | | | 1.06 | % |
Highest Notional Amount Outstanding | | | 1.25 | % |
Lowest Notional Amount Outstanding | | | 0.91 | % |
Notional Amount Outstanding as of September 30, 2011 | | | 1.11 | % |
Notional amounts outstanding at the end of the prior period are included in the average notional amount outstanding.
| 80
Notes to Financial Statements (continued)
September 30, 2011
The volume of options activity, as a percentage of net assets, for Mid Cap Growth Fund, based on month-end market values of equity securities underlying purchased and written options, at absolute value, was as follows for the year ended September 30, 2011:
| | | | | | | | | | | | | | | | |
Mid Cap Growth Fund* | | Call Options
Written | | | Put Options Written | | | Call Options Purchased | | | Put Options
Purchased | |
Average Market Value of Underlying Securities | | | 0.87 | % | | | 1.21 | % | | | 0.01 | % | | | 1.94 | % |
Highest Market Value of Underlying Securities | | | 8.07 | % | | | 8.07 | % | | | 1.80 | % | | | 10.19 | % |
Lowest Market Value of Underlying Securities | | | 0.00 | % | | | 0.00 | % | | | 0.00 | % | | | 0.00 | % |
Market Value of Underlying Securities as of September 30, 2011 | | | 0.00 | % | | | 0.00 | % | | | 0.00 | % | | | 0.00 | % |
| * | Market value of underlying securities is determined by multiplying option shares by the price of the option’s underlying security, as determined by the Fund’s Pricing Policies and Procedures. |
The following is a summary of Mid Cap Growth Fund’s written option activity:
| | | | | | | | |
| | | Number of Contracts | | | Premiums | |
Outstanding at 9/30/2010 | | | 1,126 | | | $ | 335,823 | |
Options written | | | 11,089 | | | | 2,919,387 | |
Options terminated in closing purchase transactions | | | (12,215 | ) | | | (3,255,210 | ) |
Options exercised | | | — | | | | — | |
Options expired | | | — | | | | — | |
| | | | | | | | |
Outstanding at 9/30/2011 | | | — | | | $ | — | |
| | | | | | | | |
5. Purchases and Sales of Securities. For the year ended September 30, 2011, purchases and sales of securities (excluding short-term investments and U.S. Government/Agency securities and including paydowns) were as follows:
| | | | | | | | |
Fund | | Purchases | | | Sales | |
Global Equity and Income Fund | | $ | 412,482,995 | | | $ | 265,178,786 | |
Growth Fund | | | 27,123,933 | | | | 18,058,228 | |
Mid Cap Growth Fund | | | 241,509,000 | | | | 256,582,545 | |
Value Fund | | | 558,142,368 | | | | 345,180,738 | |
For the year ended September 30, 2011, purchases and sales of U.S. Government/Agency securities by the Global Equity and Income Fund were $16,183,147 and $5,841,107, respectively.
81 |
Notes to Financial Statements (continued)
September 30, 2011
6. Management Fees and Other Transactions with Affiliates.
a. Management Fees. Loomis, Sayles & Company, L.P. (“Loomis Sayles”) serves as investment adviser to each Fund. Separate management agreements for each Fund in effect for the year ended September 30, 2011, provided for fees at the following annual percentage rates of each Fund’s average daily net assets:
| | | | |
Fund | | Percentage of
Average
Daily Net Assets | |
Global Equity and Income Fund | | | 0.75 | % |
Growth Fund | | | 0.50 | % |
Mid Cap Growth Fund | | | 0.75 | % |
Value Fund | | | 0.50 | % |
Loomis Sayles has given binding undertakings to the Funds to waive management fees and/or reimburse certain expenses to limit the Funds’ operating expenses, exclusive of acquired fund fees and expenses, brokerage expenses, interest expense, taxes and extraordinary expenses. These undertakings are in effect until January 31, 2012 and are reevaluated on an annual basis. Management fees payable, as reflected on the Statements of Assets and Liabilities, is net of waivers and/or expense reimbursements, if any, pursuant to these undertakings.
For the year ended September 30, 2011, the expense limits as a percentage of average daily net assets under the expense limitation agreements were as follows:
| | | | | | | | | | | | | | | | | | | | |
| | | Expense Limit
as a Percentage of
Average Daily Net Assets | |
Fund | | Class A | | | Class B | | | Class C | | | Class Y | | | Admin Class | |
Global Equity and Income Fund | | | 1.25 | % | | | — | | | | 2.00 | % | | | 1.00 | % | | | — | |
Growth Fund | | | 1.25 | % | | | 2.00 | % | | | 2.00 | % | | | 1.00 | % | | | — | |
Mid Cap Growth Fund | | | 1.25 | % | | | — | | | | 2.00 | % | | | 1.00 | % | | | — | |
Value Fund | | | 1.10 | % | | | 1.85 | % | | | 1.85 | % | | | 0.85 | % | | | 1.35 | % |
Loomis Sayles shall be permitted to recover expenses it has borne under the expense limitation agreements (whether through waiver of its management fees or otherwise) on a class by class basis in later periods to the extent the expenses of a class fall below a class’ expense limits, provided, however, that a class is not obligated to pay such waived/reimbursed fees or expenses more than one year after the end of the fiscal year in which the fees or expenses were waived/reimbursed.
| 82
Notes to Financial Statements (continued)
September 30, 2011
For the year ended September 30, 2011, the management fees and waivers of management fees for each Fund were as follows:
| | | | | | | | | | | | | | | | | | | | |
| | | Gross
Management
Fees | | | Waivers of
Management
Fees1 | | | Net
Management
Fees | | | Percentage of
Average
Daily Net Assets | |
Fund | | | | | Gross | | | Net | |
Global Equity and Income Fund | | $ | 3,346,185 | | | $ | — | | | $ | 3,346,185 | | | | 0.75 | % | | | 0.75 | % |
Growth Fund | | | 566,290 | | | | — | | | | 566,290 | | | | 0.50 | % | | | 0.50 | % |
Mid Cap Growth Fund | | | 929,737 | | | | 81,016 | | | | 848,721 | | | | 0.75 | % | | | 0.68 | % |
Value Fund | | | 6,121,595 | | | | — | | | | 6,121,595 | | | | 0.50 | % | | | 0.50 | % |
| 1 | Management fee waivers are subject to possible recovery until September 30, 2012. |
For the year ended September 30, 2011, expense reimbursements related to the prior fiscal year were recovered as follows:
| | | | | | | | | | | | | | | | |
| | | Recovered Expenses | |
Fund | | Class A | | | Class C | | | Class Y | | | Total | |
Global Equity and Income Fund | | $ | 18,769 | | | $ | 27,179 | | | $ | 39,450 | | | $ | 85,398 | |
Certain officers and employees of Loomis Sayles are also officers or Trustees of the Trust. Loomis Sayles’ general partner is indirectly owned by Natixis Global Asset Management, L.P. (“Natixis US”), which is part of Natixis Global Asset Management, an international asset management group based in Paris, France.
b. Service and Distribution Fees. Natixis Distributors, L.P. (“Natixis Distributors”), a wholly-owned subsidiary of Natixis US, has entered into a distribution agreement with the Trust. Pursuant to this agreement, Natixis Distributors serves as principal underwriter of the Funds of the Trust.
Pursuant to Rule 12b-1 under the 1940 Act, the Trust has adopted a Service Plan relating to the Fund’s Class A shares (the “Class A Plans”), a Distribution and Service Plan relating to each Fund’s Class B (if applicable) and Class C shares (the “Class B and Class C Plans”), and Value Fund has adopted a Distribution Plan relating to its Admin Class shares (the “Admin Class Plan”).
Under the Class A Plans, each Fund pays Natixis Distributors a monthly service fee at an annual rate not to exceed 0.25% of the average daily net assets attributable to the Fund’s Class A shares, as reimbursement for expenses incurred by Natixis Distributors in providing personal services to investors in Class A shares and/or the maintenance of shareholder accounts.
83 |
Notes to Financial Statements (continued)
September 30, 2011
Under the Class B (if applicable) and Class C Plans, each Fund pays Natixis Distributors a monthly service fee at an annual rate not to exceed 0.25% of the average daily net assets attributable to the Fund’s Class B (if applicable) and Class C shares, as compensation for services provided by Natixis Distributors in providing personal services to investors in Class B (if applicable) and Class C shares and/or the maintenance of shareholder accounts.
Also under the Class B (if applicable) and Class C Plans, each Fund pays Natixis Distributors a monthly distribution fee at an annual rate of 0.75% of the average daily net assets attributable to the Fund’s Class B (if applicable) and Class C shares, as compensation for services provided by Natixis Distributors in connection with the marketing or sale of Class B (if applicable) and Class C shares.
Under the Admin Class Plan, Value Fund pays Natixis Distributors a monthly distribution fee at an annual rate not to exceed 0.25% of the average daily net assets attributable to the Fund’s Admin Class shares, as compensation for services provided by Natixis Distributors in connection with the marketing or sale of Admin Class shares or for payments made by Natixis Distributors to securities dealers or other financial intermediaries as commissions, asset-based sales charges or other compensation with respect to the sale of Admin Class shares, or for providing personal services to investors and/or the maintenance of shareholder accounts.
In addition, the Admin Class shares of Value Fund may pay Natixis Distributors an administrative service fee, at an annual rate not to exceed 0.25% of the average daily net assets attributable to Admin Class shares. These fees are subsequently paid to securities dealers or financial intermediaries for providing personal services and/or account maintenance for their customers who hold such shares.
For the year ended September 30, 2011, the Funds paid the following service and distribution fees:
| | | | | | | | | | | | | | | | | | | | | | | | | | | | |
| | | Service Fees | | | Distribution Fees | |
Fund | | Class A | | | Class B | | | Class C | | | Admin
Class | | | Class B | | | Class C | | | Admin
Class | |
Global Equity and Income Fund | | $ | 245,314 | | | $ | — | | | $ | 354,883 | | | $ | — | | | $ | — | | | $ | 1,064,648 | | | $ | — | |
Growth Fund | | | 75,554 | | | | 8,788 | | | | 31,246 | | | | — | | | | 26,365 | | | | 93,736 | | | | — | |
Mid Cap Growth Fund | | | 187,045 | | | | — | | | | 3,343 | | | | — | | | | — | | | | 10,028 | | | | — | |
Value Fund | | | 368,614 | | | | 7,558 | | | | 28,229 | | | | 2 | | | | 22,672 | | | | 84,685 | | | | 4 | |
| 84
Notes to Financial Statements (continued)
September 30, 2011
c. Administrative Fees. Natixis Asset Management Advisors, L.P. (“Natixis Advisors”) provides certain administrative services for the Funds and contracts with State Street Bank to serve as sub-administrator. Natixis Advisors is a wholly-owned subsidiary of Natixis US. Pursuant to an agreement among Natixis Funds Trust I, Natixis Funds Trust II, Natixis Funds Trust IV, Gateway Trust (“Natixis Funds Trusts”), Loomis Sayles Funds I, Loomis Sayles Funds II (“Loomis Sayles Funds Trusts”), Hansberger International Series and Natixis Advisors, each Fund pays Natixis Advisors monthly its pro rata portion of fees equal to an annual rate of 0.0575% of the first $15 billion of the average daily net assets of the Natixis Funds Trusts, Loomis Sayles Funds Trusts and Hansberger International Series, 0.0500% of the next $15 billion, 0.0400% of the next $30 billion and 0.0350% of such assets in excess of $60 billion, subject to an annual aggregate minimum fee for the Natixis Funds Trusts, Loomis Sayles Funds Trusts and Hansberger International Series of $10 million, which is reevaluated on an annual basis.
For the year ended September 30, 2011, each Fund paid the following administrative fees to Natixis Advisors:
| | | | |
Fund | | Administrative Fees | |
Global Equity and Income Fund | | $ | 207,132 | |
Growth Fund | | | 52,614 | |
Mid Cap Growth Fund | | | 57,598 | |
Value Fund | | | 568,761 | |
d. Sub-Transfer Agent Fees. Natixis Distributors has entered into agreements with financial intermediaries to provide certain recordkeeping, processing, shareholder communications and other services to customers of the intermediaries and has agreed to compensate the intermediaries for providing those services. Certain services would be provided by the Funds if the shares of those customers were registered directly with the Funds’ transfer agent. Accordingly, the Funds agreed to pay a portion of the intermediary fees attributable to shares of the Funds held by the intermediaries (which generally is a percentage of the value of shares held) not to exceed what the Funds would have paid its transfer agent had each customer’s shares been registered directly with the transfer agent instead of held through the intermediaries. Natixis Distributors pays the remainder of the fees.
For the year ended September 30, 2011, the Funds paid the following sub-transfer agent fees, which are reflected in transfer agent fees and expenses in the Statements of Operations.
| | | | |
Fund | | Sub-Transfer Agent Fees | |
Global Equity and Income Fund | | $ | 279,118 | |
Growth Fund | | | 58,835 | |
Mid Cap Growth Fund | | | 112,649 | |
Value Fund | | | 1,696,042 | |
85 |
Notes to Financial Statements (continued)
September 30, 2011
e. Commissions. Commissions (including CDSCs) on Fund shares retained by Natixis Distributors during the year ended September 30, 2011, were as follows:
| | | | |
Fund | | Commissions | |
Global Equity and Income Fund | | $ | 787,418 | |
Growth Fund | | | 24,334 | |
Mid Cap Growth Fund | | | 15,132 | |
Value Fund | | | 53,504 | |
f. Trustees Fees and Expenses. The Trust does not pay any compensation directly to its officers or Trustees who are directors, officers or employees of Natixis Advisors, Natixis Distributors, Natixis US or their affiliates. The Chairperson of the Board receives a retainer fee at the annual rate of $250,000. The Chairperson does not receive any meeting attendance fees for Board of Trustees meetings or committee meetings that she attends. Each Independent Trustee (other than the Chairperson) receives, in the aggregate, a retainer fee at the annual rate of $80,000. Each Independent Trustee also receives a meeting attendance fee of $10,000 for each meeting of the Board of Trustees that he or she attends in person and $5,000 for each meeting of the Board of Trustees that he or she attends telephonically. In addition, each committee chairman receives an additional retainer fee at the annual rate of $15,000. Each Contract Review and Governance Committee member is compensated $6,000 for each Committee meeting that he or she attends in person and $3,000 for each meeting that he or she attends telephonically. Each Audit Committee member is compensated $7,500 for each Committee meeting that he or she attends in person and $3,750 for each meeting that he or she attends telephonically. These fees are allocated among the funds in the Natixis Funds Trusts, Loomis Sayles Funds Trusts and Hansberger International Series based on a formula that takes into account, among other factors, the relative net assets of each fund. Trustees are reimbursed for travel expenses in connection with attendance at meetings.
A deferred compensation plan (the “Plan”) is available to the Trustees on a voluntary basis. Deferred amounts remain in the Funds until distributed in accordance with the provisions of the Plan. The value of a participating Trustee’s deferral account is based on theoretical investments of deferred amounts, on the normal payment dates, in certain funds of the Natixis Funds Trusts, Loomis Sayles Funds Trusts and Hansberger International Series as designated by the participating Trustees. Changes in the value of participants’ deferral accounts are allocated pro rata among the funds in the Natixis Funds Trusts, Loomis Sayles Funds Trusts, and Hansberger International Series, and are normally reflected as Trustees’ fees and expenses in the Statements of Operations. The portions of the accrued obligations allocated to the Funds under the Plan are reflected as Deferred Trustees’ fees on the Statements of Assets and Liabilities.
g. Payments by Affiliates. For the year ended September 30, 2011, Loomis Sayles reimbursed Global Equity and Income Fund $332 for losses incurred in connection with a trading error.
| 86
Notes to Financial Statements (continued)
September 30, 2011
7. Line of Credit. Each Fund, together with certain other funds of Natixis Funds Trusts, Loomis Sayles Funds Trusts and Hansberger International Series, participates in a $200,000,000 committed unsecured line of credit provided by State Street Bank, with an individual limit of $125,000,000 for each fund that participates in the line of credit. Interest is charged to each participating fund based on its borrowings at a rate per annum equal to the greater of the Federal Funds rate or overnight LIBOR, plus 1.25%. In addition, a commitment fee of 0.125% per annum, payable at the end of each calendar quarter, is accrued and apportioned among the participating funds based on their average daily unused portion of the line of credit. Prior to April 21, 2011, the commitment fee was 0.15% per annum.
For the year ended September 30, 2011, none of the Funds had borrowings under these agreements.
8. Brokerage Commission Recapture. Each Fund has entered into agreements with certain brokers whereby the brokers will rebate a portion of brokerage commissions. All amounts rebated by the brokers are returned to the Funds under such agreements and are included in realized gains on investments on the Statements of Operations. For the year ended September 30, 2011, amounts rebated under these agreements were as follows:
| | | | |
Fund | | Rebates | |
Global Equity and Income Fund | | $ | 23,796 | |
Growth Fund | | | 3,042 | |
Mid Cap Growth Fund | | | 28,358 | |
Value Fund | | | 65,340 | |
9. Concentration of Risk. Each Fund’s investments in foreign securities are subject to foreign currency fluctuations, higher volatility than U.S. securities, varying degrees of regulation and limited liquidity. Greater political, economic, credit and information risks are also associated with foreign securities.
10. Concentration of Ownership. At September 30, 2011, Loomis Sayles Funded Pension Plan and Trust (“Pension Plan”) and the Loomis Sayles Employees’ Profit Sharing Retirement Plan (“Retirement Plan”) held shares of beneficial interest in the Funds representing the following percentages of net assets:
| | | | | | | | |
Fund | | Pension Plan | | | Retirement Plan | |
Global Equity and Income Fund | | | 2.84 | % | | | 1.86 | % |
Growth Fund | | | 5.75 | % | | | 11.10 | % |
Mid Cap Growth Fund | | | 8.25 | % | | | 9.12 | % |
Value Fund | | | 0.67 | % | | | 1.10 | % |
87 |
Notes to Financial Statements (continued)
September 30, 2011
From time to time, the Funds may have a concentration of one or more shareholders holding a significant percentage of shares outstanding. Investment activities of these shareholders could have material impacts on the Funds. As of September 30, 2011, certain Funds had shareholder accounts that comprised more than 5% of the Fund’s total outstanding shares. Such accounts may be beneficially held by one or more individuals or entities other than the owner of record. The number of shareholder accounts owning more than 5% of total outstanding shares of a fund, based on accounts that represent more than 5% of an individual class of shares, and the aggregate percentage of net assets represented by such holdings was as follows:
| | | | | | | | |
Fund | | Number of 5% Shareholder
Accounts | | | Percentage of Ownership | |
Global Equity and Income Fund | | | 2 | | | | 42.23 | % |
Growth Fund | | | 4 | | | | 32.60 | % |
Mid Cap Growth Fund | | | 1 | | | | 29.01 | % |
11. Capital Shares. Each Fund may issue an unlimited number of shares of beneficial interest, without par value. Transactions in capital shares were as follows:
| | | | | | | | | | | | | | | | |
| |
| Year Ended
September 30, 2011 |
| |
| Year Ended
September 30, 2010 |
|
Global Equity and Income Fund | | | Shares | | | | Amount | | | | Shares | | | | Amount | |
| Class A | | | | | | | | | | | | | | | | |
Issued from the sale of shares | | | 5,840,219 | | | $ | 93,587,527 | | | | 2,185,512 | | | $ | 29,116,463 | |
Issued in connection with the reinvestment of distributions | | | 72,247 | | | | 1,114,772 | | | | 73,498 | | | | 923,132 | |
Redeemed | | | (2,449,449 | ) | | | (38,839,952 | ) | | | (1,460,708 | ) | | | (18,916,251 | ) |
| | | | | | | | | | | | | | | | |
Net change | | | 3,463,017 | | | $ | 55,862,347 | | | | 798,302 | | | $ | 11,123,344 | |
| | | | | | | | | | | | | | | | |
| Class C | | | | | | | | | | | | | | | | |
Issued from the sale of shares | | | 4,630,760 | | | $ | 73,457,166 | | | | 1,778,019 | | | $ | 23,110,162 | |
Issued in connection with the reinvestment of distributions | | | 29,527 | | | | 453,530 | | | | 53,353 | | | | 667,977 | |
Redeemed | | | (1,854,383 | ) | | | (29,059,321 | ) | | | (2,091,087 | ) | | | (27,231,329 | ) |
| | | | | | | | | | | | | | | | |
Net change | | | 2,805,904 | | | $ | 44,851,375 | | | | (259,715 | ) | | $ | (3,453,190 | ) |
| | | | | | | | | | | | | | | | |
| Class Y | | | | | | | | | | | | | | | | |
Issued from the sale of shares | | | 9,009,593 | �� | | $ | 143,819,801 | | | | 3,286,223 | | | $ | 43,183,799 | |
Issued in connection with the reinvestment of distributions | | | 117,939 | | | | 1,824,523 | | | | 145,986 | | | | 1,836,503 | |
Redeemed | | | (3,819,207 | ) | | | (60,187,744 | ) | | | (2,307,485 | ) | | | (29,912,166 | ) |
| | | | | | | | | | | | | | | | |
Net change | | | 5,308,325 | | | $ | 85,456,580 | | | | 1,124,724 | | | $ | 15,108,136 | |
| | | | | | | | | | | | | | | | |
Increase (decrease) from capital share transactions | | | 11,577,246 | | | $ | 186,170,302 | | | | 1,663,311 | | | $ | 22,778,290 | |
| | | | | | | | | | | | | | | | |
| 88
Notes to Financial Statements (continued)
September 30, 2011
11. Capital Shares (continued).
| | | | | | | | | | | | | | | | |
| |
| Year Ended
September 30, 2011 |
| |
| Year Ended
September 30, 2010 |
|
Growth Fund | | | Shares | | | | Amount | | | | Shares | | | | Amount | |
| Class A | | | | | | | | | | | | | | | | |
Issued from the sale of shares | | | 789,422 | | | $ | 4,312,824 | | | | 843,820 | | | $ | 4,085,570 | |
Issued in connection with the reinvestment of distributions | | | — | | | | — | | | | — | | | | — | |
Redeemed | | | (1,515,900 | ) | | | (8,531,709 | ) | | | (2,435,871 | ) | | | (11,723,591 | ) |
| | | | | | | | | | | | | | | | |
Net change | | | (726,478 | ) | | $ | (4,218,885 | ) | | | (1,592,051 | ) | | $ | (7,638,021 | ) |
| | | | | | | | | | | | | | | | |
| Class B | | | | | | | | | | | | | | | | |
Issued from the sale of shares | | | 12,241 | | | $ | 64,046 | | | | 26,879 | | | $ | 126,650 | |
Issued in connection with the reinvestment of distributions | | | — | | | | — | | | | — | | | | — | |
Redeemed | | | (322,361 | ) | | | (1,716,414 | ) | | | (449,262 | ) | | | (2,069,094 | ) |
| | | | | | | | | | | | | | | | |
Net change | | | (310,120 | ) | | $ | (1,652,368 | ) | | | (422,383 | ) | | $ | (1,942,444 | ) |
| | | | | | | | | | | | | | | | |
| Class C | | | | | | | | | | | | | | | | |
Issued from the sale of shares | | | 174,419 | | | $ | 922,261 | | | | 131,088 | | | $ | 596,834 | |
Issued in connection with the reinvestment of distributions | | | — | | | | — | | | | — | | | | — | |
Redeemed | | | (659,616 | ) | | | (3,529,748 | ) | | | (1,381,682 | ) | | | (6,253,716 | ) |
| | | | | | | | | | | | | | | | |
Net change | | | (485,197 | ) | | $ | (2,607,487 | ) | | | (1,250,594 | ) | | $ | (5,656,882 | ) |
| | | | | �� | | | | | | | | | | | |
| Class Y | | | | | | | | | | | | | | | | |
Issued from the sale of shares | | | 4,020,714 | | | $ | 24,184,766 | | | | 1,951,737 | | | $ | 9,949,238 | |
Issued in connection with the reinvestment of distributions | | | — | | | | — | | | | — | | | | — | |
Redeemed | | | (1,211,579 | ) | | | (7,292,357 | ) | | | (4,207,016 | ) | | | (21,249,147 | ) |
| | | | | | | | | | | | | | | | |
Net change | | | 2,809,135 | | | $ | 16,892,409 | | | | (2,255,279 | ) | | $ | (11,299,909 | ) |
| | | | | | | | | | | | | | | | |
Increase (decrease) from capital share transactions | | | 1,287,340 | | | $ | 8,413,669 | | | | (5,520,307 | ) | | $ | (26,537,256 | ) |
| | | | | | | | | | | | | | | | |
89 |
Notes to Financial Statements (continued)
September 30, 2011
11. Capital Shares (continued).
| | | | | | | | | | | | | | | | |
| |
| Year Ended
September 30, 2011 |
| |
| Year Ended
September 30, 2010 |
|
Mid Cap Growth Fund | | | Shares | | | | Amount | | | | Shares | | | | Amount | |
| Class A | | | | | | | | | | | | | | | | |
Issued from the sale of shares | | | 1,466,372 | | | $ | 40,418,776 | | | | 1,543,225 | | | $ | 34,666,538 | |
Issued in connection with the reinvestment of distributions | | | — | | | | — | | | | — | | | | — | |
Redeemed | | | (2,298,231 | ) | | | (65,461,720 | ) | | | (1,700,694 | ) | | | (35,573,122 | ) |
| | | | | | | | | | | | | | | | |
Net change | | | (831,859 | ) | | $ | (25,042,944 | ) | | | (157,469 | ) | | $ | (906,584 | ) |
| | | | | | | | | | | | | | | | |
| Class C | | | | | | | | | | | | | | | | |
Issued from the sale of shares | | | 98,542 | | | $ | 2,756,174 | | | | 2,038 | | | $ | 43,089 | |
Issued in connection with the reinvestment of distributions | | | — | | | | — | | | | — | | | | — | |
Redeemed | | | (8,837 | ) | | | (239,677 | ) | | | (650 | ) | | | (13,453 | ) |
| | | | | | | | | | | | | | | | |
Net change | | | 89,705 | | | $ | 2,516,497 | | | | 1,388 | | | $ | 29,636 | |
| | | | | | | | | | | | | | | | |
| Class Y | | | | | | | | | | | | | | | | |
Issued from the sale of shares | | | 1,071,985 | | | $ | 31,656,798 | | | | 303,029 | | | $ | 6,515,222 | |
Issued in connection with the reinvestment of distributions | | | — | | | | — | | | | — | | | | — | |
Redeemed | | | (453,103 | ) | | | (13,031,891 | ) | | | (363,286 | ) | | | (7,649,693 | ) |
| | | | | | | | | | | | | | | | |
Net change | | | 618,882 | | | $ | 18,624,907 | | | | (60,257 | ) | | $ | (1,134,471 | ) |
| | | | | | | | | | | | | | | | |
Increase (decrease) from capital share transactions | | | (123,272 | ) | | $ | (3,901,540 | ) | | | (216,338 | ) | | $ | (2,011,419 | ) |
| | | | | | | | | | | | | | | | |
| 90
Notes to Financial Statements (continued)
September 30, 2011
11. Capital Shares (continued).
| | | | | | | | | | | | | | | | |
| |
| Year Ended
September 30, 2011 |
| |
| Year Ended
September 30, 2010* |
|
Value Fund | | | Shares | | | | Amount | | | | Shares | | | | Amount | |
| Class A | | | | | | | | | | | | | | | | |
Issued from the sale of shares | | | 1,915,039 | | | $ | 35,613,722 | | | | 2,979,169 | | | $ | 49,942,924 | |
Issued in connection with the reinvestment of distributions | | | 88,461 | | | | 1,648,032 | | | | 60,746 | | | | 1,001,699 | |
Redeemed | | | (1,900,272 | ) | | | (35,517,239 | ) | | | (2,599,420 | ) | | | (43,052,197 | ) |
| | | | | | | | | | | | | | | | |
Net change | | | 103,228 | | | $ | 1,744,515 | | | | 440,495 | | | $ | 7,892,426 | |
| | | | | | | | | | | | | | | | |
| Class B | | | | | | | | | | | | | | | | |
Issued from the sale of shares | | | 11,718 | | | $ | 225,248 | | | | 19,365 | | | $ | 325,859 | |
Issued in connection with the reinvestment of distributions | | | 438 | | | | 8,207 | | | | — | | | | — | |
Redeemed | | | (81,989 | ) | | | (1,540,415 | ) | | | (137,739 | ) | | | (2,333,285 | ) |
| | | | | | | | | | | | | | | | |
Net change | | | (69,833 | ) | | $ | (1,306,960 | ) | | | (118,374 | ) | | $ | (2,007,426 | ) |
| | | | | | | | | | | | | | | | |
| Class C | | | | | | | | | | | | | | | | |
Issued from the sale of shares | | | 207,950 | | | $ | 3,898,637 | | | | 202,556 | | | $ | 3,401,414 | |
Issued in connection with the reinvestment of distributions | | | 1,601 | | | | 29,658 | | | | 939 | | | | 15,401 | |
Redeemed | | | (258,633 | ) | | | (4,682,108 | ) | | | (202,655 | ) | | | (3,347,711 | ) |
| | | | | | | | | | | | | | | | |
Net change | | | (49,082 | ) | | $ | (753,813 | ) | | | 840 | | | $ | 69,104 | |
| | | | | | | | | | | | | | | | |
| Class Y | | | | | | | | | | | | | | | | |
Issued from the sale of shares | | | 21,675,948 | | | $ | 394,526,208 | | | | 24,167,438 | | | $ | 406,626,788 | |
Issued in connection with the reinvestment of distributions | | | 734,748 | | | | 13,695,698 | | | | 379,395 | | | | 6,260,027 | |
Redeemed | | | (9,761,611 | ) | | | (181,413,250 | ) | | | (12,514,723 | ) | | | (207,737,479 | ) |
| | | | | | | | | | | | | | | | |
Net change | | | 12,649,085 | | | $ | 226,808,656 | | | | 12,032,110 | | | $ | 205,149,336 | |
| | | | | | | | | | | | | | | | |
| Admin Class | | | | | | | | | | | | | | | | |
Issued from the sale of shares | | | 27 | | | $ | 502 | | | | 60 | | | $ | 1,002 | |
Issued in connection with the reinvestment of distributions | | | 1 | | | | 11 | | | | — | | | | — | |
Redeemed | | | (3 | ) | | | (50 | ) | | | — | | | | — | |
| | | | | | | | | | | | | | | | |
Net change | | | 25 | | | $ | 463 | | | | 60 | | | $ | 1,002 | |
| | | | | | | | | | | | | | | | |
Increase (decrease) from capital share transactions | | | 12,633,423 | | | $ | 226,492,861 | | | | 12,355,131 | | | $ | 211,104,442 | |
| | | | | | | | | | | | | | | | |
| * | From commencement of operations on February 1, 2010 through September 30, 2010 for Admin Class shares. |
91 |
Report of Independent Registered Public Accounting Firm
To the Trustees of Loomis Sayles Funds II and Shareholders of Loomis Sayles Global Equity and Income Fund, Loomis Sayles Growth Fund, Loomis Sayles Mid Cap Growth Fund and Loomis Sayles Value Fund:
In our opinion, the accompanying statements of assets and liabilities, including the portfolios of investments, and the related statements of operations and of changes in net assets and the financial highlights present fairly, in all material respects, the financial position of the Loomis Sayles Global Equity and Income Fund (formerly Loomis Sayles Global Markets Fund), Loomis Sayles Growth Fund, Loomis Sayles Mid Cap Growth Fund and Loomis Sayles Value Fund, each a series of Loomis Sayles Funds II (collectively, the “Funds”), at September 30, 2011, and the results of each of their operations, the changes in each of their net assets and the financial highlights for each of the periods indicated, in conformity with accounting principles generally accepted in the United States of America. These financial statements and financial highlights (hereafter referred to as “financial statements”) are the responsibility of the Funds’ management; our responsibility is to express an opinion on these financial statements based on our audits. We conducted our audits of these financial statements in accordance with the standards of the Public Company Accounting Oversight Board (United States). Those standards require that we plan and perform the audits to obtain reasonable assurance about whether the financial statements are free of material misstatement. An audit includes examining, on a test basis, evidence supporting the amounts and disclosures in the financial statements, assessing the accounting principles used and significant estimates made by management, and evaluating the overall financial statement presentation. We believe that our audits, which included confirmation of securities at September 30, 2011 by correspondence with the custodian and brokers, provide a reasonable basis for our opinion.
PricewaterhouseCoopers LLP
Boston, Massachusetts
November 22, 2011
| 92
2011 U.S. Tax Distribution Information to Shareholders (Unaudited)
Corporate Dividends Received Deduction. For the fiscal year ended September 30, 2011, a percentage of dividends distributed by the Funds listed below qualify for the dividends received deduction for corporate shareholders. These percentages are as follows:
| | | | |
Fund | | Qualifying
Percentage | |
Global Equity and Income | | | 11.95 | % |
Value | | | 100.00 | % |
Qualified Dividend Income. For the fiscal year ended September 30, 2011, the Funds below will designate up to the maximum amount allowable pursuant to the Internal Revenue Code as qualified dividend income eligible for reduced tax rates. These lower rates range from 0% to 15% depending on an individual’s tax bracket. If the Funds pay a distribution during calendar year 2011, complete information will be reported in conjunction with Form 1099-DIV.
|
Fund |
Global Equity and Income |
Value |
93 |
Trustee and Officer Information
The tables below provide certain information regarding the trustees and officers of Loomis Sayles Funds II (the “Trust”). Unless otherwise indicated, the address of all persons below is 399 Boylston Street, Boston, MA 02116. The Funds’ Statements of Additional Information include additional information about the trustees of the Trust and are available by calling Natixis Funds at 800-225-5478.
| | | | | | | | |
Name and Year of Birth | | Position(s) Held
with the Trust,
Length of Time
Served and Term
of Office* | | Principal
Occupation(s)
During Past
5 Years | | Number of
Portfolios in
Fund Complex
Overseen**
and Other
Directorships Held
During Past 5
Years | | Experience,
Qualifications,
Attributes, Skills
for Board
Membership |
| | | |
| INDEPENDENT TRUSTEES | | | | | | |
| | | | |
Graham T. Allison, Jr.
(1940) | | Trustee Since 2003 Contract Review and Governance Committee Member | | Douglas Dillon Professor and Director of the Belfer Center for Science and International Affairs, John F. Kennedy School of Government, Harvard University | | 44 Director, Taubman Centers, Inc. (real estate investment trust) | | Significant experience on Board of Trustees of the Trust and/or other business organizations; government experience (including as Assistant Secretary of Defense under President Clinton); academic experience |
| | | | |
Charles D. Baker1
(1956) | | Trustee From 2005 to 2009 and since 2011 Contract Review and Governance Committee Member | | Executive in Residence at General Catalyst Partners (venture capital and growth equity firm); formerly, President and Chief Executive Officer, Harvard Pilgrim Health Care (health plan) | | 44 None | | Significant experience on Board of Trustees of the Trust and/or other business organizations; executive experience including president and chief executive officer of a corporation |
| | | | |
Edward A. Benjamin
(1938) | | Trustee Since 2002 Chairman of the Contract Review and Governance Committee | | Retired | | 44 Formerly, Director, Precision Optics Corporation (optics manufacturer) | | Significant experience on Board of Trustees of the Trust and/or other business organizations; significant experience providing legal counsel to boards, funds, advisers and other financial institutions (former partner at Ropes & Gray LLP) |
| 94
Trustee and Officer Information
| | | | | | | | |
Name and Year of Birth | | Position(s) Held
with the Trust,
Length of Time
Served and Term
of Office* | | Principal
Occupation(s)
During Past
5 Years | | Number of
Portfolios in
Fund Complex
Overseen**
and Other
Directorships Held
During Past 5
Years | | Experience,
Qualifications,
Attributes, Skills
for Board
Membership |
| | | |
INDEPENDENT TRUSTEES
continued | | | | | | |
| | | | |
Daniel M. Cain (1945) | | Trustee Since 2003 Contract Review and Governance Committee Member | | Chairman (formerly, President and Chief Executive Officer) of Cain Brothers & Company, Incorporated (investment banking) | | 44 Director, Sheridan Healthcare Inc. (physician practice management) | | Significant experience on Board of Trustees of the Trust and/or other business organizations; experience in the financial industry, including roles as chairman and former chief executive officer of an investment banking firm |
| | | | |
Kenneth A. Drucker
(1945) | | Trustee Since 2008 Chairman of the Audit Committee | | Formerly, Vice President and Treasurer, Sequa Corp. (aerospace, automotive and metal manufacturing) | | 44 Formerly, Director, M Fund, Inc. (investment company); Director, Gateway Trust (investment company) | | Significant experience on Board of Trustees of the Trust and/or other business organizations; executive experience including as treasurer of a corporation |
| | | | |
Wendell J. Knox
(1948) | | Trustee Since 2009 Audit Committee Member | | Director (formerly, President and Chief Executive Officer) of Abt Associates Inc. (research and consulting) | | 44 Director, Eastern Bank (commercial bank); Director, The Hanover Insurance Group (property and casualty insurance) | | Significant experience on Board of Trustees of the Trust and/or other business organizations; executive experience including roles as president and chief executive officer of a consulting company |
| | | | |
Sandra O. Moose
(1942) | | Chairperson of the Board of Trustees since November 2005 Trustee Since 2003 Ex officio member of the Audit Committee and Contract Review and Governance Committee | | President, Strategic Advisory Services (management consulting); formerly, Senior Vice President and Director, The Boston Consulting Group, Inc. (management consulting) | | 44 Director, Verizon Communications; Director, AES Corporation (international power company); Formerly, Director, Rohm and Haas Company (specialty chemicals) | | Significant experience on Board of Trustees of the Trust and/or other business organizations; executive experience at a management consulting company |
95 |
Trustee and Officer Information
| | | | | | | | |
Name and Year of Birth | | Position(s) Held
with the Trust,
Length of Time
Served and Term
of Office* | | Principal
Occupation(s)
During Past
5 Years | | Number of
Portfolios in
Fund Complex
Overseen**
and Other
Directorships Held
During Past 5
Years | | Experience,
Qualifications,
Attributes, Skills
for Board
Membership |
| | | |
INDEPENDENT TRUSTEES
continued | | | | | | |
| | | | |
Erik R. Sirri
(1958) | | Trustee Since 2009 Contract Review and Governance Committee Member | | Professor of Finance at Babson College; formerly, Director of the Division of Trading and Markets at the Securities and Exchange Commission | | 44 None | | Experience on Board of Trustees of the Trust; experience as Director of the Division of Trading and Markets at the Securities and Exchange Commission; academic experience and training as an economist |
| | | | |
Peter J. Smail
(1952) | | Trustee Since 2009 Contract Review and Governance Committee Member | | Retired; formerly, President and Chief Executive Officer of Pyramis Global Advisors (investment management) | | 44 None | | Experience on Board of Trustees of the Trust; mutual fund industry and executive experience, including roles as president and chief executive officer for an investment adviser |
| | | | |
Cynthia L. Walker
(1956) | | Trustee Since 2005 Audit Committee Member | | Deputy Dean for Finance and Administration, Yale University School of Medicine; formerly, Executive Dean for Administration, Harvard Medical School; and formerly, Dean for Finance and Chief Financial Officer, Harvard Medical School | | 44 None | | Significant experience on Board of Trustees of the Trust and/or other business organizations; executive experience in a variety of academic organizations, including roles as dean for finance and administration |
| | | |
| INTERESTED TRUSTEES | | | | | | |
| | | | |
Robert J. Blanding2
(1947) 555 California Street San Francisco, CA 94104 | | Trustee Since 2002 Chief Executive Officer of Loomis Sayles Funds II since 2002 | | President, Chairman, Director and Chief Executive Officer, Loomis, Sayles & Company, L.P. | | 44 None | | Significant experience on Board of Trustees of the Trust; continuing service as president, chairman, and chief executive officer of Loomis, Sayles & Company, L.P. |
| 96
Trustee and Officer Information
| | | | | | | | |
Name and Year of Birth | | Position(s) Held
with the Trust,
Length of Time
Served and Term
of Office* | | Principal
Occupation(s)
During Past
5 Years | | Number of
Portfolios in
Fund Complex
Overseen**
and Other
Directorships Held
During Past 5
Years | | Experience,
Qualifications,
Attributes, Skills
for Board
Membership |
| | | |
INTERESTED TRUSTEES
continued | | | | | | |
| | | | |
| David L. Giunta1, 3 (1965) | | Trustee Since 2011 President Since 2008 | | President and Chief Executive Officer, Natixis Distribution Corporation, Natixis Asset Management Advisors, L.P. and Natixis Distributors, L.P.; formerly President, Fidelity Charitable Gift Fund; and formerly, Senior Vice President, Fidelity Brokerage Company. | | 44 None | | Experience on Board of Trustees of the Trust; continuing experience as President and Chief Executive Officer of Natixis Global Associates – U.S. |
| | | | |
John T. Hailer4
(1960) | | Trustee Since 2003 | | President and Chief Executive Officer-U.S. and Asia, Natixis Global Asset Management, L.P.; formerly, President and Chief Executive Officer, Natixis Distribution Corporation, Natixis Asset Management Advisors, L.P., Natixis Distributors, L.P. and Natixis Global Associates, Inc. | | 44 None | | Significant experience on Board of Trustees of the Trust; continuing experience as Chief Executive Officer of Natixis Global Asset Management, L.P. |
| * | Each trustee serves until retirement, resignation or removal from the Board of Trustees. The current retirement age is 72; however, the trustees designated 2010 as a transition period so that any trustees who were age 72 or older during 2010 will not be required to retire until the end of calendar year 2011. The position of Chairperson of the Board is appointed for a two-year term. Ms. Moose was appointed to serve an additional two year term as the Chairperson of the Board of Trustees on November 20, 2009. |
| ** | The trustees of the Trust serve as trustees of a fund complex that includes all series of the Natixis Funds Trust I, Natixis Funds Trust II, Natixis Funds Trust IV and Gateway Trust (collectively, the “Natixis Funds Trusts”), Loomis Sayles Funds I and Loomis Sayles Funds II (collectively, the “Loomis, Sayles and Company, L.P. Funds Trusts”), and Hansberger International Series (collectively, the “Fund Complex”). |
| 1 | Mr. Baker and Mr. Giunta were appointed as trustees effective January 1, 2011. |
| 2 | Mr. Blanding is deemed an “interested person” of the Trust because he holds the following positions with an affiliated person of the Trust: President, Chairman, Director and Chief Executive Officer of Loomis Sayles. |
| 3 | Mr. Giunta is deemed an “interested person” of the Trust because he holds the following positions with an affiliated person of the Trust: President and Chief Executive Officer, Natixis Distribution Corporation, Natixis Asset Management Advisors, L.P. and Natixis Distributors, L.P |
| 4 | Mr. Hailer is deemed an “interested person” of the Trust because he holds the following positions with an affiliated person of the Trust: President and Chief Executive Officer – U.S. and Asia, Natixis Global Asset Management, L.P. |
97 |
Trustee and Officer Information
| | | | | | |
Name and Year of Birth | | Position(s) Held
with the Trust | | Term of Office* and
Length of Time Served | | Principal Occupation(s) During Past 5 Years** |
|
| OFFICERS OF THE TRUST |
| | | |
| Coleen Downs Dinneen (1960) | | Secretary, Clerk and Chief Legal Officer | | Since September 2004 | | Executive Vice President, General Counsel, Secretary and Clerk (formerly, Senior Vice President, Deputy General Counsel, Assistant Secretary and Assistant Clerk), Natixis Distribution Corporation, Natixis Asset Management Advisors, L.P. and Natixis Distributors, L.P. |
| | | |
Daniel J. Fuss
(1933) One Financial Center Boston, MA 02111 | | Executive Vice President | | Since June 2003 | | Vice Chairman and Director, Loomis, Sayles & Company, L.P. |
| | | |
Russell L. Kane (1969) | | Chief Compliance Officer, Assistant Secretary and Anti-Money Laundering Officer | | Chief Compliance Officer, since May 2006; Assistant Secretary since June 2004; and Anti-Money Laundering Officer since April 2007 | | Chief Compliance Officer for Mutual Funds, Senior Vice President, Deputy General Counsel, Assistant Secretary and Assistant Clerk, Natixis Distribution Corporation, Natixis Asset Management Advisors, L.P. and Natixis Distributors, L.P. |
| | | |
Michael C. Kardok
(1959) | | Treasurer, Principal Financial and Accounting Officer | | Since October 2004 | | Senior Vice President, Natixis Asset Management Advisors, L.P. and Natixis Distributors, L.P. |
| * | Each officer of the Trust serves for an indefinite term in accordance with the Trust’s current by-laws until the date his or her successor is elected and qualified, or until he or she sooner dies, retires, is removed or becomes disqualified. |
| ** | Each person listed above, except as noted, holds the same position(s) with the Natixis Funds Trusts, Loomis Sayles Funds Trust and Hansberger International Series. Mr. Fuss is not an officer of the Natixis Funds Trusts or the Hansberger International Series. Previous positions during the past five years with the Distributor, Natixis Advisors or Loomis Sayles are omitted, if not materially different from a trustee’s or officer’s current position with such entity. |
| 98

Loomis Sayles Small Cap Growth Fund
Loomis Sayles Small Cap Value Fund
ANNUAL REPORT
SEPTEMBER 30, 2011
LOOMIS SAYLES SMALL CAP GROWTH FUND
Fund and manager review
FUND FACTS
Managers:
Mark F. Burns, CFA
John Slavik, CFA
Symbols:
| | |
| Institutional Class | | LSSIX |
| Retail Class | | LCGRX |
Objective:
Long-term capital growth from investments in common stocks or other equity securities
Strategy:
Invests at least 80% of its net assets (plus any borrowings made for investment purposes) in equity securities of companies with market capitalizations that fall within the capitalization range of the Russell 2000 Index or is $3 billion or less at the time of investment. Unlike the Index, the Fund may invest in companies of any size.
The fund may invest any portion of its assets in Canadian securities and up to 20% of assets in other foreign securities, including emerging markets securities.
Fund Inception Date:
December 31, 1996
Net Assets:
$267.4 million
Market Conditions
The period began positively, as prospects for global economic growth appeared to be in place. Nevertheless, the markets began to struggle following a multitude of shocks, including a devastating earthquake and tsunami in Japan, which caused negative growth in the world’s third largest economy and disrupted the global supply chain, unrest in the Middle East and Northern Africa, which caused oil to spike above $100 a barrel, and Standard & Poor’s downgrade of the United States’ long-term credit rating. In Europe, the sovereign-debt crisis sent fears through the region’s banking system further roiling markets. These headwinds, coupled with weaker-than-anticipated U.S. economic data, led to an increase in market volatility as the second half of the period unfolded. Small-cap stocks were hit especially hard during the market volatility.
Performance Results
For the 12 months ended September 30, 2011, Institutional Class shares of Loomis Sayles Small Cap Growth Fund returned 7.34%. The fund outperformed its benchmark, the Russell 2000 Growth Index, which returned -1.12% for the period.
Explanation of Fund Performance
Robust stock selection in most sectors drove the fund’s outperformance. Relative to the benchmark, only the financial services sector underperformed, and the lagging results were due primarily to stock selection. Overall, positions in the consumer discretionary, producer durables, energy and materials and processing sectors made the greatest contributions to the fund’s 12-month relative return. In terms of individual holdings, Pharmasset, IPG Photonics and Ulta Salon Cosmetics & Fragrance were among the fund’s top performers. Pharmasset, a biotechnology company, advanced during the period after reporting multiple strong quarters and releasing positive data relating to its hepatitis C treatment, which was effective in 98% of patients participating in a recent clinical trial. Fiber laser
1 |
manufacturer IPG Photonics, a long-time holding of the fund, performed well after reporting a strong fourth quarter resulting from higher-than-expected revenues. Beauty products retailer Ulta Salon Cosmetics & Fragrance’s shares rose sharply from new product launches leading to successful penetration of their existing customer base and success in acquiring new customers.
On a sector basis, financial services was the only negative performer. In terms of individual holdings, Newpark Resources, Nektar Therapeutics and Dice Holdings were among the largest detractors from fund performance. Newpark Resources, a drilling services company, declined after reporting earnings that fell short of estimates, as a large customer reduced their usage of a Newpark product. Shares of Nektar Therapeutics, a biopharmaceutical company, declined after the company decided not to add a financial partner to help develop its cancer drug. The company raised capital to fund the drug’s development, which diluted earnings and caused the stock to sell off. In addition, shares of career services company Dice Holdings declined as the employment outlook weakened, which put pressure on Dice’s key business segments.
Outlook
The market remains highly responsive to and strongly influenced by macroeconomic and related geopolitical considerations, and we think it’s unlikely this pattern will change in the near term. It appears corporate earnings growth rates have peaked. For certain sectors, industries and many companies, earnings actually may decline in the year ahead. We also believe much of this bad news already has been priced into the market. Stock market valuation indicators point to equities being attractively valued relative to history, and equity valuations appear especially attractive relative to interest rates. While our long-term conviction in equities remains intact, especially at these low historical valuation levels, the near to intermediate term could offer a wide range of outcomes and continued volatility.
What You Should Know:
Investments in the fund are subject to a number of risks. Please see the “Principal Risks” section of the fund’s prospectus. The purchase of fund shares should be seen as a long-term investment.
| 2
LOOMIS SAYLES SMALL CAP GROWTH FUND
Average Annual Total Returns
September 30, 2011
| | | | | | | | | | | | | | |
| | | | | |
| | | | | 1 year | | | 5 years | | | 10 years | |
| | | | | |
| Institutional Class (Inception 12/31/96) | | | | | 7.34 | % | | | 4.65 | % | | | 5.48 | % |
| Retail Class (Inception 12/31/96) | | | | | 7.16 | | | | 4.40 | | | | 5.23 | |
| | | | | |
| Comparative Performance | | | | | | | | | | | | | | |
| Russell 2000 Growth Index(c) | | | | | -1.12 | | | | 0.96 | | | | 5.45 | |
| Russell 2000 Index(c) | | | | | -3.53 | | | | -1.02 | | | | 6.12 | |
| Lipper Small-Cap Growth Funds Index(c) | | | | | -1.10 | | | | 0.27 | | | | 4.52 | |
| Net expense ratio (after fee waivers and/or expense reimbursements)* | |
| Institutional: 1.03% Retail: 1.28% | | | | | | | | | | | | | | |
| * | | As stated in the most recent prospectus. Waivers/reimbursements are contractual and are set to expire on 1/31/12. Contracts are reevaluated on an annual basis. |
Cumulative Performance
September 30, 2001 to September 30, 2011(a)(b)
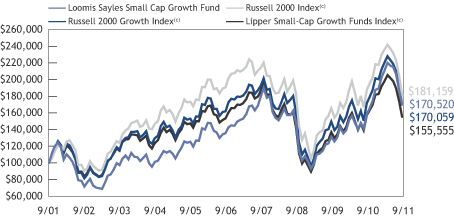
Performance data quoted represents past performance and is no guarantee of future results. Total return and value will vary and you may have a gain or loss when shares are sold. Current performance may be lower or higher than quoted. For most recent month-end performance, visit loomissayles.com. You may not invest directly in an index. Performance for periods less than one year is cumulative, not annualized. Returns reflect changes in share price and reinvestment of dividends and capital gains, if any. Performance data reflects certain fee waivers and/or expense reimbursements, if any, without which performance would be lower.
The table and graph do not reflect taxes shareholders might owe on any fund distributions or when they redeem their shares.
| (a) | | Cumulative performance is shown for the Institutional Class. Performance of the Retail Class would be lower due to higher fees and expenses. |
| (b) | | The mountain chart is based on the initial investment minimum of $100,000 for the Institutional Class. |
| (c) | | See page 7 for a description of the indices. |
3 |
LOOMIS SAYLES SMALL CAP VALUE FUND
Fund and manager review
FUND FACTS
Managers:
Joseph Gatz, CFA
Symbols:
| | |
| Institutional Class | | LSSCX |
| Retail Class | | LSCRX |
| Admin Class | | LSVAX |
Objective:
Long-term capital growth from investments in common stocks or other equity securities
Strategy:
Invests at least 80% of its net assets (plus any borrowings made for investment purposes) in equity securities of companies with market capitalizations that fall within the capitalization range of the Russell 2000 Index or is $3 billion or less at the time of investment. Unlike the Index, the Fund may invest in companies of any size.
The fund may invest up to 20% of its assets in securities of foreign issuers including emerging market securities.
Fund Inception Date:
May 13, 1991
Class Inception Date:
Institutional Class: May 13, 1991
Retail Class: December 31, 1996
Admin Class: January 2, 1998
Net Assets:
$845.0 million
Market Conditions
Small cap value stocks began the period with robust gains in late 2010 and early 2011, only to see markets reverse in the late spring and summer of 2011. Initial gains were fueled by a modest improvement in U.S. business conditions and investor optimism stemming from continued accommodation from the Federal Reserve Board. The subsequent decline was triggered by moderating economic data points and renewed concerns over global sovereign debt, the European banking sector, and the lack of political initiative to solve these problems. Nearly all sectors in the Russell 2000 Value Index declined during the period, with economically sensitive sectors suffering the most. Utilities were the only sector to record a material gain for the 12-month period, aided by higher dividend yields and less sensitivity to economic trends.
Performance Results
For the 12 months ended September 30, 2011, Institutional Class shares of Loomis Sayles Small Cap Value Fund returned -1.88%. The fund outperformed its benchmark, the Russell 2000 Value Index, which returned -5.99% for the period.
Explanation of Fund Performance
Favorable stock selection in the producer durables, financial services and consumer discretionary sectors drove the fund’s relative outperformance, offsetting a slight shortfall in the materials and processing sector. The leading stocks during the period included Baldor Electric, a manufacturer of industrial electric motors and power transmission products. Baldor was among the fund’s largest holdings during the fourth quarter of 2010, when the company announced a merger agreement with Switzerland-based power and automation engineering company ABB Ltd. Another leading performer was DFC Global Corporation, a provider of consumer loans, including pawn and payday lending services. The company has maintained strong earnings growth through international expansion and a
| 4
growing available market due to traditional banks cutting back on consumer lending services. Genesco Inc., a specialty retailer of footwear and headwear, also was a leading contributor. The company’s shares advanced after earnings exceeded expectations and the company announced a potentially promising international acquisition.
Among the worst individual performers were industrial battery supplier EnerSys Inc., specialty chemical manufacturer Ferro Corporation., and hotel real estate investment trust Hersha Hospitality. All three stocks declined on mounting concerns about economic growth and the potential for reduced earnings.
In terms of absolute performance, a positive contribution was achieved within the producer durables and consumer discretionary sectors, offset by a negative contribution from materials & processing and financial services.
Outlook
The market remains highly responsive to and strongly influenced by macroeconomic and related geopolitical considerations, and we think it’s unlikely this pattern will change in the near term. It appears corporate earnings growth rates have peaked. For certain sectors, industries and many companies: earnings actually may decline in the year ahead. We also believe much of this bad news already has been priced into the market. Stock market valuation indicators point to equities being attractively priced relative to history, and equity valuations appear especially attractive relative to interest rates. While our long-term conviction in equities remains intact, especially at these low historical valuation levels, the near to intermediate term could offer a wide range of outcomes and continued volatility.
What You Should Know:
Investments in the fund are subject to a number of risks. Please see the “Principal Risks” section of the fund’s prospectus. The purchase of fund shares should be seen as a long-term investment.
5 |
LOOMIS SAYLES SMALL CAP VALUE FUND
Average Annual Total Returns
September 30, 2011
| | | | | | | | | | | | | | |
| | | | | |
| | | | | 1 year | | | 5 years | | | 10 years | |
| | | | | |
| Institutional Class (Inception 5/13/91) | | | | | -1.88 | % | | | 0.55 | % | | | 7.22 | % |
| Retail Class (Inception 12/31/96) | | | | | -2.12 | | | | 0.31 | | | | 6.96 | |
| Admin Class (Inception 1/2/98) | | | | | -2.40 | | | | 0.04 | | | | 6.69 | |
| | | | | |
| Comparative Performance | | | | | | | | | | | | | | |
| Russell 2000 Value Index(c) | | | | | -5.99 | | | | -3.08 | | | | 6.47 | |
| Russell 2000 Index(c) | | | | | -3.53 | | | | -1.02 | | | | 6.12 | |
| Lipper Small-Cap Core Funds Index(c) | | | | | -2.54 | | | | 0.26 | | | | 6.52 | |
| |
| Net expense ratio (after fee waivers and/or expense reimbursements)* | |
| Institutional: 0.96% Retail: 1.21% Admin: 1.46% | |
| * | | As stated in the most recent prospectus. Waivers/reimbursements are contractual and are set to expire on 1/31/12. Contracts are reevaluated on an annual basis. |
Cumulative Performance
September 30, 2001 to September 30, 2011(a)(b)
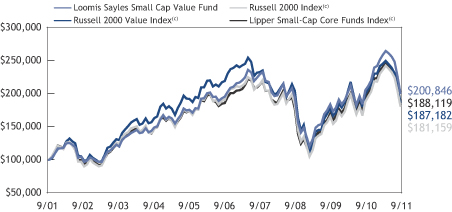
Performance data quoted represents past performance and is no guarantee of future results. Total return and value will vary and you may have a gain or loss when shares are sold. Current performance may be lower or higher than quoted. For most recent month-end performance, visit loomissayles.com. You may not invest directly in an index. Performance for periods less than one year is cumulative, not annualized. Returns reflect changes in share price and reinvestment of dividends and capital gains, if any. Performance data reflects certain fee waivers and/or expense reimbursements, if any, without which performance would be lower.
The table and graph do not reflect taxes shareholders might owe on any fund distributions or when they redeem their shares.
| (a) | | Cumulative performance is shown for the Institutional Class. Performance of the Retail and Admin Classes would be lower due to higher fees and expenses. |
| (b) | | The mountain chart is based on the initial investment minimum of $100,000 for the Institutional Class. |
| (c) | | See page 7 for a description of the indices. |
| 6
ADDITIONAL INFORMATION
The views expressed in this report reflect those of the portfolio managers as of the dates indicated. The managers’ views are subject to change at any time without notice based on changes in market or other conditions. References to specific securities or industries should not be regarded as investment advice. Because the funds are actively managed, there is no assurance that they will continue to invest in the securities or industries mentioned.
Index Definitions
Indices are unmanaged and do not have expenses that affect results, unlike mutual funds. Index returns are adjusted for the reinvestment of capital gain distributions and income dividends. It is not possible to invest directly in an index.
Lipper Small-Cap Core Funds Index is an unmanaged index that tracks the average performance of the 30 largest small-cap core funds according to Lipper Inc.
Lipper Small-Cap Growth Funds Index is an unmanaged index that tracks the average performance of the 30 largest small-cap growth funds according to Lipper Inc.
Source: Lipper, Inc.
Russell 2000 Index is an unmanaged index that measures the performance of the small-cap segment of the U.S. equity universe.
Russell 2000 Growth Index is an unmanaged index that measures the performance of the small-cap growth segment of the U.S. equity universe. It includes those Russell 2000 companies with higher price-to-book ratios and higher forecasted growth values.
Russell 2000 Value Index is an unmanaged index that measures the performance of the small-cap value segment of the U.S. equity universe. It includes those Russell 2000 companies with lower price-to-book ratios and lower forecasted growth values.
Proxy Voting Information
A description of the funds’ proxy voting policies and procedures is available without charge, upon request, (i) by calling Loomis Sayles at 800-633-3330; (ii) on the funds’ website, www.loomissayles.com, and (iii) on the SEC’s website, www.sec.gov. Information about how the funds voted proxies relating to portfolio securities during the 12 months ended June 30, 2011 is available on (i) the funds’ website and (ii) the SEC’s website.
Quarterly Portfolio Schedules
The funds file a complete schedule of portfolio holdings with the SEC for the first and third quarters of each fiscal year on Form N-Q. The funds’ Forms N-Q are available on the SEC’s website at www.sec.gov and may be reviewed and copied at the SEC’s Public Reference Room in Washington, DC. Information on the operation of the Public Reference Room may be obtained by calling 800-SEC-0330.
7 |
UNDERSTANDING YOUR FUND’S EXPENSES
As a mutual fund shareholder you incur two types of costs: (1) transaction costs and (2) ongoing costs, including management fees, distribution and/or service fees (12b-1 fees), and other fund expenses. These costs are described in more detail in the funds’ prospectus. The examples below are intended to help you understand the ongoing costs of investing in the funds and help you compare these with the ongoing costs of investing in other mutual funds.
The first line in the table of each fund shows the actual amount of fund expenses you would have paid on a $1,000 investment in the fund from April 1, 2011 through September 30, 2011. It also shows how much a $1,000 investment would be worth at the close of the period, assuming actual fund returns and expenses. To estimate the expenses you paid over the period, simply divide your account value by $1,000 (for example $8,600 account value divided by $1,000 = 8.6) and multiply the result by the number in the Expenses Paid During Period column as shown below for your class.
The second line in the table of each fund provides information about hypothetical account values and hypothetical expenses based on the fund’s actual expense ratios and an assumed rate of return of 5% per year before expenses, which is not the fund’s actual return. The hypothetical account values and expenses may not be used to estimate the actual ending account balance or expenses you paid on your investment for the period. You may use this information to compare the ongoing costs of investing in the funds and other funds. To do so, compare this 5% hypothetical example with the 5% hypothetical examples that appear in the shareholder reports of other funds.
Please note that the expenses shown reflect ongoing costs only, and do not include any transaction costs. Therefore, the second line in the table is useful in comparing ongoing costs only, and will not help you determine the relative costs of owning different funds. If transaction costs were included, total costs would be higher.
Loomis Sayles Small Cap Growth Fund
| | | | | | | | | | | | |
Institutional Class | | Beginning
Account Value
4/1/2011 | | | Ending
Account Value
9/30/2011 | | | Expenses Paid
During Period*
4/1/2011 – 9/30/2011 | |
Actual | | | $1,000.00 | | | | $810.50 | | | | $4.36 | |
Hypothetical
(5% return before expenses) | | | $1,000.00 | | | | $1,020.26 | | | | $4.86 | |
| | | |
Retail Class | | | | | | | | | |
Actual | | | $1,000.00 | | | | $809.80 | | | | $5.67 | |
Hypothetical
(5% return before expenses) | | | $1,000.00 | | | | $1,018.80 | | | | $6.33 | |
* Expenses are equal to the Fund’s annualized expense ratio (after waiver/reimbursement): 0.96% and 1.25% for Institutional and Retail Class, respectively, multiplied by the average account value over the period, multiplied by the number of days in the most recent fiscal half-year, divided by 365 (to reflect the half-year period). | |
| 8
Loomis Sayles Small Cap Value Fund
| | | | | | | | | | | | |
Institutional Class | | Beginning
Account Value
4/1/2011 | | | Ending
Account Value
9/30/2011 | | | Expenses Paid
During Period*
4/1/2011 – 9/30/2011 | |
Actual | | | $1,000.00 | | | | $778.00 | | | | $4.01 | |
Hypothetical
(5% return before expenses) | | | $1,000.00 | | | | $1,020.56 | | | | $4.56 | |
| | | |
Retail Class | | | | | | | | | |
Actual | | | $1,000.00 | | | | $777.10 | | | | $5.12 | |
Hypothetical
(5% return before expenses) | | | $1,000.00 | | | | $1,019.30 | | | | $5.82 | |
| | | |
Admin Class | | | | | | | | | |
Actual | | | $1,000.00 | | | | $776.00 | | | | $6.23 | |
Hypothetical
(5% return before expenses) | | | $1,000.00 | | | | $1,018.05 | | | | $7.08 | |
* Expenses are equal to the Fund’s annualized expense ratio (after waiver/reimbursement): 0.90%, 1.15% and 1.40% for Institutional, Retail and Admin Class, respectively, multiplied by the average account value over the period, multiplied by the number of days in the most recent fiscal half-year, divided by 365 (to reflect the half-year period). | |
9 |
BOARD APPROVAL OF THE EXISTING ADVISORY AGREEMENTS
The Board of Trustees, including the Independent Trustees, considers matters bearing on each Fund’s advisory agreement (collectively, the “Agreements”) at most of its meetings throughout the year. Each year, usually in the spring, the Contract Review and Governance Committee of the Board meets to review the Agreements to determine whether to recommend that the full Board approve the continuation of the Agreements, typically for an additional one-year period. After the Committee has made its recommendation, the full Board, including the Independent Trustees, determines whether to approve the continuation of the Agreements.
In connection with these meetings, the Trustees receive materials that the Funds’ investment adviser (the “Adviser”) believes to be reasonably necessary for the Trustees to evaluate the Agreements. These materials generally include, among other items, (i) information on the investment performance of the Funds and the performance of peer groups of funds and the Funds’ performance benchmarks, (ii) information on the Funds’ advisory fees and other expenses, including information comparing the Funds’ expenses to the fees charged to institutional accounts with similar strategies managed by the Adviser and to those of peer groups of funds and information about applicable expense caps and fee “breakpoints,” (iii) sales and redemption data in respect of the Funds, (iv) information about the profitability of the Agreements to the Adviser and (v) information obtained through the completion of a questionnaire by the Adviser (the Trustees are consulted as to the information requested through that questionnaire). The Board of Trustees, including the Independent Trustees, also consider other matters such as (i) the Adviser’s financial results and financial condition, (ii) each Fund’s investment objective and strategies and the size, education and experience of the Adviser’s investment staff and its use of technology, external research and trading cost measurement tools, (iii) arrangements in respect of the distribution of the Funds’ shares and the related costs, (iv) the procedures employed to determine the value of the Funds’ assets, (v) the allocation of the Funds’ brokerage, if any, including, if applicable, allocations to brokers affiliated with the Adviser and the use of “soft” commission dollars to pay Fund expenses and to pay for research and other similar services, (vi) the resources devoted to, and the record of compliance with, the Funds’ investment policies and restrictions, policies on personal securities transactions and other compliance policies, (vii) information about amounts invested by the Funds’ portfolio managers in the Funds or in similar accounts that they manage and (viii) the general economic outlook with particular emphasis on the mutual fund industry. Throughout the process, the Trustees are afforded the opportunity to ask questions of and request additional materials from the Adviser.
In addition to the materials requested by the Trustees in connection with their annual consideration of the continuation of the Agreements, the Trustees receive materials in advance of each regular quarterly meeting of the Board of Trustees that provide detailed information about the Funds’ investment performance and the fees charged to the Funds for advisory and other services. This information generally includes, among other things, an internal performance rating for each Fund based on agreed-upon criteria, graphs showing each Fund’s performance and fee differentials against each Fund’s peer group of
| 10
funds, performance ratings provided by a third-party, total return information for various periods, and third-party performance rankings for various periods comparing a Fund against its peer group. The portfolio management team for each Fund or other representatives of the Adviser make periodic presentations to the Contract Review and Governance Committee and/or the full Board of Trustees, and Funds identified as presenting possible performance concerns may be subject to more frequent board presentations and reviews. In addition, each quarter the Trustees are provided with detailed statistical information about each Fund’s portfolio. The Trustees also receive periodic updates between meetings.
The Board of Trustees most recently approved the continuation of the Agreements at their meeting held in June 2011. The Agreements were continued for a one-year period for the Funds. In considering whether to approve the continuation of the Agreements, the Board of Trustees, including the Independent Trustees, did not identify any single factor as determinative. Individual Trustees may have evaluated the information presented differently from one another, giving different weights to various factors. Matters considered by the Trustees, including the Independent Trustees, in connection with their approval of the Agreements included, but were not limited to, the factors listed below.
The nature, extent and quality of the services provided to the Funds under the Agreements. The Trustees considered the nature, extent and quality of the services provided by the Adviser and its affiliates to the Funds and the resources dedicated to the Funds by the Adviser and its affiliates. The Trustees also considered the administrative services provided by Natixis Asset Management Advisors, L.P. (“Natixis Advisors”) and its affiliates to the Funds.
For each Fund, the Trustees also considered the benefits to shareholders of investing in a mutual fund that is part of a family of funds that offers shareholders the right to exchange shares of one type of fund for shares of another type of fund, and provides a variety of fund and shareholder services.
After reviewing these and related factors, the Trustees concluded, within the context of their overall conclusions regarding each of the Agreements, that the nature, extent and quality of services provided supported the renewal of the Agreements.
Investment performance of the Funds and the Adviser. As noted above, the Trustees received information about the performance of the Funds over various time periods, including information which compared the performance of the Funds to the performance of peer groups of funds and the Funds’ respective performance benchmarks. In addition, the Trustees also reviewed data prepared by an independent third party which analyzed the performance of the Funds using a variety of performance metrics, including metrics which also measured the performance of the Funds on a risk adjusted basis.
With respect to each Fund, the Board concluded that the Fund’s performance or other relevant factors supported the renewal of the Agreement relating to that Fund. In the case of the Loomis Sayles Small Cap Value Fund, the performance of which lagged that of a relevant peer group of funds for certain (although not necessarily all) periods, the Board concluded that other factors relevant to performance supported renewal of the relevant Agreement, including (1) that the underperformance was attributable, to a significant
11 |
extent, to investment decisions (such as security selection or sector allocation) by the Adviser that were reasonable and consistent with the Fund’s investment objective and policies; (2) that although the Fund’s performance lagged that of its relevant peer group for certain recent periods, performance was stronger when compared to the Fund’s relevant performance benchmark; and (3) that the Fund’s more recent performance was competitive when compared to relevant performance benchmarks or peer groups.
The Trustees also considered the Adviser’s performance and reputation generally, the Funds’ performance as a fund family generally (as noted by certain financial publications), and the historical responsiveness of the Adviser to Trustee concerns about performance and the willingness of the Adviser to take steps intended to improve performance.
After reviewing these and related factors, the Trustees concluded, within the context of their overall conclusions regarding each of the Agreements, that the performance of the Funds and the Adviser supported the renewal of the Agreements.
The costs of the services to be provided and profits to be realized by the Adviser and its affiliates from their respective relationships with the Funds. The Trustees considered the fees charged to the Funds for advisory services as well as the total expense levels of the Funds. This information included comparisons (provided both by management and also by an independent third party) of the Funds’ advisory fees and total expense levels to those of their peer groups and information about the advisory fees charged by the Adviser to comparable accounts (such as institutional separate accounts), as well as information about differences in such fees. In considering the fees charged to comparable accounts, the Trustees considered, among other things, management’s representations about the differences between managing mutual funds as compared to other types of accounts, including the additional resources required to effectively manage and the greater regulatory costs associated with the management of mutual fund assets. In evaluating each Fund’s advisory fee, the Trustees also took into account the demands, complexity and quality of the investment management of such Fund and the need for the Adviser to offer competitive compensation. The Trustees considered that over the past several years, management had made recommendations regarding reductions in advisory fee rates, implementation of advisory fee breakpoints and the institution of advisory fee waivers and expense caps for various funds in the fund family. They noted that both of the Loomis Sayles Funds in this report have expense caps in place, and they considered the amounts waived or reimbursed by the Adviser under these caps.
The Trustees also considered the compensation directly or indirectly received by the Adviser and its affiliates from their relationships with the Funds. The Trustees reviewed information provided by management as to the profitability of the Adviser and its affiliates’ relationships with the Funds, and information about the allocation of expenses used to calculate profitability. They also reviewed information provided by management about the effect of distribution costs and changes in asset levels on Adviser profitability, including information regarding resources spent on distribution activities. When reviewing profitability, the Trustees also considered information about court cases in which adviser profitability was an issue, the performance of the relevant Funds, the expense levels of the Funds, and whether the Adviser had implemented breakpoints and/or expense caps with respect to such Funds.
| 12
After reviewing these and related factors, the Trustees concluded, within the context of their overall conclusions regarding each of the Agreements, that the advisory fee charged to each of the Funds was fair and reasonable, and that the costs of these services generally and the related profitability of the Adviser and its affiliates in respect of their relationships with the Funds supported the renewal of the Agreements.
Economies of Scale. The Trustees considered the existence of any economies of scale in the provision of services by the Adviser and whether those economies are shared with the Funds through breakpoints in their investment advisory fees or other means, such as expense waivers or caps. The Trustees noted that although each Fund’s management fee was not subject to breakpoints, each Fund’s management fee and overall net expense ratio was at or below the median fee for a peer group of funds and that each of the Funds was subject to an expense cap. In considering these issues, the Trustees also took note of the costs of the services provided (both on an absolute and a relative basis) and the profitability to the Adviser and its affiliates of their relationships with the Funds, as discussed above.
After reviewing these and related factors, the Trustees concluded, within the context of their overall conclusions regarding each of the Agreements, that the extent to which economies of scale were shared with the Funds supported the renewal of the Agreements.
The Trustees also considered other factors, which included but were not limited to the following:
| • | | The effect of recent market and economic turmoil on the performance, asset levels and expense ratios of each Fund. |
| • | | Whether each Fund has operated in accordance with its investment objective and the Fund’s record of compliance with its investment restrictions, and the compliance programs of the Funds and the Adviser. They also considered the compliance-related resources the Adviser and its affiliates were providing to the Funds. |
| • | | The nature, quality, cost and extent of administrative and shareholder services performed by the Adviser and its affiliates, both under the Agreements and under separate agreements covering administrative services. |
| • | | So-called “fallout benefits” to the Adviser, such as the engagement of affiliates of the Adviser to provide distribution, administrative and brokerage services to the Funds, and the benefits of research made available to the Adviser by reason of brokerage commissions (if any) generated by the Funds’ securities transactions. The Trustees also considered the fact that Natixis Advisors’ parent company benefits from the retention of an affiliated Adviser. The Trustees considered the possible conflicts of interest associated with these fallout and other benefits, and the reporting, disclosure and other processes in place to disclose and monitor such possible conflicts of interest. |
| • | | The Trustees’ review and discussion of the Funds’ advisory arrangements in prior years, and management’s record of responding to Trustee concerns raised during the year and in prior years. |
Based on their evaluation of all factors that they deemed to be material, including those factors described above, and assisted by the advice of independent counsel, the Trustees, including the Independent Trustees, concluded that each of the existing Agreements should be continued through June 30, 2012.
13 |
Portfolio of Investments – as of September 30, 2011
Loomis Sayles Small Cap Growth Fund
| | | | | | | | |
Shares | | | Description | | Value (†) | |
| | | | | | | | |
| |
| | Common Stocks – 95.7% of Net Assets | | | | |
| | |
| | | | Aerospace & Defense – 2.4% | | | | |
| | 60,185 | | | HEICO Corp. | | $ | 2,963,510 | |
| | 160,695 | | | Hexcel Corp.(b) | | | 3,561,001 | |
| | | | | | | | |
| | | | | | | 6,524,511 | |
| | | | | | | | |
| | | | Air Freight & Logistics – 1.4% | | | | |
| | 57,775 | | | Atlas Air Worldwide Holdings, Inc.(b) | | | 1,923,330 | |
| | 68,723 | | | HUB Group, Inc., Class A(b) | | | 1,942,799 | |
| | | | | | | | |
| | | | | | | 3,866,129 | |
| | | | | | | | |
| | | | Auto Components – 1.7% | | | | |
| | 196,986 | | | Amerigon, Inc.(b) | | | 2,507,632 | |
| | 78,838 | | | Tenneco, Inc.(b) | | | 2,019,041 | |
| | | | | | | | |
| | | | | | | 4,526,673 | |
| | | | | | | | |
| | | | Biotechnology – 3.1% | | | | |
| | 84,556 | | | Cepheid, Inc.(b) | | | 3,283,310 | |
| | 84,410 | | | Cubist Pharmaceuticals, Inc.(b) | | | 2,981,361 | |
| | 137,162 | | | Incyte Corp. Ltd.(b) | | | 1,916,153 | |
| | | | | | | | |
| | | | | | | 8,180,824 | |
| | | | | | | | |
| | | | Building Products – 0.6% | | | | |
| | 204,644 | | | NCI Building Systems, Inc.(b) | | | 1,547,109 | |
| | | | | | | | |
| | | | Capital Markets – 2.5% | | | | |
| | 102,159 | | | Evercore Partners, Inc., Class A | | | 2,329,225 | |
| | 104,582 | | | Financial Engines, Inc.(b) | | | 1,893,980 | |
| | 91,736 | | | Stifel Financial Corp.(b) | | | 2,436,508 | |
| | | | | | | | |
| | | | | | | 6,659,713 | |
| | | | | | | | |
| | | | Commercial Banks – 1.9% | | | | |
| | 58,796 | | | Signature Bank(b) | | | 2,806,333 | |
| | 59,482 | | | SVB Financial Group(b) | | | 2,200,834 | |
| | | | | | | | |
| | | | | | | 5,007,167 | |
| | | | | | | | |
| | | | Commercial Services & Supplies – 2.6% | | | | |
| | 148,959 | | | Mobile Mini, Inc.(b) | | | 2,448,886 | |
| | 133,826 | | | Waste Connections, Inc. | | | 4,525,995 | |
| | | | | | | | |
| | | | | | | 6,974,881 | |
| | | | | | | | |
| | | | Construction & Engineering – 0.8% | | | | |
| | 128,529 | | | MasTec, Inc.(b) | | | 2,263,396 | |
| | | | | | | | |
| | | | Consumer Finance – 1.0% | | | | |
| | 62,573 | | | First Cash Financial Services, Inc.(b) | | | 2,624,937 | |
| | | | | | | | |
| | | | Diversified Consumer Services – 0.9% | | | | |
| | 92,548 | | | K12, Inc.(b) | | | 2,356,272 | |
| | | | | | | | |
See accompanying notes to financial statements.
| 14
Portfolio of Investments – as of September 30, 2011
Loomis Sayles Small Cap Growth Fund – continued
| | | | | | | | |
Shares | | | Description | | Value (†) | |
| | | | | | | | |
| |
| | Common Stocks – continued | | | | |
| | |
| | | | Diversified Financial Services – 1.0% | | | | |
| | 93,208 | | | MSCI, Inc., Class A(b) | | $ | 2,826,999 | |
| | | | | | | | |
| | | | Electrical Equipment – 0.9% | | | | |
| | 43,056 | | | Polypore International, Inc.(b) | | | 2,433,525 | |
| | | | | | | | |
| | | | Electronic Equipment, Instruments & Components – 2.6% | | | | |
| | 46,299 | | | IPG Photonics Corp.(b) | | | 2,011,229 | |
| | 149,293 | | | Maxwell Technologies, Inc.(b) | | | 2,748,484 | |
| | 83,786 | | | Measurement Specialties, Inc.(b) | | | 2,175,084 | |
| | | | | | | | |
| | | | | | | 6,934,797 | |
| | | | | | | | |
| | | | Energy Equipment & Services – 3.2% | | | | |
| | 73,262 | | | C&J Energy Services, Inc.(b) | | | 1,204,427 | |
| | 44,253 | | | Lufkin Industries, Inc. | | | 2,354,702 | |
| | 347,434 | | | Newpark Resources, Inc.(b) | | | 2,115,873 | |
| | 81,263 | | | Oceaneering International, Inc. | | | 2,871,835 | |
| | | | | | | | |
| | | | | | | 8,546,837 | |
| | | | | | | | |
| | | | Food & Staples Retailing – 1.1% | | | | |
| | 76,237 | | | Fresh Market, Inc. (The)(b) | | | 2,909,204 | |
| | | | | | | | |
| | | | Food Products – 0.8% | | | | |
| | 25,990 | | | Diamond Foods, Inc. | | | 2,073,742 | |
| | | | | | | | |
| | | | Health Care Equipment & Supplies – 5.9% | | | | |
| | 59,397 | | | Cyberonics, Inc.(b) | | | 1,680,935 | |
| | 173,627 | | | DexCom, Inc.(b) | | | 2,083,524 | |
| | 164,904 | | | Insulet Corp.(b) | | | 2,516,435 | |
| | 107,574 | | | Masimo Corp. | | | 2,328,977 | |
| | 95,650 | | | NxStage Medical, Inc.(b) | | | 1,995,259 | |
| | 86,239 | | | Tornier NV(b) | | | 1,767,037 | |
| | 113,049 | | | Volcano Corp.(b) | | | 3,349,642 | |
| | | | | | | | |
| | | | | | | 15,721,809 | |
| | | | | | | | |
| | | | Health Care Providers & Services – 6.9% | | | | |
| | 49,567 | | | Catalyst Health Solutions, Inc.(b) | | | 2,859,520 | |
| | 173,616 | | | Hanger Orthopedic Group, Inc.(b) | | | 3,279,606 | |
| | 174,753 | | | HMS Holdings Corp.(b) | | | 4,262,226 | |
| | 36,344 | | | MWI Veterinary Supply, Inc.(b) | | | 2,501,194 | |
| | 144,289 | | | PSS World Medical, Inc.(b) | | | 2,841,051 | |
| | 171,036 | | | Team Health Holdings, Inc.(b) | | | 2,808,411 | |
| | | | | | | | |
| | | | | | | 18,552,008 | |
| | | | | | | | |
| | | | Health Care Technology – 1.7% | | | | |
| | 82,771 | | | SXC Health Solutions Corp.(b) | | | 4,610,345 | |
| | | | | | | | |
| | | | Hotels, Restaurants & Leisure – 2.0% | | | | |
| | 25,791 | | | Panera Bread Co., Class A(b) | | | 2,680,717 | |
| | 204,966 | | | Texas Roadhouse, Inc. | | | 2,709,650 | |
| | | | | | | | |
| | | | | | | 5,390,367 | |
| | | | | | | | |
See accompanying notes to financial statements.
15 |
Portfolio of Investments – as of September 30, 2011
Loomis Sayles Small Cap Growth Fund – continued
| | | | | | | | |
Shares | | | Description | | Value (†) | |
| | | | | | | | |
| |
| | Common Stocks – continued | | | | |
| | |
| | | | Household Durables – 0.9% | | | | |
| | 44,346 | | | Tempur-Pedic International, Inc.(b) | | $ | 2,333,043 | |
| | | | | | | | |
| | | | Internet & Catalog Retail – 0.8% | | | | |
| | 55,525 | | | Shutterfly, Inc.(b) | | | 2,286,520 | |
| | | | | | | | |
| | | | Internet Software & Services – 5.1% | | | | |
| | 74,549 | | | Ancestry.com, Inc.(b) | | | 1,751,901 | |
| | 122,882 | | | Constant Contact, Inc.(b) | | | 2,124,630 | |
| | 166,132 | | | DealerTrack Holdings, Inc.(b) | | | 2,603,288 | |
| | 195,308 | | | Dice Holdings, Inc.(b) | | | 1,527,309 | |
| | 63,486 | | | Liquidity Services, Inc.(b) | | | 2,035,996 | |
| | 33,174 | | | OpenTable, Inc.(b) | | | 1,526,336 | |
| | 120,870 | | | Vocus, Inc.(b) | | | 2,025,781 | |
| | | | | | | | |
| | | | | | | 13,595,241 | |
| | | | | | | | |
| | | | IT Services – 0.9% | | | | |
| | 210,608 | | | InterXion Holding NV(b) | | | 2,487,281 | |
| | | | | | | | |
| | | | Life Sciences Tools & Services – 0.8% | | | | |
| | 96,838 | | | Luminex Corp.(b) | | | 2,146,898 | |
| | | | | | | | |
| | | | Machinery – 4.1% | | | | |
| | 54,116 | | | Chart Industries, Inc.(b) | | | 2,282,072 | |
| | 84,356 | | | RBC Bearings, Inc.(b) | | | 2,867,260 | |
| | 82,027 | | | Robbins & Myers, Inc. | | | 2,847,157 | |
| | 101,793 | | | Westport Innovations, Inc.(b) | | | 2,944,872 | |
| | | | | | | | |
| | | | | | | 10,941,361 | |
| | | | | | | | |
| | | | Media – 0.9% | | | | |
| | 159,329 | | | MDC Partners, Inc., Class A | | | 2,297,524 | |
| | | | | | | | |
| | | | Oil, Gas & Consumable Fuels – 3.9% | | | | |
| | 97,948 | | | Approach Resources, Inc.(b) | | | 1,664,136 | |
| | 82,154 | | | Brigham Exploration Co.(b) | | | 2,075,210 | |
| | 82,388 | | | Oasis Petroleum, Inc.(b) | | | 1,839,724 | |
| | 66,821 | | | Rosetta Resources, Inc.(b) | | | 2,286,615 | |
| | 78,703 | | | World Fuel Services Corp. | | | 2,569,653 | |
| | | | | | | | |
| | | | | | | 10,435,338 | |
| | | | | | | | |
| | | | Pharmaceuticals – 2.8% | | | | |
| | 134,350 | | | Aegerion Pharmaceuticals, Inc.(b) | | | 1,702,215 | |
| | 106,374 | | | Auxilium Pharmaceuticals, Inc.(b) | | | 1,594,546 | |
| | 95,775 | | | Impax Laboratories, Inc.(b) | | | 1,715,330 | |
| | 89,532 | | | Questcor Pharmaceuticals, Inc.(b) | | | 2,440,642 | |
| | | | | | | | |
| | | | | | | 7,452,733 | |
| | | | | | | | |
| | | | Professional Services – 5.3% | | | | |
| | 79,206 | | | Advisory Board Co. (The)(b) | | | 5,111,163 | |
| | 104,325 | | | Corporate Executive Board Co. (The) | | | 3,108,885 | |
See accompanying notes to financial statements.
| 16
Portfolio of Investments – as of September 30, 2011
Loomis Sayles Small Cap Growth Fund – continued
| | | | | | | | |
Shares | | | Description | | Value (†) | |
| | | | | | | | |
| |
| | Common Stocks – continued | | | | |
| | |
| | | | Professional Services – continued | | | | |
| | 54,510 | | | CoStar Group, Inc.(b) | | $ | 2,832,885 | |
| | 82,322 | | | FTI Consulting, Inc.(b) | | | 3,030,273 | |
| | | | | | | | |
| | | | | | | 14,083,206 | |
| | | | | | | | |
| | | | Road & Rail – 1.0% | | | | |
| | 57,354 | | | Genesee & Wyoming, Inc., Class A(b) | | | 2,668,108 | |
| | | | | | | | |
| | | | Semiconductors & Semiconductor Equipment – 6.5% | | | | |
| | 79,277 | | | Cavium, Inc.(b) | | | 2,141,272 | |
| | 102,989 | | | Ceva, Inc.(b) | | | 2,503,663 | |
| | 64,719 | | | Cymer, Inc.(b) | | | 2,406,252 | |
| | 53,329 | | | EZchip Semiconductor Ltd.(b) | | | 1,771,589 | |
| | 54,107 | | | Hittite Microwave Corp.(b) | | | 2,635,011 | |
| | 35,891 | | | Netlogic Microsystems, Inc.(b) | | | 1,726,716 | |
| | 61,930 | | | Power Integrations, Inc. | | | 1,895,677 | |
| | 70,501 | | | Silicon Laboratories, Inc.(b) | | | 2,362,489 | |
| | | | | | | | |
| | | | | | | 17,442,669 | |
| | | | | | | | |
| | | | Software – 9.0% | | | | |
| | 169,816 | | | Allot Communications Ltd.(b) | | | 1,655,706 | |
| | 172,687 | | | Ariba, Inc.(b) | | | 4,785,157 | |
| | 60,587 | | | CommVault Systems, Inc.(b) | | | 2,245,354 | |
| | 59,369 | | | Concur Technologies, Inc.(b) | | | 2,209,714 | |
| | 92,578 | | | QLIK Technologies, Inc.(b) | | | 2,005,240 | |
| | 100,447 | | | RealPage, Inc.(b) | | | 2,054,141 | |
| | 127,932 | | | Sourcefire, Inc.(b) | | | 3,423,460 | |
| | 111,043 | | | SuccessFactors, Inc.(b) | | | 2,552,879 | |
| | 67,735 | | | Ultimate Software Group, Inc.(The)(b) | | | 3,164,579 | |
| | | | | | | | |
| | | | | | | 24,096,230 | |
| | | | | | | | |
| | | | Specialty Retail – 5.6% | | | | |
| | 151,881 | | | Asbury Automotive Group, Inc.(b) | | | 2,504,518 | |
| | 62,514 | | | DSW, Inc., Class A | | | 2,886,896 | |
| | 97,376 | | | Hibbett Sports, Inc.(b) | | | 3,300,073 | |
| | 91,065 | | | Lumber Liquidators Holdings, Inc.(b) | | | 1,375,081 | |
| | 41,207 | | | Ulta Salon, Cosmetics & Fragrance, Inc.(b) | | | 2,564,312 | |
| | 63,935 | | | Vitamin Shoppe, Inc.(b) | | | 2,393,726 | |
| | | | | | | | |
| | | | | | | 15,024,606 | |
| | | | | | | | |
| | | | Textiles, Apparel & Luxury Goods – 3.1% | | | | |
| | 33,947 | | | Deckers Outdoor Corp.(b) | | | 3,165,897 | |
| | 101,786 | | | G-III Apparel Group Ltd.(b) | | | 2,326,828 | |
| | 46,841 | | | PVH Corp. | | | 2,728,020 | |
| | | | | | | | |
| | | | | | | 8,220,745 | |
| | | | | | | | |
| | |
| | | | Total Common Stocks (Identified Cost $258,763,531) | | | 256,042,748 | |
| | | | | | | | |
See accompanying notes to financial statements.
17 |
Portfolio of Investments – as of September 30, 2011
Loomis Sayles Small Cap Growth Fund – continued
| | | | | | | | |
Principal
Amount | | | Description | | Value (†) | |
| | | | | | | | |
| |
| | Short-Term Investments – 4.0% | | | | |
| $ | 10,586,037 | | | Tri-Party Repurchase Agreement with Fixed Income Clearing Corporation, dated 9/30/2011 at 0.000% to be repurchased at $10,586,037 on 10/03/2011 collateralized by $10,785,000 Federal Home Loan Mortgage Corp., 0.600% due 8/23/2013 valued at $10,798,575 including accrued interest (Note 2 of Notes to Financial Statements) (Identified Cost $10,586,037) | | $ | 10,586,037 | |
| | | | | | | | |
| | |
| | | | Total Investments – 99.7% (Identified Cost $269,349,568)(a) | | | 266,628,785 | |
| | | | Other assets less liabilities – 0.3% | | | 793,664 | |
| | | | | | | | |
| | | | Net Assets – 100.0% | | $ | 267,422,449 | |
| | | | | | | | |
| | |
| | (†) | | | See Note 2 of Notes to Financial Statements. | | | | |
| | (a) | | | Federal Tax Information: | | | | |
| | | | At September 30, 2011, the net unrealized depreciation on investments based on a cost of $269,670,904 for federal income tax purposes was as follows: | | | | |
| | | | Aggregate gross unrealized appreciation for all investments in which there is an excess of value over tax cost | | $ | 23,376,035 | |
| | | | Aggregate gross unrealized depreciation for all investments in which there is an excess of tax cost over value | | | (26,418,154 | ) |
| | | | | | | | |
| | | | Net unrealized depreciation | | $ | (3,042,119 | ) |
| | | | | | | | |
| | (b) | | | Non-income producing security. | | | | |
Industry Summary at September 30, 2011 (Unaudited)
| | | | |
Software | | | 9.0 | % |
Health Care Providers & Services | | | 6.9 | |
Semiconductors & Semiconductor Equipment | | | 6.5 | |
Health Care Equipment & Supplies | | | 5.9 | |
Specialty Retail | | | 5.6 | |
Professional Services | | | 5.3 | |
Internet Software & Services | | | 5.1 | |
Machinery | | | 4.1 | |
Oil, Gas & Consumable Fuels | | | 3.9 | |
Energy Equipment & Services | | | 3.2 | |
Textiles, Apparel & Luxury Goods | | | 3.1 | |
Biotechnology | | | 3.1 | |
Pharmaceuticals | | | 2.8 | |
Commercial Services & Supplies | | | 2.6 | |
Electronic Equipment, Instruments & Components | | | 2.6 | |
Capital Markets | | | 2.5 | |
Aerospace & Defense | | | 2.4 | |
Hotels, Restaurants & Leisure | | | 2.0 | |
Other Investments, less than 2% each | | | 19.1 | |
Short-Term Investments | | | 4.0 | |
| | | | |
Total Investments | | | 99.7 | |
Other assets less liabilities | | | 0.3 | |
| | | | |
Net Assets | | | 100.0 | % |
| | | | |
See accompanying notes to financial statements.
| 18
Portfolio of Investments – as of September 30, 2011
Loomis Sayles Small Cap Value Fund
| | | | | | | | |
| Shares | | | Description | | Value (†) | |
| | | | | | | | |
| |
| | Common Stocks – 96.8% of Net Assets | | | | |
| | |
| | | | Air Freight & Logistics – 0.2% | | | | |
| | 52,301 | | | Atlas Air Worldwide Holdings, Inc.(b) | | $ | 1,741,100 | |
| | | | | | | | |
| | | | Auto Components – 1.1% | | | | |
| | 459,158 | | | Dana Holding Corp.(b) | | | 4,821,159 | |
| | 172,744 | | | Tenneco, Inc.(b) | | | 4,423,974 | |
| | | | | | | | |
| | | | | | | 9,245,133 | |
| | | | | | | | |
| | | | Building Products – 1.0% | | | | |
| | 147,180 | | | Armstrong World Industries, Inc. | | | 5,068,879 | |
| | 376,559 | | | Griffon Corp.(b) | | | 3,080,253 | |
| | | | | | | | |
| | | | | | | 8,149,132 | |
| | | | | | | | |
| | | | Capital Markets – 1.7% | | | | |
| | 777,711 | | | Fifth Street Finance Corp. | | | 7,248,266 | |
| | 269,619 | | | Stifel Financial Corp.(b) | | | 7,161,081 | |
| | | | | | | | |
| | | | | | | 14,409,347 | |
| | | | | | | | |
| | | | Chemicals – 4.2% | | | | |
| | 300,663 | | | Chemtura Corp.(b) | | | 3,015,650 | |
| | 642,823 | | | Ferro Corp.(b) | | | 3,953,361 | |
| | 230,016 | | | Koppers Holdings, Inc. | | | 5,890,710 | |
| | 80,553 | | | Minerals Technologies, Inc. | | | 3,968,846 | |
| | 282,814 | | | Olin Corp. | | | 5,093,480 | |
| | 421,127 | | | Omnova Solutions, Inc.(b) | | | 1,507,635 | |
| | 228,186 | | | WR Grace & Co.(b) | | | 7,598,594 | |
| | 285,865 | | | Zep, Inc. | | | 4,293,692 | |
| | | | | | | | |
| | | | | | | 35,321,968 | |
| | | | | | | | |
| | | | Commercial Banks – 8.1% | | | | |
| | 587,102 | | | BancorpSouth, Inc. | | | 5,154,756 | |
| | 618,248 | | | Cathay General Bancorp | | | 7,035,662 | |
| | 181,773 | | | City National Corp. | | | 6,863,748 | |
| | 495,700 | | | CVB Financial Corp. | | | 3,811,933 | |
| | 556,621 | | | First Financial Bancorp | | | 7,681,370 | |
| | 160,056 | | | IBERIABANK Corp. | | | 7,532,235 | |
| | 379,315 | | | Pinnacle Financial Partners, Inc.(b) | | | 4,149,706 | |
| | 2,604,324 | | | Popular, Inc.(b) | | | 3,906,486 | |
| | 183,036 | | | Prosperity Bancshares, Inc. | | | 5,981,616 | |
| | 180,927 | | | Signature Bank(b) | | | 8,635,646 | |
| | 299,455 | | | Wintrust Financial Corp. | | | 7,728,934 | |
| | | | | | | | |
| | | | | | | 68,482,092 | |
| | | | | | | | |
| | | | Commercial Services & Supplies – 4.8% | | | | |
| | 351,957 | | | KAR Auction Services, Inc.(b) | | | 4,262,199 | |
| | 336,098 | | | McGrath Rentcorp | | | 7,995,771 | |
| | 567,866 | | | Rollins, Inc. | | | 10,624,773 | |
See accompanying notes to financial statements.
19 |
Portfolio of Investments – as of September 30, 2011
Loomis Sayles Small Cap Value Fund – continued
| | | | | | | | |
| Shares | | | Description | | Value (†) | |
| | | | | | | | |
| |
| | Common Stocks – continued | | | | |
| | |
| | | | Commercial Services & Supplies – continued | | | | |
| | 406,373 | | | Standard Parking Corp.(b) | | $ | 6,355,674 | |
| | 130,259 | | | Team, Inc.(b) | | | 2,732,834 | |
| | 247,808 | | | Waste Connections, Inc. | | | 8,380,867 | |
| | | | | | | | |
| | | | | | | 40,352,118 | |
| | | | | | | | |
| | | | Communications Equipment – 1.9% | | | | |
| | 229,374 | | | ADTRAN, Inc. | | | 6,069,236 | |
| | 318,695 | | | Brocade Communications Systems, Inc.(b) | | | 1,376,763 | |
| | 853,097 | | | Harmonic, Inc.(b) | | | 3,634,193 | |
| | 205,280 | | | NETGEAR, Inc.(b) | | | 5,314,699 | |
| | | | | | | | |
| | | | | | | 16,394,891 | |
| | | | | | | | |
| | | | Construction & Engineering – 0.3% | | | | |
| | 168,632 | | | MYR Group, Inc.(b) | | | 2,974,668 | |
| | | | | | | | |
| | | | Consumer Finance – 2.4% | | | | |
| | 182,778 | | | Cash America International, Inc. | | | 9,350,922 | |
| | 506,243 | | | DFC Global Corp.(b) | | | 11,061,410 | |
| | | | | | | | |
| | | | | | | 20,412,332 | |
| | | | | | | | |
| | | | Distributors – 0.4% | | | | |
| | 109,064 | | | Core-Mark Holding Co., Inc.(b) | | | 3,340,630 | |
| | | | | | | | |
| | | | Diversified Financial Services – 1.6% | | | | |
| | 309,746 | | | MarketAxess Holdings, Inc. | | | 8,059,591 | |
| | 346,060 | | | PHH Corp.(b) | | | 5,564,645 | |
| | | | | | | | |
| | | | | | | 13,624,236 | |
| | | | | | | | |
| | | | Electric Utilities – 2.9% | | | | |
| | 178,898 | | | ALLETE, Inc. | | | 6,553,034 | |
| | 131,699 | | | ITC Holdings Corp. | | | 10,197,454 | |
| | 224,693 | | | UIL Holdings Corp. | | | 7,399,140 | |
| | | | | | | | |
| | | | | | | 24,149,628 | |
| | | | | | | | |
| | | | Electrical Equipment – 3.5% | | | | |
| | 151,992 | | | AZZ, Inc. | | | 5,892,730 | |
| | 287,466 | | | EnerSys(b) | | | 5,755,069 | |
| | 130,525 | | | Global Power Equipment Group, Inc.(b) | | | 3,037,317 | |
| | 449,943 | | | II-VI, Inc.(b) | | | 7,874,002 | |
| | 169,536 | | | Thomas & Betts Corp.(b) | | | 6,766,182 | |
| | | | | | | | |
| | | | | | | 29,325,300 | |
| | | | | | | | |
| | | | Electronic Equipment, Instruments & Components – 4.3% | | | | |
| | 134,768 | | | Cognex Corp. | | | 3,653,560 | |
| | 359,931 | | | GSI Group, Inc.(b) | | | 2,764,270 | |
| | 168,298 | | | Littelfuse, Inc. | | | 6,767,263 | |
| | 537,821 | | | Methode Electronics, Inc. | | | 3,996,010 | |
See accompanying notes to financial statements.
| 20
Portfolio of Investments – as of September 30, 2011
Loomis Sayles Small Cap Value Fund – continued
| | | | | | | | |
| Shares | | | Description | | Value (†) | |
| | | | | | | | |
| |
| | Common Stocks – continued | | | | |
| | |
| | | | Electronic Equipment, Instruments & Components – continued | | | | |
| | 246,260 | | | Rofin-Sinar Technologies, Inc.(b) | | $ | 4,728,192 | |
| | 122,746 | | | Rogers Corp.(b) | | | 4,803,051 | |
| | 278,194 | | | ScanSource, Inc.(b) | | | 8,223,415 | |
| | 127,627 | | | TTM Technologies, Inc.(b) | | | 1,213,733 | |
| | | | | | | | |
| | | | | | | 36,149,494 | |
| | | | | | | | |
| | | | Energy Equipment & Services – 2.3% | | | | |
| | 289,873 | | | Helix Energy Solutions Group, Inc.(b) | | | 3,797,336 | |
| | 120,001 | | | Lufkin Industries, Inc. | | | 6,385,253 | |
| | 269,710 | | | Oceaneering International, Inc. | | | 9,531,552 | |
| | | | | | | | |
| | | | | | | 19,714,141 | |
| | | | | | | | |
| | | | Food & Staples Retailing – 1.1% | | | | |
| | 75,937 | | | Casey’s General Stores, Inc. | | | 3,314,650 | |
| | 410,633 | | | Spartan Stores, Inc. | | | 6,356,599 | |
| | | | | | | | |
| | | | | | | 9,671,249 | |
| | | | | | | | |
| | | | Food Products – 2.6% | | | | |
| | 112,798 | | | Corn Products International, Inc. | | | 4,426,194 | |
| | 535,716 | | | Darling International, Inc.(b) | | | 6,744,664 | |
| | 100,125 | | | Fresh Del Monte Produce, Inc. | | | 2,322,900 | |
| | 168,066 | | | J & J Snack Foods Corp. | | | 8,075,571 | |
| | | | | | | | |
| | | | | | | 21,569,329 | |
| | | | | | | | |
| | | | Gas Utilities – 1.2% | | | | |
| | 381,155 | | | UGI Corp. | | | 10,012,942 | |
| | | | | | | | |
| | | | Health Care Equipment & Supplies – 1.3% | | | | |
| | 155,947 | | | SurModics, Inc.(b) | | | 1,419,118 | |
| | 112,062 | | | Teleflex, Inc. | | | 6,025,574 | |
| | 85,911 | | | West Pharmaceutical Services, Inc. | | | 3,187,298 | |
| | | | | | | | |
| | | | | | | 10,631,990 | |
| | | | | | | | |
| | | | Health Care Providers & Services – 2.1% | | | | |
| | 116,531 | | | MEDNAX, Inc.(b) | | | 7,299,502 | |
| | 271,045 | | | Vanguard Health Systems, Inc.(b) | | | 2,753,817 | |
| | 206,504 | | | WellCare Health Plans, Inc.(b) | | | 7,843,022 | |
| | | | | | | | |
| | | | | | | 17,896,341 | |
| | | | | | | | |
| | | | Hotels, Restaurants & Leisure – 2.0% | | | | |
| | 107,958 | | | Churchill Downs, Inc. | | | 4,213,601 | |
| | 89,415 | | | Cracker Barrel Old Country Store, Inc. | | | 3,583,753 | |
| | 95,722 | | | Six Flags Entertainment Corp. | | | 2,653,414 | |
| | 222,622 | | | Wyndham Worldwide Corp. | | | 6,346,953 | |
| | | | | | | | |
| | | | | | | 16,797,721 | |
| | | | | | | | |
See accompanying notes to financial statements.
21 |
Portfolio of Investments – as of September 30, 2011
Loomis Sayles Small Cap Value Fund – continued
| | | | | | | | |
| Shares | | | Description | | Value (†) | |
| | | | | | | | |
| |
| | Common Stocks – continued | | | | |
| | |
| | | | Household Durables – 1.2% | | | | |
| | 163,170 | | | Jarden Corp. | | $ | 4,611,184 | |
| | 405,244 | | | La-Z-Boy, Inc.(b) | | | 3,002,858 | |
| | 117,495 | | | Leggett & Platt, Inc. | | | 2,325,226 | |
| | | | | | | | |
| | | | | | | 9,939,268 | |
| | | | | | | | |
| | | | Industrial Conglomerates – 0.8% | | | | |
| | 137,270 | | | Raven Industries, Inc. | | | 6,616,414 | |
| | | | | | | | |
| | | | Insurance – 3.5% | | | | |
| | 446,540 | | | Employers Holdings, Inc. | | | 5,697,851 | |
| | 326,467 | | | HCC Insurance Holdings, Inc. | | | 8,830,932 | |
| | 108,309 | | | ProAssurance Corp. | | | 7,800,414 | |
| | 156,558 | | | Reinsurance Group of America, Inc., Class A | | | 7,193,840 | |
| | | | | | | | |
| | | | | | | 29,523,037 | |
| | | | | | | | |
| | | | Internet & Catalog Retail – 0.5% | | | | |
| | 127,655 | | | HSN, Inc.(b) | | | 4,229,210 | |
| | | | | | | | |
| | | | Internet Software & Services – 1.0% | | | | |
| | 144,398 | | | IAC/InterActiveCorp(b) | | | 5,710,941 | |
| | 341,227 | | | Perficient, Inc.(b) | | | 2,497,782 | |
| | | | | | | | |
| | | | | | | 8,208,723 | |
| | | | | | | | |
| | | | IT Services – 1.1% | | | | |
| | 234,247 | | | Wright Express Corp.(b) | | | 8,910,756 | |
| | | | | | | | |
| | | | Leisure Equipment & Products – 0.3% | | | | |
| | 554,470 | | | Callaway Golf Co. | | | 2,866,610 | |
| | | | | | | | |
| | | | Life Sciences Tools & Services – 0.5% | | | | |
| | 155,622 | | | Pharmaceutical Product Development, Inc. | | | 3,993,261 | |
| | | | | | | | |
| | | | Machinery – 4.7% | | | | |
| | 334,348 | | | Actuant Corp., Class A | | | 6,603,373 | |
| | 146,584 | | | Alamo Group, Inc. | | | 3,047,481 | |
| | 439,916 | | | Albany International Corp., Class A | | | 8,028,467 | |
| | 402,453 | | | Altra Holdings, Inc.(b) | | | 4,656,381 | |
| | 308,158 | | | Commercial Vehicle Group, Inc.(b) | | | 2,024,598 | |
| | 283,740 | | | John Bean Technologies Corp. | | | 4,046,133 | |
| | 54,759 | | | Middleby Corp. (The)(b) | | | 3,858,319 | |
| | 139,684 | | | RBC Bearings, Inc.(b) | | | 4,747,859 | |
| | 49,107 | | | Wabtec Corp. | | | 2,596,287 | |
| | | | | | | | |
| | | | | | | 39,608,898 | |
| | | | | | | | |
| | | | Marine – 0.8% | | | | |
| | 121,016 | | | Kirby Corp.(b) | | | 6,370,282 | |
| | | | | | | | |
See accompanying notes to financial statements.
| 22
Portfolio of Investments – as of September 30, 2011
Loomis Sayles Small Cap Value Fund – continued
| | | | | | | | |
| Shares | | | Description | | Value (†) | |
| | | | | | | | |
| |
| | Common Stocks – continued | | | | |
| | |
| | | | Media – 2.6% | | | | |
| | 137,892 | | | Arbitron, Inc. | | $ | 4,561,468 | |
| | 186,322 | | | John Wiley & Sons, Inc., Class A | | | 8,276,423 | |
| | 149,604 | | | Liberty Media Corp. - Liberty Starz, Class A(b) | | | 9,508,830 | |
| | | | | | | | |
| | | | | | | 22,346,721 | |
| | | | | | | | |
| | | | Metals & Mining – 1.6% | | | | |
| | 102,828 | | | Haynes International, Inc. | | | 4,467,876 | |
| | 560,885 | | | Horsehead Holding Corp.(b) | | | 4,161,767 | |
| | 154,083 | | | Reliance Steel & Aluminum Co. | | | 5,240,363 | |
| | | | | | | | |
| | | | | | | 13,870,006 | |
| | | | | | | | |
| | | | Multiline Retail – 0.6% | | | | |
| | 486,031 | | | Fred’s, Inc. Class A | | | 5,181,090 | |
| | | | | | | | |
| | | | Oil, Gas & Consumable Fuels – 2.3% | | | | |
| | 149,607 | | | Berry Petroleum Co., Class A | | | 5,293,096 | |
| | 349,136 | | | Cloud Peak Energy, Inc.(b) | | | 5,917,855 | |
| | 506,035 | | | Energy Partners Ltd.(b) | | | 5,601,807 | |
| | 678,926 | | | Magnum Hunter Resources Corp.(b) | | | 2,247,245 | |
| | | | | | | | |
| | | | | | | 19,060,003 | |
| | | | | | | | |
| | | | Paper & Forest Products – 0.5% | | | | |
| | 67,695 | | | Deltic Timber Corp. | | | 4,040,038 | |
| | | | | | | | |
| | | | Pharmaceuticals – 0.9% | | | | |
| | 287,573 | | | Impax Laboratories, Inc.(b) | | | 5,150,432 | |
| | 296,279 | | | Obagi Medical Products, Inc.(b) | | | 2,687,251 | |
| | | | | | | | |
| | | | | | | 7,837,683 | |
| | | | | | | | |
| | | | REITs - Apartments – 3.8% | | | | |
| | 277,338 | | | American Campus Communities, Inc. | | | 10,319,747 | |
| | 124,279 | | | Home Properties, Inc. | | | 7,054,076 | |
| | 133,984 | | | Mid-America Apartment Communities, Inc. | | | 8,068,517 | |
| | 309,208 | | | UDR, Inc. | | | 6,845,865 | |
| | | | | | | | |
| | | | | | | 32,288,205 | |
| | | | | | | | |
| | | | REITs - Diversified – 1.5% | | | | |
| | 364,429 | | | DuPont Fabros Technology, Inc. | | | 7,175,607 | |
| | 185,220 | | | Potlatch Corp. | | | 5,838,134 | |
| | | | | | | | |
| | | | | | | 13,013,741 | |
| | | | | | | | |
| | | | REITs - Healthcare – 0.8% | | | | |
| | 427,396 | | | Omega Healthcare Investors, Inc. | | | 6,808,418 | |
| | | | | | | | |
| | | | REITs - Hotels – 0.7% | | | | |
| | 1,629,443 | | | Hersha Hospitality Trust | | | 5,637,873 | |
| | | | | | | | |
| | | | REITs - Office Property – 1.0% | | | | |
| | 532,268 | | | BioMed Realty Trust, Inc. | | | 8,819,681 | |
| | | | | | | | |
See accompanying notes to financial statements.
23 |
Portfolio of Investments – as of September 30, 2011
Loomis Sayles Small Cap Value Fund – continued
| | | | | | | | |
| Shares | | | Description | | Value (†) | |
| | | | | | | | |
| |
| | Common Stocks – continued | | | | |
| | |
| | | | REITs - Single Tenant – 0.9% | | | | |
| | 290,796 | | | National Retail Properties, Inc. | | $ | 7,813,689 | |
| | | | | | | | |
| | | | REITs - Storage – 1.5% | | | | |
| | 707,732 | | | CubeSmart | | | 6,036,954 | |
| | 180,366 | | | Sovran Self Storage, Inc. | | | 6,704,204 | |
| | | | | | | | |
| | | | | | | 12,741,158 | |
| | | | | | | | |
| | | | Road & Rail – 1.8% | | | | |
| | 121,198 | | | Genesee & Wyoming, Inc., Class A(b) | | | 5,638,131 | |
| | 218,510 | | | Old Dominion Freight Line, Inc.(b) | | | 6,330,235 | |
| | 163,188 | | | Werner Enterprises, Inc. | | | 3,399,206 | |
| | | | | | | | |
| | | | | | | 15,367,572 | |
| | | | | | | | |
| | | | Semiconductors & Semiconductor Equipment – 1.8% | | | | |
| | 965,558 | | | Lattice Semiconductor Corp.(b) | | | 5,069,179 | |
| | 278,294 | | | Semtech Corp.(b) | | | 5,872,003 | |
| | 373,453 | | | Teradyne, Inc.(b) | | | 4,111,718 | |
| | | | | | | | |
| | | | | | | 15,052,900 | |
| | | | | | | | |
| | | | Software – 1.8% | | | | |
| | 322,712 | | | Monotype Imaging Holdings, Inc.(b) | | | 3,914,497 | |
| | 320,750 | | | Progress Software Corp.(b) | | | 5,629,162 | |
| | 420,295 | | | SS&C Technologies Holdings, Inc.(b) | | | 6,006,016 | |
| | | | | | | | |
| | | | | | | 15,549,675 | |
| | | | | | | | |
| | | | Specialty Retail – 4.0% | | | | |
| | 169,583 | | | Genesco, Inc.(b) | | | 8,738,612 | |
| | 1,077,563 | | | Hot Topic, Inc. | | | 8,221,806 | |
| | 219,819 | | | RadioShack Corp. | | | 2,554,297 | |
| | 175,920 | | | Rent-A-Center, Inc. | | | 4,829,004 | |
| | 554,071 | | | Sally Beauty Holdings, Inc.(b) | | | 9,197,578 | |
| | | | | | | | |
| | | | | | | 33,541,297 | |
| | | | | | | | |
| | | | Textiles, Apparel & Luxury Goods – 0.8% | | | | |
| | 160,273 | | | Kenneth Cole Productions, Inc., Class A(b) | | | 1,719,729 | |
| | 418,305 | | | Movado Group, Inc. | | | 5,094,955 | |
| | | | | | | | |
| | | | | | | 6,814,684 | |
| | | | | | | | |
| | | | Thrifts & Mortgage Finance – 1.2% | | | | |
| | 216,184 | | | BankUnited, Inc. | | | 4,487,980 | |
| | 557,049 | | | Capitol Federal Financial, Inc. | | | 5,882,437 | |
| | | | | | | | |
| | | | | | | 10,370,417 | |
| | | | | | | | |
| | | | Trading Companies & Distributors – 0.8% | | | | |
| | 290,065 | | | H&E Equipment Services, Inc.(b) | | | 2,393,036 | |
| | 299,808 | | | Rush Enterprises, Inc., Class A(b) | | | 4,245,282 | |
| | | | | | | | |
| | | | | | | 6,638,318 | |
| | | | | | | | |
See accompanying notes to financial statements.
| 24
Portfolio of Investments – as of September 30, 2011
Loomis Sayles Small Cap Value Fund – continued
| | | | | | | | |
| Shares | | | Description | | Value (†) | |
| | | | | | | | |
| |
| | Common Stocks – continued | | | | |
| | |
| | | | Water Utilities – 0.5% | | | | |
| | 272,189 | | | Middlesex Water Co. | | $ | 4,646,266 | |
| | | | | | | | |
| | |
| | | | Total Common Stocks (Identified Cost $783,582,072) | | | 818,071,676 | |
| | | | | | | | |
| |
| | Closed End Investment Companies – 0.9% | | | | |
| | 527,881 | | | Ares Capital Corp. (Identified Cost $7,110,703) | | | 7,268,921 | |
| | | | | | | | |
| | |
| Principal
Amount |
| | | | | | |
| |
| | Short-Term Investments – 3.1% | | | | |
| $ | 26,703,466 | | | Tri-Party Repurchase Agreement with Fixed Income Clearing Corporation, dated 9/30/2011 at 0.000% to be repurchased at $26,703,466 on 10/03/2011 collateralized by $26,770,000 U.S. Treasury Note, 1.375% due 2/15/2013 valued at $27,238,475 including accrued interest (Note 2 of Notes to Financial Statements) (Identified Cost $26,703,466) | | | 26,703,466 | |
| | | | | | | | |
| | |
| | | | Total Investments – 100.8% (Identified Cost $817,396,241)(a) | | | 852,044,063 | |
| | | | Other assets less liabilities—(0.8)% | | | (7,022,971 | ) |
| | | | | | | | |
| | | | Net Assets – 100.0% | | $ | 845,021,092 | |
| | | | | | | | |
| | |
| | (†) | | | See Note 2 of Notes to Financial Statements. | | | | |
| | (a) | | | Federal Tax Information: | | | | |
| | | | At September 30, 2011, the net unrealized appreciation on investments based on a cost of $818,658,243 for federal income tax purposes was as follows: | | | | |
| | | | Aggregate gross unrealized appreciation for all investments in which there is an excess of value over tax cost | | $ | 116,877,704 | |
| | | | Aggregate gross unrealized depreciation for all investments in which there is an excess of tax cost over value | | | (83,491,884 | ) |
| | | | | | | | |
| | | | Net unrealized appreciation | | $ | 33,385,820 | |
| | | | | | | | |
| | (b) | | | Non-income producing security. | | | | |
| | REITs | | | Real Estate Investment Trusts | | | | |
See accompanying notes to financial statements.
25 |
Portfolio of Investments – as of September 30, 2011
Loomis Sayles Small Cap Value Fund – continued
Industry Summary at September 30, 2011 (Unaudited)
| | | | |
Commercial Banks | | | 8.1 | % |
Commercial Services & Supplies | | | 4.8 | |
Machinery | | | 4.7 | |
Electronic Equipment, Instruments & Components | | | 4.3 | |
Chemicals | | | 4.2 | |
Specialty Retail | | | 4.0 | |
REITs – Apartments | | | 3.8 | |
Insurance | | | 3.5 | |
Electrical Equipment | | | 3.5 | |
Electric Utilities | | | 2.9 | |
Media | | | 2.6 | |
Food Products | | | 2.6 | |
Consumer Finance | | | 2.4 | |
Energy Equipment & Services | | | 2.3 | |
Oil, Gas & Consumable Fuels | | | 2.3 | |
Health Care Providers & Services | | | 2.1 | |
Hotels, Restaurants & Leisure | | | 2.0 | |
Other Investments, less than 2% each | | | 37.6 | |
Short-Term Investments | | | 3.1 | |
| | | | |
Total Investments | | | 100.8 | |
Other assets less liabilities | | | (0.8 | ) |
| | | | |
Net Assets | | | 100.0 | % |
| | | | |
See accompanying notes to financial statements.
| 26
Statements of Assets and Liabilities
September 30, 2011
| | | | | | | | |
| | | Small Cap
Growth Fund | | | Small Cap
Value Fund | |
ASSETS | | | | | | | | |
Investments at cost | | $ | 269,349,568 | | | $ | 817,396,241 | |
Net unrealized appreciation (depreciation) | | | (2,720,783 | ) | | | 34,647,822 | |
| | | | | | | | |
Investments at value | | | 266,628,785 | | | | 852,044,063 | |
Receivable for Fund shares sold | | | 790,188 | | | | 809,440 | |
Receivable for securities sold | | | 3,282,377 | | | | 895,003 | |
Dividends receivable | | | 2,900 | | | | 1,038,817 | |
| | | | | | | | |
TOTAL ASSETS | | | 270,704,250 | | | | 854,787,323 | |
| | | | | | | | |
LIABILITIES | | | | | | | | |
Payable for securities purchased | | | 2,461,160 | | | | 6,795,534 | |
Payable for Fund shares redeemed | | | 482,225 | | | | 2,190,936 | |
Management fees payable (Note 5) | | | 189,542 | | | | 498,561 | |
Deferred Trustees’ fees (Note 5) | | | 69,983 | | | | 141,018 | |
Administrative fees payable (Note 5) | | | 10,464 | | | | 34,363 | |
Other accounts payable and accrued expenses | | | 68,427 | | | | 105,819 | |
| | | | | | | | |
TOTAL LIABILITIES | | | 3,281,801 | | | | 9,766,231 | |
| | | | | | | | |
NET ASSETS | | $ | 267,422,449 | | | $ | 845,021,092 | |
| | | | | | | | |
NET ASSETS CONSIST OF: | | | | | | | | |
Paid-in capital | | $ | 297,408,833 | | | $ | 867,065,886 | |
Distributions in excess of net investment income/Accumulated net investment (loss) | | | (69,983 | ) | | | (141,018 | ) |
Accumulated net realized loss on investments | | | (27,195,618 | ) | | | (56,551,598 | ) |
Net unrealized appreciation (depreciation) on investments | | | (2,720,783 | ) | | | 34,647,822 | |
| | | | | | | | |
NET ASSETS | | $ | 267,422,449 | | | $ | 845,021,092 | |
| | | | | | | | |
| | |
COMPUTATION OF NET ASSET VALUE AND OFFERING PRICE: | | | | | | | | |
Institutional Class: | | | | | | | | |
Net assets | | $ | 154,312,625 | | | $ | 431,761,314 | |
| | | | | | | | |
Shares of beneficial interest | | | 10,243,263 | | | | 19,308,454 | |
| | | | | | | | |
Net asset value, offering and redemption price per share | | $ | 15.06 | | | $ | 22.36 | |
| | | | | | | | |
Retail Class: | | | | | | | | |
Net assets | | $ | 113,109,824 | | | $ | 347,759,400 | |
| | | | | | | | |
Shares of beneficial interest | | | 7,791,683 | | | | 15,710,385 | |
| | | | | | | | |
Net asset value, offering and redemption price per share | | $ | 14.52 | | | $ | 22.14 | |
| | | | | | | | |
Admin Class: | | | | | | | | |
Net assets | | $ | — | | | $ | 65,500,378 | |
| | | | | | | | |
Shares of beneficial interest | | | — | | | | 3,015,902 | |
| | | | | | | | |
Net asset value, offering and redemption price per share | | $ | — | | | $ | 21.72 | |
| | | | | | | | |
See accompanying notes to financial statements.
27 |
Statements of Operations
For the Year Ended September 30, 2011
| | | | | | | | |
| | | Small Cap
Growth Fund | | | Small Cap
Value Fund | |
INVESTMENT INCOME | | | | | | | | |
Dividends | | $ | 426,462 | | | $ | 12,766,557 | (a) |
Less net foreign taxes withheld | | | (4,900 | ) | | | — | |
| | | | | | | | |
| | | 421,562 | | | | 12,766,557 | |
| | | | | | | | |
Expenses | | | | | | | | |
Management fees (Note 5) | | | 1,692,500 | | | | 7,809,927 | |
Service and distribution fees (Note 5) | | | 284,823 | | | | 1,484,623 | |
Administrative fees (Note 5) | | | 104,735 | | | | 483,829 | |
Trustees’ fees and expenses (Note 5) | | | 26,536 | | | | 48,139 | |
Transfer agent fees and expenses (Notes 5 and 6) | | | 252,076 | | | | 1,264,012 | |
Audit and tax services fees | | | 37,707 | | | | 43,244 | |
Custodian fees and expenses | | | 31,125 | | | | 40,668 | |
Legal fees | | | 3,654 | | | | 16,884 | |
Registration fees | | | 50,274 | | | | 65,746 | |
Shareholder reporting expenses | | | 19,737 | | | | 116,288 | |
Miscellaneous expenses | | | 10,875 | | | | 34,263 | |
| | | | | | | | |
Total expenses | | | 2,514,042 | | | | 11,407,623 | |
Fee/expense recovery (Note 5) | | | 29,470 | | | | — | |
Less waiver and/or expense reimbursement (Note 5) | | | (27,094 | ) | | | (551,088 | ) |
| | | | | | | | |
Net expenses | | | 2,516,418 | | | | 10,856,535 | |
| | | | | | | | |
Net investment income (loss) | | | (2,094,856 | ) | | | 1,910,022 | |
| | | | | | | | |
| | |
NET REALIZED AND UNREALIZED GAIN (LOSS)
ON INVESTMENTS | | | | | | | | |
Net realized gain on: | | | | | | | | |
Investments | | | 24,546,166 | | | | 92,685,709 | |
Net change in unrealized appreciation
(depreciation) on: | | | | | | | | |
Investments | | | (32,206,864 | ) | | | (102,463,891 | ) |
| | | | | | | | |
Net realized and unrealized loss on investments | | | (7,660,698 | ) | | | (9,778,182 | ) |
| | | | | | | | |
| | |
NET DECREASE IN NET ASSETS RESULTING FROM OPERATIONS | | $ | (9,755,554 | ) | | $ | (7,868,160 | ) |
| | | | | | | | |
| (a) | Includes a non-recurring dividend of $465,154. |
See accompanying notes to financial statements.
| 28
Statements of Changes in Net Assets
| | | | | | | | | | | | | | | | |
| | | Small Cap Growth Fund | | | Small Cap Value Fund | |
| | | Year Ended
September 30,
2011 | | | Year Ended
September 30,
2010 | | | Year Ended
September 30,
2011 | | | Year Ended
September 30,
2010 | |
FROM OPERATIONS: | | | | | | | | | | | | | | | | |
Net investment income (loss) | | $ | (2,094,856 | ) | | $ | (1,245,082 | ) | | $ | 1,910,022 | | | $ | 3,463,326 | |
Net realized gain on investments | | | 24,546,166 | | | | 14,954,786 | | | | 92,685,709 | | | | 58,619,537 | |
Net change in unrealized appreciation (depreciation) on investments | | | (32,206,864 | ) | | | 10,136,058 | | | | (102,463,891 | ) | | | 34,774,717 | |
| | | | | | | | | | | | | | | | |
Net increase (decrease) in net assets resulting from operations | | | (9,755,554 | ) | | | 23,845,762 | | | | (7,868,160 | ) | | | 96,857,580 | |
| | | | | | | | | | | | | | | | |
FROM DISTRIBUTIONS TO SHAREHOLDERS: | | | | | | | | | | | | | | | | |
Net investment income | | | | | | | | | | | | | | | | |
Institutional Class | | | — | | | | — | | | | (3,276,433 | ) | | | (1,798,397 | ) |
Retail Class | | | — | | | | — | | | | (1,768,636 | ) | | | (522,660 | ) |
Admin Class | | | — | | | | — | | | | (178,569 | ) | | | — | |
| | | | | | | | | | | | | | | | |
Total distributions | | | — | | | | — | | | | (5,223,638 | ) | | | (2,321,057 | ) |
| | | | | | | | | | | | | | | | |
NET INCREASE (DECREASE) IN NET ASSETS FROM CAPITAL SHARE TRANSACTIONS (NOTE 10) | | | 149,332,650 | | | | (17,035,340 | ) | | | (54,117,495 | ) | | | (150,208,179 | ) |
| | | | | | | | | | | | | | | | |
Net increase (decrease) in net assets | | | 139,577,096 | | | | 6,810,422 | | | | (67,209,293 | ) | | | (55,671,656 | ) |
NET ASSETS | | | | | | | | | | | | | | | | |
Beginning of the year | | | 127,845,353 | | | | 121,034,931 | | | | 912,230,385 | | | | 967,902,041 | |
| | | | | | | | | | | | | | | | |
End of the year | | $ | 267,422,449 | | | $ | 127,845,353 | | | $ | 845,021,092 | | | $ | 912,230,385 | |
| | | | | | | | | | | | | | | | |
UNDISTRIBUTED (DISTRIBUTIONS IN EXCESS OF) NET INVESTMENT INCOME/ACCUMULATED NET INVESTMENT (LOSS) | | $ | (69,983 | ) | | $ | (53,431 | ) | | $ | (141,018 | ) | | $ | 2,319,360 | |
| | | | | | | | | | | | | | | | |
See accompanying notes to financial statements.
29 |
THIS PAGE INTENTIONALLY LEFT BLANK
| 30
Financial Highlights
For a share outstanding throughout each period.
| | | | | | | | | | | | | | | | | | | | | | | | | | | | | | |
| | | | | | Income (Loss) from
Investment Operations: | | | | | Less Distributions: | |
| | | Net asset
value,
beginning
of the
period | | | Net
investment
income
(loss) (a)(b) | | | Net
realized
and
unrealized
gain (loss) | | | Total
from
investment
operations | | | | | Dividends
from net
investment
income (b) | | | Distributions
from net
realized
capital
gains | | | Total
distributions | |
Small Cap Growth Fund | | | | | | | | | | | | | | | | | | | | | | | |
| Institutional Class | | | | | | | | | | | | | | | | | | | | | | | | | | | |
9/30/2011 | | $ | 14.03 | | | $ | (0.13 | ) | | $ | 1.16 | (g) | | $ | 1.03 | | | | | $ | — | | | $ | — | | | $ | — | |
9/30/2010 | | | 11.58 | | | | (0.11 | )(i) | | | 2.56 | | | | 2.45 | | | | | | — | | | | — | | | | — | |
9/30/2009 | | | 13.07 | | | | (0.07 | ) | | | (1.42 | ) | | | (1.49 | ) | | | | | — | | | | — | | | | — | |
9/30/2008 | | | 15.87 | | | | (0.07 | ) | | | (2.73 | ) | | | (2.80 | ) | | | | | — | | | | — | | | | — | |
9/30/2007 | | | 12.00 | | | | (0.06 | )(j) | | | 3.93 | | | | 3.87 | | | | | | — | | | | — | | | | — | |
| Retail Class | | | | | | | | | | | | | | | | | | | | | | | | | | | | | | |
9/30/2011 | | | 13.55 | | | | (0.18 | ) | | | 1.15 | (g) | | | 0.97 | | | | | | — | | | | — | | | | — | |
9/30/2010 | | | 11.21 | | | | (0.13 | )(i) | | | 2.47 | | | | 2.34 | | | | | | — | | | | — | | | | — | |
9/30/2009 | | | 12.69 | | | | (0.09 | ) | | | (1.39 | ) | | | (1.48 | ) | | | | | — | | | | — | | | | — | |
9/30/2008 | | | 15.45 | | | | (0.10 | ) | | | (2.66 | ) | | | (2.76 | ) | | | | | — | | | | — | | | | — | |
9/30/2007 | | | 11.71 | | | | (0.09 | )(j) | | | 3.83 | | | | 3.74 | | | | | | — | | | | — | | | | — | |
| | | | | | |
Small Cap Value Fund | | | | | | | | | | | | | | | | | | | | | | | |
| Institutional Class | | | | | | | | | | | | | | | | | | | | | | | | | | | |
9/30/2011 | | $ | 22.93 | | | $ | 0.09 | (k) | | $ | (0.50 | ) | | $ | (0.41 | ) | | | | $ | (0.16 | ) | | $ | — | | | $ | (0.16 | ) |
9/30/2010 | | | 20.66 | | | | 0.11 | | | | 2.23 | | | | 2.34 | | | | | | (0.07 | ) | | | — | | | | (0.07 | ) |
9/30/2009 | | | 22.01 | | | | 0.09 | | | | (1.32 | ) | | | (1.23 | ) | | | | | (0.11 | ) | | | (0.01 | ) | | | (0.12 | ) |
9/30/2008 | | | 28.77 | | | | 0.11 | (l) | | | (4.03 | ) | | | (3.92 | ) | | | | | (0.06 | ) | | | (2.78 | ) | | | (2.84 | ) |
9/30/2007 | | | 27.69 | | | | 0.12 | (j)(m) | | | 4.29 | | | | 4.41 | | | | | | (0.17 | ) | | | (3.16 | ) | | | (3.33 | ) |
| Retail Class | | | | | | | | | | | | | | | | | | | | | | | | | | | | | | |
9/30/2011 | | | 22.71 | | | | 0.02 | (k) | | | (0.48 | ) | | | (0.46 | ) | | | | | (0.11 | ) | | | — | | | | (0.11 | ) |
9/30/2010 | | | 20.47 | | | | 0.06 | | | | 2.21 | | | | 2.27 | | | | | | (0.03 | ) | | | — | | | | (0.03 | ) |
9/30/2009 | | | 21.79 | | | | 0.04 | | | | (1.30 | ) | | | (1.26 | ) | | | | | (0.05 | ) | | | (0.01 | ) | | | (0.06 | ) |
9/30/2008 | | | 28.52 | | | | 0.05 | (l) | | | (4.00 | ) | | | (3.95 | ) | | | | | — | | | | (2.78 | ) | | | (2.78 | ) |
9/30/2007 | | | 27.46 | | | | 0.04 | (j)(m) | | | 4.28 | | | | 4.32 | | | | | | (0.10 | ) | | | (3.16 | ) | | | (3.26 | ) |
| Admin Class | | | | | | | | | | | | | | | | | | | | | | | | | | | |
9/30/2011 | | | 22.30 | | | | (0.04 | )(k) | | | (0.49 | ) | | | (0.53 | ) | | | | | (0.05 | ) | | | — | | | | (0.05 | ) |
9/30/2010 | | | 20.11 | | | | 0.00 | | | | 2.19 | | | | 2.19 | | | | | | — | | | | — | | | | — | |
9/30/2009 | | | 21.40 | | | | 0.00 | | | | (1.28 | ) | | | (1.28 | ) | | | | | (0.00 | ) | | | (0.01 | ) | | | (0.01 | ) |
9/30/2008 | | | 28.13 | | | | (0.01 | )(l) | | | (3.94 | ) | | | (3.95 | ) | | | | | — | | | | (2.78 | ) | | | (2.78 | ) |
9/30/2007 | | | 27.14 | | | | (0.03 | )(j)(m) | | | 4.22 | | | | 4.19 | | | | | | (0.04 | ) | | | (3.16 | ) | | | (3.20 | ) |
| (a) | Per share net investment income (loss) has been calculated using the average shares outstanding during the period. | |
| (b) | Amount rounds to less than $0.01 per share, if applicable. | |
| (c) | Effective June 1, 2009, redemption fees were eliminated. | |
| (d) | Had certain expenses not been waived/reimbursed during the period, if applicable, total returns would have been lower. Periods less than one year, if applicable, are not annualized. | |
| (e) | Computed on an annualized basis for periods less than one year, if applicable. | |
| (f) | The investment adviser and/or administrator agreed to waive its fees and/or reimburse a portion of the Fund’s expenses during the period. Without this waiver/reimbursement, if applicable, expenses would have been higher. | |
| (g) | The amount shown for a share outstanding does not correspond with the aggregate realized and unrealized gain (loss) on investments for the period due to the timing of sales and redemptions of fund shares in relation to fluctuating market values of investments of the Fund. | |
| (h) | Includes fee/expense recovery of 0.03%. | |
See accompanying notes to financial statements.
31 |
| | | | | | | | | | | | | | | | | | | | | | | | | | | | | | |
| | | | | | | | | | | | | Ratios to Average Net Assets: | | | | |
Redemption
fees (b)(c) | | | Net asset
value,
end of
the
period | | | Total
return
(%) (d) | | | Net assets,
end of
the period
(000’s) | | | Net
expenses
(%) (e)(f) | | | Gross
expenses (%)(e) | | | Net
investment
income
(loss)
(%) (e) | | | Portfolio
turnover
rate (%) | |
| | | | | | | | | | | | | | | | | | | | | | | | | | | | | | |
| | | | | | | | | | | | | | | | | | | | | | | | | | | | | | |
| $ | — | | | $ | 15.06 | | | | 7.34 | | | $ | 154,313 | | | | 0.98 | (h) | | | 0.98 | (h) | | | (0.78 | ) | | | 76 | |
| | — | | | | 14.03 | | | | 21.16 | | | | 52,501 | | | | 1.00 | | | | 1.06 | | | | (0.85 | )(i) | | | 69 | |
| | — | | | | 11.58 | | | | (11.40 | ) | | | 45,557 | | | | 1.00 | | | | 1.01 | | | | (0.68 | ) | | | 107 | |
| | 0.00 | | | | 13.07 | | | | (17.64 | ) | | | 44,540 | | | | 1.00 | | | | 1.01 | | | | (0.47 | ) | | | 92 | |
| | 0.00 | | | | 15.87 | | | | 32.25 | | | | 28,088 | | | | 1.00 | | | | 1.23 | | | | (0.47 | ) | | | 83 | |
| | | | | | | | | | | | | | | | | | | | | | | | | | | | | | |
| | — | | | | 14.52 | | | | 7.16 | | | | 113,110 | | | | 1.25 | | | | 1.27 | | | | (1.07 | ) | | | 76 | |
| | — | | | | 13.55 | | | | 20.87 | | | | 75,344 | | | | 1.25 | | | | 1.39 | | | | (1.10 | )(i) | | | 69 | |
| | — | | | | 11.21 | | | | (11.66 | ) | | | 75,478 | | | | 1.25 | | | | 1.43 | | | | (0.93 | ) | | | 107 | |
| | 0.00 | | | | 12.69 | | | | (17.86 | ) | | | 79,897 | | | | 1.25 | | | | 1.42 | | | | (0.70 | ) | | | 92 | |
| | 0.00 | | | | 15.45 | | | | 31.94 | | | | 20,924 | | | | 1.25 | | | | 1.50 | | | | (0.66 | ) | | | 83 | |
| | | | | | | |
| | | | | | | | | | | | | | | | | | | | | | | | | | | | | | |
| | | | | | | | | | | | | | | | | | | | | | | | | | | | | | |
| $ | — | | | $ | 22.36 | | | | (1.88 | )(k) | | $ | 431,761 | | | | 0.90 | | | | 0.93 | | | | 0.33 | (k) | | | 42 | |
| | — | | | | 22.93 | | | | 11.39 | | | | 454,853 | | | | 0.90 | | | | 0.94 | | | | 0.50 | | | | 52 | |
| | 0.00 | | | | 20.66 | | | | (5.42 | ) | | | 506,324 | | | | 0.90 | | | | 0.94 | | | | 0.52 | | | | 55 | |
| | 0.00 | | | | 22.01 | | | | (15.02 | ) | | | 553,268 | | | | 0.89 | | | | 0.89 | | | | 0.47 | | | | 61 | |
| | 0.00 | | | | 28.77 | | | | 17.02 | | | | 534,776 | | | | 0.89 | | | | 0.89 | | | | 0.43 | | | | 57 | |
| | | | | | | | | | | | | | | | | | | | | | | | | | | | | | |
| | — | | | | 22.14 | | | | (2.12 | )(k) | | | 347,759 | | | | 1.15 | | | | 1.22 | | | | 0.08 | (k) | | | 42 | |
| | — | | | | 22.71 | | | | 11.10 | | | | 383,934 | | | | 1.15 | | | | 1.24 | | | | 0.26 | | | | 52 | |
| | 0.00 | | | | 20.47 | | | | (5.66 | ) | | | 387,383 | | | | 1.15 | | | | 1.31 | | | | 0.26 | | | | 55 | |
| | 0.00 | | | | 21.79 | | | | (15.21 | ) | | | 464,525 | | | | 1.15 | | | | 1.27 | | | | 0.21 | | | | 61 | |
| | 0.00 | | | | 28.52 | | | | 16.74 | | | | 465,055 | | | | 1.15 | | | | 1.24 | | | | 0.15 | | | | 57 | |
| | | | | | | | | | | | | | | | | | | | | | | | | | | | | | |
| | — | | | | 21.72 | | | | (2.40 | )(k) | | | 65,500 | | | | 1.40 | | | | 1.52 | | | | (0.17 | )(k) | | | 42 | |
| | — | | | | 22.30 | | | | 10.89 | | | | 73,443 | | | | 1.40 | | | | 1.56 | | | | 0.02 | | | | 52 | |
| | 0.00 | | | | 20.11 | | | | (5.93 | ) | | | 74,195 | | | | 1.40 | | | | 1.77 | | | | 0.02 | | | | 55 | |
| | 0.00 | | | | 21.40 | | | | (15.44 | ) | | | 77,855 | | | | 1.40 | | | | 1.68 | | | | (0.04 | ) | | | 61 | |
| | 0.00 | | | | 28.13 | | | | 16.41 | | | | 76,783 | | | | 1.40 | | | | 1.56 | | | | (0.10 | ) | | | 57 | |
| | (i) | Includes a non-recurring dividend. Without this dividend, net investment loss per share would have been $(0.12) and $(0.14) for Institutional Class and Retail Class, respectively, and the ratio of net investment loss to average net assets would have been (0.92)% and (1.17)% for Institutional Class and Retail Class, respectively. |
| | (j) | Includes a non-recurring payment of $0.01 per share and $0.00 per share for Small Cap Growth Fund and Small Cap Value Fund, respectively. |
| | (k) | Includes a non-recurring dividend. Without this dividend, net investment income (loss) per share would have been $0.07, $0.01 and $(0.06) for Institutional Class, Retail Class and Admin Class, respectively, total return would have been (1.93)%, (2.16)% and (2.44)% for Institutional Class, Retail Class and Admin Class, respectively and the ratio of net investment income (loss) to average net assets would have been 0.28%, 0.03% and (0.22)% for Institutional Class, Retail Class and Admin Class, respectively. |
| | (l) | Includes a non-recurring dividend of $0.02 per share. |
| | (m) | Includes a non-recurring dividend of $0.05 per share. |
See accompanying notes to financial statements.
| 32
Notes to Financial Statements
September 30, 2011
1. Organization. Loomis Sayles Funds I and Loomis Sayles Funds II (the “Trusts” and each a “Trust”) are each organized as a Massachusetts business trust. Each Trust is registered under the Investment Company Act of 1940, as amended (the “1940 Act”), as an open-end management investment company. Each Declaration of Trust permits the Board of Trustees to authorize the issuance of an unlimited number of shares of the Trust in multiple series. The financial statements for certain funds of the Trusts are presented in separate reports. The following funds (individually, a “Fund” and collectively, the “Funds”) are included in this report:
Loomis Sayles Funds I:
Loomis Sayles Small Cap Value Fund (the “Small Cap Value Fund”)
Loomis Sayles Funds II:
Loomis Sayles Small Cap Growth Fund (the “Small Cap Growth Fund”)
Each Fund is a diversified investment company.
Each Fund offers Institutional Class Shares and Retail Class Shares. In addition, Small Cap Value Fund offers Admin Class Shares.
Most expenses of the Trusts can be directly attributed to a Fund. Expenses which cannot be directly attributed to a Fund are generally apportioned based on the relative net assets of each of the Funds in the Trusts. Expenses of a Fund are borne pro rata by the holders of each class of shares, except that each class bears expenses unique to that class (including the Rule 12b-1 service and distribution fees and transfer agent fees). In addition, each class votes as a class only with respect to its own Rule 12b-1 Plan. Shares of each class would receive their pro rata share of the net assets of a Fund if the Fund were liquidated. The Trustees approve separate distributions from net investment income on each class of shares.
2. Significant Accounting Policies. The following is a summary of significant accounting policies consistently followed by each Fund in the preparation of its financial statements. The Funds’ financial statements are prepared in accordance with accounting principles generally accepted in the United States of America which require the use of management estimates that affect the reported amounts and disclosures in the financial statements. Actual results could differ from those estimates. Management has evaluated the events and transactions subsequent to year-end through the date the financial statements were issued and has determined that there were no material events that would require disclosure in the Funds’ financial statements.
a. Valuation. Equity securities, including shares of closed-end investment companies and exchange-traded funds, for which market quotations are readily available are valued at market value, as reported by pricing services recommended by the investment adviser and approved by the Board of Trustees. Such pricing services generally use the security’s last sale price on the exchange or market where the security is primarily traded or, if there is no reported sale during the day, the closing bid price. Securities traded on the NASDAQ Global Select Market, NASDAQ Global Market and NASDAQ Capital Market are valued
33 |
Notes to Financial Statements – continued
September 30, 2011
at the NASDAQ Official Closing Price (“NOCP”), or if lacking a NOCP, at the most recent bid quotation on the applicable NASDAQ Market. Debt securities (other than short-term obligations purchased with an original or remaining maturity of sixty days or less) and unlisted equity securities are generally valued on the basis of evaluated bids furnished to the Funds by a pricing service recommended by the investment adviser and approved by the Board of Trustees, which service determines valuations for normal, institutional-size trading units of such securities using market information, transactions for comparable securities and various relationships between securities which are generally recognized by institutional traders. Broker-dealer bid quotations may also be used to value debt and equity securities where a pricing service does not price a security or where a pricing service does not provide a reliable price for the security. In instances where broker-dealer bid quotations are not available, certain securities held by the Funds may be valued on the basis of a price provided by a principal market maker. Investments in other open-end investment companies are valued at their net asset value each day. Short-term obligations purchased with an original or remaining maturity of sixty days or less are valued at amortized cost, which approximates market value. Securities for which market quotations are not readily available are valued at fair value as determined in good faith by the Funds’ investment adviser using consistently applied procedures under the general supervision of the Board of Trustees.
The Funds may hold securities traded in foreign markets. Foreign securities are valued at the market price in the foreign market. However, if events occurring after the close of the foreign market (but before the close of regular trading on the New York Stock Exchange) are believed to materially affect the value of those securities, such securities are fair valued pursuant to procedures approved by the Board of Trustees. When fair valuing securities, the Funds may, among other things, use modeling tools or other processes that may take into account factors such as securities market activity and/or significant events that occur after the close of the foreign market and before the Funds calculate their net asset values.
b. Investment Transactions and Related Investment Income. Investment transactions are accounted for on a trade date plus one basis for daily net asset value calculation. However, for financial reporting purposes, investment transactions are reported on trade date. Dividend income is recorded on ex-dividend date, or in the case of certain foreign securities, as soon as a Fund is notified, and interest income is recorded on an accrual basis. Interest income is increased by the accretion of discount and decreased by the amortization of premium. Distributions received from investments in securities that represent a return of capital or capital gain are recorded as a reduction of the cost of investments or as a realized gain, respectively. The calendar year-end amounts of ordinary income, capital gains, and return of capital included in distributions received from the Funds’ investments in real estate investment trusts (“REITs”) are reported to the Funds after the end of the fiscal year; accordingly, the Funds estimate these amounts for accounting purposes until the characterization of REIT distributions is reported to the Funds after the end of the fiscal year. Estimates are based on the most recent REIT
| 34
Notes to Financial Statements – continued
September 30, 2011
distribution information available. Investment income is recorded net of foreign taxes withheld when applicable. In determining net gain or loss on securities sold, the cost of securities has been determined on an identified cost basis. Investment income, non-class specific expenses and realized and unrealized gains and losses are allocated on a pro rata basis to each class based on the relative net assets of each class to the total net assets of the Fund.
c. Foreign Currency Translation. The books and records of the Funds are maintained in U.S. dollars. The values of securities, currencies and other assets and liabilities denominated in currencies other than U.S. dollars are translated into U.S. dollars based upon foreign exchange rates prevailing at the end of the period. Purchases and sales of investment securities, income and expenses are translated on the respective dates of such transactions.
Since the values of investment securities are presented at the foreign exchange rates prevailing at the end of the period, it is not practical to isolate that portion of the results of operations arising from changes in exchange rates from fluctuations which arise due to changes in market prices of investment securities. Such changes are included with the net realized and unrealized gain or loss on investments.
Net realized foreign exchange gains or losses arise from sales of foreign currency, currency gains or losses realized between the trade and settlement dates on securities transactions and the difference between the amounts of dividends, interest and foreign withholding taxes recorded on the Funds’ books and the U.S. dollar equivalent of the amounts actually received or paid. Net unrealized foreign exchange gains and losses arise from changes in the value of assets and liabilities, other than investment securities, at the end of the fiscal period, resulting from changes in exchange rates.
Each Fund may use foreign currency exchange contracts to facilitate transactions in foreign-denominated investments. Losses may arise from changes in the value of the foreign currency or if the counterparties do not perform under the contracts’ terms.
d. Federal and Foreign Income Taxes. Each Trust treats each Fund as a separate entity for federal income tax purposes. Each Fund intends to meet the requirements of the Internal Revenue Code of 1986, as amended, applicable to regulated investment companies, and to distribute to its shareholders substantially all of its net investment income and any net realized capital gains at least annually. Management has performed an analysis of each Fund’s tax positions for the open tax years as of September 30, 2011 and has concluded that no provisions for income tax are required. The Funds’ federal tax returns for the prior three fiscal years remain subject to examination by the Internal Revenue Service. Management is not aware of any events that are reasonably possible to occur in the next twelve months that would result in the amounts of any unrecognized tax benefits significantly increasing or decreasing for the Funds. However, management’s conclusions regarding tax positions taken may be subject to review and adjustment at a later date based on factors including, but not limited to, new tax laws and accounting regulations and interpretations thereof.
35 |
Notes to Financial Statements – continued
September 30, 2011
A Fund may be subject to foreign taxes on income and gains on investments that are accrued based upon the Fund’s understanding of the tax rules and regulations that exist in the countries in which the Fund invests. Foreign governments may also impose taxes or other payments on investments with respect to foreign securities. Such taxes are accrued as applicable.
e. Dividends and Distributions to Shareholders. Dividends and distributions are recorded on ex-dividend date. The timing and characterization of certain income and capital gain distributions are determined annually in accordance with federal tax regulations, which may differ from accounting principles generally accepted in the United States of America. Permanent differences are primarily due to differing treatments for book and tax purposes of items such as expired capital loss carryforwards, distributions in excess of current earnings, net operating losses and deferred Trustees’ fees. Permanent book and tax basis differences relating to shareholder distributions will result in reclassifications to capital accounts. Temporary differences between book and tax distributable earnings are primarily due to securities lending collateral gain/loss adjustment, deferred Trustees’ fees and wash sales. Distributions from net investment income and short-term capital gains are considered to be distributed from ordinary income for tax purposes.
The tax characterization of distributions is determined on an annual basis. The tax character of distributions paid to shareholders during the years ended September 30, 2011 and 2010 were as follows:
| | | | | | | | | | | | | | | | | | | | | | | | |
| | | 2011 Distributions Paid From: | | | 2010 Distributions Paid From: | |
Fund | | Ordinary
Income | | | Long-Term
Capital Gains | | | Total | | | Ordinary
Income | | | Long-Term
Capital Gains | | | Total | |
Small Cap Growth Fund | | $ | — | | | $ | — | | | $ | — | | | $ | — | | | $ | — | | | $ | — | |
Small Cap Value Fund | | | 5,223,638 | | | | — | | | | 5,223,638 | | | | 2,321,057 | | | | — | | | | 2,321,057 | |
As of September 30, 2011, the components of distributable earnings on a tax basis were as follows:
| | | | | | | | |
| | | Small Cap
Growth Fund | | | Small Cap
Value Fund | |
Undistributed ordinary income | | $ | — | | | $ | — | |
Undistributed long-term capital gains | | | — | | | | — | |
| | | | | | | | |
Total undistributed earnings | | | — | | | | — | |
| | | | | | | | |
Capital loss carryforward: | | | | | | | | |
Expires September 30, 2017 | | | (14,995,800 | ) | | | — | |
Expires September 30, 2018 | | | (11,878,485 | ) | | | (55,289,597 | ) |
| | | | | | | | |
Total capital loss carryforward | | | (26,874,285 | ) | | | (55,289,597 | ) |
Deferred net capital losses
(post-October 2010) | | | — | | | | — | |
Unrealized appreciation (depreciation) | | | (3,042,116 | ) | | | 33,385,821 | |
| | | | | | | | |
Total accumulated losses | | $ | (29,916,401 | ) | | $ | (21,903,776 | ) |
| | | | | | | | |
Capital loss carryforward utilized in the current year | | $ | (24,342,443 | ) | | $ | (91,474,906 | ) |
| | | | | | | | |
| 36
Notes to Financial Statements – continued
September 30, 2011
The Small Cap Growth Fund had $34,940,597 of capital loss carryforwards expire in the current year.
On December 22, 2010, the Regulated Investment Company Modernization Act of 2010 (the “Act”) was enacted. The Act modernizes several of the federal income and excise tax provisions related to RICs, and, with certain exceptions, is effective for taxable years beginning after December 22, 2010. Among the changes made are changes to the capital loss carryforward rules allowing for capital losses to be carried forward indefinitely. Rules in effect as of the report date limit the carryforward period to eight years. Capital loss carryforwards generated in taxable years beginning after the effective date of the Act must be fully used before capital loss carryforwards generated in taxable years prior to effective date of the Act; therefore, under certain circumstances, capital loss carryforwards available as of the report date, if any, may expire unused.
f. Repurchase Agreements. It is each Fund’s policy that the market value of the collateral for repurchase agreements be at least equal to 102% of the repurchase price, including interest. Certain repurchase agreements are tri-party arrangements whereby the collateral is held in a segregated account for the benefit of the Fund and on behalf of the counterparty. Repurchase agreements could involve certain risks in the event of default or insolvency of the counterparty, including possible delays or restrictions upon a Fund’s ability to dispose of the underlying securities.
g. Securities Lending. The Funds have entered into an agreement with State Street Bank and Trust Company (“State Street Bank”), as agent of the Funds, to lend securities to certain designated borrowers. The loans are collateralized with cash or securities in an amount equal to at least 105% or 102% of the market value (including accrued interest) of the loaned international or domestic securities, respectively, when the loan is initiated. Thereafter, the value of the collateral must remain at least 102% of the market value (including accrued interest) of loaned securities for U.S. equities and U.S. corporate debt; at least 105% of the market value (including accrued interest) of loaned securities for non-U.S. equities; and at least 100% of the market value (including accrued interest) of loaned securities for U.S. Government securities, sovereign debt issued by non-U.S. Governments and non-U.S. corporate debt. In the event that the market value of the collateral falls below the required percentages described above, the borrower will deliver additional collateral on the next business day. As with other extensions of credit, the Funds may bear the risk of loss with respect to the investment of the collateral. The Funds invest cash collateral in short-term investments, a portion of the income from which is remitted to the borrowers and the remainder allocated between the Funds and State Street Bank as lending agent.
For the year ended September 30, 2011, neither Fund had loaned securities under this agreement.
h. Indemnifications. Under the Trusts’ organizational documents, their officers and Trustees are indemnified against certain liabilities arising out of the performance of their
37 |
Notes to Financial Statements – continued
September 30, 2011
duties to the Funds. Additionally, in the normal course of business, the Funds enter into contracts with service providers that contain general indemnification clauses. The Funds’ maximum exposure under these arrangements is unknown as this would involve future claims that may be made against the Funds that have not yet occurred. However, based on experience, the Funds expect the risk of loss to be remote.
3. Fair Value Measurements. In accordance with accounting standards related to fair value measurements and disclosures, the Funds have categorized the inputs utilized in determining the value of each Fund’s assets or liabilities. These inputs are summarized in the three broad levels listed below:
| | • | | Level 1—quoted prices in active markets for identical assets or liabilities; |
| | • | | Level 2—prices determined using other significant inputs that are observable either directly, or indirectly through corroboration with observable market data (which could include quoted prices for similar assets or liabilities, interest rates, credit risk, etc.); |
| | • | | Level 3—prices determined using significant unobservable inputs when quoted prices or observable inputs are unavailable such as when there is little or no market activity for an asset or liability (unobservable inputs reflect each Fund’s own assumptions in determining the fair value of assets or liabilities and would be based on the best information available). |
The inputs or methodology used for valuing securities are not necessarily an indication of the risk associated with investing in those securities.
The following is a summary of the inputs used to value the Funds’ investments as of September 30, 2011, at value:
Small Cap Growth Fund
Asset Valuation Inputs
| | | | | | | | | | | | | | | | |
Description(a) | | Level 1 | | | Level 2 | | | Level 3 | | | Total | |
Common Stocks | | $ | 256,042,748 | | | $ | — | | | $ | — | | | $ | 256,042,748 | |
Short-Term Investments | | | — | | | | 10,586,037 | | | | — | | | | 10,586,037 | |
| | | | | | | | | | | | | | | | |
Total | | $ | 256,042,748 | | | $ | 10,586,037 | | | $ | — | | | $ | 266,628,785 | |
| | | | | | | | | | | | | | | | |
(a) Details of the major categories of the Fund’s investments are reflected within the Portfolio of Investments.
Small Cap Value Fund
Asset Valuation Inputs
| | | | | | | | | | | | | | | | |
Description(a) | | Level 1 | | | Level 2 | | | Level 3 | | | Total | |
Common Stocks | | $ | 818,071,676 | | | $ | — | | | $ | — | | | $ | 818,071,676 | |
Closed End Investment Companies | | | 7,268,921 | | | | — | | | | — | | | | 7,268,921 | |
Short-Term Investments | | | — | | | | 26,703,466 | | | | — | | | | 26,703,466 | |
| | | | | | | | | | | | | | | | |
Total | | $ | 825,340,597 | | | $ | 26,703,466 | | | $ | — | | | $ | 852,044,063 | |
| | | | | | | | | | | | | | | | |
(a) Details of the major categories of the Fund’s investments are reflected within the Portfolio of Investments.
| 38
Notes to Financial Statements – continued
September 30, 2011
4. Purchases and Sales of Securities. For the year ended September 30, 2011, purchases and sales of securities (excluding short-term investments) were as follows:
| | | | | | | | |
Fund | | Purchases | | | Sales | |
Small Cap Growth Fund | | $ | 304,753,106 | | | $ | 165,116,650 | |
Small Cap Value Fund | | | 426,899,177 | | | | 491,443,524 | |
5. Management Fees and Other Transactions with Affiliates.
a. Management Fees. Loomis, Sayles & Company, L.P. (“Loomis Sayles”) serves as investment adviser to each Fund. Under the terms of the management agreements, each Fund pays a management fee at the following annual rates, calculated daily and payable monthly, based on each Fund’s average daily net assets:
| | | | |
Fund | | Percentage of Average
Daily Net Assets | |
Small Cap Growth Fund | | | 0.75% | |
Small Cap Value Fund | | | 0.75% | |
Loomis Sayles has given binding undertakings to the Funds to waive management fees and/or reimburse certain expenses to limit the Funds’ operating expenses, exclusive of acquired fund fees and expenses, brokerage expenses, interest expense, taxes and extraordinary expenses. These undertakings are in effect until January 31, 2012 and are reevaluated on an annual basis. Management fees payable, as reflected on the Statements of Assets and Liabilities, is net of waivers and/or expense reimbursements, if any, pursuant to these undertakings.
For the year ended September 30, 2011, the expense limits as a percentage of average daily net assets under the expense limitation agreements were as follows:
| | | | | | | | | | | | |
| | | Expense Limit as a Percentage of
Average Daily Net Assets | |
Fund | | Institutional Class | | | Retail Class | | | Admin Class | |
Small Cap Growth Fund | �� | | 1.00% | | | | 1.25% | | | | — | |
Small Cap Value Fund | | | 0.90% | | | | 1.15% | | | | 1.40% | |
Loomis Sayles shall be permitted to recover expenses it has borne under the expense limitation agreements (whether through waiver of its management fees or otherwise) on a class by class basis in later periods to the extent the expenses of a class fall below a class’ expense limits, provided, however, that a class is not obligated to pay such waived/reimbursed fees or expenses more than one year after the end of the fiscal year in which the fees or expenses were waived/reimbursed.
For the year ended September 30, 2011, the management fees for each Fund were as follows:
| | | | | | | | |
Fund | | Management
Fees | | | Percentage of
Average Daily Net Assets | |
Small Cap Growth Fund | | $ | 1,692,500 | | | | 0.75% | |
Small Cap Value Fund | | | 7,809,927 | | | | 0.75% | |
39 |
Notes to Financial Statements – continued
September 30, 2011
For the year ended September 30, 2011, class-specific expenses have been reimbursed as follows:
| | | | | | | | | | | | | | | | |
| | | Reimbursement1 | |
Fund | | Institutional
Class | | | Retail
Class | | | Admin
Class | | | Total | |
Small Cap Growth Fund | | $ | — | | | $ | 27,094 | | | $ | — | | | $ | 27,094 | |
Small Cap Value Fund | | | 133,329 | | | | 316,740 | | | | 101,019 | | | | 551,088 | |
1Expense reimbursements are subject to possible recovery until September 30, 2012.
For the year ended September 30, 2011, expense reimbursements related to the prior fiscal year were recovered as follows:
| | | | | | | | | | | | |
| | | Recovered Expenses | |
Fund | | Institutional
Class | | | Retail Class | | | Total | |
Small Cap Growth Fund | | $ | 29,470 | | | $ | — | | | $ | 29,470 | |
Certain officers and employees of Loomis Sayles are also officers or Trustees of the Trust. Loomis Sayles’ general partner is indirectly owned by Natixis Global Asset Management, L.P. (“Natixis US”), which is part of Natixis Global Asset Management, an international asset management group based in Paris, France.
b. Service and Distribution Fees. Natixis Distributors, L.P. (“Natixis Distributors”), a wholly-owned subsidiary of Natixis US, has entered into a distribution agreement with the Trusts. Pursuant to this agreement, Natixis Distributors serves as principal underwriter of the Funds of the Trusts.
Pursuant to Rule 12b-1 under the 1940 Act, Small Cap Growth Fund and Small Cap Value Fund have adopted a Distribution Plan relating to each Fund’s Retail Class shares (the “Retail Class Plans”) and Small Cap Value Fund has adopted a Distribution Plan relating to its Admin Class shares (the “Admin Class Plan”).
Under the Retail Class Plans, each Fund pays Natixis Distributors a monthly distribution fee at an annual rate not to exceed 0.25% of the average daily net assets attributable to the Funds’ Retail Class shares, as compensation for services provided by Natixis Distributors in connection with the marketing or sale of Retail Class shares or for payments made by Natixis Distributors to securities dealers or other financial intermediaries as commissions, asset-based sales charges or other compensation with respect to the sale of Retail Class shares, or for providing personal services to investors and/or maintenance of shareholder accounts.
Under the Admin Class Plan, Small Cap Value Fund pays Natixis Distributors a monthly distribution fee at an annual rate not to exceed 0.25% of the average daily net assets attributable to the Fund’s Admin Class shares, as compensation for services provided by Natixis Distributors in connection with the marketing or sale of Admin Class shares or for payments made by Natixis Distributors to securities dealers or other financial intermediaries as commissions, asset-based sales charges or other compensation with
| 40
Notes to Financial Statements – continued
September 30, 2011
respect to the sale of Admin Class shares, or for providing personal services to investors and/or the maintenance of shareholder accounts.
In addition, the Admin Class shares of Small Cap Value Fund may pay Natixis Distributors an administrative service fee, at an annual rate not to exceed 0.25% of the average daily net assets attributable to Admin Class shares. These fees are subsequently paid to securities dealers or financial intermediaries for providing personal services and/or account maintenance for their customers who hold such shares.
For the year ended September 30, 2011, the Funds paid the following service and distribution fees:
| | | | | | | | | | | | |
| | | Service Fees | | | Distribution Fees | |
Fund | | Admin Class | | | Retail Class | | | Admin Class | |
Small Cap Growth Fund | | $ | — | | | $ | 284,823 | | | $ | — | |
Small Cap Value Fund | | | 205,471 | | | | 1,073,681 | | | | 205,471 | |
c. Administrative Fees. Natixis Asset Management Advisors, L.P. (“Natixis Advisors”) provides certain administrative services for the Funds and contracts with State Street Bank to serve as sub-administrator. Natixis Advisors is a wholly-owned subsidiary of Natixis US. Pursuant to an agreement among Natixis Funds Trust I, Natixis Funds Trust II, Natixis Funds Trust IV, Gateway Trust (“Natixis Funds Trusts”), Loomis Sayles Funds I, Loomis Sayles Funds II (“Loomis Sayles Funds Trusts”), Hansberger International Series and Natixis Advisors, each Fund pays Natixis Advisors monthly its pro rata portion of fees equal to an annual rate of 0.0575% of the first $15 billion of the average daily net assets of the Natixis Funds Trusts, Loomis Sayles Funds Trusts and Hansberger International Series, 0.0500% of the next $15 billion, 0.0400% of the next $30 billion and 0.0350% of such assets in excess of $60 billion, subject to an annual aggregate minimum fee for the Natixis Funds Trusts, Loomis Sayles Funds Trusts and Hansberger International Series of $10 million, which is reevaluated on an annual basis.
For the year ended September 30, 2011, each Fund paid the following administrative fees to Natixis Advisors:
| | | | |
Fund | | Administrative
Fees | |
Small Cap Growth Fund | | $ | 104,735 | |
Small Cap Value Fund | | | 483,829 | |
d. Sub-Transfer Agent Fees. Natixis Distributors has entered into agreements with financial intermediaries to provide certain recordkeeping, processing, shareholder communications and other services to customers of the intermediaries and has agreed to compensate the intermediaries for providing those services. Certain services would be provided by the Funds if the shares of those customers were registered directly with the Funds’ transfer agent. Accordingly, the Funds agreed to pay a portion of the intermediary fees attributable to shares of the Funds held by the intermediaries (which generally is a percentage of the value of shares held) not to exceed what the Funds would have paid its transfer agent had each customer’s
41 |
Notes to Financial Statements – continued
September 30, 2011
shares been registered directly with the transfer agent instead of held through the intermediaries. Natixis Distributors pays the remainder of the fees.
For the year ended September 30, 2011, the Funds paid the following sub-transfer agent fees, which are reflected in transfer agent fees and expenses in the Statements of Operations:
| | | | | | | | | | | | |
| | | Sub-Transfer Agent Fees | |
Fund | | Institutional
Class | | | Retail Class | | | Admin
Class | |
Small Cap Growth Fund | | $ | 80,104 | | | $ | 82,827 | | | $ | — | |
Small Cap Value Fund | | | 480,211 | | | | 577,864 | | | | 152,883 | |
e. Trustees Fees and Expenses. The Trusts do not pay any compensation directly to their officers or Trustees who are directors, officers or employees of Natixis Advisors, Natixis Distributors, Natixis US or their affiliates. The Chairperson of the Board receives a retainer fee at the annual rate of $250,000. The Chairperson does not receive any meeting attendance fees for Board of Trustees meetings or committee meetings that she attends. Each Independent Trustee (other than the Chairperson) receives, in the aggregate, a retainer fee at the annual rate of $80,000. Each Independent Trustee also receives a meeting attendance fee of $10,000 for each meeting of the Board of Trustees that he or she attends in person and $5,000 for each meeting of the Board of Trustees that he or she attends telephonically. In addition, each committee chairman receives an additional retainer fee at an annual rate of $15,000. Each Contract Review and Governance Committee member is compensated $6,000 for each Committee meeting that he or she attends in person and $3,000 for each meeting that he or she attends telephonically. Each Audit Committee member is compensated $7,500 for each Committee meeting that he or she attends in person and $3,750 for each meeting that he or she attends telephonically. These fees are allocated among the funds in the Natixis Funds Trusts, Loomis Sayles Funds Trusts and Hansberger International Series based on a formula that takes into account, among other factors, the relative net assets of each fund. Trustees are reimbursed for travel expenses in connection with attendance at meetings.
A deferred compensation plan (the “Plan”) is available to the Trustees on a voluntary basis. Deferred amounts remain in the Funds until distributed in accordance with the provisions of the Plan. The value of a participating Trustee’s deferral account is based on theoretical investments of deferred amounts, on the normal payment dates, in certain funds of the Natixis Funds Trusts, Loomis Sayles Funds Trusts and Hansberger International Series as designated by the participating Trustees. Changes in the value of participants’ deferral accounts are allocated pro rata among the funds in the Natixis Funds Trusts, Loomis Sayles Funds Trusts, and Hansberger International Series, and are normally reflected as Trustees’ fees and expenses in the Statements of Operations. The portions of the accrued obligations allocated to the Funds under the Plan are reflected as Deferred Trustees’ fees in the Statements of Assets and Liabilities.
f. Payments by Affiliates. For the year ended September 30, 2011, Loomis Sayles reimbursed Small Cap Growth Fund $36 for losses incurred in connection with a trading error.
| 42
Notes to Financial Statements – continued
September 30, 2011
6. Class Specific Expenses. For the year ended September 30, 2011, the Funds paid the following class-specific transfer agent fees and expenses (including sub-transfer agent fees):
| | | | | | | | | | | | |
| | | Transfer Agent Fees and Expenses | |
Fund | | Institutional
Class | | | Retail Class | | | Admin
Class | |
Small Cap Growth Fund | | $ | 83,934 | | | $ | 168,142 | | | $ | — | |
Small Cap Value Fund | | | 495,430 | | | | 611,177 | | | | 157,405 | |
7. Line of Credit. Each Fund, together with certain other funds of Natixis Funds Trusts, Loomis Sayles Funds Trusts and Hansberger International Series, participates in a $200,000,000 committed unsecured line of credit provided by State Street Bank, with an individual limit of $125,000,000 for each fund that participates in the line of credit. Interest is charged to each participating fund based on its borrowings at a rate per annum equal to the greater of the Federal Funds rate or overnight LIBOR, plus 1.25%. In addition, a commitment fee of 0.125% per annum, payable at the end of each calendar quarter, is accrued and apportioned among the participating funds based on their average daily unused portion of the line of credit. Prior to April 21, 2011, the commitment fee was 0.15% per annum.
For the year ended September 30, 2011, neither Fund had borrowings under these agreements.
8. Brokerage Commission Recapture. Each Fund has entered into agreements with certain brokers whereby the brokers will rebate a portion of brokerage commissions. All amounts rebated by the brokers are returned to the Funds under such agreements and are included in realized gains on investments in the Statements of Operations. For the year ended September 30, 2011, amounts rebated under these agreements were as follows:
| | | | |
Fund | | Rebates | |
Small Cap Growth Fund | | $ | 23,926 | |
Small Cap Value Fund | | | 124,396 | |
9. Concentration of Ownership. At September 30, 2011, Loomis Sayles Funded Pension Plan and Trust (“Pension Plan”) and the Loomis Sayles Employees’ Profit Sharing Retirement Plan (“Retirement Plan”) held shares of beneficial interest in the Funds representing the following percentages of net assets:
| | | | | | | | |
Fund | | Pension Plan | | | Retirement Plan | |
Small Cap Growth Fund | | | 2.01% | | | | 2.37% | |
Small Cap Value Fund | | | 1.04% | | | | 1.90% | |
From time to time, the Funds may have a concentration of one or more shareholders holding a significant percentage of shares outstanding. Investment activities of these shareholders could have material impacts on the Funds. As of September 30, 2011, one shareholder account comprised more than 5% of Small Cap Value Fund’s total outstanding shares, representing 25.73% of the Fund’s net assets, based on accounts that represent more than 5% of an individual class of shares. Such accounts may be beneficially held by one or more individuals or entities other than the owner of record.
43 |
Notes to Financial Statements – continued
September 30, 2011
10. Capital Shares. Each Fund may issue an unlimited number of shares of beneficial interest, without par value. Transactions in capital shares were as follows:
| | | | | | | | | | | | | | | | |
| | | Small Cap Growth Fund | |
| | | Year Ended
September 30, 2011 | | | Year Ended
September 30, 2010 | |
| Institutional Class | | Shares | | | Amount | | | Shares | | | Amount | |
Issued from the sale of shares | | | 8,270,565 | | | $ | 142,244,743 | | | | 942,038 | | | $ | 12,157,438 | |
Issued in connection with the reinvestment of distributions | | | — | | | | — | | | | — | | | | — | |
Redeemed | | | (1,769,935 | ) | | | (30,230,462 | ) | | | (1,134,399 | ) | | | (14,055,822 | ) |
| | | | | | | | | | | | | | | | |
Net change | | | 6,500,630 | | | $ | 112,014,281 | | | | (192,361 | ) | | $ | (1,898,384 | ) |
| | | | | | | | | | | | | | | | |
| Retail Class | | | | | | | | | | | | |
Issued from the sale of shares | | | 5,486,059 | | | $ | 91,670,428 | | | | 1,649,726 | | | $ | 20,206,682 | |
Issued in connection with the reinvestment of distributions | | | — | | | | — | | | | — | | | | — | |
Redeemed | | | (3,253,098 | ) | | | (54,352,059 | ) | | | (2,822,162 | ) | | | (35,343,638 | ) |
| | | | | | | | | | | | | | | | |
Net change | | | 2,232,961 | | | $ | 37,318,369 | | | | (1,172,436 | ) | | $ | (15,136,956 | ) |
| | | | | | | | | | | | | | | | |
Increase (decrease) from capital share transactions | | | 8,733,591 | | | $ | 149,332,650 | | | | (1,364,797 | ) | | $ | (17,035,340 | ) |
| | | | | | | | | | | | | | | | |
| 44
Notes to Financial Statements – continued
September 30, 2011
10. Capital Shares – continued.
| | | | | | | | | | | | | | | | |
| | | Small Cap Value Fund | |
| | | Year Ended
September 30, 2011 | | | Year Ended
September 30, 2010 | |
| Institutional Class | | Shares | | | Amount | | | Shares | | | Amount | |
Issued from the sale of shares | | | 3,546,529 | | | $ | 95,137,414 | | | | 2,602,888 | | | $ | 56,206,503 | |
Issued in connection with the reinvestment of distributions | | | 114,244 | | | | 3,053,733 | | | | 80,409 | | | | 1,643,559 | |
Redeemed | | | (4,186,397 | ) | | | (112,560,971 | ) | | | (7,355,313 | ) | | | (156,910,081 | ) |
| | | | | | | | | | | | | | | | |
Net change | | | (525,624 | ) | | $ | (14,369,824 | ) | | | (4,672,016 | ) | | $ | (99,060,019 | ) |
| | | | | | | | | | | | | | | | |
| Retail Class | | | | | | | | | | | | |
Issued from the sale of shares | | | 2,574,140 | | | $ | 67,167,049 | | | | 1,882,548 | | | $ | 40,646,183 | |
Issued in connection with the reinvestment of distributions | | | 66,486 | | | | 1,762,558 | | | | 25,691 | | | | 521,021 | |
Redeemed | | | (3,836,066 | ) | | | (101,096,155 | ) | | | (3,929,781 | ) | | | (84,156,249 | ) |
| | | | | | | | | | | | | | | | |
Net change | | | (1,195,440 | ) | | $ | (32,166,548 | ) | | | (2,021,542 | ) | | $ | (42,989,045 | ) |
| | | | | | | | | | | | | | | | |
| Admin Class | | | | | | | | | | | | |
Issued from the sale of shares | | | 1,061,267 | | | $ | 27,365,871 | | | | 995,292 | | | $ | 21,022,763 | |
Issued in connection with the reinvestment of distributions | | | 5,109 | | | | 133,140 | | | | — | | | | — | |
Redeemed | | | (1,344,604 | ) | | | (35,080,134 | ) | | | (1,389,922 | ) | | | (29,181,878 | ) |
| | | | | | | | | | | | | | | | |
Net change | | | (278,228 | ) | | $ | (7,581,123 | ) | | | (394,630 | ) | | $ | (8,159,115 | ) |
| | | | | | | | | | | | | | | | |
Increase (decrease) from capital share transactions | | | (1,999,292 | ) | | $ | (54,117,495 | ) | | | (7,088,188 | ) | | $ | (150,208,179 | ) |
| | | | | | | | | | | | | | | | |
45 |
Report of Independent Registered Public Accounting Firm
To the Trustees of Loomis Sayles Funds I and Loomis Sayles Funds II and Shareholders of
Loomis Sayles Small Cap Value Fund and Loomis Sayles Small Cap Growth Fund:
In our opinion, the accompanying statements of assets and liabilities, including the portfolios of investments, and the related statements of operations and of changes in net assets and the financial highlights present fairly, in all material respects, the financial position of the Loomis Sayles Small Cap Value Fund, a series of Loomis Sayles Funds I, and the Loomis Sayles Small Cap Growth Fund, a series of Loomis Sayles Funds II (collectively, the “Funds”), at September 30, 2011, and the results of each of their operations, the changes in each of their net assets and the financial highlights for each of the periods indicated, in conformity with accounting principles generally accepted in the United States of America. These financial statements and financial highlights (hereafter referred to as “financial statements”) are the responsibility of the Funds’ management; our responsibility is to express an opinion on these financial statements based on our audits. We conducted our audits of these financial statements in accordance with the standards of the Public Company Accounting Oversight Board (United States). Those standards require that we plan and perform the audits to obtain reasonable assurance about whether the financial statements are free of material misstatement. An audit includes examining, on a test basis, evidence supporting the amounts and disclosures in the financial statements, assessing the accounting principles used and significant estimates made by management, and evaluating the overall financial statement presentation. We believe that our audits, which included confirmation of securities at September 30, 2011 by correspondence with the custodian and brokers, provide a reasonable basis for our opinion.
PricewaterhouseCoopers LLP
Boston, Massachusetts
November 22, 2011
| 46
2011 U.S. Tax Distribution Information to
Shareholders (Unaudited)
Corporate Dividends Received Deduction. For the fiscal year ended September 30, 2011, a percentage of dividends distributed by the Funds listed below qualify for the dividends received deduction for corporate shareholders. These percentages are as follows:
| | | | |
Fund | | Qualifying Percentage | |
Small Cap Value | | | 100.00% | |
Qualified Dividend Income. For the fiscal year ended September 30, 2011, the Funds below will designate up to the maximum amount allowable pursuant to the Internal Revenue Code as qualified dividend income eligible for reduced tax rates. These lower rates range from 0% to 15% depending on an individual’s tax bracket. If the Funds pay a distribution during calendar year 2011, complete information will be reported in conjunction with Form 1099-DIV.
47 |
Trustee and Officer Information
The tables below provide certain information regarding the trustees and officers of Loomis Sayles Funds I and Loomis Sayles Funds II (the “Trusts”). Unless otherwise indicated, the address of all persons below is 399 Boylston Street, Boston, MA 02116. The Trusts’ Statements of Additional Information include additional information about the trustees of the Trusts and are available by calling Natixis Funds at 800-225-5478.
| | | | | | | | |
| Name and Year of Birth | | Position(s) Held
with the Trusts,
Length of Time
Served and Term of Office* | | Principal
Occupation(s)
During Past 5 Years | | Number of
Portfolios in
Fund Complex
Overseen** and
Other
Directorships Held During Past 5 Years | | Experience, Qualifications, Attributes, Skills for Board Membership |
| | | |
| INDEPENDENT TRUSTEES | | | | | | |
| | | | |
| Graham T. Allison, Jr. (1940) | | Trustee since 2003 and Contract Review and Governance Committee Member | | Douglas Dillon Professor and Director of the Belfer Center for Science and International Affairs, John F. Kennedy School of Government, Harvard University | | 44 Director, Taubman Centers, Inc. (real estate investment trust) | | Significant experience on Board of Trustees of the Trusts and/or other business organizations; government experience (including as Assistant Secretary of Defense under President Clinton); academic experience |
| | | | |
| Charles D. Baker (1956)*** | | Trustee from 2005 to 2009 and since 2011 and Contract Review and Governance Committee Member | | Executive in Residence at General Catalyst Partners (venture capital growth equity firm); formerly, President and Chief Executive Officer, Harvard Pilgrim Health Care (health plan) | | 44 None | | Significant experience on Board of Trustees of the Trusts and/or other business organizations; executive experience including president and chief executive officer of a corporation |
| | | | |
| Edward A. Benjamin (1938) | | Trustee since 2002 and Chairman of the Contract Review and Governance Committee | | Retired | | 44 Formerly, Director, Precision Optics Corporation (optics manufacturer) | | Significant experience on Board of Trustees of the Trusts and/or other business organizations; significant experience providing legal counsel to boards, funds, advisers and other financial institutions (former partner at Ropes & Gray LLP) |
| 48
| | | | | | | | |
| Name and Year of Birth | | Position(s) Held
with the Trusts,
Length of Time
Served and Term of Office* | | Principal
Occupation(s)
During Past 5 Years | | Number of
Portfolios in
Fund Complex
Overseen** and
Other
Directorships Held During Past 5 Years | | Experience, Qualifications, Attributes, Skills for Board Membership |
| | |
| INDEPENDENT TRUSTEES – continued | | | | |
| | | | |
Daniel M. Cain
(1945) | | Trustee since 2003 and Contract Review and Governance Committee Member | | Chairman (formerly, President and Chief Executive Officer) of Cain Brothers & Company, Incorporated (investment banking) | | 44 Director, Sheridan Healthcare Inc. (physician practice management) | | Significant experience on Board of Trustees of the Trusts and/or other business organizations; experience in the financial industry, including roles as chairman and former chief executive officer of an investment banking firm |
| | | | |
Kenneth A. Drucker (1945) | | Trustee since 2008 and Chairman of the Audit Committee | | Formerly, Vice President and Treasurer, Sequa Corp. (aerospace, automotive and metal manufacturing) | | 44 Formerly, Director, M Fund, Inc. (investment company); Director, Gateway Trust (investment company) | | Significant experience on Board of Trustees of the Trusts and/or other business organizations; executive experience including as treasurer of a corporation |
| | | | |
Wendell J. Knox (1948) | | Trustee since 2009 and Audit Committee Member | | Director (formerly, President and Chief Executive Officer) of Abt Associates Inc. (research and consulting) | | 44 Director, Eastern Bank (commercial bank); Director, The Hanover Insurance Group (property and casualty insurance) | | Significant experience on Board of Trustees of the Trusts and/or other business organizations; executive experience including roles as president and chief executive officer of a consulting company |
| | | | |
Sandra O. Moose
(1942) | | Chairperson of the Board of Trustees since November 2005 Trustee since 2003 Ex officio member of the Audit Committee and Contract Review and Governance Committee | | President, Strategic Advisory Services (management consulting); formerly, Senior Vice President and Director, The Boston Consulting Group, Inc. (management consulting) | | 44 Director, Verizon Communications; Director, AES Corporation (international power company); Formerly, Director, Rohm and Haas Company (specialty chemicals) | | Significant experience on Board of Trustees of the Trusts and/or other business organizations; executive experience at a management consulting company |
49 |
| | | | | | | | |
| Name and Year of Birth | | Position(s) Held
with the Trusts,
Length of Time
Served and Term of Office* | | Principal
Occupation(s)
During Past 5 Years | | Number of
Portfolios in
Fund Complex
Overseen** and
Other
Directorships Held During Past 5 Years | | Experience, Qualifications, Attributes, Skills for Board Membership |
| | |
| INDEPENDENT TRUSTEES – continued | | | | |
| | | | |
Erik R. Sirri (1958) | | Trustee since 2009 and Contract Review and Governance Committee Member | | Professor of Finance at Babson College; formerly, Director of the Division of Trading and Markets at the Securities and Exchange Commission | | 44 None | | Experience on Board of Trustees of the Trusts; Experience as Director of the Division of Trading and Markets at the Securities and Exchange Commission; academic experience and training as an economist |
| | | | |
Peter J. Smail (1952) | | Trustee since 2009 and Contract Review and Governance Committee Member | | Retired; formerly, President and Chief Executive Officer of Pyramis Global Advisors (investment management) | | 44 None | | Experience on Board of Trustees of the Trusts; Mutual fund industry and executive experience, including roles and president and chief executive officer for an investment advisor |
| | | | |
Cynthia L. Walker (1956) | | Trustee since 2005 and Audit Committee Member | | Deputy Dean for Finance and Administration, Yale University School of Medicine; formerly, Executive Dean for Administration, Harvard Medical School; and formerly, Dean for Finance and Chief Financial Officer, Harvard Medical School | | 44 None | | Significant experience on Board of Trustees of the Trusts and/or other business organizations; executive experience in a variety of academic organizations, including roles as dean for finance and administration |
| | | |
| INTERESTED TRUSTEES | | | | | | |
| | | | |
Robert J. Blanding1 (1947) 555 California Street San Francisco, CA 94104 | | Trustee since 2002 President and Chief Executive Officer of Loomis Sayles Funds I since 2002 Chief Executive Officer of Loomis Sayles Funds II since 2002 | | President, Chairman, Director and Chief Executive Officer, Loomis, Sayles & Company, L.P. | | 44 None | | Significant experience on Board of Trustees of the Trusts; continuing service as president, chairman, and chief executive officer of Loomis Sayles & Company, L.P. |
| 50
| | | | | | | | |
| Name and Year of Birth | | Position(s) Held
with the Trusts,
Length of Time
Served and Term of Office* | | Principal
Occupation(s)
During Past 5 Years | | Number of
Portfolios in
Fund Complex
Overseen** and
Other
Directorships Held During Past 5 Years | | Experience, Qualifications, Attributes, Skills for Board Membership |
| | |
| INTERESTED TRUSTEES – continued | | | | |
| | | | |
| David L. Giunta2 (1965)*** | | Trustee since 2011 President of Loomis Sayles Funds II; Executive Vice President of Loomis Sayles Funds I | | President and Chief Executive Officer, Natixis Distribution Corporation, Natixis Asset Management Advisors, L.P. and Natixis Distributors, L.P.; formerly, President, Fidelity Charitable Gift Fund; and formerly, Senior Vice President, Fidelity Brokerage Company | | 44 None | | Experience on Board of Trustees of the Trusts; continuing experience as President and Chief Executive Officer of Natixis Global Associates – U.S. |
| | | | |
John T. Hailer3
(1960) | | Trustee since 2003 | | President and Chief Executive Officer – U.S. and Asia, Natixis Global Asset Management, L.P.; formerly, President and Chief Executive Officer, Natixis Distribution Corporation, Natixis Asset Management Advisors, L.P., Natixis Distributors, L.P. and Natixis Global Associates, Inc. | | 44 None | | Significant experience on Board of Trustees of the Trusts; continuing experience as Chief Executive Officer of Natixis Global Asset Management, L.P. |
| * | Each trustee serves until retirement, resignation or removal from the Board of Trustees. The current retirement age is 72; however, the trustees designated 2010 as a transition period so that any trustees who were age 72 or older during 2010 will not be required to retire until the end of calendar year 2011. The position of Chairperson of the Board is appointed for a two-year term. Ms. Moose was appointed to serve an additional two-year term as the Chairperson of the Board of Trustees on November 20, 2009. |
| ** | The trustees of the Trusts serve as trustees of a fund complex that includes all series of the Natixis Funds Trust I, Natixis Funds Trust II, Natixis Funds Trust IV and Gateway Trust (collectively, the “Natixis Funds Trusts”), Loomis Sayles Funds I and Loomis Sayles Funds II (collectively, the “Loomis Sayles Funds Trusts”), and Hansberger International Series (collectively, the “Fund Complex”). |
| *** | Messrs. Baker and Giunta were appointed as trustees effective January 1, 2011. |
| 1 | Mr. Blanding is deemed an “interested person” of the Trusts because he holds the following positions with affiliated persons of the Trusts: President, Chairman, Director and Chief Executive Officer of Loomis, Sayles Company, L.P. |
| 2 | Mr. Giunta is deemed an “interested person” of the Trusts because he holds the following positions with affiliated persons of the Trusts: President and Chief Executive Officer, Natixis Distribution Corporation, Natixis Asset Management Advisors, L.P. and Natixis Distributors, L.P. |
| 3 | Mr. Hailer is deemed an “interested person” of the Trusts because he holds the following positions with affiliated persons of the Trusts: President and Chief Executive Officer – U.S. and Asia, Natixis Global Asset Management, L.P. |
51 |
| | | | | | |
| Name and Year of Birth | | Position(s) Held with
the Trust | | Term of Office* and
Length of Time Served | | Principal Occupation(s) During Past 5 Years** |
|
| OFFICERS OF THE TRUST |
| | | |
Coleen Downs Dinneen (1960) | | Secretary, Clerk and Chief Legal Officer | | Since September 2004 | | Executive Vice President, General Counsel, Secretary and Clerk (formerly, Senior Vice President, Deputy General Counsel, Assistant Secretary and Assistant Clerk), Natixis Distribution Corporation, Natixis Distributors, L.P., and Natixis Asset Management Advisors, L.P. |
| | | |
Daniel J. Fuss
(1933) One Financial Center Boston, MA 02111 | | Executive Vice President of Loomis Sayles Funds I and Loomis Sayles Funds II | | Since June 2003 | | Vice Chairman and Director, Loomis, Sayles & Company, L.P. |
| | | |
Russell L. Kane (1969) | | Chief Compliance Officer; Assistant Secretary and Anti-Money Laundering Officer | | Chief Compliance Officer since May 2006; Assistant Secretary since June 2004; and Anti-Money Laundering Officer since April 2007 | | Chief Compliance Officer for Mutual Funds, Senior Vice President, Deputy General Counsel, Assistant Secretary and Assistant Clerk, Natixis Distribution Corporation, Natixis Distributors, L.P. and Natixis Asset Management Advisors, L.P. |
| | | |
Michael C. Kardok
(1959) | | Treasurer, Principal Financial and Accounting Officer | | Since October 2004 | | Senior Vice President, Natixis Asset Management Advisors, L.P. and Natixis Distributors, L.P. |
| * | Each officer of the Trusts serves for an indefinite term in accordance with the Trusts’ current by-laws until the date his or her successor is elected and qualified, or until he or she sooner dies, retires, is removed or becomes disqualified. |
| ** | Each person listed above, except as noted, holds the same position(s) with the Natixis Funds Trusts, Loomis Sayles Funds Trusts and Hansberger International Series. Mr. Fuss is not an officer of the Natixis Funds Trusts or the Hansberger International Series. Previous positions during the past five years with the Distributor, Natixis Distributors, L.P., Natixis Advisors, or Loomis Sayles are omitted, if not materially different from a Trustee’s or officer’s current position with such entity. |
| 52
ANNUAL REPORT
September 30, 2011

Loomis Sayles Investment Grade Bond Fund
TABLE OF CONTENTS
Management Discussion page 1
Investment Results page 3
Portfolio of Investments page 13
Financial Statements page 33
Loomis Sayles Investment Grade Bond Fund
Management Discussion
Managers:
Daniel Fuss, CFA, CIC
Associate Managers:
Matthew J. Eagan, CFA
Kathleen Gaffney, CFA
Elaine Stokes
Loomis, Sayles & Company, L.P.
Objective:
High total investment return through a combination of current income and capital appreciation
Strategy:
Invests primarily in investment-grade, fixed-income securities, although it may invest up to 10% of its assets in below investment-grade fixed-income securities. The fund may invest any portion of its assets in securities of Canadian issuers and up to 20% in other foreign securities, including emerging markets.
Fund Inception:
December 31, 1996
Symbols:
| | |
| Class A | | LIGRX |
| Class B | | LGBBX |
| Class C | | LGBCX |
| Class Y | | LSIIX |
| Admin Class | | LIGAX |
| Class J | | LIGJX |
Market Conditions
Fixed-income markets rallied through the start of 2011, fueled by the Federal Reserve Board’s (the Fed) second large-scale asset purchase program, known as quantitative easing. Non-Treasury securities were the primary beneficiaries of the program, and commercial mortgage-backed securities (CMBS), high-yield bonds and equity-sensitive convertible bonds posted robust returns at the start of the year. The rally stalled in the summer months, after Standard & Poor’s downgraded U.S. government debt, the European sovereign debt situation worsened and economic data suggested a possible slowdown in global growth. Investors shunned risk during the third quarter of 2011, and a sudden flight to quality drove down U.S. Treasury yields to historical lows.
Performance Results
For the 12 months ended September 30, 2011, Class A shares of Loomis Sayles Investment Grade Bond Fund returned 3.47% at net asset value. The fund underperformed its benchmark, the Barclays Capital U.S. Government/Credit Bond Index, which returned 5.14% for the period. It also underperformed the 3.53% average return of its peer group, the Morningstar Intermediate-Term Bond category.
Explanation of Fund Performance
Duration strategy aided the fund’s performance during the period. (Duration measures price sensitivity to interest rate changes.) We extended the fund’s duration through the start of 2011, which boosted performance when rates on U.S. Treasuries plummeted. (When interest rates fall, funds with longer durations tend to experience greater price appreciation.) In addition, modest out-of-benchmark allocations to asset-backed securities (ABS) and CMBS helped the fund’s return, primarily due to strong security selection. A substantial currency allocation to commodity-rich nations, including Canada, New Zealand and Australia, continued to provide strong returns. Exposure to Canadian sovereign debt was a notable contributor, benefiting from the market’s flight to quality.
1 |
The fund’s out-of-benchmark allocations to high-yield and convertible bonds detracted most from returns. These securities sold off as investors lost confidence in the outlook for global growth and faced persistent negative news throughout the third quarter of 2011. An underweight in U.S. Treasuries also hurt performance, as the sector posted robust returns during the flight to quality late in the period. A position in investment-grade corporate bonds had a mixed impact on performance. Weakness in the financials sector (primarily among banking, communication, and finance names) offset our strong security selection in the industrials and utilities sectors (led by natural gas, capital goods and supranational names).
Outlook
Pronounced market illiquidity, re-pricing of risk assets for slower global growth, the effects of the Fed’s latest stimulus plan, named “Operation Twist” and events in Europe are among the themes we will focus on through year-end. Growth expectations for the U.S. and other developed economies remain lackluster, as high volatility and an uncertain business environment persist. Geopolitical factors are further clouding the outlook. Details of new regulations (healthcare reform, and the Dodd-Frank Act and Basel III financial regulation) have yet to be implemented, and election posturing in the U.S. will likely begin to overshadow policy formulation.
While our base case for economic growth for the remainder of 2011 and into 2012 remains less than robust, we believe there are many long-term, fundamentally stable or improving credits that currently offer attractive relative value. Default expectations are historically low, many corporate balance sheets remain strong, and companies are behaving conservatively given the uncertain business climate. These are all factors that can potentially benefit bondholders.
Although the Fed has signaled that it remains accommodative on a number of fronts in the short term, we believe U.S. interest rates are currently in a period of transition, with a bias higher over the long term. We will continue to pursue what we believe are less market-sensitive securities, seeking to own credits that move independent of the general market, regardless of the direction of rates. As macroeconomic fears and illiquidity feed periods of price declines, we intend to use these opportunities to increase allocations to fundamentally sound credits. Our conviction in opportunistic investing driven by fundamental research has not changed, and we remain steadfast in our long-term approach.
What You Should Know
Investments in the fund are subject to a number of risks. Please see the “Principal Risks” section of the fund’s prospectus. The purchase of fund shares should be seen as a long-term investment.
| 2
Loomis Sayles Investment Grade Bond Fund
Investment Results through September 30, 2011
The charts comparing the fund’s performance to an index provide you with a general sense of how it performed. The fund’s total return for the period shown below appears with and without sales charges and includes fund expenses and fees. An index measures the performance of a theoretical portfolio. Unlike a fund, the index is unmanaged and does not have expenses that affect the results. It is not possible to invest directly in an index. Investors would incur transaction costs and other expenses if they purchased the securities necessary to match the index.
Growth of a $10,000 Investment in Class A Shares1,3
September 30, 2001 through September 30, 2011
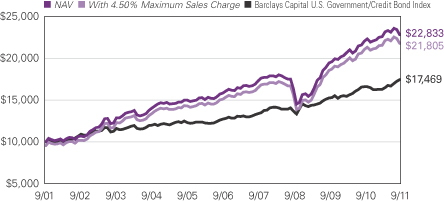
3 |
Average Annual Total Returns — September 30, 20113
| | | | | | | | | | | | |
| | | | |
| | | 1 Year | | | 5 Years | | | 10 Years | |
| | | | |
| Class A (Inception 12/31/96)1 | | | | | | | | | | | | |
| NAV | | | 3.47 | % | | | 7.59 | % | | | 8.61 | % |
| With 4.50% Maximum Sales Charge | | | -1.18 | | | | 6.61 | | | | 8.10 | |
| | | | |
| Class B (Inception 9/12/03)1 | | | | | | | | | | | | |
| NAV | | | 2.70 | | | | 6.69 | | | | 7.68 | |
| With CDSC2 | | | -2.12 | | | | 6.38 | | | | 7.68 | |
| | | | |
| Class C (Inception 9/12/03)1 | | | | | | | | | | | | |
| NAV | | | 2.71 | | | | 6.79 | | | | 7.74 | |
| With CDSC2 | | | 1.75 | | | | 6.79 | | | | 7.74 | |
| | | | |
| Class Y (Inception 12/31/96) | | | | | | | | | | | | |
| NAV | | | 3.81 | | | | 7.86 | | | | 8.91 | |
| | | | |
| Admin Class (Inception 2/1/10)1 | | | | | | | | | | | | |
| NAV | | | 3.26 | | | | 7.17 | | | | 8.08 | |
| | | | |
| Class J (Inception 5/24/99) | | | | | | | | | | | | |
| NAV | | | 3.05 | | | | 7.07 | | | | 8.10 | |
| With 3.50% Sales Charge | | | -0.52 | | | | 6.31 | | | | 7.71 | |
| | | | |
| Comparative Performance | | | | | | | | | | | | |
| Barclays Capital U.S. Government/Credit Bond Index | | | 5.14 | | | | 6.52 | | | | 5.74 | |
| Morningstar Intermediate-Term Bond Fund Avg. | | | 3.53 | | | | 5.63 | | | | 5.10 | |
Performance data quoted represents past performance and is no guarantee of future results. Total return and value will vary and you may have a gain or loss when shares are sold. Current performance may be lower or higher than quoted. For most recent month-end performance, visit ga.natixis.com. Performance for other share classes will be greater or less than shown based on differences in fees and sales charges. Performance for periods less than one year is cumulative, not annualized. Returns reflect changes in share price and reinvestment of dividends and capital gains, if any. Class Y shares are not available for purchase by all investors. Class J shares are not offered for sale in the United States and are not eligible for sale to U.S. investors.
The table and graph do not reflect taxes shareholders might owe on any fund distributions or when they redeem their shares.
NOTES TO CHARTS
See page 6 for a description of the index/average.
| 1 | Prior to 9/15/03, performance of Class A shares is that of Retail Class shares, which were redesignated as Class A shares, restated to reflect the sales load of Class A shares. From 12/18/00 to 1/31/02, during which time Retail Class shares were not outstanding, performance is that of Institutional Class shares, restated to reflect the higher net expenses and sales loads of Class A shares. Prior to the inception of Class B and C shares (9/12/03), performance is that of Institutional Class shares, which were redesignated as Class Y shares, restated to reflect the higher net expenses and sales loads of Class B and C shares. Prior to the inception of Admin Class shares (2/1/10), performance is that of Class A shares, restated to reflect the higher net expenses of Admin Class shares. |
| 2 | Performance for Class B shares assumes a maximum 5% contingent deferred sales charge (“CDSC”) applied when you sell shares, which declines annually between years 1-6 according to the following schedule: 5, 4, 3, 3, 2, 1, 0%. Class C shares performance assumes a 1% CDSC applied when you sell shares within one year of purchase. |
| 3 | Fund performance has been increased by fee waivers and/or expense reimbursements, if any, without which performance would have been lower. |
| 4
| | | | |
| Credit Quality | | % of Net Assets as of
9/30/11 | |
Aaa | | | 20.7 | |
Aa | | | 6.4 | |
A | | | 22.1 | |
Baa | | | 38.7 | |
Ba | | | 3.4 | |
B | | | 1.6 | |
Caa & Lower | | | 0.3 | |
Not Rated | | | 0.0 | |
Short-term and other | | | 6.8 | |
Credit quality at 9/30/11 reflects the highest credit rating assigned to individual holdings of the fund among Moody’s, S&P or Fitch; ratings are subject to change. The fund’s shares are not rated by any rating agency and no credit rating for the fund’s shares is implied. The Moody’s equivalent of the assigned rating is presented in the table.
| | | | |
| Effective Maturity | | % of Net Assets as of
9/30/11 | |
1 year or less | | | 12.9 | |
1-5 years | | | 22.8 | |
5-10 years | | | 46.1 | |
10+ years | | | 18.2 | |
Average Effective Maturity | | | 8.4 | |
Portfolio characteristics will vary.
Expense Ratios
as stated in the most recent prospectus
| | | | | | | | |
| Share Class | | Gross Expense Ratio1 | | | Net Expense Ratio2 | |
| A | | | 0.81 | % | | | 0.81 | % |
| B | | | 1.56 | | | | 1.56 | |
| C | | | 1.56 | | | | 1.56 | |
| Y | | | 0.56 | | | | 0.56 | |
| Admin | | | 1.06 | | | | 1.06 | |
| J | | | 1.30 | | | | 1.30 | |
| 1 | Before fee waivers and/or expense reimbursements. |
| 2 | After fee waivers and/or expense reimbursements. Waivers/reimbursements are contractual and are set to expire on 1/31/12. Contracts are reevaluated on an annual basis. |
5 |
ADDITIONAL INFORMATION
The views expressed in this report reflect those of the portfolio managers as of the dates indicated. The managers’ views are subject to change at any time without notice based on changes in market or other conditions. References to specific securities or industries should not be regarded as investment advice. Because the fund is actively managed, there is no assurance that it will continue to invest in the securities, countries or industries mentioned.
Before investing, consider the fund’s investment objectives, risks, charges and other expenses. Visit ga.natixis.com or call 800-225-5478 for a prospectus and/or a summary prospectus, both of which contain this and other information. Read it carefully.
INDEX/AVERAGE DESCRIPTIONS:
Barclays Capital U.S. Government/Credit Bond Index is an unmanaged index that includes U.S. Treasuries, government-related issues, and investment grade U.S. corporate securities.
Morningstar Intermediate-Term Bond Fund Average is the average performance without sales charges of funds with similar investment objectives, as calculated by Morningstar, Inc.
PROXY VOTING INFORMATION
A description of the fund’s proxy voting policies and procedures is available without charge, upon request, by calling Natixis Funds at 800-225-5478; on the fund’s website at ga.natixis.com; and on the Securities and Exchange Commission’s (SEC’s) website at www.sec.gov. Information regarding how the fund voted proxies relating to portfolio securities during the 12-month period ended June 30, 2011 is available from the fund’s website and the SEC’s website.
QUARTERLY PORTFOLIO SCHEDULES
The fund files a complete schedule of portfolio holdings with the SEC for the first and third quarters of each fiscal year on Form N-Q. The fund’s Forms N-Q are available on the SEC’s website at www.sec.gov and may be reviewed and copied at the SEC’s Public Reference Room in Washington, DC. Information on the operation of the Public Reference Room may be obtained by calling 800-SEC-0330.
| 6
UNDERSTANDING YOUR FUND’S EXPENSES
As a mutual fund shareholder, you incur different types of costs: transaction costs, including sales charges (loads) on purchases and contingent deferred sales charges on redemptions; and ongoing costs, including management fees, distribution fees (12b-1 fees) and/or service fees, and other fund expenses. These costs are described in more detail in the fund’s prospectus. The examples below are intended to help you understand the ongoing costs of investing in the fund and help you compare these with the ongoing costs of investing in other mutual funds.
The first line in the table for each class shows the actual amount of fund expenses you would have paid on a $1,000 investment in the fund from April 1, 2011 through September 30, 2011. It also shows how much a $1,000 investment would be worth at the close of the period, assuming actual fund returns and expenses. To estimate the expenses you paid over the period, simply divide your account value by $1,000 (for example $8,600 account value divided by $1,000 =8.60) and multiply the result by the number in the Expenses Paid During Period row as shown below for your class.
The second line in the table for each class provides information about hypothetical account values and hypothetical expenses based on the fund’s actual expense ratios and an assumed rate of return of 5% per year before expenses, which is not the fund’s actual return. The hypothetical account values and expenses may not be used to estimate the actual ending account balance or expenses you paid on your investment for the period. You may use this information to compare the ongoing costs of investing in the fund and other funds. To do so, compare this 5% hypothetical example with the 5% hypothetical examples that appear in the shareholder reports of the other funds.
Please note that the expenses shown reflect ongoing costs only, and do not include any transaction costs. Therefore, the second line in the table of the fund is useful in comparing ongoing costs only, and will not help you determine the relative costs of owning different funds. If transaction costs were included, total costs would be higher.
7 |
| | | | | | | | | | | | |
LOOMIS SAYLES INVESTMENT GRADE
BOND FUND | | BEGINNING
ACCOUNT VALUE
4/1/2011 | | | ENDING
ACCOUNT VALUE
9/30/2011 | | | EXPENSES PAID
DURING PERIOD*
4/1/2011 – 9/30/2011 | |
Class A | | | | | | | | | | | | |
Actual | | | $1,000.00 | | | | $1,010.10 | | | | $4.13 | |
Hypothetical (5% return before expenses) | | | $1,000.00 | | | | $1,020.96 | | | | $4.15 | |
Class B | | | | | | | | | | | | |
Actual | | | $1,000.00 | | | | $1,006.30 | | | | $7.90 | |
Hypothetical (5% return before expenses) | | | $1,000.00 | | | | $1,017.20 | | | | $7.94 | |
Class C | | | | | | | | | | | | |
Actual | | | $1,000.00 | | | | $1,006.30 | | | | $7.90 | |
Hypothetical (5% return before expenses) | | | $1,000.00 | | | | $1,017.20 | | | | $7.94 | |
Class Y | | | | | | | | | | | | |
Actual | | | $1,000.00 | | | | $1,011.30 | | | | $2.87 | |
Hypothetical (5% return before expenses) | | | $1,000.00 | | | | $1,022.21 | | | | $2.89 | |
Admin Class | | | | | | | | | | | | |
Actual | | | $1,000.00 | | | | $1,009.00 | | | | $5.44 | |
Hypothetical (5% return before expenses) | | | $1,000.00 | | | | $1,019.65 | | | | $5.47 | |
Class J | | | | | | | | | | | | |
Actual | | | $1,000.00 | | | | $1,008.40 | | | | $6.55 | |
Hypothetical (5% return before expenses) | | | $1,000.00 | | | | $1,018.55 | | | | $6.58 | |
| * | Expenses are equal to the Fund’s annualized expense ratio (after waiver/reimbursement): 0.82%, 1.57%, 1.57%, 0.57%, 1.08% and 1.30% for Class A, B, C, Y, Admin Class and Class J, respectively, multiplied by the average account value over the period, multiplied by the number of days in the most recent fiscal half-year, divided by 365 (to reflect the half-year period). |
| 8
BOARD APPROVAL OF THE EXISTING ADVISORY AGREEMENT
The Board of Trustees, including the Independent Trustees, considers matters bearing on the Fund’s advisory agreement (the “Agreement”) at most of its meetings throughout the year. Each year, usually in the spring, the Contract Review and Governance Committee of the Board meets to review the Agreement to determine whether to recommend that the full Board approve the continuation of the Agreement, typically for an additional one-year period. After the Committee has made its recommendation, the full Board, including the Independent Trustees, determines whether to approve the continuation of the Agreement.
In connection with these meetings, the Trustees receive materials that the Fund’s investment adviser (the “Adviser”) believes to be reasonably necessary for the Trustees to evaluate the Agreement. These materials generally include, among other items, (i) information on the investment performance of the Fund and the performance of a peer group of funds and the Fund’s performance benchmarks, (ii) information on the Fund’s advisory fee and other expenses, including information comparing the Fund’s expenses to the fees charged to institutional accounts with similar strategies managed by the Adviser and to those of a peer group of funds and information about any applicable expense caps and fee “breakpoints,” (iii) sales and redemption data in respect of the Fund, (iv) information about the profitability of the Agreement to the Adviser and (v) information obtained through the completion of a questionnaire by the Adviser (the Trustees are consulted as to the information requested through that questionnaire). The Board of Trustees, including the Independent Trustees, also consider other matters such as (i) the Adviser’s financial results and financial condition, (ii) the Fund’s investment objective and strategies and the size, education and experience of the Adviser’s investment staff and their use of technology, external research and trading cost measurement tools, (iii) arrangements in respect of the distribution of the Fund’s shares and the related costs, (iv) the procedures employed to determine the value of the Fund’s assets, (v) the allocation of the Fund’s brokerage, if any, including, if applicable, allocations to brokers affiliated with the Adviser and the use of “soft” commission dollars to pay Fund expenses and to pay for research and other similar services, (vi) the resources devoted to, and the record of compliance with, the Fund’s investment policies and restrictions, policies on personal securities transactions and other compliance policies, (vii) information about amounts invested by the Fund’s portfolio managers in the Fund or in similar accounts that they manage and (viii) the general economic outlook with particular emphasis on the mutual fund industry. Throughout the process, the Trustees are afforded the opportunity to ask questions of and request additional materials from the Adviser.
In addition to the materials requested by the Trustees in connection with their annual consideration of the continuation of the Agreement, the Trustees receive materials in advance of each regular quarterly meeting of the Board of Trustees that provide detailed information about the Fund’s investment performance and the fees charged to the Fund for advisory and other services. This information generally includes, among other things, an internal performance rating for the Fund based on agreed-upon criteria, graphs showing performance and fee differentials against the Fund’s peer group of funds,
9 |
performance ratings provided by a third-party, total return information for various periods, and third-party performance rankings for various periods comparing the Fund against its peer group. The portfolio management team for the Fund or other representatives of the Adviser make periodic presentations to the Contract Review and Governance Committee and/or the full Board of Trustees, and if the Fund is identified as presenting possible performance concerns it may be subject to more frequent board presentations and reviews. In addition, each quarter the Trustees are provided with detailed statistical information about the Fund’s portfolio. The Trustees also receive periodic updates between meetings.
The Board of Trustees most recently approved the continuation of the Agreement at their meeting held in June 2011. The Agreement was continued for a one-year period. In considering whether to approve the continuation of the Agreement, the Board of Trustees, including the Independent Trustees, did not identify any single factor as determinative. Individual Trustees may have evaluated the information presented differently from one another, giving different weights to various factors. Matters considered by the Trustees, including the Independent Trustees, in connection with their approval of the Agreement included, but were not limited to, the factors listed below.
The nature, extent and quality of the services provided to the Fund under the Agreement. The Trustees considered the nature, extent and quality of the services provided by the Adviser and its affiliates to the Fund and the resources dedicated to the Fund by the Adviser and its affiliates.
The Trustees considered not only the advisory services provided by the Adviser to the Fund, but also the administrative services provided by Natixis Asset Management Advisors, L.P. and its affiliates to the Fund.
The Trustees also considered the benefits to shareholders of investing in a mutual fund that is part of a family of funds that offers shareholders the right to exchange shares of one type of fund for shares of another type of fund, and provides a variety of fund and shareholder services.
After reviewing these and related factors, the Trustees concluded, within the context of their overall conclusions regarding the Agreement, that the nature, extent and quality of services provided supported the renewal of the Agreement.
Investment performance of the Fund and the Adviser. As noted above, the Trustees received information about the performance of the Fund over various time periods, including information which compared the performance of the Fund to the performance of a peer group of funds and the Fund’s performance benchmark. In addition, the Trustees also reviewed data prepared by an independent third party which analyzed the performance of the Fund using a variety of performance metrics, including metrics which also measured the performance of the Fund on a risk adjusted basis.
With respect to the Fund, the Board concluded that the Fund’s performance or other relevant factors supported the renewal of the Fund’s Agreement. The Trustees also considered the Adviser’s performance and reputation generally, the performance of the fund family generally (as noted by certain financial publications), and the historical responsiveness of the Adviser to Trustee concerns about performance and the willingness of the Adviser to take steps intended to improve performance.
| 10
After reviewing these and related factors, the Trustees concluded, within the context of their overall conclusions regarding the Agreement, that the performance of the Fund and the Adviser supported the renewal of the Agreement.
The costs of the services to be provided and profits to be realized by the Adviser and its affiliates from their respective relationships with the Fund. The Trustees considered the fees charged to the Fund for advisory services as well as the total expense level of the Fund. This information included comparisons (provided both by management and also by an independent third party) of the Fund’s advisory fee and total expense level to those of its peer group and information about the advisory fees charged by the Adviser to comparable accounts (such as institutional separate accounts), as well as information about differences in such fees. In considering the fees charged to comparable accounts, the Trustees considered, among other things, management’s representations about the differences between managing mutual funds as compared to other types of accounts, including the additional resources required to effectively manage and the greater regulatory costs associated with the management of mutual fund assets. In evaluating the Fund’s advisory fee, the Trustees also took into account the demands, complexity and quality of the investment management of the Fund, as well as the need for the Adviser to offer competitive compensation in order to attract and retain capable personnel and the need for the Adviser to expend additional resources as the Fund grows in size. The Trustees considered that over the past several years, management had made recommendations regarding reductions in advisory fee rates, implementation of advisory fee breakpoints and the institution of advisory fee waivers and expense caps for various funds in the fund family. They noted that the Fund currently has an expense cap in place, although the current expenses of the Fund are below the cap.
The Trustees also considered the compensation directly or indirectly received by the Adviser and its affiliates from their relationships with the Fund. The Trustees reviewed information provided by management as to the profitability of the Adviser’s and its affiliates’ relationships with the Fund, and information about the allocation of expenses used to calculate profitability. They also reviewed information provided by management about the effect of distribution costs and changes in asset levels on Adviser profitability, including information regarding resources spent on distribution activities. When reviewing profitability, the Trustees also considered information about court cases in which adviser profitability was an issue, the performance of the Fund, the expense levels of the Fund, whether the Adviser had implemented breakpoints and/or expense caps with respect to the Fund and the overall profit margin of the Adviser compared to other investment managers.
After reviewing these and related factors, the Trustees concluded, within the context of their overall conclusions regarding the Agreement, that the advisory fee charged to the Fund was fair and reasonable, and that the costs of these services generally and the related profitability of the Adviser and its affiliates in respect of their relationships with the Fund supported the renewal of the Agreement.
Economies of Scale. The Trustees considered the existence of any economies of scale in the provision of services by the Adviser and whether those economies are shared with the Fund through breakpoints in its investment advisory fee or other means, such as expense waivers or caps. The Trustees noted that although the Fund’s advisory fee was not subject
11 |
to breakpoints, the Fund was subject to an expense cap and the Fund’s overall net expense ratio was below the median compared to a peer group of funds. In considering the issues, the Trustees also took note of the costs of the services provided (both on an absolute and a relative basis) and the profitability to the Adviser and its affiliates of their relationships with the Fund, as discussed above.
After reviewing these and related factors, the Trustees concluded, within the context of their overall conclusions regarding the Agreement, that the extent to which economies of scale were shared with the Fund supported the renewal of the Agreement.
The Trustees also considered other factors, which included but were not limited to the following:
| · | | The effect of recent market and economic turmoil on the performance, asset levels and expense ratios of the Fund. |
| · | | Whether the Fund has operated in accordance with its investment objective and the Fund’s record of compliance with its investment restrictions, and the compliance programs of the Fund and the Adviser. They also considered the compliance-related resources the Adviser and its affiliates were providing to the Fund. |
| · | | The nature, quality, cost and extent of administrative and shareholder services performed by the Adviser and its affiliates, both under the Agreement and under a separate agreement covering administrative services. |
| · | | So-called “fallout benefits” to the Adviser, such as the engagement of affiliates of the Adviser to provide distribution, administrative and brokerage services to the Fund. The Trustees considered the possible conflicts of interest associated with these fallout and other benefits, and the reporting, disclosure and other processes in place to disclose and monitor such possible conflicts of interest. |
| · | | The Trustees’ review and discussion of the Fund’s advisory arrangements in prior years, and management’s record of responding to Trustee concerns raised during the year and in prior years. |
Based on their evaluation of all factors that they deemed to be material, including those factors described above, and assisted by the advice of independent counsel, the Trustees, including the Independent Trustees, concluded that the existing Agreement should be continued through June 30, 2012.
| 12
Portfolio of Investments – as of September 30, 2011
Loomis Sayles Investment Grade Bond Fund
| | | | | | | | |
Principal
Amount (‡) | | | Description | | Value (†) | |
| | | | | | | | |
| | Bonds and Notes — 93.0% of Net Assets | |
| | Non-Convertible Bonds — 88.8% | |
| | | | ABS Car Loan — 0.8% | | | | |
| $ | 5,153,750 | | | Avis Budget Rental Car Funding AESOP LLC, Series 2007-2A, Class A, 0.371%, 8/20/2013, 144A(b) | | $ | 5,074,117 | |
| | 831,000 | | | Avis Budget Rental Car Funding AESOP LLC, Series 2010-2A, Class B, 5.740%, 8/20/2014, 144A | | | 875,993 | |
| | 4,590,000 | | | Avis Budget Rental Car Funding AESOP LLC, Series 2010-3A, Class B, 6.740%, 5/20/2016, 144A | | | 5,246,900 | |
| | 2,889,250 | | | Avis Budget Rental Car Funding AESOP LLC, Series 2010-5A, Class B, 5.110%, 3/20/2017, 144A | | | 3,115,596 | |
| | 18,620,000 | | | Chesapeake Funding LLC, Series 2009-2A, Class B,
1.979%, 9/15/2021, 144A(b) | | | 18,743,291 | |
| | 16,736,000 | | | Chesapeake Funding LLC, Series 2009-2A, Class C,
1.979%, 9/15/2021, 144A(b) | | | 16,776,233 | |
| | 19,574,000 | | | Ford Auto Securitization Trust, Series 2010-R3A, Class A3,
2.714%, 9/15/2015, 144A, (CAD) | | | 18,886,416 | |
| | 5,481,000 | | | Ford Auto Securitization Trust, Series 2010-R3A, Class D,
4.526%, 3/15/2017, 144A, (CAD) | | | 5,230,461 | |
| | 8,333,000 | | | Merrill Auto Trust Securitization Asset, Series 2008-1, Class B,
6.750%, 4/15/2015 | | | 8,574,090 | |
| | | | | | | | |
| | | | | | | 82,523,097 | |
| | | | | | | | |
| | | | ABS Credit Card — 0.8% | | | | |
| | 28,592,000 | | | Chase Issuance Trust, Series 2007-B1, Class B1, 0.479%, 4/15/2019(b) | | | 27,907,525 | |
| | 19,182,000 | | | GE Capital Credit Card Master Note Trust, Series 2009-4, Class B,
5.390%, 11/15/2017, 144A | | | 21,291,538 | |
| | 9,787,000 | | | MBNA Credit Card Master Note Trust, Series 2002-C1, Class C1, 6.800%, 7/15/2014 | | | 9,989,301 | |
| | 14,465,000 | | | MBNA Credit Card Master Note Trust, Series 2004-B1, Class B1, 4.450%, 8/15/2016 | | | 15,459,932 | |
| | 2,324,000 | | | World Financial Network Credit Card Master Trust,
Series 2010-A, Class B,
6.750%, 4/15/2019 | | | 2,595,139 | |
| | | | | | | | |
| | | | | | | 77,243,435 | |
| | | | | | | | |
| | | | ABS Other — 1.9% | | | | |
| | 1,664,000 | | | Community Program Loan Trust, Series 1987-A, Class A5,
4.500%, 4/01/2029 | | | 1,597,410 | |
| | 9,248,561 | | | Diamond Resorts Owner Trust, Series 2011-1, Class A,
4.000%, 3/20/2023, 144A | | | 9,325,733 | |
| | 43,266,070 | | | Marriott Vacation Club Owner Trust, Series 2009-2A, Class A, 4.809%, 7/20/2031, 144A | | | 44,743,286 | |
| | 6,426,740 | | | Sierra Receivables Funding Co., Series 2009-3A, Class A1,
7.620%, 7/20/2026, 144A | | | 6,454,626 | |
| | 41,457,573 | | | SVO VOI Mortgage Corp., Series 2009-BA, Class NT,
5.810%, 12/20/2028, 144A | | | 43,679,035 | |
| | 41,863,747 | | | Trinity Rail Leasing LP, Series 2009-1A, Class A, 6.657%, 11/16/2039, 144A | | | 47,096,385 | |
| | 16,297,574 | | | Trinity Rail Leasing LP, Series 2010-1A, Class A, 5.194%, 10/16/2040, 144A | | | 15,740,246 | |
See accompanying notes to financial statements.
13 |
Portfolio of Investments – as of September 30, 2011
Loomis Sayles Investment Grade Bond Fund – (continued)
| | | | | | | | |
Principal
Amount (‡) | | | Description | | Value (†) | |
| | | | | | | | |
| | | | ABS Other — continued | | | | |
| $ | 17,845,040 | | | Trip Rail Master Funding LLC, Series 2011-1A, Class A1A,
4.370%, 7/15/2041, 144A | | $ | 17,931,751 | |
| | | | | | | | |
| | | | | | | 186,568,472 | |
| | | | | | | | |
| | | | Airlines — 2.9% | | | | |
| | 7,867,489 | | | American Airlines Pass Through Trust, Series 2009-1A,
10.375%, 1/02/2021 | | | 8,575,562 | |
| | 333,288 | | | Continental Airlines Pass Through Trust, Series 1997-1, Class A,
7.461%, 10/01/2016 | | | 329,539 | |
| | 895,042 | | | Continental Airlines Pass Through Trust, Series 1998-1, Class A,
6.648%, 3/15/2019 | | | 895,042 | |
| | 942,774 | | | Continental Airlines Pass Through Trust, Series 1999-1, Class A,
6.545%, 8/02/2020 | | | 952,202 | |
| | 8,846,956 | | | Continental Airlines Pass Through Trust, Series 2000-1, Class A-1, 8.048%, 5/01/2022 | | | 9,200,835 | |
| | 1,752,198 | | | Continental Airlines Pass Through Trust, Series 2000-2, Class A-1, 7.707%, 10/02/2022 | | | 1,804,764 | |
| | 3,123,921 | | | Continental Airlines Pass Through Trust, Series 2001-1, Class A-1, 6.703%, 12/15/2022 | | | 3,202,019 | |
| | 56,777,452 | | | Continental Airlines Pass Through Trust, Series 2007-1, Class A,
5.983%, 10/19/2023 | | | 57,061,339 | |
| | 11,625,979 | | | Continental Airlines Pass Through Trust, Series 2007-1, Class B,
6.903%, 4/19/2022 | | | 10,812,161 | |
| | 26,779,093 | | | Continental Airlines Pass Through Trust, Series 2009-1, 9.000%, 7/08/2016 | | | 28,921,420 | |
| | 20,593,770 | | | Continental Airlines Pass Through Trust, Series 2009-2, Class A,
7.250%, 5/10/2021 | | | 21,695,949 | |
| | 1,907,491 | | | Delta Air Lines Pass Through Trust, Series 2007-1, Class A,
6.821%, 2/10/2024 | | | 1,921,797 | |
| | 14,333,716 | | | Delta Air Lines Pass Through Trust, Series 2007-1, Class B,
8.021%, 2/10/2024 | | | 13,975,373 | |
| | 37,996,104 | | | Delta Air Lines Pass Through Trust, Series 2009-1, Class A,
7.750%, 6/17/2021 | | | 39,895,909 | |
| | 3,404,292 | | | Delta Air Lines Pass Through Trust, Series 2009-1, Series B,
9.750%, 12/17/2016 | | | 3,489,399 | |
| | 21,186,690 | | | Delta Air Lines Pass Through Trust, Series 2010-1, Class A,
6.200%, 7/02/2018 | | | 21,822,291 | |
| | 7,285,253 | | | Northwest Airlines, Inc., Series 2007-1, Class B, 8.028%, 11/01/2017 | | | 7,285,253 | |
| | 7,277,000 | | | Qantas Airways Ltd., 6.050%, 4/15/2016, 144A | | | 7,771,734 | |
| | 24,732,136 | | | UAL Pass Through Trust, Series 2007-1, Class A, 6.636%, 1/02/2024 | | | 24,006,990 | |
| | 7,322,966 | | | UAL Pass Through Trust, Series 2009-1, 10.400%, 5/01/2018 | | | 7,908,803 | |
| | 17,386,000 | | | US Airways Pass Through Trust, Series 2011-1A, Class A,
7.125%, 4/22/2025 | | | 16,516,700 | |
| | | | | | | | |
| | | | | | | 288,045,081 | |
| | | | | | | | |
| | | | Automotive — 1.2% | | | | |
| | 40,992,000 | | | Cummins, Inc., 5.650%, 3/01/2098 | | | 39,263,900 | |
| | 5,274,000 | | | Cummins, Inc., 6.750%, 2/15/2027 | | | 6,382,199 | |
| | 1,948,000 | | | Ford Motor Co., 6.375%, 2/01/2029 | | | 1,883,447 | |
| | 125,000 | | | Ford Motor Co., 6.500%, 8/01/2018 | | | 130,596 | |
See accompanying notes to financial statements.
| 14
Portfolio of Investments – as of September 30, 2011
Loomis Sayles Investment Grade Bond Fund – (continued)
| | | | | | | | |
Principal
Amount (‡) | | | Description | | Value (†) | |
| | | | | | | | |
| | | | Automotive — continued | | | | |
| $ | 255,000 | | | Ford Motor Co., 6.625%, 2/15/2028 | | $ | 253,089 | |
| | 5,074,000 | | | Ford Motor Co., 6.625%, 10/01/2028 | | | 5,035,681 | |
| | 8,544,000 | | | Ford Motor Co., 7.450%, 7/16/2031 | | | 9,645,151 | |
| | 240,000 | | | Ford Motor Co., 7.500%, 8/01/2026 | | | 242,597 | |
| | 40,126,000 | | | Ford Motor Credit Co. LLC, 6.625%, 8/15/2017 | | | 41,783,525 | |
| | 338,000 | | | Ford Motor Credit Co. LLC, 7.000%, 10/01/2013 | | | 354,940 | |
| | 5,319,000 | | | Ford Motor Credit Co. LLC, 7.000%, 4/15/2015 | | | 5,584,950 | |
| | 4,540,000 | | | Ford Motor Credit Co. LLC, 8.000%, 12/15/2016 | | | 4,954,093 | |
| | | | | | | | |
| | | | | | | 115,514,168 | |
| | | | | | | | |
| | | | Banking — 10.0% | | | | |
| | 22,547,000 | | | AgriBank FCB, 9.125%, 7/15/2019, 144A | | | 29,888,281 | |
| | 7,200,000 | | | American Express Centurion Bank, Series BKN1, 6.000%, 9/13/2017 | | | 8,080,380 | |
| | 35,878,000 | | | Associates Corp. of North America, 6.950%, 11/01/2018 | | | 39,712,964 | |
| | 2,540,000 | | | BAC Capital Trust VI, 5.625%, 3/08/2035 | | | 1,818,803 | |
| | 3,590,000 | | | Bank of America Corp., 5.420%, 3/15/2017 | | | 3,118,859 | |
| | 9,805,000 | | | Bank of America Corp., 6.000%, 9/01/2017 | | | 9,433,420 | |
| | 11,100,000 | | | Bank of America Corp., MTN, 5.000%, 5/13/2021 | | | 9,902,909 | |
| | 17,249,000 | | | Bank of America NA, 5.300%, 3/15/2017 | | | 15,578,590 | |
| | 7,110,000,000 | | | Barclays Bank PLC, EMTN, 3.680%, 8/20/2015, (KRW) | | | 6,052,532 | |
| | 2,173,000 | | | Bear Stearns Cos., Inc. (The), 4.650%, 7/02/2018 | | | 2,279,199 | |
| | 8,994,000 | | | Capital One Financial Corp., 6.150%, 9/01/2016 | | | 9,527,488 | |
| | 6,473,000 | | | Citigroup, Inc., 5.000%, 9/15/2014 | | | 6,348,453 | |
| | 2,700,000 | | | Citigroup, Inc., 5.365%, 3/06/2036, (CAD)(c) | | | 1,936,327 | |
| | 14,680,000 | | | Citigroup, Inc., 5.500%, 2/15/2017 | | | 14,613,045 | |
| | 1,297,000 | | | Citigroup, Inc., 5.850%, 12/11/2034 | | | 1,252,235 | |
| | 2,740,000 | | | Citigroup, Inc., 5.875%, 2/22/2033 | | | 2,291,928 | |
| | 19,875,000 | | | Citigroup, Inc., 6.125%, 5/15/2018 | | | 21,318,004 | |
| | 8,705,000 | | | Citigroup, Inc., 6.125%, 8/25/2036 | | | 7,363,603 | |
| | 72,682,000 | | | Citigroup, Inc., 6.375%, 8/12/2014 | | | 76,949,814 | |
| | 2,398,000 | | | Citigroup, Inc., EMTN, (fixed rate to 11/30/2012, variable rate thereafter), 3.625%, 11/30/2017, (EUR) | | | 2,480,503 | |
| | 63,845,000 | | | Citigroup, Inc., MTN, 5.500%, 10/15/2014 | | | 66,331,763 | |
| | 6,958,000 | | | First Niagara Finance Group, Inc., 6.750%, 3/19/2020 | | | 7,825,837 | |
| | 1,174,000 | | | Goldman Sachs Group, Inc. (The), 6.450%, 5/01/2036 | | | 1,066,884 | |
| | 96,910,000 | | | Goldman Sachs Group, Inc. (The), 6.750%, 10/01/2037 | | | 88,647,744 | |
| | 6,645,000 | | | Goldman Sachs Group, Inc. (The), GMTN, 5.375%, 3/15/2020 | | | 6,598,983 | |
| | 1,527,000 | | | HBOS PLC, 6.000%, 11/01/2033, 144A | | | 986,938 | |
| | 700,000 | | | ICICI Bank Ltd., (fixed rate to 4/30/2017, variable rate thereafter),
6.375%, 4/30/2022, 144A | | | 581,000 | |
| | 67,364,716,380 | | | JPMorgan Chase & Co., Zero Coupon, 4/12/2012, 144A, (IDR) | | | 7,139,587 | |
| | 12,000,000,000 | | | JPMorgan Chase & Co., EMTN, 7.070%, 3/22/2014, (IDR) | | | 1,284,505 | |
| | 16,000,000,000 | | | JPMorgan Chase Bank NA, 7.700%, 6/01/2016, 144A, (IDR) | | | 1,748,168 | |
| | 337,153,200,000 | | | JPMorgan Chase Bank NA, EMTN, Zero Coupon, 10/17/2011, 144A, (IDR) | | | 37,612,335 | |
| | 100,000 | | | Keybank NA, 6.950%, 2/01/2028 | | | 117,263 | |
| | 9,787,000 | | | Lloyds TSB Bank PLC, EMTN, 4.570%, 10/13/2015, (CAD) | | | 8,712,756 | |
| | 81,622,000 | | | Lloyds TSB Bank PLC, MTN, 6.500%, 9/14/2020, 144A | | | 69,360,417 | |
| | 6,479,000 | | | Merrill Lynch & Co., Inc., 5.700%, 5/02/2017 | | | 5,821,122 | |
See accompanying notes to financial statements.
15 |
Portfolio of Investments – as of September 30, 2011
Loomis Sayles Investment Grade Bond Fund – (continued)
| | | | | | | | |
Principal
Amount (‡) | | | Description | | Value (†) | |
| | | | | | | | |
| | | | Banking — continued | | | | |
| $ | 4,300,000 | | | Merrill Lynch & Co., Inc., 6.050%, 5/16/2016 | | $ | 3,869,720 | |
| | 93,791,000 | | | Merrill Lynch & Co., Inc., 6.110%, 1/29/2037 | | | 72,672,174 | |
| | 19,787,000 | | | Merrill Lynch & Co., Inc., 6.220%, 9/15/2026 | | | 16,734,361 | |
| | 9,780,000 | | | Merrill Lynch & Co., Inc., 10.710%, 3/08/2017, (BRL) | | | 4,785,321 | |
| | 3,132,000 | | | Merrill Lynch & Co., Inc., EMTN, 4.625%, 9/14/2018, (EUR) | | | 3,096,665 | |
| | 11,641,000 | | | Merrill Lynch & Co., Inc., MTN, 6.875%, 4/25/2018 | | | 11,645,179 | |
| | 40,126,000 | | | Merrill Lynch & Co., Inc., Series C, MTN, 6.050%, 6/01/2034 | | | 35,821,604 | |
| | 2,652,000 | | | Merrill Lynch & Co., Inc., Series C, MTN, 6.400%, 8/28/2017 | | | 2,571,233 | |
| | 18,273,000 | | | Morgan Stanley, 4.750%, 4/01/2014 | | | 17,365,179 | |
| | 104,793,000 | | | Morgan Stanley, 5.500%, 7/24/2020 | | | 94,912,802 | |
| | 1,510,000 | | | Morgan Stanley, EMTN, 5.450%, 1/09/2017 | | | 1,456,513 | |
| | 24,100,000 | | | Morgan Stanley, GMTN, 7.625%, 3/03/2016, (AUD) | | | 23,113,754 | |
| | 29,556,000 | | | Morgan Stanley, Series F, GMTN, 5.625%, 9/23/2019 | | | 27,725,626 | |
| | 5,187,000 | | | Morgan Stanley, Series F, GMTN, 6.625%, 4/01/2018 | | | 5,145,826 | |
| | 9,699,000 | | | Morgan Stanley, Series F, MTN, 5.950%, 12/28/2017 | | | 9,404,975 | |
| | 2,789,000 | | | Morgan Stanley, Series G & H, GMTN, 5.125%, 11/30/2015, (GBP) | | | 4,094,747 | |
| | 2,875,000 | | | National City Bank of Indiana, 4.250%, 7/01/2018 | | | 2,928,952 | |
| | 8,638,000 | | | National City Corp., 6.875%, 5/15/2019 | | | 9,924,440 | |
| | 4,600,000 | | | Royal Bank of Scotland PLC (The), EMTN, 4.350%, 1/23/2017, (EUR) | | | 4,492,477 | |
| | 16,175,000 | | | Santander Holdings USA, Inc., 4.625%, 4/19/2016 | | | 15,582,769 | |
| | 16,392,000 | | | Societe Generale S.A., MTN, 5.200%, 4/15/2021, 144A | | | 14,232,747 | |
| | 3,300,000 | | | Standard Chartered Bank, 6.400%, 9/26/2017, 144A | | | 3,465,356 | |
| | 17,861,000 | | | Standard Chartered PLC, 5.500%, 11/18/2014, 144A | | | 19,410,763 | |
| | | | | | | | |
| | | | | | | 978,235,822 | |
| | | | | | | | |
| | | | Brokerage — 1.7% | | | | |
| | 59,450,000 | | | Cantor Fitzgerald LP, 6.375%, 6/26/2015, 144A | | | 61,883,288 | |
| | 44,990,000 | | | Cantor Fitzgerald LP, 7.875%, 10/15/2019, 144A(c) | | | 46,188,129 | |
| | 11,813,000 | | | Jefferies Group, Inc., 6.250%, 1/15/2036 | | | 10,715,939 | |
| | 44,188,000 | | | Jefferies Group, Inc., 8.500%, 7/15/2019 | | | 49,145,054 | |
| | | | | | | | |
| | | | | | | 167,932,410 | |
| | | | | | | | |
| | | | Building Materials — 1.3% | | | | |
| | 6,640,000 | | | Masco Corp., 4.800%, 6/15/2015 | | | 6,421,896 | |
| | 10,942,000 | | | Masco Corp., 5.850%, 3/15/2017 | | | 10,380,774 | |
| | 6,616,000 | | | Masco Corp., 6.125%, 10/03/2016 | | | 6,451,811 | |
| | 4,808,000 | | | Masco Corp., 6.500%, 8/15/2032 | | | 4,258,330 | |
| | 29,341,000 | | | Masco Corp., 7.125%, 3/15/2020 | | | 28,432,515 | |
| | 4,923,000 | | | Masco Corp., 7.750%, 8/01/2029 | | | 4,829,168 | |
| | 24,394,000 | | | Owens Corning, Inc., 6.500%, 12/01/2016 | | | 26,314,710 | |
| | 41,379,000 | | | Owens Corning, Inc., 7.000%, 12/01/2036 | | | 42,873,609 | |
| | 1,037,000 | | | USG Corp., 6.300%, 11/15/2016 | | | 759,602 | |
| | | | | | | | |
| | | | | | | 130,722,415 | |
| | | | | | | | |
| | | | Chemicals — 0.5% | | | | |
| | 34,763,000 | | | Chevron Phillips Chemical Co. LLC, 8.250%, 6/15/2019, 144A | | | 43,861,798 | |
| | 3,469,000 | | | Cytec Industries, Inc., 6.000%, 10/01/2015 | | | 3,844,003 | |
| | 2,349,000 | | | Methanex Corp., Senior Note, 6.000%, 8/15/2015 | | | 2,418,098 | |
| | | | | | | | |
| | | | | | | 50,123,899 | |
| | | | | | | | |
See accompanying notes to financial statements.
| 16
Portfolio of Investments – as of September 30, 2011
Loomis Sayles Investment Grade Bond Fund – (continued)
| | | | | | | | |
Principal
Amount (‡) | | | Description | | Value (†) | |
| | | | | | | | |
| | | | Collateralized Mortgage Obligations — 0.0% | | | | |
| $ | 1,230,007 | | | GSR Mortgage Loan Trust, Series 2005-AR2, Class 2A1,
2.723%, 4/25/2035(b) | | $ | 1,027,615 | |
| | 2,576,778 | | | WaMu Mortgage Pass Through Certificates, Series 2007-OA6, Class 2A, 2.600%, 7/25/2047(b) | | | 1,427,435 | |
| | 86,308 | | | Wells Fargo Mortgage Backed Securities Trust,
Series 2006-AR12, Class 1A1,
2.742%, 9/25/2036(b) | | | 63,355 | |
| | | | | | | | |
| | | | | | | 2,518,405 | |
| | | | | | | | |
| | | | Commercial Mortgage-Backed Securities — 3.9% | | | | |
| | 7,927,364 | | | Bear Stearns Commercial Mortgage Securities,
Series 2007-PW15, Class A4,
5.331%, 2/11/2044 | | | 8,177,853 | |
| | 33,167,701 | | | Citigroup/Deutsche Bank Commercial Mortgage Trust,
Series 2007-CD4, Class A4,
5.322%, 12/11/2049 | | | 34,189,299 | |
| | 61,632,812 | | | Credit Suisse Mortgage Capital Certificates, Series 2007-C3, Class A4, 5.714%, 6/15/2039(b) | | | 64,183,424 | |
| | 34,381,273 | | | Credit Suisse Mortgage Capital Certificates, Series 2007-C4, Class A4, 5.795%, 9/15/2039(b) | | | 36,351,664 | |
| | 5,001,090 | | | Credit Suisse Mortgage Capital Certificates, Series 2007-C5, Class A4, 5.695%, 9/15/2040 | | | 5,328,236 | |
| | 57,694,000 | | | Crown Castle Towers LLC, 6.113%, 1/15/2040, 144A | | | 64,847,998 | |
| | 23,544,272 | | | Greenwich Capital Commercial Funding Corp.,
Series 2007-GG11, Class A4, 5.736%, 12/10/2049 | | | 24,441,144 | |
| | 19,789,051 | | | JPMorgan Chase Commercial Mortgage Securities Corp.,
Series 2006-LDP6, Class A4, 5.475%, 4/15/2043 | | | 21,593,159 | |
| | 8,739,675 | | | JPMorgan Chase Commercial Mortgage Securities Corp.,
Series 2006-LDP7, Class A4,
5.878%, 4/15/2045(b) | | | 9,606,520 | |
| | 59,341,803 | | | JPMorgan Chase Commercial Mortgage Securities Corp.,
Series 2007-LD11, Class A4,
5.817%, 6/15/2049(b) | | | 62,014,024 | |
| | 21,524,263 | | | JPMorgan Chase Commercial Mortgage Securities Corp.,
Series 2007-LDPX, Class A3,
5.420%, 1/15/2049 | | | 22,316,980 | |
| | 3,131,798 | | | LB-UBS Commercial Mortgage Trust, Series 2006-C4, Class A4, 5.870%, 6/15/2038(b) | | | 3,436,441 | |
| | 1,311,441 | | | Merrill Lynch/Countrywide Commercial Mortgage Trust,
Series 2007-6, Class A4, 5.485%, 3/12/2051 | | | 1,345,420 | |
| | 9,786,870 | | | Morgan Stanley Re-REMIC Trust, Series 2009-GG10, Class A4B, 5.790%, 8/12/2045, 144A(b) | | | 9,133,137 | |
| | 6,851,000 | | | Vornado DP LLC, Series 2010-VNO, Class D, 6.356%, 9/13/2028, 144A | | | 6,184,377 | |
| | 3,621,142 | | | Wachovia Bank Commercial Mortgage Trust, Series 2006-C29, Class A4, 5.308%, 11/15/2048 | | | 3,856,574 | |
| | | | | | | | |
| | | | | | | 377,006,250 | |
| | | | | | | | |
See accompanying notes to financial statements.
17 |
Portfolio of Investments – as of September 30, 2011
Loomis Sayles Investment Grade Bond Fund – (continued)
| | | | | | | | |
Principal
Amount (‡) | | | Description | | Value (†) | |
| | | | | | | | |
| | | | Construction Machinery — 0.3% | | | | |
| $ | 23,638,000 | | | Case New Holland, Inc., 7.750%, 9/01/2013 | | $ | 24,642,615 | |
| | 6,787,000 | | | Toro Co., 6.625%, 5/01/2037(c) | | | 7,756,672 | |
| | | | | | | | |
| | | | | | | 32,399,287 | |
| | | | | | | | |
| | | | Consumer Cyclical Services — 0.1% | | | | |
| | 6,955,000 | | | Western Union Co. (The), 6.200%, 11/17/2036 | | | 7,367,696 | |
| | 196,000 | | | Western Union Co. (The), 6.200%, 6/21/2040 | | | 208,305 | |
| | | | | | | | |
| | | | | | | 7,576,001 | |
| | | | | | | | |
| | | | Consumer Products — 0.2% | | | | |
| | 7,458,000 | | | Hasbro, Inc., 6.600%, 7/15/2028 | | | 8,616,563 | |
| | 11,754,000 | | | Snap-on, Inc., 6.700%, 3/01/2019 | | | 14,580,038 | |
| | | | | | | | |
| | | | | | | 23,196,601 | |
| | | | | | | | |
| | | | Distributors — 0.9% | | | | |
| | 9,787,000 | | | EQT Corp., 8.125%, 6/01/2019 | | | 11,865,749 | |
| | 60,038,000 | | | Equitable Resources, Inc., 6.500%, 4/01/2018 | | | 67,889,950 | |
| | 5,740,000 | | | ONEOK, Inc., 6.000%, 6/15/2035 | | | 6,172,687 | |
| | | | | | | | |
| | | | | | | 85,928,386 | |
| | | | | | | | |
| | | | Diversified Manufacturing — 1.3% | | | | |
| | 1,395,000 | | | Ingersoll-Rand Global Holding Co. Ltd., 6.875%, 8/15/2018 | | | 1,710,614 | |
| | 2,814,000 | | | Textron Financial Corp., 5.400%, 4/28/2013 | | | 2,887,347 | |
| | 1,181,000 | | | Textron Financial Corp., Series E, MTN, 5.125%, 8/15/2014 | | | 1,226,134 | |
| | 18,800,000 | | | Textron, Inc., 3.875%, 3/11/2013, (EUR) | | | 25,234,448 | |
| | 78,795,000 | | | Textron, Inc., 5.950%, 9/21/2021 | | | 82,419,334 | |
| | 11,040,000 | | | Textron, Inc., EMTN, 6.625%, 4/07/2020, (GBP) | | | 17,417,019 | |
| | | | | | | | |
| | | | | | | 130,894,896 | |
| | | | | | | | |
| | | | Electric — 3.1% | | | | |
| | 36,661,742 | | | Alta Wind Holdings LLC, 7.000%, 6/30/2035, 144A | | | 39,335,483 | |
| | 46,556,000 | | | Ameren Illinois Co., 6.250%, 4/01/2018 | | | 53,848,392 | |
| | 39,539,000 | | | AmerenEnergy Generating Co., Series H, 7.000%, 4/15/2018 | | | 40,033,238 | |
| | 489,000 | | | Baltimore Gas & Electric Co., 5.200%, 6/15/2033 | | | 539,662 | |
| | 11,503,547 | | | Bruce Mansfield Unit, 6.850%, 6/01/2034 | | | 12,308,795 | |
| | 17,435,000 | | | Cleveland Electric Illuminating Co. (The), 5.700%, 4/01/2017 | | | 19,154,562 | |
| | 18,687,000 | | | Cleveland Electric Illuminating Co. (The), 5.950%, 12/15/2036 | | | 19,562,635 | |
| | 876,000 | | | Commonwealth Edison Co., 4.700%, 4/15/2015 | | | 964,093 | |
| | 11,985,000 | | | EDP Finance BV, 4.900%, 10/01/2019, 144A | | | 8,663,058 | |
| | 3,500,000 | | | EDP Finance BV, 6.000%, 2/02/2018, 144A | | | 2,773,722 | |
| | 1,000,000 | | | EDP Finance BV, EMTN, 4.625%, 6/13/2016, (EUR) | | | 1,050,239 | |
| | 900,000 | | | EDP Finance BV, EMTN, 5.875%, 2/01/2016, (EUR) | | | 969,144 | |
| | 979,000 | | | Empresa Nacional de Electricidad S.A. (Endesa-Chile), 8.350%, 8/01/2013 | �� | | 1,071,982 | |
| | 5,383,000 | | | Endesa S.A./Cayman Islands, 7.875%, 2/01/2027 | | | 6,384,507 | |
| | 19,600,000 | | | Enel Finance International NV, 6.000%, 10/07/2039, 144A | | | 16,522,173 | |
| | 3,603,000 | | | Exelon Corp., 4.900%, 6/15/2015 | | | 3,899,858 | |
| | 1,864,000 | | | ITC Holdings Corp., 5.875%, 9/30/2016, 144A | | | 2,110,645 | |
| | 8,370,232 | | | Mackinaw Power LLC, 6.296%, 10/31/2023, 144A | | | 8,985,193 | |
| | 1,532,000 | | | Ohio Edison Co., 6.875%, 7/15/2036 | | | 1,899,410 | |
| | 50,026,000 | | | Southwestern Electric Power Co., 6.450%, 1/15/2019 | | | 60,043,957 | |
See accompanying notes to financial statements.
| 18
Portfolio of Investments – as of September 30, 2011
Loomis Sayles Investment Grade Bond Fund – (continued)
| | | | | | | | |
Principal
Amount (‡) | | | Description | | Value (†) | |
| | | | | | | | |
| | | | Electric — continued | | | | |
| $ | 1,075,000 | | | White Pine Hydro LLC, 6.310%, 7/10/2017(c) | | $ | 1,159,119 | |
| | 1,600,000 | | | White Pine Hydro LLC, 6.960%, 7/10/2037(c) | | | 1,724,912 | |
| | | | | | | | |
| | | | | | | 303,004,779 | |
| | | | | | | | |
| | | | Entertainment — 0.1% | | | | |
| | 494,000 | | | Time Warner, Inc., 7.625%, 4/15/2031 | | | 616,634 | |
| | 323,000 | | | Time Warner, Inc., 7.700%, 5/01/2032 | | | 409,863 | |
| | 3,616,000 | | | Viacom, Inc., 6.125%, 10/05/2017 | | | 4,115,637 | |
| | | | | | | | |
| | | | | | | 5,142,134 | |
| | | | | | | | |
| | | | Financial Other — 0.9% | | | | |
| | 58,115,000 | | | Aviation Capital Group Corp., 6.750%, 4/06/2021, 144A | | | 55,913,022 | |
| | 26,914,000 | | | National Life Insurance Co., 10.500%, 9/15/2039, 144A | | | 36,502,974 | |
| | | | | | | | |
| | | | | | | 92,415,996 | |
| | | | | | | | |
| | | | Food & Beverage — 0.2% | | | | |
| | 2,450,000 | | | Cargill, Inc., EMTN, 5.375%, 3/02/2037, (GBP) | | | 4,083,820 | |
| | 8,446,000 | | | Corn Products International, Inc., 6.625%, 4/15/2037 | | | 10,204,263 | |
| | | | | | | | |
| | | | | | | 14,288,083 | |
| | | | | | | | |
| | | | Government Guaranteed — 0.2% | | | | |
| | 6,610,000 | | | Instituto de Credito Oficial, EMTN, 4.530%, 3/17/2016, (CAD) | | | 5,778,120 | |
| | 6,770,000 | | | Instituto de Credito Oficial, MTN, 5.500%, 10/11/2012, (AUD) | | | 6,479,193 | |
| | 10,276,000 | | | Instituto de Credito Oficial, MTN, 6.125%, 2/27/2014, (AUD) | | | 9,652,884 | |
| | | | | | | | |
| | | | | | | 21,910,197 | |
| | | | | | | | |
| | | | Government Owned — No Guarantee — 1.5% | | | | |
| | 3,720,000 | | | Abu Dhabi National Energy Co., 6.500%, 10/27/2036, 144A | | | 3,747,900 | |
| | 36,975,000 | | | Abu Dhabi National Energy Co., 7.250%, 8/01/2018, 144A | | | 43,122,094 | |
| | 58,060,000 | | | DP World Ltd., 6.850%, 7/02/2037, 144A | | | 52,834,600 | |
| | 26,030,000,000 | | | Export-Import Bank of Korea, 6.600%, 11/04/2013, 144A, (IDR) | | | 2,770,611 | |
| | 27,800,000,000 | | | Export-Import Bank of Korea, 8.300%, 3/15/2014, 144A, (IDR) | | | 2,993,165 | |
| | 22,478,000 | | | Federal Home Loan Mortgage Corp., 1.625%, 4/15/2013 | | | 22,910,387 | |
| | 15,170,000 | | | Korea Gas Corp., 6.000%, 7/15/2014, 144A | | | 16,308,781 | |
| | 1,000,000 | | | Telekom Malaysia Berhad, 7.875%, 8/01/2025, 144A | | | 1,287,032 | |
| | | | | | | | |
| | | | | | | 145,974,570 | |
| | | | | | | | |
| | | | Government Sponsored — 0.7% | | | | |
| | 66,200,000 | | | Federal Home Loan Bank, 1.875%, 6/21/2013 | | | 67,890,020 | |
| | | | | | | | |
| | | | Health Insurance — 0.0% | | | | |
| | 1,569,000 | | | CIGNA Corp., 7.875%, 5/15/2027 | | | 1,950,262 | |
| | 1,174,000 | | | CIGNA Corp., (Step to 8.080% on 1/15/2023), 8.300%, 1/15/2033(d) | | | 1,448,638 | |
| | | | | | | | |
| | | | | | | 3,398,900 | |
| | | | | | | | |
| | | | Healthcare — 0.9% | | | | |
| | 7,692,000 | | | Boston Scientific Corp., 6.000%, 1/15/2020 | | | 8,623,678 | |
| | 7,374,000 | | | Covidien International Finance S.A., 6.000%, 10/15/2017 | | | 8,756,241 | |
| | 17,416,000 | | | Express Scripts, Inc., 6.250%, 6/15/2014 | | | 19,169,983 | |
| | 9,459,000 | | | Express Scripts, Inc., 7.250%, 6/15/2019 | | | 11,597,983 | |
| | 9,278,000 | | | HCA, Inc., 5.750%, 3/15/2014 | | | 9,046,050 | |
See accompanying notes to financial statements.
19 |
Portfolio of Investments – as of September 30, 2011
Loomis Sayles Investment Grade Bond Fund – (continued)
| | | | | | | | |
Principal
Amount (‡) | | | Description | | Value (†) | |
| | | | | | | | |
| | | | Healthcare — continued | | | | |
| $ | 1,908,000 | | | HCA, Inc., 6.250%, 2/15/2013 | | $ | 1,934,235 | |
| | 3,729,000 | | | HCA, Inc., 6.375%, 1/15/2015 | | | 3,626,452 | |
| | 3,929,000 | | | HCA, Inc., 6.500%, 2/15/2016 | | | 3,752,195 | |
| | 357,000 | | | HCA, Inc., 6.750%, 7/15/2013 | | | 362,355 | |
| | 2,936,000 | | | HCA, Inc., 7.050%, 12/01/2027 | | | 2,451,560 | |
| | 2,241,000 | | | HCA, Inc., 7.190%, 11/15/2015 | | | 2,173,770 | |
| | 2,109,000 | | | HCA, Inc., 7.500%, 12/15/2023 | | | 1,898,100 | |
| | 1,282,000 | | | HCA, Inc., 7.500%, 11/06/2033 | | | 1,092,905 | |
| | 3,807,000 | | | HCA, Inc., 7.690%, 6/15/2025 | | | 3,426,300 | |
| | 4,164,000 | | | HCA, Inc., 8.360%, 4/15/2024 | | | 3,987,030 | |
| | 1,199,000 | | | HCA, Inc., MTN, 7.580%, 9/15/2025 | | | 1,073,105 | |
| | 3,068,000 | | | HCA, Inc., MTN, 7.750%, 7/15/2036 | | | 2,653,820 | |
| | 2,256,000 | | | Owens & Minor, Inc., 6.350%, 4/15/2016(c) | | | 2,426,265 | |
| | | | | | | | |
| | | | | | | 88,052,027 | |
| | | | | | | | |
| | | | Home Construction — 0.1% | | | | |
| | 2,006,000 | | | Desarrolladora Homex SAB de CV, 7.500%, 9/28/2015 | | | 1,945,820 | |
| | 2,546,000 | | | Pulte Group, Inc., 5.200%, 2/15/2015 | | | 2,304,130 | |
| | 9,200,000 | | | Pulte Group, Inc., 6.000%, 2/15/2035 | | | 6,164,000 | |
| | 3,567,000 | | | Pulte Group, Inc., 6.375%, 5/15/2033 | | | 2,479,065 | |
| | | | | | | | |
| | | | | | | 12,893,015 | |
| | | | | | | | |
| | | | Independent Energy — 0.1% | | | | |
| | 11,930,000 | | | Anadarko Petroleum Corp., 6.375%, 9/15/2017 | | | 13,383,360 | |
| | | | | | | | |
| | | | Industrial Other — 0.1% | | | | |
| | 4,893,000 | | | Worthington Industries, Inc., 6.500%, 4/15/2020 | | | 5,306,238 | |
| | | | | | | | |
| | | | Life Insurance — 1.0% | | | | |
| | 4,400,000 | | | American International Group, Inc., EMTN, 5.000%, 4/26/2023, (GBP) | | | 5,829,592 | |
| | 6,910,000 | | | American International Group, Inc., Series G, MTN, 5.850%, 1/16/2018 | | | 6,845,737 | |
| | 2,036,000 | | | American International Group, Inc., Series MP, GMTN, 5.450%, 5/18/2017 | | | 1,949,623 | |
| | 9,777,000 | | | ASIF III Jersey Ltd., Series 2003-G, EMTN, 4.750%, 9/11/2013, (EUR) | | | 13,143,492 | |
| | 15,000,000 | | | Forethought Financial Group, Inc., 8.625%, 4/15/2021, 144A | | | 15,444,480 | |
| | 10,971,000 | | | MetLife, Inc., 6.400%, 12/15/2066 | | | 9,724,563 | |
| | 9,063,000 | | | Mutual of Omaha Insurance Co., 6.800%, 6/15/2036, 144A | | | 10,243,773 | |
| | 6,440,000 | | | NLV Financial Corp., 7.500%, 8/15/2033, 144A | | | 6,581,809 | |
| | 2,872,000 | | | Penn Mutual Life Insurance Co. (The), 6.650%, 6/15/2034, 144A | | | 3,217,039 | |
| | 14,489,000 | | | Penn Mutual Life Insurance Co. (The), 7.625%, 6/15/2040, 144A | | | 17,807,546 | |
| | 4,732,000 | | | Unum Group, 7.125%, 9/30/2016 | | | 5,452,594 | |
| | | | | | | | |
| | | | | | | 96,240,248 | |
| | | | | | | | |
| | | | Local Authorities — 2.8% | | | | |
| | 7,448,000 | | | Manitoba (Province of), GMTN, 6.375%, 9/01/2015, (NZD) | | | 6,117,869 | |
| | 99,450,000 | | | New South Wales Treasury Corp., 5.500%, 8/01/2013, (AUD) | | | 98,661,043 | |
| | 47,456,000 | | | New South Wales Treasury Corp., 6.000%, 5/01/2012, (AUD) | | | 46,358,528 | |
| | 30,476,000 | | | New South Wales Treasury Corp., Series 12RG, 6.000%, 5/01/2012, (AUD) | | | 29,714,998 | |
| | 17,930,000 | | | New South Wales Treasury Corp., Series 17RG, 5.500%, 3/01/2017, (AUD) | | | 18,233,918 | |
| | 18,615 | | | Province of Alberta, 5.930%, 9/16/2016, (CAD) | | | 20,236 | |
| | 489,000 | | | Province of Nova Scotia, 6.600%, 6/01/2027, (CAD) | | | 632,779 | |
See accompanying notes to financial statements.
| 20
Portfolio of Investments – as of September 30, 2011
Loomis Sayles Investment Grade Bond Fund – (continued)
| | | | | | | | |
Principal
Amount (‡) | | | Description | | Value (†) | |
| | | | | | | | |
| | | | Local Authorities — continued | | | | |
| | 29,791,000 | | | Province of Quebec, Canada, Series QC, 6.750%, 11/09/2015, (NZD) | | $ | 24,810,893 | |
| | 31,142,000 | | | Queensland Treasury Corp., 7.125%, 9/18/2017, 144A, (NZD) | | | 26,669,293 | |
| | 19,163,000 | | | Queensland Treasury Corp., Series 14, 5.750%, 11/21/2014, (AUD) | | | 19,280,792 | |
| | | | | | | | |
| | | | | | | 270,500,349 | |
| | | | | | | | |
| | | | Lodging — 1.0% | | | | |
| | 52,516,000 | | | Choice Hotels International, Inc., 5.700%, 8/28/2020 | | | 56,978,705 | |
| | 4,522,000 | | | Wyndham Worldwide Corp., 5.750%, 2/01/2018 | | | 4,618,043 | |
| | 13,286,000 | | | Wyndham Worldwide Corp., 6.000%, 12/01/2016 | | | 13,895,734 | |
| | 23,518,000 | | | Wyndham Worldwide Corp., 7.375%, 3/01/2020 | | | 26,071,796 | |
| | | | | | | | |
| | | | | | | 101,564,278 | |
| | | | | | | | |
| | | | Media Cable — 1.2% | | | | |
| | 2,923,000 | | | Comcast Corp., 6.950%, 8/15/2037 | | | 3,503,902 | |
| | 17,832,000 | | | Shaw Communications, Inc., 5.650%, 10/01/2019, (CAD) | | | 18,084,361 | |
| | 4,101,000 | | | Time Warner Cable, Inc., 5.850%, 5/01/2017 | | | 4,556,875 | |
| | 78,178,000 | | | Time Warner Cable, Inc., 6.750%, 7/01/2018 | | | 90,972,299 | |
| | | | | | | | |
| | | | | | | 117,117,437 | |
| | | | | | | | |
| | | | Media Non-Cable — 0.1% | | | | |
| | 7,536,000 | | | News America, Inc., 6.150%, 3/01/2037 | | | 8,051,085 | |
| | 4,482,000 | | | News America, Inc., 8.150%, 10/17/2036 | | | 5,572,408 | |
| | | | | | | | |
| | | | | | | 13,623,493 | |
| | | | | | | | |
| | | | Metals & Mining — 1.5% | | | | |
| | 20,000,000 | | | Alcoa, Inc., 5.400%, 4/15/2021 | | | 19,380,520 | |
| | 15,060,000 | | | Alcoa, Inc., 5.870%, 2/23/2022 | | | 14,877,141 | |
| | 6,000,000 | | | Alcoa, Inc., 5.900%, 2/01/2027 | | | 5,939,820 | |
| | 5,505,000 | | | Alcoa, Inc., 5.950%, 2/01/2037 | | | 5,130,798 | |
| | 28,838,000 | | | Alcoa, Inc., 6.150%, 8/15/2020 | | | 29,212,346 | |
| | 5,804,000 | | | Alcoa, Inc., 6.750%, 1/15/2028 | | | 6,006,815 | |
| | 24,150,000 | | | ArcelorMittal, 6.750%, 3/01/2041 | | | 20,870,527 | |
| | 9,915,000 | | | ArcelorMittal, 7.000%, 10/15/2039 | | | 8,842,911 | |
| | 3,181,000 | | | Rio Tinto Alcan, Inc., 5.750%, 6/01/2035 | | | 3,581,055 | |
| | 1,943,000 | | | United States Steel Corp., 6.050%, 6/01/2017 | | | 1,768,130 | |
| | 4,612,000 | | | United States Steel Corp., 6.650%, 6/01/2037 | | | 3,551,240 | |
| | 31,210,000 | | | United States Steel Corp., 7.000%, 2/01/2018 | | | 28,089,000 | |
| | 3,655,000 | | | Vale Overseas Ltd., 6.875%, 11/21/2036 | | | 3,942,279 | |
| | | | | | | | |
| | | | | | | 151,192,582 | |
| | | | | | | | |
| | | | Mortgage Related — 0.0% | | | | |
| | 95,183 | | | FHLMC, 5.000%, 12/01/2031 | | | 102,764 | |
| | 15,027 | | | FNMA, 6.000%, 7/01/2029 | | | 16,691 | |
| | | | | | | | |
| | | | | | | 119,455 | |
| | | | | | | | |
| | | | Non-Captive Consumer — 1.6% | | | | |
| | 62,425(††) | | | SLM Corp., 6.000%, 12/15/2043 | | | 1,257,084 | |
| | 6,342,000 | | | SLM Corp., MTN, 5.050%, 11/14/2014 | | | 6,119,535 | |
| | 347,000 | | | SLM Corp., MTN, 5.125%, 8/27/2012 | | | 346,841 | |
| | 641,000 | | | SLM Corp., MTN, 8.000%, 3/25/2020 | | | 632,793 | |
See accompanying notes to financial statements.
21 |
Portfolio of Investments – as of September 30, 2011
Loomis Sayles Investment Grade Bond Fund – (continued)
| | | | | | | | |
Principal
Amount (‡) | | | Description | | Value (†) | |
| | | | | | | | |
| | | | Non-Captive Consumer — continued | | | | |
| $ | 4,796,000 | | | SLM Corp., Series A, MTN, 0.553%, 1/27/2014(b) | | $ | 4,402,273 | |
| | 9,224,000 | | | SLM Corp., Series A, MTN, 5.000%, 10/01/2013 | | | 9,029,171 | |
| | 6,547,000 | | | SLM Corp., Series A, MTN, 5.000%, 4/15/2015 | | | 6,105,457 | |
| | 1,957,000 | | | SLM Corp., Series A, MTN, 5.000%, 6/15/2018 | | | 1,719,874 | |
| | 6,141,000 | | | SLM Corp., Series A, MTN, 5.375%, 1/15/2013 | | | 6,141,283 | |
| | 5,368,000 | | | SLM Corp., Series A, MTN, 5.375%, 5/15/2014 | | | 5,282,831 | |
| | 19,496,000 | | | SLM Corp., Series A, MTN, 5.625%, 8/01/2033 | | | 15,524,567 | |
| | 30,667,000 | | | SLM Corp., Series A, MTN, 8.450%, 6/15/2018 | | | 31,898,832 | |
| | 4,893,000 | | | Springleaf Finance Corp., Series I, MTN, 5.400%, 12/01/2015 | | | 3,571,890 | |
| | 87,676,000 | | | Springleaf Finance Corp., Series J, MTN, 6.900%, 12/15/2017 | | | 63,126,720 | |
| | | | | | | | |
| | | | | | | 155,159,151 | |
| | | | | | | | |
| | | | Non-Captive Diversified — 3.6% | | | | |
| | 1,316,000 | | | Ally Financial, Inc., 6.000%, 12/15/2011 | | | 1,317,333 | |
| | 1,282,000 | | | Ally Financial, Inc., 6.625%, 5/15/2012 | | | 1,294,321 | |
| | 1,634,000 | | | Ally Financial, Inc., 6.750%, 12/01/2014 | | | 1,583,944 | |
| | 391,000 | | | Ally Financial, Inc., 6.875%, 8/28/2012 | | | 396,137 | |
| | 1,184,000 | | | Ally Financial, Inc., 7.000%, 2/01/2012 | | | 1,192,403 | |
| | 3,075,000 | | | Ally Financial, Inc., 7.500%, 12/31/2013 | | | 3,121,125 | |
| | 5,543,000 | | | Ally Financial, Inc., 8.000%, 12/31/2018 | | | 5,044,130 | |
| | 2,285,000 | | | Ally Financial, Inc., 8.000%, 11/01/2031 | | | 2,084,674 | |
| | 1,189,117 | | | CIT Group, Inc., 7.000%, 5/01/2014 | | | 1,212,899 | |
| | 6,756,571 | | | CIT Group, Inc., 7.000%, 5/01/2015 | | | 6,705,897 | |
| | 10,302,540 | | | CIT Group, Inc., 7.000%, 5/01/2016 | | | 9,993,464 | |
| | 15,765,347 | | | CIT Group, Inc., 7.000%, 5/01/2017 | | | 15,292,387 | |
| | 35,688,000 | | | GATX Corp., 4.750%, 10/01/2012 | | | 36,704,216 | |
| | 7,355,000 | | | General Electric Capital Australia Funding Pty Ltd., EMTN,
8.000%, 2/13/2012, (AUD) | | | 7,182,559 | |
| | 7,570,000 | | | General Electric Capital Australia Funding Pty Ltd., MTN,
6.000%, 5/15/2013, (AUD) | | | 7,400,803 | |
| | 3,100,000 | | | General Electric Capital Australia Funding Pty Ltd., MTN,
6.000%, 4/15/2015, (AUD) | | | 3,016,409 | |
| | 1,874,000 | | | General Electric Capital Australia Funding Pty Ltd., MTN,
6.000%, 3/15/2019, (AUD) | | | 1,757,147 | |
| | 969,000 | | | General Electric Capital Corp., 5.625%, 5/01/2018 | | | 1,059,300 | |
| | 4,673,000 | | | General Electric Capital Corp., MTN, 5.875%, 1/14/2038 | | | 4,789,671 | |
| | 14,225,000 | | | General Electric Capital Corp., Series A, EMTN, 6.750%, 9/26/2016, (NZD) | | | 11,530,093 | |
| | 6,000,000 | | | General Electric Capital Corp., Series A, GMTN, 2.960%, 5/18/2012, (SGD) | | | 4,630,441 | |
| | 13,100,000 | | | General Electric Capital Corp., Series A, GMTN, 3.485%, 3/08/2012, (SGD) | | | 10,078,977 | |
| | 36,850,000 | | | General Electric Capital Corp., Series A, GMTN,
7.625%, 12/10/2014, (NZD) | | | 30,488,626 | |
| | 10,247,000 | | | General Electric Capital Corp., Series A, MTN, 0.549%, 5/13/2024(b) | | | 8,354,154 | |
| | 16,696,000 | | | General Electric Capital Corp., Series A, MTN, 4.875%, 3/04/2015 | | | 17,828,440 | |
| | 26,931,000 | | | General Electric Capital Corp., Series A, MTN, 6.500%, 9/28/2015, (NZD) | | | 21,691,341 | |
| | 73,590,000 | | | International Lease Finance Corp., 6.250%, 5/15/2019 | | | 63,963,839 | |
| | 13,899,000 | | | International Lease Finance Corp., 6.375%, 3/25/2013 | | | 13,516,777 | |
| | 60,419,000 | | | International Lease Finance Corp., 7.125%, 9/01/2018, 144A | | | 60,645,571 | |
| | 548,000 | | | International Lease Finance Corp., 8.625%, 9/15/2015 | | | 543,890 | |
See accompanying notes to financial statements.
| 22
Portfolio of Investments – as of September 30, 2011
Loomis Sayles Investment Grade Bond Fund – (continued)
| | | | | | | | |
Principal
Amount (‡) | | | Description | | Value (†) | |
| | | | | | | | |
| | | | Non-Captive Diversified — continued | | | | |
| $ | 1,473,000 | | | International Lease Finance Corp., Series R, MTN, 5.625%, 9/20/2013 | | $ | 1,414,080 | |
| | 1,625,000 | | | International Lease Finance Corp., Series R, MTN, 5.650%, 6/01/2014 | | | 1,507,188 | |
| | | | | | | | |
| | | | | | | 357,342,236 | |
| | | | | | | | |
| | | | Oil Field Services — 0.7% | | | | |
| | 5,965,000 | | | Nabors Industries, Inc., 6.150%, 2/15/2018 | | | 6,651,023 | |
| | 22,583,000 | | | Nabors Industries, Inc., 9.250%, 1/15/2019 | | | 28,567,834 | |
| | 23,338,000 | | | Rowan Cos., Inc., 7.875%, 8/01/2019 | | | 27,555,877 | |
| | 587,000 | | | Transocean Ltd., 7.375%, 4/15/2018 | | | 671,616 | |
| | | | | | | | |
| | | | | | | 63,446,350 | |
| | | | | | | | |
| | | | Paper — 1.2% | | | | |
| | 4,365,000 | | | Celulosa Arauco y Constitucion S.A., 7.250%, 7/29/2019 | | | 5,077,342 | |
| | 23,225,000 | | | Georgia-Pacific LLC, 5.400%, 11/01/2020, 144A | | | 23,627,164 | |
| | 715,000 | | | Georgia-Pacific LLC, 7.250%, 6/01/2028 | | | 796,171 | |
| | 2,672,000 | | | Georgia-Pacific LLC, 7.375%, 12/01/2025 | | | 2,981,345 | |
| | 644,000 | | | Georgia-Pacific LLC, 7.750%, 11/15/2029 | | | 744,722 | |
| | 545,000 | | | Georgia-Pacific LLC, 8.000%, 1/15/2024 | | | 639,821 | |
| | 1,336,000 | | | Georgia-Pacific LLC, 8.875%, 5/15/2031 | | | 1,667,464 | |
| | 6,161,000 | | | International Paper Co., 5.250%, 4/01/2016 | | | 6,566,252 | |
| | 7,611,000 | | | International Paper Co., 8.700%, 6/15/2038 | | | 9,603,529 | |
| | 5,270,000 | | | Mead Corp. (The), 7.550%, 3/01/2047 | | | 5,834,549 | |
| | 5,764,000 | | | Westvaco Corp., 8.200%, 1/15/2030 | | | 6,534,687 | |
| | 24,007,000 | | | Weyerhaeuser Co., 6.875%, 12/15/2033 | | | 22,965,576 | |
| | 7,374,000 | | | Weyerhaeuser Co., 7.375%, 10/01/2019 | | | 8,143,831 | |
| | 20,254,000 | | | Weyerhaeuser Co., 7.375%, 3/15/2032 | | | 20,199,740 | |
| | | | | | | | |
| | | | | | | 115,382,193 | |
| | | | | | | | |
| | | | Pharmaceuticals — 0.6% | | | | |
| | 56,052,000 | | | Roche Holdings, Inc., 5.000%, 3/01/2014, 144A | | | 61,629,679 | |
| | 489,000 | | | Schering-Plough Corp., 5.300%, 12/01/2013 | | | 535,110 | |
| | | | | | | | |
| | | | | | | 62,164,789 | |
| | | | | | | | |
| | | | Pipelines — 4.1% | | | | |
| | 5,236,000 | | | CenterPoint Energy Resources Corp., 6.250%, 2/01/2037 | | | 5,964,359 | |
| | 1,967,000 | | | DCP Midstream LP, 6.450%, 11/03/2036, 144A | | | 2,148,556 | |
| | 528,000 | | | Energy Transfer Partners LP, 6.125%, 2/15/2017 | | | 574,775 | |
| | 1,571,000 | | | Energy Transfer Partners LP, 6.625%, 10/15/2036 | | | 1,614,773 | |
| | 9,253,000 | | | Enterprise Products Operating LLP, 6.300%, 9/15/2017 | | | 10,741,123 | |
| | 3,328,000 | | | Florida Gas Transmission Co., 7.900%, 5/15/2019, 144A | | | 4,240,518 | |
| | 14,300,000 | | | IFM US Colonial Pipeline 2 LLC, 6.450%, 5/01/2021, 144A | | | 16,060,444 | |
| | 14,675,000 | | | Kinder Morgan Energy Partners LP, 5.300%, 9/15/2020 | | | 15,904,398 | |
| | 66,165,000 | | | Kinder Morgan Energy Partners LP, 5.950%, 2/15/2018 | | | 75,302,188 | |
| | 303,000 | | | Kinder Morgan Finance Co., 5.700%, 1/05/2016 | | | 303,758 | |
| | 29,746,150 | | | Maritimes & Northeast Pipeline LLC, 7.500%, 5/31/2014, 144A(c) | | | 32,153,803 | |
| | 8,886,000 | | | NGPL PipeCo LLC, 6.514%, 12/15/2012, 144A | | | 9,248,753 | |
| | 30,760,000 | | | NGPL PipeCo LLC, 7.119%, 12/15/2017, 144A | | | 32,437,281 | |
| | 13,790,000 | | | NiSource Finance Corp., 6.125%, 3/01/2022 | | | 15,625,173 | |
| | 24,110,000 | | | NiSource Finance Corp., 6.400%, 3/15/2018 | | | 28,069,778 | |
See accompanying notes to financial statements.
23 |
Portfolio of Investments – as of September 30, 2011
Loomis Sayles Investment Grade Bond Fund – (continued)
| | | | | | | | |
Principal
Amount (‡) | | | Description | | Value (†) | |
| | | | | | | | |
| | | | Pipelines — continued | | | | |
| $ | 21,614,000 | | | NiSource Finance Corp., 6.800%, 1/15/2019 | | $ | 25,210,915 | |
| | 9,899,000 | | | Panhandle Eastern Pipeline Co., 6.200%, 11/01/2017 | | | 11,497,372 | |
| | 47,594,000 | | | Panhandle Eastern Pipeline Co., 7.000%, 6/15/2018 | | | 56,586,315 | |
| | 1,404,000 | | | Panhandle Eastern Pipeline Co., 8.125%, 6/01/2019 | | | 1,779,597 | |
| | 2,085,000 | | | Plains All American Pipeline LP, 6.125%, 1/15/2017 | | | 2,346,749 | |
| | 15,683,000 | | | Plains All American Pipeline LP, 6.500%, 5/01/2018 | | | 18,057,767 | |
| | 4,497,000 | | | Plains All American Pipeline LP, 6.650%, 1/15/2037 | | | 4,968,272 | |
| | 4,125,000 | | | Southern Natural Gas Co., 5.900%, 4/01/2017, 144A | | | 4,626,860 | |
| | 19,574,000 | | | Texas Eastern Transmission LP, 6.000%, 9/15/2017, 144A | | | 23,429,491 | |
| | | | | | | | |
| | | | | | | 398,893,018 | |
| | | | | | | | |
| | | | Property & Casualty Insurance — 0.9% | | | | |
| | 3,083,000 | | | Hanover Insurance Group, Inc. (The), 7.500%, 3/01/2020 | | | 3,476,083 | |
| | 9,038,000 | | | Liberty Mutual Group, Inc., 6.500%, 3/15/2035, 144A | | | 8,721,923 | |
| | 30,349,000 | | | Marsh & McLennan Cos., Inc., 5.875%, 8/01/2033 | | | 33,634,735 | |
| | 944,000 | | | MBIA Insurance Corp., (fixed rate to 1/15/2013, variable rate thereafter),
14.000%, 1/15/2033, 144A | | | 424,800 | |
| | 14,575,000 | | | Nationwide Mutual Insurance Co., 6.600%, 4/15/2034, 144A | | | 13,530,497 | |
| | 7,609,000 | | | White Mountains Re Group Ltd., 6.375%, 3/20/2017, 144A | | | 7,638,485 | |
| | 13,521,000 | | | Willis North America, Inc., 7.000%, 9/29/2019 | | | 15,641,187 | |
| | 2,212,000 | | | XL Group PLC, 6.250%, 5/15/2027 | | | 2,267,366 | |
| | 1,463,000 | | | XL Group PLC, 6.375%, 11/15/2024 | | | 1,544,790 | |
| | | | | | | | |
| | | | | | | 86,879,866 | |
| | | | | | | | |
| | | | Property Trust — 0.4% | | | | |
| | 36,192,000 | | | WEA Finance LLC/WT Finance Australia Property Ltd.,
6.750%, 9/02/2019, 144A | | | 40,215,392 | |
| | | | | | | | |
| | | | Railroads — 0.1% | | | | |
| | 9,787,000 | | | Canadian Pacific Railway Co., 7.250%, 5/15/2019 | | | 12,273,779 | |
| | 238,000 | | | Missouri Pacific Railroad Co., 4.750%, 1/01/2030(c) | | | 209,440 | |
| | 1,701,000 | | | Missouri Pacific Railroad Co., 5.000%, 1/01/2045(c) | | | 1,224,720 | |
| | 191,000 | | | Missouri Pacific Railroad Co., Series A, 4.750%, 1/01/2020(c) | | | 175,720 | |
| | | | | | | | |
| | | | | | | 13,883,659 | |
| | | | | | | | |
| | | | Real Estate Operations/Development — 0.1% | | | | |
| | 10,276,000 | | | First Industrial LP, 5.950%, 5/15/2017 | | | 9,451,341 | |
| | | | | | | | |
| | | | REITs — Apartments — 0.4% | | | | |
| | 12,243,000 | | | Camden Property Trust, 5.000%, 6/15/2015 | | | 13,067,089 | |
| | 16,491,000 | | | Camden Property Trust, 5.700%, 5/15/2017 | | | 18,035,827 | |
| | 988,000 | | | ERP Operating LP, 5.125%, 3/15/2016 | | | 1,059,925 | |
| | 1,762,000 | | | ERP Operating LP, 5.375%, 8/01/2016 | | | 1,919,741 | |
| | 2,368,000 | | | ERP Operating LP, 5.750%, 6/15/2017 | | | 2,644,992 | |
| | | | | | | | |
| | | | | | | 36,727,574 | |
| | | | | | | | |
| | | | REITs — Diversified — 0.3% | | | | |
| | 4,140,000 | | | Duke Realty LP, 5.950%, 2/15/2017 | | | 4,336,927 | |
| | 19,574,000 | | | Duke Realty LP, 6.500%, 1/15/2018 | | | 21,041,502 | |
| | | | | | | | |
| | | | | | | 25,378,429 | |
| | | | | | | | |
See accompanying notes to financial statements.
| 24
Portfolio of Investments – as of September 30, 2011
Loomis Sayles Investment Grade Bond Fund – (continued)
| | | | | | | | |
Principal
Amount (‡) | | | Description | | Value (†) | |
| | | | | | | | |
| | | | REITs — Healthcare — 0.1% | | | | |
| $ | 5,972,000 | | | Health Care REIT, Inc., 6.500%, 3/15/2041 | | $ | 5,665,272 | |
| | | | | | | | |
| | | | REITs — Office Property — 0.4% | | | | |
| | 20,817,000 | | | Highwoods Properties, Inc., 5.850%, 3/15/2017 | | | 21,956,627 | |
| | 11,306,000 | | | Highwoods Properties, Inc., 7.500%, 4/15/2018 | | | 13,117,255 | |
| | | | | | | | |
| | | | | | | 35,073,882 | |
| | | | | | | | |
| | | | REITs — Regional Malls — 0.2% | | | | |
| | 2,427,000 | | | Simon Property Group LP, 5.250%, 12/01/2016 | | | 2,643,809 | |
| | 12,209,000 | | | Simon Property Group LP, 5.750%, 12/01/2015 | | | 13,471,862 | |
| | 1,889,000 | | | Simon Property Group LP, 5.875%, 3/01/2017 | | | 2,123,178 | |
| | 4,066,000 | | | Simon Property Group LP, 6.100%, 5/01/2016 | | | 4,610,352 | |
| | | | | | | | |
| | | | | | | 22,849,201 | |
| | | | | | | | |
| | | | REITs — Shopping Centers — 0.1% | | | | |
| | 4,893,000 | | | Equity One, Inc., 6.000%, 9/15/2017 | | | 4,966,429 | |
| | 1,918,000 | | | Federal Realty Investment Trust, 5.650%, 6/01/2016 | | | 2,090,375 | |
| | | | | | | | |
| | | | | | | 7,056,804 | |
| | | | | | | | |
| | | | REITs — Single Tenant — 0.4% | | | | |
| | 5,862,000 | | | Realty Income Corp., 5.750%, 1/15/2021 | | | 6,502,470 | |
| | 25,529,000 | | | Realty Income Corp., 6.750%, 8/15/2019 | | | 29,702,660 | |
| | | | | | | | |
| | | | | | | 36,205,130 | |
| | | | | | | | |
| | | | REITs — Warehouse/Industrials — 0.6% | | | | |
| | 3,873,000 | | | ProLogis LP, 5.625%, 11/15/2015 | | | 3,998,291 | |
| | 11,179,000 | | | ProLogis LP, 5.625%, 11/15/2016 | | | 11,340,112 | |
| | 10,889,000 | | | ProLogis LP, 5.750%, 4/01/2016 | | | 11,126,827 | |
| | 9,698,000 | | | ProLogis LP, 6.625%, 5/15/2018 | | | 10,056,642 | |
| | 18,869,000 | | | ProLogis LP, 7.375%, 10/30/2019 | | | 20,410,578 | |
| | | | | | | | |
| | | | | | | 56,932,450 | |
| | | | | | | | |
| | | | Restaurants — 0.1% | | | | |
| | 10,320,000 | | | Darden Restaurants, Inc., 6.000%, 8/15/2035 | | | 11,000,284 | |
| | | | | | | | |
| | | | Retailers — 0.6% | | | | |
| | 7,996,000 | | | J.C. Penney Corp., Inc., 5.750%, 2/15/2018 | | | 7,796,100 | |
| | 8,139,000 | | | J.C. Penney Corp., Inc., 6.375%, 10/15/2036 | | | 6,836,760 | |
| | 12,000 | | | J.C. Penney Corp., Inc., 7.125%, 11/15/2023 | | | 12,120 | |
| | 8,656,000 | | | J.C. Penney Corp., Inc., 7.625%, 3/01/2097 | | | 7,271,040 | |
| | 13,425,000 | | | Macy’s Retail Holdings, Inc., 6.375%, 3/15/2037 | | | 14,729,722 | |
| | 10,467,000 | | | Macy’s Retail Holdings, Inc., 6.790%, 7/15/2027 | | | 10,546,298 | |
| | 2,691,000 | | | Macy’s Retail Holdings, Inc., 6.900%, 4/01/2029 | | | 3,019,916 | |
| | 8,064,000 | | | Marks & Spencer PLC, 7.125%, 12/01/2037, 144A | | | 8,639,729 | |
| | | | | | | | |
| | | | | | | 58,851,685 | |
| | | | | | | | |
| | | | Sovereigns — 1.2% | | | | |
| | 4,111,400(†††) | | | Mexican Fixed Rate Bonds, Series M-20, 8.000%, 12/07/2023, (MXN) | | | 32,814,447 | |
| | 24,178,000 | | | Republic of Brazil, 10.250%, 1/10/2028, (BRL) | | | 13,501,875 | |
| | 6,035,000 | | | Republic of Brazil, 12.500%, 1/05/2022, (BRL) | | | 3,771,374 | |
| | 52,555,000 | | | Republic of Croatia, 6.750%, 11/05/2019, 144A | | | 50,820,685 | |
See accompanying notes to financial statements.
25 |
Portfolio of Investments – as of September 30, 2011
Loomis Sayles Investment Grade Bond Fund – (continued)
| | | | | | | | |
Principal
Amount (‡) | | | Description | | Value (†) | |
| | | | | | | | |
| | | | Sovereigns — continued | | | | |
| | 1,018,562,437 | | | Republic of Iceland, 4.250%, 8/24/2012, (ISK) | | $ | 5,308,610 | |
| | 927,108,000 | | | Republic of Iceland, 6.000%, 10/13/2016, (ISK) | | | 5,062,538 | |
| | 776,294,507 | | | Republic of Iceland, 7.250%, 5/17/2013, (ISK) | | | 4,239,855 | |
| | | | | | | | |
| | | | | | | 115,519,384 | |
| | | | | | | | |
| | | | Supermarkets — 0.2% | | | | |
| | 4,130,000 | | | American Stores Co., Series B, MTN, 7.100%, 3/20/2028 | | | 3,149,125 | |
| | 3,269,000 | | | Kroger Co. (The), 6.400%, 8/15/2017 | | | 3,876,066 | |
| | 1,860,000 | | | New Albertson’s, Inc., 7.450%, 8/01/2029 | | | 1,395,000 | |
| | 979,000 | | | New Albertson’s, Inc., Series C, MTN, 6.625%, 6/01/2028 | | | 680,405 | |
| | 10,863,000 | | | Safeway, Inc., 6.350%, 8/15/2017 | | | 12,566,145 | |
| | | | | | | | |
| | | | | | | 21,666,741 | |
| | | | | | | | |
| | | | Supranational — 1.4% | | | | |
| | 11,745,000 | | | European Bank for Reconstruction & Development, GMTN, 9.250%, 9/10/2012, (BRL) | | | 6,329,588 | |
| | 192,350,850,000 | | | European Investment Bank, EMTN, Zero Coupon, 4/24/2013, 144A, (IDR) | | | 18,852,134 | |
| | 28,082,000 | | | European Investment Bank, EMTN, 7.000%, 1/18/2012, (NZD) | | | 21,622,061 | |
| | 329,210,000,000 | | | Inter-American Development Bank, EMTN, Zero Coupon, 5/20/2013, (IDR) | | | 32,246,850 | |
| | 410,030,000,000 | | | Inter-American Development Bank, EMTN, Zero Coupon, 9/23/2013, (IDR) | | | 38,857,223 | |
| | 12,982,000 | | | Inter-American Development Bank, EMTN, 6.000%, 12/15/2017, (NZD) | | | 10,708,876 | |
| | 15,070,000 | | | International Bank for Reconstruction & Development, 1.430%, 3/05/2014, (SGD) | | | 11,750,947 | |
| | | | | | | | |
| | | | | | | 140,367,679 | |
| | | | | | | | |
| | | | Technology — 3.4% | | | | |
| | 8,705,000 | | | Agilent Technologies, Inc., 6.500%, 11/01/2017 | | | 10,185,477 | |
| | 4,600,000 | | | Alcatel-Lucent USA, Inc., 6.450%, 3/15/2029 | | | 3,818,000 | |
| | 1,028,000 | | | Arrow Electronics, Inc., 6.875%, 6/01/2018 | | | 1,141,544 | |
| | 3,059,000 | | | Avnet, Inc., 5.875%, 3/15/2014 | | | 3,274,598 | |
| | 6,097,000 | | | Avnet, Inc., 6.000%, 9/01/2015 | | | 6,591,302 | |
| | 1,507,000 | | | Avnet, Inc., 6.625%, 9/15/2016 | | | 1,675,838 | |
| | 12,444,000 | | | BMC Software, Inc., 7.250%, 6/01/2018(c) | | | 14,924,226 | |
| | 13,457,000 | | | Corning, Inc., 6.750%, 9/15/2013 | | | 14,658,979 | |
| | 1,448,000 | | | Corning, Inc., 6.850%, 3/01/2029 | | | 1,776,026 | |
| | 57,571,000 | | | Corning, Inc., 7.000%, 5/15/2024 | | | 72,719,312 | |
| | 7,487,000 | | | Corning, Inc., 7.250%, 8/15/2036 | | | 9,238,209 | |
| | 55,237,000 | | | Dun & Bradstreet Corp. (The), 6.000%, 4/01/2013 | | | 58,879,825 | |
| | 7,051,000 | | | Equifax, Inc., 7.000%, 7/01/2037 | | | 8,325,609 | |
| | 323,000 | | | Freescale Semiconductor, Inc., 10.125%, 12/15/2016 | | | 328,653 | |
| | 70,969,000 | | | Ingram Micro, Inc., 5.250%, 9/01/2017 | | | 75,407,330 | |
| | 7,795,000 | | | Intuit, Inc., 5.750%, 3/15/2017 | | | 8,760,917 | |
| | 19,078,000 | | | KLA-Tencor Corp., 6.900%, 5/01/2018 | | | 21,799,439 | |
| | 1,502,000 | | | Motorola Solutions, Inc., 6.625%, 11/15/2037 | | | 1,786,375 | |
| | 1,590,000 | | | Motorola Solutions, Inc., 8.000%, 11/01/2011 | | | 1,597,964 | |
| | 2,397,000 | | | Samsung Electronics Co. Ltd., 7.700%, 10/01/2027, 144A | | | 2,881,475 | |
| | 5,603,000 | | | Tyco Electronics Group S.A., 6.550%, 10/01/2017 | | | 6,585,884 | |
| | 561,000 | | | Xerox Corp., 6.350%, 5/15/2018 | | | 637,661 | |
| | 7,110,000 | | | Xerox Corp., 6.750%, 2/01/2017 | | | 8,160,282 | |
| | | | | | | | |
| | | | | | | 335,154,925 | |
| | | | | | | | |
See accompanying notes to financial statements.
| 26
Portfolio of Investments – as of September 30, 2011
Loomis Sayles Investment Grade Bond Fund – (continued)
| | | | | | | | |
Principal
Amount (‡) | | | Description | | Value (†) | |
| | | | | | | | |
| | | | Textile — 0.2% | | | | |
| $ | 3,755,000 | | | Phillips-Van Heusen Corp., 7.750%, 11/15/2023 | | $ | 3,966,928 | |
| | 14,903,000 | | | VF Corp., 6.450%, 11/01/2037 | | | 19,199,848 | |
| | | | | | | | |
| | | | | | | 23,166,776 | |
| | | | | | | | |
| | | | Tobacco — 0.1% | | | | |
| | 8,128,000 | | | Reynolds American, Inc., 6.750%, 6/15/2017 | | | 9,368,186 | |
| | 1,992,000 | | | Reynolds American, Inc., 7.250%, 6/15/2037 | | | 2,236,596 | |
| | | | | | | | |
| | | | | | | 11,604,782 | |
| | | | | | | | |
| | | | Transportation Services — 0.7% | | | | |
| | 8,436,000 | | | Erac USA Finance Co., 6.375%, 10/15/2017, 144A | | | 9,779,416 | |
| | 2,824,000 | | | Erac USA Finance Co., 6.700%, 6/01/2034, 144A | | | 3,146,219 | |
| | 51,504,000 | | | Erac USA Finance Co., 7.000%, 10/15/2037, 144A | | | 60,002,160 | |
| | | | | | | | |
| | | | | | | 72,927,795 | |
| | | | | | | | |
| | | | Treasuries — 16.4% | | | | |
| | 360,010,000 | | | Canadian Government, 2.000%, 9/01/2012, (CAD) | | | 347,164,524 | |
| | 194,485,000 | | | Canadian Government, 3.750%, 6/01/2019, (CAD) | | | 210,537,111 | |
| | 4,159,000 | | | Canadian Government, 4.000%, 6/01/2016, (CAD) | | | 4,444,998 | |
| | 183,949,000 | | | Canadian Government, 4.250%, 6/01/2018, (CAD) | | | 203,930,787 | |
| | 2,956,326 | | | Hellenic Republic Government Bond, 2.300%, 7/25/2030, (EUR) | | | 1,172,752 | |
| | 1,420,000 | | | Hellenic Republic Government Bond, 4.500%, 9/20/2037, (EUR) | | | 593,753 | |
| | 979,000 | | | Hellenic Republic Government Bond, 4.600%, 7/20/2018, (EUR) | | | 538,615 | |
| | 47,042,000 | | | Hellenic Republic Government Bond, 4.700%, 3/20/2024, (EUR) | | | 19,859,024 | |
| | 85,198,516 | | | Ireland Government Bond, 4.500%, 10/18/2018, (EUR) | | | 96,408,896 | |
| | 24,638,126 | | | Ireland Government Bond, 4.500%, 4/18/2020, (EUR) | | | 27,169,976 | |
| | 5,049,296 | | | Ireland Government Bond, 5.000%, 10/18/2020, (EUR) | | | 5,638,997 | |
| | 63,183,488 | | | Ireland Government Bond, 5.400%, 3/13/2025, (EUR) | | | 70,090,256 | |
| | 12,263,000 | | | New Zealand Government Bond, 6.000%, 12/15/2017, (NZD) | | | 10,377,713 | |
| | 328,483,000 | | | New Zealand Government Bond, 6.500%, 4/15/2013, (NZD) | | | 263,964,271 | |
| | 726,401,000 | | | Norwegian Government, 4.250%, 5/19/2017, (NOK) | | | 138,557,331 | |
| | 118,387,000 | | | Norwegian Government, 5.000%, 5/15/2015, (NOK) | | | 22,499,701 | |
| | 921,369,000 | | | Norwegian Government, 6.500%, 5/15/2013, (NOK) | | | 169,354,626 | |
| | 18,301,446 | | | Portugal Obrigacoes do Tesouro OT, 3.850%, 4/15/2021, (EUR) | | | 14,179,546 | |
| | 4,599,829 | | | Portugal Obrigacoes do Tesouro OT, 4.800%, 6/15/2020, (EUR) | | | 3,723,104 | |
| | | | | | | | |
| | | | | | | 1,610,205,981 | |
| | | | | | | | |
| | | | Wireless — 0.8% | | | | |
| | 5,200,000 | | | Brasil Telecom S.A., 9.750%, 9/15/2016, 144A, (BRL) | | | 2,516,687 | |
| | 31,416,000 | | | Cellco Partnership/Verizon Wireless Capital LLC, 8.500%, 11/15/2018 | | | 41,863,108 | |
| | 15,375,000 | | | Nextel Communications, Inc., Series C, 5.950%, 3/15/2014 | | | 14,414,062 | |
| | 8,549,000 | | | Nextel Communications, Inc., Series D, 7.375%, 8/01/2015 | | | 8,100,177 | |
| | 279,000 | | | Nextel Communications, Inc., Series E, 6.875%, 10/31/2013 | | | 271,328 | |
| | 6,373,000 | | | Sprint Capital Corp., 6.875%, 11/15/2028 | | | 4,763,817 | |
| | 2,594,000 | | | Sprint Capital Corp., 6.900%, 5/01/2019 | | | 2,230,840 | |
| | 612,000 | | | Sprint Capital Corp., 8.750%, 3/15/2032 | | | 531,675 | |
| | 91,000 | | | Sprint Nextel Corp., 6.000%, 12/01/2016 | | | 78,260 | |
| | 1,619,000 | | | Vodafone Group PLC, 5.000%, 9/15/2015 | | | 1,802,451 | |
| | | | | | | | |
| | | | | | | 76,572,405 | |
| | | | | | | | |
See accompanying notes to financial statements.
27 |
Portfolio of Investments – as of September 30, 2011
Loomis Sayles Investment Grade Bond Fund – (continued)
| | | | | | | | |
Principal
Amount (‡) | | | Description | | Value (†) | |
| | | | | | | | |
| | | | Wirelines — 4.6% | | | | |
| | 406,000 | | | Bell Canada, MTN, 7.300%, 2/23/2032, (CAD) | | $ | 454,926 | |
| | 1,874,000 | | | BellSouth Corp., 6.000%, 11/15/2034 | | | 2,039,594 | |
| | 2,936,000 | | | BellSouth Telecommunications, Inc., 5.850%, 11/15/2045 | | | 3,046,946 | |
| | 6,665,000 | | | BellSouth Telecommunications, Inc., 7.000%, 12/01/2095 | | | 7,897,585 | |
| | 62,040,000 | | | CenturyLink, Inc., 6.450%, 6/15/2021 | | | 57,487,257 | |
| | 4,990,000 | | | CenturyLink, Inc., Series G, 6.875%, 1/15/2028 | | | 4,320,562 | |
| | 2,708,000 | | | CenturyLink, Inc., Series P, 7.600%, 9/15/2039 | | | 2,435,895 | |
| | 131,306,000 | | | Deutsche Telekom International Finance BV, 6.000%, 7/08/2019 | | | 151,714,366 | |
| | 24,103,000 | | | Embarq Corp., 7.995%, 6/01/2036 | | | 22,615,700 | |
| | 3,279,000 | | | GTE Corp., 6.940%, 4/15/2028 | | | 4,051,955 | |
| | 1,440,000 | | | Level 3 Financing, Inc., 8.750%, 2/15/2017 | | | 1,326,600 | |
| | 354,000 | | | Level 3 Financing, Inc., 9.250%, 11/01/2014 | | | 349,575 | |
| | 200,000 | | | Level 3 Financing, Inc., 9.375%, 4/01/2019, 144A | | | 186,000 | |
| | 7,550,000 | | | Portugal Telecom International Finance BV, EMTN,
4.500%, 6/16/2025, (EUR) | | | 6,574,822 | |
| | 18,600,000 | | | Portugal Telecom International Finance BV, EMTN,
5.000%, 11/04/2019, (EUR) | | | 18,564,913 | |
| | 1,698,000 | | | Qwest Capital Funding, Inc., 6.500%, 11/15/2018 | | | 1,630,080 | |
| | 2,755,000 | | | Qwest Capital Funding, Inc., 6.875%, 7/15/2028 | | | 2,383,075 | |
| | 4,370,000 | | | Qwest Capital Funding, Inc., 7.625%, 8/03/2021 | | | 4,522,950 | |
| | 949,000 | | | Qwest Capital Funding, Inc., 7.750%, 2/15/2031 | | | 882,570 | |
| | 333,000 | | | Qwest Corp., 6.500%, 6/01/2017 | | | 343,822 | |
| | 14,480,000 | | | Qwest Corp., 6.875%, 9/15/2033 | | | 13,683,600 | |
| | 4,668,000 | | | Qwest Corp., 7.200%, 11/10/2026 | | | 4,434,600 | |
| | 9,077,000 | | | Qwest Corp., 7.250%, 9/15/2025 | | | 8,759,305 | |
| | 9,474,000 | | | Qwest Corp., 7.250%, 10/15/2035 | | | 9,095,040 | |
| | 1,566,000 | | | Qwest Corp., 7.500%, 6/15/2023 | | | 1,544,593 | |
| | 18,301,000 | | | Telecom Italia Capital S.A., 6.000%, 9/30/2034 | | | 14,971,774 | |
| | 8,718,000 | | | Telecom Italia Capital S.A., 6.375%, 11/15/2033 | | | 7,458,258 | |
| | 1,700,000 | | | Telefonica Emisiones SAU, 7.045%, 6/20/2036 | | | 1,698,759 | |
| | 1,700,000 | | | Telefonica Emisiones SAU, EMTN, 5.289%, 12/09/2022, (GBP) | | | 2,336,840 | |
| | 2,700,000 | | | Telefonica Emisiones SAU, EMTN, 5.375%, 2/02/2026, (GBP) | | | 3,589,393 | |
| | 14,137,000 | | | Telus Corp., 4.950%, 3/15/2017, (CAD) | | | 14,664,490 | |
| | 54,665,000 | | | Telus Corp., Series CG, 5.050%, 12/04/2019, (CAD) | | | 56,551,331 | |
| | 3,598,000 | | | Verizon Communications, Inc., 6.100%, 4/15/2018 | | | 4,290,482 | |
| | 4,163,000 | | | Verizon Maryland, Inc., Series B, 5.125%, 6/15/2033 | | | 4,231,111 | |
| | 2,642,000 | | | Verizon New England, Inc., 7.875%, 11/15/2029 | | | 3,302,891 | |
| | 5,260,000 | | | Verizon Pennsylvania, Inc., 6.000%, 12/01/2028 | | | 5,860,691 | |
| | | | | | | | |
| | | | | | | 449,302,351 | |
| | | | | | | | |
| | | | Total Non-Convertible Bonds
(Identified Cost $7,938,183,376) | | | 8,715,493,311 | |
| | | | | | | | |
| | Convertible Bonds — 3.5% | |
| | | | Automotive — 0.5% | | | | |
| | 34,827,000 | | | Ford Motor Co., 4.250%, 11/15/2016 | | | 45,231,566 | |
| | | | | | | | |
| | | | Life Insurance — 0.7% | | | | |
| | 72,915,000 | | | Old Republic International Corp., 3.750%, 3/15/2018 | | | 65,896,931 | |
| | | | | | | | |
See accompanying notes to financial statements.
| 28
Portfolio of Investments – as of September 30, 2011
Loomis Sayles Investment Grade Bond Fund – (continued)
| | | | | | | | |
Principal
Amount (‡) | | | Description | | Value (†) | |
| | | | | | | | |
| | | | Media Non-Cable — 0.0% | | | | |
| $ | 515,099 | | | Liberty Media LLC, 3.500%, 1/15/2031 | | $ | 278,154 | |
| | | | | | | | |
| | | | REITs — Warehouse/Industrials — 0.3% | | | | |
| | 27,359,000 | | | ProLogis LP, 3.250%, 3/15/2015 | | | 27,051,211 | |
| | | | | | | | |
| | | | Technology — 2.0% | | | | |
| | 35,120,000 | | | Intel Corp., 2.950%, 12/15/2035 | | | 35,602,900 | |
| | 137,016,000 | | | Intel Corp., 3.250%, 8/01/2039 | | | 161,165,070 | |
| | 880,000 | | | Micron Technology, Inc., 1.875%, 6/01/2014 | | | 821,700 | |
| | | | | | | | |
| | | | | | | 197,589,670 | |
| | | | | | | | |
| | | | Wirelines — 0.0% | | | | |
| | 304,000 | | | Level 3 Communications, Inc., 3.500%, 6/15/2012 | | | 299,820 | |
| | 2,926,000 | | | Level 3 Communications, Inc., 7.000%, 3/15/2015, 144A(c) | | | 3,496,570 | |
| | | | | | | | |
| | | | | | | 3,796,390 | |
| | | | | | | | |
| | | | Total Convertible Bonds
(Identified Cost $311,182,359) | | | 339,843,922 | |
| | | | | | | | |
| | Municipals — 0.7% | |
| | | | California — 0.1% | | | | |
| | 1,275,000 | | | San Jose California Redevelopment Agency Tax Allocation (Merged Area Redevelopment), Series C, (MBIA insured), 3.750%, 8/01/2028 | | | 947,108 | |
| | 470,000 | | | San Jose California Redevelopment Agency Tax Allocation (Merged Area Redevelopment), Series C, (Registered), (MBIA insured),
3.750%, 8/01/2028 | | | 403,472 | |
| | 1,585,000 | | | State of California, (AMBAC insured), 4.500%, 8/01/2027 | | | 1,586,395 | |
| | 4,420,000 | | | State of California, 4.500%, 10/01/2029 | | | 4,334,473 | |
| | 1,285,000 | | | State of California, (AMBAC insured), 4.500%, 8/01/2030 | | | 1,257,771 | |
| | 1,450,000 | | | State of California, 4.500%, 8/01/2030 | | | 1,419,274 | |
| | 820,000 | | | State of California (Various Purpose), (MBIA insured), 3.250%, 12/01/2027 | | | 699,788 | |
| | 3,880,000 | | | State of California (Various Purpose), (AMBAC insured),
4.500%, 12/01/2033 | | | 3,626,597 | |
| | | | | | | | |
| | | | | | | 14,274,878 | |
| | | | | | | | |
| | | | District of Columbia — 0.2% | | | | |
| | 14,680,000 | | | Metropolitan Washington Airports Authority, 7.462%, 10/01/2046 | | | 16,869,228 | |
| | | | | | | | |
| | | | Illinois — 0.2% | | | | |
| | 530,000 | | | Chicago O’Hare International Airport, Series A, (AGMC insured), 4.500%, 1/01/2038 | | | 507,146 | |
| | 24,640,000 | | | State of Illinois, 5.100%, 6/01/2033 | | | 22,272,343 | |
| | | | | | | | |
| | | | | | | 22,779,489 | |
| | | | | | | | |
| | | | Michigan — 0.0% | | | | |
| | 2,490,000 | | | Michigan Tobacco Settlement Finance Authority Taxable Turbo,
Series A,
7.309%, 6/01/2034(c) | | | 1,882,291 | |
| | | | | | | | |
| | | | Ohio — 0.1% | | | | |
| | 6,430,000 | | | Buckeye Tobacco Settlement Financing Authority, Series A-2,
5.875%, 6/01/2047(c) | | | 4,503,379 | |
| | | | | | | | |
See accompanying notes to financial statements.
29 |
Portfolio of Investments – as of September 30, 2011
Loomis Sayles Investment Grade Bond Fund – (continued)
| | | | | | | | |
Principal
Amount (‡) | | | Description | | Value (†) | |
| | | | | | | | |
| | | | Virginia — 0.1% | | | | |
| $ | 14,240,000 | | | Virginia Tobacco Settlement Financing Corp., Series A-1,
6.706%, 6/01/2046(c) | | $ | 9,393,985 | |
| | | | | | | | |
| | | | Total Municipals
(Identified Cost $70,075,093) | | | 69,703,250 | |
| | | | | | | | |
| | | | Total Bonds and Notes
(Identified Cost $8,319,440,828) | | | 9,125,040,483 | |
| | | | | | | | |
| | Senior Loans — 0.2% | |
| | | | Aerospace & Defense — 0.2% | | | | |
| | 16,560,000 | | | AWAS Finance Luxembourg S.A.R.L., Term Loan B, 5.250%, 6/10/2016(b)
(Identified Cost $16,560,000) | | | 16,228,800 | |
| | | | | | | | |
| | Short-Term Investments — 5.4% | |
| | 532,462,793 | | | Tri-Party Repurchase Agreement with Fixed Income Clearing Corporation, dated 9/30/2011 at 0.000% to be repurchased at $532,462,793 on 10/03/2011 collateralized by $67,255,000 Federal Home Loan Bank Discount Note, due 11/23/11 valued at $67,255,000; $16,160,000 Federal Home Loan Bank, 1.500% due 1/16/2013 valued at $16,442,800; $297,900,000 Federal Home Loan Mortgage Corp., 0.515% due 11/26/2012 valued at $299,389,500; $100,060,000 Federal Home Loan Mortgage Corp., 0.375% due 11/30/2012 valued at $100,310,150; $59,345,000 U.S. Treasury Note, 0.625% due 1/31/2013 valued at $59,715,906 including accrued interest (Note 2 of Notes to Financial Statements)
(Identified Cost $532,462,793) | | | 532,462,793 | |
| | | | | | | | |
| | | | | | | | |
| | | | Total Investments — 98.6%
(Identified Cost $8,868,463,621)(a) | | | 9,673,732,076 | |
| | | | Other assets less liabilities — 1.4% | | | 134,280,699 | |
| | | | | | | | |
| | | | Net Assets — 100.0% | | $ | 9,808,012,775 | |
| | | | | | | | |
| | (‡) | | | Principal amount stated in U.S. dollars unless otherwise noted. | | | | |
| | (†) | | | See Note 2 of Notes to Financial Statements. | | | | |
| | (††) | | | Amount shown represents units. One unit represents a principal amount of 25. | | | | |
| | (†††) | | | Amount shown represents units. One unit represents a principal amount of 100. | |
| | (a) | | | Federal Tax Information: | | | | |
| | | | At September 30, 2011, the net unrealized appreciation on investments based on a cost of $8,911,118,824 for federal income tax purposes was as follows: | | | | |
| | | | Aggregate gross unrealized appreciation for all investments in which there is an excess of value over tax cost | | $ | 930,422,767 | |
| | | | Aggregate gross unrealized depreciation for all investments in which there is an excess of tax cost over value | | | (167,809,515 | ) |
| | | | | | | | |
| | | | Net unrealized appreciation | | $ | 762,613,252 | |
| | | | | | | | |
| | | | | | | | |
| | (b) | | | Variable rate security. Rate as of September 30, 2011 is disclosed. | | | | |
| | (c) | | | Illiquid security. At September 30, 2011, the value of these securities amounted to $129,155,558 or 1.3% of net assets. | |
See accompanying notes to financial statements.
| 30
Portfolio of Investments – as of September 30, 2011
Loomis Sayles Investment Grade Bond Fund – (continued)
| | | | | | |
| | | | | | |
| | (d) | | | Coupon rate is a fixed rate for an initial period then resets at a specified date and rate. |
| | | | | | |
| | 144A | | | All or a portion of these securities are exempt from registration under Rule 144A of the Securities Act of 1933. These securities may be resold in transactions exempt from registration, normally to qualified institutional buyers. At September 30, 2011, the value of Rule 144A holdings amounted to $1,579,442,345 or 16.1% of net assets. |
| | | | | | |
| | ABS | | | Asset-Backed Securities | | |
| | AGMC | | | Assured Guaranty Municipal Corp. | | |
| | AMBAC | | | American Municipal Bond Assurance Corp. | | |
| | EMTN | | | Euro Medium Term Note | | |
| | FHLMC | | | Federal Home Loan Mortgage Corp. | | |
| | FNMA | | | Federal National Mortgage Association | | |
| | GMTN | | | Global Medium Term Note | | |
| | MBIA | | | Municipal Bond Investors Assurance Corp. | | |
| | MTN | | | Medium Term Note | | |
| | REITs | | | Real Estate Investment Trusts | | |
| | REMIC | | | Real Estate Mortgage Investment Conduit | | |
| | | | | | |
| | AUD | | | Australian Dollar | | |
| | BRL | | | Brazilian Real | | |
| | CAD | | | Canadian Dollar | | |
| | EUR | | | Euro | | |
| | GBP | | | British Pound | | |
| | IDR | | | Indonesian Rupiah | | |
| | ISK | | | Icelandic Krona | | |
| | KRW | | | South Korean Won | | |
| | MXN | | | Mexican Peso | | |
| | NOK | | | Norwegian Krone | | |
| | NZD | | | New Zealand Dollar | | |
| | SGD | | | Singapore Dollar | | |
Industry Summary at September 30, 2011 (Unaudited)
| | | | |
Treasuries | | | 16.4 | % |
Banking | | | 10.0 | |
Technology | | | 5.4 | |
Wirelines | | | 4.6 | |
Pipelines | | | 4.1 | |
Commercial Mortgage-Backed Securities | | | 3.9 | |
Non-Captive Diversified | | | 3.6 | |
Electric | | | 3.1 | |
Airlines | | | 2.9 | |
Local Authorities | | | 2.8 | |
Other Investments, less than 2% each | | | 36.4 | |
Short-Term Investments | | | 5.4 | |
| | | | |
Total Investments | | | 98.6 | |
Other assets less liabilities | | | 1.4 | |
| | | | |
Net Assets | | | 100.0 | % |
| | | | |
See accompanying notes to financial statements.
31 |
Portfolio of Investments – as of September 30, 2011
Loomis Sayles Investment Grade Bond Fund – (continued)
Currency Exposure at September 30, 2011 (Unaudited)
| | | | |
United States Dollar | | | 72.8 | % |
Canadian Dollar | | | 9.3 | |
New Zealand Dollar | | | 4.3 | |
Norwegian Krone | | | 3.4 | |
Euro | | | 3.1 | |
Australian Dollar | | | 2.8 | |
Other, less than 2% each | | | 2.9 | |
| | | | |
Total Investments | | | 98.6 | |
Other assets less liabilities | | | 1.4 | |
| | | | |
Net Assets | | | 100.0 | % |
| | | | |
See accompanying notes to financial statements.
| 32
Statement of Assets and Liabilities
September 30, 2011
| | | | |
ASSETS | | | | |
Investments at cost | | $ | 8,868,463,621 | |
Net unrealized appreciation | | | 805,268,455 | |
| | | | |
Investments at value | | | 9,673,732,076 | |
Cash | | | 2,670,525 | |
Foreign currency at value (identified cost $8,153,029) | | | 8,036,795 | |
Receivable for Fund shares sold | | | 36,463,685 | |
Interest receivable | | | 138,822,956 | |
Tax reclaims receivable | | | 120,854 | |
| | | | |
TOTAL ASSETS | | | 9,859,846,891 | |
| | | | |
LIABILITIES | | | | |
Payable for securities purchased | | | 14,656,840 | |
Payable for Fund shares redeemed | | | 32,320,790 | |
Foreign taxes payable (Note 2) | | | 71,911 | |
Management fees payable (Note 5) | | | 3,198,147 | |
Deferred Trustees’ fees (Note 5) | | | 320,123 | |
Administrative fees payable (Note 5) | | | 375,654 | |
Other accounts payable and accrued expenses | | | 890,651 | |
| | | | |
TOTAL LIABILITIES | | | 51,834,116 | |
| | | | |
NET ASSETS | | $ | 9,808,012,775 | |
| | | | |
NET ASSETS CONSIST OF: | | | | |
Paid-in capital | | $ | 8,863,506,627 | |
Undistributed net investment income | | | 75,922,048 | |
Accumulated net realized gain on investments and foreign currency transactions | | | 66,340,249 | |
Net unrealized appreciation on investments and foreign currency translations | | | 802,243,851 | |
| | | | |
NET ASSETS | | $ | 9,808,012,775 | |
| | | | |
See accompanying notes to financial statements.
33 |
Statement of Assets and Liabilities (continued)
September 30, 2011
| | | | |
COMPUTATION OF NET ASSET VALUE AND OFFERING PRICE: | | | | |
Class A shares: | | | | |
Net assets | | $ | 2,705,809,816 | |
| | | | |
Shares of beneficial interest | | | 223,167,736 | |
| | | | |
Net asset value and redemption price per share | | $ | 12.12 | |
| | | | |
Offering price per share (100/95.50 of net asset value) (Note 1) | | $ | 12.69 | |
| | | | |
Class B shares: (redemption price per share is equal to net asset value less any applicable contingent deferred sales charge) (Note 1) | | | | |
Net assets | | $ | 13,548,559 | |
| | | | |
Shares of beneficial interest | | | 1,123,003 | |
| | | | |
Net asset value and offering price per share | | $ | 12.06 | |
| | | | |
Class C shares: (redemption price per share is equal to net asset value less any applicable contingent deferred sales charge) (Note 1) | | | | |
Net assets | | $ | 2,091,833,547 | |
| | | | |
Shares of beneficial interest | | | 173,874,025 | |
| | | | |
Net asset value and offering price per share | | $ | 12.03 | |
| | | | |
Class Y shares: | | | | |
Net assets | | $ | 4,887,741,708 | |
| | | | |
Shares of beneficial interest | | | 402,860,674 | |
| | | | |
Net asset value, offering and redemption price per share | | $ | 12.13 | |
| | | | |
Admin Class shares: | | | | |
Net assets | | $ | 5,966,944 | |
| | | | |
Shares of beneficial interest | | | 492,782 | |
| | | | |
Net asset value, offering and redemption price per share | | $ | 12.11 | |
| | | | |
Class J shares: | | | | |
Net assets | | $ | 103,112,201 | |
| | | | |
Shares of beneficial interest | | | 8,514,614 | |
| | | | |
Net asset value and redemption price per share | | $ | 12.11 | |
| | | | |
Offering price per share (100/96.50 of net asset value) (Note 1) | | $ | 12.55 | |
| | | | |
See accompanying notes to financial statements.
| 34
Statement of Operations
For the Year Ended September 30, 2011
| | | | |
INVESTMENT INCOME | | | | |
Interest | | $ | 516,720,623 | |
| | | | |
Expenses | | | | |
Management fees (Note 5) | | | 38,461,268 | |
Service and distribution fees (Note 5) | | | 30,895,307 | |
Administrative fees (Note 5) | | | 4,468,537 | |
Trustees’ fees and expenses (Note 5) | | | 202,431 | |
Transfer agent fees and expenses (Notes 5 and 6) | | | 9,173,523 | |
Audit and tax services fees | | | 64,822 | |
Custodian fees and expenses | | | 439,170 | |
Legal fees (Note 6) | | | 182,336 | |
Registration fees (Note 6) | | | 219,724 | |
Shareholder reporting expenses (Note 6) | | | 667,250 | |
Miscellaneous expenses | | | 293,149 | |
| | | | |
Total expenses | | | 85,067,517 | |
Less waiver and/or expense reimbursement (Note 5) | | | (26,917 | ) |
| | | | |
Net expenses | | | 85,040,600 | |
| | | | |
Net investment income | | | 431,680,023 | |
| | | | |
NET REALIZED AND UNREALIZED GAIN (LOSS) ON INVESTMENTS AND FOREIGN CURRENCY TRANSACTIONS | | | | |
Net realized gain on: | | | | |
Investments | | | 188,980,397 | |
Foreign currency transactions | | | 3,482,754 | |
Net change in unrealized appreciation (depreciation) on: | | | | |
Investments | | | (321,032,389 | ) |
Foreign currency translations | | | (4,130,224 | ) |
| | | | |
Net realized and unrealized loss on investments and foreign currency transactions | | | (132,699,462 | ) |
| | | | |
NET INCREASE IN NET ASSETS RESULTING FROM OPERATIONS | | $ | 298,980,561 | |
| | | | |
See accompanying notes to financial statements.
35 |
Statement of Changes in Net Assets
| | | | | | | | |
| | | Year Ended
September 30,
2011 | | | Year Ended
September 30,
2010 | |
FROM OPERATIONS: | | | | | | | | |
Net investment income | | $ | 431,680,023 | | | $ | 428,365,635 | |
Net realized gain on investments and foreign currency transactions | | | 192,463,151 | | | | 221,545,263 | |
Net change in unrealized appreciation (depreciation) on investments and foreign currency translations | | | (325,162,613 | ) | | | 549,147,089 | |
| | | | | | | | |
Net increase in net assets resulting from operations | | | 298,980,561 | | | | 1,199,057,987 | |
| | | | | | | | |
FROM DISTRIBUTIONS TO SHAREHOLDERS: | | | | | | | | |
Net investment income | | | | | | | | |
Class A | | | (135,092,743 | ) | | | (141,582,997 | ) |
Class B | | | (629,400 | ) | | | (676,565 | ) |
Class C | | | (94,388,368 | ) | | | (102,299,334 | ) |
Class Y | | | (221,472,525 | ) | | | (192,755,479 | ) |
Admin Class | | | (116,800 | ) | | | (9,090 | ) |
Class J | | | (5,237,024 | ) | | | (5,898,638 | ) |
Net realized capital gains | | | | | | | | |
Class A | | | (60,444,223 | ) | | | (6,651,489 | ) |
Class B | | | (338,411 | ) | | | (39,640 | ) |
Class C | | | (51,169,312 | ) | | | (5,758,632 | ) |
Class Y | | | (92,540,414 | ) | | | (8,463,329 | ) |
Admin Class | | | (26,910 | ) | | | — | |
Class J | | | (2,664,737 | ) | | | (320,597 | ) |
| | | | | | | | |
Total distributions | | | (664,120,867 | ) | | | (464,455,790 | ) |
| | | | | | | | |
NET INCREASE (DECREASE) IN NET ASSETS FROM CAPITAL SHARE TRANSACTIONS (NOTE 10) | | | (137,153,662 | ) | | | 433,617,282 | |
| | | | | | | | |
Net increase (decrease) in net assets | | | (502,293,968 | ) | | | 1,168,219,479 | |
NET ASSETS | | | | | | | | |
Beginning of the year | | | 10,310,306,743 | | | | 9,142,087,264 | |
| | | | | | | | |
End of the year | | $ | 9,808,012,775 | | | $ | 10,310,306,743 | |
| | | | | | | | |
UNDISTRIBUTED NET INVESTMENT INCOME | | $ | 75,922,048 | | | $ | 39,402,955 | |
| | | | | | | | |
See accompanying notes to financial statements.
| 36
Financial Highlights
For a share outstanding throughout each period.
| | | | | | | | | | | | | | | | | | | | | | | | | | | | |
| | | | | | Income (Loss) From Investment
Operations: | | | Less Distributions: | |
| | | Net asset
value,
beginning
of the
period | | | Net
investment
income (a) | | | Net realized
and
unrealized
gain (loss) | | | Total from
investment
operations | | | Dividends
from net
investment
income | | | Distributions
from net
realized
capital
gains | | | Total
distributions | |
INVESTMENT GRADE BOND FUND | | | | | | | | | | | | | | | | | | | | | |
Class A | | | | | | | | | | | | | | | | | | | | | | | | | | | | |
9/30/2011 | | $ | 12.56 | | | $ | 0.57 | | | $ | (0.15 | ) | | $ | 0.42 | | | $ | (0.60 | ) | | $ | (0.26 | ) | | $ | (0.86 | ) |
9/30/2010 | | | 11.64 | | | | 0.55 | | | | 0.96 | | | | 1.51 | | | | (0.56 | ) | | | (0.03 | ) | | | (0.59 | ) |
9/30/2009 | | | 10.54 | | | | 0.60 | | | | 1.22 | | | | 1.82 | | | | (0.59 | ) | | | (0.13 | ) | | | (0.72 | ) |
9/30/2008 | | | 11.73 | | | | 0.60 | | | | (1.15 | ) | | | (0.55 | ) | | | (0.64 | ) | | | — | | | | (0.64 | ) |
9/30/2007 | | | 11.35 | | | | 0.58 | | | | 0.42 | | | | 1.00 | | | | (0.62 | ) | | | — | | | | (0.62 | ) |
Class B | | | | | | | | | | | | | | | | | | | | | | | | | | | | |
9/30/2011 | | | 12.50 | | | | 0.47 | | | | (0.14 | ) | | | 0.33 | | | | (0.51 | ) | | | (0.26 | ) | | | (0.77 | ) |
9/30/2010 | | | 11.59 | | | | 0.45 | | | | 0.95 | | | | 1.40 | | | | (0.46 | ) | | | (0.03 | ) | | | (0.49 | ) |
9/30/2009 | | | 10.50 | | | | 0.51 | | | | 1.21 | | | | 1.72 | | | | (0.50 | ) | | | (0.13 | ) | | | (0.63 | ) |
9/30/2008 | | | 11.68 | | | | 0.50 | | | | (1.14 | ) | | | (0.64 | ) | | | (0.54 | ) | | | — | | | | (0.54 | ) |
9/30/2007 | | | 11.31 | | | | 0.47 | | | | 0.43 | | | | 0.90 | | | | (0.53 | ) | | | — | | | | (0.53 | ) |
Class C | | | | | | | | | | | | | | | | | | | | | | | | | | | | |
9/30/2011 | | | 12.47 | | | | 0.47 | | | | (0.14 | ) | | | 0.33 | | | | (0.51 | ) | | | (0.26 | ) | | | (0.77 | ) |
9/30/2010 | | | 11.56 | | | | 0.46 | | | | 0.96 | | | | 1.42 | | | | (0.48 | ) | | | (0.03 | ) | | | (0.51 | ) |
9/30/2009 | | | 10.47 | | | | 0.52 | | | | 1.22 | | | | 1.74 | | | | (0.52 | ) | | | (0.13 | ) | | | (0.65 | ) |
9/30/2008 | | | 11.66 | | | | 0.51 | | | | (1.15 | ) | | | (0.64 | ) | | | (0.55 | ) | | | — | | | | (0.55 | ) |
9/30/2007 | | | 11.30 | | | | 0.49 | | | | 0.42 | | | | 0.91 | | | | (0.55 | ) | | | — | | | | (0.55 | ) |
Class Y | | | | | | | | | | | | | | | | | | | | | | | | | | | | |
9/30/2011 | | | 12.56 | | | | 0.60 | | | | (0.14 | ) | | | 0.46 | | | | (0.63 | ) | | | (0.26 | ) | | | (0.89 | ) |
9/30/2010 | | | 11.65 | | | | 0.58 | | | | 0.95 | | | | 1.53 | | | | (0.59 | ) | | | (0.03 | ) | | | (0.62 | ) |
9/30/2009 | | | 10.55 | | | | 0.62 | | | | 1.23 | | | | 1.85 | | | | (0.62 | ) | | | (0.13 | ) | | | (0.75 | ) |
9/30/2008 | | | 11.73 | | | | 0.64 | | | | (1.15 | ) | | | (0.51 | ) | | | (0.67 | ) | | | — | | | | (0.67 | ) |
9/30/2007 | | | 11.36 | | | | 0.61 | | | | 0.41 | | | | 1.02 | | | | (0.65 | ) | | | — | | | | (0.65 | ) |
Admin Class | | | | | | | | | | | | | | | | | | | | | | | | | |
9/30/2011 | | | 12.55 | | | | 0.54 | | | | (0.15 | ) | | | 0.39 | | | | (0.57 | ) | | | (0.26 | ) | | | (0.83 | ) |
9/30/2010* | | | 11.80 | | | | 0.33 | | | | 0.73 | | | | 1.06 | | | | (0.31 | ) | | | — | | | | (0.31 | ) |
Class J | | | | | | | | | | | | | | | | | | | | | | | | | | | | |
9/30/2011 | | | 12.54 | | | | 0.50 | | | | (0.13 | ) | | | 0.37 | | | | (0.54 | ) | | | (0.26 | ) | | | (0.80 | ) |
9/30/2010 | | | 11.63 | | | | 0.49 | | | | 0.95 | | | | 1.44 | | | | (0.50 | ) | | | (0.03 | ) | | | (0.53 | ) |
9/30/2009 | | | 10.53 | | | | 0.55 | | | | 1.22 | | | | 1.77 | | | | (0.54 | ) | | | (0.13 | ) | | | (0.67 | ) |
9/30/2008 | | | 11.71 | | | | 0.54 | | | | (1.14 | ) | | | (0.60 | ) | | | (0.58 | ) | | | — | | | | (0.58 | ) |
9/30/2007 | | | 11.34 | | | | 0.52 | | | | 0.42 | | | | 0.94 | | | | (0.57 | ) | | | — | | | | (0.57 | ) |
| * | From commencement of Class operations on February 1, 2010 through September 30, 2010. |
| (a) | Per share net investment income has been calculated using the average shares outstanding during the period. |
| (b) | Had certain expenses not been waived/reimbursed during the period, if applicable, total returns would have been lower. |
| (c) | A sales charge for Class A and Class J shares and a contingent deferred sales charge for Class B and Class C shares are not reflected in total return calculations. Periods less than one year, if applicable, are not annualized. |
See accompanying notes to financial statements.
37 |
| | | | | | | | | | | | | | | | | | | | | | | | | | |
| | | | | | | | | |
Ratios to Average Net Assets: | | | | |
Net asset
value,
end of
the period | | | Total
return
(%) (b)(c) | | | Net assets,
end of the
period
(000’s) | | | Net
expenses
(%) (d)(e) | | | Gross
expenses
(%) (e) | | | Net investment
income
(%) (e) | | | Portfolio
turnover
rate (%) | |
| | | | | | | | | | | | | | | | | | | | | | | | | | |
| | | | | | | | | | | | | | | | | | | | | | | | | | |
| $ | 12.12 | | | | 3.47 | | | $ | 2,705,810 | | | | 0.81 | | | | 0.81 | | | | 4.56 | | | | 19 | |
| | 12.56 | | | | 13.41 | | | | 3,092,956 | | | | 0.81 | | | | 0.81 | | | | 4.58 | | | | 25 | |
| | 11.64 | | | | 18.64 | | | | 2,946,489 | | | | 0.80 | | | | 0.80 | | | | 5.87 | | | | 30 | |
| | 10.54 | | | | (5.12 | ) | | | 1,867,335 | | | | 0.80 | | | | 0.80 | | | | 5.20 | | | | 35 | |
| | 11.73 | | | | 9.14 | | | | 834,736 | | | | 0.83 | | | | 0.83 | | | | 5.05 | | | | 35 | |
| | | | | | | | | | | | | | | | | | | | | | | | | | |
| | 12.06 | | | | 2.70 | | | | 13,549 | | | | 1.56 | | | | 1.56 | | | | 3.81 | | | | 19 | |
| | 12.50 | | | | 12.43 | | | | 17,113 | | | | 1.65 | | | | 1.65 | | | | 3.74 | | | | 25 | |
| | 11.59 | | | | 17.59 | | | | 17,489 | | | | 1.67 | | | | 1.67 | | | | 5.07 | | | | 30 | |
| | 10.50 | | | | (5.88 | ) | | | 16,009 | | | | 1.65 | (f) | | | 1.65 | (f) | | | 4.29 | | | | 35 | |
| | 11.68 | | | | 8.17 | | | | 17,082 | | | | 1.70 | | | | 1.71 | | | | 4.16 | | | | 35 | |
| | | | | | | | | | | | | | | | | | | | | | | | | | |
| | 12.03 | | | | 2.71 | | | | 2,091,834 | | | | 1.56 | | | | 1.56 | | | | 3.81 | | | | 19 | |
| | 12.47 | | | | 12.58 | | | | 2,593,324 | | | | 1.56 | | | | 1.56 | | | | 3.83 | | | | 25 | |
| | 11.56 | | | | 17.80 | | | | 2,495,305 | | | | 1.56 | | | | 1.56 | | | | 5.09 | | | | 30 | |
| | 10.47 | | | | (5.84 | ) | | | 1,333,421 | | | | 1.55 | | | | 1.55 | | | | 4.45 | | | | 35 | |
| | 11.66 | | | | 8.28 | | | | 605,934 | | | | 1.57 | | | | 1.57 | | | | 4.30 | | | | 35 | |
| | | | | | | | | | | | | | | | | | | | | | | | | | |
| | 12.13 | | | | 3.81 | | | | 4,887,742 | | | | 0.56 | | | | 0.56 | | | | 4.81 | | | | 19 | |
| | 12.56 | | | | 13.60 | | | | 4,473,001 | | | | 0.56 | | | | 0.56 | | | | 4.82 | | | | 25 | |
| | 11.65 | | | | 18.94 | | | | 3,531,187 | | | | 0.54 | | | | 0.54 | | | | 6.01 | | | | 30 | |
| | 10.55 | | | | (4.79 | ) | | | 1,044,046 | | | | 0.53 | | | | 0.53 | | | | 5.48 | | | | 35 | |
| | 11.73 | | | | 9.32 | | | | 448,873 | | | | 0.55 | (f) | | | 0.55 | (f) | | | 5.33 | | | | 35 | |
| | | | | | | | | | | | | | | | | | | | | | | | | | |
| | 12.11 | | | | 3.26 | | | | 5,967 | | | | 1.07 | | | | 1.07 | | | | 4.32 | | | | 19 | |
| | 12.55 | | | | 9.13 | | | | 879 | | | | 1.08 | | | | 7.68 | | | | 4.06 | | | | 25 | |
| | | | | | | | | | | | | | | | | | | | | | | | | | |
| | 12.11 | | | | 3.05 | | | | 103,112 | | | | 1.30 | | | | 1.32 | | | | 4.07 | | | | 19 | |
| | 12.54 | | | | 12.77 | | | | 133,034 | | | | 1.30 | (g) | | | 1.30 | (g) | | | 4.09 | | | | 25 | |
| | 11.63 | | | | 18.05 | | | | 151,617 | | | | 1.30 | | | | 1.31 | | | | 5.48 | | | | 30 | |
| | 10.53 | | | | (5.50 | ) | | | 167,775 | | | | 1.28 | | | | 1.28 | | | | 4.66 | | | | 35 | |
| | 11.71 | | | | 8.52 | | | | 180,453 | | | | 1.28 | | | | 1.28 | | | | 4.57 | | | | 35 | |
| (d) | The investment adviser and/or administrator agreed to waive its fees and/or reimburse a portion of the Fund’s expenses during the period. Without this waiver/reimbursement, if applicable, expenses would have been higher. |
| (e) | Computed on an annualized basis for periods less than one year, if applicable. |
| (f) | Includes fee/expense recovery of less than 0.01%. |
| (g) | Includes fee/expense recovery of 0.01%. |
See accompanying notes to financial statements.
| 38
Notes to Financial Statements
September 30, 2011
1. Organization. Loomis Sayles Funds II (the “Trust”) is organized as a Massachusetts business trust. The Trust is registered under the Investment Company Act of 1940, as amended (the “1940 Act”), as an open-end management investment company. The Declaration of Trust permits the Board of Trustees to authorize the issuance of an unlimited number of shares of the Trust in multiple series. The financial statements for certain funds of the Trust are presented in separate reports. Information presented in these financial statements pertains to Loomis Sayles Investment Grade Bond Fund (the “Fund”).
The Fund is a diversified investment company.
The Fund offers Class A, Class C, Class Y, and Admin Class shares. Effective October 17, 2011, Class J shares are no longer offered. Effective October 12, 2007, Class B shares are no longer offered. Existing Class B shareholders may continue to reinvest dividends into Class B shares and exchange their Class B shares for Class B shares of other Natixis Funds subject to existing exchange privileges as described in the prospectus.
Class A shares are sold with a maximum front-end sales charge of 4.50%. Class B shares do not pay a front-end sales charge; however, they are charged higher Rule 12b-1 fees, and are subject to a contingent deferred sales charge (“CDSC”) if such shares are redeemed within six years of purchase. After eight years of ownership, Class B shares convert to Class A shares. Class C shares do not pay a front-end sales charge, do not convert to any other class of shares, pay higher Rule 12b-1 fees than Class A shares and may be subject to a CDSC of 1.00% if those shares are redeemed within one year of acquisition, except for reinvested distributions. Class Y shares do not pay a front-end sales charge, a CDSC or Rule 12b-1 fees. Class Y shares are generally intended for institutional investors with a minimum initial investment of $100,000, though some categories of investors are exempted from the minimum investment amount as outlined in the Fund’s prospectus. Admin Class shares do not pay a front-end sales charge or a CDSC, but do pay a Rule 12b-1 fee. Admin Class shares are offered exclusively through intermediaries. Class J shares were only offered to non-U.S. investors and were sold with a maximum front-end sales charge of 3.50%.
Most expenses of the Trust can be directly attributed to a Fund. Expenses which can not be directly attributed to a Fund are generally apportioned based on the relative net assets of each of the Funds in the Trust. Expenses of the Fund are borne pro rata by the holders of each class of shares, except that each class bears expenses unique to that class (Rule 12b-1 service and distribution fees for Class A, Class B, Class C, Admin Class and Class J, and registration, legal, shareholder reporting and transfer agent fees for Class J). In addition, each class votes as a class only with respect to its own Rule 12b-1 Plan. Shares of each class would receive their pro rata share of the net assets of the Fund if the Fund were liquidated. The Trustees approve separate distributions from net investment income on each class of shares.
39 |
Notes to Financial Statements (continued)
September 30, 2011
2. Significant Accounting Policies. The following is a summary of significant accounting policies consistently followed by the Fund in the preparation of its financial statements. The Fund’s financial statements are prepared in accordance with accounting principles generally accepted in the United States of America which require the use of management estimates that affect the reported amounts and disclosures in the financial statements. Actual results could differ from those estimates. Management has evaluated the events and transactions subsequent to year-end through the date the financial statements were issued and has determined that there were no material events that would require disclosure in the Fund’s financial statements except as disclosed in Note 12.
a. Valuation. Debt securities (other than short-term obligations purchased with an original or remaining maturity of sixty days or less) are generally valued on the basis of evaluated bids furnished to the Fund by a pricing service recommended by the investment adviser and approved by the Board of Trustees, which service determines valuations for normal, institutional-size trading units of such securities using market information, transactions for comparable securities and various relationships between securities which are generally recognized by institutional traders. Senior loans shall be priced at bid prices supplied by a pricing service, if available. Broker-dealer bid quotations may also be used to value debt and equity securities where a pricing service does not price a security or where a pricing service does not provide a reliable price for the security. In instances where broker-dealer bid quotations are not available, certain securities held by the Fund may be valued on the basis of a price provided by a principal market maker. Forward foreign currency contracts are valued utilizing interpolated prices determined from information provided by an independent pricing service. Investments in other open-end investment companies are valued at their net asset value each day. Short-term obligations purchased with an original or remaining maturity of sixty days or less are valued at amortized cost, which approximates market value. Securities for which market quotations are not readily available are valued at fair value as determined in good faith by the Fund’s investment adviser using consistently applied procedures under the general supervision of the Board of Trustees.
The Fund may hold securities traded in foreign markets. Foreign securities are valued at the market price in the foreign market. However, if events occurring after the close of the foreign market (but before the close of regular trading on the New York Stock Exchange) are believed to materially affect the value of those securities, such securities are fair valued pursuant to procedures approved by the Board of Trustees. When fair valuing securities, the Fund may, among other things, use modeling tools or other processes that may take into account factors such as securities market activity and/or significant events that occur after the close of the foreign market and before the Fund calculates its net asset value.
b. Investment Transactions and Related Investment Income. Investment transactions are accounted for on a trade date plus one basis for daily net asset value calculation.
| 40
Notes to Financial Statements (continued)
September 30, 2011
However, for financial reporting purposes, investment transactions are reported on trade date. Interest income is recorded on an accrual basis. Interest income is increased by the accretion of discount and decreased by the amortization of premium. Investment income is recorded net of foreign taxes withheld when applicable. In determining net gain or loss on securities sold, the cost of securities has been determined on an identified cost basis. Investment income, non-class specific expenses and realized and unrealized gains and losses are allocated on a pro rata basis to each class based on the relative net assets of each class to the total net assets of the Fund.
c. Foreign Currency Translation. The books and records of the Fund are maintained in U.S. dollars. The values of securities, currencies and other assets and liabilities denominated in currencies other than U.S. dollars are translated into U.S. dollars based upon foreign exchange rates prevailing at the end of the period. Purchases and sales of investment securities, income and expenses are translated on the respective dates of such transactions.
Since the values of investment securities are presented at the foreign exchange rates prevailing at the end of the period, it is not practical to isolate that portion of the results of operations arising from changes in exchange rates from fluctuations which arise due to changes in market prices of investment securities. Such changes are included with the net realized and unrealized gain or loss on investments.
Net realized foreign exchange gains or losses arise from sales of foreign currency, currency gains or losses realized between the trade and settlement dates on securities transactions and the difference between the amounts of interest and foreign withholding taxes recorded on the Fund’s books and the U.S. dollar equivalent of the amounts actually received or paid. Net unrealized foreign exchange gains and losses arise from changes in the value of assets and liabilities, other than investment securities, at the end of the fiscal period, resulting from changes in exchange rates.
The Fund may use foreign currency exchange contracts to facilitate transactions in foreign-denominated investments. Losses may arise from changes in the value of the foreign currency or if the counterparties do not perform under the contracts’ terms.
d. Forward Foreign Currency Contracts. The Fund may enter into forward foreign currency contracts, including forward foreign cross currency contracts. Contracts to buy generally are used to acquire exposure to foreign currencies, while contracts to sell generally are used to hedge the Fund’s investments against currency fluctuation. Also, a contract to buy or sell can offset a previous contract. These contracts involve market risk in excess of the unrealized gain or loss reflected in the Fund’s Statement of Assets and Liabilities. The U.S. dollar value of the currencies the Fund has committed to buy or sell represents the aggregate exposure to each currency the Fund has acquired or hedged through currency contracts outstanding at period end. Gains or losses are recorded for financial statement purposes as unrealized until settlement date. Risks
41 |
Notes to Financial Statements (continued)
September 30, 2011
may arise upon entering into these contracts from the potential inability of counterparties to meet the terms of their contracts and from unanticipated movements in the value of a foreign currency relative to the U.S. dollar. Certain contracts may require the movement of cash and/or securities as collateral for the Fund’s or counterparty’s net obligations under the contracts.
There were no forward foreign currency contracts held by the Fund during the year ended September 30, 2011.
e. Federal and Foreign Income Taxes. The Trust treats each Fund as a separate entity for federal income tax purposes. The Fund intends to meet the requirements of the Internal Revenue Code of 1986, as amended, applicable to regulated investment companies, and to distribute to its shareholders substantially all of its net investment income and any net realized capital gains at least annually. Management has performed an analysis of the Fund’s tax positions for the open tax years as of September 30, 2011 and has concluded that no provisions for income tax are required. The Fund’s federal tax returns for the prior three fiscal years remain subject to examination by the Internal Revenue Service. Management is not aware of any events that are reasonably possible to occur in the next twelve months that would result in the amounts of any unrecognized tax benefits significantly increasing or decreasing for the Fund. However, management’s conclusions regarding tax positions taken may be subject to review and adjustment at a later date based on factors including, but not limited to, new tax laws and accounting regulations and interpretations thereof.
The Fund may be subject to foreign taxes on income and gains on investments that are accrued based upon the Fund’s understanding of the tax rules and regulations that exist in the countries in which the Fund invests. Foreign governments may also impose taxes or other payments on investments with respect to foreign securities. Such taxes are accrued as applicable, and are reflected as foreign taxes payable on the Statement of Assets and Liabilities.
f. Dividends and Distributions to Shareholders. Dividends and distributions are recorded on ex-dividend date. The timing and characterization of certain income and capital gain distributions are determined annually in accordance with federal tax regulations, which may differ from accounting principles generally accepted in the United States of America. Permanent differences are primarily due to differing treatments for book and tax purposes of items such as reversal of redemption in-kind gain/loss, deferred compensation, capital gains tax paid in connection with redemption in-kind, foreign currency transactions, paydown adjustments and premium amortization. Permanent book and tax basis differences relating to shareholder distributions will result in reclassifications to capital accounts. Temporary differences between book and tax distributable earnings are primarily due to premium amortization, deferred Trustees’ fees, defaulted bond accruals, securities lending collateral gain/loss adjustments, contingent payment debt instruments and wash sales. Distributions from net investment
| 42
Notes to Financial Statements (continued)
September 30, 2011
income and short-term capital gains are considered to be distributed from ordinary income for tax purposes.
The tax characterization of distributions is determined on an annual basis. The tax character of distributions paid to shareholders during the years ended September 30, 2011 and 2010 were as follows:
| | | | | | | | | | | | | | | | | | | | |
2011 Distributions Paid From: | | | 2010 Distributions Paid From: | |
Ordinary
Income | | Long-Term
Capital
Gains | | | Total | | | Ordinary
Income | | | Long-Term
Capital
Gains | | | Total | |
| $554,809,060 | | $ | 109,311,807 | | | $ | 664,120,867 | | | $ | 464,455,790 | | | $ | — | | | $ | 464,455,790 | |
Differences between these amounts and those reported in the Statement of Changes in Net Assets are primarily attributable to different book and tax treatment for short-term capital gains.
As of September 30, 2011, the components of distributable earnings on a tax basis were as follows:
| | | | |
Undistributed ordinary income | | $ | 115,880,121 | |
Undistributed long-term capital gains | | | 69,409,924 | |
| | | | |
Total undistributed earnings | | | 185,290,045 | |
Unrealized appreciation | | | 759,588,648 | |
| | | | |
Total accumulated earnings | | $ | 944,878,693 | |
| | | | |
On December 22, 2010, the Regulated Investment Company Modernization Act of 2010 (the “Act”) was enacted. The Act modernizes several of the federal income and excise tax provisions related to RICs, and, with certain exceptions, is effective for taxable years beginning after December 22, 2010. Among the changes made are changes to the capital loss carryforward rules allowing for capital losses to be carried forward indefinitely. Rules in effect as of the report date limit the carryforward period to eight years. Capital loss carryforwards generated in taxable years beginning after the effective date of the Act must be fully used before capital loss carryforwards generated in taxable years prior to effective date of the Act; therefore, under certain circumstances, capital loss carryforwards available as of the report date, if any, may expire unused.
g. Repurchase Agreements. It is the Fund’s policy that the market value of the collateral for repurchase agreements be at least equal to 102% of the repurchase price, including interest. Certain repurchase agreements are tri-party arrangements whereby the collateral is held in a segregated account for the benefit of the Fund and on behalf of the counterparty. Repurchase agreements could involve certain risks in the event of default or insolvency of the counterparty including possible delays or restrictions upon the Fund’s ability to dispose of the underlying securities.
43 |
Notes to Financial Statements (continued)
September 30, 2011
h. Securities Lending. The Fund has entered into an agreement with State Street Bank and Trust Company (“State Street Bank”), as agent of the Fund, to lend securities to certain designated borrowers. The loans are collateralized with cash or securities in an amount equal to at least 105% or 102% of the market value (including accrued interest) of the loaned international or domestic securities, respectively, when the loan is initiated. Thereafter, the value of the collateral must remain at least 102% of the market value (including accrued interest) of loaned securities for U.S. equities and U.S. corporate debt; at least 105% of the market value (including accrued interest) of loaned securities for non-U.S. equities; and at least 100% of the market value (including accrued interest) of loaned securities for U.S. Government securities, sovereign debt issued by non-U.S. Governments and non-U.S. corporate debt. In the event that the market value of the collateral falls below the required percentages described above, the borrower will deliver additional collateral on the next business day. As with other extensions of credit, the Fund may bear the risk of loss with respect to the investment of the collateral. The Fund invests cash collateral in short-term investments, a portion of the income from which is remitted to the borrowers and the remainder allocated between the Fund and State Street Bank as lending agent.
For the year ended September 30, 2011, the Fund did not loan securities under this agreement.
i. Indemnifications. Under the Trust’s organizational documents, its officers and Trustees are indemnified against certain liabilities arising out of the performance of their duties to the Fund. Additionally, in the normal course of business, the Fund enters into contracts with service providers that contain general indemnification clauses. The Fund’s maximum exposure under these arrangements is unknown as this would involve future claims that may be made against the Fund that have not yet occurred. However, based on experience, the Fund expects the risk of loss to be remote.
3. Fair Value Measurements. In accordance with accounting standards related to fair value measurements and disclosures, the Fund has categorized the inputs utilized in determining the value of the Fund’s assets or liabilities. These inputs are summarized in the three broad levels listed below:
| | • | | Level 1 – quoted prices in active markets for identical assets or liabilities; |
| | • | | Level 2 – prices determined using other significant inputs that are observable either directly, or indirectly through corroboration with observable market data (which could include quoted prices for similar assets or liabilities, interest rates, credit risk, etc.); |
| | • | | Level 3 – prices determined using significant unobservable inputs when quoted prices or observable inputs are unavailable such as when there is little or no market activity for an asset or liability (unobservable inputs reflect the Fund’s own assumptions in determining the fair value of assets or liabilities and would be based on the best information available). |
| 44
Notes to Financial Statements (continued)
September 30, 2011
The inputs or methodology used for valuing securities are not necessarily an indication of the risk associated with investing in those securities.
The following is a summary of the inputs used to value the Fund’s investments as of September 30, 2011, at value:
Asset Valuation Inputs
| | | | | | | | | | | | | | | | |
Description | | Level 1 | | | Level 2 | | | Level 3 | | | Total | |
Bonds and Notes | | | | | | | | | | | | | | | | |
Non-Convertible Bonds | | | | | | | | | | | | | | | | |
ABS Car Loan | | $ | — | | | $ | 77,292,636 | | | $ | 5,230,461 | | | $ | 82,523,097 | |
Non-Captive Consumer | | | 1,257,084 | | | | 153,902,067 | | | | — | | | | 155,159,151 | |
Treasuries | | | — | | | | 1,609,667,366 | | | | 538,615 | | | | 1,610,205,981 | |
All Other Non-Convertible Bonds(a) | | | — | | | | 6,867,605,082 | | | | — | | | | 6,867,605,082 | |
| | | | | | | | | | | | | | | | |
Total Non-Convertible Bonds | | | 1,257,084 | | | | 8,708,467,151 | | | | 5,769,076 | | | | 8,715,493,311 | |
| | | | | | | | | | | | | | | | |
Convertible Bonds(a) | | | — | | | | 339,843,922 | | | | — | | | | 339,843,922 | |
Municipals(a) | | | — | | | | 69,703,250 | | | | — | | | | 69,703,250 | |
| | | | | | | | | | | | | | | | |
Total Bonds and Notes | | | 1,257,084 | | | | 9,118,014,323 | | | | 5,769,076 | | | | 9,125,040,483 | |
| | | | | | | | | | | | | | | | |
Senior Loans(a) | | | — | | | | 16,228,800 | | | | — | �� | | | 16,228,800 | |
Short-Term Investments | | | — | | | | 532,462,793 | | | | — | | | | 532,462,793 | |
| | | | | | | | | | | | | | | | |
Total | | $ | 1,257,084 | | | $ | 9,666,705,916 | | | $ | 5,769,076 | | | $ | 9,673,732,076 | |
| | | | | | | | | | | | | | | | |
| (a) | Details of the major categories of the Fund’s investments are reflected within the Portfolio of Investments. |
45 |
Notes to Financial Statements (continued)
September 30, 2011
The following is a reconciliation of Level 3 investments for which significant unobservable inputs were used to determine fair value as of September 30, 2011:
Asset Valuation Inputs
| | | | | | | | | | | | | | | | | | | | | | | | |
Investments in
Securities | | Balance as of September 30, 2010 | | | Accrued Discounts (Premiums) | | | Realized Gain (Loss) | | | Change in Unrealized Appreciation (Depreciation) | | | Purchases | | | Sales | |
Bonds and Notes | | | | | | | | | | | | | | | | | | | | | |
Non-Convertible
Bonds | | | | | | | | | | | | | | | | | | | | | |
ABS Car Loan | | $ | 24,880,941 | | | $ | — | | | $ | 3,254 | | | $ | (96,373 | ) | | $ | — | | | $ | (119,126 | ) |
Banking | | | 9,716,202 | | | | — | | | | — | | | | — | | | | — | | | | — | |
Treasuries | | | — | | | | 35,602 | | | | (1,783 | ) | | | (421,513 | ) | | | 944,523 | | | | (18,214 | ) |
| | | | | | | | | | | | | | | | | | | | | | | | |
Total | | $ | 34,597,143 | | | $ | 35,602 | | | $ | 1,471 | | | $ | (517,886 | ) | | $ | 944,523 | | | $ | (137,340 | ) |
| | | | | | | | | | | | | | | | | | | | | | | | |
| | | | | | | | | | | | | | | | |
Investments in
Securities | | Transfers into Level 3 | | | Transfers out of Level 3 | | | Balance as of September 30, 2011 | | | Change in Unrealized Appreciation (Depreciation) from Investments Still Held at September 30, 2011 | |
Bonds and Notes | | | | | | | | | | | | | | | | |
Non-Convertible Bonds | | | | | | | | | | | | | | | | |
ABS Car Loan | | $ | — | | | $ | (19,438,235 | ) | | $ | 5,230,461 | | | $ | (96,586 | ) |
Banking | | | — | | | | (9,716,202 | ) | | | — | | | | — | |
Treasuries | | | — | | | | — | | | | 538,615 | | | | (421,513 | ) |
| | | | | | | | | | | | | | | | |
Total | | $ | — | | | $ | (29,154,437 | ) | | $ | 5,769,076 | | | $ | (518,099 | ) |
| | | | | | | | | | | | | | | | |
Debt securities valued at $29,154,437 were transferred from Level 3 to Level 2 during the period ended September 30, 2011. At September 30, 2010, these securities were valued using broker-dealer bid quotations based on inputs unobservable to the Fund; at September 30, 2011, these securities were valued on the basis of evaluated bids furnished to the Fund by a pricing service.
All transfers are recognized as of the beginning of the reporting period.
4. Purchases and Sales of Securities. For the year ended September 30, 2011, purchases and sales of securities (excluding short-term investments and
| 46
Notes to Financial Statements (continued)
September 30, 2011
U.S. Government/Agency securities and including paydowns) were $1,355,285,895 and $1,911,854,117, respectively. Purchases and sales of U.S. Government/Agency securities (excluding short-term investments and including paydowns) were $433,278,994 and $716,642,354, respectively.
5. Management Fees and Other Transactions with Affiliates.
a. Management Fees. Loomis, Sayles & Company, L.P. (“Loomis Sayles”) serves as investment adviser to the Fund. Under the terms of the management agreement, the Fund pays a management fee at the annual rate of 0.40% of average daily net assets, calculated daily and payable monthly.
Loomis Sayles has given a binding undertaking to the Fund to waive management fees and/or reimburse certain expenses to limit the Fund’s operating expenses, exclusive of acquired fund fees and expenses, brokerage expenses, interest expense, taxes and extraordinary expenses. This undertaking is in effect until January 31, 2012 and is reevaluated on an annual basis. Management fees payable, as reflected on the Statement of Assets and Liabilities, is net of waivers and/or expense reimbursements, if any, pursuant to these undertakings.
For the year ended September 30, 2011, the expense limits as a percentage of average daily net assets under the expense limitation agreement were as follows:
| | | | | | | | | | | | | | | | | | | | |
Expense Limit as a Percentage of Average Daily Net Assets | |
Class A | | Class B | | | Class C | | | Class Y | | | Admin Class | | | Class J | |
| 0.95% | | | 1.70 | % | | | 1.70 | % | | | 0.70 | % | | | 1.20 | % | | | 1.30 | % |
Loomis Sayles shall be permitted to recover expenses it has borne under the expense limitation agreement (whether through waiver of its management fees or otherwise) on a class by class basis in later periods to the extent the expenses of a class fall below a class’ expense limits, provided, however, that a class is not obligated to pay such waived/reimbursed fees or expenses more than one year after the end of the fiscal year in which the fees or expenses were waived/reimbursed.
For the year ended September 30, 2011, the management fees for the Fund were $38,461,268 (0.40% of average daily net assets).
For the year ended September 30, 2011, class-specific expenses have been reimbursed as follows:
| | | | | | | | | | | | | | | | | | | | | | | | |
Reimbursement1 | |
Class A | | Class B | | | Class C | | | Class Y | | | Admin Class | | | Class J | | | Total | |
| $ — | | $ | — | | | $ | — | | | $ | — | | | $ | — | | | $ | 26,917 | | | $ | 26,917 | |
| 1 | Expense reimbursements are subject to possible recovery until September 30, 2012. |
No expenses were recovered during the year ended September 30, 2011 under the terms of the expense limitation agreement.
47 |
Notes to Financial Statements (continued)
September 30, 2011
Certain officers and employees of Loomis Sayles are also officers or Trustees of the Trust. Loomis Sayles’ general partner is indirectly owned by Natixis Global Asset Management, L.P. (“Natixis US”), which is part of Natixis Global Asset Management, an international asset management group based in Paris, France.
b. Service and Distribution Fees. Natixis Distributors, L.P. (“Natixis Distributors”), a wholly-owned subsidiary of Natixis US, has entered into a distribution agreement with the Trust. Pursuant to this agreement, Natixis Distributors serves as principal underwriter of the Funds of the Trust, except Class J shares of the Fund. The Fund has entered into a distribution agreement relating to Class J shares with Loomis Sayles Distributors, L.P. (“Loomis Sayles Distributors”), a wholly-owned subsidiary of Natixis US.
Pursuant to Rule 12b-1 under the 1940 Act, the Trust has adopted a Service Plan relating to the Fund’s Class A shares (the “Class A Plan”), a Distribution and Service Plan relating to the Fund’s Class B and Class C shares (the “Class B and Class C Plans”), and a Distribution Plan relating to its Admin Class shares (the “Admin Class Plan”).
Under the Class A Plan, the Fund pays Natixis Distributors a monthly service fee at an annual rate not to exceed 0.25% of the average daily net assets attributable to the Fund’s Class A shares, as reimbursement for expenses incurred by Natixis Distributors in providing personal services to investors in Class A shares and/or the maintenance of shareholder accounts.
Under the Class B and Class C Plans, the Fund pays Natixis Distributors a monthly service fee at an annual rate not to exceed 0.25% of the average daily net assets attributable to the Fund’s Class B and Class C shares, as compensation for services provided by Natixis Distributors in providing personal services to investors in Class B and Class C shares and/or the maintenance of shareholder accounts.
Also under the Class B and Class C Plans, the Fund pays Natixis Distributors a monthly distribution fee at an annual rate of 0.75% of the average daily net assets attributable to the Fund’s Class B and Class C shares, as compensation for services provided by Natixis Distributors in connection with the marketing or sale of Class B and Class C shares.
Under the Admin Class Plan, the Fund pays Natixis Distributors a monthly distribution fee at an annual rate not to exceed 0.25% of the average daily net assets attributable to the Fund’s Admin Class shares, as compensation for services provided by Natixis Distributors in connection with the marketing or sale of Admin Class shares or for payments made by Natixis Distributors to securities dealers or other financial intermediaries as commissions, asset-based sales charges or other compensation with respect to the sale of Admin Class shares, or for providing personal services to investors and/or the maintenance of shareholder accounts.
| 48
Notes to Financial Statements (continued)
September 30, 2011
In addition, the Admin Class shares of the Fund may pay Natixis Distributors an administrative service fee, at an annual rate not to exceed 0.25% of the average daily net assets attributable to Admin Class shares. These fees are subsequently paid to securities dealers or financial intermediaries for providing personal services and/or account maintenance for their customers who hold such shares.
Class J shares are subject to a monthly shareholder service fee at an annual rate of 0.25% and a monthly distribution fee at an annual rate of 0.50% of the average daily net assets attributable to the Fund’s Class J shares, both payable to Loomis Sayles Distributors, pursuant to a shareholder service and distribution plan adopted under Rule 12b-1.
For the year ended September 30, 2011 the Fund paid the following service and distribution fees:
| | | | | | | | | | | | | | | | |
Service Fees | |
Class A | | Class B | | | Class C | | | Admin Class | | | Class J | |
| $6,980,244 | | $ | 38,164 | | | $ | 5,712,200 | | | $ | 6,861 | | | $ | 299,961 | |
| | | | | | | | | | | | | | |
| Distribution Fees | |
Class B | | | Class C | | | Admin Class | | | Class J | |
| | $114,492 | | | $ | 17,136,601 | | | $ | 6,861 | | | $ | 599,923 | |
c. Administrative Fees. Natixis Asset Management Advisors, L.P. (“Natixis Advisors”) provides certain administrative services for the Fund and contracts with State Street Bank to serve as sub-administrator. Natixis Advisors is a wholly-owned subsidiary of Natixis US. Pursuant to an agreement among Natixis Funds Trust I, Natixis Funds Trust II, Natixis Funds Trust IV, Gateway Trust (“Natixis Funds Trusts”), Loomis Sayles Funds I, Loomis Sayles Funds II (“Loomis Sayles Funds Trusts”), Hansberger International Series and Natixis Advisors, the Fund pays Natixis Advisors monthly its pro rata portion of fees equal to an annual rate of 0.0575% of the first $15 billion of the average daily net assets of the Natixis Funds Trusts, Loomis Sayles Funds Trusts and Hansberger International Series, 0.0500% of the next $15 billion, 0.0400% of the next $30 billion and 0.0350% of such assets in excess of $60 billion, subject to an annual aggregate minimum fee for the Natixis Funds Trusts, Loomis Sayles Funds Trusts and Hansberger International Series of $10 million, which is reevaluated on an annual basis.
For the year ended September 30, 2011, the Fund paid $4,468,537 in administrative fees to Natixis Advisors.
d. Sub-Transfer Agent Fees. Natixis Distributors has entered into agreements with financial intermediaries to provide certain recordkeeping, processing, shareholder communications and other services to customers of the intermediaries and has agreed to compensate the intermediaries for providing those services. Certain services would be provided by the Fund if the shares of those customers were registered directly with
49 |
Notes to Financial Statements (continued)
September 30, 2011
the Fund’s transfer agent. Accordingly, the Fund agreed to pay a portion of the intermediary fees attributable to shares of the Fund held by the intermediaries (which generally are a percentage of the value of shares held) not to exceed what the Fund would have paid its transfer agent had each customer’s shares been registered directly with the transfer agent instead of held through the intermediaries. Natixis Distributors pays the remainder of the fees.
For the year ended September 30, 2011, the Fund paid the following sub-transfer agent fees which are reflected in transfer agent fees and expenses in the Statement of Operations.
| | | | | | | | | | | | | | | | | | | | |
Sub-Transfer Agent Fees | |
Class A | | Class B | | | Class C | | | Class Y | | | Admin Class | | | Class J | |
| $2,357,990 | | $ | 12,990 | | | $ | 1,939,815 | | | $ | 3,666,773 | | | $ | 2,038 | | | $ | — | |
e. Commissions. Commissions (including CDSCs) on Fund shares retained by Natixis Distributors were $2,754,566 and commissions on Class J shares of the Fund retained by Loomis Sayles Distributors were $44,541 for the year ended September 30, 2011.
f. Trustees Fees and Expenses. The Trust does not pay any compensation directly to its officers or Trustees who are directors, officers or employees of Natixis Advisors, Natixis Distributors, Natixis US or their affiliates. The Chairperson of the Board receives a retainer fee at the annual rate of $250,000. The Chairperson does not receive any meeting attendance fees for Board of Trustees meetings or committee meetings that she attends. Each Independent Trustee (other than the Chairperson) receives, in the aggregate, a retainer fee at the annual rate of $80,000. Each Independent Trustee also receives a meeting attendance fee of $10,000 for each meeting of the Board of Trustees that he or she attends in person and $5,000 for each meeting of the Board of Trustees that he or she attends telephonically. In addition, each committee chairman receives an additional retainer fee at an annual rate of $15,000. Each Contract Review and Governance Committee member is compensated $6,000 for each Committee meeting that he or she attends in person and $3,000 for each meeting that he or she attends telephonically. Each Audit Committee member is compensated $7,500 for each Committee meeting that he or she attends in person and $3,750 for each meeting that he or she attends telephonically. These fees are allocated among the funds in the Natixis Funds Trusts, Loomis Sayles Funds Trusts and Hansberger International Series based on a formula that takes into account, among other factors, the relative net assets of each fund. Trustees are reimbursed for travel expenses in connection with attendance at meetings.
A deferred compensation plan (the “Plan”) is available to the Trustees on a voluntary basis. Deferred amounts remain in the Fund until distributed in accordance with the provisions of the Plan. The value of a participating Trustee’s deferral account is based on theoretical investments of deferred amounts, on the normal payment dates, in
| 50
Notes to Financial Statements (continued)
September 30, 2011
certain funds of the Natixis Funds Trusts, Loomis Sayles Funds Trusts and Hansberger International Series as designated by the participating Trustees. Changes in the value of participants’ deferral accounts are allocated pro rata among the funds in the Natixis Funds Trusts, Loomis Sayles Funds Trusts, and Hansberger International Series, and are normally reflected as Trustees’ fees and expenses in the Statement of Operations. The portions of the accrued obligations allocated to the Fund under the Plan are reflected as Deferred Trustees’ fees on the Statement of Assets and Liabilities.
6. Class-Specific Expenses. For the year ended September 30, 2011, the Fund paid the following class-specific expenses:
| | | | |
| | | Class J | |
Transfer Agent Fees and Expenses | | $ | 8,796 | |
Registration Fees | | | 1,709 | |
Legal Fees | | | 30,468 | |
Shareholder Reporting Expenses | | | 98,034 | |
Transfer agent, registration, legal, and shareholder reporting fees and expenses attributable to Class A, Class B, Class C, Class Y and Admin Class are allocated on a pro rata basis to each class based on the relative net assets of each class to the total net assets of those classes.
7. Line of Credit. The Fund, together with certain other funds of Natixis Funds Trusts, Loomis Sayles Funds Trusts and Hansberger International Series, participates in a $200,000,000 committed unsecured line of credit provided by State Street Bank, with an individual limit of $125,000,000 for each fund that participates in the line of credit. Interest is charged to each participating fund based on its borrowings at a rate per annum equal to the greater of the Federal Funds rate or overnight LIBOR, plus 1.25%. In addition, a commitment fee of 0.125% per annum, payable at the end of each calendar quarter, is accrued and apportioned among the participating funds based on their average daily unused portion of the line of credit. Prior to April 21, 2011, the commitment fee was 0.15% per annum.
For the year ended September 30, 2011, the Fund had no borrowings under these agreements.
8. Concentration of Risk. The Fund’s investments in foreign securities are subject to foreign currency fluctuations, higher volatility than U.S. securities, varying degrees of regulation and limited liquidity. Greater political, economic, credit and information risks are also associated with foreign securities.
51 |
Notes to Financial Statements (continued)
September 30, 2011
9. Concentration of Ownership. At September 30, 2011, the Loomis Sayles Employees’ Profit Sharing Retirement Plan held shares of beneficial interest in the Fund representing 0.06% of net assets.
10. Capital Shares. The Fund may issue an unlimited number of shares of beneficial interest, without par value. Transactions in capital shares were as follows:
| | | | | | | | | | | | | | | | |
| |
| Year Ended
September 30, 2011 |
| |
| Year Ended
September 30, 2010* |
|
| | | | Shares | | | | Amount | | | | Shares | | | | Amount | |
| Class A | | | | | | | | | | | | | | | | |
Issued from the sale of shares | | | 69,625,794 | | | $ | 863,861,783 | | | | 91,844,109 | | | $ | 1,096,753,290 | |
Issued in connection with the reinvestment of distributions | | | 13,344,354 | | | | 163,533,181 | | | | 10,182,612 | | | | 121,128,395 | |
Redeemed | | | (106,122,504 | ) | | | (1,311,579,537 | ) | | | (108,792,537 | ) | | | (1,299,578,958 | ) |
| | | | | | | | | | | | | | | | |
Net change | | | (23,152,356 | ) | | $ | (284,184,573 | ) | | | (6,765,816 | ) | | $ | (81,697,273 | ) |
| | | | | | | | | | | | | | | | |
| Class B | | | | | | | | | | | | | | | | |
Issued from the sale of shares | | | 61,769 | | | $ | 756,452 | | | | 105,865 | | | $ | 1,259,480 | |
Issued in connection with the reinvestment of distributions | | | 44,034 | | | | 536,387 | | | | 30,442 | | | | 360,482 | |
Redeemed | | | (352,124 | ) | | | (4,333,694 | ) | | | (276,089 | ) | | | (3,290,669 | ) |
| | | | | | | | | | | | | | | | |
Net change | | | (246,321 | ) | | $ | (3,040,855 | ) | | | (139,782 | ) | | $ | (1,670,707 | ) |
| | | | | | | | | | | | | | | | |
| Class C | | | | | | | | | | | | | | | | |
Issued from the sale of shares | | | 22,844,773 | | | $ | 280,915,141 | | | | 43,761,421 | | | $ | 518,776,270 | |
Issued in connection with the reinvestment of distributions | | | 6,164,352 | | | | 74,907,182 | | | | 4,398,460 | | | | 51,955,271 | |
Redeemed | | | (63,181,424 | ) | | | (774,669,875 | ) | | | (55,937,893 | ) | | | (664,795,170 | ) |
| | | | | | | | | | | | | | | | |
Net change | | | (34,172,299 | ) | | $ | (418,847,552 | ) | | | (7,778,012 | ) | | $ | (94,063,629 | ) |
| | | | | | | | | | | | | | | | |
| Class Y | | | | | | | | | | | | | | | | |
Issued from the sale of shares | | | 183,967,802 | | | $ | 2,281,887,609 | | | | 174,435,982 | | | $ | 2,089,695,869 | |
Issued in connection with the reinvestment of distributions | | | 19,605,289 | | | | 240,531,850 | | | | 11,822,258 | | | | 140,840,248 | |
Redeemed | | | (139,729,544 | ) | | | (1,726,639,001 | ) | | | (133,376,609 | ) | | | (1,591,510,831 | ) |
Redeemed in-kind (Note 11) | | | (16,974,699 | ) | | | (206,412,335 | ) | | | — | | | | — | |
| | | | | | | | | | | | | | | | |
Net change | | | 46,868,848 | | | $ | 589,368,123 | | | | 52,881,631 | | | $ | 639,025,286 | |
| | | | | | | | | | | | | | | | |
| Admin Class | | | | | | | | | | | | | | | | |
Issued from the sale of shares | | | 471,161 | | | $ | 5,852,745 | | | | 78,071 | | | $ | 948,013 | |
Issued in connection with the reinvestment of distributions | | | 7,731 | | | | 95,009 | | | | 719 | | | | 8,728 | |
Redeemed | | | (56,141 | ) | | | (693,953 | ) | | | (8,759 | ) | | | (107,600 | ) |
| | | | | | | | | | | | | | | | |
Net change | | | 422,751 | | | $ | 5,253,801 | | | | 70,031 | | | $ | 849,141 | |
| | | | | | | | | | | | | | | | |
| * | From commencement of operations on February 1, 2010 through September 30, 2010 for Admin Class shares. |
| 52
Notes to Financial Statements (continued)
September 30, 2011
10. Capital Shares (continued).
| | | | | | | | | | | | | | | | |
| |
| Year Ended
September 30, 2011 |
| |
| Year Ended
September 30, 2010 |
|
| | | | Shares | | | | Amount | | | | Shares | | | | Amount | |
| Class J | | | | | | | | | | | | | | | | |
Issued from the sale of shares | | | 712,300 | | | $ | 8,854,789 | | | | 1,179,600 | | | $ | 14,218,250 | |
Issued in connection with the reinvestment of distributions | | | — | | | | — | | | | — | | | | — | |
Redeemed | | | (2,804,526 | ) | | | (34,557,395 | ) | | | (3,610,670 | ) | | | (43,043,786 | ) |
| | | | | | | | | | | | | | | | |
Net change | | | (2,092,226 | ) | | $ | (25,702,606 | ) | | | (2,431,070 | ) | | $ | (28,825,536 | ) |
| | | | | | | | | | | | | | | | |
Increase (decrease) from capital share transactions | | | (12,371,603 | ) | | $ | (137,153,662 | ) | | | 35,836,982 | | | $ | 433,617,282 | |
| | | | | | | | | | | | | | | | |
11. Redemption In-Kind. In certain circumstances, a Fund may distribute portfolio securities rather than cash as payment for redemption of Fund shares (redemption in-kind). For financial reporting purposes, the Fund will recognize a gain on in-kind redemptions to the extent the value of the distributed securities on the date of redemption exceeds the cost of those securities; the Fund will recognize a loss if the cost exceeds value. Gains and losses realized on redemptions in-kind are not recognized for tax purposes, and are re-classified from realized gain (loss) to paid-in-capital. The Fund realized a gain of $19,158,810 on redemptions in-kind during the year ended September 30, 2011. This amount is included in realized gain (loss) on the Statement of Operations.
12. Subsequent Event. On September 16, 2011, the Board of Trustees approved the liquidation of Class J shares to be completed on or about January 11, 2012.
53 |
Report of Independent Registered Public Accounting Firm
To the Trustees of Loomis Sayles Funds II and Shareholders of Loomis Sayles Investment Grade Bond Fund:
In our opinion, the accompanying statement of assets and liabilities, including the portfolio of investments, and the related statements of operations and of changes in net assets and the financial highlights present fairly, in all material respects, the financial position of the Loomis Sayles Investment Grade Bond Fund, a series of Loomis Sayles Funds II (the “Fund”), at September 30, 2011, and the results of its operations, the changes in its net assets and the financial highlights for each of the periods indicated, in conformity with accounting principles generally accepted in the United States of America. These financial statements and financial highlights (hereafter referred to as “financial statements”) are the responsibility of the Fund’s management; our responsibility is to express an opinion on these financial statements based on our audits. We conducted our audits of these financial statements in accordance with the standards of the Public Company Accounting Oversight Board (United States). Those standards require that we plan and perform the audits to obtain reasonable assurance about whether the financial statements are free of material misstatement. An audit includes examining, on a test basis, evidence supporting the amounts and disclosures in the financial statements, assessing the accounting principles used and significant estimates made by management, and evaluating the overall financial statement presentation. We believe that our audits, which included confirmation of securities at September 30, 2011 by correspondence with the custodian and brokers, provide a reasonable basis for our opinion.
PricewaterhouseCoopers LLP
Boston, Massachusetts
November 22, 2011
| 54
2011 U.S. Tax Distribution Information to Shareholders (Unaudited)
Capital Gains Distributions. Pursuant to Internal Revenue Section 852(b), the Investment Grade Bond Fund designated $109,311,807 as capital gains distributions for the fiscal year ended September 30, 2011, unless subsequently determined to be different.
Qualified Dividend Income. For the fiscal year ended September 30, 2011, the Investment Grade Bond Fund will designate up to the maximum amount allowable pursuant to the Internal Revenue Code as qualified dividend income eligible for reduced tax rates. These lower rates range from 0% to 15% depending on an individual’s tax bracket. If the Fund pays a distribution during calendar year 2011, complete information will be reported in conjunction with Form 1099-DIV.
Qualified Interest Income/Short-Term Capital Gain. For the fiscal year ending September 30, 2011, the Investment Grade Bond Fund will designate up to the maximum amount allowable pursuant to the Internal Revenue Code as qualified interest income and qualified short-term capital gains eligible for reduced tax withholding rates for foreign shareholders. Complete information will be reported in conjunction with dividend information provided to foreign shareholders.
55 |
Trustee and Officer Information
The tables below provide certain information regarding the trustees and officers of Loomis Sayles Funds II (the “Trust”). Unless otherwise indicated, the address of all persons below is 399 Boylston Street, Boston, MA 02116. The Fund’s Statement of Additional Information includes additional information about the trustees of the Trust and is available by calling Natixis Funds at 800-225-5478.
| | | | | | | | |
Name and Year of Birth | | Position(s) Held with the Trust, Length of Time Served and Term of Office* | | Principal Occupation(s) During Past 5 Years | | Number of Portfolios in Fund Complex Overseen** and Other Directorships Held During the Past 5 Years | | Experience, Qualifications, Attributes, Skills for Board Membership |
| | | |
| INDEPENDENT TRUSTEES | | | | | | |
| | | | |
Graham T. Allison, Jr.
(1940) | | Trustee since 2003 and Contract Review and Governance Committee Member | | Douglas Dillon Professor and Director of the Belfer Center for Science and International Affairs, John F. Kennedy School of Government, Harvard University | | 44 Director, Taubman Centers, Inc. (real estate investment trust) | | Significant experience on Board of Trustees of the Trust and/or other business organizations; government experience (including as Assistant Secretary of Defense under President Clinton); academic experience |
| | | | |
| Charles D. Baker (1956)*** | | Trustee from 2005 to 2009 and since 2011 and Contract Review and Governance Committee Member | | Executive in Residence at General Catalyst Partners (venture capital and growth equity firm); formerly, President and Chief Executive Officer, Harvard Pilgrim Health Care (health plan) | | 44 None | | Significant experience on Board of Trustees of the Trust and/or other business organizations; executive experience including president and chief executive officer of a corporation |
| 56
Trustee and Officer Information
| | | | | | | | |
Name and Year of
Birth | | Position(s) Held with
the Trust, Length of
Time Served and
Term of Office* | | Principal
Occupation(s)
During Past
5 Years | | Number of
Portfolios in
Fund Complex
Overseen**
and Other
Directorships
Held During the
Past 5 Years | | Experience,
Qualifications,
Attributes, Skills
for Board
Membership |
| | | |
INDEPENDENT TRUSTEES continued | | | | | | |
| | | | |
Edward A. Benjamin (1938) | | Trustee since 2002 and Chairman of the Contract Review and Governance Committee | | Retired | | 44 Formerly, Director, Precision Optics Corporation (optics manufacturer) | | Significant experience on Board of Trustees of the Trust and/or other business organizations; significant experience providing legal counsel to boards, funds, advisers and other financial institutions (former partner at Ropes & Gray LLP) |
| | | | |
| Daniel M. Cain (1945) | | Trustee since 2003 and Contract Review and Governance Committee Member | | Chairman (formerly, President and Chief Executive Officer) of Cain Brothers & Company, Incorporated (investment banking) | | 44 Director, Sheridan Healthcare Inc. (physician practice management) | | Significant experience on Board of Trustees of the Trust and/or other business organizations; experience in the financial industry, including roles as chairman and former chief executive officer of an investment banking firm |
| | | | |
Kenneth A.
Drucker
(1945) | | Trustee since 2008 and Chairman of the Audit Committee | | Formerly, Vice President and Treasurer, Sequa Corp. (aerospace, automotive and metal manufacturing) | | 44 Formerly, Director, M Fund, Inc. (investment company); Director, Gateway Trust (investment company) | | Significant experience on Board of Trustees of the Trust and/or other business organizations; executive experience including as treasurer of a corporation |
57 |
Trustee and Officer Information
| | | | | | | | |
Name and Year of
Birth | | Position(s) Held with
the Trust, Length of
Time Served and
Term of Office* | | Principal
Occupation(s)
During Past
5 Years | | Number of
Portfolios in
Fund Complex
Overseen**
and Other
Directorships
Held During the
Past 5 Years | | Experience,
Qualifications,
Attributes, Skills
for Board
Membership |
| | | |
INDEPENDENT TRUSTEES continued | | | | | | |
| | | | |
Wendell J. Knox (1948) | | Trustee since 2009 and Audit Committee Member | | Director (formerly, President and Chief Executive Officer) of Abt Associates Inc. (research and consulting) | | 44 Director, Eastern Bank (commercial bank); Director, The Hanover Insurance Group (property and casualty insurance) | | Significant experience on Board of Trustees of the Trust and/or other business organizations; executive experience including roles as president and chief executive officer of a consulting company |
| | | | |
| Sandra O. Moose (1942) | | Chairperson of the Board of Trustees since November 2005 Trustee since 2003 Ex officio member of the Audit Committee and Contract Review and Governance Committee | | President, Strategic Advisory Services (management consulting); formerly, Senior Vice President and Director, The Boston Consulting Group, Inc. (management consulting) | | 44 Director, Verizon Communications; Director, AES Corporation (international power company); formerly, Director, Rohm and Haas Company (specialty chemicals) | | Significant experience on Board of Trustees of the Trust and/or other business organizations; executive experience at a management consulting company |
| | | | |
Erik R. Sirri (1958) | | Trustee since 2009 and Contract Review and Governance Committee Member | | Professor of Finance at Babson College; formerly, Director of the Division of Trading and Markets at the Securities and Exchange Commission | | 44 None | | Experience on Board of Trustees of the Trust; experience as Director of the Division of Trading and Markets at the Securities and Exchange Commission; academic experience and training as an economist |
| 58
Trustee and Officer Information
| | | | | | | | |
Name and Year of
Birth | | Position(s) Held with
the Trust, Length of
Time Served and
Term of Office* | | Principal
Occupation(s)
During Past
5 Years | | Number of
Portfolios in
Fund Complex
Overseen**
and Other
Directorships
Held During the
Past 5 Years | | Experience,
Qualifications,
Attributes, Skills
for Board
Membership |
| | | |
INDEPENDENT TRUSTEES continued | | | | | | |
| | | | |
Peter J. Smail (1952) | | Trustee since 2009 and Contract Review and Governance Committee Member | | Retired; formerly, President and Chief Executive Officer of Pyramis Global Advisors (investment management) | | 44 None | | Experience on Board of Trustees of the Trust; mutual fund industry and executive experience, including roles and president and chief executive officer for an investment advisor |
| | | | |
Cynthia L. Walker (1956) | | Trustee since 2005 and Audit Committee Member | | Deputy Dean for Finance and Administration, Yale University School of Medicine; formerly, Executive Dean for Administration, Harvard Medical School; and formerly, Dean for Finance and Chief Financial Officer, Harvard Medical School | | 44 None | | Significant experience on Board of Trustees of the Trust and/or other business organizations; executive experience in a variety of academic organizations, including roles as dean for finance and administration |
| | | |
| INTERESTED TRUSTEES | | | | | | |
| | | | |
Robert J. Blanding1 (1947) 555 California Street San Francisco, CA 94104 | | Trustee since 2002 Chief Executive Officer since 2002 | | President, Chairman, Director and Chief Executive Officer, Loomis, Sayles & Company, L.P. | | 44 None | | Significant experience on Board of Trustees of the Trust; continuing service as president, chairman, and chief executive officer of Loomis Sayles & Company, L.P. |
59 |
Trustee and Officer Information
| | | | | | | | |
Name and Year of
Birth | | Position(s) Held with
the Trust, Length of
Time Served and
Term of Office* | | Principal
Occupation(s)
During Past
5 Years | | Number of
Portfolios in
Fund Complex
Overseen**
and Other
Directorships
Held During the
Past 5 Years | | Experience,
Qualifications,
Attributes, Skills
for Board
Membership |
| | | |
INTERESTED TRUSTEES continued | | | | | | |
| | | | |
| David L. Giunta2 (1965)*** | | Trustee since 2008 President | | President and Chief Executive Officer, Natixis Distribution Corporation, Natixis Asset Management Advisors, L.P. and Natixis Distributors, L.P.; formerly, President, Fidelity Charitable Gift Fund; and formerly, Senior Vice President, Fidelity Brokerage Company | | 44 None | | Experience on Board of Trustees of the Trust; continuing experience as President and Chief Executive Officer of Natixis Global Associates – U.S. |
| | | | |
| John T. Hailer3 (1960) | | Trustee since 2003 | | President and Chief Executive Officer – U.S. and Asia, Natixis Global Asset Management, L.P.; formerly, President and Chief Executive Officer, Natixis Distribution Corporation, Natixis Asset Management Advisors, L.P., Natixis Distributors, L.P. and Natixis Global Associates, Inc. | | 44 None | | Significant experience on Board of Trustees of the Trust; continuing experience as Chief Executive Officer of Natixis Global Asset Management, L.P. |
| * | Each trustee serves until retirement, resignation or removal from the Board of Trustees. The current retirement age is 72; however, the trustees designated 2010 as a transition period so that any trustees who were age 72 or older during 2010 will not be required to retire until the end of calendar year 2011. |
| 60
Trustee and Officer Information
| | The position of Chairperson of the Board is appointed for a two-year term. Ms. Moose was appointed to serve an additional two-year term as the Chairperson of the Board of Trustees on November 20, 2009. |
| ** | The trustees of the Trust serve as trustees of a fund complex that includes all series of the Natixis Funds Trust I, Natixis Funds Trust II, Natixis Funds Trust IV and Gateway Trust (collectively, the “Natixis Funds Trusts”), Loomis Sayles Funds I and Loomis Sayles Funds II (collectively, the “Loomis Sayles Funds Trusts”), and Hansberger International Series (collectively, the “Fund Complex”). |
| *** | Messrs. Baker and Giunta were appointed as trustees effective January 1, 2011. |
| 1 | Mr. Blanding is deemed an “interested person” of the Trust because he holds the following positions with affiliated persons of the Trust: President, Chairman, Director and Chief Executive Officer of Loomis, Sayles & Company, L.P. |
| 2 | Mr. Giunta is deemed an “interested person” of the Trust because he holds the following positions with affiliated persons of the Trust: President and Chief Executive Officer, Natixis Distribution Corporation, Natixis Asset Management Advisors, L.P. and Natixis Distributors, L.P. |
| 3 | Mr. Hailer is deemed an “interested person” of the Trust because he holds the following positions with affiliated persons of the Trust: President and Chief Executive Officer – U.S. and Asia, Natixis Global Asset Management, L.P. |
| | | | | | |
Name and Year of Birth | | Position(s) Held
With the Trust | | Term of Office*
and Length of
Time Served | | Principal Occupation(s) During Past 5 Years** |
| | |
| OFFICERS OF THE TRUST | | | | |
| | | |
Coleen Downs Dinneen (1960) | | Secretary, Clerk and Chief Legal Officer | | Since September 2004 | | Executive Vice President, General Counsel, Secretary and Clerk (formerly, Senior Vice President, Deputy General Counsel, Assistant Secretary and Assistant Clerk), Natixis Distribution Corporation, Natixis Distributors, L.P., and Natixis Asset Management Advisors, L.P. |
| | | |
Daniel J. Fuss (1933) One Financial Center Boston, MA 02111 | | Executive Vice President | | Since June 2003 | | Vice Chairman and Director, Loomis, Sayles & Company, L.P. |
61 |
| | | | | | |
Name and Year of Birth | | Position(s) Held
With the Trust | | Term of Office*
and Length of
Time Served | | Principal Occupation(s) During Past 5 Years** |
| | |
OFFICERS OF THE TRUST continued | | | | |
| | | |
Russell L. Kane (1969) | | Chief Compliance Officer; Assistant Secretary and Anti-Money Laundering Officer | | Chief Compliance Officer since May 2006; Assistant Secretary since June 2004; and Anti-Money Laundering Officer since April 2007 | | Chief Compliance Officer for Mutual Funds, Senior Vice President, Deputy General Counsel, Assistant Secretary and Assistant Clerk, Natixis Distribution Corporation, Natixis Distributors, L.P. and Natixis Asset Management Advisors, L.P. |
| | | |
Michael C. Kardok (1959) | | Treasurer, Principal Financial and Accounting Officer | | Since October 2004 | | Senior Vice President, Natixis Asset Management Advisors, L.P. and Natixis Distributors, L.P. |
| * | Each officer of the Trust serves for an indefinite term in accordance with the Trust’s current by-laws until the date his or her successor is elected and qualified, or until he or she sooner dies, retires, is removed or becomes disqualified. |
| ** | Each person listed above, except as noted, holds the same position(s) with the Natixis Funds Trusts, Loomis Sayles Funds Trusts and Hansberger International Series. Mr. Fuss is not an officer of the Natixis Funds Trusts or the Hansberger International Series. Previous positions during the past five years with the Distributor, Natixis Distributors, L.P., Natixis Advisors, or Loomis Sayles are omitted, if not materially different from a Trustee’s or officer’s current position with such entity. |
| 62
ANNUAL REPORT
September 30, 2011

Loomis Sayles Strategic Income Fund
TABLE OF CONTENTS
Management Discussion page 1
Investment Results page 3
Portfolio of Investments page 14
Financial Statements page 37
LOOMIS SAYLES STRATEGIC INCOME FUND
Management Discussion
Managers:
Daniel J. Fuss, CFA, CIC
Assistant Manager:
Kathleen C. Gaffney, CFA
Associate Managers:
Matthew J. Eagan, CFA
Elaine M. Stokes
Loomis, Sayles & Company, L.P.
Objective:
Seeks high current income, with a secondary objective of capital growth
Strategy:
Invests primarily in income-producing securities in the U.S. and around the world
Fund Inception:
May 1, 1995
Symbols:
| | |
| Class A | | NEFZX |
| Class B | | NEZBX |
| Class C | | NECZX |
| Class Y | | NEZYX |
| Admin Class | | NEZAX |
Market Conditions
Fixed-income markets rallied through the start of 2011, fueled by the Federal Reserve Board’s (“the Fed”) second large-scale asset purchase program, known as “quantitative easing.” Riskier assets were the primary beneficiaries of the program, and high-yield bonds and equity-sensitive convertible bonds posted robust returns at the start of the year. The rally stalled in the summer months, after Standard & Poor’s downgraded U.S. sovereign debt, the European sovereign debt situation worsened and economic data suggested a possible slowdown in global growth. Investors shunned risk during the third quarter of 2011, and a flight to quality drove U.S. Treasury yields down to historical lows.
Performance Results
For the 12 months ended September 30, 2011, Class A shares of Loomis Sayles Strategic Income Fund returned 2.20% at net asset value. The fund underperformed its benchmark, the Barclays Capital U.S. Aggregate Bond Index, which returned 5.26% for the period. The fund outperformed the 0.85% average return of funds in its peer group, the Morningstar Multisector Bond category.
Explanation of Fund Performance
The fund’s long duration (price sensitivity to interest rate changes) buoyed performance, as yields fell throughout most of the period. (When yields fall, funds with longer duration generally experience greater price appreciation.) Furthermore, an extended duration within investment-grade financials helped lift fund performance. The fund’s underweight in U.S. agency securities was also positive, as these securities failed to keep pace with the rally in U.S. Treasuries in the second half of the period. The consumer non-cyclical sector and supranational issues also contributed positively to the fund’s performance.
Despite the fund’s positive return, its allocation to convertible bonds and non-U.S.-dollar-denominated securities detracted from results relative to the benchmark. Convertible bonds mirrored the volatile swings in the equity markets. Despite the sector’s recent instability, we believe convertibles will continue to play an important role in the fund’s performance. Certain foreign currency holdings were weak, primarily due to
1 |
anxiety stemming from unrest in the Middle East and North Africa, the aftermath of Japan’s historic earthquake and a resurgent European debt crisis. In particular, the euro and Swiss franc foundered, as inaction regarding a solution for Greece’s debt woes stymied the markets, while the Mexican peso and Brazilian real suffered due to falling commodity prices.
Outlook
Pronounced market illiquidity, re-pricing of risk assets for slower global growth, the effects of the Fed’s latest stimulus plan, named “Operation Twist,” and events in Europe are among the themes we will focus on through year-end. Growth expectations for the U.S. and other developed economies remain lackluster, as high volatility and an uncertain business environment persist. Geopolitical factors are further clouding the outlook. Details of new regulations (healthcare reform, the Dodd-Frank Act and Basel III financial regulation) have yet to be implemented, and election posturing in the U.S. will likely begin to overshadow policy formulation.
While our base case for economic growth for the remainder of 2011 and into 2012 remains less than robust, we believe there are many long-term, fundamentally stable or improving credits that currently offer attractive relative value. Default expectations are historically low, many corporate balance sheets remain strong and companies are behaving conservatively given the uncertain business climate. These are all factors that can potentially benefit bondholders.
Although the Fed has signaled that it remains accommodative on a number of fronts in the short term, we believe U.S. interest rates are currently in a period of transition, with a bias higher over the long term. We will continue to pursue what we believe are less market-sensitive securities, seeking to own credits that move independent of the general market, regardless of the direction of rates. As macroeconomic fears and illiquidity feed periods of price declines, we intend to use these opportunities to increase allocations to fundamentally sound credits. Our conviction in opportunistic investing driven by fundamental research has not changed, and we remain steadfast in our long-term approach.
What You Should Know:
Investments in the fund are subject to a number of risks. Please see the “Principal Risks” section of the fund’s prospectus. The purchase of fund shares should be seen as a long-term investment.
| 2
LOOMIS SAYLES STRATEGIC INCOME FUND
Investment Results through September 30, 2011
The charts comparing the fund’s performance to two indexes provide you with a general sense of how it performed. The fund’s total return for the period shown below appears with and without sales charges and includes fund expenses and fees. An index measures the performance of a theoretical portfolio. Unlike a fund, the index is unmanaged and does not have expenses that affect the results. It is not possible to invest directly in an index. Investors would incur transaction costs and other expenses if they purchased the securities necessary to match the index.
Growth of a $10,000 Investment in Class A Shares6
September 30, 2001 through September 30, 2011
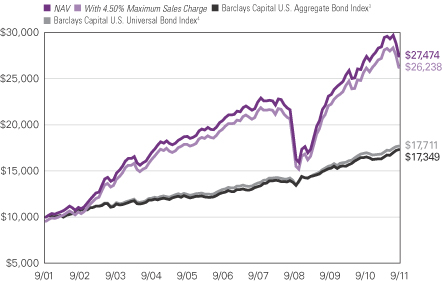
3 |
Average Annual Total Returns — September 30, 20116
| | | | | | | | | | | | |
| | | | |
| | | 1 Year | | | 5 Years | | | 10 Years | |
| | | | |
| Class A (Inception 5/1/95) | | | | | | | | | | | | |
| NAV | | | 2.20 | % | | | 6.10 | % | | | 10.63 | % |
| With 4.50% Maximum Sales Charge | | | -1.36 | | | | 5.35 | | | | 10.25 | |
| | | | |
| Class B (Inception 5/1/95) | | | | | | | | | | | | |
| NAV | | | 1.48 | | | | 5.32 | | | | 9.81 | |
| With CDSC2 | | | -3.36 | | | | 5.00 | | | | 9.81 | |
| | | | |
| Class C (Inception 5/1/95) | | | | | | | | | | | | |
| NAV | | | 1.42 | | | | 5.32 | | | | 9.81 | |
| With CDSC2 | | | 0.45 | | | | 5.32 | | | | 9.81 | |
| | | | |
| Class Y (Inception 12/1/99) | | | | | | | | | | | | |
| NAV | | | 2.46 | | | | 6.38 | | | | 10.93 | |
| | | | |
| Admin Class (Inception 2/1/10)1 | | | | | | | | | | | | |
| NAV | | | 1.98 | | | | 5.80 | | | | 10.28 | |
| | | | |
| Comparative Performance | | | | | | | | | | | | |
| Barclays Capital U.S. Aggregate Bond Index3 | | | 5.26 | | | | 6.53 | | | | 5.66 | |
| Barclays Capital U.S. Universal Bond Index4 | | | 4.77 | | | | 6.40 | | | | 5.88 | |
| Morningstar Multisector Bond Fund Avg.5 | | | 0.85 | | | | 5.15 | | | | 7.32 | |
Performance data quoted represents past performance and is no guarantee of future results. Total return and value will vary and you may have a gain or loss when shares are sold. Current performance may be lower or higher than quoted. For most recent month-end performance, visit ga.natixis.com. Performance for other share classes will be greater or less than shown based on differences in fees and sales charges. Performance for periods less than one year is cumulative, not annualized. Returns reflect changes in share price and reinvestment of dividends and capital gains, if any. Class Y shares are not available for purchase by all investors.
The table and graph do not reflect taxes shareholders might owe on any fund distributions or when they redeem their shares.
| 1 | Prior to the inception of Admin Class shares (2/1/10), performance is that of Class A shares, restated to reflect the higher net expenses of Admin Class shares. |
| 2 | Performance for Class B shares assumes a maximum 5% contingent deferred sales charge (“CDSC”) applied when you sell shares, which declines annually between years 1-6 according to the following schedule: 5, 4, 3, 3, 2, 1, 0%. Class C share performance assumes a 1% CDSC applied when you sell shares within one year of purchase. |
| 3 | Barclays Capital U.S. Aggregate Bond Index is an unmanaged index that covers the U.S.-dollar denominated, investment-grade, fixed-rate, taxable bond market of SEC-registered securities. The index includes bonds from the Treasury, government-related, corporate, mortgage-backed securities, asset-backed securities, and collateralized mortgage-backed securities sectors. |
| 4 | Barclays Capital U.S. Universal Bond Index is an unmanaged index that covers U.S. dollar-denominated taxable bonds, including U.S. government and investment grade debt, non-investment grade debt, asset-backed and mortgage-backed securities, Eurobonds, 144A securities and emerging market debt. |
| 5 | Morningstar Multisector Bond Fund Average is the average performance without sales charges of funds with similar investment objectives, as calculated by Morningstar, Inc. |
| 6 | Fund performance has been increased by fee waivers and/or expense reimbursements, if any, without which performance would have been lower. |
| 4
| | | | |
| Credit Quality | | % of Net
Assets as of
9/30/2011 | |
Aaa | | | 13.5 | |
Aa | | | 5.1 | |
A | | | 9.4 | |
Baa | | | 22.7 | |
Ba | | | 11.4 | |
B | | | 14.2 | |
Caa & Lower | | | 3.5 | |
Not Rated | | | 16.5 | |
Short-Term and Other | | | 3.7 | |
| | Credit quality at 9/30/11 reflects the highest credit rating assigned to individual holdings of the fund among Moody’s, S&P or Fitch; ratings are subject to change. The fund’s shares are not rated by any rating agency and no credit rating for the fund’s shares is implied. The Moody’s equivalent of the assigned rating is presented in the table. |
| | |
| Effective Maturity | | % of Net
Assets as of
9/30/2011 |
1 year or less | | 10.0 |
1-5 years | | 27.1 |
5-10 years | | 25.8 |
10+ years | | 37.1 |
Average Effective Maturity | | 12.7 |
Portfolio characteristics will vary.
Expense Ratios
as stated in the most recent prospectus
| | | | | | | | |
| Share Class | | Gross Expense Ratio1 | | | Net Expense Ratio2 | |
| A | | | 0.97 | % | | | 0.97 | % |
| B | | | 1.72 | | | | 1.72 | |
| C | | | 1.72 | | | | 1.72 | |
| Y | | | 0.72 | | | | 0.72 | |
| Admin | | | 1.24 | | | | 1.24 | |
NOTES TO CHARTS
| 1 | Before fee waivers and/or expense reimbursements. |
| 2 | After fee waivers and/or expense reimbursements. Waivers/reimbursements are contractual and are set to expire on 1/31/12. Contracts are reevaluated on an annual basis. |
5 |
ADDITIONAL INFORMATION
The views expressed in this report reflect those of the portfolio managers as of the dates indicated. The managers’ views are subject to change at any time without notice based on changes in market or other conditions. References to specific securities or industries should not be regarded as investment advice. Because the fund is actively managed, there is no assurance that it will continue to invest in the securities, countries or industries mentioned.
Before investing, consider the fund’s investment objectives, risks, charges and other expenses. Visit ga.natixis.com or call 800-225-5478 for a prospectus and/or a summary prospectus, both of which contain this and other information. Read it carefully.
PROXY VOTING INFORMATION
A description of the fund’s proxy voting policies and procedures is available without charge, upon request, by calling Natixis Funds at 800-225-5478; on the fund’s website at ga.natixis.com; and on the Securities and Exchange Commission’s (SEC’s) website at www.sec.gov. Information regarding how the fund voted proxies relating to portfolio securities during the 12-month period ended June 30, 2011 is available from the fund’s website and the SEC’s website.
QUARTERLY PORTFOLIO SCHEDULES
The fund files a complete schedule of portfolio holdings with the SEC for the first and third quarters of each fiscal year on Form N-Q. The fund’s Forms N-Q are available on the SEC’s website at www.sec.gov and may be reviewed and copied at the SEC’s Public Reference Room in Washington, DC. Information on the operation of the Public Reference Room may be obtained by calling 800-SEC-0330.
| 6
UNDERSTANDING YOUR FUND’S EXPENSES
As a mutual fund shareholder, you incur different types of costs: transaction costs, including sales charges (loads) on purchases and contingent deferred sales charges on redemptions; and ongoing costs, including management fees, distribution fees (12b-1 fees) and/or service fees, and other fund expenses. These costs are described in more detail in the fund’s prospectus. The examples below are intended to help you understand the ongoing costs of investing in the fund and help you compare these with the ongoing costs of investing in other mutual funds.
The first line in the table for each class shows the actual amount of fund expenses you would have paid on a $1,000 investment in the fund from April 1, 2011 through September 30, 2011. It also shows how much a $1,000 investment would be worth at the close of the period, assuming actual fund returns and expenses. To estimate the expenses you paid over the period, simply divide your account value by $1,000 (for example $8,600 account value divided by $1,000 =8.60) and multiply the result by the number in Expenses Paid During Period row as shown below for your class.
The second line in the table for each class provides information about hypothetical account values and hypothetical expenses based on the fund’s actual expense ratios and an assumed rate of return of 5% per year before expenses, which is not the fund’s actual return. The hypothetical account values and expenses may not be used to estimate the actual ending account balance or expenses you paid on your investment for the period. You may use this information to compare the ongoing costs of investing in the fund and other funds. To do so, compare this 5% hypothetical example with the 5% hypothetical examples that appear in the shareholder reports of the other funds.
Please note that the expenses shown reflect ongoing costs only, and do not include any transaction costs. Therefore, the second line in the table of the fund is useful in comparing ongoing costs only, and will not help you determine the relative costs of owning different funds. If transaction costs were included, total costs would be higher.
7 |
| | | | | | | | | | | | |
| LOOMIS SAYLES STRATEGIC INCOME FUND | | BEGINNING
ACCOUNT VALUE
4/1/2011 | | | ENDING
ACCOUNT VALUE
9/30/2011 | | | EXPENSES PAID
DURING PERIOD*
4/1/2011 – 9/30/2011 | |
Class A | | | | | | | | | | | | |
Actual | | | $1,000.00 | | | | $964.60 | | | | $4.68 | |
Hypothetical (5% return before expenses) | | | $1,000.00 | | | | $1,020.31 | | | | $4.81 | |
Class B | | | | | | | | | | | | |
Actual | | | $1,000.00 | | | | $961.80 | | | | $8.36 | |
Hypothetical (5% return before expenses) | | | $1,000.00 | | | | $1,016.55 | | | | $8.59 | |
Class C | | | | | | | | | | | | |
Actual | | | $1,000.00 | | | | $961.20 | | | | $8.36 | |
Hypothetical (5% return before expenses) | | | $1,000.00 | | | | $1,016.55 | | | | $8.59 | |
Class Y | | | | | | | | | | | | |
Actual | | | $1,000.00 | | | | $965.80 | | | | $3.45 | |
Hypothetical (5% return before expenses) | | | $1,000.00 | | | | $1,021.56 | | | | $3.55 | |
Admin Class | | | | | | | | | | | | |
Actual | | | $1,000.00 | | | | $963.40 | | | | $5.96 | |
Hypothetical (5% return before expenses) | | | $1,000.00 | | | | $1,019.00 | | | | $6.12 | |
| * | Expenses are equal to the Fund’s annualized expense ratio: 0.95%, 1.70%, 1.70%, 0.70% and 1.21% for Class A, B, C, Y and Admin Class, respectively, multiplied by the average account value over the period, multiplied by the number of days in the most recent fiscal half-year, divided by 365 (to reflect the half-year period). |
| 8
BOARD APPROVAL OF THE EXISTING ADVISORY AGREEMENT
The Board of Trustees, including the Independent Trustees, considers matters bearing on the Fund’s advisory agreement (the “Agreement”) at most of its meetings throughout the year. Each year, usually in the spring, the Contract Review and Governance Committee of the Board meets to review the Agreement to determine whether to recommend that the full Board approve the continuation of the Agreement, typically for an additional one-year period. After the Committee has made its recommendation, the full Board, including the Independent Trustees, determines whether to approve the continuation of the Agreement.
In connection with these meetings, the Trustees receive materials that the Fund’s investment adviser ( the “Adviser”) believes to be reasonably necessary for the Trustees to evaluate the Agreement. These materials generally include, among other items, (i) information on the investment performance of the Fund and the performance of peer groups of fund and the Fund’s performance benchmarks, (ii) information on the Fund’s advisory fees and other expenses, including information comparing the Fund’s expenses to the fees charged to institutional accounts with similar strategies managed by the Adviser and to those of peer groups of funds and information about any applicable expense caps and fee “breakpoints,” (iii) sales and redemption data in respect of the Fund, (iv) information about the profitability of the Agreement to the Adviser and (v) information obtained through the completion of a questionnaire by the Adviser (the Trustees are consulted as to the information requested through that questionnaire). The Board of Trustees, including the Independent Trustees, also consider other matters such as (i) the Adviser’s financial results and financial condition, (ii) the Fund’s investment objective and strategies and the size, education and experience of the Adviser’s investment staff and its use of technology, external research and trading cost measurement tools, (iii) arrangements in respect of the distribution of the Fund’s shares and the related costs, (iv) the procedures employed to determine the value of the Fund’s assets, (v) the allocation of the Fund’s brokerage, if any, including, if applicable, allocations to brokers affiliated with the Adviser and the use of “soft” commission dollars to pay Fund expenses and to pay for research and other similar services, (vi) the resources devoted to, and the record of compliance with, the Fund’s investment policies and restrictions, policies on personal securities transactions and other compliance policies, (vii) information about amounts invested by the Fund’s portfolio managers in the Fund or in similar accounts that they manage and (viii) the general economic outlook with particular emphasis on the mutual fund industry. Throughout the process, the Trustees are afforded the opportunity to ask questions of and request additional materials from the Adviser.
In addition to the materials requested by the Trustees in connection with their annual consideration of the continuation of the Agreement, the Trustees receive materials in advance of each regular quarterly meeting of the Board of Trustees that provide detailed information about the Fund’s investment performance and the fees charged to the Funds for advisory and other services. This information generally includes, among other things, an internal performance rating for the Fund based on agreed-upon criteria, graphs showing the Fund’s performance and fee differentials against the Fund’s peer group of funds, performance ratings provided by a third-party, total return information for various
9 |
periods, and third-party performance rankings for various periods comparing the Fund against its peer group. The portfolio management team for the Fund or other representatives of the Adviser make periodic presentations to the Contract Review and Governance Committee and/or the full Board of Trustees, and if the Fund is identified as presenting possible performance concerns it may be subject to more frequent board presentations and reviews. In addition, each quarter the Trustees are provided with detailed statistical information about the Fund’s portfolio. The Trustees also receive periodic updates between meetings.
The Board of Trustees most recently approved the continuation of the Agreement at their meeting held in June 2011. The Agreement was continued for a one-year period for the Fund. In considering whether to approve the continuation of the Agreement, the Board of Trustees, including the Independent Trustees, did not identify any single factor as determinative. Individual Trustees may have evaluated the information presented differently from one another, giving different weights to various factors. Matters considered by the Trustees, including the Independent Trustees, in connection with their approval of the Agreement included, but were not limited to, the factors listed below.
The nature, extent and quality of the services provided to the Fund under the Agreement. The Trustees considered the nature, extent and quality of the services provided by the Adviser and its affiliates to the Fund and the resources dedicated to the Fund by the Adviser and its affiliates.
The Trustees considered not only the advisory services provided by the Adviser to the Fund, but also the administrative services provided by Natixis Asset Management Advisors, L.P. (“Natixis Advisors”) and its affiliates to the Fund.
For the Fund, the Trustees also considered the benefits to shareholders of investing in a mutual fund that is part of a family of funds that offers shareholders the right to exchange shares of one type of fund for shares of another type of fund, and provides a variety of fund and shareholder services.
After reviewing these and related factors, the Trustees concluded, within the context of their overall conclusions regarding each of the Agreement, that the nature, extent and quality of services provided supported the renewal of the Agreement.
Investment performance of the Funs and the Adviser. As noted above, the Trustees received information about the performance of the Fund over various time periods, including information which compared the performance of the Fund to the performance of peer groups of funds and the Fund’s performance benchmarks. In addition, the Trustees also reviewed data prepared by an independent third party which analyzed the performance of the Fund using a variety of performance metrics, including metrics which also measured the performance of the Fund on a risk adjusted basis.
With respect to the Fund, the Board concluded that the Fund’s performance or other relevant factors supported the renewal of the Agreement relating to that Fund. In the case of the Fund that had performance that lagged that of a relevant peer group for certain (although not necessarily all) periods, the Board concluded that other factors relevant to performance supported renewal of the Agreement. These factors included one or more of the following: (1) that underperformance was attributable, to a significant
| 10
extent, to investment decisions (such as security selection or sector allocation) by the Adviser that was reasonable and consistent with the Fund’s investment objective and policies and (2) that the Fund’s more recent performance was competitive when compared to relevant performance benchmarks or peer groups.
The Trustees also considered the Adviser’s performance and reputation generally, the Fund’s performance as a fund family generally (as noted by certain financial publications), and the historical responsiveness of the Adviser to Trustee concerns about performance and the willingness of the Adviser to take steps intended to improve performance.
After reviewing these and related factors, the Trustees concluded, within the context of their overall conclusions regarding each of the Agreement, that the performance of the Fund and the Adviser and/or other relevant factors supported the renewal of the Agreement.
The costs of the services to be provided and profits to be realized by the Adviser and its affiliates from their respective relationships with the Fund. The Trustees considered the fees charged to the Fund for advisory services as well as the total expense levels of the Fund. This information included comparisons (provided both by management and also by an independent third party) of the Fund’s advisory fees and total expense levels to those of their peer groups and information about the advisory fees charged by the Adviser to comparable accounts (such as institutional separate accounts), as well as information about differences in such fees. In considering the fees charged to comparable accounts, the Trustees considered, among other things, management’s representations about the differences between managing mutual funds as compared to other types of accounts, including the additional resources required to effectively manage and the greater regulatory costs associated with the management of mutual fund assets. In evaluating the Fund’s advisory fee, the Trustees also took into account the demands, complexity and quality of the investment management of such Fund, as well as the need for the Adviser to offer competitive compensation and to expend additional resources as the Fund grows in size. The Trustees considered that over the past several years, management had made recommendations regarding reductions in advisory fee rates, implementation of advisory fee breakpoints and the institution of advisory fee waivers and expense caps for various funds in the Fund family. They noted that, as of December 31, 2010, the Fund has an expense cap in place, and the Trustees considered that the current expenses are below the cap. The Trustees noted that the Fund had an advisory fee rate that was above the median of a peer group of funds. The Trustees considered the circumstances that accounted for such relatively higher expenses. These factors included the following: (1) the Fund’s advisory fee rate was only slightly above its peer group median and (2) the Fund had not yet reached asset levels at which recently added breakpoints would have an impact on fees.
The Trustees also considered the compensation directly or indirectly received or to be received by the Adviser and its affiliates from their relationships with the Fund. The Trustees reviewed information provided by management as to the profitability of the Adviser’s and its affiliates’ relationships with the Fund, and information about the allocation of expenses used to calculate profitability. They also reviewed information provided by management about the effect of distribution costs and changes in asset levels on Adviser profitability, including information regarding resources spent on distribution
11 |
activities. When reviewing profitability, the Trustees also considered information about court cases in which adviser profitability was an issue, the performance of the Fund, the expense levels of the Fund, whether the Adviser had implemented breakpoints and/or expense caps with respect to the Fund and the overall profit margin of the Adviser compared to other investment managers.
After reviewing these and related factors, the Trustees concluded, within the context of their overall conclusions regarding the Agreement, that the advisory fee charged to the Fund was fair and reasonable, and that the costs of these services generally and the related profitability of the Adviser and its affiliates in respect of their relationships with the Fund supported the renewal of the Agreement.
Economies of Scale. The Trustees considered the existence of any economies of scale in the provision of services by the Adviser and whether those economies are shared with the Fund through breakpoints in their investment advisory fees or other means, such as expense waivers or caps. The Trustees noted the Fund is subject to breakpoints in its advisory fees. The Trustees further noted that the Fund was subject to an expense cap or waiver. In considering these issues, the Trustees also took note of the costs of the services provided (both on an absolute and a relative basis) and the profitability to the Adviser and its affiliates of their relationships with the Fund, as discussed above.
After reviewing these and related factors, the Trustees concluded, within the context of their overall conclusions regarding the Agreement, that the extent to which economies of scale were shared with the Fund supported the renewal of the Agreement.
The Trustees also considered other factors, which included but were not limited to the following:
| · | | the effect of recent market and economic turmoil on the performance, asset levels and expense ratios of the Fund. |
| · | | whether the Fund has operated in accordance with its investment objective and the Fund’s record of compliance with its investment restrictions, and the compliance programs of the Fund and the Adviser. They also considered the compliance-related resources the Adviser and its affiliates were providing to the Fund. |
| · | | the nature, quality, cost and extent of administrative and shareholder services performed by the Adviser and its affiliates, both under the Agreement and under separate agreements covering administrative services. |
| · | | so-called “fallout benefits” to the Adviser, such as the engagement of affiliates of the Adviser to provide distribution, administrative and brokerage services to the Fund, and the benefits of research made available to the Adviser by reason of brokerage commissions (if any) generated by the Fund’s securities transactions. The Trustees also considered the fact that Natixis Advisors’ parent company benefits from the retention of an affiliated Adviser. The Trustees considered the possible conflicts of interest associated with these fallout and other benefits, and the reporting, disclosure and other processes in place to disclose and monitor such possible conflicts of interest. |
| 12
| · | | the Trustees’ review and discussion of the Fund’s advisory arrangements in prior years, and management’s record of responding to Trustee concerns raised during the year and in prior years. |
Based on their evaluation of all factors that they deemed to be material, including those factors described above, and assisted by the advice of independent counsel, the Trustees, including the Independent Trustees, concluded that the existing Agreement should be continued through June 30, 2012.
13 |
Portfolio of Investments – as of September 30, 2011
Loomis Sayles Strategic Income Fund
| | | | | | | | |
Principal
Amount (‡) | | | Description | | Value (†) | |
| | | | | | | | |
| | Bonds and Notes — 78.8% of Net Assets | | | | |
| | Non-Convertible Bonds — 69.7% | | | | |
| | | | ABS Car Loan — 0.1% | | | | |
| $ | 7,211,250 | | | Avis Budget Rental Car Funding AESOP LLC, Series 2007-2A, Class A,
0.371%, 8/20/2013, 144A(b) | | $ | 7,099,826 | |
| | 4,093,750 | | | Avis Budget Rental Car Funding AESOP LLC, Series 2010-5A, Class B,
5.110%, 3/20/2017, 144A | | | 4,414,457 | |
| | | | | | | | |
| | | | | | | 11,514,283 | |
| | | | | | | | |
| | | | Aerospace & Defense — 0.1% | | | | |
| | 620,000 | | | Bombardier, Inc., 7.350%, 12/22/2026, (CAD) | | | 594,363 | |
| | 11,800,000 | | | Bombardier, Inc., 7.450%, 5/01/2034, 144A | | | 11,859,000 | |
| | 2,425,000 | | | Ducommun, Inc., 9.750%, 7/15/2018, 144A | | | 2,425,000 | |
| | | | | | | | |
| | | | | | | 14,878,363 | |
| | | | | | | | |
| | | | Airlines — 2.8% | | | | |
| | 35,455,000 | | | Air Canada, 10.125%, 8/01/2015, 144A, (CAD) | | | 32,311,790 | |
| | 1,501,787 | | | American Airlines Pass Through Trust, Series 2009-1A, 10.375%, 1/02/2021 | | | 1,636,948 | |
| | 99,046 | | | Continental Airlines Pass Through Trust, Series 1996-1, Class A,
6.940%, 4/15/2015 | | | 100,779 | |
| | 3,700,216 | | | Continental Airlines Pass Through Trust, Series 1997-1, Class A,
7.461%, 10/01/2016 | | | 3,658,589 | |
| | 2,534,842 | | | Continental Airlines Pass Through Trust, Series 1997-4, Class B, 6.900%, 7/02/2018 | | | 2,458,797 | |
| | 2,181,612 | | | Continental Airlines Pass Through Trust, Series 1998-1, Class B, 6.748%, 9/15/2018 | | | 2,017,991 | |
| | 4,480,765 | | | Continental Airlines Pass Through Trust, Series 1999-1, Class B, 6.795%, 2/02/2020 | | | 4,279,130 | |
| | 3,259,733 | | | Continental Airlines Pass Through Trust, Series 1999-2, Class B, 7.566%, 9/15/2021 | | | 3,161,941 | |
| | 1,304,334 | | | Continental Airlines Pass Through Trust, Series 2000-1, Class A-1, 8.048%, 5/01/2022 | | | 1,356,508 | |
| | 1,482,915 | | | Continental Airlines Pass Through Trust, Series 2000-2, Class A-1, 7.707%, 10/02/2022 | | | 1,527,403 | |
| | 3,342,501 | | | Continental Airlines Pass Through Trust, Series 2000-2, Class B, 8.307%, 10/02/2019 | | | 3,242,226 | |
| | 1,861,429 | | | Continental Airlines Pass Through Trust, Series 2001-1, Class A-1, 6.703%, 12/15/2022 | | | 1,907,965 | |
| | 1,063,631 | | | Continental Airlines Pass Through Trust, Series 2001-1, Class B, 7.373%, 6/15/2017 | | | 1,042,359 | |
| | 11,283,707 | | | Continental Airlines Pass Through Trust, Series 2007-1, Class A, 5.983%, 10/19/2023 | | | 11,340,125 | |
| | 19,117,477 | | | Continental Airlines Pass Through Trust, Series 2007-1, Class B, 6.903%, 4/19/2022 | | | 17,779,254 | |
| | 18,241,268 | | | Continental Airlines Pass Through Trust, Series 2009-1, 9.000%, 7/08/2016 | | | 19,700,569 | |
| | 16,587,152 | | | Continental Airlines Pass Through Trust, Series 2009-2, Class A, 7.250%, 5/10/2021 | | | 17,474,896 | |
See accompanying notes to financial statements.
| 14
Portfolio of Investments – as of September 30, 2011
Loomis Sayles Strategic Income Fund – (continued)
| | | | | | | | |
Principal
Amount (‡) | | | Description | | Value (†) | |
| | | | | | | | |
| | | | Airlines — continued | | | | |
| $ | 1,370,489 | | | Delta Air Lines Pass Through Trust, Series 2007-1, Class A, 6.821%, 2/10/2024 | | $ | 1,380,768 | |
| | 7,170,443 | | | Delta Air Lines Pass Through Trust, Series 2007-1, Class B, 8.021%, 2/10/2024 | | | 6,991,182 | |
| | 23,512,410 | | | Delta Air Lines Pass Through Trust, Series 2007-1, Class C, 8.954%, 8/10/2014 | | | 23,159,724 | |
| | 2,825,000 | | | Delta Air Lines, Inc., 9.500%, 9/15/2014, 144A | | | 2,909,750 | |
| | 2,090,283 | | | Northwest Airlines, Inc., Series 2002-1, Class G2, (MBIA insured), 6.264%, 5/20/2023 | | | 2,058,928 | |
| | 1,500,000 | | | Qantas Airways Ltd., 5.125%, 6/20/2013, 144A | | | 1,573,536 | |
| | 29,995,000 | | | Qantas Airways Ltd., 6.050%, 4/15/2016, 144A | | | 32,034,240 | |
| | 18,657,001 | | | UAL Pass Through Trust, Series 2007-1, Class A, 6.636%, 1/02/2024 | | | 18,109,977 | |
| | 10,295,790 | | | UAL Pass Through Trust, Series 2009-1, 10.400%, 5/01/2018 | | | 11,119,454 | |
| | 19,140,000 | | | US Airways Pass Through Trust, Series 2010-1B, Class B, 8.500%, 10/22/2018 | | | 18,326,550 | |
| | 43,228,000 | | | US Airways Pass Through Trust, Series 2010-1C, Class C, 11.000%, 10/22/2014, 144A | | | 42,363,440 | |
| | 52,073,000 | | | US Airways Pass Through Trust, Series 2011-1B, Class B, 9.750%, 4/22/2020 | | | 49,990,080 | |
| | 22,168,000 | | | US Airways Pass Through Trust, Series 2011-1C, Class C, 10.875%, 10/22/2014 | | | 21,613,800 | |
| | | | | | | | |
| | | | | | | 356,628,699 | |
| | | | | | | | |
| | | | Automotive — 1.5% | | | | |
| | 265,000 | | | ArvinMeritor, Inc., 8.125%, 9/15/2015 | | | 234,525 | |
| | 3,800,000 | | | Chrysler Group LLC/CG Co-Issuer, Inc., 8.250%, 6/15/2021, 144A | | | 2,926,000 | |
| | 6,500,000 | | | FCE Bank PLC, EMTN, 7.125%, 1/16/2012, (EUR) | | | 8,730,145 | |
| | 4,500,000 | | | FCE Bank PLC, EMTN, 7.125%, 1/15/2013, (EUR) | | | 6,149,452 | |
| | 19,011,000 | | | Ford Motor Co., 6.375%, 2/01/2029 | | | 18,381,013 | |
| | 1,975,000 | | | Ford Motor Co., 6.500%, 8/01/2018 | | | 2,063,415 | |
| | 1,220,000 | | | Ford Motor Co., 6.625%, 2/15/2028 | | | 1,210,856 | |
| | 74,829,000 | | | Ford Motor Co., 6.625%, 10/01/2028 | | | 74,263,891 | |
| | 2,365,000 | | | Ford Motor Co., 7.125%, 11/15/2025 | | | 2,333,356 | |
| | 52,045,000 | | | Ford Motor Co., 7.450%, 7/16/2031 | | | 58,752,560 | |
| | 1,345,000 | | | Ford Motor Co., 7.500%, 8/01/2026 | | | 1,359,553 | |
| | 4,977,000 | | | Goodyear Tire & Rubber Co. (The), 7.000%, 3/15/2028 | | | 4,504,185 | |
| | 6,263,000 | | | Goodyear Tire & Rubber Co. (The), 10.500%, 5/15/2016 | | | 6,779,698 | |
| | 3,100,000 | | | TRW Automotive, Inc., 7.250%, 3/15/2017, 144A | | | 3,255,000 | |
| | 5,300,000 | | | TRW Automotive, Inc., 8.875%, 12/01/2017, 144A | | | 5,644,500 | |
| | | | | | | | |
| | | | | | | 196,588,149 | |
| | | | | | | | |
| | | | Banking — 5.3% | | | | |
| | 1,175,000 | | | AgriBank FCB, 9.125%, 7/15/2019, 144A | | | 1,557,579 | |
| | 20,565,000 | | | Associates Corp. of North America, 6.950%, 11/01/2018 | | | 22,763,172 | |
| | 22,125,000 | | | BAC Capital Trust VI, 5.625%, 3/08/2035 | | | 15,842,916 | |
| | 1,675,000 | | | Bank of America Corp., 5.420%, 3/15/2017 | | | 1,455,178 | |
| | 4,560,000 | | | Bank of America Corp., 6.000%, 9/01/2017 | | | 4,387,190 | |
| | 265,000 | | | Bank of America Corp., MTN, 5.000%, 5/13/2021 | | | 236,421 | |
See accompanying notes to financial statements.
15 |
Portfolio of Investments – as of September 30, 2011
Loomis Sayles Strategic Income Fund – (continued)
| | | | | | | | |
Principal
Amount (‡) | | | Description | | Value (†) | |
| | | | | | | | |
| | | | Banking — continued | | | | |
| $ | 8,020,000 | | | Bank of America NA, 5.300%, 3/15/2017 | | $ | 7,243,335 | |
| | 39,890,000,000 | | | Barclays Bank PLC, EMTN, 3.680%, 8/20/2015, (KRW) | | | 33,957,173 | |
| | 56,650,000,000 | | | Barclays Financial LLC, 4.470%, 12/04/2011, 144A, (KRW) | | | 48,125,595 | |
| | 19,965,000 | | | Citigroup, Inc., 5.000%, 9/15/2014 | | | 19,580,853 | |
| | 4,000,000 | | | Citigroup, Inc., 5.365%, 3/06/2036, (CAD)(c) | | | 2,868,632 | |
| | 985,000 | | | Citigroup, Inc., 5.850%, 12/11/2034 | | | 951,004 | |
| | 24,610,000 | | | Citigroup, Inc., 5.875%, 2/22/2033 | | | 20,585,527 | |
| | 8,999,000 | | | Citigroup, Inc., 6.000%, 10/31/2033 | | | 7,885,113 | |
| | 6,060,000 | | | Citigroup, Inc., 6.125%, 8/25/2036 | | | 5,126,184 | |
| | 3,350,000 | | | Citigroup, Inc., EMTN, (fixed rate to 11/30/2012, variable rate thereafter), 3.625%, 11/30/2017, (EUR) | | | 3,465,256 | |
| | 54,000,000 | | | Citigroup, Inc., MTN, 5.500%, 10/15/2014 | | | 56,103,300 | |
| | 9,905,000 | | | First Niagara Finance Group, Inc., 6.750%, 3/19/2020 | | | 11,140,401 | |
| | 400,000 | | | Goldman Sachs Group, Inc. (The), 6.450%, 5/01/2036 | | | 363,504 | |
| | 30,375,000 | | | Goldman Sachs Group, Inc. (The), 6.750%, 10/01/2037 | | | 27,785,319 | |
| | 3,120,000 | | | HBOS PLC, 6.000%, 11/01/2033, 144A | | | 2,016,534 | |
| | 119,806,078 | | | HSBC Bank USA, Zero Coupon, 11/28/2011, 144A | | | 115,421,175 | |
| | 9,090,000 | | | ICICI Bank Ltd., (fixed rate to 4/30/2017, variable rate thereafter), 6.375%, 4/30/2022, 144A | | | 7,544,700 | |
| | 229,157,783,660 | | | JPMorgan Chase & Co., Zero Coupon, 4/12/2012, 144A, (IDR) | | | 24,287,075 | |
| | 260,000,000,000 | | | JPMorgan Chase & Co., EMTN, 7.070%, 3/22/2014, (IDR) | | | 27,830,944 | |
| | 227,000,000,000 | | | JPMorgan Chase Bank NA, 7.700%, 6/01/2016, 144A, (IDR) | | | 24,802,139 | |
| | 27,555,000 | | | Lloyds TSB Bank PLC, MTN, 6.500%, 9/14/2020, 144A | | | 23,415,578 | |
| | 3,010,000 | | | Merrill Lynch & Co., Inc., 5.700%, 5/02/2017 | | | 2,704,365 | |
| | 100,000 | | | Merrill Lynch & Co., Inc., 6.050%, 5/16/2016 | | | 89,993 | |
| | 2,600,000 | | | Merrill Lynch & Co., Inc., 6.110%, 1/29/2037 | | | 2,014,561 | |
| | 2,600,000 | | | Merrill Lynch & Co., Inc., 6.220%, 9/15/2026 | | | 2,198,885 | |
| | 51,500,000 | | | Merrill Lynch & Co., Inc., 10.710%, 3/08/2017, (BRL) | | | 25,198,777 | |
| | 3,450,000 | | | Merrill Lynch & Co., Inc., EMTN, 4.625%, 9/14/2018, (EUR) | | | 3,411,077 | |
| | 5,410,000 | | | Merrill Lynch & Co., Inc., MTN, 6.875%, 4/25/2018 | | | 5,411,942 | |
| | 800,000 | | | Merrill Lynch & Co., Inc., Series C, MTN, 6.050%, 6/01/2034 | | | 714,182 | |
| | 1,235,000 | | | Merrill Lynch & Co., Inc., Series C, MTN, 6.400%, 8/28/2017 | | | 1,197,388 | |
| | 13,400,000 | | | Morgan Stanley, 5.500%, 7/24/2020 | | | 12,136,608 | |
| | 3,300,000 | | | Morgan Stanley, 5.750%, 1/25/2021 | | | 3,036,221 | |
| | 79,700,000 | | | Morgan Stanley, GMTN, 7.625%, 3/03/2016, (AUD) | | | 76,438,431 | |
| | 6,600,000 | | | Morgan Stanley, Series F, GMTN, 5.625%, 9/23/2019 | | | 6,191,269 | |
| | 7,900,000 | | | Morgan Stanley, Series F, GMTN, 6.625%, 4/01/2018 | | | 7,837,290 | |
| | 5,210,000 | | | Morgan Stanley, Series F, MTN, 5.950%, 12/28/2017 | | | 5,052,059 | |
| | 5,050,000 | | | Morgan Stanley, Series G & H, GMTN, 5.125%, 11/30/2015, (GBP) | | | 7,414,295 | |
| | | | | | | | |
| | | | | | | 677,789,140 | |
| | | | | | | | |
| | | | Brokerage — 0.0% | | | | |
| | 880,000 | | | Jefferies Group, Inc., 6.250%, 1/15/2036 | | | 798,275 | |
| | 3,285,000 | | | Jefferies Group, Inc., 8.500%, 7/15/2019 | | | 3,653,515 | |
| | | | | | | | |
| | | | | | | 4,451,790 | |
| | | | | | | | |
See accompanying notes to financial statements.
| 16
Portfolio of Investments – as of September 30, 2011
Loomis Sayles Strategic Income Fund – (continued)
| | | | | | | | |
Principal
Amount (‡) | | | Description | | Value (†) | |
| | | | | | | | |
| | | | Building Materials — 1.0% | | | | |
| $ | 3,255,000 | | | Masco Corp., 4.800%, 6/15/2015 | | $ | 3,148,083 | |
| | 2,220,000 | | | Masco Corp., 5.850%, 3/15/2017 | | | 2,106,134 | |
| | 13,440,000 | | | Masco Corp., 6.125%, 10/03/2016 | | | 13,106,460 | |
| | 6,345,000 | | | Masco Corp., 6.500%, 8/15/2032 | | | 5,619,614 | |
| | 2,475,000 | | | Masco Corp., 7.750%, 8/01/2029 | | | 2,427,826 | |
| | 18,935,000 | | | Owens Corning, Inc., 6.500%, 12/01/2016 | | | 20,425,885 | |
| | 35,980,000 | | | Owens Corning, Inc., 7.000%, 12/01/2036 | | | 37,279,598 | |
| | 46,412,000 | | | USG Corp., 6.300%, 11/15/2016 | | | 33,996,790 | |
| | 14,155,000 | | | USG Corp., 9.750%, 1/15/2018 | | | 11,377,081 | |
| | | | | | | | |
| | | | | | | 129,487,471 | |
| | | | | | | | |
| | | | Chemicals — 0.8% | | | | |
| | 36,355,000 | | | Chevron Phillips Chemical Co. LLC, 8.250%, 6/15/2019, 144A | | | 45,870,485 | |
| | 15,675,000 | | | Hercules, Inc., 6.500%, 6/30/2029 | | | 11,599,500 | |
| | 5,200,000 | | | Hexion US Finance Corp./Hexion Nova Scotia Finance ULC, 8.875%, 2/01/2018 | | | 4,290,000 | |
| | 5,350,000 | | | Methanex Corp., Senior Note, 6.000%, 8/15/2015 | | | 5,507,376 | |
| | 23,584,000 | | | Momentive Specialty Chemicals, Inc., 7.875%, 2/15/2023 | | | 18,159,680 | |
| | 7,420,000 | | | Momentive Specialty Chemicals, Inc., 8.375%, 4/15/2016 | | | 6,195,700 | |
| | 8,757,000 | | | Momentive Specialty Chemicals, Inc., 9.200%, 3/15/2021 | | | 6,567,750 | |
| | | | | | | | |
| | | | | | | 98,190,491 | |
| | | | | | | | |
| | | | Collateralized Mortgage Obligations — 0.1% | | | | |
| | 5,183,110 | | | Banc of America Alternative Loan Trust, Series 2007-1, Class 2A1,
5.542%, 4/25/2037(b) | | | 3,641,243 | |
| | 4,676,021 | | | Banc of America Funding Corp., Series 2007-8, Class 4A1, 6.000%, 8/25/2037 | | | 4,057,038 | |
| | 3,193,954 | | | GSR Mortgage Loan Trust, Series 2005-AR2, Class 2A1, 2.723%, 4/25/2035(b) | | | 2,668,405 | |
| | 6,675,095 | | | WaMu Mortgage Pass Through Certificates, Series 2007-OA6, Class 2A,
2.600%, 7/25/2047(b) | | | 3,697,742 | |
| | 5,586,764 | | | Wells Fargo Mortgage Backed Securities Trust, Series 2005-AR4, Class 2A2, 2.739%, 4/25/2035(b) | | | 5,164,528 | |
| | | | | | | | |
| | | | | | | 19,228,956 | |
| | | | | | | | |
| | | | Construction Machinery — 0.4% | | | | |
| | 16,000,000 | | | Case New Holland, Inc., 7.750%, 9/01/2013 | | | 16,680,000 | |
| | 1,425,000 | | | Joy Global, Inc., 6.625%, 11/15/2036 | | | 1,663,341 | |
| | 1,335,000 | | | RSC Equipment Rental, Inc./RSC Holdings III LLC, 9.500%, 12/01/2014 | | | 1,328,325 | |
| | 10,790,000 | | | Terex Corp., 8.000%, 11/15/2017 | | | 9,549,150 | |
| | 26,935,000 | | | United Rentals North America, Inc., 10.875%, 6/15/2016 | | | 29,089,800 | |
| | | | | | | | |
| | | | | | | 58,310,616 | |
| | | | | | | | |
| | | | Consumer Cyclical Services — 0.4% | | | | |
| | 670,000 | | | ServiceMaster Co. (The), 7.100%, 3/01/2018 | | | 586,250 | |
| | 5,500,000 | | | ServiceMaster Co. (The), 7.450%, 8/15/2027 | | | 4,482,500 | |
| | 37,528,000 | | | Western Union Co. (The), 6.200%, 11/17/2036 | | | 39,754,836 | |
| | 1,048,000 | | | Western Union Co. (The), 6.200%, 6/21/2040 | | | 1,113,797 | |
| | | | | | | | |
| | | | | | | 45,937,383 | |
| | | | | | | | |
See accompanying notes to financial statements.
17 |
Portfolio of Investments – as of September 30, 2011
Loomis Sayles Strategic Income Fund – (continued)
| | | | | | | | |
Principal
Amount (‡) | | | Description | | Value (†) | |
| | | | | | | | |
| | | | Diversified Manufacturing — 0.5% | | | | |
| $ | 6,100,000 | | | Fibria Overseas Finance Ltd., 7.500%, 5/04/2020, 144A | | $ | 5,734,000 | |
| | 1,441,000 | | | Textron Financial Corp., 5.400%, 4/28/2013 | | | 1,478,560 | |
| | 5,310,000 | | | Textron Financial Corp., (fixed rate to 2/15/2017, variable rate thereafter), 6.000%, 2/15/2067, 144A | | | 3,982,500 | |
| | 550,000 | | | Textron Financial Corp., Series E, MTN, 5.125%, 8/15/2014 | | | 571,019 | |
| | 13,850,000 | | | Textron, Inc., 3.875%, 3/11/2013, (EUR) | | | 18,590,271 | |
| | 5,020,000 | | | Textron, Inc., 5.600%, 12/01/2017 | | | 5,294,930 | |
| | 16,040,000 | | | Textron, Inc., EMTN, 6.625%, 4/07/2020, (GBP) | | | 25,305,162 | |
| | | | | | | | |
| | | | | | | 60,956,442 | |
| | | | | | | | |
| | | | Electric — 3.1% | | | | |
| | 7,992,852 | | | AES Ironwood LLC, 8.857%, 11/30/2025 | | | 8,172,691 | |
| | 950,373 | | | AES Red Oak LLC, Series A, 8.540%, 11/30/2019 | | | 974,132 | |
| | 50,171,437 | | | Alta Wind Holdings LLC, 7.000%, 6/30/2035, 144A | | | 53,830,440 | |
| | 69,236,555 | | | Bruce Mansfield Unit, 6.850%, 6/01/2034 | | | 74,083,114 | |
| | 3,028,992 | | | CE Generation LLC, 7.416%, 12/15/2018 | | | 3,199,167 | |
| | 13,340,000 | | | Cleveland Electric Illuminating Co. (The), 5.950%, 12/15/2036 | | | 13,965,086 | |
| | 11,275,000 | | | Dynegy Holdings, Inc., 7.125%, 5/15/2018 | | | 6,595,875 | |
| | 10,185,000 | | | Dynegy Holdings, Inc., 7.625%, 10/15/2026 | | | 5,703,600 | |
| | 8,955,000 | | | Dynegy Holdings, Inc., 7.750%, 6/01/2019 | | | 5,417,775 | |
| | 95,200,000 | | | Edison Mission Energy, 7.625%, 5/15/2027 | | | 52,360,000 | |
| | 25,500,000 | | | EDP Finance BV, 4.900%, 10/01/2019, 144A | | | 18,432,037 | |
| | 1,600,000 | | | EDP Finance BV, EMTN, 4.625%, 6/13/2016, (EUR) | | | 1,680,383 | |
| | 100,000 | | | EDP Finance BV, EMTN, 5.875%, 2/01/2016, (EUR) | | | 107,683 | |
| | 250,000 | | | Empresa Nacional de Electricidad S.A. (Endesa-Chile), 8.350%, 8/01/2013 | | | 273,744 | |
| | 4,875,000 | | | Endesa S.A./Cayman Islands, 7.875%, 2/01/2027 | | | 5,781,994 | |
| | 5,940,000 | | | Energy Future Holdings Corp., 10.000%, 1/15/2020 | | | 5,761,800 | |
| | 555,000 | | | Enersis S.A., Cayman Islands, 7.400%, 12/01/2016 | | | 650,601 | |
| | 31,735,000 | | | NGC Corp. Capital Trust I, Series B, 8.316%, 6/01/2027(c)(d) | | | 11,424,600 | |
| | 25,230,000 | | | RRI Energy, Inc., 7.875%, 6/15/2017 | | | 23,211,600 | |
| | 16,670,000 | | | Texas Competitive Electric Holdings Co. LLC / TCEH Finance, Inc., 11.500%, 10/01/2020, 144A | | | 13,336,000 | |
| | 655,000 | | | Texas Competitive Electric Holdings Co. LLC/TCEH Finance, Inc., Series A, 10.250%, 11/01/2015 | | | 245,625 | |
| | 50,270,000 | | | TXU Corp., Series P, 5.550%, 11/15/2014 | | | 30,916,050 | |
| | 101,735,000 | | | TXU Corp., Series Q, 6.500%, 11/15/2024 | | | 38,659,300 | |
| | 6,675,000 | | | TXU Corp., Series R, 6.550%, 11/15/2034 | | | 2,469,750 | |
| | 7,300,000 | | | White Pine Hydro LLC, 6.310%, 7/10/2017(c) | | | 7,871,225 | |
| | 10,935,000 | | | White Pine Hydro LLC, 6.960%, 7/10/2037(c) | | | 11,788,695 | |
| | 4,000,000 | | | White Pine Hydro Portfolio LLC, 7.260%, 7/20/2015(c) | | | 3,880,200 | |
| | | | | | | | |
| | | | | | | 400,793,167 | |
| | | | | | | | |
| | | | Financial Other — 0.3% | | | | |
| | 19,005,000 | | | Aviation Capital Group Corp., 6.750%, 4/06/2021, 144A | | | 18,284,901 | |
| | 20,000,000 | | | National Life Insurance Co., 10.500%, 9/15/2039, 144A | | | 27,125,640 | |
| | | | | | | | |
| | | | | | | 45,410,541 | |
| | | | | | | | |
See accompanying notes to financial statements.
| 18
Portfolio of Investments – as of September 30, 2011
Loomis Sayles Strategic Income Fund – (continued)
| | | | | | | | |
Principal
Amount (‡) | | | Description | | Value (†) | |
| | | | | | | | |
| | | | Food & Beverage — 0.3% | | | | |
| $ | 2,085,000 | | | ARAMARK Corp., 5.000%, 6/01/2012 | | $ | 2,074,575 | |
| | 23,195,000 | | | Corn Products International, Inc., 6.625%, 4/15/2037 | | | 28,023,666 | |
| | 965,000 | | | Smithfield Foods, Inc., 7.750%, 7/01/2017 | | | 991,537 | |
| | 4,370,000 | | | Viterra, Inc., 6.406%, 2/16/2021, 144A, (CAD) | | | 4,363,369 | |
| | | | | | | | |
| | | | | | | 35,453,147 | |
| | | | | | | | |
| | | | Gaming — 0.0% | | | | |
| | 240,000 | | | MGM Resorts International, 6.625%, 7/15/2015 | | | 203,400 | |
| | 680,000 | | | MGM Resorts International, 6.875%, 4/01/2016 | | | 578,000 | |
| | 450,000 | | | MGM Resorts International, 7.500%, 6/01/2016 | | | 390,375 | |
| | 475,000 | | | MGM Resorts International, 7.625%, 1/15/2017 | | | 407,313 | |
| | | | | | | | |
| | | | | | | 1,579,088 | |
| | | | | | | | |
| | | | Government Owned — No Guarantee — 0.9% | | | | |
| | 26,435,000 | | | Abu Dhabi National Energy Co., 7.250%, 8/01/2018, 144A | | | 30,829,819 | |
| | 19,500,000 | | | DP World Ltd., 6.850%, 7/02/2037, 144A | | | 17,745,000 | |
| | 70,300,000,000 | | | Export-Import Bank of Korea, 6.600%, 11/04/2013, 144A, (IDR) | | | 7,482,671 | |
| | 499,300,000,000 | | | Export-Import Bank of Korea, 8.300%, 3/15/2014, 144A, (IDR) | | | 53,758,535 | |
| | 8,935,000 | | | Petroleos de Venezuela S.A., 5.375%, 4/12/2027 | | | 4,087,762 | |
| | | | | | | | |
| | | | | | | 113,903,787 | |
| | | | | | | | |
| | | | Healthcare — 2.4% | | | | |
| | 4,075,000 | | | Boston Scientific Corp., 5.125%, 1/12/2017 | | | 4,377,112 | |
| | 2,765,000 | | | Boston Scientific Corp., 5.450%, 6/15/2014 | | | 2,974,805 | |
| | 4,155,000 | | | Boston Scientific Corp., 6.400%, 6/15/2016 | | | 4,643,977 | |
| | 16,510,000 | | | Boston Scientific Corp., 7.000%, 11/15/2035 | | | 19,302,865 | |
| | 17,785,000 | | | HCA, Inc., 5.750%, 3/15/2014 | | | 17,340,375 | |
| | 3,800,000 | | | HCA, Inc., 6.250%, 2/15/2013 | | | 3,852,250 | |
| | 17,035,000 | | | HCA, Inc., 6.375%, 1/15/2015 | | | 16,566,538 | |
| | 49,350,000 | | | HCA, Inc., 6.500%, 2/15/2016 | | | 47,129,250 | |
| | 2,074,000 | | | HCA, Inc., 6.750%, 7/15/2013 | | | 2,105,110 | |
| | 14,620,000 | | | HCA, Inc., 7.050%, 12/01/2027 | | | 12,207,700 | |
| | 11,104,000 | | | HCA, Inc., 7.190%, 11/15/2015 | | | 10,770,880 | |
| | 20,447,000 | | | HCA, Inc., 7.500%, 12/15/2023 | | | 18,402,300 | |
| | 24,215,000 | | | HCA, Inc., 7.500%, 11/06/2033 | | | 20,643,288 | |
| | 46,148,000 | | | HCA, Inc., 7.690%, 6/15/2025 | | | 41,533,200 | |
| | 32,745,000 | | | HCA, Inc., 8.360%, 4/15/2024 | | | 31,353,337 | |
| | 15,815,000 | | | HCA, Inc., MTN, 7.580%, 9/15/2025 | | | 14,154,425 | |
| | 9,492,000 | | | HCA, Inc., MTN, 7.750%, 7/15/2036 | | | 8,210,580 | |
| | 2,620,000 | | | Kindred Healthcare, Inc., 8.250%, 6/01/2019, 144A | | | 2,001,025 | |
| | 3,260,000 | | | Owens & Minor, Inc., 6.350%, 4/15/2016(c) | | | 3,506,039 | |
| | 32,559,000 | | | Tenet Healthcare Corp., 6.875%, 11/15/2031 | | | 24,744,840 | |
| | 4,765,000 | | | Tenet Healthcare Corp., 9.250%, 2/01/2015 | | | 4,765,000 | |
| | | | | | | | |
| | | | | | | 310,584,896 | |
| | | | | | | | |
| | | | Home Construction — 0.7% | | | | |
| | 11,265,000 | | | Desarrolladora Homex SAB de CV, 7.500%, 9/28/2015 | | | 10,927,050 | |
| | 4,830,000 | | | K. Hovnanian Enterprises, Inc., 6.250%, 1/15/2015 | | | 1,787,100 | |
| | 16,075,000 | | | K. Hovnanian Enterprises, Inc., 6.250%, 1/15/2016 | | | 5,947,750 | |
See accompanying notes to financial statements.
19 |
Portfolio of Investments – as of September 30, 2011
Loomis Sayles Strategic Income Fund – (continued)
| | | | | | | | |
Principal
Amount (‡) | | | Description | | Value (†) | |
| | | | | | | | |
| | | | Home Construction — continued | | | | |
| $ | 6,040,000 | | | K. Hovnanian Enterprises, Inc., 6.375%, 12/15/2014 | | $ | 3,095,500 | |
| | 2,490,000 | | | K. Hovnanian Enterprises, Inc., 6.500%, 1/15/2014 | | | 1,394,400 | |
| | 6,290,000 | | | K. Hovnanian Enterprises, Inc., 7.500%, 5/15/2016 | | | 2,201,500 | |
| | 1,685,000 | | | KB Home, 5.750%, 2/01/2014 | | | 1,465,950 | |
| | 8,340,000 | | | KB Home, 5.875%, 1/15/2015 | | | 6,755,400 | |
| | 5,805,000 | | | KB Home, 6.250%, 6/15/2015 | | | 4,644,000 | |
| | 11,315,000 | | | KB Home, 7.250%, 6/15/2018 | | | 8,882,275 | |
| | 3,745,000 | | | Pulte Group, Inc., 5.200%, 2/15/2015 | | | 3,389,225 | |
| | 47,260,000 | | | Pulte Group, Inc., 6.000%, 2/15/2035 | | | 31,664,200 | |
| | 13,190,000 | | | Pulte Group, Inc., 6.375%, 5/15/2033 | | | 9,167,050 | |
| | | | | | | | |
| | | | | | | 91,321,400 | |
| | | | | | | | |
| | | | Independent Energy — 0.3% | | | | |
| | 7,570,000 | | | Chesapeake Energy Corp., 6.875%, 11/15/2020 | | | 7,910,650 | |
| | 6,495,000 | | | Hilcorp Energy I LP, 7.750%, 11/01/2015, 144A | | | 6,543,713 | |
| | 4,798,000 | | | Pioneer Natural Resources Co., 7.200%, 1/15/2028 | | | 5,131,619 | |
| | 12,635,000 | | | QEP Resources, Inc., 6.875%, 3/01/2021 | | | 13,203,575 | |
| | 2,499,000 | | | Swift Energy Co., 7.125%, 6/01/2017 | | | 2,449,020 | |
| | | | | | | | |
| | | | | | | 35,238,577 | |
| | | | | | | | |
| | | | Industrial Other — 0.1% | | | | |
| | 10,000,000 | | | Worthington Industries, Inc., 6.500%, 4/15/2020 | | | 10,844,550 | |
| | | | | | | | |
| | | | Life Insurance — 0.7% | | | | |
| | 2,185,000 | | | American International Group, Inc., Series G, MTN, 5.600%, 10/18/2016 | | | 2,161,594 | |
| | 19,625,000 | | | American International Group, Inc., Series G, MTN, 5.850%, 1/16/2018 | | | 19,442,488 | |
| | 4,815,000 | | | American International Group, Inc., Series MP, GMTN, 5.450%, 5/18/2017 | | | 4,610,724 | |
| | 2,855,000 | | | American International Group, Inc., Series MPLE, 4.900%, 6/02/2014, (CAD) | | | 2,670,007 | |
| | 15,000,000 | | | Forethought Financial Group, Inc., 8.625%, 4/15/2021, 144A | | | 15,444,480 | |
| | 15,930,000 | | | MetLife, Inc., 6.400%, 12/15/2066 | | | 14,120,161 | |
| | 9,620,000 | | | MetLife, Inc., 10.750%, 8/01/2069 | | | 12,025,000 | |
| | 8,920,000 | | | NLV Financial Corp., 7.500%, 8/15/2033, 144A | | | 9,116,418 | |
| | 3,910,000 | | | Penn Mutual Life Insurance Co. (The), 6.650%, 6/15/2034, 144A | | | 4,379,743 | |
| | 6,700,000 | | | Unum Group, 7.125%, 9/30/2016 | | | 7,720,283 | |
| | | | | | | | |
| | | | | | | 91,690,898 | |
| | | | | | | | |
| | | | Local Authorities — 1.9% | | | | |
| | 3,905,000 | | | Manitoba (Province of), GMTN, 6.375%, 9/01/2015, (NZD) | | | 3,207,610 | |
| | 79,755,000 | | | New South Wales Treasury Corp., 6.000%, 5/01/2012, (AUD) | | | 77,910,578 | |
| | 10,530,000 | | | New South Wales Treasury Corp., Series 12RG, 6.000%, 5/01/2012, (AUD) | | | 10,267,060 | |
| | 66,305,000 | | | New South Wales Treasury Corp., Series 17RG, 5.500%, 3/01/2017, (AUD) | | | 67,428,885 | |
| | 72,695,000 | | | Queensland Treasury Corp., 7.125%, 9/18/2017, 144A, (NZD) | | | 62,254,328 | |
| | 26,730,000 | | | Queensland Treasury Corp., Series 14, 5.750%, 11/21/2014, (AUD) | | | 26,894,305 | |
| | | | | | | | |
| | | | | | | 247,962,766 | |
| | | | | | | | |
See accompanying notes to financial statements.
| 20
Portfolio of Investments – as of September 30, 2011
Loomis Sayles Strategic Income Fund – (continued)
| | | | | | | | |
Principal
Amount (‡) | | | Description | | Value (†) | |
| | | | | | | | |
| | | | Lodging — 0.0% | | | | |
| $ | 2,850,000 | | | Wyndham Worldwide Corp., 5.750%, 2/01/2018 | | $ | 2,910,531 | |
| | | | | | | | |
| | | | Media Cable — 0.2% | | | | |
| | 25,270,000 | | | Shaw Communications, Inc., 5.650%, 10/01/2019, (CAD) | | | 25,627,624 | |
| | | | | | | | |
| | | | Media Non-Cable — 0.4% | | | | |
| | 3,785,000 | | | Clear Channel Communications, Inc., 5.750%, 1/15/2013 | | | 3,368,650 | |
| | 64,250,000 | | | Clear Channel Communications, Inc., 9.000%, 3/01/2021 | | | 47,705,625 | |
| | | | | | | | |
| | | | | | | 51,074,275 | |
| | | | | | | | |
| | | | Metals & Mining — 0.4% | | | | |
| | 3,949,000 | | | Alcoa, Inc., 5.870%, 2/23/2022 | | | 3,901,051 | |
| | 1,405,000 | | | Alcoa, Inc., 5.950%, 2/01/2037 | | | 1,309,495 | |
| | 4,330,000 | | | Alcoa, Inc., 6.750%, 1/15/2028 | | | 4,481,308 | |
| | 17,905,000 | | | Algoma Acquisition Corp., 9.875%, 6/15/2015, 144A | | | 13,876,375 | |
| | 7,000,000 | | | United States Steel Corp., 6.050%, 6/01/2017 | | | 6,370,000 | |
| | 6,779,000 | | | United States Steel Corp., 6.650%, 6/01/2037 | | | 5,219,830 | |
| | 16,435,000 | | | United States Steel Corp., 7.000%, 2/01/2018 | | | 14,791,500 | |
| | | | | | | | |
| | | | | | | 49,949,559 | |
| | | | | | | | |
| | | | Non-Captive Consumer — 4.5% | | | | |
| | 69,019,000 | | | Residential Capital LLC, 9.625%, 5/15/2015 | | | 53,489,725 | |
| | 995,000 | | | SLM Corp., 6.000%, 5/10/2012, (AUD) | | | 939,780 | |
| | 109,950(††) | | | SLM Corp., 6.000%, 12/15/2043 | | | 2,214,118 | |
| | 20,970,000 | | | SLM Corp., MTN, 5.050%, 11/14/2014 | | | 20,234,414 | |
| | 2,160,000 | | | SLM Corp., MTN, 8.000%, 3/25/2020 | | | 2,132,346 | |
| | 44,478,000 | | | SLM Corp., Series A, MTN, 5.000%, 10/01/2013 | | | 43,538,536 | |
| | 41,770,000 | | | SLM Corp., Series A, MTN, 5.000%, 4/15/2015 | | | 38,952,948 | |
| | 14,465,000 | | | SLM Corp., Series A, MTN, 5.000%, 6/15/2018 | | | 12,712,305 | |
| | 24,705,000 | | | SLM Corp., Series A, MTN, 5.375%, 5/15/2014 | | | 24,313,030 | |
| | 35,405,000 | | | SLM Corp., Series A, MTN, 5.625%, 8/01/2033 | | | 28,192,824 | |
| | 95,060,000 | | | SLM Corp., Series A, MTN, 8.450%, 6/15/2018 | | | 98,878,370 | |
| | 26,150,000 | | | Springleaf Finance Corp., 3.250%, 1/16/2013, (EUR) | | | 31,040,285 | |
| | 10,120,000 | | | Springleaf Finance Corp., MTN, 5.750%, 9/15/2016 | | | 7,387,600 | |
| | 6,900,000 | | | Springleaf Finance Corp., Series H, MTN, 5.375%, 10/01/2012 | | | 6,348,000 | |
| | 10,700,000 | | | Springleaf Finance Corp., Series I, MTN, 4.875%, 7/15/2012 | | | 10,004,500 | |
| | 14,232,000 | | | Springleaf Finance Corp., Series I, MTN, 5.400%, 12/01/2015 | | | 10,389,360 | |
| | 14,430,000 | | | Springleaf Finance Corp., Series I, MTN, 5.850%, 6/01/2013 | | | 12,337,650 | |
| | 600,000 | | | Springleaf Finance Corp., Series J, MTN, 5.200%, 12/15/2011 | | | 589,500 | |
| | 2,900,000 | | | Springleaf Finance Corp., Series J, MTN, 5.900%, 9/15/2012 | | | 2,664,375 | |
| | 800,000 | | | Springleaf Finance Corp., Series J, MTN, 6.500%, 9/15/2017 | | | 570,000 | |
| | 241,395,000 | | | Springleaf Finance Corp., Series J, MTN, 6.900%, 12/15/2017 | | | 173,804,400 | |
| | | | | | | | |
| | | | | | | 580,734,066 | |
| | | | | | | | |
| | | | Non-Captive Diversified — 8.0% | | | | |
| | 22,211,000 | | | Ally Financial, Inc., 6.750%, 12/01/2014 | | | 21,239,269 | |
| | 2,947,000 | | | Ally Financial, Inc., 6.875%, 8/28/2012 | | | 3,002,256 | |
| | 17,038,000 | | | Ally Financial, Inc., 7.500%, 12/31/2013 | | | 17,293,570 | |
| | 35,400,000 | | | Ally Financial, Inc., 7.500%, 9/15/2020 | | | 32,037,000 | |
| | 32,711,000 | | | Ally Financial, Inc., 8.000%, 12/31/2018 | | | 29,767,010 | |
See accompanying notes to financial statements.
21 |
Portfolio of Investments – as of September 30, 2011
Loomis Sayles Strategic Income Fund – (continued)
| | | | | | | | |
Principal
Amount (‡) | | | Description | | Value (†) | |
| | | | | | | | |
| | | | Non-Captive Diversified — continued | | | | |
| $ | 25,955,000 | | | Ally Financial, Inc., 8.000%, 11/01/2031 | | $ | 22,775,512 | |
| | 49,800,000 | | | Ally Financial, Inc., 8.300%, 2/12/2015 | | | 49,239,750 | |
| | 4,777,293 | | | CIT Group, Inc., 7.000%, 5/01/2014 | | | 4,872,838 | |
| | 27,144,615 | | | CIT Group, Inc., 7.000%, 5/01/2015 | | | 26,941,030 | |
| | 61,650,794 | | | CIT Group, Inc., 7.000%, 5/01/2016 | | | 59,801,270 | |
| | 70,757,457 | | | CIT Group, Inc., 7.000%, 5/01/2017 | | | 68,634,733 | |
| | 3,100,000 | | | General Electric Capital Corp., EMTN, 6.125%, 5/17/2012, (GBP) | | | 4,939,459 | |
| | 79,035,000 | | | General Electric Capital Corp., Series A, EMTN, 6.750%, 9/26/2016, (NZD) | | | 64,061,929 | |
| | 65,300,000 | | | General Electric Capital Corp., Series A, GMTN, 2.960%, 5/18/2012, (SGD) | | | 50,394,635 | |
| | 115,000,000 | | | General Electric Capital Corp., Series A, GMTN, 3.485%, 3/08/2012, (SGD) | | | 88,479,570 | |
| | 58,490,000 | | | General Electric Capital Corp., Series A, GMTN, 7.625%, 12/10/2014, (NZD) | | | 48,392,937 | |
| | 15,305,000 | | | General Electric Capital Corp., Series A, MTN, 0.549%, 5/13/2024(b) | | | 12,477,830 | |
| | 245,797,000 | | | General Electric Capital Corp., Series A, MTN, 6.500%, 9/28/2015, (NZD) | | | 197,975,068 | |
| | 360,000 | | | International Lease Finance Corp., 5.875%, 5/01/2013 | | | 347,400 | |
| | 9,289,000 | | | International Lease Finance Corp., 6.375%, 3/25/2013 | | | 9,033,553 | |
| | 20,610,000 | | | International Lease Finance Corp., 7.125%, 9/01/2018, 144A | | | 20,687,287 | |
| | 16,430,000 | | | International Lease Finance Corp., 8.250%, 12/15/2020 | | | 16,101,400 | |
| | 24,750,000 | | | International Lease Finance Corp., 8.625%, 9/15/2015 | | | 24,564,375 | |
| | 2,620,000 | | | International Lease Finance Corp., Series R, MTN, 5.625%, 9/20/2013 | | | 2,515,200 | |
| | 2,547,000 | | | International Lease Finance Corp., Series R, MTN, 5.650%, 6/01/2014 | | | 2,362,343 | |
| | 34,782,000 | | | iStar Financial, Inc., 5.150%, 3/01/2012 | | | 33,390,720 | |
| | 3,010,000 | | | iStar Financial, Inc., 5.500%, 6/15/2012 | | | 2,882,075 | |
| | 23,175,000 | | | iStar Financial, Inc., 5.850%, 3/15/2017 | | | 17,844,750 | |
| | 20,478,000 | | | iStar Financial, Inc., 5.875%, 3/15/2016 | | | 16,177,620 | |
| | 8,300,000 | | | iStar Financial, Inc., 6.050%, 4/15/2015 | | | 6,557,000 | |
| | 35,130,000 | | | iStar Financial, Inc., 8.625%, 6/01/2013 | | | 31,968,300 | |
| | 2,920,000 | | | iStar Financial, Inc., Series B, 5.700%, 3/01/2014 | | | 2,336,000 | |
| | 44,610,000 | | | iStar Financial, Inc., Series B, 5.950%, 10/15/2013 | | | 38,699,175 | |
| | | | | | | | |
| | | | | | | 1,027,792,864 | |
| | | | | | | | |
| | | | Oil Field Services — 0.9% | | | | |
| | 7,015,000 | | | Allis-Chalmers Energy, Inc., 8.500%, 3/01/2017 | | | 6,874,700 | |
| | 77,565,000 | | | Nabors Industries, Inc., 9.250%, 1/15/2019 | | | 98,120,888 | |
| | 3,095,000 | | | Parker Drilling Co., 9.125%, 4/01/2018 | | | 3,125,950 | |
| | 7,275,000 | | | Rowan Cos., Inc., 7.875%, 8/01/2019 | | | 8,589,811 | |
| | | | | | | | |
| | | | | | | 116,711,349 | |
| | | | | | | | |
| | | | Packaging — 0.3% | | | | |
| | 2,450,000 | | | OI European Group BV, 6.875%, 3/31/2017, 144A, (EUR) | | | 3,101,856 | |
| | 33,261,000 | | | Owens-Illinois, Inc., 7.800%, 5/15/2018 | | | 34,092,525 | |
| | | | | | | | |
| | | | | | | 37,194,381 | |
| | | | | | | | |
| | | | Paper — 1.2% | | | | |
| | 14,715,000 | | | Georgia-Pacific LLC, 7.250%, 6/01/2028 | | | 16,385,535 | |
| | 12,410,000 | | | Georgia-Pacific LLC, 7.375%, 12/01/2025 | | | 13,846,743 | |
| | 120,000 | | | Georgia-Pacific LLC, 7.700%, 6/15/2015 | | | 137,548 | |
See accompanying notes to financial statements.
| 22
Portfolio of Investments – as of September 30, 2011
Loomis Sayles Strategic Income Fund – (continued)
| | | | | | | | |
Principal
Amount (‡) | | | Description | | Value (†) | |
| | | | | | | | |
| | | | Paper — continued | | | | |
| $ | 47,875,000 | | | Georgia-Pacific LLC, 7.750%, 11/15/2029 | | $ | 55,362,650 | |
| | 11,003,000 | | | Georgia-Pacific LLC, 8.875%, 5/15/2031 | | | 13,732,866 | |
| | 14,520,000 | | | Westvaco Corp., 7.950%, 2/15/2031 | | | 16,385,501 | |
| | 25,210,000 | | | Westvaco Corp., 8.200%, 1/15/2030 | | | 28,580,754 | |
| | 2,840,000 | | | Weyerhaeuser Co., 6.950%, 10/01/2027 | | | 3,039,147 | |
| | 5,490,000 | | | Weyerhaeuser Co., 7.375%, 3/15/2032 | | | 5,475,292 | |
| | | | | | | | |
| | | | | | | 152,946,036 | |
| | | | | | | | |
| | | | Pipelines — 2.0% | | | | |
| | 750,000 | | | El Paso Corp., GMTN, 7.800%, 8/01/2031 | | | 871,552 | |
| | 5,255,000 | | | Energy Transfer Partners LP, 6.125%, 2/15/2017 | | | 5,720,530 | |
| | 9,115,000 | | | Energy Transfer Partners LP, 6.625%, 10/15/2036 | | | 9,368,971 | |
| | 13,175,000 | | | Enterprise Products Operating LLP, 6.300%, 9/15/2017 | | | 15,293,883 | |
| | 5,100,000 | | | Florida Gas Transmission Co., 7.900%, 5/15/2019, 144A | | | 6,498,389 | |
| | 21,200,000 | | | IFM US Colonial Pipeline 2 LLC, 6.450%, 5/01/2021, 144A | | | 23,809,890 | |
| | 43,468,428 | | | Maritimes & Northeast Pipeline LLC, 7.500%, 5/31/2014, 144A(c) | | | 46,986,763 | |
| | 81,710,000 | | | NGPL PipeCo LLC, 7.119%, 12/15/2017, 144A | | | 86,165,483 | |
| | 43,450,000 | | | NiSource Finance Corp., 6.400%, 3/15/2018 | | | 50,586,141 | |
| | 10,770,000 | | | Plains All American Pipeline LP, 6.125%, 1/15/2017 | | | 12,122,055 | |
| | 4,168,000 | | | Transportadora de Gas del Sur S.A., 7.875%, 5/14/2017, 144A | | | 3,667,840 | |
| | | | | | | | |
| | | | | | | 261,091,497 | |
| | | | | | | | |
| | | | Property & Casualty Insurance — 0.4% | | | | |
| | 14,855,000 | | | Hanover Insurance Group, Inc. (The), 6.375%, 6/15/2021 | | | 15,572,155 | |
| | 3,405,000 | | | Hanover Insurance Group, Inc. (The), 7.500%, 3/01/2020 | | | 3,839,138 | |
| | 11,075,000 | | | Marsh & McLennan Cos., Inc., 5.875%, 8/01/2033 | | | 12,274,035 | |
| | 6,080,000 | | | MBIA Insurance Corp., (fixed rate to 1/15/2013, variable rate thereafter),
14.000%, 1/15/2033, 144A | | | 2,736,000 | |
| | 2,275,000 | | | Nationwide Mutual Insurance Co., 6.600%, 4/15/2034, 144A | | | 2,111,964 | |
| | 11,200,000 | | | White Mountains Re Group Ltd., 6.375%, 3/20/2017, 144A | | | 11,243,400 | |
| | 4,445,000 | | | XL Group PLC, 6.250%, 5/15/2027 | | | 4,556,258 | |
| | 1,425,000 | | | XL Group PLC, 6.375%, 11/15/2024 | | | 1,504,666 | |
| | | | | | | | |
| | | | | | | 53,837,616 | |
| | | | | | | | |
| | | | Property Trust — 0.4% | | | | |
| | 46,015,000 | | | WEA Finance LLC/WT Finance Australia Property Ltd., 6.750%, 9/02/2019, 144A | | | 51,130,396 | |
| | | | | | | | |
| | | | Railroads — 0.0% | | | | |
| | 1,153,000 | | | Missouri Pacific Railroad Co., 5.000%, 1/01/2045(c) | | | 830,160 | |
| | | | | | | | |
| | | | REITs — Apartments — 0.3% | | | | |
| | 2,025,000 | | | Camden Property Trust, 5.000%, 6/15/2015 | | | 2,161,305 | |
| | 27,950,000 | | | Camden Property Trust, 5.700%, 5/15/2017 | | | 30,568,272 | |
| | | | | | | | |
| | | | | | | 32,729,577 | |
| | | | | | | | |
| | | | REITs — Diversified — 0.0% | | | | |
| | 4,030,000 | | | Duke Realty LP, 5.950%, 2/15/2017 | | | 4,221,695 | |
| | | | | | | | |
| | | | REITs — Office Property — 0.4% | | | | |
| | 47,305,000 | | | Highwoods Properties, Inc., 5.850%, 3/15/2017 | | | 49,894,712 | |
| | | | | | | | |
See accompanying notes to financial statements.
23 |
Portfolio of Investments – as of September 30, 2011
Loomis Sayles Strategic Income Fund – (continued)
| | | | | | | | |
Principal
Amount (‡) | | | Description | | Value (†) | |
| | | | | | | | |
| | | | REITs — Warehouse/Industrials — 0.1% | | | | |
| $ | 4,180,000 | | | ProLogis LP, 5.625%, 11/15/2015 | | $ | 4,315,223 | |
| | 3,915,000 | | | ProLogis LP, 5.625%, 11/15/2016 | | | 3,971,423 | |
| | 4,635,000 | | | ProLogis LP, 5.750%, 4/01/2016 | | | 4,736,233 | |
| | 1,662,000 | | | ProLogis LP, 6.625%, 5/15/2018 | | | 1,723,463 | |
| | 1,100,000 | | | ProLogis LP, 6.875%, 3/15/2020 | | | 1,147,601 | |
| | 2,080,000 | | | ProLogis LP, 7.375%, 10/30/2019 | | | 2,249,934 | |
| | | | | | | | |
| | | | | | | 18,143,877 | |
| | | | | | | | |
| | | | Retailers — 1.1% | | | | |
| | 8,758,000 | | | Dillard’s, Inc., 6.625%, 1/15/2018 | | | 8,582,840 | |
| | 3,325,000 | | | Dillard’s, Inc., 7.000%, 12/01/2028 | | | 2,959,250 | |
| | 4,187,000 | | | Dillard’s, Inc., 7.130%, 8/01/2018 | | | 4,187,000 | |
| | 1,500,000 | | | Dillard’s, Inc., 7.750%, 7/15/2026 | | | 1,425,000 | |
| | 425,000 | | | Dillard’s, Inc., 7.875%, 1/01/2023 | | | 418,625 | |
| | 10,270,000 | | | Foot Locker, Inc., 8.500%, 1/15/2022 | | | 10,424,050 | |
| | 3,685,000 | | | J.C. Penney Corp., Inc., 5.750%, 2/15/2018 | | | 3,592,875 | |
| | 37,064,000 | | | J.C. Penney Corp., Inc., 6.375%, 10/15/2036 | | | 31,133,760 | |
| | 635,000 | | | J.C. Penney Corp., Inc., 7.125%, 11/15/2023 | | | 641,350 | |
| | 3,985,000 | | | J.C. Penney Corp., Inc., 7.625%, 3/01/2097 | | | 3,347,400 | |
| | 15,907,000 | | | Macy’s Retail Holdings, Inc., 6.375%, 3/15/2037 | | | 17,452,938 | |
| | 12,275,000 | | | Macy’s Retail Holdings, Inc., 6.790%, 7/15/2027 | | | 12,367,995 | |
| | 2,365,000 | | | Macy’s Retail Holdings, Inc., 6.900%, 4/01/2029 | | | 2,654,069 | |
| | 6,365,000 | | | Marks & Spencer PLC, 7.125%, 12/01/2037, 144A | | | 6,819,429 | |
| | 32,675,000 | | | Toys R Us, Inc., 7.375%, 10/15/2018 | | | 27,773,750 | |
| | 8,355,000 | | | Toys R Us, Inc., 7.875%, 4/15/2013 | | | 8,250,563 | |
| | | | | | | | |
| | | | | | | 142,030,894 | |
| | | | | | | | |
| | | | Sovereigns — 3.1% | | | | |
| | 104,626,000,000 | | | Indonesia Treasury Bond, Series FR43, 10.250%, 7/15/2022, (IDR) | | | 14,698,263 | |
| | 10,000,000,000 | | | Indonesia Treasury Bond, Series FR47, 10.000%, 2/15/2028, (IDR) | | | 1,410,793 | |
| | 272,460,000,000 | | | Indonesia Treasury Bond, Series ZC3, Zero Coupon, 11/20/2012, (IDR) | | | 29,336,007 | |
| | 18,686,981(†††) | | | Mexican Fixed Rate Bonds, Series M-20, 8.000%, 12/07/2023, (MXN) | | | 149,146,994 | |
| | 56,700,000 | | | Republic of Brazil, 10.250%, 1/10/2028, (BRL) | | | 31,663,343 | |
| | 49,120,000 | | | Republic of Brazil, 12.500%, 1/05/2016, (BRL) | | | 29,128,467 | |
| | 107,840,000 | | | Republic of Brazil, 12.500%, 1/05/2022, (BRL) | �� | | 67,391,038 | |
| | 18,400,000 | | | Republic of Croatia, 6.750%, 11/05/2019, 144A | | | 17,792,800 | |
| | 3,639,662,000 | | | Republic of Iceland, 4.250%, 8/24/2012, (ISK) | | | 18,969,428 | |
| | 3,481,377,000 | | | Republic of Iceland, 6.000%, 10/13/2016, (ISK) | | | 19,010,303 | |
| | 3,178,700,000 | | | Republic of Iceland, 7.250%, 5/17/2013, (ISK) | | | 17,360,972 | |
| | | | | | | | |
| | | | | | | 395,908,408 | |
| | | | | | | | |
| | | | Supermarkets — 0.8% | | | | |
| | 8,336,000 | | | American Stores Co., 7.900%, 5/01/2017 | | | 7,710,800 | |
| | 73,686,000 | | | New Albertson’s, Inc., 7.450%, 8/01/2029 | | | 55,264,500 | |
| | 20,250,000 | | | New Albertson’s, Inc., 7.750%, 6/15/2026 | | | 16,605,000 | |
| | 9,430,000 | | | New Albertson’s, Inc., 8.000%, 5/01/2031 | | | 7,449,700 | |
| | 2,795,000 | | | New Albertson’s, Inc., 8.700%, 5/01/2030 | | | 2,382,737 | |
| | 13,707,000 | | | New Albertson’s, Inc., Series C, MTN, 6.625%, 6/01/2028 | | | 9,526,365 | |
| | | | | | | | |
| | | | | | | 98,939,102 | |
| | | | | | | | |
See accompanying notes to financial statements.
| 24
Portfolio of Investments – as of September 30, 2011
Loomis Sayles Strategic Income Fund – (continued)
| | | | | | | | |
Principal
Amount (‡) | | | Description | | Value (†) | |
| | | | | | | | |
| | | | Supranational — 2.0% | | | | |
| | 108,310,000 | | | European Bank for Reconstruction & Development, GMTN,
9.000%, 4/28/2014, (BRL) | | $ | 58,829,280 | |
| | 20,250,000 | | | European Bank for Reconstruction & Development, GMTN,
9.250%, 9/10/2012, (BRL) | | | 10,913,083 | |
| | 16,375,000 | | | European Investment Bank, 11.250%, 2/14/2013, (BRL) | | | 9,024,212 | |
| | 460,500,000,000 | | | European Investment Bank, EMTN, Zero Coupon, 4/24/2013, 144A, (IDR) | | | 45,133,191 | |
| | 24,398,000 | | | European Investment Bank, EMTN, 7.000%, 1/18/2012, (NZD) | | | 18,785,523 | |
| | 60,665,000 | | | European Investment Bank, MTN, 6.250%, 4/15/2015, (AUD) | | | 61,797,841 | |
| | 244,840,000,000 | | | Inter-American Development Bank, EMTN, Zero Coupon, 5/20/2013, (IDR) | | | 23,982,621 | |
| | 24,450,000 | | | Inter-American Development Bank, EMTN, 6.000%, 12/15/2017, (NZD) | | | 20,168,851 | |
| | 8,300,000 | | | International Bank for Reconstruction & Development,
1.430%, 3/05/2014, (SGD) | | | 6,471,988 | |
| | | | | | | | |
| | | | | | | 255,106,590 | |
| | | | | | | | |
| | | | Technology — 1.6% | | | | |
| | 1,370,000 | | | Advanced Micro Devices, Inc., 7.750%, 8/01/2020 | | | 1,342,600 | |
| | 41,705,000 | | | Agilent Technologies, Inc., 6.500%, 11/01/2017 | | | 48,797,853 | |
| | 550,000 | | | Alcatel-Lucent, 8.500%, 1/15/2016, (EUR) | | | 692,651 | |
| | 832,000 | | | Alcatel-Lucent, EMTN, 6.375%, 4/07/2014, (EUR) | | | 1,103,525 | |
| | 60,755,000 | | | Alcatel-Lucent USA, Inc., 6.450%, 3/15/2029 | | | 50,426,650 | |
| | 5,480,000 | | | Alcatel-Lucent USA, Inc., 6.500%, 1/15/2028 | | | 4,548,400 | |
| | 2,435,000 | | | Arrow Electronics, Inc., 6.875%, 6/01/2018 | | | 2,703,948 | |
| | 10,600,000 | | | Avnet, Inc., 5.875%, 3/15/2014 | | | 11,347,088 | |
| | 35,630,000 | | | Avnet, Inc., 6.000%, 9/01/2015 | | | 38,518,631 | |
| | 11,345,000 | | | Avnet, Inc., 6.625%, 9/15/2016 | | | 12,616,048 | |
| | 6,150,000 | | | Corning, Inc., 6.850%, 3/01/2029 | | | 7,543,202 | |
| | 6,960,000 | | | Eastman Kodak Co., 7.250%, 11/15/2013 | | | 1,740,000 | |
| | 95,000 | | | Freescale Semiconductor, Inc., 8.875%, 12/15/2014 | | | 96,425 | |
| | 6,290,000 | | | Freescale Semiconductor, Inc., 10.125%, 12/15/2016 | | | 6,400,075 | |
| | 475,000 | | | Motorola Solutions, Inc., 6.000%, 11/15/2017 | | | 529,796 | |
| | 2,562,000 | | | Motorola Solutions, Inc., 6.625%, 11/15/2037 | | | 3,047,066 | |
| | 9,260,000 | | | Nortel Networks Capital Corp., 7.875%, 6/15/2026(e) | | | 9,537,800 | |
| | 255,000 | | | Samsung Electronics Co. Ltd., 7.700%, 10/01/2027, 144A | | | 306,540 | |
| | 1,730,000 | | | Xerox Corp., MTN, 7.200%, 4/01/2016 | | | 2,003,259 | |
| | | | | | | | |
| | | | | | | 203,301,557 | |
| | | | | | | | |
| | | | Tobacco — 0.2% | | | | |
| | 12,780,000 | | | Reynolds American, Inc., 6.750%, 6/15/2017 | | | 14,729,998 | |
| | 6,175,000 | | | Reynolds American, Inc., 7.250%, 6/15/2037 | | | 6,933,222 | |
| | | | | | | | |
| | | | | | | 21,663,220 | |
| | | | | | | | |
| | | | Transportation Services — 0.4% | | | | |
| | 10,503,000 | | | APL Ltd., 8.000%, 1/15/2024(c) | | | 6,721,920 | |
| | 10,760,161 | | | Atlas Air Pass Through Trust, Series 1998-1, Class B,
7.680%, 7/02/2015 | | | 9,899,348 | |
| | 6,862,758 | | | Atlas Air Pass Through Trust, Series 1998-1, Class C, 8.010%, 7/02/2011(d)(k) | | | 5,215,696 | |
See accompanying notes to financial statements.
25 |
Portfolio of Investments – as of September 30, 2011
Loomis Sayles Strategic Income Fund – (continued)
| | | | | | | | |
Principal
Amount (‡) | | | Description | | Value (†) | |
| | | | | | | | |
| | | | Transportation Services — continued | | | | |
| $ | 7,006,575 | | | Atlas Air Pass Through Trust, Series 1999-1, Class A-1, 7.200%, 7/02/2020 | | $ | 6,516,115 | |
| | 97,637 | | | Atlas Air Pass Through Trust, Series 1999-1, Class A-2, 6.880%, 4/02/2014 | | | 89,826 | |
| | 8,204,741 | | | Atlas Air Pass Through Trust, Series 1999-1, Class B,
7.630%, 7/02/2016 | | | 6,727,887 | |
| | 4,744,556 | | | Atlas Air Pass Through Trust, Series 1999-1, Class C, 8.770%, 7/02/2012(d) | | | 3,416,080 | |
| | 4,009,281 | | | Atlas Air Pass Through Trust, Series 2000-1, Class B,
10.128%, 7/02/2017 | | | 3,688,539 | |
| | 3,970,000 | | | Erac USA Finance Co., 7.000%, 10/15/2037, 144A | | | 4,625,050 | |
| | | | | | | | |
| | | | | | | 46,900,461 | |
| | | | | | | | |
| | | | Treasuries — 12.3% | | | | |
| | 320,680,000 | | | Canadian Government, 2.000%, 9/01/2012, (CAD) | | | 309,237,854 | |
| | 80,216,000 | | | Canadian Government, 3.500%, 6/01/2013, (CAD) | | | 79,854,687 | |
| | 171,980,000 | | | Canadian Government, 3.750%, 6/01/2019, (CAD) | | | 186,174,628 | |
| | 25,445,000 | | | Canadian Government, 4.250%, 6/01/2018, (CAD) | | | 28,209,008 | |
| | 4,175,632 | | | Hellenic Republic Government Bond, 2.300%, 7/25/2030, (EUR) | | | 1,656,443 | |
| | 2,520,000 | | | Hellenic Republic Government Bond, 4.500%, 9/20/2037, (EUR) | | | 1,053,702 | |
| | 1,350,000 | | | Hellenic Republic Government Bond, 4.600%, 7/20/2018, (EUR) | | | 742,727 | |
| | 69,280,000 | | | Hellenic Republic Government Bond, 4.700%, 3/20/2024, (EUR) | | | 29,246,911 | |
| | 47,935,000 | | | Hellenic Republic Government International Bond, 2.125%, 7/05/2013, (CHF) | | | 33,949,657 | |
| | 118,375,000 | | | Ireland Government Bond, 4.500%, 10/18/2018, (EUR) | | | 133,950,725 | |
| | 52,325,000 | | | Ireland Government Bond, 4.500%, 4/18/2020, (EUR) | | | 57,701,995 | |
| | 7,325,000 | | | Ireland Government Bond, 5.000%, 10/18/2020, (EUR) | | | 8,180,477 | |
| | 111,500,000 | | | Ireland Government Bond, 5.400%, 3/13/2025, (EUR) | | | 123,688,385 | |
| | 22,670,000 | | | New Zealand Government Bond, 6.000%, 12/15/2017, (NZD) | | | 19,184,763 | |
| | 151,035,000 | | | New Zealand Government Bond, 6.500%, 4/15/2013, (NZD) | | | 121,369,580 | |
| | 457,420,000 | | | Norwegian Government, 4.250%, 5/19/2017, (NOK) | | | 87,250,560 | |
| | 221,050,000 | | | Norwegian Government, 5.000%, 5/15/2015, (NOK) | | | 42,011,023 | |
| | 1,520,540,000 | | | Norwegian Government, 6.500%, 5/15/2013, (NOK) | | | 279,486,810 | |
| | 27,700,000 | | | Portugal Obrigacoes do Tesouro OT, 3.850%, 4/15/2021, (EUR) | | | 21,461,332 | |
| | 6,225,000 | | | Portugal Obrigacoes do Tesouro OT, 4.800%, 6/15/2020, (EUR) | | | 5,038,518 | |
| | 13,200,000 | | | Portugal Obrigacoes do Tesouro OT, 4.950%, 10/25/2023, (EUR) | | | 10,433,972 | |
| | | | | | | | |
| | | | | | | 1,579,883,757 | |
| | | | | | | | |
| | | | Utility Other — 0.0% | | | | |
| | 3,300,000 | | | Listrindo Capital BV, 9.250%, 1/29/2015, 144A | | | 3,238,884 | |
| | | | | | | | |
| | | | Wireless — 1.1% | | | | |
| | 42,310,000 | | | Nextel Communications, Inc., Series C, 5.950%, 3/15/2014 | | | 39,665,625 | |
| | 30,755,000 | | | Nextel Communications, Inc., Series D, 7.375%, 8/01/2015 | | | 29,140,362 | |
| | 3,628,000 | | | Nextel Communications, Inc., Series E, 6.875%, 10/31/2013 | | | 3,528,230 | |
| | 31,041,000 | | | Sprint Capital Corp., 6.875%, 11/15/2028 | | | 23,203,148 | |
| | 29,252,000 | | | Sprint Capital Corp., 6.900%, 5/01/2019 | | | 25,156,720 | |
| | 6,260,000 | | | Sprint Capital Corp., 8.750%, 3/15/2032 | | | 5,438,375 | |
See accompanying notes to financial statements.
| 26
Portfolio of Investments – as of September 30, 2011
Loomis Sayles Strategic Income Fund – (continued)
| | | | | | | | |
Principal
Amount (‡) | | | Description | | Value (†) | |
| | | | | | | | |
| | | | Wireless — continued | | | | |
| $ | 11,309,000 | | | Sprint Nextel Corp., 6.000%, 12/01/2016 | | $ | 9,725,740 | |
| | 10,170,000 | | | True Move Co. Ltd., 10.750%, 12/16/2013, 144A | | | 10,780,200 | |
| | | | | | | | |
| | | | | | | 146,638,400 | |
| | | | | | | | |
| | | | Wirelines — 3.9% | | | | |
| | 5,650,000 | | | Axtel SAB de CV, 9.000%, 9/22/2019, 144A | | | 4,746,000 | |
| | 4,370,000 | | | Bell Canada, MTN, 6.550%, 5/01/2029, 144A, (CAD) | | | 4,704,412 | |
| | 21,480,000 | | | Bell Canada, Series M-17, 6.100%, 3/16/2035, (CAD) | | | 21,748,936 | |
| | 2,715,000 | | | BellSouth Telecommunications, Inc., 7.000%, 12/01/2095 | | | 3,217,096 | |
| | 72,320,000 | | | CenturyLink, Inc., 6.450%, 6/15/2021 | | | 67,012,869 | |
| | 7,410,000 | | | CenturyLink, Inc., Series G, 6.875%, 1/15/2028 | | | 6,415,904 | |
| | 2,965,000 | | | CenturyLink, Inc., Series P, 7.600%, 9/15/2039 | | | 2,667,071 | |
| | 350,000 | | | Cincinnati Bell Telephone Co. LLC, 6.300%, 12/01/2028 | | | 264,250 | |
| | 155,000 | | | Cincinnati Bell, Inc., 7.000%, 2/15/2015 | | | 153,063 | |
| | 5,330,000 | | | Embarq Corp., 7.995%, 6/01/2036 | | | 5,001,107 | |
| | 38,336,000 | | | Frontier Communications Corp., 7.875%, 1/15/2027 | | | 33,160,640 | |
| | 1,120,000 | | | Koninklijke (Royal) KPN NV, EMTN, 5.750%, 3/18/2016, (GBP) | | | 1,923,976 | |
| | 1,800,000 | | | Koninklijke (Royal) KPN NV, GMTN, 4.000%, 6/22/2015, (EUR) | | | 2,483,655 | |
| | 50,080,000 | | | Level 3 Financing, Inc., 8.750%, 2/15/2017 | | | 46,136,200 | |
| | 8,399,000 | | | Level 3 Financing, Inc., 9.250%, 11/01/2014 | | | 8,294,013 | |
| | 2,555,000 | | | Level 3 Financing, Inc., 9.375%, 4/01/2019, 144A | | | 2,376,150 | |
| | 500,000 | | | OTE PLC, GMTN, 4.625%, 5/20/2016, (EUR) | | | 396,901 | |
| | 10,750,000 | | | Portugal Telecom International Finance BV, EMTN,
4.500%, 6/16/2025, (EUR) | | | 9,361,502 | |
| | 26,800,000 | | | Portugal Telecom International Finance BV, EMTN,
5.000%, 11/04/2019, (EUR) | | | 26,749,445 | |
| | 16,335,000 | | | Qwest Capital Funding, Inc., 6.500%, 11/15/2018 | | | 15,681,600 | |
| | 42,460,000 | | | Qwest Capital Funding, Inc., 6.875%, 7/15/2028 | | | 36,727,900 | |
| | 12,463,000 | | | Qwest Capital Funding, Inc., 7.625%, 8/03/2021 | | | 12,899,205 | |
| | 32,395,000 | | | Qwest Capital Funding, Inc., 7.750%, 2/15/2031 | | | 30,127,350 | |
| | 31,060,000 | | | Qwest Corp., 6.875%, 9/15/2033 | | | 29,351,700 | |
| | 3,075,000 | | | Qwest Corp., 7.200%, 11/10/2026 | | | 2,921,250 | |
| | 3,999,000 | | | Qwest Corp., 7.250%, 9/15/2025 | | | 3,859,035 | |
| | 2,288,000 | | | Qwest Corp., 7.500%, 6/15/2023 | | | 2,256,723 | |
| | 5,470,000 | | | SK Broadband Co. Ltd., 7.000%, 2/01/2012, 144A | | | 5,516,057 | |
| | 25,655,000 | | | Telecom Italia Capital S.A., 6.000%, 9/30/2034 | | | 20,987,971 | |
| | 20,965,000 | | | Telecom Italia Capital S.A., 6.375%, 11/15/2033 | | | 17,935,578 | |
| | 31,690,000 | | | Telus Corp., 4.950%, 3/15/2017, (CAD) | | | 32,872,440 | |
| | 18,600,000 | | | Telus Corp., Series CG, 5.050%, 12/04/2019, (CAD) | | | 19,241,832 | |
| | 9,835,000 | | | Verizon Maryland, Inc., Series B, 5.125%, 6/15/2033 | | | 9,995,910 | |
| | 3,346,000 | | | Verizon New England, Inc., 7.875%, 11/15/2029 | | | 4,182,995 | |
| | 5,215,000 | | | Verizon Pennsylvania, Inc., 6.000%, 12/01/2028 | | | 5,810,553 | |
| | | | | | | | |
| | | | | | | 497,181,289 | |
| | | | | | | | |
| | | | Total Non-Convertible Bonds
(Identified Cost $8,799,240,755) | | | 8,966,357,377 | |
| | | | | | | | |
| | | | | | | | |
See accompanying notes to financial statements.
27 |
Portfolio of Investments – as of September 30, 2011
Loomis Sayles Strategic Income Fund – (continued)
| | | | | | | | |
Principal
Amount (‡) | | | Description | | Value (†) | |
| | | | | | | | |
| | Convertible Bonds — 7.6% | | | | |
| | | | Airlines — 0.1% | | | | |
| $ | 21,960,000 | | | AMR Corp., 6.250%, 10/15/2014 | | $ | 12,983,850 | |
| | 1,255,000 | | | United Continental Holdings, Inc., 4.500%, 6/30/2021 | | | 1,104,400 | |
| | | | | | | | |
| | | | | | | 14,088,250 | |
| | | | | | | | |
| | | | Automotive — 1.4% | | | | |
| | 2,305,000 | | | ArvinMeritor, Inc., (Step to Zero Coupon on 2/15/2019), 4.000%, 2/15/2027(f) | | | 1,570,281 | |
| | 125,580,000 | | | Ford Motor Co., 4.250%, 11/15/2016 | | | 163,097,025 | |
| | 8,460,000 | | | Navistar International Corp., 3.000%, 10/15/2014 | | | 8,396,550 | |
| | | | | | | | |
| | | | | | | 173,063,856 | |
| | | | | | | | |
| | | | Diversified Manufacturing — 0.3% | | | | |
| | 30,570,000 | | | Owens-Brockway Glass Container, Inc., 3.000%, 6/01/2015, 144A | | | 27,513,000 | |
| | 16,727,000 | | | Trinity Industries, Inc., 3.875%, 6/01/2036 | | | 15,033,391 | |
| | | | | | | | |
| | | | | | | 42,546,391 | |
| | | | | | | | |
| | | | Electric — 0.0% | | | | |
| | 1,800,000 | | | CMS Energy Corp., 5.500%, 6/15/2029 | | | 2,623,500 | |
| | | | | | | | |
| | | | Healthcare — 0.5% | | | | |
| | 19,215,000 | | | Hologic, Inc., 2.000% (accretes to principal after 12/15/2013), 12/15/2037(f) | | | 17,990,044 | |
| | 12,005,000 | | | Life Technologies Corp., 1.500%, 2/15/2024 | | | 12,125,050 | |
| | 190,000 | | | LifePoint Hospitals, Inc., 3.250%, 8/15/2025 | | | 192,137 | |
| | 2,380,000 | | | LifePoint Hospitals, Inc., 3.500%, 5/15/2014 | | | 2,409,750 | |
| | 5,445,000 | | | Omnicare, Inc., 3.250%, 12/15/2035 | | | 4,920,919 | |
| | 20,495,000 | | | Omnicare, Inc., 3.750%, 12/15/2025 | | | 22,928,781 | |
| | | | | | | | |
| | | | | | | 60,566,681 | |
| | | | | | | | |
| | | | Independent Energy — 0.2% | | | | |
| | 20,440,000 | | | Chesapeake Energy Corp., 2.250%, 12/15/2038 | | | 17,348,450 | |
| | 7,230,000 | | | Chesapeake Energy Corp., 2.500%, 5/15/2037 | | | 6,886,575 | |
| | | | | | | | |
| | | | | | | 24,235,025 | |
| | | | | | | | |
| | | | Life Insurance — 0.5% | | | | |
| | 72,915,000 | | | Old Republic International Corp., 3.750%, 3/15/2018 | | | 65,896,931 | |
| | | | | | | | |
| | | | Media Non-Cable — 0.0% | | | | |
| | 7,641,444 | | | Liberty Media LLC, 3.500%, 1/15/2031 | | | 4,126,380 | |
| | | | | | | | |
| | | | Metals & Mining — 0.1% | | | | |
| | 1,000,000 | | | Steel Dynamics, Inc., 5.125%, 6/15/2014 | | | 1,028,750 | |
| | 11,270,000 | | | United States Steel Corp., 4.000%, 5/15/2014 | | | 11,748,975 | |
| | | | | | | | |
| | | | | | | 12,777,725 | |
| | | | | | | | |
| | | | Non-Captive Diversified — 0.3% | | | | |
| | 44,035,000 | | | iStar Financial, Inc., 0.746%, 10/01/2012(b) | | | 38,530,625 | |
| | | | | | | | |
| | | | Pharmaceuticals — 0.3% | | | | |
| | 41,680,000 | | | Human Genome Sciences, Inc., 2.250%, 8/15/2012 | | | 43,138,800 | |
| | | | | | | | |
| | | | REITs — Warehouse/Industrials — 0.2% | | | | |
| | 19,445,000 | | | ProLogis LP, 3.250%, 3/15/2015 | | | 19,226,244 | |
| | | | | | | | |
See accompanying notes to financial statements.
| 28
Portfolio of Investments – as of September 30, 2011
Loomis Sayles Strategic Income Fund – (continued)
| | | | | | | | |
Principal
Amount (‡) | | | Description | | Value (†) | |
| | | | | | | | |
| | | | Technology — 2.8% | | | | |
| $ | 220,000 | | | Ciena Corp., 0.250%, 5/01/2013 | | $ | 209,825 | |
| | 49,215,000 | | | Ciena Corp., 0.875%, 6/15/2017 | | | 35,926,950 | |
| | 5,535,000 | | | Ciena Corp., 3.750%, 10/15/2018, 144A | | | 4,905,394 | |
| | 6,075,000 | | | Ciena Corp., 4.000%, 3/15/2015, 144A | | | 5,824,406 | |
| | 11,463,000 | | | Intel Corp., 2.950%, 12/15/2035 | | | 11,620,617 | |
| | 220,000,000 | | | Intel Corp., 3.250%, 8/01/2039 | | | 258,775,000 | |
| | 9,197,000 | | | Kulicke & Soffa Industries, Inc., 0.875%, 6/01/2012 | | | 9,024,556 | |
| | 50,625,000 | | | Micron Technology, Inc., Series B, 1.875%, 8/01/2031, 144A | | | 38,728,125 | |
| | | | | | | | |
| | | | | | | 365,014,873 | |
| | | | | | | | |
| | | | Textile — 0.0% | | | | |
| | 68,000 | | | Dixie Yarns, Inc., 7.000%, 5/15/2012 | | | 67,320 | |
| | | | | | | | |
| | | | Wirelines — 0.9% | | | | |
| | 3,440,000 | | | Level 3 Communications, Inc., 3.500%, 6/15/2012 | | | 3,392,700 | |
| | 6,000,000 | | | Level 3 Communications, Inc., 6.500%, 10/01/2016 | | | 8,520,000 | |
| | 54,075,000 | | | Level 3 Communications, Inc., 7.000%, 3/15/2015, 144A(c) | | | 64,619,625 | |
| | 32,895,000 | | | Level 3 Communications, Inc., Series B, 7.000%, 3/15/2015(c) | | | 39,309,525 | |
| | | | | | | | |
| | | | | | | 115,841,850 | |
| | | | | | | | |
| | | | Total Convertible Bonds
(Identified Cost $915,116,845) | | | 981,744,451 | |
| | | | | | | | |
| | | | | | | | |
| | Municipals – 1.5% | | | | |
| | | | California — 0.4% | | | | |
| | 4,170,000 | | | San Jose California Redevelopment Agency Tax Allocation (Merged Area Redevelopment), Series C, (MBIA insured), 3.750%, 8/01/2028 | | | 3,097,601 | |
| | 1,530,000 | | | San Jose California Redevelopment Agency Tax Allocation (Merged Area Redevelopment), Series C, (Registered), (MBIA insured), 3.750%, 8/01/2028 | | | 1,313,428 | |
| | 5,175,000 | | | State of California, (AMBAC insured), 4.500%, 8/01/2027 | | | 5,179,554 | |
| | 14,415,000 | | | State of California, 4.500%, 10/01/2029 | | | 14,136,070 | |
| | 4,190,000 | | | State of California, (AMBAC insured), 4.500%, 8/01/2030 | | | 4,101,214 | |
| | 4,075,000 | | | State of California, 4.500%, 8/01/2030 | | | 3,988,651 | |
| | 2,680,000 | | | State of California (Various Purpose), (MBIA insured), 3.250%, 12/01/2027 | | | 2,287,112 | |
| | 12,645,000 | | | State of California (Various Purpose), (AMBAC insured), 4.500%, 12/01/2033 | | | 11,819,155 | |
| | | | | | | | |
| | | | | | | 45,922,785 | |
| | | | | | | | |
| | | | District of Columbia — 0.0% | | | | |
| | 3,850,000 | | | Metropolitan Washington DC Airports Authority, Series D, 8.000%, 10/01/2047 | | | 4,345,880 | |
| | | | | | | | |
| | | | Illinois — 0.3% | | | | |
| | 1,725,000 | | | Chicago O’Hare International Airport, Series A, (AGMC insured),
4.500%, 1/01/2038 | | | 1,650,618 | |
| | 47,285,000 | | | State of Illinois, 5.100%, 6/01/2033 | | | 42,741,384 | |
| | | | | | | | |
| | | | | | | 44,392,002 | |
| | | | | | | | |
See accompanying notes to financial statements.
29 |
Portfolio of Investments – as of September 30, 2011
Loomis Sayles Strategic Income Fund – (continued)
| | | | | | | | |
Principal
Amount (‡) | | | Description | | Value (†) | |
| | | | | | | | |
| | | | Michigan — 0.1% | | | | |
| $ | 12,500,000 | | | Michigan Tobacco Settlement Finance Authority Taxable Turbo, Series A, 7.309%, 6/01/2034(c) | | $ | 9,449,250 | |
| | | | | | | | |
| | | | Virginia — 0.7% | | | | |
| | 128,820,000 | | | Virginia Tobacco Settlement Financing Corp., Series A-1, 6.706%, 6/01/2046(c) | | | 84,981,266 | |
| | | | | | | | |
| | | | Total Municipals
(Identified Cost $226,144,359) | | | 189,091,183 | |
| | | | | | | | |
| | | | Total Bonds and Notes
(Identified Cost $9,940,501,959) | | | 10,137,193,011 | |
| | | | | | | | |
| | | | | | | | |
| | Senior Loans — 0.3% | | | | |
| | | | Electric — 0.0% | | | | |
| | 4,788,467 | | | Texas Competitive Electric Holdings Company, LLC, Non-Extended Term Loan, 3.726%, 10/10/2014(g) | | | 3,366,914 | |
| | | | | | | | |
| | | | Media Non-Cable — 0.1% | | | | |
| | 2,871,863 | | | Dex Media West, LLC, New Term Loan, 7.000%, 10/24/2014(b) | | | 1,911,598 | |
| | 25,306,057 | | | SuperMedia, Inc., Exit Term Loan, 11.000%, 12/31/2015(b) | | | 11,046,094 | |
| | | | | | | | |
| | | | | | | 12,957,692 | |
| | | | | | | | |
| | | | Wireless — 0.1% | | | | |
| | 8,511,351 | | | Hawaiian Telcom Communications, Inc., Exit Term Loan,
9.000%, 11/01/2015(b)(h) | | | 8,476,795 | |
| | | | | | | | |
| | | | Wirelines — 0.1% | | | | |
| | 1,190,000 | | | FairPoint Communications, Inc., New Term Loan B, 1/22/2016(i) | | | 934,150 | |
| | 24,025,097 | | | FairPoint Communications, Inc., New Term Loan B, 6.500%, 1/22/2016(b) | | | 18,859,701 | |
| | | | | | | | |
| | | | | | | 19,793,851 | |
| | | | | | | | |
| | | | Total Senior Loans
(Identified Cost $72,776,348) | | | 44,595,252 | |
| | | | | | | | |
| | | | | | | | |
| Shares | | | | | | |
| | Common Stocks — 14.3% | | | | |
| | | | Biotechnology — 0.3% | | | | |
| | 867,059 | | | Vertex Pharmaceuticals, Inc.(d) | | | 38,618,808 | |
| | | | | | | | |
| | | | Chemicals — 1.1% | | | | |
| | 2,000,000 | | | PPG Industries, Inc. | | | 141,320,000 | |
| | | | | | | | |
| | | | Containers & Packaging — 0.1% | | | | |
| | 460,656 | | | Owens-Illinois, Inc.(d) | | | 6,965,119 | |
| | 1,675 | | | Rock-Tenn Co., Class A | | | 81,539 | |
| | | | | | | | |
| | | | | | | 7,046,658 | |
| | | | | | | | |
| | | | Diversified Telecommunication Services — 3.2% | | | | |
| | 183,181 | | | FairPoint Communications, Inc.(d) | | | 787,678 | |
| | 283,397 | | | Hawaiian Telcom Holdco, Inc.(d) | | | 3,950,554 | |
| | 3,871,339 | | | Telecom Italia SpA, Sponsored ADR | | | 37,551,989 | |
See accompanying notes to financial statements.
| 30
Portfolio of Investments – as of September 30, 2011
Loomis Sayles Strategic Income Fund – (continued)
| | | | | | | | |
Shares | | | Description | | Value (†) | |
| | | | | | | | |
| | | | Diversified Telecommunication Services — continued | | | | |
| | 200,000 | | | Telecom Italia SpA, Sponsored ADR | | $ | 2,162,000 | |
| | 19,550,590 | | | Telefonica S.A., Sponsored ADR | | | 373,807,281 | |
| | | | | | | | |
| | | | | | | 418,259,502 | |
| | | | | | | | |
| | | | Electric Utilities — 0.0% | | | | |
| | 282,500 | | | Duke Energy Corp. | | | 5,647,175 | |
| | | | | | | | |
| | | | Electronic Equipment, Instruments & Components — 0.0% | | | | |
| | 41,343 | | | Corning, Inc. | | | 510,999 | |
| | | | | | | | |
| | | | Food Products — 0.4% | | | | |
| | 2,309,175 | | | ConAgra Foods, Inc. | | | 55,928,218 | |
| | | | | | | | |
| | | | Household Durables — 0.1% | | | | |
| | 477,725 | | | KB Home | | | 2,799,469 | |
| | 549,450 | | | Lennar Corp., Class A | | | 7,439,553 | |
| | | | | | | | |
| | | | | | | 10,239,022 | |
| | | | | | | | |
| | | | Media — 0.0% | | | | |
| | 4,701 | | | Dex One Corp.(d) | | | 2,632 | |
| | 56,625 | | | SuperMedia, Inc.(d) | | | 87,769 | |
| | | | | | | | |
| | | | | | | 90,401 | |
| | | | | | | | |
| | | | Oil, Gas & Consumable Fuels — 2.3% | | | | |
| | 846,398 | | | Chesapeake Energy Corp. | | | 21,625,469 | |
| | 5,119,117 | | | Repsol YPF S.A., Sponsored ADR | | | 134,428,012 | |
| | 2,134,173 | | | Royal Dutch Shell PLC, ADR | | | 131,294,323 | |
| | 141,249 | | | Spectra Energy Corp. | | | 3,464,838 | |
| | | | | | | | |
| | | | | | | 290,812,642 | |
| | | | | | | | |
| | | | Pharmaceuticals — 2.9% | | | | |
| | 8,514,190 | | | Bristol-Myers Squibb Co. | | | 267,175,282 | |
| | 2,288 | | | Teva Pharmaceutical Industries, Ltd., Sponsored ADR | | | 85,160 | |
| | 2,691,177 | | | Valeant Pharmaceuticals International, Inc. | | | 99,896,490 | |
| | | | | | | | |
| | | | | | | 367,156,932 | |
| | | | | | | | |
| | | | REITs — Apartments — 0.3% | | | | |
| | 290,904 | | | Apartment Investment & Management Co., Class A | | | 6,434,796 | |
| | 889,730 | | | Associated Estates Realty Corp. | | | 13,755,226 | |
| | 460,000 | | | Equity Residential | | | 23,860,200 | |
| | | | | | | | |
| | | | | | | 44,050,222 | |
| | | | | | | | |
| | | | REITs — Regional Malls — 0.1% | | | | |
| | 123,159 | | | Simon Property Group, Inc. | | | 13,545,027 | |
| | | | | | | | |
| | | | REITs — Shopping Centers — 0.0% | | | | |
| | 201,557 | | | DDR Corp. | | | 2,196,971 | |
| | | | | | | | |
| | | | Semiconductors & Semiconductor Equipment — 2.2% | | | | |
| | 13,359,360 | | | Intel Corp. | | | 284,955,149 | |
| | | | | | | | |
| | | | Software — 1.3% | | | | |
| | 6,568,091 | | | Microsoft Corp. | | | 163,479,785 | |
| | | | | | | | |
| | | | Total Common Stocks
(Identified Cost $1,743,228,860) | | | 1,843,857,511 | |
| | | | | | | | |
See accompanying notes to financial statements.
31 |
Portfolio of Investments – as of September 30, 2011
Loomis Sayles Strategic Income Fund – (continued)
| | | | | | | | |
Shares | | | Description | | Value (†) | |
| | | | | | | | |
| | Preferred Stocks — 2.8% | | | | |
| | Convertible Preferred Stocks — 2.1% | | | | |
| | | | Automotive — 0.9% | | | | |
| | 2,776,055 | | | General Motors Co., Series B, 4.750% | | $ | 97,384,009 | |
| | 642,890 | | | Goodyear Tire & Rubber Co. (The), 5.875% | | | 25,040,566 | |
| | | | | | | | |
| | | | | | | 122,424,575 | |
| | | | | | | | |
| | | | Banking — 0.3% | | | | |
| | 19,062 | | | Bank of America Corp., Series L, 7.250% | | | 14,601,301 | |
| | 203,658 | | | Sovereign Capital Trust IV, 4.375% | | | 9,826,499 | |
| | 8,533 | | | Wells Fargo & Co., Series L, Class A, 7.500% | | | 8,815,101 | |
| | | | | | | | |
| | | | | | | 33,242,901 | |
| | | | | | | | |
| | | | Construction Machinery — 0.1% | | | | |
| | 229,491 | | | United Rentals Trust I, 6.500% | | | 9,179,640 | |
| | | | | | | | |
| | | | Consumer Products — 0.1% | | | | |
| | 192,518 | | | Newell Financial Trust I, 5.250% | | | 8,085,756 | |
| | | | | | | | |
| | | | Electric — 0.2% | | | | |
| | 380,577 | | | AES Trust III, 6.750% | | | 18,541,711 | |
| | 107,725 | | | CMS Energy Trust I, 7.750%(c)(j) | | | 4,847,625 | |
| | | | | | | | |
| | | | | | | 23,389,336 | |
| | | | | | | | |
| | | | Home Construction — 0.0% | | | | |
| | 355,000 | | | Hovnanian Enterprises, Inc., 7.250% | | | 2,623,450 | |
| | | | | | | | |
| | | | Independent Energy — 0.1% | | | | |
| | 52,020 | | | Chesapeake Energy Corp., 4.500% | | | 4,837,860 | |
| | 99,800 | | | SandRidge Energy, Inc., 8.500% | | | 9,980,000 | |
| | | | | | | | |
| | | | | | | 14,817,860 | |
| | | | | | | | |
| | | | Pipelines — 0.1% | | | | |
| | 242,297 | | | El Paso Energy Capital Trust I, 4.750% | | | 10,835,522 | |
| | | | | | | | |
| | | | REITs — Healthcare — 0.0% | | | | |
| | 116,700 | | | Health Care REIT, Inc., Series I, 6.500% | | | 5,403,210 | |
| | | | | | | | |
| | | | Technology — 0.3% | | | | |
| | 39,920 | | | Lucent Technologies Capital Trust I, 7.750% | | | 32,934,000 | |
| | | | | | | | |
| | | | Total Convertible Preferred Stocks
(Identified Cost $306,487,808) | | | 262,936,250 | |
| | | | | | | | |
| | | | | | | | |
| | Non-Convertible Preferred Stocks — 0.7% | | | | |
| | | | Banking — 0.2% | | | | |
| | 35,000 | | | Bank of America Corp., 6.375% | | | 641,550 | |
| | 847,800 | | | Citigroup Capital XIII, (fixed rate to 10/30/2015, variable rate thereafter), 7.875% | | | 22,390,398 | |
| | 389,800 | | | Countrywide Capital IV, 6.750% | | | 7,480,262 | |
| | | | | | | | |
| | | | | | | 30,512,210 | |
| | | | | | | | |
| | | | Electric — 0.0% | | | | |
| | 393 | | | Entergy New Orleans, Inc., 4.750% | | | 33,737 | |
| | | | | | | | |
See accompanying notes to financial statements.
| 32
Portfolio of Investments – as of September 30, 2011
Loomis Sayles Strategic Income Fund – (continued)
| | | | | | | | |
Shares | | | Description | | Value (†) | |
| | | | | | | | |
| | | | Government Sponsored — 0.2% | | | | |
| | 26,000 | | | Falcons Funding Trust I, (Step to 10.875% on 3/15/2015, variable rate after 3/15/2020), 8.875%, 144A(f) | | $ | 27,202,500 | |
| | | | | | | | |
| | | | Home Construction — 0.0% | | | | |
| | 203,246 | | | Hovnanian Enterprises, Inc., 7.625%(d) | | | 406,492 | |
| | | | | | | | |
| | | | Non-Captive Consumer — 0.0% | | | | |
| | 101,175 | | | SLM Corp., Series A, 6.970% | | | 4,258,456 | |
| | | | | | | | |
| | | | Non-Captive Diversified — 0.2% | | | | |
| | 36,916 | | | Ally Financial, Inc., Series G, 7.000%, 144A | | | 22,149,600 | |
| | | | | | | | |
| | | | REITs — Office Property — 0.0% | | | | |
| | 1,596 | | | Highwoods Properties, Inc., Series A, 8.625% | | | 1,618,942 | |
| | | | | | | | |
| | | | REITs — Warehouse/Industrials — 0.1% | | | | |
| | 116,192 | | | ProLogis, Inc., Series Q, 8.540% | | | 6,512,562 | |
| | | | | | | | |
| | | | Total Non-Convertible Preferred Stocks
(Identified Cost $75,616,434) | | | 92,694,499 | |
| | | | | | | | |
| | | | Total Preferred Stocks
(Identified Cost $382,104,242) | | | 355,630,749 | |
| | | | | | | | |
| | | | | | | | |
| | Closed End Investment Companies — 0.1% | | | | |
| | 681,131 | | | Highland Credit Strategies Fund | | | 4,223,012 | |
| | 104,115 | | | Morgan Stanley Emerging Markets Debt Fund, Inc. | | | 1,006,792 | |
| | 1,491,769 | | | Western Asset High Income Opportunity Fund, Inc. | | | 8,622,425 | |
| | | | | | | | |
| | | | Total Closed End Investment Companies
(Identified Cost $20,700,094) | | | 13,852,229 | |
| | | | | | | | |
| | | | | | | | |
Principal
Amount (‡) | | | | | | |
| | Short-Term Investments — 1.4% | | | | |
| $ | 42,904 | | | Repurchase Agreement with State Street Bank and Trust Company, dated 9/30/2011 at 0.000% to be repurchased at $42,904 on 10/03/2011 collateralized by $45,000 U.S. Treasury Note, 1.375% due 5/15/2013 valued at $46,032 including accrued interest (Note 2 of Notes to Financial Statements) | | | 42,904 | |
| | 177,649,655 | | | Tri-Party Repurchase Agreement with Fixed Income Clearing Corporation, dated 9/30/2011 at 0.000% to be repurchased at $177,649,655 on 10/03/2011 collateralized by $20,075,000 Federal Home Loan Bank, 3.625% due 5/29/2013 valued at $21,379,875; $68,165,000 Federal Home Loan Bank, 1.500% due 1/16/2013 valued at $69,357,888; $20,015,000 Federal Home Loan Mortgage Corp., 0.500% due 2/08/2013 valued at $20,040,019; $54,830,000 Federal Home Loan Mortgage Corp., 0.500% due 8/23/2013 valued at $54,830,000; $15,330,000 U.S. Treasury Note, 1.375% due 2/15/2013 valued at $15,598,275 including accrued interest (Note 2 of Notes to Financial Statements) | | | 177,649,655 | |
| | | | | | | | |
| | | | Total Short-Term Investments
(Identified Cost $177,692,559) | | | 177,692,559 | |
| | | | | | | | |
See accompanying notes to financial statements.
33 |
Portfolio of Investments – as of September 30, 2011
Loomis Sayles Strategic Income Fund – (continued)
| | | | | | | | |
| | | | Description | | Value (†) | |
| | | | | | | | |
| | | | Total Investments — 97.7%
(Identified Cost $12,337,004,062)(a) | | $ | 12,572,821,311 | |
| | | | Other assets less liabilities — 2.3% | | | 296,620,890 | |
| | | | | | | | |
| | | | Net Assets — 100.0% | | $ | 12,869,442,201 | |
| | | | | | | | |
| | | | | | | | |
| | (‡) | | | Principal amount stated in U.S. dollars unless otherwise noted. | |
| | (†) | | | See Note 2 of Notes to Financial Statements. | |
| | (††) | | | Amount shown represents units. One unit represents a principal amount of 25. | |
| | (†††) | | | Amount shown represents units. One unit represents a principal amount of 100. | |
| | (a) | | | Federal Tax Information: | |
| | | | At September 30, 2011, the net unrealized appreciation on investments based on a cost of $12,414,975,167 for federal income tax purposes was as follows: | |
| | | | Aggregate gross unrealized appreciation for all investments in which there is an excess of value over tax cost | | $ | 1,004,795,195 | |
| | | | Aggregate gross unrealized depreciation for all investments in which there is an excess of tax cost over value | | | (846,949,051 | ) |
| | | | | | | | |
| | | | Net unrealized appreciation | | $ | 157,846,144 | |
| | | | | | | | |
| | | | | | | | |
| | (b) | | | Variable rate security. Rate as of September 30, 2011 is disclosed. | |
| | (c) | | | Illiquid security. At September 30, 2011, the value of these securities amounted to $299,085,525 or 2.3% of net assets. | |
| | (d) | | | Non-income producing security. | |
| | (e) | | | The issuer is in default with respect to interest and/or principal payments. Income is not being accrued. | |
| | (f) | | | Coupon rate is a fixed rate for an initial period then resets at a specified date and rate. | |
| | (g) | | | Variable rate security. Rate shown represents the weighted average rate at September 30, 2011. | |
| | (h) | | | All or a portion of interest payment is paid-in-kind. | |
| | (i) | | | Position is unsettled. Contract rate was not determined at September 30, 2011 and does not take effect until settlement date. | |
| | (j) | | | Fair valued security by the Fund’s investment adviser. At September 30, 2011, the value of this security amounted to $4,847,625 representing less than 0.1% of net assets. | |
| | (k) | | | Maturity has been extended under the terms of a plan of reorganization. | |
| | | | | | | | |
| | | | | |
| | 144A | | | All or a portion of these securities are exempt from registration under Rule 144A of the Securities Act of 1933. These securities may be resold in transactions exempt from registration, normally to qualified institutional buyers. At September 30, 2011, the value of Rule 144A holdings amounted to $1,365,499,024 or 10.6% of net assets. | |
| | | | | | | | |
| | ADR | | | An American Depositary Receipt is a certificate issued by a custodian bank representing the right to receive securities of the foreign issuer described. The values of ADRs may be significantly influenced by trading on exchanges not located in the United States. | |
| | ABS | | | Asset-Backed Securities | |
| | AGMC | | | Assured Guaranty Municipal Corp. | |
| | AMBAC | | | American Municipal Bond Assurance Corp. | |
| | EMTN | | | Euro Medium Term Note | |
| | GMTN | | | Global Medium Term Note | |
| | MBIA | | | Municipal Bond Investors Assurance Corp. | |
See accompanying notes to financial statements.
| 34
Portfolio of Investments – as of September 30, 2011
Loomis Sayles Strategic Income Fund – (continued)
| | | | | | |
| | MTN | | | Medium Term Note |
| | REITs | | | Real Estate Investment Trusts |
| | | | |
| | AUD | | | Australian Dollar |
| | BRL | | | Brazilian Real |
| | CAD | | | Canadian Dollar |
| | CHF | | | Swiss Franc |
| | EUR | | | Euro |
| | GBP | | | British Pound |
| | IDR | | | Indonesian Rupiah |
| | ISK | | | Icelandic Krona |
| | KRW | | | South Korean Won |
| | MXN | | | Mexican Peso |
| | NOK | | | Norwegian Krone |
| | NZD | | | New Zealand Dollar |
| | SGD | | | Singapore Dollar |
Industry Summary at September 30, 2011 (Unaudited)
| | | | |
Treasuries | | | 12.3 | % |
Non-Captive Diversified | | | 8.5 | |
Banking | | | 5.8 | |
Wirelines | | | 4.9 | |
Technology | | | 4.7 | |
Non-Captive Consumer | | | 4.5 | |
Automotive | | | 3.8 | |
Electric | | | 3.3 | |
Diversified Telecommunication Services | | | 3.2 | |
Pharmaceuticals | | | 3.2 | |
Sovereigns | | | 3.1 | |
Healthcare | | | 2.9 | |
Airlines | | | 2.9 | |
Oil, Gas & Consumable Fuels | | | 2.3 | |
Semiconductors & Semiconductor Equipment | | | 2.2 | |
Pipelines | | | 2.1 | |
Supranational | | | 2.0 | |
Other Investments, less than 2% each | | | 24.6 | |
Short-Term Investments | | | 1.4 | |
| | | | |
Total Investments | | | 97.7 | |
Other assets less liabilities | | | 2.3 | |
| | | | |
Net Assets | | | 100.0 | % |
| | | | |
See accompanying notes to financial statements.
35 |
Portfolio of Investments – as of September 30, 2011
Loomis Sayles Strategic Income Fund – (continued)
Currency Exposure at September 30, 2011 (Unaudited)
| | | | |
United States Dollar | | | 70.2 | % |
Canadian Dollar | | | 5.8 | |
New Zealand Dollar | | | 4.3 | |
Euro | | | 4.0 | |
Norwegian Krone | | | 3.2 | |
Australian Dollar | | | 2.5 | |
Other, less than 2% each | | | 7.7 | |
| | | | |
Total Investments | | | 97.7 | |
Other assets less liabilities | | | 2.3 | |
| | | | |
Net Assets | | | 100.0 | % |
| | | | |
See accompanying notes to financial statements.
| 36
Statement of Assets & Liabilities
September 30, 2011
| | | | |
ASSETS | | | | |
Investments at cost | | $ | 12,337,004,062 | |
Net unrealized appreciation | | | 235,817,249 | |
| | | | |
Investments at value | | | 12,572,821,311 | |
Cash | | | 11,305,744 | |
Due from custodian (Note 2) | | | 2,968,650 | |
Foreign currency at value (identified cost $17,894,773) | | | 16,244,173 | |
Receivable for Fund shares sold | | | 23,213,038 | |
Receivable for securities sold | | | 95,443,078 | |
Dividends and interest receivable | | | 184,470,296 | |
Tax reclaims receivable | | | 335,723 | |
| | | | |
TOTAL ASSETS | | | 12,906,802,013 | |
| | | | |
LIABILITIES | | | | |
Payable for securities purchased | | | 3,009,631 | |
Payable for Fund shares redeemed | | | 22,401,612 | |
Foreign taxes payable (Note 2) | | | 282,871 | |
Due to broker (Note 2) | | | 2,968,650 | |
Management fees payable (Note 5) | | | 6,136,225 | |
Deferred Trustees’ fees (Note 5) | | | 716,375 | |
Administrative fees payable (Note 5) | | | 510,476 | |
Other accounts payable and accrued expenses | | | 1,333,972 | |
| | | | |
TOTAL LIABILITIES | | | 37,359,812 | |
| | | | |
NET ASSETS | | $ | 12,869,442,201 | |
| | | | |
NET ASSETS CONSIST OF: | | | | |
Paid-in capital | | $ | 13,065,049,670 | |
Undistributed net investment income | | | 62,197,900 | |
Accumulated net realized loss on investments and foreign currency transactions | | | (486,480,194 | ) |
Net unrealized appreciation on investments and foreign currency translations | | | 228,674,825 | |
| | | | |
NET ASSETS | | $ | 12,869,442,201 | |
| | | | |
See accompanying notes to financial statements.
37 |
| | | | |
COMPUTATION OF NET ASSET VALUE AND OFFERING PRICE: | | | | |
Class A shares: | | | | |
Net assets | | $ | 5,262,765,275 | |
| | | | |
Shares of beneficial interest | | | 370,273,556 | |
| | | | |
Net asset value and redemption price per share | | $ | 14.21 | |
| | | | |
Offering price per share (100/95.50 of net asset value) (Note 1) | | $ | 14.88 | |
| | | | |
Class B shares: (redemption price per share is equal to net asset value less any applicable contingent deferred sales charge) (Note 1) | | | | |
Net assets | | $ | 107,399,593 | |
| | | | |
Shares of beneficial interest | | | 7,507,876 | |
| | | | |
Net asset value and offering price per share | | $ | 14.30 | |
| | | | |
Class C shares: (redemption price per share is equal to net asset value less any applicable contingent deferred sales charge) (Note 1) | | | | |
Net assets | | $ | 4,666,077,230 | |
| | | | |
Shares of beneficial interest | | | 326,476,737 | |
| | | | |
Net asset value and offering price per share | | $ | 14.29 | |
| | | | |
Class Y shares: | | | | |
Net assets | | $ | 2,807,776,592 | |
| | | | |
Shares of beneficial interest | | | 197,688,014 | |
| | | | |
Net asset value, offering and redemption price per share | | $ | 14.20 | |
| | | | |
Admin Class shares: | | | | |
Net assets | | $ | 25,423,511 | |
| | | | |
Shares of beneficial interest | | | 1,792,634 | |
| | | | |
Net asset value, offering and redemption price per share | | $ | 14.18 | |
| | | | |
See accompanying notes to financial statements.
| 38
Statement of Operations
For the Year Ended September 30, 2011
| | | | |
INVESTMENT INCOME | | | | |
Interest | | $ | 771,113,640 | |
Dividends | | | 53,873,331 | |
Less net foreign taxes withheld | | | (565,931 | ) |
| | | | |
| | | 824,421,040 | |
| | | | |
Expenses | | | | |
Management fees (Note 5) | | | 76,046,459 | |
Service and distribution fees (Note 5) | | | 66,240,149 | |
Administrative fees (Note 5) | | | 6,330,110 | |
Trustees’ fees and expenses (Note 5) | | | 283,010 | |
Transfer agent fees and expenses (Note 5) | | | 10,060,254 | |
Audit and tax services fees | | | 58,158 | |
Custodian fees and expenses | | | 684,062 | |
Legal fees | | | 219,214 | |
Registration fees | | | 463,068 | |
Shareholder reporting expenses | | | 893,686 | |
Miscellaneous expenses | | | 389,554 | |
| | | | |
Total expenses | | | 161,667,724 | |
| | | | |
Net investment income | | | 662,753,316 | |
| | | | |
NET REALIZED AND UNREALIZED GAIN (LOSS) ON INVESTMENTS AND FOREIGN CURRENCY TRANSACTIONS | | | | |
Net realized gain on: | | | | |
Investments | | | 360,894,856 | |
Foreign currency transactions | | | 4,223,227 | |
Net change in unrealized appreciation (depreciation) on: | | | | |
Investments | | | (748,007,748 | ) |
Foreign currency translations | | | (8,507,147 | ) |
| | | | |
Net realized and unrealized loss on investments and foreign currency transactions | | | (391,396,812 | ) |
| | | | |
NET INCREASE IN NET ASSETS RESULTING FROM OPERATIONS | | $ | 271,356,504 | |
| | | | |
See accompanying notes to financial statements.
39 |
Statement of Changes in Net Assets
| | | | | | | | |
| | | Year Ended
September 30,
2011 | | | Year Ended
September 30,
2010 | |
FROM OPERATIONS: | | | | | | | | |
Net investment income | | $ | 662,753,316 | | | $ | 708,256,908 | |
Net realized gain (loss) on investments and foreign currency transactions | | | 365,118,083 | | | | (74,940,768 | ) |
Net change in unrealized appreciation (depreciation) on investments and foreign currency translations | | | (756,514,895 | ) | | | 1,297,093,620 | |
| | | | | | | | |
Net increase in net assets resulting from operations | | | 271,356,504 | | | | 1,930,409,760 | |
| | | | | | | | |
FROM DISTRIBUTIONS TO SHAREHOLDERS: | | | | | | | | |
Net investment income | | | | | | | | |
Class A | | | (312,937,228 | ) | | | (325,626,381 | ) |
Class B | | | (5,960,721 | ) | | | (7,060,015 | ) |
Class C | | | (237,583,471 | ) | | | (249,098,299 | ) |
Class Y | | | (155,221,506 | ) | | | (134,204,230 | ) |
Admin Class | | | (816,337 | ) | | | (41,765 | ) |
| | | | | | | | |
Total distributions | | | (712,519,263 | ) | | | (716,030,690 | ) |
| | | | | | | | �� |
NET DECREASE IN NET ASSETS FROM CAPITAL SHARE TRANSACTIONS (NOTE 9) | | | (256,613,434 | ) | | | (292,510,626 | ) |
| | | | | | | | |
Net increase (decrease) in net assets | | | (697,776,193 | ) | | | 921,868,444 | |
NET ASSETS | | | | | | | | |
Beginning of the year | | | 13,567,218,394 | | | | 12,645,349,950 | |
| | | | | | | | |
End of the year | | $ | 12,869,442,201 | | | $ | 13,567,218,394 | |
| | | | | | | | |
UNDISTRIBUTED NET INVESTMENT INCOME | | $ | 62,197,900 | | | $ | 4,843,087 | |
| | | | | | | | |
See accompanying notes to financial statements.
| 40
Financial Highlights
For a share outstanding throughout each period.
| | | | | | | | | | | | | | | | | | | | | | | | | | | | |
| | | | | | Income (Loss) from Investment
Operations: | | | Less Distributions: | |
| | | Net asset
value,
beginning
of the
period | | | Net
investment
income (a) | | | Net realized
and
unrealized
gain (loss) | | | Total from
investment
operations | | | Dividends
from net
investment
income | | | Distributions
from net
realized
capital
gains | | | Total
distributions | |
STRATEGIC INCOME FUND | | | | | | | | | | | | | | | | | | | | | | | | | |
Class A | | | | | | | | | | | | | | | | | | | | | | | | | | | | |
9/30/2011 | | $ | 14.69 | | | $ | 0.77 | | | $ | (0.42 | ) | | $ | 0.35 | | | $ | (0.83 | ) | | $ | — | | | $ | (0.83 | ) |
9/30/2010 | | | 13.39 | | | | 0.80 | | | | 1.31 | | | | 2.11 | | | | (0.81 | ) | | | — | | | | (0.81 | ) |
9/30/2009 | | | 12.10 | | | | 0.87 | | | | 1.36 | | | | 2.23 | | | | (0.86 | ) | | | (0.08 | ) | | | (0.94 | ) |
9/30/2008 | | | 15.18 | | | | 0.96 | | | | (3.02 | ) | | | (2.06 | ) | | | (1.01 | ) | | | (0.01 | ) | | | (1.02 | ) |
9/30/2007 | | | 14.60 | | | | 0.80 | | | | 0.60 | | | | 1.40 | | | | (0.82 | ) | | | — | | | | (0.82 | ) |
Class B | | | | | | | | | | | | | | | | | | | | | | | | | | | | |
9/30/2011 | | | 14.78 | | | | 0.66 | | | | (0.43 | ) | | | 0.23 | | | | (0.71 | ) | | | — | | | | (0.71 | ) |
9/30/2010 | | | 13.46 | | | | 0.69 | | | | 1.33 | | | | 2.02 | | | | (0.70 | ) | | | — | | | | (0.70 | ) |
9/30/2009 | | | 12.16 | | | | 0.79 | | | | 1.36 | | | | 2.15 | | | | (0.77 | ) | | | (0.08 | ) | | | (0.85 | ) |
9/30/2008 | | | 15.25 | | | | 0.85 | | | | (3.04 | ) | | | (2.19 | ) | | | (0.89 | ) | | | (0.01 | ) | | | (0.90 | ) |
9/30/2007 | | | 14.66 | | | | 0.69 | | | | 0.60 | | | | 1.29 | | | | (0.70 | ) | | | — | | | | (0.70 | ) |
Class C | | | | | | | | | | | | | | | | | | | | | | | | | | | | |
9/30/2011 | | | 14.77 | | | | 0.66 | | | | (0.43 | ) | | | 0.23 | | | | (0.71 | ) | | | — | | | | (0.71 | ) |
9/30/2010 | | | 13.45 | | | | 0.69 | | | | 1.33 | | | | 2.02 | | | | (0.70 | ) | | | — | | | | (0.70 | ) |
9/30/2009 | | | 12.15 | | | | 0.79 | | | | 1.37 | | | | 2.16 | | | | (0.78 | ) | | | (0.08 | ) | | | (0.86 | ) |
9/30/2008 | | | 15.24 | | | | 0.85 | | | | (3.03 | ) | | | (2.18 | ) | | | (0.90 | ) | | | (0.01 | ) | | | (0.91 | ) |
9/30/2007 | | | 14.65 | | | | 0.69 | | | | 0.60 | | | | 1.29 | | | | (0.70 | ) | | | — | | | | (0.70 | ) |
Class Y | | | | | | | | | | | | | | | | | | | | | | | | | | | | |
9/30/2011 | | | 14.68 | | | | 0.81 | | | | (0.43 | ) | | | 0.38 | | | | (0.86 | ) | | | — | | | | (0.86 | ) |
9/30/2010 | | | 13.38 | | | | 0.83 | | | | 1.31 | | | | 2.14 | | | | (0.84 | ) | | | — | | | | (0.84 | ) |
9/30/2009 | | | 12.09 | | | | 0.90 | | | | 1.36 | | | | 2.26 | | | | (0.89 | ) | | | (0.08 | ) | | | (0.97 | ) |
9/30/2008 | | | 15.17 | | | | 1.00 | | | | (3.03 | ) | | | (2.03 | ) | | | (1.04 | ) | | | (0.01 | ) | | | (1.05 | ) |
9/30/2007 | | | 14.59 | | | | 0.85 | | | | 0.59 | | | | 1.44 | | | | (0.86 | ) | | | — | | | | (0.86 | ) |
Admin Class | | | | | | | | | | | | | | | | | | | | | | | | | |
9/30/2011 | | | 14.66 | | | | 0.73 | | | | (0.42 | ) | | | 0.31 | | | | (0.79 | ) | | | — | | | | (0.79 | ) |
9/30/2010* | | | 13.87 | | | | 0.52 | | | | 0.79 | | | | 1.31 | | | | (0.52 | ) | | | — | | | | (0.52 | ) |
| * | From commencement of Class operations on February 1, 2010 through September 30, 2010. |
| (a) | Per share net investment income has been calculated using the average shares outstanding during the period. |
| (b) | Amount rounds to less than $0.01 per share, if applicable. |
| (c) | Effective June 2, 2008, redemption fees were eliminated. |
| (d) | A sales charge for Class A shares and a contingent deferred sales charge for Class B and Class C shares are not reflected in total return calculations. Periods less than one year, if applicable, are not annualized. |
See accompanying notes to financial statements.
41 |
| | | | | | | | | | | | | | | | | | | | | | | | | | | | | | |
| | | | | | | | | | | | |
Ratios to Average Net Assets: | | | | |
Redemption
fees (b)(c) | | |
Net asset
value,
end of
the period | | | Total
return
(%) (d)(e) | | | Net assets,
end of
the period
(000’s) | | | Net
expenses
(%) (f)(g) | | | Gross
expenses
(%) (f) | | | Net investment
income
(%) (f) | | | Portfolio
turnover
rate (%) | |
| | | | | | | | | | | | | | | | | | | | | | | | | | | | | | |
| | | | | | | | | | | | | | | | | | | | | | | | | | | | | | |
| $ | — | | | $ | 14.21 | | | | 2.20 | | | $ | 5,262,765 | | | | 0.95 | | | | 0.95 | | | | 5.10 | | | | 25 | |
| | — | | | | 14.69 | | | | 16.20 | | | | 5,758,070 | | | | 0.96 | | | | 0.96 | | | | 5.67 | | | | 27 | |
| | — | | | | 13.39 | | | | 20.56 | | | | 5,544,029 | | | | 0.99 | | | | 0.99 | | | | 7.74 | | | | 39 | |
| | 0.00 | | | | 12.10 | | | | (14.54 | ) | | | 5,551,066 | | | | 0.97 | | | | 0.98 | | | | 6.59 | | | | 24 | |
| | 0.00 | | | | 15.18 | | | | 9.90 | | | | 5,749,315 | | | | 1.00 | | | | 1.00 | | | | 5.39 | | | | 22 | |
| | | | | | | | | | | | | | | | | | | | | | | | | | | | | | |
| | — | | | | 14.30 | | | | 1.48 | | | | 107,400 | | | | 1.70 | | | | 1.70 | | | | 4.35 | | | | 25 | |
| | — | | | | 14.78 | | | | 15.39 | | | | 137,268 | | | | 1.71 | | | | 1.71 | | | | 4.92 | | | | 27 | |
| | — | | | | 13.46 | | | | 19.62 | | | | 148,887 | | | | 1.74 | | | | 1.74 | | | | 7.02 | | | | 39 | |
| | 0.00 | | | | 12.16 | | | | (15.19 | ) | | | 161,751 | | | | 1.72 | | | | 1.73 | | | | 5.78 | | | | 24 | |
| | 0.00 | | | | 15.25 | | | | 9.08 | | | | 233,418 | | | | 1.76 | | | | 1.76 | | | | 4.61 | | | | 22 | |
| | | | | | | | | | | | | | | | | | | | | | | | | | | | | | |
| | — | | | | 14.29 | | | | 1.42 | | | | 4,666,077 | | | | 1.70 | | | | 1.70 | | | | 4.35 | | | | 25 | |
| | — | | | | 14.77 | | | | 15.40 | | | | 5,146,164 | | | | 1.71 | | | | 1.71 | | | | 4.92 | | | | 27 | |
| | — | | | | 13.45 | | | | 19.66 | | | | 4,894,546 | | | | 1.74 | | | | 1.74 | | | | 6.95 | | | | 39 | |
| | 0.00 | | | | 12.15 | | | | (15.19 | ) | | | 3,984,204 | | | | 1.72 | | | | 1.73 | | | | 5.85 | | | | 24 | |
| | 0.00 | | | | 15.24 | | | | 9.08 | | | | 3,843,823 | | | | 1.75 | | | | 1.75 | | | | 4.63 | | | | 22 | |
| | | | | | | | | | | | | | | | | | | | | | | | | | | | | | |
| | — | | | | 14.20 | | | | 2.46 | | | | 2,807,777 | | | | 0.70 | | | | 0.70 | | | | 5.35 | | | | 25 | |
| | — | | | | 14.68 | | | | 16.50 | | | | 2,521,337 | | | | 0.71 | | | | 0.71 | | | | 5.92 | | | | 27 | |
| | — | | | | 13.38 | | | | 20.91 | | | | 2,057,888 | | | | 0.72 | | | | 0.72 | | | | 7.76 | | | | 39 | |
| | 0.00 | | | | 12.09 | | | | (14.34 | ) | | | 783,058 | | | | 0.72 | | | | 0.72 | | | | 6.88 | | | | 24 | |
| | 0.00 | | | | 15.17 | | | | 10.22 | | | | 638,868 | | | | 0.74 | | | | 0.74 | | | | 5.67 | | | | 22 | |
| | | | | | | | | | | | | | | | | | | | | | | | | | | | | | |
| | — | | | | 14.18 | | | | 1.98 | | | | 25,424 | | | | 1.21 | | | | 1.21 | | | | 4.87 | | | | 25 | |
| | — | | | | 14.66 | | | | 9.61 | | | | 4,379 | | | | 1.24 | | | | 1.24 | | | | 5.52 | | | | 27 | |
| (e) | Had certain expenses not been waived/reimbursed during the period, if applicable, total returns would have been lower. |
| (f) | Computed on an annualized basis for periods less than one year, if applicable. |
| (g) | The investment adviser and/or administrator agreed to waive its fees and/or reimburse a portion of the Fund’s expenses during the period. Without this waiver/reimbursement, if applicable, expenses would have been higher. |
See accompanying notes to financial statements.
| 42
Notes to Financial Statements
September 30, 2011
1. Organization. Loomis Sayles Funds II (the “Trust”) is organized as a Massachusetts business trust. The Trust is registered under the Investment Company Act of 1940, as amended (the “1940 Act”), as an open-end management investment company. The Declaration of Trust permits the Board of Trustees to authorize the issuance of an unlimited number of shares of the Trust in multiple series. The financial statements for certain funds of the Trust are presented in separate reports. Information presented in these financial statements pertains to Loomis Sayles Strategic Income Fund (the “Fund”).
The Fund is a diversified investment company.
The Fund offers Class A, Class C, Class Y and Admin Class shares. Effective October 12, 2007, Class B shares are no longer offered. Existing Class B shareholders may continue to reinvest dividends into Class B shares and exchange their Class B shares for Class B shares of other Natixis Funds subject to existing exchange privileges as described in the prospectus.
Class A shares are sold with a maximum front-end sales charge of 4.50%. Class B shares do not pay a front-end sales charge; however, they are charged higher Rule 12b-1 fees, and are subject to a contingent deferred sales charge (“CDSC”) if such shares are redeemed within six years of purchase. After eight years of ownership, Class B shares convert to Class A shares. Class C shares do not pay a front-end sales charge, do not convert to any other class of shares, pay higher Rule 12b-1 fees than Class A shares and may be subject to a CDSC of 1.00% if those shares are redeemed within one year of acquisition, except for reinvested distributions. Class Y shares do not pay a front-end sales charge, a CDSC or Rule 12b-1 fees. Class Y shares are generally intended for institutional investors with a minimum initial investment of $100,000, though some categories of investors are exempted from the minimum investment amount as outlined in the Fund’s prospectus. Admin Class shares do not pay a front-end sales charge or a CDSC, but do pay a Rule 12b-1 fee. Admin Class shares are offered exclusively through intermediaries.
Most expenses of the Trust can be directly attributed to a Fund. Expenses which cannot be directly attributed to a Fund are generally apportioned based on the relative net assets of each of the funds in the Trust. Expenses of the Fund are borne pro rata by the holders of each class of shares, except that each class bears expenses unique to that class (including the Rule 12b-1 service and distribution fees). In addition, each class votes as a class only with respect to its own Rule 12b-1 Plan. Shares of each class would receive their pro rata share of the net assets of the Fund if the Fund were liquidated. The Trustees approve separate distributions from net investment income on each class of shares.
2. Significant Accounting Policies. The following is a summary of significant accounting policies consistently followed by the Fund in the preparation of its financial
43 |
Notes to Financial Statements (continued)
September 30, 2011
statements. The Fund’s financial statements are prepared in accordance with accounting principles generally accepted in the United States of America which require the use of management estimates that affect the reported amounts and disclosures in the financial statements. Actual results could differ from those estimates. Management has evaluated the events and transactions subsequent to year-end through the date the financial statements were issued and has determined that there were no material events that would require disclosure in the Fund’s financial statements.
a. Valuation. Debt securities (other than short-term obligations purchased with an original or remaining maturity of sixty days or less) and unlisted equity securities are generally valued on the basis of evaluated bids furnished to the Fund by a pricing service recommended by the investment adviser and approved by the Board of Trustees, which service determines valuations for normal, institutional-size trading units of such securities using market information, transactions for comparable securities and various relationships between securities which are generally recognized by institutional traders. Senior loans shall be priced at bid prices supplied by a pricing service, if available. Equity securities, including shares of closed-end investment companies and exchange-traded funds, for which market quotations are readily available are valued at market value, as reported by pricing services recommended by the investment adviser and approved by the Board of Trustees. Such pricing services generally use the security’s last sale price on the exchange or market where the security is primarily traded or, if there is no reported sale during the day, the closing bid price. Securities traded on the NASDAQ Global Select Market, NASDAQ Global Market and NASDAQ Capital Market are valued at the NASDAQ Official Closing Price (“NOCP”), or if lacking a NOCP, at the most recent bid quotation on the applicable NASDAQ Market. Broker-dealer bid quotations may also be used to value debt and equity securities where a pricing service does not price a security or where a pricing service does not provide a reliable price for the security. In instances where broker-dealer bid quotations are not available, certain securities held by the Fund may be valued on the basis of a price provided by a principal market maker. Investments in other open-end investment companies are valued at their net asset value each day. Short-term obligations purchased with an original or remaining maturity of sixty days or less are valued at amortized cost, which approximates market value. Securities for which market quotations are not readily available are valued at fair value as determined in good faith by the Fund’s investment adviser using consistently applied procedures under the general supervision of the Board of Trustees.
The Fund may hold securities traded in foreign markets. Foreign securities are valued at the market price in the foreign market. However, if events occurring after the close of the foreign market (but before the close of regular trading on the New York Stock Exchange) are believed to materially affect the value of those securities, such securities are fair valued pursuant to procedures approved by the Board of Trustees. When fair valuing securities, the Fund may, among other things, use modeling tools or
| 44
Notes to Financial Statements (continued)
September 30, 2011
other processes that may take into account factors such as securities market activity and/or significant events that occur after the close of the foreign market and before the Fund calculates its net asset value.
b. Investment Transactions and Related Investment Income. Investment transactions are accounted for on a trade date plus one basis for daily net asset value calculation. However, for financial reporting purposes, investment transactions are reported on trade date. Dividend income is recorded on ex-dividend date, or in the case of certain foreign securities, as soon as the Fund is notified, and interest income is recorded on an accrual basis. Interest income is increased by the accretion of discount and decreased by the amortization of premium. Distributions received from investments in securities that represent a return of capital or capital gain are recorded as a reduction of the cost of investments or as a realized gain, respectively. Investment income is recorded net of foreign taxes withheld when applicable. In determining net gain or loss on securities sold, the cost of securities has been determined on an identified cost basis. Investment income, non-class specific expenses and realized and unrealized gains and losses are allocated on a pro rata basis to each class based on the relative net assets of each class to the total net assets of the Fund.
c. Foreign Currency Translation. The books and records of the Fund are maintained in U.S. dollars. The values of securities, currencies and other assets and liabilities denominated in currencies other than U.S. dollars are translated into U.S. dollars based upon foreign exchange rates prevailing at the end of the period. Purchases and sales of investment securities, income and expenses are translated on the respective dates of such transactions.
Since the values of investment securities are presented at the foreign exchange rates prevailing at the end of the period, it is not practical to isolate that portion of the results of operations arising from changes in exchange rates from fluctuations which arise due to changes in market prices of investment securities. Such changes are included with the net realized and unrealized gain or loss on investments.
Net realized foreign exchange gains or losses arise from sales of foreign currency, currency gains or losses realized between the trade and settlement dates on securities transactions, and the difference between the amounts of dividends, interest and foreign withholding taxes recorded on the Fund’s books and the U.S. dollar equivalent of the amounts actually received or paid. Net unrealized foreign exchange gains and losses arise from changes in the value of assets and liabilities, other than investment securities, at the end of the fiscal period, resulting from changes in exchange rates.
The Fund may use foreign currency exchange contracts to facilitate transactions in foreign-denominated investments. Losses may arise from changes in the value of the foreign currency or if the counterparties do not perform under the contracts’ terms.
45 |
Notes to Financial Statements (continued)
September 30, 2011
d. Federal and Foreign Income Taxes. The Trust treats each Fund as a separate entity for federal income tax purposes. The Fund intends to meet the requirements of the Internal Revenue Code of 1986, as amended, applicable to regulated investment companies, and to distribute to its shareholders substantially all of its net investment income and any net realized capital gains at least annually. Management has performed an analysis of the Fund’s tax positions for the open tax years as of September 30, 2011 and has concluded that no provisions for income tax are required. The Fund’s federal tax returns for the prior three fiscal years remain subject to examination by the Internal Revenue Service. Management is not aware of any events that are reasonably possible to occur in the next twelve months that would result in the amounts of any unrecognized tax benefits significantly increasing or decreasing for the Fund. However, management’s conclusions regarding tax positions taken may be subject to review and adjustment at a later date based on factors including, but not limited to, new tax laws and accounting regulations and interpretations thereof.
The Fund may be subject to foreign taxes on income and gains on investments that are accrued based upon the Fund’s understanding of the tax rules and regulations that exist in the countries in which the Fund invests. Foreign governments may also impose taxes or other payments on investments with respect to foreign securities. Such taxes are accrued as applicable, and are reflected as foreign taxes payable on the Statement of Assets and Liabilities.
e. Dividends and Distributions to Shareholders. Dividends and distributions are recorded on ex-dividend date. The timing and characterization of certain income and capital gain distributions are determined annually in accordance with federal tax regulations, which may differ from accounting principles generally accepted in the United States of America. Permanent differences are primarily due to differing treatments for book and tax purposes of items such as foreign currency transactions, deferred compensation, return of capital dividend received, premium amortization, defaulted bond adjustments, paydown gains and losses, trust preferred securities and return of capital and capital gains distributions from real estate investment trusts (“REITs”). Permanent book and tax basis differences relating to shareholder distributions will result in reclassifications to capital accounts. Temporary differences between book and tax distributable earnings are primarily due to deferred Trustees’ fees, wash sales, premium amortization, securities lending collateral gain/loss adjustment, REIT basis adjustments, trust preferred securities, contingent payment debt instruments and defaulted bond interest. Distributions from net investment income and short-term capital gains are considered to be distributed from ordinary income for tax purposes.
| 46
Notes to Financial Statements (continued)
September 30, 2011
The tax characterization of distributions is determined on an annual basis. The tax character of distributions paid to shareholders during the years ended September 30, 2011 and 2010 was as follows:
| | | | | | | | | | | | | | | | | | | | | | |
| 2011 Distributions Paid From: | | | 2010 Distributions Paid From: | |
Ordinary
Income | | | Long-Term Capital Gains | | | Total | | | Ordinary Income | | | Long-Term Capital Gains | | | Total | |
| $ | 712,519,263 | | | $ | — | | | $ | 712,519,263 | | | $ | 716,030,690 | | | $ | — | | | $ | 716,030,690 | |
As of September 30, 2011, the components of distributable earnings on a tax basis were as follows:
| | | | |
Undistributed ordinary income | | $ | 101,229,944 | |
Undistributed long-term capital gains | | | — | |
| | | | |
Total undistributed earnings | | | 101,229,944 | |
| | | | |
Capital loss carryforward: | | | | |
Expires September 30, 2018 | | | (440,508,454 | ) |
| | | | |
Unrealized appreciation | | | 150,703,719 | |
| | | | |
Total accumulated losses | | $ | (188,574,791 | ) |
| | | | |
Capital loss carryforward utilized in the current year | | $ | 135,104,873 | |
| | | | |
On December 22, 2010, the Regulated Investment Company Modernization Act of 2010 (the “Act”) was enacted. The Act modernizes several of the federal income and excise tax provisions related to RICs, and, with certain exceptions, is effective for taxable years beginning after December 22, 2010. Among the changes made are changes to the capital loss carryforward rules allowing for capital losses to be carried forward indefinitely. Rules in effect as of the report date limit the carryforward period to eight years. Capital loss carryforwards generated in taxable years beginning after the effective date of the Act must be fully used before capital loss carryforwards generated in taxable years prior to effective date of the Act; therefore, under certain circumstances, capital loss carryforwards available as of the report date, if any, may expire unused.
f. Repurchase Agreements. It is the Fund’s policy that the market value of the collateral for repurchase agreements be at least equal to 102% of the repurchase price, including interest. Certain repurchase agreements are tri-party arrangements whereby the collateral is held in a segregated account for the benefit of the Fund and on behalf of the counterparty. Repurchase agreements could involve certain risks in the event of default or insolvency of the counterparty including possible delays or restrictions upon the Fund’s ability to dispose of the underlying securities.
g. Securities Lending. The Fund has entered into an agreement with State Street Bank and Trust Company (“State Street Bank”), as agent of the Fund, to lend securities to
47 |
Notes to Financial Statements (continued)
September 30, 2011
certain designated borrowers. The loans are collateralized with cash or securities in an amount equal to at least 105% or 102% of the market value (including accrued interest) of the loaned international or domestic securities, respectively, when the loan is initiated. Thereafter, the value of the collateral must remain at least 102% of the market value (including accrued interest) of loaned securities for U.S. equities and U.S. corporate debt; at least 105% of the market value (including accrued interest) of loaned securities for non-U.S. equities; and at least 100% of the market value (including accrued interest) of loaned securities for U.S. Government securities, sovereign debt issued by non-U.S. Governments and non-U.S. corporate debt. In the event that the market value of the collateral falls below the required percentages described above, the borrower will deliver additional collateral on the next business day. As with other extensions of credit, the Fund may bear the risk of loss with respect to the investment of the collateral. The Fund invests cash collateral in short-term investments, a portion of the income from which is remitted to the borrowers and the remainder allocated between the Fund and State Street Bank as lending agent. Excess collateral in the amount of $2,968,650 related to terminated loans with a bankrupt borrower is held by State Street Bank on behalf of the Fund.
For the year ended September 30, 2011, the Fund did not loan securities under this agreement.
h. Indemnifications. Under the Trust’s organizational documents, its officers and Trustees are indemnified against certain liabilities arising out of the performance of their duties to the Fund. Additionally, in the normal course of business, the Fund enters into contracts with service providers that contain general indemnification clauses. The Fund’s maximum exposure under these arrangements is unknown as this would involve future claims that may be made against the Fund that have not yet occurred. However, based on experience, the Fund expects the risk of loss to be remote.
3. Fair Value Measurements. In accordance with accounting standards related to fair value measurements and disclosures, the Fund has categorized the inputs utilized in determining the value of the Fund’s assets or liabilities. These inputs are summarized in the three broad levels listed below:
| | • | | Level 1 – quoted prices in active markets for identical assets or liabilities; |
| | • | | Level 2 – prices determined using other significant inputs that are observable either directly, or indirectly through corroboration with observable market data (which could include quoted prices for similar assets or liabilities, interest rates, credit risk, etc.); |
| | • | | Level 3 – prices determined using significant unobservable inputs when quoted prices or observable inputs are unavailable such as when there is little or no market activity for an asset or liability (unobservable inputs reflect the Fund’s own assumptions in determining the fair value of assets or liabilities and would be based on the best information available). |
| 48
Notes to Financial Statements (continued)
September 30, 2011
The inputs or methodology used for valuing securities are not necessarily an indication of the risk associated with investing in those securities.
The following is a summary of the inputs used to value the Fund’s investments as of September 30, 2011, at value:
Asset Valuation Inputs
| | | | | | | | | | | | | | | | |
Description | | Level 1 | | | Level 2 | | | Level 3 | | | Total | |
Bonds and Notes | | | | | | | | | | | | | | | | |
Non-Convertible Bonds | | | | | | | | | | | | | | | | |
Consumer Cyclical Services | | $ | — | | | $ | 41,454,883 | | | $ | 4,482,500 | | | $ | 45,937,383 | |
Non-Captive Consumer | | | 2,214,118 | | | | 578,519,948 | | | | — | | | | 580,734,066 | |
Technology | | | — | | | | 201,561,557 | | | | 1,740,000 | | | | 203,301,557 | |
Treasuries | | | — | | | | 1,579,141,030 | | | | 742,727 | | | | 1,579,883,757 | |
All Other Non-Convertible Bonds(a) | | | — | | | | 6,556,500,614 | | | | — | | | | 6,556,500,614 | |
| | | | | | | | | | | | | | | | |
Total Non-Convertible Bonds | | | 2,214,118 | | | | 8,957,178,032 | | | | 6,965,227 | | | | 8,966,357,377 | |
| | | | | | | | | | | | | | | | |
Convertible Bonds(a) | | | — | | | | 981,744,451 | | | | — | | | | 981,744,451 | |
Municipals(a) | | | — | | | | 189,091,183 | | | | — | | | | 189,091,183 | |
| | | | | | | | | | | | | | | | |
Total Bonds and Notes | | | 2,214,118 | | | | 10,128,013,666 | | | | 6,965,227 | | | | 10,137,193,011 | |
| | | | | | | | | | | | | | | | |
Senior Loans(a) | | | — | | | | 44,595,252 | | | | — | | | | 44,595,252 | |
Common Stocks(a) | | | 1,843,857,511 | | | | — | | | | — | | | | 1,843,857,511 | |
Preferred Stocks | | | | | | | | | | | | | | | | |
Convertible Preferred Stocks | | | | | | | | | | | | | | | | |
Automotive | | | 122,424,575 | | | | — | | | | — | | | | 122,424,575 | |
Banking | | | 23,416,402 | | | | 9,826,499 | | | | — | | | | 33,242,901 | |
Construction Machinery | | | 9,179,640 | | | | — | | | | — | | | | 9,179,640 | |
Consumer Products | | | — | | | | 8,085,756 | | | | — | | | | 8,085,756 | |
Electric | | | 18,541,711 | | | | — | | | | 4,847,625 | | | | 23,389,336 | |
Home Construction | | | 2,623,450 | | | | — | | | | — | | | | 2,623,450 | |
Independent Energy | | | 4,837,860 | | | | — | | | | 9,980,000 | | | | 14,817,860 | |
Pipelines | | | 10,835,522 | | | | — | | | | — | | | | 10,835,522 | |
REITs - Healthcare | | | 5,403,210 | | | | — | | | | — | | | | 5,403,210 | |
Technology | | | 32,934,000 | | | | — | | | | — | | | | 32,934,000 | |
| | | | | | | | | | | | | | | | |
Total Convertible Preferred Stocks | | | 230,196,370 | | | | 17,912,255 | | | | 14,827,625 | | | | 262,936,250 | |
| | | | | | | | | | | | | | | | |
49 |
Notes to Financial Statements (continued)
September 30, 2011
Asset Valuation Inputs (continued)
| | | | | | | | | | | | | | | | |
Description | | Level 1 | | | Level 2 | | | Level 3 | | | Total | |
Non-Convertible Preferred Stocks | | | | | | | | | | | | | | | | |
Banking | | $ | 30,512,210 | | | $ | — | | | $ | — | | | $ | 30,512,210 | |
Electric | | | — | | | | 33,737 | | | | — | | | | 33,737 | |
Government Sponsored | | | — | | | | 27,202,500 | | | | — | | | | 27,202,500 | |
Home Construction | | | 406,492 | | | | — | | | | — | | | | 406,492 | |
Non-Captive Consumer | | | 4,258,456 | | | | — | | | | — | | | | 4,258,456 | |
Non-Captive Diversified | | | — | | | | — | | | | 22,149,600 | | | | 22,149,600 | |
REITs - Office Property | | | — | | | | 1,618,942 | | | | — | | | | 1,618,942 | |
REITs - Warehouse/Industrials | | | 6,512,562 | | | | — | | | | — | | | | 6,512,562 | |
| | | | | | | | | | | | | | | | |
Total Non-Convertible Preferred Stocks | | | 41,689,720 | | | | 28,855,179 | | | | 22,149,600 | | | | 92,694,499 | |
| | | | | | | | | | | | | | | | |
Total Preferred Stocks | | | 271,886,090 | | | | 46,767,434 | | | | 36,977,225 | | | | 355,630,749 | |
| | | | | | | | | | | | | | | | |
Closed End Investment Companies | | | 13,852,229 | | | | — | | | | — | | | | 13,852,229 | |
Short-Term Investments | | | — | | | | 177,692,559 | | | | — | | | | 177,692,559 | |
| | | | | | | | | | | | | | | | |
Total | | $ | 2,131,809,948 | | | $ | 10,397,068,911 | | | $ | 43,942,452 | | | $ | 12,572,821,311 | |
| | | | | | | | | | | | | | | | |
| (a) | Details of the major categories of the Fund’s investments are reflected within the Portfolio of Investments. |
Preferred stocks valued at $58,059,149 were transferred from Level 2 to Level 1 during the period ended September 30, 2011. At September 30, 2010, these securities were valued at original purchase price ($21,195,000) or on the basis of evaluated bids furnished to the Fund by a pricing service ($36,864,149); at September 30, 2011, these securities were valued at a market price in accordance with the Fund’s valuation policies.
All transfers are recognized as of the beginning of the reporting period.
| 50
Notes to Financial Statements (continued)
September 30, 2011
The following is a reconciliation of Level 3 investments for which significant unobservable inputs were used to determine fair value as of September 30, 2011:
Asset Valuation Inputs
| | | | | | | | | | | | | | | | | | | | |
| Investments in Securities | | Balance as of
September 30,
2010 | | | Accrued
Discounts
(Premiums) | | | Realized
Gain (Loss) | | | Change in
Unrealized
Appreciation
(Depreciation) | | | Purchases | |
Bonds and Notes | | | | | | | | | | | | | | | | | | | | |
Non-Convertible Bonds | | | | | | | | | | | | | | | | | | | | |
Airlines | | $ | 34,976,018 | | | $ | — | | | $ | — | | | $ | — | | | $ | — | |
Consumer Cyclical Services | | | — | | | | 31,569 | | | | — | | | | 270,931 | | | | — | |
Technology | | | — | | | | 176,506 | | | | — | | | | (4,711,093 | ) | | | 2,780,187 | |
Treasuries | | | — | | | | 48,869 | | | | — | | | | (581,249 | ) | | | 1,275,107 | |
Preferred Stocks | | | | | | | | | | | | | | | | | | | | |
Convertible Preferred Stocks | | | | | | | | | | | | | | | | | | | | |
Electric | | | 3,770,375 | | | | — | | | | — | | | | 1,077,250 | | | | — | |
Independent Energy | | | — | | | | — | | | | — | | | | (434,350 | ) | | | — | |
Non-Convertible Preferred Stocks | | | | | | | | | | | | | | | | | | | | |
Non-Captive Diversified | | | — | | | | — | | | | — | | | | (11,080,570 | ) | | | — | |
| | | | | | | | | | | | | | | | | | | | |
Total | | $ | 38,746,393 | | | $ | 256,944 | | | $ | — | | | $ | (15,459,081 | ) | | $ | 4,055,294 | |
| | | | | | | | | | | | | | | | | | | | |
| | | | | |
| Investments in Securities | | Sales | | | Transfers
into Level 3 | | | Transfers out of Level 3 | | | Balance as of
September 30,
2011 | | | Change in
Unrealized
Appreciation
(Depreciation)
from
Investments
Still Held at
September 30,
2011 | |
Bonds and Notes | | | | | | | | | | | | | | | | | | | | |
Non-Convertible Bonds | | | | | | | | | | | | | | | | | | | | |
Airlines | | $ | — | | | $ | — | | | $ | (34,976,018 | ) | | $ | — | | | $ | — | |
Consumer Cyclical Services | | | — | | | | 4,180,000 | | | | — | | | | 4,482,500 | | | | 270,931 | |
Technology | | | — | | | | 3,494,400 | | | | — | | | | 1,740,000 | | | | (4,711,093 | ) |
Treasuries | | | — | | | | — | | | | — | | | | 742,727 | | | | (581,249 | ) |
Preferred Stocks | | | | | | | | | | | | | | | | | | | | |
Convertible Preferred Stocks | | | | | | | | | | | | | | | | | | | | |
Electric | | | — | | | | — | | | | — | | | | 4,847,625 | | | | 1,077,250 | |
Independent Energy | | | — | | | | 10,414,350 | | | | — | | | | 9,980,000 | | | | (434,350 | ) |
Non-Convertible Preferred Stocks | | | | | | | | | | | | | | | | | | | | |
Non-Captive Diversified | | | — | | | | 33,230,170 | | | | — | | | | 22,149,600 | | | | (11,080,570 | ) |
| | | | | | | | | | | | | | | | | | | | |
Total | | $ | — | | | $ | 51,318,920 | | | $ | (34,976,018 | ) | | $ | 43,942,452 | | | $ | (15,459,081 | ) |
| | | | | | | | | | | | | | | | | | | | |
A debt security valued at $34,976,018 was transferred from Level 3 to Level 2 during the period ended September 30, 2011. At September 30, 2010, this security was valued using
51 |
Notes to Financial Statements (continued)
September 30, 2011
broker-dealer bid quotations based on inputs unobservable to the Fund; at September 30, 2011, this security was valued on the basis of evaluated bids furnished to the Fund by a pricing service.
Debt securities ($7,674,400) and preferred stocks ($43,644,520) valued at $51,318,920 were transferred from Level 2 to Level 3 during the period ended September 30, 2011. At September 30, 2010, these securities were valued on the basis of evaluated bids furnished to the Fund by a pricing service; at September 30, 2011, these securities were valued using broker-dealer bid quotations based on inputs unobservable to the Fund.
All transfers are recognized as of the beginning of the reporting period.
4. Purchases and Sales of Securities. For the year ended September 30, 2011, purchases and sales of securities (excluding short-term investments and U.S. Government/Agency securities and including paydowns) were $3,018,224,709 and $3,639,567,709, respectively. Purchases and sales of U.S. Government/Agency securities (excluding short-term investments and including paydowns) were $318,107,642 and $323,675,698, respectively.
5. Management Fees and Other Transactions with Affiliates.
a. Management Fees. Loomis, Sayles & Company, L.P. (“Loomis Sayles”) serves as investment adviser to the Fund. Under the terms of the management agreement, the Fund pays a management fee at the following annual rates, calculated daily and payable monthly, based on the Fund’s average daily net assets:
| | | | | | | | | | | | | | |
| Percentage of Average Daily Net Assets | |
First $200 million | | | Next
$1.8 billion | | | Next
$13 billion | | | Over
$15 billion | |
| | 0.65% | | | | 0.60% | | | | 0.55% | | | | 0.54% | |
Loomis Sayles has given a binding undertaking to the Fund to waive management fees and/or reimburse certain expenses to limit the Fund’s operating expenses, exclusive of acquired fund fees and expenses, brokerage expenses, interest expense, taxes and extraordinary expenses. This undertaking is in effect until January 31, 2012 and is reevaluated on an annual basis. Management fees payable, as reflected on the Statement of Assets and Liabilities, is net of waivers and/or expense reimbursements, if any, pursuant to this undertaking.
For the year ended September 30, 2011, the expense limits as a percentage of average daily net assets under the expense limitation agreement were as follows:
| | | | | | | | | | | | | | | | | | |
| Expense Limit as a Percentage of Average Daily Net Assets | |
Class A | | | Class B | | | Class C | | | Class Y | | | Admin Class | |
| | 1.25% | | | | 2.00% | | | | 2.00% | | | | 1.00% | | | | 1.50% | |
| 52
Notes to Financial Statements (continued)
September 30, 2011
Loomis Sayles shall be permitted to recover expenses it has borne under the expense limitation agreement (whether through waiver of its management fees or otherwise) on a class by class basis in later periods to the extent the expenses of a class fall below a class’ expense limits, provided, however, that a class is not obligated to pay such waived/reimbursed fees or expenses more than one year after the end of the fiscal year in which the fees or expenses were waived/reimbursed.
For the year ended September 30, 2011, the management fees for the Fund were $76,046,459 (effective rate of 0.56% of average daily net assets).
No expenses were recovered during the year ended September 30, 2011 under the terms of the expense limitation agreement.
Certain officers and employees of Loomis Sayles are also officers or Trustees of the Trust. Loomis Sayles’ general partner is indirectly owned by Natixis Global Asset Management, L.P. (“Natixis US”), which is part of Natixis Global Asset Management, an international asset management group based in Paris, France.
b. Service and Distribution Fees. Natixis Distributors, L.P. (“Natixis Distributors”), a wholly-owned subsidiary of Natixis US, has entered into a distribution agreement with the Trust. Pursuant to this agreement, Natixis Distributors serves as principal underwriter of the Funds of the Trust.
Pursuant to Rule 12b-1 under the 1940 Act, the Trust has adopted a Service Plan relating to the Fund’s Class A shares (the “Class A Plan”), a Distribution and Service Plan relating to the Fund’s Class B and Class C shares (the “Class B and Class C Plans”), and a Distribution Plan relating to its Admin Class shares (the “Admin Class Plan”).
Under the Class A Plan, the Fund pays Natixis Distributors a monthly service fee at an annual rate not to exceed 0.25% of the average daily net assets attributable to the Fund’s Class A shares, as reimbursement for expenses incurred by Natixis Distributors in providing personal services to investors in Class A shares and/or the maintenance of shareholder accounts.
Under the Class B and Class C Plans, the Fund pays Natixis Distributors a monthly service fee at an annual rate not to exceed 0.25% of the average daily net assets attributable to the Fund’s Class B and Class C shares, as compensation for services provided by Natixis Distributors in providing personal services to investors in Class B and Class C shares and/or the maintenance of shareholder accounts.
Also under the Class B and Class C Plans, the Fund pays Natixis Distributors a monthly distribution fee at an annual rate of 0.75% of the average daily net assets attributable to the Fund’s Class B and Class C shares, as compensation for services provided by Natixis Distributors in connection with the marketing or sale of Class B and Class C shares.
53 |
Notes to Financial Statements (continued)
September 30, 2011
Under the Admin Class Plan, the Fund pays Natixis Distributors a monthly distribution fee at an annual rate not to exceed 0.25% of the average daily net assets attributable to the Fund’s Admin Class shares, as compensation for services provided by Natixis Distributors in connection with the marketing or sale of Admin Class shares or for payments made by Natixis Distributors to securities dealers or other financial intermediaries as commissions, asset-based sales charges or other compensation with respect to the sale of Admin Class shares, or for providing personal services to investors and/or the maintenance of shareholder accounts.
In addition, the Admin Class shares of the Fund may pay Natixis Distributors an administrative service fee, at an annual rate not to exceed 0.25% of the average daily net assets attributable to Admin Class shares. These fees are subsequently paid to securities dealers or financial intermediaries for providing personal services and/or account maintenance for their customers who hold such shares.
For the year ended September 30, 2011, the Fund paid the following service and distribution fees:
| | | | | | | | | | | | | | | | | | | | | | | | | | |
| Service Fees | | | Distribution Fees | |
Class A | | | Class B | | | Class C | | | Admin Class | | | Class B | | | Class C | | | Admin Class | |
| $ | 14,296,958 | | | $ | 318,472 | | | $ | 12,648,196 | | | $ | 38,260 | | | $ | 955,415 | | | $ | 37,944,588 | | | $ | 38,260 | |
c. Administrative Fees. Natixis Asset Management Advisors, L.P. (“Natixis Advisors”) provides certain administrative services for the Fund and contracts with State Street Bank to serve as sub-administrator. Natixis Advisors is a wholly-owned subsidiary of Natixis US. Pursuant to an agreement among Natixis Funds Trust I, Natixis Funds Trust II, Natixis Funds Trust IV, Gateway Trust (“Natixis Funds Trusts”), Loomis Sayles Funds I, Loomis Sayles Funds II (“Loomis Sayles Funds Trusts”), Hansberger International Series and Natixis Advisors, the Fund pays Natixis Advisors monthly its pro rata portion of fees equal to an annual rate of 0.0575% of the first $15 billion of the average daily net assets of the Natixis Funds Trusts, Loomis Sayles Funds Trusts and Hansberger International Series, 0.0500% of the next $15 billion, 0.0400% of the next $30 billion and 0.0350% of such assets in excess of $60 billion, subject to an annual aggregate minimum fee for the Natixis Funds Trusts, Loomis Sayles Funds Trusts and Hansberger International Series of $10 million, which is reevaluated on an annual basis.
For the year ended September 30, 2011, the Fund paid $6,330,110 in administrative fees to Natixis Advisors.
d. Sub-Transfer Agent Fees. Natixis Distributors has entered into agreements with financial intermediaries to provide certain recordkeeping, processing, shareholder communications and other services to customers of the intermediaries and has agreed to compensate the intermediaries for providing those services. Certain services would be provided by the Fund if the shares of those customers were registered directly with the Fund’s transfer agent. Accordingly, the Fund agreed to pay a portion of the
| 54
Notes to Financial Statements (continued)
September 30, 2011
intermediary fees attributable to shares of the Fund held by intermediaries (which generally are a percentage of the value of shares held) not to exceed what the Fund would have paid its transfer agent had each customer’s shares been registered directly with the transfer agent instead of held through the intermediaries. Natixis Distributors pays the remainder of the fees.
For the year ended September 30, 2011, the Fund paid $8,277,371 in sub-transfer agent fees, which are reflected in transfer agent fees and expenses in the Statement of Operations.
e. Commissions. Commissions (including CDSCs) on Fund shares retained by Natixis Distributors during the year ended September 30, 2011 amounted to $5,010,618.
f. Trustees Fees and Expenses. The Trust does not pay any compensation directly to its officers or Trustees who are directors, officers or employees of Natixis Advisors, Natixis Distributors, Natixis US or their affiliates. The Chairperson of the Board receives a retainer fee at the annual rate of $250,000. The Chairperson does not receive any meeting attendance fees for Board of Trustees meetings or committee meetings that she attends. Each Independent Trustee (other than the Chairperson) receives, in the aggregate, a retainer fee at the annual rate of $80,000. Each Independent Trustee also receives a meeting attendance fee of $10,000 for each meeting of the Board of Trustees that he or she attends in person and $5,000 for each meeting of the Board of Trustees that he or she attends telephonically. In addition, each committee chairman receives an additional retainer fee at an annual rate of $15,000. Each Contract Review and Governance Committee member is compensated $6,000 for each Committee meeting that he or she attends in person and $3,000 for each meeting that he or she attends telephonically. Each Audit Committee member is compensated $7,500 for each Committee meeting that he or she attends in person and $3,750 for each meeting that he or she attends telephonically. These fees are allocated among the funds in the Natixis Funds Trusts, Loomis Sayles Funds Trusts and Hansberger International Series based on a formula that takes into account, among other factors, the relative net assets of each fund. Trustees are reimbursed for travel expenses in connection with attendance at meetings.
A deferred compensation plan (the “Plan”) is available to the Trustees on a voluntary basis. Deferred amounts remain in the Fund until distributed in accordance with the provisions of the Plan. The value of a participating Trustee’s deferral account is based on theoretical investments of deferred amounts, on the normal payment dates, in certain funds of the Natixis Funds Trusts, Loomis Sayles Funds Trusts and Hansberger International Series as designated by the participating Trustees. Changes in the value of participants’ deferral accounts are allocated pro rata among the funds in the Natixis Funds Trusts, Loomis Sayles Funds Trusts, and Hansberger International Series, and are normally reflected as Trustees’ fees and expenses in the Statement of Operations. The
55 |
Notes to Financial Statements (continued)
September 30, 2011
portions of the accrued obligations allocated to the Fund under the Plan are reflected as Deferred Trustees’ fees on the Statement of Assets and Liabilities.
6. Line of Credit. The Fund, together with certain other funds of Natixis Funds Trusts, Loomis Sayles Funds Trusts and Hansberger International Series, participates in a $200,000,000 committed unsecured line of credit provided by State Street Bank, with an individual limit of $125,000,000 for each fund that participates in the line of credit. Interest is charged to each participating fund based on its borrowings at a rate per annum equal to the greater of the Federal Funds rate or overnight LIBOR, plus 1.25%. In addition, a commitment fee of 0.125% per annum, payable at the end of each calendar quarter, is accrued and apportioned among the participating funds based on their average daily unused portion of the line of credit. Prior to April��21, 2011, the commitment fee was 0.15% per annum.
For the year ended September 30, 2011, the Fund had no borrowings under these agreements.
7. Concentration of Risk. The Fund’s investments in foreign securities are subject to foreign currency fluctuations, higher volatility than U.S. securities, varying degrees of regulation and limited liquidity. Greater political, economic, credit and information risks are also associated with foreign securities.
8. Concentration of Ownership. From time to time, the Fund may have a concentration of one or more shareholders holding a significant percentage of shares outstanding. Investment activities of these shareholders could have material impacts on the Fund. As of September 30, 2011, one shareholder account comprised more than 5% of the Fund’s total outstanding shares, representing 30.82% of the Fund’s net assets, based on accounts that represent more than 5% of an individual class of shares. Such accounts may be beneficially held by one or more individuals or entities other than the owner of record.
9. Capital Shares. The Fund may issue an unlimited number of shares of beneficial interest, without par value. Transactions in capital shares were as follows:
| | | | | | | | | | | | | | | | |
| | | Year Ended
September 30, 2011 | | | Year Ended
September 30, 2010 | |
| | | Shares | | | Amount | | | Shares | | | Amount | |
Class A | | | | | | | | | | | | | | | | |
Issued from the sale of shares | | | 100,728,799 | | | $ | 1,519,559,694 | | | | 102,095,738 | | | $ | 1,433,327,434 | |
Issued in connection with the reinvestment of distributions | | | 16,985,705 | | | | 254,980,186 | | | | 19,067,875 | | | | 267,178,534 | |
Redeemed | | | (139,402,301 | ) | | | (2,096,241,991 | ) | | | (143,344,700 | ) | | | (2,011,259,494 | ) |
| | | | | | | | | | | | | | | | |
Net change | | | (21,687,797 | ) | | $ | (321,702,111 | ) | | | (22,181,087 | ) | | $ | (310,753,526 | ) |
| | | | | | | | | | | | | | | | |
| 56
Notes to Financial Statements (continued)
September 30, 2011
9. Capital Shares (continued)
| | | | | | | | | | | | | | | | |
| | | Year Ended
September 30, 2011 | | | Year Ended
September 30, 2010 | |
| | | Shares | | | Amount | | | Shares | | | Amount | |
Class B | | | | | | | | | | | | | | | | |
Issued from the sale of shares | | | 192,090 | | | $ | 2,919,791 | | | | 186,206 | | | $ | 2,622,085 | |
Issued in connection with the reinvestment of distributions | | | 201,211 | | | | 3,037,937 | | | | 248,193 | | | | 3,496,666 | |
Redeemed | | | (2,173,334 | ) | | | (32,992,197 | ) | | | (2,205,963 | ) | | | (31,123,182 | ) |
| | | | | | | | | | | | | | | | |
Net change | | | (1,780,033 | ) | | $ | (27,034,469 | ) | | | (1,771,564 | ) | | $ | (25,004,431 | ) |
| | | | | | | | | | | | | | | | |
Class C | | | | | | | | | | | | | | | | |
Issued from the sale of shares | | | 43,771,397 | | | $ | 662,887,999 | | | | 56,633,554 | | | $ | 798,369,591 | |
Issued in connection with the reinvestment of distributions | | | 7,721,378 | | | | 116,516,115 | | | | 8,306,362 | | | | 117,036,115 | |
Redeemed | | | (73,499,317 | ) | | | (1,110,786,820 | ) | | | (80,289,909 | ) | | | (1,131,902,366 | ) |
| | | | | | | | | | | | | | | | |
Net change | | | (22,006,542 | ) | | $ | (331,382,706 | ) | | | (15,349,993 | ) | | $ | (216,496,660 | ) |
| | | | | | | | | | | | | | | | |
Class Y | | | | | | | | | | | | | | | | |
Issued from the sale of shares | | | 98,118,850 | | | $ | 1,481,121,222 | | | | 71,382,373 | | | $ | 1,004,096,644 | |
Issued in connection with the reinvestment of distributions | | | 4,346,254 | | | | 65,258,226 | | | | 3,481,005 | | | | 48,849,457 | |
Redeemed | | | (76,525,358 | ) | | | (1,145,382,580 | ) | | | (56,938,380 | ) | | | (797,459,413 | ) |
| | | | | | | | | | | | | | | | |
Net change | | | 25,939,746 | | | $ | 400,996,868 | | | | 17,924,998 | | | $ | 255,486,688 | |
| | | | | | | | | | | | | | | | |
Admin Class | | | | | | | | | | | | | | | | |
Issued from the sale of shares | | | 1,568,042 | | | $ | 23,628,559 | | | | 309,466 | | | $ | 4,414,761 | |
Issued in connection with the reinvestment of distributions | | | 41,605 | | | | 625,462 | | | | 2,485 | | | | 35,684 | |
Redeemed | | | (115,648 | ) | | | (1,745,037 | ) | | | (13,316 | ) | | | (193,142 | ) |
| | | | | | | | | | | | | | | | |
Net change | | | 1,493,999 | | | $ | 22,508,984 | | | | 298,635 | | | $ | 4,257,303 | |
| | | | | | | | | | | | | | | | |
Increase (decrease) from capital share transactions | | | (18,040,627 | ) | | $ | (256,613,434 | ) | | | (21,079,011 | ) | | $ | (292,510,626 | ) |
| | | | | | | | | | | | | | | | |
| * | From commencement of operations on February 1, 2010 through September 30, 2010 for Admin Class shares. |
57 |
Report of Independent Registered Public
Accounting Firm
To the Trustees of Loomis Sayles Funds II and Shareholders of Loomis Sayles Strategic Income Fund:
In our opinion, the accompanying statement of assets and liabilities, including the portfolio of investments, and the related statements of operations and of changes in net assets and the financial highlights present fairly, in all material respects, the financial position of the Loomis Sayles Strategic Income Fund, a series of Loomis Sayles Funds II (the “Fund”), at September 30, 2011, and the results of its operations, the changes in its net assets and the financial highlights for each of the periods indicated, in conformity with accounting principles generally accepted in the United States of America. These financial statements and financial highlights (hereafter referred to as “financial statements”) are the responsibility of the Fund’s management; our responsibility is to express an opinion on these financial statements based on our audits. We conducted our audits of these financial statements in accordance with the standards of the Public Company Accounting Oversight Board (United States). Those standards require that we plan and perform the audits to obtain reasonable assurance about whether the financial statements are free of material misstatement. An audit includes examining, on a test basis, evidence supporting the amounts and disclosures in the financial statements, assessing the accounting principles used and significant estimates made by management, and evaluating the overall financial statement presentation. We believe that our audits, which included confirmation of securities at September 30, 2011 by correspondence with the custodian and brokers, provide a reasonable basis for our opinion.
PricewaterhouseCoopers LLP
Boston, Massachusetts
November 22, 2011
| 58
2011 U.S. Tax Distribution Information to
Shareholders (Unaudited)
Corporate Dividends Received Deduction. For the fiscal year ended September 30, 2011, 3.97% of dividends distributed by Strategic Income Fund qualify for the dividends received deduction for corporate shareholders.
Qualified Dividend Income. For the fiscal year ended September 30, 2011, the Strategic Income Fund will designate up to the maximum amount allowable pursuant to the Internal Revenue Code as qualified dividend income eligible for reduced tax rates. These lower rates range from 0% to 15% depending on an individual’s tax bracket. If the Fund pays a distribution during calendar year 2011, complete information will be reported in conjunction with Form 1099-DIV.
59 |
LS Strategic Income
Trustee and Officer Information
The tables below provide certain information regarding the trustees and officers of Loomis Sayles Funds II (the “Trust”). Unless otherwise indicated, the address of all persons below is 399 Boylston Street, Boston, MA 02116. The Fund’s Statement of Additional Information includes additional information about the trustees of the Trust and are available by calling Natixis Funds at 800-225-5478.
| | | | | | | | |
Name and Year of Birth | | Position(s) Held with the Trust, Length of Time Served and Term of Office* | | Principal Occupation(s) During Past 5 Years | | Number of Portfolios in Fund Complex Overseen** and Other Directorships Held
During Past 5 Years | | Experience, Qualifications, Attributes, Skills for Board Membership |
| | | |
| INDEPENDENT TRUSTEES | | | | | | |
| | | | |
| Graham T. Allison, Jr. (1940) | | Trustee Since 2003 Contract Review and Governance Committee Member | | Douglas Dillon Professor and Director of the Belfer Center for Science and International Affairs, John F. Kennedy School of Government, Harvard University | | 44 Director, Taubman Centers, Inc. (real estate investment trust) | | Significant experience on Board of Trustees of the Trust and/or other business organizations; government experience (including as Assistant Secretary of Defense under President Clinton); academic experience |
| | | | |
Charles D. Baker1 (1956) | | Trustee From 2005 to 2009 and since 2011 Contract Review and Governance Committee Member | | Executive in Residence at General Catalyst Partners (venture capital and growth equity firm); formerly, President and Chief Executive Officer, Harvard Pilgrim Health Care (health plan) | | 44 None | | Significant experience on Board of Trustees of the Trust and/or other business organizations; executive experience including president and chief executive officer of a corporation |
| 60
Trustee and Officer Information
| | | | | | | | |
Name and Year of Birth | | Position(s) Held with the Trust, Length of Time Served and Term of Office* | | Principal Occupation(s) During Past 5 Years | | Number of Portfolios in Fund Complex Overseen** and Other Directorships Held
During Past 5 Years | | Experience, Qualifications, Attributes, Skills for Board Membership |
| | | |
INDEPENDENT TRUSTEES continued | | | | | | |
| | | | |
Edward A. Benjamin (1938) | | Trustee Since 2002 Chairman of the Contract Review and Governance Committee | | Retired | | 44 Formerly, Director, Precision Optics Corporation (optics manufacturer) | | Significant experience on Board of Trustees of the Trust and/or other business organizations; significant experience providing legal counsel to boards, funds, advisers and other financial institutions (former partner at Ropes & Gray LLP) |
| | | | |
Daniel M. Cain (1945) | | Trustee Since 2003 Contract Review and Governance Committee Member | | Chairman (formerly, President and Chief Executive Officer) of Cain Brothers & Company, Incorporated (investment banking) | | 44 Director, Sheridan Healthcare Inc. (physician practice management) | | Significant experience on Board of Trustees of the Trust and/or other business organizations; experience in the financial industry, including roles as chairman and former chief executive officer of an investment banking firm |
| | | | |
Kenneth A. Drucker (1945) | | Trustee Since 2008 Chairman of the Audit Committee | | Formerly, Vice President and Treasurer, Sequa Corp. (aerospace, automotive and metal manufacturing) | | 44 Formerly, Director, M Fund, Inc. (investment company); Director, Gateway Trust (investment company) | | Significant experience on Board of Trustees of the Trust and/or other business organizations; executive experience including as treasurer of a corporation |
61 |
Trustee and Officer Information
| | | | | | | | |
Name and Year of Birth | | Position(s) Held with the Trust, Length of Time Served and Term of Office* | | Principal Occupation(s) During Past 5 Years | | Number of Portfolios in Fund Complex Overseen** and Other Directorships Held
During Past 5 Years | | Experience, Qualifications, Attributes, Skills for Board Membership |
| | | |
INDEPENDENT TRUSTEES continued | | | | | | |
| | | | |
Wendell J. Knox (1948) | | Trustee Since 2009 Audit Committee Member | | Director (formerly, President and Chief Executive Officer) of Abt Associates Inc. (research and consulting) | | 44 Director, Eastern Bank (commercial bank); Director, The Hanover Insurance Group (property and casualty insurance) | | Significant experience on Board of Trustees of the Trust and/or other business organizations; executive experience including roles as president and chief executive officer of a consulting company |
| | | | |
Sandra O. Moose (1942) | | Chairperson of the Board of Trustees since November 2005 Trustee since 2003 Ex officio member of the Audit Committee and Contract Review and Governance Committee | | President, Strategic Advisory Services (management consulting); formerly, Senior Vice President and Director, The Boston Consulting Group, Inc. (management consulting) | | 44 Director, Verizon Communications; Director, AES Corporation (international power company); formerly, Director, Rohm and Haas Company (specialty chemicals) | | Significant experience on Board of Trustees of the Trust and/or other business organizations; executive experience at a management consulting company |
| | | | |
Erik R. Sirri (1958) | | Trustee Since 2009 Contract Review and Governance Committee Member | | Professor of Finance at Babson College; formerly, Director of the Division of Trading and Markets at the Securities and Exchange Commission | | 44 None | | Experience on Board of Trustees of the Trust; experience as Director of the Division of Trading and Markets at the Securities and Exchange Commission; academic experience and training as an economist |
| 62
Trustee and Officer Information
| | | | | | | | |
Name and Year of Birth | | Position(s) Held with the Trust, Length of Time Served and Term of Office* | | Principal Occupation(s) During Past 5 Years | | Number of Portfolios in Fund Complex Overseen** and Other Directorships Held
During Past 5 Years | | Experience, Qualifications, Attributes, Skills for Board Membership |
| | | |
INDEPENDENT TRUSTEES continued | | | | | | |
| | | | |
Peter J. Smail (1952) | | Trustee Since 2009 Contract Review and Governance Committee Member | | Retired; formerly, President and Chief Executive Officer of Pyramis Global Advisors (investment management) | | 44 None | | Experience on Board of Trustees of the Trust; mutual fund industry and executive experience, including roles as president and chief executive officer for an investment adviser |
| | | | |
Cynthia L. Walker (1956) | | Trustee Since 2005 Audit Committee Member | | Deputy Dean for Finance and Administration, Yale University School of Medicine; formerly, Executive Dean for Administration, Harvard Medical School; and formerly, Dean for Finance and Chief Financial Officer, Harvard Medical School | | 44 None | | Significant experience on Board of Trustees of the Trust and/or other business organizations; executive experience in a variety of academic organizations, including roles as dean for finance and administration |
| | | |
| INTERESTED TRUSTEES | | | | | | |
| | | | |
Robert J. Blanding2 (1947) 555 California Street San Francisco, CA 94104 | | Trustee Since 2002 Chief Executive Officer Since 2002 | | President, Chairman, Director and Chief Executive Officer, Loomis, Sayles & Company, L.P. | | 44 None | | Significant experience on Board of Trustees of the Trust; continuing service as president, chairman, and chief executive officer of Loomis, Sayles & Company, L.P. |
63 |
Trustee and Officer Information
| | | | | | | | |
Name and Year of Birth | | Position(s) Held with the Trust, Length of Time Served and Term of Office* | | Principal Occupation(s) During Past 5 Years | | Number of Portfolios in Fund Complex Overseen** and Other Directorships Held
During Past 5 Years | | Experience, Qualifications, Attributes, Skills for Board Membership |
| | | |
INTERESTED TRUSTEES continued | | | | | | |
| | | | |
David L. Giunta1, 3 (1965) | | Trustee Since 2011 President Since 2008 | | President and Chief Executive Officer, Natixis Distribution Corporation, Natixis Asset Management Advisors, L.P. and Natixis Distributors, L.P.; formerly President, Fidelity Charitable Gift Fund; and formerly, Senior Vice President, Fidelity Brokerage Company. | | 44 None | | Experience on Board of Trustees of the Trust; continuing experience as President and Chief Executive Officer of Natixis Global Associates – U.S. |
| | | | |
John T. Hailer4 (1960) | | Trustee Since 2003 | | President and Chief Executive Officer-U.S. and Asia, Natixis Global Asset Management, L.P.; formerly, President and Chief Executive Officer, Natixis Distribution Corporation, Natixis Asset Management Advisors, L.P., Natixis Distributors, L.P. and Natixis Global Associates, Inc. | | 44 None | | Significant experience on Board of Trustees of the Trust; continuing experience as Chief Executive Officer of Natixis Global Asset Management, L.P. |
| * | Each trustee serves until retirement, resignation or removal from the Board of Trustees. The current retirement age is 72; however, the trustees designated 2010 as a transition period so that any trustees |
| 64
Trustee and Officer Information
| | who were age 72 or older during 2010 will not be required to retire until the end of calendar year 2011. The position of Chairperson of the Board is appointed for a two-year term. Ms. Moose was appointed to serve an additional two year term as the Chairperson of the Board of Trustees on November 20, 2009. |
| ** | The trustees of the Trust serve as trustees of a fund complex that includes all series of the Natixis Funds Trust I, Natixis Funds Trust II, Natixis Funds Trust IV and Gateway Trust (collectively, the “Natixis Funds Trusts”), Loomis Sayles Funds I and Loomis Sayles Funds II (collectively, the “Loomis Sayles Funds Trusts”), and Hansberger International Series (collectively, the “Fund Complex”). |
| 1 | Mr. Baker and Mr. Giunta were appointed as trustees effective January 1, 2011. |
| 2 | Mr. Blanding is deemed an “interested person” of the Trust because he holds the following positions with an affiliated person of the Trust: President, Chairman, Director and Chief Executive Officer of Loomis Sayles. |
| 3 | Mr. Giunta is deemed an “interested person” of the Trust because he holds the following positions with an affiliated person of the Trust: President and Chief Executive Officer, Natixis Distribution Corporation, Natixis Asset Management Advisors, L.P. and Natixis Distributors, L.P. |
| 4 | Mr. Hailer is deemed an “interested person” of the Trust because he holds the following positions with an affiliated person of the Trust: President and Chief Executive Officer – U.S. and Asia, Natixis Global Asset Management, L.P. |
| | | | | | |
Name and Year of Birth | | Position(s) Held With the Trust | | Term of Office* and Length of Time Served | | Principal Occupation(s) During Past 5 Years** |
|
| OFFICERS OF THE TRUST |
| | | |
Coleen Downs Dinneen (1960) | | Secretary, Clerk and Chief Legal Officer | | Since September 2004 | | Executive Vice President, General Counsel, Secretary and Clerk (formerly, Senior Vice President, Deputy General Counsel, Assistant Secretary and Assistant Clerk), Natixis Distribution Corporation, Natixis Asset Management Advisors, L.P. and Natixis Distributors, L.P. |
| | | |
Daniel J. Fuss (1933) One Financial Center Boston, MA 02111 | | Executive Vice President | | Since June 2003 | | Vice Chairman and Director, Loomis, Sayles & Company, L.P. |
65 |
Trustee and Officer Information
| | | | | | |
Name and Year of Birth | | Position(s) Held With the Trust | | Term of Office* and Length of Time Served | | Principal Occupation(s) During Past 5 Years** |
|
OFFICERS OF THE TRUST continued |
| | | |
Russell L. Kane (1969) | | Chief Compliance Officer, Assistant Secretary and Anti-Money Laundering Officer | | Chief Compliance Officer, since May 2006; Assistant Secretary since June 2004; and Anti-Money Laundering Officer since April 2007 | | Chief Compliance Officer for Mutual Funds, Senior Vice President, Deputy General Counsel, Assistant Secretary and Assistant Clerk, Natixis Distribution Corporation, Natixis Asset Management Advisors, L.P. and Natixis Distributors, L.P. |
| | | |
Michael C. Kardok (1959) | | Treasurer, Principal Financial and Accounting Officer | | Since October 2004 | | Senior Vice President, Natixis Asset Management Advisors, L.P. and Natixis Distributors, L.P. |
| * | Each officer of the Trust serves for an indefinite term in accordance with the Trust’ current by-laws until the date his or her successor is elected and qualified, or until he or she sooner dies, retires, is removed or becomes disqualified. |
| ** | Each person listed above, except as noted, holds the same position(s) with the Natixis Funds Trusts, Loomis Sayles Funds Trust and Hansberger International Series. Mr. Fuss is not an officer of the Natixis Funds Trusts or the Hansberger International Series. Previous positions during the past five years with the Distributor, Natixis Advisors or Loomis Sayles are omitted, if not materially different from a trustee’s or officer’s current position with such entity. |
| 66
Item 2. Code of Ethics.
The Registrant has adopted a code of ethics that applies to the Registrant’s principal executive officer, principal financial officer and persons performing similar functions. There have been no amendments or waivers of the Registrant’s code of ethics during the period.
Item 3. Audit Committee Financial Expert.
The Board of Trustees of the Registrant has established an audit committee. Ms. Cynthia L. Walker, Mr. Wendell J. Knox and Mr. Kenneth A. Drucker are members of the audit committee and have been designated as “audit committee financial experts” by the Board of Trustees. Each of these individuals is also an Independent Trustee of the Registrant.
Item 4. Principal Accountant Fees and Services.
Fees billed by the Principal Accountant for services rendered to the Registrant.
The table below sets forth fees billed by the principal accountant, PricewaterhouseCoopers LLP, for the past two fiscal years for professional services rendered in connection with a) the audit of the Registrant’s annual financial statements and services provided in connection with regulatory filings; b) audit-related services (including services that are reasonably related to the performance of the audit of the Registrant’s financial statements and but not reported under “Audit Fees”); c) tax compliance, tax advice and tax planning and d) all other fees billed for professional services rendered by the principal accountant to the Registrant, other than the services reported as a part of (a) through (c) of this Item.
| | | | | | | | | | | | | | | | | | | | | | | | | | | | | | | | |
| | | Audit fees | | | Audit-related fees1 | | | Tax fees2 | | | All other fees3 | |
| | | 10/1/09-
9/30/10 | | | 10/1/10-
9/30/11 | | | 10/1/09-
9/30/10 | | | 10/1/10-
9/30/11 | | | 10/1/09-
9/30/10 | | | 10/1/10-
9/30/11 | | | 10/1/09-
9/30/10 | | | 10/1/10-
9/30/11 | |
Loomis Sayles Funds II | | $ | 408,090 | | | $ | 378,470 | | | $ | 5,955 | | | $ | 13,432 | | | $ | 104,056 | | | $ | 97,230 | | | $ | 27,842 | | | $ | 30,422 | |
| 1. | Audit-related fees consist of: |
2010 & 2011– performance of agreed-upon procedures related to the Registrant’s deferred compensation plan and consulting services with respect to regulatory matters.
2010 - review of Registrant’s tax returns, consulting services with respect to complex security types, and consulting services related to new Massachusetts filing requirements.
2011 - review of Registrant’s tax returns, consulting services with respect to complex security types, and consulting services related to Form 1099 penalties.
| 3. | All other fees consist of: |
2010 & 2011 - filing and translation services with respect to Japanese shareholders in Loomis Sayles Investment Grade Bond Fund.
Aggregate fees billed to the Registrant for non-audit services during 2010 and 2011 were $137,853 and $141,084, respectively.
Fees billed by the Principal Accountant for services rendered to the Adviser and Control Affiliates.
The following table sets forth the fees billed by the Registrant’s principal accountant for non-audit services rendered to Loomis, Sayles & Company, L.P. and entities controlling, controlled by or under common control with Loomis, Sayles & Company, L.P. Registrant (“Control Affiliates”) that provide ongoing services to the Registrant, for engagements that related directly to the operations and financial reporting of the Registrant for the last two fiscal years.
| | | | | | | | | | | | | | | | | | | | | | | | |
| | | Audit-related fees | | | Tax fees | | | All other fees | |
| | | 10/1/09-
9/30/10 | | | 10/1/10-
9/30/11 | | | 10/1/09-
9/30/10 | | | 10/1/10-
9/30/11 | | | 10/1/09-
9/30/10 | | | 10/1/10-
9/30/11 | |
Control Affiliates | | $ | 12,000 | | | $ | — | | | $ | — | | | $ | — | | | $ | — | | | $ | — | |
The following table sets forth the aggregate fees billed by the Registrant’s principal accountant for non-audit services rendered to Loomis, Sayles & Company, L.P. and Control Affiliates that provide ongoing services to the Registrant, for the last two fiscal years, including the fees disclosed in the table above.
| | | | | | | | |
| | | Aggregate Non-Audit Fees | |
| | | 10/1/09-9/30/10 | | | 10/1/10-9/30/11 | |
Control Affiliates | | $ | 174,242 | | | $ | 56,589 | |
None of the services described above were approved pursuant to (c)(7)(i)(C) of Regulation S-X.
Audit Committee Pre Approval Policies.
Annually, the Registrant’s Audit Committee reviews the audit, audit-related, tax and other non-audit services together with the projected fees, for services proposed to be rendered to the Trust and/or other entities for which pre-approval is required during the upcoming year. Any subsequent revisions to already pre-approved services or fees (including fee increases) and requests for pre-approval of new services would be presented for consideration quarterly as needed.
If, in the opinion of management, a proposed engagement by the Registrant’s independent accountants needs to commence before the next regularly scheduled Audit Committee meeting, any member of the Audit Committee who is an independent Board member is authorized to pre-approve the engagement, but only for engagements to provide audit, audit related and tax services. This approval is subject to review of the full Audit Committee at its next quarterly meeting. All other engagements require the approval of all the members of the Audit Committee.
Item 5. Audit Committee of Listed Registrants.
Not applicable.
Item 6. Schedule of Investments.
Included as part of the Report to Shareholders filed as Item 1 herewith.
Item 7. Disclosure of Proxy Voting Policies and Procedures for Closed-End Management Investment Companies.
Not applicable.
Item 8. Portfolio Managers of Closed-End Management Investment Companies
Not applicable.
Item 9. Purchases of Equity Securities by Closed-End Management Investment Companies and Affiliated Purchasers.
Not applicable.
Item 10. Submission of Matters to a Vote of Securities Holders.
There were no material changes to the procedures by which shareholders may recommend nominees to the Registrant’s Board of Trustees.
Item 11. Controls and Procedures.
The Registrant’s principal executive officer and principal financial officer have concluded that the Registrant’s disclosure controls and procedures are sufficient to ensure that information required to be disclosed by the Registrant in this Form N-CSR was recorded, processed, summarized and reported within the time periods specified in the Securities and Exchange Commission’s rules and forms, based upon such officers’ evaluation of these controls and procedures as of a date within 90 days of the filing date of the report.
There were no changes in the Registrant’s internal control over financial reporting that occurred during the Registrant’s last fiscal quarter of the period covered by the report that has materially affected, or is reasonably likely to materially affect, the Registrant’s internal control over financial reporting.
Item 12. Exhibits.
| | | | | | |
| | (a) | | (1) | | Code of Ethics required by Item 2 hereof, filed herewith as Exhibit (a)(1). |
| | | |
| | (a) | | (2) | | Certifications of Principal Executive Officer and Principal Financial Officer pursuant to Rule 30a-2(a) under the Investment Company Act of 1940 (17 CFR 270.30a-2(a)), filed herewith as Exhibits (a)(2)(1) and (a)(2)(2), respectively. |
| | | |
| | (a) | | (3) | | Not applicable. |
| | | |
| | (b) | | | | Certification of Principal Executive Officer and Principal Financial Officer pursuant to Section 906 of Sarbanes-Oxley Act of 2002 are filed herewith as Exhibit (b). |
SIGNATURES
Pursuant to the requirements of the Securities Exchange Act of 1934 and the Investment Company Act of 1940, the Registrant has duly caused this report to be signed on its behalf by the undersigned, thereunto duly authorized.
| | |
| Loomis Sayles Funds II |
| |
| By: | | /s/ Robert J. Blanding |
| Name: | | Robert J. Blanding |
| Title: | | Chief Executive Officer |
| Date: | | November 22, 2011 |
Pursuant to the requirements of the Securities Exchange Act of 1934 and the Investment Company Act of 1940, this report has been signed by the following persons on behalf of the Registrant and in the capacities and on the dates indicated.
| | |
| By: | | /s/ Robert J. Blanding |
| Name: | | Robert J. Blanding |
| Title: | | Chief Executive Officer |
| Date: | | November 22, 2011 |
| |
| By: | | /s/ Michael C. Kardok |
| Name: | | Michael C. Kardok |
| Title: | | Treasurer |
| Date: | | November 22, 2011 |